How to evaluate trading strategies: From backtesting to live trading
AI Summary
Show More
Quickly grasp the article's content and gauge market sentiment in just 30 seconds!
When a trader adopts a strategy after watching someone else post strong performance, the decision often backfires because it’s typically not based on the trader’s individual circumstances, risk tolerance or new market realities. This is why strategies get abandoned after the first losing streak — or worse, keep running long after the conditions that made them profitable have disappeared.
Evaluating a trading strategy isn't a single checkpoint you clear before going live. It's a discipline you return to continually — since markets shift, and a strategy that worked in one regime can quietly stop working in another.
In this article, we cover the key metrics, testing phases and decision criteria you need to evaluate in order to understand if a trading strategy fits your goals and risk tolerance.
Key Takeaways:
Strategy evaluation should weigh multiple performance metrics together, since win rate alone tells you very little.
Backtesting and forward testing are crucial before you commit significant capital to real trades.
Objective criteria — not gut feeling — should decide whether you keep, adjust or abandon a strategy.
Why evaluation matters
Two common failed trading scenarios, opposite in nature, account for most of the damage traders do to otherwise workable strategies:
Abandoning a strategy during a drawdown that falls well within its normal historical range, simply because a losing streak feels worse in real time than it looked on a chart.
Sticking with a broken strategy because one recent good trade masked a generally unsuitable or rapidly deteriorating approach.
Both mistakes trace back to the same issue: the absence of objective criteria for what "acceptable" performance looks like for that specific strategy. Without defined criteria and thresholds, every drawdown feels like a signal to quit, and every win feels like the ultimate vindication.
A structured evaluation process replaces the emotional approach with a fixed set of questions, applied the same way — irrespective of how the last trade felt. Such consistency strips the decision of recency bias, and lets the data — not gut feeling — decide what happens next.
Key metrics for evaluating a strategy
A single metric, viewed in isolation, will mislead you. This is why evaluation needs to run across several key dimensions at once, each one catching a failure type the others miss on their own.
The example below illustrates why evaluating several metrics together produces a more complete picture than relying on win rate alone.
Metric | What it measures | Why it matters |
Net profit/loss | Total return over the evaluation period | Answers the baseline question: Is the strategy making money at all? |
Win rate | Percentage of trades that are profitable | Context-dependent, since a 40% win rate can still be profitable if the winners are large enough. |
Profit factor | Gross profit divided by gross loss | A figure above 1.0 means gross profits exceed gross losses; a higher figure generally signals a more robust performance, though acceptable ranges vary by strategy type. |
Max drawdown | Largest peak-to-trough decline | Shows the worst-case scenario; this is the number that tells you whether you can actually stomach the drop. |
Risk-adjusted return (Sharpe ratio) | Return per unit of risk taken | Lets you compare strategies fairly, regardless of leverage or position size. |
Expectancy | (Win rate × average win) minus (loss rate × average loss) | The expected value per trade; a positive value means the edge is real over time, not simply a run of luck. |
Number of trades | Sample size | Too few trades means unreliable data: you need a meaningful sample size before trusting any of the above metrics. |
These metrics interact closely — and reading one without the others is why most misjudgments occur. For instance, a high win rate paired with a low profit factor usually means the winners are small and the losers are large — a development that can look good on a monthly summary, while quietly building toward a blowup further down the line.
The reverse pattern frequently shows up, too. A strategy with a modest win rate can still carry strong expectancy if its average winner dwarfs its average loser — which is exactly why the win rate alone gets so much undeserved weight from newer traders.
Consequently, no single number in the table above should be treated as a verdict on its own. Treat these metrics as a set of cross-checks in which each one has to pass before you trust your strategy with more capital.
The table below compares two strategies with quite different win rates and performance metrics, and yet both are profitable.
Metric | Strategy A (High win rate, small wins) | Strategy B (Low win rate, large wins) |
Net profit | $9,000 | $15,600 |
Win rate | 70% | 40% |
Profit factor | 1.8 | 2.4 |
Max drawdown | 10% | 25% |
Sharpe ratio | 1.8 | 1.1 |
Expectancy | $90 | $260 |
Number of trades | 100 | 60 |
How to evaluate: The process
A trading strategy should earn your trust only through a defined testing framework that spans three distinct phases: backtesting, forward testing and live review. Skipping a phase, or rushing through one to get to live trading faster, is precisely how strategies that look solid on paper end up losing money.
One critical rule applies across all three phases, and is worth stating clearly here: Any evaluation requires a minimum sample size of 30 trades before its conclusions carry weight. Fewer trades than that, and you're reading into noise, not detecting signals — regardless of how good or bad the results look.
The evaluation process framework
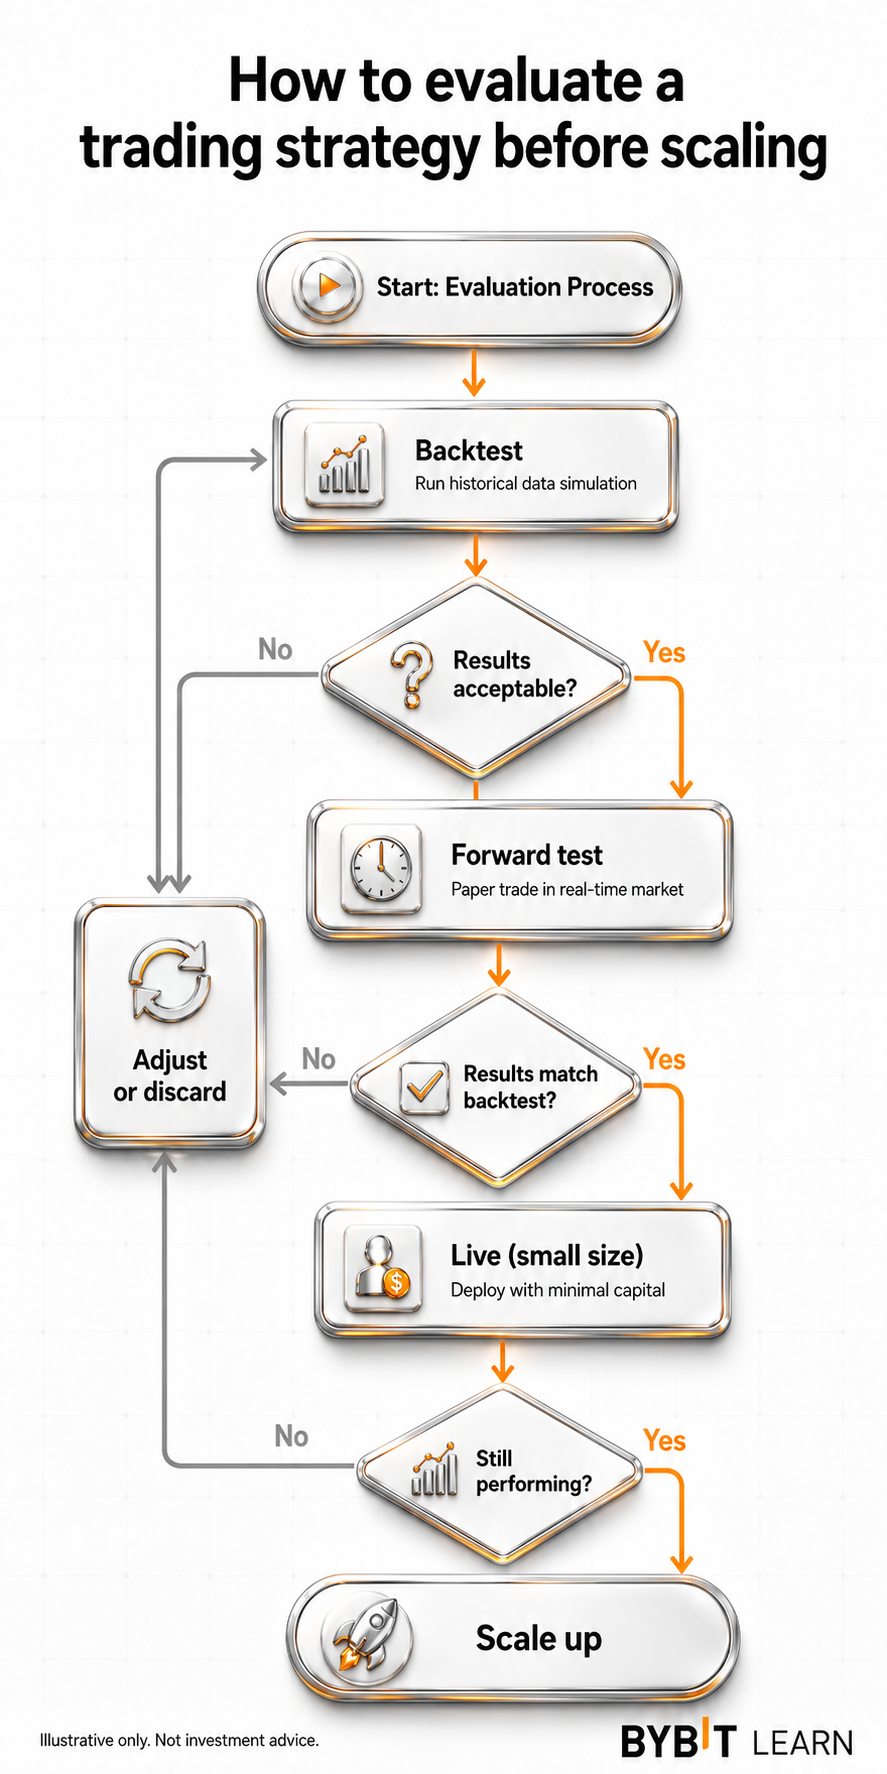
Phase 1: Backtest
Before risking anything, test the strategy against historical data covering at least six to twelve months, ideally spanning multiple market conditions — such as trending, ranging, and high and low volatility. Record every metric from the table above, instead of cherry-picking the ones that look favorable.
A strong backtest shows potential, but it doesn't prove anything yet. Overfitting to historical data — typically by over-tuning parameters to match past price action perfectly — is the main risk at this stage. An unrealistically flawless equity curve is usually the first warning sign.
Phase 2: Forward test (demo/paper trading)
Run the strategy on a demo account under live market conditions, rather than historical data, since real-time price action introduces variables that a backtest can't fully replicate. Plan on the 30-trade minimum specified above, or a test period of 4–8 weeks, whichever comes first.
Compare the forward results directly against the backtest numbers. A significant divergence between these two is a blazing red flag worth investigating before you risk real capital. Resist the temptation to explain the divergence away.
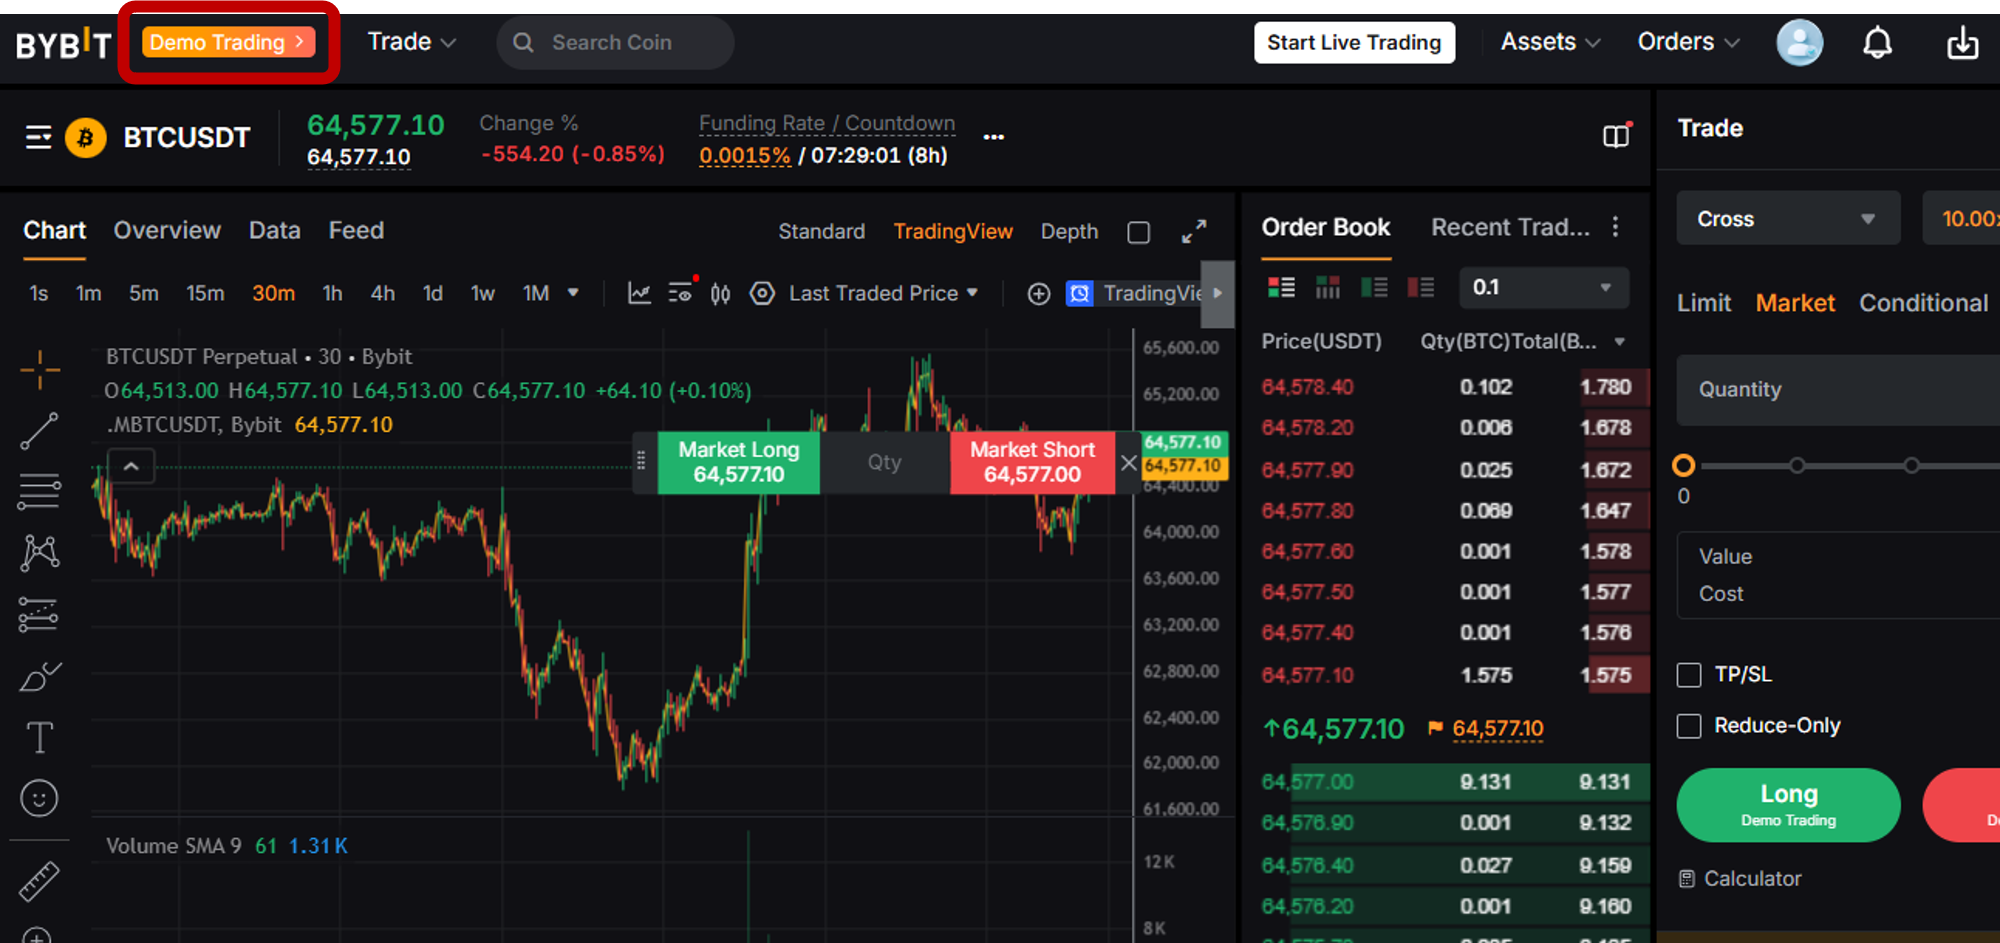
Bybit's Demo Trading feature lets you run this phase without risking capital — which is precisely the point of forward testing in the first place.
Phase 3: Live review (small size)
Deploy the strategy with a reduced position size — something in the range of 10%–25% of your intended allocation — once forward testing holds up. Track the same metrics under real conditions, which are where slippage, fees and your own emotional execution all introduce friction that no backtest or demo account can fully capture.
Evaluate after a defined period or trade count has passed — never after a single bad or lucky day. A strategy judged on one session is being judged on noise, not on performance.
When to keep, adjust or abandon a strategy
This is when evaluation stops being an academic exercise and turns into an actual decision. Once you have the metrics from testing and enough live data to trust them, the question narrows to one of three outcomes.
Keep (no changes)
Keep running the strategy unmodified when:
its live metrics remain within the range your testing established
drawdowns stay inside what you’ve observed during backtesting
the current losing streak — however uncomfortable it may feel at the moment — falls within historical norms for that strategy
None of these conditions requires the strategy to perform at its best — only to remain within the expected range you’ve already mapped out during testing. For example, a strategy at the lower end of this range is behaving exactly as its history had predicted.
Adjust
Adjustment is the right call when market conditions have shifted for the specific strategy. For example, let’s say a trend-following system is now operating in a range-bound market, although the core logic still holds. If metrics have slipped slightly below expectations, but the underlying edge hasn't broken, the fix is usually in adjusting position sizing or risk parameters rather than the strategy's core rules. Traders who default to abandoning a sound system at the first sign of underperformance often discard strategies that only need relatively minor tweaks.
Abandon
Abandon the strategy:
when its metrics fall consistently below backtest expectations over a meaningful sample frame
when the market structure it depends upon has changed at a structural level, rather than a cyclical one
when maximum drawdown has exceeded what you're actually willing to tolerate, regardless of what the backtest said was normal
This is where we have to reiterate the ever-important sample size rule: Never make a keep, adjust or abandon call based on a handful of trades. A too-small sample is exactly what produces false signals in both directions, either leading to unjustified overconfidence or instilling a sense of defeatism.
Common evaluation mistakes
Even traders who understand the metrics listed above still fall into a handful of recurring traps when applying them in real-world conditions. The most common evaluation mistakes include:
evaluating over too few trades, well short of the 30-trade threshold covered earlier, and drawing a firm conclusion from what's really a small, noisy sample
ignoring drawdown entirely and judging a strategy on total return alone, which hides exactly how much pain was involved in generating that return
overfitting a backtest to historical data, i.e., tuning parameters until the curve fits the past perfectly; a strategy overfit to old data rarely holds up against new market conditions
comparing strategies without adjusting for risk, which can make a risky leveraged strategy look better on raw returns while carrying more downside exposure than its unleveraged counterpart
changing strategy parameters after every single losing trade, which erases any chance of building a fair evaluation sample and turns the process into a reaction to noise — rather than a read on performance
The bottom line
Evaluating trading strategies is what separates traders who improve over time from those who cycle through systems indefinitely without ever learning why one failed. A clear framework, defined metrics, structured testing phases and objective decision criteria remove the guesswork that can turn trading into a string of emotional reactions.
It’s also critical to remember that past backtest performance never guarantees future results — which is exactly why strategy evaluation has to run through its full three-stage process. This is also why evaluating your strategies is a never-ending exercise, one that doesn’t stop the moment capital is committed to live trades. Within the framework of this ongoing activity, Bybit's Demo Trading is a critical component that lets you test strategies risk-free before going live.