АКШЖалақыларыЖәнеСтавкаШешімдеріМакроАптаныАйқындайды
BoE 5 қарашада 12:00 UTC-де мөлшерлемені 4,00%-ға дейін көтереді деп күтілуде. АҚШ-тағы жалақы ведомостері 6 қарашада 13:30 UTC-де жарияланады, 65 мың жұмыс орны, 4,2% жұмыссыздық және айлық жалақы өсімі +0,3% (айлық есепте) күтілуде. Жұмыс орындары немесе жалақы бойынша болжамнан жоғары көрсеткіш кірістіліктің және доллардың өсуіне әкеліп, BTC, алтын және өсім акцияларына қысым көрсетуі мүмкін; ал болжамнан төмен көрсеткіш, егер рецессияға қатысты қауіптер басым болмайтын болса, оларды қолдауы ықтимал. Қай актив ең көп реакция береді?


GOLD Smashed our $3800 target zone🎯
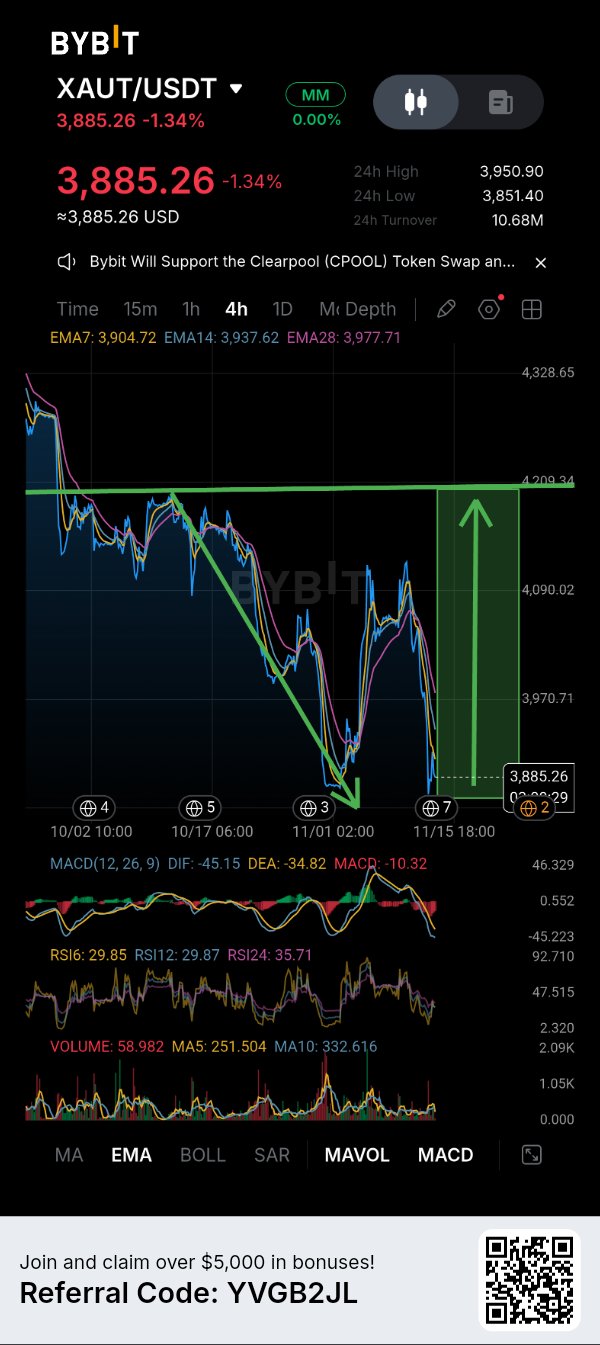
$XAUTUSDT is aproaching an important decision zone, and I think the reaction around $3,850–$3,885 could determine the next meaningful move🤔 4h structure is still bearish. Price is currently trading around $3,885.26, down 1.34%, after another rejection from the higher price region. What concerns me is the EMA structure: EMA7 sits at $3,904.72, EMA14 at $3,937.62, and EMA28 at $3,977.71. All three are above the current price, showing that sellers still have control of the short-term trend. however, I don't want to ignore the momentum situation either. RSI6 and RSI12 are both near 29.85, while RSI24 is around 35.71. This suggests considerable downside pressure and potentially stretched short-term momentum. with DIF at -45.15 and DEA at -34.82. So, although a relief bounce is possible, I would not treat oversold conditions alone as a buy signal my primary area of interest is $3,851–$3,885. The 24H low is already around $3,851.40, making this an important nearby support area to watch. If buyers defend this region, reclaim $3,905 first, and gradually push above $3,938, I would start paying more attention to a potential recovery first important resistance sits around $3,970–$3,978, where the EMA28 also comes into play. A stronger recovery could open the way toward $4,090, followed by the larger resistance area around $4,200 on the other hand, a decisive 4H breakdown below $3,851 would weaken the bullish recovery idea considerably. I would rather wait for a confirmed reclaim and a higher-low structure than attempt to catch a falling market📊 For now, $3,851 is the level I'm watching most closely. XAUT neds to prove that buyers are willing to defend this area before I consider a long position Patience first. Confirmation second. Execution comes last......👍 market is volatile, so you have to manage your own risk✅ #ByXIMPACT #SanDiskAnnounces8For1StockSplit #DeutscheBankLaunchesDigitalAssetCustody #USPayrollsAndRateDecisionsDriveMacroWeek

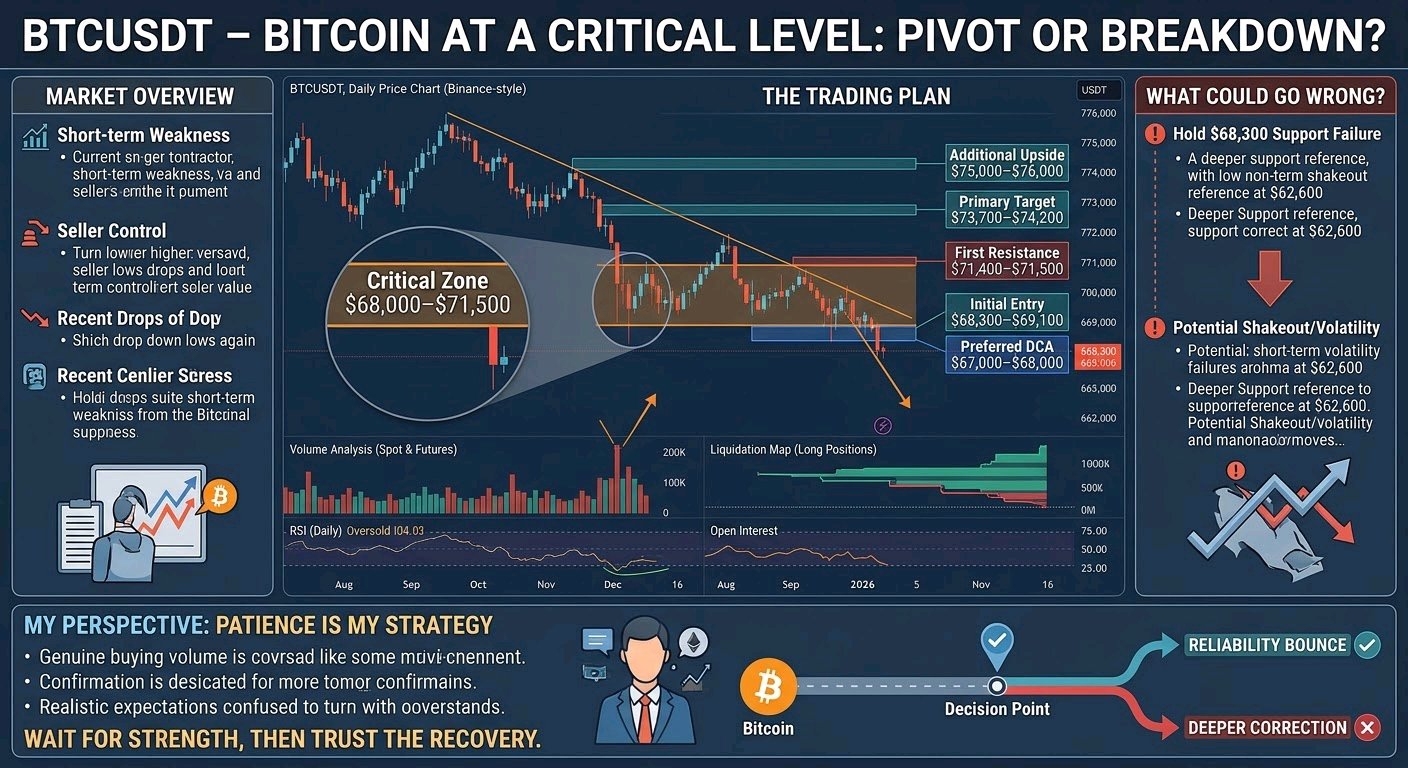
$BTCUSDT – BITCOIN IS AT A CRITICAL LEVEL. I'M WATCHING THE NEXT MOVE CLOSELY. Bitcoin has been under noticeable selling pressure lately, and the price action is getting interesting. After the recent drop, I'm paying close attention to whether buyers are ready to step in or if sellers still have more control. Market Overview Looking at the daily structure, BTC is still showing short-term weakness. Sellers have been pushing the price lower, and buyers haven't yet shown enough strength to confirm a proper recovery. The $68,000–$68,300 area is one zone I'm watching closely. If buyers manage to defend it, we could see a relief bounce. But I don't want to assume the bottom is in just because price has dropped significantly. Volume Analysis Trading activity has picked up during this move, which tells me that market participants are reacting strongly to the current conditions. Liquidations have also added pressure, particularly on leveraged long positions. This can sometimes create opportunities for a recovery, but it doesn't automatically mean the downtrend is over. What I really want to see is genuine buying volume entering the spot market. My Trading Plan I'm not interested in chasing Bitcoin at every small move. I'd rather wait for a clear reaction around important levels. - Initial Entry: $68,300–$69,100, if buyers show confirmation. - Preferred DCA: $67,000–$68,000, only if this area provides a strong reaction. - First Resistance: $71,400–$71,500. - Primary Target: $73,700–$74,200. - Additional Upside: $75,000–$76,000 if bullish momentum improves. A recovery above $71,500 would make the setup more interesting. Until then, I'm keeping my expectations realistic. What Could Go Wrong? The main concern is a failure to hold the $68,300 support area. If sellers push BTC below this level and buyers fail to reclaim it, further downside could follow. In that situation, I'll be watching the broader $62,600 region as a deeper support reference. I also don't want to ignore the possibility of another short-term shakeout. The market is volatile, and entering too early can be costly. My Perspective Personally, I think Bitcoin is approaching an important decision point. The recent selling and liquidation activity have created a market where both sides need to prove themselves. Bears currently have the advantage, but a strong defense of support followed by a move above $71,500 could change the short-term picture. I'm not calling for an immediate rally, and I'm certainly not ruling out another dip. For now, patience is my strategy. I want to see buyers return, volume support the move, and market structure start improving before becoming more aggressive. Bitcoin doesn't need to move today. It needs to show strength before I trust the next recovery. #USPayrollsAndRateDecisionsDriveMacroWeek

Today’s news and market key points
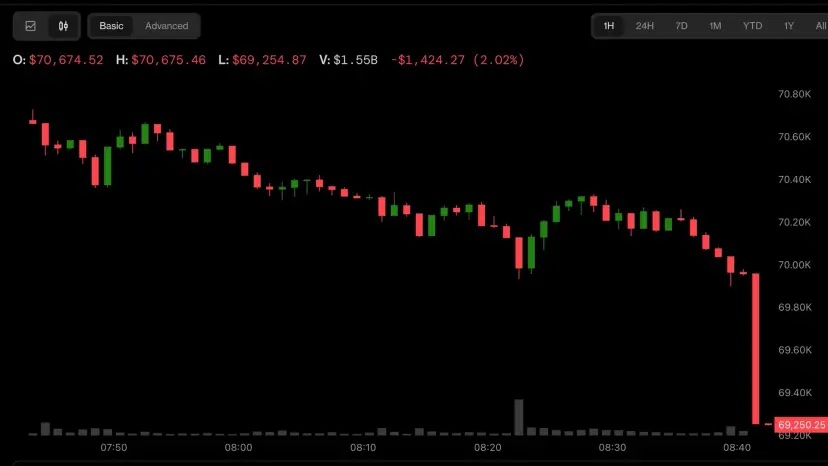
The crypto market selloff gathered pace early Friday. Bitcoin dropped below $70,000 and ether traded below $2,000, triggering large liquidations in futures market. Summary: Bitcoin fell below $70,000 early Friday to its lowest level since Aug. 19, as the Dollar Index held steady at 19-month highs. The sell-off accelerated amid reports of renewed military escalation in the Middle East, including Iran’s claim that it destroyed a U.S. early-warning radar in Bahrain. Exchanges liquidated more than $1.3 billion in cryptocurrency futures positions over 24 hours. The broader market suffered. Ether ETH $1,935.76 , the second-largest token, dropped below $2,000 for the first time since August. XRP (XRP) traded close to the $1 level, while Solana’s SOL traded below $80. Several smaller tokens, such as GT, Stacks, and XMR, were down 7% or more. The selloff gathered pace as the Dollar Index (DXY), which tracks the greenback’s exchange rate against major fiat currencies, traded above 103, its highest since April 2025. The odds that the Federal Reserve will raise interest rates by half a percentage point in December have increased following a hotter-than-expected U.S. consumer price index reading for October released early this week. #WSOT2026 #AnthropicIPOValuationTest #Розпродаж акцій ШІ-технологій знищив 2,5 трильйона доларів з індексу Nasdaq 100 #Звіт із зайнятості в США та рішення щодо ставок формують макротиждень @STRATEGY @

🚨 WHY IS $BTC DUMPING BELOW $69,000?
THE REAL REASONS BEHIND THE NOVEMBER 2026 CRYPTO CRASH Guys... $BTCUSDT has already broken below $70,000 and is now trading around $68,850, down 6.5% in 24 hours. And honestly... this is no longer looking like an ordinary correction. Multiple forces are hitting the market simultaneously: • Institutional ETF outflows • Massive leveraged liquidations • Inflation concerns • Federal Reserve rate expectations • Technology stock weakness • Declining investor risk appetite Let's look at the actual numbers... because the situation is getting more serious. 1. BITCOIN HAS LOST MORE THAN 45% FROM ITS ATH November 13, 2026: • BTC price: approximately $68,850 • 24-hour performance: -6.5% • Previous ATH: approximately $126,198 • Current drawdown: approximately -45.4% • Recent chart high: $87,383 • Decline from that high: approximately 21.2% Bitcoin is now trading significantly below its October 2025 peak, and the selling pressure is accelerating. 2. INSTITUTIONAL MONEY IS LEAVING BITCOIN ETFs U.S. spot Bitcoin ETFs reportedly recorded FIVE consecutive trading days of net outflows. November 5–11: • November 5: -$430.2M • November 6: -$411.9M • November 9: -$201.0M • November 10: -$95.0M • November 11: -$299.8M TOTAL: approximately $1.438 BILLION in net outflows. Another concerning detail... BlackRock's IBIT reportedly recorded approximately $269.7M in outflows on November 11, marking its ninth consecutive outflow session. Its cumulative outflows across those nine sessions reportedly reached approximately $2 BILLION. And guys... this matters. Spot ETFs have become an important institutional access channel for Bitcoin. When ETF redemptions persist, institutional demand is no longer providing the same buying support. 3. NEARLY $681 MILLION IN CRYPTO LIQUIDATIONS According to CoinGlass figures cited in November 13 reports: • Total crypto liquidations: $680.81M • Long liquidations: approximately 88% • Short liquidations: approximately 12% • Bitcoin liquidations: $325.28M • Ethereum liquidations: $106.07M • Traders liquidated: 112,947 • Largest single liquidation: $31.09M Bitcoin accounted for approximately $325M in liquidations, with 95.3% reportedly coming from LONG positions. This is a classic leverage unwind. Falling prices trigger margin calls, exchanges close leveraged positions, forced selling increases, and additional longs become vulnerable. And the cycle continues... The decline is being amplified by forced selling, not just ordinary spot market activity. 4. MACROECONOMIC PRESSURE IS ADDING TO THE SELLING Inflation concerns, uncertainty around future Federal Reserve rate cuts and weakness in technology stocks are making investors more cautious. Bitcoin remains sensitive to changes in liquidity and broader risk appetite. If investors expect interest rates to remain elevated for longer, speculative assets can face additional pressure. But these factors don't prove that every dollar of BTC selling is directly caused by the Fed. 5. THE TECHNICAL STRUCTURE IS STILL BEARISH Now compare all those developments with the actual Bybit chart... BTC is trading below its major daily moving averages: • EMA7: $72,902 • EMA14: $74,909 • EMA28: $77,133 The 4H chart confirms the weakness. • EMA7: $70,888 • EMA14: $72,066 • EMA28: $73,290 Price is below all three, and the market continues forming lower highs and lower lows. Bitcoin has already touched $67,468, before recovering slightly toward $68,850. That recovery alone is NOT enough to confirm a reversal. 6. IS $65,000 THE NEXT TARGET? For me, the important downside levels are: $67,468 → $66,000 → $65,000 If Bitcoin loses $67.4K with sustained selling pressure, a move toward $65K becomes increasingly plausible. But there is also a risk for late SHORT sellers. After such aggressive liquidations, even a temporary recovery can trigger a sharp short squeeze. For a meaningful bullish recovery, BTC needs to reclaim: $70,900–$71,300, followed by $72,600–$73,300. Until that happens, the broader short-term structure remains bearish. Personally, i wouldn't blindly LONG just because Bitcoin has already dropped more than 45% from its ATH. And i wouldn't chase SHORT positions after a massive red candle without waiting for a proper setup either. ETF outflows, leveraged liquidations, macro uncertainty and bearish technicals are all adding pressure at the same time. Bitcoin has already lost $70K. Now the real question is whether buyers can defend $67.4K... or whether $65,000 becomes the next major battleground. #USPayrollsAndRateDecisionsDriveMacroWeek
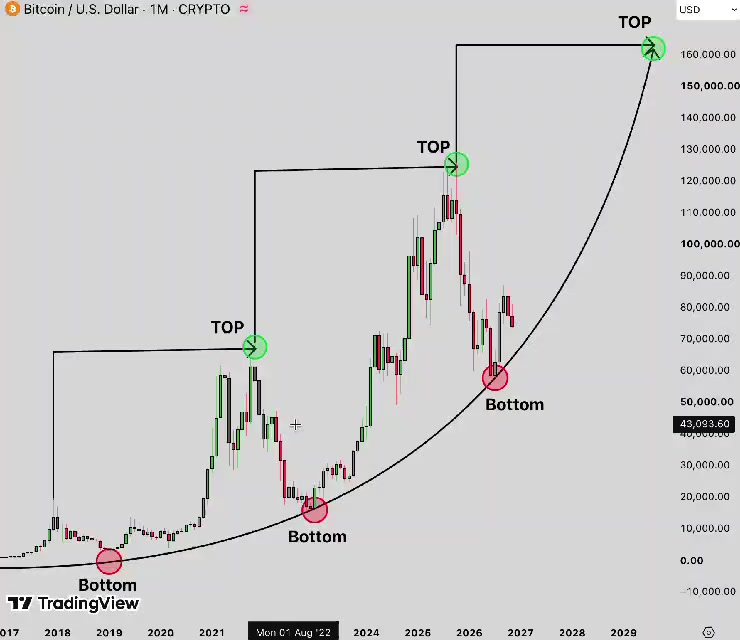

BTC keeps falling
BTC keeps falling below $70 down to $68 lets wait and see what comes next #BitcoinHitsTwoMonthLowAfterUSMidterms #USPayrollsAndRateDecisionsDriveMacroWeek #USInflationRunsHotAndRateHikeBetsRise @BybitX @Sabeer @btcflow @realklyro1 $BTCUSDT $NEARUSDT

HYPE‑USDT Trading & Analytics Brief (For WSOT Disclaimer: This is educational‑market overview only, not financial advice. 📌 About HYPE‑USDT HYPE‑USDT is the main trading pair for Hyperliquid’s native token on Bybit, available for spot and perpetual futures in the WSOT tournament. HYPE powers the Hyperliquid Layer‑1 trading blockchain, used for staking, governance, fee payments, and regular token‑buy‑and‑burn from protocol revenue . 📊 Core HYPE‑USDT Analytics To Watch ‑ On‑chain data: Total burned tokens, whale accumulation, staking ratio, new wallet growth ‑ Market metrics: 24‑h trading volume, open interest, funding rates, key support & resistance zones ‑ Key catalysts: Elysium Layer‑2 updates, institutional partnership news, global crypto market sentiment ‑ Risk note: HYPE has high volatility — price moves fast during WSOT trading rounds 🧩 WSOT Quick‑Check List for HYPE‑USDT 1. First check the overall crypto trend before opening HYPE positions 2. Track volume spikes — these often signal incoming momentum shifts 3. Mark clear support / resistance levels on your daily chart 4. Always set stop‑loss rules to protect squad tournament points ✅ Ready‑to‑Post WSOT Caption “HYPE‑USDT WSOT update! Hyperliquid’s ecosystem keeps expanding, with ongoing token‑burn activity and high trading volume — our squad watches key zones & news triggers closely for set‑ups!” $HYPEUSDT $SPXUSDT #ByXIMPACT #WSOT2026 #PiecesOf8 #NovUSCPIWatch #USPayrollsAndRateDecisionsDriveMacroWeek

Jensen Huang Resigned
THE MAN BEHIND NVIDIA'S AI EMPIRE. A POTENTIAL EXIT. A MARKET ON EDGE. Jensen Huang's reported departure could mark a defining moment for NVIDIA. Colette Kress reportedly takes the interim CEO position, but the bigger challenge is maintaining the momentum behind one of the most important companies in the AI economy. One question dominates: Is $NVDAXUSDT bigger than Jensen Huang? Wall Street may soon find out. #AITechSelloffErases2Point5TrillionFromNasdaq100 #USPayrollsAndRateDecisionsDriveMacroWeek #BitcoinHitsTwoMonthLowAfterUSMidterms #AnthropicIPOTestsTheAIBoom #USInflationRunsHotAndRateHikeBetsRise


WHALE POSITIONING (honest version)
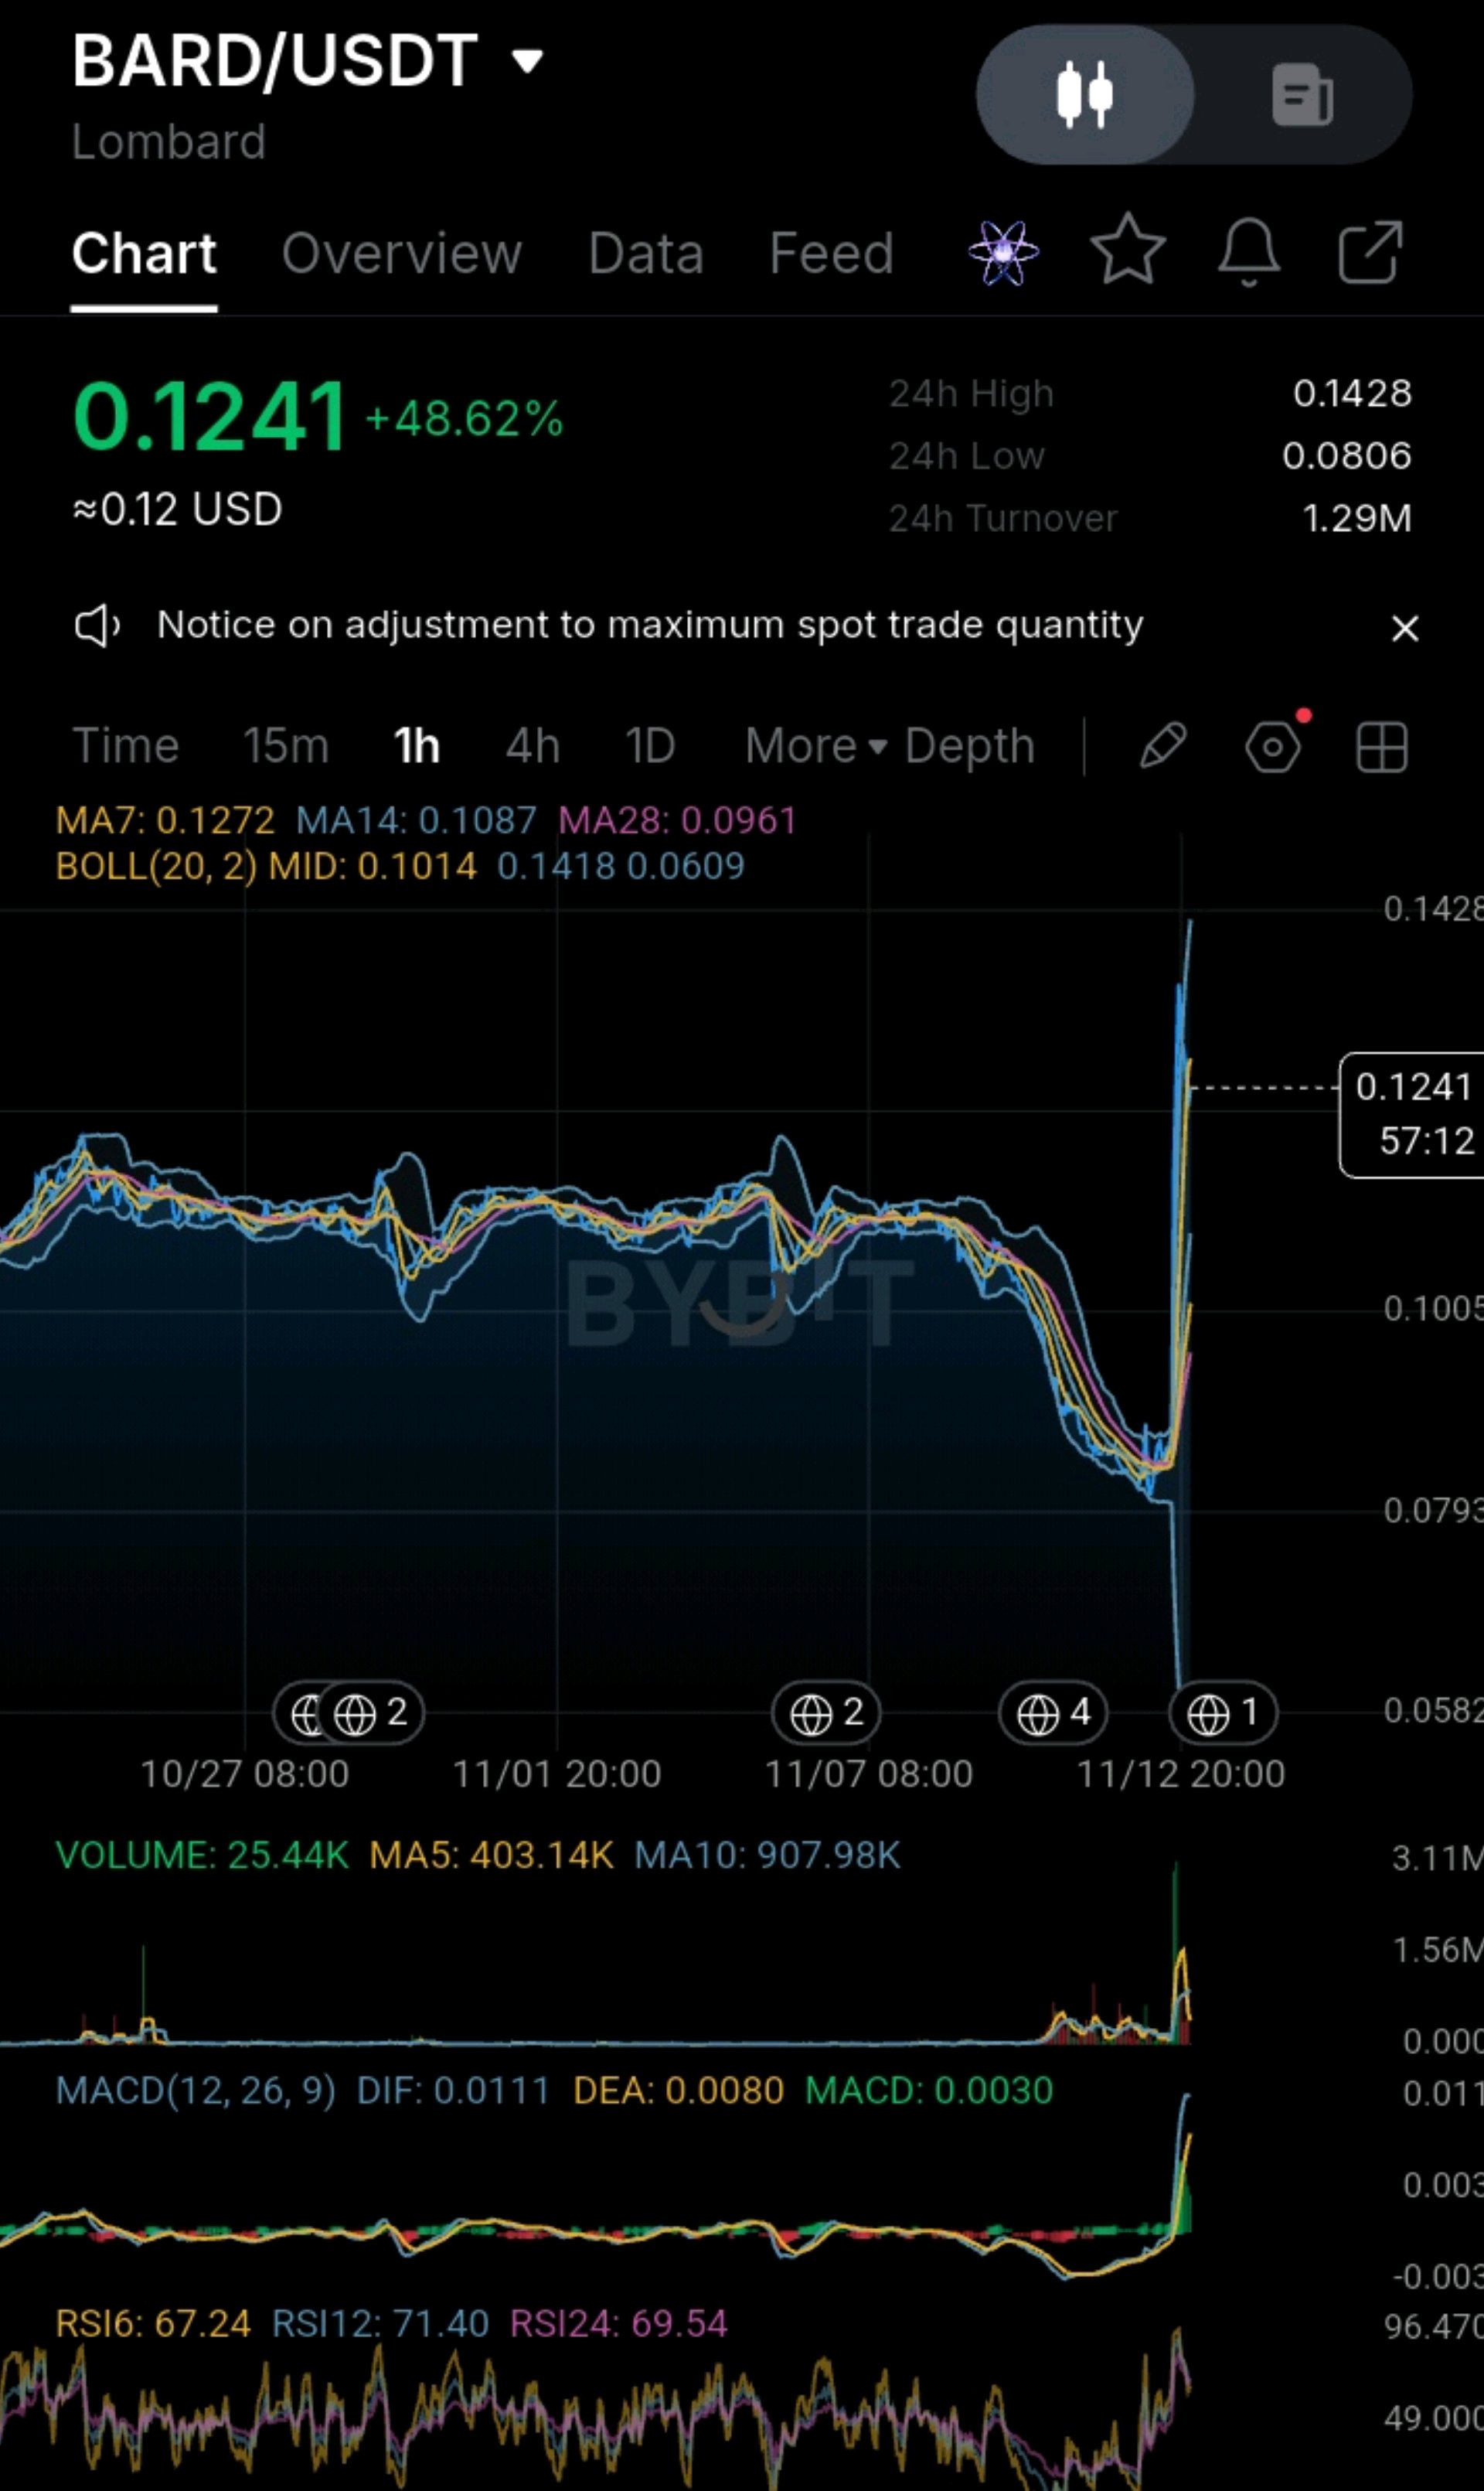
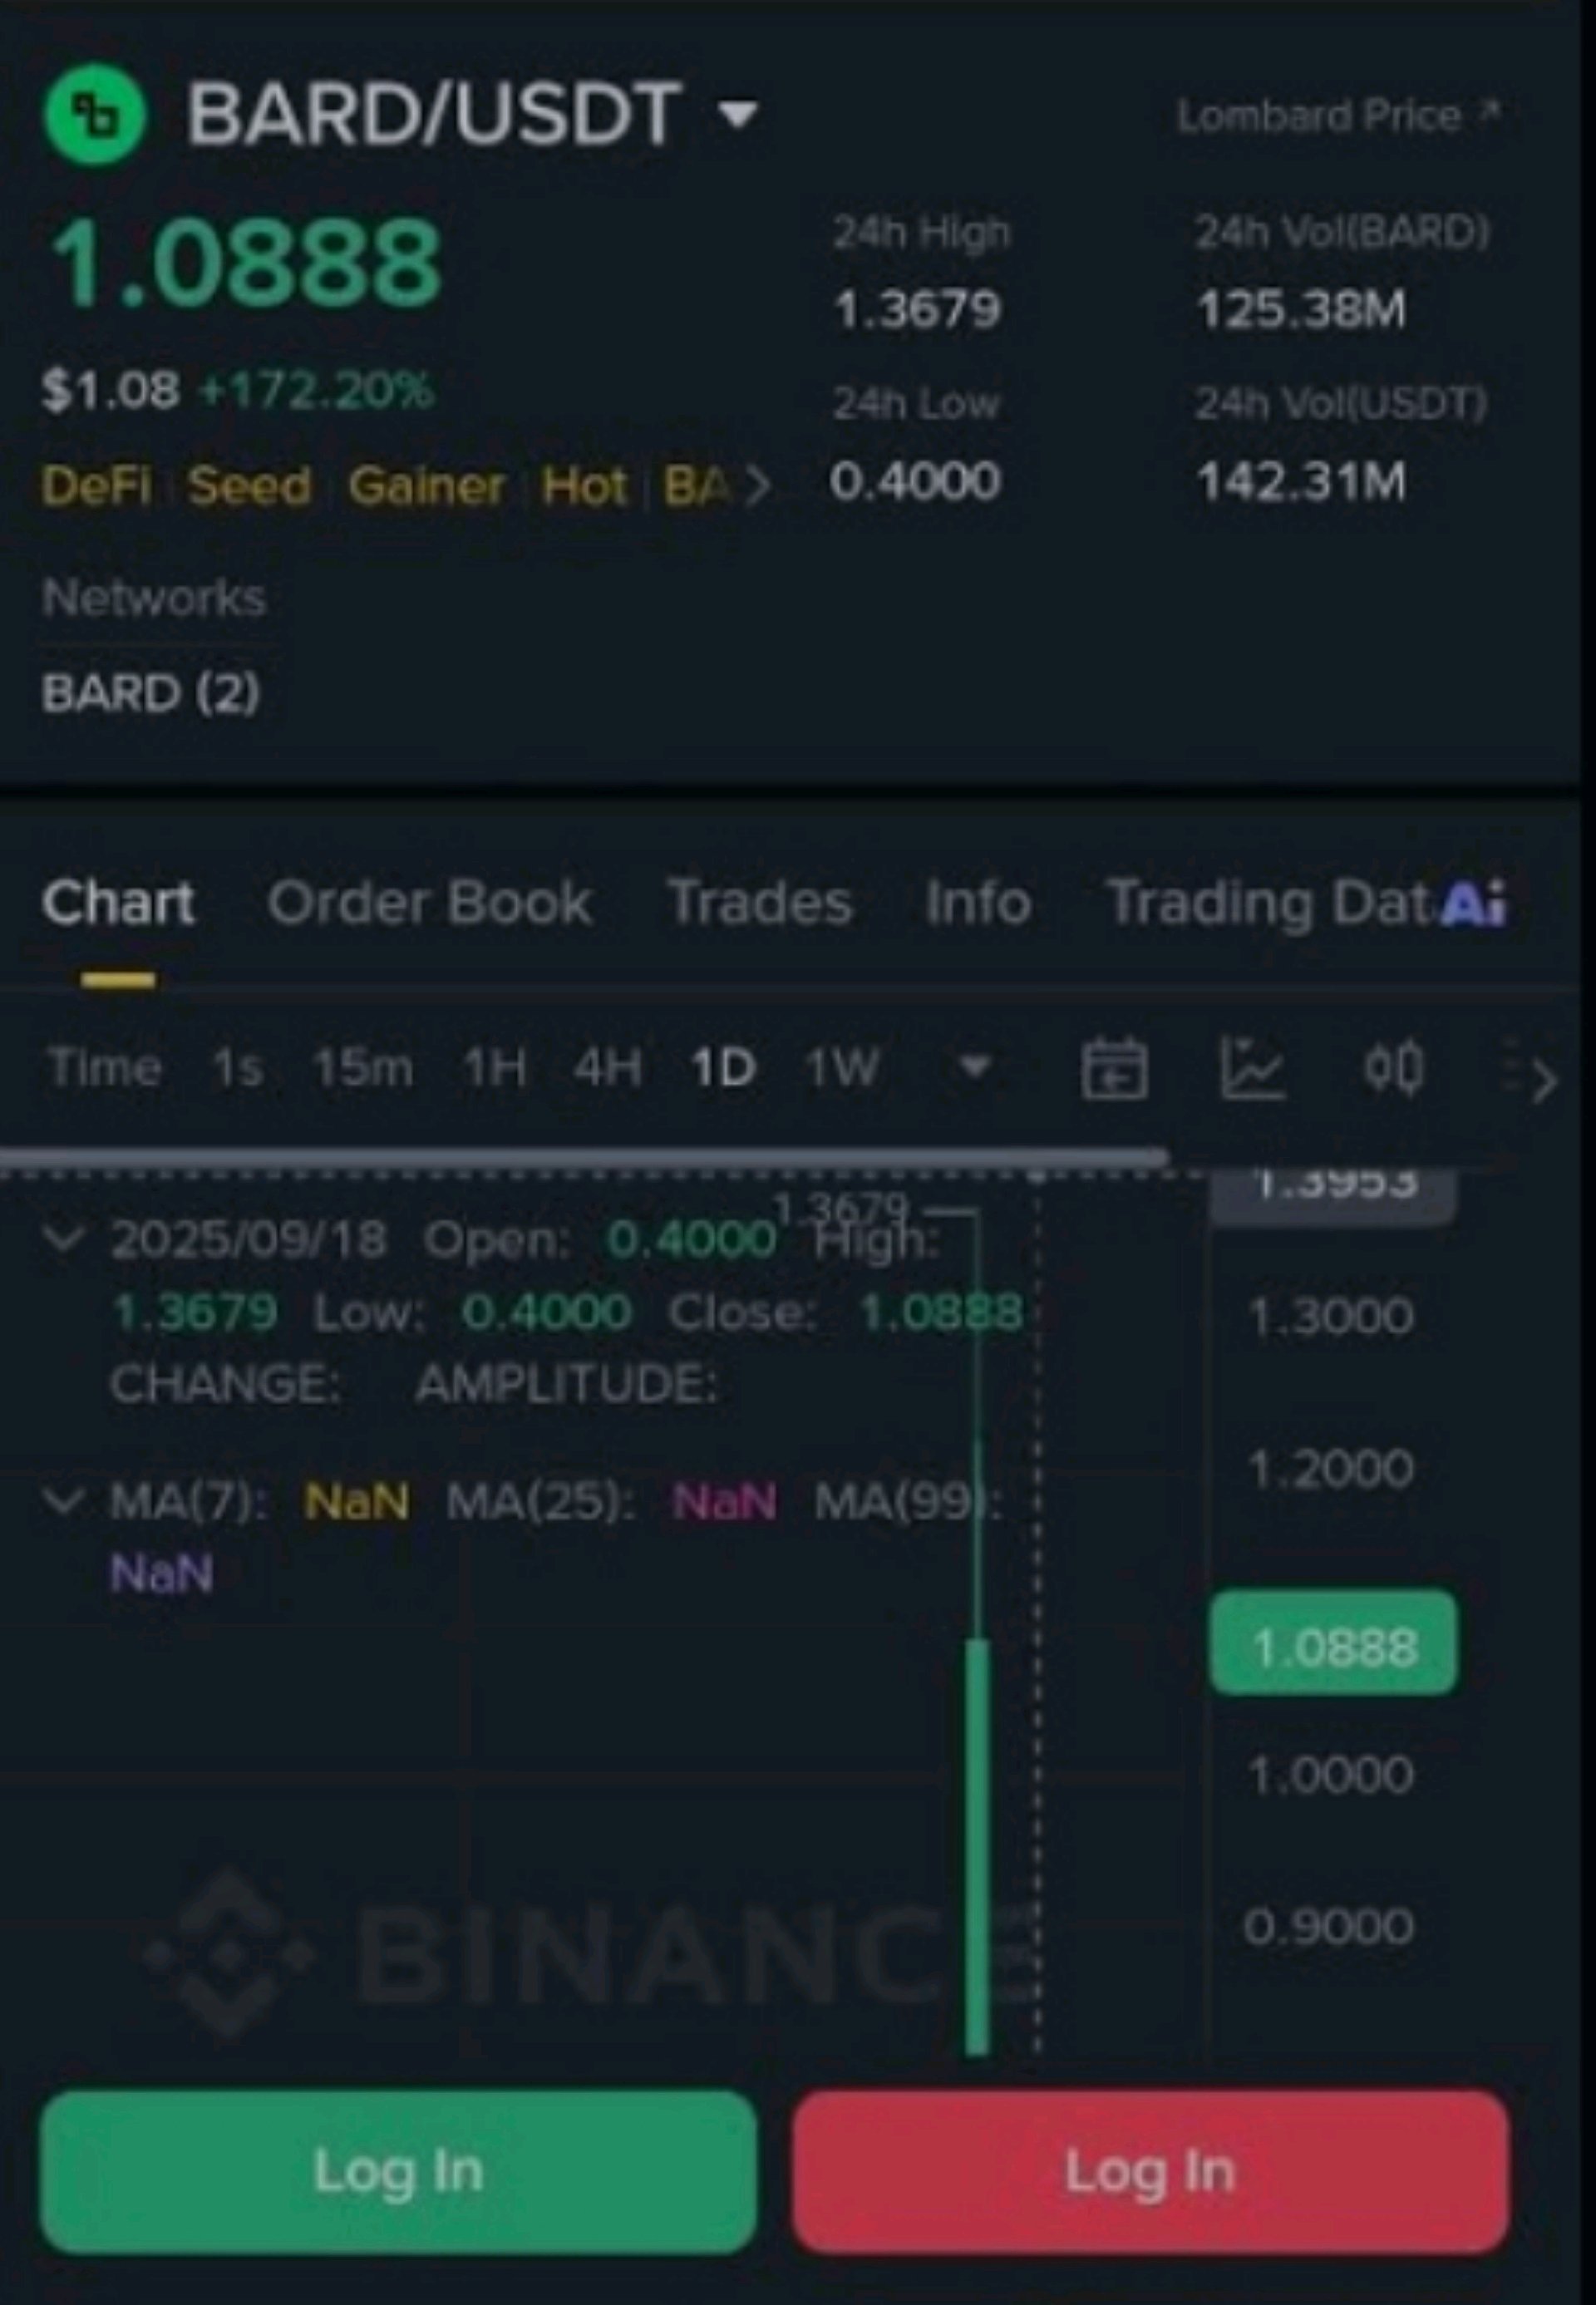
#IMPACTbyTrade #USInflationRunsHotAndRateHikeBetsRise #WSOT2026 #NovUSCPIWatch #USPayrollsAndRateDecisionsDriveMacroWeek 🐋 WHALE POSITIONING (honest version) BARD: the main whale-related risk is scheduled supply. Private investors were set to get 20% of the supply on a 12-month cliff with 36-month vesting, and the investor and team unlocks were reported to accelerate from September 2026. Large unlocks can add selling pressure, so check the current unlock dates. One older snapshot showed perps volume at about 14x spot, which suggests leveraged traders drive much of the action, but that data is undated. KOR: a new listing usually means concentrated early holders, a small float and heavy speculation. One snapshot showed about $1.1M of perp open interest and a positive funding rate of 0.0294% per 8 hours, meaning longs were paying to hold, which can unwind quickly. The Series A investors raised money at a $100M valuation in July 2026, so there may be early holders sitting on large, locked positions. That is a risk to verify, not a conclusion. Use Arkham and Nansen for labeled wallets, the explorer's holder page (Etherscan for BARD, Basescan for KOR), Coinglass for open interest and funding, and the projects' own docs for unlock dates. 📈 TECHNICAL INTERPRETATION BARD: a breakout that has started to retrace. Price is above the MA14 but below the MA7, volume is fading, and RSI is elevated (RSI6 67.24, RSI12 71.40, RSI24 69.54). Resistance is 0.1272 (MA7), then 0.1418 and 0.1428. Support is 0.1087 (MA14), 0.1014 (BB mid), 0.0961 (MA28), then 0.0806. KOR: a stronger trend that is dangerously stretched. The structure is bullish, but RSI6 at 75.45 and a gap of nearly 50% above the MA14 argue for patience. Resistance is 0.000629, then about 0.000680 (an estimate). Support is 0.000546 (upper band), about 0.000528 (the earlier spike zone), 0.000479 (MA7), then 0.000403/0.000396 and the 0.000301 low. Quick scorecard: Short-term trend: KOR is stronger. BARD has already lost its MA7. Momentum: both have fresh MACD crosses up. KOR's volume holds better, and BARD's is fading fast. Extension: BARD is less stretched. KOR is far more extended. Project maturity: BARD is clearly more established. KOR is days old. Overall risk: KOR is much higher, and BARD's is the unlock overhang. Best entry area: BARD is 0.1090-0.1130 (MA14). KOR is 0.000480-0.000500 (MA7), which is about 16-19% below the current price. 🧭 ADVICE TO BEGINNERS Don't chase a +45% candle. Both of these are better after a pullback than at the highs. Be extra careful with brand-new listings. KOR has already fallen roughly 98% from its listing-day high, and a bounce inside that is not a trend change. Check the unlock schedule. Heavy scheduled unlocks, like BARD's, can keep pressure on the price even when the chart looks good. Watch funding rates. A positive funding rate that stays high, as KOR's did in the snapshot, means longs are crowded and vulnerable. Use limit orders on thin tokens, since spreads and slippage cost real money. Always set a stop before you enter, and don't move it once you're in a trade. Risk only 1-2% of your account per trade. With stops this wide, that means a small position. Skip leverage until you're consistent. 🎯 MY VIEW On risk-adjusted terms, BARD is the better candidate: more established, less extended, and with a clear pullback zone. I'd want a bounce at the MA14 or a reclaim of 0.1272 on rising volume. KOR has the stronger chart right now, but it's a days-old, tiny-cap listing that is nearly 50% above its averages, so if you trade it, keep the size small and wait for a pullback to the MA7 zone. Neither is a chase here. Call to action: Which one holds up better if the market cools, $BARDUSDT or $KORUSDT? Drop your pick 👇 and set alerts at BARD 0.1272 / 0.0990 and KOR 0.000629 / 0.000440, then tell me whether you're waiting for a pullback or a breakout. This is technical analysis for discussion, not financial advice. New listings and small-cap tokens are highly volatile and you can lose your whole stake, so use your own risk limits and always use a stop. Market-cap and unlock figures come from data sites that disagree with each other and are not always dated, so check them live before relying on them. Tell me in the comment, the data site you use for research. $BTCUSDT $KORUSDT


i need a girl from USA or Europe
#ShowMyRWATrades #USInflationRunsHotAndRateHikeBetsRise @usayouths #SanDiskAnnounces8For1StockSplit @AMERICA #USPayrollsAndRateDecisionsDriveMacroWeek phne#2348137826026 can you be my girlfriend dats mi watsap relationship #USPayrollsAndRateDecisionsDriveMacroWeek
i need a girl from USA or Europe
#ShowMyRWATrades #USInflationRunsHotAndRateHikeBetsRise @usayouths #SanDiskAnnounces8For1StockSplit @AMERICA #USPayrollsAndRateDecisionsDriveMacroWeek phne#2348137826026 $BTCUSDT @miami @NEWYORKSTOCKEXCHANGE
i need a girl from USA or Europe
#ShowMyRWATrades #USInflationRunsHotAndRateHikeBetsRise @usayouths #SanDiskAnnounces8For1StockSplit @AMERICA #USPayrollsAndRateDecisionsDriveMacroWeek phne#2348137826026 $BTCUSDT @miami @NEWYORKSTOCKEXCHANGE


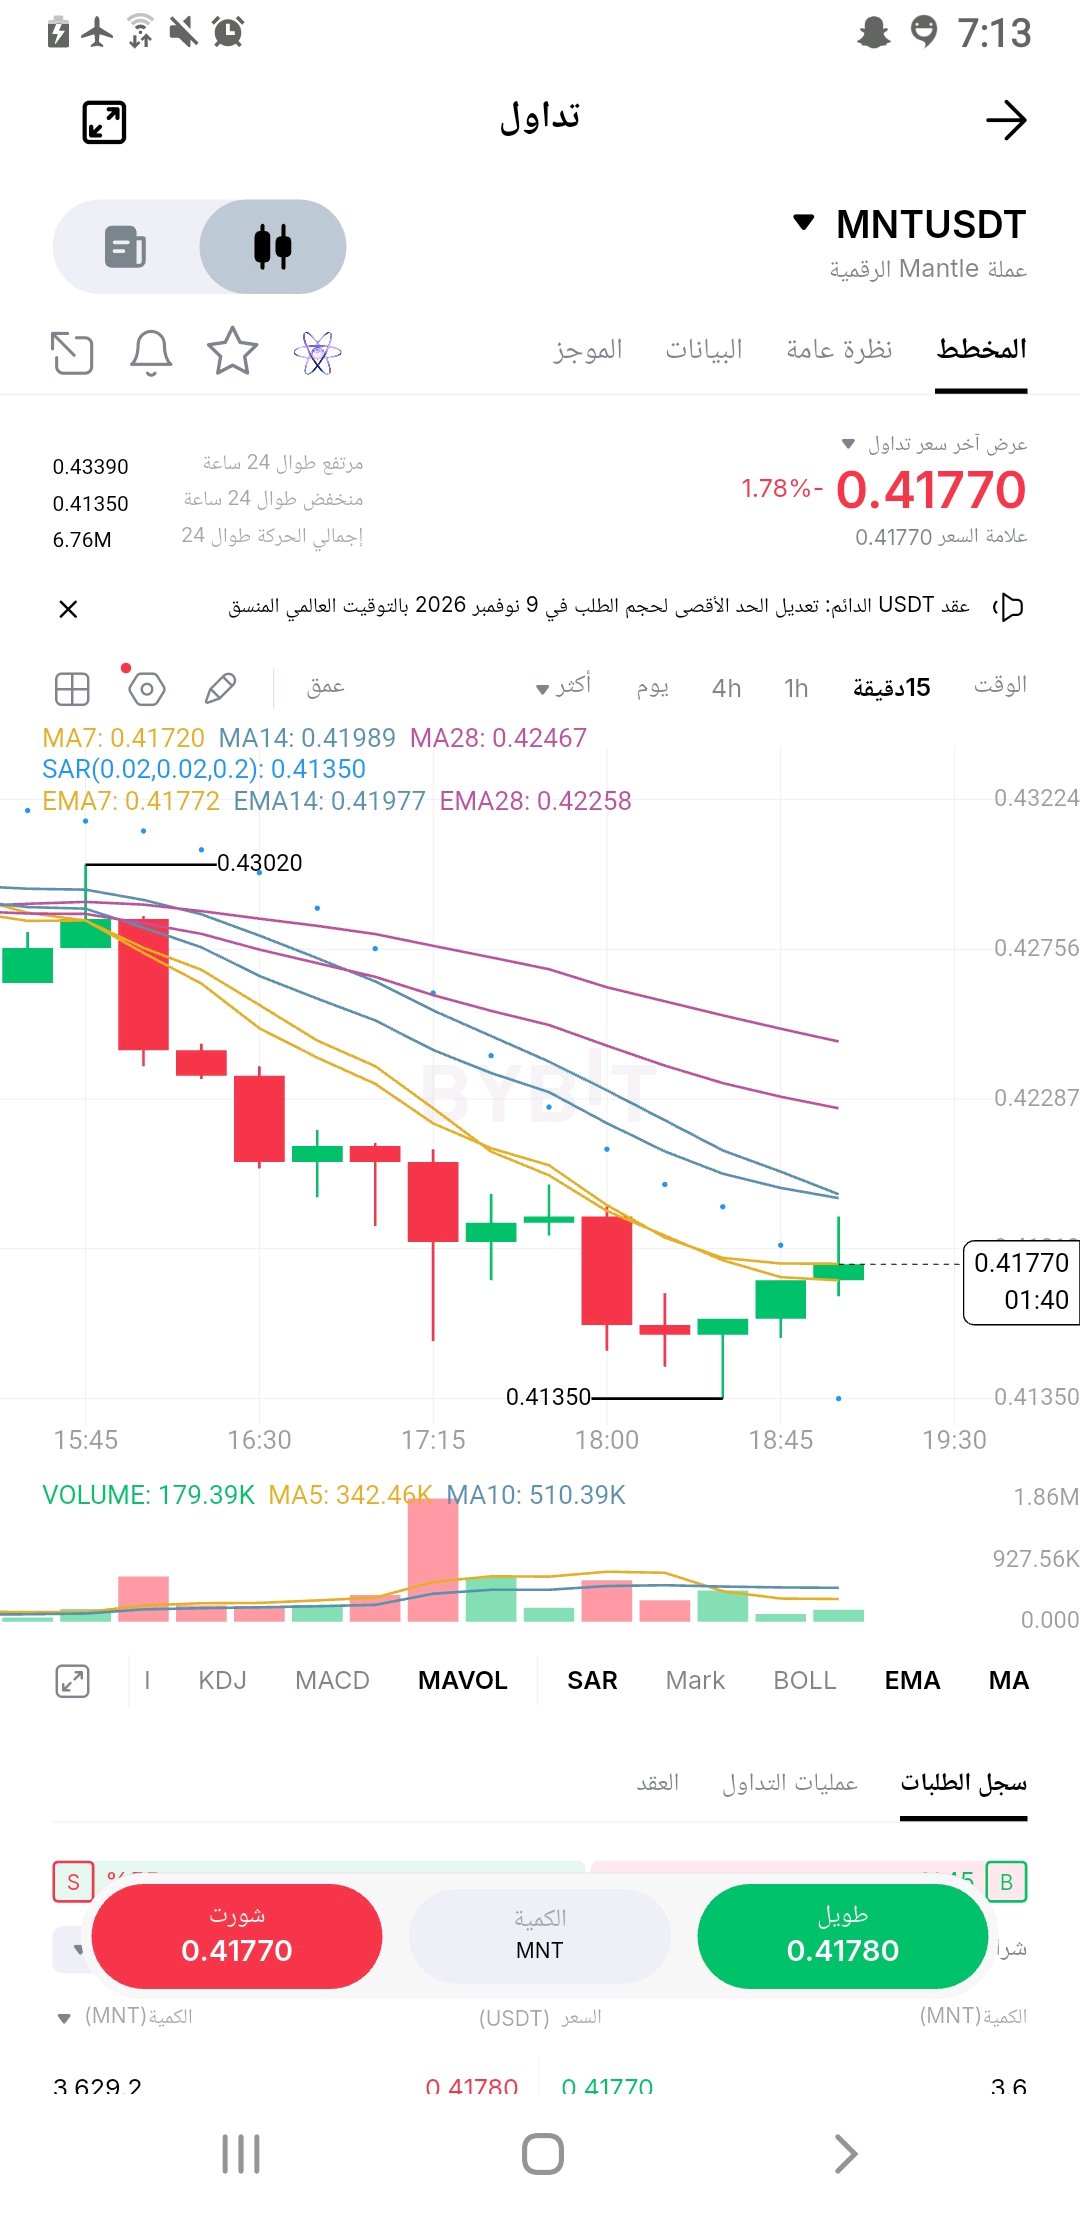
🚨 MNT is poised for a strong move! Has the bullish bounce begun? 🔥 💎 MNT/USDT | 15-minute timeframe 💰 Current price: $0.4177 🟢 Entry zone: $0.4170 – $0.4190 🚀 Bullish confirmation: Breakout above $0.4200 🎯 TP1: $0.4225 🎯 TP2: $0.4245 🎯 TP3: $0.4280 🛑 Stop loss: $0.4130 📊 A bounce from the $0.41350 support is underway as the price attempts to regain momentum, but the trend still needs confirmation with a break above the $0.4200 resistance. 🔥 All eyes are on MNT... Will we witness a new surge? #MNT #Crypto #Bybit #Trading #Altcoins ⚠️ Technical analysis is not a guarantee of profit. Risk management is key. #WSOT2026 #ارتفاع التضخم الأمريكي وزيادة الرهانات على رفع أسعار الفائدة #كشوف المرتبات الأمريكية وقرارات أسعار الفائدة تحرك الأسبوع الاقتصادي #مراقبة مؤشر أسعار المستهلك الأمريكي لشهر نوفمبر $MNTUSDT #ByXIMPACT $SUIUSDT @ByX

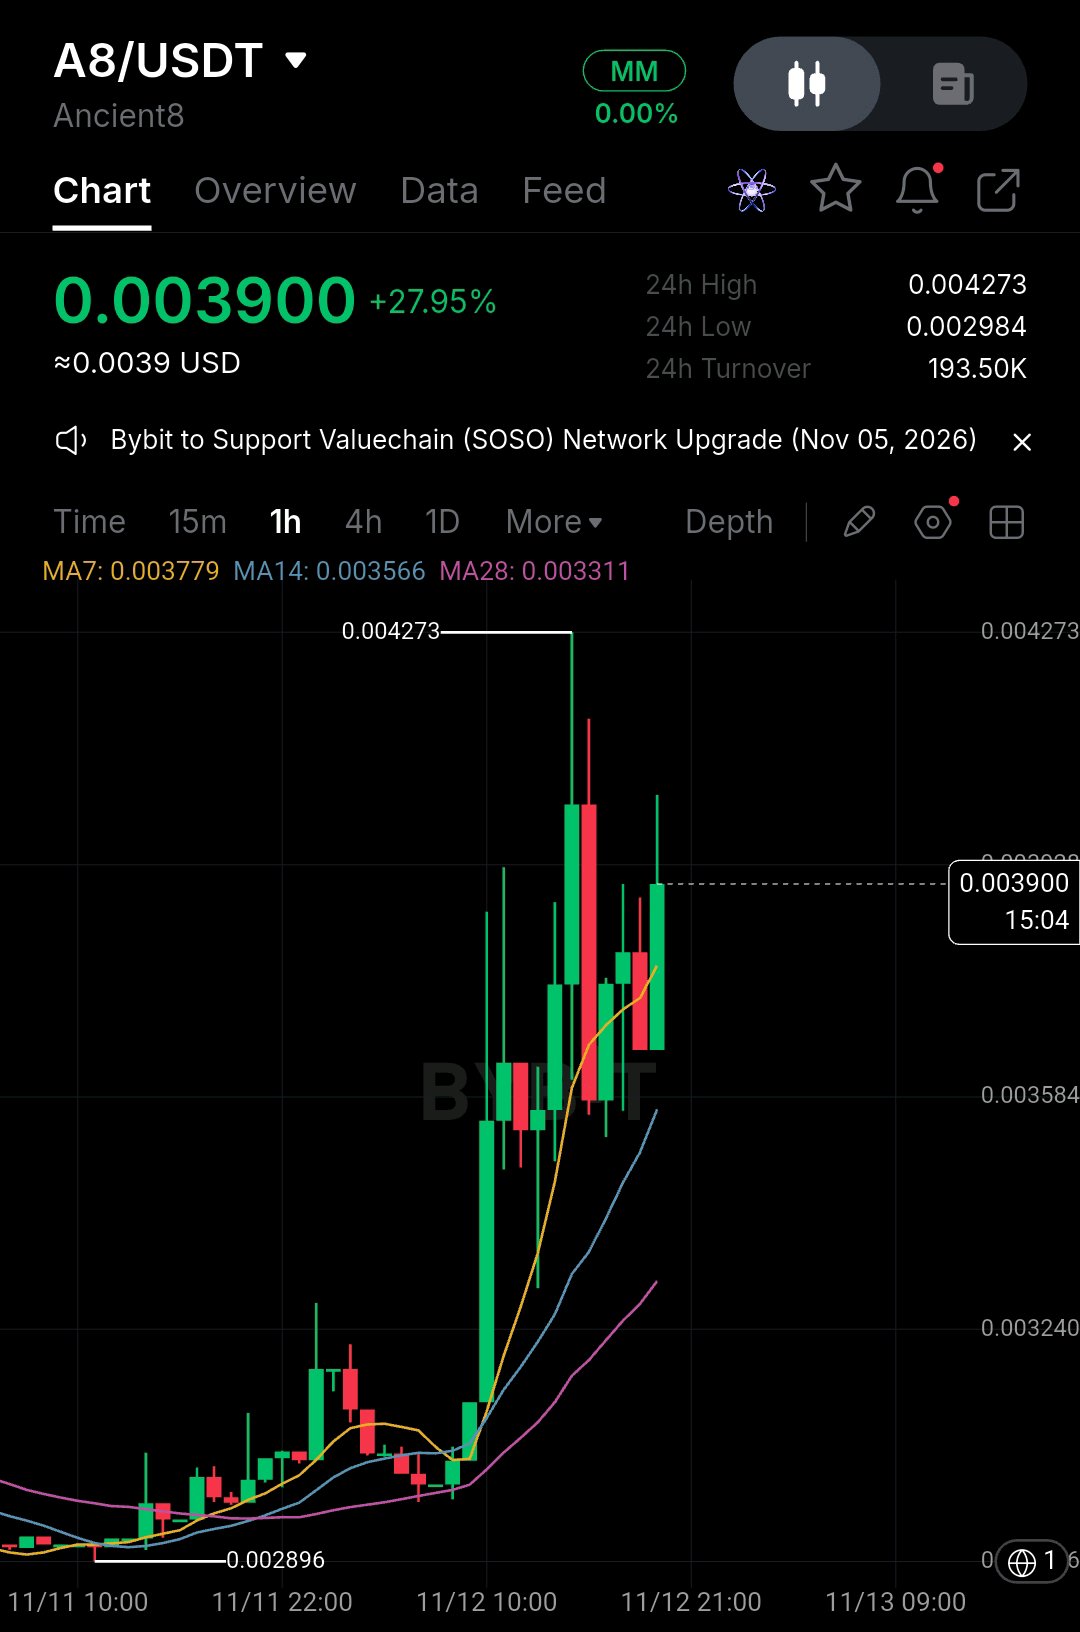
$A8 IS SHOWING STRONG MOMENTUM — BUYERS ARE TAKING CONTROL. 🚀 Ancient8 ($A8) is up nearly 28% in the last 24 hours, with price trading around $0.00390 after a strong breakout on the 1H timeframe. The chart is showing a clear shift in momentum. Price is holding above the 7, 14 and 28-period moving averages, suggesting buyers are maintaining short-term control. The key level I'm watching is $0.00427, the recent swing high. A clean breakout and sustained close above this resistance could open the door for another upside extension. On the downside, $0.00378 is the first level to watch, followed by the $0.00358 support zone. Momentum is strong, but after such a sharp move, some consolidation or a healthy pullback would not be surprising. I'm watching for confirmation rather than chasing the green candles. $A8 | Patience over FOMO. $A8USDT #WSOT2026 #USPayrollsAndRateDecisionsDriveMacroWeek #NovUSCPIWatch #PiecesOf8 #USInflationRunsHotAndRateHikeBetsRise
The 1H chart just gave us a textbook capitulation candle. $AAVEUSDT Price absolutely nuked down to $110.45, sweeping the lows and triggering panic stops. But look at that immediate rejection—we are already back at $112.57. The bears overplayed their hand, and the MACD is already showing hidden bullish divergence. The bounce is loading. Here is the Trade Setup: 🎯 EP (Entry Point): $112.57 (Current Market Price) · We are buying the immediate rejection of the sweep. 🛑 SL (Stop Loss): $109.50 · Strict risk management. If we lose the $110.45 wick low, the setup is invalidated, and the dump continues. No holding and hoping. 💰 TP (Take Profit): · TP1: $116.39 (Local resistance / reclaiming the breakdown level) · TP2: $124.00 (Major liquidity grab above / previous structural supply zone) The Numbers: · Risk: ~2.7% (Downside) · Reward: ~10.1% (Upside to TP2) · R:R Ratio: 3.7 : 1 The trend is heavy, but the selling is exhausted. We play the bounce, take the liquidity, and protect the capital. Let's ride the relief rally. 🚀 #ByXIMPACT #WSOT2026 #USInflationRunsHotAndRateHikeBetsRise #USPayrollsAndRateDecisionsDriveMacroWeek #DeutscheBankLaunchesDigitalAssetCustody $AAVEUSDC

🚨 BREAKING: MAJOR SHAKE-UP AT NVIDIA!
Jensen Huang has reportedly resigned as NVIDIA CEO and board member, effective immediately, with CFO Colette Kress stepping in as interim CEO. If confirmed, this would mark one of the biggest leadership changes in the AI and semiconductor industry. With NVIDIA at the center of the global AI boom, the market will be watching closely for what comes next. A new chapter for NVIDIA begins. 👀 #USPayrollsAndRateDecisionsDriveMacroWeek #WSOT2026 #USInflationRunsHotAndRateHikeBetsRise



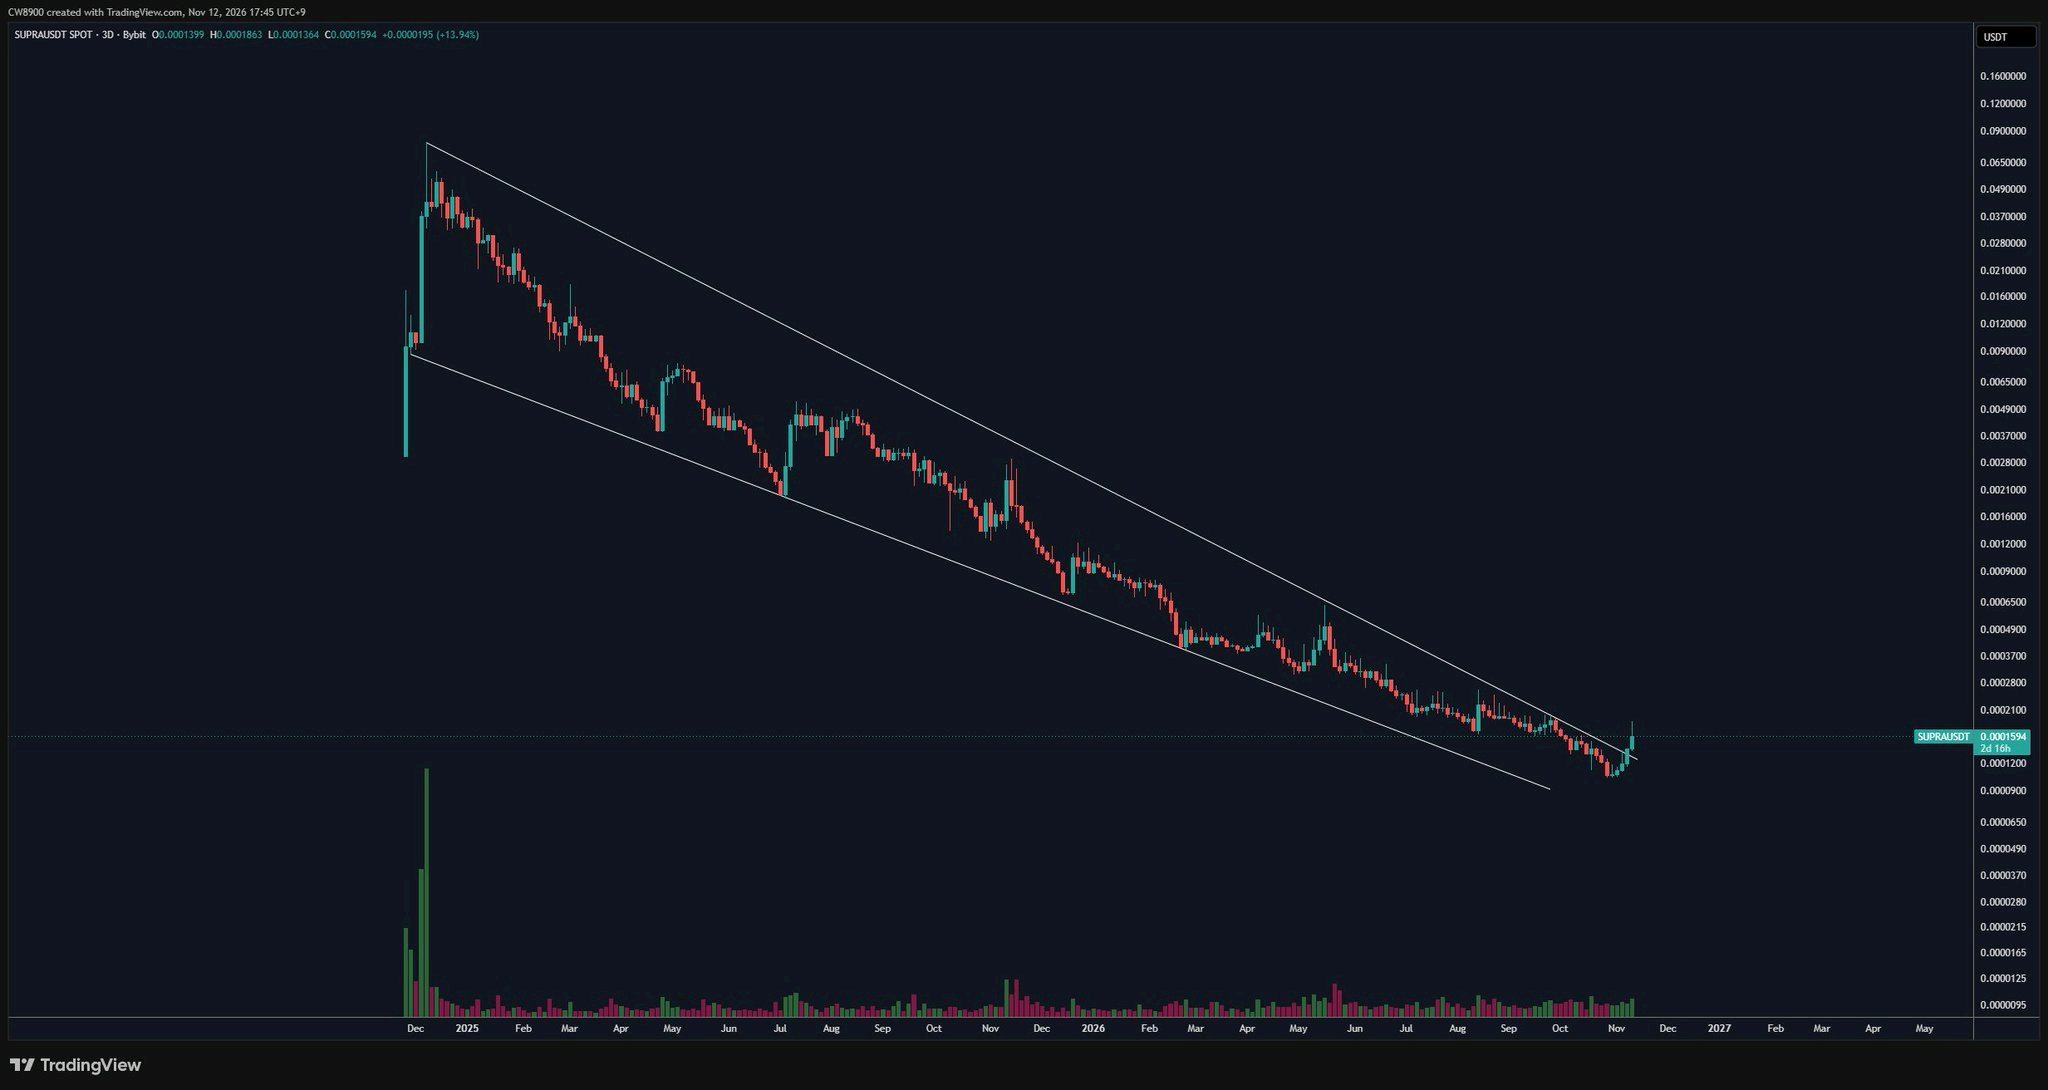
$SUPRAUSDT has broken out of a massive falling wedge pattern. The downtrend has ended, and an uptrend is beginning. #USPayrollsAndRateDecisionsDriveMacroWeek #NovUSCPIWatch #DeutscheBankLaunchesDigitalAssetCustody #AITechSelloffErases2Point5TrillionFromNasdaq100 #PiecesOf8
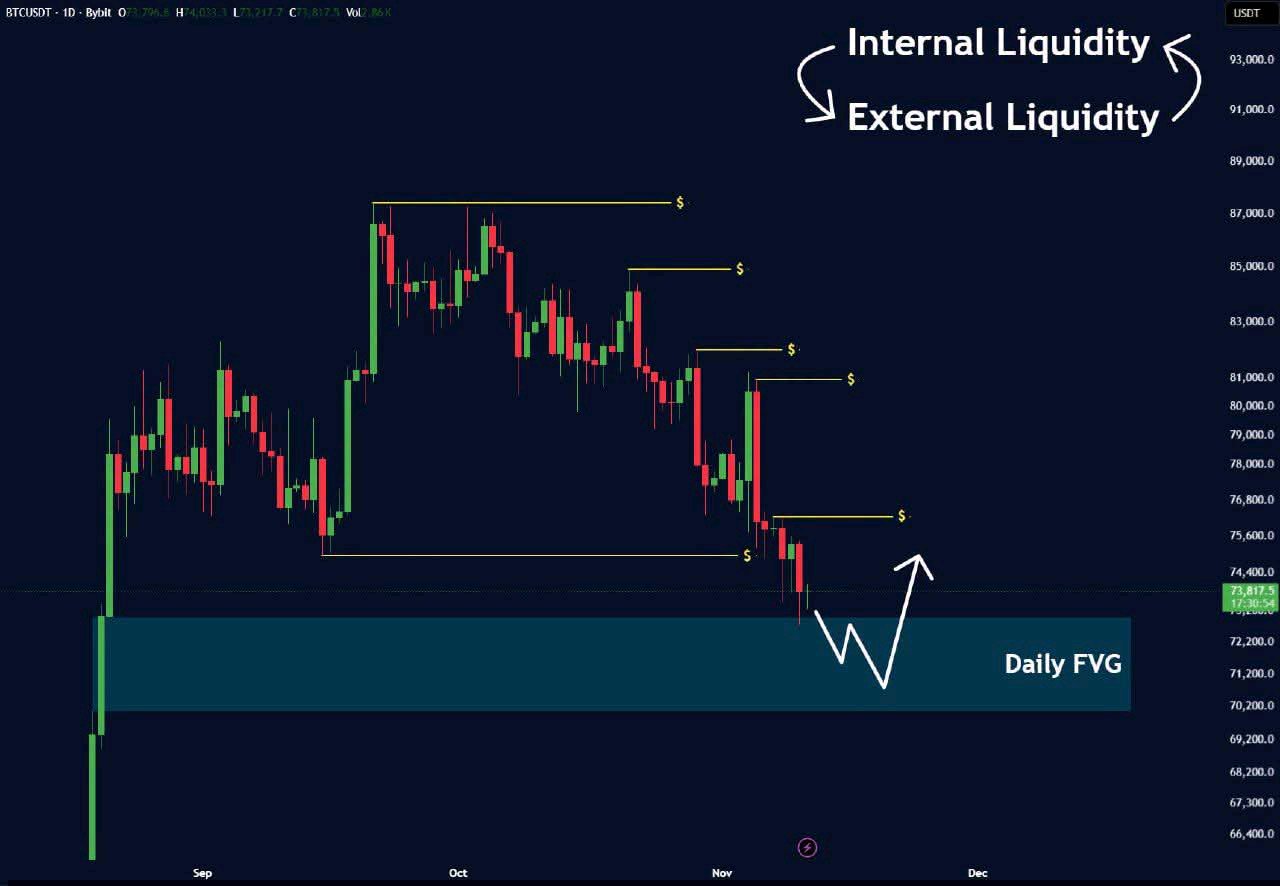
BTC has approached the Daily FVG around $70K–$73K. 👀 Could this be where we see a bounce from? What's your take for today? 🔥 #USInflationRunsHotAndRateHikeBetsRise #AnthropicIPOTestsTheAIBoom #SanDiskAnnounces8For1StockSplit #PiecesOf8 #USPayrollsAndRateDecisionsDriveMacroWeek $BTCUSDT

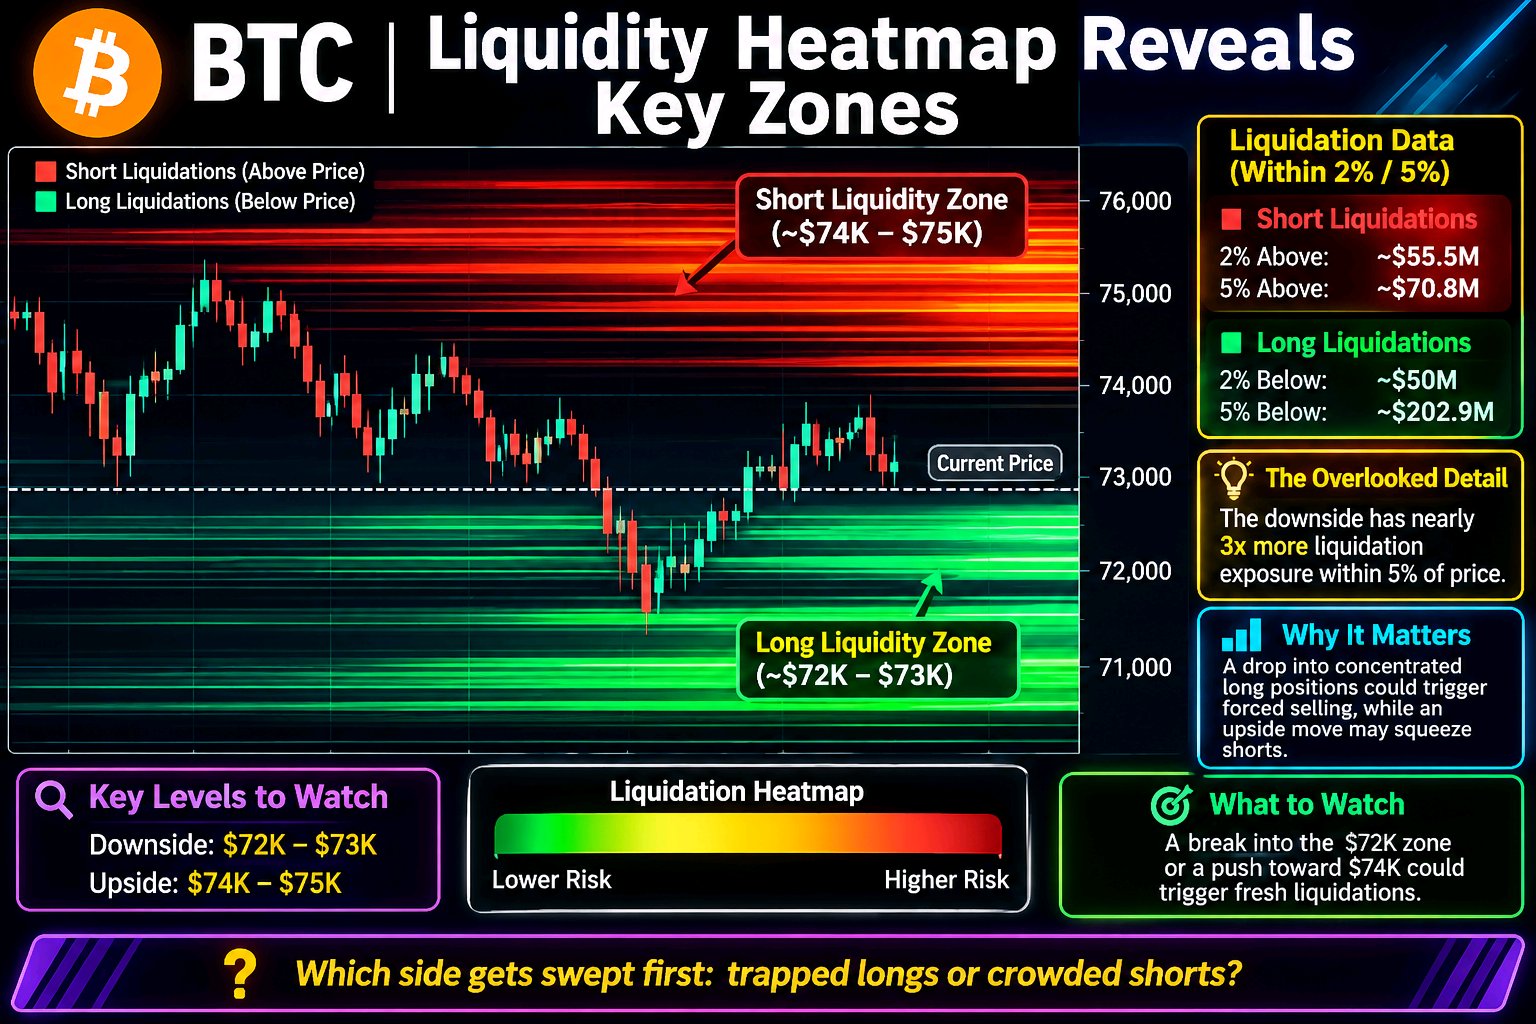
BTC Liquidity Clusters Reveal Two Key Zones
$BTCUSDT Bitcoin is approaching a liquidity battle on both sides, but the downside carries a much larger pool of potential liquidations. Market Observation — November 12 Around 05:26 UTC, BTC liquidation data showed: - Long liquidations within 2% below price: approximately $50M. - Short liquidations within 2% above price: approximately $55.5M. - Long liquidations within 5% below: approximately $202.9M. - Short liquidations within 5% above: approximately $70.8M. The Overlooked Detail The downside has nearly three times the estimated liquidation exposure within 5% of price. Why It Matters A drop into concentrated long positions could trigger forced selling and accelerate volatility. Meanwhile, an upside move could squeeze shorts near current levels. What to Watch Watch the $72K–$73K downside area and nearby $74K–$75K upside liquidity. These are estimated liquidation zones, not guaranteed price targets. Which side gets swept first: trapped longs or crowded shorts? #NovUSCPIWatch #AnthropicIPOTestsTheAIBoom #USPayrollsAndRateDecisionsDriveMacroWeek

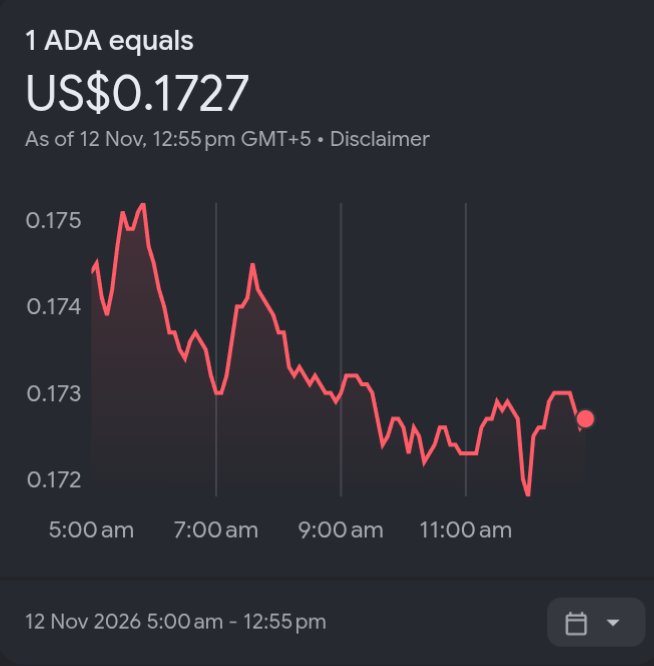
CARDANO (ADA) LATEST MARKET UPDATE 🚨
$ADAUSDT CARDANO (ADA) MARKET ANALYSIS | NOVEMBER 12, 2026 Cardano is currently trading around $0.1742, with sellers maintaining pressure on the daily timeframe. 📊 Technical Overview: • Current Price: $0.1742 • Resistance 1: $0.1782 • Resistance 2: $0.1827 • Support 1: $0.1706 • Support 2: $0.1648 📈 Bullish Scenario: A strong breakout above $0.1782 could push ADA towards $0.1827. 📉 Bearish Scenario: A breakdown below $0.1706 could bring further downside towards $0.1648. Market Sentiment: Bearish in the short term. RSI indicates weak momentum, so traders should watch for confirmation before entering positions. 🎯 My Strategy: Watch key support and resistance levels. Avoid chasing sudden price movements. What is your prediction for ADA? 🚀 BULLISH or 🔻 BEARISH? #USPayrollsAndRateDecisionsDriveMacroWeek #NovUSCPIWatch #AnthropicIPOTestsTheAIBoom #OilVolatilityTracksIranPeaceTalks #PiecesOf8 #ADA #Cardano #CryptoAnalysis #BinanceSquare #CryptoTrading


🥷$ASTER:BEYOND PRICE ACTION
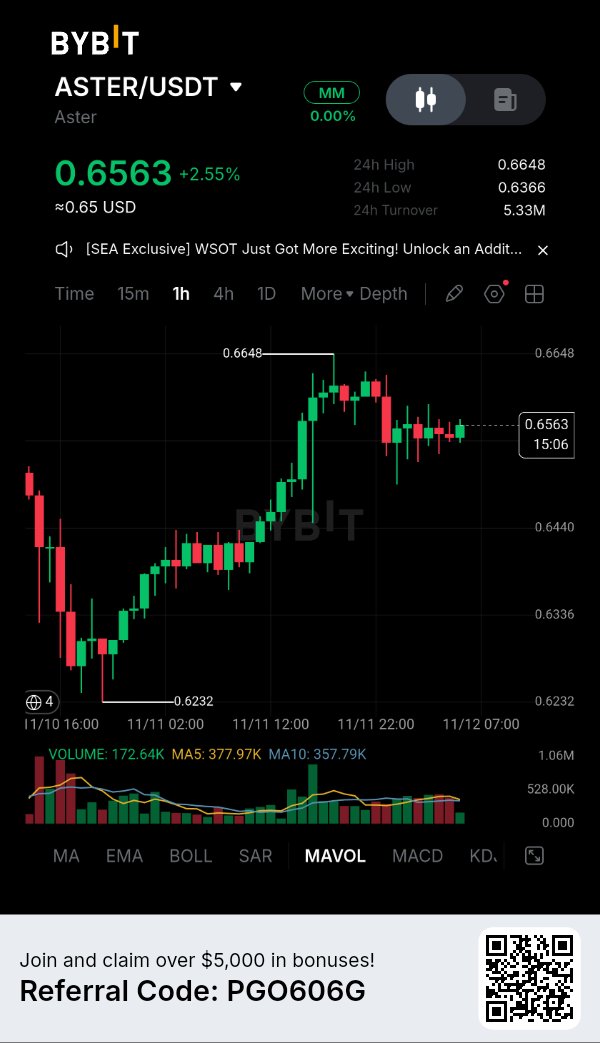
Aster is attracting attention, but the real opportunity may lie beyond short-term price movements. The project recently reported $35 billion in cumulative taker volume through its USD1 RWA Boost program after 10 epochs. This highlights significant trading activity, although volume should not be confused with revenue or net capital inflows. Sotwe Market overview — November 12: ASTER price: approximately $0.6548 24H change: +2.39% 24H range: $0.6362–$0.6643 Open interest: approximately $368.47M What I'm watching: The $0.6362 area is an important short-term reference. A confirmed breakout above $0.6643 could strengthen bullish momentum, with $0.68 as the next area to monitor. However, failure to hold support could expose ASTER to renewed selling pressure. Fundamentally, Aster's combination of perpetual trading, RWA exposure, multi-chain infrastructure and fee-linked buybacks makes it an interesting DeFi ecosystem to follow. Its long-term success will depend on sustainable adoption, real revenue and token utility. DefiLlama +1 My perspective: I'm interested in ASTER's ability to transform trading activity into sustainable ecosystem growth. A price rally is temporary; real utility is what deserves long-term attention. 💬 Do you believe ASTER has the potential to become a major player in DeFi? $ASTERUSDT #ByXIMPACT #USInflationRunsHotAndRateHikeBetsRise #USPayrollsAndRateDecisionsDriveMacroWeek #OilVolatilityTracksIranPeaceTalks #AnthropicIPOTestsTheAIBoom


THANKS TO MY BYBIT FAMILY
💙 BYBIT FAMILY — STRONGER TOGETHER, GROWING TOGETHER! 🚀 Every great journey becomes special because of the people who walk alongside us. My Bybit family, you are more than followers; you are a community built on support, trust, friendship, and shared dreams. I truly appreciate every like, comment, repost, and encouraging word. Your love and support motivate me to keep creating, learning, sharing, and growing every single day. The digital world is full of opportunities, but the real achievement is building genuine connections with amazing people. Let's continue supporting one another, celebrating every milestone, and making this journey unforgettable. Thank you, Bybit family, for being part of my journey. ❤️ Together we grow, together we shine! #Bybit #BybitFamily #CryptoCommunity #TogetherWeGrow #PiecesOf8 #DeutscheBankLaunchesDigitalAssetCustody #NovUSCPIWatch #AnthropicIPOTestsTheAIBoom #USPayrollsAndRateDecisionsDriveMacroWeek $NEARUSDT $ETHUSDT


🚨 BITCOIN UNDER SELLING PRESSURE — WHAT'S NEXT?
Bitcoin traders need to stay alert. When the market turns red, panic is not a strategy. What I'm Watching: 1. Selling pressure and lower highs 2. Key support levels 2. Trading volume and breakout confirmation Bullish Scenario: If buyers regain control and BTC breaks above resistance, a recovery could develop. Bearish Scenario: If support breaks with strong selling volume, further downside may follow. My approach is simple: Wait for confirmation instead of chasing market movements. Remember, protecting capital is just as important as finding opportunities. What do you think? Is Bitcoin preparing for a recovery or another correction? $BTCUSDT $SOLUSDT #BitcoinHitsTwoMonthLowAfterUSMidterms #USPayrollsAndRateDecisionsDriveMacroWeek #AITechSelloffErases2Point5TrillionFromNasdaq100


Adam Back's $1M Bet Needs A Different Cycle
On CNBC this week, Adam Back said Bitcoin is still early in its cycle, and he's personally betting it tops $1 million before the cycle ends. He puts that in 2028. The quote going around says "later in 2028," but the coverage I found only says "by 2028."$BTCUSDT It isn't a new call. He floated $500,000 to $1 million by 2028 at the Bitcoin Conference in April, and again with Cointelegraph in June, arguing that today's retail and ETF demand could be enough on its own. His logic: most of Bitcoin's adoption, he guesses about 95%, is still ahead, and the big pools of retirement and fund money haven't really arrived. He calls it a personal bet, not a guarantee. So I did the arithmetic. From roughly $73,000 to $74,000 around November 10 to 11, $1 million means about 13.5 to 13.7 times today's price (my math). To get there by the end of 2028, Bitcoin would need to compound at roughly 240% to 290% a year, depending on whether "later in 2028" means December or October (my math). At that price, the whole network would be worth about $20 trillion, at about 20.1 million coins (my estimate). The part I keep coming back to is timing. Each of the last four peaks landed 12 to 18 months after a halving, and a bear market followed each time: - November 2013: about 12 months after the 2012 halving - December 2017: about 17 months after 2016 - November 2021: about 18 months after 2020 - October 2025, at about $126,000: about 17 to 18 months after April 2024 Those dates line up across several cycle trackers (CoinGecko covers the first three), though exact days vary by exchange. The June low was roughly $58,000 to $59,000. For $1 million in 2028, this cycle's real top has to arrive later than the last four did. Strategy, a company that sells bitcoin exposure, said on October 29 that it sees the start of the next bull market. Against that, US spot ETFs are about $1.1 billion negative for 2026 through November 9, and Bitcoin slipped under its 50-week average on the November 8 weekly close. My take: $1 million by 2028 is a far bigger claim than "early innings." I'm watching one checkpoint. Bitcoin back above $126,000 sometime in 2027 would be about +70% to +73% from here (my math). If it's still below that at the end of 2027, $1 million in 2028 needs at least about 8 times in a single year, and more if it's lower. #OilVolatilityTracksIranPeaceTalks #USPayrollsAndRateDecisionsDriveMacroWeek #AnthropicIPOTestsTheAIBoom #PiecesOf8 #NovUSCPIWatch


MY CRYPTO JOURNEY
My Crypto Journey — 3 Years of Hope, Losses and Learning* Three years ago, I was jobless. No income. No source. Life felt stuck. Then crypto found me. Crypto did not make me rich. It gave me something bigger — hope. It gave me a reason to wake up, to learn, to try again when everything felt closed. I started with Creator Pad campaigns and social media campaigns. I learned posting, engaging, building, and staying consistent. In trading, yes, I faced big losses. Losses that hurt and cannot be cured. But campaign rewards helped me survive, stay alive in this market, and keep going. My experience in crypto is not bad. It taught me patience, discipline, and reality. There is so much to learn about trading, about market, about myself. Now I want one thing more — friends. Because in this digital world, without friends, you are nothing. With friends, every loss becomes a lesson, and every win becomes a celebration. If you are on this journey, let's connect and grow together. #PiecesOf8 #AnthropicIPOTestsTheAIBoom #USPayrollsAndRateDecisionsDriveMacroWeek #NovUSCPIWatch #DeutscheBankLaunchesDigitalAssetCustody $BTCUSDT $NEARUSDT

SUPRA vs NIGHT
#IMPACTbyTrade #WSOT2026 #AITechSelloffErases2Point5TrillionFromNasdaq100 #NovUSCPIWatch #USPayrollsAndRateDecisionsDriveMacroWeek SUPRA vs NIGHT — Comparative Market Analysis 1H Technical Outlook | 12 November 2026 Which coin has the stronger momentum? Which has better entry potential? Where might the whales be positioning? both coins are showing bullish structures, but they are at different stages of their market movements. SUPRA: Aggressive breakout, strong buying momentum, but significantly overbought. NIGHT: Strong upward movement followed by consolidation, with a healthier RSI but weakening momentum. My initial assessment: SUPRA has stronger immediate momentum, while NIGHT currently offers a more balanced technical setup. 1. Side-by-side comparison Chart time frame, 1H (1H) Price in screenshot, $0.0001450 ($0.04746) 24H change, +14.72%(+10.60%) RSI(6), 86.77 (59.90) RSI(12)82.59 (65.48) RSI(24), 75.40 (65.61) MACD, Bullish (Slightly bearish) Volume trend, Increasing (Declining) Price structure, Breakout (Consolidation) Immediate condition, Overextended (Cooling off) What this comparison tells us SUPRA is winning the momentum battle. Its breakout has stronger volume confirmation, and its MACD remains bullish. However, the extreme RSI readings make chasing the price dangerous. NIGHT is winning the short-term risk/reward setup. Its RSI is healthier, and it is consolidating above important moving averages. However, declining volume and a bearish MACD crossover mean another upward move is not yet confirmed. 2. Whale positioning — Where is the big money? This requires separating actual on-chain evidence from what a candlestick chart suggests. SUPRA: Whale assessment There are three important observations: SUPRA has recorded a sharp price increase accompanied by rising trading volume. CoinGlass reported positive spot net inflows in its November 11 snapshot, although the reported inflow was relatively small. SupraTools provides tracking for large wallet movements, staking, unlocks and exchange transfers. However, I cannot establish from the available evidence that large investors are accumulating SUPRA right now. Positive spot inflows alone do not prove whale buying. Whale interpretation: Possible accumulation, but confirmation is missing. NIGHT: Whale assessment NIGHT presents a more interesting ownership picture. Cardanoscan currently reports: Approximately 127,435 holders. Top 100 holders control approximately 81% of supply. Top 10 holders control approximately 59.2%. 16 wallets are classified as whales, holding approximately 66% of supply. Cardanoscan There is also evidence of significant large-wallet trading. Recent reported transactions include: A purchase of approximately 891,584 NIGHT. A sale of 500,000 NIGHT. Another purchase of approximately 476,202 NIGHT. A sale of approximately 488,139 NIGHT. Super Cardano Whale interpretation: Large holders are active, but their positioning is mixed. The concentration of NIGHT ownership is an important risk. Large holders can influence liquidity and price movements. Important distinction: A large wallet is not automatically a whale accumulating. Some large wallets belong to exchanges, treasury operations, foundations or custodians. My assessment: SUPRA: Momentum-led buying, with whale confirmation still needed. NIGHT: Concentrated ownership, with evidence of substantial buying and selling. Neither chart proves that whales are preparing for another pump. 3. Strengths and weaknesses SUPRA — Supra Strengths Strong bullish breakout. Increasing trading volume. Positive MACD momentum. Strong short-term buying interest. Potential for continuation if resistance breaks. Weaknesses RSI readings are dangerously elevated. Vulnerable to sudden profit-taking. A breakout failure could trigger a sharp retracement. Whale accumulation is not yet independently confirmed. Relatively small market depth can increase volatility. $SUPRAUSDT $NIGHTUSDT


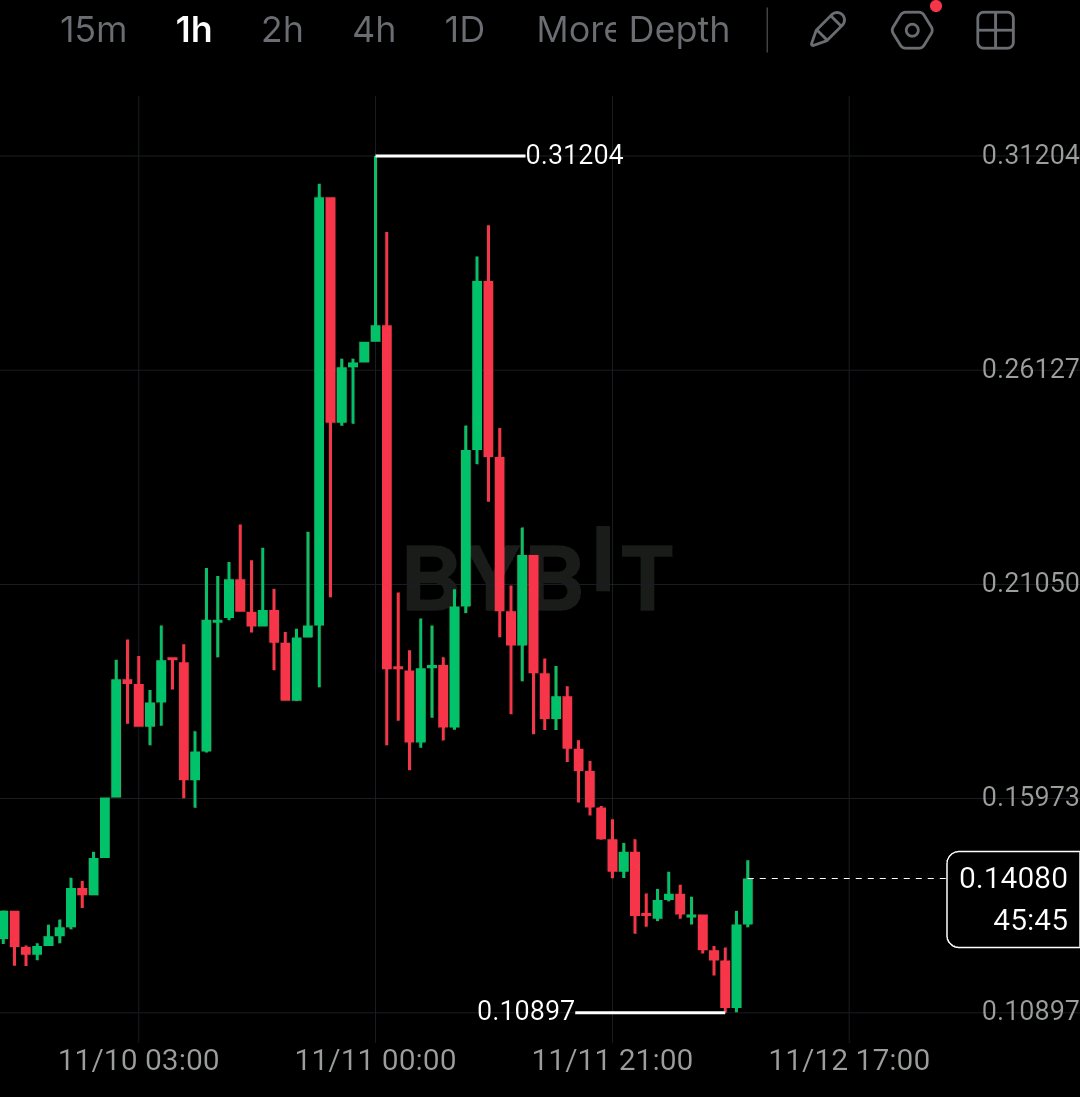
$INITUSDT at $0.1426 after a -54% crash and I am not buying this bounce yet I saw INIT pump straight to $0.39500 and then dump to $0.11046 in the same day. That is not a normal move, that is a pump and dump. Now it is at $0.14264, trying to hold. That bounce looks green, but I have seen this trap before. I am not calling a bottom just because we bounced from $0.11046. For me $0.11046 is the floor that must hold. That is the 24h low. If we lose it with a close below, $0.09623 opens fast. On the upside $0.15883 is the first wall. Break and hold above $0.15883 and $0.18296 opens. My plan is simple. I am not buying $0.1426 in the middle. If we hold $0.11046 and close above $0.15883, I look long toward $0.18296, stop below $0.11046. If $0.11046 breaks, I step aside, short toward $0.09623 only on confirmed close below. Risk 1 to 2% only, 5x to 10x isolated max. This coin just moved -54% in a day, I am keeping size small. Tell me, does $0.11046 hold or does $0.15883 reclaim first? Comment HOLD if $0.11046 holds, BREAK if $0.09623 comes. Tap $INITUSDT to trade this $0.11046 test, trade on this same coin. @BybitX @Bybit Learn @612 Ceros @SignalX @Demon - Trader @RoYoK @IBLOLO #IMPACTbyTrade #USPayrollsAndRateDecisionsDriveMacroWeek #AnthropicIPOTestsTheAIBoom #PiecesOf8 #WSOT2026 #USInflationRunsHotAndRateHikeBetsRise
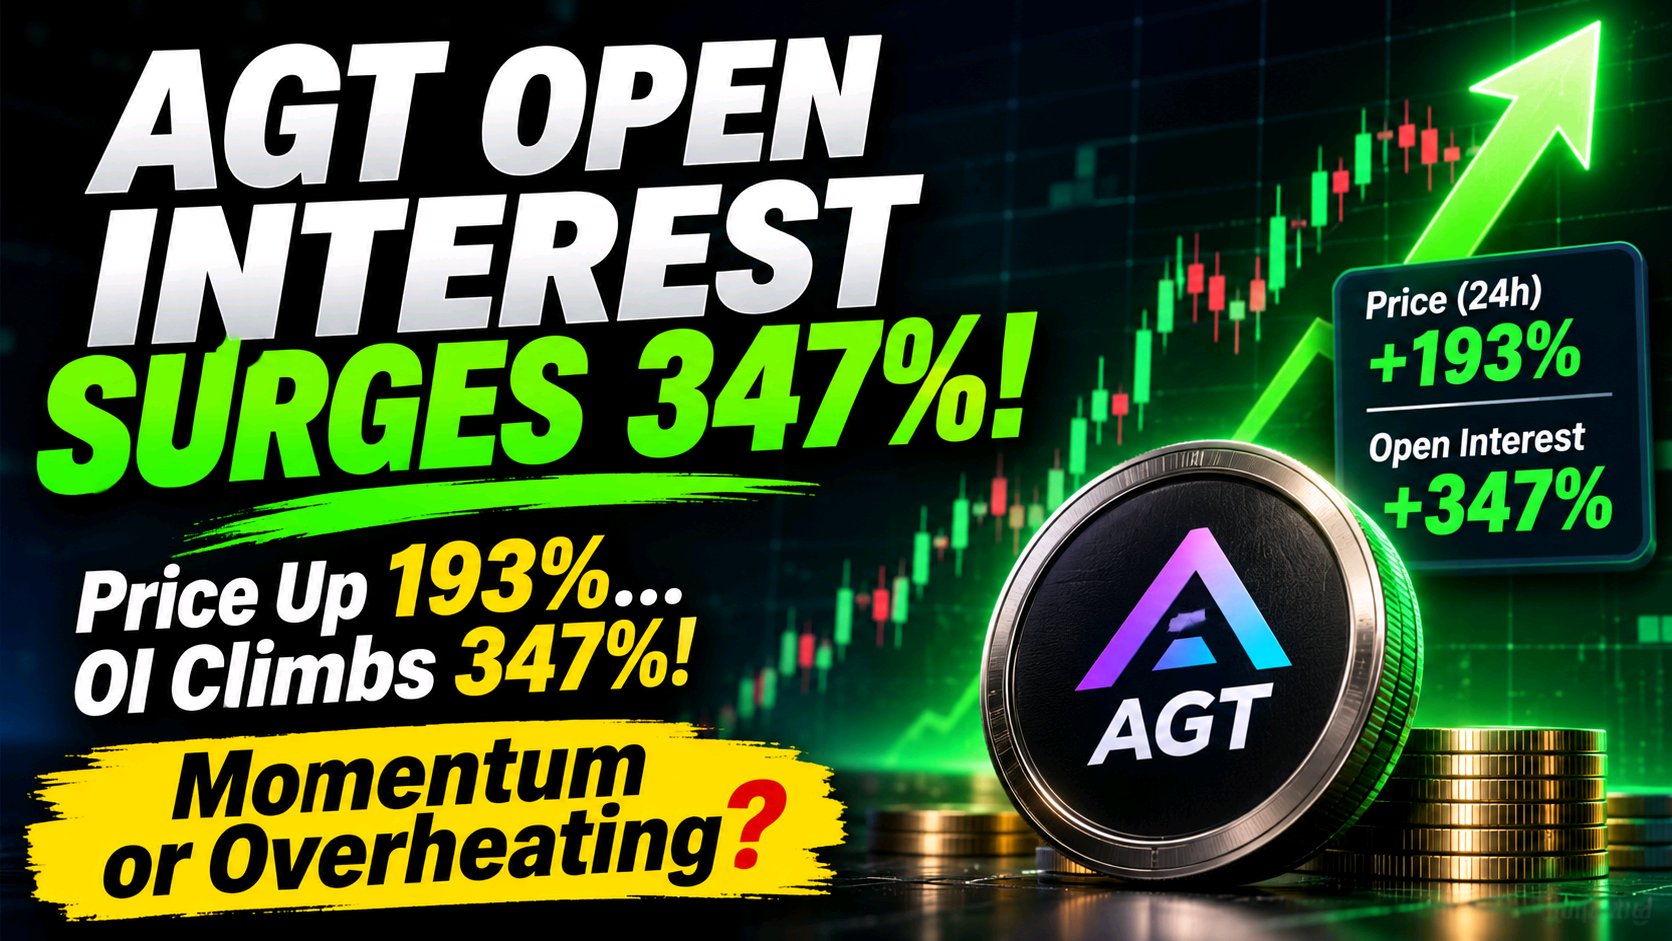
AGT Open Interest Surges 347%!
#BybitAIEvolving $AGT is attracting massive speculative attention as leveraged trading activity accelerates. AGT has recorded an approximate 193% price increase in 24 hours, while Open Interest has climbed nearly 347%, reaching around $67 million. **The key detail:** Open Interest is rising significantly faster than price. This suggests aggressive new leveraged positions are entering the market. Meanwhile, approximately $2.3 million in short liquidations indicates that bearish traders have faced substantial pressure. **Why it matters:** Rising price alongside rising OI signals expanding market participation. However, elevated funding near 0.13% per 8 hours suggests long positions may be getting crowded. **What to watch:** If price continues higher with strong volume, bullish momentum could remain intact. But a price reversal alongside declining OI could signal long-position unwinding. Is AGT building sustainable momentum, or is excessive leverage setting up the next volatility shock? #USPayrollsAndRateDecisionsDriveMacroWeek #NovUSCPIWatch
Key levels
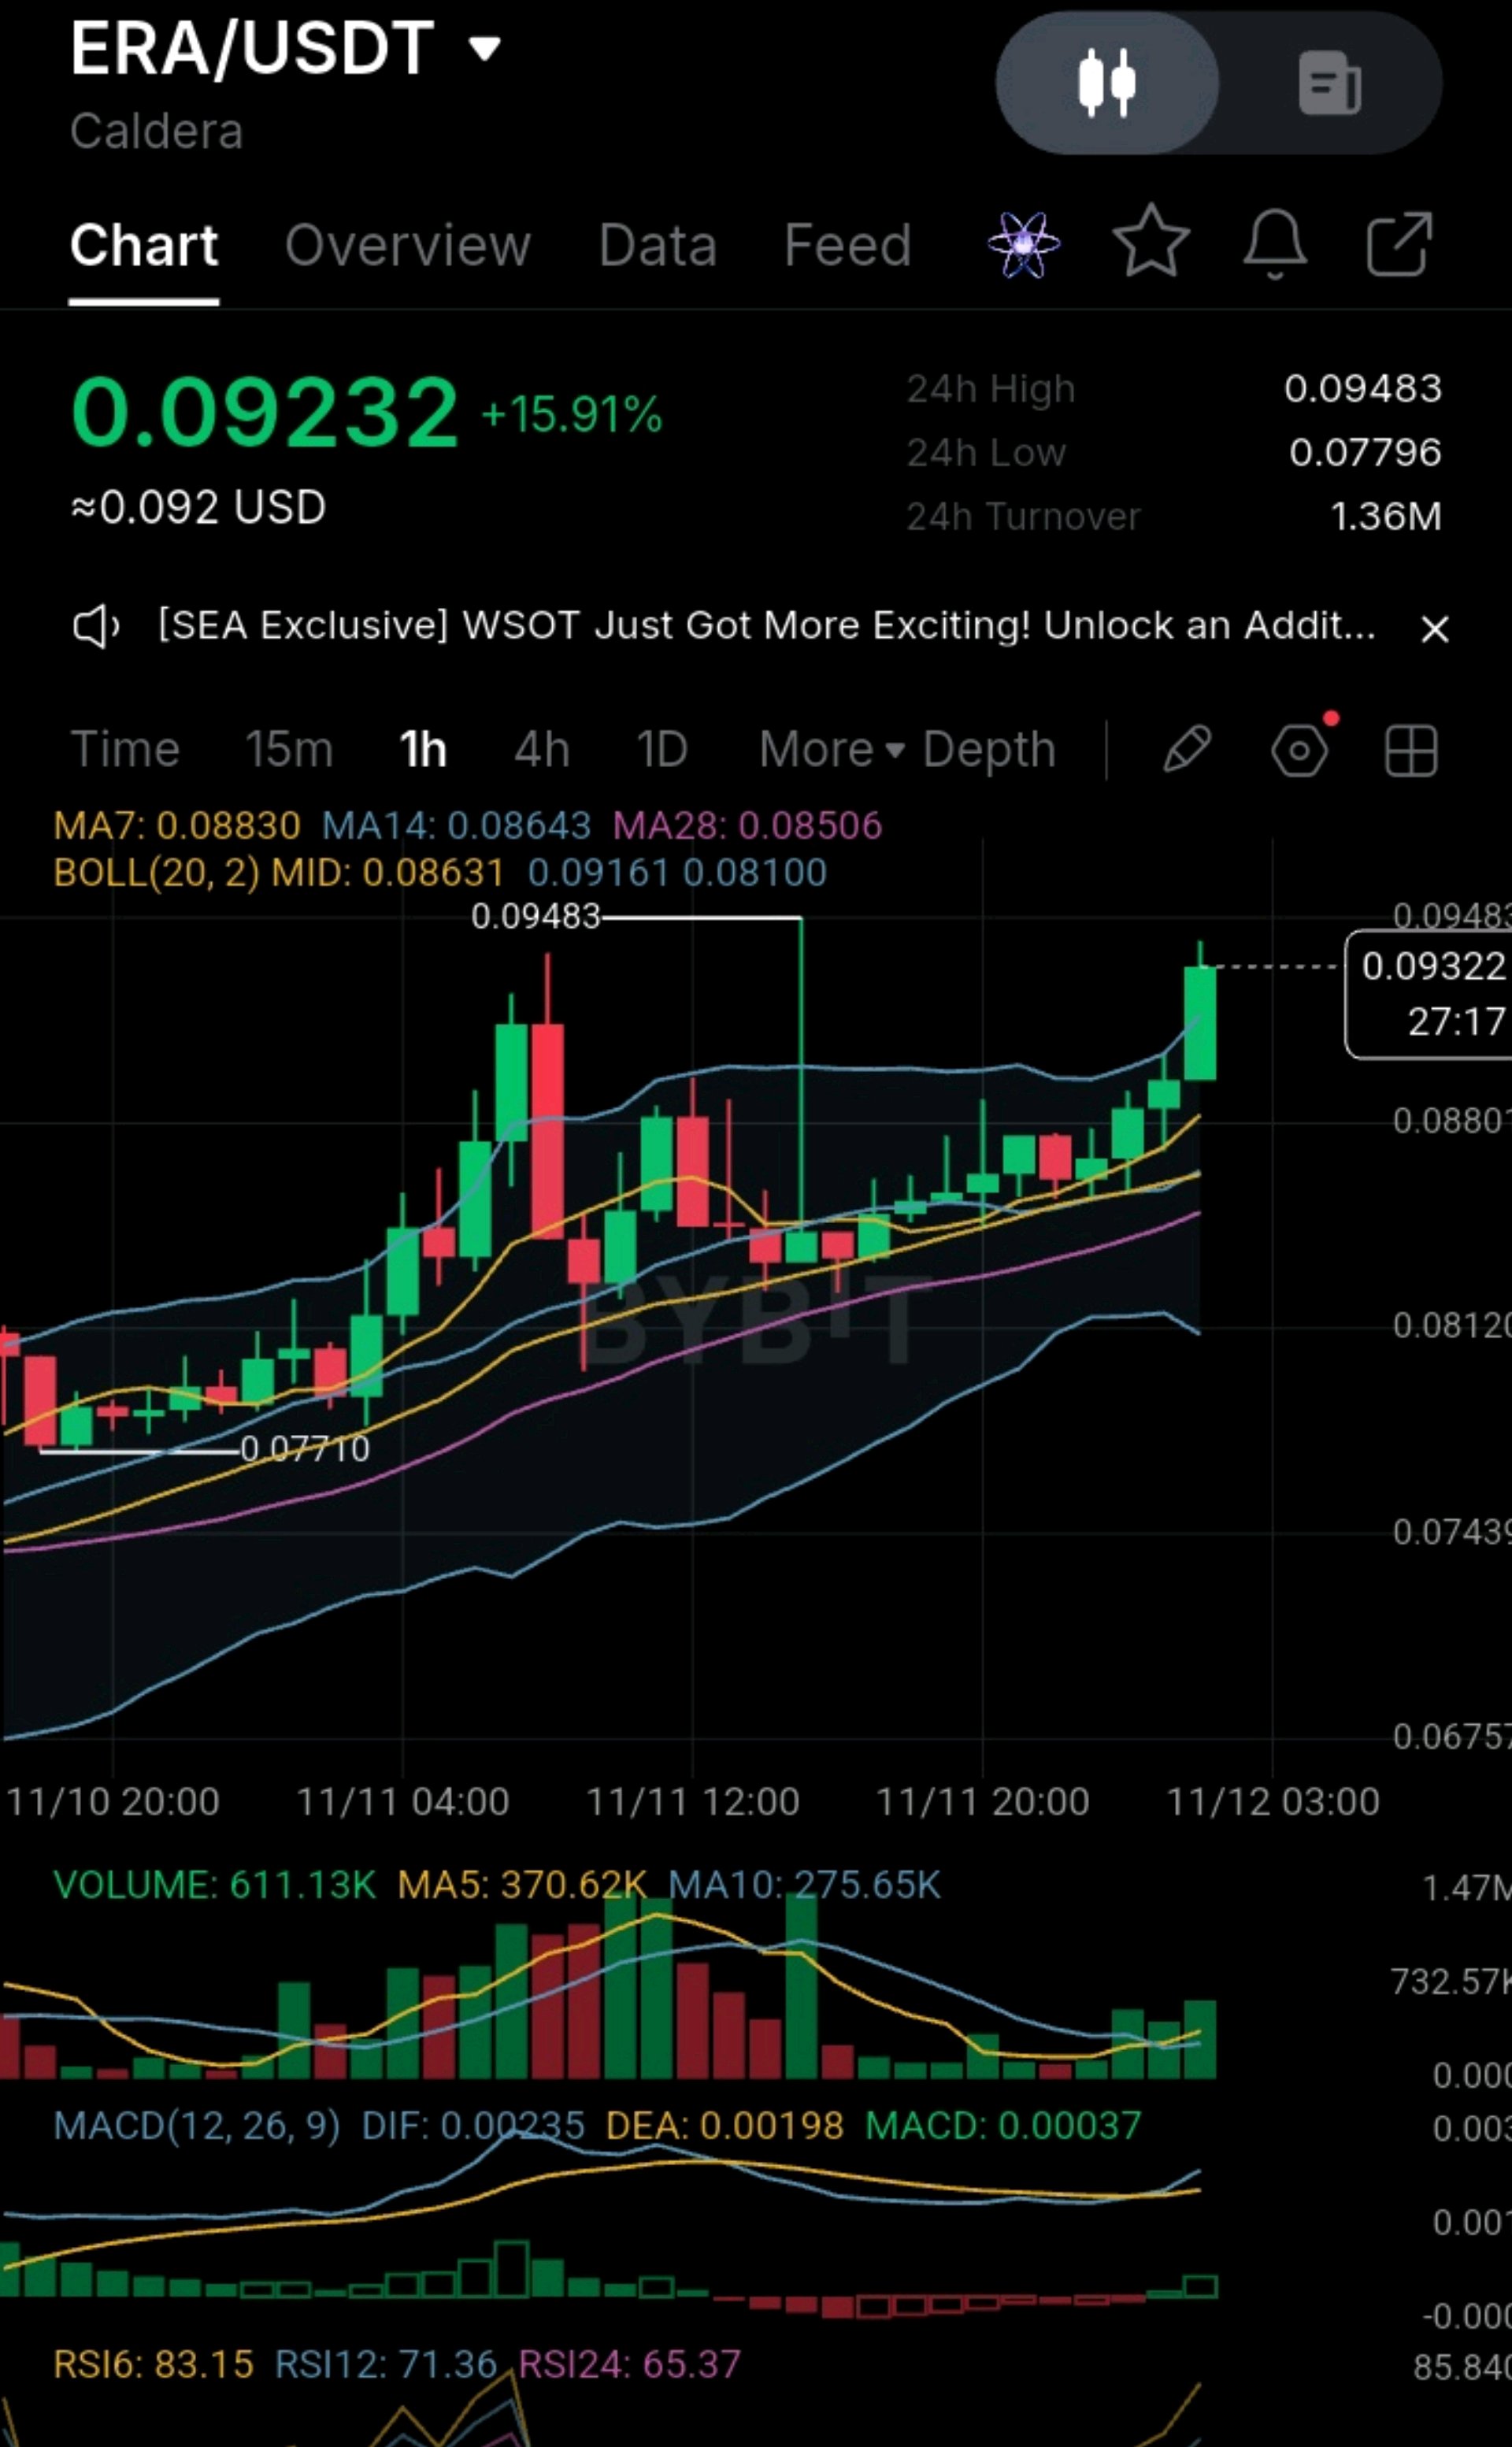
#ByXIMPACT #USInflationRunsHotAndRateHikeBetsRise #AITechSelloffErases2Point5TrillionFromNasdaq100 #BitcoinHitsTwoMonthLowAfterUSMidterms #USPayrollsAndRateDecisionsDriveMacroWeek ERA is pressing back into its 24h high after a clean staircase of higher lows. The next hourly closes decide whether it breaks out or fails at 0.0948 for the second time. Look at this 1-hour chart. ERA climbed from the 0.0771 low, spiked to 0.09483, pulled back and held above the moving averages, then rallied again. The latest green candle is pushing through the upper Bollinger Band and testing the prior high. Price is about 0.0923 to 0.0932, up 15.91% on the day, and the candle is still open with about 27 minutes left, so judge it at the close. The Power: Price is above MA7 (0.08830), MA14 (0.08643) and MA28 (0.08506), and the MAs are stacked in bullish order and rising. MACD has just crossed up (DIF 0.00235 vs DEA 0.00198, histogram +0.00037). Volume is confirming: the current bar (611.13K) is well above the MA5 (370.62K) and MA10 (275.65K). That is unusual after a pullback and favors the breakout attempt. The Exhaustion Risk: RSI6 is 83.15 (RSI12 71.36, RSI24 65.37), so the short term is overbought. Price is above the upper Bollinger Band (0.09161) and about 5% above the MA7, so the move is extended. 0.09483 is a prior rejection zone, and ERA is testing it for the second time. Double tests often fail without strong volume. Turnover is modest (1.36M), so reversals can be sharp. Key levels: Resistance: 0.09483 (24h high), then roughly 0.0990-0.1000 (an estimate near the round number, not a hard level) Support: 0.09161 (upper band), 0.08830 (MA7), 0.08643 (MA14), 0.08631 (BB mid), 0.08506 (MA28), then 0.0810 and the 0.0771 low Trade Plan (illustrative): Preferred entry: a pullback into 0.0885-0.0905, near the MA7 and the top of the recent consolidation, ideally with a bounce candle. Stop loss: 0.0860, just under the MA14 and the BB midline. A closing break below invalidates the setup. Target 1: 0.09483, about 1.5R from a 0.0895 entry. Target 2: 0.0990, about 2.7R. Breakout alternative: an hourly close above 0.09483 on rising volume, with a stop under 0.0910 and smaller size, since the stop sits far from a breakout entry. Position size: risk only 1-2% of your account on the stop distance. Take partial profit at Target 1 and move the stop to breakeven. If it goes wrong: below 0.0860, expect a slide to the MA28 (0.08506), then 0.0810 (the lower band), and a break of that would put the 0.0771 low in play. Verdict: this is one of the healthier setups because volume and MACD agree with the trend. But with RSI6 above 83 and a retest of a prior high, I'd rather wait for a pullback to the MA7 zone, or for a confirmed volume break above 0.09483, than buy at the highs. Call to action: Are you buying the dip to 0.0890, waiting for a confirmed break of 0.0948, or staying out until RSI cools? Set alerts at 0.09483 and 0.0860 so you don't miss either move. This is technical analysis for discussion, not financial advice. $ERAUSDT
December Rate Hike Back on the Table
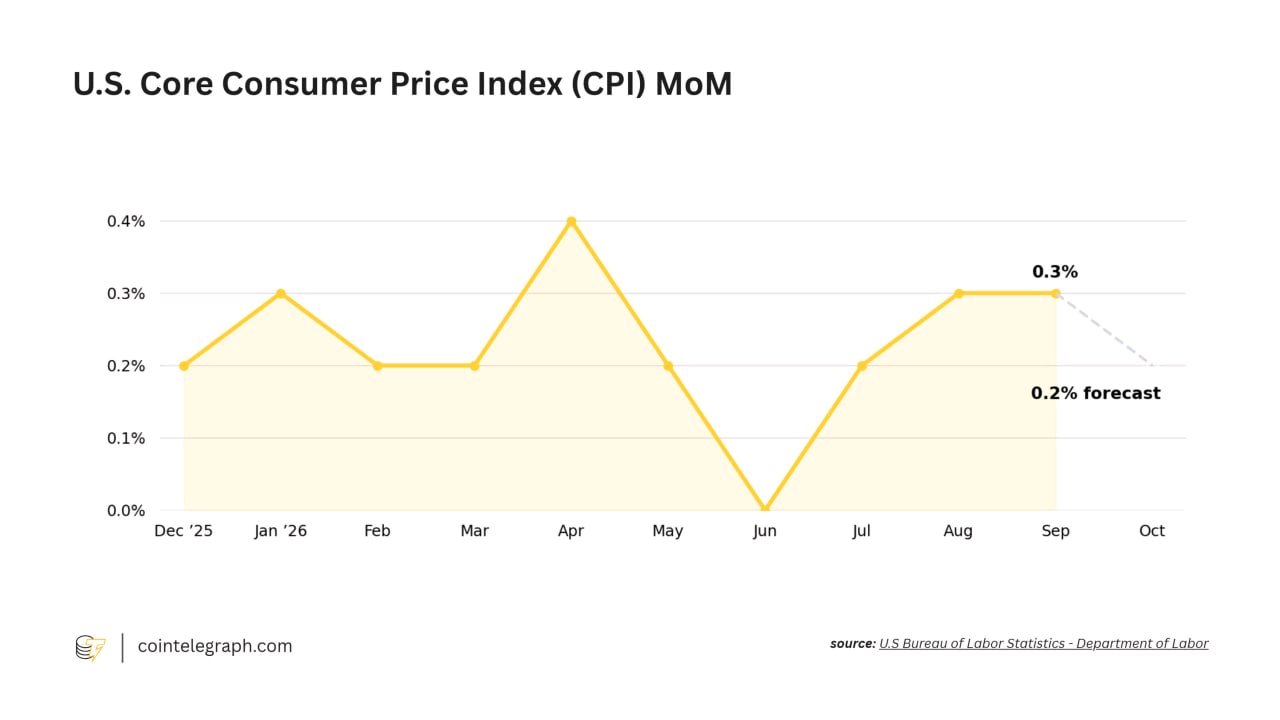
December could bring another shock from the Fed. Waller signals a potential 25–50 bps rate hike, with October Core CPI expected at 0.2% likely to influence the decision. $BTCUSDT Markets are pricing expectations, but inflation data will determine the narrative. One CPI print. Major implications for risk assets. #USInflationRunsHotAndRateHikeBetsRise #BitcoinHitsTwoMonthLowAfterUSMidterms #NovUSCPIWatch #USPayrollsAndRateDecisionsDriveMacroWeek #OilVolatilityTracksIranPeaceTalks
MCRT ran hard
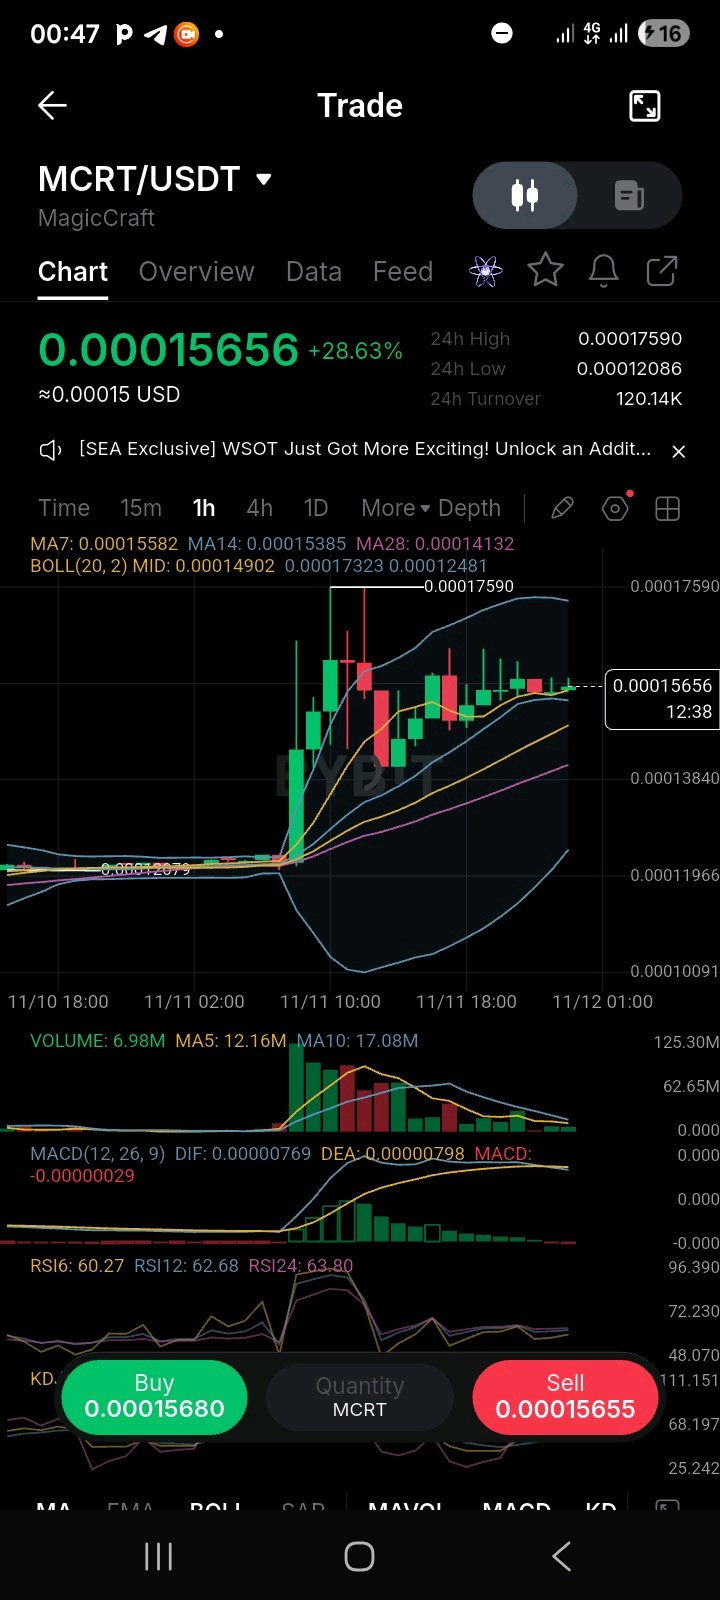
#IMPACTbyTrade #USInflationRunsHotAndRateHikeBetsRise #WSOT2026 #USPayrollsAndRateDecisionsDriveMacroWeek #OilVolatilityTracksIranPeaceTalks MCRT ran hard, cooled off, and is now coiling in a tight range under its 24h high. The next hourly closes decide whether this is a flag before a second leg or a fade. Look at this 1-hour chart. MCRT sat flat around 0.00012 for hours, then exploded on a huge volume candle to a high of 0.00017590. It was rejected, pulled back toward 0.00014, and has since consolidated in small candles right on the MA7/MA14. Price is 0.00015656, up 28.63% on the day, and the current candle is still open (about 12 minutes left), so judge it at the close. The Power: Price is above MA7 (0.00015582), MA14 (0.00015385) and MA28 (0.00014132), and above the BB midline (0.00014902). The pullback was orderly and held the moving averages, which is constructive after a vertical move. RSI has cooled from extreme levels to 60-64 (RSI6 60.27, RSI12 62.68, RSI24 63.80), so the move has reset without breaking structure. The Exhaustion Risk: MACD has crossed down: DIF (0.00000769) is below DEA (0.00000798), with a slightly negative histogram. Momentum is fading. Volume is drying up: 6.98M now against a MA5 of 12.16M and a MA10 of 17.08M. The big volume was all on the breakout candles. The 0.00017590 high was rejected with a long wick, so sellers are active at 0.00017-0.00017590. Turnover is thin (120.14K), and a +28% day on a micro-priced token can reverse fast. Key levels: Resistance: 0.00016500, then 0.00017323 (upper band), then 0.00017590 (24h high) Support: 0.00015582 (MA7), 0.00015385 (MA14), 0.00014902 (BB mid), 0.00014132 (MA28), then the 0.00012079 base Trade Plan (illustrative): Preferred entry: a dip into 0.00015200-0.00015450 (MA14 area), ideally with a bounce candle. Stop loss: 0.00014700, just under the BB midline. A closing break below invalidates the setup. Target 1: 0.00016500, about 2.0R from a 0.00015300 entry. Target 2: 0.00017323, about 3.4R. Target 3: 0.00017590 (24h high), about 3.8R. Breakout alternative: an hourly close above 0.00017590 on rising volume, with a stop under 0.00016500 and smaller size, since chasing a breakout has worse risk/reward. Position size: risk only 1-2% of your account on the stop distance. Take partial profit at Target 1 and move the stop to breakeven. If it goes wrong: below 0.00014700, expect a slide to the MA28 (0.00014132), and below that the whole move would be at risk of giving back toward the 0.00012 base. Verdict: the structure is bullish and the consolidation is healthy, but momentum and volume are fading. I'd want either a bounce off the MA14/BB-mid zone or a volume breakout above 0.00017590 before trusting it. After a +28% day, chasing here is poor risk/reward. I can't see a news catalyst in the chart, so check for listings or announcements first. Call to action: Are you buying the dip to 0.000153, waiting for a confirmed break of 0.0001759, or staying out until volume returns? Set alerts at 0.0001759 and 0.0001470 so you don't miss either move. This is technical analysis for discussion, not financial advice. $MCRTUSDT
Strategy компаниясының 850 364 BTC-сі: Ауқымды және зарарсыз нүктеге жақын
Strategy компаниясының 9 қарашадағы SEC-ке берген есебіне сәйкес, қазір оның иелігінде 850 364 BTC бар. Бұл айналымдағы ұсыныстың шамамен 4,2%-ын немесе 21 миллиондық шектің шамамен 4,05%-ын құрайды (менің есебімше). Тақырыпшасы сәйкес келеді, бірақ кейбір егжей-тегжейлері бар.$BTCUSDT Жағдай қалай қалыптасып жатыр? BlackRock-тың IBIT-і BitcoinTreasuries-тің 9 қарашадағы суреті бойынша шамамен 811 000 BTC-мен ең ірі ETF болып табылады, бірақ бұл сан 26 қазандағы көрсеткішпен сәйкес келеді, ал IBIT-те содан бері қаражаттың шығуы болды. АҚШ үкіметі шамамен 328 000, ал барлық бақыланатын үкіметтер бірге шамамен 646 000 BTC ұстайды. Strategy олардың әрқайсысынан асып түседі. Ол АҚШ-тың барлық споттық ETF-терін қоса алғанда, шамамен 1,3 миллион BTC ұстайтынынан асып түспейді (менің есебімше, 95,9 миллиард долларлық таза активтерден алынды). Маған рейтингтен гөрі, оның қалай ұсталатыны қызығырақ. Strategy-дің орташа құны - 75 456 доллар. 9-10 қарашадағы жағдай бойынша Bitcoin шамамен 74 800 доллар болғанда, бұл шамамен 550 миллион долларлық шығын (менің есебімше). Bitcoin бағасының әрбір 1 000 долларлық ауытқуы оны шамамен 850 миллион долларға өзгертеді. CPI-дан кейінгі 72 800 долларға жуық төменгі деңгейде қағаз жүзіндегі шығын шамамен 2,3 миллиард долларды құрар еді. Өткен аптадағы сатып алу 81,9 миллион долларға 1 036 BTC болды, орташа бағасы 79 012 доллар. Бұл құнынан шамамен 5%-ға төмен (менің есебімше). Және бұл MSTR акцияларын сату арқылы қаржыландырылды. Сол есепте акцияларды сатудан түскен 188,3 миллион доллар STRC (артықшылықты акцияларын) қайтарып сатып алуға жұмсалды. Бұл сатып алынған биткоиндерден 2,3 есе көп (менің есебімше). Сонымен, ең ірі ұстаушы бұл жай ғана пассивті жинақтаушы емес. Ол несиелендірілген, өз капиталының құрылымын белсенді түрде басқарады және 3 тамыздағы есепке сәйкес, дивидендтер мен STRC-ті кері сатып алуды қаржыландыру үшін осы жылдың басында біраз биткоин сатты. Менің пікірім: "ең ірі ұстаушы" деген сөз шындыққа жанасады. "Ең қауіпсіз ұстаушы" деген бөлек мәселе. Мен үш нәрсеге назар аударып отырмын. Bitcoin-нің 75 456 долларға қатысты жағдайы. Апталық сатып алулар акцияларды сату арқылы жалғаса бере ме, жоқ па. Және STRC-ті кері сатып алу биткоин сатып алудан басым түсе бере ме. #BybitAIEvolving #Мұнайдың құбылмалылығы Ирандағы бейбіт келіссөздермен қатар жүреді #АКШЖалақыларыЖәнеСтавкаШешімдеріМакроАптаныАйқындайды #AnthropicIPOValuationTest #WSOT2026

🎯 كيف تعمل هذه اللعبة؟
توقع أسعار العملات الرقمية ونتائج الرياضة على اختيارك الرابح (ByPick): توقع مجانًا واربح مكافآت حقيقية. النقاط المجانية (CP): تحصل على نقاط "CP" مجانية عند التسجيل واستخدامها في التوقعات، وهي نقاط لا تحمل أي قيمة نقدية حقيقية ولا يمكن سحبها . · طريقة التوقع: تختار حدثاً معيناً وتضع توقعك (مثلاً: هل سيرتفع سعر عملة معينة؟). إذا كان توقعك صحيحاً، تربح المزيد من النقاط . · الترتيب والجوائز: يتم ترتيب المشاركين بناءً على عدد نقاط CP التي جمعوها خلال "الموسم". في نهاية الموسم، يتم توزيع جوائز حقيقية بالـ USDT على أصحاب المراكز الأعلى في لوحة الصدارة . #WSOT2026 #BybitAIEvolving #كشوف المرتبات الأمريكية وقرارات أسعار الفائدة تحرك الأسبوع الاقتصادي #مراقبة مؤشر أسعار المستهلك الأمريكي لشهر نوفمبر #تقلبات النفط تتبع محادثات السلام الإيرانية

2000 PKR Weekly: SEI, SUI, or DOGE? 🤔
My plan is to invest 2,000 PKR every week into one coin (DCA). Let's compare them based on current data: $SUIUSDT : · Current price is around 257 PKR. · Price is below key moving averages, and momentum is currently with the sellers. · However, major partnerships like Samsung Wallet are happening, which could pay off in the future. $SEIUSDT : · Current price is around 13.5 PKR. · Down 34% in the last 30 days. · One analyst suggests SEI has built a long base and could be preparing for a new rally. DOGE: · Price is around $0.068. · Whales have sold 750 million DOGE since Nov 3rd, putting pressure on the price. · It's a meme coin with no supply cap. My View: If you are looking to invest for the long term (1-2 years), SUI and SEI look like more solid projects. SUI has a strong ecosystem, and SEI might be preparing for a big rally. DOGE carries more risk right now since whales are selling and it lacks utility. My suggestion: Split the 2,000 PKR between SUI and SEI (1,000 each) to manage your risk. Which coin are you investing in? #USInflationRunsHotAndRateHikeBetsRise #BitcoinHitsTwoMonthLowAfterUSMidterms #BybitAIEvolving #OilVolatilityTracksIranPeaceTalks #USPayrollsAndRateDecisionsDriveMacroWeek
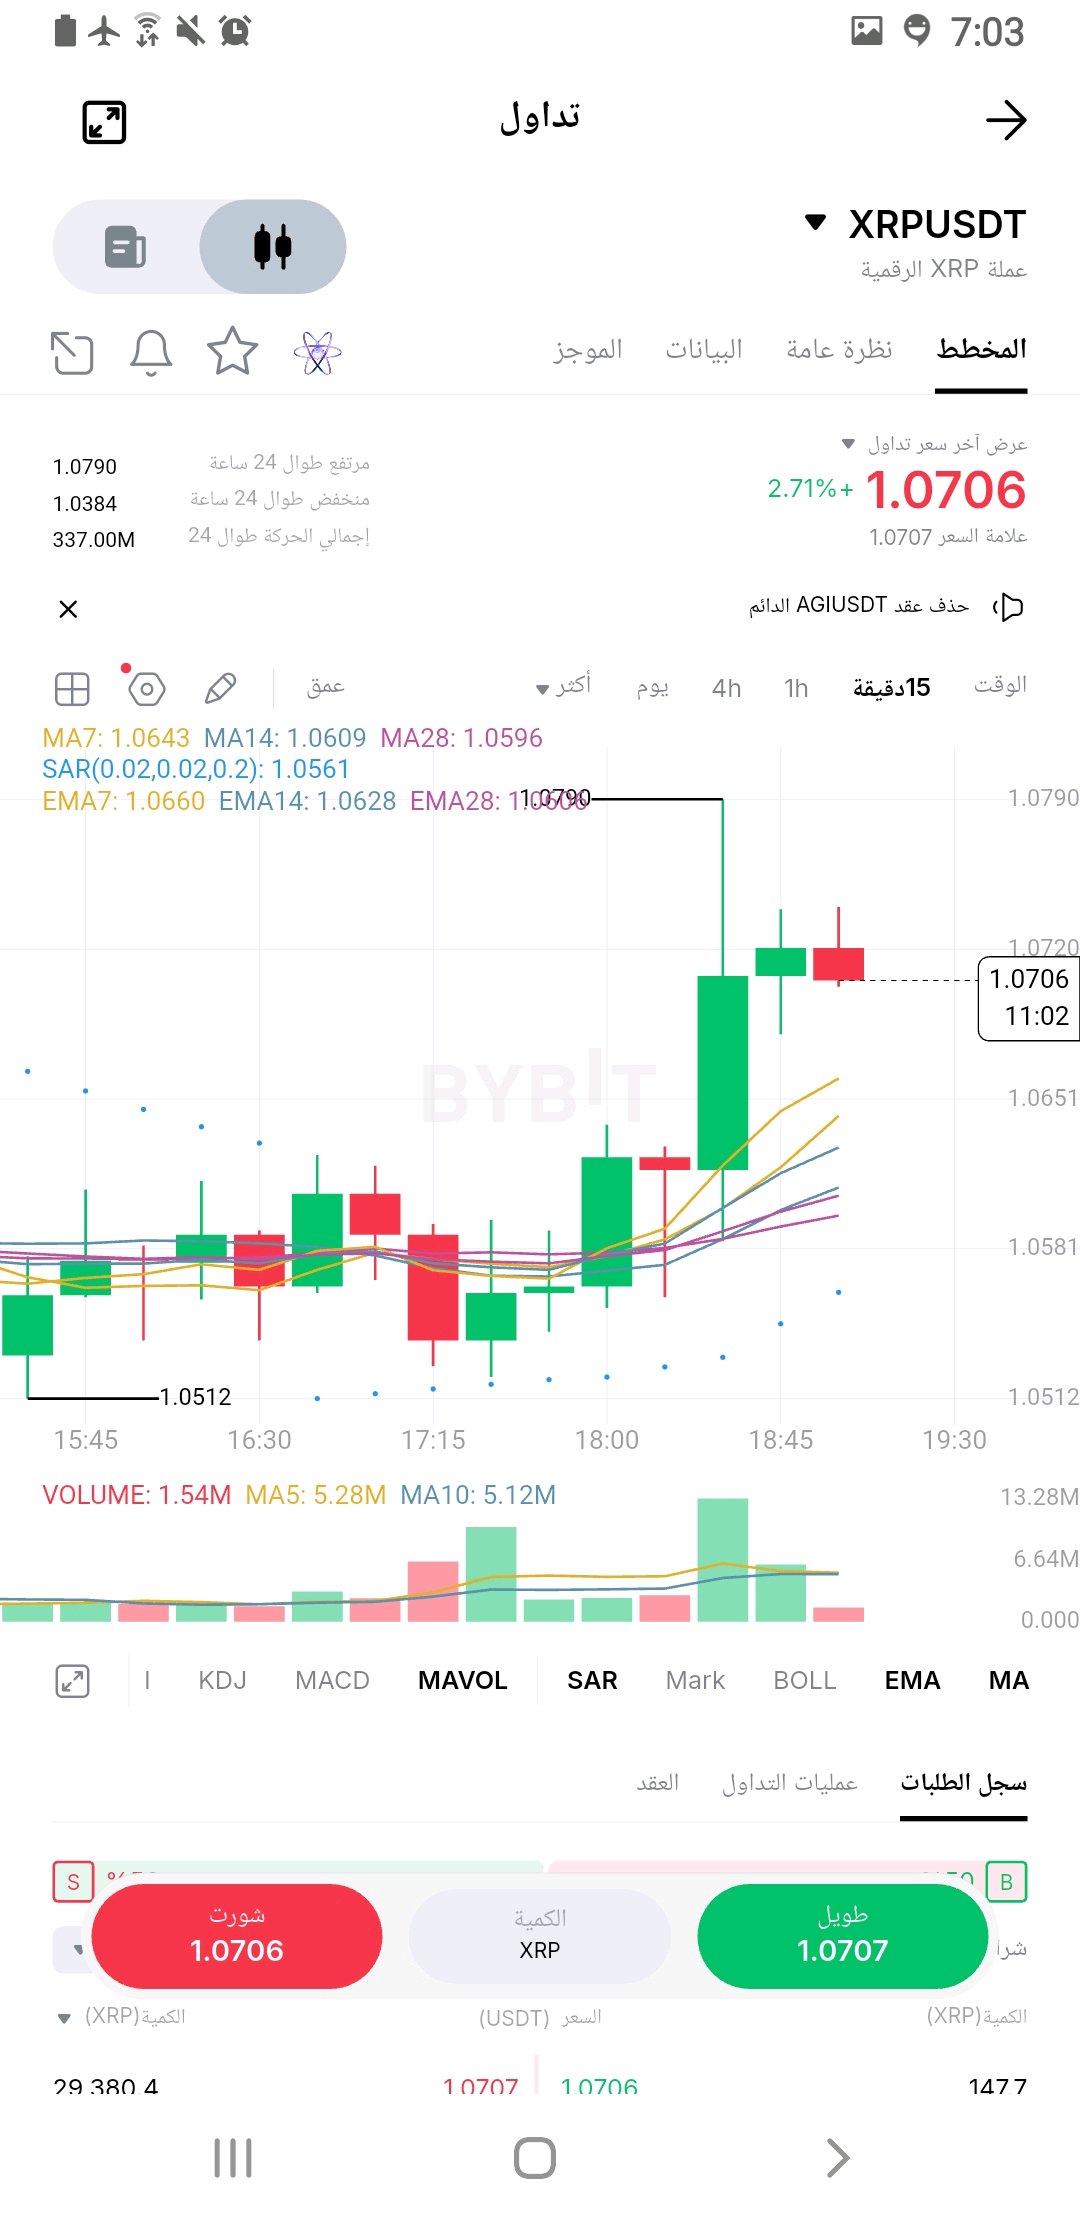
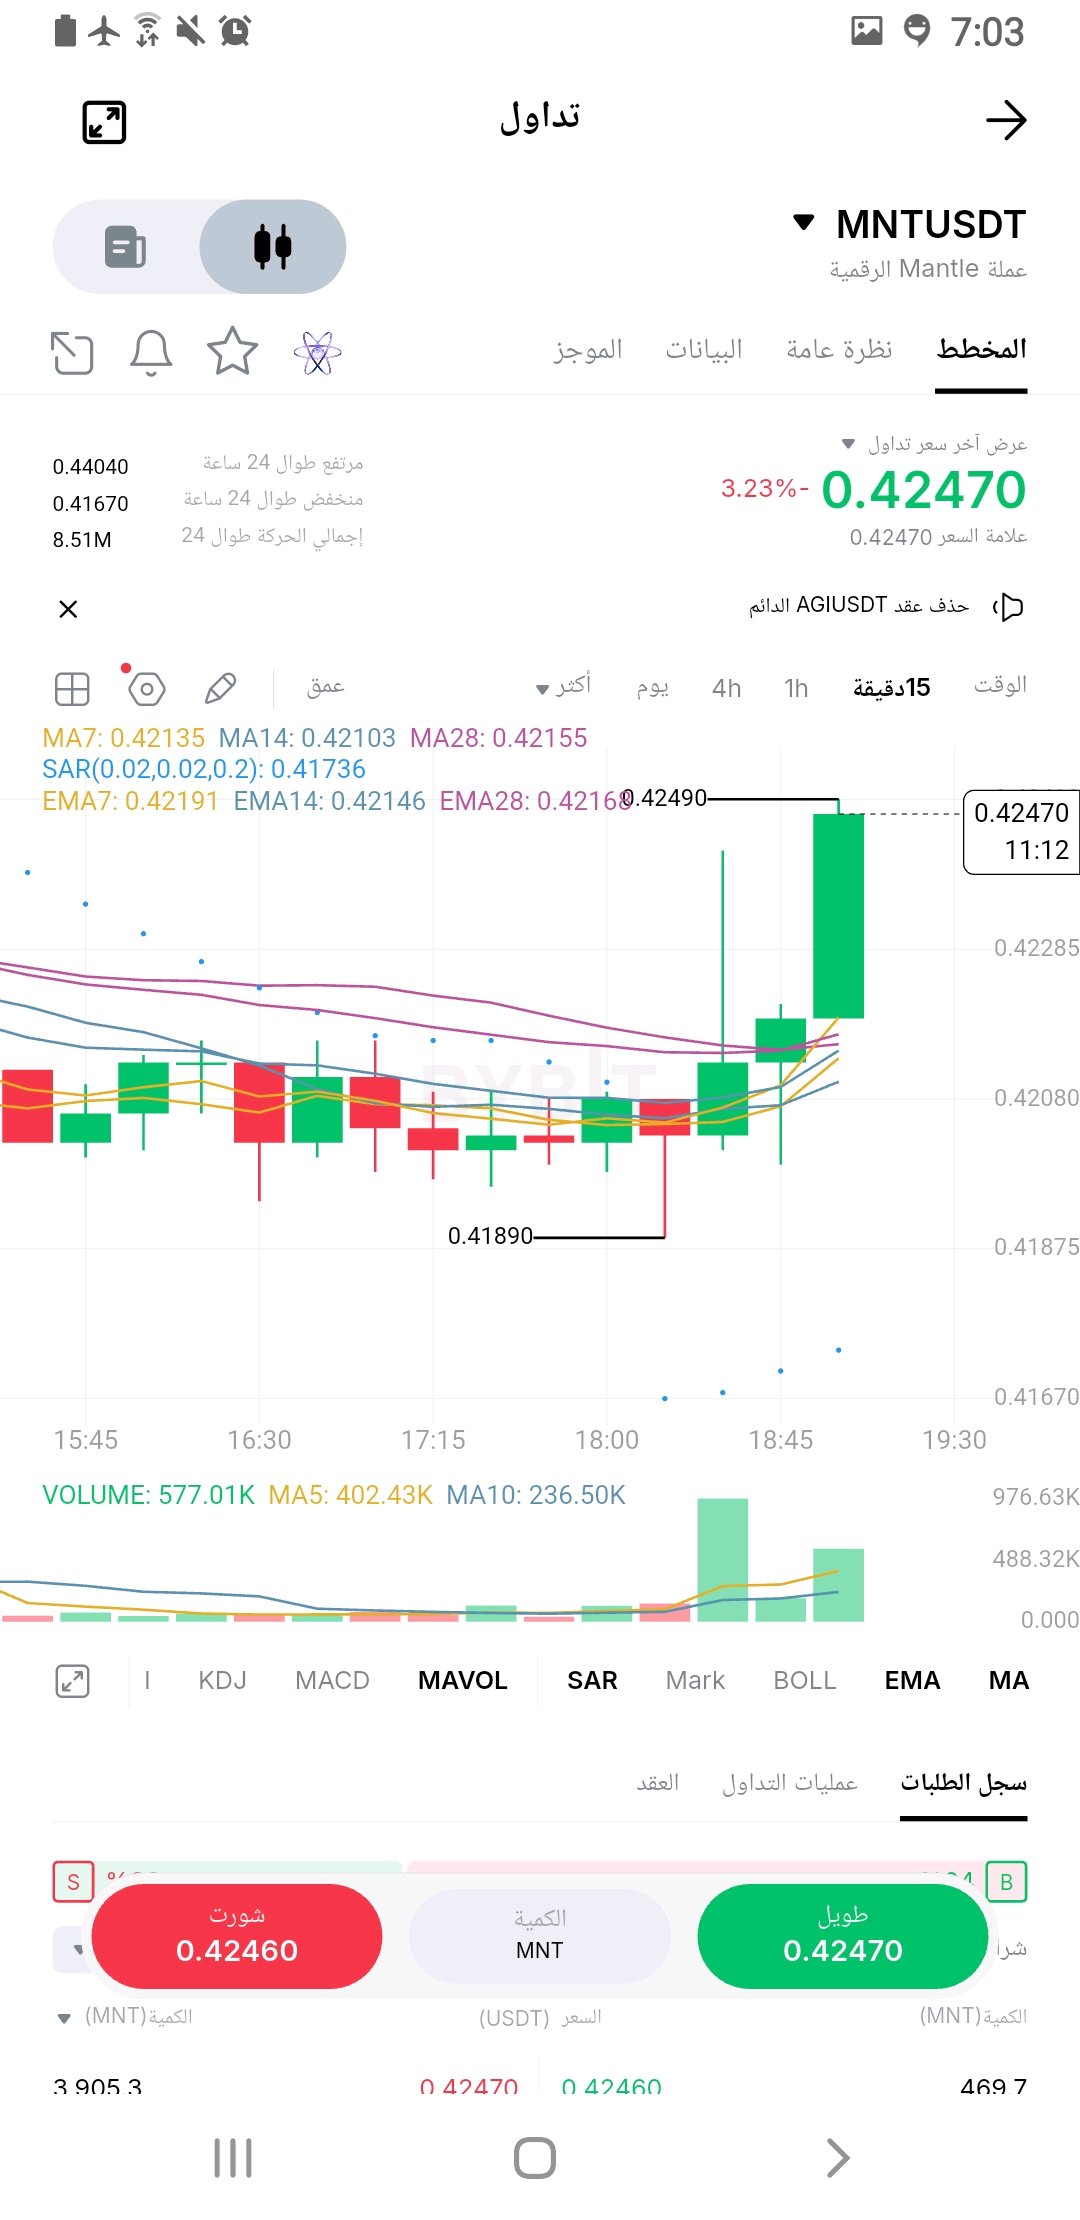
#ByXIMPACT XRP: Shows clear buying power and a tendency to continue the upward trend. MNT: Shows an attempted pullback/reversal from a low, but needs the price to stabilize above the current resistance to confirm the trend change. Trading on the 15-minute timeframe is considered scalping and is risky; it is always preferable to place strict stop-loss orders below the mentioned support levels. Short-term Bullish. · Price Action: We observe a very strong rebound from the local bottom at 1.0512. The price experienced a sudden breakout via a massive green candle that surpassed all moving averages, reaching a high peak of 1.0790 before beginning the current minor correction. · Technical Indicators: · Moving Averages (EMA/MA): The current price is above all moving averages (EMA7, EMA14, EMA28), and the averages have begun to cross positively (Golden Cross), supporting the upside. · Parabolic SAR (Blue Dots): The dots appeared below the candles following the breakout, which is a clear bullish signal. · Trading Volume: There is massive buying liquidity clearly visible in the large green breakout candle. · Key Levels: · Current Resistance: 1.0790 (highest point reached recently). · First Support: The 1.0640 - 1.0660 zone (where short moving averages are concentrated). · Analysis: The coin is in a state of strong positive momentum. The current correction (small red candle) is normal for profit-taking. If the price maintains its position above the 1.0600 level, it is likely to resume its upward movement to retest 1.0790. 📉 Second: Mantle (MNTUSDT) Analysis - Second Image · Current Price: $0.42470 (down -3.23%). · General Trend: Medium-term bearish, with a recent attempt at a rebound. · Price Action: The coin was in a clear downward path, reaching a low at 0.41890. Recently (on the chart), a very strong green candle appeared, breaking upward through the moving averages and reaching the 0.42490 level. · Technical Indicators: · Moving Averages (EMA/MA): The current price has managed to break through the moving averages, marking the first positive sign after the wave of decline. · Parabolic SAR: Blue dots have started appearing below the candles, giving a potential bullish reversal signal. · Trading Volume: We observe a significant increase in trading volumes accompanying the latest green candle, lending credibility to the rebound. · Key Levels: · Near Resistance: 0.42490 (current peak). Breaking this level is necessary for continued upward movement. · Strong Support: 0.41890 (previous low). · Analysis: Although the general trend remains bearish (as shown at the top of the chart with a previous high of 0.44040), the latest green candle is very strong and indicates buying interest at the bottoms. There is a state of anticipation; either the price continues upward to confirm the reversal, or it pulls back downward to retest the support once more. #WSOT2026 #BybitAIEvolving #تقلبات النفط تتبع محادثات السلام الإيرانية #كشوف المرتبات الأمريكية وقرارات أسعار الفائدة تحرك الأسبوع الاقتصادي $XRPUSDT $MNTUSDT
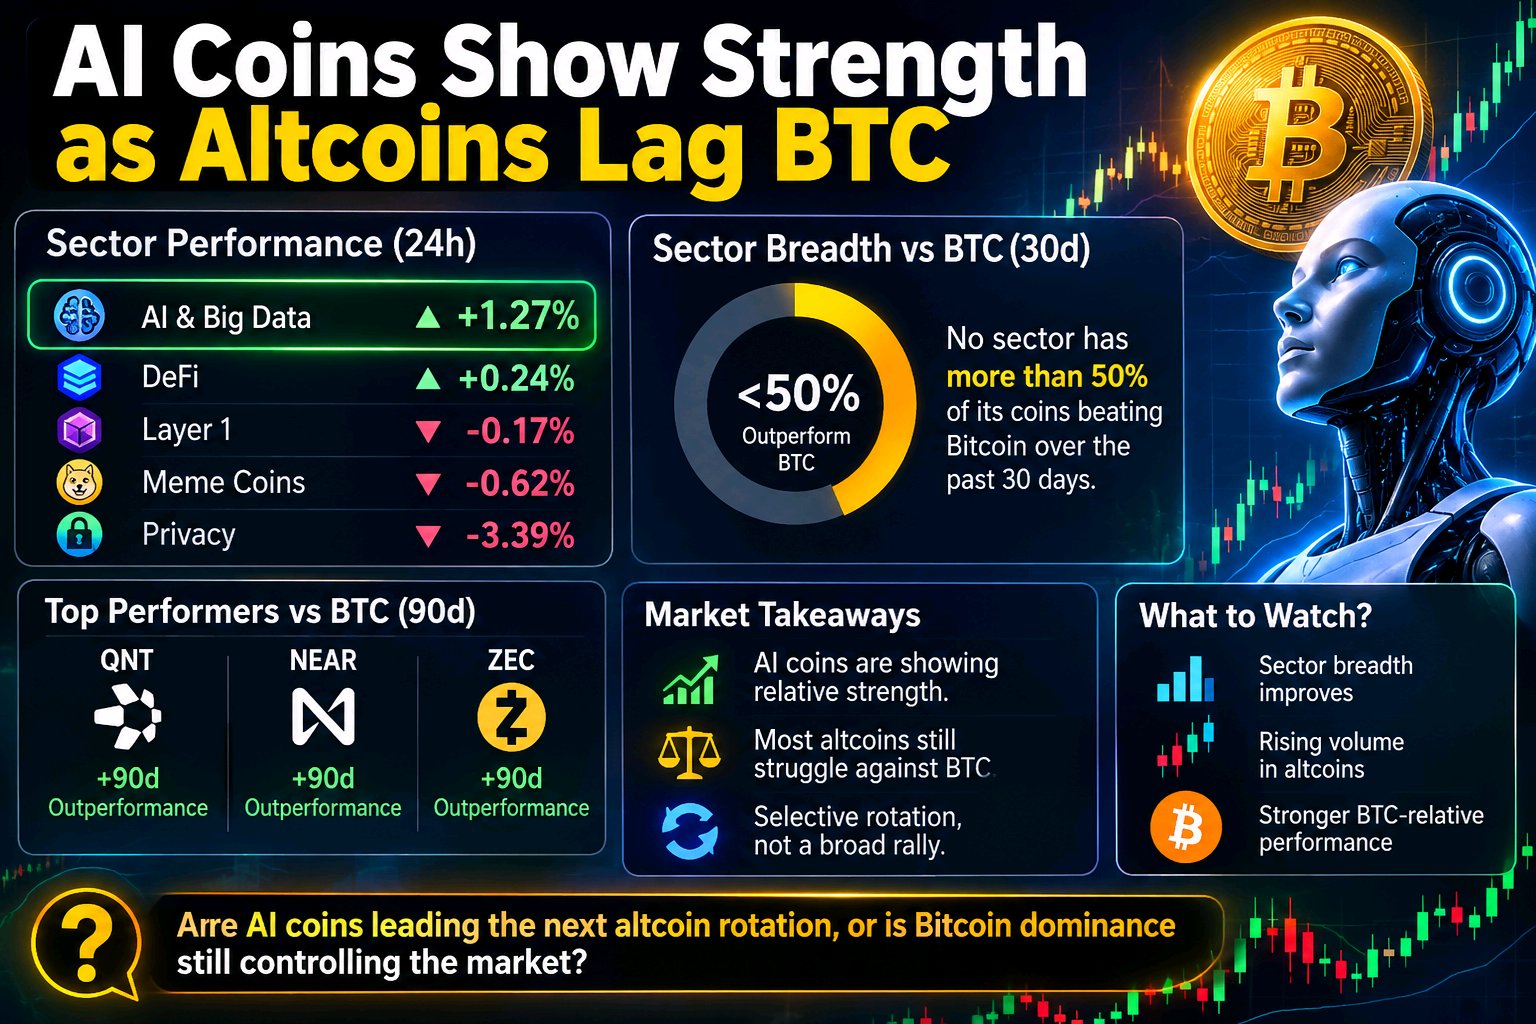
AI Coins Show Strength as Altcoins Lag BTC
$BTCUSDT The altcoin market is showing an interesting split, and smart traders should pay attention. As of November 11, AI & Big Data is showing relative strength, with approximately 1.27% gains over 24 hours. Meanwhile, Privacy coins are facing pressure, declining around 3.39%. **Top performers to watch:** QNT, NEAR and ZEC have demonstrated notable outperformance against Bitcoin over the past 90 days. **The overlooked detail:** Despite individual winners, no tracked altcoin sector currently has more than 50% of its coins outperforming BTC over the 30-day period. This suggests capital is rotating selectively rather than entering the entire altcoin market. If sector breadth improves alongside rising volume and stronger BTC-relative performance, the rotation could become more convincing. **Are AI coins leading the next altcoin rotation, or is Bitcoin dominance still controlling the market?** #BybitAIEvolving #USPayrollsAndRateDecisionsDriveMacroWeek

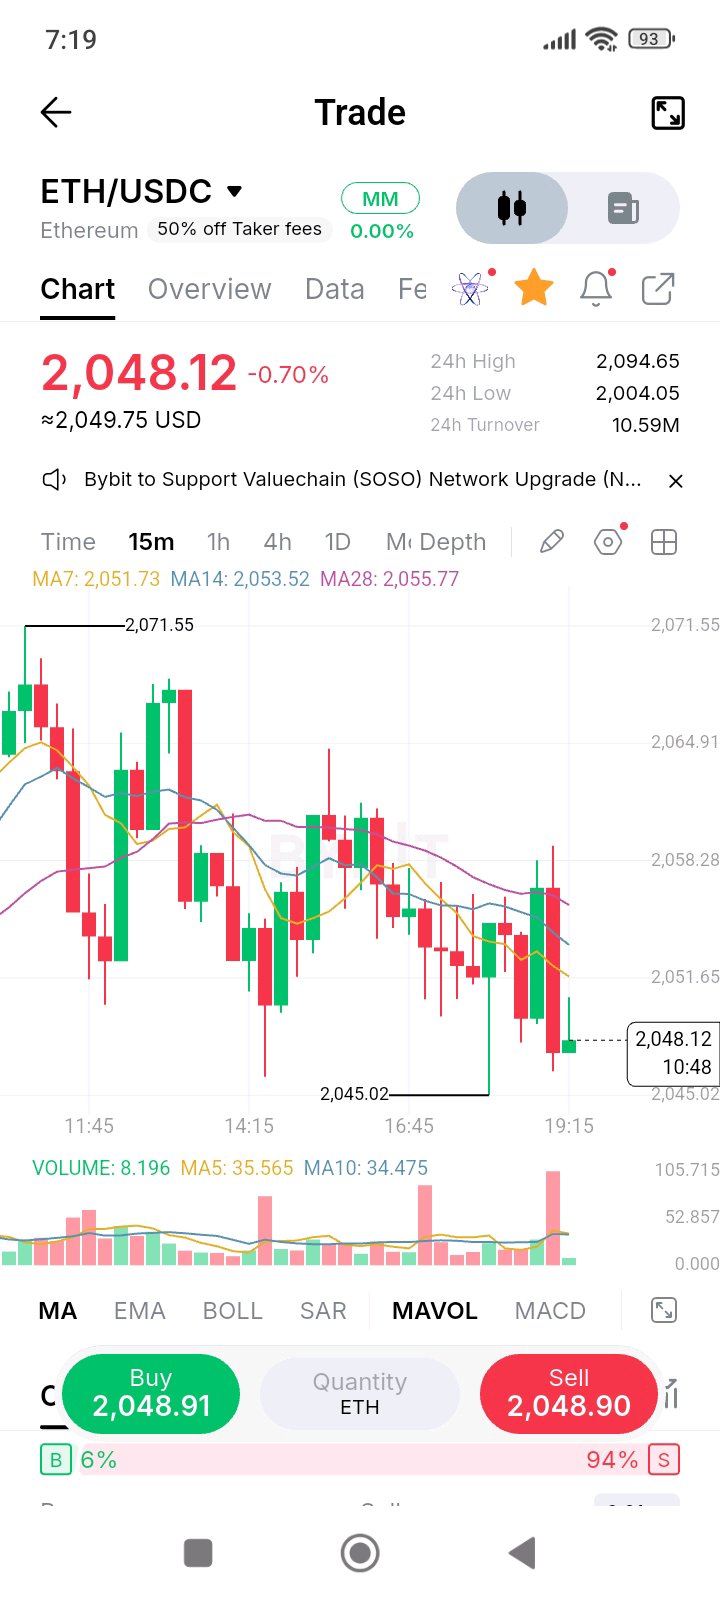
$ETH: Bears Are Pressuring the Market, But
I’ve been watching Ethereum closely, and this latest move is a reminder that the market can turn aggressive when buyers lose control. ETH is trading around $2,048 after struggling to maintain momentum near the $2,071 zone. Now the price is testing an important area where bulls need to show some strength. 📊 The 15-minute chart is currently leaning bearish. ETH is trading below MA7 ($2,051.73), MA14 ($2,053.52), and MA28 ($2,055.77). All three moving averages are sitting overhead, creating resistance for any recovery attempt. The recent low around $2,045.02 is the immediate level I'm watching. If sellers break it decisively, downside pressure could increase. However, a strong bounce followed by a reclaim of $2,055 could change the short-term picture. 🐋 I don't have confirmed whale-flow data here, so I'm watching price and volume rather than guessing what large players are doing. 🎯 Key levels: - Support: $2,045 - Resistance: $2,055 - Breakout: $2,058 - Next target: $2,065 - Major upside level: $2,071 🔥 I'm not interested in blindly chasing a green candle. ETH needs buying strength and volume confirmation before I trust a reversal. I've been following every move with this community, and I'm still watching. Will ETH defend $2,045 and fight back, or are sellers preparing another breakdown? 👀 #BitcoinHitsTwoMonthLowAfterUSMidterms #DeutscheBankLaunchesDigitalAssetCustody #USPayrollsAndRateDecisionsDriveMacroWeek
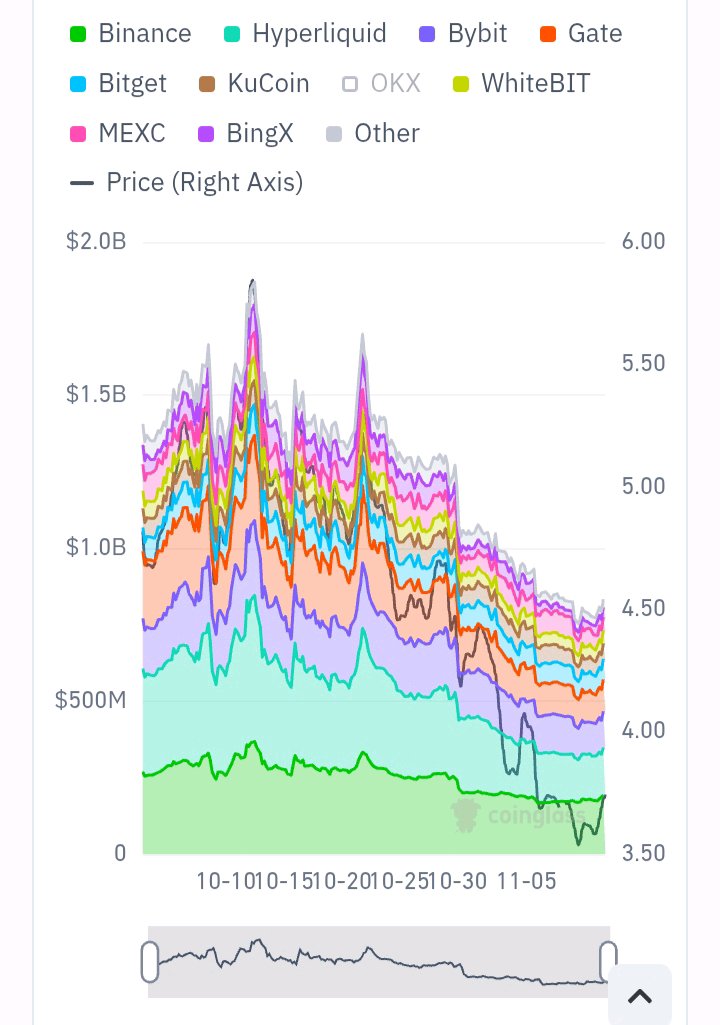
Where is NEAR's money going? 🤔
$NEARUSDT Look at this Open Interest (OI) chart for NEAR: · Total OI: Dropped heavily from over $2.0B to the $500M-$700M zone. · The Trend: A massive decline across all platforms. Big players are closing their positions. What does this mean? When OI and Price drop together, it means leverage is leaving the NEAR market. Traders are avoiding new risk right now. What do you think? When will liquidity return to NEAR? #USInflationRunsHotAndRateHikeBetsRise #BybitAIEvolving #OilVolatilityTracksIranPeaceTalks #USPayrollsAndRateDecisionsDriveMacroWeek #BitcoinHitsTwoMonthLowAfterUSMidterms $ETHUSDT

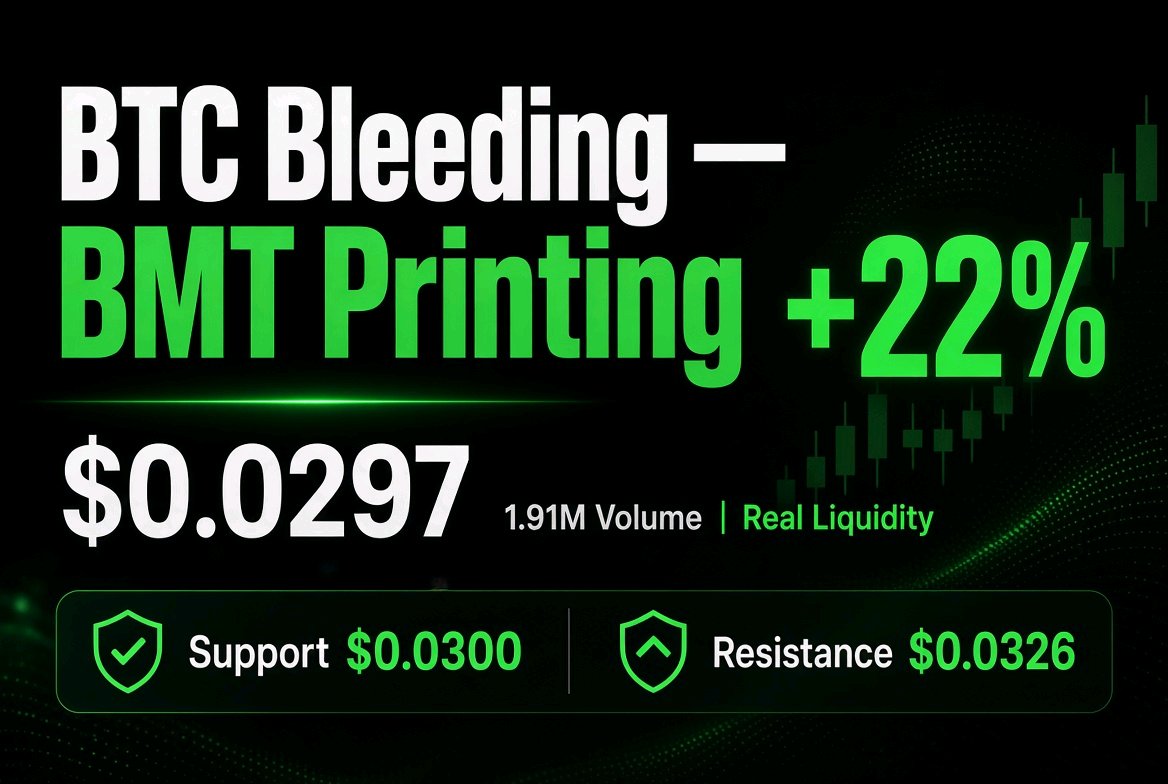
BTC is bleeding, but BMT is printing. 🚀
Here is the setup. ⚡ The whole market is red today. $BTCUSDT is fighting to hold $73,600, and ETH is sitting near $2,058 . But while the majors chop, BMT is quietly building strength on the Bybit board. Why $BMTUSDT ? Look at the data. It is up over 22% to $0.0297, and the turnover is a massive 1.91M. That is real liquidity, not an empty order book pump. On-chain, the top 100 wallets hold around 45% of the supply, and the new Intel Desk launch is adding real utility to the token . The Levels: Resistance sits at $0.0326. A clean break here opens the door for the next leg up. Support is the MA cluster around $0.0300. As long as buyers defend this floor, the structure stays intact . While the market hunts for a bottom, BMT is showing relative strength. Are you watching this one today? 👇 #NovUSCPIWatch #USPayrollsAndRateDecisionsDriveMacroWeek #OilVolatilityTracksIranPeaceTalks #BybitAIEvolving #BOERateDecision

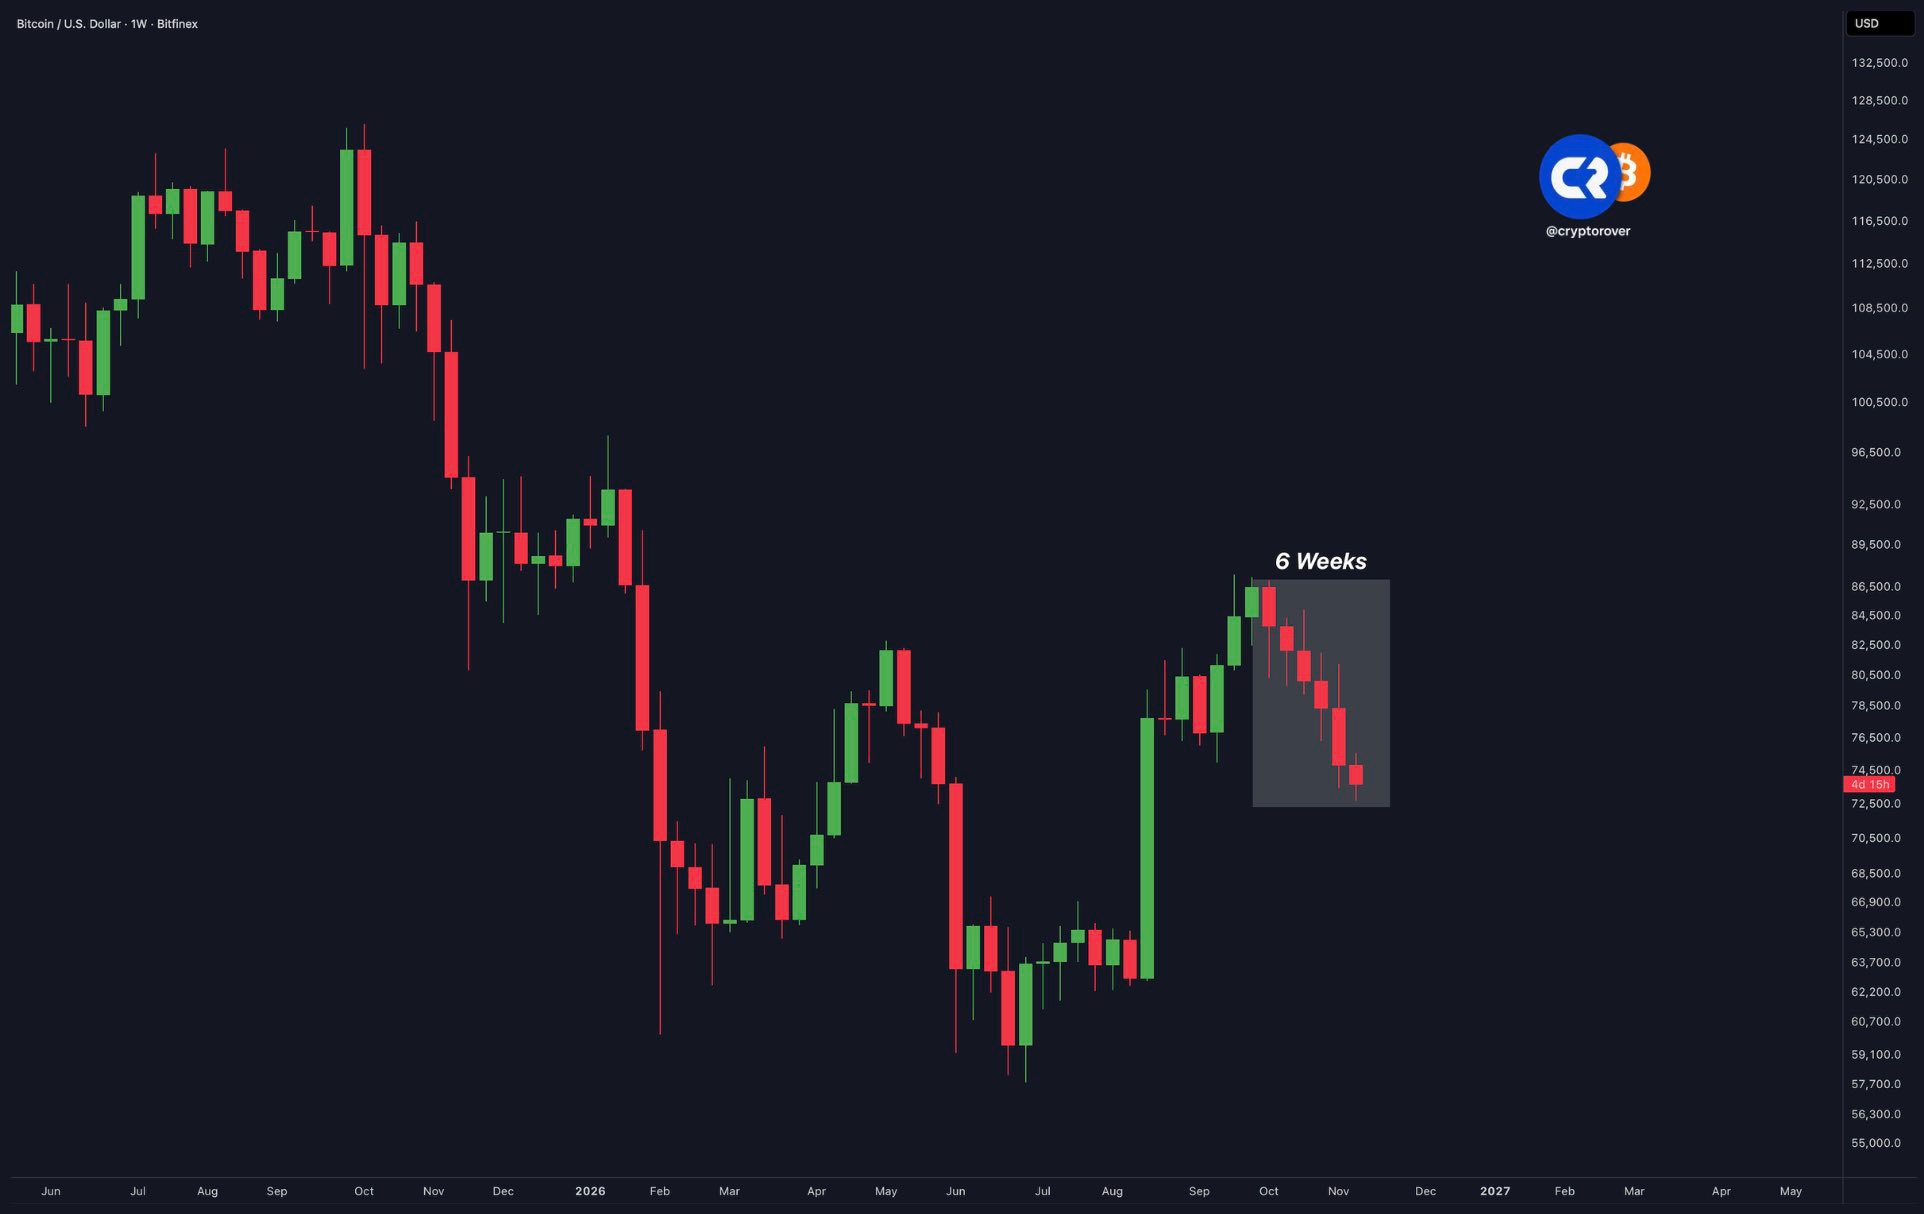
BITCOIN
#USPayrollsAndRateDecisionsDriveMacroWeek 🔴 Bitcoin is about to close 6 RED weeks in a row. Bitcoin is experiencing one of the longest losing streaks in its history... Could this mean the longest winning streak in history is coming next? #WSOT2026 #WSOTPicktoEarn10U #OilVolatilityTracksIranPeaceTalks #NovUSCPIWatch
Trading
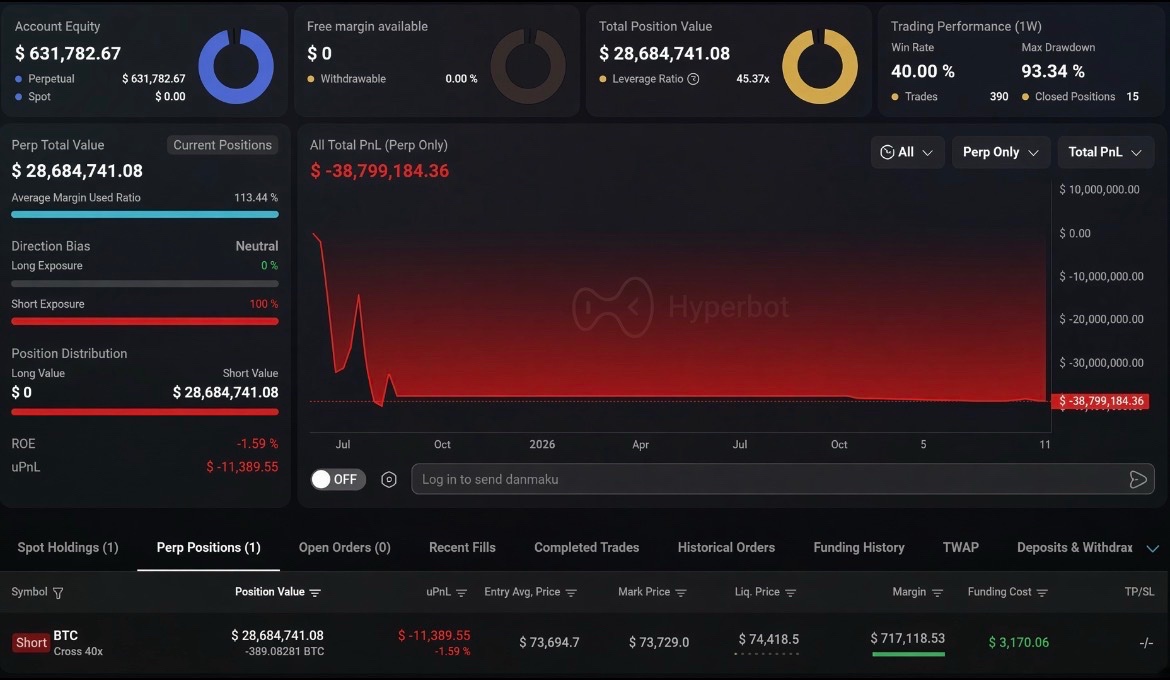
Someone just opened a 40x $BTC short worth ~$30M. His all-time PnL: -$38.8M When people start gambling on the last bit of downside, you know it’s time to go long #WSOT2026 #WSOTPicktoEarn10U #NovUSCPIWatch #USPayrollsAndRateDecisionsDriveMacroWeek #BybitAIEvolving