Блокчейн қауіпсіздігі
Крипто активтерді тәжірибелік қауіпсіздік әдеттерімен қорғауды үйреніңіз: екі факторлы аутентификацияны қосыңыз, бірегей құпия сөздерді пайдаланыңыз, қаражатты алу мекенжайларының ақ тізімдерін және фишингке қарсы кодтарды белсендіріңіз, әмиян рұқсаттарын жүйелі түрде тексеріңіз, белгісіз сілтемелер мен қолтаңбалардан аулақ болыңыз және лонг мерзімді активтеріңізді қауіпсіз әмиянға сақтаңыз. Хакерлік шабуылдардан, алаяқтықтан және рұқсат етілмеген транзакциялардан сақ болыңыз.

🔐 Secure Your Crypto!
We spend hours analyzing charts and finding opportunities, but how often do we protect what we already own? One careless click can cost everything. Here are 6 essential security habits: 🔸 Enable 2FA for extra protection. 🔸 Use strong, unique passwords. 🔸 Activate withdrawal whitelists. 🔸 Set up anti-phishing codes. 🔸 Review wallet approvals regularly. 🔸 Store long-term assets in secure wallets. Remember, protecting your crypto is just as important as growing it. Protect your assets before chasing profits. 🔐 What's your most important crypto security habit? #BlockchainSecurity $BTCUSDT $XRPUSDT



World Liberty Financial is turning to token buybacks after a difficult period for its governance token. The announcement arrived as $WLFIUSDT faced renewed selling pressure following the US midterm elections, exposing how closely the project's market sentiment remains connected to political developments. But a buyback announcement alone cannot reverse a prolonged decline. Investors still need to know how much capital will enter the market, how purchases will be executed and whether the programme creates lasting demand. On November 6, World Liberty Financial announced that it was launching a buyback programme funded through an initial allocation that may include fees generated from reserves backing its USD1 stablecoin and other sources. The stated objective is to encourage governance participation and increase the voting power of long-term holders. The project also described buybacks as an ongoing part of its strategy, with the pace and scale depending on ecosystem growth and participation. The missing details are important. World Liberty has not disclosed the initial funding allocation, a purchase schedule or a specific amount of WLFI it intends to acquire. Without those figures, the market cannot estimate the programme's potential buying pressure. There is also a distinction between buying tokens and burning them. A purchase does not automatically remove tokens from circulation; that depends on what happens to the acquired supply afterwards. WLFI's market performance explains why the announcement attracted attention. Reuters reported on November 6 that the token had fallen approximately 10% following the election results and more than 60% since the beginning of 2026. Around 32% of its maximum supply of 100 billion tokens was reportedly in circulation. This means future supply releases remain relevant even if the buyback programme creates additional demand. The proposed funding source introduces another variable. If income from USD1 reserves contributes meaningfully to purchases, the relationship between stablecoin adoption and WLFI demand becomes more direct. Greater USD1 activity could potentially generate more revenue for the programme. However, the company has not disclosed how much of the funding will come from reserve income, so the scale of that relationship remains uncertain. Governance is equally important. WLFI voting power is linked to token holdings, meaning buybacks could increase the relative influence of holders who retain their tokens. That may encourage longer-term participation, but it also raises questions about how concentrated voting power could become. The programme should therefore be assessed not only by its effect on price, but also by its transparency and impact on governance. For WLFI, the next meaningful evidence will be actual on-chain purchases, disclosed funding and clear reporting on the treatment of acquired tokens. Until those details emerge, the announcement is a proposed source of support rather than proof that selling pressure has been absorbed. Key questions: 1. Can WLFI buybacks create sustained demand after a decline of more than 60%? 2. Will USD1 reserve income provide meaningful and consistent funding? 3. Could concentrating voting power among long-term holders weaken governance participation? #BlockchainSecurity

Greece Approves New Crypto Tax Rules for Investors
Crypto regulations in Europe keep moving forward. Greece's parliament has officially approved a new crypto tax framework. Now, if you trade crypto or earn income through DeFi in Greece, you need to understand the new tax rules. Let's break down what is happening. 10% Tax on Crypto Gains Greece has approved a 10% tax on cryptocurrency investment gains. But there is some relief for smaller investors. Annual crypto gains of up to €500 will remain tax-free. This means that if you make profits from crypto investments, you will need to consider this exemption when calculating your taxes. 15% Tax on DeFi Income There is also an important update for DeFi users. Income earned through staking, crypto lending and liquidity pools will face a 15% tax. This means that taxes will not only apply to trading profits but also to income earned by using crypto assets on DeFi platforms. Investors will need to include this extra cost when calculating their actual returns. 12 Months to Declare Previous Gains There is some relief for investors here. People who have not declared their previous crypto gains will get 12 months to report eligible past gains. Those who declare within this period may avoid late-filing penalties and interest, subject to the applicable conditions. What About Crypto-to-Crypto Swaps? There is still one important question that needs a clear answer. If an investor converts Bitcoin into Ethereum or swaps one cryptocurrency for another, how will the tax apply to that transaction? We will have to wait for the final implementation guidelines to understand this properly. My Take Greece's decision shows that crypto regulations in Europe are getting closer to traditional financial rules. Investors will now need to look beyond entry prices, exit prices and trading fees. Tax rules are also becoming an important part of managing a crypto portfolio. But the real test will be how these rules are implemented. It will be interesting to see how the new framework affects crypto investors and DeFi users. What do you think? Will taxing crypto profits make the market more regulated, or could it push investors away from crypto trading and DeFi? #ByXIMPACT #WSOT2026 #BybitAIEvolving #BlockchainSecurity


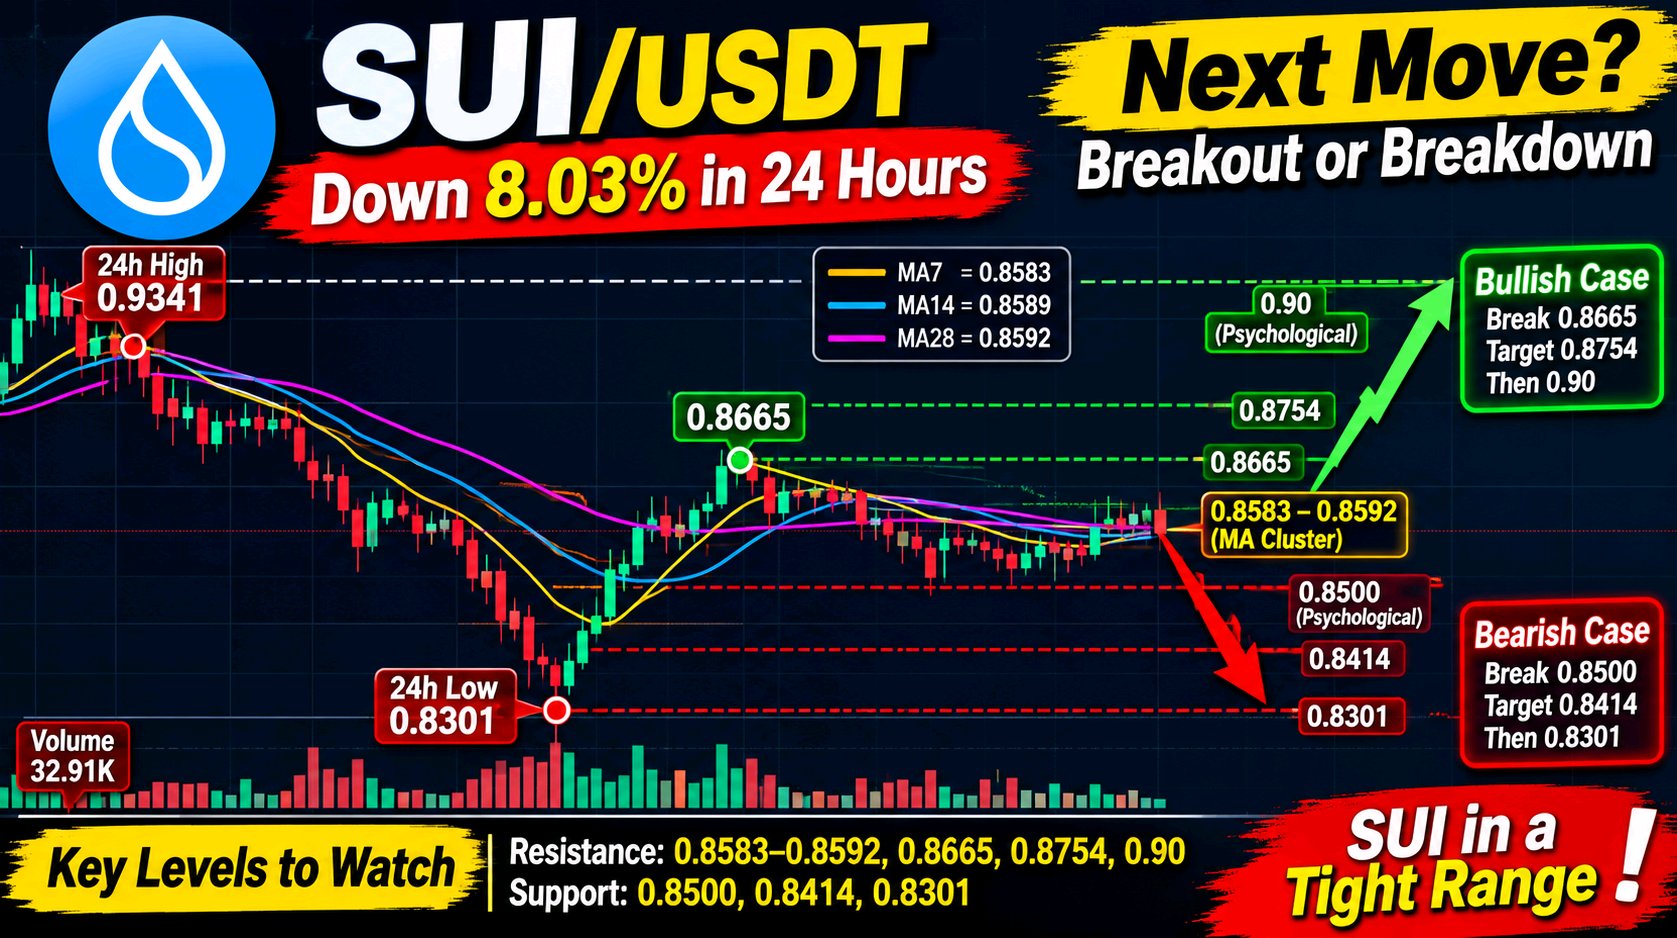
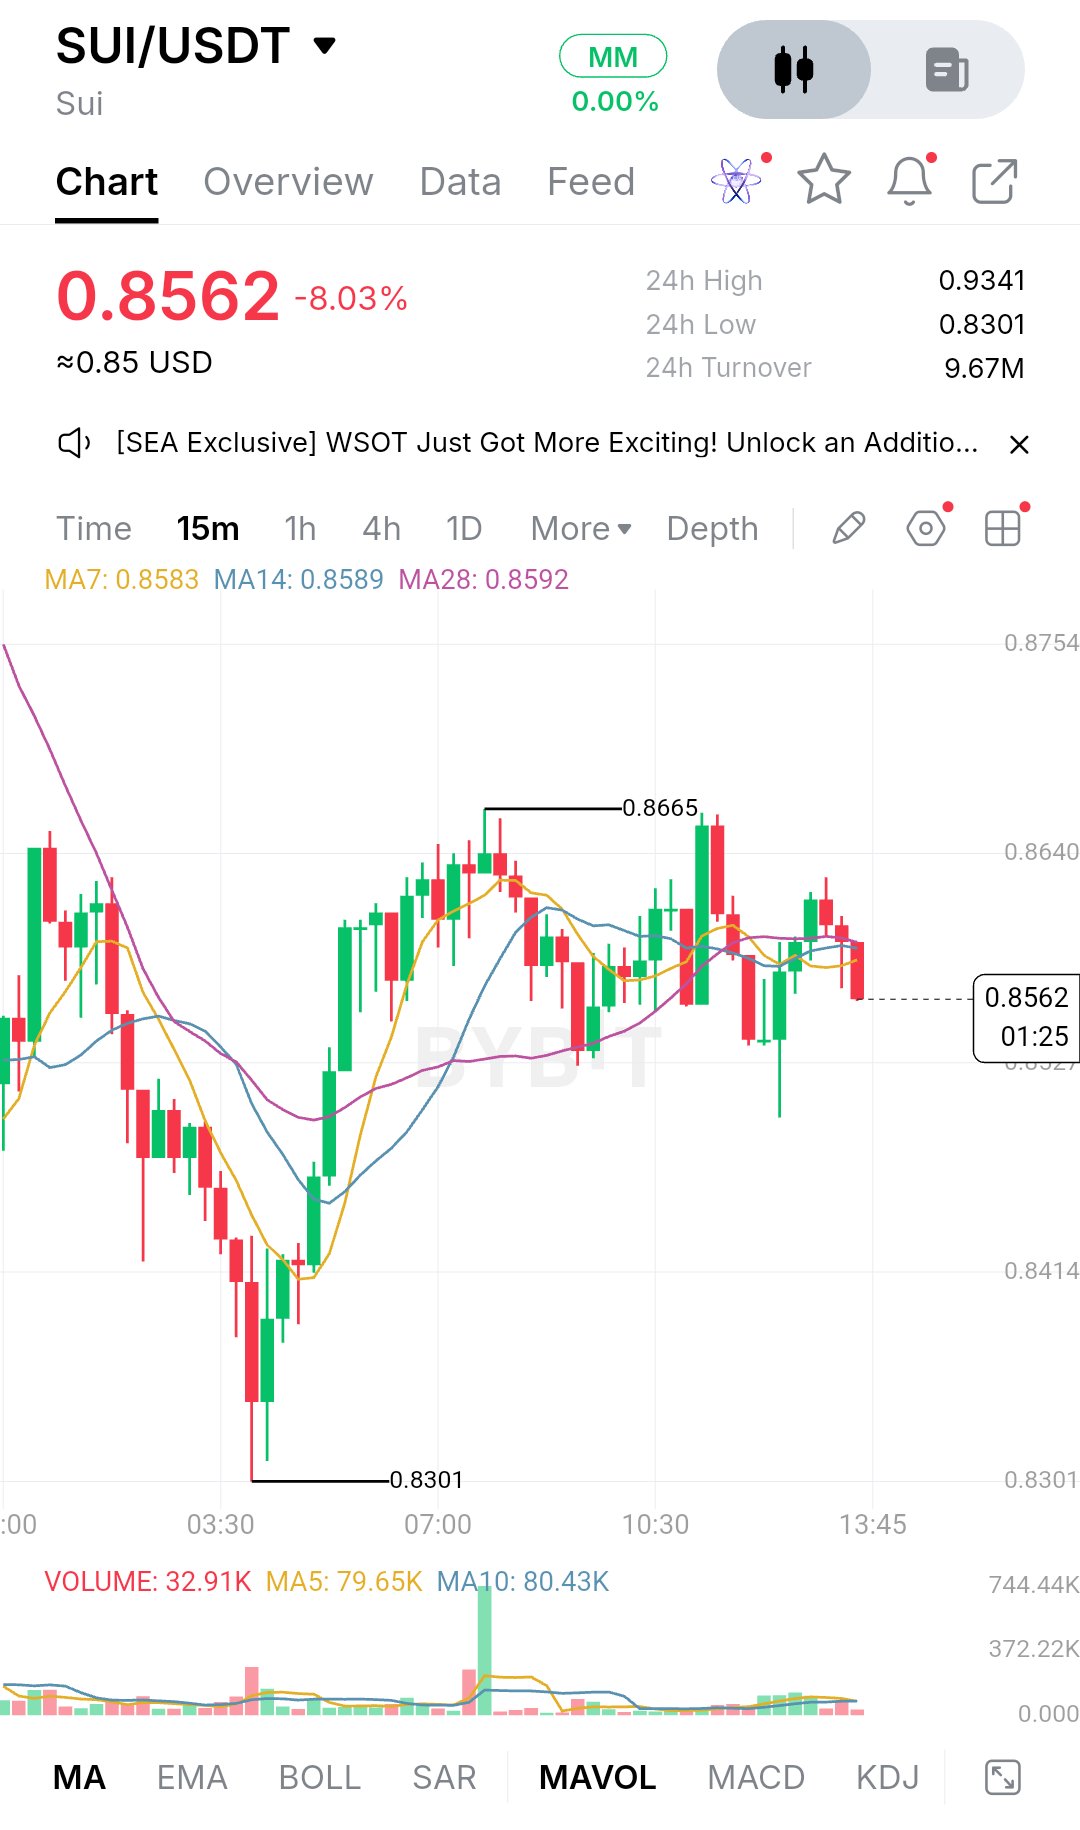
$SUIUSDT is trading at 0.8562, down 8.03% over the last 24 hours. The day began with buyers pushing price as high as 0.9341, but that strength didn't hold, and sellers took control from there. The slide ended at 0.8301, which is where the real damage stopped. That low was marked by a long wick, a sign that dip buyers showed up aggressively once price got there. Since then the chart has told a more cautious story. Price bounced hard from 0.8301, climbed back to a local high of 0.8665 around 07:15, and has spent the hours since moving sideways with a slightly heavier tone. The recovery was clean, but it never turned into a full reversal. Rallies keep stalling in the same area, and each push up is being sold into. The structure right now is a tight range sitting inside a larger downtrend. After a fast flush and a sharp rebound, the market is digesting. The candles are getting smaller, wicks are showing up on both sides, and price keeps rotating around the same band. That is classic consolidation, but the direction of the earlier move matters. Until buyers prove otherwise, this reads more like a pause than a bottom. On the moving averages, MA7 sits at 0.8583, MA14 at 0.8589 and MA28 at 0.8592, all bunched together right above the current price. When they compress like this, it usually means momentum has gone flat. Price is now trading slightly under all three, which turns that cluster into overhead resistance rather than support. The most recent candles are red and closing below the group, so short-term control leans toward sellers for the moment. Volume adds some context. The biggest spike of the session came during the push toward 0.8665, which is where buyers made their strongest attempt and where sellers answered. Since then activity has dried up. The latest volume reading is 32.91K against MA5 at 79.65K and MA10 at 80.43K, so current participation is well below recent averages. Low volume in a range tells you neither side is convinced, and it often comes before a larger move once one side commits. The first support to watch is the 0.8500 area, a round number sitting just below current price, and the level most likely to be tested next if sellers keep pressing. Below that, the 0.8414 zone on the chart's price axis is the next reference point. The big one is 0.8301, the session low and the spot where the rebound began. If price comes back there and holds again, buyers will have defended it twice, which strengthens the range. A clean break below with strong volume would be a different story. It would erase the entire recovery and open the door to fresh lows, because there is no obvious structure beneath it on this chart. On the upside, the immediate resistance is the moving average cluster around 0.8583 to 0.8592. Above that sits 0.8640, a level the chart has reacted to before, followed by the swing high at 0.8665. A move through that high would be the first real sign of strength. Beyond it, 0.8754 is the top of the visible range and the next logical target, and the 0.90 psychological zone sits higher still, with the 24-hour high of 0.9341 as the major ceiling for the day. For the bullish case, buyers first need to reclaim the moving average cluster and hold above it on closing candles. After that, they need to take out 0.8665 with rising volume, not the thin participation we have now. If that happens, 0.8754 becomes a realistic next stop, and a sustained hold above it would put 0.90 back in play. The key is follow-through. A breakout on weak volume has a much higher chance of fading. The bearish case is simpler. If price keeps getting rejected under 0.8590 and prints lower highs, sellers stay in control. That likely brings 0.8500 into play first, then 0.8414. If those give way, a retest of 0.8301 becomes likely, and a close below it would confirm that the earlier bounce was just a relief move inside a larger decline. Key price levels: - Resistance: 0.8583 to 0.8592 (MA cluster), 0.8640, 0.8665 (swing high), 0.8754, 0.90 (psychological), 0.9341 (24h high) - Support: 0.8500 (psychological), 0.8414, 0.8301 (24h low) - Current price: 0.8562 Overall, SUI is sitting in a compressed range after a sharp drop and a strong bounce, with price pinned just beneath a flat cluster of moving averages and volume fading. That combination usually does not last long. The next meaningful move will likely come from either a volume-backed break above 0.8665 or a decisive loss of 0.8500 and then 0.8301. Rather than guessing direction, it makes more sense to watch how price reacts at those edges, because the quality of that reaction will say a lot about whether the next expansion is a recovery or a continuation lower. This is not financial advice, so manage your risk accordingly. #BlockchainSecurity $ETHUSDT

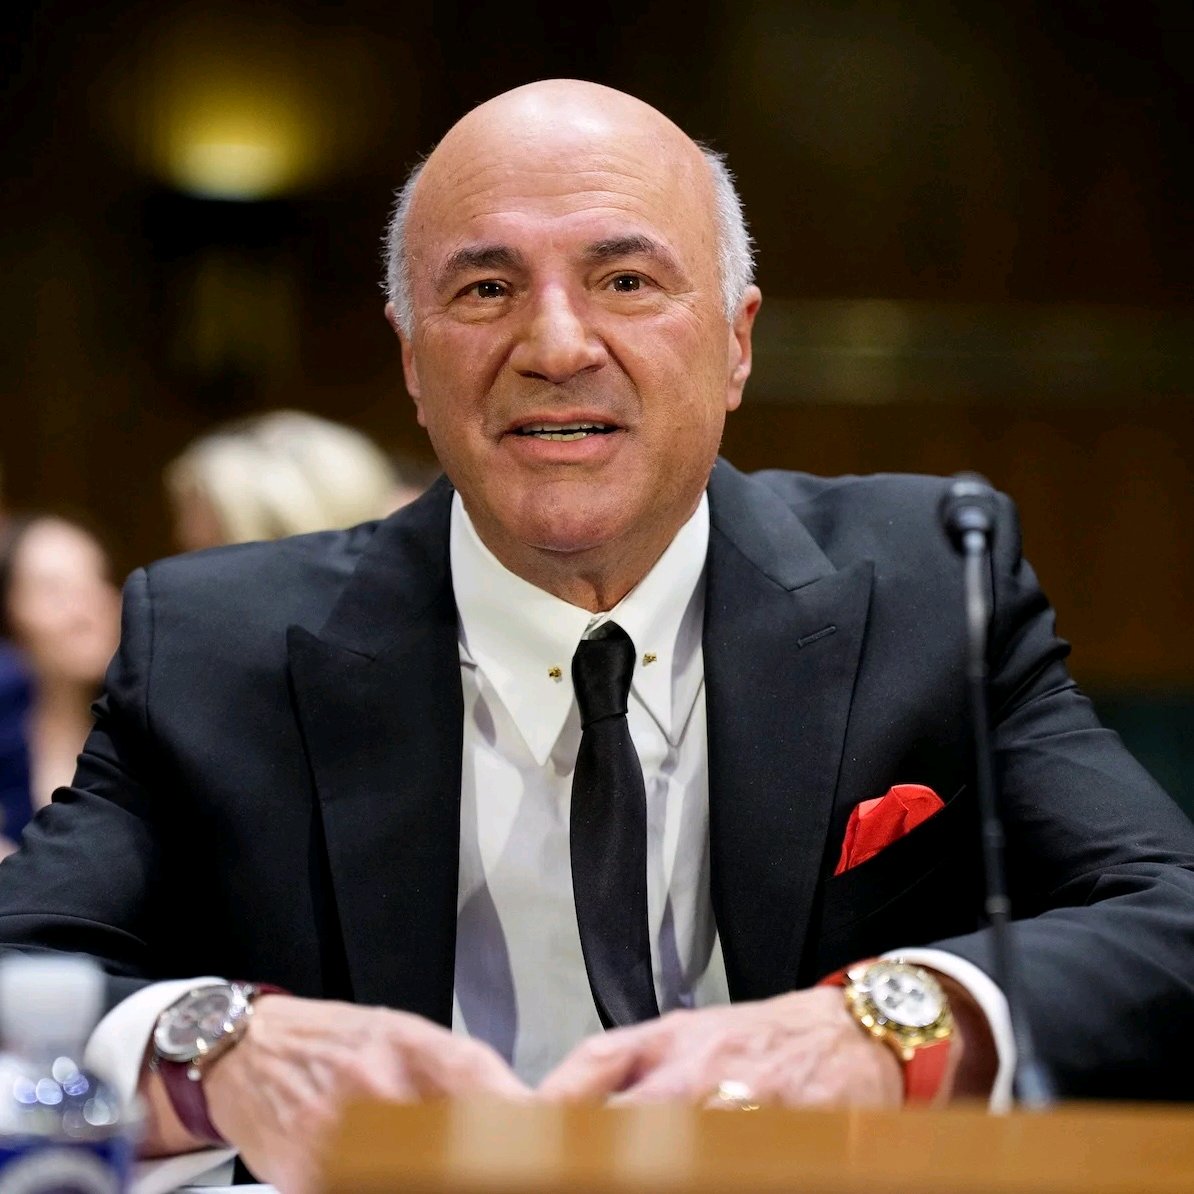
Binance and CZ have subpoenaed Kevin O'Leary in the ongoing $1.76 billion FTX lawsuit. ₿ $BTC The legal battle centres on a 2021 deal in which FTX repurchased Binance's ownership stake. Bankruptcy administrators allege that the transaction was funded using misappropriated customer assets. Binance and CZ have denied wrongdoing and attempted to dismiss the lawsuit, arguing that responsibility for FTX's collapse lies with Sam Bankman-Fried. A US bankruptcy judge ruled in July that the $1.76 billion recovery claim could proceed, keeping the dispute alive. $BTCUSDT #USPayrollsAndRateDecisionsDriveMacroWeek #BlockchainSecurity #BybitAIEvolving #OilVolatilityTracksIranPeaceTalks #ByXIMPACT


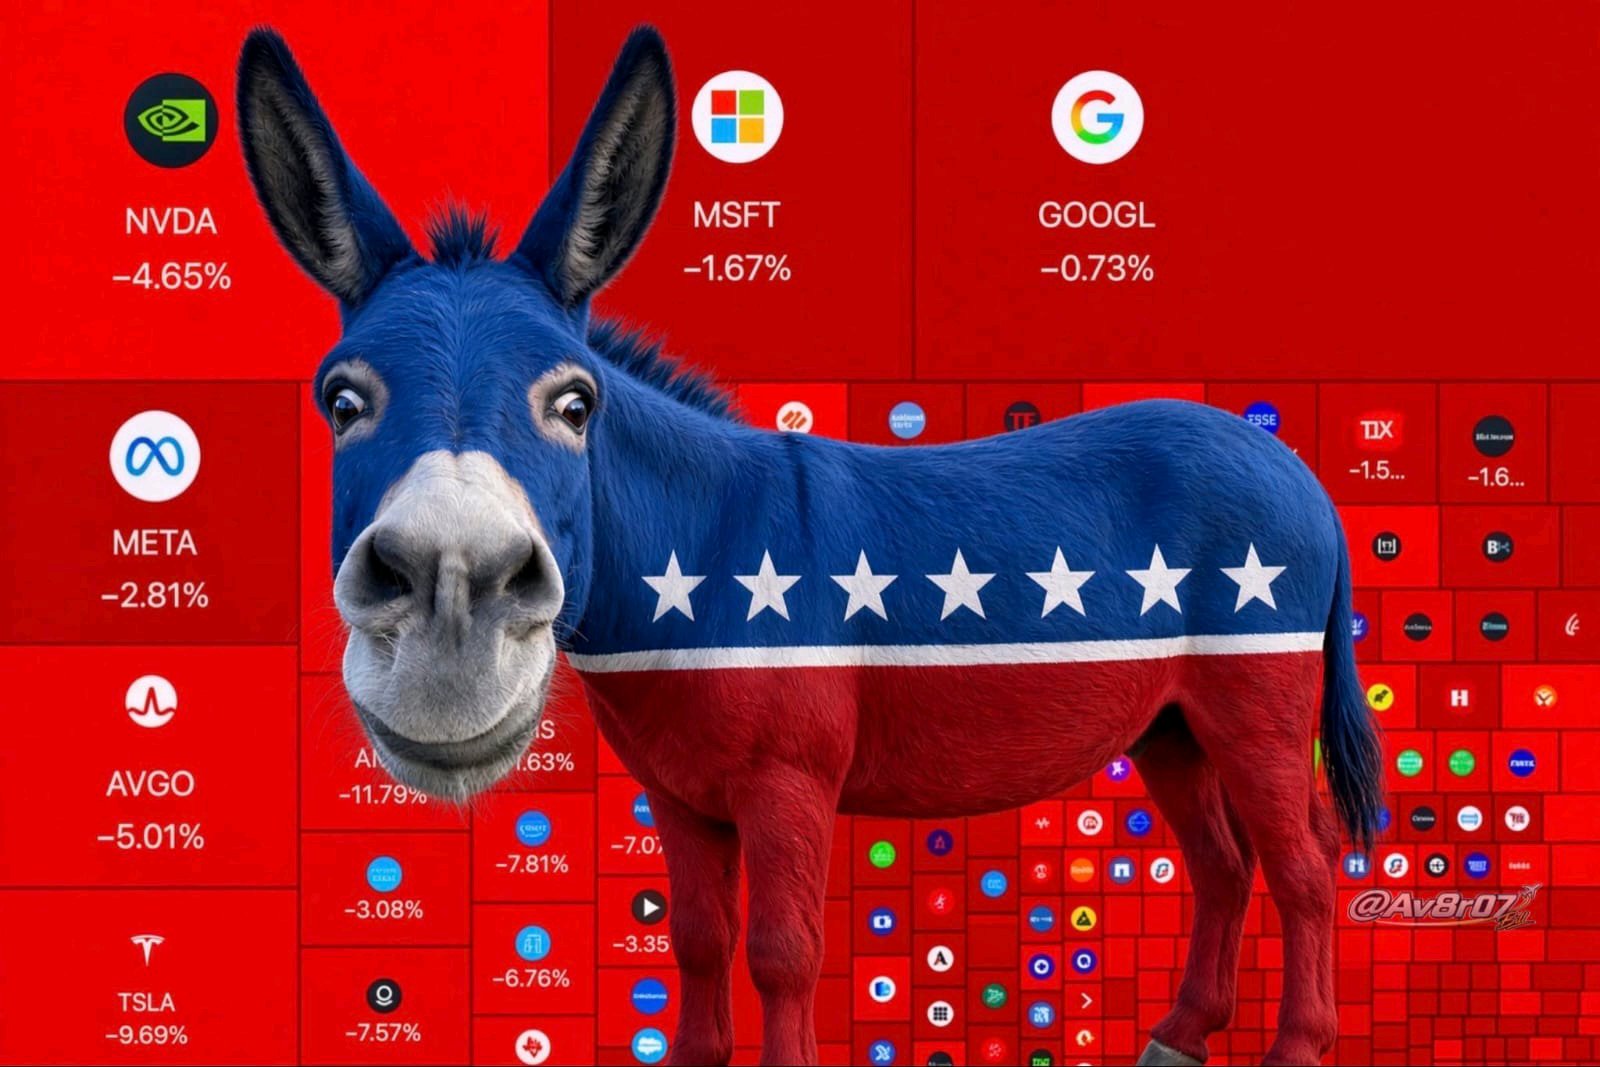
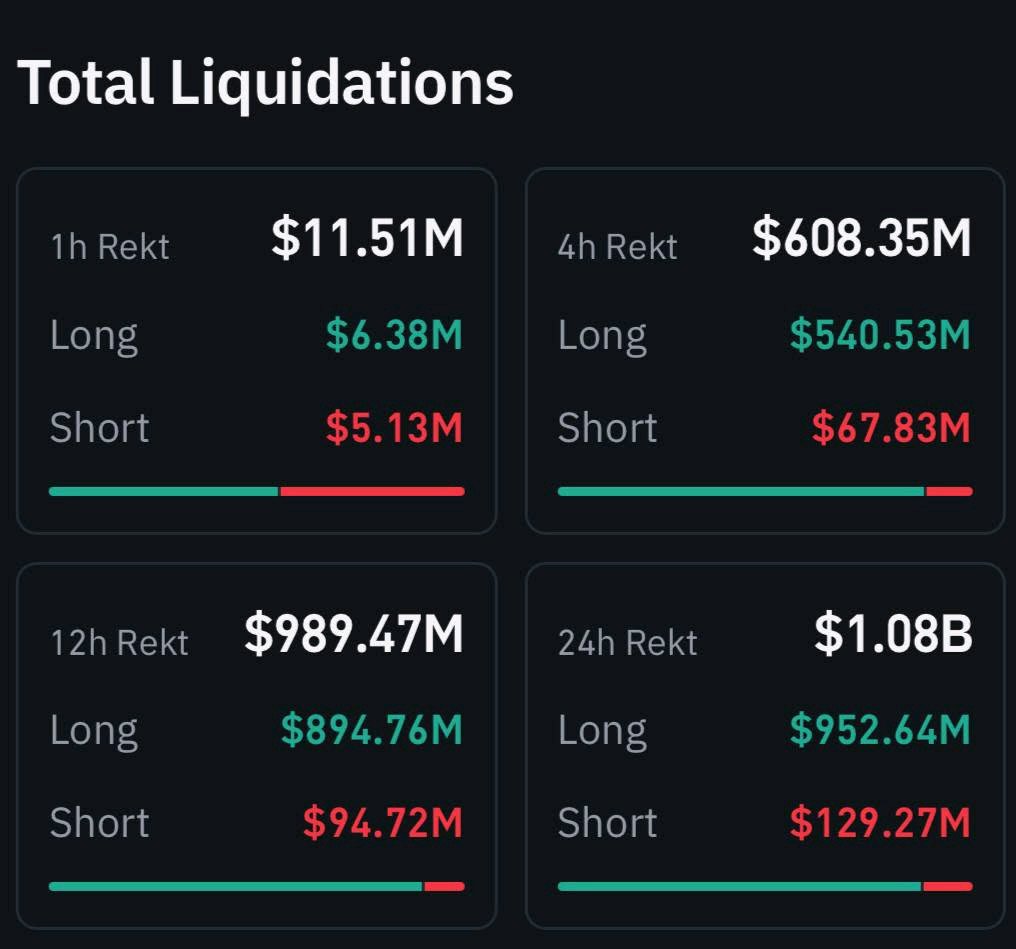
What on earth is happening in the financial markets right now ? honestly, this is becoming one of the most difficult periods to navigate, not just for stock investors but for crypto traders as well. The combination of political uncertainty, Trump's influence over government decisions, shifting economic expectations and growing market anxiety is creating an environment where confidence can disappear incredibly fast. And the consequences are showing up everywhere. Stocks and Crypto Are Feeling the Pressure what concerns me most is how quickly sentiment has changed. Investors who were comfortable holding risk asets are suddenly becoming more defensive. When uncertainty increases around government policy, trade decisions, economic direction, and interest rates, traditional markets can react aggressively. The stock market is particularly sensitive to these developments because large companies depend on stable economic conditions, predictable policies, and investor confidence. But crypto is not isolated from that environment. Bitcoin and the broader cryptocurrency market are still heavily influenced by global liquidity and overall risk appetite. When investors start reducing exposure to risky assets, crypto often feels the pressure alongside technology stocks and other growth-oriented investments. That is why we can see selling pressure across multiple markets at the same time. $1 BILLION+ LIQUIDATIONS. That's Not Something to Ignore. 🔴 The liquidation figure makes the situation even more concerning. When more than $1 billion in leveraged positions gets liquidated, it shows how dangerous excessive leverage can become during sudden market movements. Long positions can get wiped out when prices fall sharply. Then, if the market rebounds aggressively, overleveraged short positions can become the next targets. This creates a chain reaction. price drops trigger liquidations, liquidations add further selling pressure, and panic encourages more traders to exit their positions. Before long, the market can move much further than many participants expected. However, I would separate forced liquidations from genuine long-term selling. They are not necessarily the same thing. What Am I Watching Now? I am not interested in blindly buying every dip, but I am also not convinced that every sharp correction means the entire market cycle is finished. My focus is on three things. First, whether Bitcoin can establish a meaningful support zone instead of continuing to print lower lows. Second, whether traditional stock markets can regain stability. A sustained recovery in risk sentiment could help crypto as well. Third, whether liquidation pressure starts cooling down. Until excessive leverage is cleared, sudden volatility can remain a serious problem. for now, capital preservation matters more to me than trying to catch every falling candle. I would rather miss the first part of a recovery than enter too early and get caught in another liquidation wave. My Personal Trading Strategy I am keeping my leverage low, avoiding emotional entries, and watching important support and resistance levels before making decisions. If the market stabilizes, I will look for confirmation before considering new positions. If selling pressure continues, I am comfortable staying patient and keeping some capital available for better opportunities. One thing is certain: political headlines can change market sentiment quickly, but price action still needs to confirm the direction. This is a market where risk management is not optional. what do you think is driving this situation more right now: Trump's political influence, macroeconomic uncertainty, institutional selling, or excessive leverage across the financial markets? Are we looking at a temporary liquidity shock, or could this be the beginning of a much deeper correction? Let's hear your thoughts. #BlockchainSecurity #Oracle20BFundingPlanTestsTheAITrade #AnthropicIPOTestsTheAIBoom #BOERateDecision #BybitAIEvolving $BTCUSDT $ETHUSDT

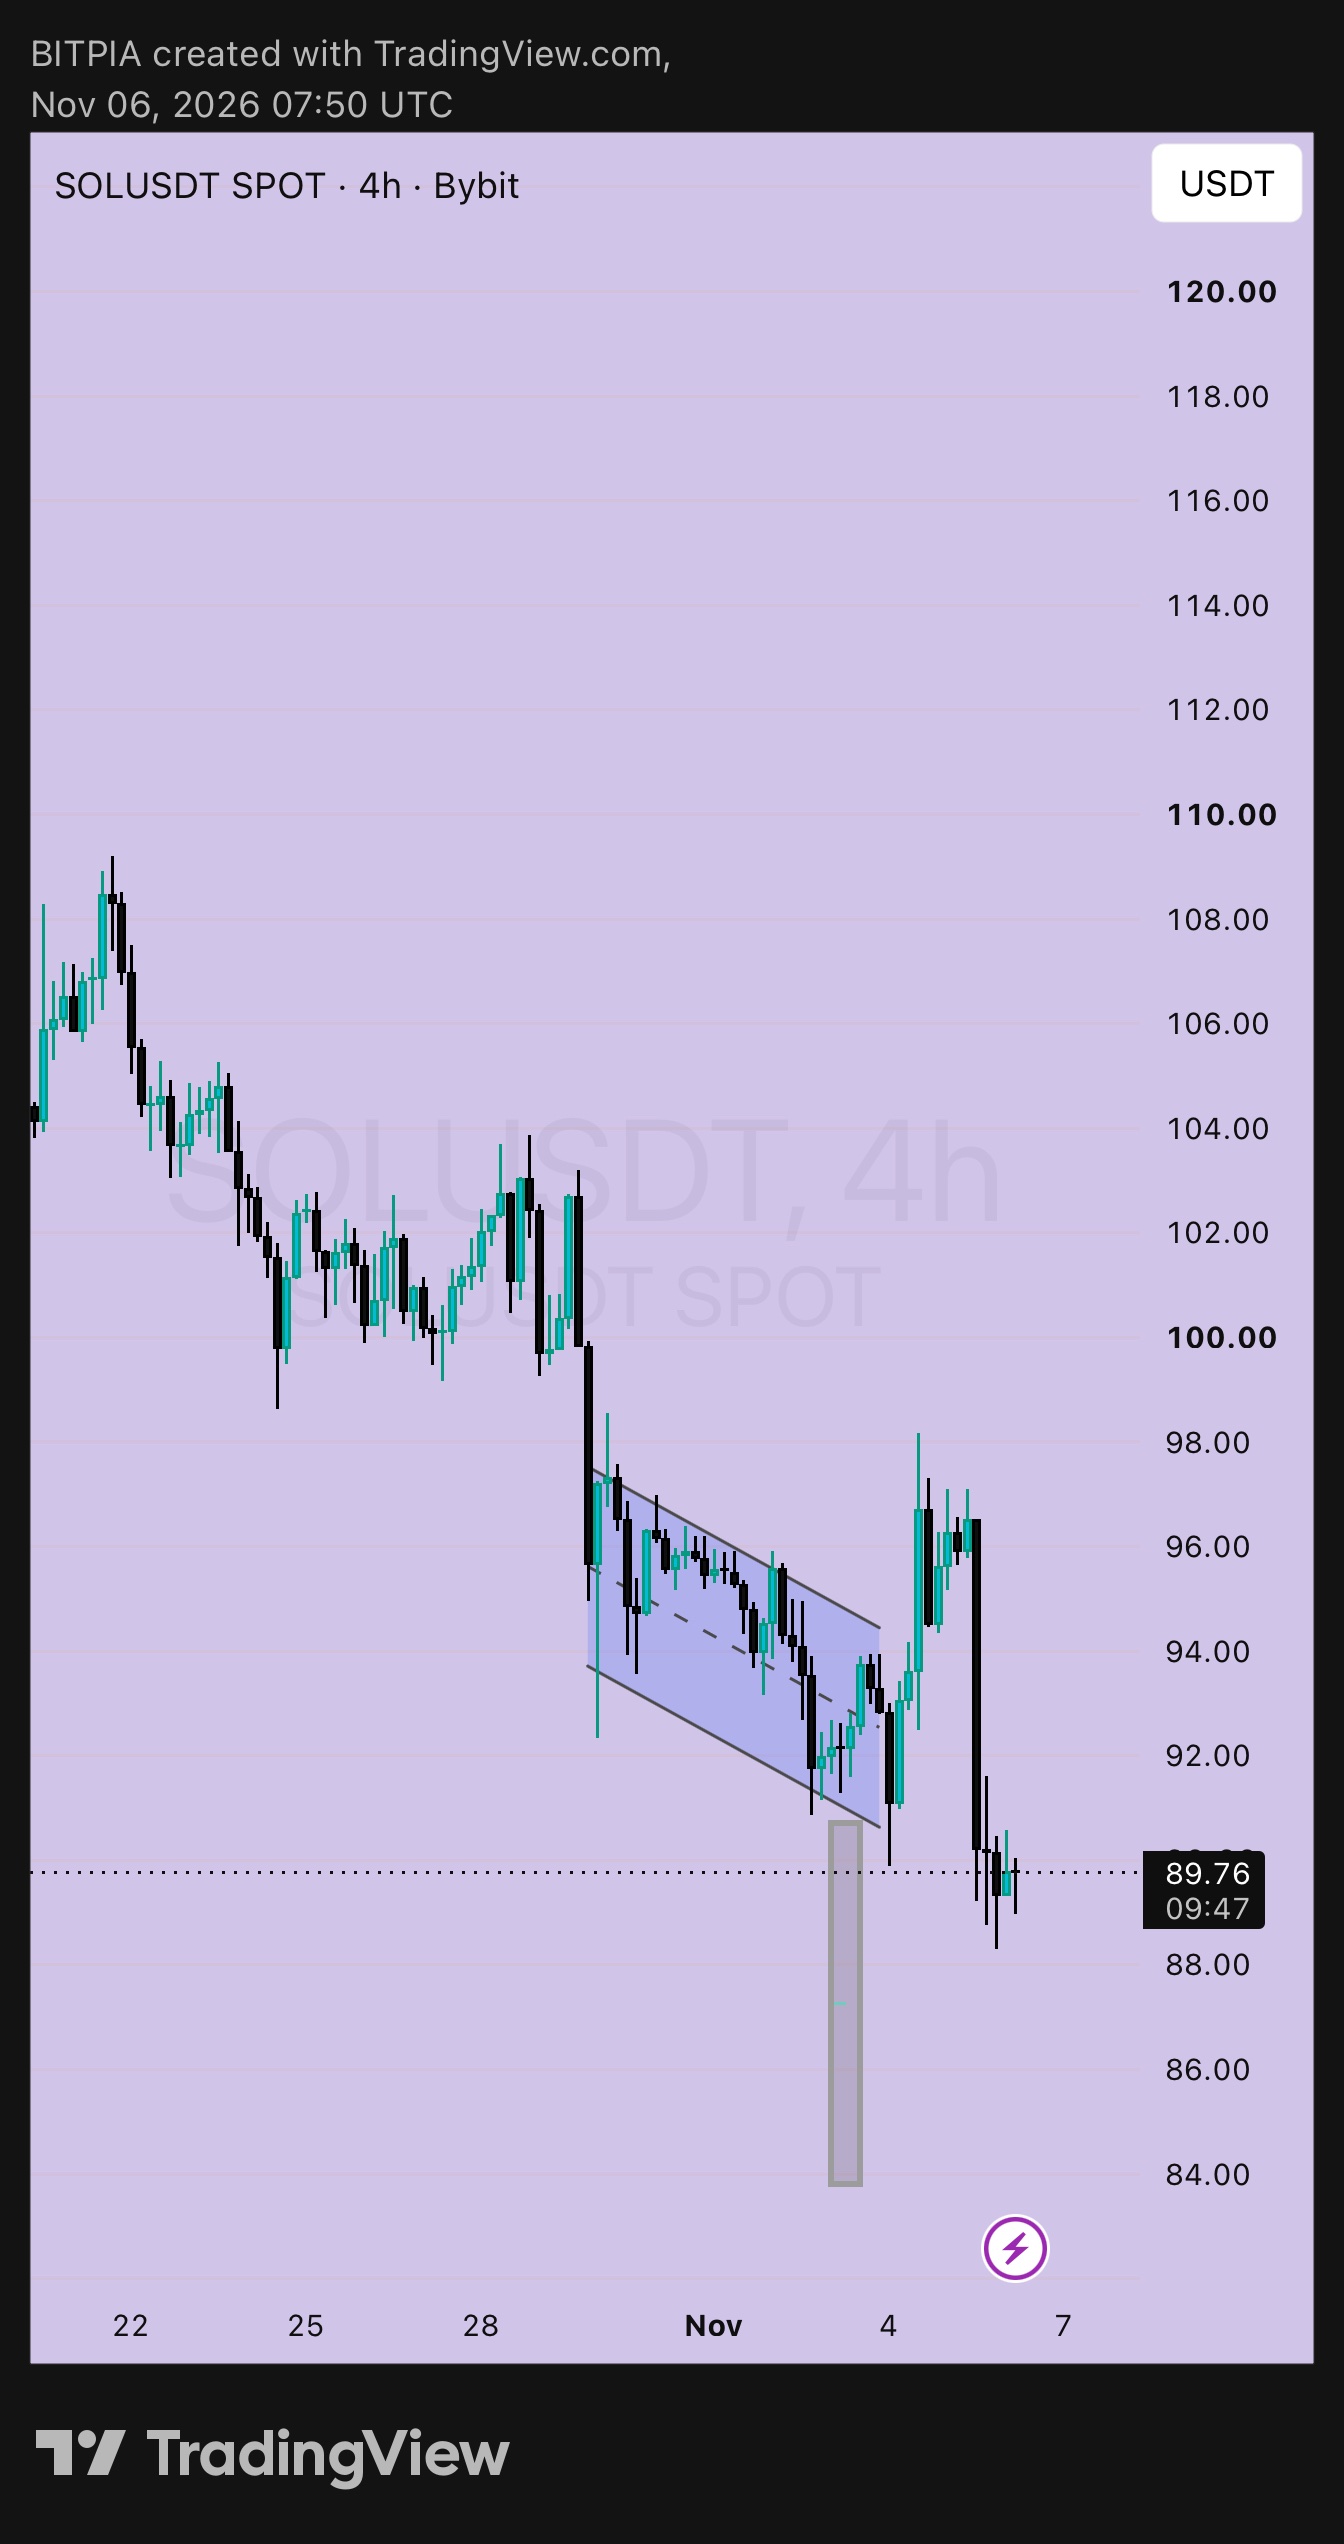
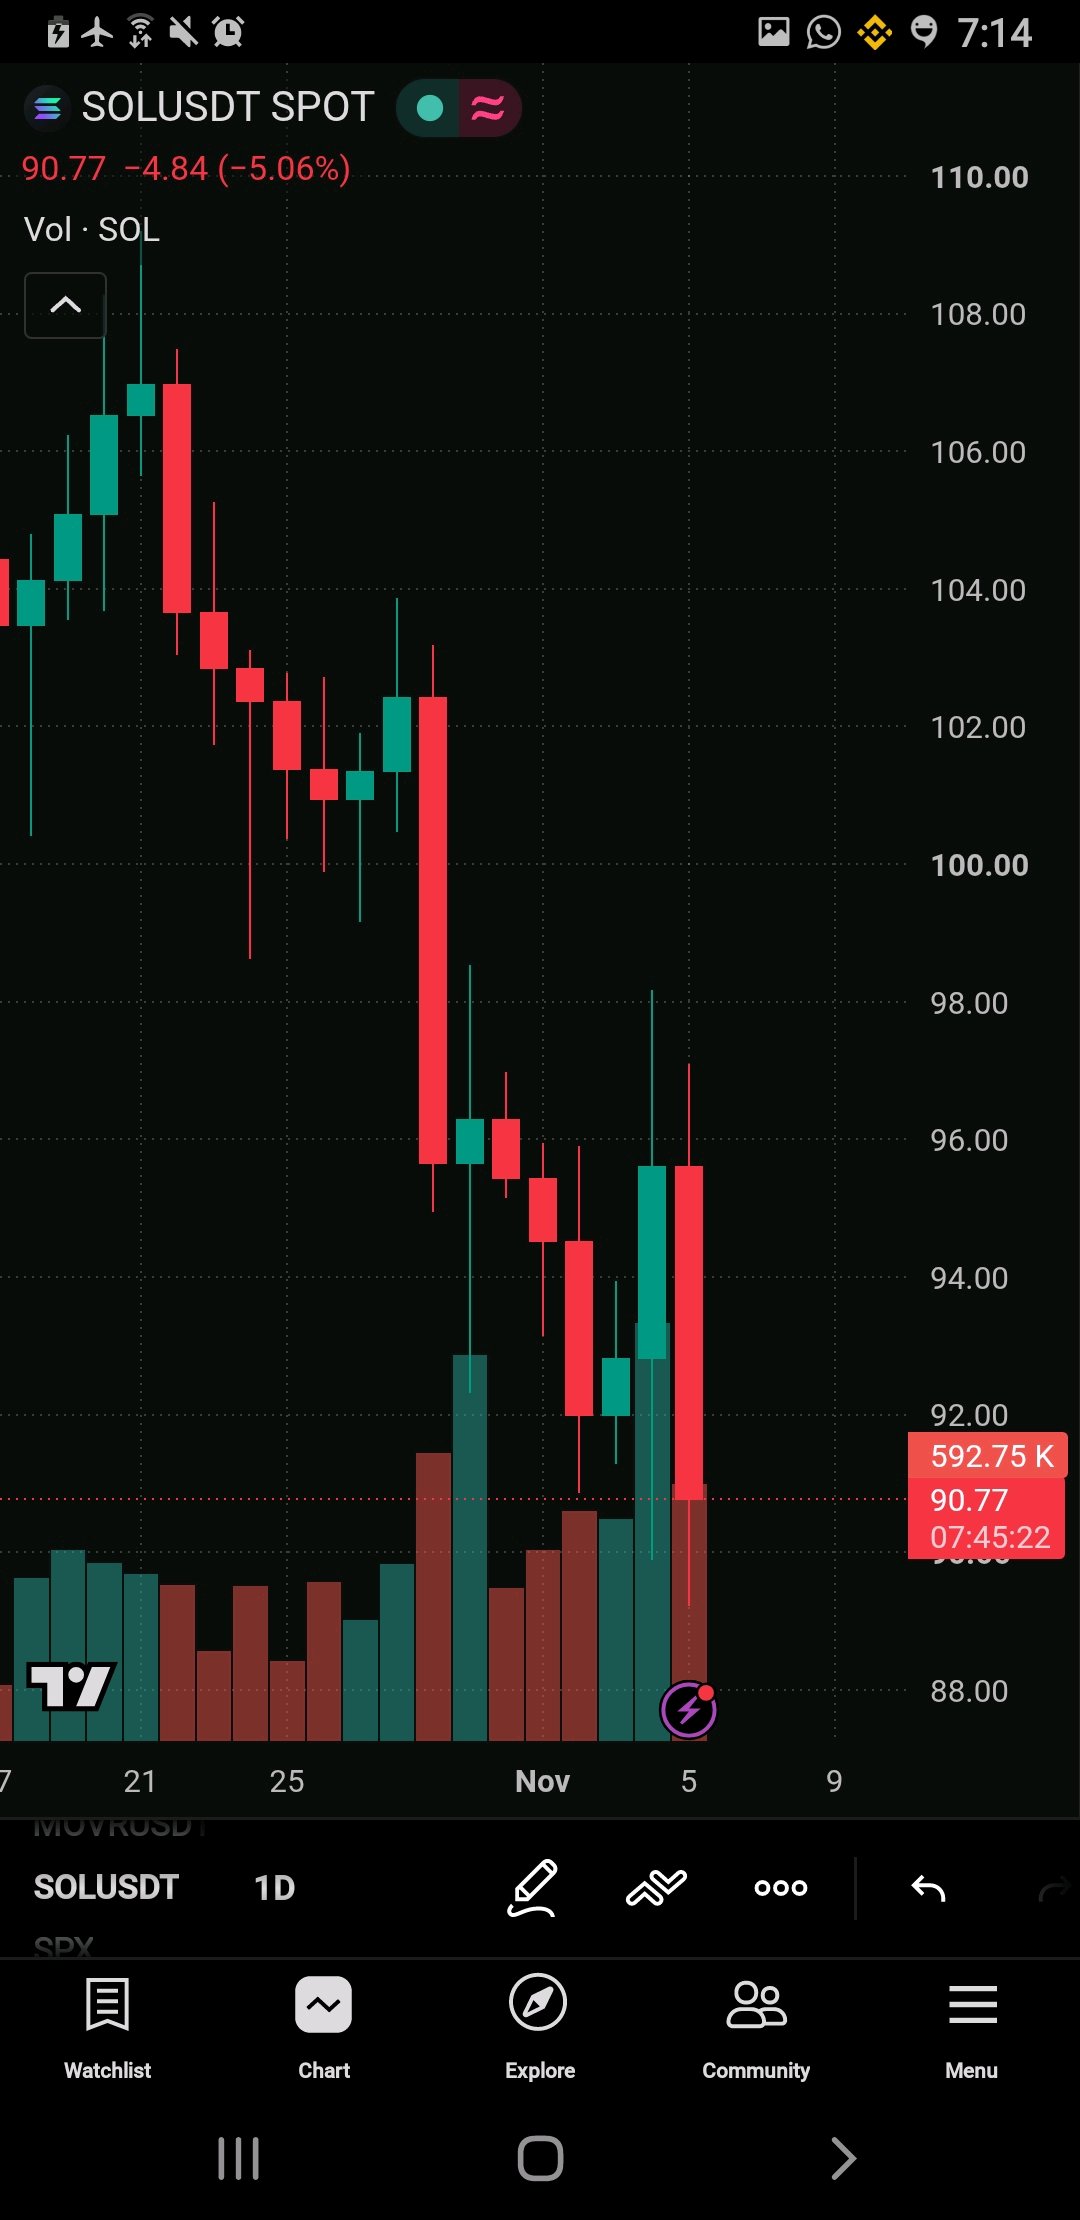
SOL 4h: both sides of the trade
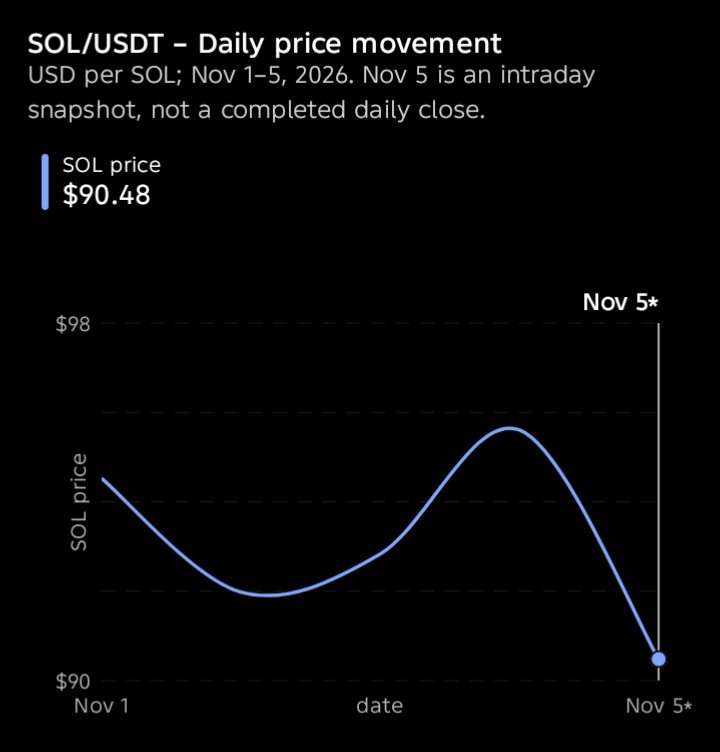
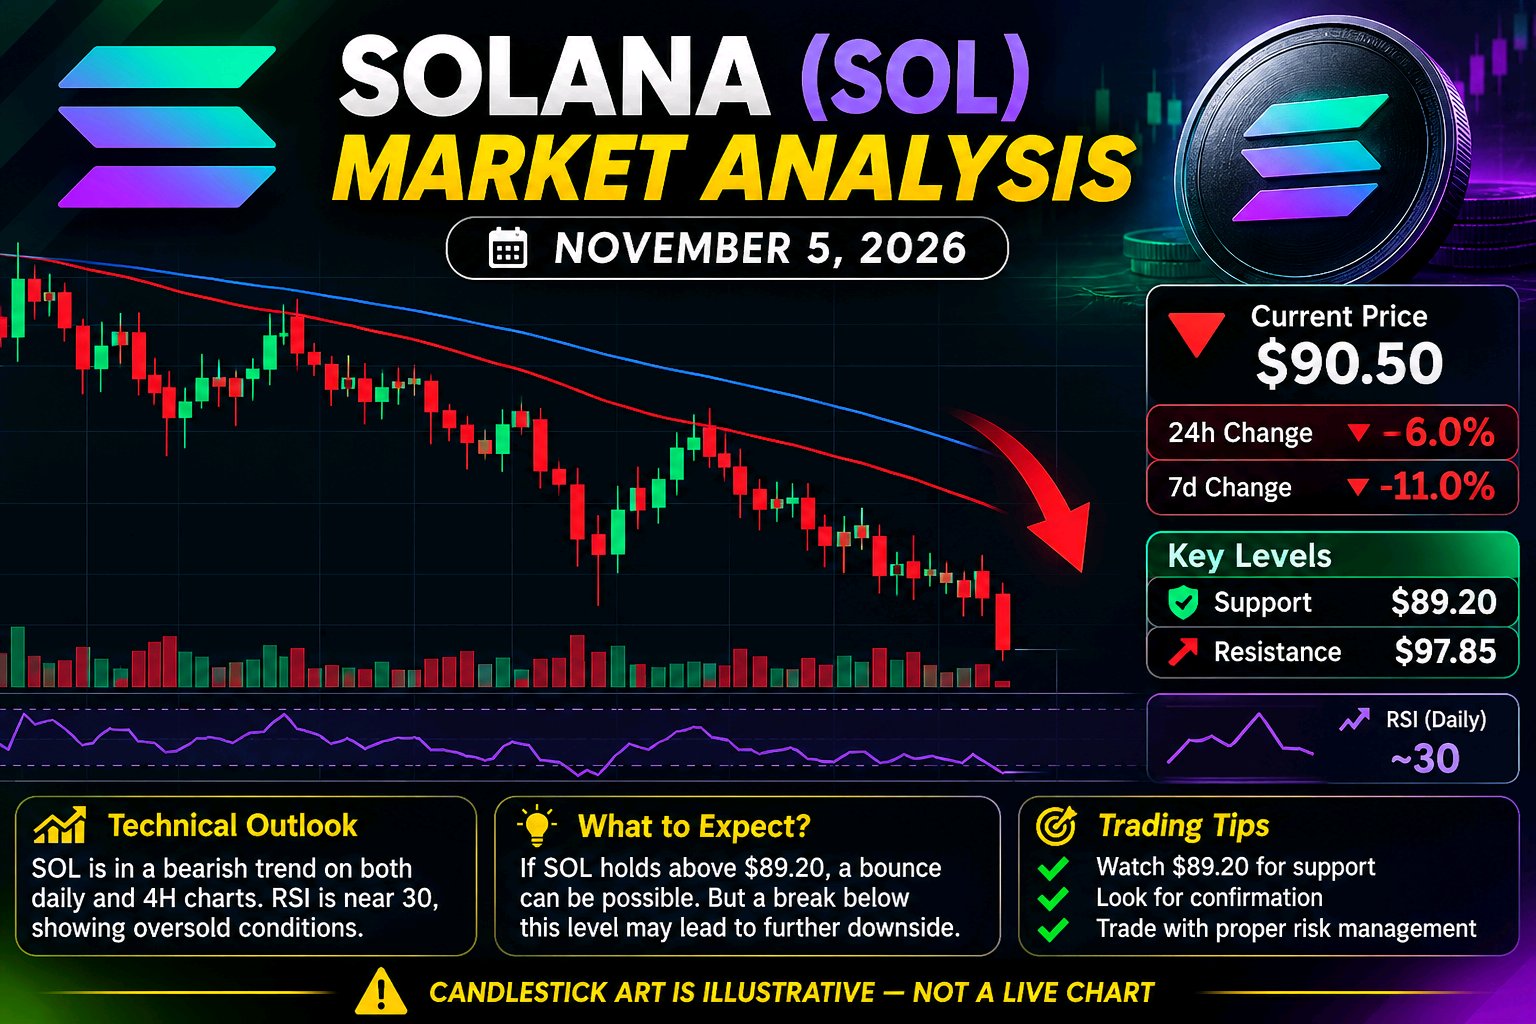
$SOLUSDT is at 89.77. The flag I've been tracking broke lower, price bounced to about 98, and then it rolled back under the old flag low near 90.5. The measured move from the flag points to roughly 84, which is the grey box on my chart. So I'm looking at this from both directions. ➤ What I see ▸ The bounce to 98 failed and sellers took back control ▸ Price is now below the flag, and the 90.5 area has flipped from support to resistance ▸ The wick low near 88.5 is the first level to watch ➤ Side 1: short on a retest ▸ Entry: around 91.5, if price retests the flag low and gets rejected ▸ Stop-loss: above 94.0 ▸ Risk per unit: 2.5 ▸ Targets: 86 (+5.5, about 2.2R) and 84 (+7.5, about 3R) ➤ Side 2: long near the target zone ▸ Entry: around 85, only if price reaches the 84 to 86 area and buyers show up ▸ Stop-loss: below 82.5 ▸ Risk per unit: 2.5 ▸ Targets: 90.5 (+5.5, about 2.2R) and 94.5 (+9.5, about 3.8R) ➤ What I'm not doing Not opening anything at 89.77. That's the middle of nowhere, with no level close enough for a tight stop. ➤ What changes my view A 4h close back above 94.5, the top of the old flag, tells me the breakdown failed and sellers lost control. I'd drop the short idea and look at 98 again. Both ideas depend on the levels holding, so keep size small and leverage low if you use perps. Not financial advice. Do your own research and only risk what you can afford to lose. #ByXIMPACT #WSOT2026 #BlockchainSecurity

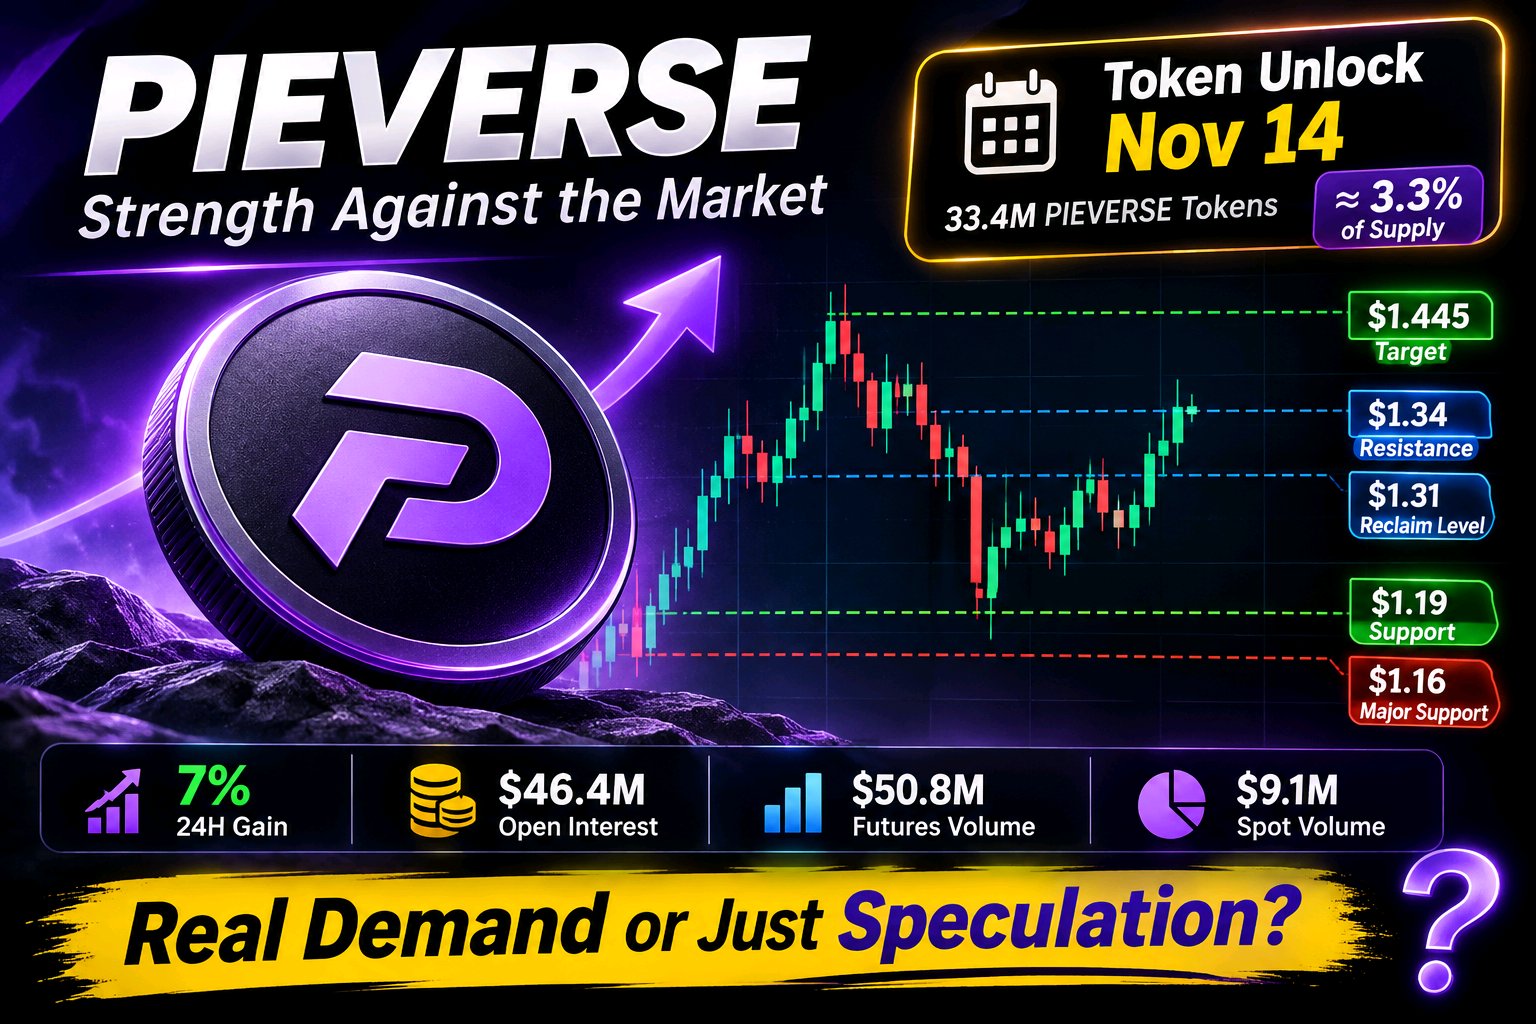
$PIEVERSEUSDT is showing an unusual kind of strength: it is moving against the broader market instead of simply following Bitcoin's direction. In the November 6 market snapshot, PIEVERSE gained around 7% while BTC dropped 5.37% and ETH lost 7.34%. That relative strength is worth watching, but the question is whether real spot demand is supporting it. The derivatives picture deserves attention. Open interest is around $46.4M, while 24-hour futures turnover reached approximately $50.8M against just $9.1M in spot volume. This suggests speculative positioning is playing a much bigger role than spot activity. It can accelerate a breakout, but it can also make a reversal sharper. My technical focus is the $1.19–$1.34 range. The $1.19 area is the first important defense, while $1.31 is the reclaim level that could improve the short-term structure. A sustained move above $1.34 would open the way toward $1.445. On the downside, losing $1.19 puts the $1.16 support area back in focus. There is another factor traders should not ignore: 33.4 million PIEVERSE tokens are scheduled to unlock on November 14. That represents approximately 3.3% of total supply. Not every unlocked token will be sold, but the market will need enough genuine demand to absorb the additional supply. Pieverse has a real infrastructure angle through agent-native payments, verifiable receipts and compliance-focused transactions. Its token also has governance, staking and fee-discount utilities. However, product adoption only becomes a strong token catalyst when it translates into measurable token demand. I would avoid chasing momentum before seeing how price reacts around the reclaim zone. If $1.19 holds and $1.31 is recovered, the bullish case improves. If support breaks, the setup changes. Is PIEVERSE's relative strength evidence of genuine accumulation, or is leveraged trading creating a rally that could struggle when the unlock approaches? #WSOT2026 #BlockchainSecurity
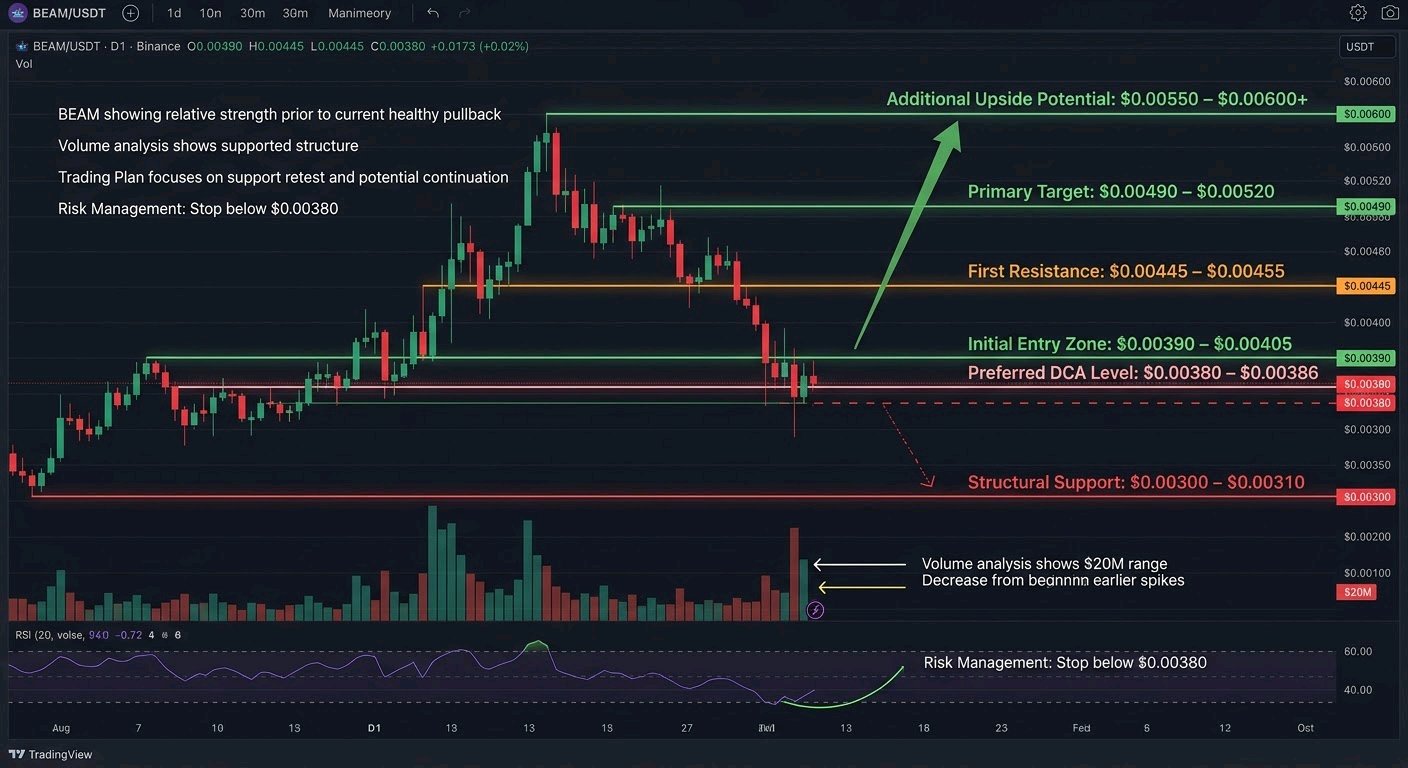
$BEAMUSDT - STRONG RELATIVE STRENGTH EARLIER THIS WEEK, NOW PULLING BACK HARD. I’M WATCHING THE $0.0038–$0.0039 ZONE CLOSELY FOR THE NEXT MOVE.** Beam has been one of the clearer relative-strength names in the gaming/GameFi sector over the past month. While large parts of the market chopped or sold off, BEAM pushed a multi-week uptrend, broke higher on elevated participation late October, and briefly extended toward the $0.006 area. That move has now given back a good portion of the recent gains. Price is currently trading near $0.00395–$0.0040 after a roughly 15% decline over the last 24 hours, with the 24h range stretching from roughly $0.00394 to $0.00479. On the higher timeframes the structure still looks constructive. The broader uptrend from the June lows remains intact, price is holding above several key moving averages on the daily, and the October breakout that flipped prior resistance into potential support is still in play. What we’re seeing now is a classic post-impulse pullback after an overextended push. Relative strength versus Bitcoin over the last 30 days has been notable, even if the last day or two has shown some mean-reversion. **Volume Analysis** 24-hour volume is running in the $20M range across major venues (spot + perps). That is still elevated compared with quieter periods earlier in the month, though it has cooled from the extreme spikes seen during the late-October breakout. The volume profile of the recent advance was healthy — participation expanded as price moved higher. The current pullback has not yet shown the kind of aggressive high-volume selling that would signal a full trend reversal. I’m treating the volume as still supportive of the larger structure rather than a distribution event, provided the key demand zones hold. **My Trading Plan** I’m treating this as a potential continuation setup after the pullback, not a fresh breakout chase. - **Initial Entry Zone**: $0.00390 – $0.00405 (current area and slight dips). This is where I’m looking for the first signs of buyers stepping back in after the recent flush. - **Preferred DCA Level**: $0.00380 – $0.00386. This zone has acted as short-term support recently and aligns with prior structure and order-block type demand from the impulse move. A controlled fill here improves the overall risk-reward. - **First Resistance**: $0.00445 – $0.00455. This is the immediate area price needs to reclaim and hold to signal the pullback is likely complete. - **Primary Target**: $0.00490 – $0.00520. A clean move back through this zone would put the recent local highs back in play. - **Additional Upside Potential**: $0.00550 – $0.00600+ if momentum returns and the broader market cooperates. These levels were tested during the late-October spike and remain logical extensions of the current structure. Confirmation for me is a higher low forming on the 4H/ daily combined with a reclaim of the $0.00445 area on rising volume. Without that, I stay patient and size smaller. **What Could Go Wrong?** The biggest risk is that this pullback deepens into a larger correction. A decisive break and daily close below $0.00380 would weaken the short-term bullish structure and open the door toward the $0.00340 – $0.00350 demand zone that launched the latest leg higher. Below that, the next meaningful structural support sits closer to the $0.00300–$0.00310 region. If volume expands sharply on the downside while the broader market remains soft, the relative-strength story can fade quickly. I’m also watching for any sustained weakness in the gaming sector as a whole. A failure to hold the $0.00380 area on volume would invalidate the immediate long setup for me and force a reassessment of the higher-timeframe structure. **My Perspective** Beam remains interesting because it has shown genuine relative strength inside a still-fragile altcoin environment. The multi-month uptrend, the clean breakout structure, and the fact that it held up better than many peers during recent market stress keep it on my radar. The current pullback looks like healthy digestion after a sharp run rather than the start of a major top — at least as long as the $0.00380–$0.00390 zone continues to attract buyers. I’m watching two things next: whether buyers defend the current support cluster with improving volume, and whether price can reclaim $0.00445 without heavy selling on the attempts. If those conditions develop, I’m expecting a continuation move that retests the recent highs and potentially extends further. If support fails cleanly, I’ll step aside and wait for a clearer higher-low structure to form lower. No guarantees in this market — just levels, structure, and risk management. BEAM is still one of the names I’m actively tracking for a potential next leg higher once this pullback stabilizes. #ByXIMPACT #WSOT2026 #BlockchainSecurity

$SOL | A strong ecosystem doesn't guarantee a strong price. Market confirmation still matters. Solana is trading around $89 after losing the $92 support zone during the latest market sell-off. Despite continued activity across its DeFi, meme-coin and trading ecosystems, SOL still needs to demonstrate that buyers are willing to defend current levels. Here's what traders should watch: • $89: Immediate price zone to monitor. • $85–$87: Key potential support area. • $92.30: Important resistance to reclaim. • $98: Next upside target if bullish momentum strengthens. A sustained move above $92.30, supported by stronger spot volume, could improve the short-term structure and open the door towards $98. However, continued rejection below resistance could leave SOL vulnerable to further downside. My take: Solana's ecosystem growth is worth watching, but network activity and token price performance are two different things. Traders should focus on demand, volume and confirmation before anticipating a recovery. Strong fundamentals matter. Price confirmation matters too. #Solana #SOL #Bybit #DeFi #CryptoTrading #BlockchainSecurity #MidtermsMarketWatch
$DOGE | Community strength can attract attention, but only buying pressure can sustain a rally. Dogecoin is facing renewed selling pressure, trading around $0.072–$0.073 after losing the $0.0724 support level. Despite continued speculative interest, price action suggests sellers still have the upper hand. Here's what traders should watch: • $0.0710: Immediate support to defend. • $0.0702: Next potential downside level. • $0.0770: Key resistance and recovery level. A sustained reclaim of $0.0770, backed by stronger spot volume, could signal a shift in short-term momentum. However, a confirmed breakdown below $0.0710 would increase downside risk and strengthen the bearish outlook. My take: DOGE needs genuine demand to support a recovery. Traders should monitor volume, Bitcoin's stability and reactions around key levels before positioning for the next move. Meme momentum is powerful, but market structure still matters. #Dogecoin #DOGE #Bybit #Memecoins #CryptoTrading #BlockchainSecurity #MidtermsMarketWatch
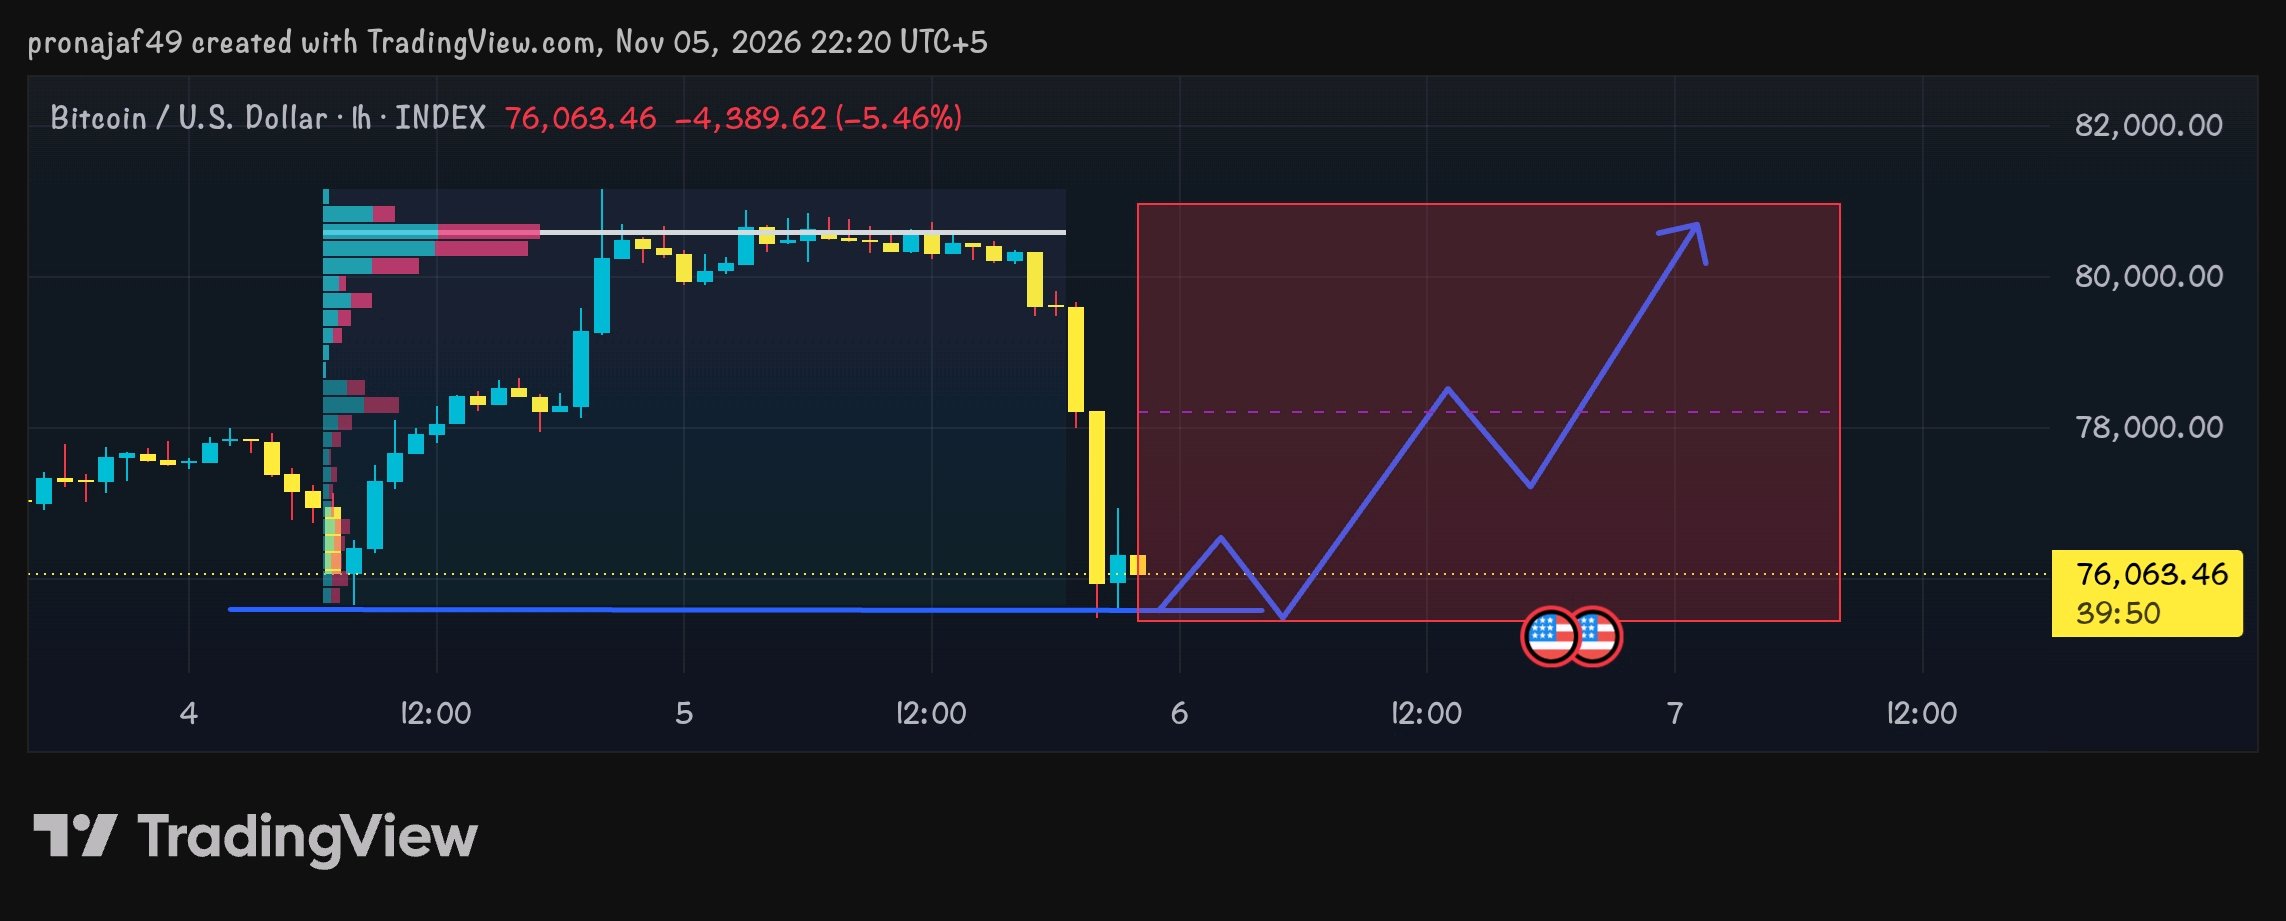
$BTC | Bitcoin is at a critical point. The next move needs confirmation, not speculation. Bitcoin is facing renewed selling pressure around $76,000 after losing a key support zone. Buyers now need to demonstrate strength to prevent further downside. Here's what traders should watch: • $74,900–$75,000: Key support zone to defend. • $73,300: Next potential downside target if selling pressure increases. • $76,600: Immediate resistance and first recovery level. • $78,000: Major reclaim level that could strengthen bullish momentum. The current market structure remains weak, with buyers yet to establish convincing control. My take: A sustained reclaim of $76,600, supported by strong spot volume, could improve Bitcoin's short-term outlook. Until then, patience, risk management and capital preservation should remain priorities. In this market, confirmation matters more than prediction. #Bitcoin #BTC #Bybit #CryptoTrading #MarketAnalysis #BlockchainSecurity #WSOTPicktoEarn10U

ETHEREUM LATEST MARKET UPDATE
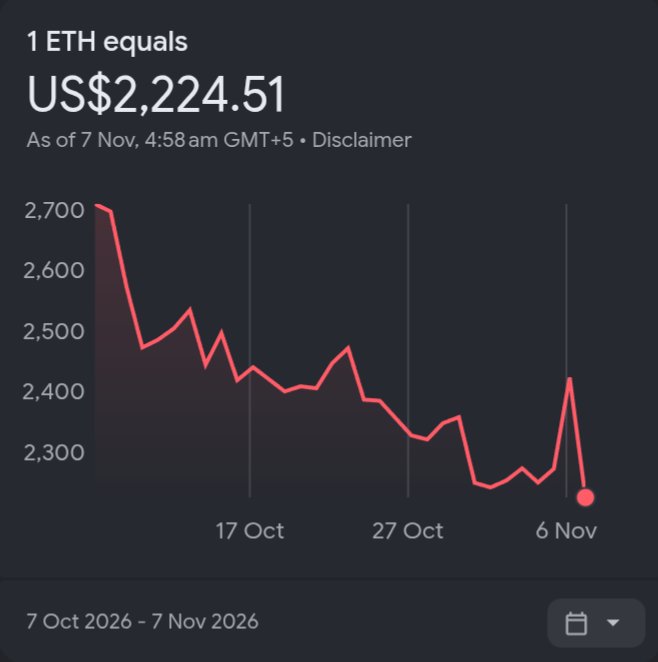
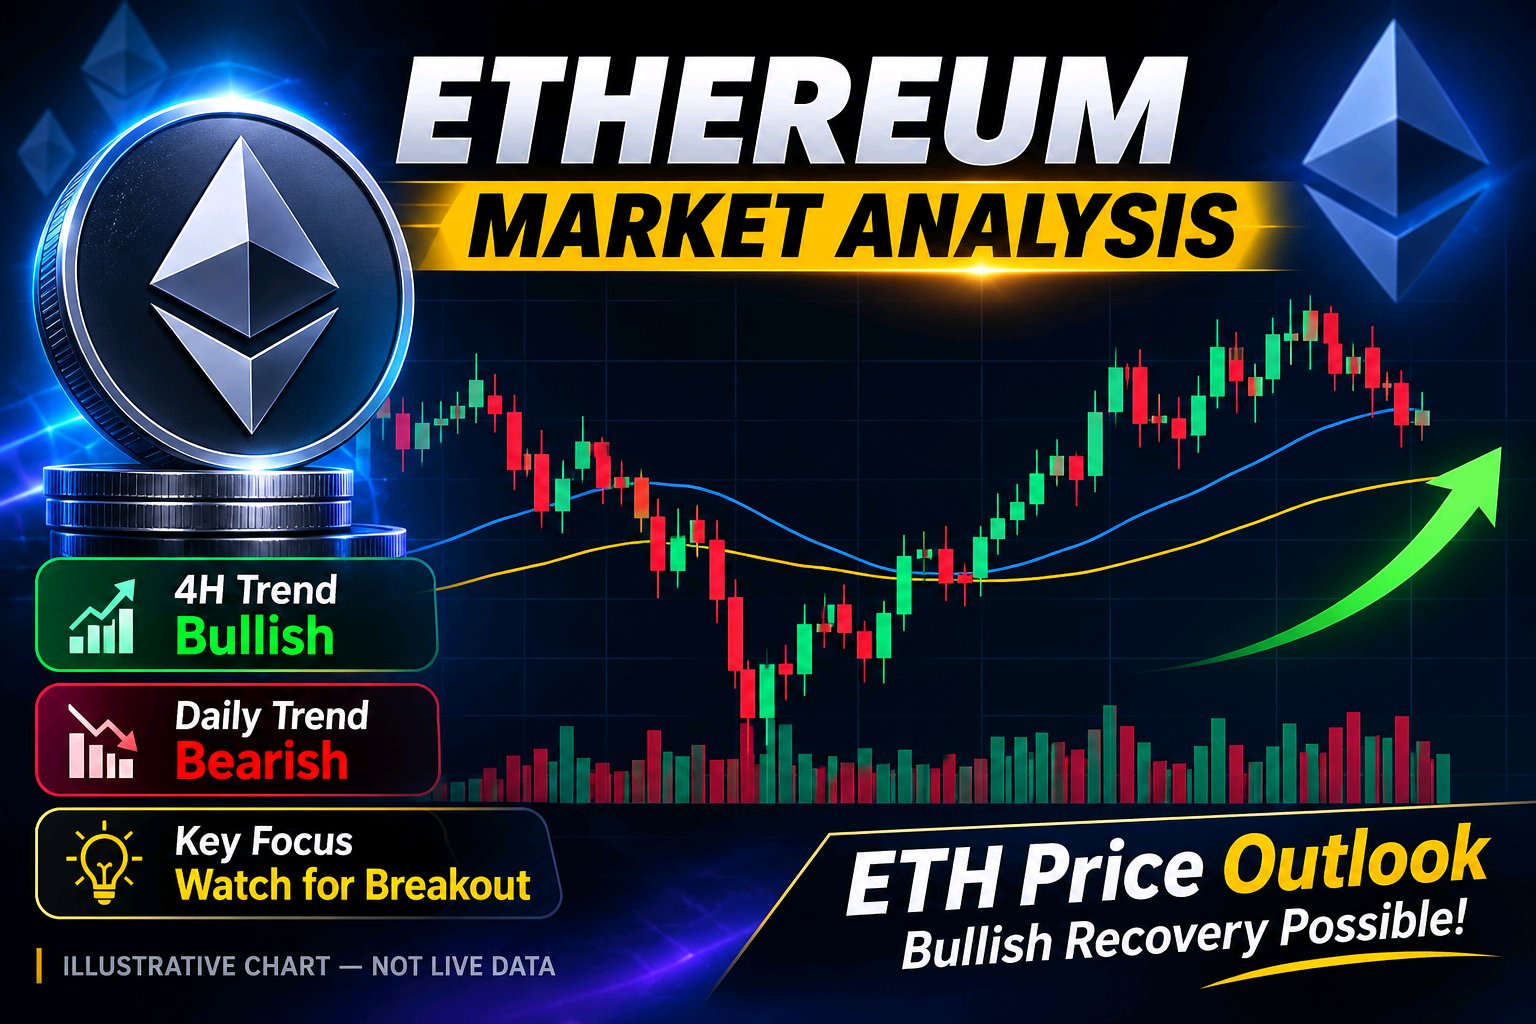
$ETHUSDT ETHEREUM MARKET ANALYSIS | 6 NOVEMBER 2026 💰 ETH Price: $2,236 📉 24H Change: -7.78% 📊 Technical Overview Ethereum is showing signs of a short-term recovery on the 4H chart, while the daily trend remains bearish. Traders should watch key support and resistance levels before entering the market. 🟢 SUPPORT LEVELS - $2,227 - $2,217 - $2,206 🔴 RESISTANCE LEVELS - $2,279 – $2,289 - $2,321 – $2,330 - $2,390 – $2,400 📈 BULLISH SCENARIO If ETH breaks above $2,289 with strong volume, the next targets could be $2,321, $2,330 and $2,400. 📉 BEARISH SCENARIO If ETH loses the $2,217 support level, further downside towards $2,206 could be possible. 🎯 TRADING STRATEGY - Entry: Wait for breakout confirmation. - Stop Loss: Below confirmed support. - Targets: $2,289 / $2,330 / $2,400. 🔥 FINAL VERDICT Ethereum is attempting a short-term recovery, but the overall daily trend remains bearish. A confirmed breakout above resistance is needed before expecting a stronger bullish move. ⚠️ Trade carefully and always manage your risk. #WSOT2026 #USPayrollsAndRateDecisionsDriveMacroWeek #BybitAIEvolving #BlockchainSecurity #OilVolatilityTracksIranPeaceTalks $DOGEUSDT #Ethereum #ETH #ETHUSDT #CryptoAnalysis #BinanceSquare #CryptoTrading #TechnicalAnalysis

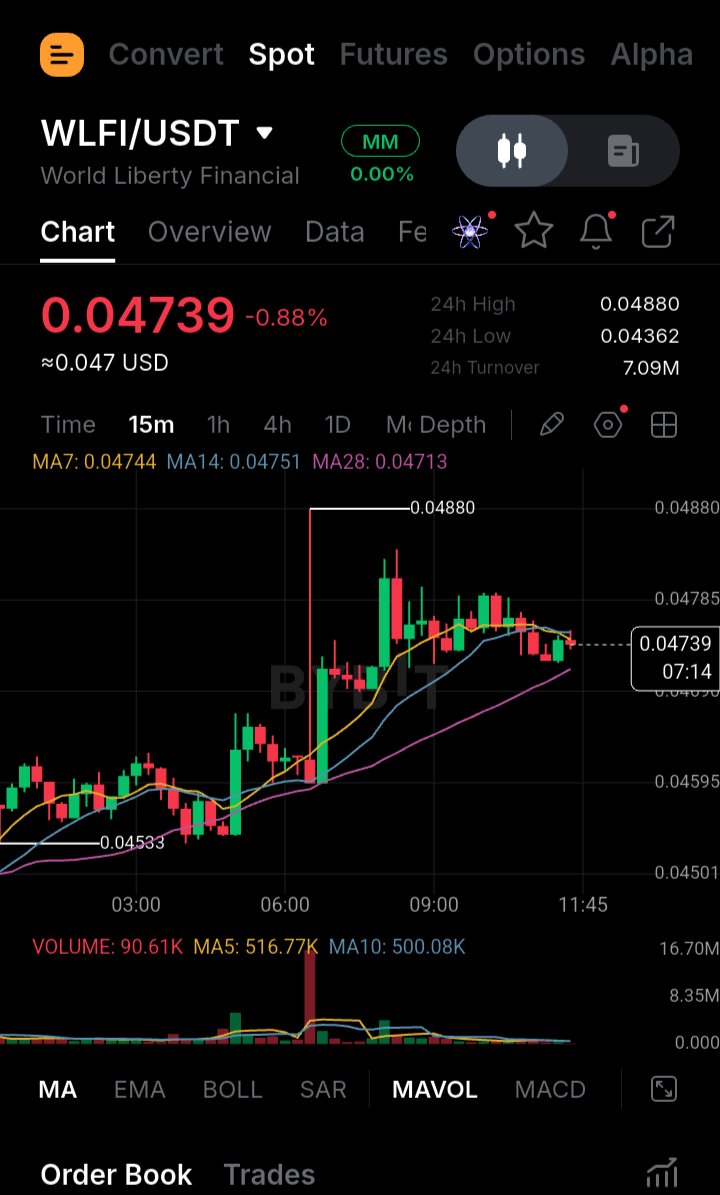
$WLFI Shows Signs of Recovery After a Healthy Pullback WLFI experienced a controlled retracement while maintaining its overall market structure. Buyers are gradually returning, suggesting that bullish momentum may be rebuilding. The key factor now is whether price can maintain support and attract sustained buying pressure. A strong move above nearby resistance could strengthen the recovery, while losing support may lead to another downside test. Key figures $0.0472–$0.0473 — Important short-term price zone $0.0465 — Critical support to monitor #BybitAIEvolving #BlockchainSecurity $WLFIUSDT


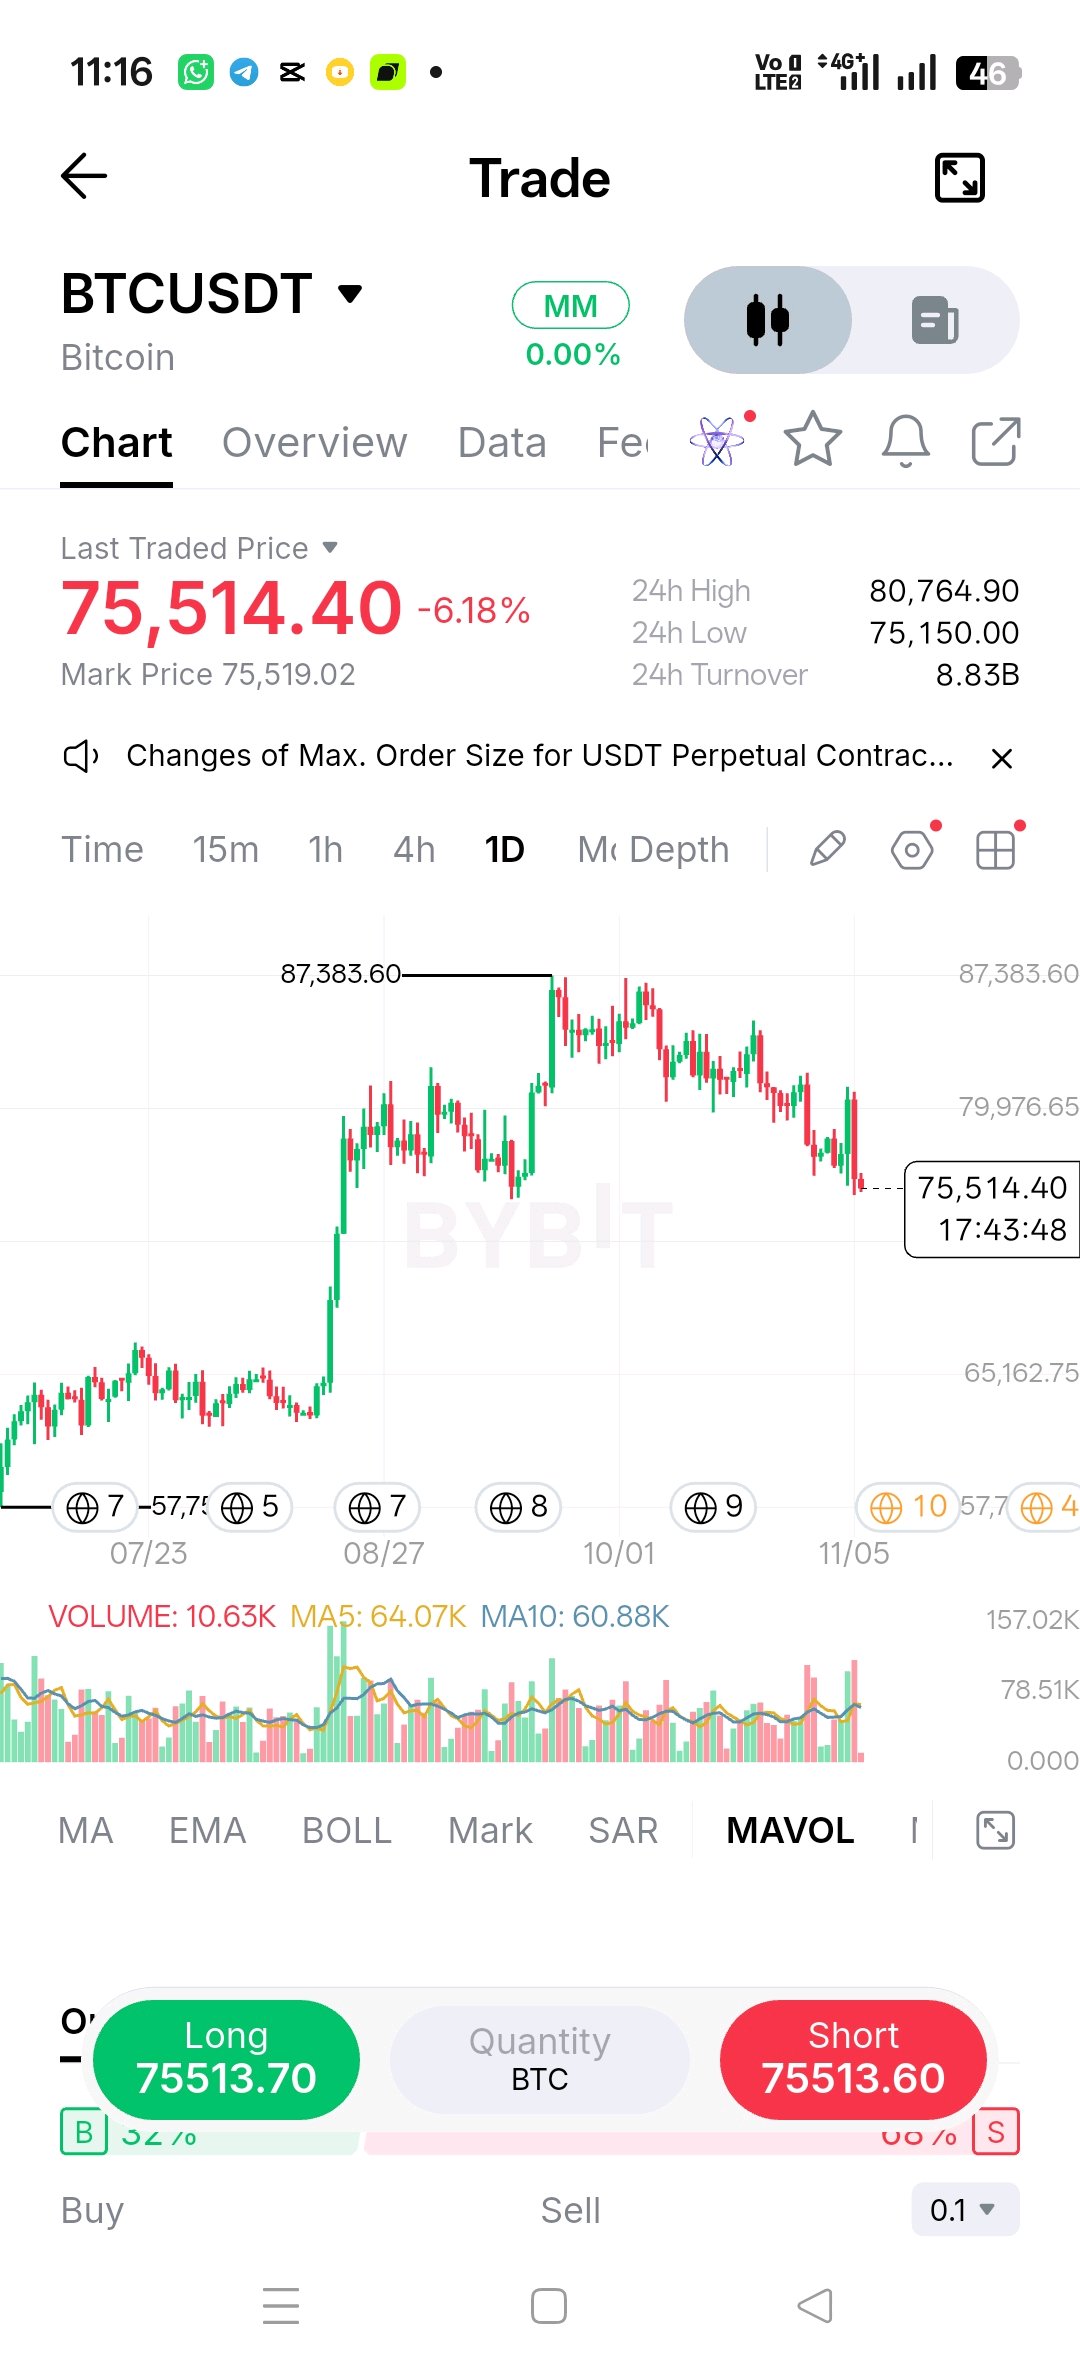
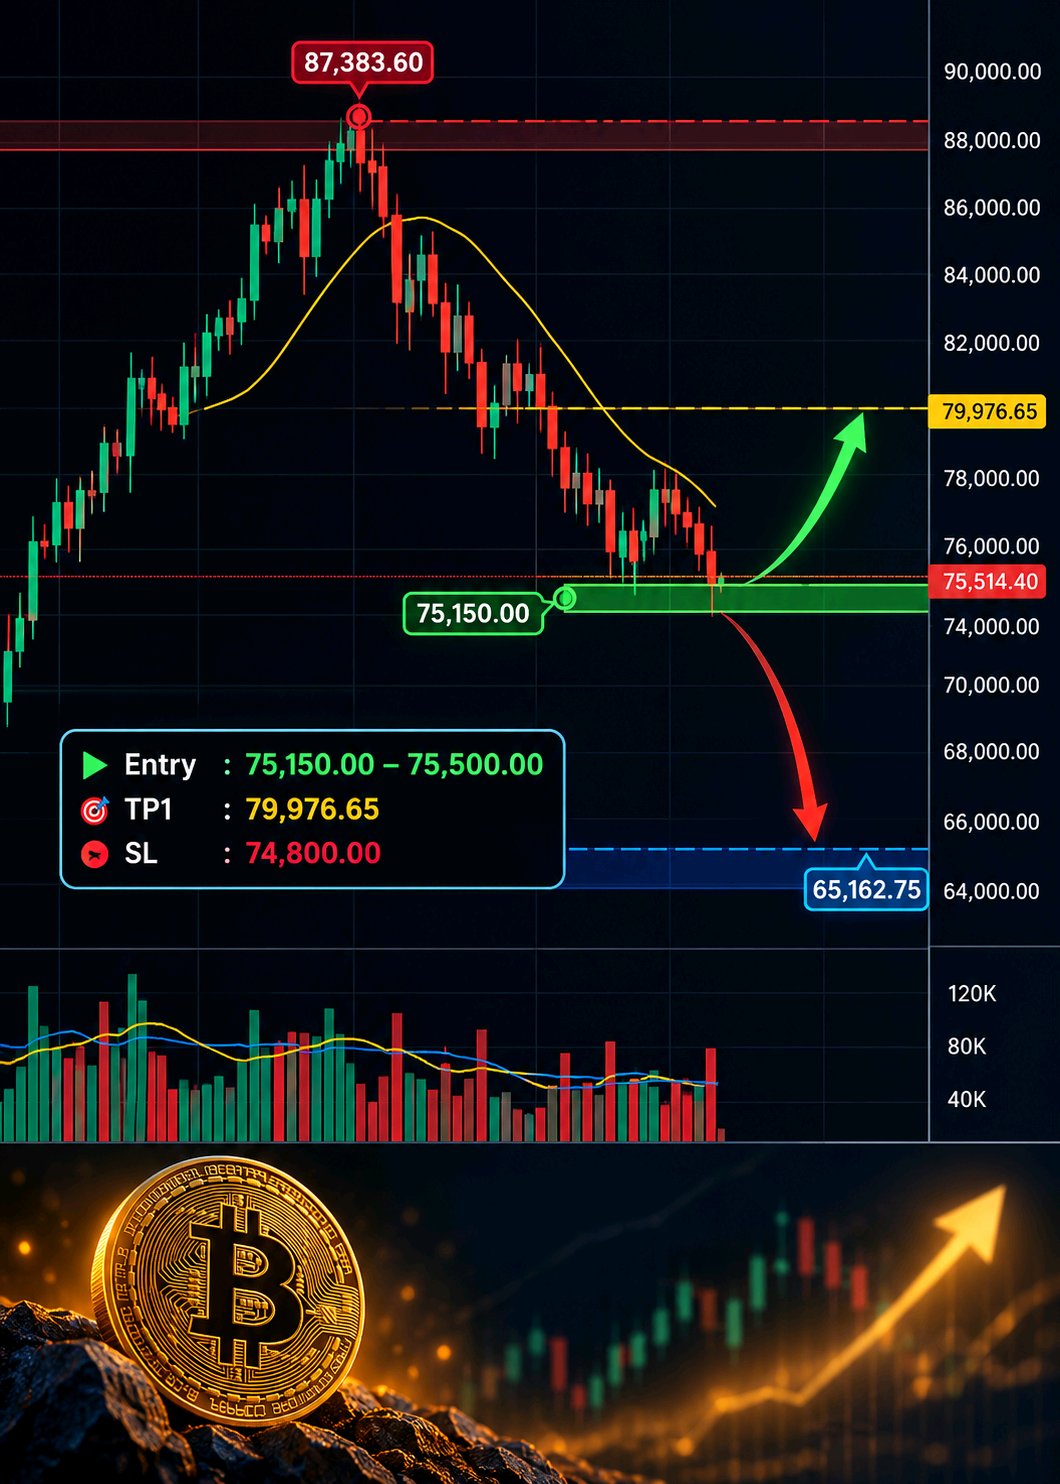
BTC Pullback: 75K Support in Focus
$BTCUSDT The daily chart for BTCUSDT shows a notable shift in momentum, with the price currently trading at 75,514.40, down -6.18% over the last 24 hours. The price is currently sitting near the lower end of the recent daily range, testing immediate support. 📊 Market Structure: Looking at the visible daily timeframe, the market structure previously established a strong upward trend, printing a clear local peak at 87,383.60. Since that high, the structure has shifted into a corrective phase, characterized by a series of lower highs and lower lows. · Immediate Support: The current area is critical, with the 24h low sitting at 75,150.00 acting as immediate visible support. · Resistance: The nearest visible intermediate resistance is around the 79,976.65 level, while the major structure resistance remains the peak at 87,383.60. · Volume: The visible MAVOL indicator shows current volume (10.63K) is significantly lower than the moving averages (MA5 at 64.07K, MA10 at 60.88K), suggesting a pause or exhaustion in the current downward movement for this specific candle. · Deeper Support: If the current level fails, the next visible historical consolidation support zone on the chart is located around the 65,162.75 area. 🎯 Potential Setup: Based purely on the current price testing a visible support level (24h low), here is a potential reactive scenario: · Entry: 75,150.00 - 75,500.00 zone (current price area). · TP1: 79,976.65 (visible intermediate resistance). · TP2: Not clearly defined on this timeframe without a confirmed change in market structure; focus on taking partials at TP1. · SL / Invalidation: 74,800.00 (A decisive daily close below the 24h low of 75,150.00). ⚠️ Confirmation: For this scenario to gain validity, we would want to see the current daily candle close above the 75,514.40 level, ideally with a long lower wick, indicating buyers are stepping in. Furthermore, a bullish bounce should be accompanied by an increase in trading volume to confirm the support. ❌ Invalidation: This setup is invalidated if the price breaks down and closes decisively below the 75,150.00 (24h low) mark. A sustained break below this level would confirm the continuation of the downward structure, potentially opening the door for a deeper retracement toward the 65K zone. 🧠 Risk Note: We are currently in a short-term downward structure. Counter-trend longs at support levels carry higher risk. Always use strict stop-losses to protect your capital, manage your position sizing appropriately, and do not over-leverage. #IMPACTbyTrade $XAUTUSDT #BlockchainSecurity #Oracle20BFundingPlanTestsTheAITrade
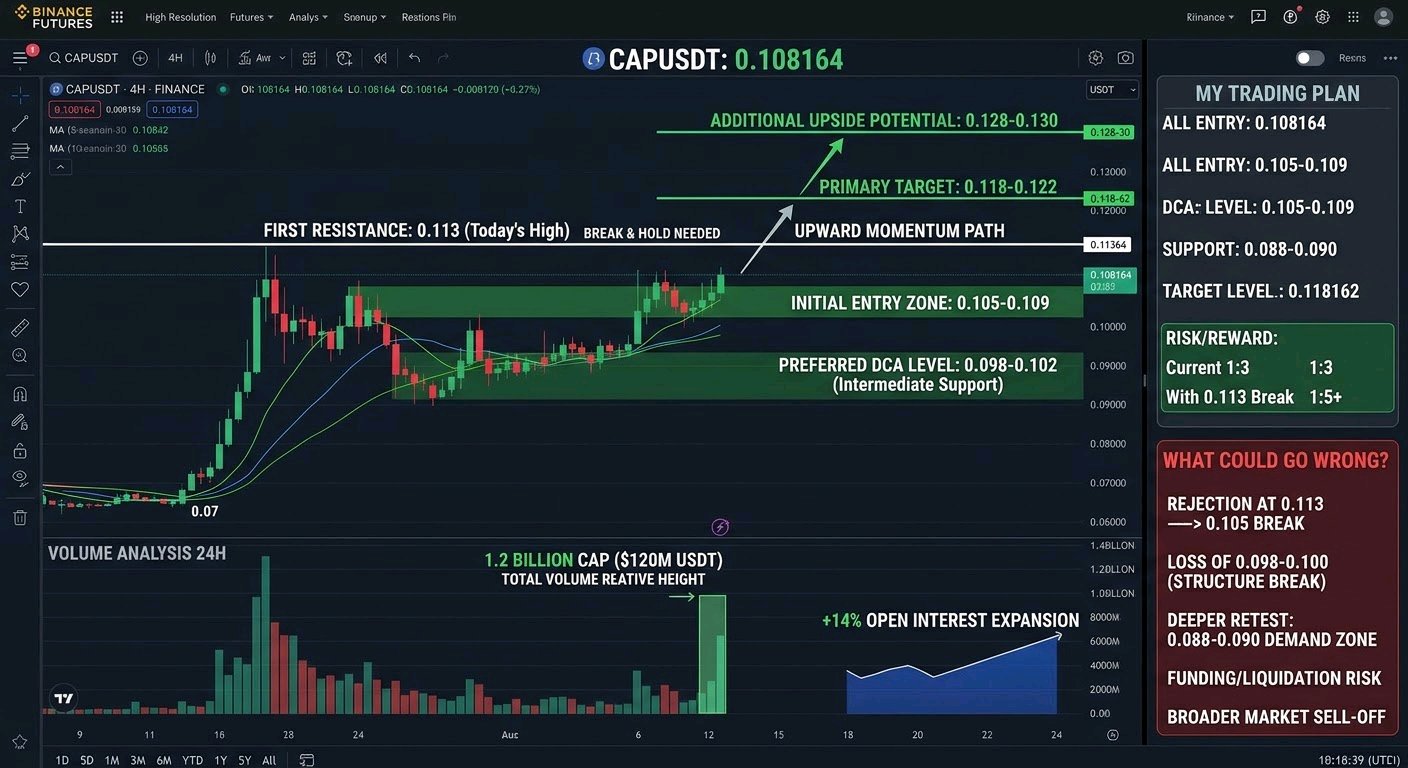
$CAPUSDT USDT - VOLUME STAYS ELEVATED AND PRICE IS HOLDING NEAR THE HIGHS, I’M WATCHING FOR A CLEAN BREAK ABOVE 0.113 CAP continues to show relative strength against the broader market. While majors have been choppy, this one has pushed higher over the past 24 hours and is currently trading near 0.108–0.109 after tagging a high of 0.11291. The daily structure improved after the strong recovery from the 0.07 region earlier in the week, and price is sitting comfortably above the short-term moving averages. The key question now is whether buyers can force a sustained move through the recent high. Volume Analysis 24-hour volume remains solid at roughly 1.2 billion CAP and over $120 million in USDT notional on Binance futures. Open interest has expanded in the process, and funding has stayed positive. This level of participation supports the recent advance rather than painting it as a thin, low-conviction move. As long as volume holds up on any push higher, the odds of continuation improve. My Trading Plan I’m approaching this from a momentum-and-structure perspective with clear levels. Initial entry zone: 0.105–0.109 (current area or shallow dips that hold the higher-low structure) Preferred DCA level: 0.097–0.102 (near the zone that marked the recent acceleration and intermediate support) First resistance: 0.112–0.113 (today’s high — a decisive break and hold here would open the next leg) Primary target: 0.118–0.122 (prior swing high region) Additional upside potential: 0.128–0.130 if momentum and volume expand after the breakout Confirmation for me would be a clean close above 0.113 accompanied by steady volume, followed by a successful retest that turns the level into support. What Could Go Wrong? After a multi-day run, a rejection at 0.112–0.113 is always possible. A drop back below 0.105 would weaken the short-term bullish structure and increase the chance of a deeper pullback. Losing the 0.097–0.100 area would put the recent higher lows at risk and likely send price toward the 0.088–0.090 demand zone. Elevated funding and rising open interest also mean any downside move can accelerate through liquidations. A broader market sell-off would add further pressure regardless of CAP’s relative strength . My Perspective CAP is interesting right now because the volume and open-interest growth have accompanied the price advance, and the market structure has shifted higher after the sharp recovery. The current action near the recent highs matters because a successful break could open room toward the previous swing highs, while a failure would simply reset the short-term picture. Continuation still looks more likely than an immediate deep correction as long as 0.105 holds and participation remains healthy, but I am treating any extension with defined risk. I’m watching the reaction at 0.113 closely and will adjust if the structure breaks. Overall the setup remains constructive while staying realistic about the risk of a healthy pullback. #ByXIMPACT #BlockchainSecurity #WSOT2026
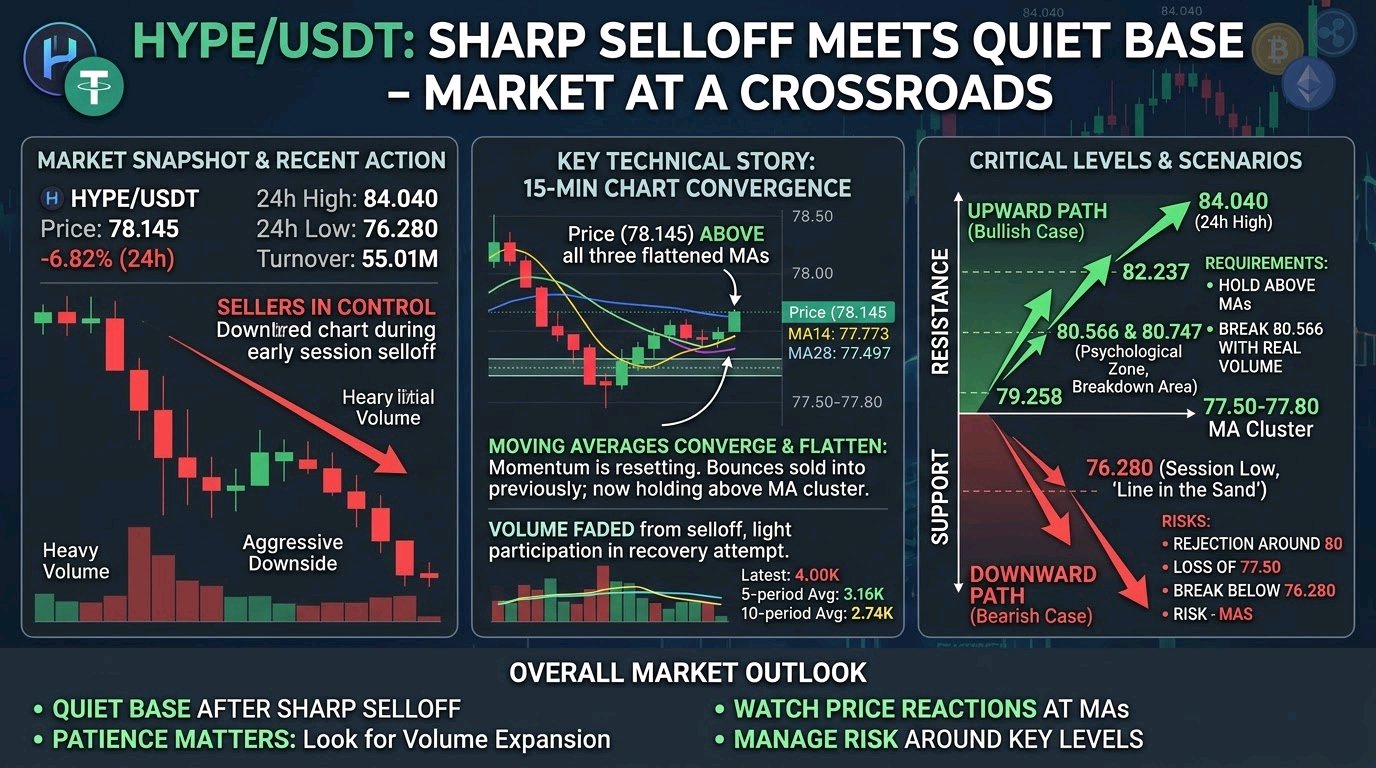
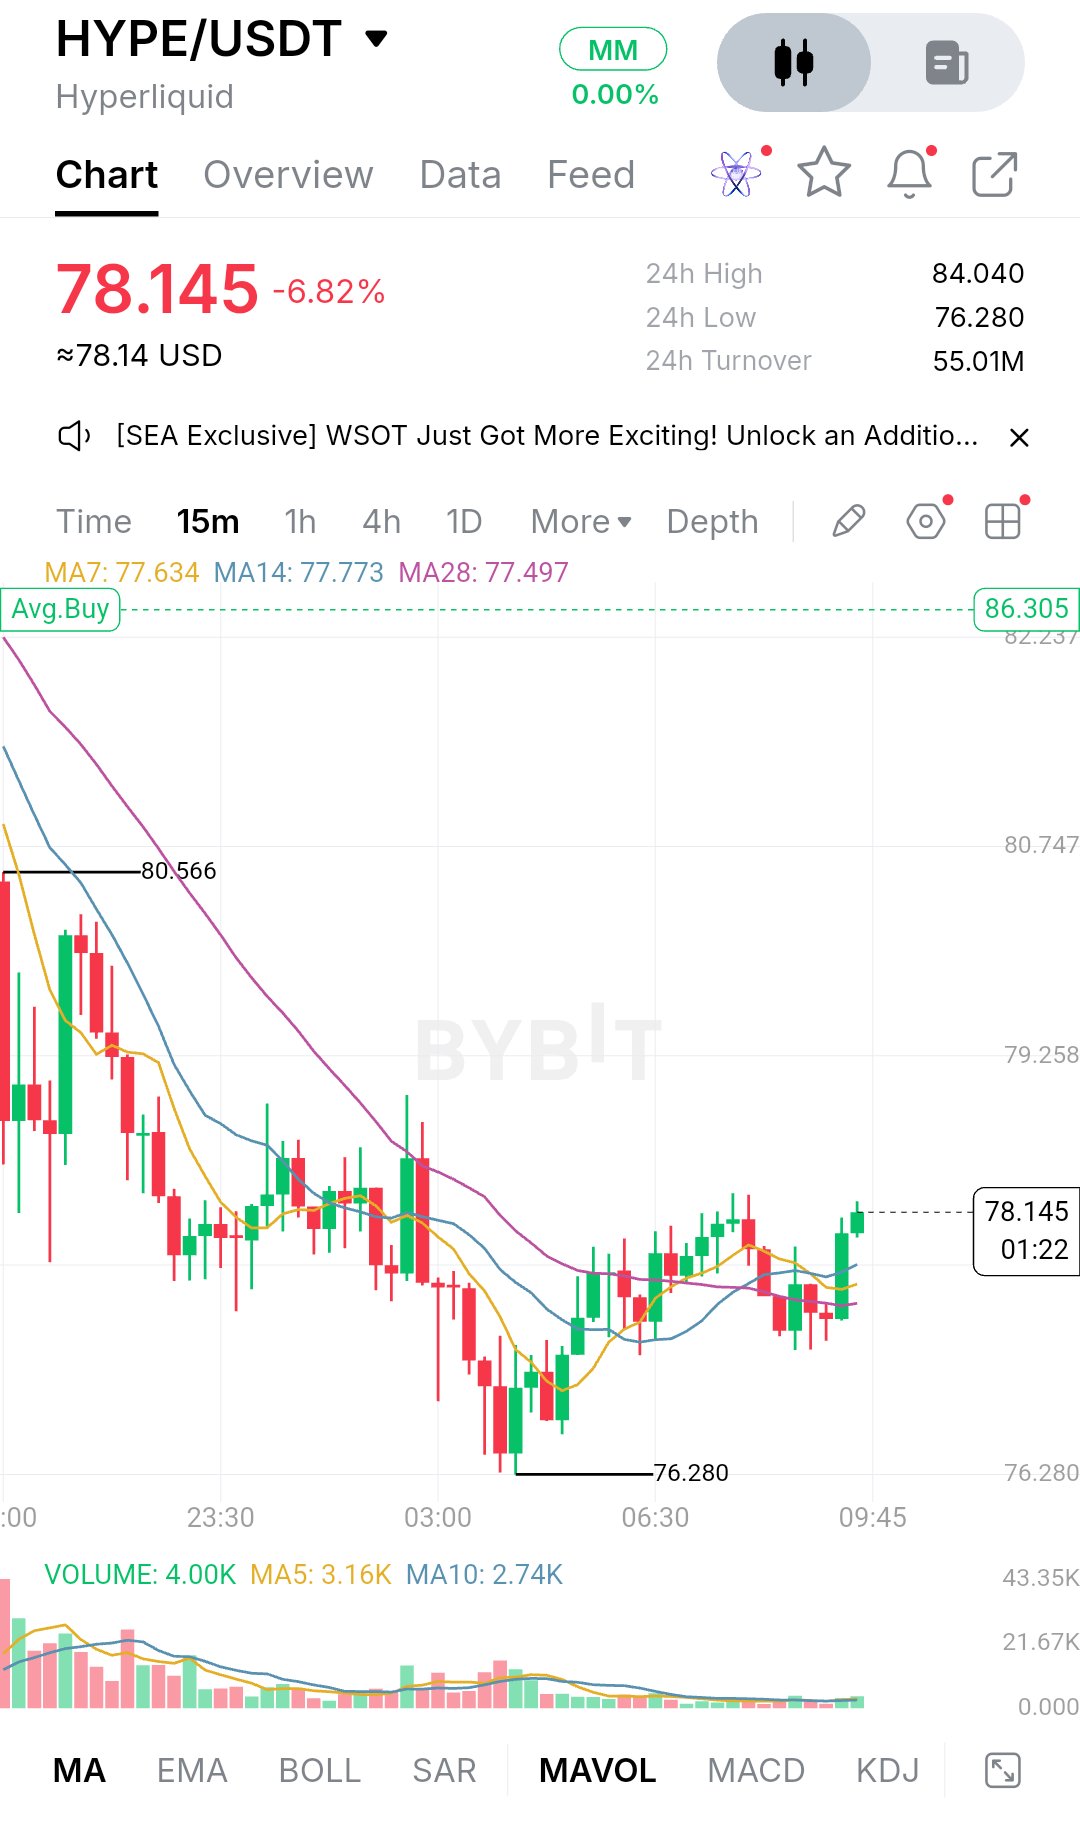
$HYPEUSDT 78,145 деңгейінде саудалануда, соңғы 24 сағатта 6,82%-ға төмендеді және бұл қозғалыс айқын жағдайдан хабар береді. Тәуліктік максимум 84,040 деңгейінде болды, содан кейін сатушылар бақылауды қолға алып, бағаны 76,280 деңгейіндегі ең төменгі нүктеге дейін біртіндеп түсірді. Сауда басында қарқынды жүрді: үлкен қызыл шамдар және сессиядағы ең үлкен сауда көлемі тіркелді, әрбір көтерілу әрекеті сату қысымына ұшырады. Айналым 55,01 млн шамасында, демек, бұл жай ғана ағым емес, нақты қозғалыс болды. Сол төменгі деңгейден кейін график сипаты өзгерді. Баға 76,280 шамасында түбін тауып, қайта көтерілді және соңғы бірнеше сағат бойы бүйірлік немесе сәл жоғары бағытта қозғалуда. Шамдар бірі-бірінің үстіне түсіп жатыр, бұрынғыдай агрессивті төмендеу байқалмайды. Бұл трендтің өзгеруінен гөрі, негіз қалау немесе қалпына келудің алғашқы әрекетіне ұқсайды. Сатушылардың екпіні бәсеңдеді, бірақ сатып алушылар әлі толық бақылауды алған жоқ. 15 минуттық графикте жылжымалы орташа мәндер (MA) негізгі рөл атқарады. MA7 – 77,634, MA14 – 77,773 және MA28 – 77,497 деңгейлерінде тұр, барлығы қазіргі бағаның астында шоғырланған. Баға олардан әлдеқайда жоғары болып, төмен қарай еңкейген ұзақ құлдыраудан кейін, олар қазір тегістеліп, бір нүктеге жинақталды. Бұл әдетте нарықтың серпінін қалпына келтіру кезеңінде болады. Баға үшеуінен де жоғары көтерілді және соңғы жасыл шамдар олардың үстінде тұрақтылық танытуда, бұл жақсарудың шағын, бірақ нақты белгісі. Сауда көлеміне қатысты сақ болған жөн. Сату толқынынан кейін көлем айтарлықтай азайды: соңғы көрсеткіш 4,00K, ал 5 кезеңдік орташа көрсеткіш 3,16K және 10 кезеңдік орташа көрсеткіш 2,74K деңгейінде. Аздап өсу бар, бірақ сессияның басымен салыстырғанда бұл әлі де өте тыныш. Қалпына келу әзірге төмен белсенділікпен жүріп жатыр, яғни ол толық расталмаған. Қолдау деңгейі бойынша, алғашқы аймақ – 77,50 мен 77,80 аралығы, мұнда үш жылжымалы орташа көрсеткіш шоғырланған. Егер баға кері қайтып, осы жерде ұсталса, бұл сатып алушылардың жаңа негізді қорғап жатқанын көрсетеді. Одан төмендегі нақты шекара – 76,280, яғни сессияның ең төменгі нүктесі. Бұл деңгей бір рет тексеріліп, өзін сақтап қалды, бұл сатушылардың күші таусылған жер. Одан төмен құлдырау бүкіл қалпына келу процесін күмәнға келтіреді және одан әрі төмендеуге жол ашуы мүмкін, өйткені бұл графикте төменде бағаны тежейтін құрылым жоқ. Жоғары жағындағы ең жақын қарсылық – 79,258, одан кейін 80,566. Бұл бұрынғы ауытқудың максимумы болды және баға шкаласындағы 80,747 деңгейімен сәйкес келеді. 80-81 аймағы – психологиялық дөңгелек сан және бұрынғы құлдырау аймағы болғандықтан, сатушылардың сол жерде пайда болатынын күтемін. Одан жоғары – 82,237 келесі маркер, ал егер серпін күшейсе, 84,040 тәуліктік максимумы үлкенірек мақсат болады. Өсу сценарийі қарапайым: сатып алушылар бағаны жылжымалы орташалар кластерінен жоғары ұстап, 79,258 деңгейін бұзып өтіп, нақты көлеммен 80,566 деңгейінен жоғары жабуы керек. Егер бұл орындалса, 82,237 деңгейіне қарай жылжу нақтыланады, ал күш сақталса, 84,040 деңгейін қайта сынау мүмкін болады. Бастысы – бағаның жай ғана көтерілуі емес, бұзып өту кезінде көлемнің ұлғаюы. Төмендеу сценарийі: баға 79,258 деңгейіне жетпей тұрып тоқтаса немесе 80 деңгейінен кері қайтарылса, содан кейін жылжымалы орташаларды қайта жоғалтса. Бұл жағдайда өсу тек құлдырау трендіндегі қысқа мерзімді жеңілдік болып қалады. 77,50 деңгейінен төмен түсу назарды қайтадан 76,280 деңгейіне аударады, ал одан төмен бұзылу сатушылардың әлі де бақылауда екенін растайды. Негізгі баға деңгейлері: - Қарсылық: 79,258, 80,566, 80,747, 82,237, 84,040 - Ағымдағы баға: 78,145 - Қолдау: 77,80-ден 77,50-ге дейін (MA кластері), 76,280 (сессияның төменгі нүктесі) Жалпы алғанда, HYPE күрт құлдыраудан кейін тыныш негізге көшті, дәл осы кезеңде шыдамдылық маңызды. Келесі нақты серпін 80,566 деңгейінен жоғары көлеммен бұзып өтуден немесе 76,280 деңгейінен төмен құлдыраудан келуі мүмкін. Осылардың бірі болмайынша, нарық бағытты таңдау процесінде. Сондықтан аралықтағы ұсақ шамдарды қуаламай, бағаның жылжымалы орташаларда қалай әрекет ететінін және көлемнің арта бастағанын бақылаған жөн. Бұл ештеңеге кепілдік бермейді, трейдерлер осы деңгейлер төңірегінде тәуекелді басқаруы керек. $BTCUSDT #Блокчейн қауіпсіздігі
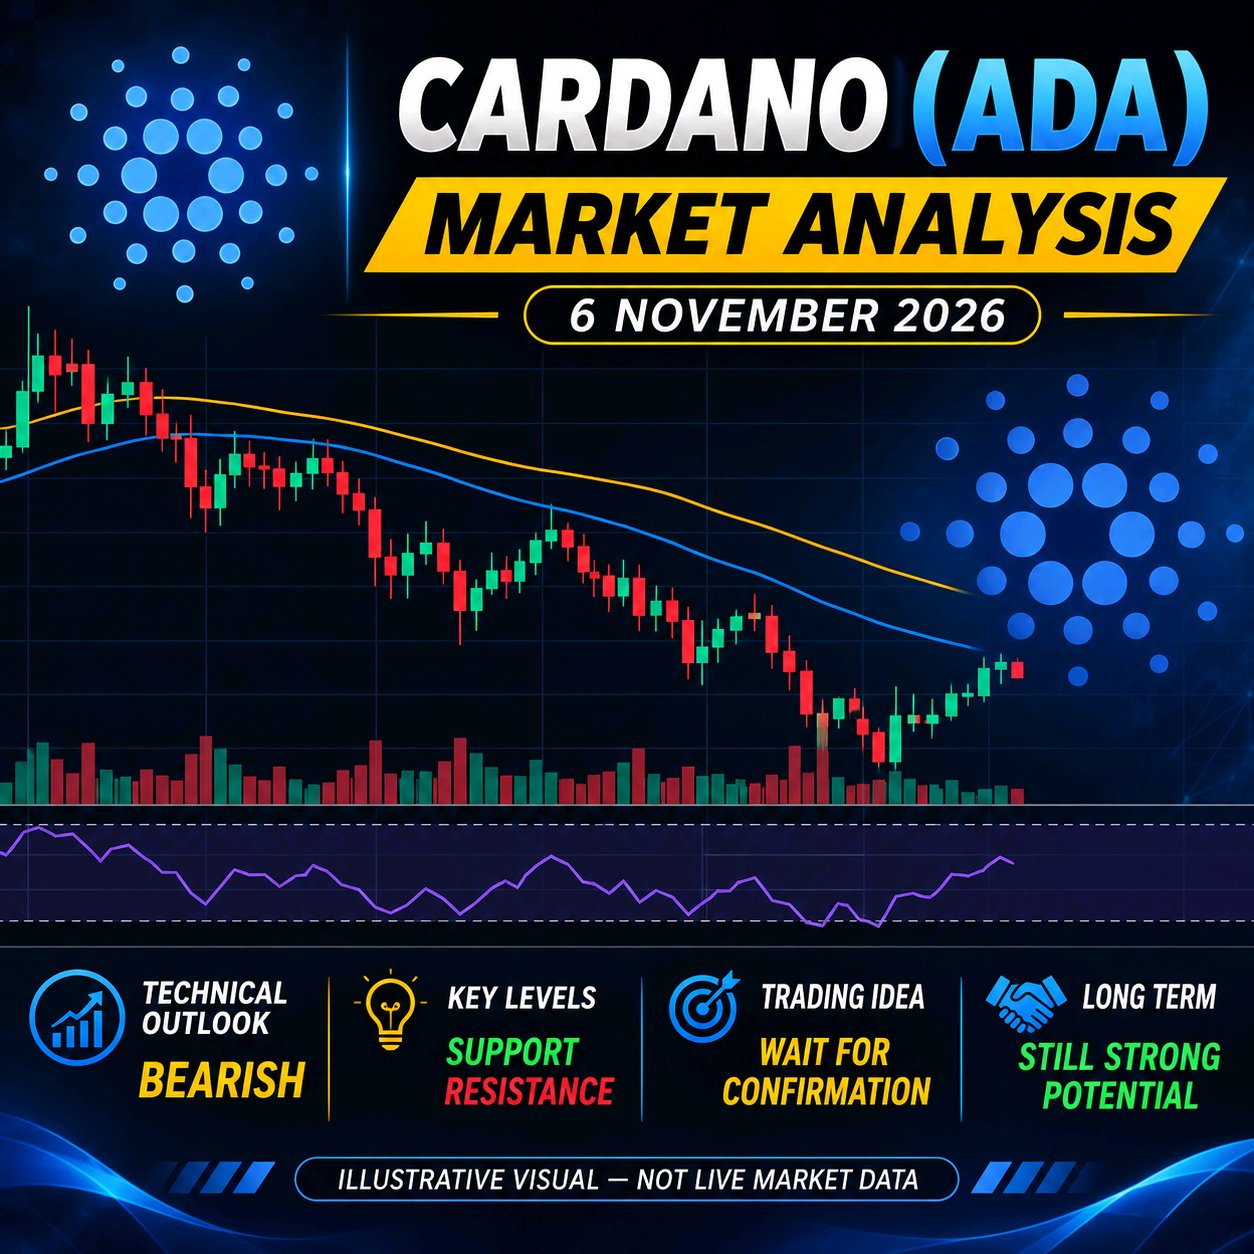
🚨 CARDANO (ADA) PRICE ANALYSIS
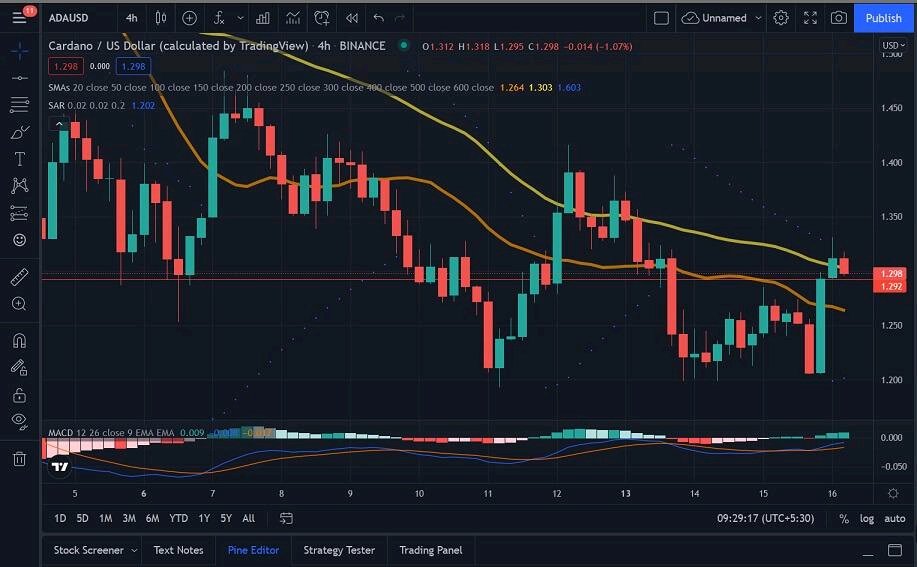
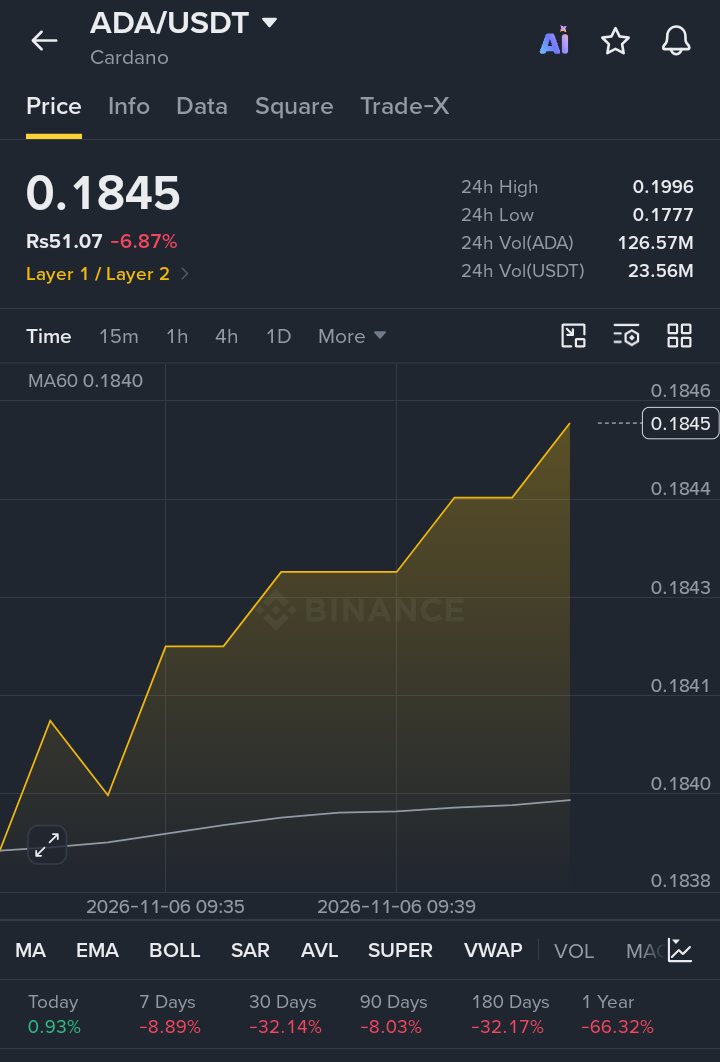
$ADAUSDT PRICE ANALYSIS — NOVEMBER 6, 2026 🔹 Current Price: Around $0.181–$0.185 🔹 Market Trend: Bearish 🔹 Daily RSI: Around 31–32 🔹 Market Momentum: Weak 🔹 Trading Sentiment: Sellers currently dominate. 📉 TECHNICAL ANALYSIS Cardano is facing strong selling pressure. ADA is trading below its major moving averages, indicating that the broader trend remains bearish. RSI is approaching oversold territory, which means a short-term recovery could happen, but buyers need to confirm their strength. 🔻 SUPPORT LEVELS • $0.1766 • $0.1738 • $0.1712 🚀 RESISTANCE LEVELS • $0.1885 • $0.1930 • $0.1957 📊 BULLISH SCENARIO If ADA reclaims $0.1885 with strong buying volume, the next potential targets are $0.1930 and $0.1957. 📉 BEARISH SCENARIO If ADA breaks below $0.1766, further downside towards $0.1738 and $0.1712 becomes possible. 🎯 TRADING STRATEGY Avoid rushing into long positions. Wait for a confirmed breakout, stronger volume and RSI recovery before considering a bullish entry. 🔥 FINAL VERDICT ADA remains bearish in the short term. However, oversold conditions could create a temporary relief bounce. Trade carefully and always manage your risk. #ADA #Cardano #CryptoAnalysis #BinanceSquare #Altcoins #CryptoTrading #BlockchainSecurity #MidtermsMarketWatch #USPayrollsAndRateDecisionsDriveMacroWeek #WSOTPicktoEarn10U #WSOT2026
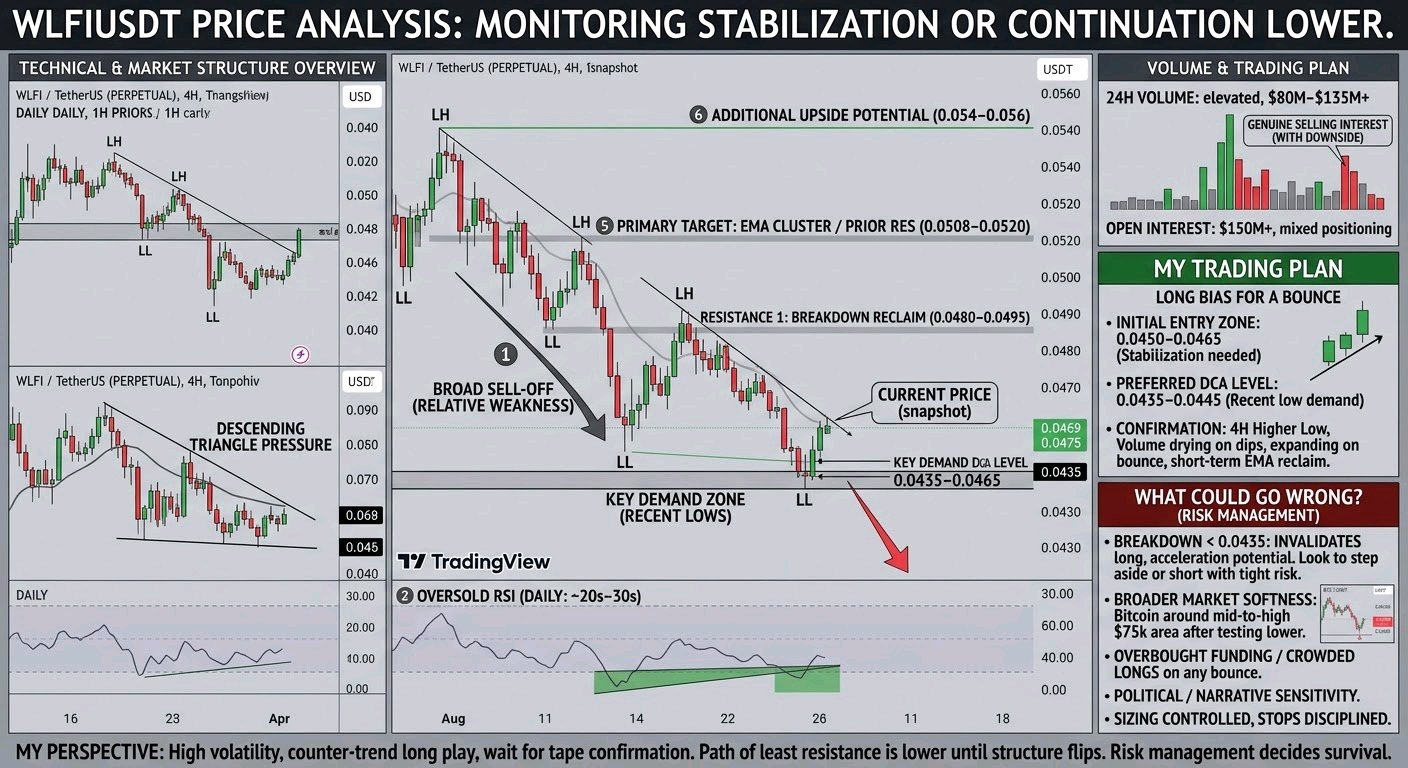
$WLFIUSDT USDT - БАҒА САТЫЛЫМДАН КЕЙІН ЖАҚЫНДАҒЫ ЕҢ ТӨМЕНГІ ДЕҢГЕЙЛЕРДЕ ТҰР, МЕН ТҰРАҚТАНУДЫ НЕМЕСЕ ОДАН ӘРІ ТӨМЕНДЕУДІ КҮТІП ТҰРМЫН.** WLFI анық қысымда қалуда. Биткоин соңғы сессияларда күрт төмендесе де (төменгі деңгейлерді сынап көргеннен кейін $75к шамасында саудаланып жатыр), WLFI салыстырмалы әлсіздік танытып, $0.0435–$0.046 аймағында жаңа бірнеше апталық немесе жақындағы ең төменгі көрсеткіштерін жаңартты және қазіргі сәтте нақты деректерге байланысты $0.0469–$0.0475 шамасында ауытқуда. Жоғары уақыт аралықтарында аю тренді сақталуда: күнделікті және 4 сағаттық трендтер төмен бағытталған, баға негізгі EMA көрсеткіштерінен төмен және күнделікті RSI асыра сатылған аумақта (дереккөздер бойынша 20-30-дар шамасында). Құрылым төменірек шыңдар мен төменірек түптерді көрсетеді, кейбір талдауларда күнделікті графикте төмендейтін үшбұрыш түріндегі қысым байқалады. Қысқа уақыт аралықтарында аралас әрекеттер мен кездейсоқ өсу әрекеттері бар, бірақ нарықтың жалпы құрылымы әзірше сатушылардың пайдасына. Соңғы 24 сағаттық диапазон $0.0488–$0.0508 жоғарғы және $0.0435–$0.0464 төменгі деңгейлерді көрді. **Көлемді талдау** 24 сағаттық сауда көлемі есептер бойынша $80М–$135М диапазонында жоғары деңгейде қалуда (кейде күрт өсулермен), бұл оны орта капитализациялы жұптар арасында белсенді етеді. Бұл нарықтық капитализацияға қатысты ($1.5 млрд шамасында) жақсы қатысу. Көлем төмендеу қозғалыстарымен бірге жүрді, бұл әдетте жалғастыруды қолдайды немесе жай ғана төмен қарай ақырындап сырғу емес, шынайы сату қызығушылығын көрсетеді. Фьючерстердегі жоғары ашық позициялар (көбінесе $150М+) және аралас ұзақ/қысқа позициялар белсенді сауданы толықтырады. Мұндай артқан қатысу көбінесе қозғалыстың мақсатты екенін білдіреді — бұл одан әрі төмендеуге немесе күрт кері қайтуға алып келе ме, мен мұны бақылап отырмын. **Менің сауда жоспарым** Мен мұны асыра сатылған жағдайлардан екі бағытта да тез қозғала алатын жоғары волатильді актив ретінде қарастырамын, сондықтан көлемді бақылауда ұстап, деңгейлерді таза сақтаймын. - **Бастапқы кіру аймағы (өсу үшін ұзақ позиция):** Егер ол 1 сағаттық/4 сағаттық графикте жоғарырақ түптермен тұрақтанса, қазіргі деңгейлерге немесе $0.0450–$0.0465 аймағына төмендеуін күтемін. - **Қалаулы DCA деңгейі:** $0.0435–$0.0445 аймағына тереңірек (жақындағы төменгі деңгей / сұраныс аймағы). Осы жерде бекітілу және қайта көтерілу трендке қарсы ұзақ позицияның тәуекел/пайда қатынасын жақсартар еді. - **Бірінші қарсылық:** $0.0480–$0.0495. Бұл бұрынғы құлдыраулар мен қысқа мерзімді ұсыныс орналасқан жер. Таза үзіліс және одан жоғары бекітілу күштің алғашқы нақты белгісі болар еді. - **Негізгі мақсат:** $0.0508–$0.0520 аймағы (бұрынғы қарсылық / EMA кластері). - **Қосымша өсу әлеуеті:** Егер импульс күшейсе, $0.054–$0.056 аймағы қызықты болады, бірақ бұл алдымен құрылымның анық өзгеруін талап етеді. Ұзақ позицияны растау үшін 4 сағаттық графикте жоғарырақ түптің қалыптасуы, төмендеген кезде көлемнің азаюы және өскен кезде көбеюі, сондай-ақ қысқа мерзімді EMA көрсеткіштерінің қайта бағындырылуы қажет. Мен позицияға мәжбүрлеп кірмеймін — баға әрекеті сатып алушылардың сенімді түрде қосылып жатқанын көрсеткенше күтемін. **Не дұрыс болмауы мүмкін?** Кең нарық әлсіз және WLFI артта қалып келеді. $0.0435 шамасындағы соңғы төменгі деңгейден төмен көлемнің ұлғаюымен бұзылу тереңірек қолдауға жол ашып, төмендеу трендін күшейтуі мүмкін. Ондай жағдайда кез келген ұзақ позицияға арналған сценарий жарамсыз болады, және мен шетке шығамын немесе тек қатаң тәуекелмен қысқа позицияны қарастырамын. Тереңірек сұраныс бар, бірақ құрылымсыз сауда жасау — тез ұтылудың жолы. Асыра сатылған қаржыландыру немесе кез келген өсудегі толып кеткен ұзақ позициялар да тез кері қайтуы мүмкін. Бұл токенге қатысты саяси немесе жаңалықтық сезімталдық қозғалыстарды екі бағытта да күшейте алады, сондықтан мен стоптар бойынша тәртіпті сақтаймын. **Менің көзқарасым** WLFI қазір қызықты, өйткені ол көлем белсенді болып тұрғанда асыра сатылған аймаққа қатты сатылды. Бұл комбинация жиі не күрт жеңілдететін өсуді, не ірі ойыншылар келесі бағытты шешкенге дейінгі соңғы құлдырауды тудырады. Жоғары уақыт аралығындағы құрылым әлі де аю бағытында, сондықтан кез келген ұзақ позиция — трендтің бұзылуы мен қарсылықтың қайта бағындырылғанын көрмейінше, трендке қарсы сауда. Мен реакцияны байқау үшін $0.0435–$0.0465 сұраныс аймағын және қабылдау немесе бас тартуды көру үшін $0.048–$0.050 қарсылық аймағын мұқият бақылап отырмын. Жалпы күту: осы төменгі деңгейлерге жақын жерде көбірек волатильділік болуы ықтимал. Егер сатып алушылар қорғаса, тұрақтану және $0.050+-ке қарай қайта оралу мүмкін, бірақ құрылым өзгермейінше ең аз қарсылық жолы төмен қарай бағытталған. Мен сабырлымын, көлемді шағын ұстаймын және позицияға кірер алдында нарықтың растауын күтемін. Бұл — тәуекелді басқару кімнің келесі қозғалыстан аман қалатынын шешетін жағдай. #IMPACTbyTrade #Блокчейн қауіпсіздігі #WSOT2026
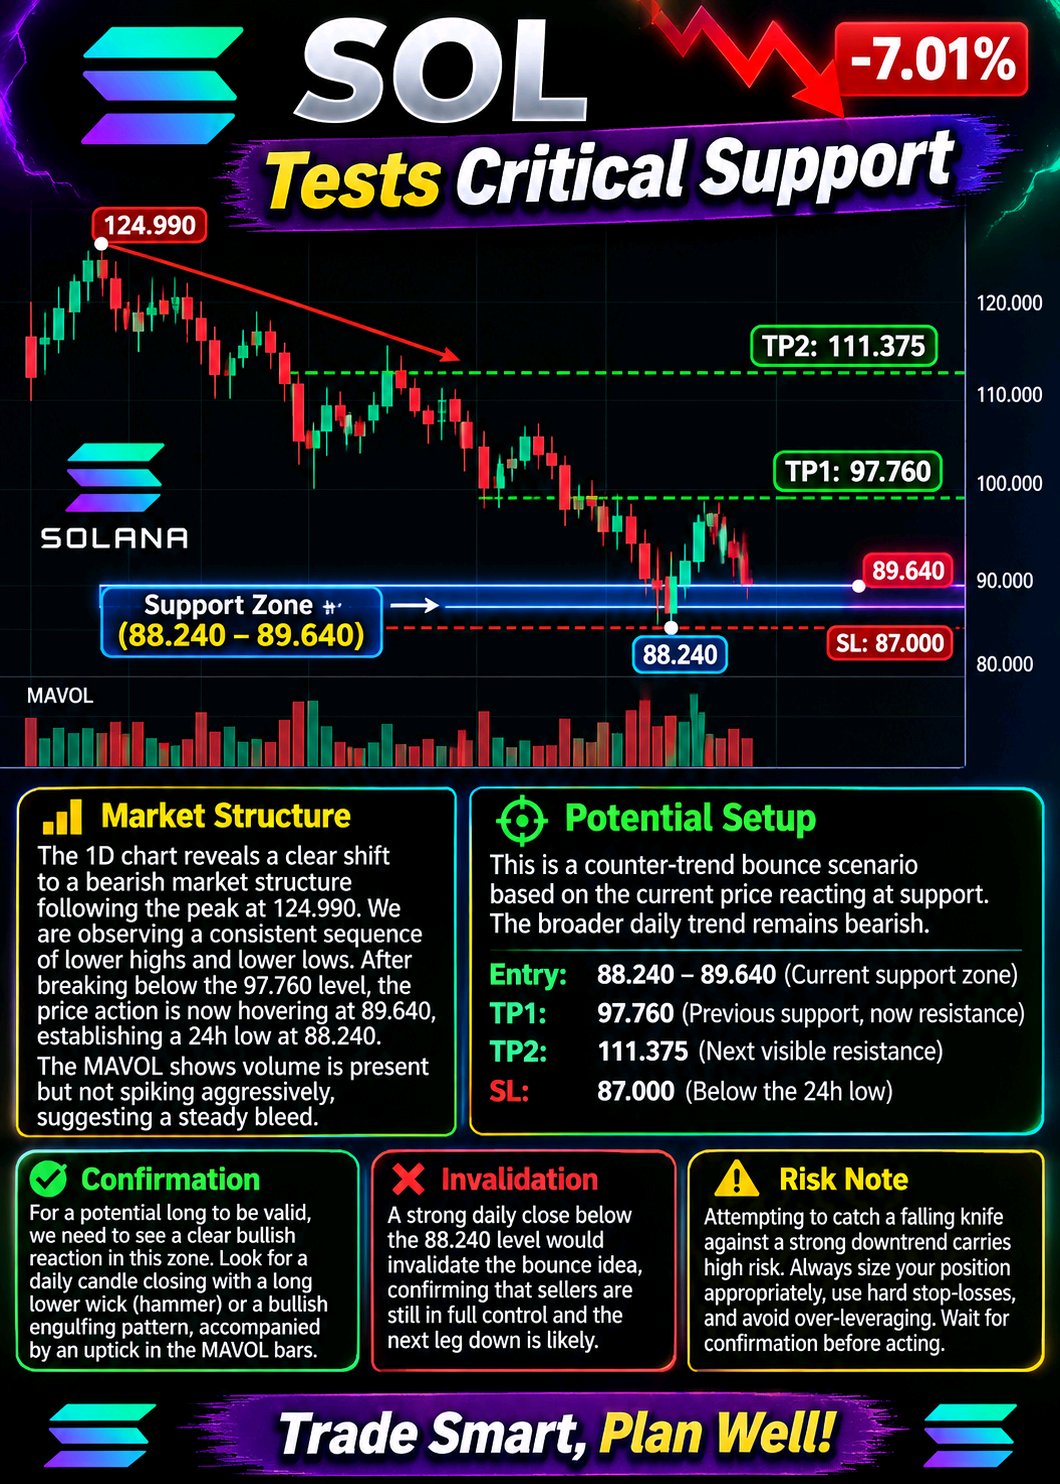
🔥 SOL Tests Critical Support
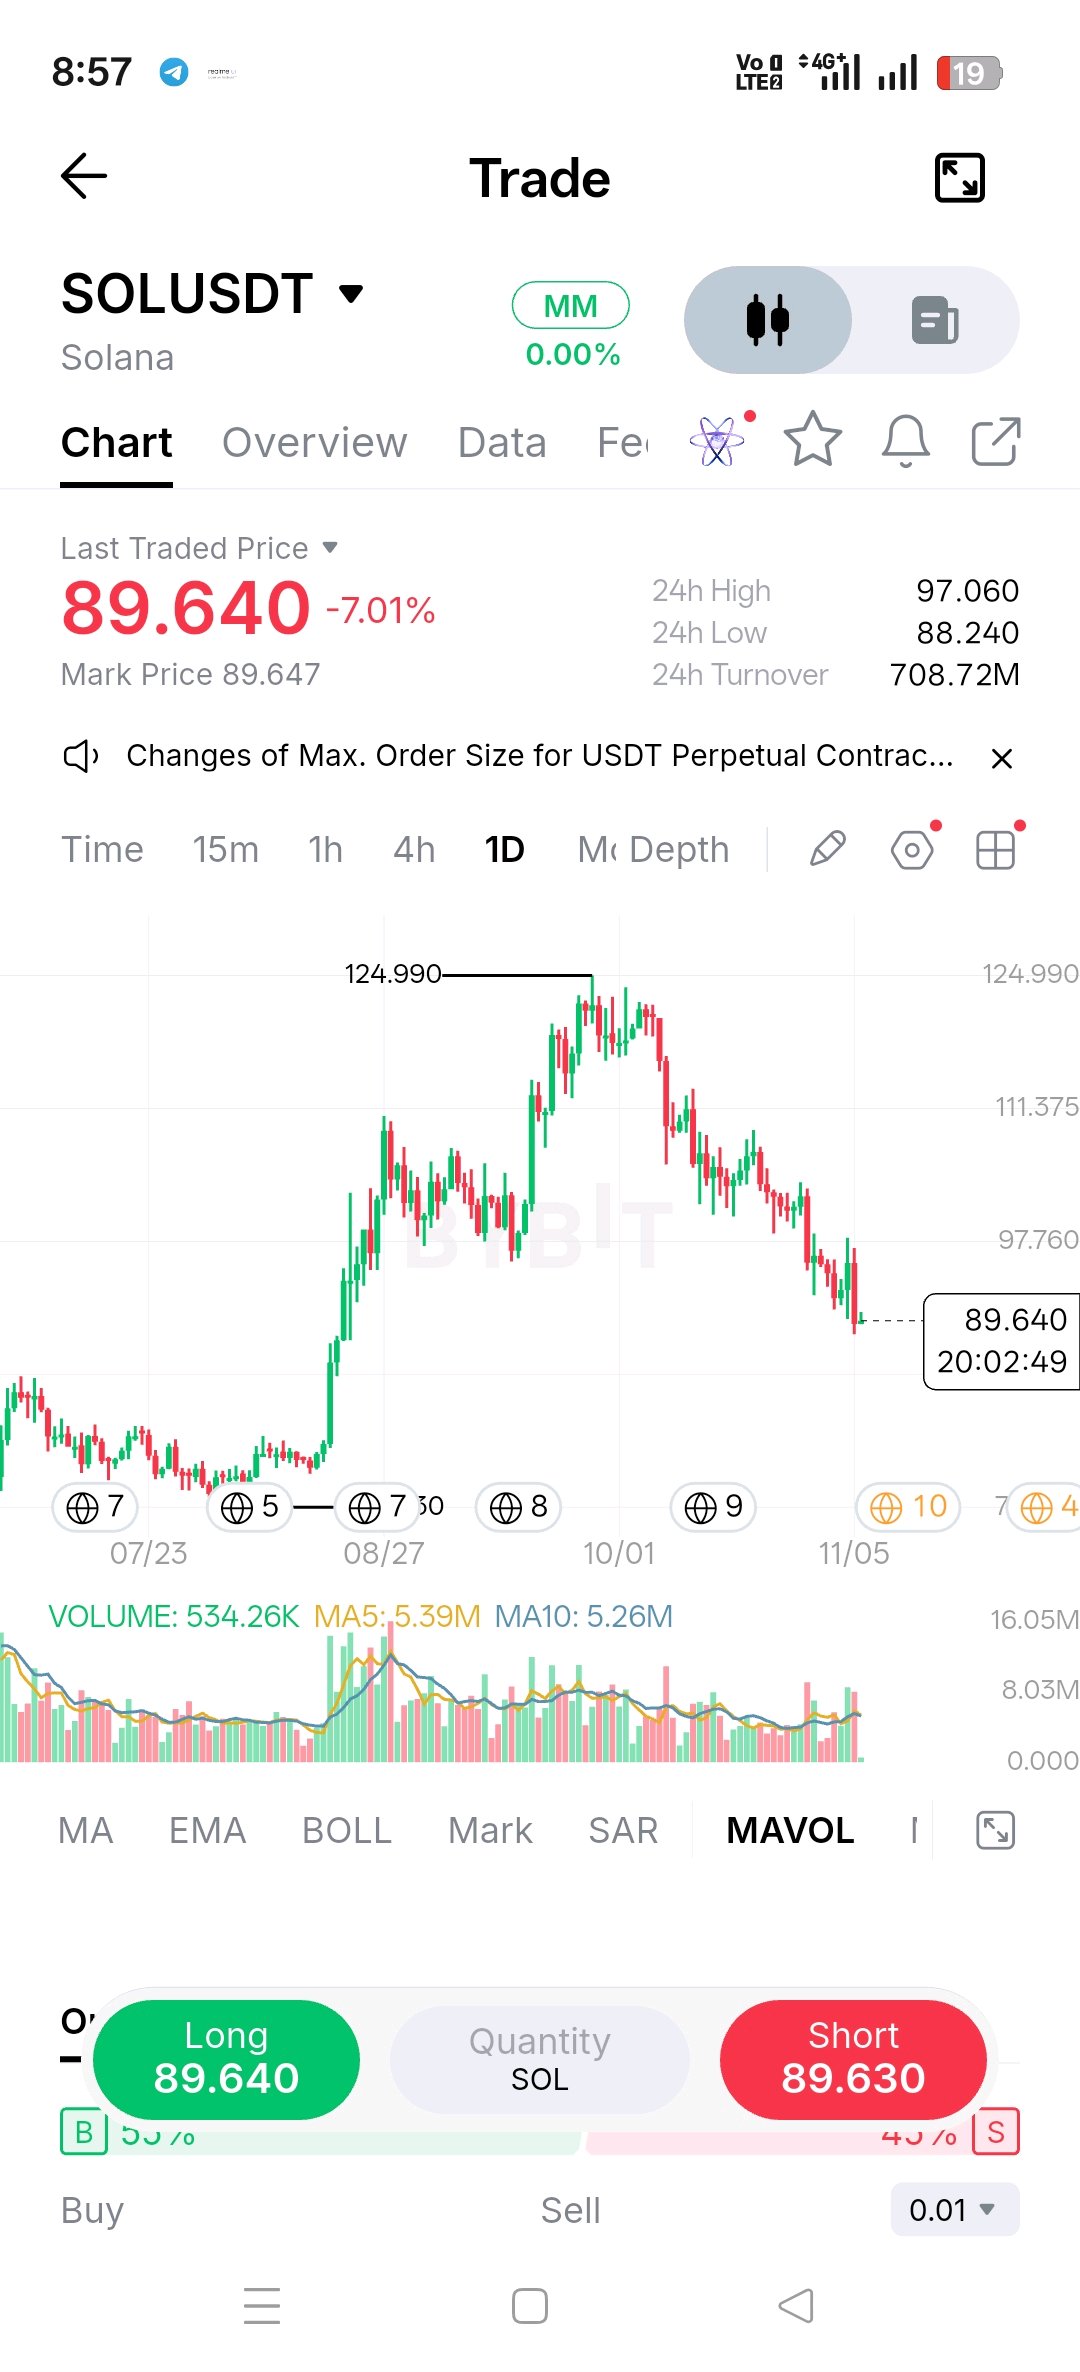
Solana is currently experiencing heavy selling pressure, printing a notable red daily candle with a -7.01% change. Price has retraced significantly from its recent highs and is now testing a critical lower boundary. 📊 Market Structure: The 1D chart reveals a clear shift to a bearish market structure following the peak at 124.990. We are observing a consistent sequence of lower highs and lower lows. After breaking below the 97.760 level, the price action is now hovering at 89.640, establishing a 24h low at 88.240. The MAVOL indicator shows volume is present but not spiking aggressively, suggesting a steady bleed rather than a capitulation event. The current zone aligns with consolidation levels seen back in early August. 🎯 Potential Setup: This is a counter-trend bounce scenario based on the current price reacting to support. The broader daily trend remains bearish. Entry: 88.240 - 89.640 (Current support zone) TP1: 97.760 (Previous support, now potential resistance) TP2: 111.375 (Next visible structural resistance) SL / Invalidation: 87.000 (Below the current 24h low to allow for slight volatility) ⚠️ Confirmation: For a potential long to be valid, we need to see a clear bullish reaction in this zone. Look for a daily candle closing with a long lower wick (hammer) or a bullish engulfing pattern, accompanied by an uptick in the MAVOL bars. ❌ Invalidation: A strong daily close below the 88.240 level would invalidate the bounce idea, confirming that sellers are still in full control and the next leg down is likely. 🧠 Risk Note: Attempting to catch a falling knife against a strong downtrend carries high risk. Always size your position appropriately, use hard stop-losses, and avoid over-leveraging. Wait for confirmation before acting. #ByXIMPACT $BTCUSDT #BlockchainSecurity #WSOTPicktoEarn10U
₿ BITCOIN (BTC) LATEST MARKET ANALYSIS
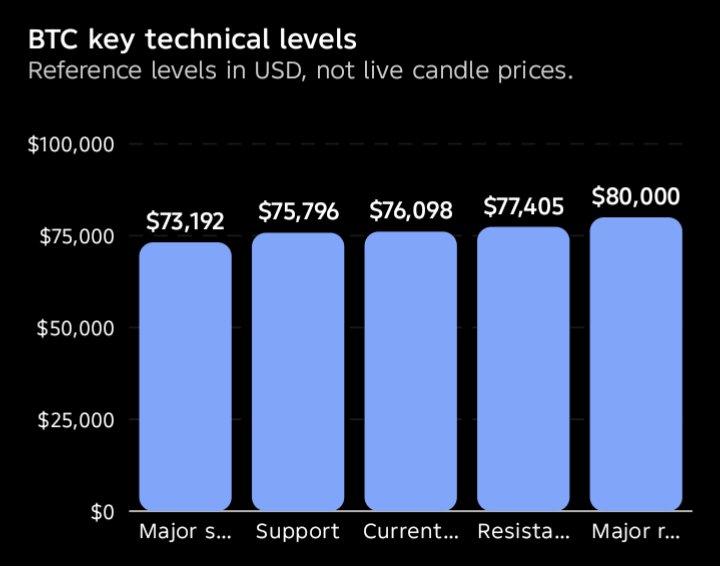
$BTCUSDT latest update 📅 November 6, 2026 💰 Current Price: Approximately $76,098 📊 MARKET OVERVIEW Bitcoin is showing short-term bearish pressure after struggling to maintain its recent recovery. Buyers are attempting to defend the $75,796 support zone, while sellers remain active around $77,405. 🔍 KEY TECHNICAL LEVELS 🟢 Support 1: $75,796 🟢 Major Support: $73,192 🔴 Resistance 1: $77,405 🔴 Major Resistance: $80,000 📉 TECHNICAL INDICATORS • RSI (14): Around 39 • Short-term momentum: Bearish • Market structure: Weak • Buying pressure: Needs confirmation 🚀 BULLISH SCENARIO If BTC breaks above $77,405 and confirms the breakout with strong volume, the next potential target is $80,000. 🐻 BEARISH SCENARIO If Bitcoin loses $75,796, selling pressure could increase, potentially pushing BTC towards $73,192. 🎯 MY MARKET OUTLOOK Bitcoin is currently in a critical zone. Traders should watch the $75,796 support and $77,405 resistance carefully before entering any position. ⚠️ Always use proper risk management. Avoid emotional trading and excessive leverage. #BlockchainSecurity #BybitAIEvolving #Oracle20BFundingPlanTestsTheAITrade #USPayrollsAndRateDecisionsDriveMacroWeek #Bitcoin #BTC #CryptoAnalysis #Binance #CryptoTrading #BTCUSDT
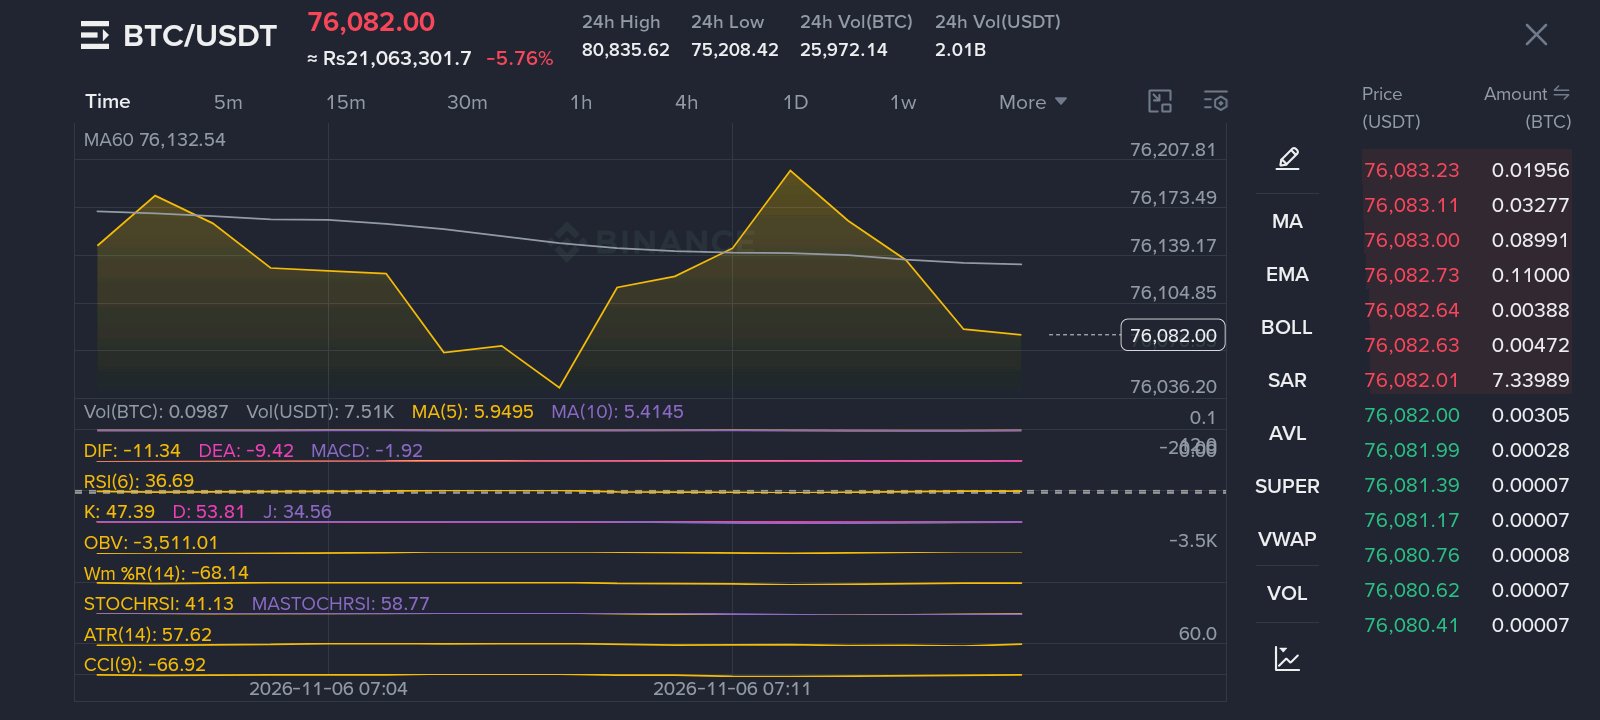
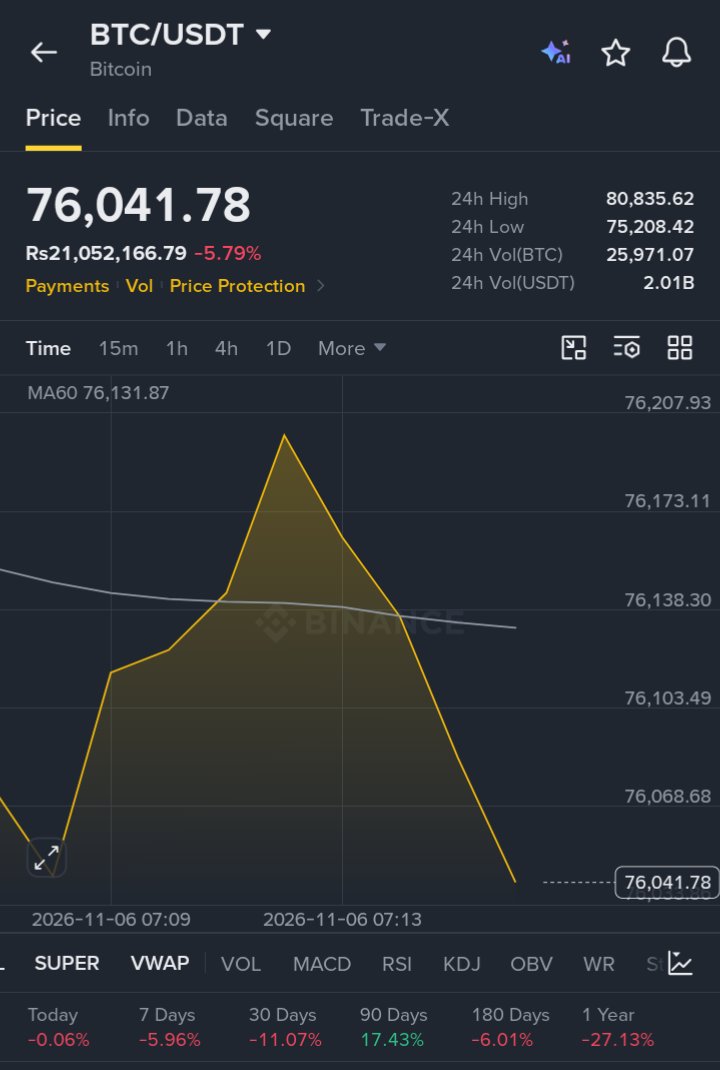

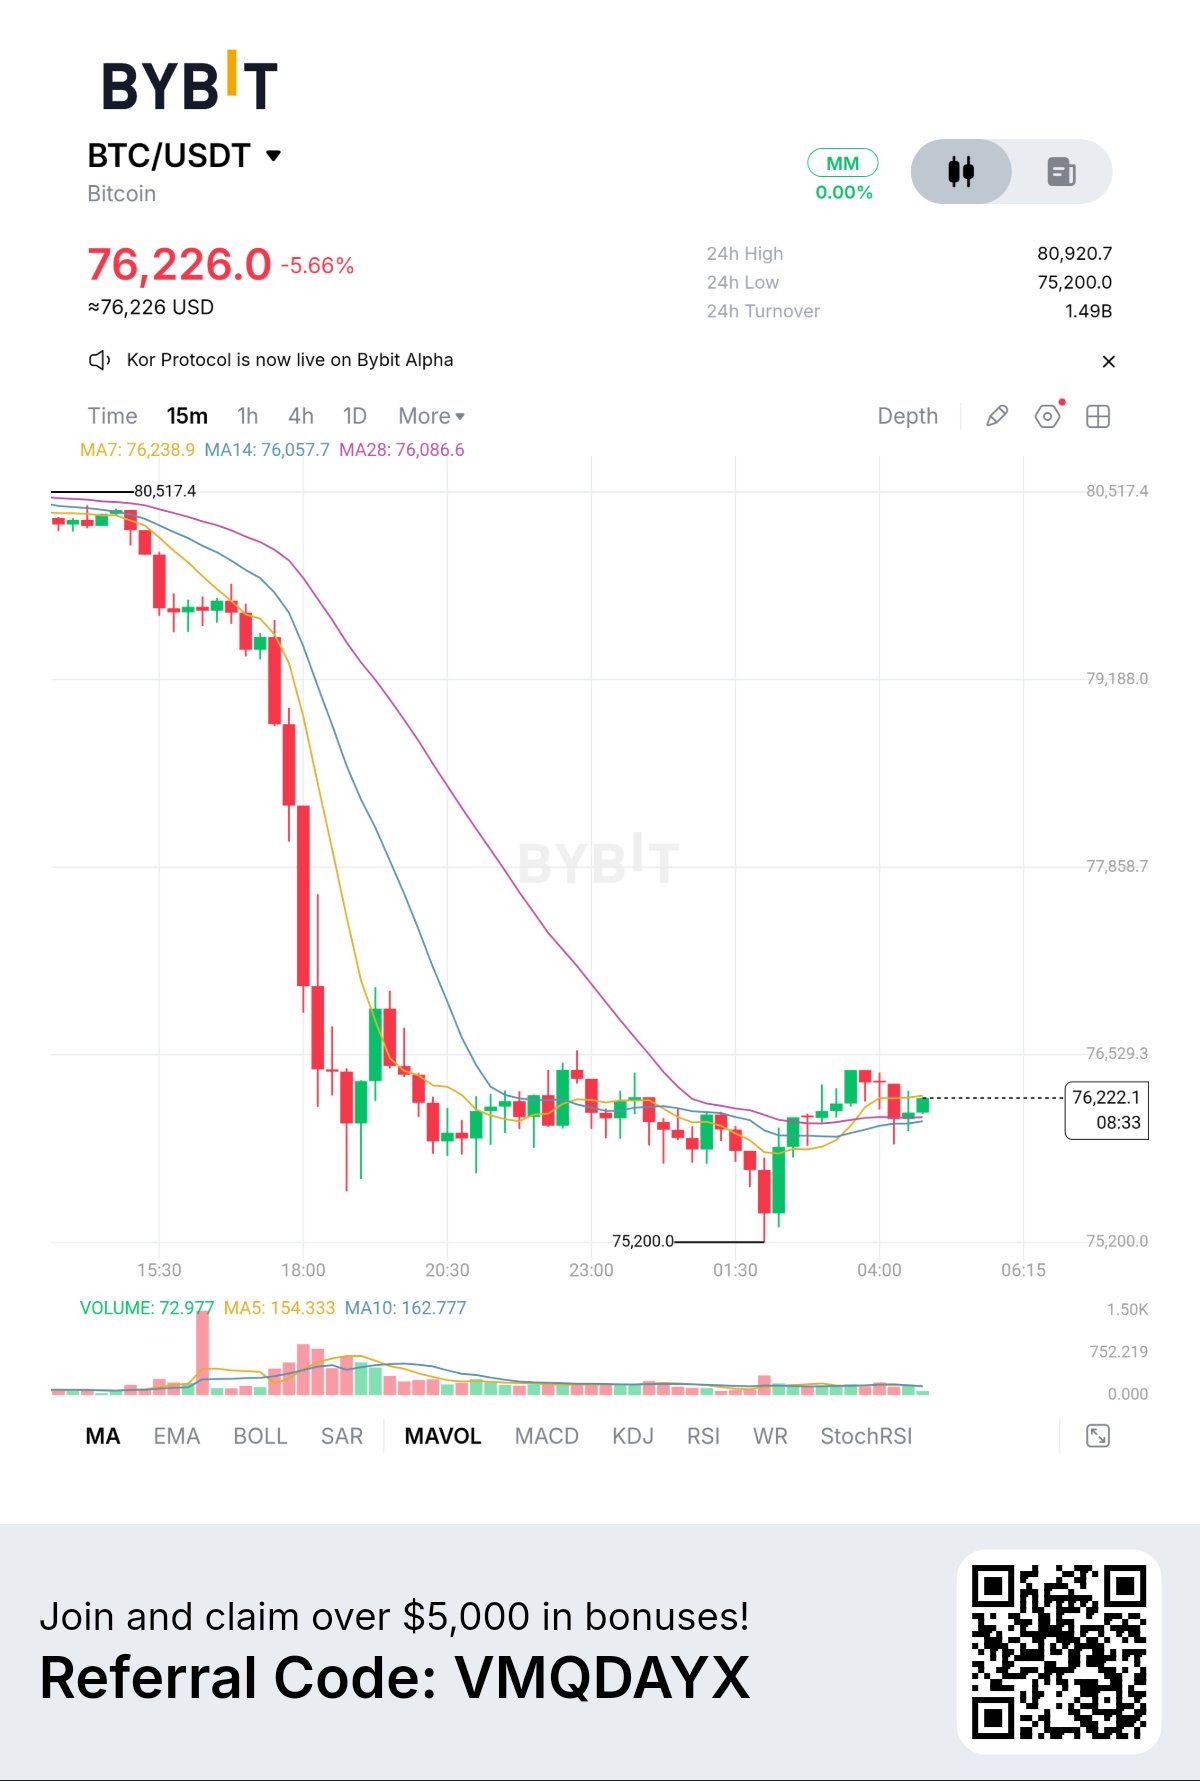
I'm watching $BTCUSDT around $76,021, and what stands out to me is how quickly the market has shifted from holding higher levels to trading below all three major moving averages on the 6H chart. MA7 is around $78,536, MA14 near $77,975, and MA28 around $77,820. That tells me buyers still have some work to do before I can consider the short-term structure healthy again. The recent selling pressure is clear, but I'm not interested in chasing a move simply because the candles look bearish. I'm focusing on the $75,200 area because it marks the recent 24H low and sits close to the lower Bollinger Band around $75,094. If sellers push price into that zone, I want to see how BTC reacts. A clean breakdown with expanding volume would make me cautious about further downside, while a strong rejection could open the door for a recovery attempt. On the other side, I want to see BTC reclaim the $77,800-$78,500 region before taking any bullish setup seriously. Momentum is still weak, with KDJ showing K at 32.8, D at 49.92, and J below zero. Volume also needs attention: current volume is around 1.07K, below both volume averages near 3.98K and 3.85K. I don't see enough confirmation yet to trust a reversal. For now, I'm waiting for either a convincing support reaction or a proper breakdown with volume confirmation. No forced entries, no guessing the bottom, and no chasing a relief bounce. BTC is giving me levels to watch, but not yet a setup worth taking. My current position is simple: WAIT. #WSOT2026 #BlockchainSecurity #WSOTPicktoEarn10U $BTCUSDT $ETHUSDT

🚨 Trezor amplió de 50 a 128 caracteres el límite de sus frases de contraseña en cuatro modelos de dispositivos. La actualización busca reforzar la protección de las wallets de bitcoin frente a intentos de acceso no autorizado. #BybitAIEvolving #Seguridad de Blockchain $SOLUSDT


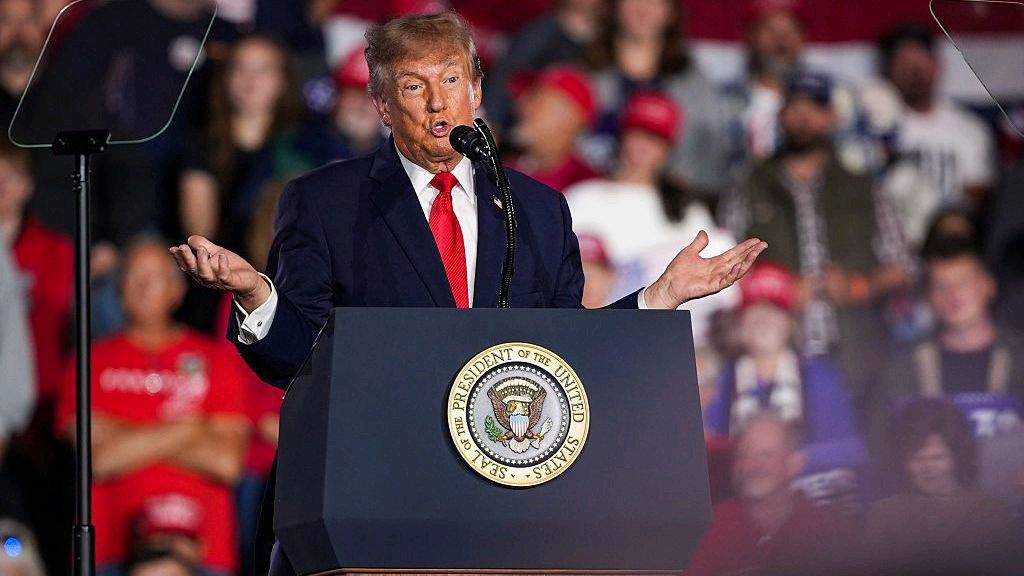
Трамп нәтижелерді қабылдайтынын мәлімдеді
TRUMP және $BNBUSDT АҚШ аралық сайлауының нарыққа әсеріне байланысты бақылауда WSJ тікелей бақылауына сәйкес, Трамп АҚШ-тағы аралық сайлау нәтижелерін қабылдайтынын және Конгресстің екі палатасын да бақылауына алған демократтармен жұмыс істеуге дайын екенін мәлімдеді. Сонымен қатар, ол Truth Social парақшасында: "Мен сайлау бюллетенінде болмадым, бірақ егер болғанымда, біз жеңіске жетер едік!" деп жазды. Түнгі сағат 01:26-дағы скриншоттарыңыздағы бақылау нәтижесі (дереккөз: AP арқылы WSJ): ӨКІЛДЕР ПАЛАТАСЫ: Демократтар 13 орын қосып, 188-ге жетті, Республикашылдар 13 орын жоғалтып, 110-ға түсті, көпшілікке 218 орын қажет. СЕНАТ: Демократтар 6 орын қосып, 52-ге жетті, Республикашылдар 6 орын жоғалтып, 40-қа түсті, көпшілікке 51 орын қажет. Карта әлі де аралас есептер келіп жатқанын көрсетеді, сондықтан бұл түпкілікті бекітілген нәтиже емес, тікелей есептеу. Мен мұны крипто үшін неге бақылап отырмын? Аралық сайлау әрқашан құбылмалылықты әкеледі. TRUMP – Трамптың тақырыптары үшін мем-бета, ол Truth Social жазбаларында қатты көтеріліп, қайта құлдырайды. $BNB – бұл нарықтық бета және Binance экожүйесінің монетасы, саяси жаңалықтар тәуекел көңіл-күйіне әсер еткенде, ол $BTC-мен бірге қозғалады. Мен тек жаңалыққа бола өсіп жатқан бағаны қуып жүрген жоқпын. TRUMP үшін басқа мем-трекерлерде 24 сағаттық ең жоғарғы көрсеткіш болған $0.03000 аймағы – алғашқы қарсылық деңгейі, ал қолдау күнінің ең төменгі нүктесі – бүгін $Q қайта көтерілген $0.02632 аймағы. $BNB үшін $76,648 деңгейін бақылаңыз, егер BTC $76,171 (24 сағаттық ең төменгі деңгей) деңгейін ұстап тұрса, альткоиндер демалады, егер $75,736 бұзылса, альткоиндер қайтадан құлдырайды. Менің жоспарым қарапайым: жаңалыққа бола жоғары деңгейден ұзақ мерзімді сауда (long) ашпаймын. Мен түзетуді және растауды күтемін. Егер TRUMP $0.02810 деңгейінен жоғары тұрып, көлеммен $0.02869 деңгейін қайтарып алса, онда $0.02970 және $0.03000-ға қарай ұзақ позиция ашамын, stop-loss $0.02632-ден төмен болады. Егер жаңалықтың әсері бәсеңдеп, баға $0.02730-дан төмен жабылса, мен нарықтан шығамын. Тәуекел тек 1-2%, жаңалықтарға негізделген сауда тез өтеді және бағытын өзгертуі мүмкін. Демократтардың екі палатаны да бақылауы крипто реттеуі мен серпіні үшін оң ба (bullish) әлде теріс пе (bearish) деп ойлайсыз? Бұл сайлау құбылмалылығында сауда жасау үшін $TRUMPUSDT түймесін басыңыз @BybitX @Bybit Learn @612 Ceros @SignalX @Demon - Trader @GhostWriter @VietnexusCrypto @PRADO @IBLOLO @Crypto BOSS #trump #АКШЖалақыларыЖәнеСтавкаШешімдеріМакроАптаныАйқындайды #Аралық сайлаулар нарығының шолуы #Блокчейн қауіпсіздігі #WSOT2026 #Мұнайдың құбылмалылығы Ирандағы бейбіт келіссөздермен қатар жүреді

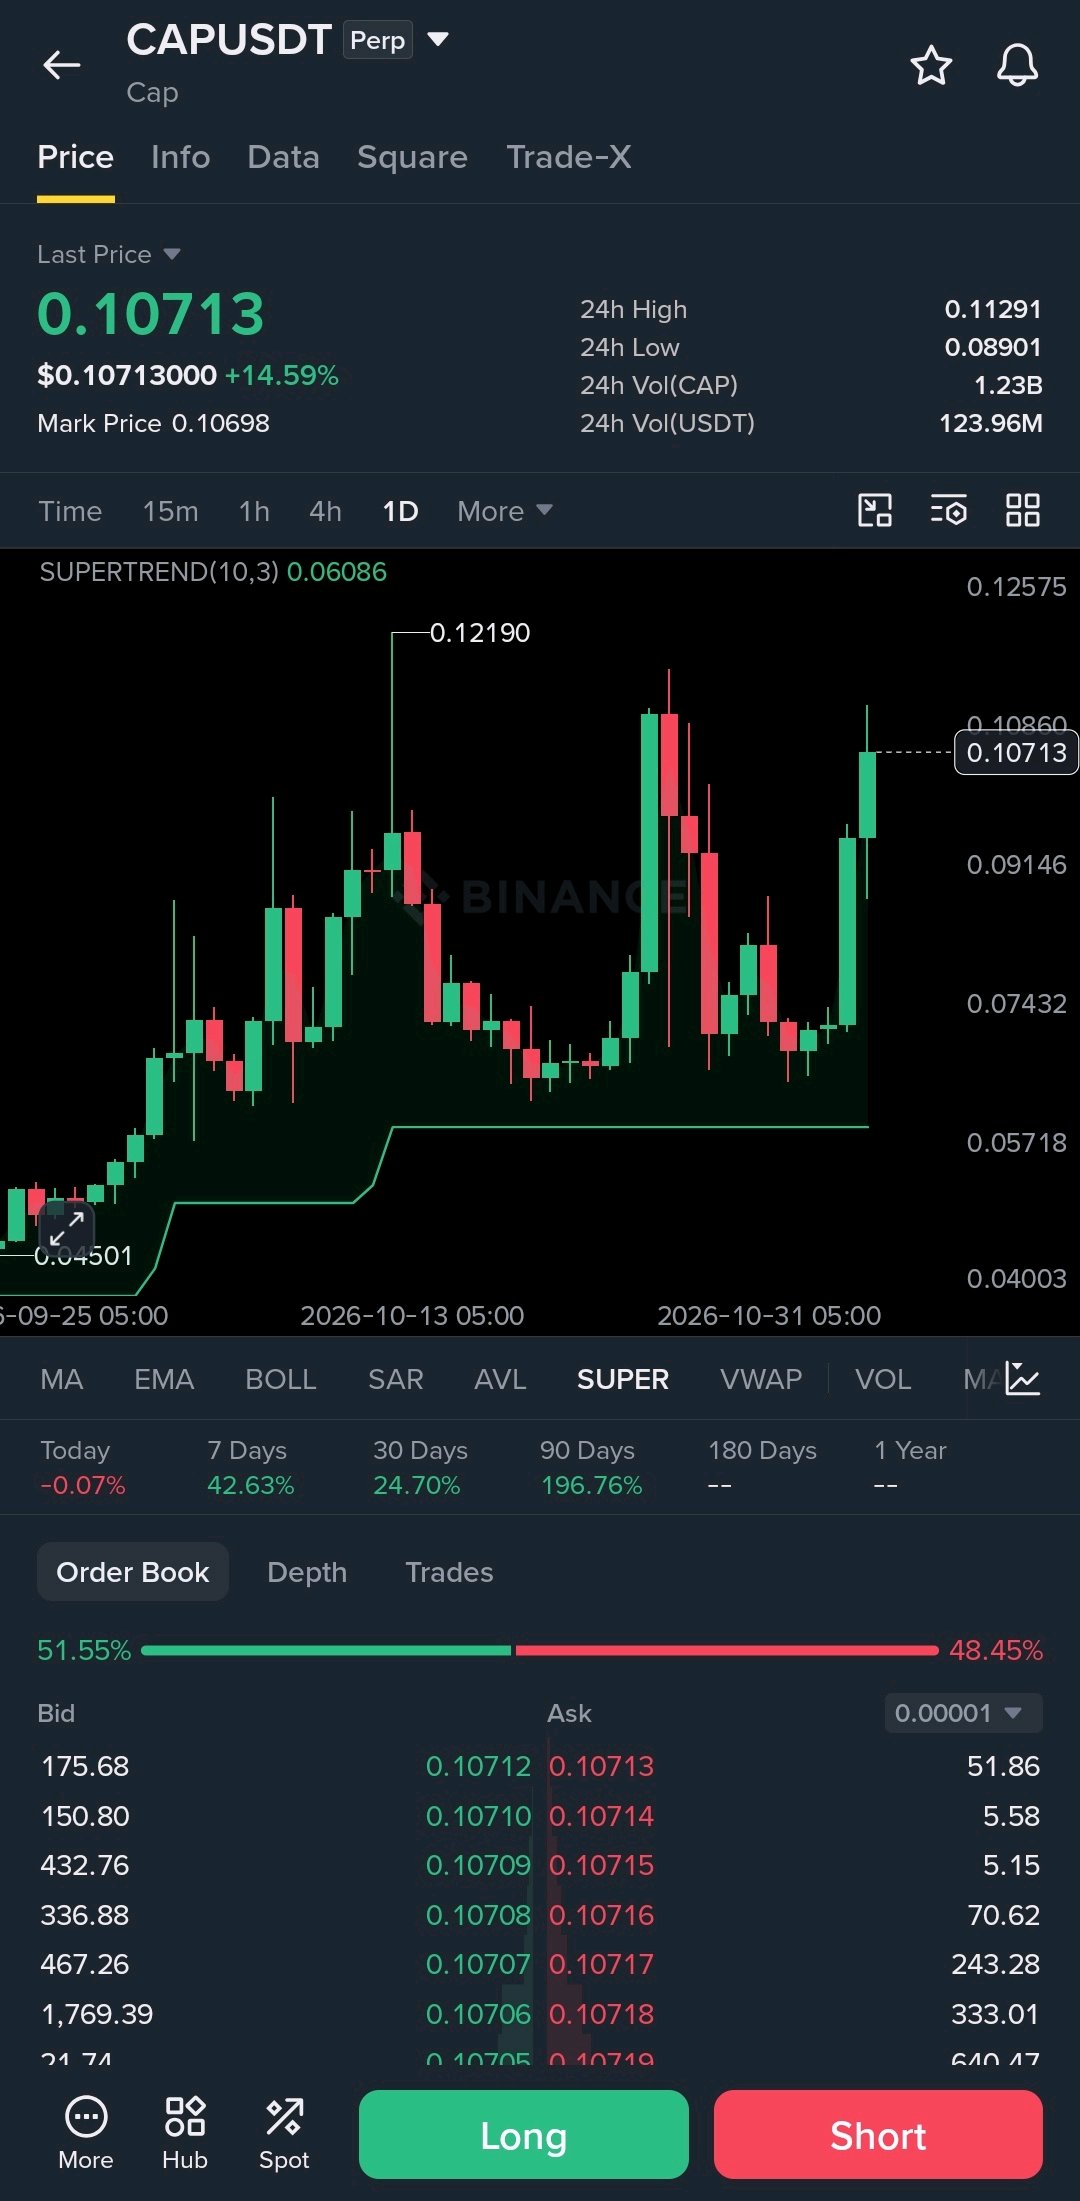
$CAPUSDT is building a strong bullish structure, and buyers are clearly back in control. Price has climbed to $0.1071 after reclaiming the $0.09 area. The daily Supertrend remains bullish at $0.06086, while momentum is now bringing the previous high into focus. Key levels to watch: Support: $0.091–$0.089 Near-term resistance: $0.1129 Major resistance: $0.1219 Trend support: $0.0608 A clean break above $0.1129 could set up a retest of $0.1219. If buyers fail to hold $0.089, a deeper pullback becomes possible. CAP is showing impressive relative strength. The next challenge is turning this momentum into a confirmed breakout. #Oracle20BFundingPlanTestsTheAITrade #BlockchainSecurity
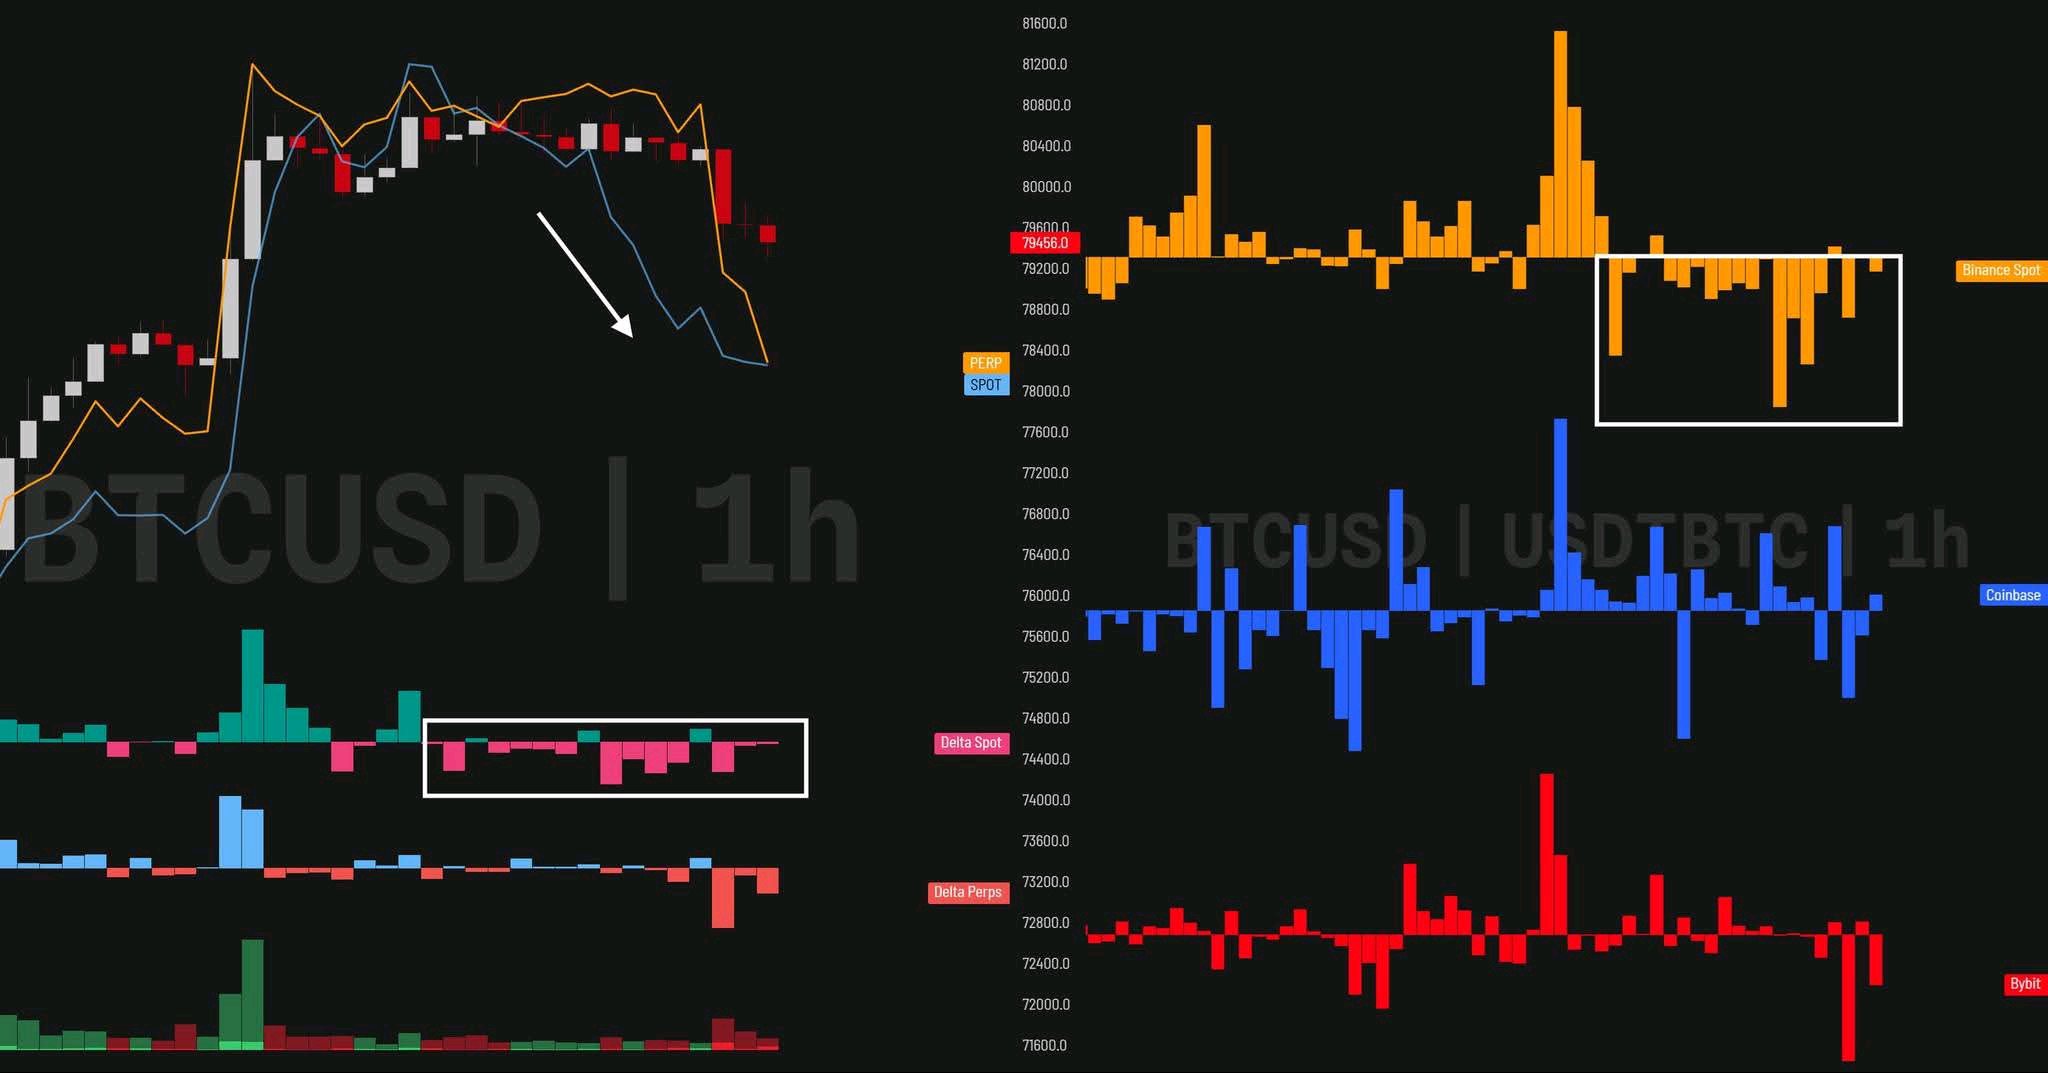
$BTCUSDT Баға төмендеп бара жатқандықтан, спот көлемі бәсеңдеуде. Бұл аю нарығы емес, 76 мыңнан 80 мыңға дейінгі өсімнен кейінгі қалыпты жағдай. Әлі де 76 мыңнан ұстап отырмын 78-79 мың деңгейінде қосуды жоспарлап отырмын Жарамсыздық деңгейі өзгеріссіз #Блокчейн қауіпсіздігі #АКШЖалақыларыЖәнеСтавкаШешімдеріМакроАптаныАйқындайды #WSOTPicktoEarn10U #WSOT2026 #BybitAIEvolving $MNTUSDT
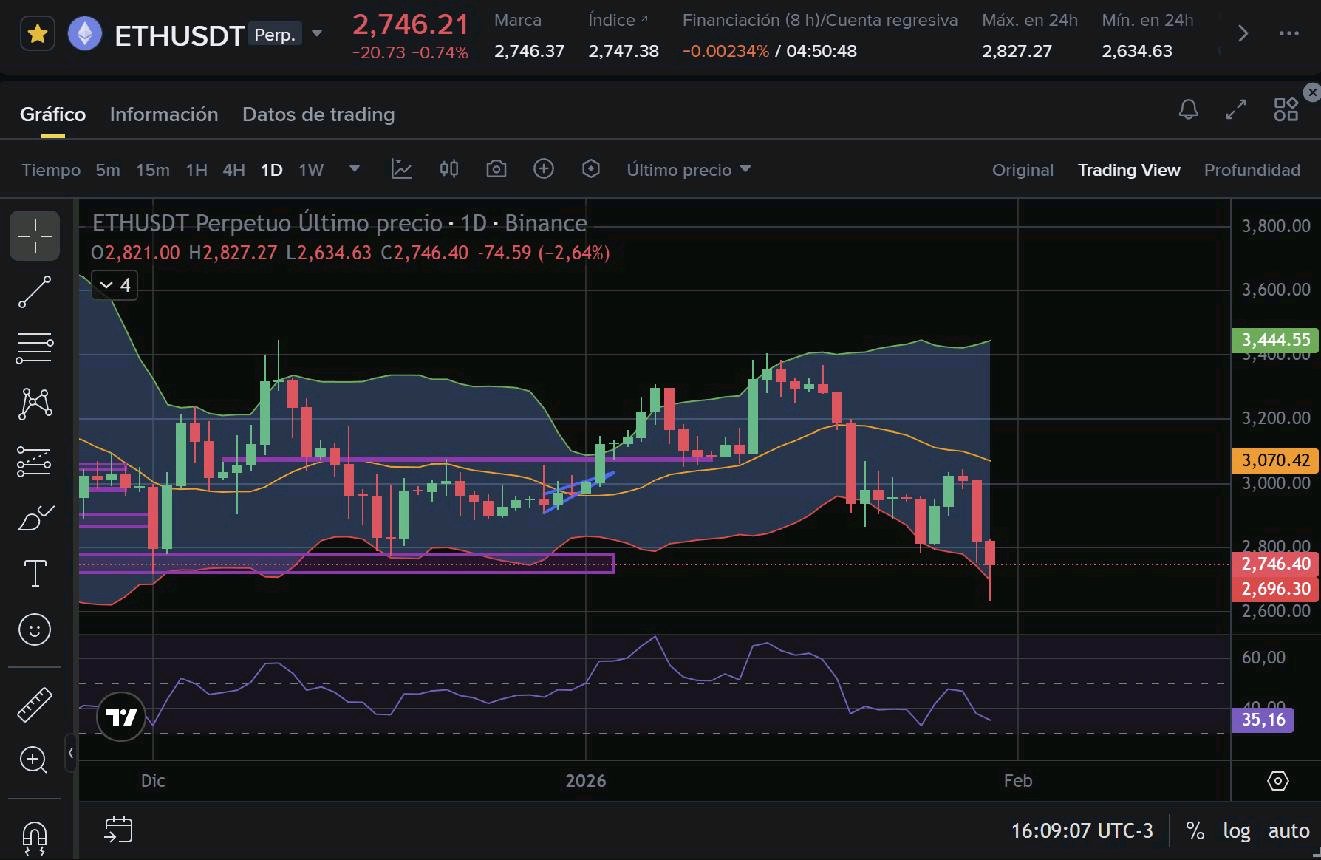
🚨 ETHEREUM (ETH) LIVE MARKET ANALYSIS
$ETHUSDT (ETH) MARKET UPDATE 📊 ETH/USDT – Market Outlook Ethereum is showing mixed market signals, with short-term bullish momentum on the 4-hour chart but a bearish trend on the daily timeframe. 💰 Latest Retrieved Price Snapshot: $2,286 📉 24H Change: -6.11% 🔍 Key Support Levels - $2,238 - $2,227 🎯 Key Resistance Levels - $2,321 - $2,330 - $2,452 📈 Bullish Scenario: If ETH breaks above $2,330 and maintains momentum, buyers could push the price toward higher resistance zones. 📉 Bearish Scenario: If ETH loses the $2,227 support zone, further downside pressure may develop. 📊 Market Sentiment: Short-term: Mixed / cautiously bullish Daily trend: Bearish 💡 Trading Strategy: Wait for a confirmed breakout or breakdown before entering a trade. Avoid chasing sudden price movements. ⚠️ Always use proper risk management. This analysis is for educational purposes, not financial advice. #ETH #ETHUSDT #CryptoAnalysis #Binance #Trading #CryptoMarket #WSOT2026 #USPayrollsAndRateDecisionsDriveMacroWeek #BybitAIEvolving #BlockchainSecurity

$XAUTUSDT Gold Shows Strong Recovery as Investors Watch Global Economic Developments Gold is gaining attention again as changing market expectations and movements in the US dollar influence precious metals. The $4,200 level is an important area to watch. A sustained move above this resistance could strengthen bullish momentum, while rejection may bring another period of consolidation. Gold remains an important asset to watch amid global economic uncertainty. Stay focused on market confirmation and manage your risk. #Gold #XAUUSD #GoldTrading #PreciousMetals #MarketNewsBinance Continues Security Recovery and Strengthens User Confidence Binance is making further progress with its security recovery efforts, including updates on asset withdrawals and platform protection. Security remains one of the most important factors for any crypto exchange. These developments highlight the importance of transparency, user protection, and stronger security systems across the crypto industry. The crypto community will be watching Binance's next updates closely. #BlockchainSecurity #Oracle20BFundingPlanTestsTheAITrade #MidtermsMarketWatch #AnthropicIPOTestsTheAIBoom #BOERateDecision $BTCUSDT
Bitcoin Shows Recovery Strength as Market Volatility Continues $BTCUSDT Bitcoin is showing signs of recovery after facing strong selling pressure. The market is trying to regain bullish momentum, while investors are closely watching the $82,000 resistance zone. ETF inflows and short liquidations are adding some support to the recovery. However, bulls still need a strong breakout to confirm the next upward move. The coming sessions could be important for Bitcoin's direction. Stay patient, manage risk, and watch key levels. #BlockchainSecurity #Oracle20BFundingPlanTestsTheAITrade #MidtermsMarketWatch #AnthropicIPOTestsTheAIBoom #BybitAIEvolving

$BTCUSDT looks interesting i suggest buy buy buy as much you can this last chance before 90k I'm bullish I'm opening #WSOT2026 #USPayrollsAndRateDecisionsDriveMacroWeek #BybitAIEvolving #AnthropicIPOTestsTheAIBoom #BlockchainSecurity
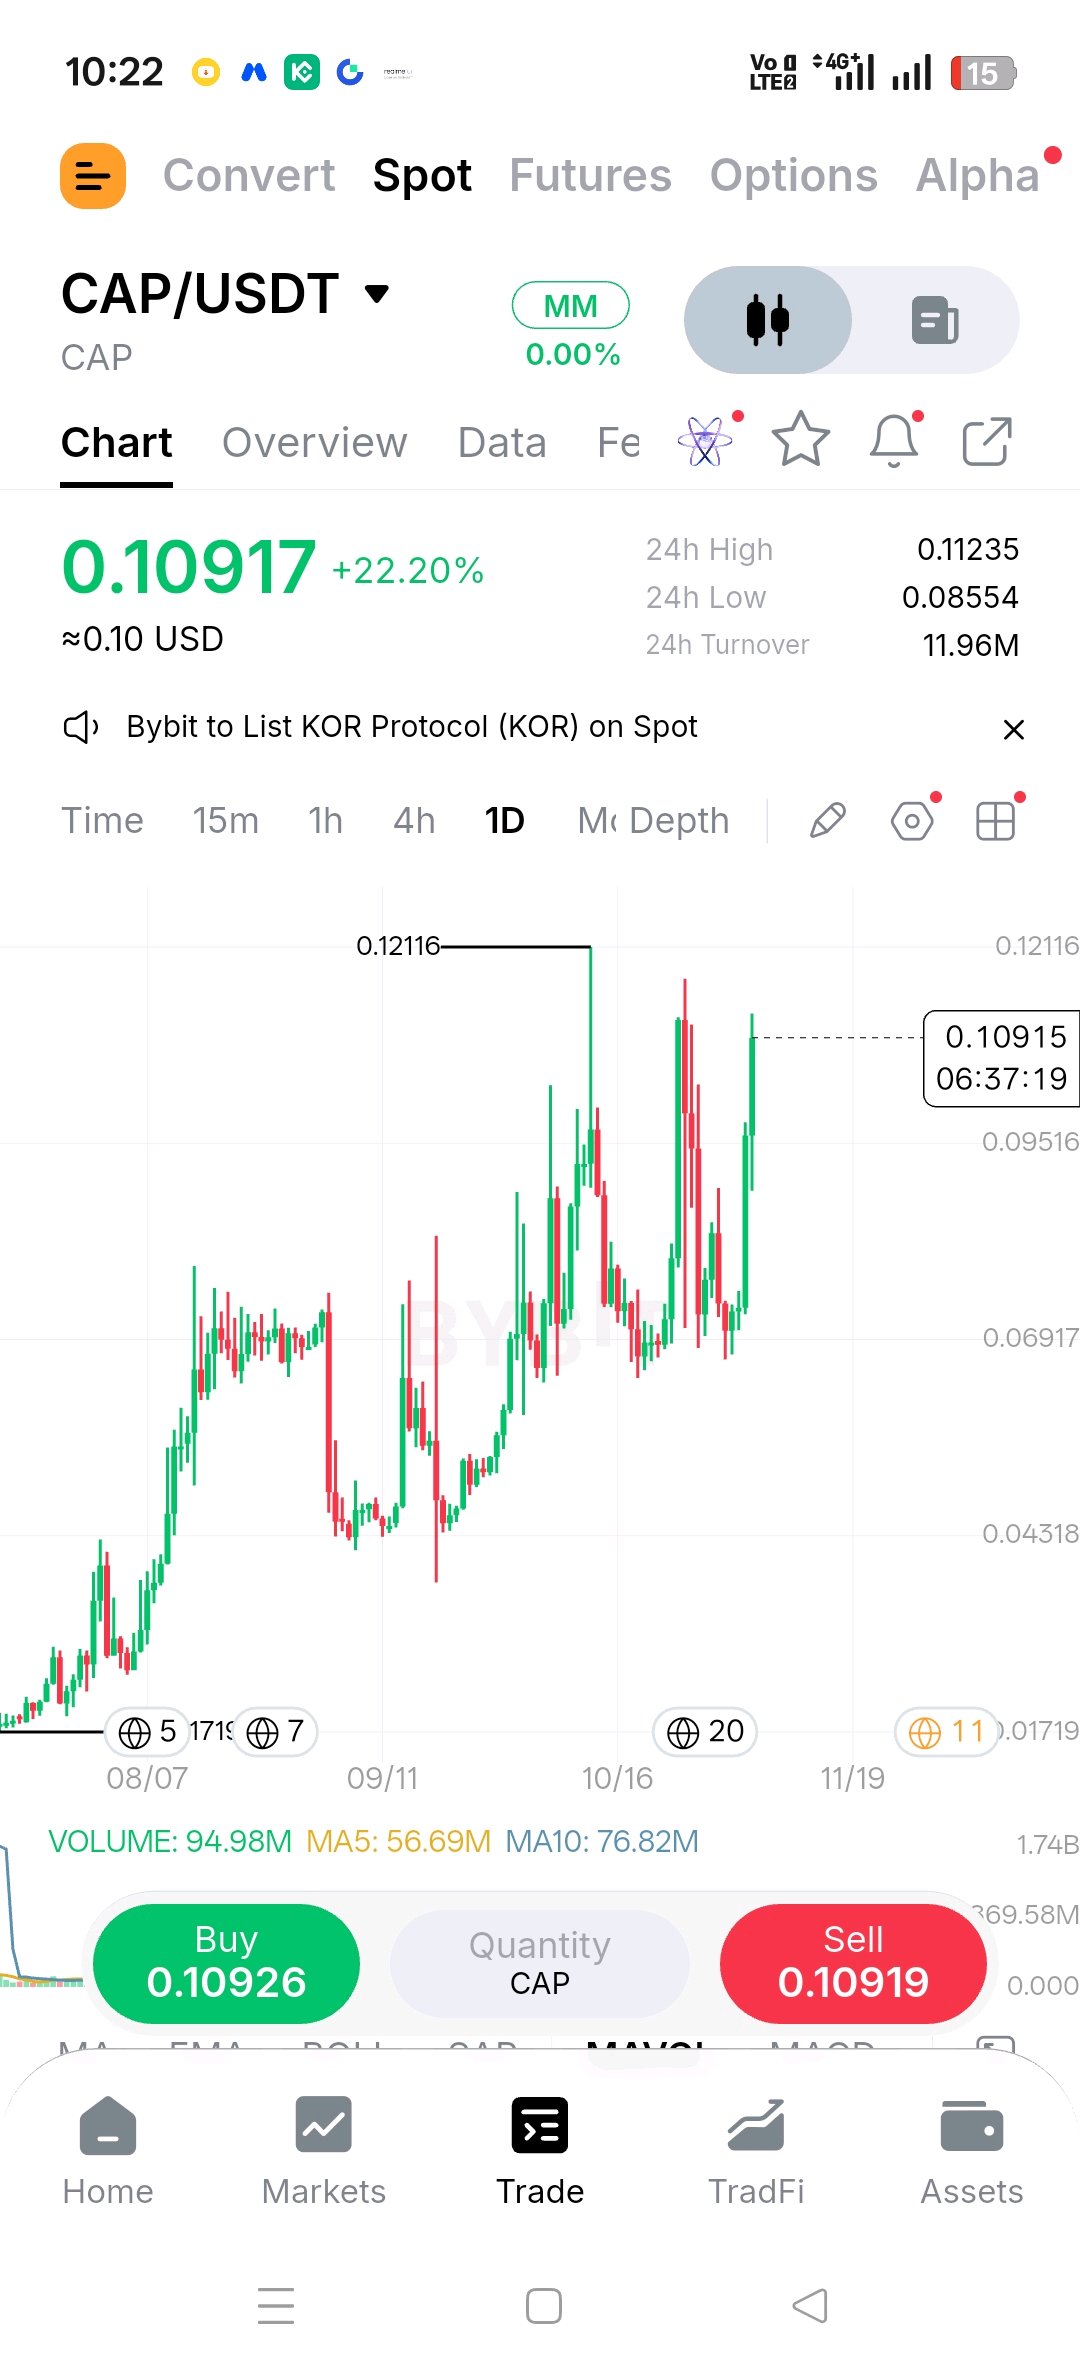
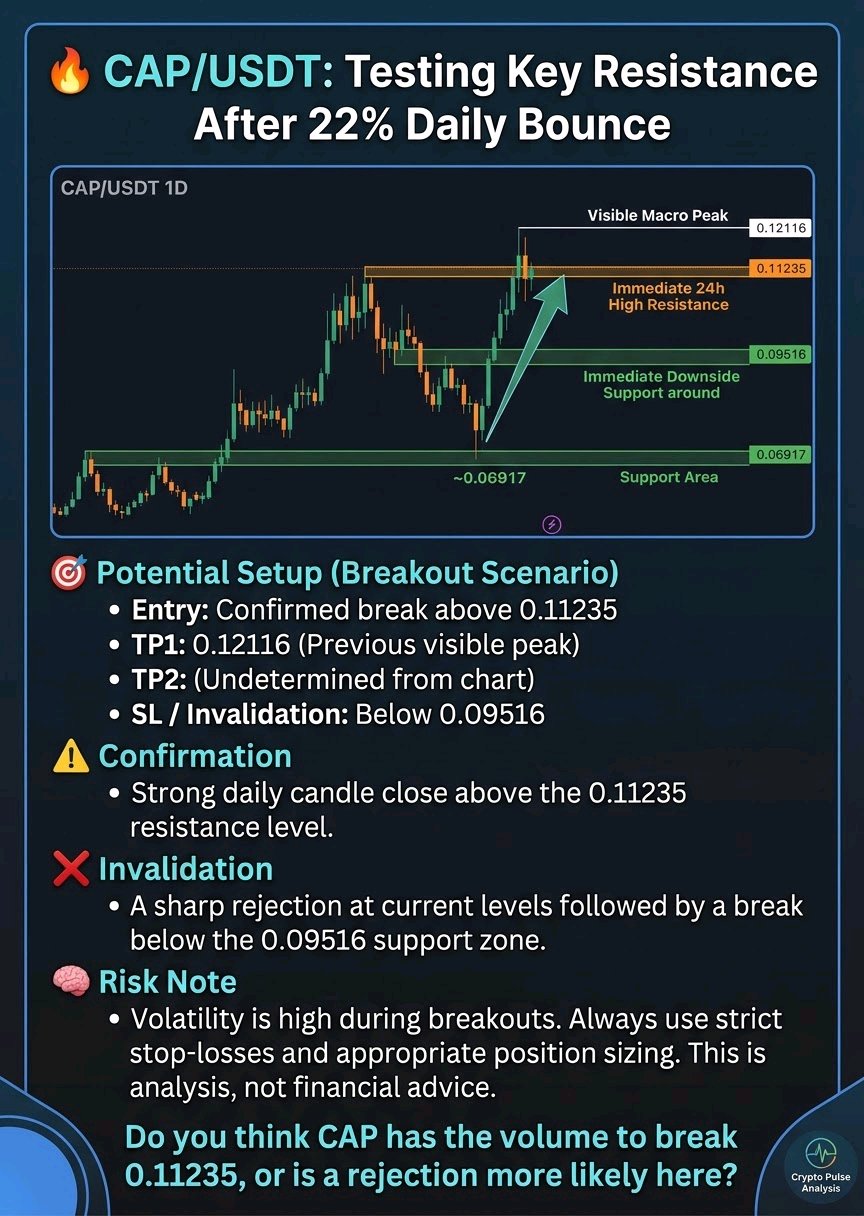
🔥CAP/USDT: Key Resistance Test
$CAPUSDT CAP is showing strong bullish momentum today, recovering sharply from recent lows to test local resistance. 📊 Market Structure: On the 1D chart, CAP/USDT is in a broader uptrend, having bounced firmly from the ~0.06917 support area. Price is currently challenging the immediate 24h high of 0.11235, with the visible macro peak sitting higher at 0.12116. Immediate downside support is visible around 0.09516. 🎯 Potential Setup (Breakout Scenario): · Entry: Confirmed break above 0.11235 · TP1: 0.12116 (Previous visible peak) · TP2: Not clear from chart · SL / Invalidation: Below 0.09516 ⚠️ Confirmation: A strong daily candle close above the 0.11235 resistance level. ❌ Invalidation: A sharp rejection at current levels followed by a break below the 0.09516 support zone. 🧠 Risk Note: Volatility is high during breakouts. Always use strict stop-losses and appropriate position sizing. This is analysis, not financial advice. #IMPACTbyTrade #BlockchainSecurity #BybitAIEvolving
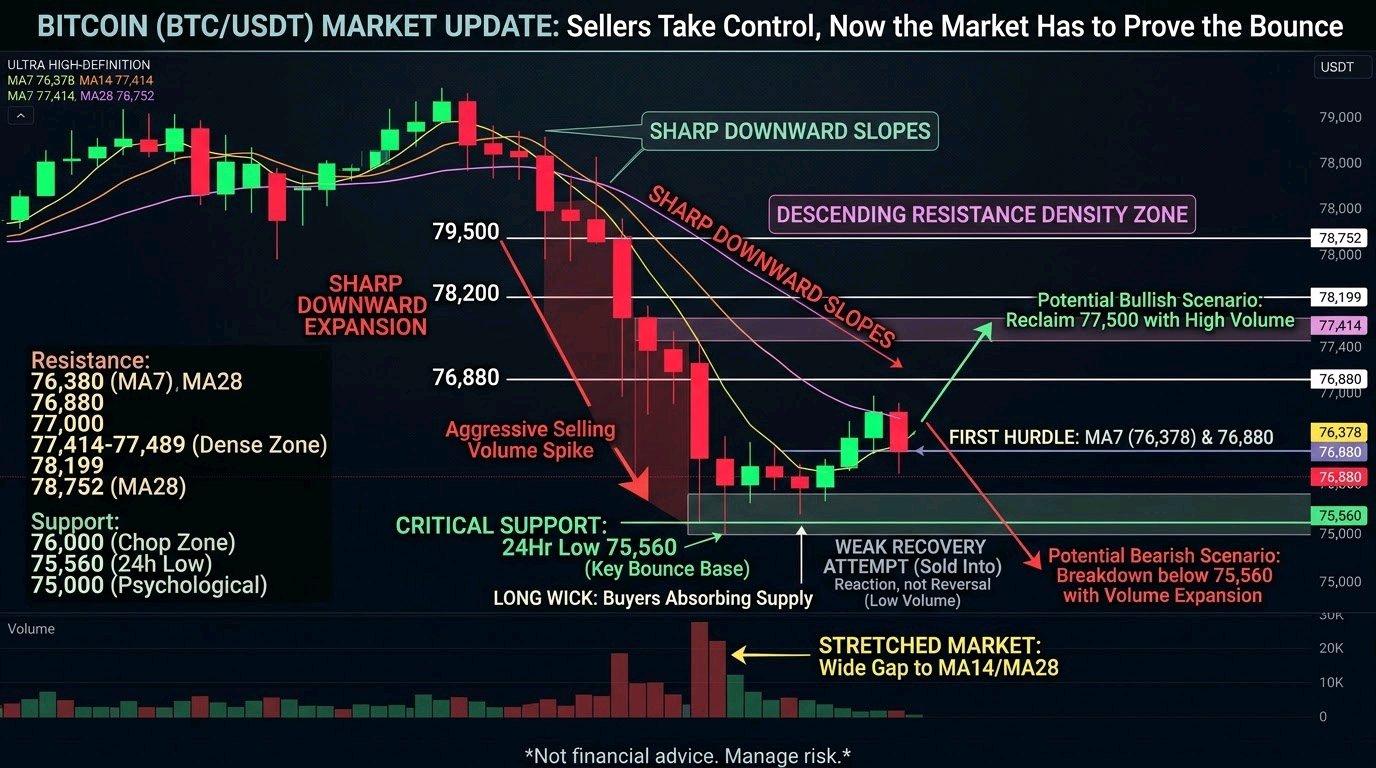
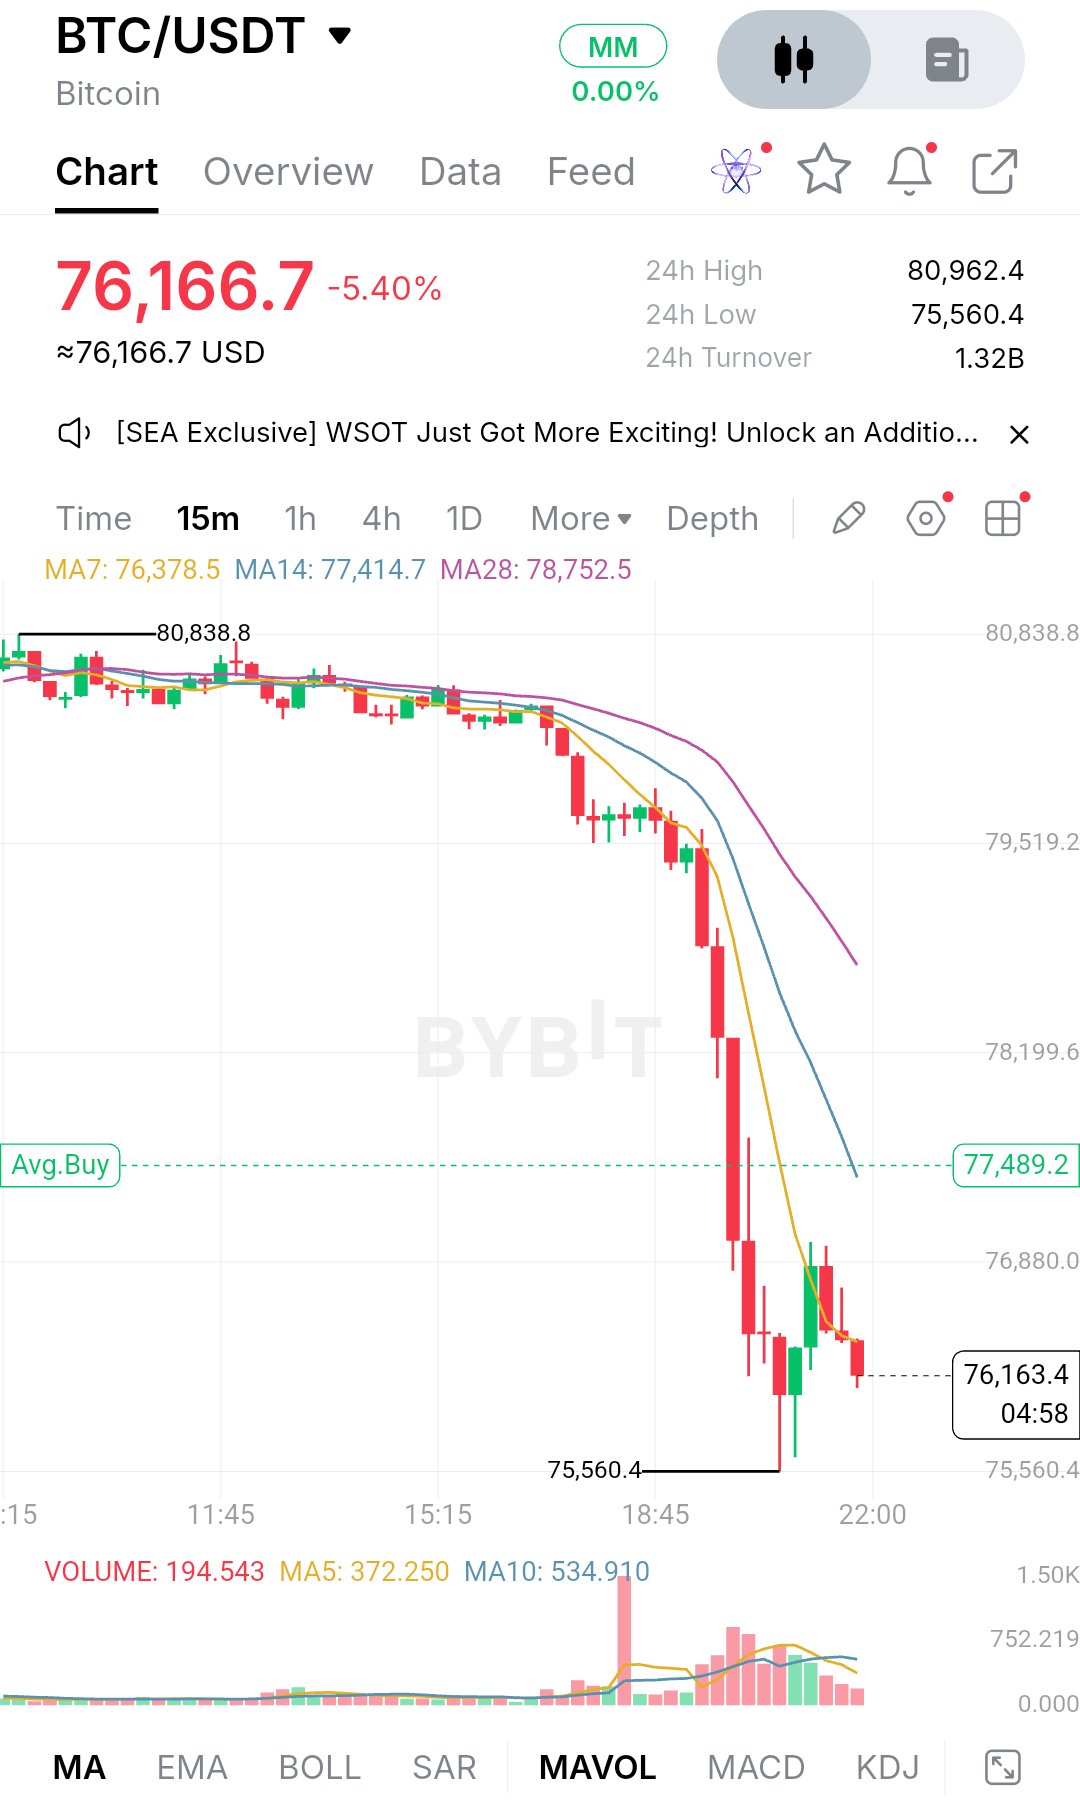
$BTCUSDC: Сатушылар бақылауды қолға алды, енді нарық серпілісті дәлелдеуі керек Bitcoin шамамен 76 166 деңгейінде саудаланып жатыр, бұл күнделікті мәннен шамамен 5,4%-ға төмен. 24 сағаттық диапазон 80 962 маңындағы жоғары көрсеткіштен 75 560 төменгі көрсеткішке дейін ауытқыды, сондықтан бұл жай ғана баяу төмендеу емес, нарықтық бағаның нақты қайта қалыптасуы болды. Сауда-саттықтың алғашқы бөлігінде баға 81 000-ға жетпей тұрды, ал сатушылар 80 800 аймағында үнемі пайда болып, нарық ақыры берілгенше қысым көрсетті. Бірнеше сағат бойы график шаршаңқы диапазондағыдай көрінді. Шамдар кішкентай және бір-бірінің үстіне түсіп жатты, нақты бағыт жоқ еді, ал жылжымалы орташалар (moving averages) бір жерге жиналып, тегістелген болатын. Мұндай сығылу сирек ұзаққа созылады. Баға орташалар кластерінен төмен түскен бойда, қозғалыс тездетілді. Ірі қызыл шамдар тізбегі BTC-ні 79 500, 78 200 және 76 880 деңгейлері арқылы ешқандай кідіріссіз өткізіп жіберді, ал құлдыраудың ең қарқынды сәтіндегі көлемнің өсуі бұл жай ғана баяу төмендеу емес, мәжбүрлі және агрессивті сату болғанын растайды. 75 560 деңгейіндегі ең төменгі нүктеден кейін сатып алушылар белсенділік танытты. Бірнеше жасыл шам бағаны 77 000 аймағына қарай итерді, бірақ серпіліс тез арада сатылып кетті және соңғы шам қайтадан қызыл түске ие болды. Бұл маған қалпына келудің әлі де кері қайту емес, тек реакция екенін көрсетеді. Серпіліс кезіндегі сауда көлемі төмендеу кезіндегіге қарағанда айтарлықтай төмен және қазіргі көрсеткіш өзінің қысқа мерзімді орташа көрсеткішінен әлдеқайда төмен, сондықтан қазір екі тараптан да сенімділік жоқ. Баға тұрақтанып келеді, бірақ әлі ешқандай құрылым қалыптастырған жоқ. Мен көріп отырған индикаторлар бойынша жағдай әлі де аю (bearish) бағытында. MA7 76 378, MA14 77 414 және MA28 78 752 деңгейінде, үшеуі де төмендейтін тәртіппен орналасқан және күрт төмен қарай бағытталған. Баға MA7 деңгейінде саудаланып жатыр, бұл бірінші қарсылық сызығы. BTC одан жоғары жабылып, сол деңгейді ұстап тұрмаса, қысқа мерзімді тренд сатушылардың қолында болады. Баға мен MA14 және MA28 арасындағы үлкен алшақтық құлдыраудың қаншалықты созылғанын көрсетеді, сондықтан серпілістің орынды екені түсінікті, бірақ созылған нарық ұзақ уақыт бойы созылған күйде қалуы мүмкін. Ең маңызды қолдау — 75 560 деңгейіндегі ең төменгі көрсеткіш, мұнда сату басылып, ұзын білте (wick) сатып алушылардың ұсынысты сіңіріп жатқанын көрсетеді. Егер қайта тексеру кезінде бұл деңгей сақталса, әсіресе сату көлемінің төмендеуімен, ол қысқа мерзімді диапазонның негізіне айналуы мүмкін. Егер ол бұзылса, бұл графикте одан төмен ешқандай қолдау көрінбейді және 75 000 дөңгелек деңгейі келесі психологиялық магнитке айналады. Ең төменгі деңгей мен ағымдағы баға арасында 76 000 аймағы нарық бұрыннан тербеліп жатқан ең жақын аймақ болып табылады, сондықтан мен алдымен бағаның онда өзін қалай ұстайтынын бақылайтын едім. Жоғары жағында бірінші кедергі 76 380 маңындағы MA7, одан кейін құлдырау кезінде бұзылған және қазір қарсылық ретінде қызмет ететін 76 880 деңгейі. Одан жоғары 77 000 — келесі дөңгелек нөмірлік кедергі, ал MA14 (77 414) 77 489 белгісінің жанында орналасып, тығыз қарсылық аймағын құрайды. Одан әрі 78 199 және MA28 (78 752 жанында) негізгі деңгейлер болып табылады, және оларға жететін қалпына келу нарық көңіл-күйінің маңызды өзгерісі болар еді. 79 500 аймағы және одан кейін 80 000 — үлкенірек психологиялық мақсаттар, бірақ олар ағымдағы бағадан алыс және импульстің тұрақты өзгеруін қажет етеді. Бұқа (bullish) жағдайы үшін сатып алушылар 76 880 деңгейін қайтарып алып, оны қолдауға айналдыруы керек, содан кейін көлемнің өсуімен 77 400 - 77 500 кластерін бұзып өтуі керек. Мұндай қозғалыс қысқа мерзімді орташаларды тегістеп, сату процесі аяқталғанын білдірер еді. Осыдан кейін 78 200 және 78 750 деңгейлері келесі шынайы аялдамалар болады. MA14 деңгейінен төмен тоқтап қалған әлсіз көлемдегі серпіліс жеткіліксіз болады. Аю (bearish) жағдайы үшін бәрі қарапайым. Егер баға 76 400 - 77 000 аймағында кері қайтарылса, нарық 75 560 деңгейін қайта тексереді. Осы ең төменгі деңгейден төмен қарай айқын бұзылу, әсіресе құлдырау кезінде көргендей көлемнің кеңеюімен бірге, 75 000 деңгейіне және одан да төмен құлдырауға есік ашады. Төмендеп жатқан орташалар кезіндегі қайталама сәтсіздіктер серпілістің тек кідіріс болғанын растайды. **Негізгі баға деңгейлері** - Қарсылық: 76 380 (MA7), 76 880, 77 000, 77 414 - 77 489 (MA14 аймағы), 78 199, 78 752 (MA28), 79 519, 80 000 - Қолдау: 76 000 (жақын маңдағы тербеліс аймағы), 75 560 (24 сағаттық ең төменгі деңгей), 75 000 (психологиялық) - Аю көзқарасының жойылуы: 77 500 деңгейінен жоғары, күшті көлеммен тұрақты ұсталу Жалпы алғанда, BTC тығыз, шешімсіз диапазоннан төмен қарай күрт кеңеюге ауысты, ал нарық қазір бұл трендтің басталуы ма, әлде шамадан тыс асыра сілтеу ме, соны шешіп жатыр. Маңызды деңгейлер түсінікті: төменде 75 560 және жоғарыда 77 000 - 77 500 аймағы. Баға әрқайсысында қалай әрекет ететінін бақылаңыз және кез келген бір серпіліске қарағанда көлемге және шамның жабылуына көбірек назар аударыңыз. Келесі кеңею осы екі деңгейдің қайсысы бірінші болып берілсе, содан басталады. Бұл талқылау үшін берілген график талдауы, қаржылық кеңес емес. Тәуекеліңізді әрқашан басқарыңыз. $ETHUSDC #Блокчейн қауіпсіздігі

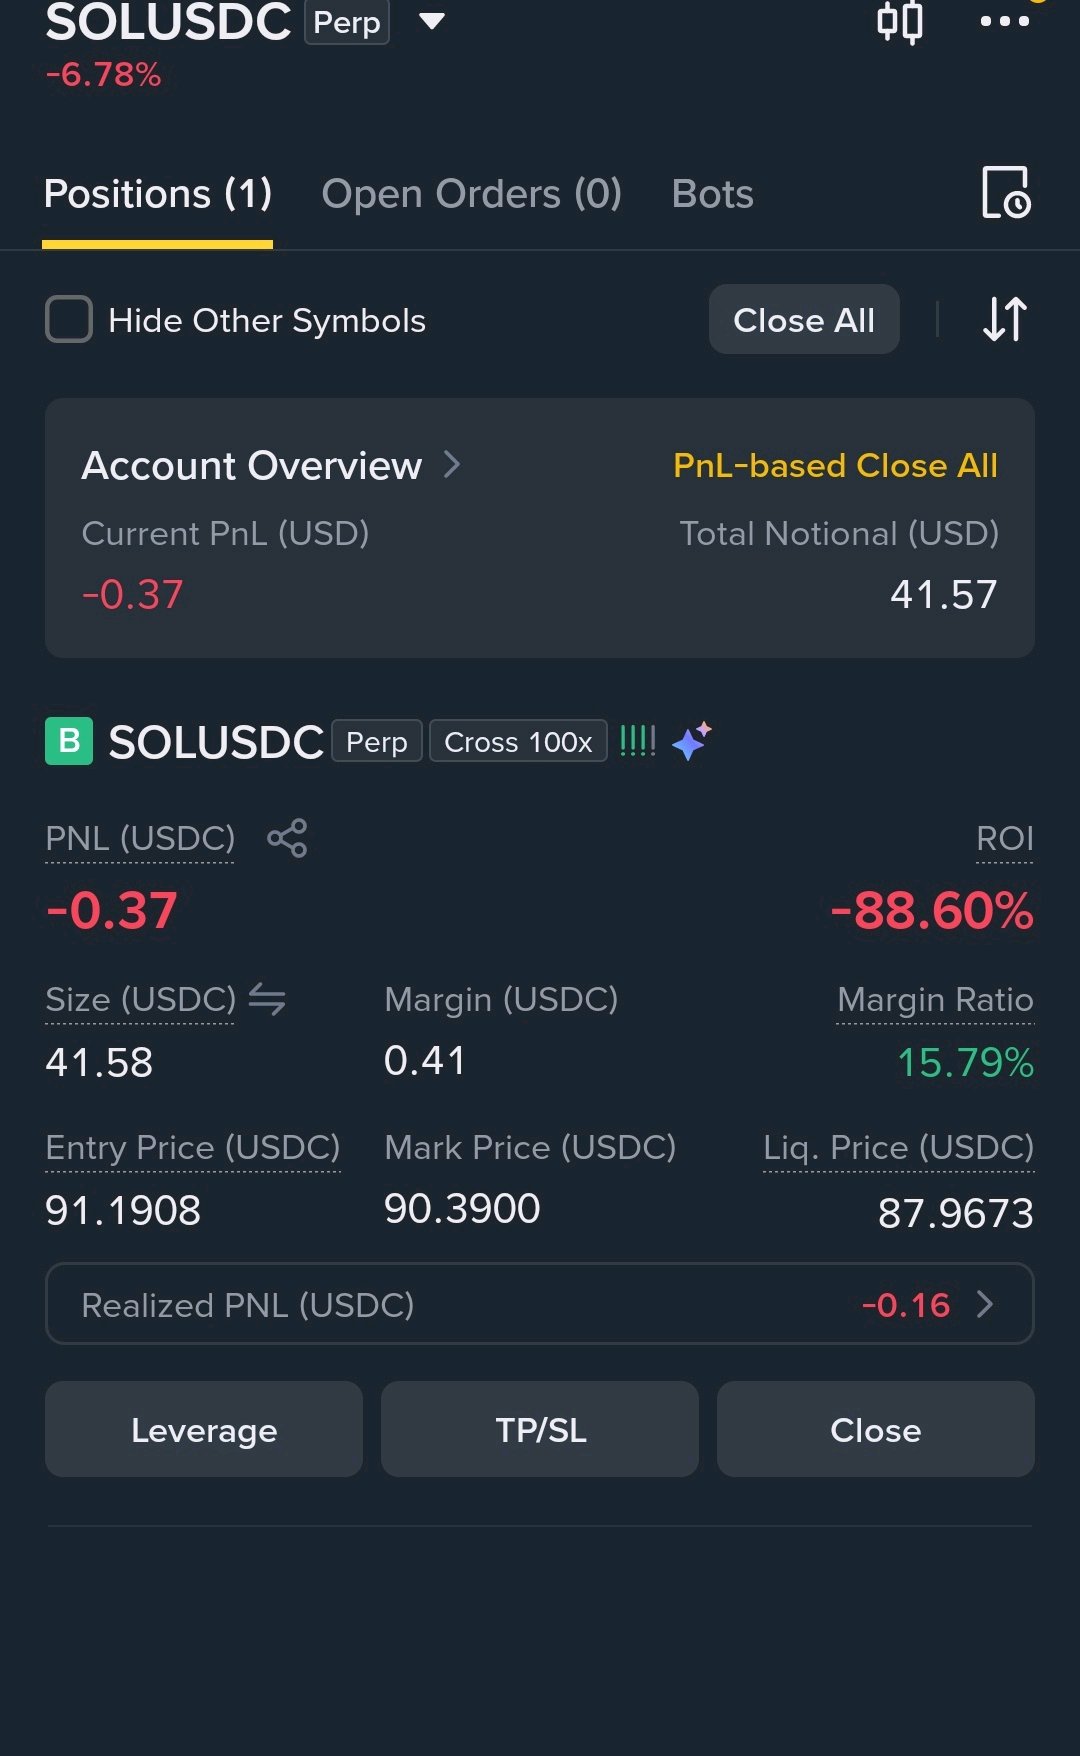
Buy/Rebound Speculative (Long) sol
Pair: SOL/USDT Trade Type: Long Buy/Bounce Current Price: $91.24 Suggested Entry Zone: Around the current price or upon testing support near $89.50-$90.00 Momentum Indicators: RSI(6) at 33.51 (approaching oversold territory), MACD showing slowing downward momentum with an attempt at a bullish crossover. Targets (Take Profit): Target 1: $93.00 Target 2: $95.00 Stop Loss: Close below $88.50 $SOLUSDT $NEARUSDT #WSOTPicktoEarn10U #أمن البلوكشين #BybitAIEvolving

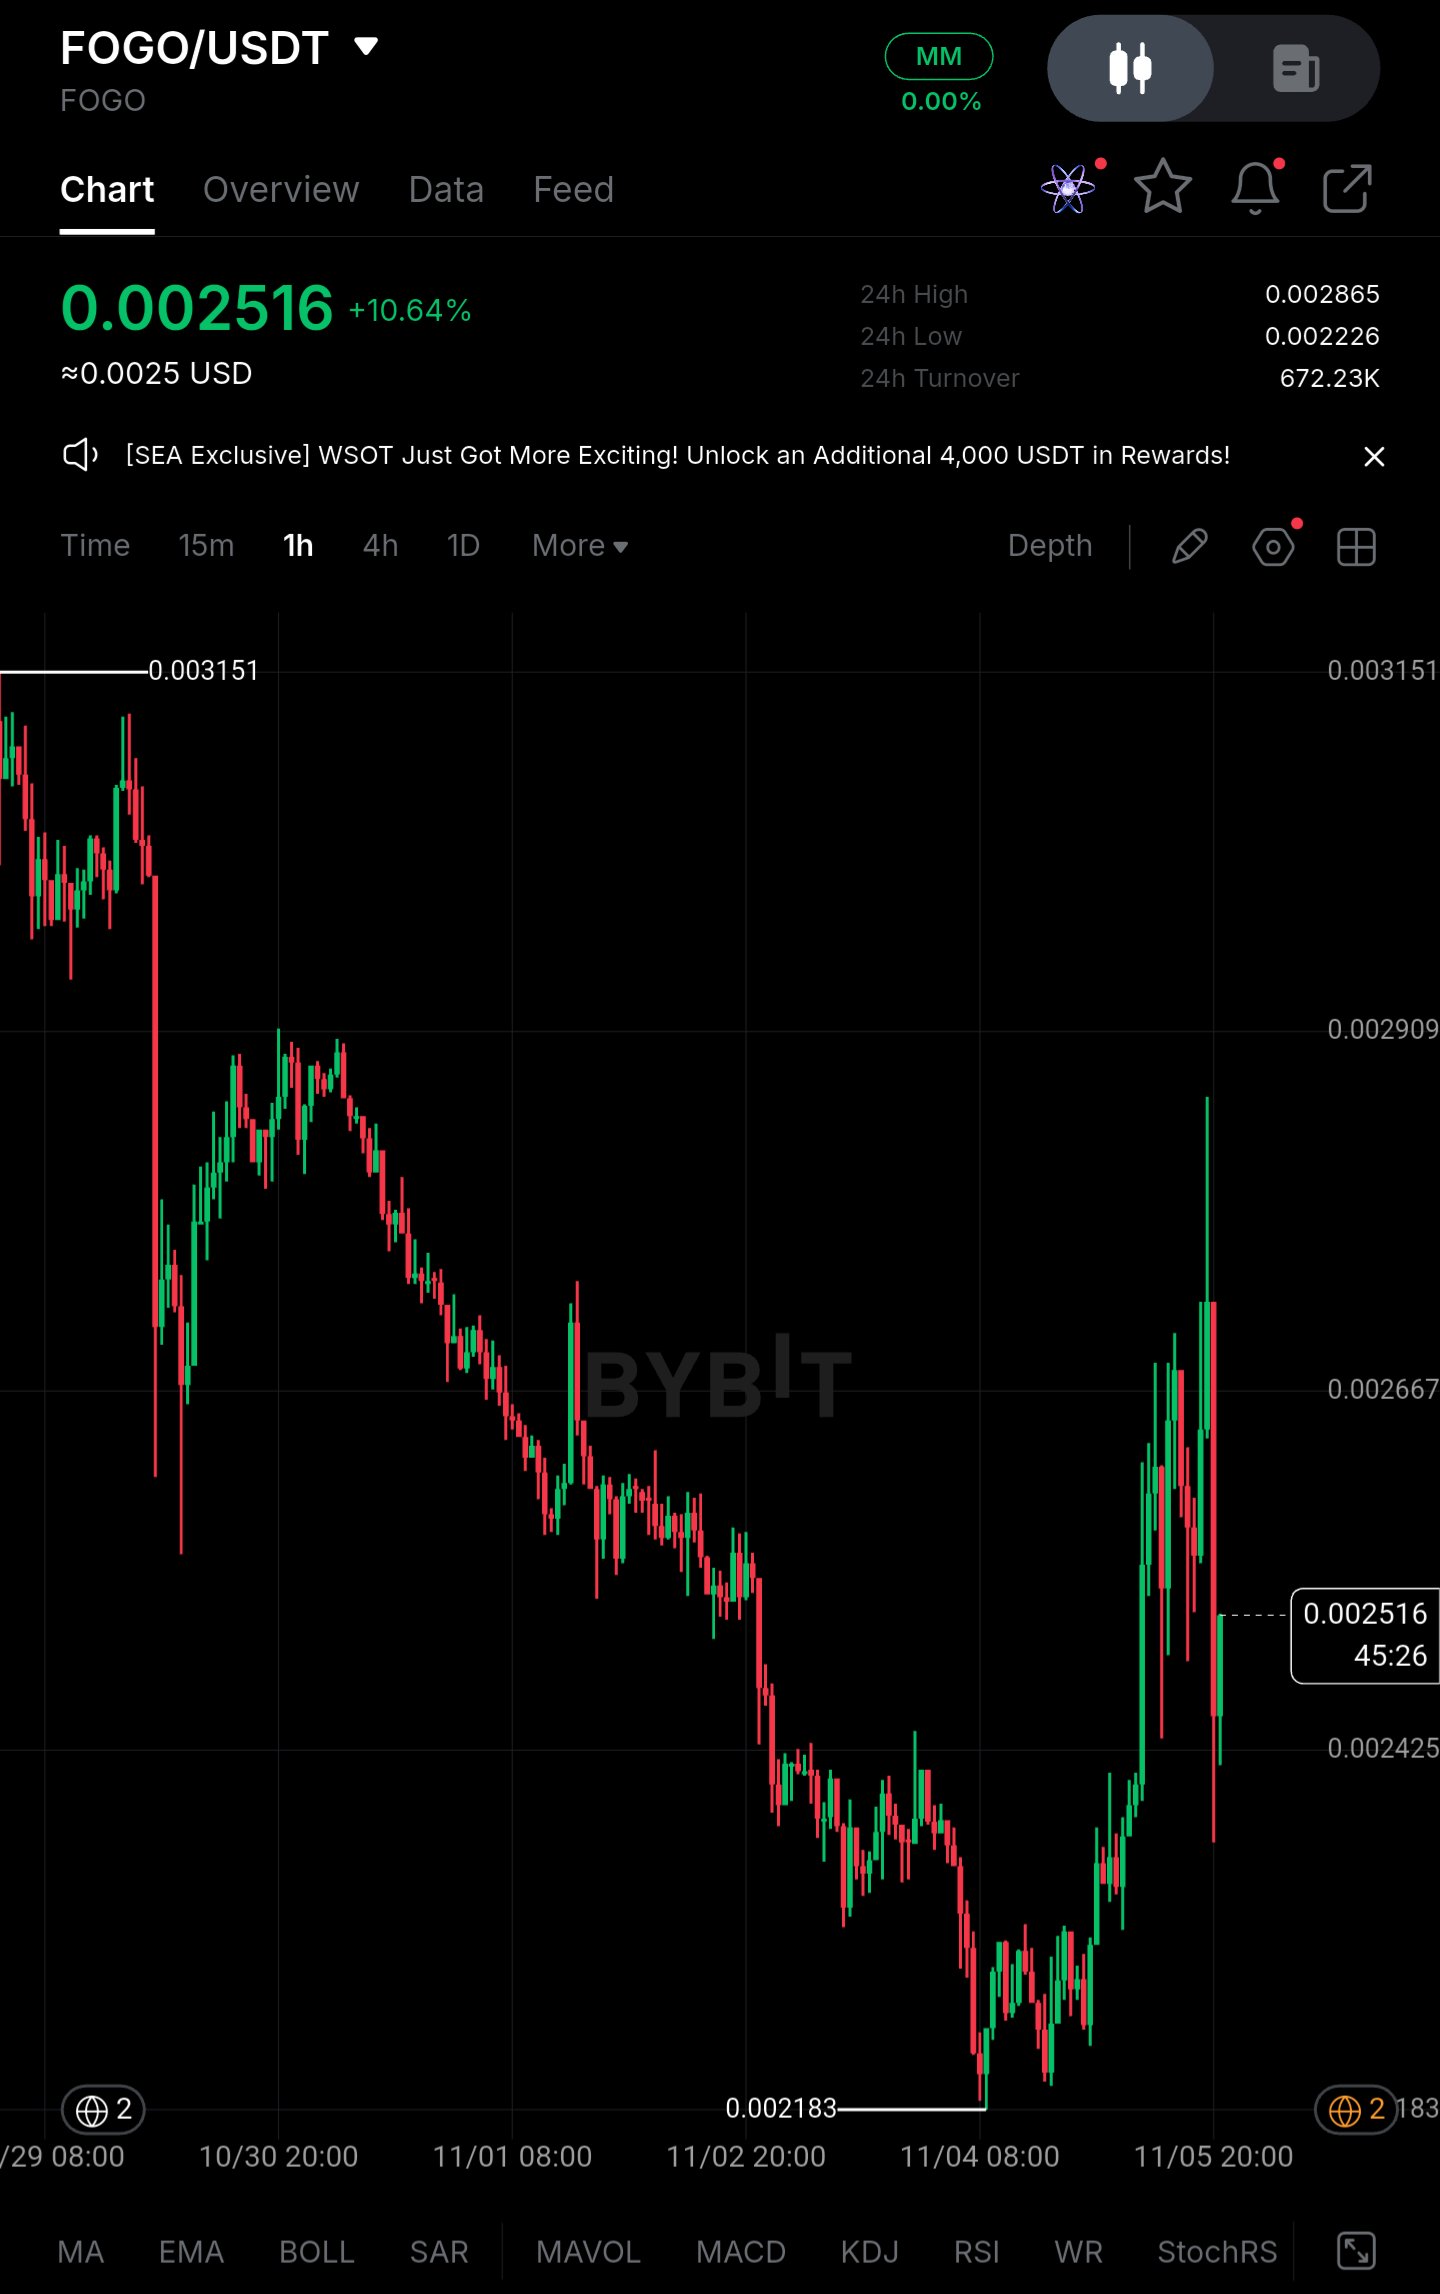
$FOGOUSDT FOGO/USDT – Market Structure Analysis | 1H Current Price: $0.002516 FOGO is trading around $0.002516 after rebounding approximately 15.25% from its recent chart low of $0.002183. While the latest price action shows a meaningful short-term bounce, I am not treating this move as a confirmed recovery yet. The broader structure remains under pressure. FOGO has experienced a prolonged sequence of lower highs and lower lows, and the recent upside move still needs confirmation through sustained spot demand. The key concern is whether buyers can absorb overhead selling pressure or whether this bounce becomes another opportunity for sellers to distribute. # 1\. Price Action & Market Structure * Current Price: $0.002516 * 24H Change: +10.64% * 24H High: $0.002865 * 24H Low: $0.002226 * Recent Chart Low: $0.002183 * Previous Major High: $0.003151 FOGO has recovered from the $0.002183 area, but the broader descending structure has not yet been invalidated. Immediate Resistance: * $0.002667 * $0.002865 * $0.002909 Support Zones: * $0.002425 * $0.002226 * $0.002183 A sustained reclaim above $0.002667 would improve the short-term structure. However, the $0.002865–$0.002909 region remains an important supply area. # 2\. Institutional / Large Capital Picture The chart shows a sharp downside trend followed by an aggressive rebound with elevated price volatility. However, there is no verified institutional flow, exchange wallet movement, or large-holder accumulation data available in the screenshot. The important distinction is that a sharp price rebound does not automatically establish meaningful capital inflows. I would want to see sustained spot buying volume and continued acceptance above reclaimed resistance before interpreting this move as genuine demand. ## 3\. Liquidity & Range Conditions FOGO previously declined from approximately $0.003151 toward $0.002183 before attempting its current rebound. The latest candles show aggressive volatility, including long upper and lower wicks. This suggests considerable short-term price uncertainty. The $0.002425–$0.002667 region is particularly important. A narrow consolidation after a significant decline is not sufficient evidence of accumulation. Stronger spot participation is necessary to establish whether buyers can defend the newly formed support. # 4\. Derivatives Positioning – Critical Risk The provided chart does not display open interest, funding rates, or long/short positioning. Therefore, precise derivatives figures cannot be established responsibly. * Open Interest: Not available. * Funding Rate: Not available. * Long/Short Ratio: Not available. * Long Position Percentage: Not available. This matters because excessive positive funding and crowded long positioning could make the current bounce vulnerable to a downside liquidity sweep. If leverage increases aggressively while spot demand remains weak, a breakdown below support could trigger fresh long liquidations. ## 5\. Key Figures | Metric | Price / Data | | -------------------- | ------------- | | Current Price | $0.002516 | | 24H Change | +10.64% | | Immediate Resistance | $0.002667 | | Major Resistance | $0.002865 | | Upper Resistance | $0.002909 | | First Support | $0.002425 | | Major Support | $0.002226 | | Recent Low | $0.002183 | | Previous High | $0.003151 | | Open Interest | Not available | | Funding Rate | Not available | | Long Percentage | Not available | # 6\. Confirmation Levels Bullish Confirmation: A sustained reclaim above $0.002667 would be the first meaningful improvement in short-term structure. A successful move through $0.002865 could open the way toward $0.002909 and potentially $0.003151. However, resistance breaks need volume confirmation rather than isolated upward wicks. Bearish Confirmation: A breakdown below $0.002425 would weaken the current rebound structure. Further acceptance below $0.002226 would expose the recent low at $0.002183. Losing that level would increase the probability of another downside liquidity sweep. ### 7\. Final Market Outlook FOGO is showing temporary strength, but the broader market structure has n ot yet confirmed a sustainable reversal. The recent +10.64% daily move deserves attention, but aggressive volatility and overhead resistance make chasing the bounce a risky proposition. My focus remains on two things: whether spot buyers can sustain demand above $0.002667 and whether leverage remains controlled during the consolidation. The decisive signal is not another green candle. It is sustained spot buying, a confirmed resistance reclaim, and controlled derivatives positioning. Otherwise, another support breakdown could turn this bounce into a fresh liquidity event. #BlockchainSecurity #BybitAIEvolving #ByXIMPACT
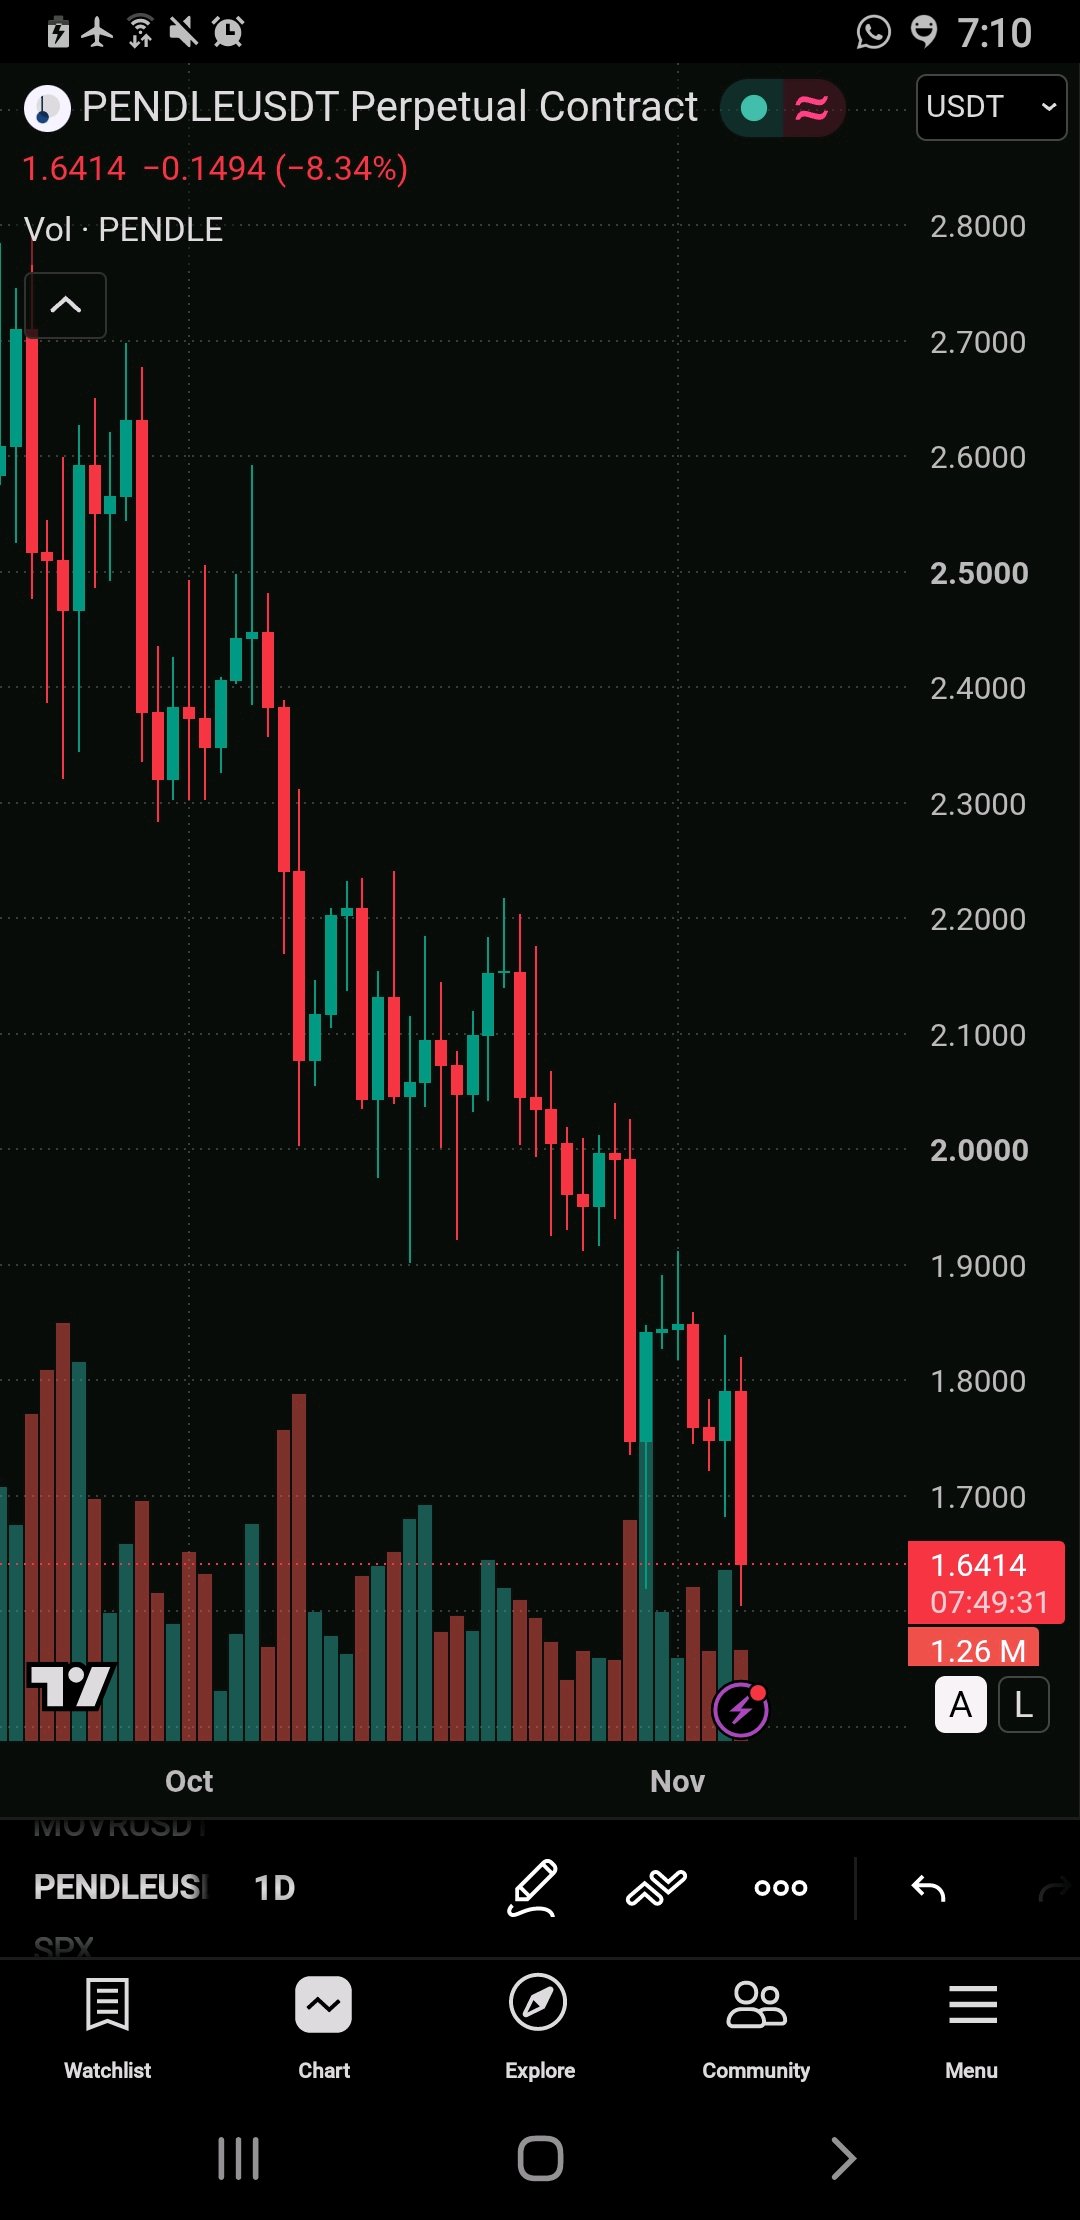
enormous recovery potential
🚀 RENDER Coin (RENDER) - Huge Recovery Potential! Will We Reach $16? 🔥 💰 Current Price: $1.614 (+0.62%) 📊 Technical Analysis: RENDER is showing consolidation near a key support zone between $1.20 and $1.60 after a prolonged downtrend. The weekly chart shows a descending trendline of resistance, while buyers attempt to establish a solid base for a move. 🎯 Potential Targets: Target 1 (TP1): $3 Target 2 (TP2): $6 Target 3 (TP3): $10 Main Target: $16 ⚠️ Key Levels to Watch: A confirmed break above $6 could significantly boost the bullish momentum. A break below support could weaken the outlook. (Reminder: This is a technical forecast for speculation and not a guaranteed target.) 👀 Do you think RENDER can make a strong comeback? $PENDLEUSDT $BTCUSDT #WSOTPicktoEarn10U #BybitAIEvolving #أمن البلوكشين
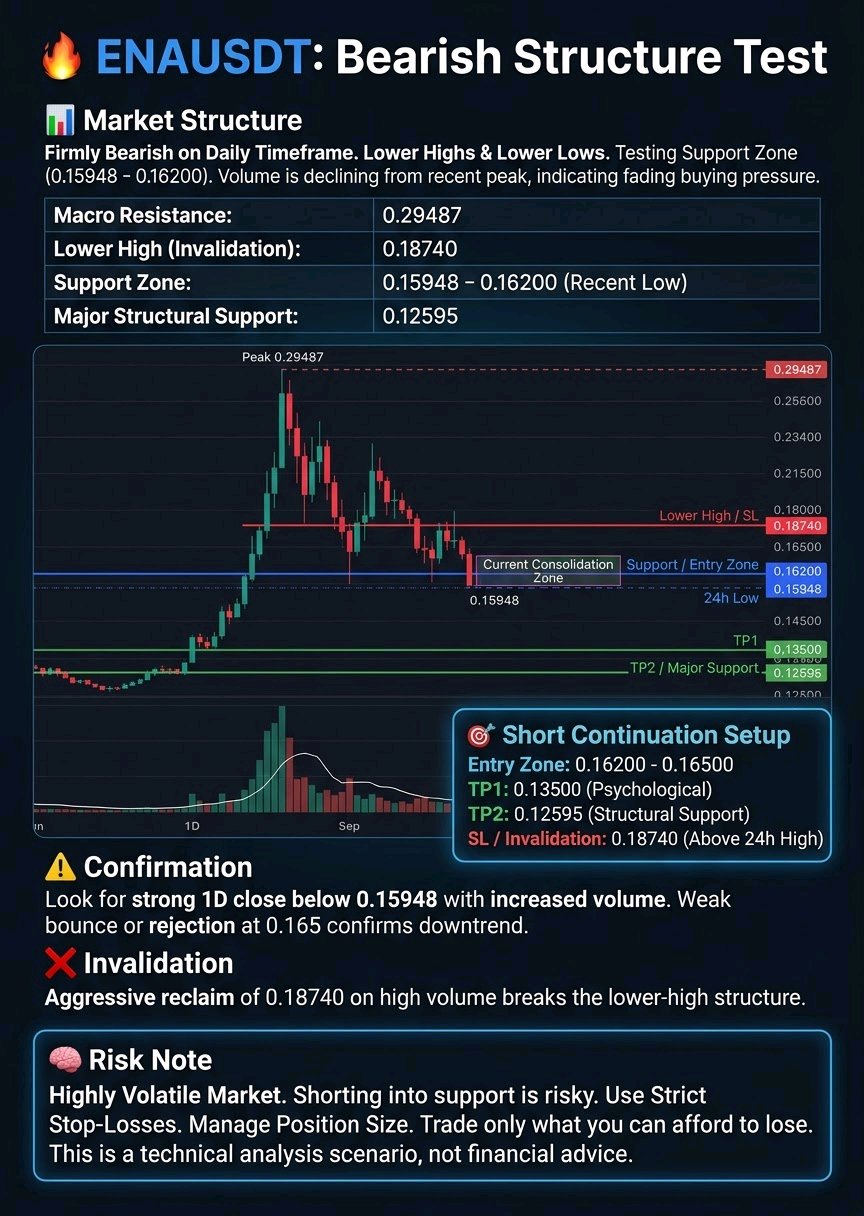
🔥 ENAUSDT: Bearish Structure Test
$ENAUSDT The daily chart for ENAUSDT shows a parabolic run followed by a steep corrective phase. After peaking near 0.29487, the asset is forming lower highs and lower lows. 📊 Market Structure: The visible trend on the 1D timeframe is firmly bearish. We are currently testing support around the 0.15948 - 0.16200 zone, which represents a recent 24h low and a potential temporary floor. Volume has notably declined from the massive spike seen during the peak, indicating fading buying pressure. The next major structural support below current levels is visible down at the 0.12595 area. On the upside, immediate resistance is found at the recent lower high around 0.18740, with the macro resistance remaining at 0.29487. 🎯 Potential Setup (Short Continuation): Note: This is a scenario based on the current visible downtrend, not a financial signal. Entry: 0.16200 - 0.16500 (Current consolidation zone) TP1: 0.13500 (Psychological and intermediate visible level) TP2: 0.12595 (Major visible structural support) SL / Invalidation: 0.18740 (Above the 24h high and recent lower high) ⚠️ Confirmation: For this bearish scenario to play out, we would want to see a strong 1D candle close below the 0.15948 support level, accompanied by an increase in downward volume. A weak bounce or rejection at the 0.165 area would further validate the downtrend. ❌ Invalidation: If the price aggressively reclaims the 0.18740 level on high volume, it would break the current market structure of lower highs and indicate a potential trend reversal or deeper retracement upward. 🧠 Risk Note: The crypto market is highly volatile, and shorting into strong support can be risky. Always use strict stop-losses, manage your position size according to your risk tolerance, and never trade more than you can afford to lose. #IMPACTbyTrade $BTCUSDT #BlockchainSecurity #BybitAIEvolving
BTC latest update
$BTCUSDT BITCOIN (BTC) LATEST MARKET ANALYSIS – NOVEMBER 5, 2026 Bitcoin is showing signs of recovery after bouncing back above the $80,000 psychological level. The short-term technical outlook is bullish, but BTC needs a confirmed breakout to continue its upward momentum. 📊 KEY MARKET LEVELS 🟢 Current reference price: $80,400 🟢 Support 1: $79,746 🟢 Support 2: $77,820 🔴 Resistance 1: $81,128 🔴 Resistance 2: $82,218 🔴 Major resistance: $83,582 📈 TECHNICAL ANALYSIS • Daily RSI: 50.2 (neutral momentum) • 4H trend: Bullish bias • Daily trend: Bullish bias • Weekly trend: Bullish bias BULLISH SCENARIO 🚀 If BTC breaks and holds above $81,128, the next targets could be $82,218 and $83,582. BEARISH SCENARIO ⚠️ If BTC loses $79,746, selling pressure could increase toward $77,820 and potentially $75,253. 🎯 MY MARKET VIEW Bitcoin is showing recovery potential, but confirmation above resistance is important. Avoid chasing breakouts without volume confirmation. What do you think? 🚀 BTC to $85K or correction toward $77K? #BybitAIEvolving #BlockchainSecurity #AnthropicIPOTestsTheAIBoom #MidtermsMarketWatch #Bitcoin #BTC #CryptoAnalysis #BinanceSquare #BitcoinTrading #CryptoMarket
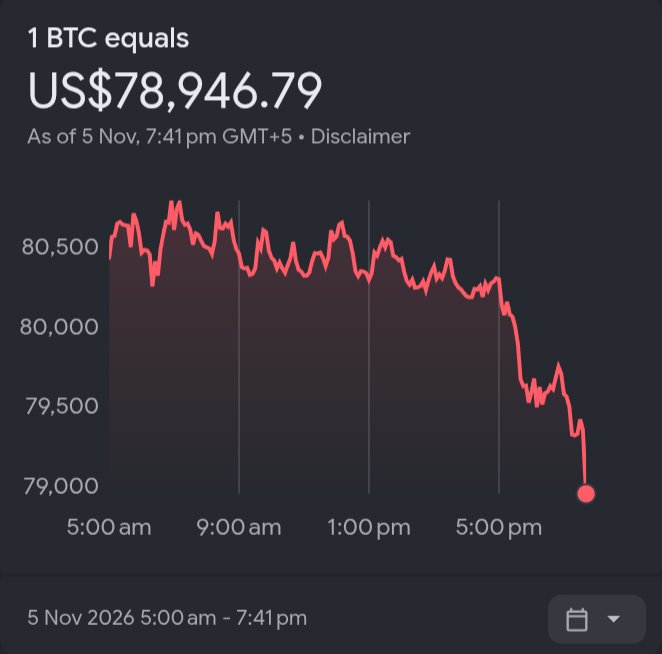
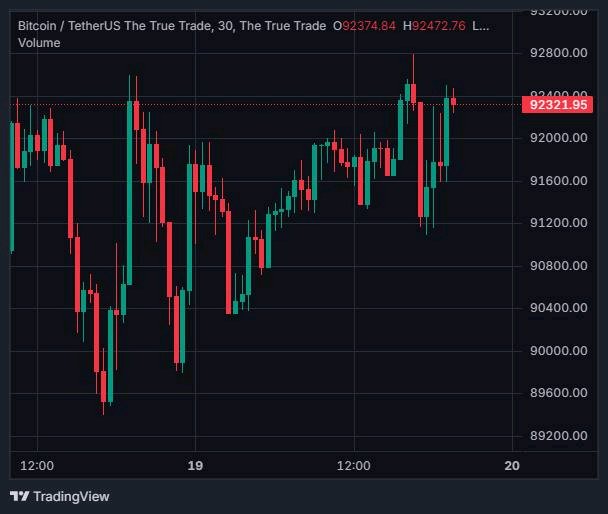
$ETHUSDT USDT – ТҰРАҚТЫ КӨЛЕМ ҚАЙТА ОРАЛДЫ, МЕН 2410 АРҚЫЛЫ 2450+ ДЕҢГЕЙІНЕ ҚАРАЙ ИТЕРМЕЛЕНУДІ БАҚЫЛАП ОТЫРМЫН** Ethereum бүгін айқын салыстырмалы күш көрсетіп отыр. Биткоин 79,6 мың – 80 мың доллар айналасында қарапайым өсіммен тұрса, ETH күніне шамамен 3%-ға өсіп, 2 387 – 2 395 доллар маңында саудалануда. Кеңірек нарық «тәуекелге дайын» (risk-on) режимінде, бірақ ETH ірі капиталдандырылған активтер арасында қозғалысты бастап тұр. Мен мұнда күнделікті және 4 сағаттық (4H) құрылымды мұқият бақылап отырмын. Баға қазіргі уақытта 2 410 – 2 411 доллар маңындағы күнделікті EMA50 көрсеткішінен сәл төмен деңгейде тұр. Ол EMA20 аймағын қайтарып алды және бірнеше рет тексерілген 2 300 доллардың орта тұсындағы қолдау белдеуінен жоғары тұр. 24 сағаттық диапазон шамамен 2 310 – 2 450 доллар аралығында болды, сондықтан біз лайықты қалпына келтіруден кейін осы диапазонның жоғарғы жартысындамыз. ### Көлемді талдау 24 сағаттық сауда көлемі шамамен 15 миллиард долларды құрайды. Бұл ETH үшін сау қатысу көрсеткіші және төмен сенімділікпен жай ғана секіру емес, жоғары қарай қозғалысты қолдайды. Мұндай «жасыл» күндері көлем ұлғайып, баға соңғы сұраныс аймағынан жоғары болса, бұл әдетте ірі ойыншылардың жай ғана қысқа позицияларды жабуға емес, қозғалыстың жалғасуына әлі де мүдделі екенін білдіреді. Мен бұл көлемді жақын арадағы бұқалар сценарийі үшін конструктивті деп есептеймін. ### Менің сауда жоспарым Мен бұған нақты деңгейлері бар ықтимал жалғасу орнатуы ретінде қарап отырмын: - **Бастапқы кіру аймағы**: $2 380 – $2 395 Баға әлі де EMA50-ден төмен болса да, соңғы қалпына келтіру құрылымын сақтап тұрған кезде, мен осы жерден позиция жинауды бастауға дайынмын. - **Қолайлы DCA деңгейі**: $2 350 – $2 360 Бұл бірнеше рет жанасу болған күнделікті консолидация аймағының төменгі жиегі. Осы аймаққа бақыланатын кері шегініс (pullback) құрылымды бұзбай, орташа бағаны жақсартады. - **Бірінші қарсылық**: $2 410 – $2 415 Күнделікті EMA50. Осы деңгейден жоғары таза жабылу және ұстап тұру сатып алушылардың қайтадан бақылауды қолға алғанының алғашқы нақты растауы болады. - **Негізгі мақсат**: $2 445 – $2 450 Соңғы 24 сағаттық максимум және айқын көлденең деңгей. Бұл жерде мен алғашқы нақты ұсыныстың (supply) пайда болуын күтемін. - **Қосымша өсу әлеуеті**: $2 480 – $2 530 Егер импульс жалғасып, 2450 деңгейінен өткеннен кейін көлем жоғары болып қалса, бұл аймақ өлшенген қозғалыс кезінде шынайы болады. Мен кез келген күндізгі төмендеулерде бағаның 2 370 – 2 380 доллардан жоғары болуын және орнатудың таза болуы үшін күннің EMA50-ден жоғары жабылғанын қалаймын. ### Не дұрыс болмауы мүмкін? EMA50 деңгейіндегі шұғыл бас тарту (rejection) және кейін 2 360 доллардан төмен түсу қысқа мерзімді бұқалар сценарийін әлсіретіп, 2 310 – 2 320 доллар сұраныс аймағын тереңірек қайта тексеруге жол ашады. Егер бұл деңгей өсіп жатқан көлеммен бұзылса, келесі құрылымдық қолдау төменірек 2 250 – 2 300 доллар аймағында орналасқан. Мен сондай-ақ BTC-ді мұқият бақылап отырмын — Биткоиндегі кез келген кенеттен тәуекелден қашу (risk-off) қозғалысы оның салыстырмалы күшіне қарамастан ETH-ті төмендетуі мүмкін. Егер біз күнделікті жабылуда сату көлемінің артуымен 2 350 доллар аймағын жоғалтсақ, бұл орнату тартымдылығын жоғалтады. ### Менің көзқарасым ETH дәл қазір қызықты, себебі ол BTC-ге қатысты салыстырмалы күш көрсетіп отыр, ал көлем тұрақты болып қалуда және күнделікті құрылым өзін-өзі қалпына келтіруге тырысуда. Біз әлі таза серпіліс (breakout) жасаған жоқпыз — баға әлі де EMA50 деңгейінен өтіп, оны ұстап тұруы керек — бірақ 2 310 долларлық минимумнан қалпына келтіру ретті болды және қатысушылар тарапынан қолдау тапты. Егер сатып алушылар ағымдағы аймақты қорғап, 2410 деңгейінен көлеммен өте алса, мен келесі бірнеше сессияда қозғалыстың жалғасуына бейіммін. 2350-ден төмен қайта сырғу мені сақ болуға мәжбүр етеді және жақсырақ құрылымды күтуге итермелейді. Әзірге мен EMA50 реакциясын және көлемді мұқият бақылаймын. Бұл конструктивті аймақ, бірақ ол әлі де растауды қажет етеді. #Блокчейн қауіпсіздігі #WSOT2026 #Аралық сайлаулар нарығының шолуы
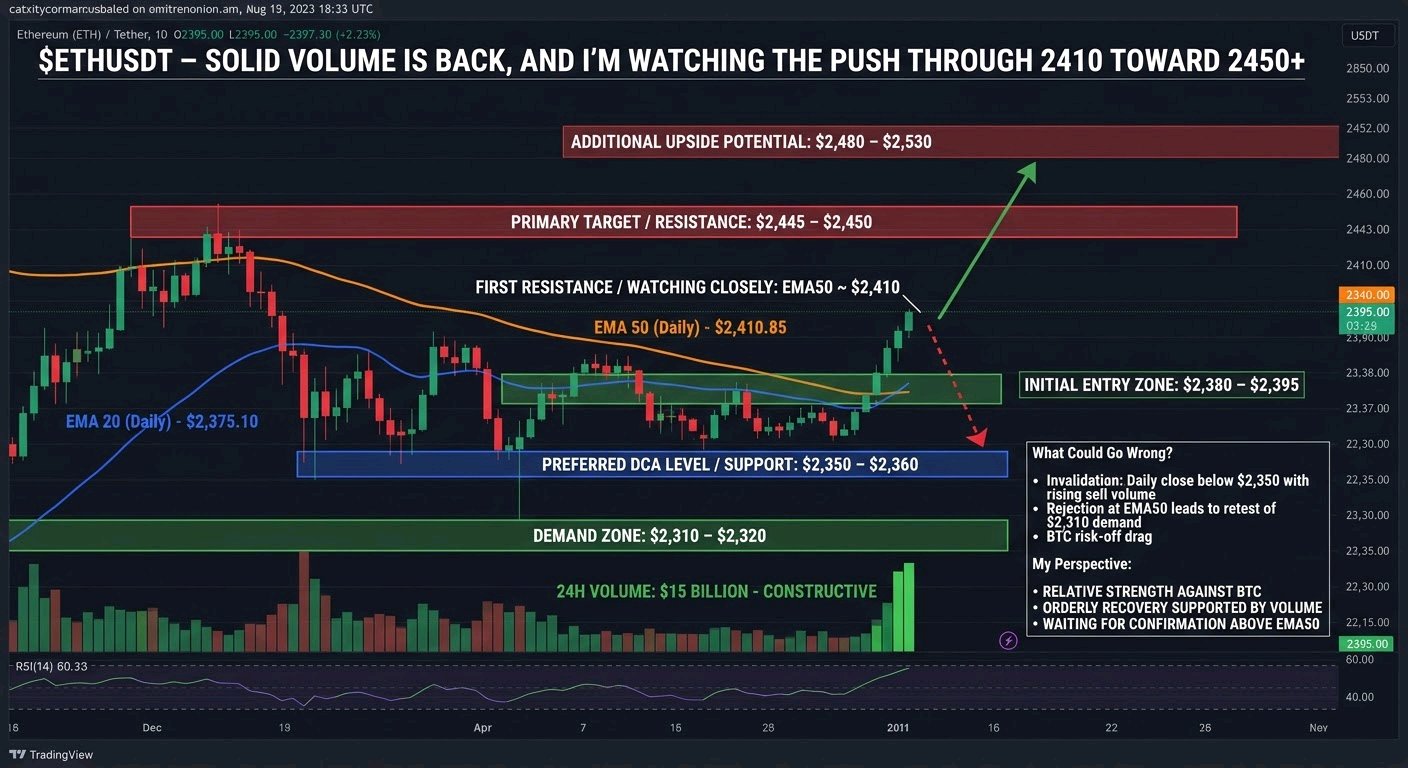
$TRUMPUSDT 1.241 бағасымен саудаланып жатыр, соңғы 24 сағатта 13.34%-ға төмендеді, 24 сағаттық ең жоғарғы көрсеткіші 1.467, ал ең төменгісі 1.211. Сауда көлемі 14.79 млн. 1.467-дегі жоғарғы көрсеткіш ағымдағы бағадан әлдеқайда жоғары, бұл сатушылардың сессия барысын бақылауда ұстағанын көрсетеді. 15 минуттық графикте ең соңғы құлдырау бір өткір төменгі қозғалыспен болды. Сессияның ортасында 1.25 пен 1.27 аймағында ауытқып тұрған баға, экрандағы ең үлкен көлем бағандарының бірімен қолдау тауып, үлкен қызыл шаммен күрт төмендеді. Бұл құлдырау оны сатып алушылар араласқанға дейін 1.211-ге дейін итермеледі. Ең төменгі нүктеден кейін не болғаны қызықтырақ. 1.211 шамы ұзын төменгі білте қалдырды, ал келесі бірнеше шам бағаны 1.23-тен жоғары қайтарған күшті жасыл денелер болды. Бұл сатушылардың шаршауынан туындаған реакциялық өрлеу сияқты, нақты қайта өрлеу емес. Соңғы шам кішкентай жоғарғы білтесі бар қызыл түсті, сондықтан қалпына келу процесінде кідіріс байқалады. Құрылымдық тұрғыдан баға шамамен 1.25 пен 1.29 аралығындағы құбылмалы диапазоннан құлдырауға және V-тәрізді өрлеуге ауысты. Ол тұрақтануға тырысуда, бірақ әзірге ештеңе қалпына келтірілген жоқ. Көрініп тұрған индикаторлар бойынша MA7 1.232-де, MA14 1.245-те және MA28 1.255-те тұр. Баға MA7-ден жоғары, бірақ әлі де MA14 пен MA28-ден төмен және олардың екеуі де төмен қарай еңкейген. Бұл қысқа мерзімді төмендеу трендінің ішіндегі қалпына келу құрылымы. Сауда көлемі мұны растайды: ағымдағы баған MA5 57.83K және MA10 84.54K-ға қарсы 12.17K-ны көрсетеді, сондықтан өрлеу әлсіреген қатысумен жүріп жатыр. Төмен көлемдегі қалпына келу созылуы мүмкін, бірақ сенімді болу үшін көлемнің артуы қажет. Қолдау 1.231 мен 1.232 аймағында басталады, мұнда MA7 және бірінші кері қайту аймағы орналасқан. Одан төмен, 1.211 негізгі деңгей болып табылады, өйткені бұл 15 минуттық және 24 сағаттық ең төменгі көрсеткіш. Егер баға сол жерде тұрақтаса, бұл таза қос түпті (double-bottom) база жасар еді. Одан төмен құлдырау бағаны бұрынғы құрылымсыз төмен қарай жаңа деңгейлерді іздеуге әкеледі. Жедел қарсылық – ағымдағы бағадан сәл жоғары тұрған, 1.245-ке жуық MA14 деңгейі. Одан кейін 1.255-ке жуық MA28 деңгейі, құлдырауға дейін қолдау ретінде әрекет еткен және қазір қарсылыққа айналуы мүмкін 1.252-1.255 аймағымен сәйкес келеді. Одан жоғарырақ 1.272 және 1.293-тегі шыңдар келесі маңызды шектер болып табылады, ал 1.30 – психологиялық дөңгелек сан. Өсу сценарийі үшін сатып алушыларға MA7-ден жоғары тұру, 1.245-тен өту және ең дұрысы сауда көлемінің артуымен MA28-ден жоғары шамды жабу қажет. Бұл қысқа мерзімді орташа көрсеткіштерді тегістеп, 1.272 және 1.293-ті ойынға қосар еді. Төмендеу сценарийі үшін MA14 немесе MA28-дегі кері қайтару және одан кейін 1.231-дің жоғалуы бұл өрлеудің жай ғана жеңілдету қозғалысы болғанын білдіреді. Бұл 1.211-ді қайтадан қысымға ұшыратар еді, ал деңгейді екінші рет сынау әдетте біріншісіне қарағанда нашаррақ нәтиже береді. Негізгі баға деңгейлері: - Қарсылық: 1.245 (MA14), 1.255 (MA28), 1.272, 1.293 - Қолдау: 1.232 (MA7), 1.231, 1.211 (24 сағаттық ең төменгі баға) - 24 сағаттық диапазон: 1.211-ден 1.467-ге дейін Жалпы алғанда, TRUMP шешім қабылдау аймағының ортасында тұр. Сатылым әзірге жұтылды, бірақ өрлеу көлемі жеткіліксіз және жоғарыдағы жылжымалы орташаларды қалпына келтірген жоқ. Келесі кеңею 1.255-тен жоғары көлеммен қолдау тапқан серпілістен немесе 1.211-дің жоғалуынан туындайды. Қалпына келуге тым қатты қуанбас бұрын MA14 айналасындағы бағаның мінез-құлқын бақылаңыз және мұның бәрін бағыттың кепілдігі емес, құрылымды оқу деп қабылдаңыз. График туралы ескертпе: бұл 1 сағаттық емес, 15 минуттық уақыт аралығында және тек MA7/14/28 және MA5/MA10 бар көлемді көрсетеді. Экранда EMA200, RSI, MACD немесе Фибоначчи жоқ, сондықтан мен оларды ойлап таппай, қалдырып кеттім. Егер сіз сол индикаторлары бар 1 сағаттық скриншотты немесе LITUSDT анықтамалық жазбасын жіберсеңіз, мен стилі мен тереңдігін дәлірек сәйкестендіре аламын. #Блокчейн қауіпсіздігі #Аралық сайлаулар нарығының шолуы $BTCUSDT
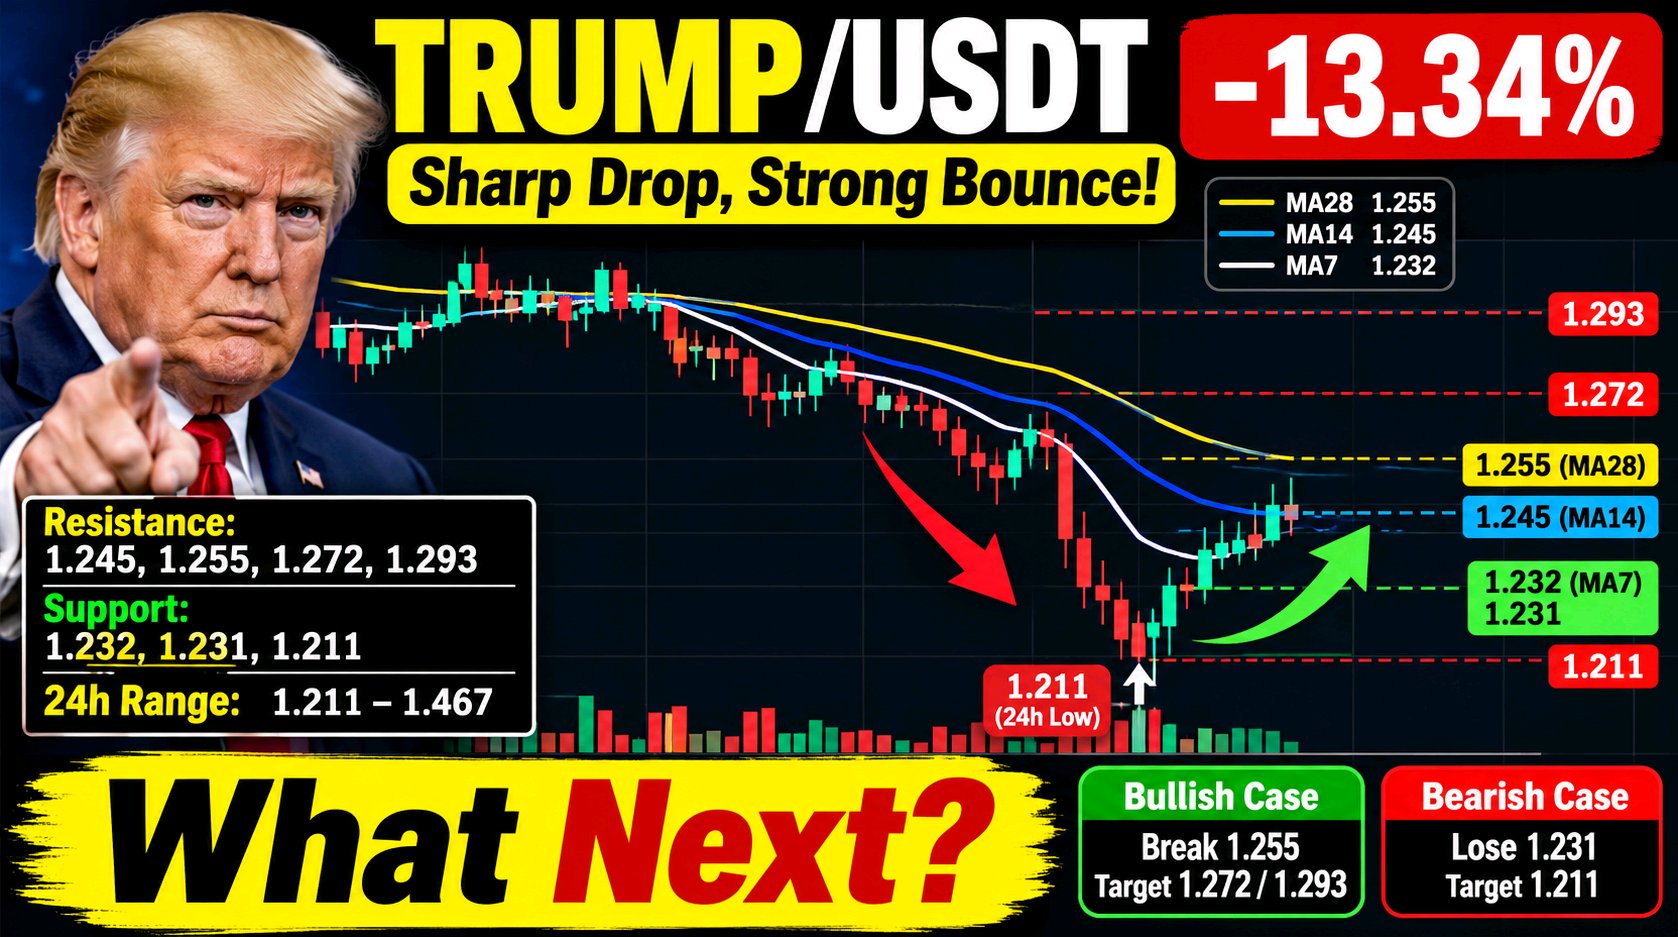
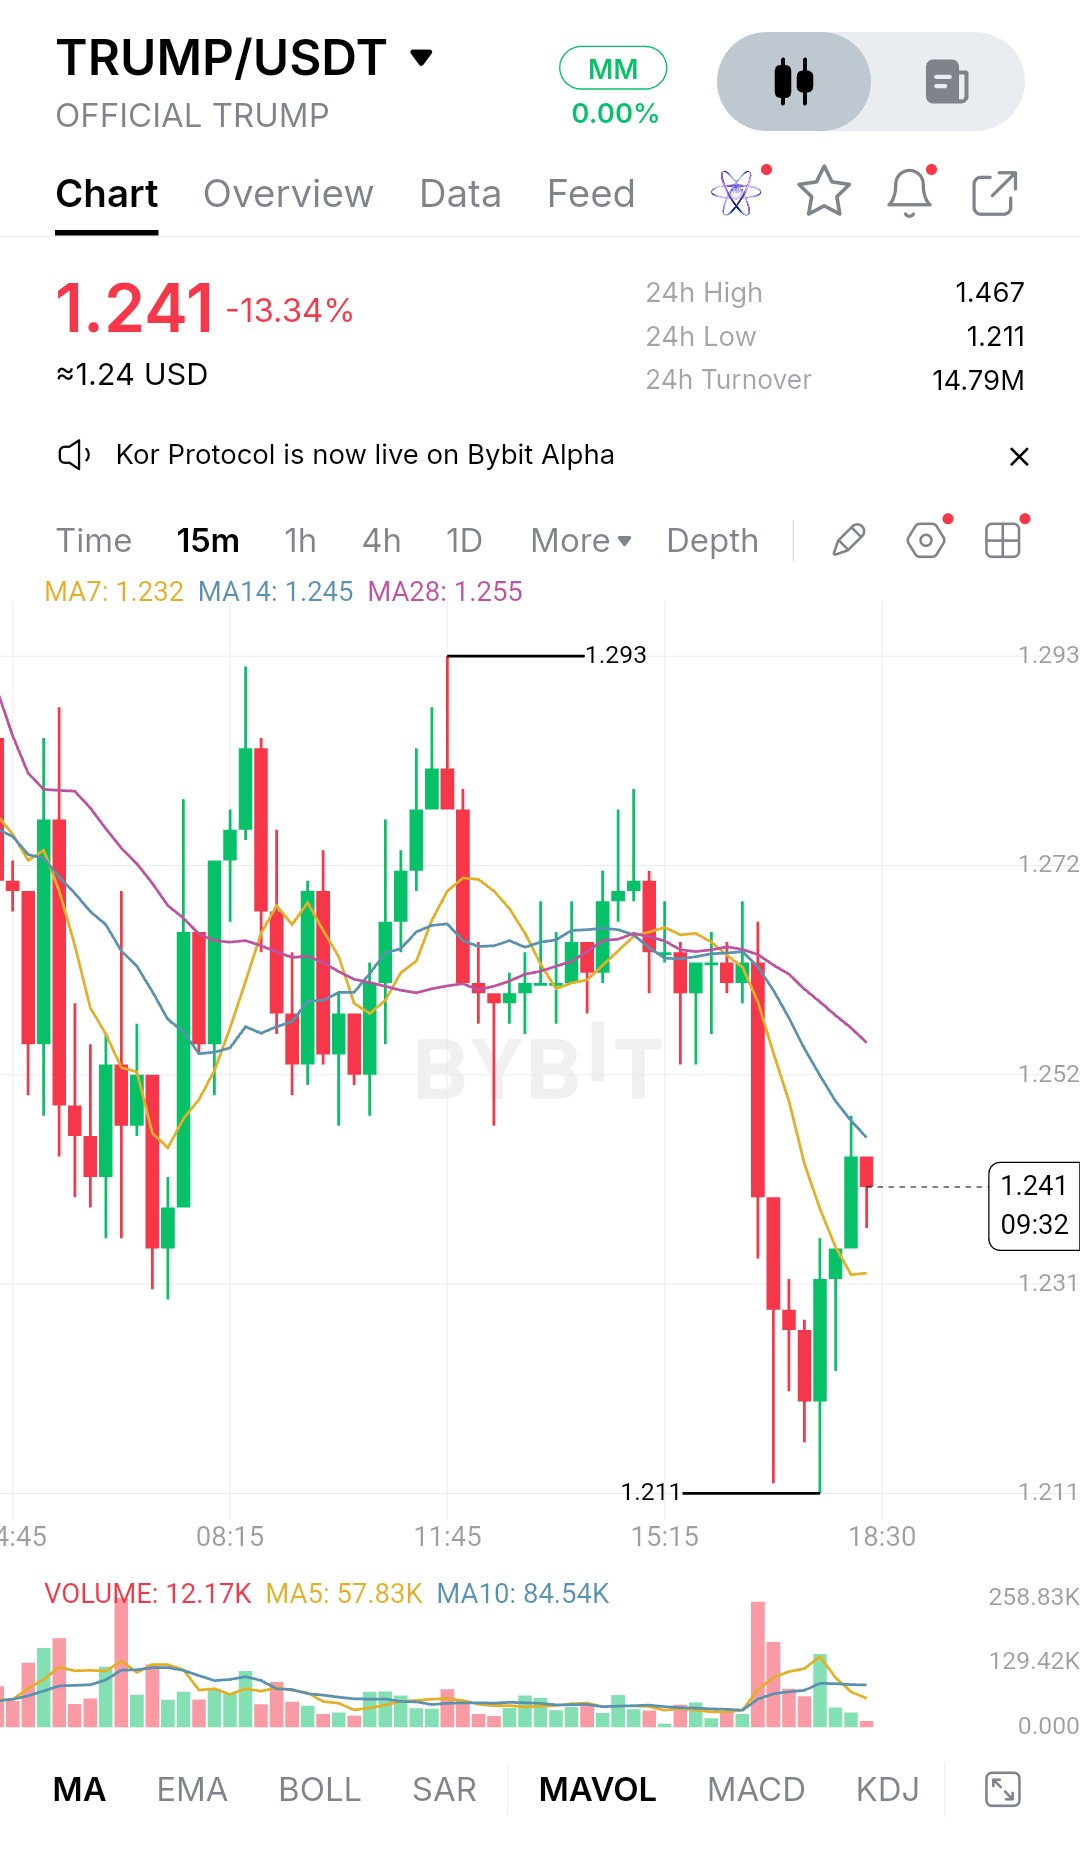

🚀 BITTENSOR (TAO) – ӨСУ ТРЕНДІНЕ КЕРІ ҚАЙТУДЫҢ ЗОР ӘЛЕУЕТІ! $800 НЫСАНАДА МА? 🔥 💰 Ағымдағы баға: $223.30 (-0.04%) 📊 Техникалық талдау: TAO $150–$220 айналасындағы негізгі апталық сұраныс аймағына жақындап келеді. Графикте ұзақ төмендеу тренд сызығы көрінеді, ал сатып алушылар бұл қолдау аймағын қорғауға тырысуда. 🎯 Ықтимал мақсаттар: - TP1: $300 - TP2: $400 - TP3: $600 - Негізгі мақсат: $800 ⚠️ $300-ден жоғары серпіліс өсу импульсін күшейтуі мүмкін. $150 қолдау аймағының жоғалуы бұл болжамды жарамсыз ете алады. $800 мақсаты – ұзақ мерзімді график болжамы, бұл кепілдік емес. 👀 TAO қуатты қайтарылым жасай ала ма? #Блокчейн қауіпсіздігі $ETCUSDT $BTCUSDT