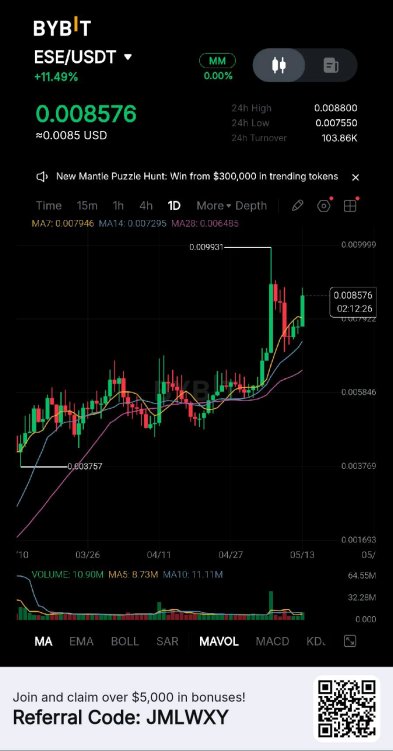

📊 $ESEUSDT Technical Analysis — Bullish Momentum Building 🚀
$ESE is showing a strong bullish structure on the daily timeframe after breaking out from the long consolidation range near 0.0050 – 0.0060. Buyers stepped in aggressively, pushing price toward the recent high around 0.0099.
🔥 Why ESE Looks Bullish
Price trading above MA7, MA14, and MA28
Strong breakout candle followed by healthy consolidation
Higher highs and higher lows confirm trend continuation
Volume expansion signals increasing buyer interest
Bulls quickly bought the dip after recent pullback
📈 Key Technical Levels
Immediate Support: 0.0078 – 0.0080
Strong Support Zone: 0.0072
Resistance: 0.0099
Breakout Target: 0.0110 – 0.0120
⚡ Bullish Scenario If ESE breaks above 0.0099 with strong volume confirmation, the chart could enter another impulsive rally phase targeting higher resistance zones quickly.
📉 Risk to Watch A drop below 0.0072 may weaken short-term momentum and trigger consolidation before the next move.
💡 Market Structure The current setup still favors bulls. The recent pullback appears more like a healthy retest rather than a bearish reversal. Momentum remains positive while price stays above the key moving averages.
🚀 Conclusion ESE remains bullish on the daily timeframe with breakout continuation potential. Traders are likely watching for a confirmed move above resistance to fuel the next leg higher.
#ByXMayPostingLeaderboard #RealWorldAssets $80K #BTC Predict & Earn Challenge #WhatNextForUSIranConflict
5/14/2026, 5:50:26 AM
Comments
No comments yet.
 3
3 0
0Open in Bybit App