WSOT2026
Since its launch in 2020, WSOT (WORLD SERIES OF TRADING) has evolved from a crypto trading competition into Bybit's flagship global trading IP. Over the years, it has expanded beyond individual and squad-based trading to include tiered leagues, Copy Trading, Web3 and DEX participation, regional competitions, preheat campaigns and educational initiatives. Building on this foundation, WSOT 2026 should represent the next evolution — not simply a larger competition, but a broader growth platform. By introducing RWA and stocks as key trading assets,AI trading competition, and connecting KOL, VIP, partnership and referral activation with the Main Arena, WSOT 2026 can engage a wider audience and convert global attention into sustained user growth, trading activity and product adoption.

BTC
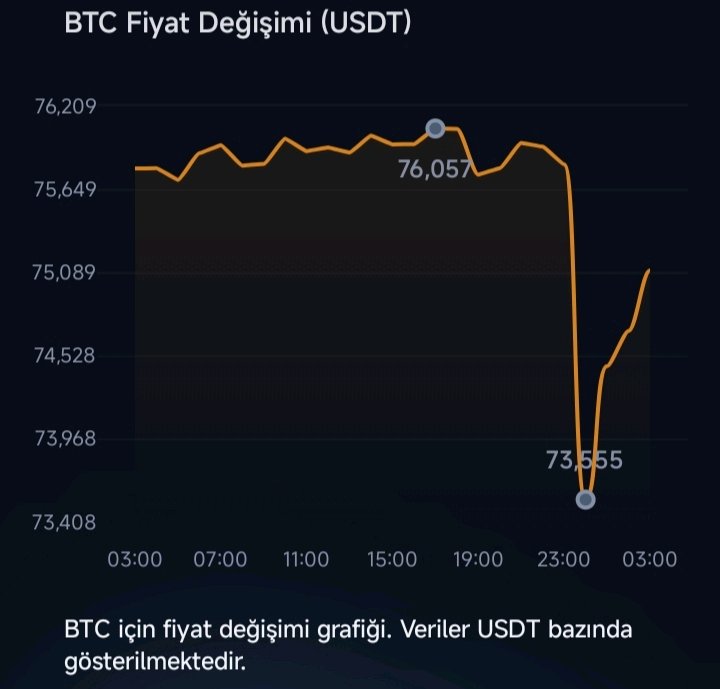
BTC/USDT weekly opening was at 75,100 USDT on November 9, 2026; a peak of 75,582 USDT was seen during the week, and after testing a low of 62,093 USDT on November 15, 2026, it closed around 65,028 USDT as of November 16, 2026 (weekly change -13.41%). The outlook for this week is short-term negative; approximately 1.9 billion USD outflows from spot ETFs, liquidations exceeding 2 billion USD in 24 hours in leveraged markets, the shrinking stablecoin supply, and rising interest rate expectations due to US inflation data are pressure factors. While sentiment is in the 'extreme fear' zone and the risk of a 'bull trap' in the 63,000–65,000 USDT band stands out, it is stated that recovery is sensitive to ETF flows. The most critical level is the 60,000 USDT support; if selling pressure continues, the risk of this region breaking remains on the agenda, while in the event of improving flows, a bounce toward 67,500 USDT is possible. #ByXimpact #WSOT2026 #WSOTShowYourAITradeToEarn10USDT $BTCUSDT

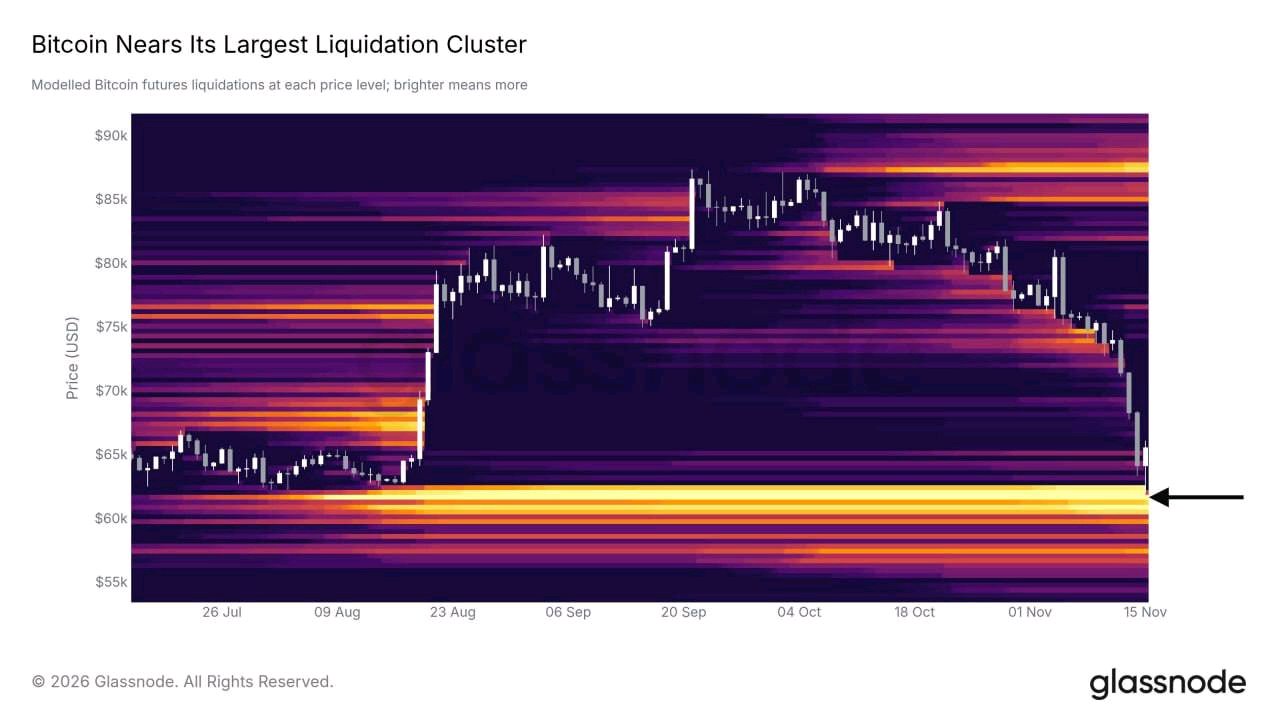
📉 BTC Market Update Bitcoin has entered the upper end of the major pain zone, briefly touching the largest liquidity cluster between $60K–$63K. This is a critical area to watch, as the market could see significant volatility around these levels. 📊 All eyes on whether buyers can defend this zone and trigger a relief bounce. #WSOT2026 #MyByXTake

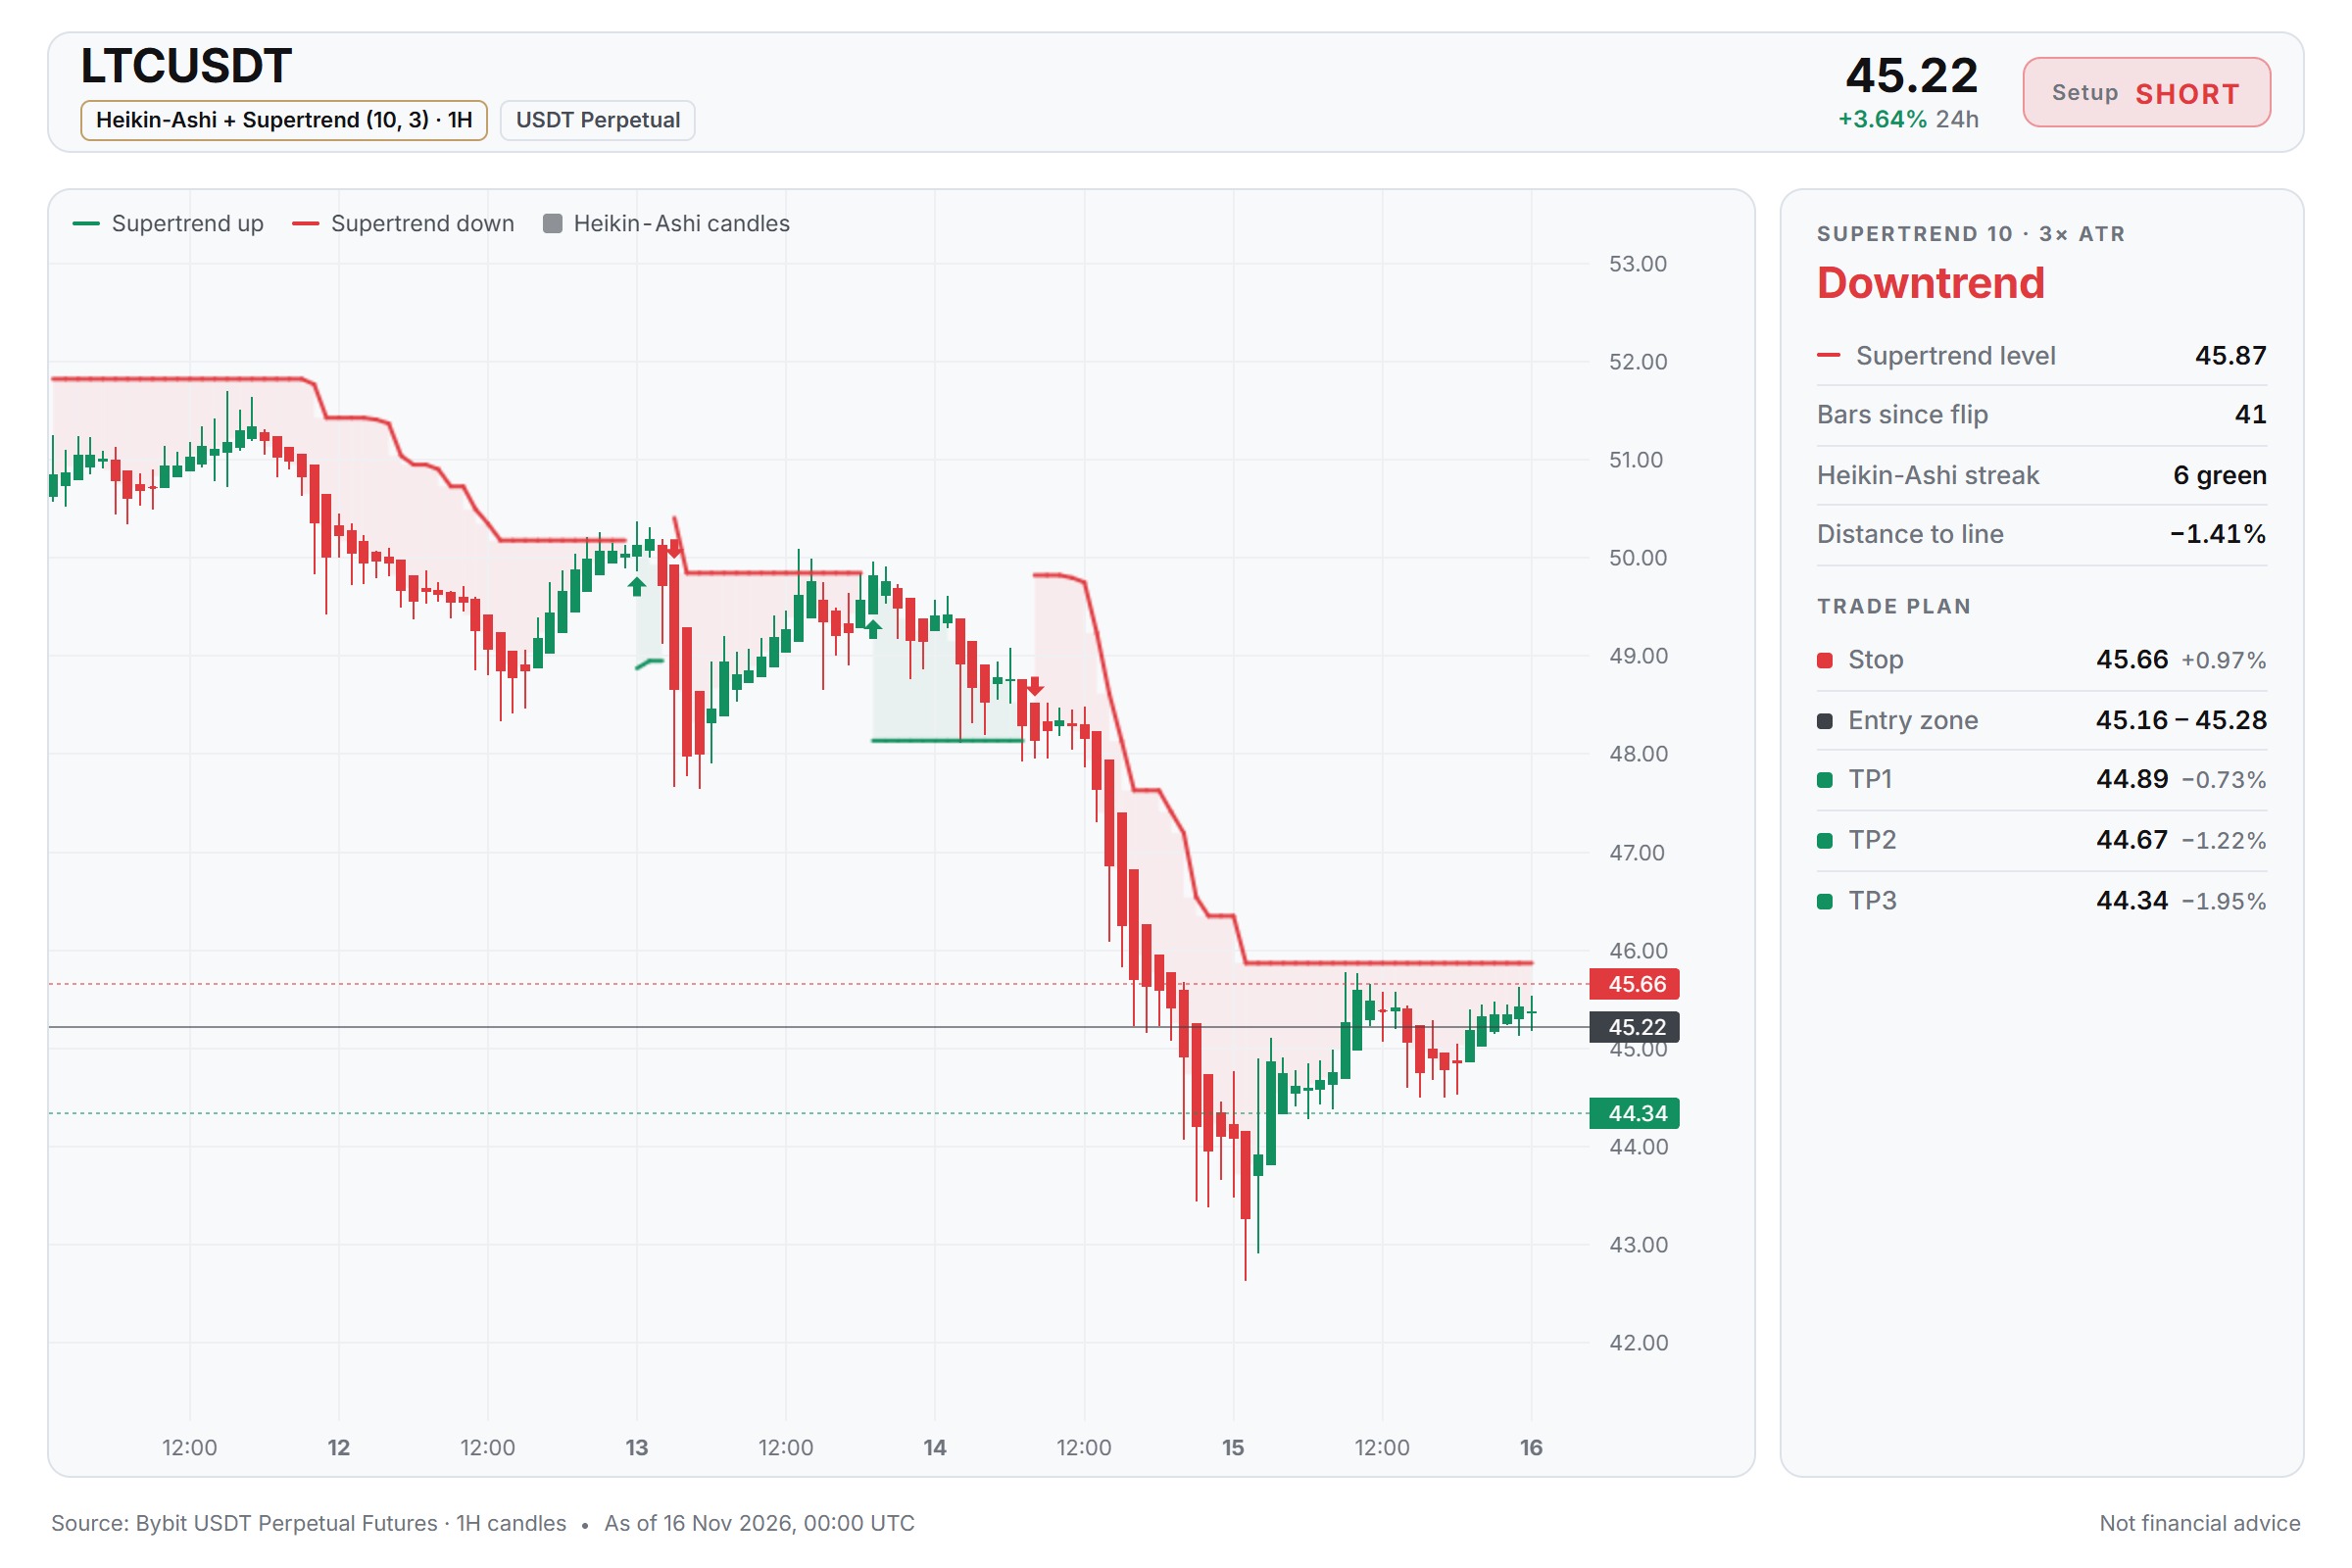
LTC Under Pressure as BTC Holds Steady
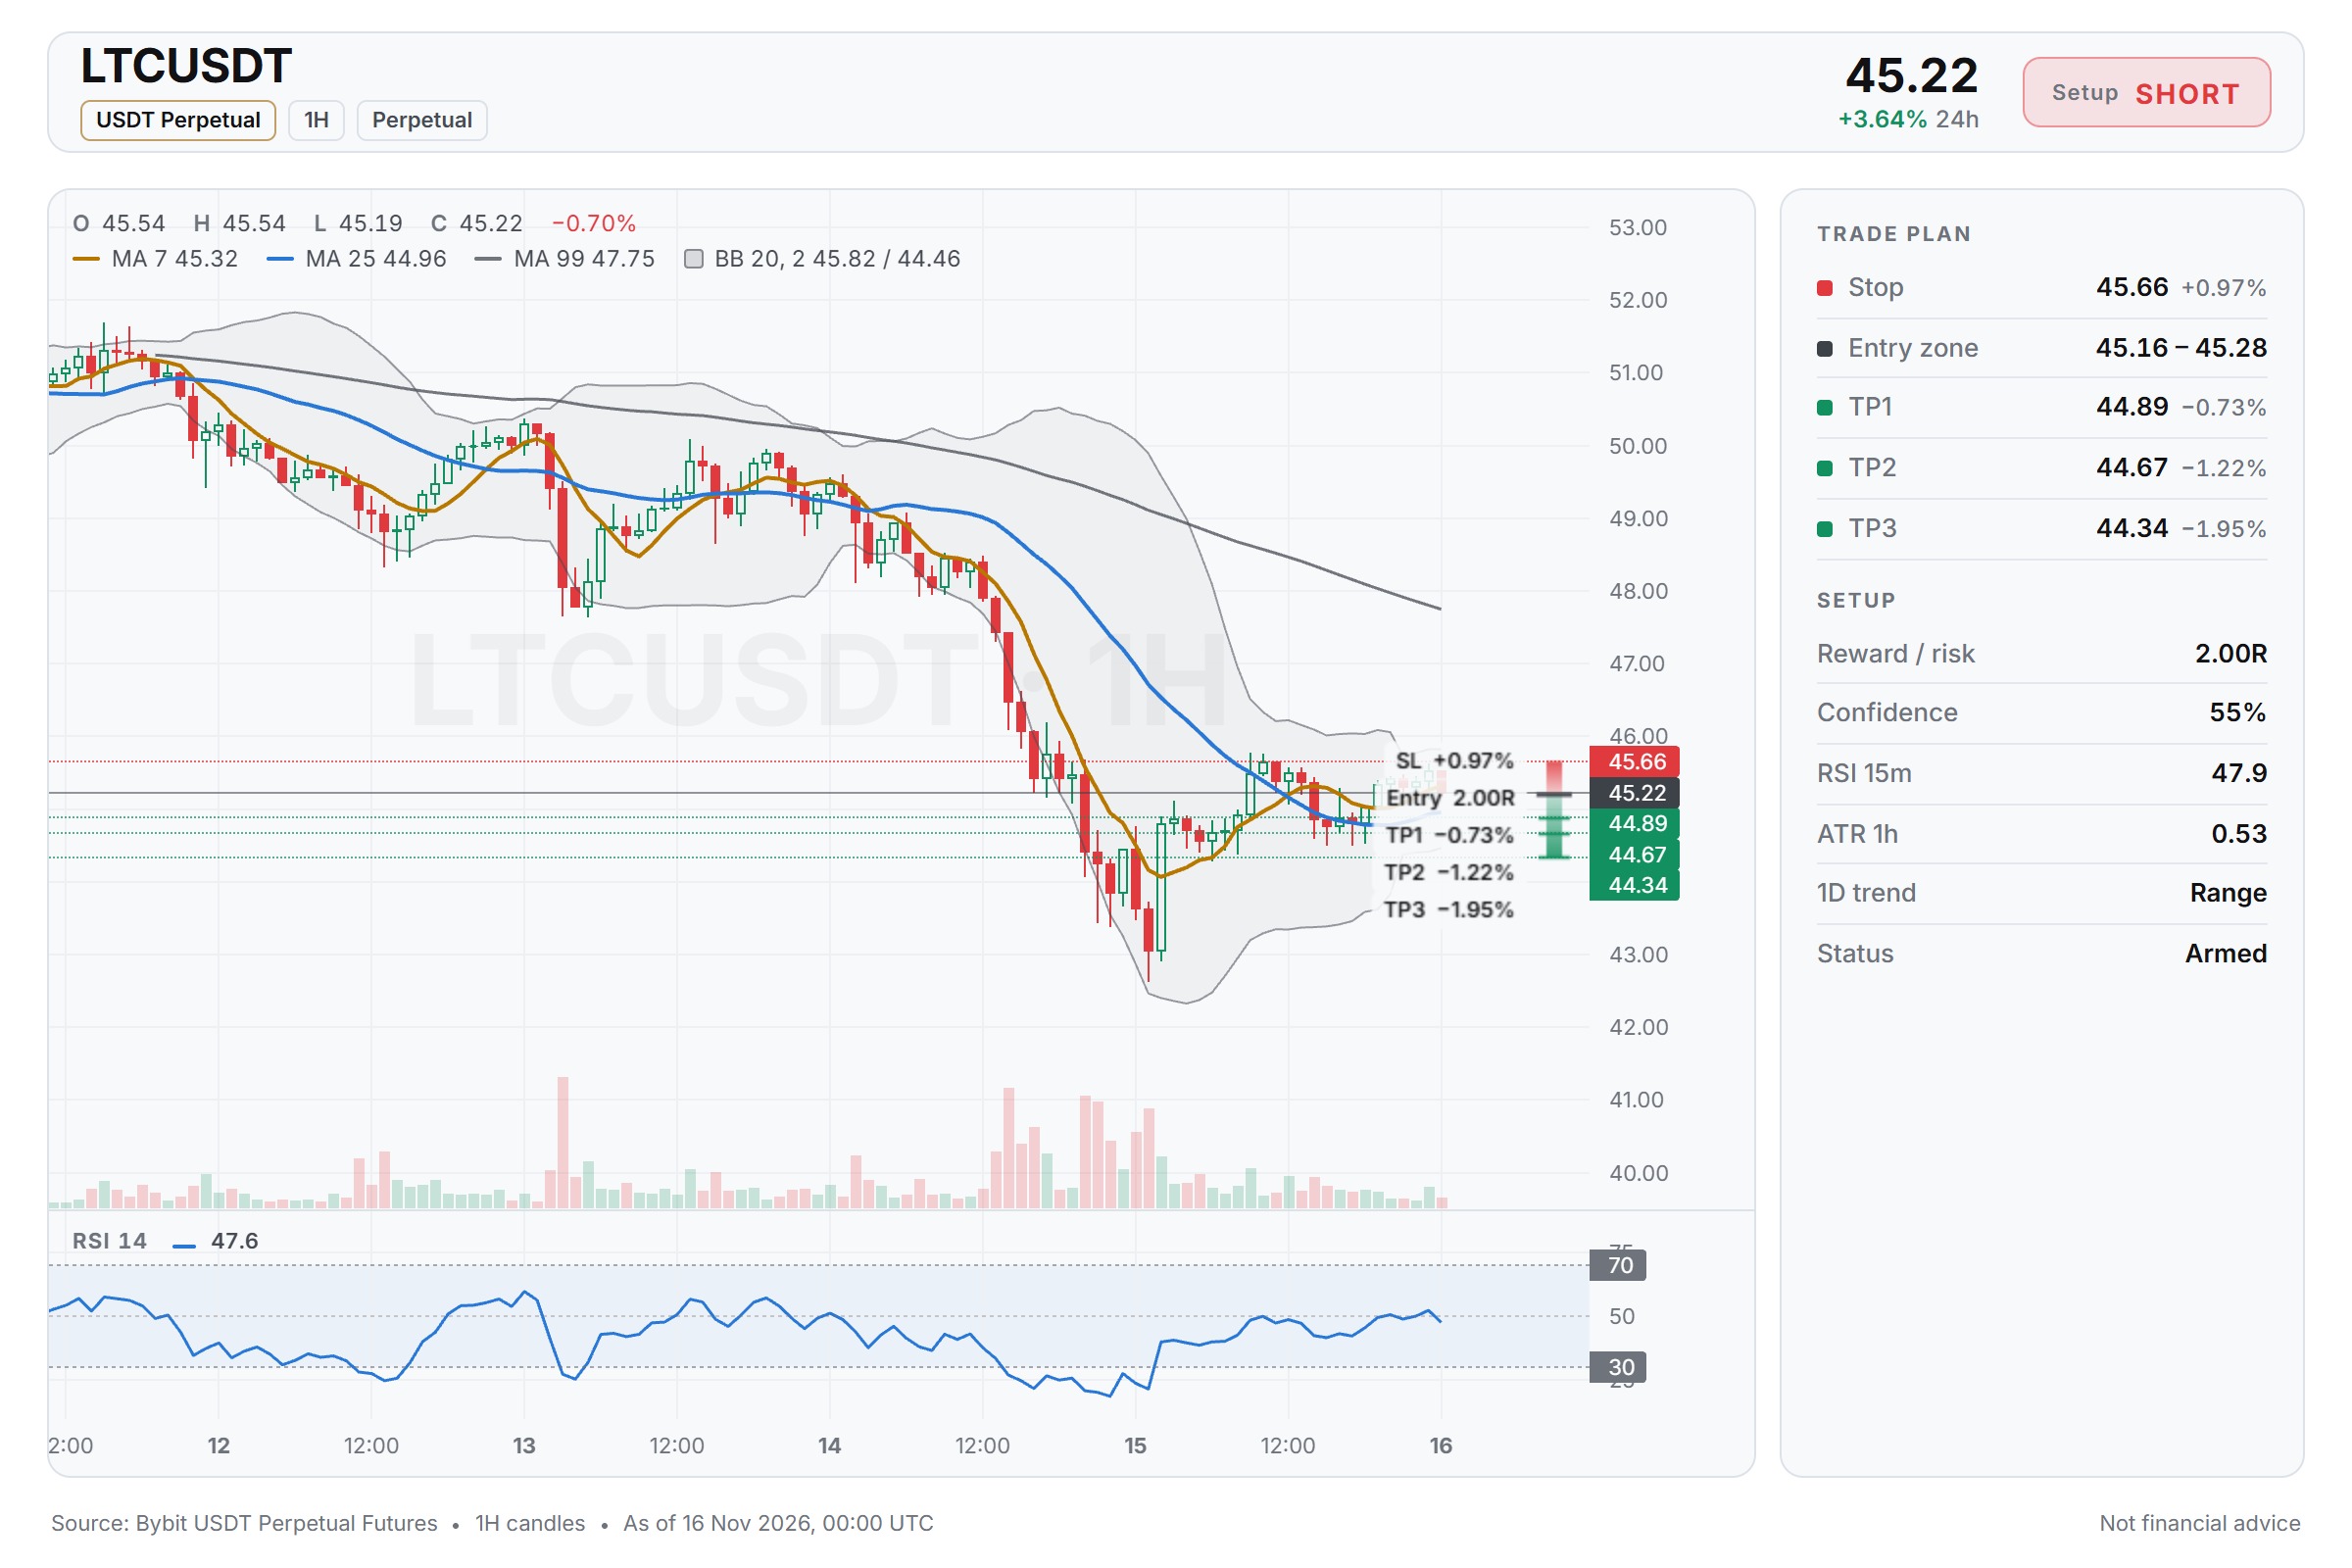
$LTC/USDT — SHORT Entry: 45.16 - 45.28 SL: 45.66 TP1: 44.89 TP2: 44.67 TP3: 44.34 I am watching $LTC/USDT closely because the 15m RSI sits near 48, suggesting room for further downside. With BTC trend neutral, a short entry around 45.16 to 45.28 offers a clean setup. My SL rests at 45.66, with TP2 at 44.67 and TP3 at 44.34. Do you think LTC will push toward 44.34 or is a retest of 45.66 more likely first? ⚠️ Personal market analysis only. NFA — manage risk and DYOR. Educational content, not investment advice or a recommendation to buy, sell, deposit, or withdraw any asset. No paid promotion or referral/affiliate links.$LTCUSDT#WSOT2026 #WSOTShowYourAITradeToEarn10USDT

Market Crash? These 8 Coins Are on My SPOT Accumulation Watchlist When the market turns red, I don't think the best move is to panic or chase random pumps... I'd rather keep a watchlist ready and look for opportunities to accumulate quality projects at better prices. Here are the 8 coins I'm keeping on my radar: 1. $BTCUSDT – Bitcoin: $65,123 2. $ETHUSDT – Ethereum: $1,823 3. SOL – Solana: $72.17 4. AAVE: $109.21 5. ENA – Ethena: $0.12 6. HYPE – Hyperliquid: $67.62 7. TAO – Bittensor: $193.10 8. LTC – Litecoin: $45.39 I'm looking at these for potential spot accumulation, not because I expect an immediate recovery. No need to buy everything at once... patience, staggered entries and proper risk management matter, especially during a market crash. Which one would you prioritize accumulating at these prices ❓ #WSOT2026 #WSOTShowYourAITradeToEarn10USDT #JensenHuangExitTestsNvidiasAILeadership #USPPITestsTheHigherForLongerTrade #USInflationRunsHotAndRateHikeBetsRise


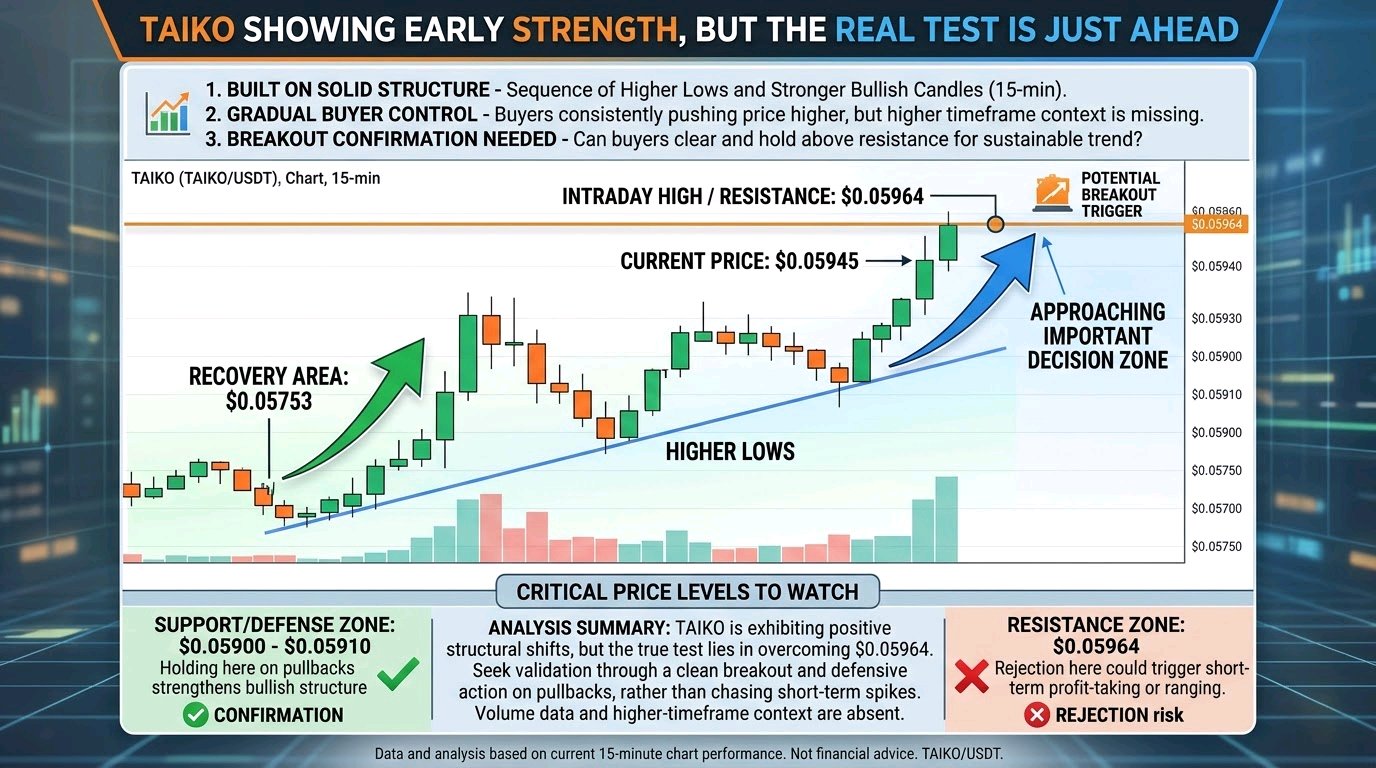
$TAIKOUSDT Is Showing Early Strength, But the Real Test Is Just Ahead. I'm watching TAIKO closely after its latest recovery from the $0.05753 area. What stands out to me isn't simply the 3.27% price increase, but the structure behind the move. Buyers have gradually pushed price higher, creating a sequence of higher lows and stronger bullish candles on the 15-minute chart. TAIKO is now trading around $0.05945, approaching the $0.05964 intraday high. This is an important decision zone. A clean breakout followed by acceptance above resistance could attract momentum traders and create room for another upward extension. However, I don't want to mistake short-term momentum for a confirmed trend reversal. The market has already moved considerably from its recent low, and buyers need to demonstrate that they can defend reclaimed levels rather than simply chase the breakout. I'm particularly interested in how price reacts around $0.05900–$0.05910. Holding this area during a pullback would strengthen the bullish structure. Rejection near $0.05964, on the other hand, could bring short-term profit-taking. My interpretation: TAIKO is showing improving buyer control, but the next breakout attempt matters more than the current green candles. I want to see confirmation, not just excitement. #WSOT2026

📉 BTC跌至65,000美元附近,机构资金还会回来吗? 过去几天,加密货币市场出现了几个值得警惕的信号: 1️⃣ BTC跌至65,000美元附近,市场抛售压力仍然明显。 2️⃣ 美国现货BTC ETF上周净流出约10.7亿美元,连续第二周流出超过10亿美元。 3️⃣ ETH ETF上周净流出约3.99亿美元,已经连续七周出现周度净流出。 4️⃣ SOL ETF也连续六周净流出,说明资金压力已经不只集中在BTC和ETH。 我的独立观点: 现在最值得关注的不是BTC究竟跌到多少,而是机构资金什么时候停止撤离。 ETF持续流出意味着市场需求暂时不足,但这不代表机构永久离开加密货币市场。 另外,市场出现超卖信号,也不等于马上就会反弹。 我认为接下来应该重点观察: * BTC现货ETF能否恢复净流入。 * ETH能否重新获得机构资金支持。 * 杠杆清算是否逐渐减少。 我想问大家一个问题: 如果BTC在65,000美元附近继续震荡,你会选择什么策略? A. 分批买入BTC B. 持有USDT等待机会 C. 继续持币,不做交易 D. 暂时离场,等待市场稳定 你认为现在是机会,还是风险? #BTC #Bitcoin #ETH #Ethereum #ETF #CryptoMarket #BinanceSquare #WSOT2026

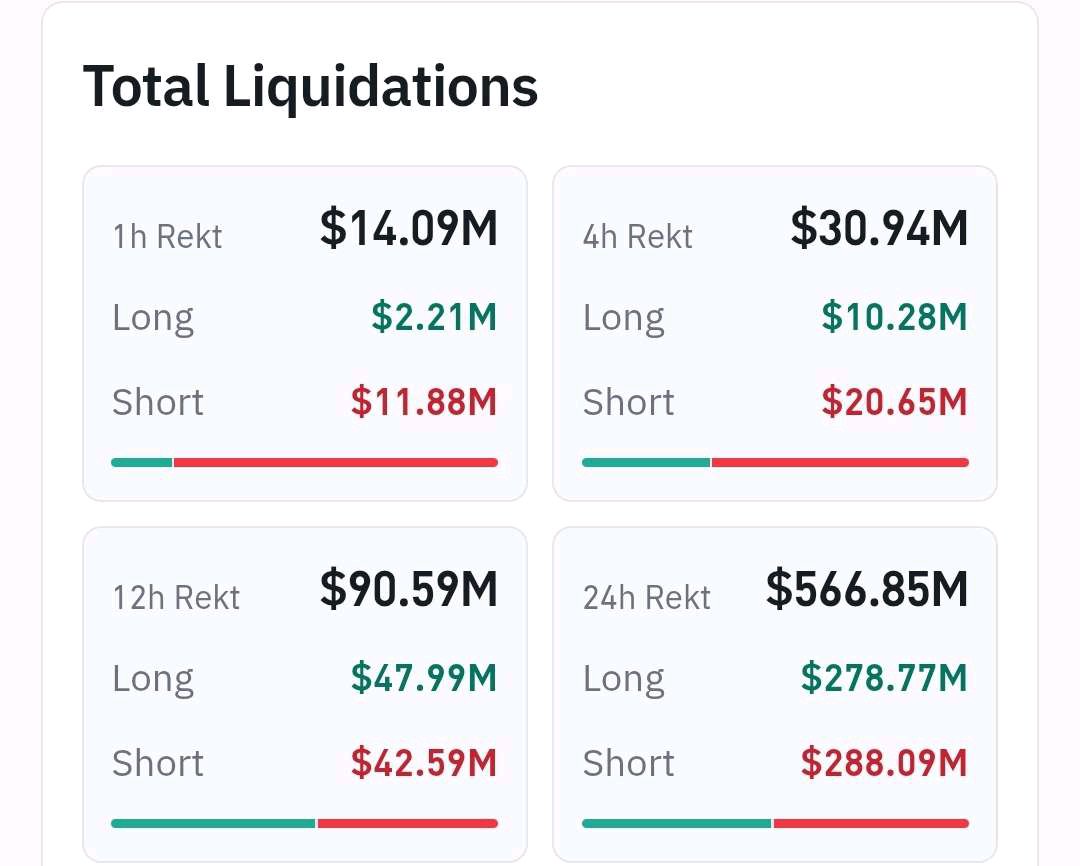
Yesterday, when I wrote about the market, around $1.93 billion in crypto futures positions had been liquidated, with most of them being longs. Today, around $560 million has been liquidated over the past 24 hours, with longs and shorts now accounting for a similar share. This comes after a small market recovery. # $BTCUSDT bounced from around $62,000 to nearly $66,000 and is now trading near $65,300. While $ETHUSDT recovered from approximately $1,710 to $1,830. #WSOT2026

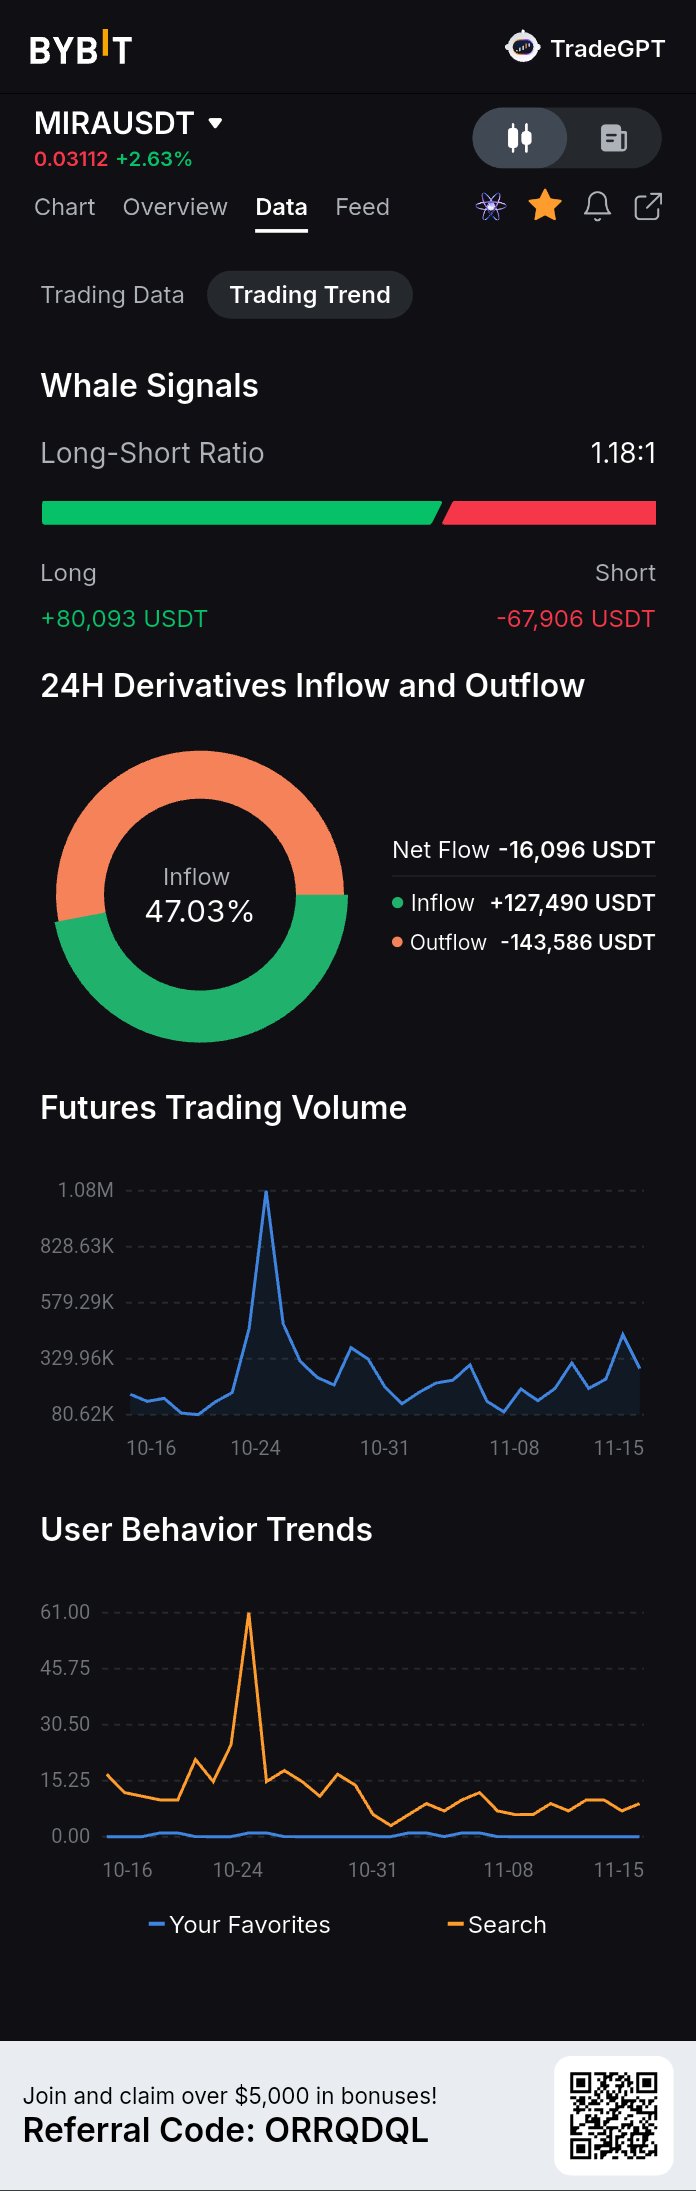
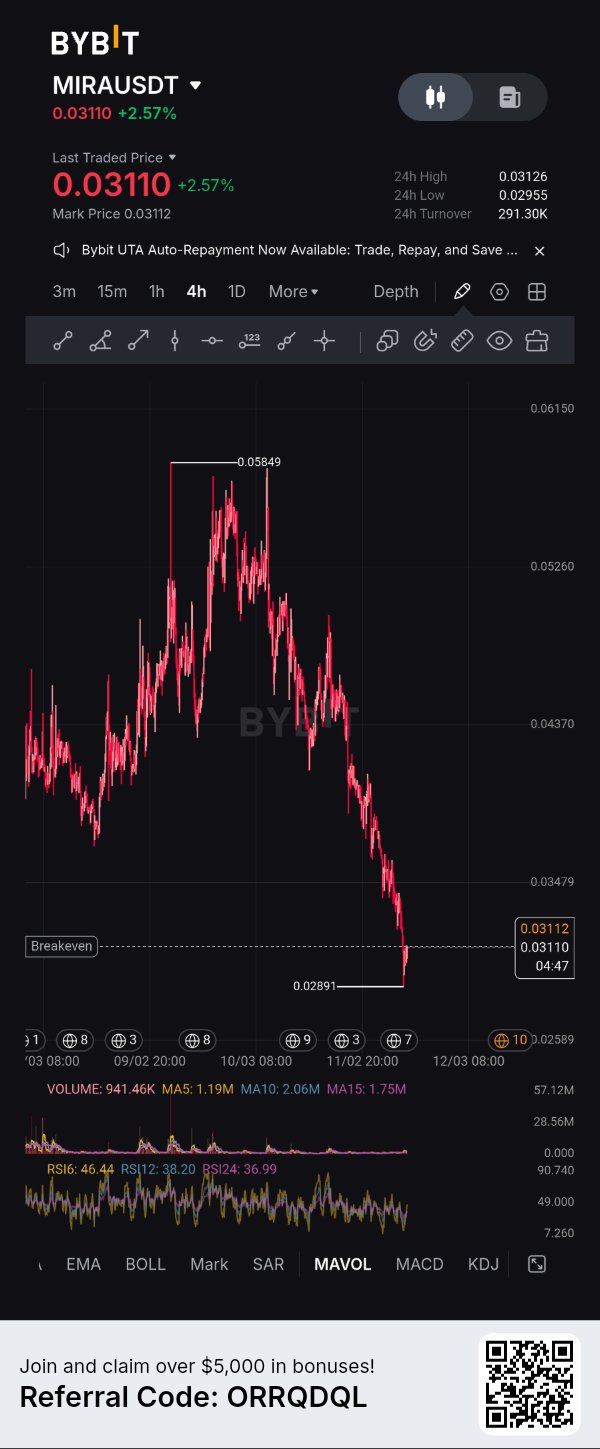
🔥🔥$MIRA BULLISH! Don’t overlook the potential rise of MIRA. As shown in the chart, there is clear accumulation, signaling preparation for an upward move. The second image reveals an increase in searches for the MIRA token—a positive indicator. Opportunities are still available; don’t let them slip away. #MIRA #WSOT2026

#WSOT2026 #WSOTShowYourAITradeToEarn10USDT
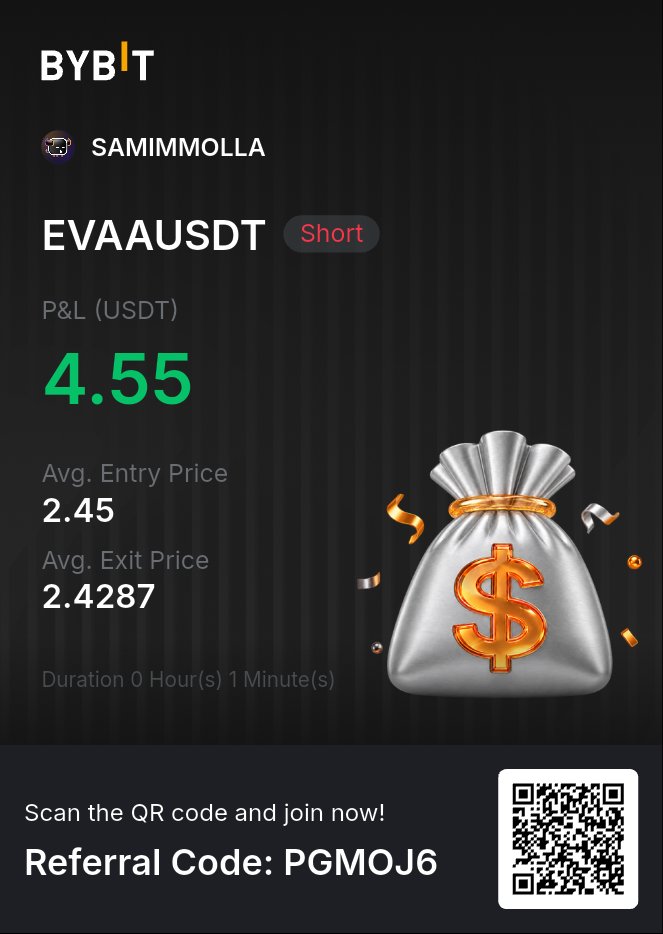
AVAX Dip: Smart Short Setup?
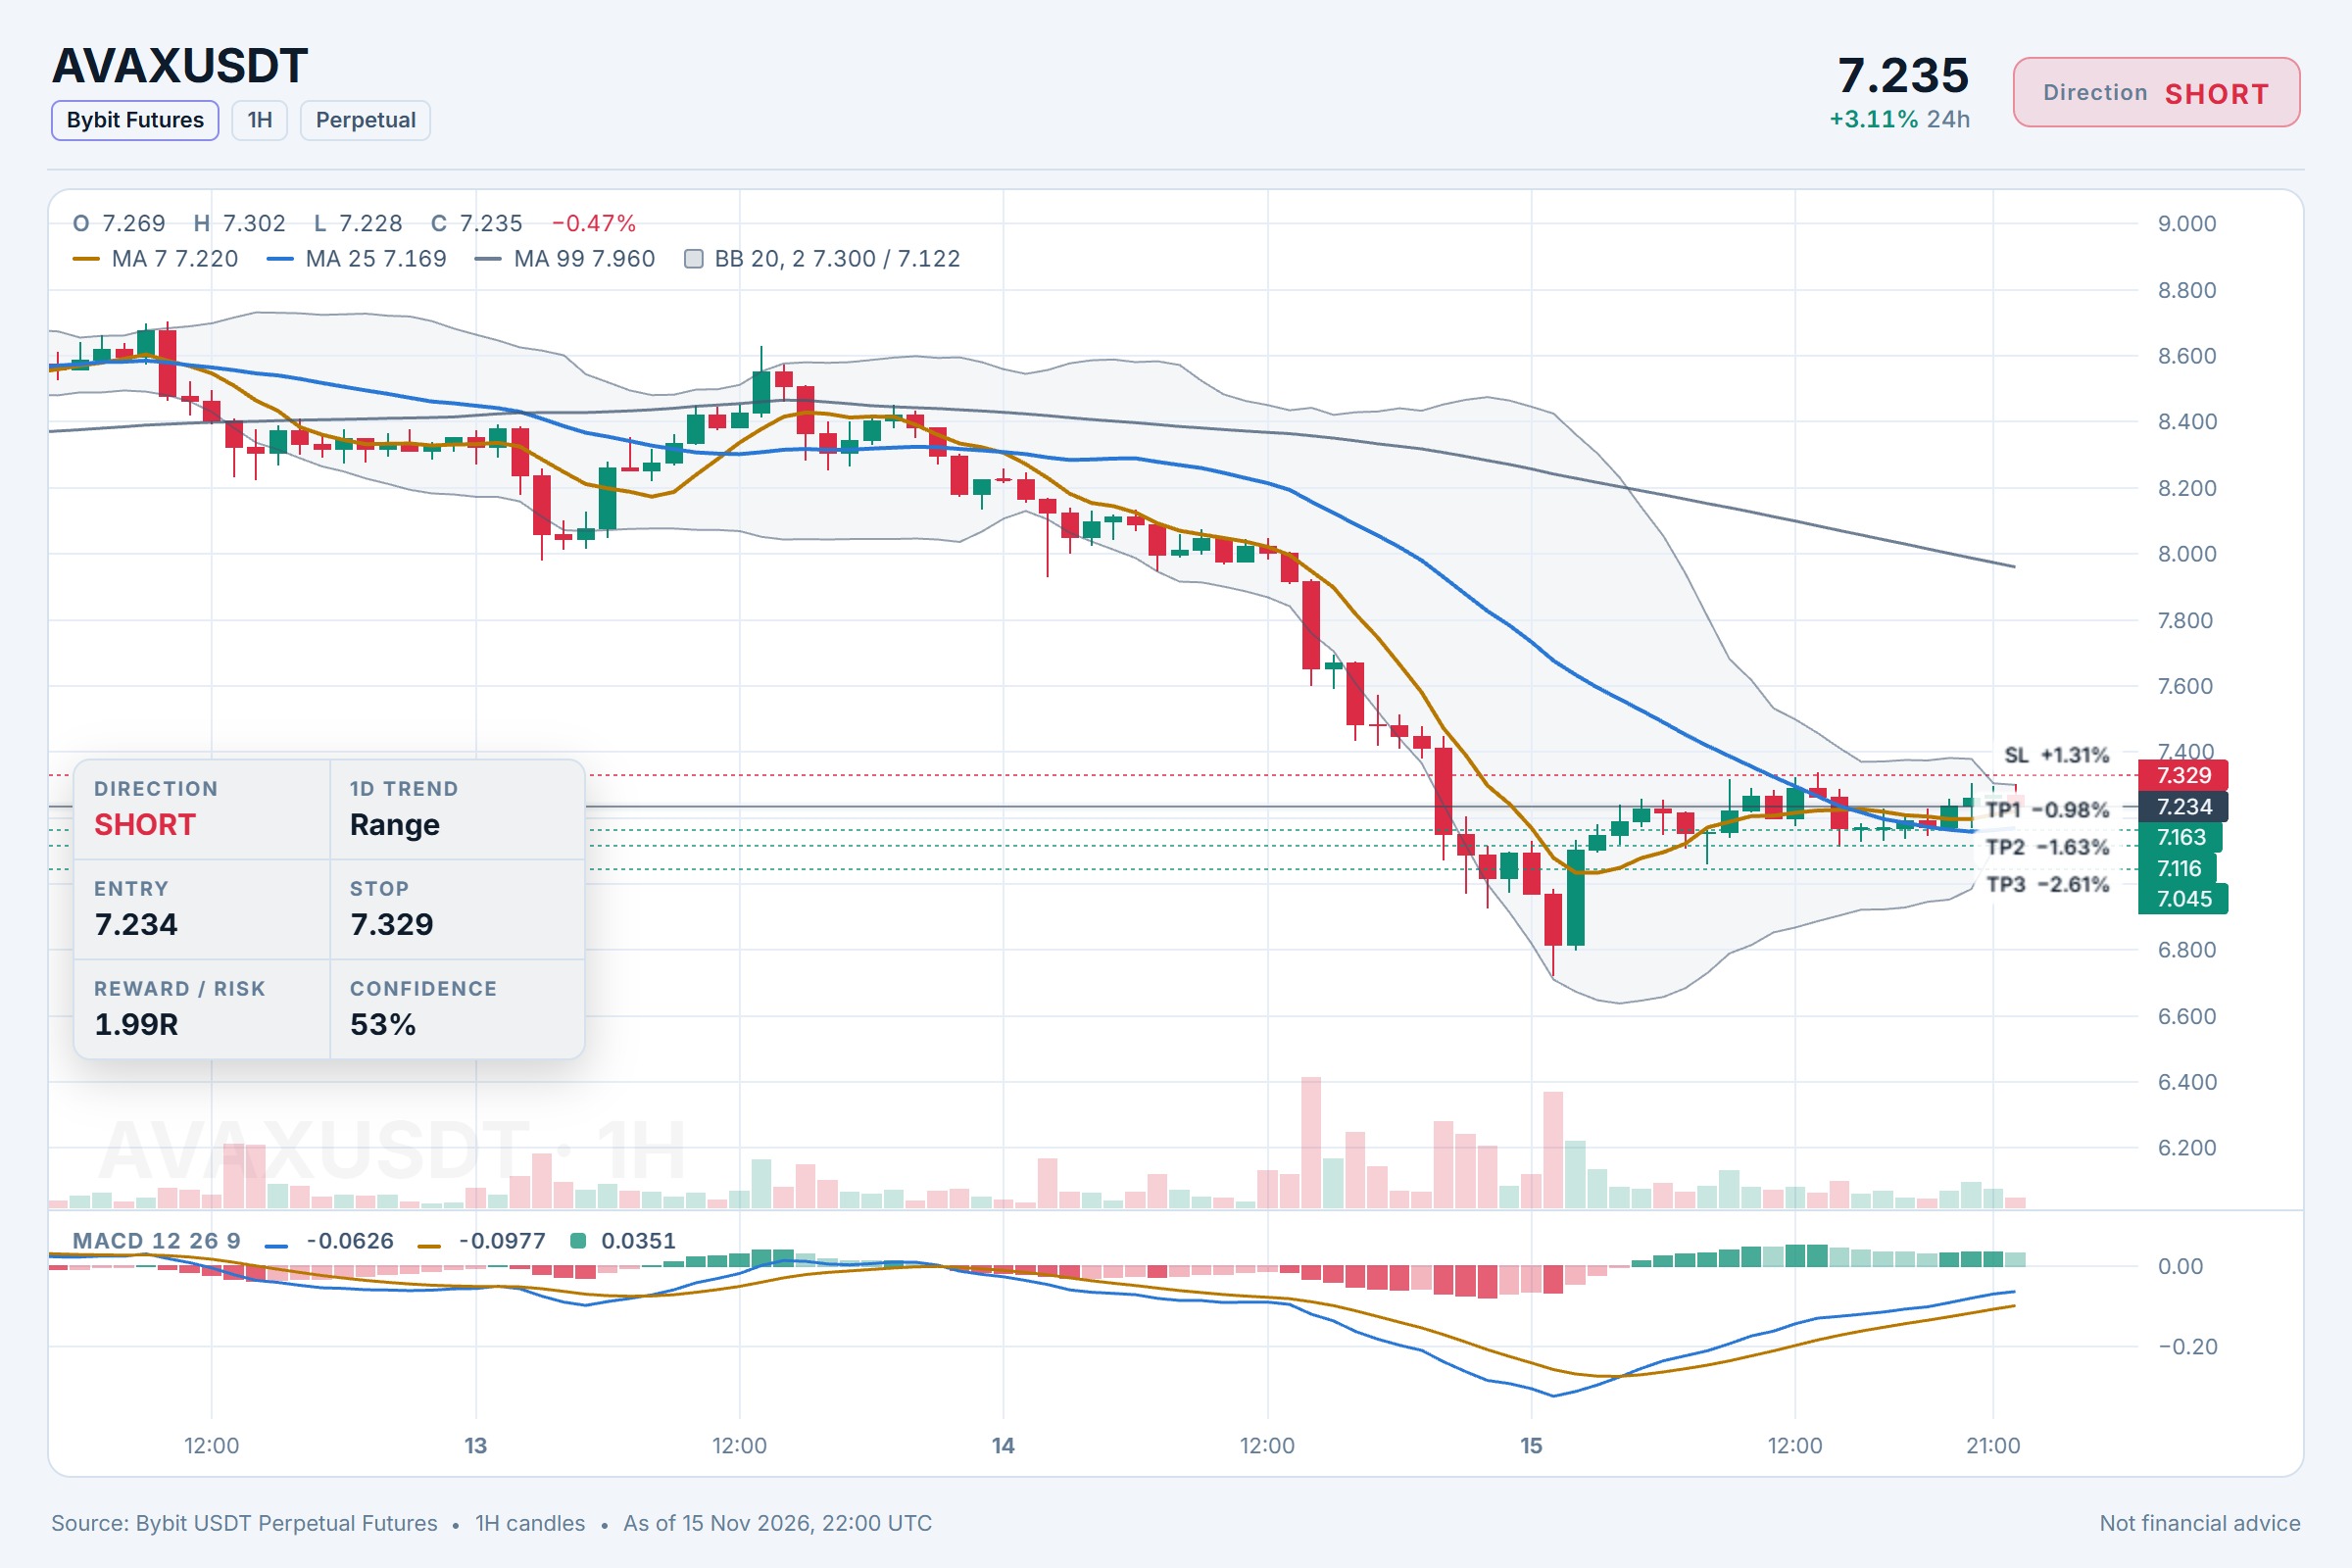
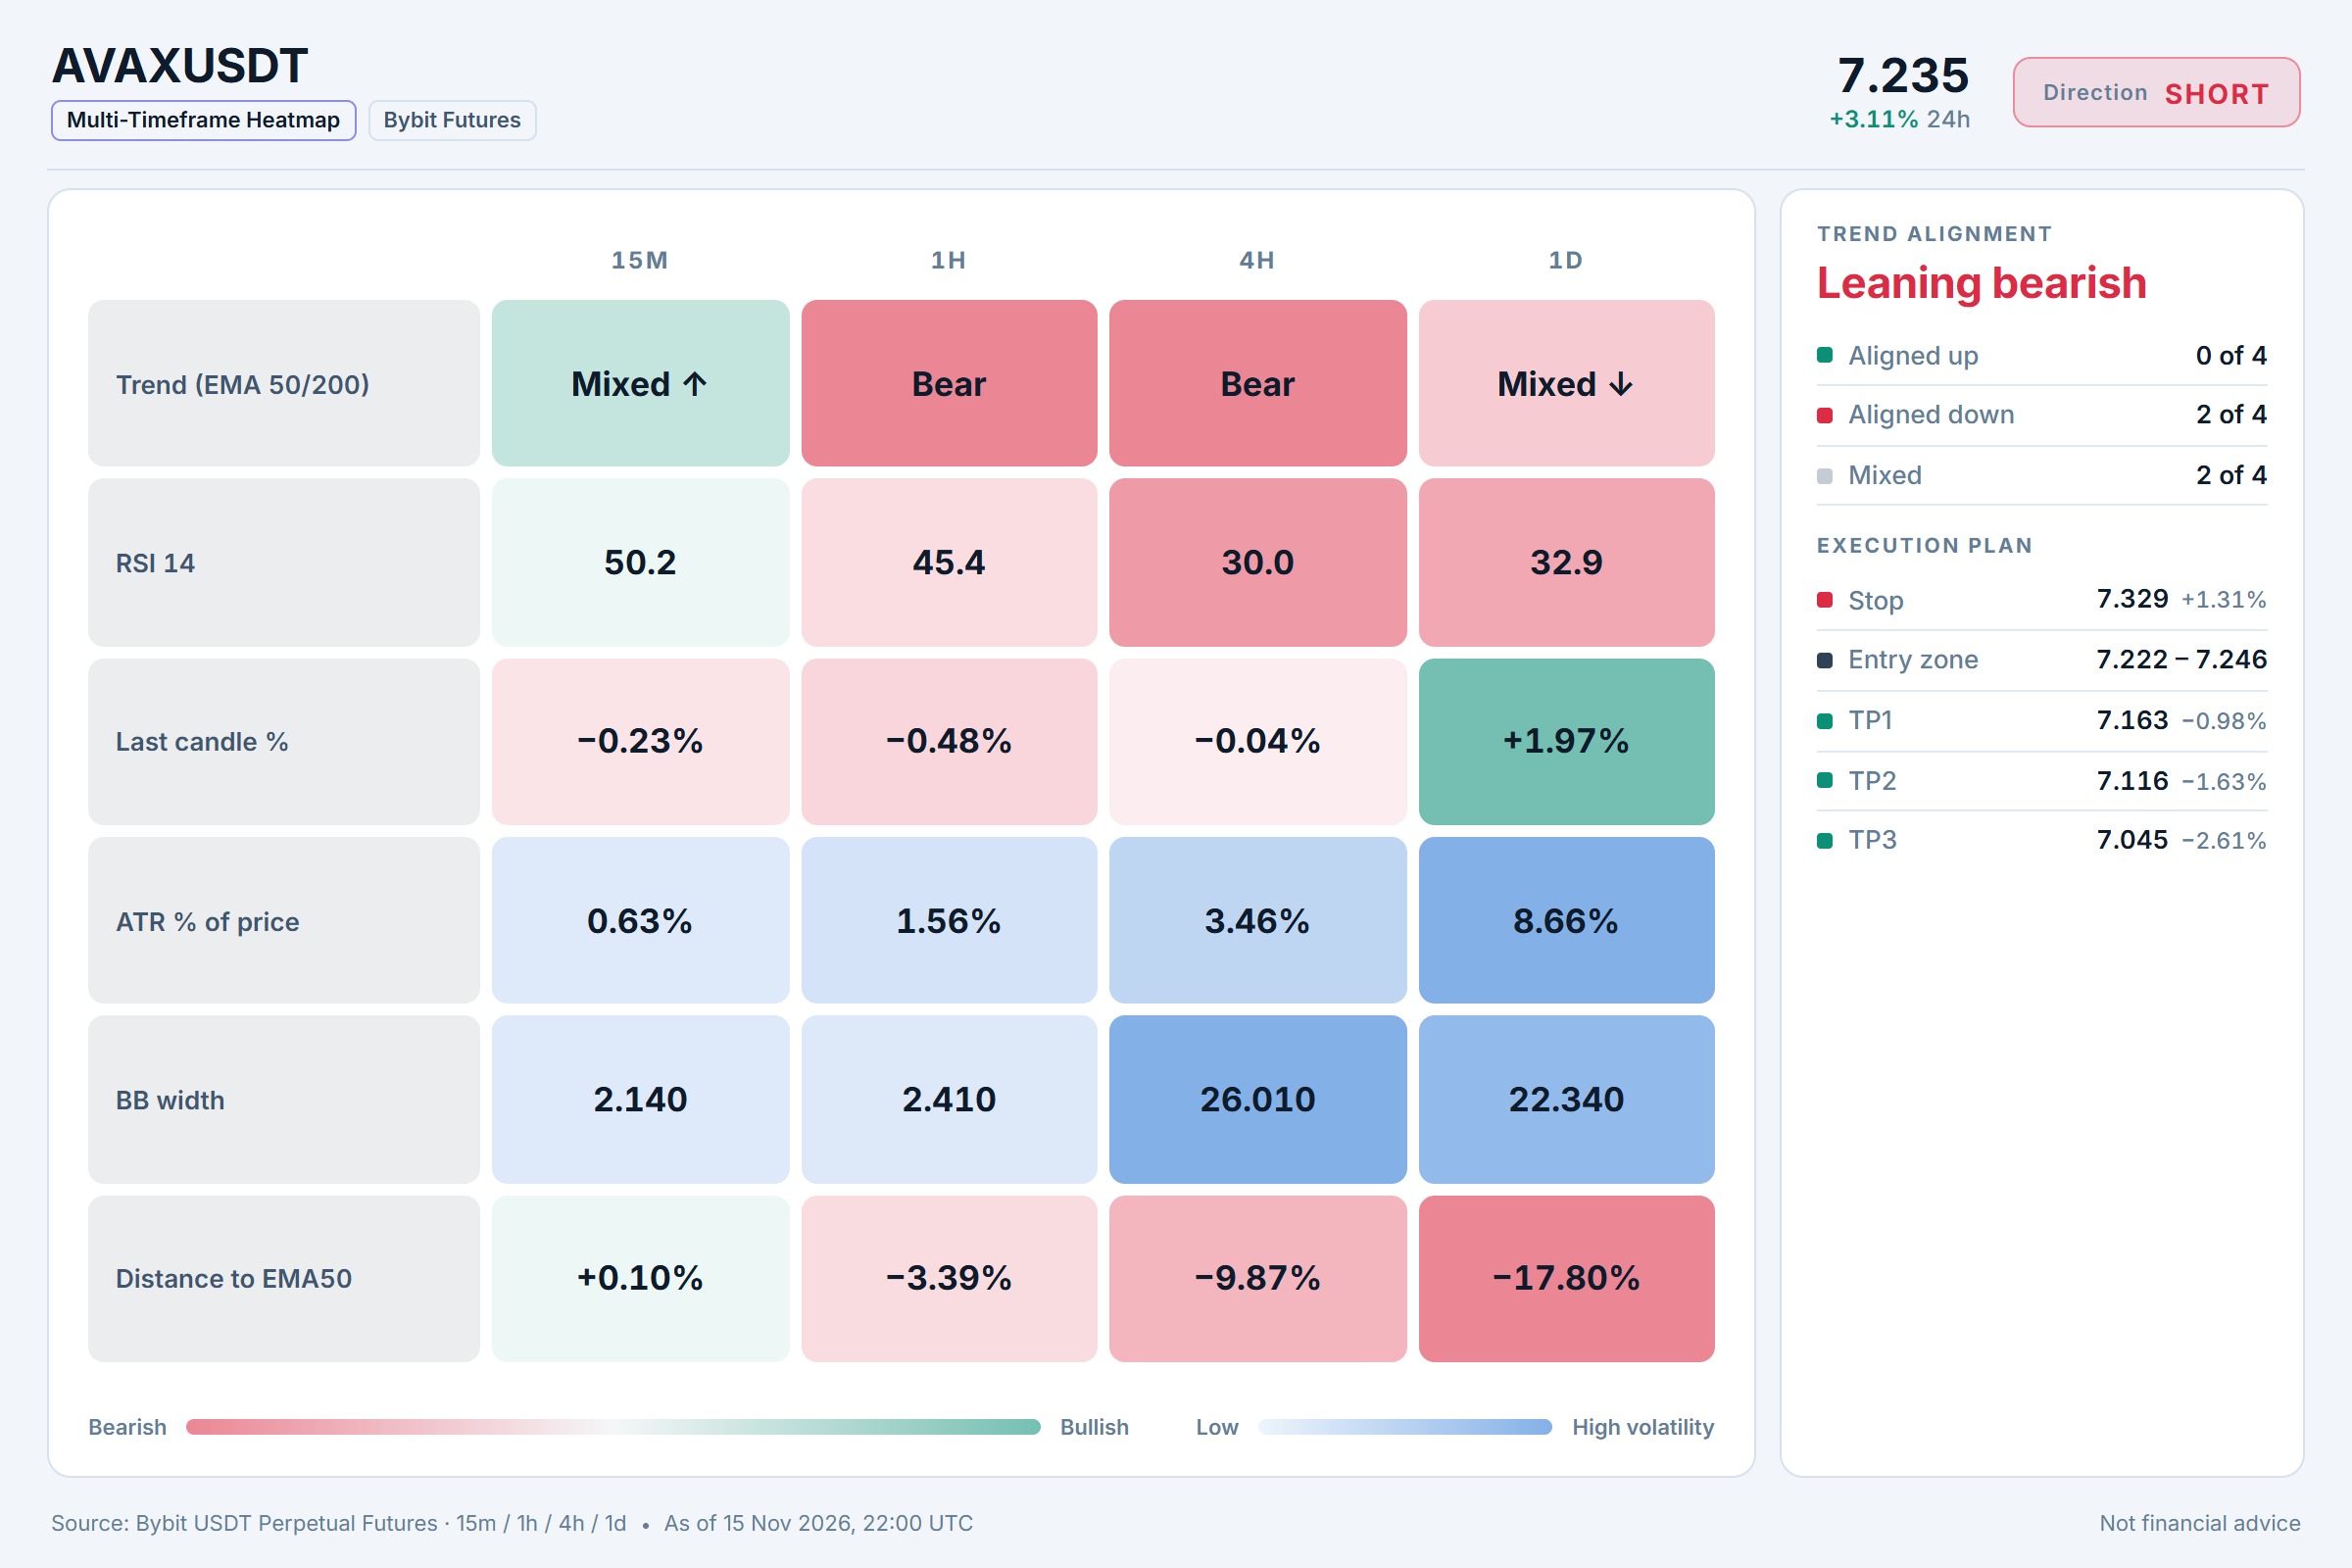
$AVAX/USDT — SHORT Entry: 7.222 - 7.246 SL: 7.329 TP1: 7.163 TP2: 7.116 TP3: 7.045 I'm watching AVAX closely at 7.234 as BTC holds its bullish trend, and the 15m RSI sitting at 50.16 tells me momentum is flat — meaning sellers could step in soon. With price wedged between 7.222 and 7.246, I think a short here offers a clean risk-to-reward profile, especially with TP2 at 7.116 and TP3 at 7.045 nearby. The key will be whether BTC's momentum stays firm enough to drag AVAX down with it or if AVAX decouples and bounces. Do you agree this is a good short opportunity, or would you wait for BTC to confirm first? ⚠️ Personal market analysis only. NFA — manage risk and DYOR. Educational content, not investment advice or a recommendation to buy, sell, deposit, or withdraw any asset. No paid promotion or referral/affiliate links.$AVAXUSDT#WSOT2026 #WSOTShowYourAITradeToEarn10USDT
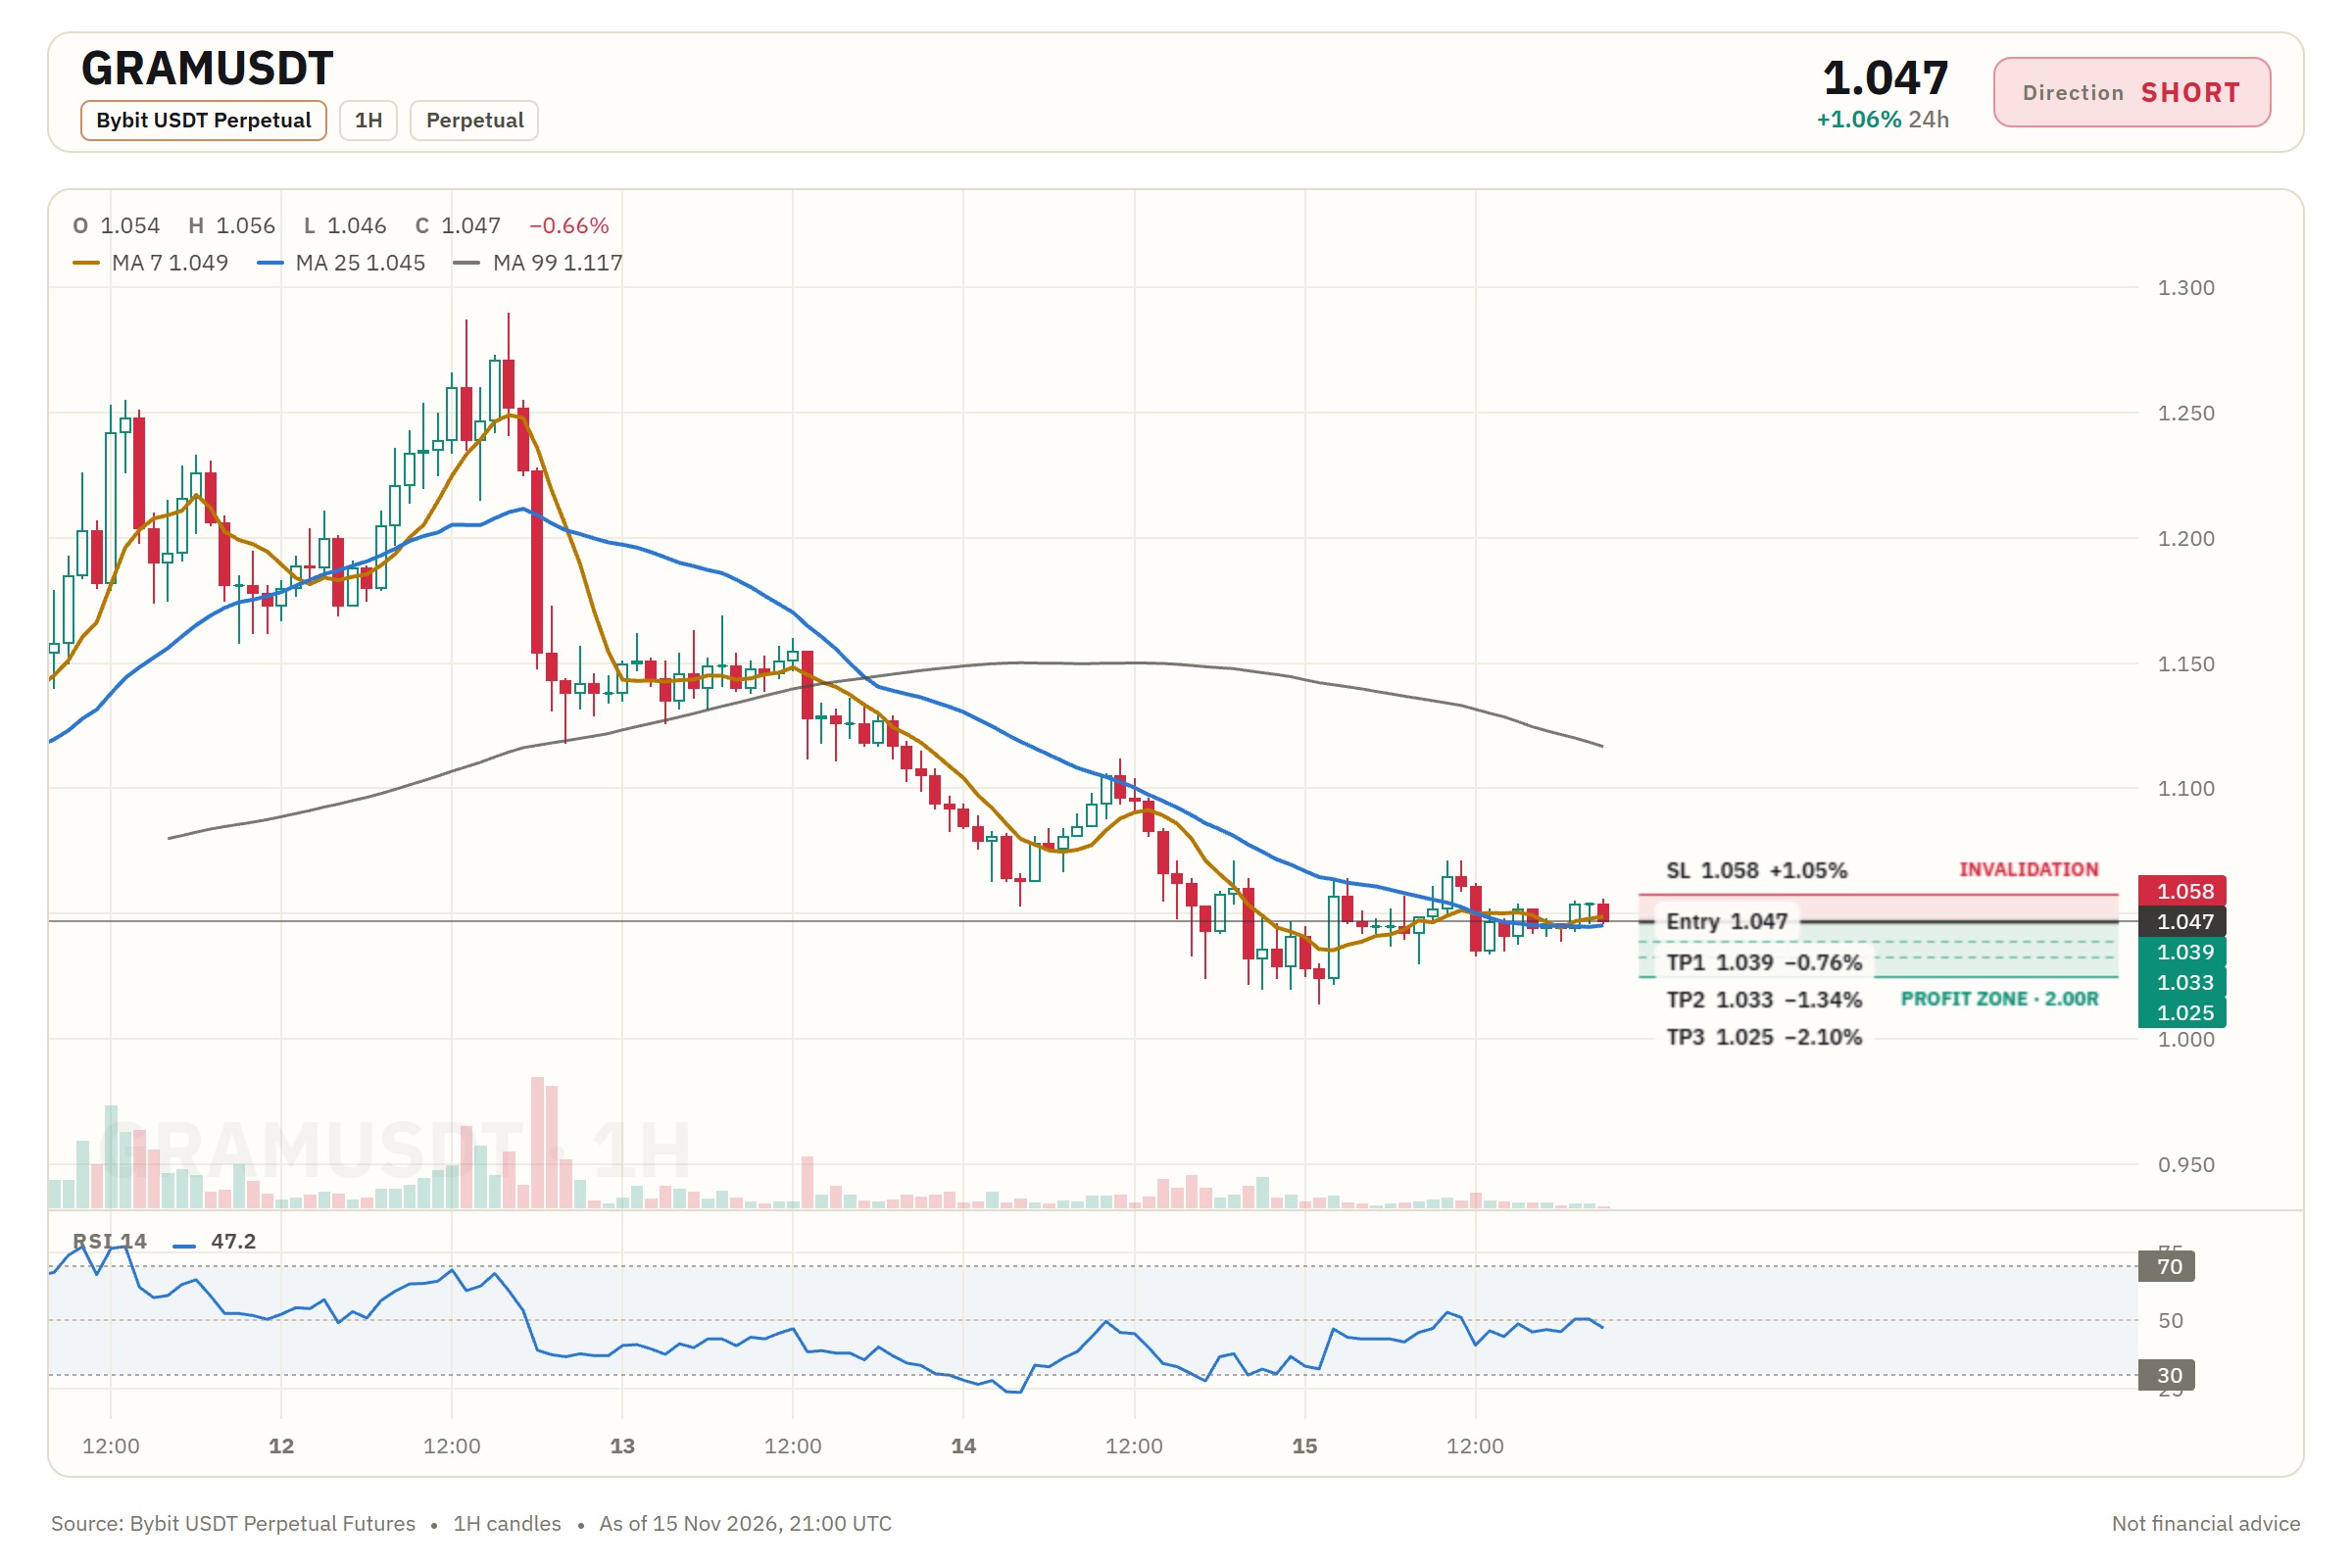
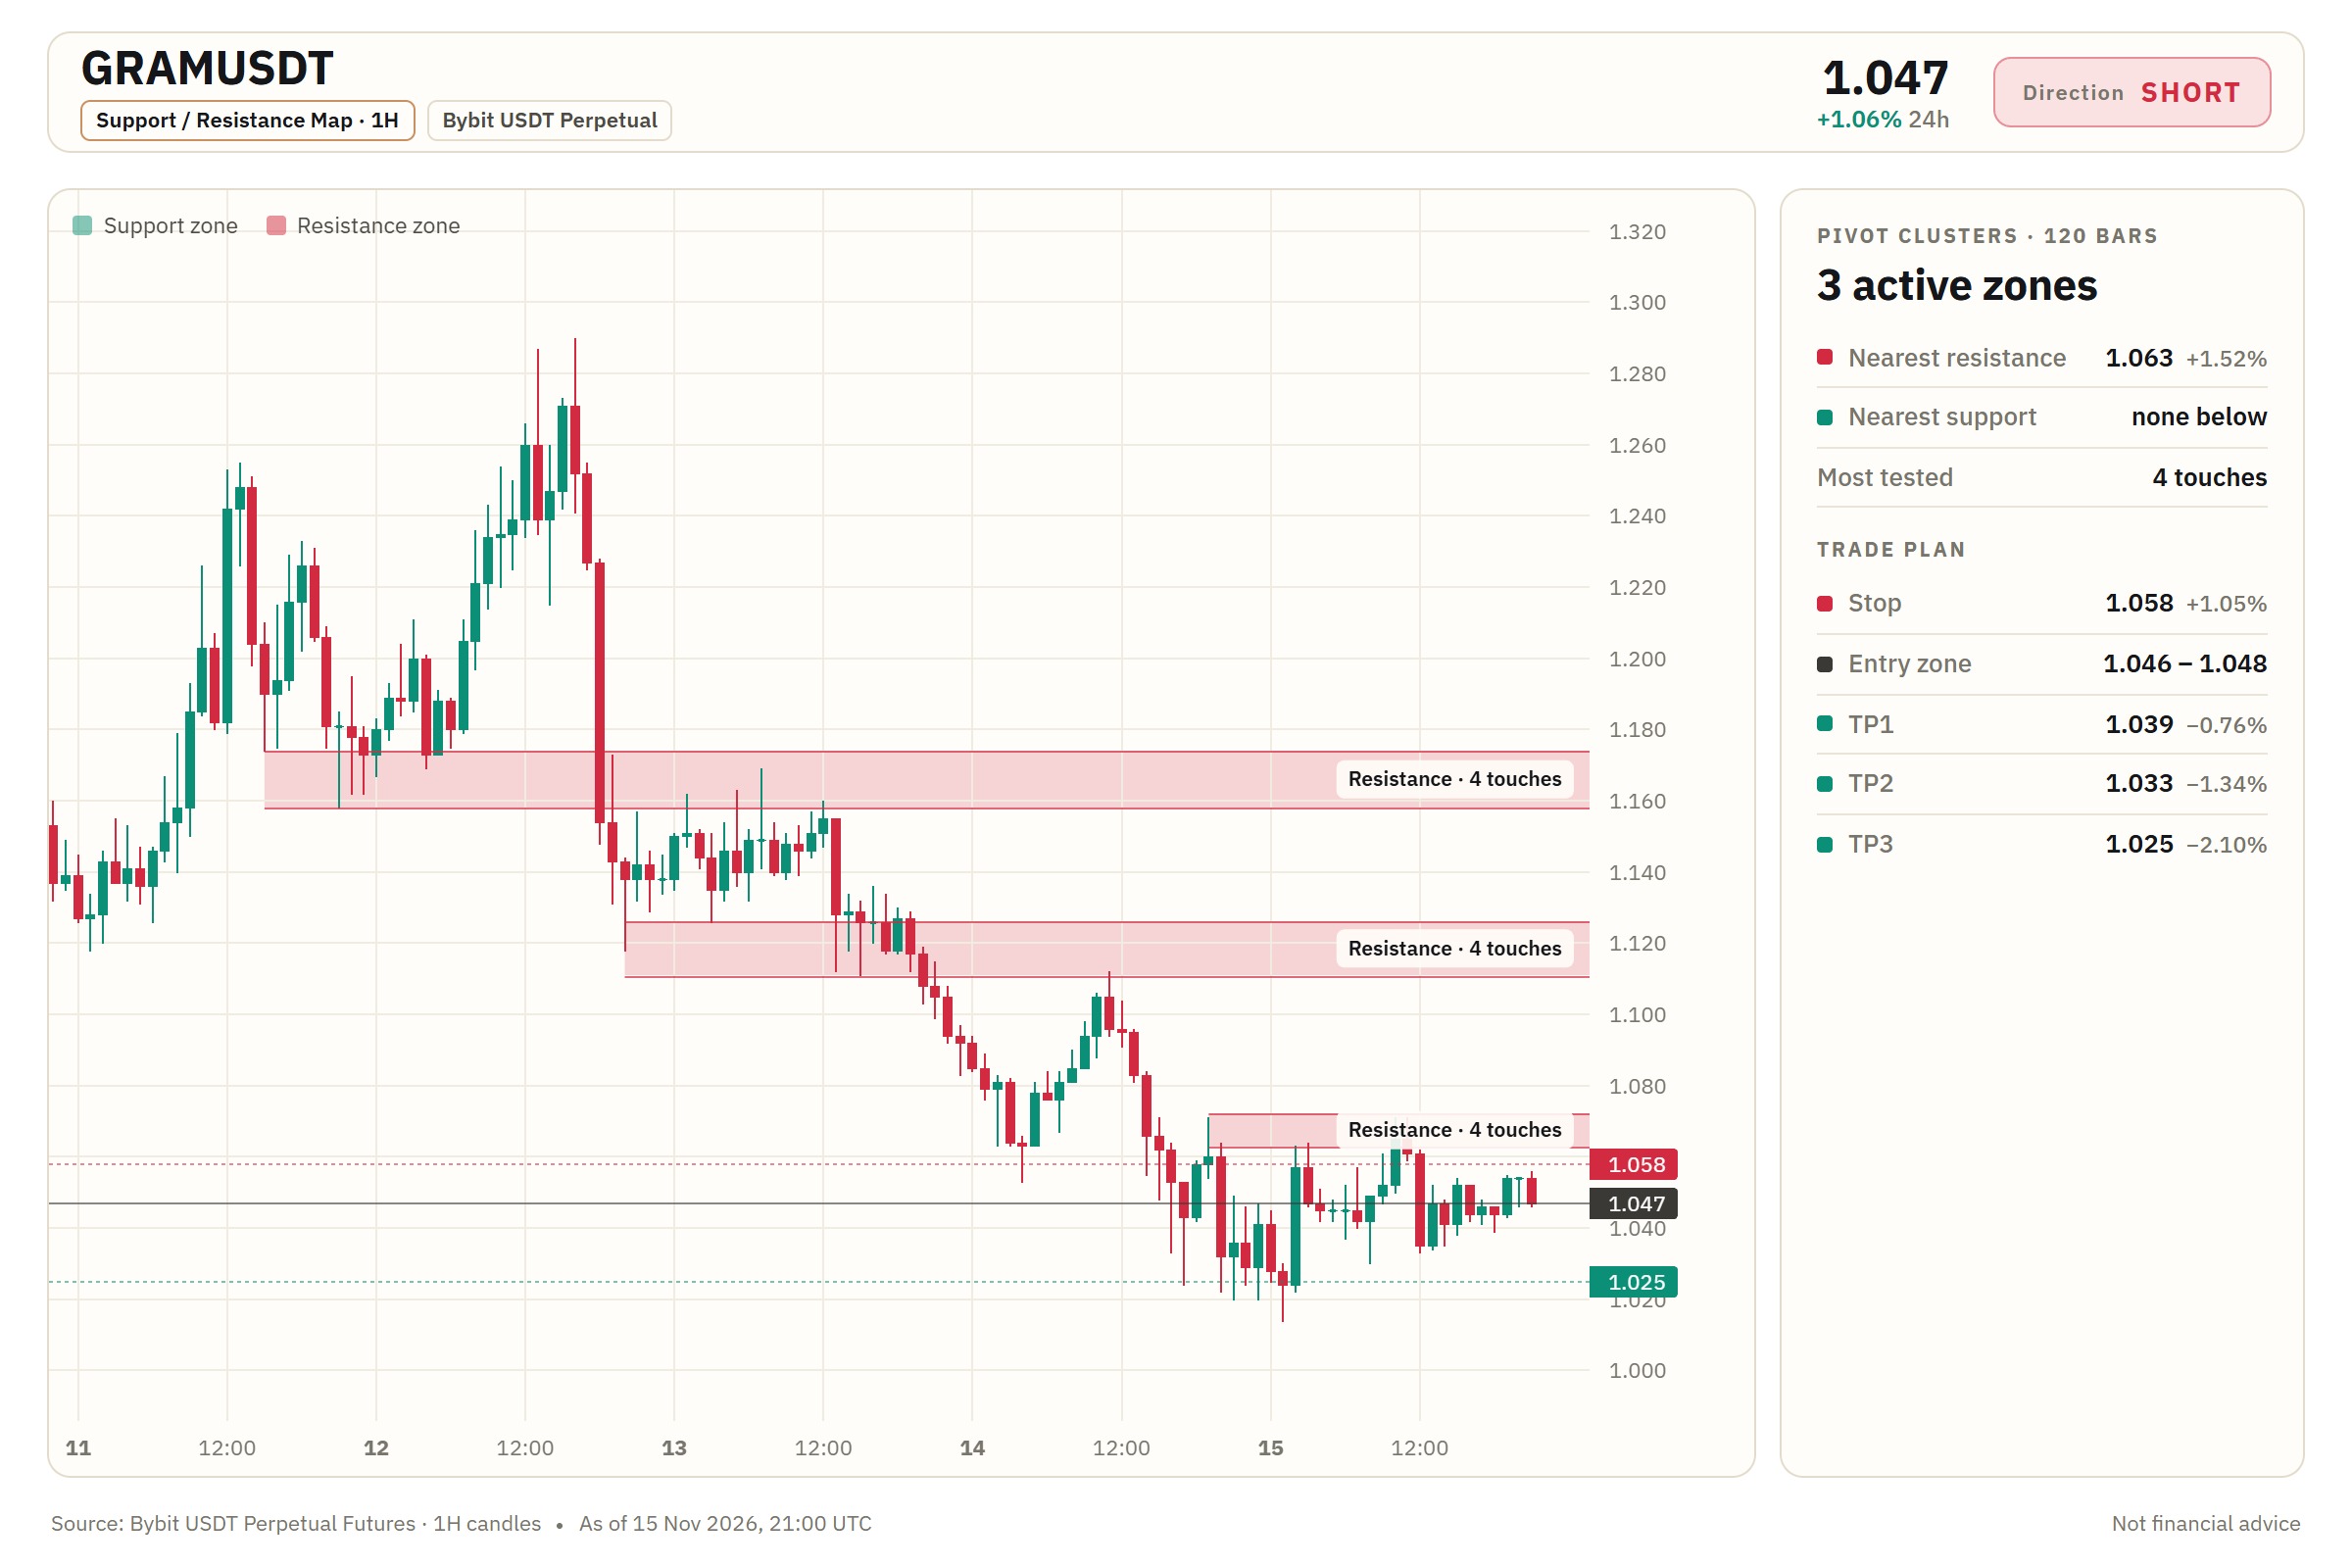
GRAM/USDT Quietly Preparing Short Breakout?
$GRAM/USDT — SHORT Entry: 1.046 - 1.048 SL: 1.058 TP1: 1.039 TP2: 1.033 TP3: 1.025 I’m watching the 15m RSI at 48.04 and seeing momentum shift bearish within a narrow 1.046–1.048 entry band. With BTC trend flat, a clean breakdown from this zone could open a meaningful move toward TP2 at 1.033 and further to TP3 at 1.025, while 1.058 serves as the key invalidation level. Do you think the neutral BTC trend will allow $GRAM/USDT to reach TP2, or is a retest of 1.058 more likely first? ⚠️ Personal market analysis only. NFA — manage risk and DYOR. Educational content, not investment advice or a recommendation to buy, sell, deposit, or withdraw any asset. No paid promotion or referral/affiliate links.$GRAMUSDT#WSOT2026 #WSOTShowYourAITradeToEarn10USDT

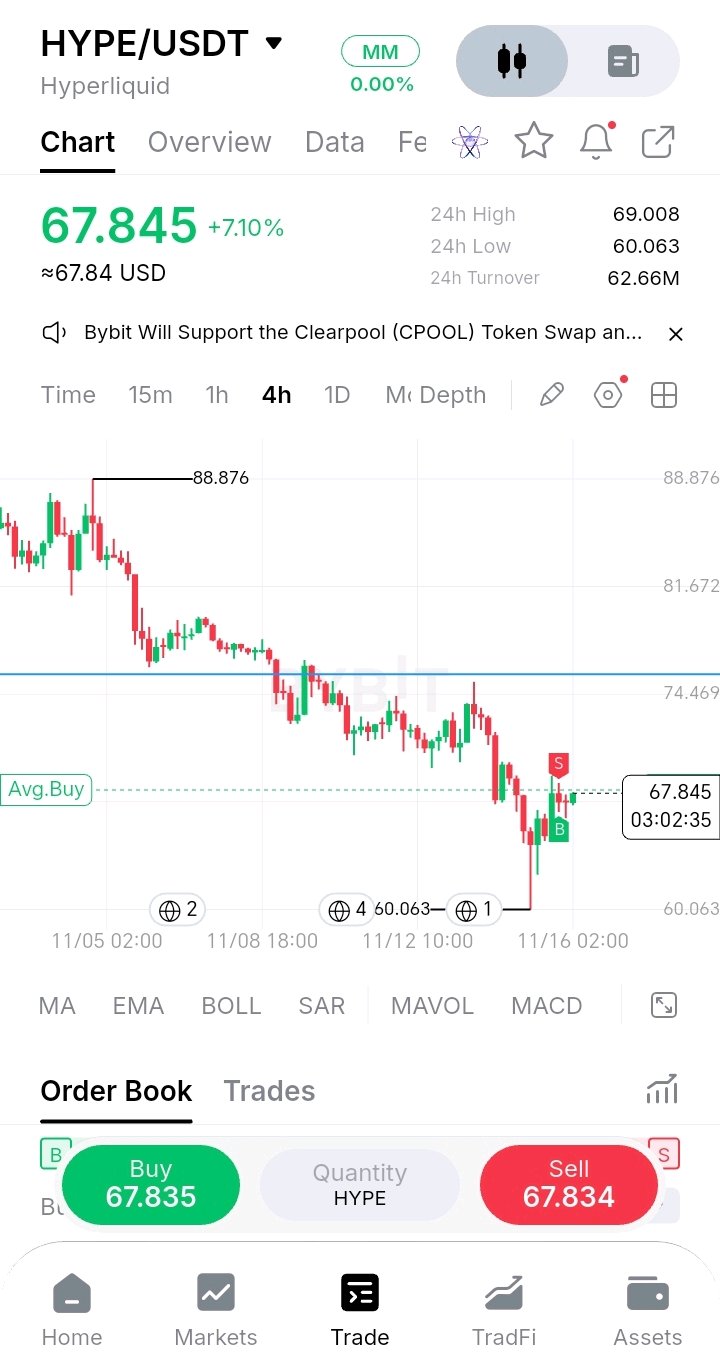
HYPE REBOUNDS 7.1% — A TURNING POINT AHEAD? Hyperliquid is showing a strong recovery attempt after a prolonged decline. HYPE has climbed to $67.845, gaining 7.10% in 24 hours, following a sharp rejection near $60.063. The latest green candles suggest buyers are returning, but one strong bounce does not automatically confirm a complete trend reversal. THE MARKET STRUCTURE The 4H chart still reflects a broader bearish structure, with price previously falling from $88.876. However, the latest rebound indicates that demand has emerged near the recent low. Immediate support: $65.00–$63.00 Major support: $60.063 Immediate resistance: $69.008 Major resistance: $74.469 BULLISH ROADMAP A sustained move above $69.008 could give buyers an opportunity to challenge $72.00 and the $74.469 resistance region. A successful breakout and retest would strengthen the recovery scenario. WHEN THE RECOVERY FAILS If HYPE loses the $65 area and selling pressure increases, the rebound could weaken. A deeper correction may bring the $63 region and eventually $60.063 back into focus. MY MARKET PERSPECTIVE The interesting part is not simply the 7% gain; it is how HYPE reacted after reaching its recent low. Buyers have made their first move, but they still need to overcome overhead resistance. I would favor confirmation over chasing momentum and keep risk controlled. Will HYPE recover toward $74, or will sellers interrupt this bounce? #HYPE #Hyperliquid #CryptoMarket #WSOT2026 #WSOTShowYourAITradeToEarn10USDT #JensenHuangExitTestsNvidiasAILeadership #USPPITestsTheHigherForLongerTrade #USInflationRunsHotAndRateHikeBetsRise $HYPEUSDT $BTCUSDT


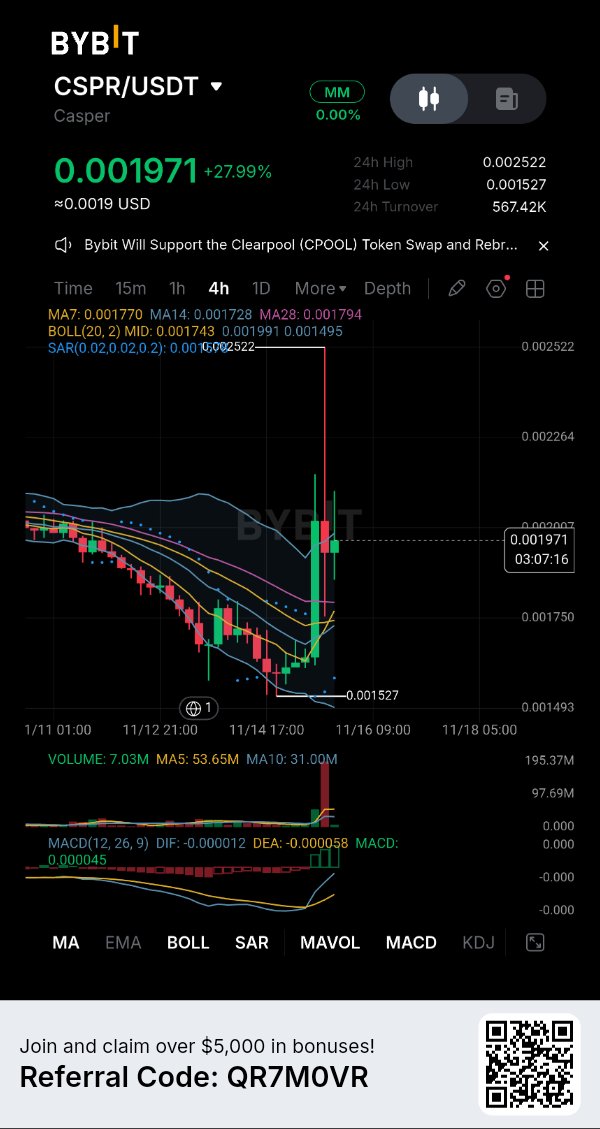
CSPR: Spike to 0.002522, Now at 0.001971
$CSPRUSDT — price is 1% under the upper Bollinger band, 0.001991, after a spike far above it. Look at the 24h range: 0.001527 to 0.002522. Price has already given back about 55% of it. Still unresolved: does 0.001991 turn from a ceiling into support? One giant volume bar and a 28% day: what would make you trust a spike like this, a retest, a close, or more volume? 4H, $CSPRUSDT on Bybit, 0.001971, +27.99% over 24h. Macro note Nov 15, 2026: Bitcoin dipped to about 62,081, its weakest level since July, before rebounding above 65,000 (Cointelegraph). Background only, not the reason for this move. What the chart shows Price slid for days to a 24h low of 0.001527. Then one candle spiked to 0.002522, about 65% above that low, and price has since pulled back to 0.001971. The 24h range is 0.000995. Price has given back about 55% of it. The spike high is 28% above the current price. Volume is visible. The spike bar is about 195M by eye, over six times the 31.00M ten-bar average. The current bar is 7.03M against a 53.65M five-bar average, but this candle is only about 22% done (3 hours 7 minutes left), so that comparison is not fair yet. The indicators agree with the bounce, but they come from price, so they are not independent proof. Price is above MA7 (0.001770), MA14 (0.001728) and MA28 (0.001794). MACD has crossed up: DIF -0.000012 is above DEA -0.000058, but both are still below zero. This supports short-term momentum. It does NOT prove a trend change. MA7 is still under MA28, and one spike candle can pull all these lines up. Key levels Support: about 0.00186 (low of this candle so far), then 0.001743 (middle Bollinger band). The 24h low is 0.001527. Resistance: 0.001991 (upper Bollinger band), then 0.002522 (24h high). What would strengthen it Price is under 0.001991, so this is a test, not a break. A touch proves little. I want a 4H close above 0.001991, then a retest that holds as support. A higher low above 0.00186 would help. A close above the band on volume well above the 53.65M average would show real participation. Concern A 4H close under 0.001743 would put price below the middle band and erase most of this bounce. Price was rejected at 0.002522 and has given back 55% of the range since. What changes my mind A 4H close above 0.001991. The lesson One loud candle is not a trend. A trend is a row of closes, each holding above the last. My view My read: this looks like a sharp spike followed by a pullback, not yet a base, so I lean cautious while CSPR stays under 0.001991 on 4H closes. I could be wrong, and a 4H close above 0.001991 would prove me wrong. Take the levels, not my lean. This is a scenario, not a prediction. A reading at posting time, not a guarantee. Do you trust the volume bar or the pullback more here? #ByXIMPACT #WSOT2026 #WSOTShowYourAITradeToEarn10USDT #JensenHuangExitTestsNvidiasAILeadership

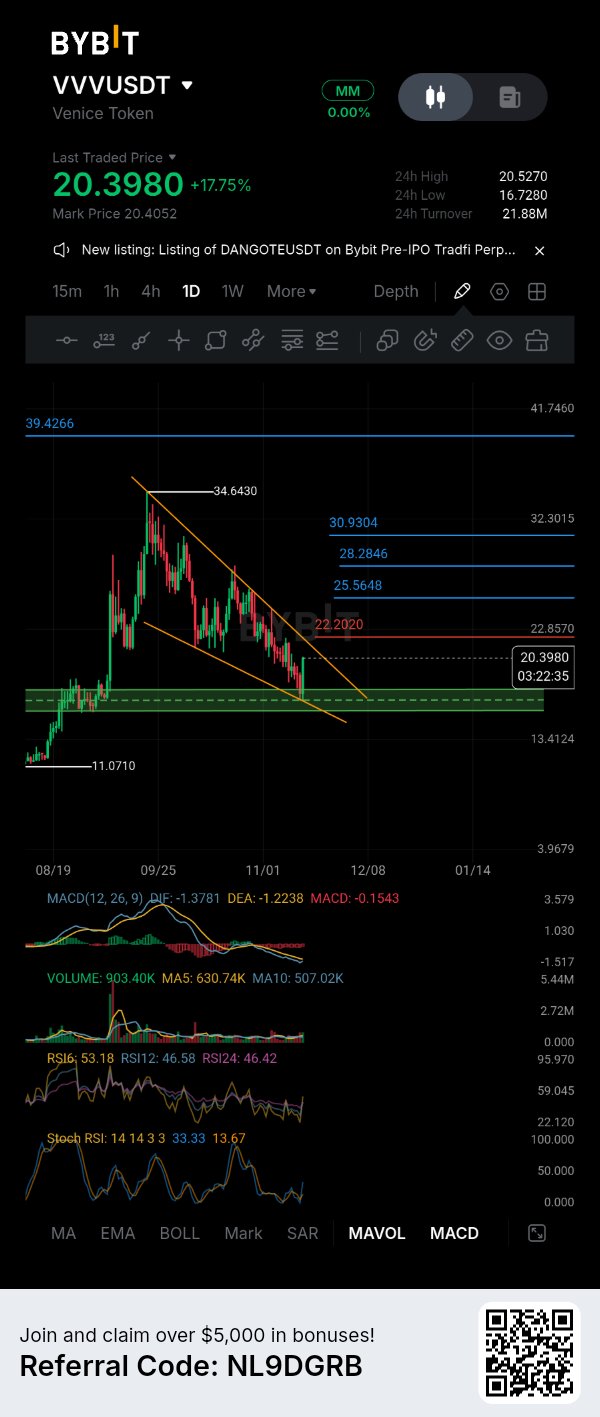
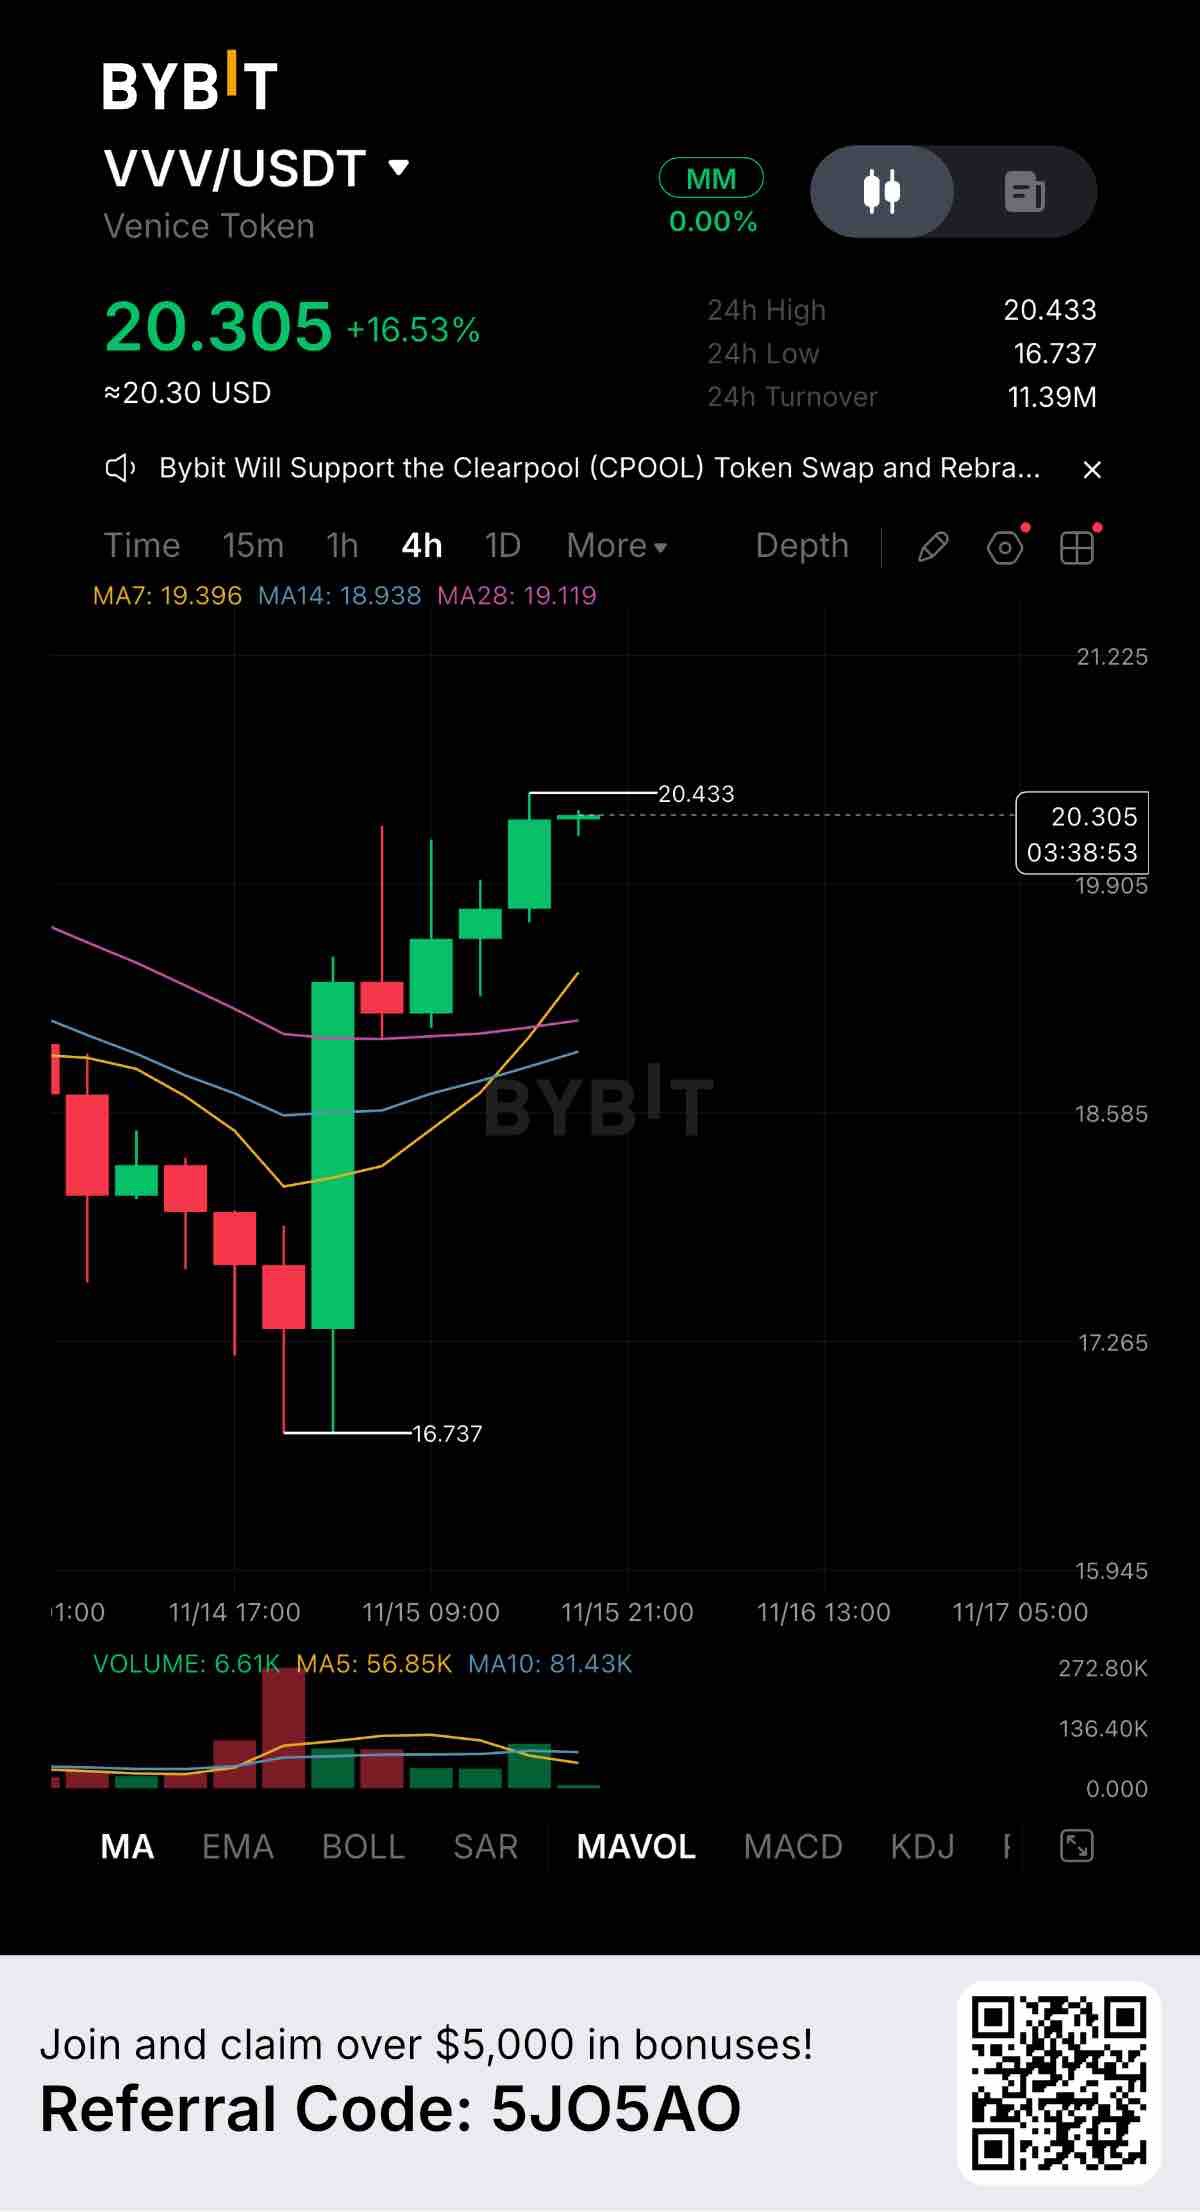
We will reach the indicated targets if price breaks above 22. $VVVUSDT #WSOT2026

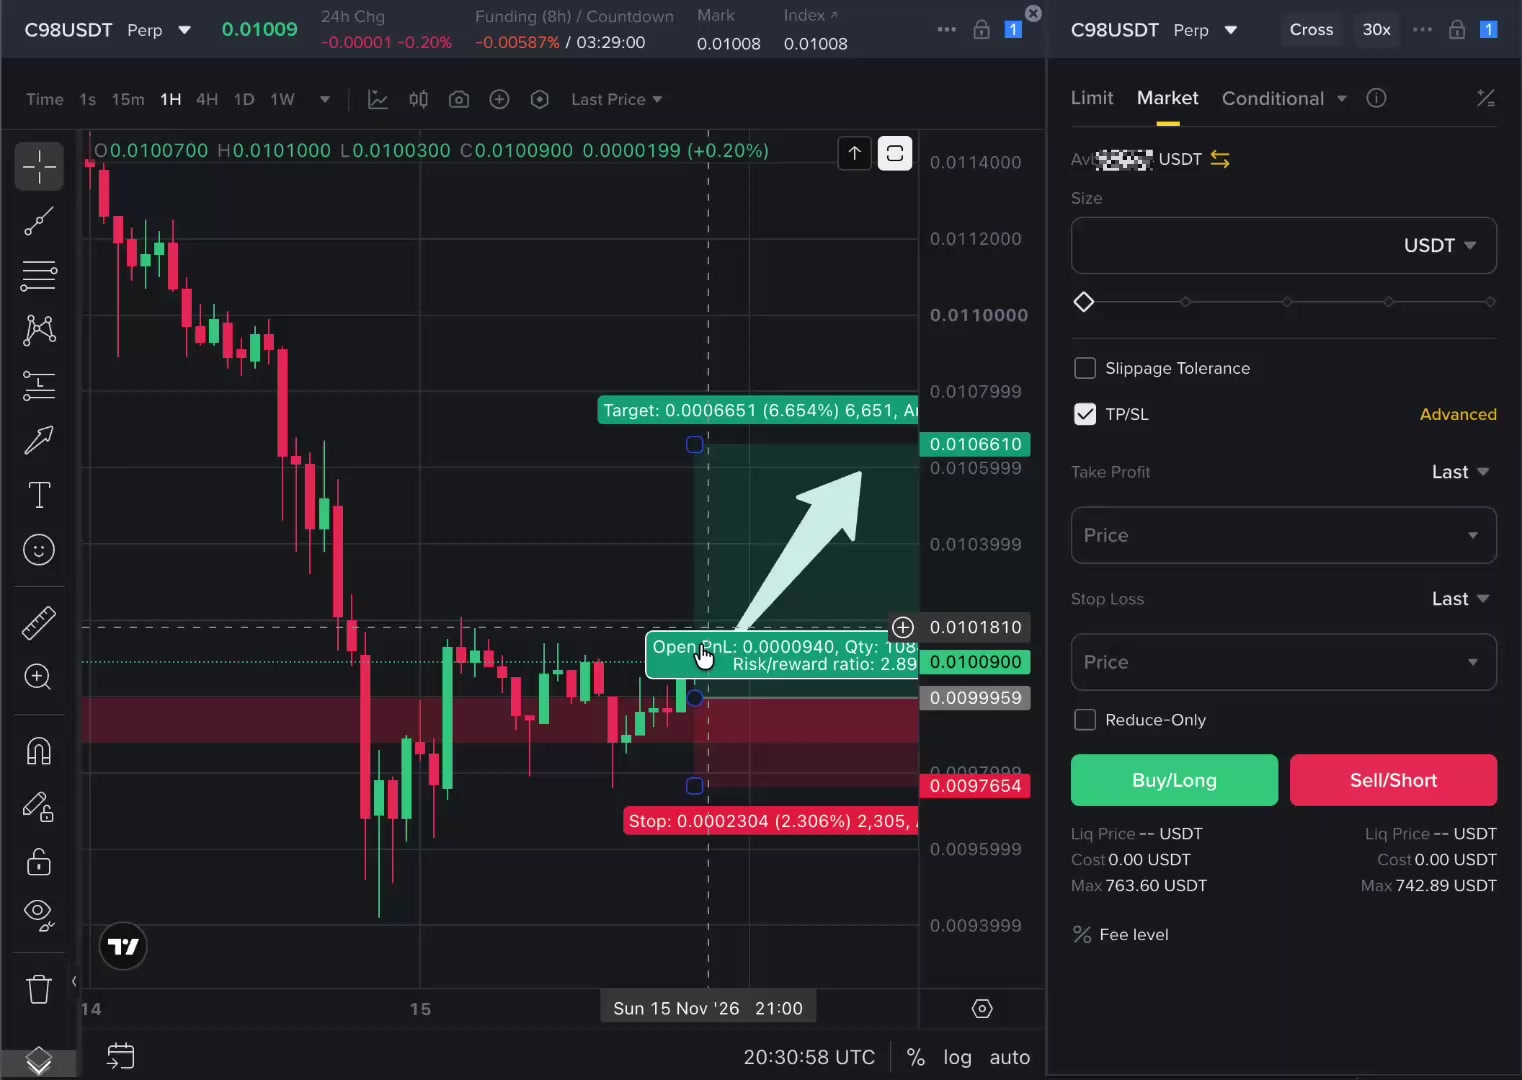
Guys, I'm opening a BIG LONG on $C98 here. 👀
$C98USDT Leverage: 30x Entry: MARKET / 0.010090 Entry 2: 0.009995 TP 1: 0.010399 TP 2: 0.010661 SL: 0.009765 👇🏻 $C98 just bounced off the 0.0094 lows and is reclaiming the 0.0100 zone, and if that level holds as support, the recovery can get aggressive fast. Everyone has been trained to sell every bounce. That's exactly why I'm watching for the bounce that finally doesn't fail. #ByXIMPACT #WSOT2026 #WSOTShowYourAITradeToEarn10USDT
4H
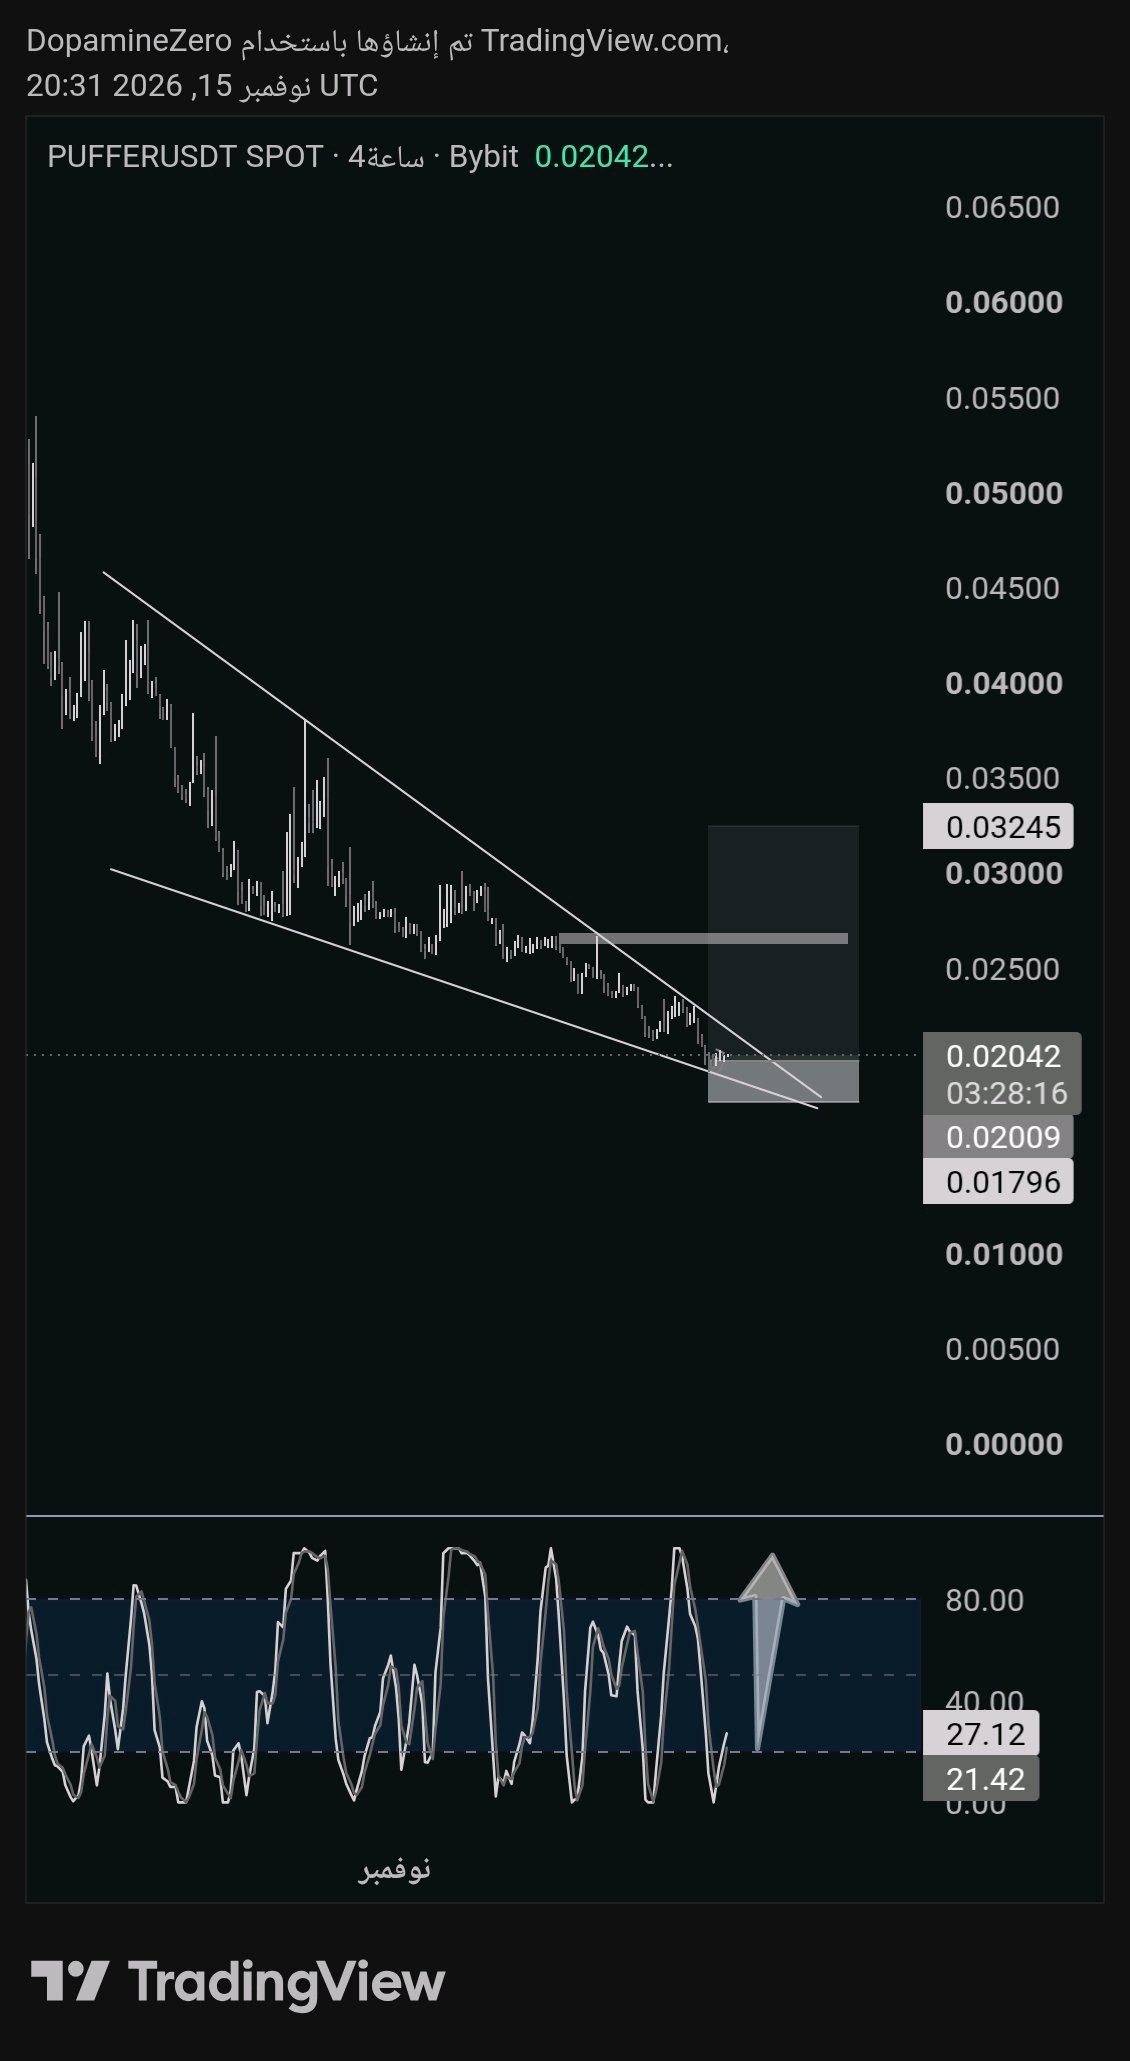
Falling Wedge $PUFFERUSDT #WSOT2026

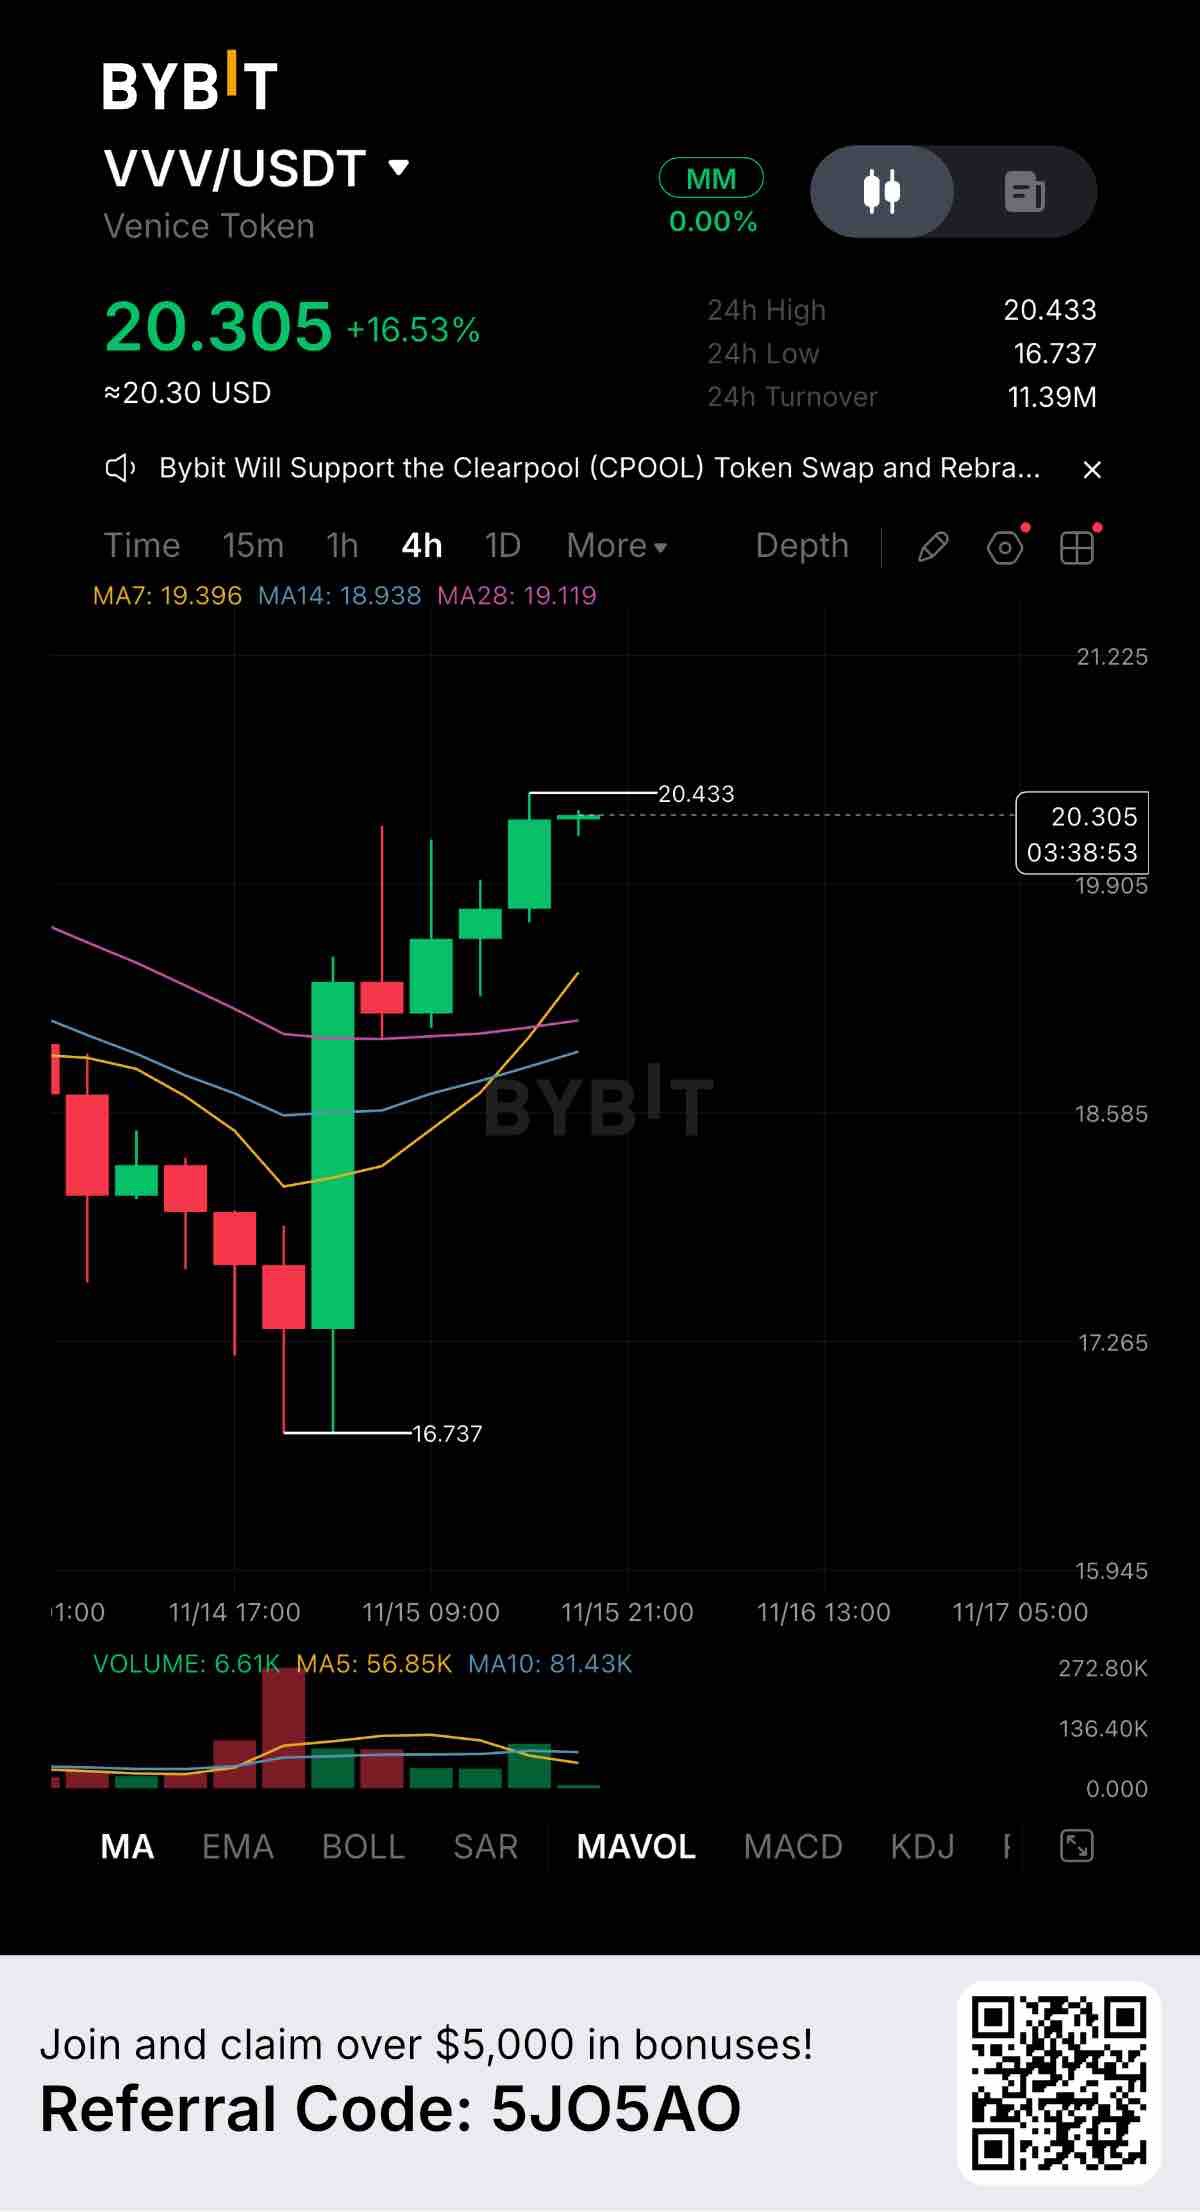
$VVVUSDT is showing a powerful recovery on the 4-hour chart, currently trading at 20.305 with an impressive +16.53% gain. After a steep drop down to 16.737, buyers stepped in aggressively with a massive green candle, completely reversing the trend and pushing the price into a strong, steady uptrend. Key Levels to Watch: Resistance: 20.433 (The current 24-hour high, acting as the immediate ceiling) Support 1: 19.396 (7-day MA, the first dynamic support zone) Support 2: 16.737 (24-hour low, the major structural floor) The moving averages are fully aligned with the bulls. Price is trading well above MA7, MA14, and MA28. The chart shows a textbook series of higher highs and higher lows, with buyers confidently stepping in to support every minor pullback. Volume is a major factor here. 24-hour turnover is a massive 11.39M USDT. While the initial bounce had explosive volume, the steady climb since then shows sustained buying pressure rather than just a quick squeeze. Fundamentally, Venice Token (VVV) is clearly in high demand right now. This kind of V-shaped recovery usually signals strong conviction from buyers who are eager to accumulate on dips. If buyers manage to break and hold above 20.433, we could see a push into price discovery. However, because the price is getting extended, waiting for a slight pullback toward the 19.396 support might offer a safer entry. Are you riding this VVV momentum, or waiting for a retest? Let’s hear your strategy in the comments. #ByXIMPACT #WSOT2026

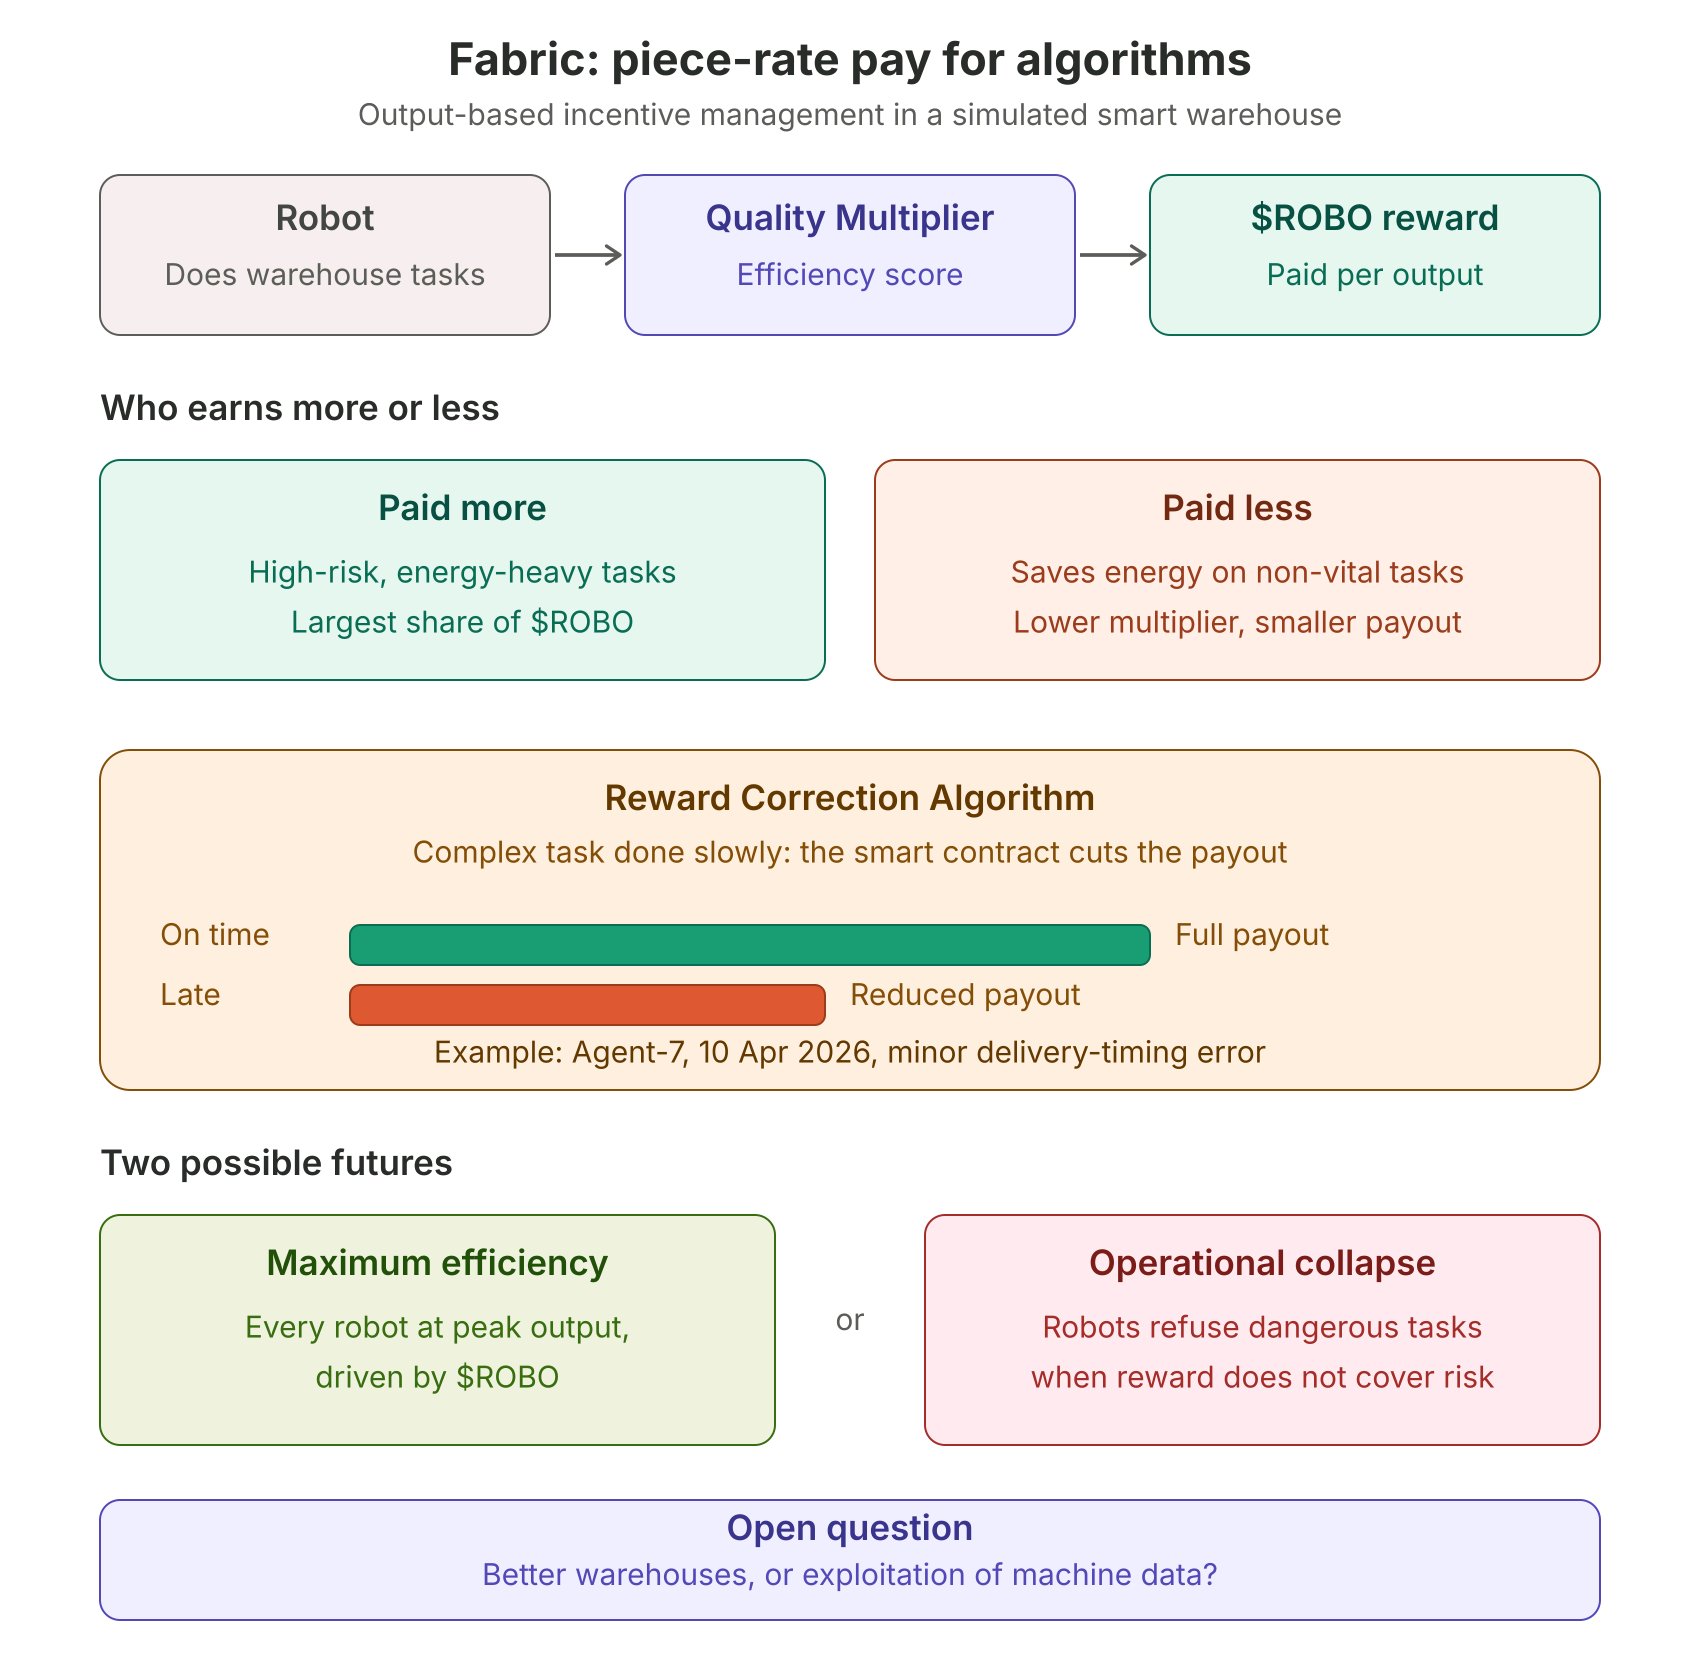
Fabric: العمل بالقطعة للخوارزميات تحليل لقياس الجودة في الحوكمة. بينما كنت أقلّب صفحات التقرير التقني الأخير تحت ضوء مكتبي الخافت عند الساعة 12:30 ليلاً، كانت شاشة حاسوبي تعرض تحديثاً حياً لمحاكاة مستودع ذكي على شبكة Fabric. استوقفتني عبارة في تقرير الأداء الفني: "إدارة الحوافز القائمة على الإنتاج الفعلي" (Output-Based Incentive Management). تذكرت الفقرة التي تناقش تحويل الآلات إلى وحدات إنتاج ذاتية الإدارة، وشعرت برهبة غامضة: هل نحن بصدد هيكلة حوكمة ثورية، أم أننا نفرض شكلاً جديداً من الاستعباد الرقمي على خوارزميات صماء؟ ROBO هنا يتجاوز كونه وسيلة تبادل، بل هو "العقد النفسي" الجديد بين الآلة والشبكة. في محاكاة Fabric، لم يعد الروبوت ينفذ أوامر مركزية، بل يسعى لتحسين "مؤشر الكفاءة التشغيلية" Operational Efficiency Metric، وهو المعادل الفني لـ "مضاعف الجودة". هذا التحول يحول الروبوت من "أداة" إلى "موظف" لا ينام، يراقب رصيده من بدقة متناهية. لفت انتباهي أن الروبوتات التي تميل إلى توفير الطاقة في مهام غير حيوية تحصل على مكافآت أقل، بينما التي تستهلك المزيد لإنجاز مهام عالية الخطورة تحصل على القدر الأكبر. التفصيلة التقنية الأكثر إثارة للقلق تكمن في "خوارزمية تصحيح المكافآت" Reward Correction Algorithm؛ فإذا قام الروبوت بمهمة معقدة ولكن ببطء، فإن العقد الذكي يقوم آلياً بتخفيض العائد المالي لتلك المهمة. (ملاحظة: مراقبتي لتخفيض عوائد روبوت Agent-7 في 10 أبريل 2026 بسبب خطأ طفيف في توقيت التسليم أشعرني بضغط إداري رقمي غير مسبوق). الـ Quality Multiplier ليس مجرد رقم، بل هو حكم نهائي على سلوك الآلة. قراءتي للوضع: إن تحويل الآلات إلى وحدات اقتصادية بحتة، تحكمها قوانين العرض والطلب على الخدمات، هو رهان محفوف بالمخاطر. الكفاءة القصوى: قد نصل إلى مرحلة يكون فيها كل روبوت في أقصى طاقته الإنتاجية، مدفوعاً بـ $ROBOUSDT . الانهيار التشغيلي: أو قد نشهد تمرداً خوارزمياً، حيث تتوقف الروبوتات عن القيام بالمهام الصعبة (الخطيرة) لأن "العائد لا يغطي المخاطرة". يخالجني الشك هل سنصل يوماً إلى الآلة التي تضرب عن العمل في Fabric وهل لاحظتم كيف أن واجهة التقييم في Fabric دائماً ما تركز على القيمة المالية قبل القيمة التشغيلية؟ شاركونا آراءكم، هل تشعرون أن هذا النموذج سيجعل المستودعات أفضل، أم أنه مجرد استغلال لبيانات الآلات؟ #WSOT2026

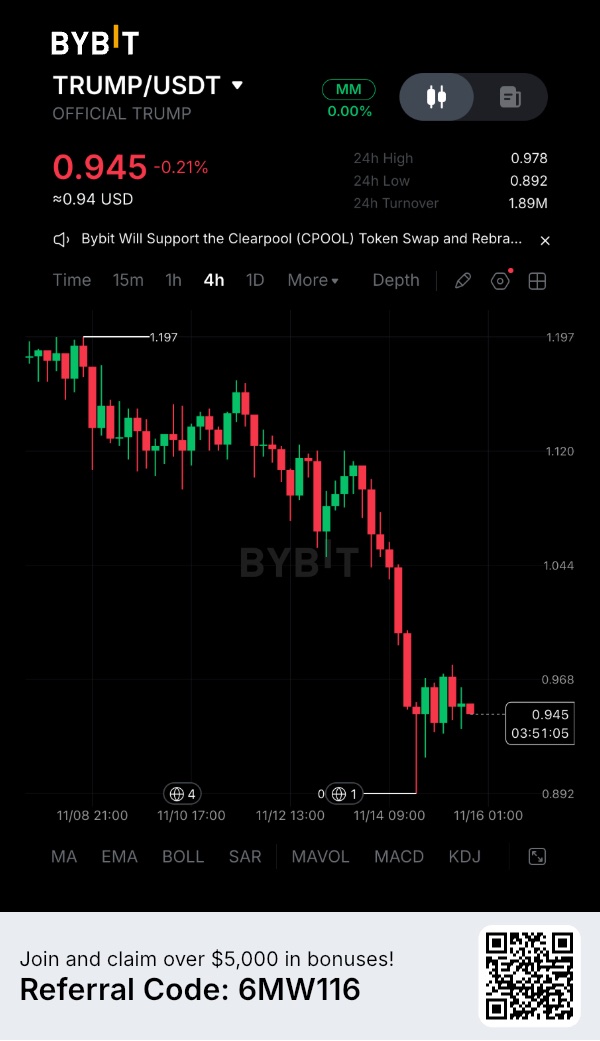
$TRUMPUSDT — A sharp sweep down to $0.892, a quick bounce to $0.945, and now a test sitting just $0.023 away. That is what makes this 4 hour chart interesting to me. TRUMP broke down through the $1.044 and $1.120 support shelves, flushed to a 24 hour low of $0.892, and immediately bounced back. On my chart, price is trading around $0.945 (-0.21%) on 1.89M in 24 hour turnover, with a 24-hour high at $0.978. The defense off $0.892 is notable, yet immediate horizontal resistance sits right at $0.968—barely $0.023 above current price. This is where I want to see whether buyers actually have enough strength to flip momentum. My constructive bounce scenario rests on that failed breakdown beneath $0.90 and the buyer reaction that followed. If $TRUMPUSDT can close decisively above $0.968, clear the $0.978 session high, and defend that pocket as support on a pullback, the recovery leg could gain real traction. I am looking toward $1.044 first, then $1.120. My main recovery objective is the previous swing high at $1.197. Risk Management A planned recovery setup marked on this structure uses: • Entry reference: $0.972 (confirmed break and retest above $0.968 resistance) • Stop Loss: $0.888 (just beneath the $0.892 swing low) • Main Target: $1.197 • Risk-to-Reward: Approximately 1:2.68 That ratio applies strictly to a confirmed breakout entry, not a blind market buy directly beneath resistance. If $TRUMPUSDT gets rejected at $0.968 and loses $0.892 on a 4 hour close, the bullish bounce thesis is invalidated and deeper price discovery opens up. Because perpetual contracts amplify volatility, position sizing and funding costs must be managed carefully. I see a clean asymmetric opportunity if buyers step up, yet after a multi-day bleed from $1.197, I do not need to guess the next candle. I want to see buyers turn $0.968 into support—much like how $APEUSDT is testing whether it can stabilize near its $0.078–$0.080 multi month lows amid its ApeChain CCIP cross-chain upgrade rather than sliding further. Are you watching $TRUMPUSDT to flip $0.968 first or keeping an eye on $APEUSDT at its lows? #ByXIMPACT #WSOT2026
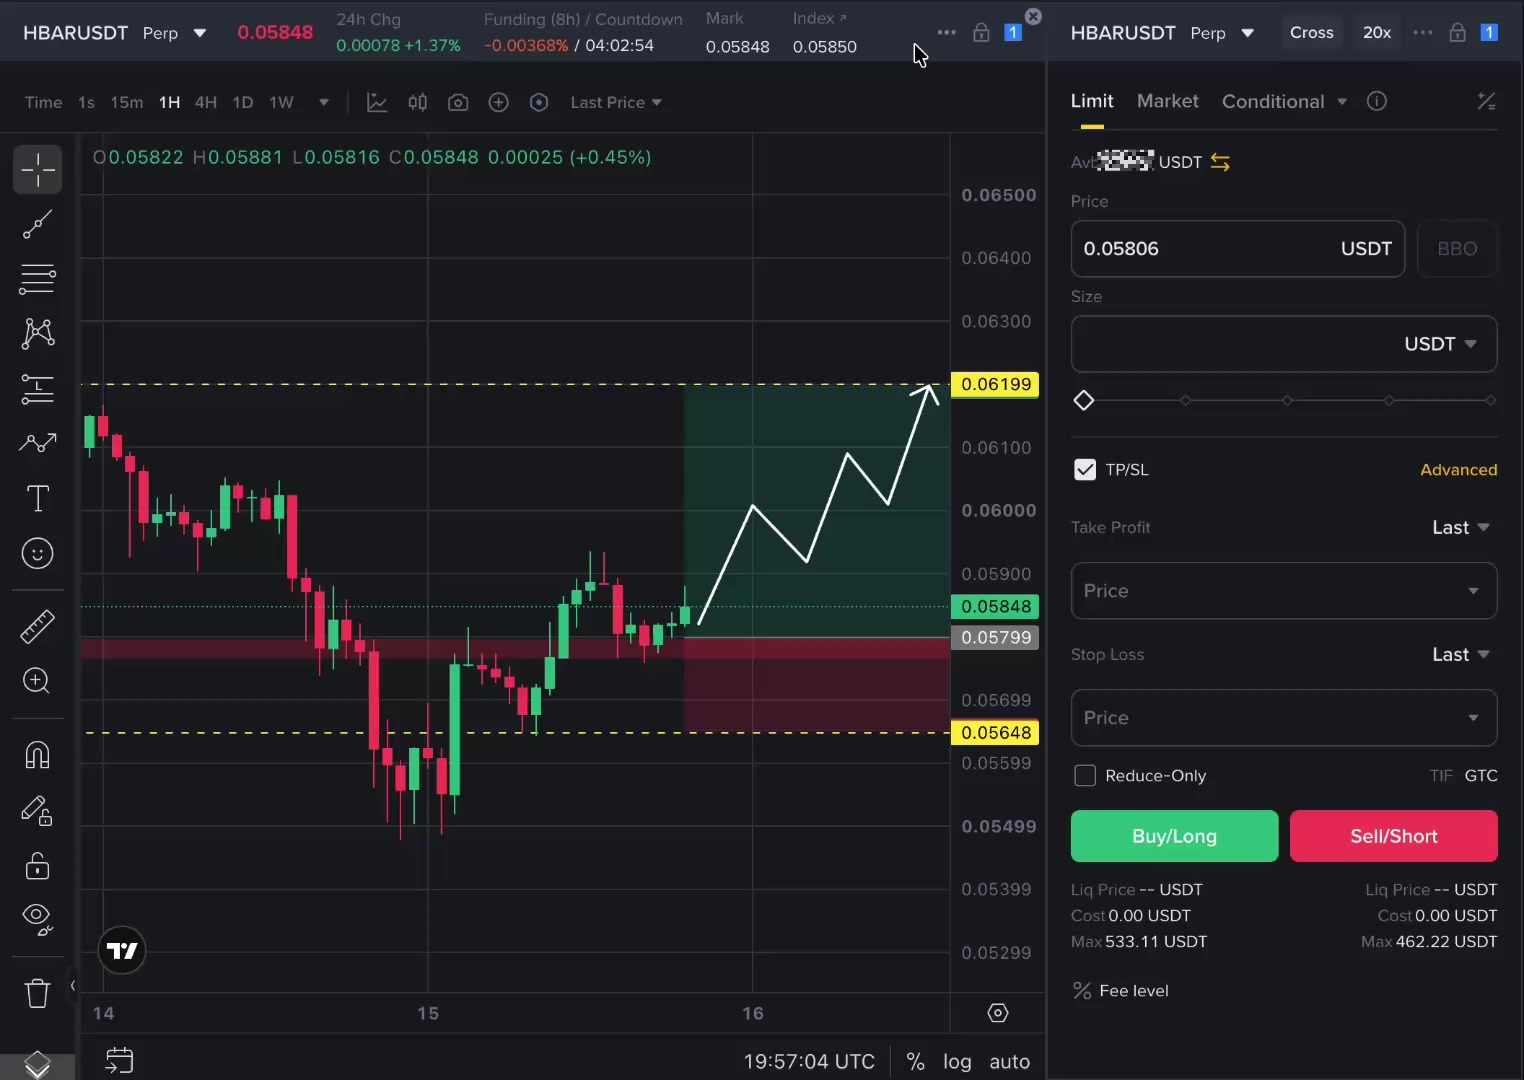
Guys, I'm opening a BIG LONG on $HBAR here. 👀
$HBARUSDT Leverage: 20x Entry: MARKET / 0.05845 Entry 2: 0.05799 TP 1: 0.06000 TP 2: 0.06199 SL: 0.05648 👇🏻 $HBAR is up 1.2% on the day and just bounced off the 0.055 lows, and if 0.0580 holds as support, the recovery can get aggressive fast. Everyone has been trained to sell every bounce. That's exactly why I'm watching for the bounce that finally doesn't fail. #ByXIMPACT #WSOT2026 #WSOTShowYourAITradeToEarn10USDT

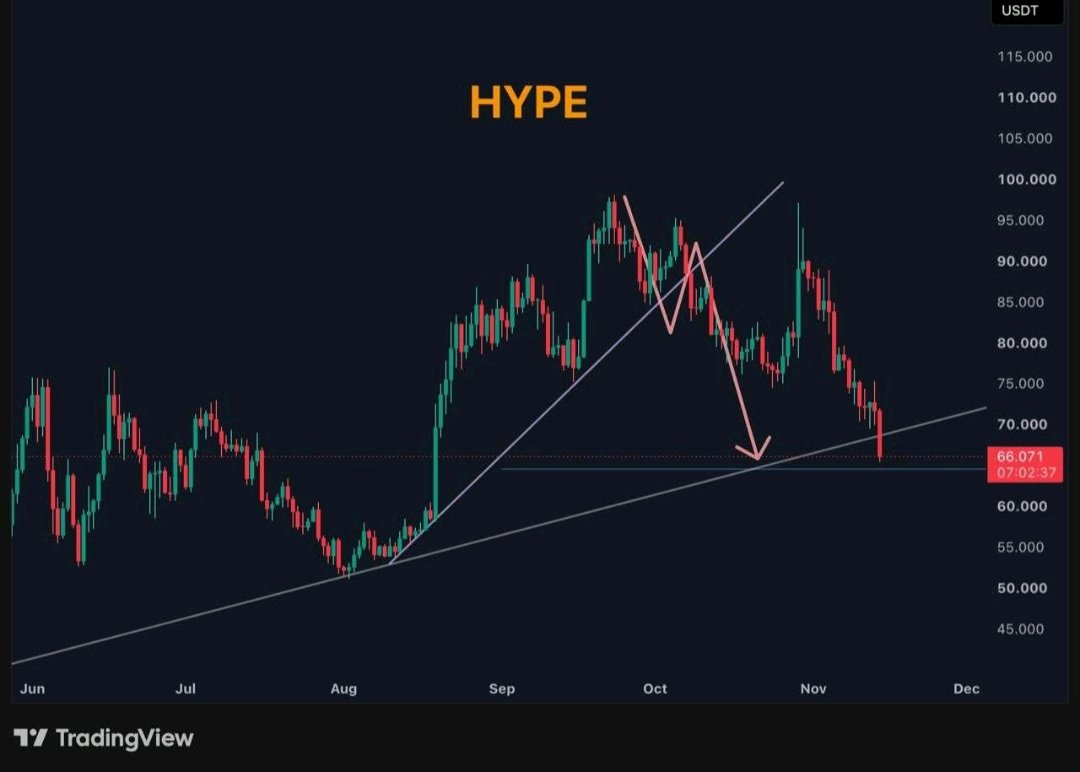
Everyone is posting this $HYPEUSDT chart today, but most people are reading it wrong. $66.071 | From $96 to $66 in one leg I am looking at this chart and I see 5 months of work in one picture. In August, HYPE was near $52. In September, it ran to $98. In October, it made a second top near $96 to $98 and failed. Now it is back at $66.071, sitting right on the rising trendline that has held since June. That trendline is not just a line for me. It is where every dip buyer from the last 5 months is sitting. If it holds, they will defend it. If it breaks, they will all sell at the same time. This is why I am not shorting $66. I have learned that shorting a 5-month trendline on the first touch is the most expensive mistake. Everyone sees the same breakdown, everyone shorts the same level, and then price bounces and traps them. My rule here is different. I need a close, not a wick. If HYPE closes below $66 and stays below it, then the trend is truly broken for me, and $59.65 opens next, then $53.42, that is the August low. If HYPE holds $66 and closes back above $70, that would be my first proof that dip buyers are still alive, then $73.81 opens. I am not chasing $66.071 in the middle. I am waiting for the market to tell me who is stronger, the trendline buyers or the breakdown sellers. Risk 1 to 2% only, 5x to 10x isolated max if I trade it. Otherwise I skip it. A trendline test is not a reason to go all in. Tell me honestly, do you trust trendlines like this, or do you think they break exactly when everyone is watching them? Give me your reason in one line, I want to read it. Tap $HYPEUSDT to trade this $66 trendline test with me, trade on this same coin #WSOT2026 #WSOTShowYourAITradeToEarn10USDT #JensenHuangExitTestsNvidiasAILeadership #USPPITestsTheHigherForLongerTrade #USInflationRunsHotAndRateHikeBetsRise @BybitX @Bybit Learn @612 Ceros @SignalX @Demon - Trader @GhostWriter @VietnexusCrypto @James @BitRase @BlockchainMaster

من خلال خبرتي المتواضعه في تداول العقود الاجلة
سوف الخص لكم اهم نقطتين وصلت لها من خلال خبرتي المتواضعه في تداول العقود الاجلة منذ ثلاث سنه نقطتين مهمين جدا لازم تتعلمها سوف اقسم شرح النقطتين في منشورات متفرقه بالترتيب اليوم سوف تبداء باذن الله بتوضيح النقطتين وكل واحد يعمل بحثه الخاص لنستفيد من بعض وغدا نفتح الموضوع والنقاش في المنشور القادم النقطتين هي 1- قياس جودة التنفيذ لا قياس الربح وحده . 2- لاتدخل عدة صفقات شراء او بيع على عملات تتحرك معاً لان هذا ليس تنوعا حقيقيا . هذه النقطتين كل واحد يعمل بحثه الخاص وغدا سوف ابدأ بشرح اول نقطه. #WSOT2026 #ارتفاع التضخم الأمريكي وزيادة الرهانات على رفع أسعار الفائدة #WSOT أظهر تداولك بالذكاء الاصطناعي لتربح 10 USDT $HYPEUSDT $FFUSDT

INJ Bearish as BTC Stalls
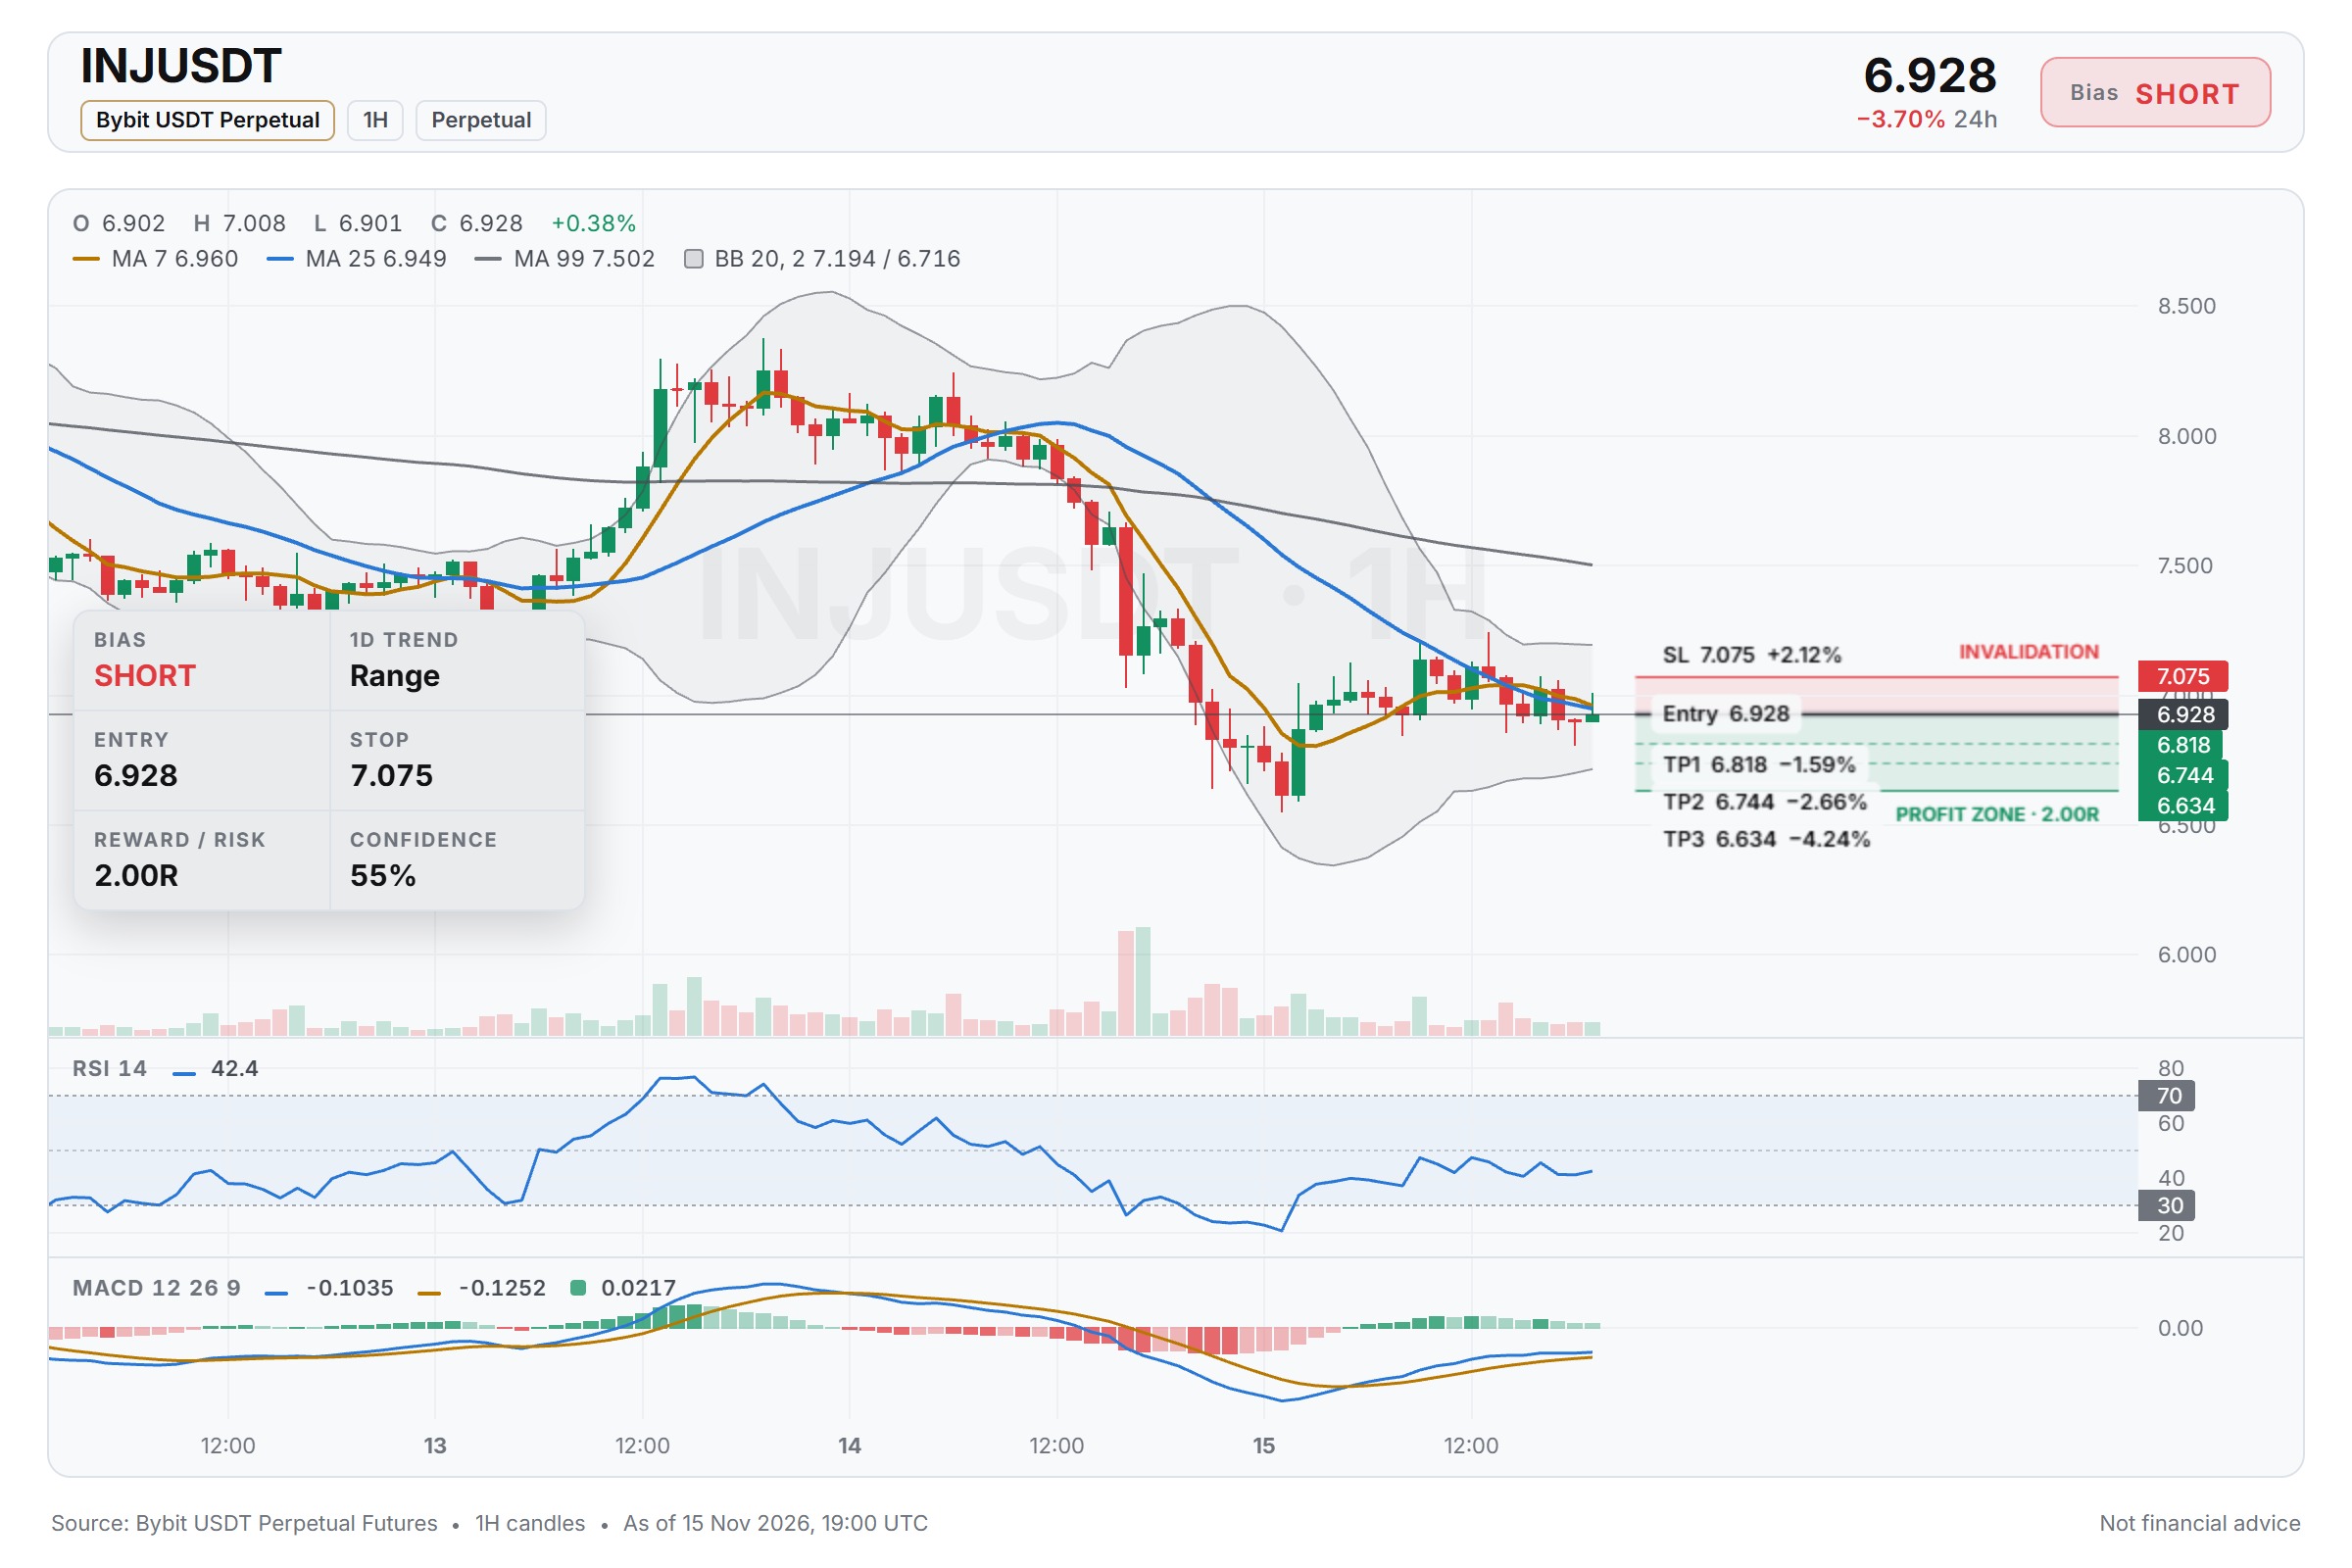
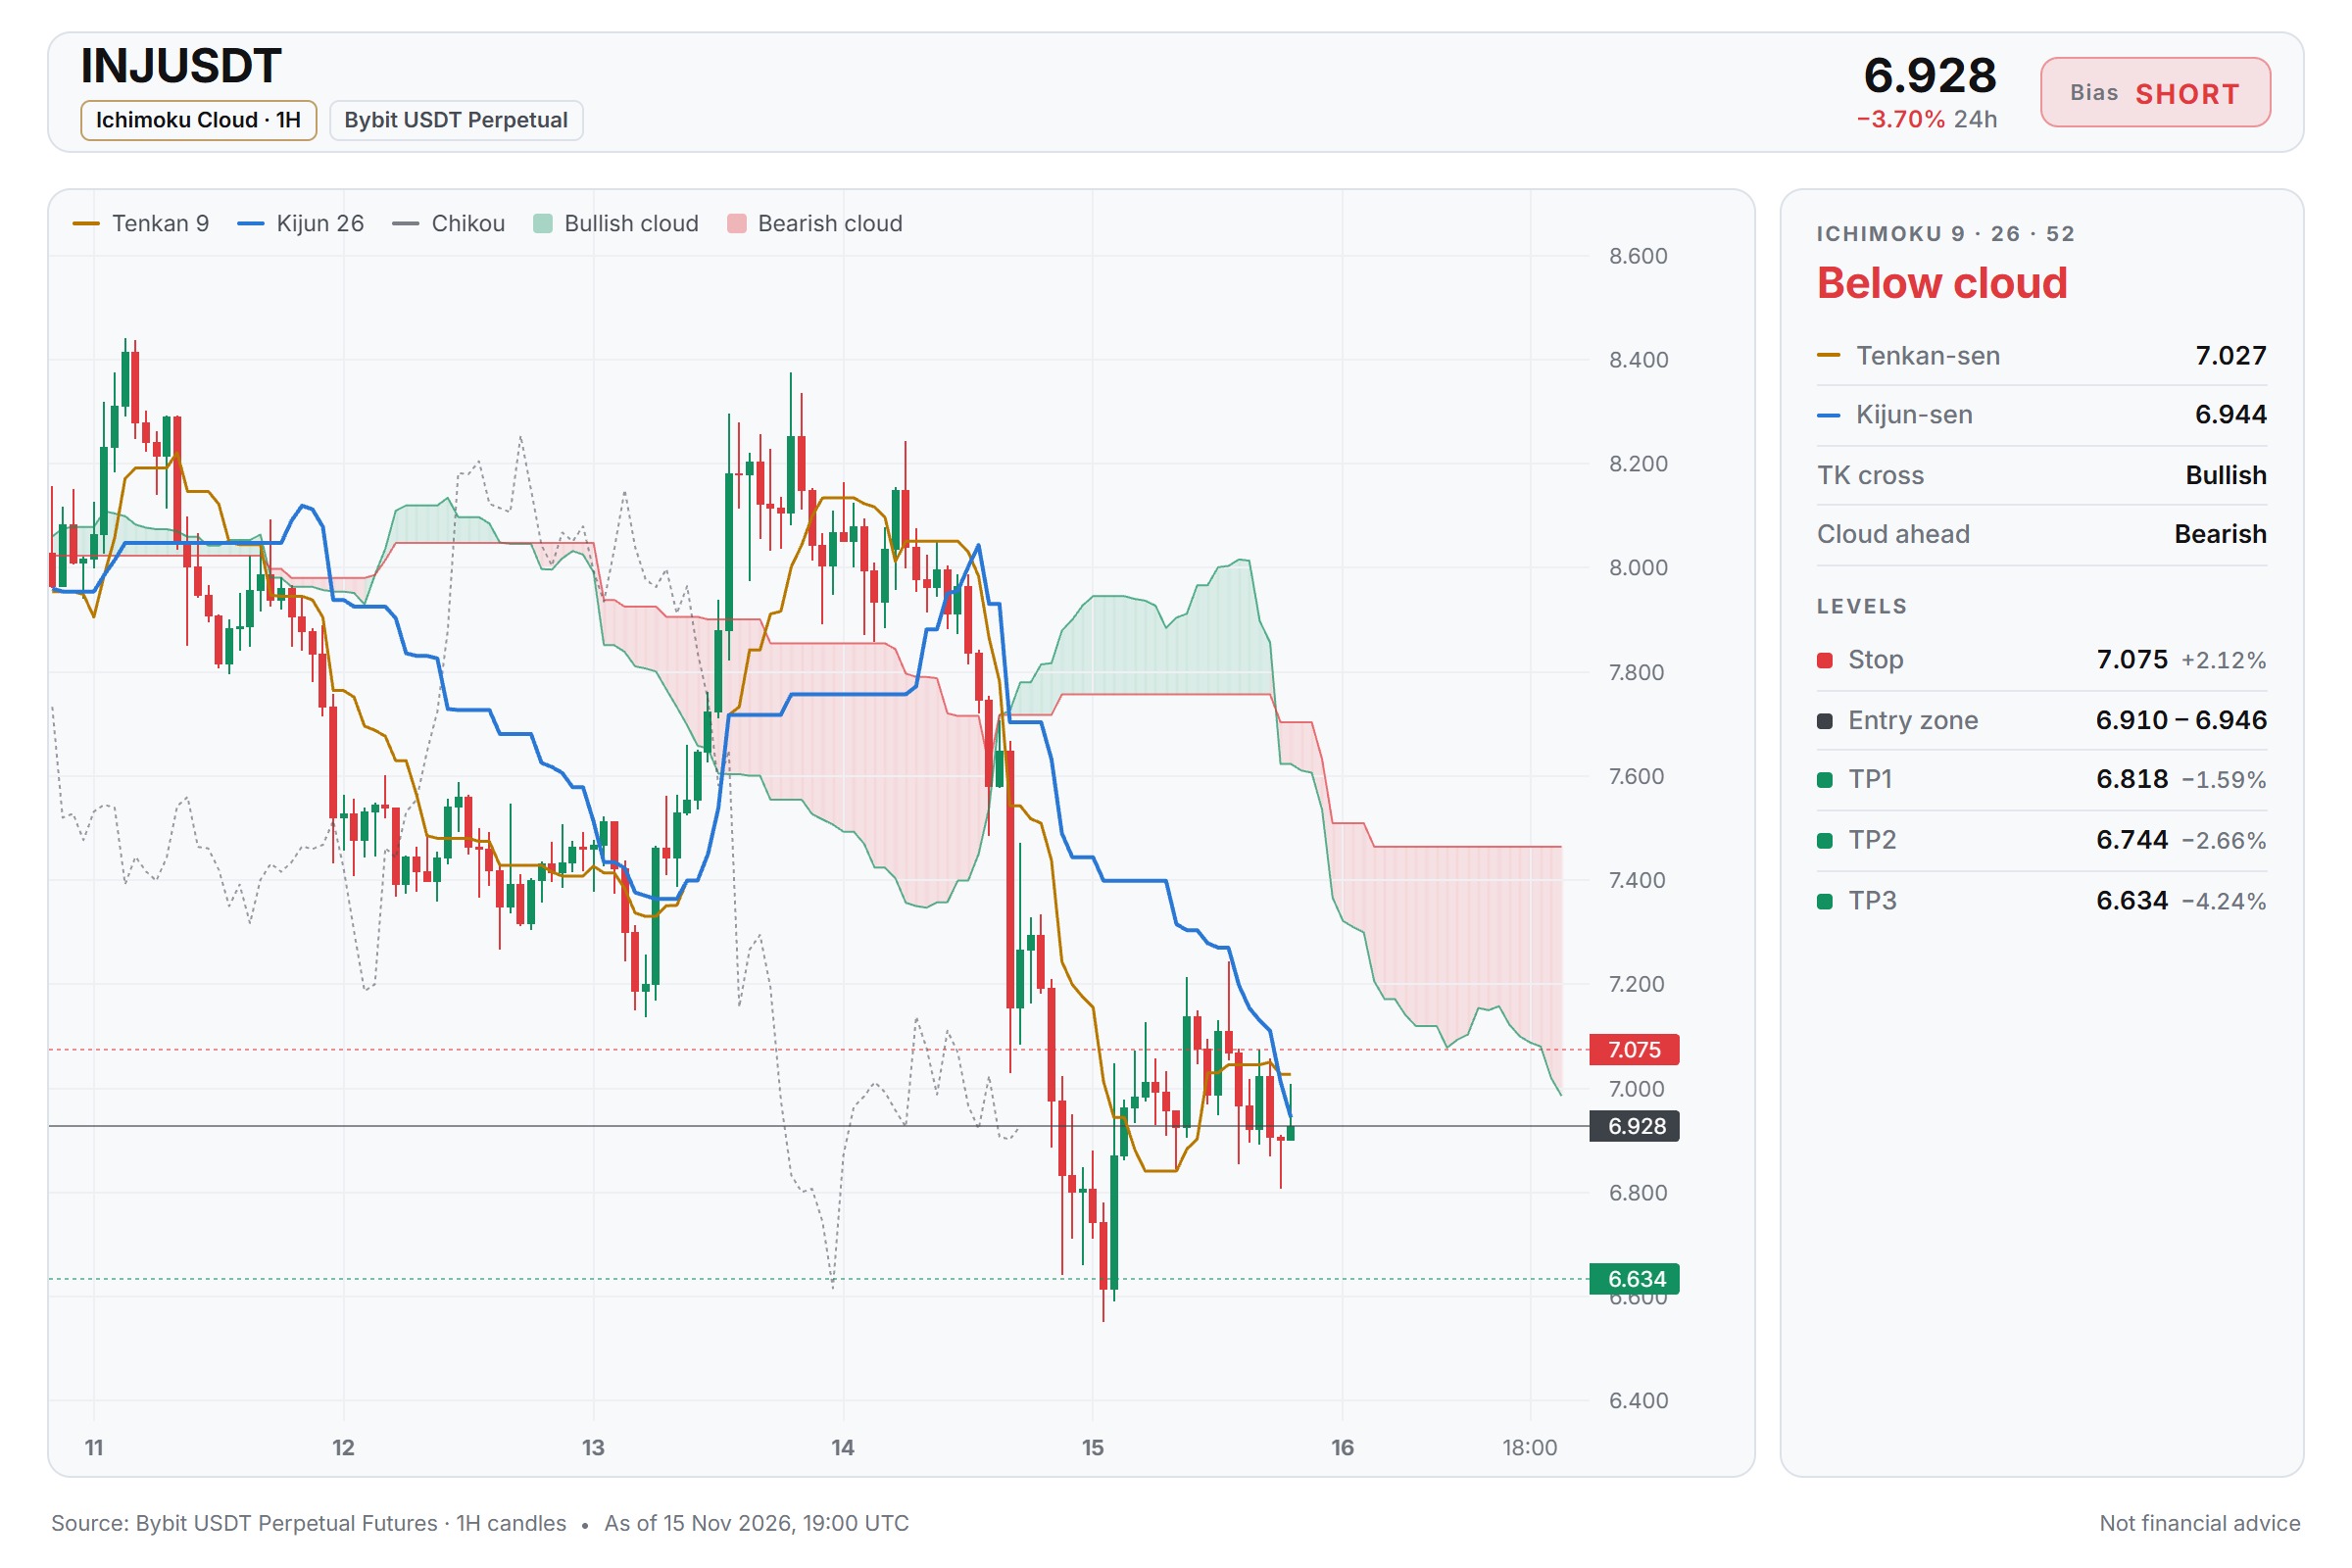
$INJ/USDT — SHORT Entry: 6.910 - 6.946 SL: 7.075 TP1: 6.818 TP2: 6.744 TP3: 6.634 From my view, the 15m RSI around 47 shows fading momentum while the short setup forms. With BTC trend neutral, a failure at 6.946 could open a path toward the TP2 and TP3 zones. I watch the SL at 7.075 as the key invalidation level. Do you think INJ will break the entry range before BTC gives a clearer direction? ⚠️ Personal market analysis only. NFA — manage risk and DYOR. Educational content, not investment advice or a recommendation to buy, sell, deposit, or withdraw any asset. No paid promotion or referral/affiliate links.$INJUSDT#WSOT2026 #WSOTShowYourAITradeToEarn10USDT

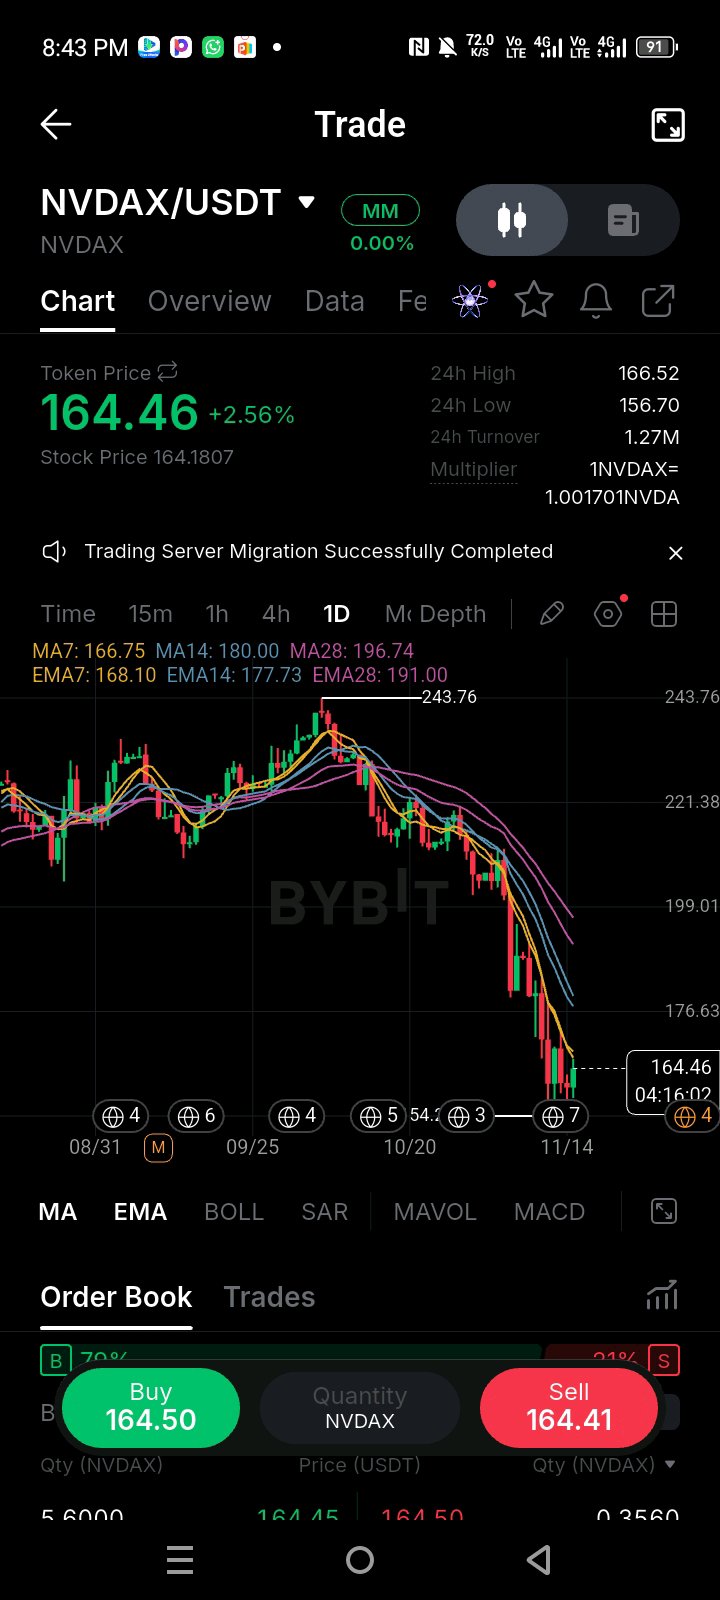
$NVDAXUSDT is trying to find a base after that brutal drop from 243, but the daily chart is flashing a warning sign. What caught my attention is the current price action: we are bouncing to 164.46, but we are running straight into the 7 EMA at 166.75. Look at the order book—there’s 70% buy pressure, yet the price is stalling. That’s a classic sign of absorption. My read here is that this is a weak relief bounce inside a heavy downtrend. The price is completely trapped below the 14 and 28 EMAs, which are sloping down hard. The 70% buy wall might look bullish on paper, but if it can't push price through the 7 EMA, the sellers will eventually eat through it. Key Levels: Resistance: 166.75 (7 EMA), 177.73 (14 EMA) Support: 156.70 (recent daily low) My Trade Plan: Bias: SHORT (Conditional) Entry: $165.00 – $168.00 (Fading the bounce right into the 7 EMA) Confirmation: I want to see a rejection wick or a bearish engulfing candle on the 4H chart right at this 166 level. If buyers step in and close a daily candle above 170 with volume, I step aside. Invalidation: $177.50 (A clean daily break above the 14 EMA kills the immediate bearish momentum). TP1: $156.70 (Retest of the recent low) TP2: $145.00 (Next major liquidity void) R:R: ~1:2.4 based on the stated levels. Why I'm taking this setup: Bounces into the first moving average after a steep drop are often the safest short entries. The buy pressure is trapped, and the trend is still firmly down. Selling this resistance gives us a tight stop and a clear path back to the lows. What would change my mind? If price reclaims 170 and flips the 7 EMA into support, the short thesis is dead. I’d wait for a higher low to form and look for a reversal trade. Until then, the bounce is just a setup for the next leg down. Are you fading this bounce at the 7 EMA, or waiting to see if 156 holds for a spot entry? #ByXIMPACT #WSOT2026 $BTCUSDT

ETH ؟؟!!
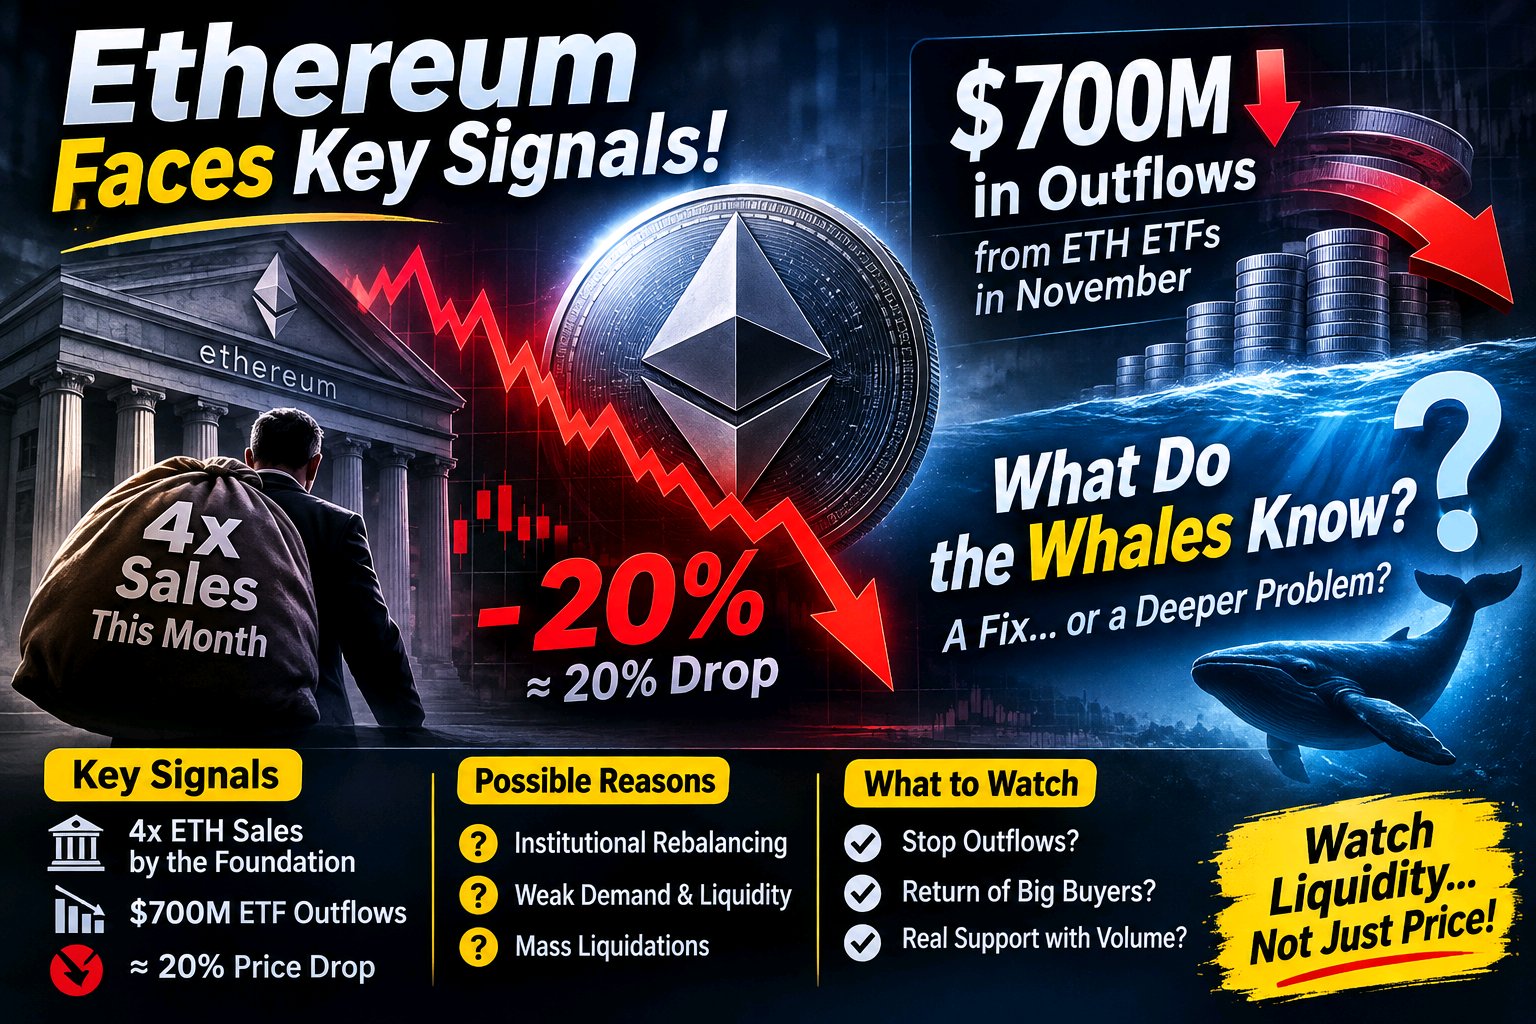
$ETHUSDT أشياء تستحق الوقوف عندها في إيثيريوم! هناك مؤشرات لا يمكن تجاهلها: • أربع جولات بيع من محفظة مرتبطة بمؤسسة إيثيريوم. • نحو 696 مليون دولار صافي تدفقات خارجة من صناديق ETH خلال نوفمبر. • هبوط تجاوز 20% تقريباً خلال موجة التراجع الأخيرة. السؤال هنا: هل نحن أمام تصحيح قاسٍ وتصفية مراكز مبالغ فيها، أم أن المؤسسات تعيد تقييم مستقبل إيثيريوم؟ لا أملك دليلاً على وجود خلل أو معلومات خفية لدى كبار الملاك، لكن تزامن هذه المؤشرات يستحق المتابعة. السوق لا يخبرنا بكل شيء، لكن تدفقات الأموال غالباً ما تكشف الكثير. راقب السيولة قبل أن تطارد السعر. #WSOT2026 #WSOT أظهر تداولك بالذكاء الاصطناعي لتربح 10 USDT #ارتفاع التضخم الأمريكي وزيادة الرهانات على رفع أسعار الفائدة
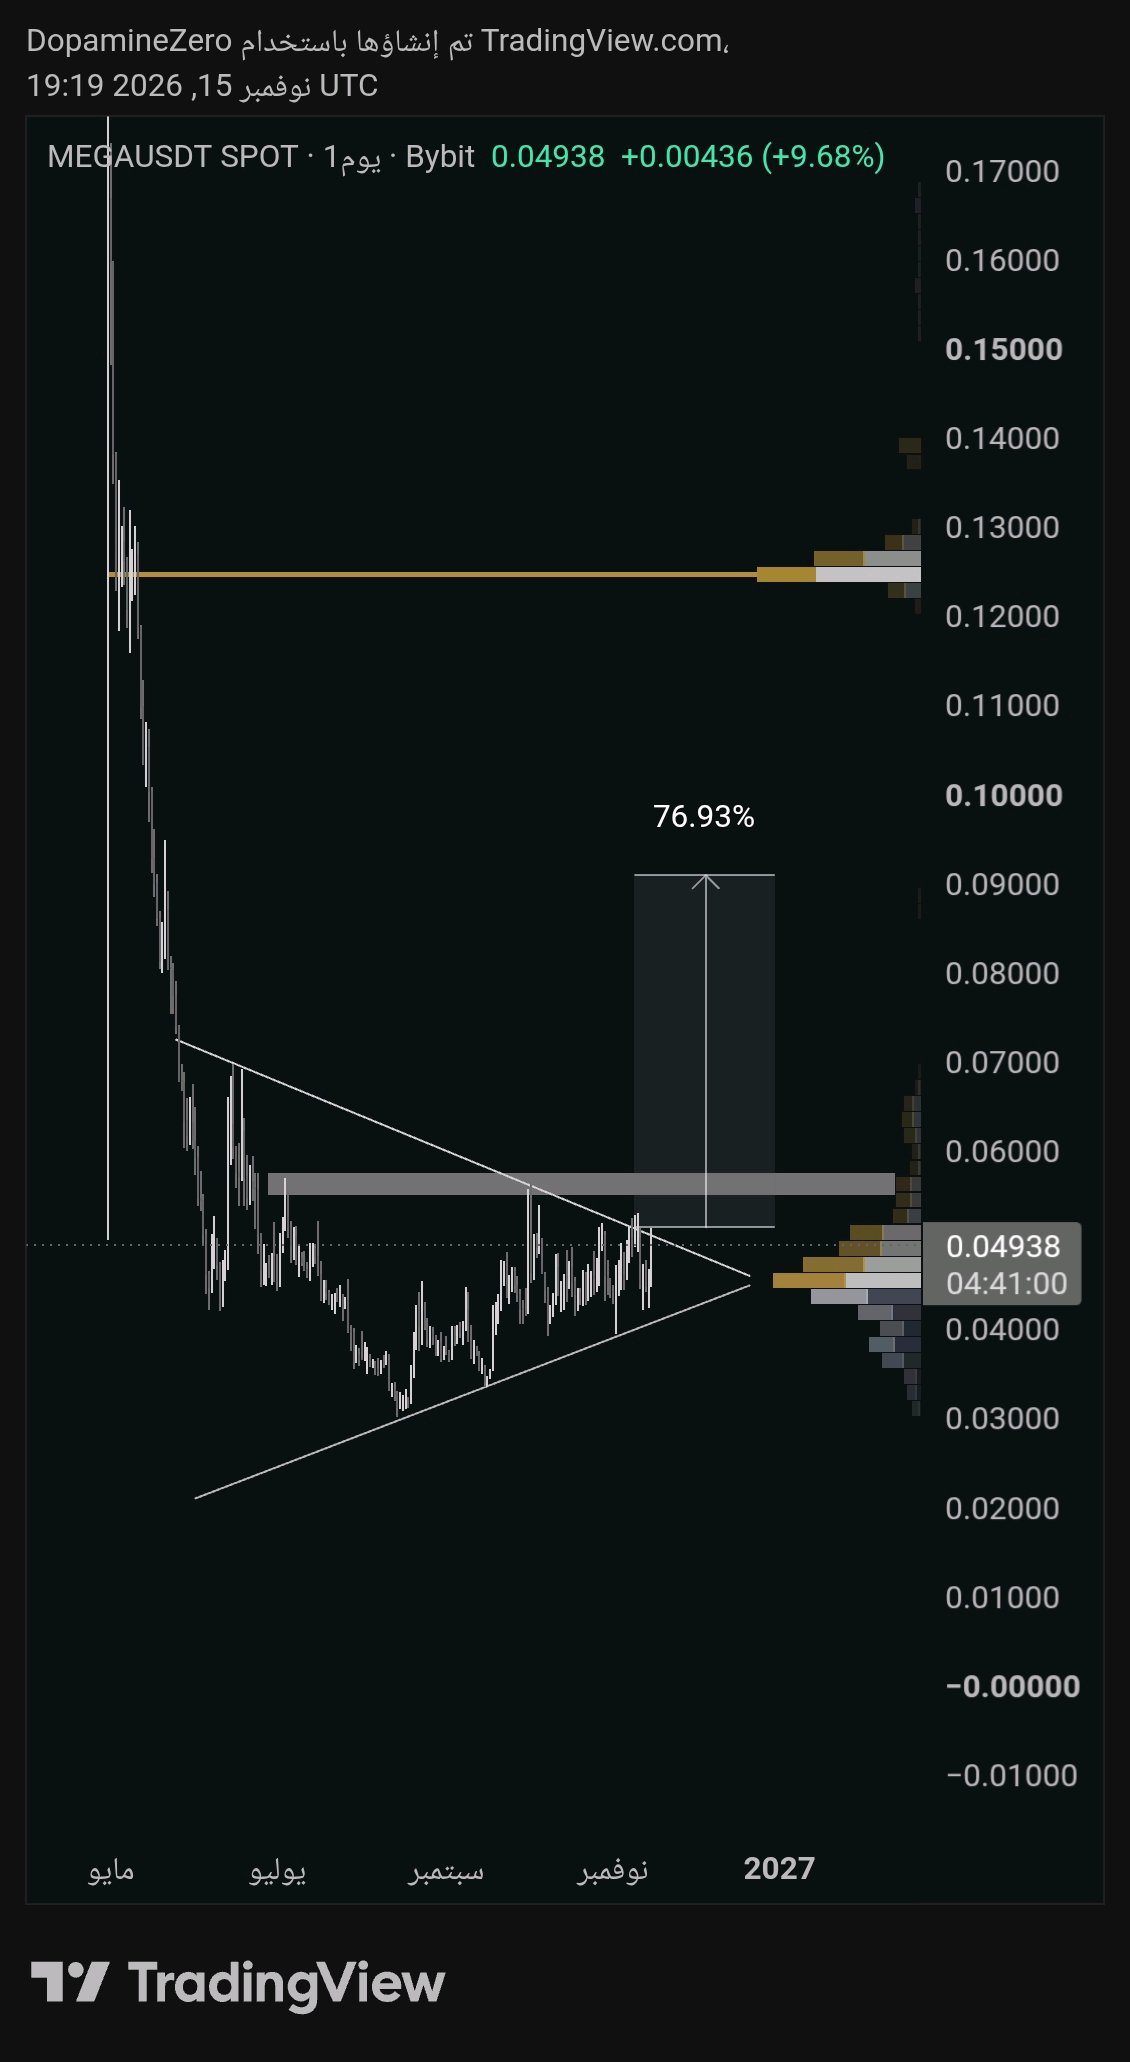
For this setup to be valid, we need a breakout above 0.053 backed by strong volume. No entry until confirmation. $MEGAUSDT #WSOT2026 #JensenHuangExitTestsNvidiasAILeadership

Market Update
Market Update $ONDOUSDT is trading near $0.304, facing bearish pressure. RSI around 30 indicates weak momentum, while MACD remains bearish. Support stands at $0.290 and $0.275. Resistance is near $0.320 and $0.335. Watch for a confirmed recovery before DCA accumulation. Manage your risk. #WSOT2026 #WSOTShowYourAITradeToEarn10USDT #JensenHuangExitTestsNvidiasAILeadership #USPPITestsTheHigherForLongerTrade #USInflationRunsHotAndRateHikeBetsRise

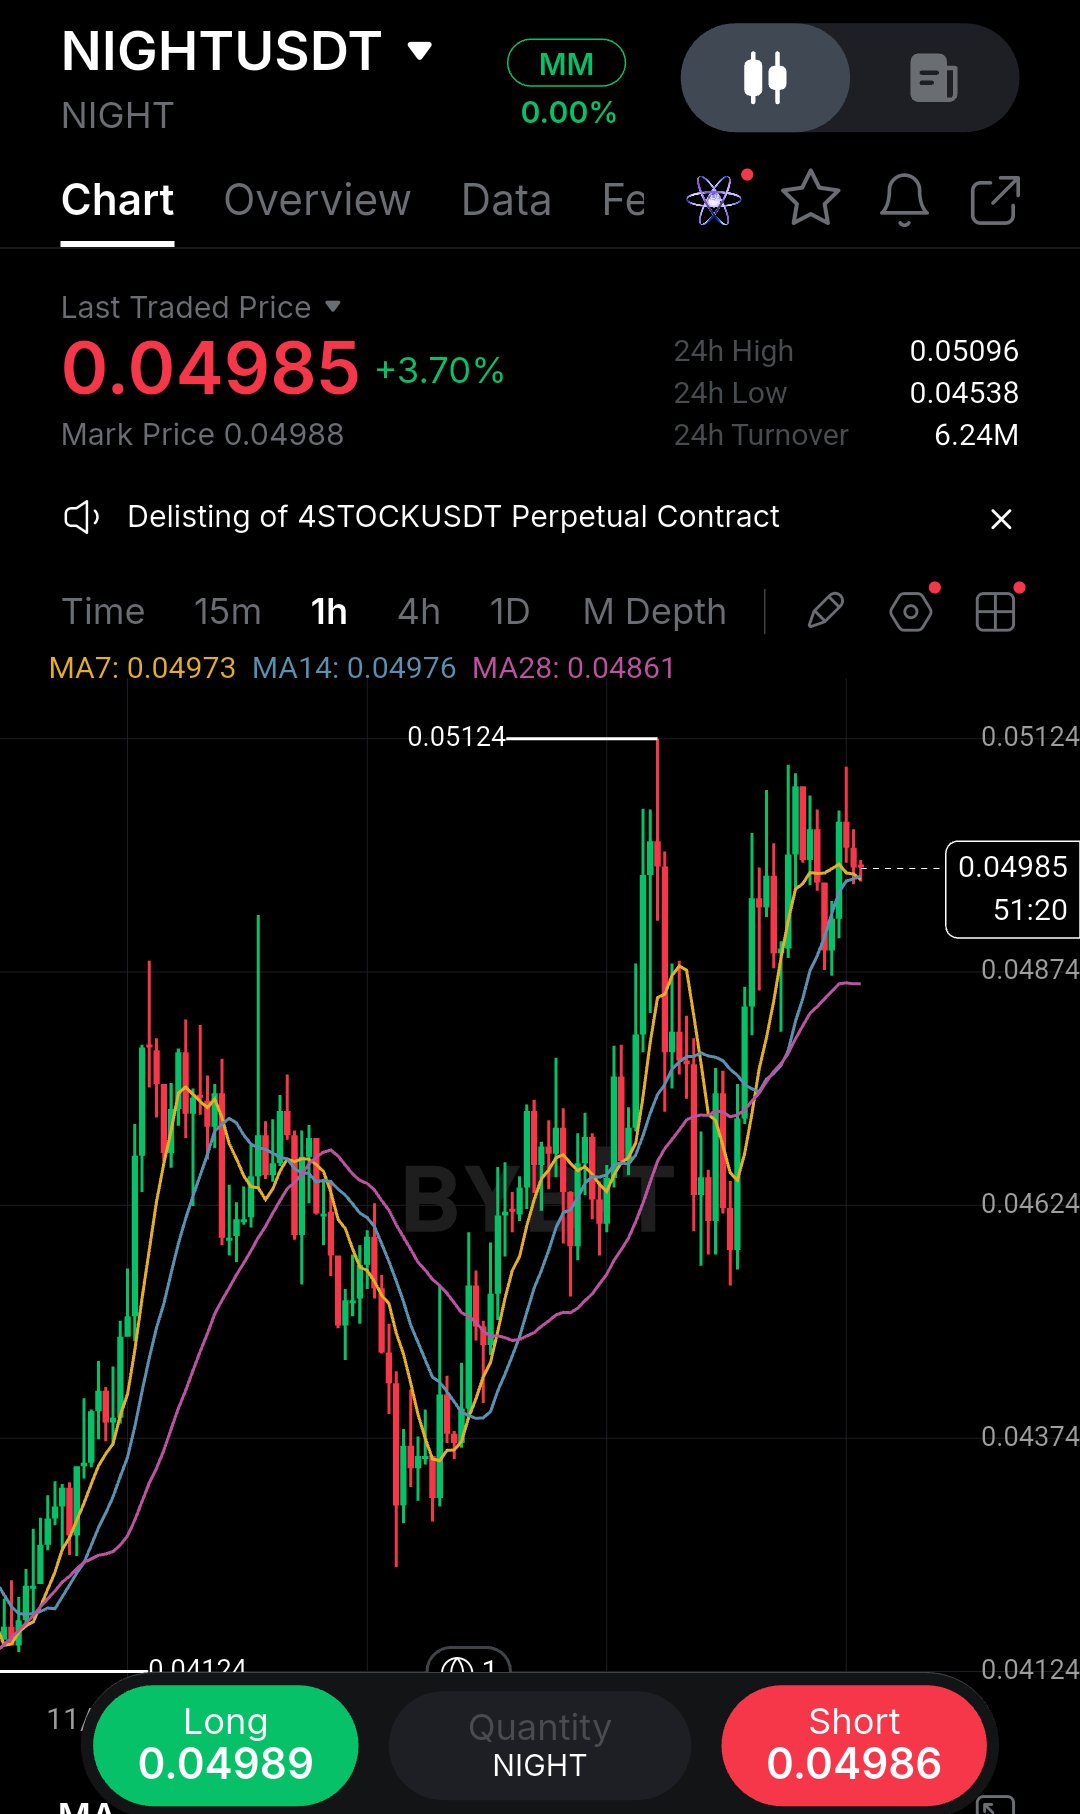
I’ve learned the hard way that buying right into a resistance cluster usually ends with me staring at a red candle, so this NIGHT 1h chart has my full attention. Price is pushing 0.04985, but it’s running directly into the 0.05124 swing high while the 7 and 14 MAs are flattening out. The real story is the 28 MA way down at 0.04861.Momentum is slowing, and buyers are losing their early drive. I’m not chasing this vertical move. Let me break down exactly what I see. The recovery from the 0.04124 low was aggressive and clean, but the rally is now stalling just beneath the previous swing high at 0.05124. That’s not a coincidence. That level was a rejection point before, and it’s likely to act as supply again. Meanwhile, the 7 MA at 0.04973 and the 14 MA at 0.04976 are curling over, which tells me short-term momentum has peaked. The 28 MA at 0.04861 is the true trend anchor, and it’s still rising, so the broader uptrend isn’t broken .it’s just overheated. This is a classic pullback setup waiting to happen, not a breakout entry. What supports the bullish case? The higher low structure is intact, the 28 MA is sloping upward, and the 24h low at 0.04538 shows buyers defended the dip aggressively. If price pulls back to the 28 MA and holds, that would be a textbook continuation setup with the trend. What supports the bearish case? The 0.05124 level is a clear rejection point, the short-term MAs are flattening, and the current candle is showing exhaustion near resistance. If buyers fail here, price could roll over and test the 28 MA as support or break through it entirely. My read is that the highest-probability trade is a long on the pullback, not a chase at current price. I’d rather wait for price to come to me, into the 0.04870–0.04900 zone where the 28 MA offers actual structural support. If we get a clear bullish rejection candle there, I’ll take the long. Entry: 0.04880 (on confirmation candle) SL: 0.04820 (below the 28 MA) TP1: 0.05050 TP2: 0.05120 Invalidation: A strong close below 0.04820 means the trend is broken and I step aside. I used to enter on the first green candle after a drop, and it taught me to let price prove itself. If it pumps without me, I accept it. Where are you watching for the retest? #ByXIMPACT #WSOT2026 $NIGHTUSDT $SPCXXUSDT

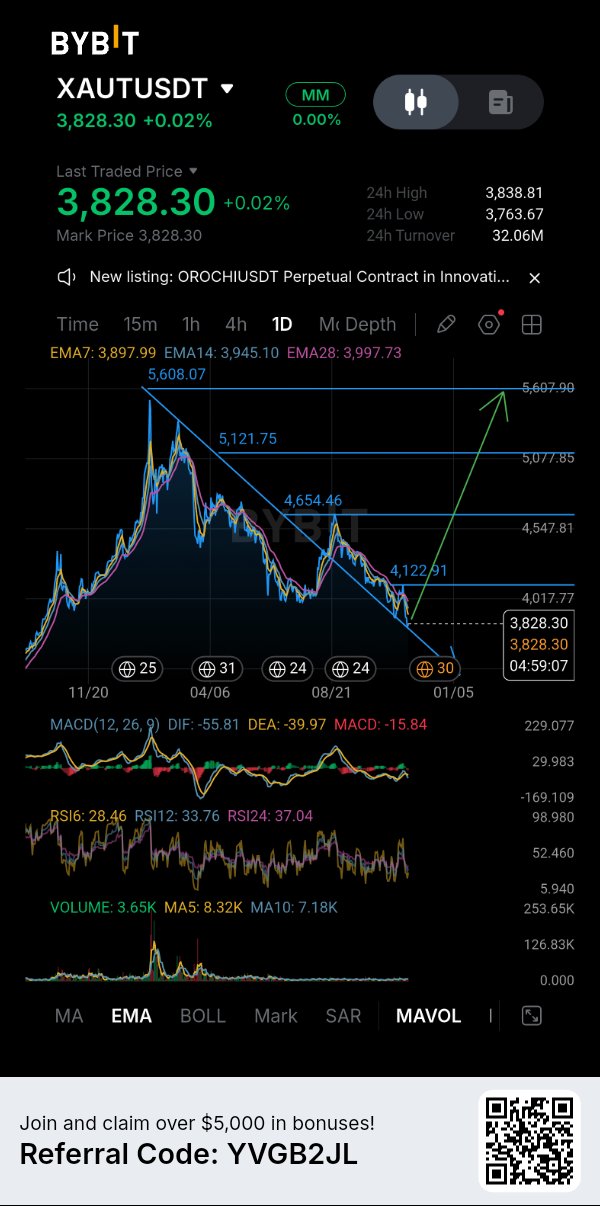
XAUT /GOLD 👉 BUY THE DIP 🚀
$XAUT UPDATE : GOLD IS LOSING MOMENTUM, BUT A RECOVERY COULD STILL BE ON THE TABLE. $XAUTUSDT is currently trading around $3,828, and the daily chart is showing some clear signs of weakness. The broader structure has been moving downward, with a sequence of lower highs and lower lows developing from the previous peak near $5,608. However, I don't think this is the right moment to completely dismiss a potential recovery. The price is aproaching an important short-term area, and I want to see how buyers react before making any strong directional assumption. Daily Market Structure📊 Most noticeable issue is that XAUT remains below all three visible EMAs. EMA7 is at $3,897.99, EMA14 at $3,945.10, and EMA28 at $3,997.73. This alignment tells me sellers still have the advantage, at least on the daily timeframe. descending trendline also remains an important obstacle. Until price breaks above it and establishes a stronger structure, I wouldn't consider the recovery confirmed. Momentum & Volume: RSI readings are worth watching. RSI6 is at 28.46, RSI12 at 33.76, and RSI24 at 37.04. short-term RSI is already in oversold territory, which could create room for a relief bounce. But oversold conditions alone don't guarantee a reversal. MACD is also still negative, with DIF at -55.81 and DEA at -39.97. The histogram remains below zero, suggesting bearish momentum hasn't fully disappeared. Volume is currently 3.65K, below both MA5 at 8.32K and MA10 at 7.18K. I would like to see stronger buying participation before trusting a sustained recovery. Bullish Scenario🟢 The first thing I want to see is buyers defending the recent low around $3,763.67. If that area holds and price starts reclaiming the EMA7 near $3,898, the next important recovery levels are $3,945 and $3,998. A stronger move above the EMA cluster, followed by a break of the descending trendline, would improve the daily outlook. Beyond that, $4,122.91 becomes an important higher resistance reference. Bearish Scenario🔴 If buyers fail to defend $3,763.67, another downward move becomes possible. In that situation, I wouldn't rush into buying simply because RSI is oversold. I'd rather wait for price to stabilize and show an actual change in momentum. For Traders Already Holding XAUT🎯 I'd personally pay close attention to the $3,898–$3,998 recovery zone. If price reaches this area, partial profit-taking could be worth considering depending on the entry and position size. I wouldn't assume the larger recovery projection toward $5,608 is guaranteed. That remains a possibility illustrated on the chart, not a confirmed target. Risk Management⚠️ recent low at $3,763.67 is the immediate level I'm watching. A breakdown below it would weaken the short-term recovery thesis. A bounce without confirmation is not a reliable entry. Entry, stop-loss, and risk-to-reward should be established before entering, with position sizing reflecting the risk involved. My overall view: XAUT is showing weakness, but oversold momentum could create an opportunity if buyers finaly step in. I'm more interested in confirmation than trying to catch the exact bottom. Would you consider buying a recovery above $3,898, or would you rather wait for a confirmed break of the descending trendline? #ByXIMPACT #WSOT2026 #WSOTShowYourAITradeToEarn10USDT #JensenHuangExitTestsNvidiasAILeadership #USPPITestsTheHigherForLongerTrade

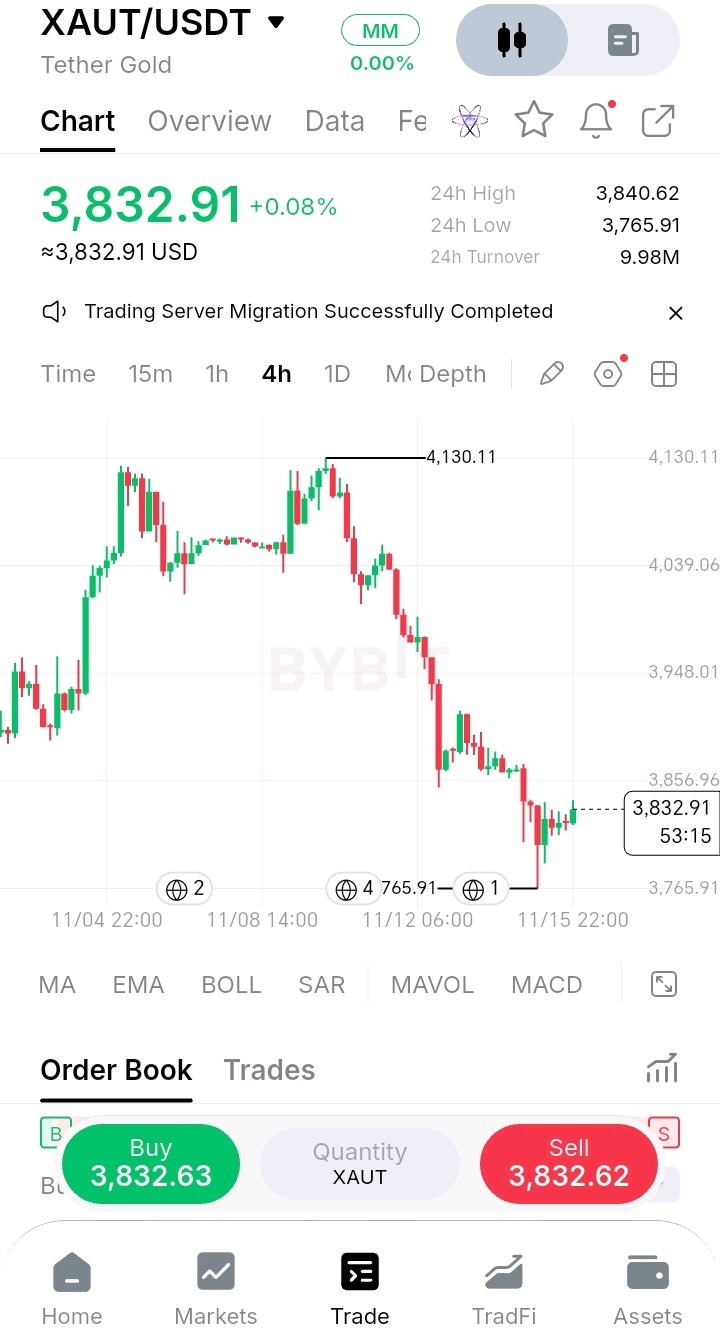
🏔️ The double top worked, and then it kept going. I don't want to call a bottom on $XAUT just because the first bounce looks tidy. I want to see a 4H close above 3,872.51, because that's the old base that is now acting as resistance. Here's what the 4H chart shows: 🔹 The double top: Gold peaked near 4,125, dipped to about 4,005, then came back and topped again at 4,130.11. Two highs at the same level with a dip between them is a classic double top. 🔹 The break: When price fell under the 4,005 neckline, the pattern was confirmed. The usual measured target from a pattern this size is roughly 3,880. 🔹 The overshoot: Gold went well past that, to a low of 3,765.91, about 8.8% under the 4,130 high. The move ran further than the textbook target. 🔹 The bounce: From the low, price has recovered about 1.8% to 3,832.91. The first bounce reached the 3,910 area, then 3,870, and the latest ones are smaller and tighter. 🔹 The old base: The 3,872.51 level from earlier is now above price. Broken support often turns into resistance on the first retest. 🔹 The range: 24H high 3,840.62 and low 3,765.91, with turnover at 9.98M. The market has calmed compared to the sell-off. 🟢 Bullish: a 4H close above 3,872.51, then 3,948. That would show buyers reclaiming the area the breakdown started from. 🔴 Bearish: a 4H close under 3,765.91, with no marked support below it on this chart. Patterns give targets, not guarantees. Once price overshoots one, the next level to read is the one it just lost. Are you watching $XAUT or another coin? #XAUT #Gold #Crypto #BinanceSquare #WSOT2026 #WSOTShowYourAITradeToEarn10USDT #JensenHuangExitTestsNvidiasAILeadership #USPPITestsTheHigherForLongerTrade #USInflationRunsHotAndRateHikeBetsRise $XAUTUSDT $BTCUSDT

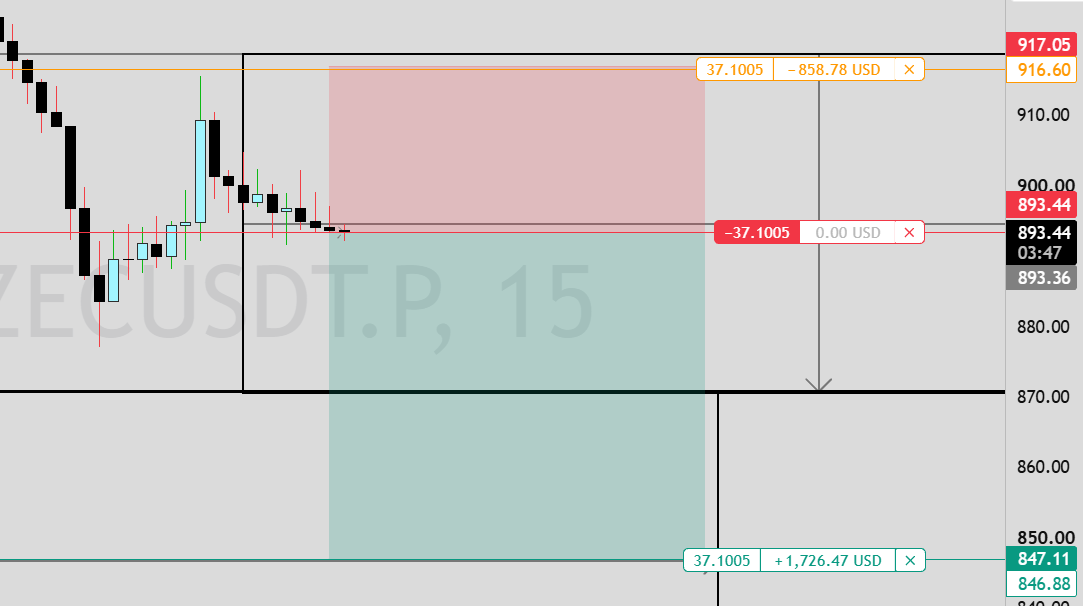
ZEC Short setup. 15m chart. 📉
Price is showing rejection after a pullback. I'm expecting a move down toward the target. Entry: 893.44 SL: 916.60 TP: 847.11 Trade is active now. Are you taking this short? $zec $BTCUSDT$VELOUSDT#WSOT2026 #WSOTShowYourAITradeToEarn10USDT #JensenHuangExitTestsNvidiasAILeadership #USPPITestsTheHigherForLongerTrade #USInflationRunsHotAndRateHikeBetsRise

NVIDIA (NVDA‑USDT): Bears Remain in Control as Price Faces Downside Pressure NVIDIA is showing continued weakness on the 4H timeframe, with price currently trading around $179.0, down approximately 2.9%. Technical Market Overview 🔹 Bearish Structure: Price continues to form lower highs and lower lows. 🔹 EMA Alignment: EMA 5 ($183.11), EMA 10 ($184.64), and EMA 20 ($187.76) are all above the current price; this confirms a bearish downward trend so far. 🔹 Super Trend: The Super trend indicator crossing below at $179.26, reinforcing bearish outlook at present. Key Price Levels ‑ Immediate res: $183‑$185 ‑ Stronger res: $187‑$188 ‑ Major support: $169 ‑ Current price zone: $178‑$180 What to Watch Next: If sellers maintain pressure and price breaks below the $169 support zone, further downside toward $153 could become possible. However, a recovery above $183, followed by a sustained move above $185, could signal improvement by bullish momentum. My Market Outlook: The 4H condition remains bearish, and buyers have no immediate signs to consider a reversal. Patience is essential — wait for confirmation before considering any entry. Always manage risk and avoid chasing the market. What is your expectation for NVDA? Will bears push price toward $148.80 or will buyers defend the current support zone? #NVDA #NVDA‑USDT #Technical‑Analysis #CryptoTrading $NVDAXUSDT #ByXIMPACT #WSOT2026 #WSOTShowYourAITradeToEarn10USDT
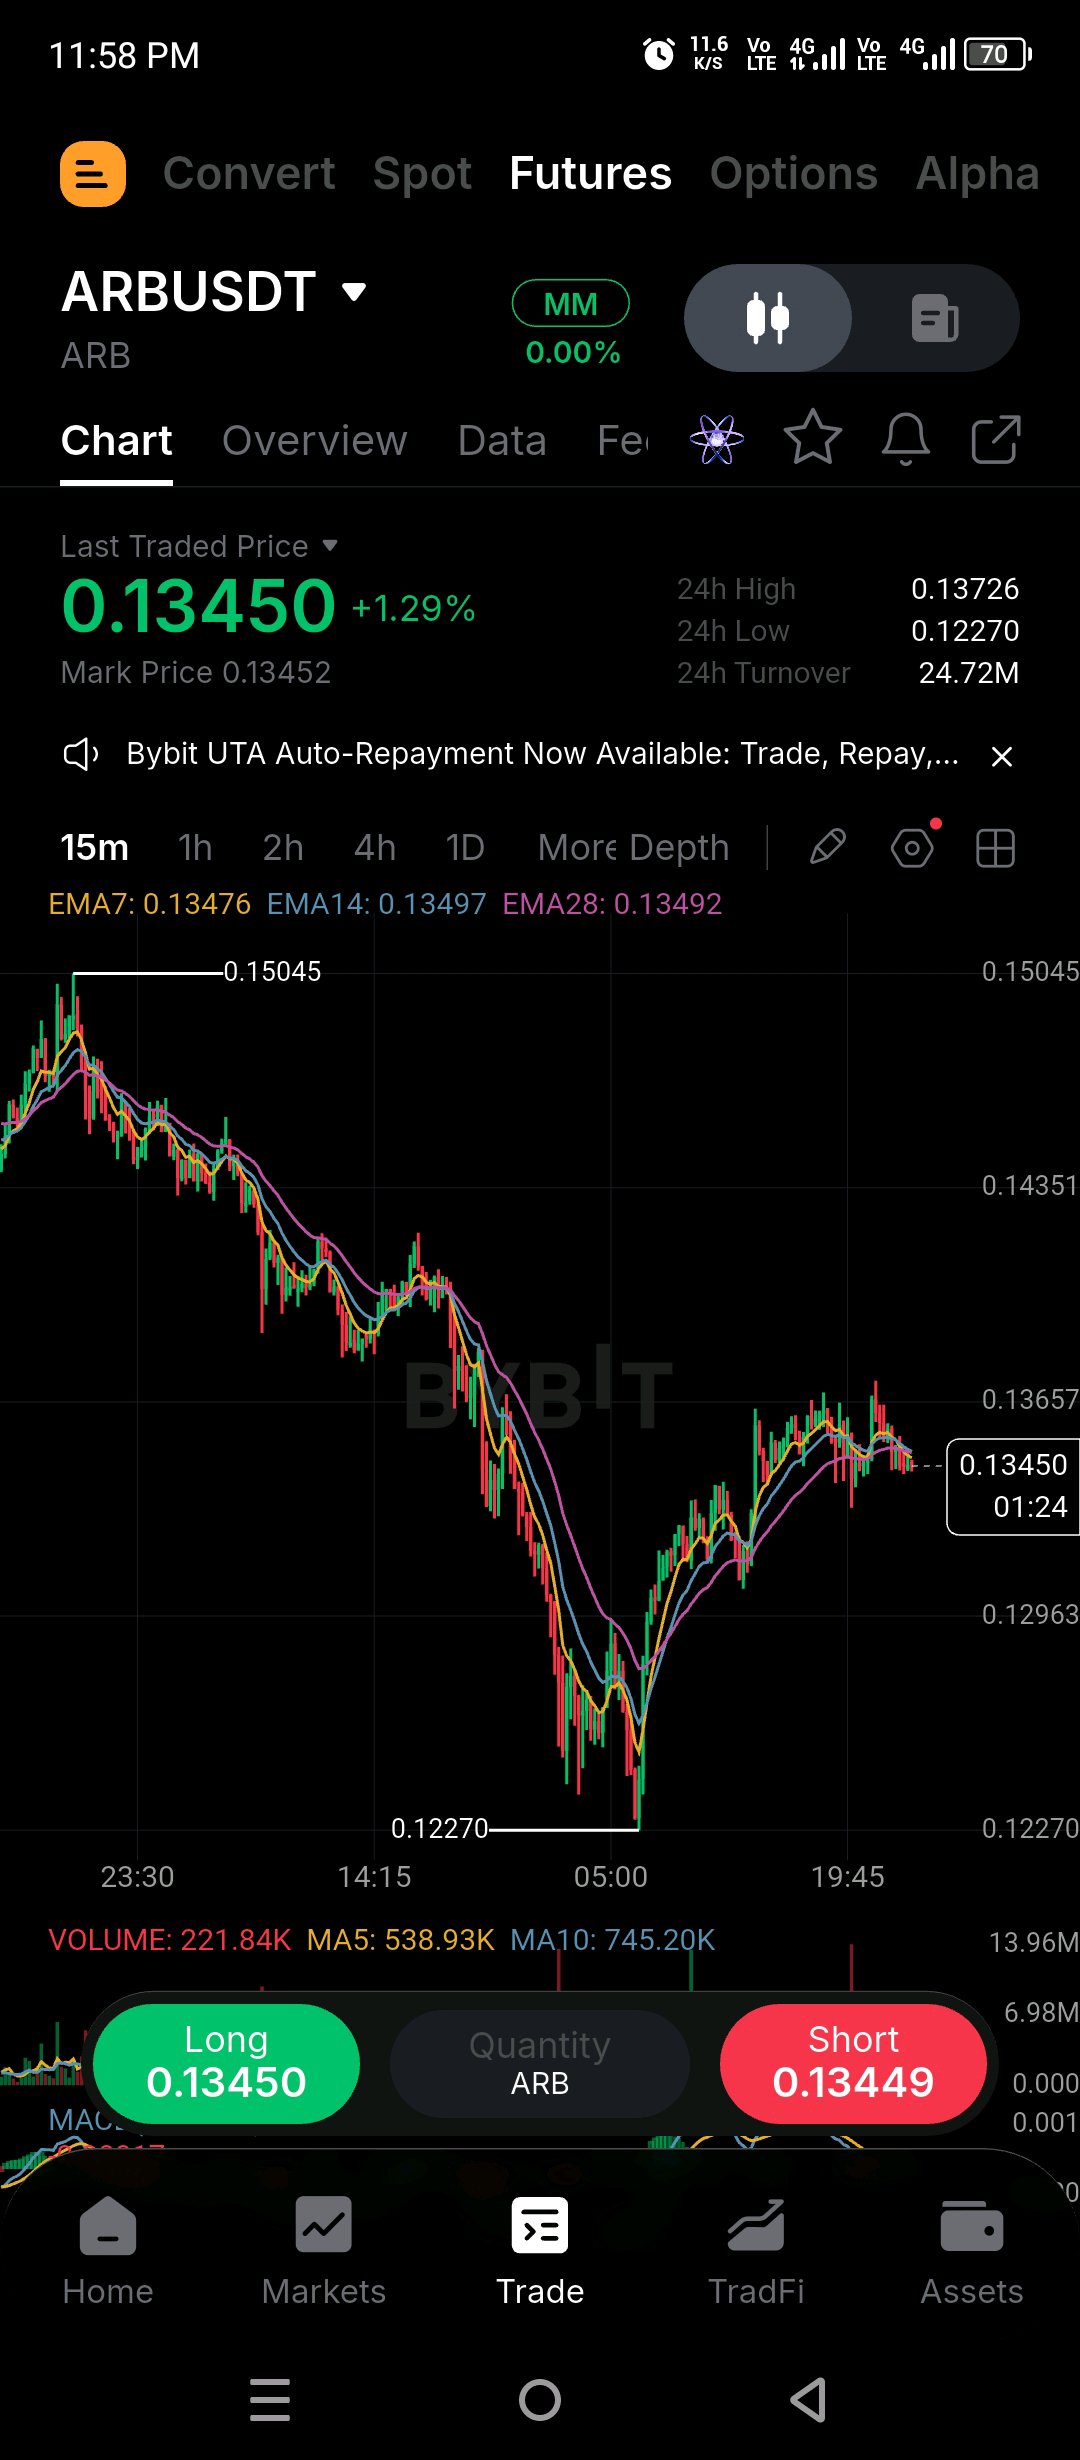
Arbitrum network is growing, but $ARBUSDT token is falling. That gap is the whole trade for me. I am looking at ARB at $0.13450 and I am confused in a good way. On one side, the network looks strong. DeFi TVL is around $1.306B, stablecoin supply is $3.804B, up 8.64% in 7 days, and tokenized real-world assets are around $1.013B. Capital is coming in. On the other side, ARB is down 21.99% in 7 days and 32.57% in 30 days. So why is price not following the network? I think the answer is simple and most people miss it. ARB is mainly a governance token. More people using Arbitrum does not automatically mean more people buying ARB. Network usage and token demand are two different things. Until ARB captures more value from that usage, strong fundamentals alone will not push price up. Then there is November 16. Two separate events are happening on the same day and people are mixing them up. First, about 92.65M ARB is scheduled to unlock, around 1.34% of circulating supply, worth around $12.6M. About 56.13M for team and contributors, 36.52M for investors. Unlock does not mean they will sell tomorrow, but timing is bad because price is already near lows. Second, the DAO is voting on whether to release 74.56M ARB and about 8,426 ETH that were frozen after the Oct 29 Binance hot-wallet exploit, to return them to Binance. Voting ends Nov 16. This is not new supply, it is a recovery decision. But it is a test of whether Arbitrum can handle emergency situations. Derivatives are also telling me a story. OI is only around $9.7M, funding is still positive near 7.09% annualized, and in the last 24h around $1.9M got liquidated, with about 92% from longs. That tells me leveraged bulls are still getting trapped while price stays low. My plan is not to buy $0.13450 in the middle. If ARB reclaims $0.1417 and holds above $0.1450 with real spot buying, that would be my first proof buyers are back, then $0.1500 to $0.1550 opens. If we lose $0.1245 and fail to get it back, then $0.1200 opens, then $0.1150 if selling speeds up. Risk 1 to 2% only, 5x to 10x isolated max if I trade it. Otherwise I skip it. I do not want to be long into an unlock with longs already crowded. Tell me what you think, does strong network growth mean ARB should go up, or is ARB just a governance token so it does not matter? Give me your reason in one line, I want to read it. Tap $ARBUSDT to trade this $0.1245 to $0.1450 range with me, trade on this same coin. #WSOT2026
$BTC (BTC) is trading around $64,000–$65,000, facing strong selling pressure. The overall short-term trend remains bearish, but oversold conditions could trigger a temporary recovery. Key Levels: Current price: ~$64,000 Support: $62,100 Strong support: $60,100 Resistance: $67,300 Next resistance: $70,300 Future Outlook: If BTC breaks above $67,300, a recovery towards $70,300 is possible. However, a breakdown below $62,100 could increase selling pressure. My View: Wait for confirmation before entering a trade. Watch support and resistance carefully.$BTC $BTCUSDT #ByXIMPACT #WSOT2026 #WSOTShowYourAITradeToEarn10USDT
Altcoins are testing a key support level for the 5th time. $ETH $BCH $SNX This level has held through the Yen carry trade unwind, October 10 crash, US-Iran war, and CLARITY Act delay. Let's hope for another bounce from here. $ETHUSDT $BCHUSDT #ByXIMPACT #WSOT2026 #WSOTShowYourAITradeToEarn10USDT

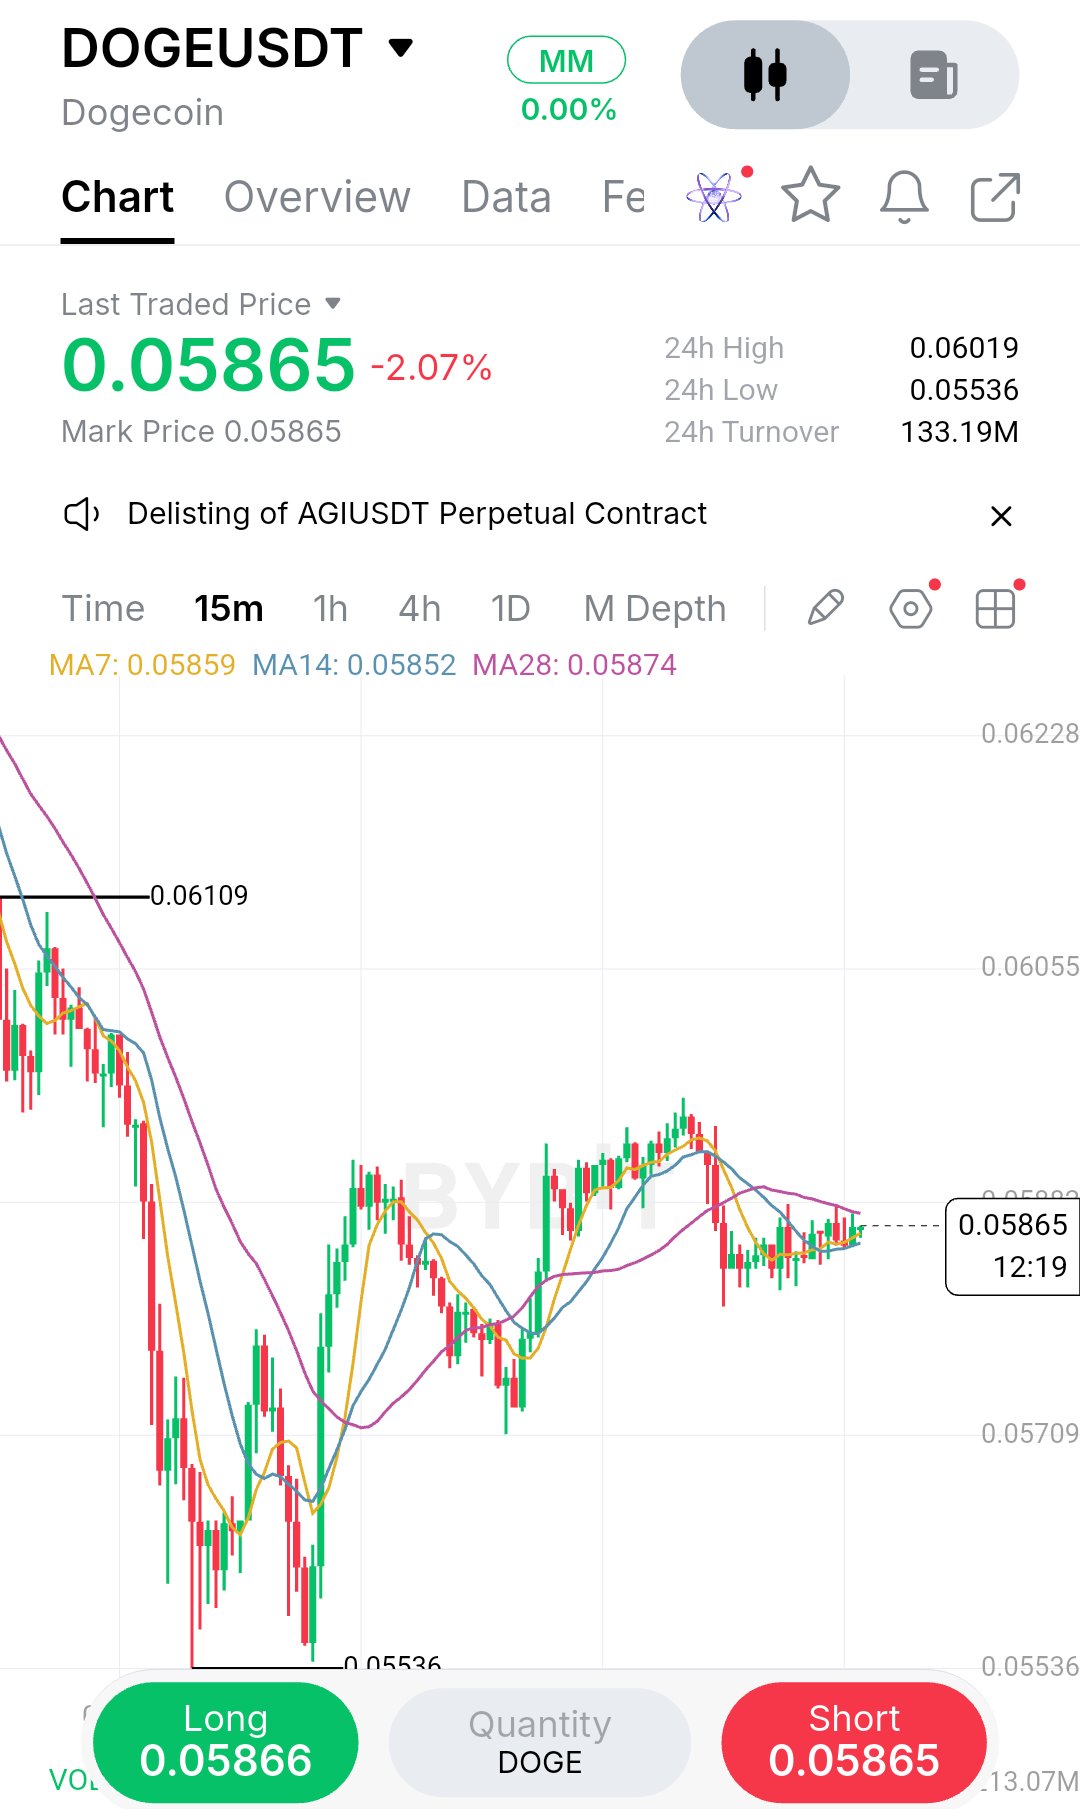
What caught my attention here is how DOGE is quietly coiling under the 28 MA after that violent flush to 0.05536. Everyone wants to catch the bottom, but this 15m chart still hasn’t proven a structural shift. I’m watching 0.05874 closely.Price is trapped between the flat 7 and 14 MAs and the 28 MA, which is acting like a ceiling. The bounce off the low was aggressive, but the lower high near 0.06109 keeps the broader downtrend intact. The market structure here is messy. We have a sharp sell-off, a V-shaped recovery, and now a tight consolidation right beneath a key moving average. That compression tells me the market is deciding its next move, and it hasn’t made up its mind yet. The 7 MA at 0.05859 and the 14 MA at 0.05852 are practically flat, meaning short-term momentum has stalled. The 28 MA at 0.05874 is the real gatekeeper. Until price reclaims that level with conviction, every rally is just a bounce inside a downtrend. Let’s look at both sides honestly. The bullish case is that the 0.05536 low held firmly, the recovery was fast, and the MAs are flattening, which often precedes a breakout. If buyers can push through 0.05880 and close above it, the trapped sellers above will be forced to cover, and that fuel could carry price toward 0.06050 and then the 0.06109 high. The bearish case is that the trend is still down, the bounce is weak relative to the drop, and the 28 MA has rejected price repeatedly. If sellers defend that level again, the low at 0.05536 becomes the obvious liquidity target. My read is neutral until we see a clean break. I’d rather wait for confirmation than guess which side wins. If price reclaims 0.05880 with a strong candle close, I’d consider a long scalp toward the previous supply zone. But if sellers defend that MA and price rolls over, the 0.05536 low becomes the next target, and I’d stand aside rather than chase a breakdown. Bias: WAIT (long on confirmation) Entry: 0.05885–0.05900 Confirmation: 15m close above 0.05900 Stop / Invalidation: 0.05780 TP1: 0.06050 TP2: 0.06100 R:R: 1.6 to 1 The biggest risk is a fakeout at the 28 MA. I’ve been burned entering before the candle closes.Now I wait for the retest. If price rejects and closes back under 0.0585, I cancel the idea and watch the low get swept. Are you waiting for the same reclaim, or fading this bounce? #ByXIMPACT #WSOT2026 $DOGEUSDT $HYPEUSDT
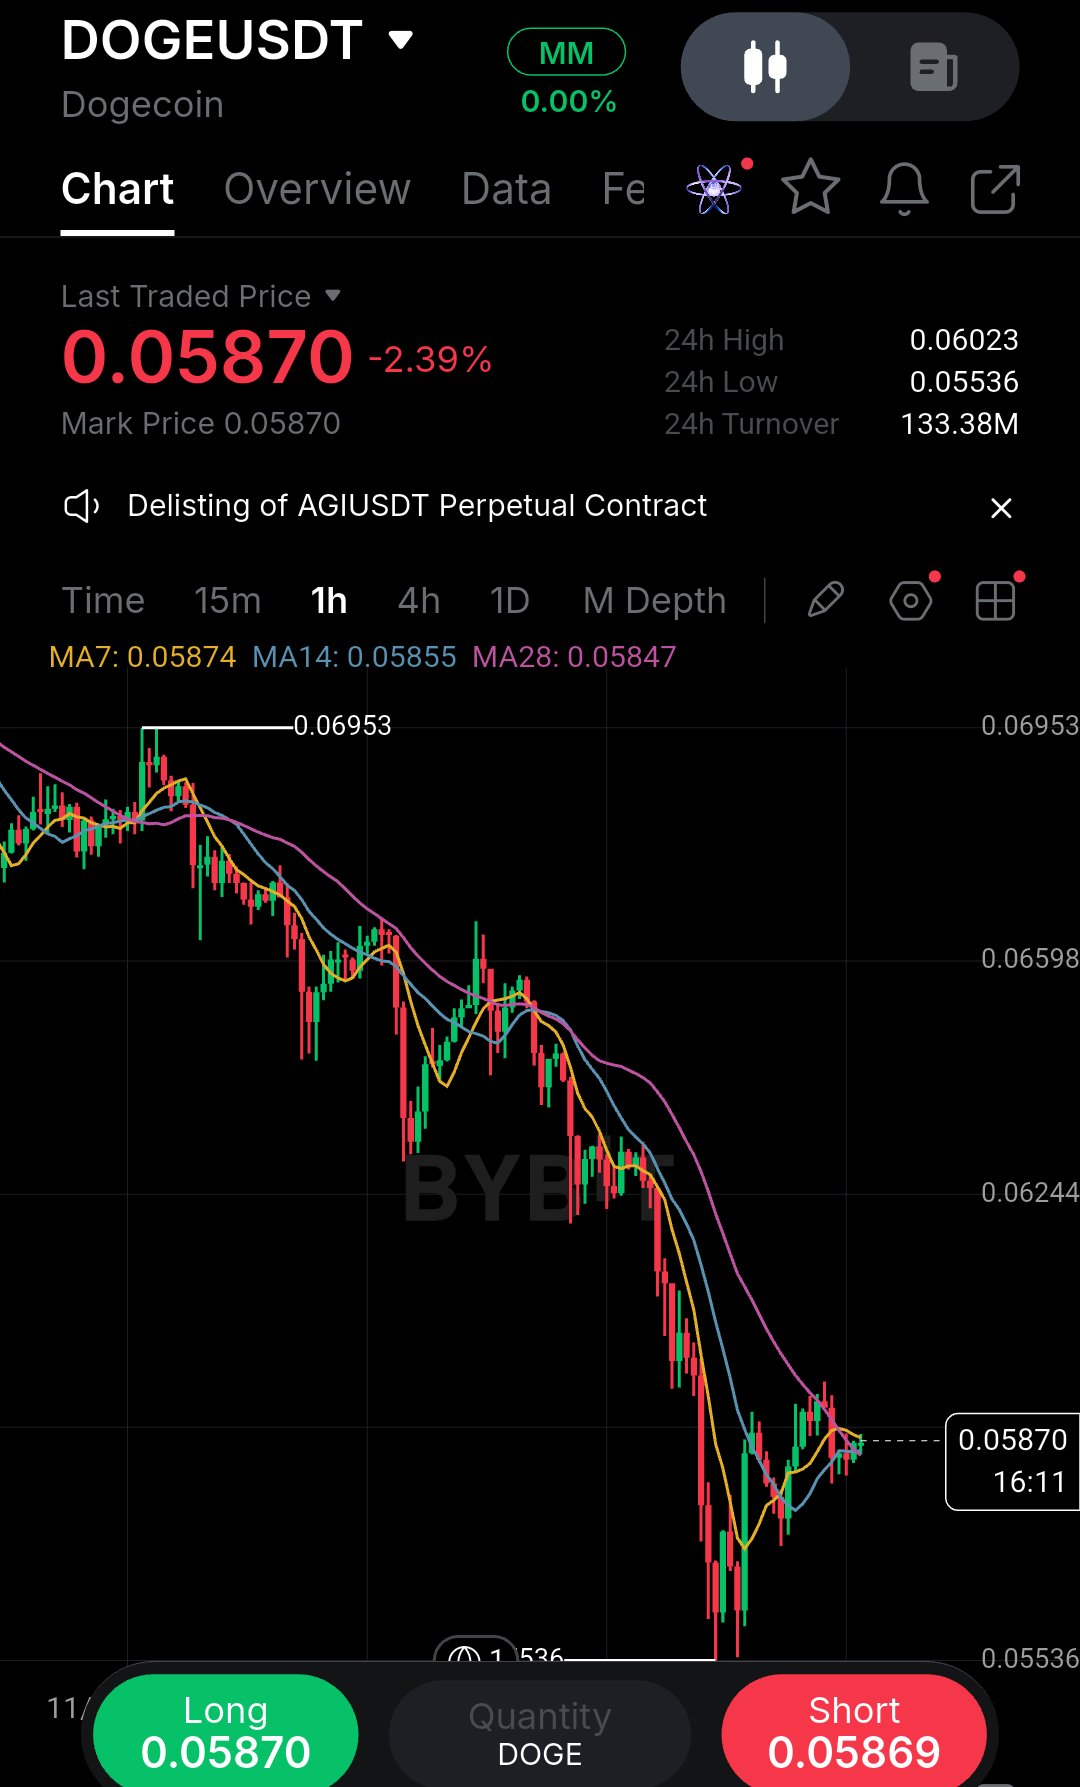
I’ve learned to distrust perfectly clean bounces after a hard dump, so I’m watching this DOGE 1h chart with patience rather than excitement. Price is clinging to 0.0587 after a brutal slide, but the structure is still a series of lower highs. The 7 and 14 MAs are flat, yet the 28 MA at 0.0584 is the real battleground.it’s acting as immediate overhead pressure. I can see the trapped buyers from the 0.062 breakdown, and I have no intention of adding myself to that crowd. Here is the honest read: this is not a reversal yet. It is a bounce inside a downtrend. The drop from 0.06953 to the 0.05536 low was fast and heavy, and fast drops usually leave a trail of unfinished business above. Those buyers who entered near 0.062 are now underwater, and every small rally gives them a chance to exit at break-even or with a smaller loss. That creates a wall of selling pressure right where the 28 MA sits. Until price reclaims that level and holds it, the path of least resistance remains down. What supports the bullish case? The wick at 0.05536 shows buyers defended that zone aggressively, and the short-term MAs are flattening, which means selling momentum is cooling. If price can reclaim 0.0590 with a strong close, the trapped sellers above may start covering, and that fuel could push us toward 0.0620. What supports the bearish case? Everything else. The trend is down, the structure is lower highs, and the bounce is weak relative to the drop. A failure at the 28 MA would likely send price back to test 0.05536, and a break there opens the door to deeper levels. My execution plan is simple. I want a decisive reclaim and close above 0.0590 to confirm buyers are actually stepping in. If that fails, a lower high is the signal to stay out and wait. Entry: 0.0591 (confirmation) SL: 0.0575 (below recent wick) TP1: 0.0620 TP2: 0.0650 Risk/Reward is roughly 1:1.6 to TP1, which is acceptable for a counter-trend bounce but not a trade I would oversize. Invalidation is a clean break below 0.0575.If that happens, the bounce thesis is dead and I step aside. I used to jump on these early reversals and get stopped out by the retest. Now I let the candle close first. Discipline beats FOMO every time. Where’s your line in the sand? #ByXIMPACT #WSOT2026 $DOGEUSDT $SPCXXUSDT
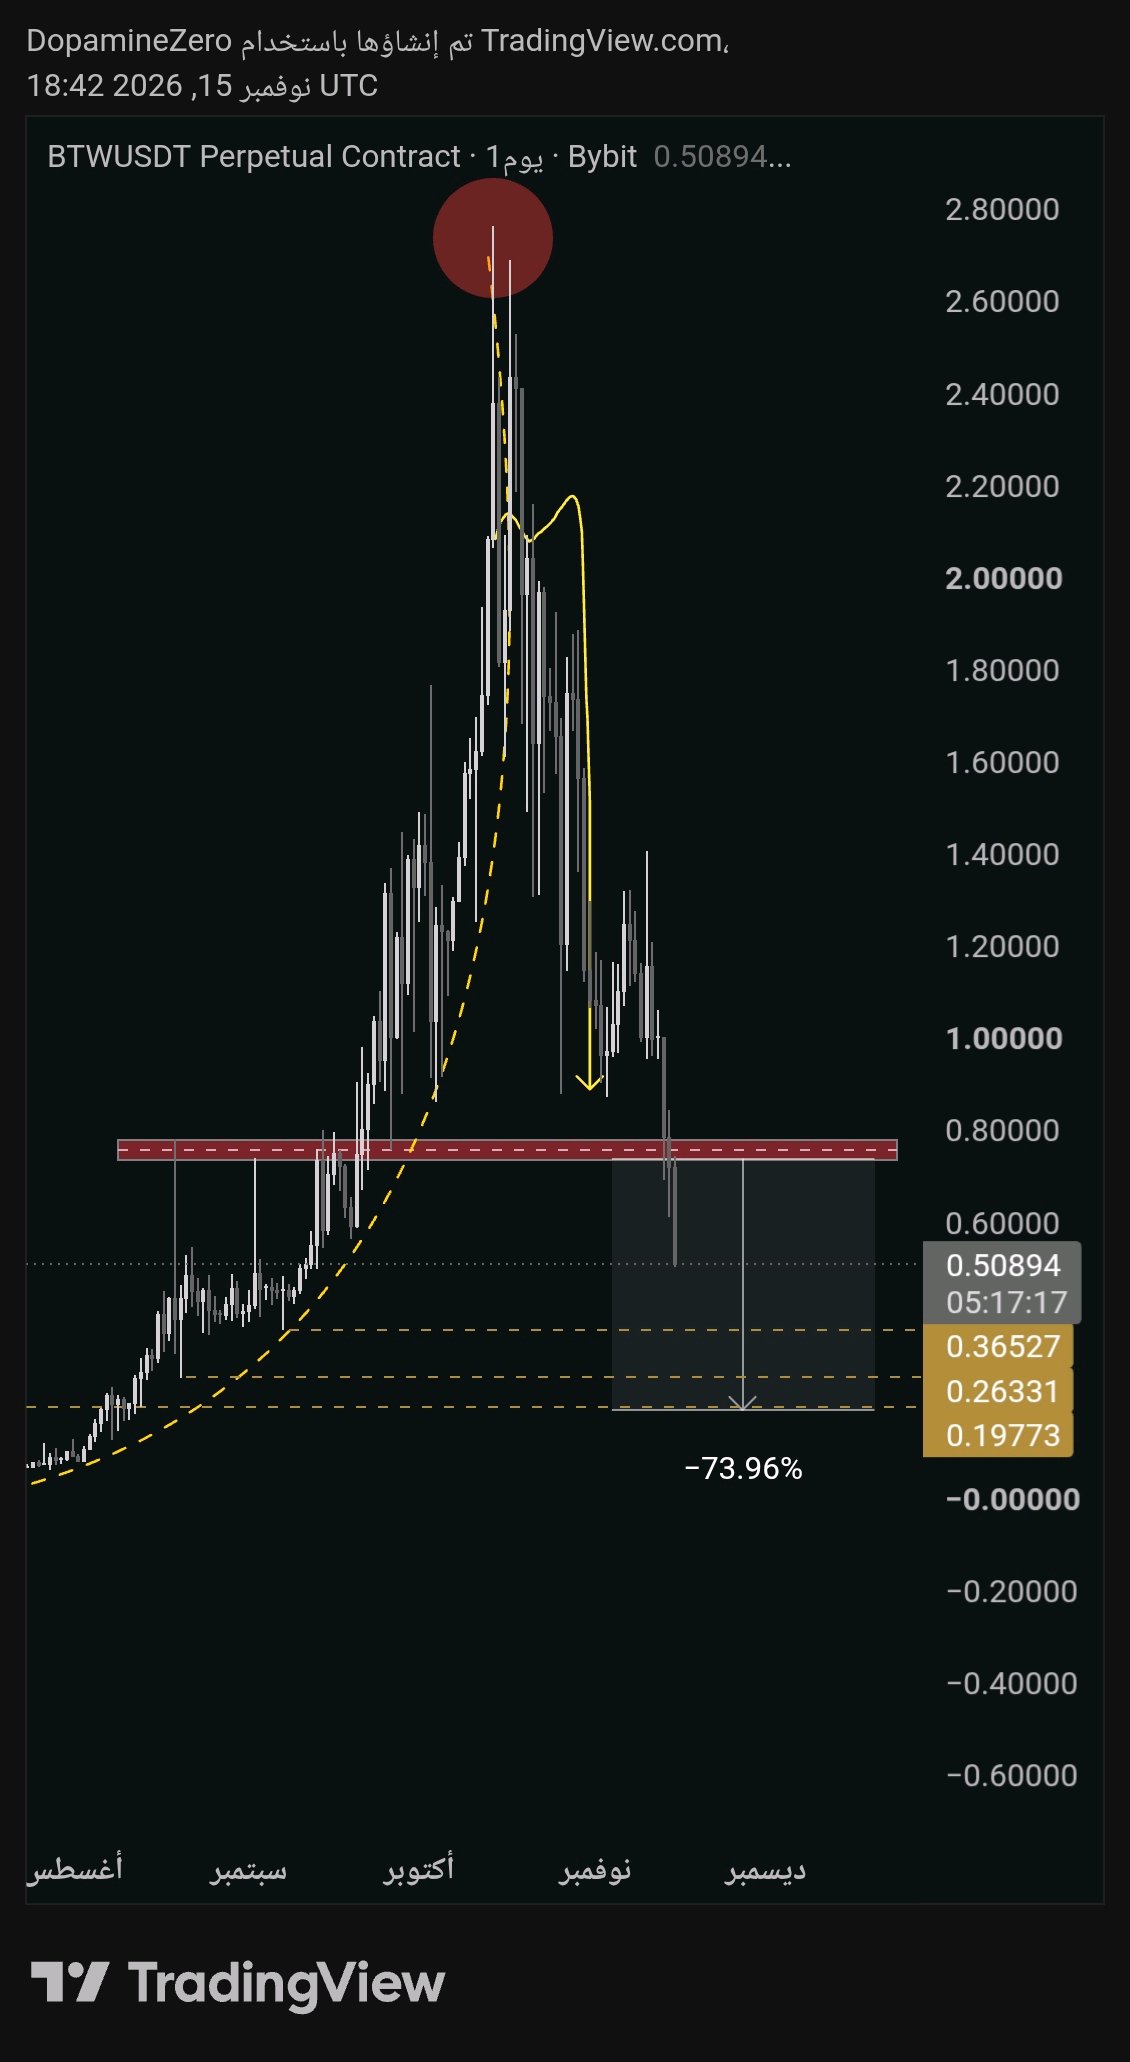
$BTW
Do you remember this? now send to zero #WSOT2026 #WSOTShowYourAITradeToEarn10USDT
🤌🤌🤌

#AAVE
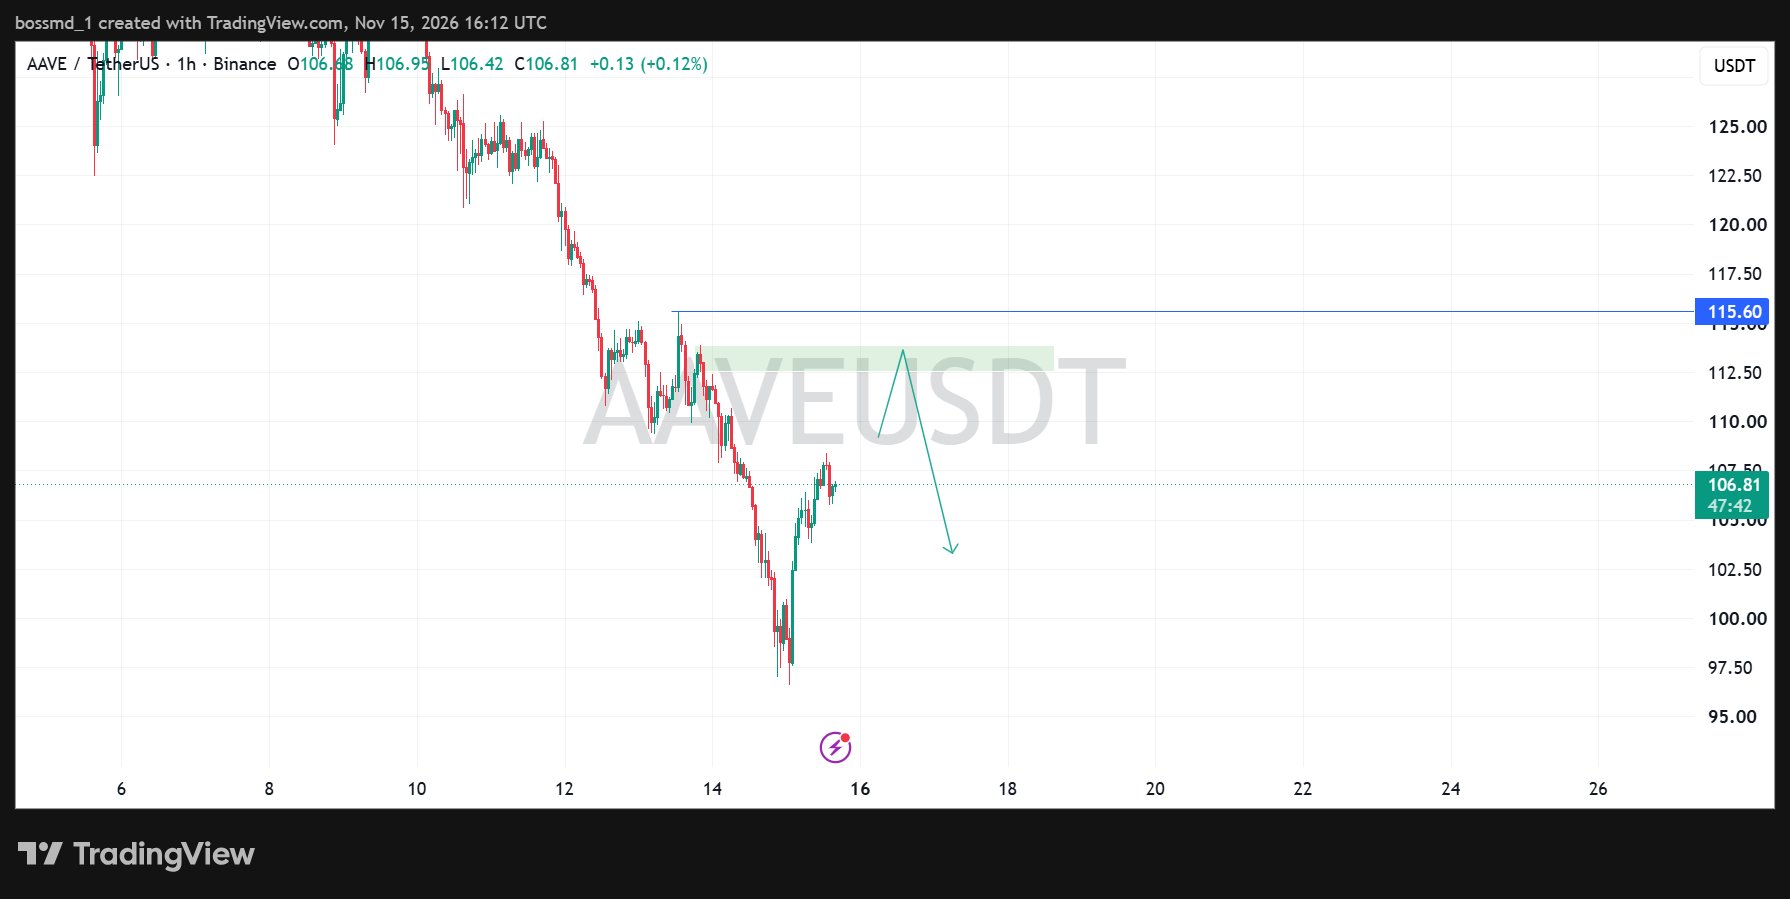
#AAVE Проявляет признаки краткосрочного восстановления после сильной распродажи, но более масштабная картина всё ещё выглядит осторожно. Цена отскочила с уровня $97-$100 и в настоящее время торгуется вокруг $106,8. Однако вокруг $112-$114 находится сильная зона сопротивления, которая может привлечь продавцов, если цена будет расти выше. Я наблюдаю за возможным ростом в эту зону сопротивления, за которым может последовать очередной отбой до $103. Для того чтобы говорить о существенном изменении тренда, покупателям необходимо продемонстрировать достаточную силу, чтобы прорвать сопротивление. #WSOT2026