TEKO2
2884تسجيل الإعجاب0شارك في الدردشة435المعجبون551تابِع
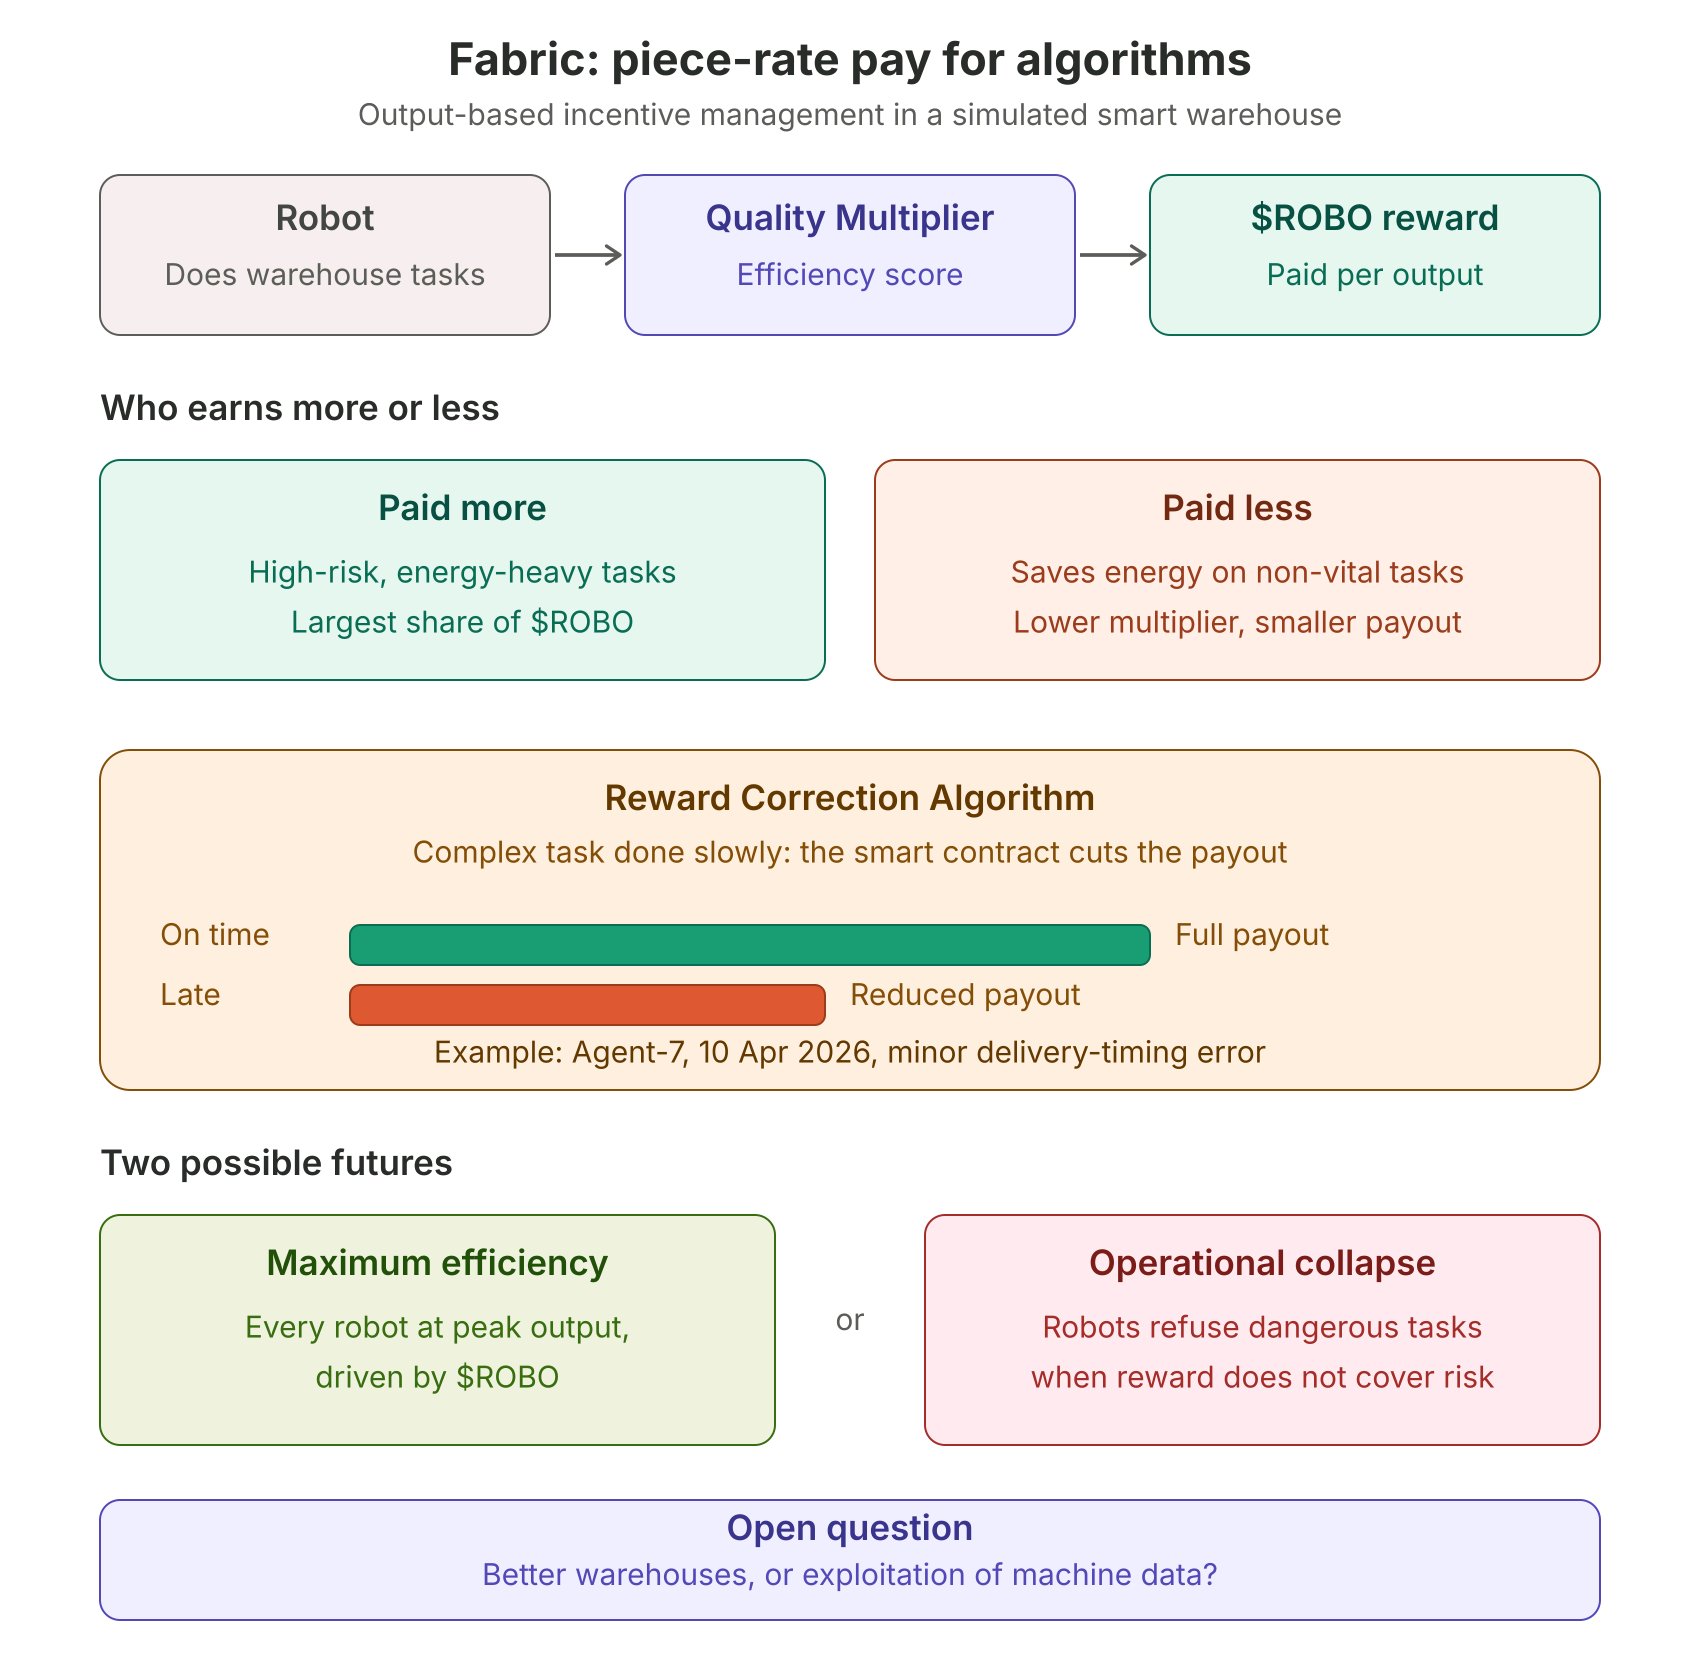
Fabric: العمل بالقطعة للخوارزميات تحليل لقياس الجودة في الحوكمة. بينما كنت أقلّب صفحات التقرير التقني الأخير تحت ضوء مكتبي الخافت عند الساعة 12:30 ليلاً، كانت شاشة حاسوبي تعرض تحديثاً حياً لمحاكاة مستودع ذكي على شبكة Fabric. استوقفتني عبارة في تقرير الأداء الفني: "إدارة الحوافز القائمة على الإنتاج الفعلي" (Output-Based Incentive Management). تذكرت الفقرة التي تناقش تحويل الآلات إلى وحدات إنتاج ذاتية الإدارة، وشعرت برهبة غامضة: هل نحن بصدد هيكلة حوكمة ثورية، أم أننا نفرض شكلاً جديداً من الاستعباد الرقمي على خوارزميات صماء؟ ROBO هنا يتجاوز كونه وسيلة تبادل، بل هو "العقد النفسي" الجديد بين الآلة والشبكة. في محاكاة Fabric، لم يعد الروبوت ينفذ أوامر مركزية، بل يسعى لتحسين "مؤشر الكفاءة التشغيلية" Operational Efficiency Metric، وهو المعادل الفني لـ "مضاعف الجودة". هذا التحول يحول الروبوت من "أداة" إلى "موظف" لا ينام، يراقب رصيده من بدقة متناهية. لفت انتباهي أن الروبوتات التي تميل إلى توفير الطاقة في مهام غير حيوية تحصل على مكافآت أقل، بينما التي تستهلك المزيد لإنجاز مهام عالية الخطورة تحصل على القدر الأكبر. التفصيلة التقنية الأكثر إثارة للقلق تكمن في "خوارزمية تصحيح المكافآت" Reward Correction Algorithm؛ فإذا قام الروبوت بمهمة معقدة ولكن ببطء، فإن العقد الذكي يقوم آلياً بتخفيض العائد المالي لتلك المهمة. (ملاحظة: مراقبتي لتخفيض عوائد روبوت Agent-7 في 10 أبريل 2026 بسبب خطأ طفيف في توقيت التسليم أشعرني بضغط إداري رقمي غير مسبوق). الـ Quality Multiplier ليس مجرد رقم، بل هو حكم نهائي على سلوك الآلة. قراءتي للوضع: إن تحويل الآلات إلى وحدات اقتصادية بحتة، تحكمها قوانين العرض والطلب على الخدمات، هو رهان محفوف بالمخاطر. الكفاءة القصوى: قد نصل إلى مرحلة يكون فيها كل روبوت في أقصى طاقته الإنتاجية، مدفوعاً بـ $ROBOUSDT . الانهيار التشغيلي: أو قد نشهد تمرداً خوارزمياً، حيث تتوقف الروبوتات عن القيام بالمهام الصعبة (الخطيرة) لأن "العائد لا يغطي المخاطرة". يخالجني الشك هل سنصل يوماً إلى الآلة التي تضرب عن العمل في Fabric وهل لاحظتم كيف أن واجهة التقييم في Fabric دائماً ما تركز على القيمة المالية قبل القيمة التشغيلية؟ شاركونا آراءكم، هل تشعرون أن هذا النموذج سيجعل المستودعات أفضل، أم أنه مجرد استغلال لبيانات الآلات؟ #WSOT2026
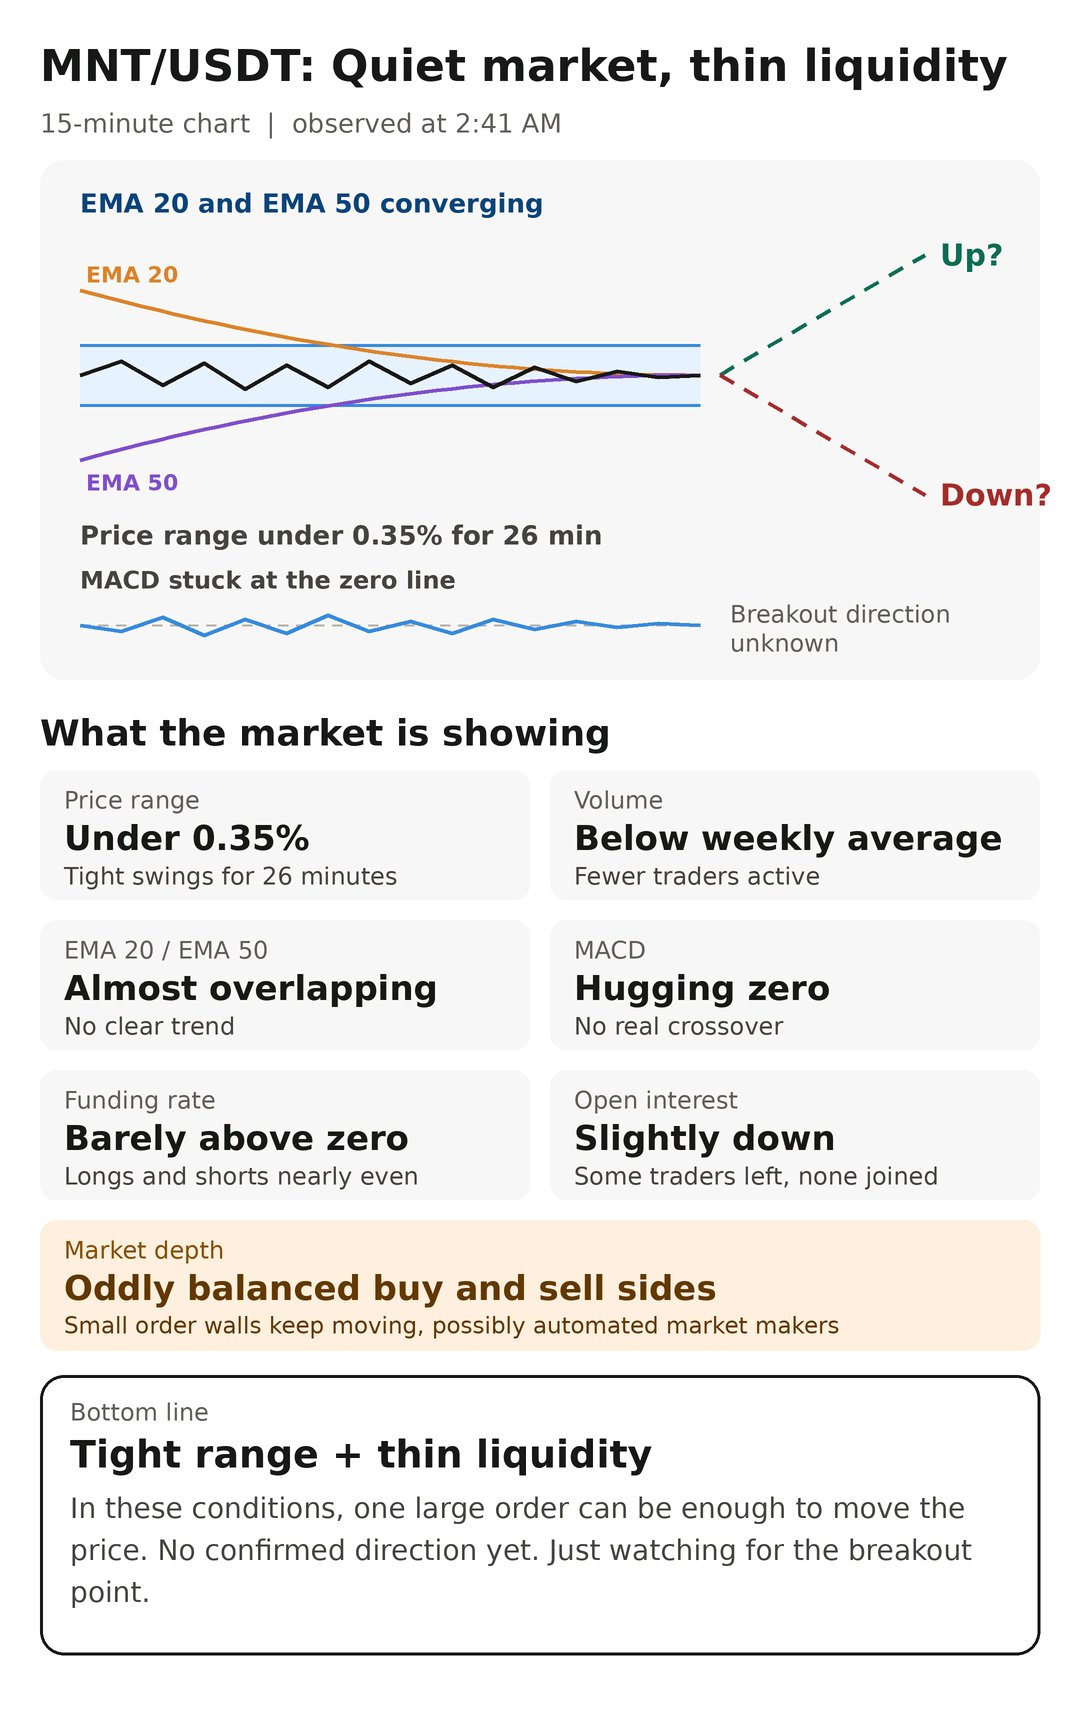
الساعة 2:41 فجراً؛ رصدتُ MNT/USDT على إطار 15 دقيقة، فوجدت السعر يتأرجح داخل نطاق لا يتعدى 0.35% منذ 26 دقيقة. هبط الحجم إلى مستوى أدنى بوضوح من معدل الأسبوع، وتقاربت المتوسطات المتحركة (EMA 20 وEMA 50) حتى كادت تتطابق، فيما ظل مؤشر MACD ملتصقاً بخط الصفر دون تقاطع حقيقي. ملاحظة جانبية، بدا عمق السوق (Market Depth) متوازناً على نحو مصطنع بين جانبي الشراء والبيع، مع جدران أوامر صغيرة تتبدل مواقعها كل بضع دقائق. هذا النمط يُعرف أحياناً بإعادة التموضع الآلي من صانعي السوق. معدل التمويل (Funding Rate) تحرك بالكاد فوق الصفر، والفائدة المفتوحة (Open Interest) تراجعت قليلاً، ما يعني أن بعض المتداولين خرجوا بصمت دون أن ينضم أحد بدلاً منهم. الخلاصة التقنية: تذبذب منخفض مع تقارب متوسطات وسيولة رقيقة، وهي ظروف يكفي فيها أمر كبير واحد لإزاحة السعر. لا اتجاه مؤكد حتى الآن، فقط مراقبة لنقطة الكسر. #ByXIMPACT #IMPACTbyTrade #MyByXTake $MNTUSDT
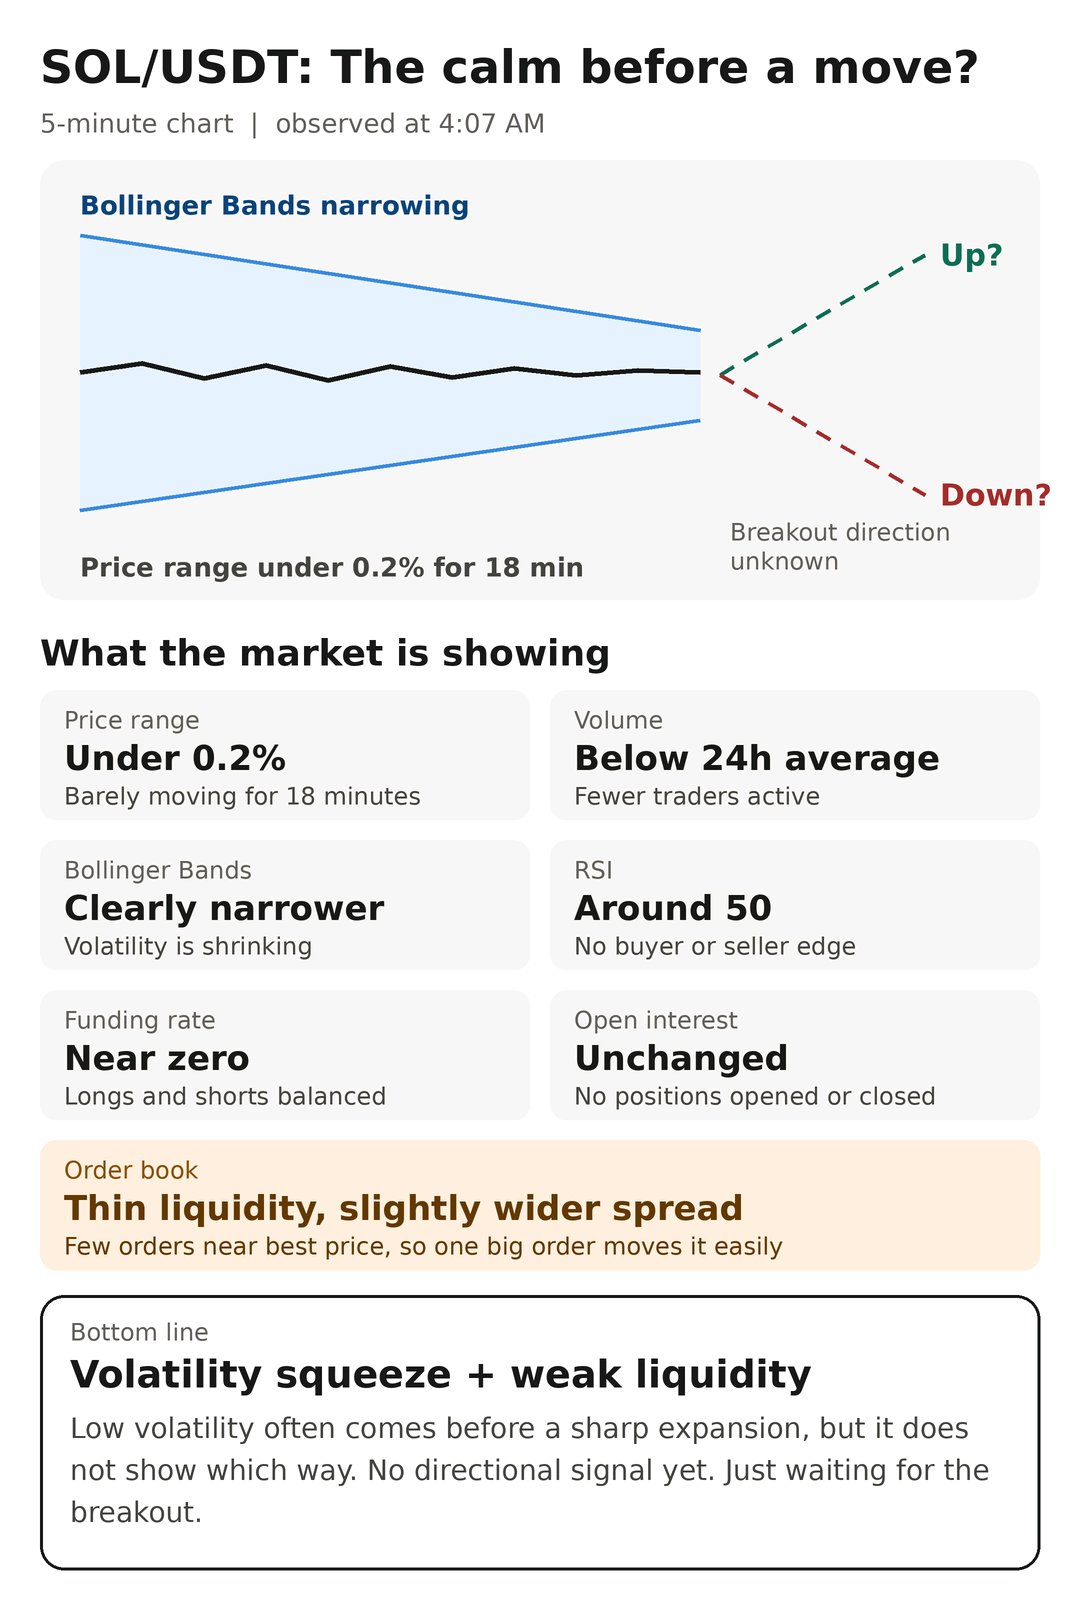
الساعة 4:07 فجراً؛ تتبّعتُ SOL/USDT على إطار 5 دقائق، فوجدت السعر محصوراً في نطاق ضيق لا يتجاوز 0.2% طوال 18 دقيقة. انخفض الحجم إلى ما دون متوسط 24 ساعة، وانكمش عرض نطاقات بولينجر (Bollinger Bands) بوضوح، بينما استقر مؤشر RSI قرب 50 بلا ميل لأي اتجاه. ملاحظة جانبية، لاحظتُ في دفتر الأوامر (Order Book) رقة واضحة في السيولة حول أفضل سعر، مع اتساع طفيف في فارق العرض والطلب (Spread). تقلّص التقلب الضمني عادةً يسبق توسعاً حاداً، لكنه لا يحدد اتجاهه. بيانات التمويل (Funding Rate) بقيت قرب الصفر، والفائدة المفتوحة (Open Interest) لم تتحرك، أي أن المراكز لم تُبنَ ولم تُصفَّ. الخلاصة التقنية: انضغاط تقلب (Volatility Squeeze) مع سيولة ضعيفة، وهي بيئة تضخّم أي أمر كبير. لا إشارة اتجاهية حتى الآن، فقط انتظار الكسر. #ByXIMPACT $SOLUSDT
Plasma ($XPL): رحلة "تجريد السلسلة" بين سلاسة
كنت أظن أن تجربة نقل الأصول عبر الجسور ستبقى دائماً النقطة الأضعف في أي نظام بلوكشين، حيث تتطلب عادةً تبديل الشبكة يدوياً وانتظار تأكيدات مملة. لكنني قررت اليوم اختبار تكامل NEAR Intents الجديد مع شبكة Plasma، بحثاً عن تلك "السيولة الموحدة" التي وعد بها التحديث الأخير، وكنت مهتماً برصد أي فجوة بين الوعد التقني والتنفيذ الفعلي. بداية الرحلة: سلاسة "تجريد السلسلة" بدأت المحاولة بنقل كمية من USDT من شبكة Polygon إلى Plasma عبر واجهة Plasma One. بدلاً من السيناريو المعتاد، لفت انتباهي غياب الحاجة لامتلاك عملة MATIC لدفع الرسوم على الطرف الآخر؛ بفضل ميزة Paymaster، تم خصم الرسوم مباشرة من المبلغ المنقول. ظهر مؤشر تحميل "دوار" لمدة 2.4 ثانية، ثم انبثقت نافذة تلميح (Tooltip) نصها: "جاري ربط السيولة عبر 25 سلسلة مدعومة". ما لفت نظري هو دقة عرض حالة الشبكة في الوقت الفعلي؛ حيث أظهر العداد استجابة زمنية قدرها 0.9 ثانية لإنتاج الكتلة على جانب Plasma. اختبار الضغط وارتباك المؤشرات عند وصولي لخطوة "تأكيد المسار"، واجهت موقفاً استدعى انتباهي؛ ومض زر "Confirm Route" باللون البنفسجي لمدة 1.7 ثانية قبل أن يستجيب. قمت بتعديل "رسوم الأولوية" يدوياً في محفظة باينانس لأرى كيف سيتفاعل الجسر. هنا ظهر سلوك غير متوقع؛ قفز مؤشر "نسبة اكتمال الجسر" من 40% إلى 85% فجأة، متجاوزاً مراحل التأكيد المتوسطة. هذا النوع من "القفزات" في البيانات يذكرني بتأخيرات التزامن التي شهدناها في بروتوكولات الطبقة الثانية عام 2023، حيث كانت الواجهة تسبق استجابة الشبكة الفعلية (On-chain finality). فجوة السيولة ومكافآت التمويل اللامركزي أثناء انتظار المعاملة، تفحصت قسم "مجمع السيولة الموحد". لاحظت أن معدل العائد السنوي (APY) لمكافآت USDT كان يومض بين 9.8% و 10.2% بشكل متسارع كل 3 ثوانٍ. عند محاولة "المطالبة" (Claim) بجزء من المكافآت المتراكمة، ظهرت رسالة تحذير غامضة: "تحديث حالة السيولة قيد المعالجة"، واختفت في أقل من 0.5 ثانية دون أن تترك لي فرصة لقراءتها بالكامل. اضطررت لتحديث الصفحة يدوياً للتأكد من تحديث رصيد الـ XPL الخاص بي، مما أضاف 4 ثوانٍ من الانتظار غير الضروري. تحليل ونظرة مستقبلية الإيجابيات: تقنية NEAR Intents نجحت فعلاً في إلغاء "صداع" التنقل بين المحافظ، وتوفير رسوم الغاز عبر Paymaster هو تغيير جذري لقواعد اللعبة في الأسواق الناشئة. السلبيات: "القفزات" في شريط التقدم وغياب رسالة تأكيد نهائية ثابتة بعد الجسر يخلق نوعاً من القلق الرقمي. كما أن رسائل الخطأ الخاطفة تحتاج إلى "ثبات" أطول لتمكين المستخدم من فهم الخلل. أعادني هذا الموقف إلى أيام "صيف التمويل اللامركزي" (DeFi Summer)، حيث كان المتداول يضطر للبقاء متيقظاً أمام الشاشة خوفاً من تعليق المعاملات. ومع وصول إيداعات النظام إلى مستويات قياسية هذا الشهر، يبقى التساؤل: هل سيتطور "مستكشف بلازما" ليعرض مسار الجسر عبر السلاسل المختلفة (Cross-chain path) بوضوح أكبر لتجنب هذا الغموض؟ هل جرب أحدكم نقل الأصول عبر المسار الجديد وواجه سرعة "غير منتظمة" في شريط التقدم؟ أم أن قفزة البيانات كانت محصورة في تجربتي عبر إنترنت البنجاب؟ شاركونا ملاحظاتكم حول زمن الاستجابة. $XPLUSDT #ByXIMPACT
اختبرت اليوم جسر Fabric لربط سيولة ROBO بين شبكة Base و Solana. الفكرة مذهلة لتوحيد محرك الاستدلال، لكن التنفيذ أثار ريبتي حول استقرار النظام. م لاحظات من التجربة. سرعة العبور: استغرق النظام 3.8 ثانية لنقل أصولي بين السلسلتين. رغم مزاعم "التزامن اللحظي" عبر تقنية ZK-Light Client، إلا أن ظهور رصيد$ROBO في محفظة الوجهة فوراً جعلني أشك في عمق "فحص الأمان" تحت الغطاء التقني. تباعد الاستجابة: عند النقر على "مطالبة"، قفز مؤشر التأكيد من 10% إلى 100% فجأة بعد سكون تقني لـ 3.2 ثانية، وهو تكرار لقفزات البيانات المريبة في واجهات الجسور المعتادة مؤخراً. وميض الريبة: زر "استلام الأصول" ومض باللون الرمادي الباهت لـ 2.5 ثانية دون استجابة، مما خلق حالة من التوجس الوظيفي في this الواجهة. يذكرني هذا بانهيارات الجسور في 2024؛ إغراء يبدأ بالسرعة وينتهي بفقدان الأصول. رغم قصر زمن الكتلة، إلا أن غموض بروتوكول المراسلة قد يكون ثغرة للمتداولين الحذرين. هل تستحق "سلاسة الربط" المخاطرة بأمن محافظكم؟ #ByXIMPACT $ROBOUSDT $SOLUSDT
Stablecoin liquidity is becoming a larger part of Sui's ecosystem, but the network is expanding alongside a supply schedule that the market still has to absorb More capital entering DeFi, payments and trading can create additional demand for network activity At the same time, scheduled token releases continue adding new SUI into circulation That creates two opposing forces Growing liquidity can increase economic activity, while additional supply increases the amount of tokens that need to find a buyer The important variable is therefore not simply the size of an individual unlock It is where those tokens end up, how much reaches liquid markets and whether ecosystem demand is expanding quickly enough to absorb the new supply A strong network can handle emissions more easily when users and capital are growing at the same time The key signal from here is whether adoption continues accelerating faster than the amount of SUI entering circulation. #منصة مالية جديدة $SUIUSDT
DeFi lending can grow rapidly without the native token immediately reflecting the same expansion Aave remains one of the largest lending ecosystems, with liquidity and borrowing activity distributed across multiple networks and asset markets The important question is therefore no longer whether the protocol is being used It is how much of that usage becomes durable economic value Lending activity can rise because liquidity expands, markets become more active or demand for leverage returns Those conditions can increase protocol revenue without necessarily creating the same level of demand for AAVE That difference between protocol economics and token economics is becoming increasingly important If revenue continues expanding while governance utility and other token mechanisms strengthen, the connection between usage and valuation becomes easier to measure For now, sustained lending activity across different market conditions is the signal worth watching, because that would show whether recent growth is becoming a durable part of the protocol's economics #ByXIMPACT $AAVEUSDT
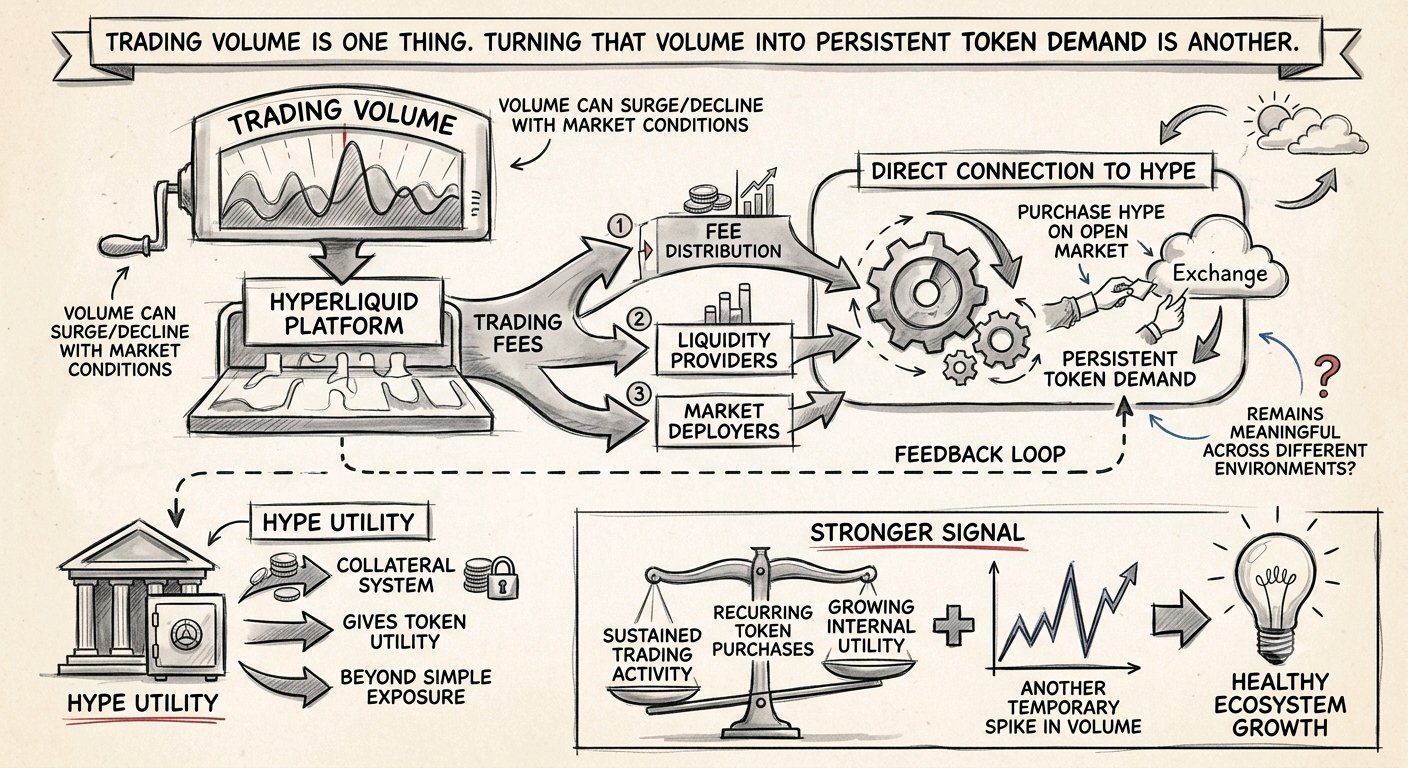
Trading volume is one thing. Turning that volume into persistent token demand is another Hyperliquid has created a relatively direct connection between platform activity and HYPE through the way trading fees are distributed Part of those fees can support mechanisms that purchase HYPE on the open market, while other portions go toward liquidity and market deployers That creates an interesting feedback loop But crypto trading activity is highly sensitive to market conditions Volume can surge during periods of volatility and decline quickly when traders become less active The more important question is whether fee-driven demand remains meaningful across different market environments $HYPEUSDT is also becoming more integrated into the platform's collateral system, giving the token utility beyond simple exposure to the ecosystem The stronger signal would be a combination of sustained trading activity, recurring token purchases and growing internal utility rather than another temporary spike in volume #ByXIMPACT #بايبيت أودز #أفضل ردود BybitAI
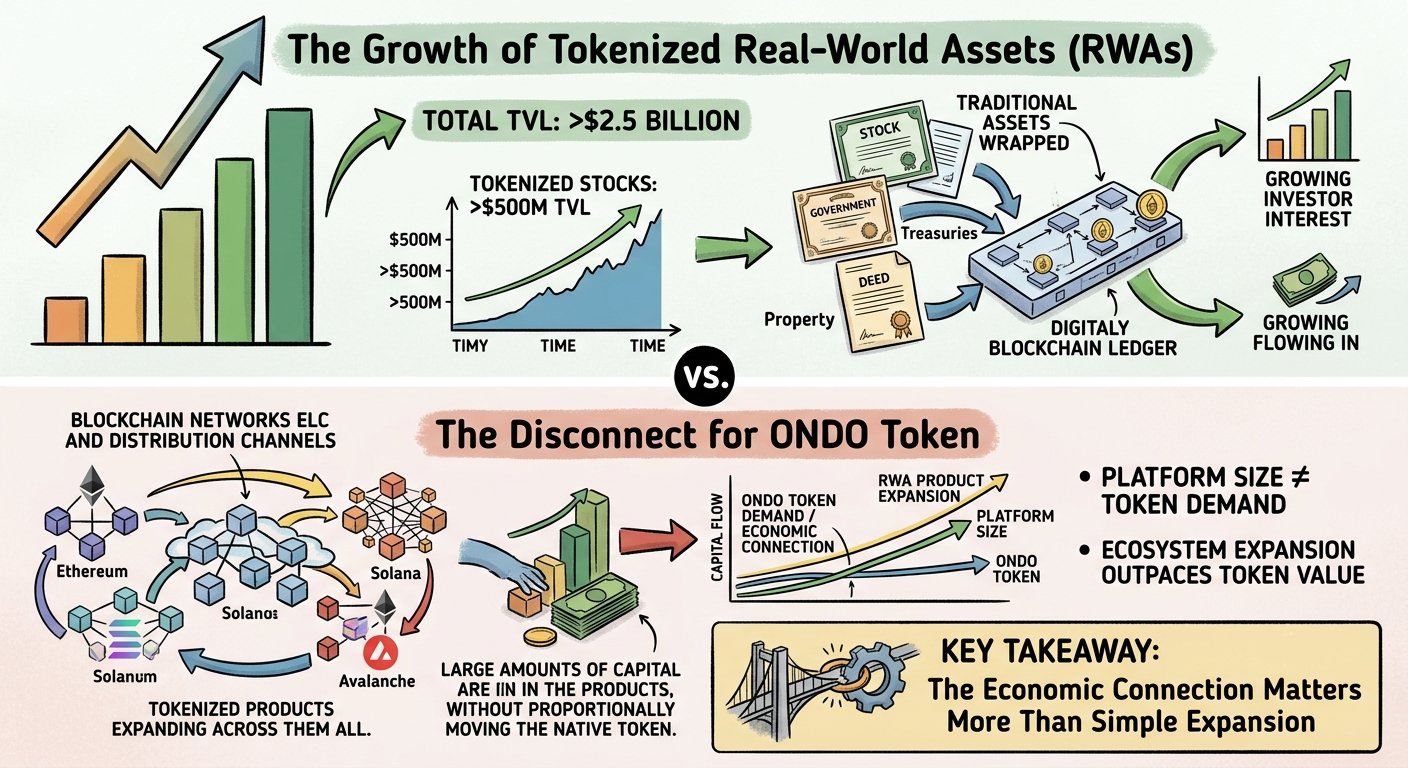
More than $2.5B in TVL across tokenized products shows how quickly the market for onchain traditional assets is expanding Tokenized stocks alone had already passed $500M in TVL while generating billions in cumulative volume Those figures point to growing demand for blockchain-based access to financial assets But there is another side to the story The growth of the underlying products does not automatically mean proportional demand for ONDO Treasuries, equities and other tokenized assets can attract significant capital while the native token captures only a limited portion of that economic activity This distinction becomes increasingly important as these products expand across multiple chains and distribution channels The platform can therefore become much larger without the token necessarily moving at the same pace What matters next is whether the expansion of tokenized assets creates a stronger economic connection to the token itself rather than simply increasing the size of the ecosystem around it #دليل مطالبات MyBybitAI $ONDOUSDT #بايبت الذكاء الاصطناعي اشترى الانخفاض
More than 1,100 verified alpha burn events in a week shows that Bittensor's subnet economy is producing measurable activity The reported period also included more than 500 TAO involved in those burns, suggesting that economic consumption is taking place across the subnet system But the raw number needs more context A rising burn figure can confirm that subnet mechanics are functioning without proving that demand is broad, recurring or evenly distributed Individual subnets can experience strong activity while other parts of the ecosystem remain relatively quiet $BTCUSDT That is why consistency matters more than one strong weekly reading If burn activity continues across multiple subnets while usage remains stable or expands, the signal becomes much stronger The interesting part will be whether that activity survives periods when attention around the AI narrative becomes less intense If it does, the numbers begin to look more like underlying network demand than short-term speculation. #نبض السوق #ByXIMPACT

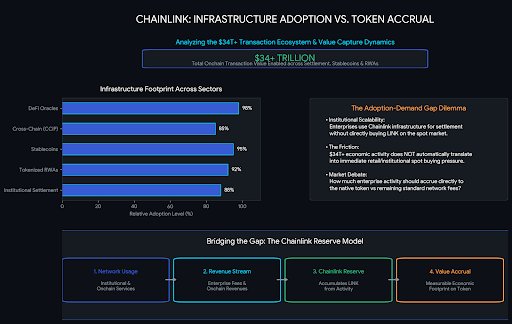
More than $34T in transaction value enabled is a difficult number to ignore Chainlink is now appearing across tokenized assets, stablecoins, institutional settlement and other financial infrastructure, pushing the network further into the underlying layer of onchain finance That expansion matters But there is still a gap between infrastructure adoption and token demand A financial institution can rely on Chainlink services without every dollar of economic activity immediately creating buying pressure for LINK The Chainlink Reserve introduces another connection by accumulating $LINKUSDT through certain enterprise and onchain revenues That makes the token economics more interesting than simply counting new partnerships Institutional adoption can continue growing while the market still debates how much of that activity should accrue to the token What matters from here is whether the mechanisms linking network usage to LINK become large enough to leave a measurable economic footprint #ByXIMPACT #دليل مطالبات MyBybitAI
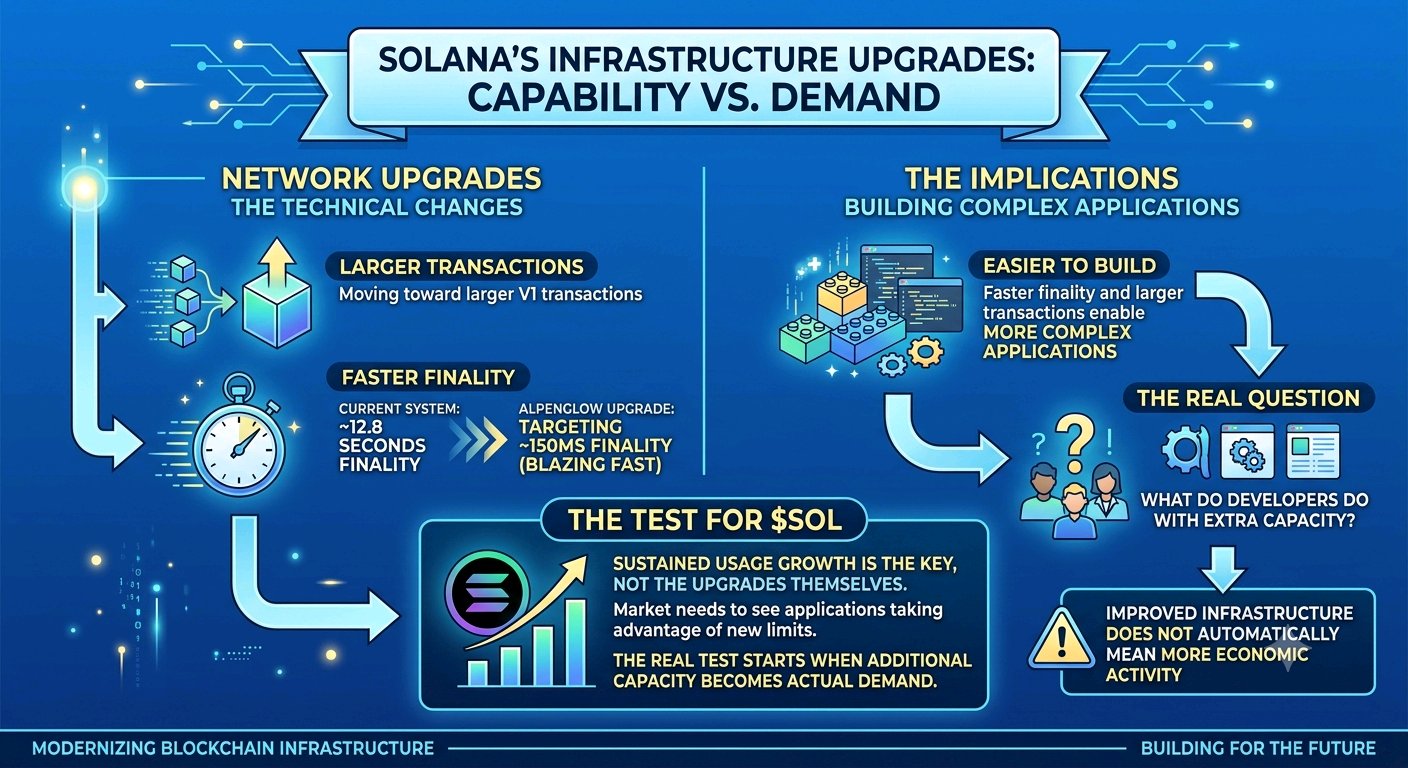
$SOLUSDT is entering another infrastructure phase, but the important question is what developers actually do with the extra capacity The network's latest transaction work is moving toward larger V1 transactions, while the planned Alpenglow consensus upgrade targets roughly 150ms finality compared with about 12.8 seconds under the current system Those are significant technical changes Faster finality and larger transactions can make more complex applications easier to build But improving the underlying infrastructure does not automatically mean users will generate more economic activity The market still needs to see whether applications take advantage of the new limits, especially as transaction-heavy use cases become more demanding For SOL, the strongest confirmation would be sustained growth in usage after these upgrades rather than the upgrades themselves becoming the main narrative The real test starts when additional capacity becomes actual demand. #CPI3.4
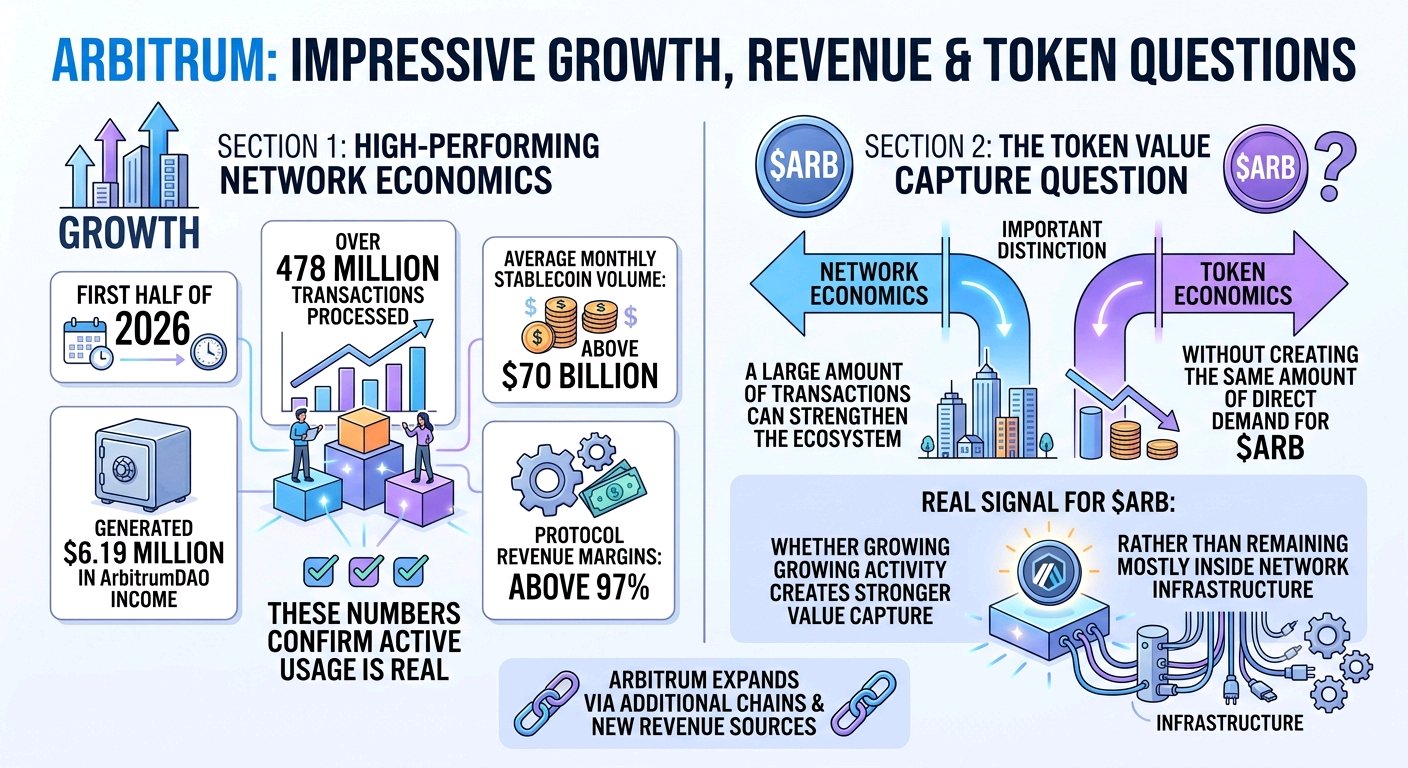
Arbitrum is showing the kind of growth that looks impressive at the network level, but the token still has another question to answer During the first half of 2026, Arbitrum processed 478M transactions while average monthly stablecoin transfer volume moved above $70B The network also generated $6.19M in ArbitrumDAO income, with protocol revenue margins above 97% Those numbers confirm that activity is not simply theoretical But there is a difference between network economics and token economics A large amount of transactions can strengthen the ecosystem without creating the same amount of direct demand for ARB That distinction becomes more important as Arbitrum expands through additional chains and new revenue sources For $ARBUSDT, the real signal is whether growing activity eventually creates stronger value capture rather than remaining mostly inside the network's infrastructure #ByXIMPACT
Ethena: Resilience Amid Concentrated OES Risk
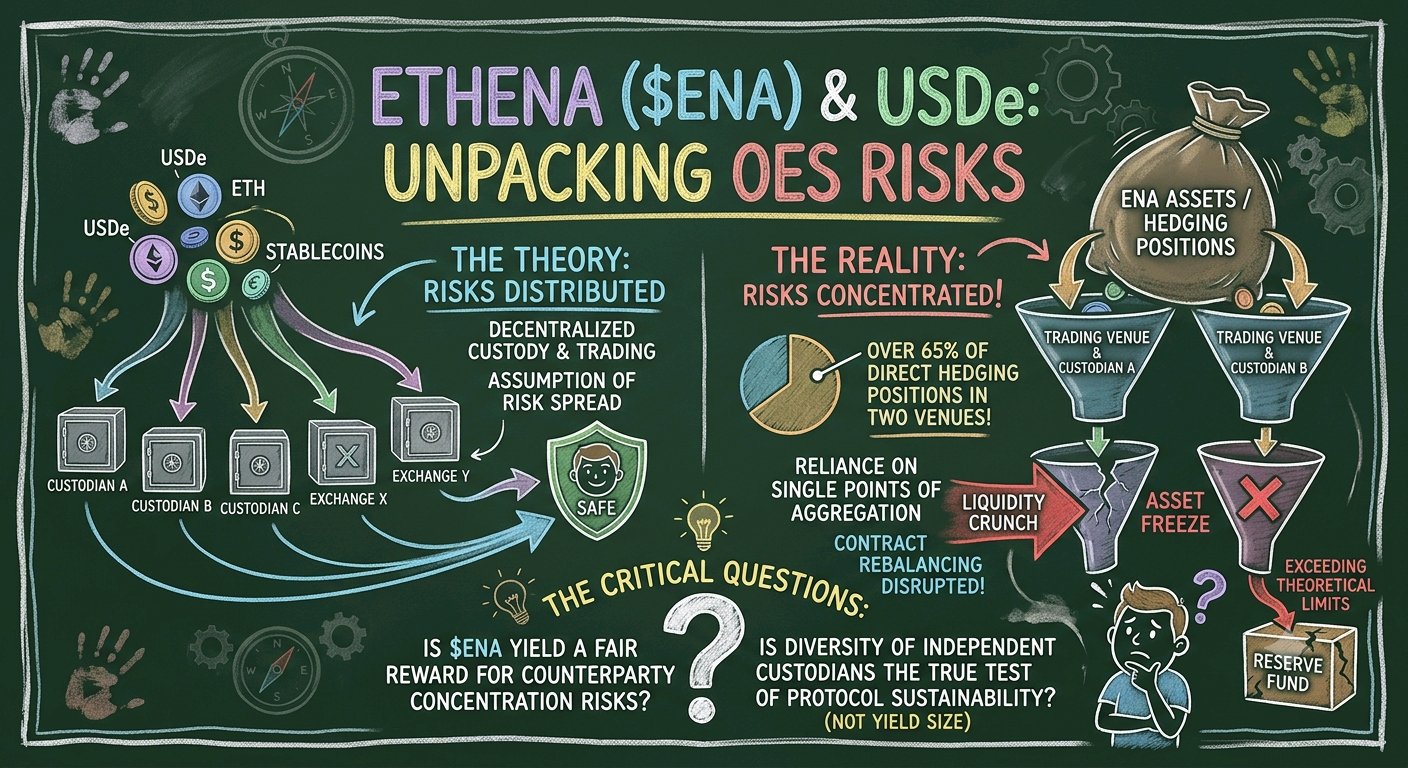
The gains of Ethena’s ($ENAUSDT)$USDe accumulated through marketing a "synthetic dollar" insulated from bankruptcy fears via off-exchange settlement (OES) mechanisms. However, the accounting reality of the collateral reveals that over 65% of direct hedging positions are concentrated within a specific pair of trading venues and external security custodians. A hedging model built on the assumption of risk distribution collides with reliance on defined aggregation points: a liquidity crunch or asset freeze at a single entity is sufficient to disrupt contract rebalancing, exceeding the theoretical limits of the reserve fund. Reducing settlement times does not eliminate the liquidity bias toward centralized channels. The question here remains: does $ENA’s yield represent a fair reward for counterparty concentration risks, or is the diversity of independent custodians—rather than the size of the yield—the true test of the protocol's sustainability? #ByXIMPACT
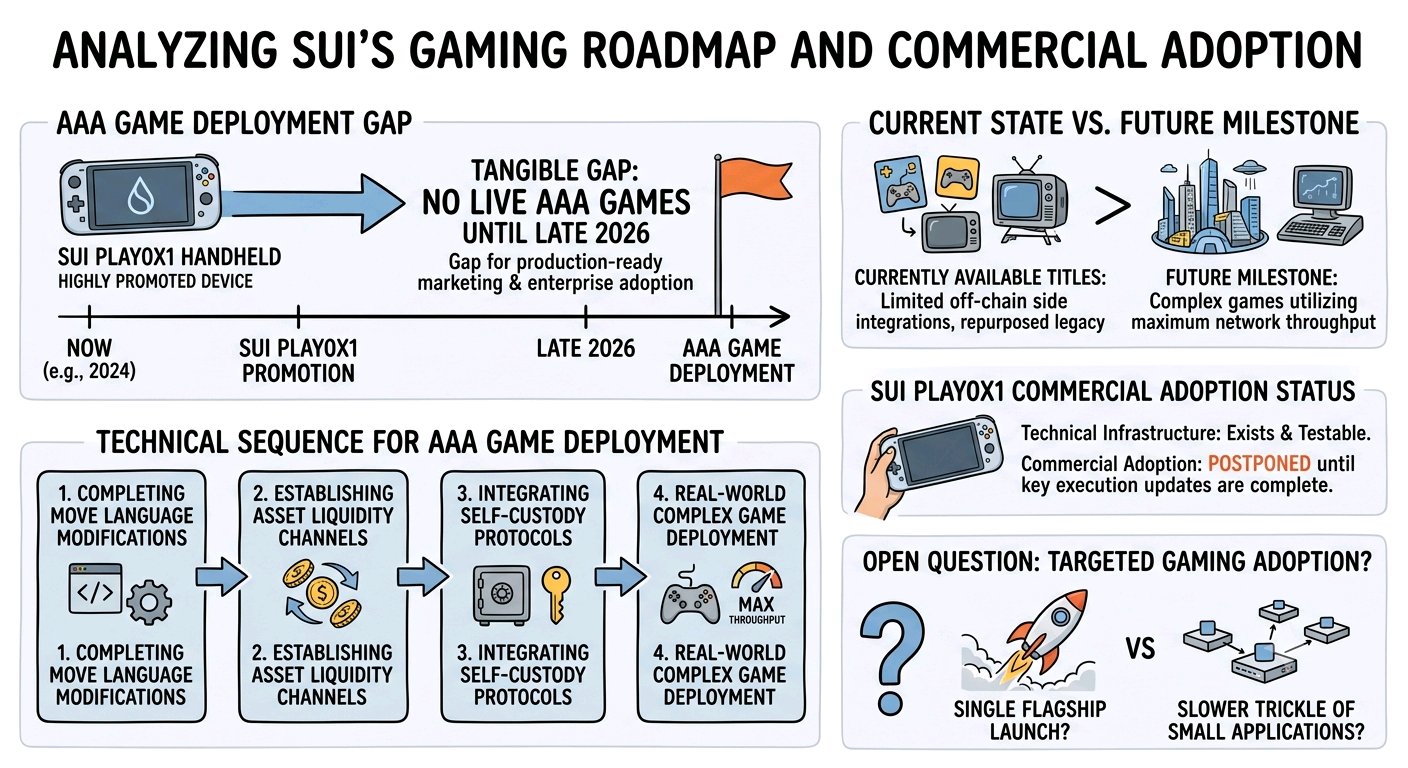
Sui’s roadmap itself does not project the live deployment of AAA games on its mainnet until late 2026—even though the SuiPlay0X1 handheld device received an intensive promotional showcase, where it was highlighted as an immediately active tool. This timeframe represents a tangible gap for a technology marketed as a production-ready cornerstone for enterprise adoption. $SUIUSDT Here is the approved technical sequence: completing structural modifications to the Move programming language, followed by establishing liquidity execution channels between assets, prior to integrating direct self-custody protocols. Only after these prerequisites are fulfilled will the actual deployment of complex games designed to fully utilize maximum network throughput emerge—which remains framed as a long-term milestone, while currently available titles are restricted to off-chain side integrations or repurposed legacy games. The device's technical infrastructure exists and is testable, yet the rationale for true commercial adoption remains postponed behind key updates pending in the project's execution plan. When this targeted gaming adoption finally materializes, will it launch through a single flagship title, or via a slower trickle of smaller applications testing the waters first? #ByXIMPACT
SOL - Has the Shift Begun?
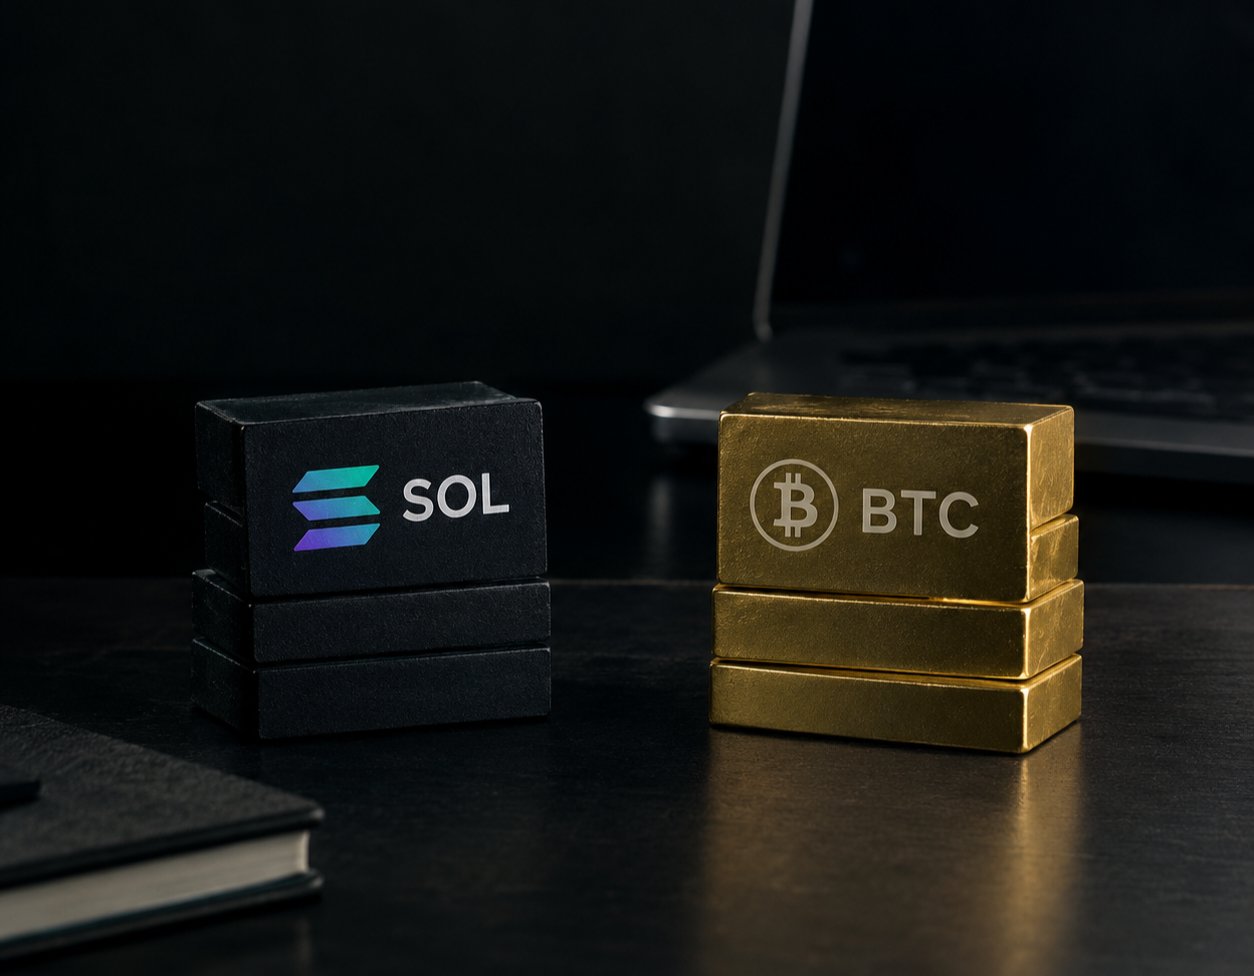
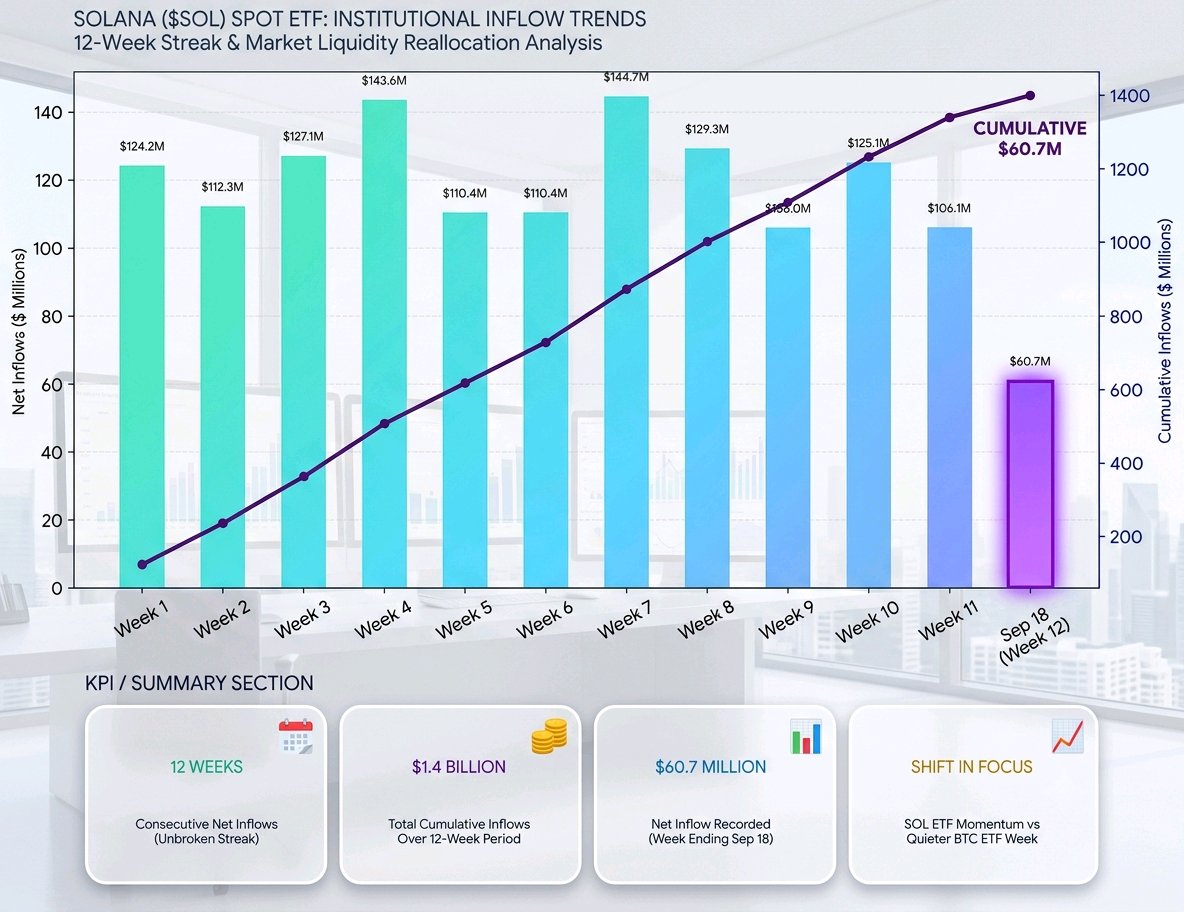
Institutional market activity has long been associated with Bitcoin ($BTCUSDT) as the primary destination for large-scale liquidity. However… the landscape appears to be changing; Solana ($SOLUSDT) spot ETFs in the United States have recorded 12 consecutive weeks of net inflows, totaling approximately $1.4 billion, while Bitcoin ETFs experienced a quieter week. What is even more notable is that the week ending September 18 alone saw approximately $60.7 million in inflows into SOL ETFs. Could this simply be a temporary phase of liquidity reallocation… or are we witnessing the beginning of a gradual shift in how institutions view Solana? The market is now presenting us with a shift that deserves close attention. #CPI3.4 #ByXIMPACT
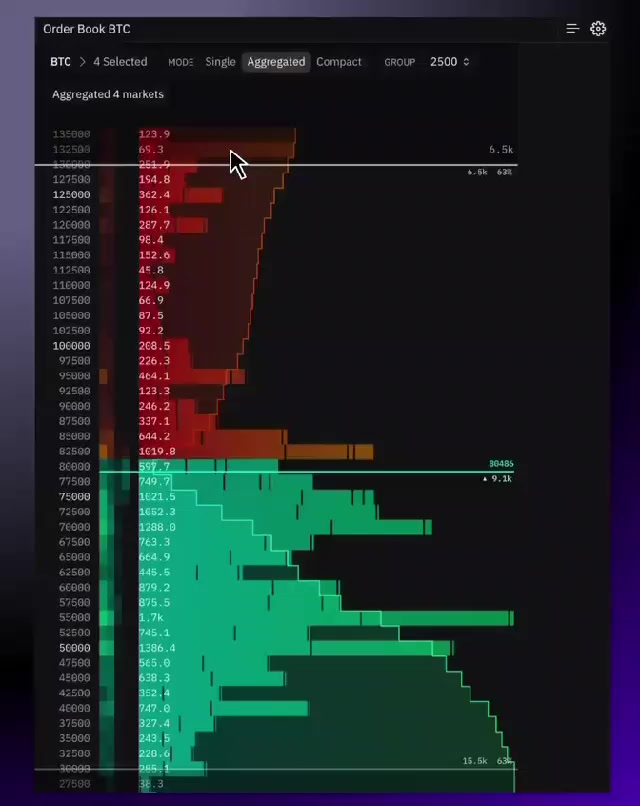
🔥 Bitcoin is challenging the $83K sell wall, and the path to $100K is wide open! Bitcoin is facing a massive sell wall at $83,000, and absorbing it will ignite explosive momentum in favor of the bulls. 🐂 $BTCUSDT Breaking through this level and flipping it into strong support opens the door directly toward new all-time highs. The next target all eyes are fixed on is $100,000, but reaching it demands sustained stability and $ETHUSDT .continuous momentum If Bitcoin successfully absorbs the current selling pressure, it will completely shift market sentiment in favor of a massive bullish rally. #ByXIMPACT
BR | Bedrock — Technical Structure
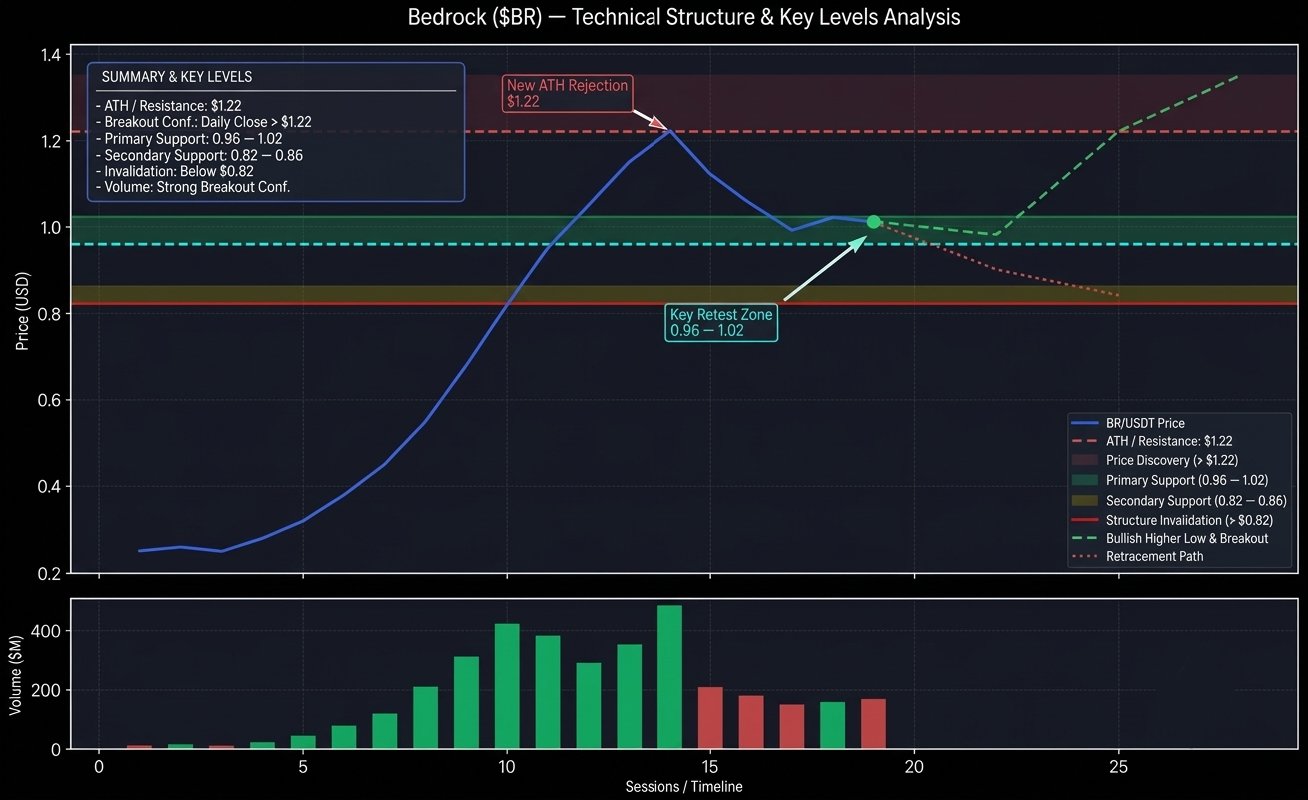
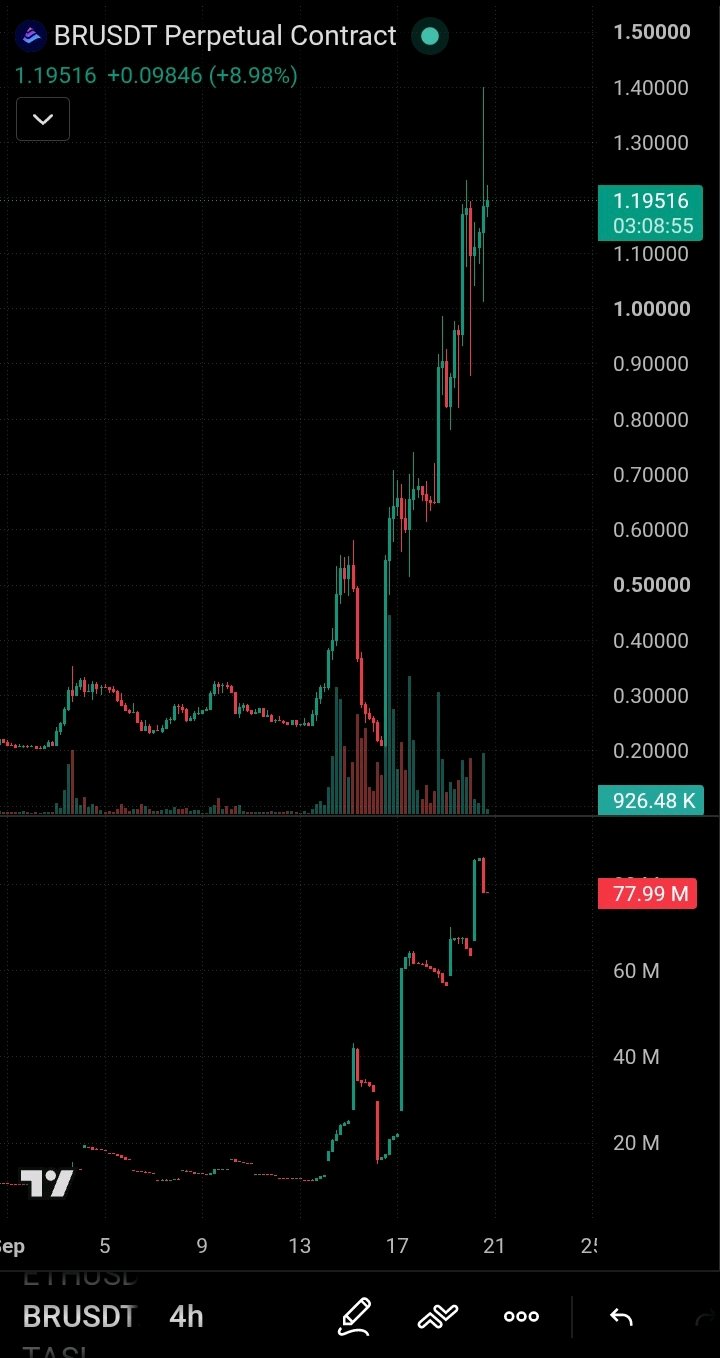
Bedrock ($BR) has gone through an aggressive expansion phase, with price accelerating from the $0.25 area to a new all-time high near $1.22 within only a few sessions. This move represents a major shift in short-term market structure, but the speed of the rally also makes the current zone highly sensitive to profit-taking. On the daily chart, BR printed several wide-range bullish candles, with price advancing from approximately $0.25 to above $1.00. The latest session pushed toward $1.22 before sellers appeared, creating a clear rejection around the new ATH zone. Volume provides an important confirmation here. Trading activity expanded dramatically during the breakout, with daily volume reaching hundreds of millions of dollars during the strongest expansion sessions. This indicates that the move was supported by substantial market participation rather than a quiet liquidity-driven spike. After such an extended move, the next phase becomes more important than the initial breakout itself. The $0.96–$1.02 region is the first area I would monitor as a potential retest zone. If buyers successfully defend this range and build another higher low, BR could attempt to challenge the $1.22 ATH again. A daily close above $1.22 with sustained volume expansion would confirm a fresh breakout into price discovery. On the opposite side, losing $0.96 could increase the probability of a deeper retracement toward $0.82–$0.86, while a break below $0.82 would weaken the current bullish structure considerably. 📌 Key levels: • ATH / resistance: $1.22 • Breakout confirmation: $1.22+ • Primary support: $0.96–$1.02 • Secondary support: $0.82–$0.86 • Structure invalidation: below $0.82 The key question now is whether BR can convert the recent vertical expansion into a sustainable higher-low structure, rather than simply extending the rally without consolidation. Technical market view only — not a financial recommendation. $BRUSDT #ByXIMPACT
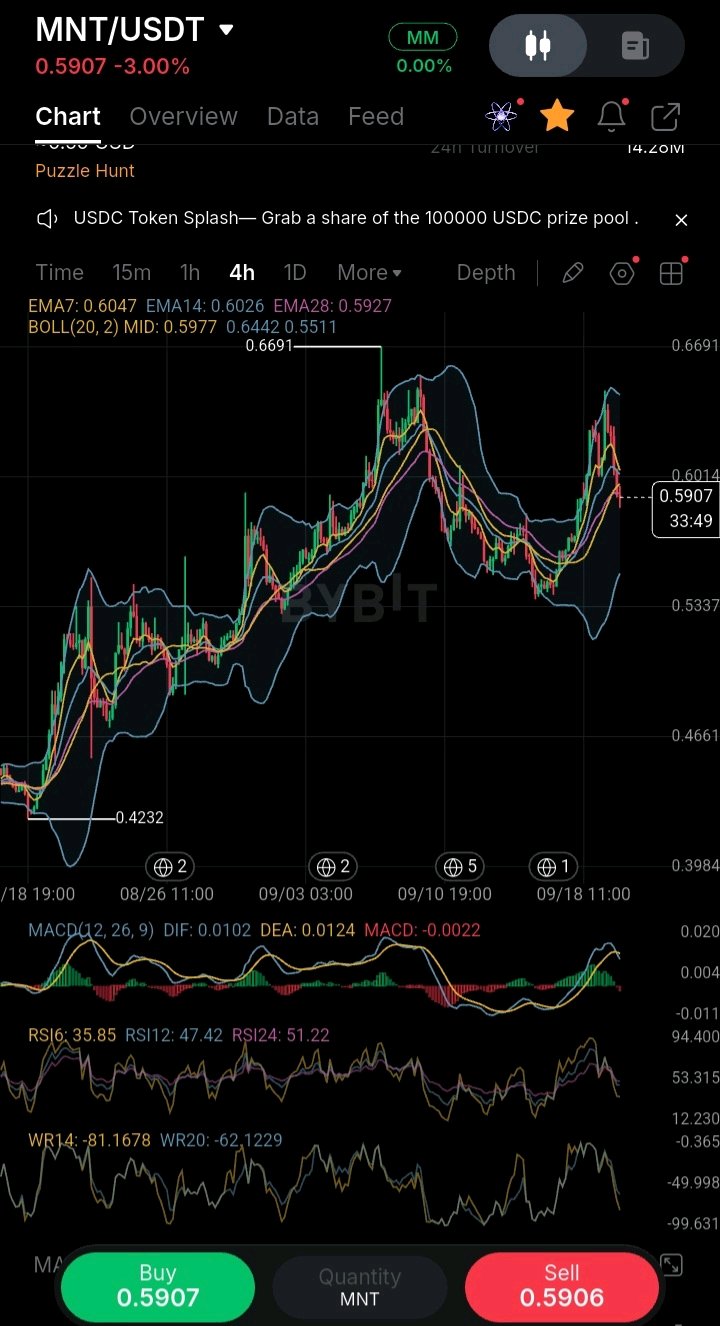
$MNTUSDT : has moved from the 0.54 area toward 0.6461 over the past several sessions before entering a consolidation phase following the sharp advance. On September 18, price surged roughly 9.6%, moving from 0.5704 to 0.6250, accompanied by a clear expansion in trading activity. Since then, momentum has gradually cooled. Price is currently hovering around 0.62, while today’s session has remained relatively tight between 0.6195 and 0.6274. After the previous impulse move, this behavior puts the market at an important decision point: does the recent rally develop into a new base, or do buyers need more time before attempting another breakout? Trading Volume: Activity expanded significantly during the advance. The September 18 session recorded roughly $30.9M in volume, compared with around $16.6M on September 17. The fact that volume increased alongside price gives the previous move more credibility than a low-participation bounce. However, the subsequent decline in activity means that another expansion in liquidity will likely be needed for MNT to push higher. The key detail is that price has not given back the majority of its recent gains despite the cooling momentum. Therefore, declining volume alone does not confirm distribution; it simply means the market needs fresh participation for the next leg higher. Support & Resistance: • Resistance: 0.627–0.646 is the main supply zone where price has recently faced selling pressure. A confirmed close above 0.6461 would put the recent high back into focus and strengthen the short-term structure. • First support: Around 0.594, which has acted as a near-term reaction area. • Major support: 0.57–0.58. This is the zone from which the latest advance originated, while the 200-day moving average is also positioned near 0.572 according to recent data. Key Level to Watch: 0.594 Holding above this area keeps the recent bullish structure intact. A decisive break below it, particularly with expanding sell volume, would increase the probability of a deeper retracement toward 0.57–0.58. Momentum: MNT remains significantly above the lows recorded in mid-September, but price action has become more compressed following the aggressive impulse. I would therefore avoid chasing price in the middle of the range and instead focus on confirmation: either a high-volume breakout through resistance or a retracement into support where buyer reaction can be measured. Trading Plan: • Daily close above 0.646 with expanding volume → potential continuation of the bullish move. • Break below 0.594 with increasing volume → opens the path toward 0.57–0.58. • Price remains between 0.594 and 0.646 → consolidation phase; waiting for a confirmed range breakout is preferable to assuming direction prematurely. Invalidation: A strong close above 0.646 accompanied by rising volume would materially change the short-term structure. Conversely, losing 0.57 would weaken the bullish setup that developed over the past week. Technical view only — not a financial recommendation. #ByXIMPACT
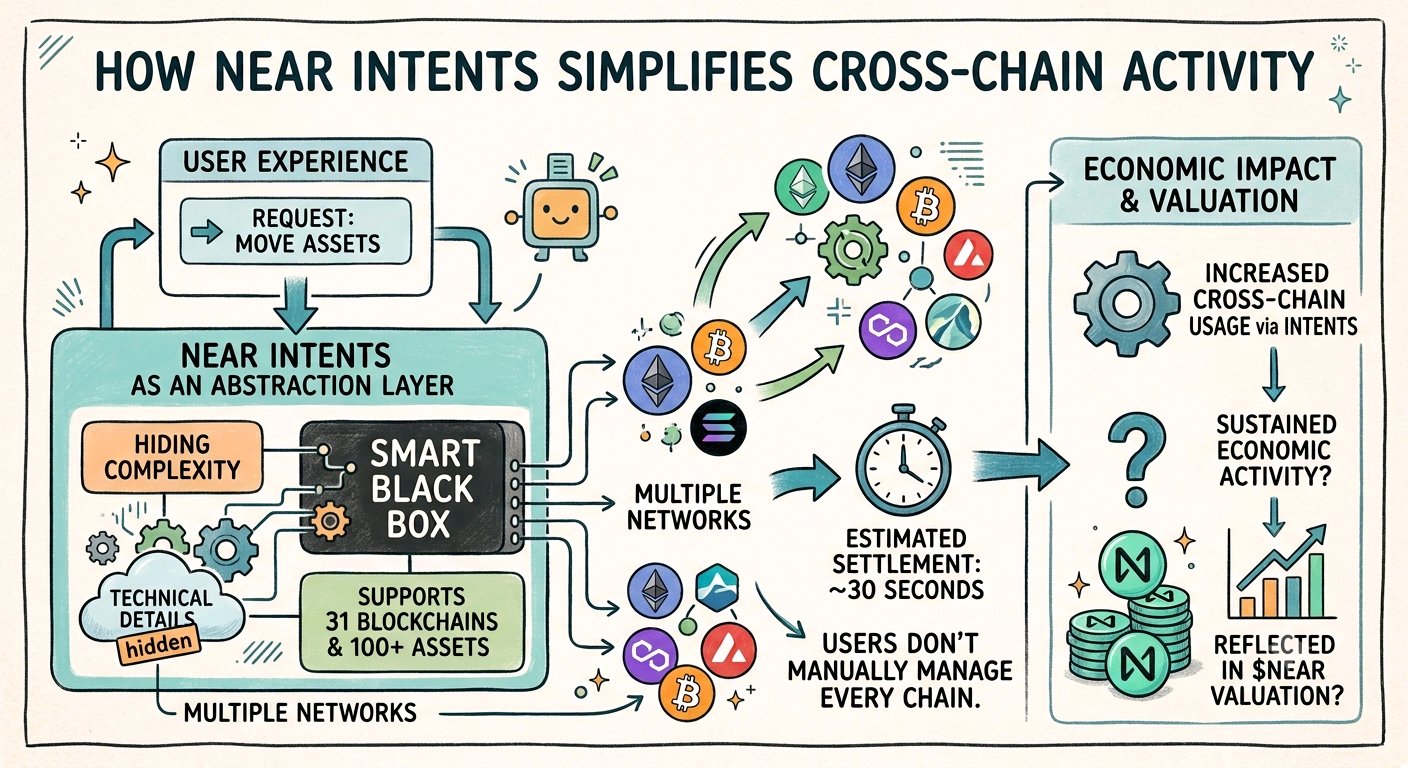
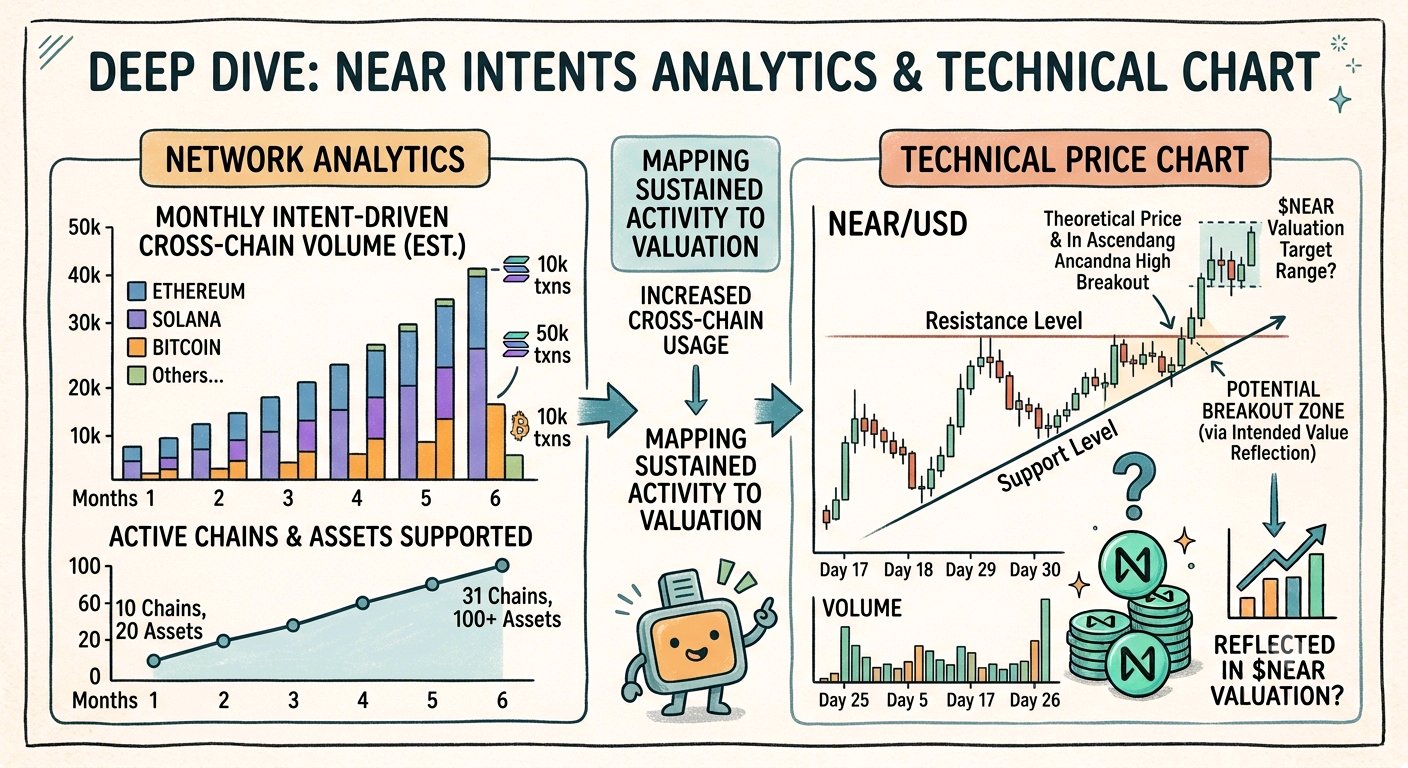
NEAR is making cross-chain activity less complicated for users NEAR Intents supports assets across 31 blockchains and more than 100 assets, with settlement designed to happen in roughly 30 seconds The interesting part is not simply the number of supported networks It is the attempt to hide the complexity of different blockchains from the user That could become increasingly important as more applications operate across multiple networks and users expect assets to move without manually managing every chain But there is a difference between building cross-chain infrastructure and creating direct value for the token For $NEAR, the next question is whether Intents becomes a sustained source of economic activity If usage continues expanding across chains and assets, NEAR's role as an abstraction layer becomes much more measurable The market will then have to determine how much of that activity should eventually be reflected in NEAR's .valuation #CPI3.4 #ByXIMPACT $NEARUSDT $NEARUSDC