Blockchain_Researcher
4760Like0Shares614Fans5Follow
Onchain analyst X @Byte_Bloomm
Onchain analyst X @Byte_Bloomm
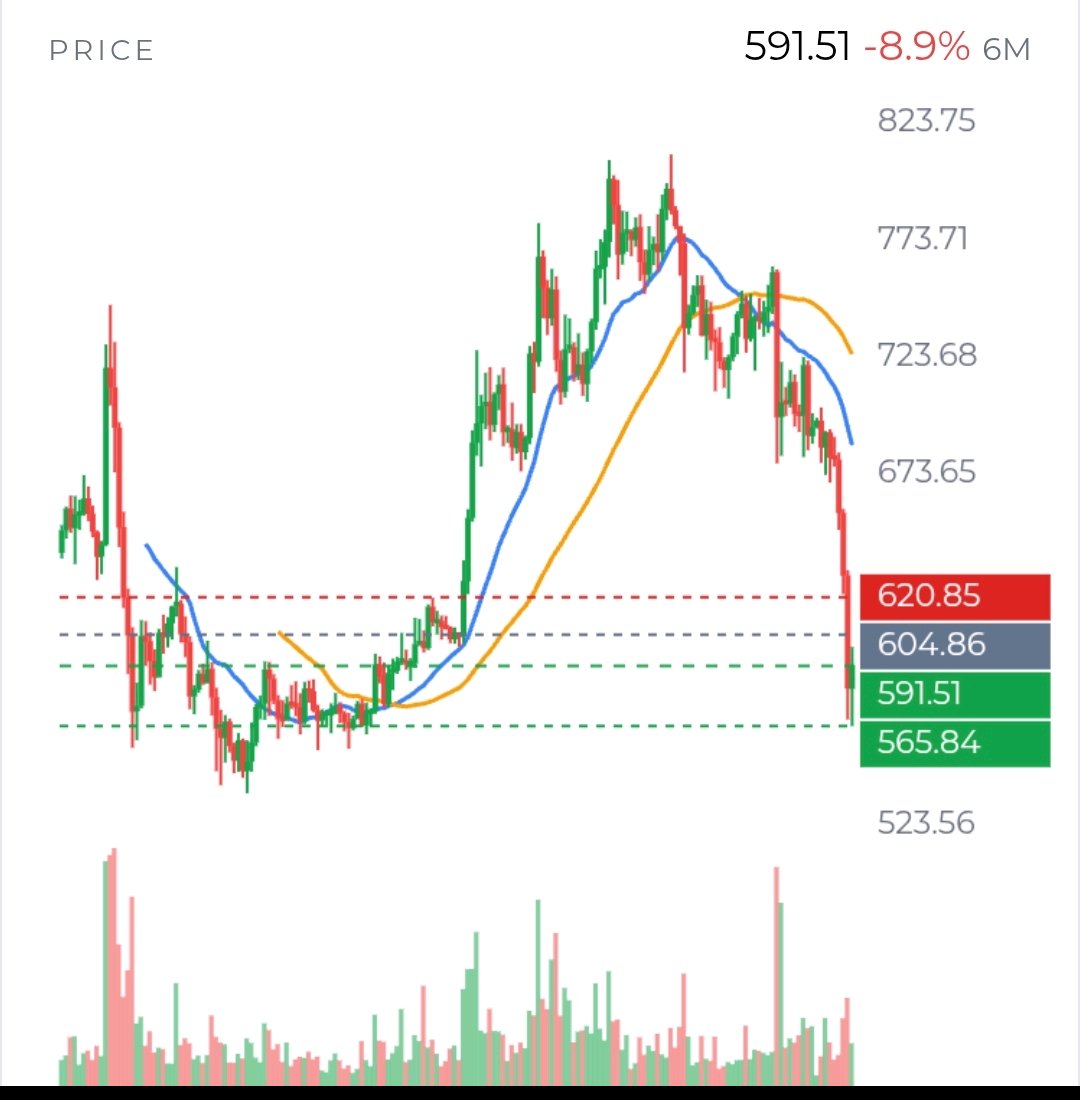
$BNBUSDT is not giving a clean signal yet. The important question is no longer simply “Is it oversold?” It is whether the market can turn a sharp drop into a stable base—or whether each bounce is an opportunity for sellers to exit. The verified picture is weak, but not one-sided. BNB is around $591, down about 15% in 7 days and 18% in 30 days. It remains below its daily EMA20 near $675 and EMA50 near $703; the hourly trend is also down. Daily RSI is 24.2, a level commonly called oversold. That tells us the decline has been forceful. It does not tell us the decline is finished. The levels closest to price matter most. Buyers have a first test at $585.72–$583.11, with the recent low at $565.84 below that. If price breaks the nearby support and cannot reclaim it, the low becomes a plausible retest. But if price holds support, could this be the beginning of a base? I would look for follow-through, not just one green candle. On the upside, $597.89–$604.84 is the first meaningful reclaim area, including the hourly EMA50. BNB has traded above part of that zone, but has not established a sustained hold. $620.60–$620.85 is the next important hurdle. Holding above it would weaken the immediate bearish interpretation; failing there would suggest the rebound has not yet changed the trend. A move all the way back to the daily EMA20 near $675 would require a much larger recovery, not merely a short-covering pop. Participation offers clues, but not a verdict. Reported spot volume is about $1.44 billion across 62 venues, though the top 3 account for 48%, including one venue at 30%. That concentration makes the aggregate number less convincing as evidence of broad buying. Perpetual open interest is reported at $563 million across 4 tracked venues; OKX open interest is down 18.8% over 7 days. That points to leverage coming out on that venue, but does not tell us what happened across the whole market. Funding is nearly flat, at roughly +0.001% per 8 hours. OKX accounts lean long, while top traders’ positioning measures lean short. The disagreement matters: it does not look like a clear, market-wide pile-up of shorts that must be squeezed, or longs that are certain to be liquidated. We also do not have verified liquidation levels, taker-flow data, or order-book evidence. So I would not claim that a particular price is a liquidation magnet or that a squeeze is underway. The wider market is a real part of this story. Total crypto market value is down about 5% in the latest snapshot, and fear is at 10, compared with 28 a week ago. Recent coverage described broad market stress and liquidations. That makes BNB’s fall look partly connected to risk aversion across crypto, not necessarily to a single BNB-specific event. If Bitcoin and the wider market stabilize, BNB could benefit; if they weaken again, local support may be less reliable. BNB Chain’s fundamentals are mixed over different timeframes. Over 30 days, fees fell 33%, TVL fell 14.7%, and stablecoin supply fell 3.7%. Those declines are a genuine headwind, though they do not identify the cause of the current selloff or time a trade. In the other direction, reported 30-day DEX volume is $29.2 billion, and a 12-month merchant-payments report found BNB Chain and Tron handled 75% of merchant USDT pay-ins. That is evidence of use, but not proof that buyers are stepping in now. My analytical view: the downtrend remains intact, while oversold conditions and nearby support make an immediate bearish continuation less certain. The most informative evidence next will be whether $565.84 holds on a retest, whether price can sustain a reclaim above $604.84, and whether any recovery comes with broader-market stability. Until those questions are answered, both a relief bounce and another leg down remain plausible. #IMPACTbyTrade
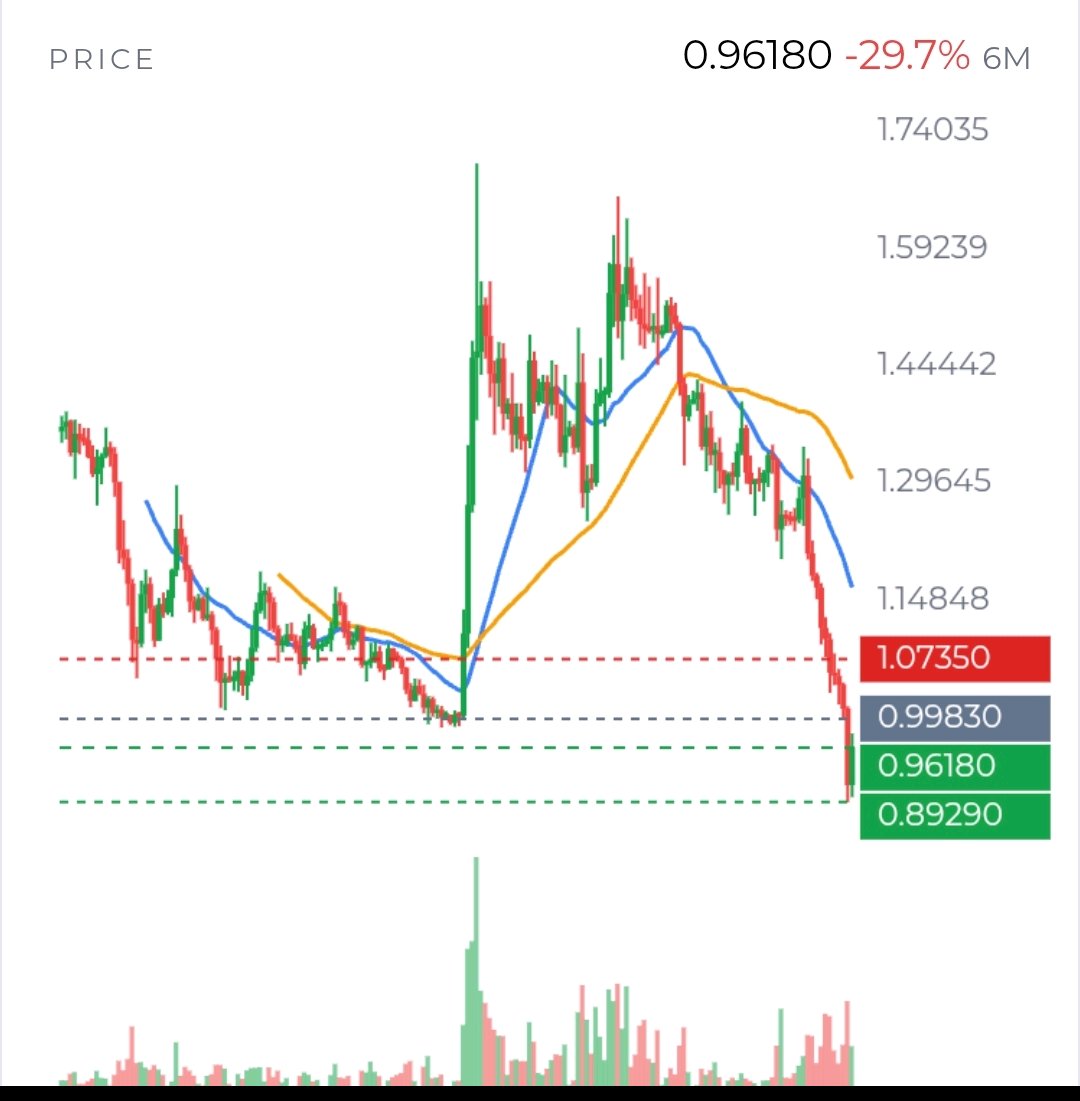
I look at $XRPUSDT less as a chart that must bounce because it is oversold, and more as a market testing whether anyone is willing to defend value after a fast repricing. That distinction matters. A low RSI tells us selling has been intense; it does not tell us who is ready to buy. The next few sessions should show whether the $0.90 area is attracting committed demand or merely pausing the decline. The verified price picture is stark. XRP traded around $0.958 on November 15, after falling to $0.8929 and rebounding from the low. It is down 17.2% over 7 days and 28.0% over 30 days. The daily RSI is 24.3, while price remains beneath the daily EMA20 at about $1.131 and EMA50 at about $1.239. Those averages are far overhead, so a move back to $1 would be a recovery attempt, not yet evidence of a broader trend reversal. I would watch the market in two steps. First, can XRP hold $0.943, then defend $0.8929 if sellers return? Those are nearby reference points, not guaranteed floors. Second, can it reclaim $0.9795–$0.9983 and stay there? That zone matters because it includes recent resistance and the 4-hour EMA20 near $0.991. A sustained hold above it would suggest buyers are doing more than reacting to a sharp fall. A quick spike that fades would tell a different story. Participation is the difficult part to read. Reported 24-hour spot volume was $4.06B, spread across 66 venues, with the top 3 accounting for 24%. That is substantial turnover, but turnover alone cannot tell us whether investors accumulated XRP or sold it to someone else. We do not have reliable spot-flow or order-book evidence here to settle that question. I would want to see price rise alongside persistent spot demand, rather than infer accumulation from a rebound candle. The derivatives market offers a possible source of volatility, not a dependable forecast. Open interest was reported at $633M across 4 tracked venues, and funding was negative at -0.011% per 8 hours, meaning shorts pay longs. That can make a sudden upside move uncomfortable for short positions. But open interest is not a count of shorts, and negative funding does not guarantee short covering. Positioning is mixed: OKX long/short accounts were net long at 2.18, while top traders’ positions leaned short at 0.91. If XRP rises, does open interest expand with the move—or shrink as traders close positions? That would help distinguish new participation from a temporary squeeze. There are reasons demand might remain hesitant. U.S. spot XRP funds recorded $6.48M in net outflows over 5 days and $1.18M over 20 days, though the latest reported session, November 13, was positive by $3.38M. On XRPL, stablecoin supply was $839M, down 25.4% over 30 days, and value locked was $30M, down 25.3%. Those figures suggest weaker recent activity and capital on the network. They do not, on their own, prove that ETF flows or on-chain weakness caused the price decline. Broader crypto was also under pressure: total market capitalization fell 4.9% in 24 hours, and fear-and-greed sentiment stood at 10, indicating extreme fear. One news detail deserves care rather than a dramatic interpretation. XRP exchange balances appeared to rise by 346.7M, but an adjusted comparison of the same tracked wallets showed a decline of 180.9M. The difference reflects newly tracked wallets, so the larger headline figure is not clean proof of fresh exchange deposits. Nor does the adjusted decline prove that investors are accumulating. My view remains conditional, not a call for either outcome. A sustained move above $0.9983, supported by spot demand, would make a recovery toward $1 more credible. Losing $0.943 and then $0.8929 would instead suggest the rebound has not found a durable base. The useful question is not whether XRP is “cheap” after falling. It is whether buyers keep showing up when the market tests them—and whether that demand appears in actual trading, not just in oversold readings or hopeful positioning. #IMPACTbyTrade $BTCUSDT
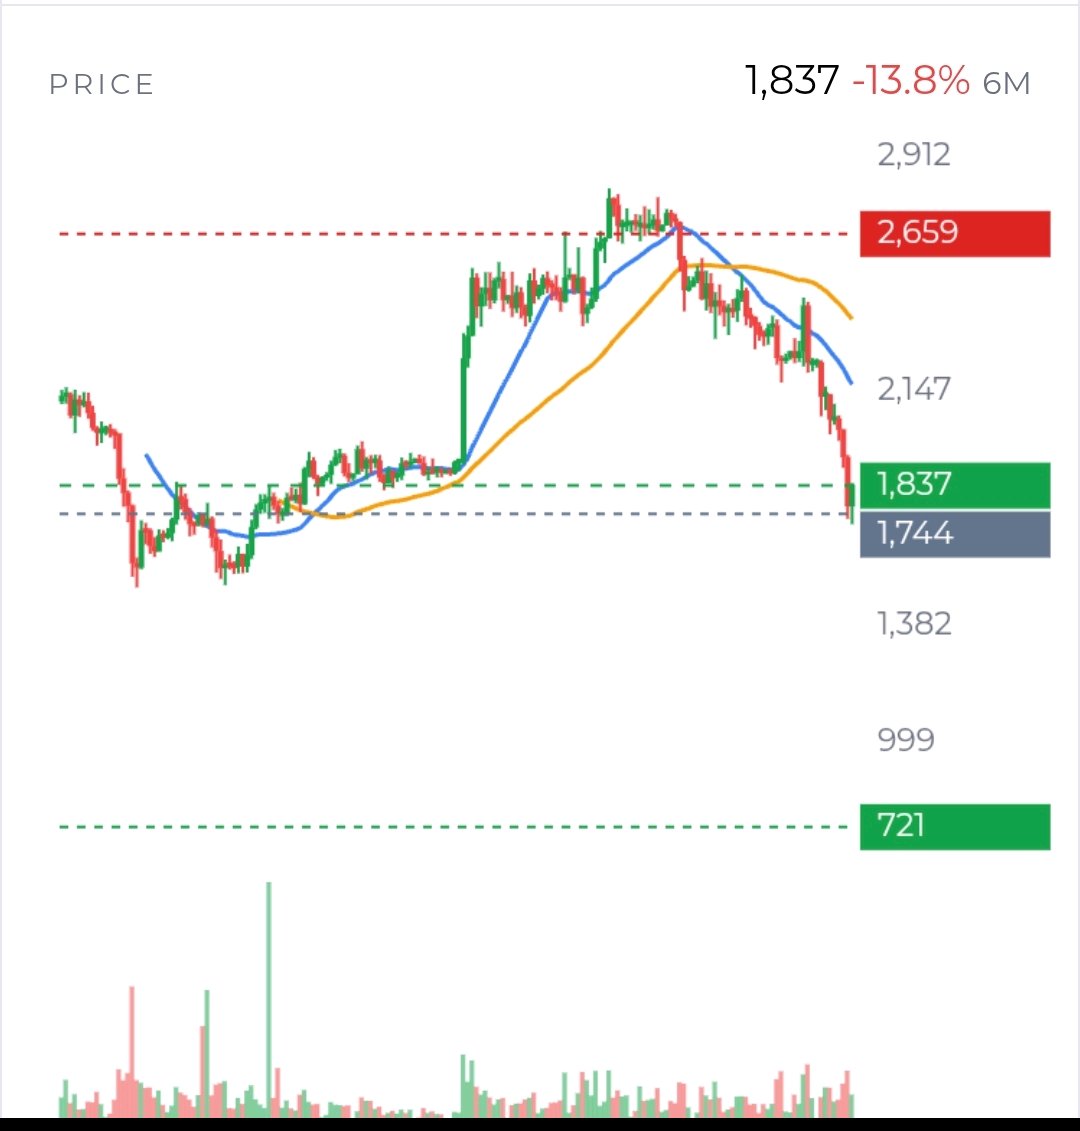
$ETHUSDT is trying to stabilize after a violent break lower, but so far the evidence looks more like a relief bounce than a confirmed change in trend. On November 15 it traded near $1,836 after falling 17.9% in a week and briefly touching $1,711. That low matters: it is the clearest nearby test of whether buyers are willing to defend the market. If ETH loses it, the next meaningful weekly support in the available chart data is around $1,504. If it holds, traders still need to ask whether the bounce can reclaim levels that sellers just surrendered. The short-term picture has improved, but only modestly. ETH has moved back above its 1-hour EMA20 near $1,820, yet it is pressing resistance around $1,845 and remains below the 1-hour EMA50 near $1,862. The larger trend is much weaker: price is below the 4-hour EMA20 near $1,898, the 4-hour EMA50 near $2,013, and the daily EMA20 near $2,127. Daily RSI at 26 shows the selloff is stretched; it does not, on its own, prove a bottom. A close above $1,845 would be an early sign of repair, but reclaiming $1,898 and then $2,013 would make the bullish case more credible. What would count as confirmation? Ideally, a successful retest of those levels, with buyers still present. The backdrop is a broad crypto selloff, not an ETH-only event. The market’s total capitalization was down 5.8% on November 15, and reports put total 24-hour crypto liquidations near $1.96 billion, with about $472 million attributed to ETH and long positions taking most of the losses overall. These figures suggest forced selling helped accelerate the drop, but they do not tell us exactly where ETH’s liquidations occurred or whether another cluster remains overhead or below. A liquidation zone can attract price, but it does not guarantee a reversal. Derivatives show some leverage has come out. OKX open interest fell 13.2% over 7 days, while funding across major venues was mildly negative, around −0.004% per 8 hours on an open-interest-weighted basis. That is consistent with traders closing positions and a slightly short-leaning market. It can reduce pressure from crowded longs, but it can also mean buyers have not yet returned. Positioning is mixed: OKX long/short accounts were net long, while top traders’ position ratio was below 1. The bounce therefore needs confirmation from actual demand, not just fewer open contracts. That demand question is central. US spot ETH ETFs recorded about $399 million in net outflows over 5 days and $1.42 billion over 20 days. ETH spot volume was substantial—$24 billion across 68 venues—but volume alone does not reveal who was more aggressive. We do not have reliable CVD or order-book imbalance here, so it would be a mistake to claim that spot buyers absorbed the selloff. Reports of Binance reserves near a five-year low could indicate fewer coins readily available to sell; equally, reserve declines alone do not establish accumulation. A widely shared claim that a large seller was linked to the Ethereum Foundation was challenged, so I would not treat that attribution as verified. Fundamentals offer a counterweight, but not an immediate price catalyst. Ethereum still has substantial stablecoin and decentralized-finance activity, and recent reporting points to institutional use of Ethereum for tokenized assets. Yet on-chain measures show TVL down 19.7% over 30 days and stablecoin supply down 8.1%. Protocol revenue remains small relative to ETH’s valuation. These facts raise a practical question: is institutional adoption creating enough incremental demand for ETH itself, or mainly activity on the network? My read is cautious, not certain. Extreme fear, oversold momentum, and reduced open interest leave room for a sharp rebound; persistent ETF outflows, falling on-chain balances and a damaged daily trend argue against calling that a reversal. The next useful evidence is whether ETH holds $1,711, reclaims $1,845 and $1,898, and does so with spot participation and improving ETF flows. If it instead loses $1,711, the bounce thesis weakens. #IMPACTbyTrade
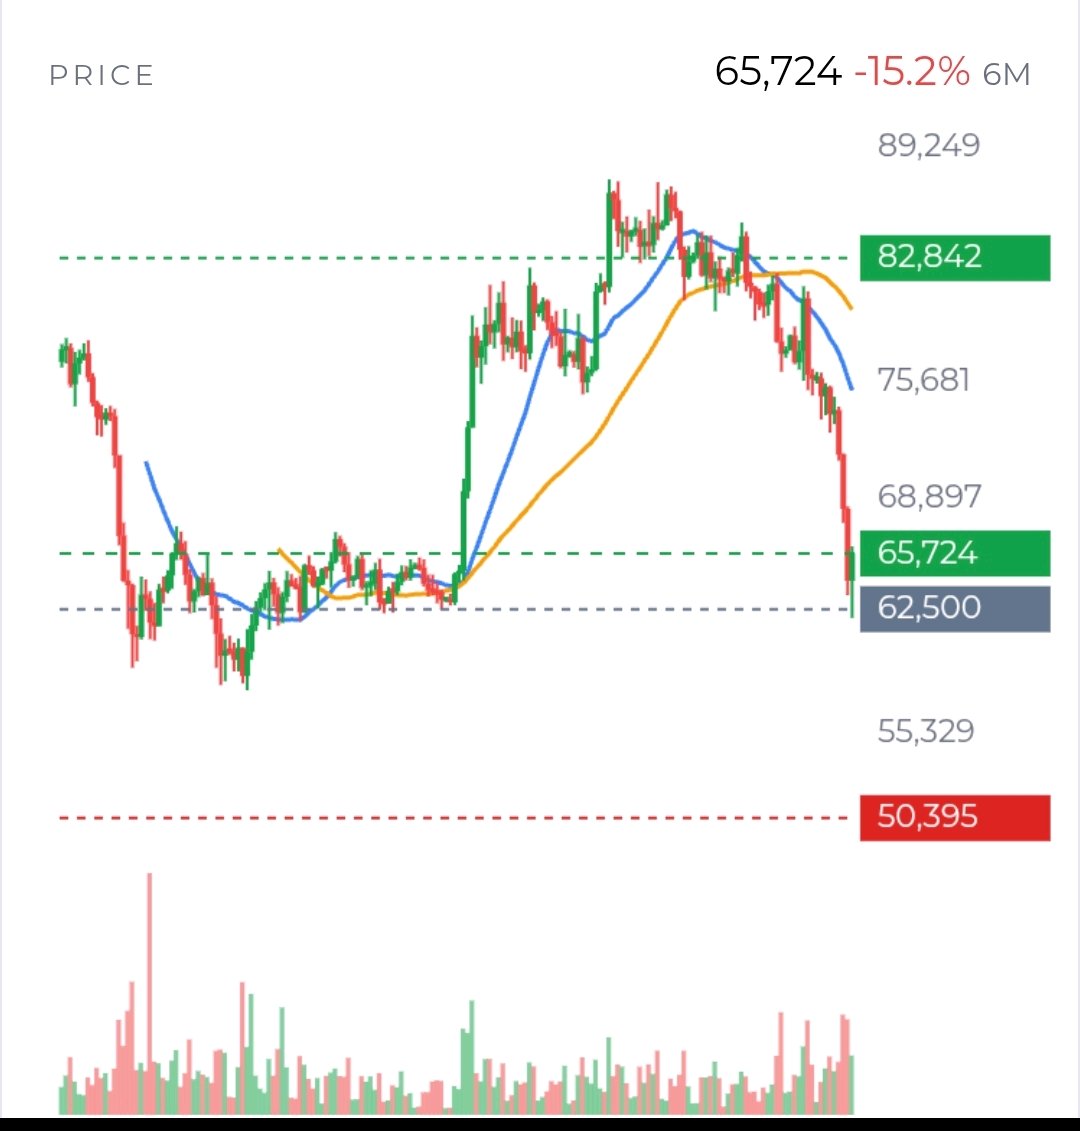
Bitcoin looks less like a market that has found its footing and more like one testing whether buyers will defend a sharp sell-off. Around $65,600, the important question is not whether BTC can bounce from an oversold reading. It is whether demand returns after the forced selling. My view is cautiously constructive over 6–12 months, but the chart has not confirmed a reversal. The strongest near-term evidence against that view is the flow picture. U.S. spot Bitcoin funds have seen 7 consecutive days of outflows: $1.07B over 5 days and $2.25B over 20 days. That is a real headwind. Still, cumulative net inflows since January 2024 remain about $54.7B. To me, that history matters because it shows institutional access has brought a substantial pool of capital into the market. It does not guarantee those investors will keep buying. The useful test now is whether redemptions ease—and whether BTC can rise when they do. Price offers a clear way to judge the next move. The market fell to $62,000 and rebounded, but has not yet reclaimed nearby resistance around $66,955–$67,522. The 4-hour EMA20, near $67,893, is another hurdle. If BTC can break above that area, hold it on a retest, and attract real spot buying, the rebound would look more credible. If it fails there, or loses $62,000, the bounce may simply be a pause in a downtrend; $57,809 is then an important lower support to watch. Why give $62,000 so much weight? It is the recent low, reached during a sharp drop that coincided with reported heavy long liquidations. That combination can mark a washout: leveraged buyers are forced out, selling pressure fades, and price recovers. But liquidation data alone cannot tell us that the sellers are finished. The next test is whether open interest rebuilds in an orderly way, alongside spot demand, or whether leveraged longs return before the market has repaired its structure. There are signs of reduced leverage, but not a clean reset. Open interest on 4 tracked perpetual venues is $16.5B; OKX open interest fell 14.5% over 7 days. Overall funding remains slightly positive at +0.004% per 8 hours, although rates vary by venue. My read is that some positions have been cleared, while traders are not uniformly positioned for a further fall. That leaves room for a squeeze in either direction. I would pay more attention to spot participation than to a single long/short ratio. The longer-term case rests on Bitcoin’s limited supply and expanding institutional access. About 20.1M of the eventual 21M BTC supply has been issued. That scarcity supports the monetary-asset argument, but it cannot set a near-term price floor. Network data are also mixed: active addresses are roughly flat, while transactions are down 36.9% over 30 days and fees are lower. That suggests weaker recent settlement activity, not necessarily a collapse in willingness to hold BTC. Extreme fear and a daily RSI near 25 make a rebound plausible; neither is a timing signal by itself. The weekly trend remains down, with price well below its weekly averages. I would change my interpretation if BTC holds $62,000, ETF outflows slow, and price reclaims $67,900 with spot buying behind it. A sustained break below $62,000 would instead make the lower support more relevant. For now, the bullish case is alive—but it still needs buyers to prove it. $BTCUSDT #IMPACTbyTrade
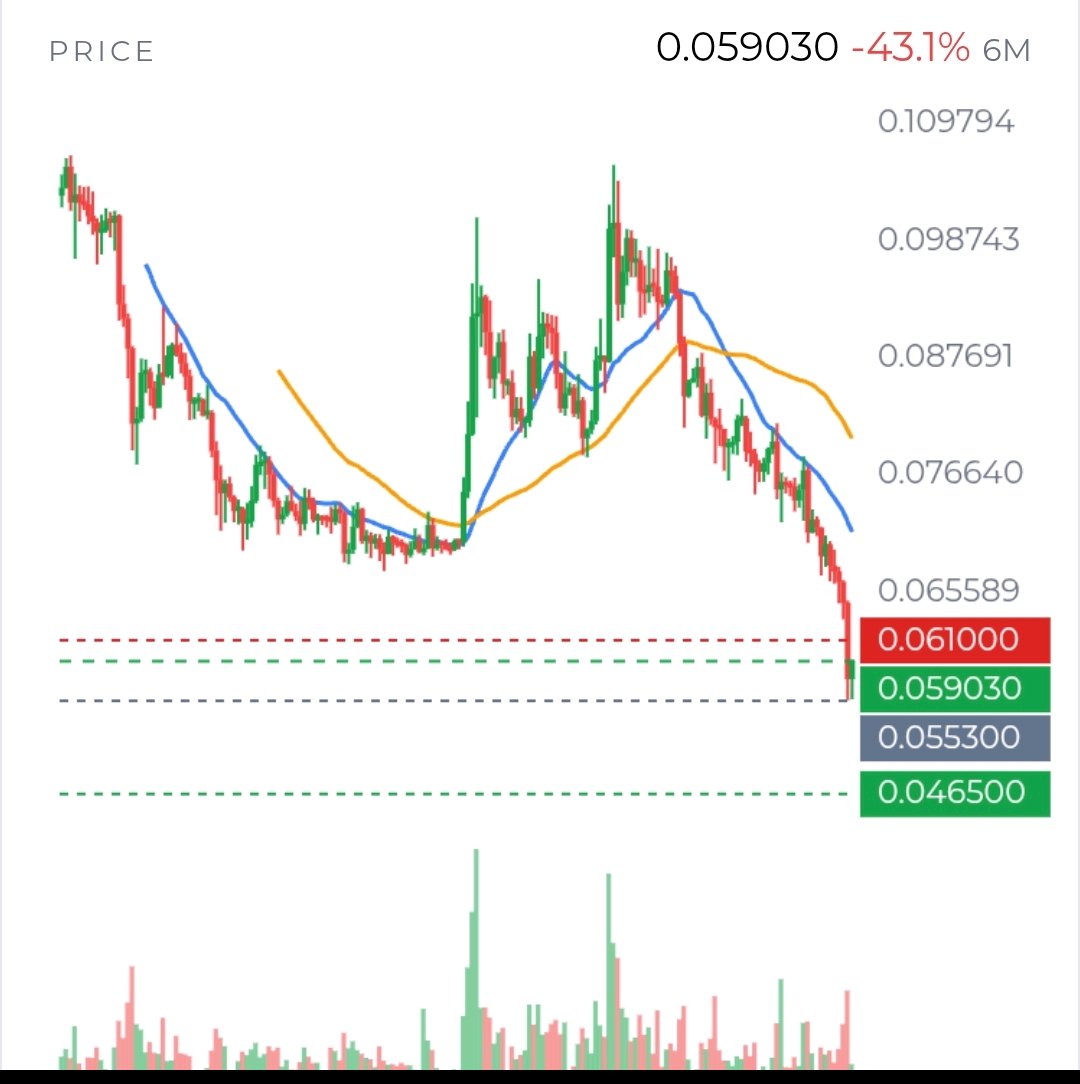
$DOGEUSDT is telling 2 different stories at once. The price chart says the selling has been severe. The positioning data says the market has already taken some risk off. Those facts do not yet tell us whether a durable floor is forming. My focus is less on predicting the next candle and more on asking what kind of participation would make this rebound credible. What we know: DOGE fell 17% over 7 days and touched $0.05537, its reported 52-week low. It has since bounced to about $0.0588. That recovery is real, but still modest beside the decline. The 4-hour and daily trends point down, and price remains well below their 20-period moving averages. Daily RSI is 23.7, an unusually weak reading that makes a snapback plausible. But oversold conditions describe how far price has fallen; they do not identify who is buying or prove that sellers are finished. That distinction matters. If the rebound is being driven mostly by traders covering shorts, it could travel upward quickly and then fade. If fresh spot buyers are accumulating, the move may have more staying power. We do not have spot CVD, which tracks whether aggressive buyers or sellers have dominated, nor reliable exchange-flow or order-book-imbalance data. So we can see the price response, but not confidently identify the source of demand. High reported trading volume shows activity, not whether it was net buying. The derivatives picture is similarly mixed. Perpetual funding is slightly negative overall: shorts pay longs. That can help a rally if price rises and short positions are forced to close. Yet the rate is small and differs by venue; it is not, on its own, a strong squeeze signal. OKX open interest is down 17.1% over 7 days. That suggests leverage has been reduced there, but it does not tell us what happened across every venue or whether new spot demand has replaced that risk. The deeply negative dated-futures basis also signals a market willing to price futures below spot. Is that bearish conviction, hedging, or simply stress? The available figures do not settle it. For me, the most useful test is not whether DOGE can print another green candle. It is whether the character of the move changes around resistance. The hourly 20-period average is near $0.0595; above that, $0.0620–$0.0634 is a more demanding test. A push through those areas that holds on a retest would be more persuasive than a quick wick above resistance. Better evidence would be spot buying alongside stable or rising open interest. Without that confirmation, a price rise could be short covering in a market that remains structurally weak. The other side of the test is $0.05537. Price has returned above that recent low, which gives buyers a level to defend. If DOGE revisits it and buyers respond, the market may be building a base. If it breaks decisively, the bounce has failed to establish support. There is no verified liquidation map here, so I would not claim that a particular price contains a guaranteed pool of forced orders. Even when traders expect liquidations near an obvious high or low, price can pass through without the reaction they anticipate. The wider setting makes the DOGE-specific story harder to isolate. The total crypto market fell 6.1% over 24 hours, fear is at 10, and Bitcoin dominance is 58.7%. Recent coverage describes a broad meme-coin selloff. These are facts consistent with a risk-off market; they do not prove that macro sentiment alone caused DOGE’s drop. Nor is there verified evidence here of whale accumulation, a major exchange inflow, or a project announcement with measurable price impact. A reported large whale purchase without wallet-level confirmation is a lead to investigate, not proof of support. DOGE’s fundamentals offer little immediate explanation for a turn. Reported circulating supply is 157 billion, equal to total supply, but DOGE still has ongoing issuance. No near-term supply unlock stands out in the data. Network fees and value locked have declined, while no verified catalyst in the reviewed news provides a clear new source of demand. For a short-term trade, sentiment and market flows may matter more than those slow-moving figures. My view remains open: extreme weakness can create a sharp rebound, but this one still needs evidence of committed buyers. I would watch whether DOGE can hold above $0.0595, then establish itself beyond $0.0634, and whether the move comes with genuine spot demand rather than leverage alone. If it cannot, or if $0.05537 gives way, the simpler explanation remains that the downtrend is still in charge. The next useful evidence is not another prediction. It is who shows up when price reaches those levels. #IMPACTbyTrade
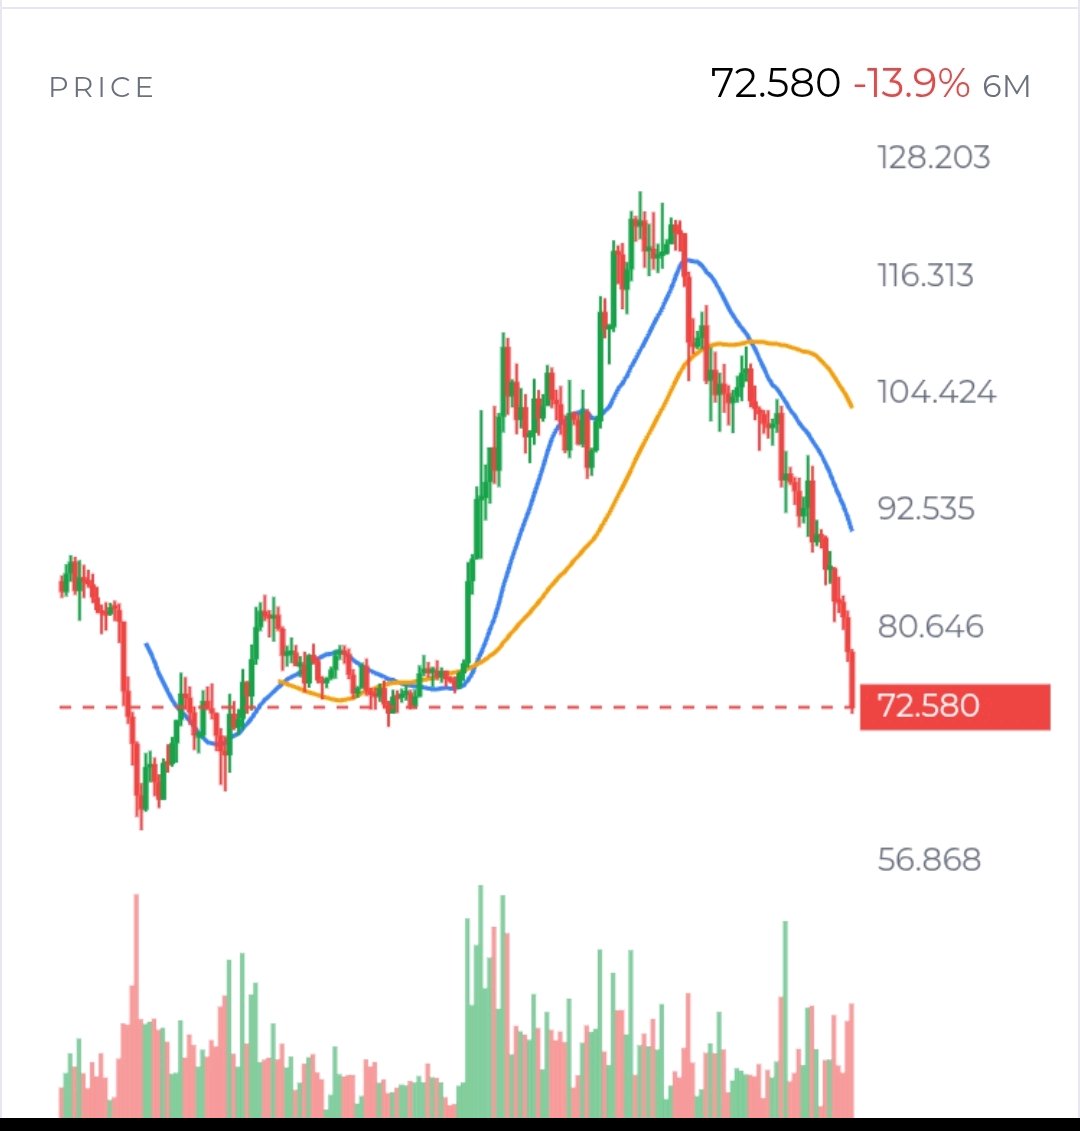
$SOLUSDT from a Different Angle: The Real Question Is Liquidity I would look at SOL less as an oversold chart and more as a market struggling to find a credible buyer. Price is near $72.44, but the important fact is not simply that it is down. It is that every attempted recovery so far has failed to change the market’s structure. That suggests the problem may be insufficient demand, not merely excessive leverage. The $71.91–$72 area is now a liquidity test. Many traders will treat it as support because it is the recent low and sits near the bottom of the established range. But support only matters if real buyers defend it. If price briefly falls below $71.91, triggers stops, and then quickly reclaims the level, that could be a meaningful liquidity sweep. If price breaks below it and remains there, the level has not produced demand; it has simply delayed the next move lower. This distinction is more important than the oversold RSI. The daily RSI is 15.7, which confirms intense selling, but it does not tell us whether sellers are exhausted. A market can remain oversold while institutions continue reducing exposure. The recent sequence of lower daily closes, combined with price below declining moving averages, says the trend still deserves respect. The derivatives data gives the market a possible escape route, but not a confirmed one. Funding is negative at approximately -0.010% per 8 hours, and top traders are net short by position size. Open interest is about $1.62B, while OKX open interest has declined 12.2% over 7 days. This creates the ingredients for a sharp rebound if support holds. Shorts are paying longs, and some bearish positions may be vulnerable to a squeeze. But there is another interpretation. Falling open interest during a falling market may show that traders are closing positions rather than building an unstable short trade. In that case, negative funding reflects caution, not necessarily a coming rally. Without dependable CVD, order-book imbalance, and liquidation detail, we cannot know whether aggressive buyers are absorbing supply or whether leverage is simply leaving the market. Spot flow is the deciding evidence I would want next. Spot volume reached roughly $4.01B, but heavy volume on a down day is ambiguous. It can represent accumulation, yet it can just as easily reflect forced selling. A bounce that occurs mainly in perpetual futures would be less convincing than a recovery supported by rising spot volume and improving price acceptance above $75.30–$76.20. The fundamental flow picture also argues against assuming that cheap price equals value. US spot SOL funds recorded 7 straight outflow days and about $32M of net outflows over 5 days. Stablecoin supply fell 6.6% over 30 days, TVL declined 19.7%, and fees dropped 45.3%. These are not immediate death signals, but they indicate that capital is leaving the ecosystem while price is weak. The Pump.fun transfer of 64,666 SOL, worth about $5.19M, adds a potential supply overhang. Still, a transfer to an exchange does not prove that coins were sold. That is an important uncertainty, not a confirmed bearish event. My preferred framework is conditional. A brief break below $71.91 followed by a fast reclaim would suggest trapped shorts and possible upside toward $75.30–$76.20. A sustained break would suggest that liquidity below support is being consumed without meaningful demand. Above $78.98, the market would begin to repair its structure. Until then, I see a market capable of violent rebounds, but not yet one showing dependable accumulation. #IMPACTbyTrade $XAUTUSDT
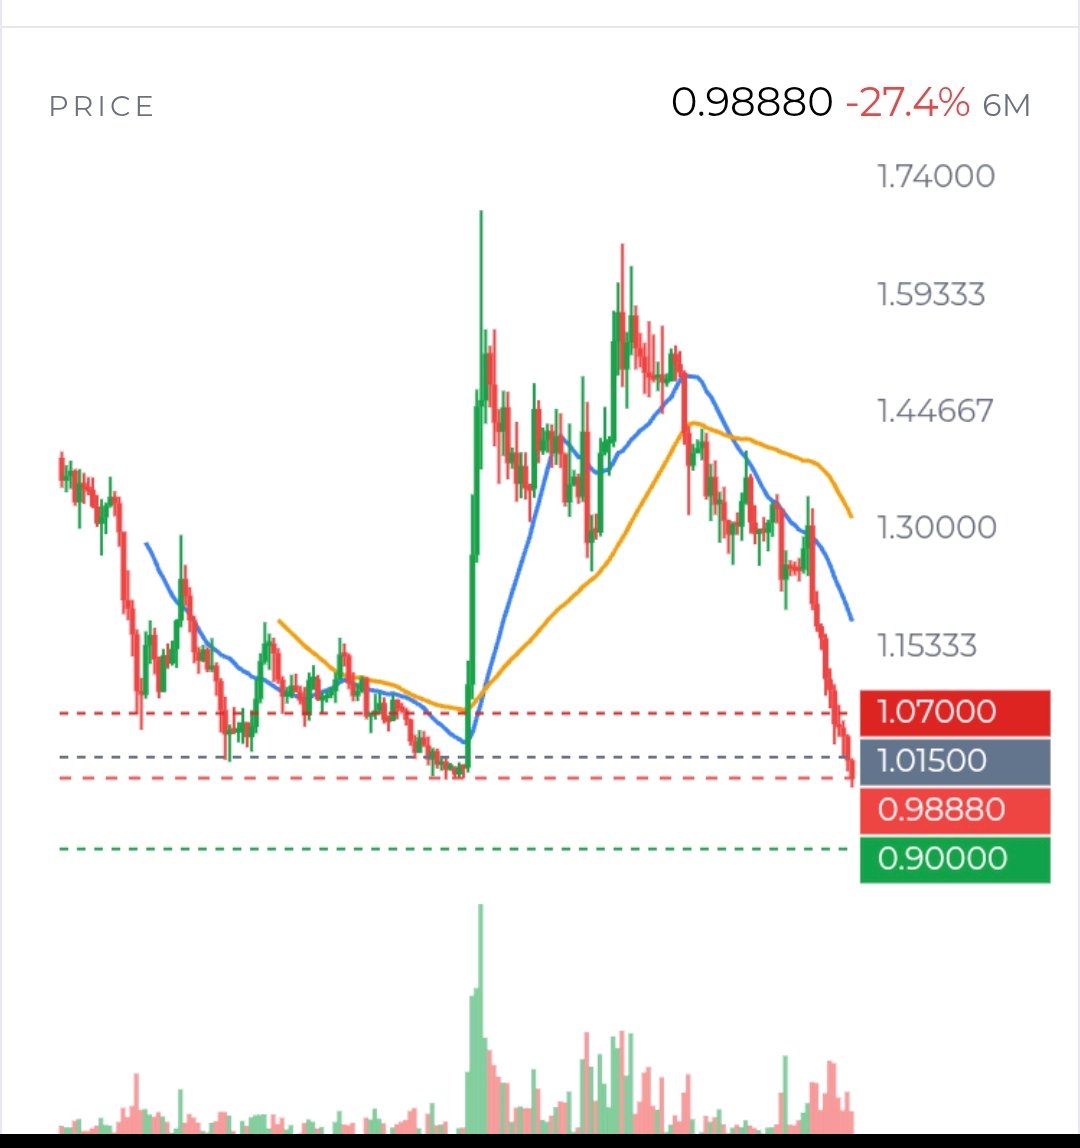
$XRPUSDT is caught between a clear downtrend and a price area where selling could become exhausted. At $0.982 on November 14, it had lost 15.7% in 7 days and was trading below $1 for the first time since August, after breaking the reported August low near $0.985. That is a meaningful loss of structure, but the market is now testing the same zone it just broke. Does a move below $0.977 attract fresh sellers, or do buyers reclaim it quickly and turn the breakdown into a bear trap? The answer matters more than the fact that XRP is oversold. Verified price evidence: The 1-hour, 4-hour, daily and weekly trends are down. Price is below the 1-hour EMA20 and EMA50 near $0.999 and $1.015, and the 4-hour averages near $1.026 and $1.083. Daily RSI is 19.1, an extreme reading, while 4-hour RSI is 30.6. Recent 4-hour candles show lower closes and a failed push toward $1.044 before selling resumed. To me, that says sellers still control the broader structure; it does not rule out a sharp bounce. A sustained reclaim of $1.00, then $1.015, would be the first evidence that buyers are changing the near-term balance. A close below $0.977 followed by a weak retest would make the breakdown more convincing. Neither outcome is confirmed yet. The derivatives picture is more mixed than the chart. Perpetual open interest is $678 million, with $377 million on Binance; OKX open interest fell 8.4% over 7 days. That decline alongside falling price is consistent with positions being closed or liquidated, rather than an obvious wave of new leveraged shorts. Funding is almost flat to slightly negative at -0.001% weighted. Retail accounts are long-biased at 2.65, while top traders’ positions are net short at 0.88. These are clues, not a map of who will be forced out. We do not have verified liquidation totals, liquidation-price clusters, CVD, or order-book imbalance. So claims that a particular level is “packed” with liquidations—or that a squeeze is imminent—would be speculation. There are signs of weak demand, but they need careful handling. Verified US spot ETF data show $6.48 million of net outflows over 5 days and $1.18 million over 20 days, despite $3.38 million of inflows on November 13. A separate report claims $19.13 million of weekly outflows; that conflicts with the 5-day figure and should not be treated as settled. News also reports exchange balances rose by 335.76 million XRP over 3 months. If accurate, that may mean more readily available supply, but it does not show that holders are selling now. We lack direct whale-flow and exchange-flow confirmation. The bullish counterpoint is increased XRPL batch and ticket activity. That shows activity, not necessarily XRP purchases: on-chain evidence does not establish that these transactions generated scaled token demand. Meanwhile, reported value locked is down 22.9% over 30 days and stablecoin supply on XRPL down 26.3%. Those figures make the activity headline less persuasive as a near-term demand signal. The broader market is also under pressure: total crypto capitalization fell 7% in 24 hours and fear is at 13. XRP’s weakness may therefore reflect both market-wide risk aversion and coin-specific supply concerns. My read is cautious, not certain. The key zone is $0.977–$0.985; above it, $1.00–$1.015 is the first reclaim test. Watch whether spot buying accompanies a recovery, whether open interest rises or keeps shrinking, and whether ETF-flow reports reconcile. Those answers would tell us whether this is capitulation, temporary exhaustion, or simply another pause in a persistent decline. #IMPACTbyTrade
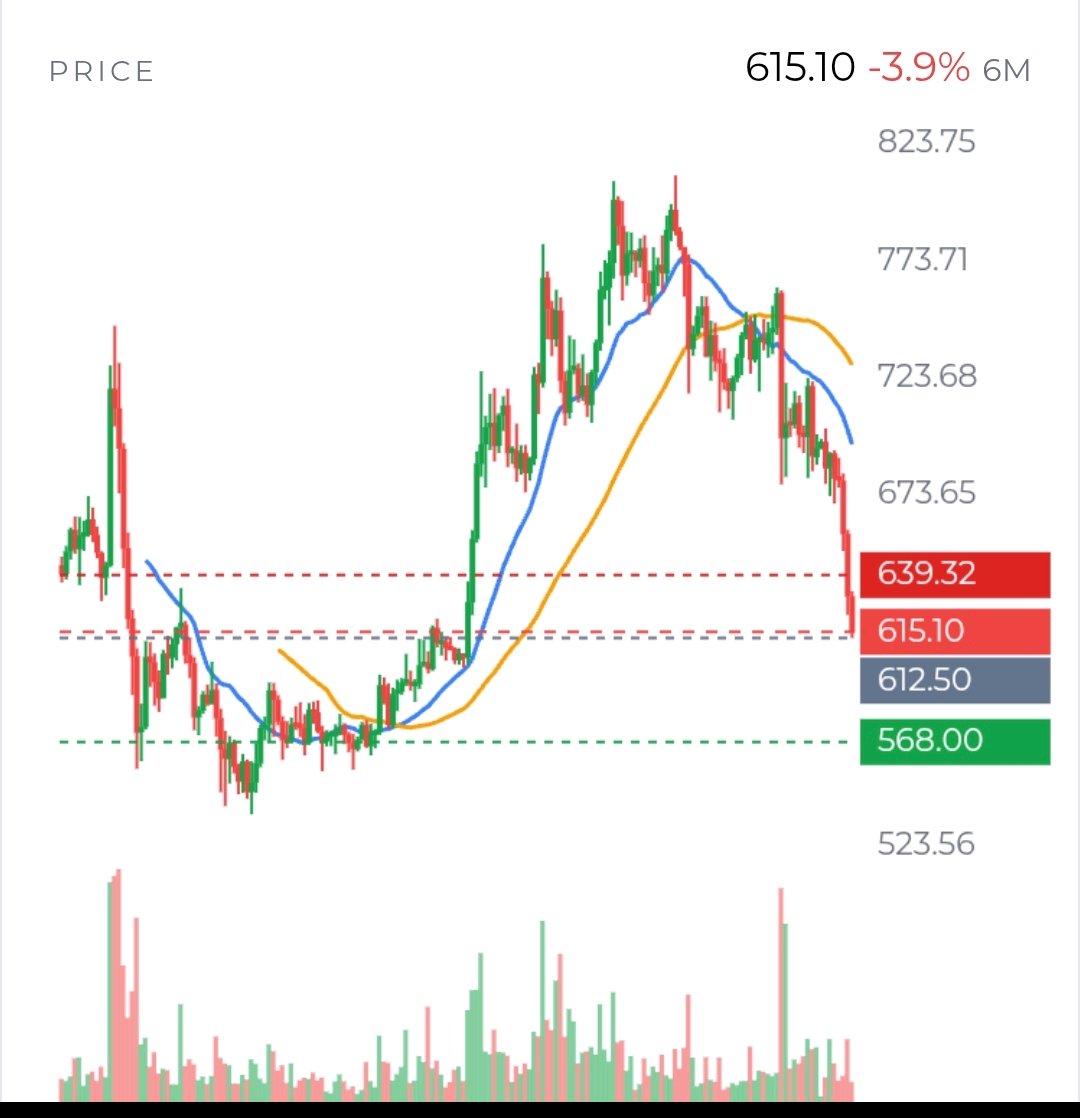
$BNBUSDT is not a simple “support or breakdown” trade anymore. From my perspective, the more important issue is that the market is losing confidence in the quality of the asset’s demand. The price is near $615, down about 11.5% in 7 days. Yes, the broader market also suffered a sharp risk-off move, so blaming everything on BNB-specific weakness would be too easy. But BNB has not shown the relative strength expected from a large, liquid asset during a market-wide sell-off. That tells me the problem is not only panic. There is also a lack of committed buyers. The $612.50–$613.71 area is receiving most of the attention, but I would not automatically call it strong support. It may simply be the point where sellers have temporarily paused. The real test is what happens after a bounce. If price cannot hold above $620.60 and repeatedly fails near $623.83, buyers are not demonstrating control. In that case, $612.50 becomes a pressure point rather than a dependable floor. A clean move below $612.50 would put $599.70 and $585.20 into focus. But I would be careful about chasing the first breakdown. Daily RSI is only 24.6, and the 4-hour RSI is also deeply oversold. A sharp recovery could occur simply because late shorts take profit. That would not necessarily mean the downtrend had ended. The derivatives picture supports this caution. Perpetual open interest is about $596M, with Binance holding approximately $481M. OKX open interest has fallen 12.4% over 7 days. Price weakness combined with declining open interest suggests that positions are being removed from the market. It does not clearly show that a large group of new shorts is building. Funding is only slightly positive at +0.001% per 8 hours. That is not an extreme long imbalance. Retail accounts are long-biased at 2.90, while top-trader ratios are below 1. This divergence is interesting, but it is not enough to estimate the size of a coming liquidation event. We also do not have dependable CVD, order-book imbalance, or liquidation-map data. Therefore, claims about a guaranteed long squeeze would be speculation. The fundamental backdrop makes rebounds harder to trust. Thirty-day fees are down 33.7%, TVL is down 11.6%, and valuation remains high compared with protocol revenue. These numbers do not identify the exact cause of this week’s sell-off, but they explain why buyers may hesitate to defend higher prices. Recent application exploits add another layer of risk, although their direct market impact is not proven. For me, the most important level is not $612.50 alone. It is the space between $620.60 and $623.83. If BNB can reclaim that area and hold it during a retest, the market may be shifting from forced selling to stabilization. A move above $637 would make the recovery more credible. If price keeps rejecting there and breaks $612.50, the market is likely still distributing supply. The unanswered question is whether this is exhaustion or acceptance below value. Oversold readings can create a bounce, but only demand can create a reversal. Until spot participation improves and price reclaims lost levels, I would treat strength as unproven rather than assume the market has turned. #ByXIMPACT
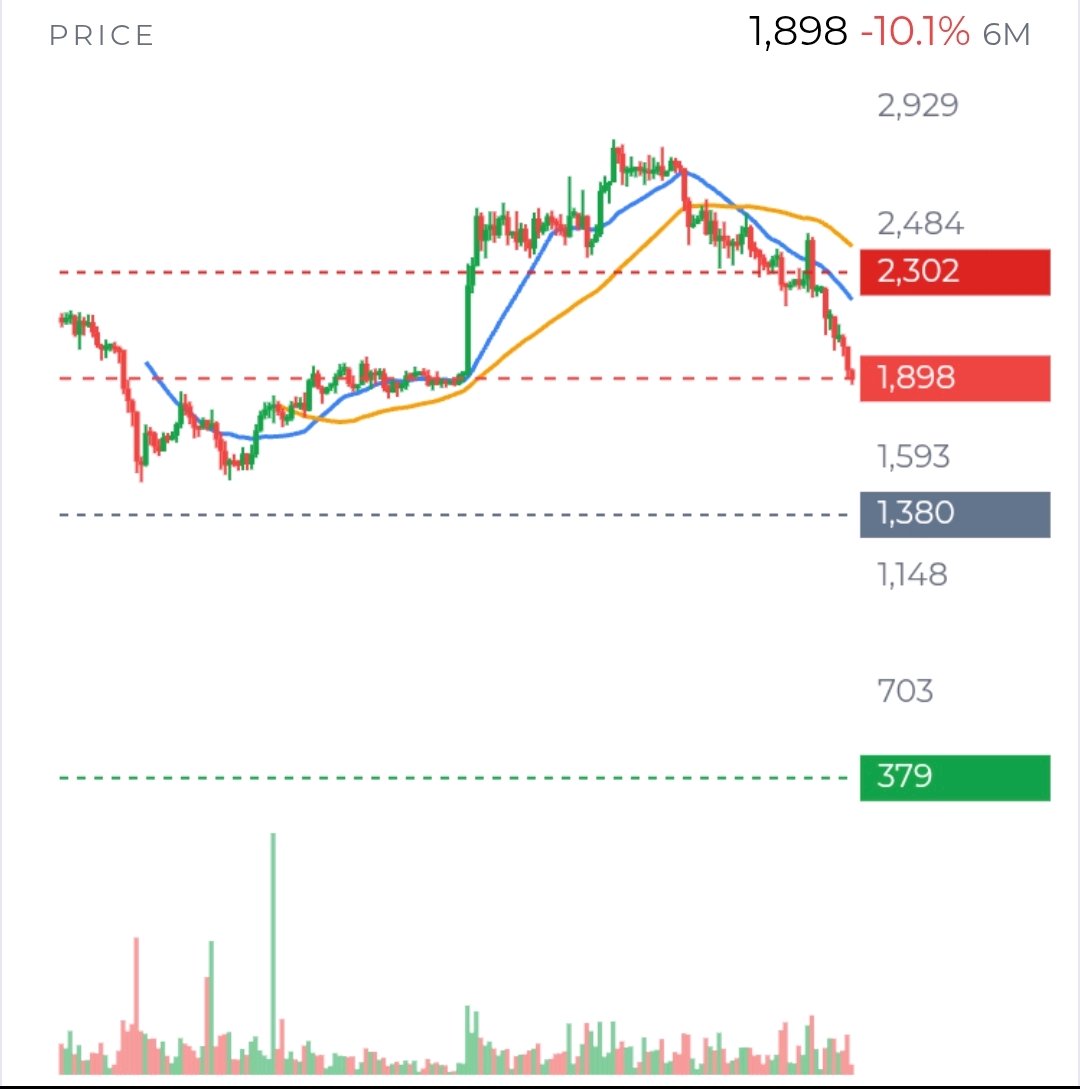
Ethereum now looks less like a simple “oversold bounce” and more like a market testing whether its long-term story still has enough support behind it. At about $1,894, ETH is trading near the lower edge of its recent range. The daily chart remains clearly weak: price is below the 20-day EMA near $2,170 and the 50-day EMA near $2,302. The weekly trend is also negative, with six declining weekly closes. That is not a small technical setback. It tells us that sellers still control the broader auction. But there is an important distinction between a weak trend and a one-way market. Daily RSI is near 23, while the 4-hour RSI is around 27. These readings show heavy selling pressure, but they also tell us that downside momentum may be becoming crowded. The question is not whether ETH can bounce. It can. The real question is whether any bounce attracts fresh spot buyers or merely gives existing holders a better exit. The first level that matters is $1,875–$1,895. ETH is sitting directly on that area. If buyers defend it and reclaim $1,956, the market could attempt a move toward $1,989 and then $2,084. Those levels matter because they are not random horizontal lines; they are areas where short-term trend control would begin to change. However, a recovery above $1,956 without follow-through would still be only a relief rally. A stronger improvement would require a higher low, rising spot volume, and a sustained reclaim of the 4-hour EMA20 near $1,989. If $1,875 fails decisively, the market could quickly shift attention toward $1,744 and then $1,504. The reason is simple: once nearby support disappears, traders usually look for the next area where prior demand appeared. A break alone would not prove that Ethereum’s long-term fundamentals are broken, but it would show that buyers are not yet willing to defend current prices. The derivatives picture does not show an obvious capitulation event. Perpetual open interest is about $10.7B, while OKX open interest has fallen 12.1% over 7 days. Funding is almost flat, around +0.002% per 8 hours. This suggests leverage has been reduced rather than aggressively rebuilt. Long accounts still outnumber shorts on OKX by 3.26 to 1, although top-trader positioning is more balanced or short. That creates room for another long flush, but not necessarily a guaranteed cascade. The available data does not provide reliable liquidation totals, so it would be premature to claim that a major liquidation bottom has already formed. Spot demand remains the missing confirmation. ETH ETF flows were negative by $399M over 5 days and $1.42B over 20 days, despite a small $2.3M inflow on November 13. One positive day is encouraging, but it is not a trend. A sustained reversal in ETF flows would matter far more than isolated wallet purchases, including the reported $2M accumulation by a new wallet. Ethereum’s underlying activity is still substantial: $132B in stablecoins and $51.1B in 30-day DEX volume. Yet TVL has fallen 17.8% in 30 days and 45.3% year on year, while protocol revenue remains modest relative to a $231B market cap. Institutional custody and tokenization developments are constructive, but the market still needs evidence that these developments create measurable ETH demand. My interpretation is therefore balanced but cautious. ETH is technically oversold and capable of a sharp recovery, but the burden of proof remains with buyers. I would watch $1,875, ETF flows, spot volume, and whether $1,956–$1,989 can be reclaimed and held. Until those conditions improve, a bounce is possible, but a durable trend reversal remains unconfirmed. $ETHUSDT #WSOTShowYourAITradeToEarn10USDT
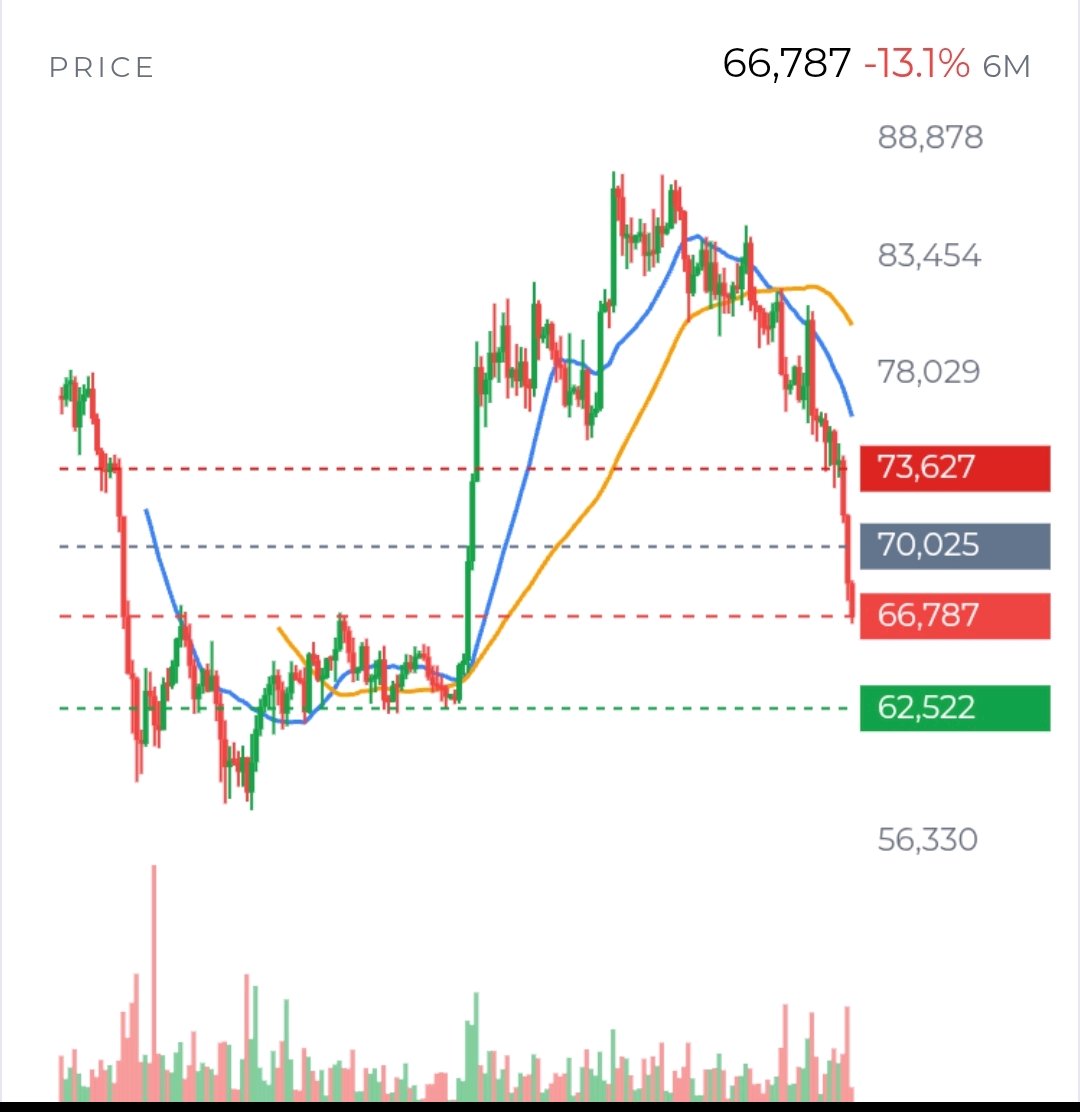
Bitcoin is around $67,100, down 11.8% over the past 7 days. I would frame this less as “Is the bottom in?” and more as a test of who is willing to take risk here. Sellers have done damage, but the evidence does not yet show that the market has entered a fresh, leveraged liquidation spiral. The level to watch first is $66,450. BTC touched it during the current hourly candle and then recovered above it; that is a reaction, not yet proof that support has held. If an hourly candle closes below $66,450 and a retest cannot reclaim it, the next substantial reference is around $62,522. That would make the breakdown more convincing. But if price keeps defending the level, shorts may find themselves pressing into a floor rather than chasing an open decline. The trend still argues for caution. On the 1-hour and 4-hour charts, price remains beneath declining moving averages. The 1-hour EMA20 is near $68,532, and the EMA50 near $70,038. Those are possible resistance areas, not automatic turning points. A bounce into them would matter more if spot buying strengthened and price could stay above them. Without that participation, a rebound could simply be a pause in the sell-off. There is a reasonable case for a sharp countertrend bounce. RSI is 26.8 on the 1-hour chart and 21.9 on the 4-hour—very weak readings that show how stretched the decline has become. Extreme fear is also in the data. But neither fear nor oversold momentum marks a reliable bottom on its own. The question is whether buyers are stepping in, or whether the market is merely running short of immediate sellers. Demand data gives bears a serious argument. US spot Bitcoin ETFs have recorded 7 straight days of outflows, including $922M over 5 days and $2.10B over 20 days. That does not prove ETF flows caused the decline, but it does show that an important source of demand has been withdrawing. Reported negative US-market pricing points in the same direction. The latest headlines about Bitdeer selling 256.1 BTC and a dormant wallet moving 75 BTC are worth noting, but there is no evidence in these reports that either movement became exchange selling or drove the price action. Futures positioning is not a simple “crowded longs, therefore crash” story. Perpetual open interest is $16.9B across tracked venues, while OKX open interest fell 10.5% in 24 hours and 10.6% in 7 days. That suggests deleveraging on OKX. Funding is modestly positive at +0.002% per 8 hours, and the account ratio remains long-heavy at 3.08. So some long-side vulnerability remains, but the evidence does not establish a broad liquidation cascade. Actual liquidation totals and order-book depth would help settle that question; without them, exact “liquidation zones” are guesswork. The bigger-picture fundamentals are mixed rather than catastrophic. Transactions and miner revenue have weakened over the past month, while active addresses are nearly flat. That fits a cooler network, but it does not by itself explain each short-term price move. A recent market account points to changing Fed-rate expectations as a pressure on Bitcoin; that is a possible macro driver, not proof of direct causation. For the next few days to 2 weeks, I would watch $66,450 for a confirmed break, and $68,500–$70,000 for evidence that buyers can reclaim lost ground. A close below the floor would strengthen the downside case; a durable reclaim on improving spot demand would weaken it. Until one side proves itself, both continuation lower and a forceful oversold rebound remain plausible. $BTCUSDT #IMPACTbyTrade
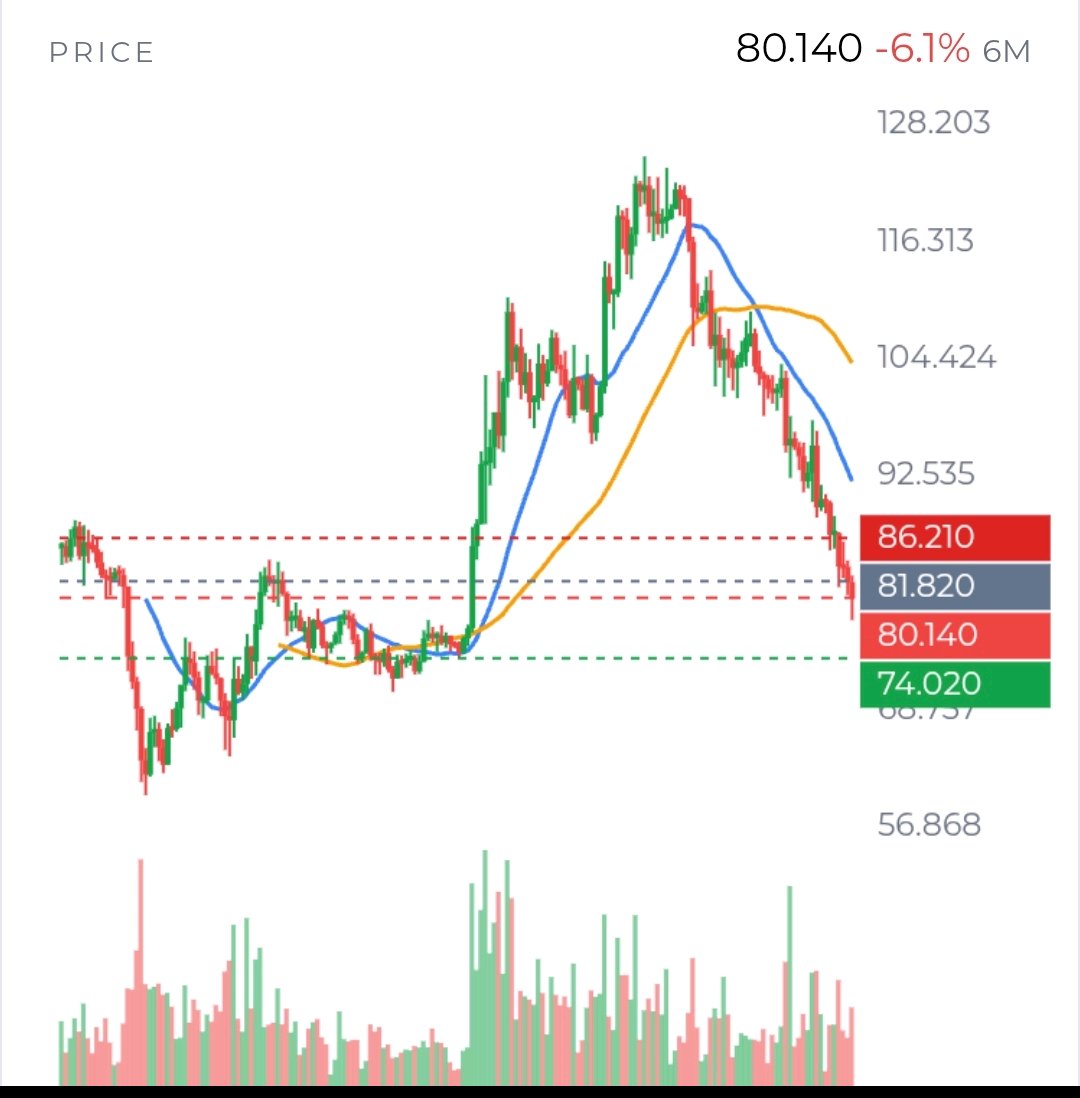
For $SOLUSDT , the unusual thing is not simply that it has fallen. It is that the market is still carrying plenty of long exposure while spot price presses near a recent low. That leaves room for another flush—but also means sellers may be getting paid to wait rather than rushing to add risk here. Verified facts: SOL is near $79.93, down 2.19% on the day, after trading between $77.88 and $82.39. Its daily RSI is 20.7, while the daily trend remains down and price is well below the 20-day average near $90.90. RSI measures recent momentum; an unusually low reading can accompany a bounce, but it does not confirm one. The important near-term question is whether the $77.88 low holds on a sustained basis. Futures positioning offers clues, but not a complete answer. Funding is positive at roughly 0.009% every 8 hours, so long holders are paying shorts. On OKX, long accounts outnumber short accounts about 3 to 1. Yet top traders’ position ratio is 0.86, a more cautious signal. Meanwhile, OKX open interest—contracts still open—has fallen 6.6% in 7 days. My interpretation: some leverage is leaving, but remaining long exposure could still make a breakdown sharper. We do not have verified liquidation totals or a price-by-price liquidation map, so a “liquidation cascade” remains a possibility, not an established fact. Spot trading is substantial, with $3.65B in 24-hour volume across 63 venues, and spreads on the largest markets are tight. That argues against this being a market too illiquid to trade normally. But total volume alone cannot tell us who is in control. The data available here does not establish CVD—whether aggressive spot buyers or sellers have dominated—or provide reliable order-book imbalance. A bounce led by spot buying would mean more than a futures-driven move that simply adds leverage. That is one of the key pieces of evidence I would want next. The broader market adds pressure. Sentiment is at 20, classified as extreme fear, and the total crypto market was down 5.5% over 24 hours. That makes a SOL-specific explanation less convincing: some selling may simply reflect traders reducing risk across crypto. Still, Solana’s own numbers are weak. Over 30 days, value locked fell 17.8%, stablecoin supply fell 7.9%, and fees fell 43.8% versus the previous 30-day period. These figures point to softer activity and liquidity, but they do not tell us whether activity is about to recover or whether sellers are responding to it now. There are positive developments, but they need to be judged by what they deliver. A $250M USDC mint on Solana could add capacity for trading and DeFi; it does not prove that the funds are being deployed, or that they are buying SOL. The Foundation’s confidential-compute initiative and a reported DTCC tokenization plan for 2027 show development and institutional interest. Their relevance to this week’s price depends on adoption, timing, and whether new activity translates into durable demand. One notable question is whether falling stablecoin supply undermines the practical impact of the USDC mint. My analytical view is that $77.88 is the market’s near-term credibility test. If price breaks and stays below it while spot selling and open interest rise, the case for further downside strengthens; $74.02 is the next chart support. If the low holds and SOL reclaims $81.82–$82.39 with spot participation, the oversold reading could translate into a tradable recovery rather than a brief bounce. What would change the picture most: confirmed spot-flow direction, exchange and whale transfers, and evidence that new stablecoin liquidity is actually being used. #IMPACTbyTrade $XAUTUSDT
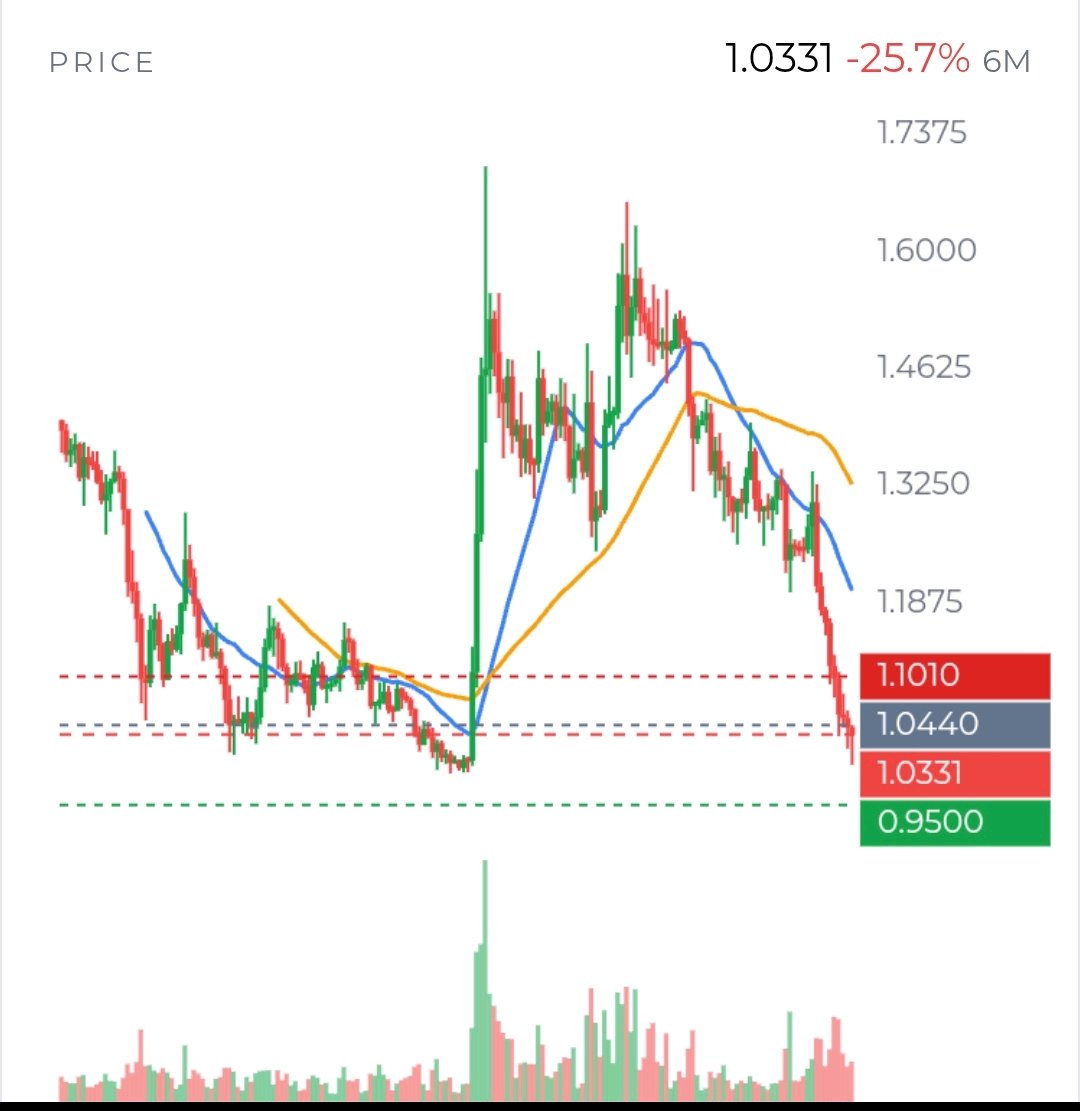
$XRPUSDT looks less like a simple breakdown and more like a market caught between forced selling and hesitant dip-buying. That distinction matters. If this were a clean, confident bearish trend, buyers would probably not be defending the $1 area so repeatedly. But if genuine accumulation were taking place, price should be holding higher levels instead of failing near $1.04–$1.05. From my perspective, the first zone to study is not $1.00 itself, but the area between $1.0164 and $1.044. This is the decision range. Below $1.0164, buyers are being asked to defend the market with less room and weaker momentum. Above $1.044, sellers must defend the recent rejection zone. Until price escapes this range convincingly, XRP may remain trapped between bargain hunters underneath and trapped longs looking to exit above. The $0.9974–$0.9872 region is more important than the round-number narrative suggests. It is where the current decline could either stabilize or accelerate. A brief move under $1 followed by a rapid recovery would indicate that sell-side liquidity was collected and that buyers were willing to step in. However, a daily close below this area would change the character of the market. It would imply that support was not absorbing supply; it was simply delaying the next leg lower. The opposite test is $1.044–$1.0569. XRP has already shown that it can bounce from depressed levels, but the market has not demonstrated that it can build acceptance above resistance. “Acceptance” means more than a brief wick or one green candle. I would want to see price close above the zone, hold it during a pullback, and attract stronger spot participation. Without that sequence, a rally into resistance may simply give existing holders an opportunity to sell. The derivatives picture supports this caution. Perpetual open interest is approximately $707M, while funding is positive at around 0.009% every 8 hours. Longs are paying to remain positioned, and retail accounts are significantly long-heavy. That creates fuel for a downside flush if support fails. Yet open interest has already declined over the past week, so this is not necessarily a market filled with fresh excessive leverage. Some weaker positions may already have been removed. The next increase in open interest therefore needs interpretation: rising OI with falling price would suggest new shorts or trapped longs, while rising OI with rising price could signal a more credible recovery. There is also a gap between activity and demand. XRP spot turnover is roughly $2.37B, but turnover does not prove that buyers control the tape. The available evidence does not verify CVD, order-book imbalance, whale deposits, or precise liquidation clusters. That uncertainty is significant. A trader may see heavy volume and assume accumulation, when the same volume could represent distribution during a failed bounce. Fundamentally, the market still lacks a strong demand catalyst. ETF flows were negative over both 5-day and 20-day periods. XRPL stablecoin supply and TVL also fell sharply over 30 days. RLUSD growth is encouraging for the broader ecosystem, but it has not yet established a clear transmission into XRP buying. Meanwhile, the wider market remains risk-sensitive, with extreme fear still present. My reading is therefore conditional rather than absolute. XRP can produce a sharp recovery because momentum is stretched and the $1 region has attracted buyers. But the market has not earned a bullish interpretation yet. I would focus on behavior, not predictions: does $0.9974 hold with improving spot demand, or does $1.044 reject price again? The answer to that question will likely reveal whether XRP is forming a base—or merely pausing before another move lower. #ByXIMPACT
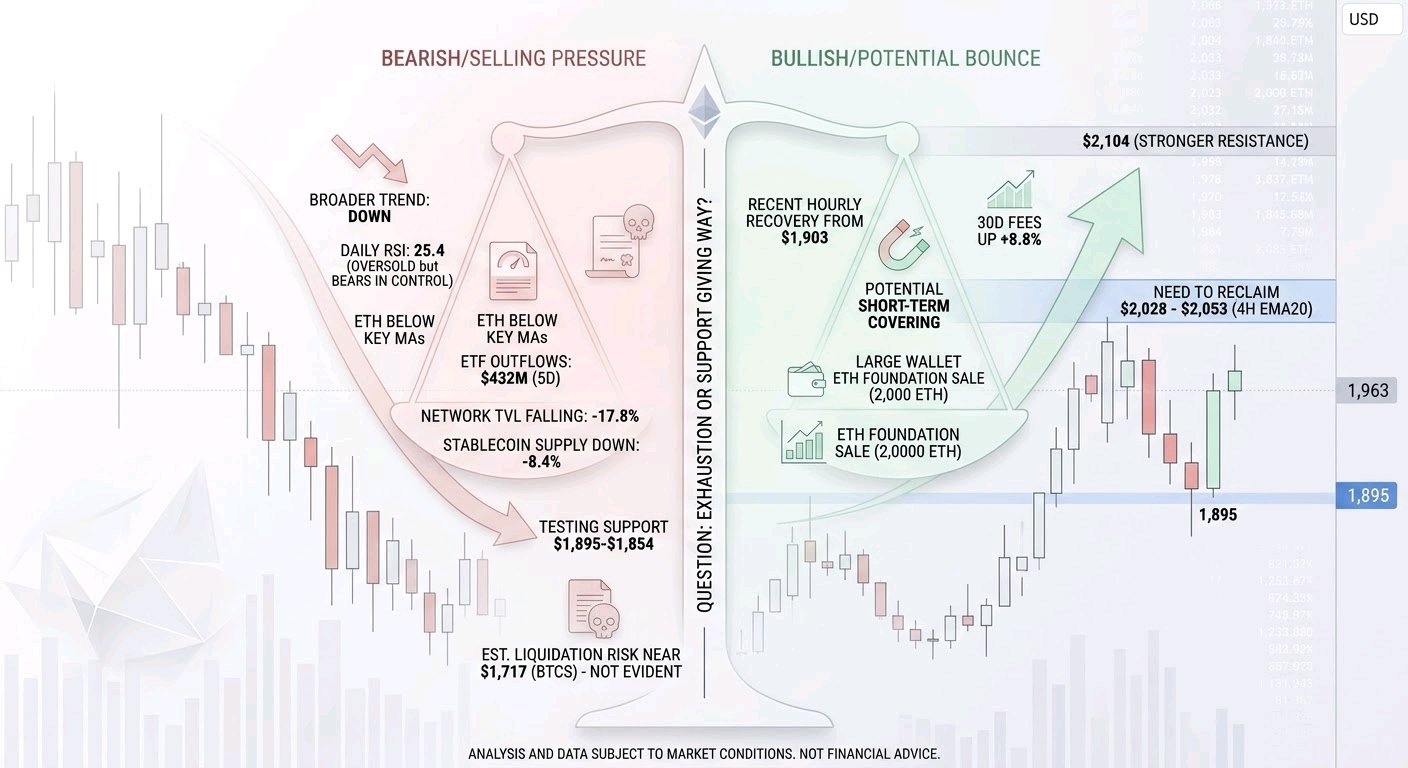
$ETHUSDT is around $1,963 after falling 2.8% on the day and trading as low as $1,895. The central question is whether that low marks temporary exhaustion or the next support giving way. My read is that the broader trend still favors sellers, but the evidence does not yet establish a fresh liquidation-driven cascade. What is verified: The 1-hour, 4-hour and daily trends are down, with ETH below their key moving averages. Daily RSI is 25.4, an oversold reading that can precede a bounce, but does not by itself signal a reversal. Recent hourly candles recovered from the $1,903 area and closed higher; that is evidence of near-term buying, not yet a structural change. The $1,895–$1,854 zone matters because it contains the recent low and the broader range floor. A convincing close below it, followed by a failed retest, would suggest sellers still control the market. What would change the picture? ETH needs to reclaim $2,028–$2,053 and hold that area to make the rebound more credible. The 4-hour EMA20 is near $2,030; $2,104 is a tougher level and stronger evidence against the immediate breakdown view. A brief move above resistance without sustained buying could still be a weak bounce. The available price data does not include reliable 15-minute candles, volume profiles, CVD or order-book imbalance, so we cannot confirm whether buyers are absorbing supply or simply benefiting from short-term covering. Futures positioning gives mixed signals. Open interest is $11.2B across the tracked venues; the available OKX series is down 2% over 24 hours but almost flat over 7 days. That points to some risk reduction, not an obvious market-wide flush. Funding is mildly positive overall at +0.002% per 8 hours, but negative on some venues. OKX accounts skew long, while top traders’ position sizing is slightly net short. Those are different measures and one venue is not the whole market. We lack aggregate liquidation totals, so a crowded-long or forced-selling story remains unproven. Liquidation levels should be treated as potential stress points, not magnets that guarantee a reaction. The clearest fundamental pressure is capital leaving: US spot ETH ETFs had $432M in outflows over 5 days and $1.43B over 20 days, with 6 consecutive outflow days. Meanwhile, network value locked fell 17.8% and stablecoin supply fell 8.4% over 30 days. Those figures suggest weaker capital conditions, though they do not prove that ETF flows or on-chain changes caused each price decline. Thirty-day fees rose 8.8%, a modest counterpoint, but growth alone has not offset the broader contraction. Recent developments also cut both ways. BTCS sold ETH to manage a $64.1M Aave loan; its collateral was reported at 46,676 ETH, with estimated liquidation near $1,717, and no liquidation had been reported through Nov. 11. That creates a visible risk if price falls sharply, but the threshold is an estimate—not evidence of an impending sale. An Ethereum Foundation-linked wallet reportedly sold 2,000 ETH, while large wallets also bought ETH. Those purchases have not yet stopped the decline, but their presence cautions against treating all large holders as sellers. The key questions now: does $1,895 hold, do ETF outflows ease, and does a reclaim of $2,028 arrive with real spot demand? Until those answers emerge, both a relief bounce and a further support test remain plausible. #WSOTShowYourAITradeToEarn10USDT
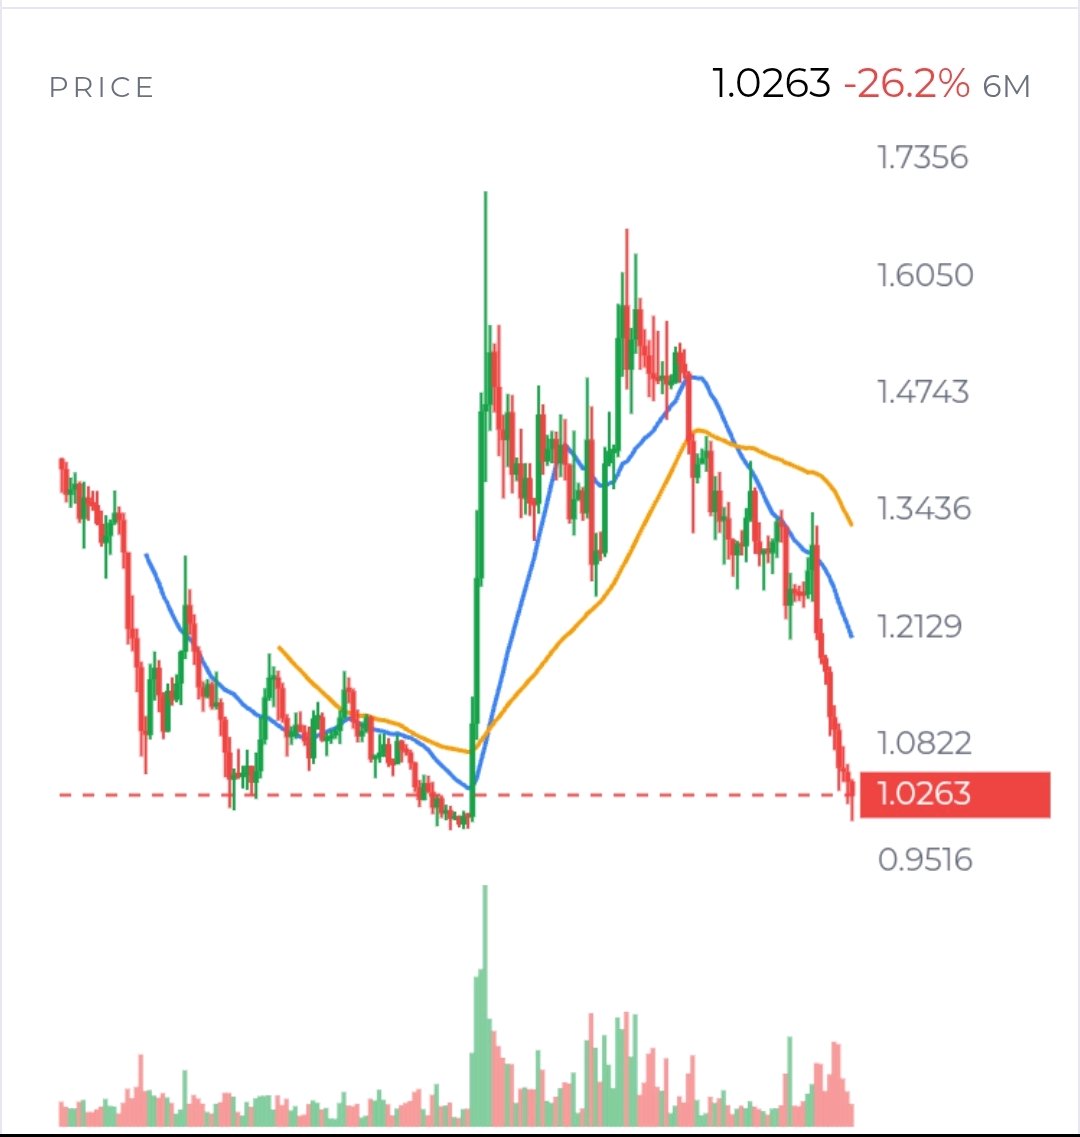
I’d frame XRP’s situation less as “oversold, so it should bounce” and more as a test of who is willing to own risk while the market is still falling. That is a different question from whether the chart can produce a short-lived rally. XRP is near $1.03, down 13.7% over 7 days, after briefly trading below $1. The broader market is also weak: the total crypto market cap fell 7.1% in 24 hours, alongside reports of heavy liquidations. In that setting, XRP’s recovery from its intraday low is worth watching—but it is not yet evidence that buyers have taken control. What would count as better evidence? Price rising while spot demand strengthens, followed by a pullback that attracts buyers rather than new selling. We do not have verified XRP spot CVD, which would help distinguish aggressive buying from selling, or reliable order-book imbalance data. Spot turnover was about $2.14 billion across venues, but volume by itself tells us activity was high, not who won. Nor is there verified evidence that recent whale purchases absorbed ETF selling. Wallets holding at least 10,000 XRP have increased over a longer period, but that cannot tell us whether those holders bought this week or moved coins to exchanges. Futures positioning adds a useful complication. Perpetual open interest is around $708 million across 4 venues; OKX open interest rose 5.8% in 24 hours, but is down 8.7% over 7 days. Funding is near neutral overall. On OKX, long accounts outnumber shorts 3.82 to 1, while top traders’ positions are net short. These measures do not describe one unified crowd. A long-heavy account ratio may reflect many small positions, not the largest traders’ conviction. If price falls and open interest expands, that would raise concern about fresh leveraged longs being trapped. If price rises alongside spot demand and open interest remains contained, the rally would look less dependent on leverage. The news and fundamentals do not offer an obvious rescue catalyst. Spot XRP ETFs recorded about $10.6 million in net outflows over 5 days, though cumulative inflows remain around $1.06 billion. On XRPL, stablecoin value fell 19.6% and TVL fell 22.8% over 30 days. Those are signs of thinning ecosystem liquidity, but they do not prove the cause of the price decline. Extreme market fear may also mean some bad news is already reflected in price; it does not tell us whether sellers are finished. The important test is not simply whether XRP can hold $1 for a few hours. $0.9872–$1.00 is the area where a sustained break would challenge the defense of recent lows. Above, $1.044–$1.057 is the first resistance zone. A reclaim that holds on a retest would improve the case for a recovery toward $1.11–$1.18; rejection there would leave the downtrend intact. My view is that neither outcome is confirmed. I’d watch what spot demand does at those levels—and whether rising futures exposure supports the move or makes it more fragile. $BTCUSDT #IMPACTbyTrade $XRPUSDT
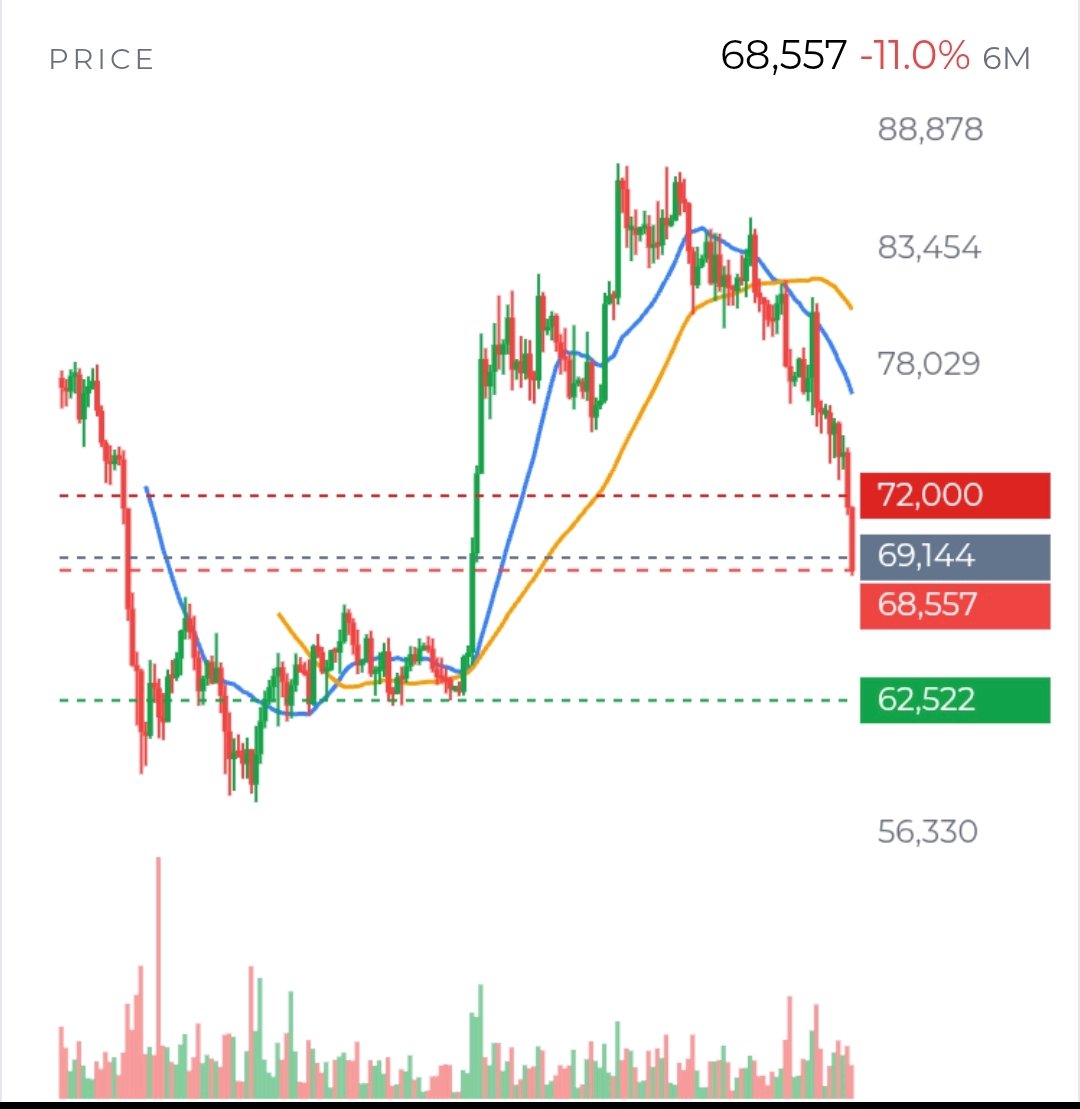
$BTCUSDT ’s hardest question right now is not whether it looks oversold. It does. The harder question is whether anyone with meaningful buying power is willing to absorb the selling—and stay in the market after the first bounce. What we know: BTC fell from around $73,900 to an intraday low near $67,510 on November 13, breaking below $70,000. It is now far beneath its declining short- and medium-term trend averages. ETF flows have also been negative: $1.06 billion out over 5 days and $1.91 billion over 20 days, with 6 consecutive days of withdrawals. Reports attribute more than $1.2 billion in recent crypto liquidations largely to long positions. Those figures fit the price action: leveraged buyers were forced out as the market fell. But there is a difference between explaining a fast drop and explaining what happens next. Liquidations can push price below where willing sellers would otherwise take it. Once they end, the market may rebound. Yet if ordinary spot buyers do not replace the demand that has disappeared, the bounce may be brief. We do not have reliable CVD, exchange-wallet flows, or order-book data here to establish whether large buyers absorbed the liquidation supply. That is a genuine blind spot—not evidence that absorption did or did not happen. The derivatives picture is also less tidy than “everyone is bearish.” Funding is close to neutral overall, at about +0.003% per 8 hours, meaning longs pay shorts only slightly. At OKX, accounts are skewed long, but top traders’ positions lean short. Open interest there is up 7.2% over 7 days, even as BTC fell. That may mean traders are opening positions into volatility rather than standing aside. It does not tell us whether new exposure is mostly hedged, directional, or vulnerable to liquidation. Nor should venue-specific open-interest figures be treated as a complete picture of the market. On the blockchain, activity looks softer rather than suddenly broken. Transactions are down 32.9% and miner revenue 28% over 30 days; active addresses are down a milder 1.9%. Hashrate has fallen 18.4%, with an estimated difficulty reduction ahead. These readings raise questions about usage and mining economics, but they do not establish that miners are selling BTC. Nor do we have verified recent whale transfers or exchange inflows that would confirm a large holder is distributing. The sensible conclusion is limited: activity and mining indicators deserve attention, but they are not a clean near-term price signal. That leaves the market’s behavior as the most practical evidence. $67,510 is the current low and a nearby test, not a magical floor. If BTC breaks it and cannot reclaim it, the next marked daily support is near $62,522. If the low holds, that alone would show only that selling paused. A more persuasive improvement would be a recovery through $69,000–$69,144, followed by buyers defending that zone on a retest. A bounce that fails there would suggest sellers still control the response. The much higher declining averages—around $72,600 on the 4-hour chart—show how much overhead supply a lasting reversal may have to overcome. The bullish interpretation is that forced selling has created room for a relief rally, while extreme fear and low daily RSI make further immediate declines less comfortable to chase. The bearish interpretation is that ETF withdrawals and weak price structure point to ongoing supply, while rising open interest could leave fresh positions exposed if support gives way. Neither is confirmed by RSI or liquidation totals alone. My main question is simple: does actual spot demand appear when the forced selling fades? Watch ETF flows, credible exchange-flow data, open interest alongside price, and whether BTC can reclaim resistance—not just touch it. Until those answers improve, this looks like a market searching for buyers, not one that has proved it found them. #IMPACTbyTrade
I’d frame $BNBUSDT less as a support-and-resistance puzzle and more as a test of whether its market can absorb supply. At about $635, the price is near the day’s low of $630, after falling 8.4% in a week. That is plainly weak. But a low price alone does not tell us whether committed buyers are waiting underneath or whether sellers simply have not finished. The context matters. On Nov. 13, the broader crypto market fell 7.9%, and Bitcoin dropped below $71,000. BNB’s decline therefore arrived during a broad risk-off move, not in isolation. Still, BNB is down 14.8% over 30 days, so “the market made it do this” is not a complete explanation. Is BNB merely amplifying general fear, or is demand for this particular asset also fading? The available flow data cannot settle that. One useful clue is that price fell while open interest was coming down: OKX open interest declined 9.8% over 7 days and 22.5% over 30 days. Funding is almost flat. That combination is consistent with traders reducing positions rather than piling into a heavily leveraged bet. It can ease the risk of a cascade, but it does not mean sellers are exhausted. Nor can we identify who is selling: spot CVD, order-book changes, exchange flows and liquidation maps were not available. I would be wary of calling this a “long squeeze” without those details. The chart still sets a practical test. $630 is the nearest line buyers must defend; below that, $600–$585 is the next substantial support zone. If price bounces, $658 is an initial reclaim level, while roughly $688–$700 is a more meaningful hurdle. A brief move through resistance would not be enough. I’d want to see price hold a retest and evidence that spot demand—not just futures positioning—is supporting it. What would invalidate the bearish reading? A sustained reclaim of that upper zone, followed by improving participation. What would strengthen it? A decisive break beneath $630 and failure to recover. There is also a slower-moving question: what is the market paying for? BNB Chain still has use, including $28.4 billion in 30-day DEX volume and $14.1 billion in stablecoins. Yet fees fell 34.8% over the latest 30 days, and value locked declined 33.8% year over year. The Saudi SME credit vault targeting $100 million could become a useful adoption signal, but a target is not proof of funded loans, recurring usage, or meaningful BNB demand. My conclusion is not that BNB must fall further; it is that the evidence has not yet demonstrated absorption or renewed demand. The next useful questions are whether $630 holds, whether any recovery is spot-led, and whether chain activity stabilizes. Until those answers improve, a bounce would be a possibility—not confirmation. #IMPACTbyTrade
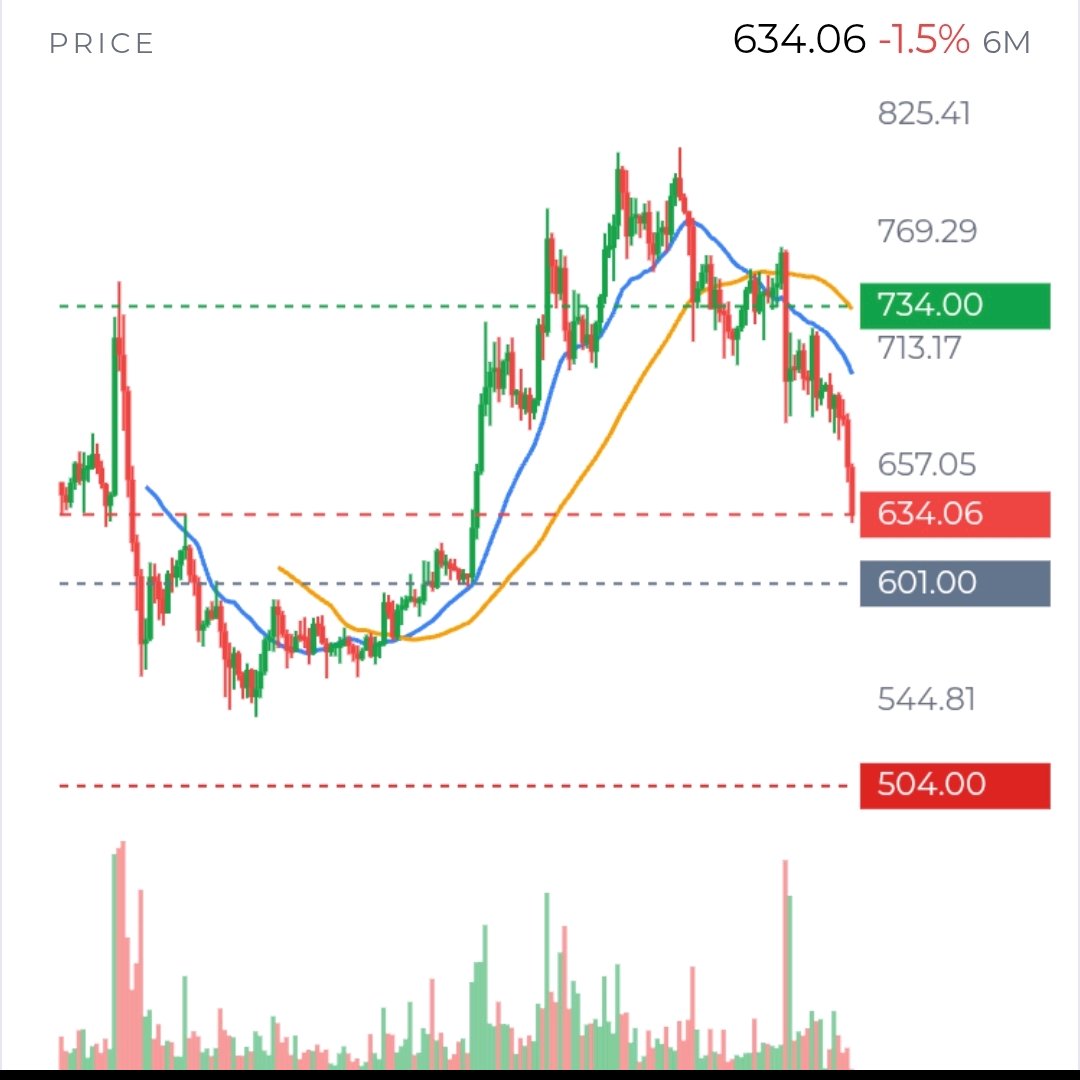
$SOLUSDT at $81.72 is testing a point where the chart, the derivatives market and the network’s economics tell different stories. I would not start by asking whether this is “cheap” or “oversold.” I would ask a narrower question: what evidence would show that the sellers who have driven this decline are actually losing control? The chart says they still have it. SOL is down 8.2% in 7 days and 23.7% over 30 days. Its weekly closes have stepped down from $121.60 to $86.54, and price remains below the weekly EMA20 at $95.57 and EMA50 at $104.08. On the daily chart, the trend is also down. These are verified price facts; the interpretation is that rallies have not yet changed the larger structure. The nearest test is unusually clear. SOL has traded as low as $80.45, with nearby support around $81.23. A sustained hold above that area could create room for a bounce, but one successful test would not establish a bottom. If price breaks below it and cannot quickly recover, weekly support at $76.70 becomes relevant, followed by $70.58. The deeper reference is $60.11, the low of the broader range. Why care about that distant level now? Because it marks where the longer-term recovery thesis would face a much more serious test. For a bullish case, I would first want SOL to reclaim $83.50–$85.84 and stay there. That zone matters because recent trading repeatedly failed to hold above it; a brief move through resistance is less informative than a close above it and a successful retest. A stronger recovery would eventually need to challenge $97.67, near weekly resistance. Until then, an oversold bounce and a trend reversal are different claims. Daily RSI at 22.3 and 4-hour RSI at 30.5 show stretched downside momentum. That can make a rebound more likely in the short run, but it does not tell us that selling has ended. Meanwhile, open interest is $1.86 billion across the reported venues, and OKX open interest is down 3.4% over 7 days. Weighted funding is slightly negative, at −0.004% per 8 hours. One reasonable interpretation is that leverage is being reduced rather than fresh bullish leverage piling in. But these figures cannot identify the sellers, prove a liquidation cascade, or tell us whether spot investors are accumulating. We lack the liquidation and order-flow evidence needed to make those claims confidently. Liquidity itself is not the obvious problem: reported 24-hour spot volume is $2.46 billion across 67 venues, and the volume-weighted spread across the largest markets is 0.019%. That suggests SOL can be traded in size without unusually wide quoted spreads. But easy execution is not the same as strong demand. The more useful question is whether buyers keep showing up at support—and whether their activity persists after the first bounce. Here the fundamentals complicate the recovery story. Solana recorded $1.62 billion in DEX volume over 24 hours and holds $14.1 billion in stablecoins, evidence of meaningful activity and liquidity. Yet, over 30 days, fees fell 42.5% to $16.1 million, locked value fell 17.1% to $4.94 billion, and stablecoin balances declined 6.4%. At a market capitalization of $48.3 billion, the data do not yet show that activity is translating into stronger, durable value for SOL holders. DEX volume is encouraging; by itself, it does not settle the valuation question. There are positive developments to watch, not proof that the economics have changed. Visa’s reported settlement integration involving Western Union’s Solana-based USDPT is a potential use case. DTCC’s planned tokenized-securities service on Solana is targeted for the second half of 2027. Both could matter if they generate sustained on-chain activity. Neither announcement, on its own, demonstrates meaningful SOL demand today. ETF flows point the other way for now: US spot SOL funds recorded $52 million of outflows over 5 days and $124 million over 20 days. That is a verified headwind, though it does not prove those flows caused the price decline. Could this pressure ease if flows turn positive while SOL holds support? Yes. Would that alone repair weakening fees and locked value? No. My read is not that SOL must fall, or that a rebound is impossible. It is that the market has not yet supplied the evidence to distinguish a durable recovery from a temporary relief rally. I would watch whether $80.45 holds, whether price can reclaim $83.50–$85.84, and whether improving price action arrives alongside renewed ETF inflows and firmer network economics. If those signals diverge, which one deserves more weight? For a longer-term investor, that remains the central uncertainty—not whether RSI is low today. #IMPACTbyTrade

What stands out to me in $XRPUSDT is not simply that it is falling. It is that the market has not yet shown clearly who is in control at the current price. XRP is near $1.02 after losing about 17.7% in a week, but the recent low around $1.0164 has not been confirmed as broken by an hourly close. That makes this a test of demand, not a settled breakdown. I would start with participation rather than indicators. Spot turnover is substantial, but the available figures do not tell us whether buyers or sellers were more aggressive. There is no reliable CVD or order-book imbalance here. CVD tracks whether trades are being initiated more by buyers or sellers; without it, we cannot confidently say spot selling is driving the move. Nor can we treat a large trade or a wallet balance change as proof of fresh demand. What we can say is that price has fallen sharply while the evidence about the type of selling remains incomplete. The derivatives picture is mixed, not dramatic. Reported perpetual open interest is $717 million across venues. On OKX it fell 8.7% over 7 days, though it rose 5.8% in the latest 24 hours. Weighted funding is mildly positive at 0.003% per 8 hours: longs are paying shorts, but the rate is not extreme. OKX accounts are tilted long, while top traders’ position ratio leans short. That disagreement matters. Is the decline being extended by leveraged longs getting out, or are traders already positioned for further weakness? The figures do not prove either. And without liquidation totals and comparative futures-volume data, talk of a forced-sell cascade is premature. The price action does tell us something about the immediate contest. XRP is below its short-term moving averages, and the daily trend remains down. The $1.0164 low is close enough to matter: a confirmed break would make the 52-week low around $0.9872 the next important reference. But support is not a law of nature, and repeated tests do not automatically mean a break is imminent. If price instead climbs above $1.0569 and holds there on a retest, that would suggest demand is doing more than briefly catching a falling market. It still would not, on its own, reverse the larger downtrend. There are genuine reasons to question demand beyond the chart. US spot XRP funds had net outflows of $10.2 million over 5 days, while XRPL stablecoin supply and TVL each fell about 19.9% and 19.7% over 30 days. These are meaningful signs of weaker flows and reduced activity or liquidity around the network. Yet the latest fund session recorded a small $370,000 inflow. These observations cover different windows, so one positive session does not cancel the weekly outflow, and the outflow does not prove that ETF investors caused the price decline. The better question is whether weakness continues. Whale headlines are less conclusive than they sound. One report claimed large wallets added 65.32 million XRP in 4 days. That could represent accumulation, but wallet balances alone cannot show that the tokens were bought in the market, moved off exchanges, or belong to unrelated holders. Could this be genuine conviction while funds withdraw, or just transfers that look bullish when viewed in isolation? We do not have the verified exchange-flow data to answer. The macro backdrop offers another explanation. The broader crypto market fell 5.2% in 24 hours, and sentiment was in fear territory. That makes it plausible XRP was caught in a wider risk-off move, rather than responding only to XRP-specific news. Still, broad weakness does not explain every part of a 17.7% weekly decline. The market has to show whether XRP demand returns when conditions stabilize. My read is cautious, but I would not mistake caution for certainty. Oversold momentum leaves room for a sharp relief bounce; weak fund flows, reduced XRPL liquidity, and the downtrend argue against assuming that a bounce will last. The decisive evidence is still ahead: does price close below $1.0164 and attract further selling, or does it reclaim $1.0569 with visible spot demand? Until we can see the answer in both price and participation, neither a breakdown nor a durable recovery is established. #IMPACTbyTrade
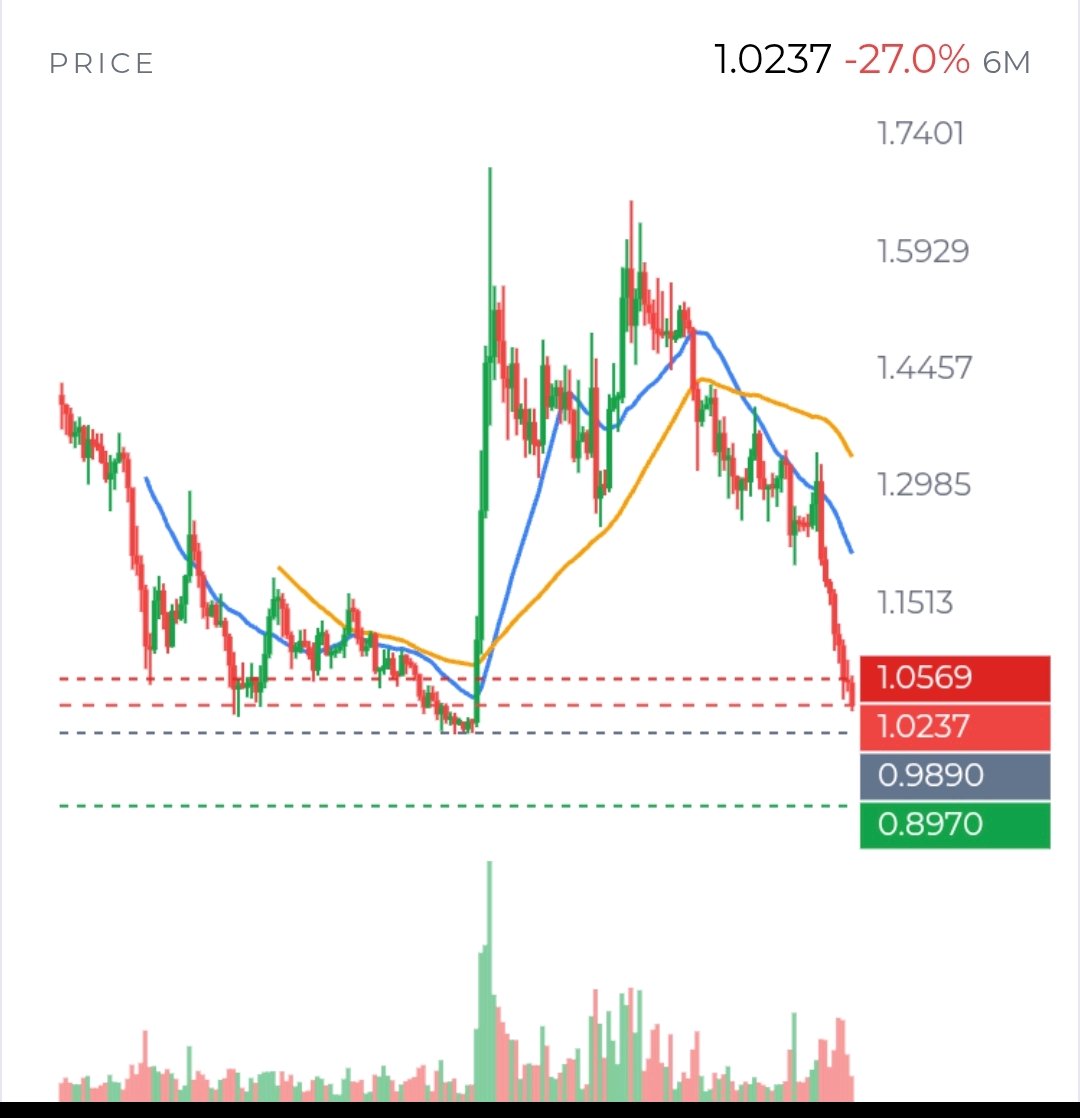
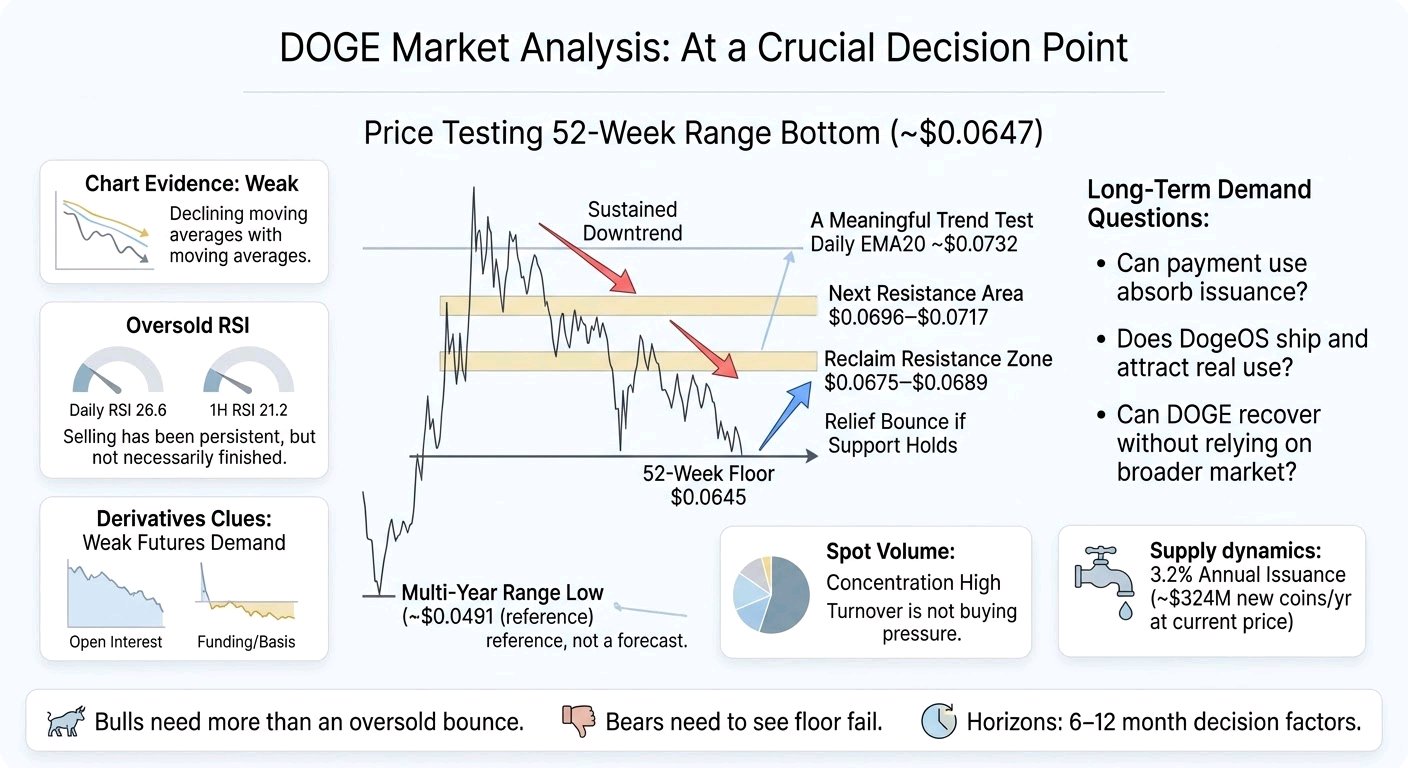
$DOGEUSDT is no longer just a chart question. At around $0.0647, the price is testing the bottom of its 52-week range, but the more important question is whether there is any durable reason for buyers to defend it. A low price can attract bargain hunters; it does not, by itself, create demand. On the chart, the evidence remains weak. DOGE has fallen for 6 consecutive weekly candles, from about $0.0959 to $0.0690, and sits below declining moving averages on daily, weekly and monthly timeframes. The immediate line in the sand is $0.0645, the recent low and 52-week floor. A hold there could produce a relief bounce, but I would want to see higher lows and a reclaim of $0.0675–$0.0689 before calling it a change in character. Above that, $0.0696–$0.0717 is another resistance area; the daily EMA20 near $0.0732 is a more meaningful trend test. A sustained move above it would improve the picture, though it would not erase the larger downtrend. A weekly close below $0.0645 would put the support thesis in doubt; the data identifies no dependable near-term floor beneath it. The multi-year range low near $0.0491 is a much lower reference, not a forecast. The oversold readings—daily RSI 26.6 and 1H RSI 21.2—tell us selling has been persistent. They do not tell us that sellers are finished. Recent candles show a sharp drop and only a modest bounce. Crucially, the available snapshots do not provide reliable 15-minute history, MACD, volume by price, order-book imbalance, cumulative volume delta or liquidation maps. So we cannot verify whether the low was bought aggressively, whether stops were swept, or whether a large liquidation event drove the move. Treating $0.0645 as a “liquidity floor” would go beyond the evidence. Derivatives offer clues, but not a clean explanation. Tracked perpetual open interest is $376M across 4 venues, while broader venue data reports $929M across 83; the coverage differs. OKX open interest is down 9.2% over 7 days, consistent with some leverage leaving as price fell. Funding is mildly negative, and dated futures trade at a negative annualised basis. That points to weak futures demand, but it does not distinguish fresh short positions from traders closing longs. Meanwhile, OKX has about 5 long accounts for every short account, yet top traders’ position ratio is 0.74. Account counts can mislead: many small accounts may be long while larger positions lean the other way. We lack verified liquidation totals and venue-wide positioning to settle that conflict. Spot turnover is substantial, but turnover is not buying pressure. The reported $867M across 63 venues is concentrated: one venue accounts for about 30%, and the top 3 for 43%. Without spot CVD or order-book data, we cannot say whether buyers absorbed supply or simply traded through a falling market. No chain-flow or whale data is available either. The long-term question is demand. DOGE has 157B coins circulating, with no hidden unlock cliff, but issuance continues at roughly 5B coins a year—about 3.2% of current supply. At today’s price, that is around $324M of new coins annually. There is no protocol revenue or holder cash flow to anchor valuation; the case depends on payments, recognition and speculative demand. The evidence does not establish that payment use is growing enough to absorb issuance. DogeOS is the clearest potential offset. Its CEO says mainnet is “very, very close,” and more than 100 builders are reportedly involved. That is a promise of possible utility, not proof of usage; no launch date or user metrics are available. Spot DOGE ETF flows were reported at zero from Oct. 14 to Nov. 10. A support agreement with House of Doge ended, though the ETF itself continues unchanged. DOGE also lost meme-coin trading-volume leadership to PEPE, suggesting speculative attention is contestable. These are headwinds, but none alone proves lasting demand has disappeared. My view is that DOGE is at a decision point, not a confirmed bargain or a confirmed breakdown. Bulls need more than an oversold bounce: support must hold, resistance must be reclaimed, and spot demand should accompany the move. Bears need to see the floor fail and price remain weak, not simply point to a downtrend already in progress. For a 6–12 month horizon, the decisive questions are whether DogeOS ships and attracts real use, whether buyers absorb ongoing issuance, and whether DOGE can recover without relying solely on a broader crypto rebound. #IMPACTbyTrade
At about $2,022 on November 12, ETH is pressing the bottom of its recent range while the short-term trend remains decisively down. The important question is whether buyers are defending a well-tested floor—or whether $2,005 is simply the next level sellers are leaning on. Over the past week $ETHUSDT fell 16.5%. It has closed 6 consecutive weeks lower, and price is well below its weekly 20- and 50-week averages, near $2,275 and $2,385. On the daily chart, RSI is 28.2; on the 4-hour chart it is about 30. That is oversold territory, but oversold does not mean the selling is finished. Recent candles show a sharp drop from around $2,045 to a low near $2,013, with no convincing recovery yet. $2,005–$2,013 is the immediate test. It is the recent intraday and daily low area, and it has so far held. But a brief bounce from there would not establish a bottom. A sustained break below it would make the daily swing low near $1,854 the next meaningful support; below that, weekly support is near $1,744. On the upside, $2,065–$2,074 is the first nearby resistance zone, followed by $2,104. A 4-hour close above $2,104, then a successful retest, would be better evidence of repair than a fast oversold bounce. Above that, $2,246–$2,275 is a tougher recovery zone. What would change the bearish short-term reading? Buyers would need to reclaim levels and hold them, not just wick above resistance. The derivatives picture is mixed, not a clean contrarian signal. Perpetual open interest is about $11.5B; OKX open interest is down 12.7% over 7 days as price fell. That suggests some positions have been closed or liquidated, rather than a fresh wave of leverage clearly backing the drop. Yet funding remains slightly positive at 0.004% per 8 hours, so longs are still paying shorts. Account positioning on OKX leans long, while top-trader positions lean short. Those figures are venue-specific and do not reveal the market’s full exposure. We also lack verified liquidation totals, liquidation heatmaps, order-book imbalance and CVD—the cumulative difference between aggressive buying and selling. So claims about exact liquidation clusters or dominant spot selling would go beyond the evidence. Spot volume is substantial—about $9.1B in the 24-hour venue snapshot—but volume alone cannot tell us whether buyers absorbed supply. The more direct demand clue is ETF flow: US spot ETH funds saw $524M of net outflows over 5 days and $1.48B over 20 days, despite $11.6B in cumulative net inflows since launch. That recent withdrawal streak is a real headwind; it does not yet prove a lasting institutional exit. BlackRock’s reported transfer of ETH to Coinbase Prime is worth watching, but a transfer to a trading/custody venue is not proof of a sale. Did it reflect routine fund operations, or actual selling? Net flow data—not wallet movement alone—will help answer that. On-chain signals also pull in different directions. Ethereum recorded $50B of DEX volume over 30 days, and fees rose 8.8% versus the prior 30 days. That is real network activity. But TVL fell 13.6% over 30 days, stablecoin supply on the chain fell 7.6%, and annualized price-to-fees remains high at 1,037×. Activity is not automatically value accruing to ETH: are users generating sustained demand for blockspace and ETH, or routing volume through a system where fees remain low? No verified recent exchange-inflow, whale-accumulation or token-unlock evidence settles that question. There are constructive developments, but their market impact is unproven. Sygnum launched a strategy targeting 8–10% annual returns measured in ETH; that shows product development, not demonstrated inflows. Institutional interest in tokenization and Ethereum’s quantum-readiness discussions are longer-term themes, not evidence that near-term demand has turned. Ethereum’s circulating and total supply are both reported at 122M, with no unissued supply overhang; that does not by itself establish whether net supply is expanding or contracting. My read is cautious, not a confident call for another leg down. Fear is 28, and ETH is near a heavily watched low; that can support a sharp rebound. But falling ETF flows, reduced on-chain capital and the weak weekly structure argue against treating oversold conditions as confirmation. The working committee stance remains hold, waiting for a confirmed weekly breakout or breakdown. The next evidence to watch is straightforward: does $2,005 hold on a closing basis; can ETH reclaim $2,104 and then sustain a retest; do ETF flows turn positive; and does spot buying rise alongside price rather than merely open interest? A weekly close below support would weaken the range interpretation. A durable reclaim of resistance, backed by flows and activity, would challenge it. #IMPACTbyTrade