
taiba
7455Like0Shares74Fans6Follow
crypto lover
crypto lover
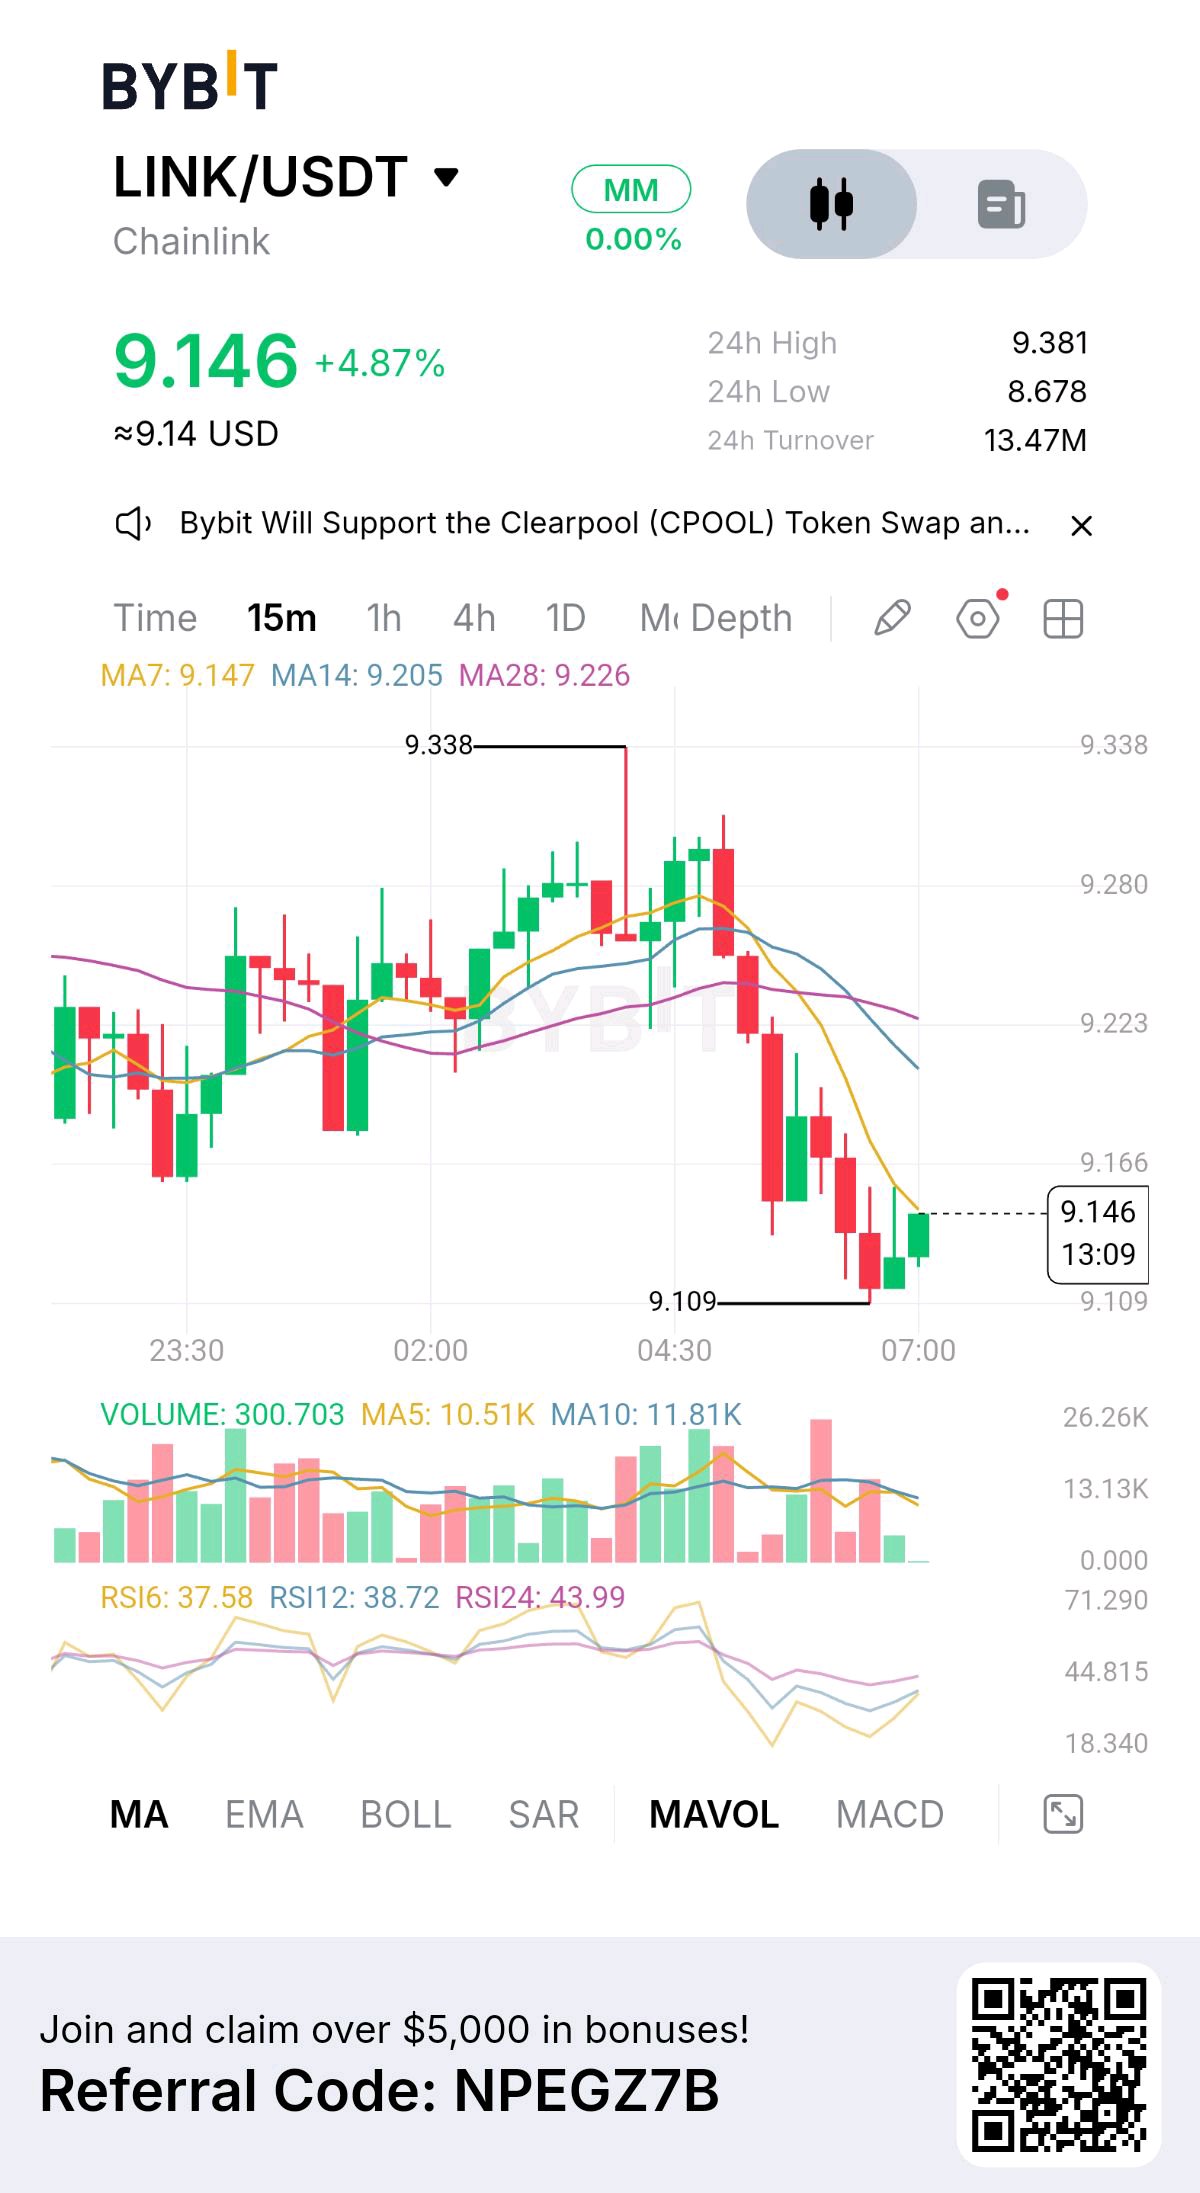
LINK is bouncing above $9.20 after briefly falling toward $8.60, but the recovery is happening while its weekly structure remains deeply negative. What makes this move interesting is that Chainlink is gaining institutional relevance at a time when its token price is still struggling. The latest development involves Moody's Ratings successfully testing Chainlink's cross-chain infrastructure for distributing credit-rating information across multiple blockchains. The question is whether institutional adoption can eventually translate into measurable demand for LINK. LINK recently traded near $9.25, up approximately 6.2% over 24 hours but down around 10.9% over seven days. Its latest 24-hour range stands at $8.616–$9.379, with market capitalization around $6.92B and trading volume near $337M. The $9.35–$9.40 zone is immediate resistance, while $9.00–$8.60 represents the important support region. A sustained move above $9.40 would strengthen the short-term recovery, but buyers still need to overcome the previous selling pressure. The fundamental catalyst is particularly important. On November 10, Chainlink and Moody's Ratings announced the successful completion of a pilot using Chainlink's Cross-Chain Interoperability Protocol (CCIP). The project demonstrated how Moody's credit-rating information could be distributed simultaneously across permissioned and permissionless blockchain networks. This matters because tokenized financial assets need reliable credit information regardless of which blockchain they operate on. However, there is one important distinction: the pilot was conducted in a testnet environment using representative data, not a live production deployment. It demonstrates technical capability, but commercial adoption still needs to follow. Another development strengthens the institutional narrative. Chainlink has introduced a revenue mechanism through which offchain and onchain enterprise revenue is converted into LINK and accumulated in the Chainlink Reserve. This creates a more direct connection between institutional adoption and token economics. The strategic opportunity is significant, but the actual impact depends on the amount of revenue generated and converted into LINK. Partnerships and integrations alone do not establish meaningful buying pressure. Tokenomics also deserve attention. Approximately 748.1M LINK are circulating against a maximum supply of 1B, meaning around 74.8% of the maximum supply is already in circulation. The remaining supply can still create distribution pressure as additional tokens enter circulation. However, the Reserve mechanism introduces a different demand-side consideration: if enterprise revenue grows and more LINK is accumulated, it could gradually strengthen the connection between network adoption and token demand. The important question is whether this demand can become large enough to offset circulating supply. Derivatives reveal another interesting development. CoinGlass reports approximately $397.26M in aggregate futures open interest, up 5.24% over 24 hours. Futures volume reached approximately $396.24M against $77.39M in spot volume, making derivatives activity roughly 5.1 times larger than spot trading. Funding is slightly positive at approximately +0.0002% per eight hours, while 24-hour liquidations reached approximately $681K, with longs accounting for around $496K. This suggests speculative participation is increasing alongside the recovery, but the relatively larger futures activity means buyers still need stronger spot confirmation. Key figures $9.25 — Current price area $9.35–$9.40 — Immediate resistance $9.00–$8.60 — Important support zone $8.616 — Recent 24H low $6.92B — Market capitalization $337M — 24H trading volume 748.1M / 1B — Circulating / maximum supply $397.26M — Aggregate futures open interest $396.24M / $77.39M — Futures / spot volume +0.0002% — Funding per eight hours $681K — 24H liquidations Bullish confirmation: Reclaim $9.40 and hold above it with stronger spot volume. That would put $9.80–$10.00 in focus, followed by the possibility of a broader recovery toward $10.50. Bearish confirmation: Lose $9.00 and fail to recover it. That would expose $8.60, with further weakness possible toward $8.20 if spot demand remains weak and leveraged positions begin unwinding. Chainlink is building a stronger institutional infrastructure story through Moody's, cross-chain interoperability and its revenue-funded Reserve mechanism. But institutional adoption and token appreciation are two different things. The decisive signal is whether real enterprise activity starts translating into sustained LINK demand while buyers reclaim $9.40—or whether derivatives-driven recovery fades under continued selling pressure. $LINKUSDT #ByXIMPACT
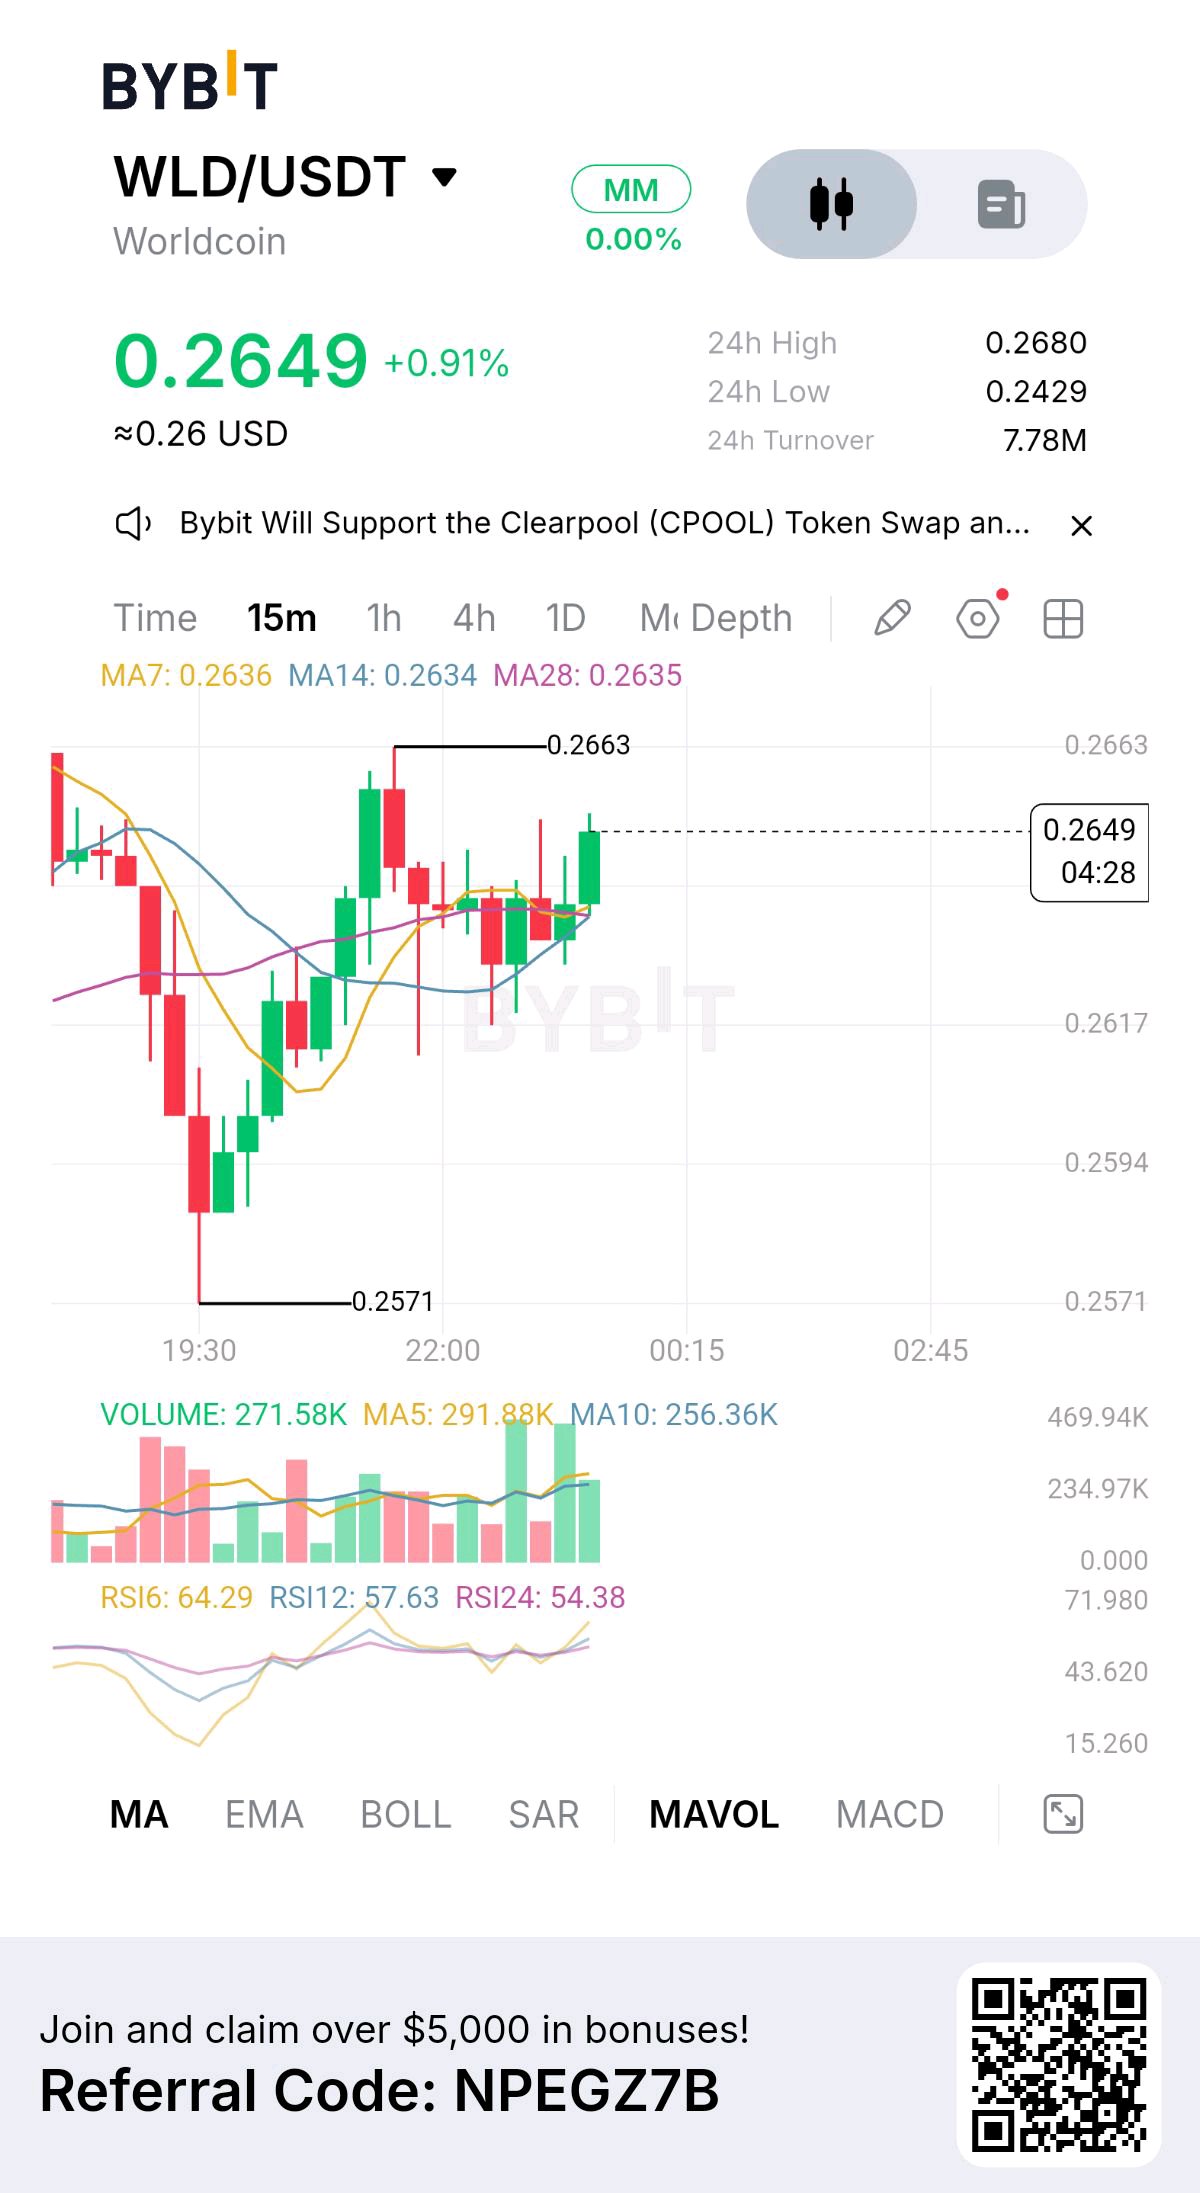
WLD is attempting to recover toward $0.27 after briefly falling near $0.243, but the weekly structure remains under pressure. What makes this setup interesting is the contrast between improving token unlock economics and continued selling pressure. World reduced its daily unlock rate by 43% in July, yet the token is still struggling to attract sustained demand. The question is whether reduced supply pressure can finally help buyers regain control. WLD recently traded near $0.262, with a market capitalization around $992M and 24-hour trading volume near $239.9M. Its latest 24-hour range stands at $0.2451–$0.2674, while the seven-day performance remains approximately 15% negative. The $0.267–$0.270 zone is immediate resistance, while $0.255–$0.245 represents the important support region. A sustained recovery above $0.270 would improve the short-term structure, but buyers still need stronger spot participation. The fundamental story revolves around World Network's expansion beyond its original identity-verification concept. World ID is designed to provide proof of human identity without revealing unnecessary personal information. The ecosystem is also expanding through World Money, which brings together stablecoin payments, financial services and global transfers. These developments could strengthen the network's long-term utility as AI-generated content and automated accounts become increasingly common. However, greater World ID adoption does not automatically create buying demand for WLD. The important question is how much actual economic activity translates into token demand. Tokenomics provide a more encouraging development. On July 24, 2026, World reduced its aggregate daily token unlock rate by approximately 43%, from 5.1M to 2.9M WLD. Community unlocks declined from 3.2M to 1.6M daily, while team and investor unlocks decreased from 1.9M to 1.3M. Approximately 3.78B WLD are currently circulating against a 10B maximum supply. This reduction removes some of the previous supply pressure, but approximately 62% of maximum supply is still outside circulation. The distinction is important: slower emissions improve the supply outlook, but continued daily unlocks can still absorb fresh market demand. Derivatives reveal another important risk. CoinGlass reports approximately $244.37M in aggregate futures open interest, down 4.60% over 24 hours. Futures volume reached approximately $483.97M against $89.91M in spot volume, making derivatives activity roughly 5.4 times larger than spot trading. Funding is negative at approximately -0.0456% per eight hours, meaning shorts are paying longs. Around $4.65M in positions were liquidated over 24 hours, with approximately 94% coming from long positions. This suggests leveraged bullish traders have faced significant pressure. Negative funding can create conditions for a short squeeze, but declining open interest and heavy long liquidations do not independently confirm accumulation. Key figures $0.262 — Current price area $0.267–$0.270 — Immediate resistance $0.255–$0.245 — Important support zone $0.2451 — Recent 24H low $992M — Market capitalization $239.9M — 24H market volume 3.78B / 10B — Circulating / maximum supply 2.9M WLD — Current approximate daily unlock rate $244.37M — Aggregate futures open interest $483.97M / $89.91M — Futures / spot volume -0.0456% — Funding per eight hours $4.65M — 24H liquidations Bullish confirmation: Reclaim $0.270 and hold above it with stronger spot volume. That would put $0.285–$0.300 in focus and strengthen the possibility of a broader recovery. Bearish confirmation: Lose $0.255 and fail to recover it. That would expose $0.245, with further downside possible toward $0.230 if selling pressure accelerates and spot demand remains weak. WLD has made meaningful progress on its token emission schedule, while World Network continues developing its identity and financial infrastructure. But reduced unlocks alone cannot reverse a weak market structure. The decisive signal is whether genuine spot demand starts absorbing the remaining daily supply—or whether leveraged trading continues dominating price action despite improving tokenomics. $WLDUSDT #ByXIMPACT
Ethereum is attempting to stabilize near $1,809 after suffering a sharp weekly decline, but the latest liquidation data suggests the market has not fully reset. What caught my attention is the combination of negative funding, declining open interest and heavy long liquidations. This could be an early sign of seller exhaustion, but it does not yet confirm that buyers have regained control. ETH recently traded near $1,809, down approximately 2.2% over 24 hours and 14.7% over seven days. Its latest 24-hour range stands at $1,710–$1,858, with market capitalization around $220.7B and circulating supply near 122.22M ETH. The $1,850–$1,860 zone is immediate resistance, while $1,750–$1,710 represents the important support region. A sustained recovery above $1,860 would improve the short-term structure, but buyers still need stronger spot participation. The institutional picture offers a small positive signal, but not enough to confirm a reversal. U.S. spot Ethereum ETFs recorded approximately $2.3M in net inflows on November 13. This suggests institutional demand has not disappeared entirely, although the relatively modest inflow is insignificant compared with Ethereum's recent market-cap decline. The important question is whether institutional buying strengthens as prices stabilize or remains too weak to absorb continued selling pressure. Ethereum's supply economics also deserve attention. Approximately 122.22M ETH are circulating, and unlike Bitcoin, Ethereum has no fixed maximum supply. Its issuance comes primarily through staking rewards, while transaction-fee burning through EIP-1559 removes ETH from circulation. This creates a dynamic supply model: when network activity and fee burning increase, the amount of ETH burned can offset more issuance. However, lower network activity can reduce burn pressure, meaning Ethereum's deflationary potential depends on actual usage rather than a guaranteed supply reduction. Derivatives reveal the most interesting part of the current setup. CoinGlass reports approximately $21.8B in aggregate futures open interest, down around 3.25% over 24 hours. Futures volume reached approximately $61.79B against $4.28B in spot volume, making derivatives activity roughly 14.4 times larger than spot trading. Funding is negative at approximately -0.0037% per eight hours, meaning shorts are paying longs. Around $386.65M in ETH positions were liquidated over 24 hours, including approximately $303.32M in longs. This indicates that leveraged bullish positions have taken substantial damage. Lower open interest and negative funding can create conditions for a recovery, but only if fresh spot buyers enter. Key figures $1,809 — Current price area $1,850–$1,860 — Immediate resistance $1,750–$1,710 — Important support zone $1,710 — Recent 24H low $220.69B — Market capitalization 122.22M ETH — Circulating supply $21.8B — Aggregate futures open interest $61.79B / $4.28B — Futures / spot volume -0.0037% — Funding per eight hours $386.65M — 24H liquidations $303.32M — Long liquidations Bullish confirmation: Reclaim $1,860 and hold above it with stronger spot volume. That would put $1,900–$1,950 in focus and strengthen the possibility of a broader recovery. Bearish confirmation: Lose $1,750 and fail to recover it. That would expose $1,710, with further downside possible toward $1,650 if leveraged selling accelerates. Ethereum is showing signs of leverage exhaustion, but a reduction in speculative positions is not the same as genuine accumulation. The decisive signal is whether spot demand returns while negative funding and declining open interest stabilize—or whether another support breakdown triggers a fresh wave of selling. $ETHUSDT #ByXIMPACT
NVDAX is struggling to recover above $160 after losing more than 10% over the past seven days, but the biggest risk is no longer just NVIDIA's share-price weakness. Jensen Huang's sudden resignation as CEO has introduced an unexpected leadership uncertainty just ahead of the company's November 17 earnings report. The question is whether strong AI demand can outweigh concerns about who will lead NVIDIA through its next growth phase. NVDAX recently traded near $160.59, down approximately 1.12% over 24 hours and 10.75% over seven days. Its latest 24-hour range stands at $155.33–$162.64, with market capitalization around $93.98M. The $162.60–$165.00 zone represents the immediate recovery resistance, while $157–$155.30 is the first support area. A sustained move above $165 would improve the short-term structure, but buyers first need to establish stronger spot participation. The fundamental catalyst is NVIDIA's unexpected leadership transition. On November 12, the company officially announced that Jensen Huang had resigned as President, CEO and board member, with CFO Colette Kress appointed interim CEO while the board searches for a permanent successor. This is significant because Huang led NVIDIA for 33 years and became closely associated with its AI strategy. The board has stated that customer commitments, operations and the product roadmap will continue without interruption. However, investors still need evidence that the transition will not disrupt execution during an important period for AI infrastructure demand. The upcoming earnings report makes this situation even more important. NVIDIA is scheduled to announce its third-quarter fiscal 2027 results on November 17. Its previous quarterly report showed $96.2B in revenue, up 106% year over year, while Data Center revenue reached $89B. The company previously guided for approximately $108B in Q3 revenue. These numbers establish a high expectation, but this earnings release will also be the first under interim CEO Colette Kress. The market will be watching both financial performance and management's confidence in future demand. Strong results alone may not resolve leadership concerns if forward guidance disappoints. Derivatives show an interesting shift in positioning. CoinGlass reports approximately $3.50M in aggregate futures open interest, down 11.52% over 24 hours. Futures volume reached approximately $20.69M against $1.41M in spot volume, showing substantially greater speculative activity in derivatives. Funding is negative at approximately -0.0759%, meaning short positions are paying long positions. Spot net inflows are approximately $710.6K, while futures net inflows are around $1.2M. This suggests some buying interest is returning, but declining open interest indicates traders are still reducing exposure rather than aggressively building bullish positions. Key figures $160.59 — Current price area $162.60–$165.00 — Immediate recovery resistance $157–$155.30 — Support zone $242.89 — October 6 all-time high $93.98M — Market capitalization $49.35M — Reported 24H market volume $3.50M — Aggregate futures open interest $20.69M / $1.41M — Futures / spot volume -0.0759% — Funding rate 584.69K — Circulating NVDAX supply November 17 — NVIDIA Q3 FY2027 earnings Bullish confirmation: Reclaim $162.60 and establish acceptance above $165 with stronger spot buying. That would put $170–$175 in focus, particularly if NVIDIA delivers strong earnings and reassuring forward guidance. Bearish confirmation: Lose $155.30 and fail to recover it. That would expose the $150 area, especially if NVIDIA shares face renewed selling pressure or earnings disappoint. NVDAX is facing two competing forces: NVIDIA's extraordinary AI business and an unexpected leadership transition at a critical moment. The upcoming earnings report could determine whether investors focus on continued business growth or demand a higher risk premium for leadership uncertainty. For me, the decisive signal is whether genuine spot demand returns ahead of November 17—or whether traders continue reducing exposure despite the company's strong underlying AI business. $NVDAXUSDT #ByXIMPACT
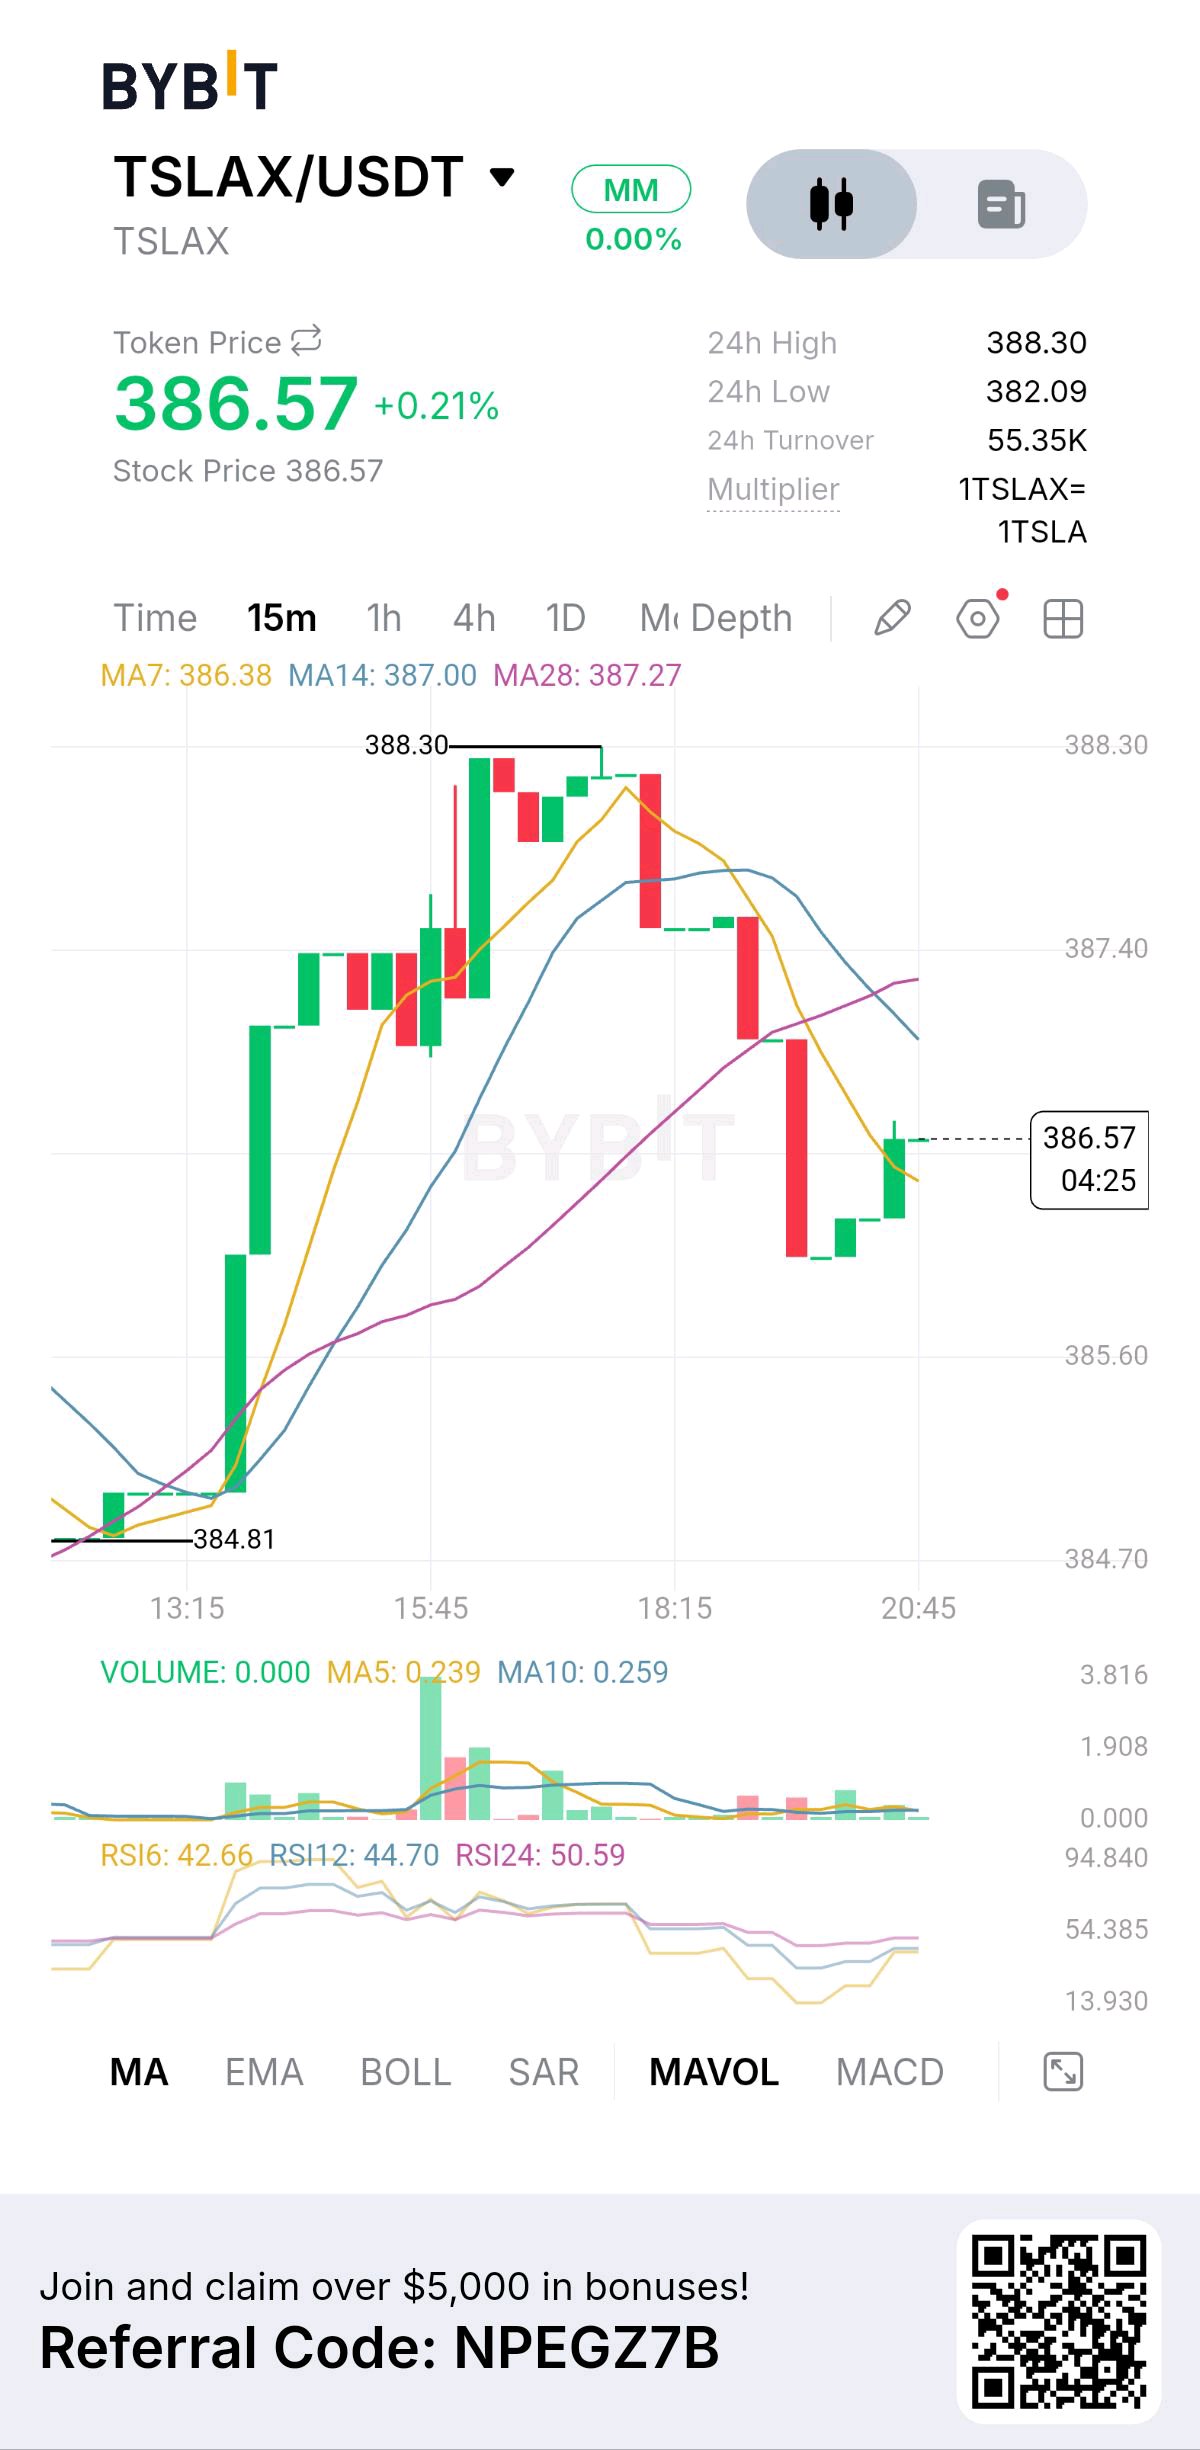
TSLAX is holding near $386 after recovering from the $353 area, but the latest rebound is approaching an important resistance zone. What makes this move interesting is that Tesla has gained renewed attention through its Robotaxi and AI ambitions, while uncertainty around Cybertruck production continues to challenge the investment story. The question is whether Tesla's future technology business can justify its valuation and sustain the recent recovery. TSLAX recently traded near $385.94, down approximately 0.6% over 24 hours but up around 7.5% over seven days. Its latest 24-hour range is approximately $382–$389, with a market capitalization around $80.3M and reported trading volume near $15.5M across tracked venues. The $389–$390 zone is immediate resistance, while $382–$378 represents the first support area. A sustained move above $390 would strengthen the recovery structure and bring the $403–$410 region into focus. The fundamental story is shifting beyond electric vehicle deliveries. Tesla's Q3 2026 update highlighted the launch of Cybercab into its Robotaxi fleet, eightfold quarterly growth in cumulative unsupervised Robotaxi miles, and a passenger-vehicle backlog at its highest level in four years. Energy storage also delivered its strongest-ever order rate and backlog. These developments support Tesla's longer-term AI, autonomous-driving and energy ambitions. However, the commercial opportunity still depends on regulatory approvals, production capacity and the ability to convert technology investments into recurring revenue. There is another important development investors should not ignore. Tesla's Cybertruck production strategy has faced uncertainty, with management discussing a production wind-down while subsequently extending the production timeline to address outstanding demand. This highlights the challenge of allocating factory capacity between existing vehicle products and the next generation of autonomous vehicles. The Robotaxi opportunity is significant, but execution remains the deciding factor. For TSLAX holders, there is an additional distinction. TSLAX is a tokenized tracker certificate designed to follow Tesla shares, not direct ownership of Tesla stock. It does not provide ordinary shareholder voting rights. Its price can also differ from the underlying stock because tokenized markets operate with their own liquidity and trading conditions. This becomes particularly important during weekends and outside U.S. stock-market hours. Derivatives show relatively limited market depth compared with major crypto assets. CoinGlass reports approximately $777.7K in aggregate futures open interest, with 24-hour futures volume around $380.4K against $77.9K in spot volume. Funding is positive near +0.014% per eight hours, meaning longs are paying shorts. The futures-to-spot volume ratio is approximately 4.9x. This suggests speculative positioning is influencing short-term activity, while relatively thin spot liquidity makes sustained buying especially important. Key figures $385.94 — Current price area $389–$390 — Immediate resistance $382–$378 — First support zone $403.66 — Seven-day high $353.34 — Seven-day low $80.31M — Reported market capitalization $15.51M — 24H trading volume $777.7K — Aggregate futures open interest $380.4K / $77.9K — Futures / spot volume +0.014% — Funding per eight hours Bullish confirmation: Reclaim $390 and hold above it with stronger spot participation. That would put $403–$410 in focus and strengthen the case for a continuation of the recovery. Bearish confirmation: Lose $378 and fail to recover it. That would expose $353, particularly if Tesla shares weaken and leveraged positions begin unwinding. TSLAX offers exposure to one of the most closely watched AI and autonomous-driving stories, but the token's price still depends primarily on Tesla's underlying equity performance. The decisive signal is whether Robotaxi progress and energy-storage growth translate into sustained confidence in Tesla shares—and whether TSLAX can reclaim resistance with genuine spot demand rather than speculative futures activity. $TSLAXUSDT #ByXIMPACT
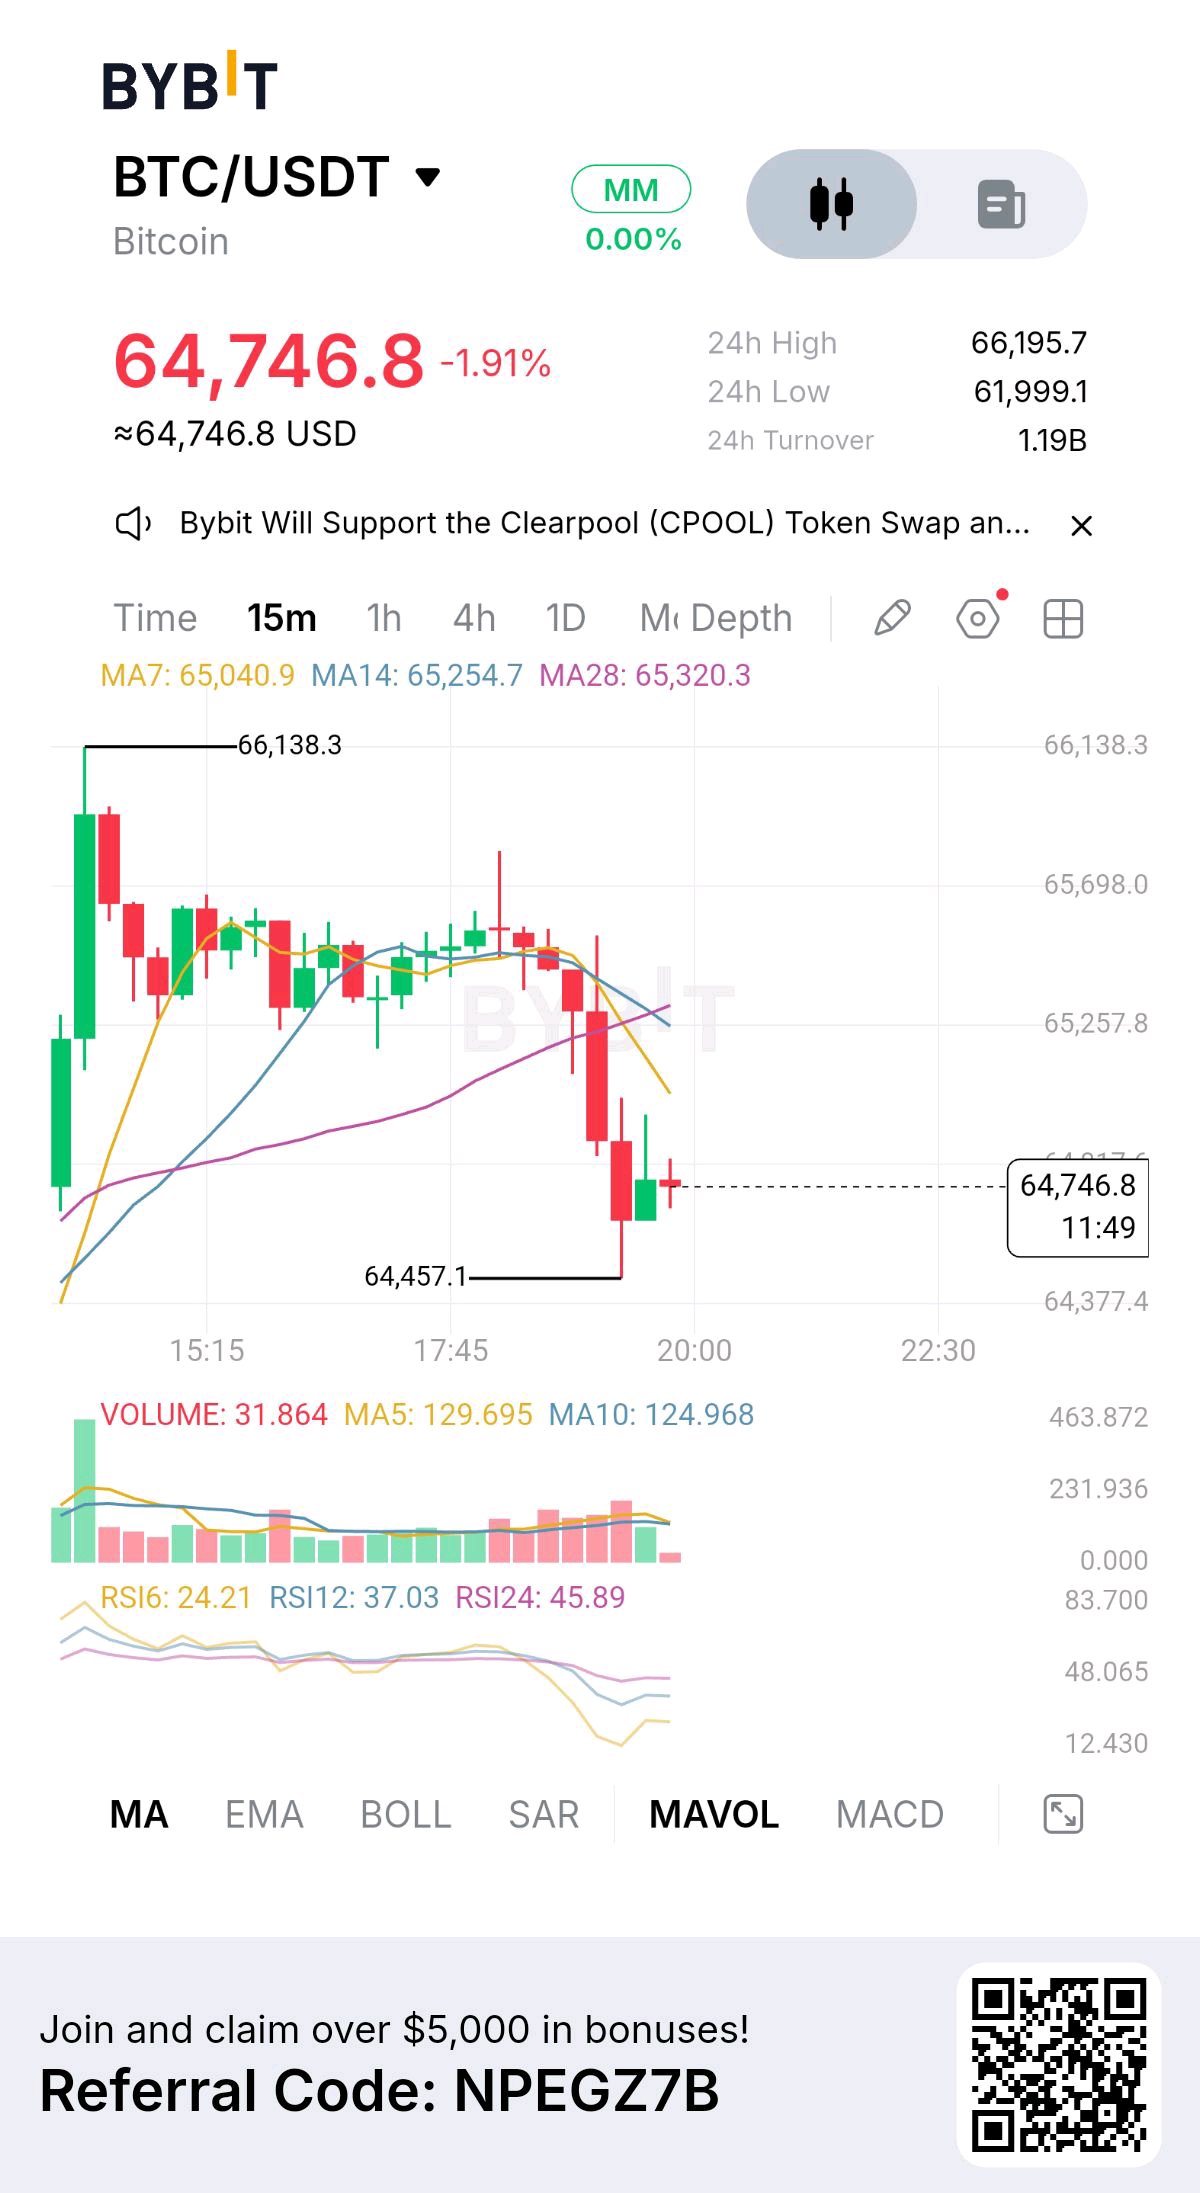
Bitcoin has recovered above $65,000 after briefly approaching $62,000, but the rebound is facing a serious test. What concerns me is that institutional demand has not returned, while more than $780M in leveraged positions have been liquidated over the past 24 hours. Is this the beginning of a recovery, or simply a pause in a broader sell-off? BTC recently traded near $65,133, down approximately 2% over 24 hours and more than 12% over seven days. Its latest 24-hour range stands at $61,956–$66,609, with market capitalization around $1.31T. The $65,900–$66,600 zone is the immediate resistance area, while $63,000–$62,000 remains the important support region. A sustained recovery above $66,600 would improve the short-term structure, but buyers still need to demonstrate stronger spot demand. The institutional picture is adding pressure. U.S. spot Bitcoin ETFs recorded approximately $1.065B in net outflows between November 9 and November 13, marking seven consecutive trading days of withdrawals. November 13 alone saw another $185.4M leave these products. This matters because institutional demand has been an important source of spot liquidity. Without renewed ETF inflows, Bitcoin may struggle to sustain a recovery even when short-term traders step in. Another important development is the deterioration in investor profitability. Recent on-chain analysis indicates that less than 45% of Bitcoin's measured active supply remains in profit. The short-term holder realized price is approximately $75,068, significantly above the current market price. This means many recent buyers remain underwater, potentially creating additional selling pressure whenever price attempts to recover toward their cost basis. However, deep unrealized losses can also create conditions for seller exhaustion if demand begins absorbing supply. Derivatives show that leverage is still playing a major role. CoinGlass reports approximately $42.1B in aggregate futures open interest, down 7.43% over 24 hours. Futures trading volume reached approximately $115.26B against $10.60B in spot volume, showing that speculative activity remains substantially larger than direct spot trading. Funding is slightly positive at +0.0012% per eight hours, while 24-hour liquidations reached approximately $781.6M, with longs accounting for 74%. The reduction in open interest suggests leverage is being removed, but sustained spot buying is still needed to establish a healthier recovery. Key figures $65,133 — Current price area $65,900–$66,600 — Immediate resistance $63,000–$62,000 — Important support zone $61,956 — 24H low $1.31T — Market capitalization $1.065B — Weekly spot ETF outflows $42.1B — Aggregate futures open interest $115.26B / $10.60B — Futures / spot volume $781.6M — 24H liquidations 45% — Active supply currently in profit, approximately Bullish confirmation: Reclaim $66,600 and hold above it with stronger spot volume and improving ETF flows. That would put $68,000–$70,000 in focus and provide evidence that buyers are regaining control. Bearish confirmation: Lose $63,000 and fail to recover it. That would expose the $61,956 low, with further downside possible toward $60,000 if institutional outflows and leveraged selling continue. Bitcoin is showing signs of temporary stabilization, but institutional withdrawals, underwater holders and heavy derivatives activity are still challenging the recovery. The decisive signal is whether genuine spot demand returns and absorbs selling pressure—or whether another support breakdown triggers a fresh wave of long liquidations. $BTCUSDT #ByXIMPACT
HYPE has bounced from the $60 area, but I wouldn't confuse a sharp recovery with a confirmed trend reversal. The important signal now is whether buyers can reclaim the levels lost during the sell-off. Price is trading near $68, after falling more than 10% on November 14 and briefly reaching $60. The seven-day performance remains around -8.5%, and HYPE is still approximately 31% below its September all-time high near $98. The daily structure has weakened considerably, even though today's recovery shows buyers are responding. The derivatives data reveals how aggressive the sell-off became. Approximately $87M in positions were liquidated over 24 hours, with around 97% coming from longs. Open interest has also declined, suggesting leveraged positions are being removed rather than a fresh wave of conviction entering the market. This is a liquidation-driven reset, but it does not guarantee the selling is finished. Fundamentally, Hyperliquid still has a strong argument: its perpetual trading infrastructure continues expanding beyond crypto-native markets. Recent activity in equity-linked perpetuals demonstrates that the protocol's opportunity is broader than simply rising HYPE prices. However, network adoption and token price performance are not automatically the same thing. Key figures $67.95 — Current price snapshot $60.01 — 24H low $69.42 — 24H high $97.98 — All-time high $17.21B — Market capitalization $2.98B — Futures open interest $87.34M — 24H liquidations 97% — Liquidations from long positions -8.54% — Seven-day performance Bullish confirmation: Hold the $65–$66 region and reclaim $69.42. A sustained move above $70 would strengthen the recovery case and open the way toward the $72–$75 resistance area. Bearish confirmation: Lose $65.50 and fail to recover it. That would suggest the bounce is losing momentum, bringing the $60 support zone back into focus. Below $58.54, the broader summer price range could become relevant. Risk Management: Funding remains slightly positive despite the liquidation event. That means the market has not fully shifted into bearish positioning. I would avoid chasing the rebound until price establishes a higher low and reclaims resistance. The $60 reaction is encouraging, but buyers still need to prove they can defend the recovery. HYPE's long-term story remains tied to protocol activity and revenue generation. The immediate chart, however, has one job: turn the $60 liquidation low into a confirmed support level. $HYPEUSDT #ByXIMPACT
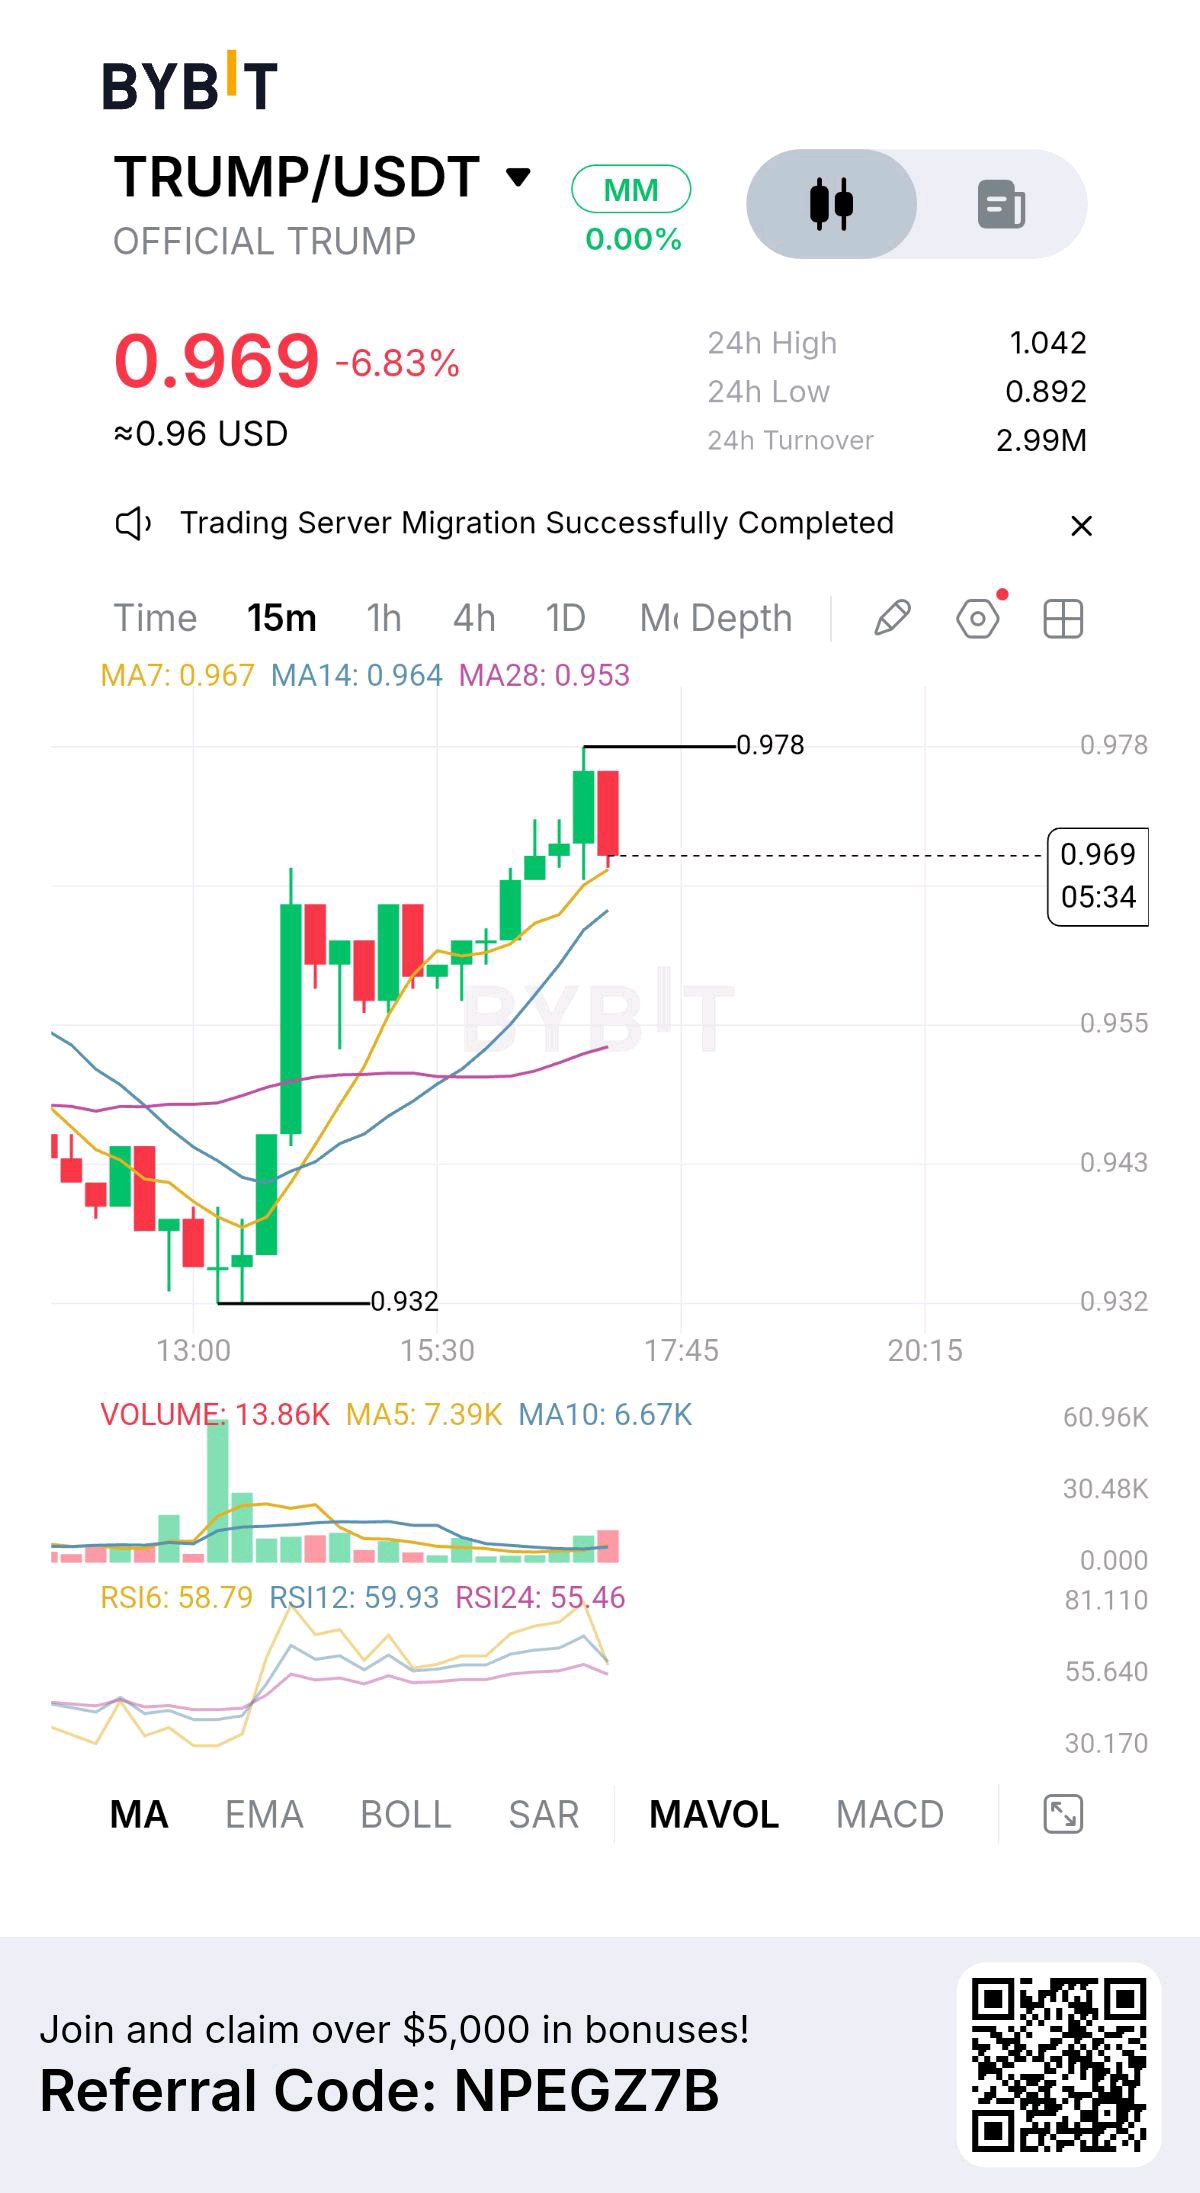
TRUMP is approaching a critical decision point. The latest sell-off has pushed price toward $0.90, but the derivatives market is showing signs of an increasingly crowded bearish trade. Price is trading around $0.95–$0.96, down roughly 12% over 24 hours and more than 16% over seven days. The recent trading range is $0.889–$1.074. Losing the $1 psychological level has weakened the structure, and buyers now need to defend the recent low before another recovery attempt becomes credible. The derivatives picture is particularly interesting. Futures open interest has fallen approximately 16% in 24 hours, while funding is deeply negative. Around $3.88M in positions were liquidated, including $3.62M in longs. This points to aggressive long-position unwinding, not fresh bullish conviction. However, heavily negative funding can also create squeeze potential if price starts reclaiming resistance. Supply remains the other major concern. Approximately 28.7 million TRUMP tokens are scheduled to unlock on November 18, representing 2.9% of total supply and around 3.7% of current market capitalization. The unlock does not guarantee immediate selling, but it adds pressure to an already weak chart. Key figures $0.95–$0.96 — Current price area $0.889 — Recent 24H low $1.00 — Psychological resistance $1.074 — Recent 24H high $265M–$270M — Market capitalization $103.6M — Futures open interest -16% — 24H open-interest change -0.0632% — Weighted funding snapshot November 18 — Next major unlock Bullish confirmation: Reclaim $1.00 and then break above $1.074 with improving spot demand. That would make a short squeeze more credible. Bearish confirmation: Lose $0.889 and fail to recover it. That would confirm continued weakness and expose the market to further downside. Risk Management: Futures volume is nearly eight times spot volume in the latest snapshot. That makes leverage-driven volatility a serious risk. I would not buy simply because funding is negative or price looks oversold. The $1 reclaim is the first confirmation I want to see. TRUMP does not need another headline to move sharply. It needs buyers to prove they can absorb selling pressure ahead of the November 18 unlock. $TRUMPUSDT #IMPACTbyTrade
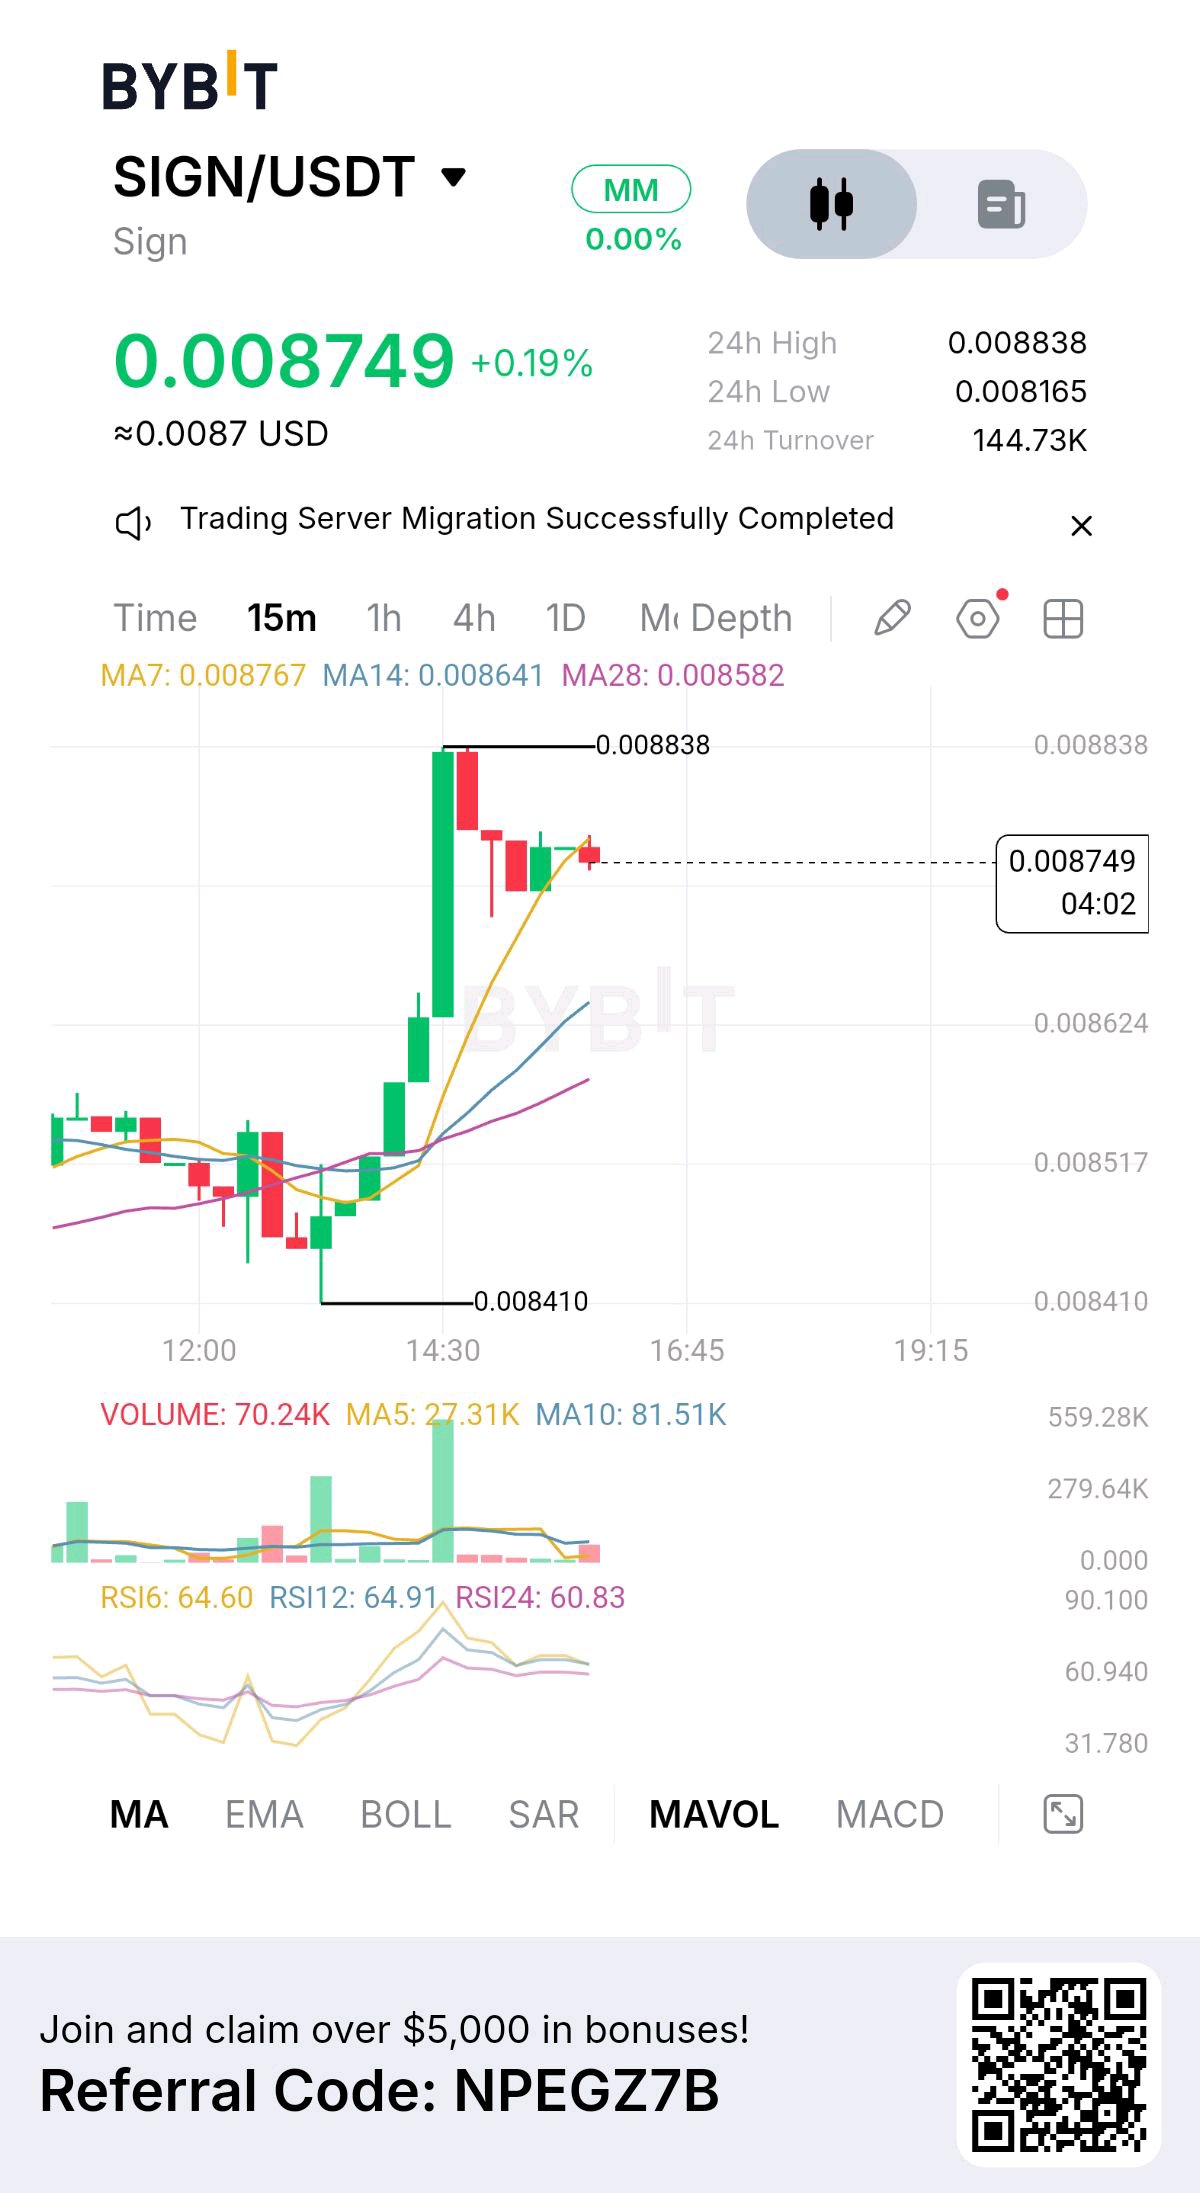
SIGN is showing early signs of short-term stabilization, but the bigger challenge is absorbing fresh supply without losing its support structure. Trading around $0.0085, SIGN remains approximately 93% below its all-time high. The 24-hour range is $0.00814–$0.00889, while the seven-day performance is still slightly negative. The daily trend remains bearish, with RSI near 34, and price trading below its major moving averages. Oversold conditions can create a bounce, but they do not confirm a reversal. The immediate technical battle is between $0.00828 support and $0.00872 resistance. A sustained reclaim of resistance would improve the short-term picture. Until then, rallies remain vulnerable to selling pressure. The supply situation deserves particular attention. Sign is building infrastructure around on-chain credential verification and token distribution through Sign Protocol and TokenTable. However, only around 28.4% of its 10 billion maximum supply is currently circulating. More importantly, a reported unlock of approximately 298 million SIGN tokens is scheduled for November 15. That represents roughly 10.5% of circulating supply. This is a substantial liquidity event, although unlocked tokens do not automatically become market sell orders. Key figures $0.0085 — Current price area $0.00828 — Immediate support $0.00872 — First resistance $0.00889 — 24H high $0.00814 — 24H low $23.86M — Market capitalization 2.843B — Circulating supply 10B — Maximum supply 298M — Reported November 15 unlock Bullish confirmation: Reclaim $0.00872 and hold above it. A stronger move toward $0.00889 would provide the first indication that buyers are regaining control. Bearish confirmation: Lose $0.00828 and fail to recover it. That would expose the recent $0.00814 low and potentially weaken the broader structure further. Risk Management: Around 61% of futures accounts are positioned short in one market snapshot, creating potential for a squeeze if resistance breaks. However, positive funding means longs are still paying shorts. I would wait for actual price confirmation rather than assume crowded shorts guarantee an upside move. SIGN has a genuine infrastructure use case, but its biggest near-term test is straightforward: can real demand absorb additional supply while the daily chart is still bearish? $SIGNUSDT #ByXIMPACT
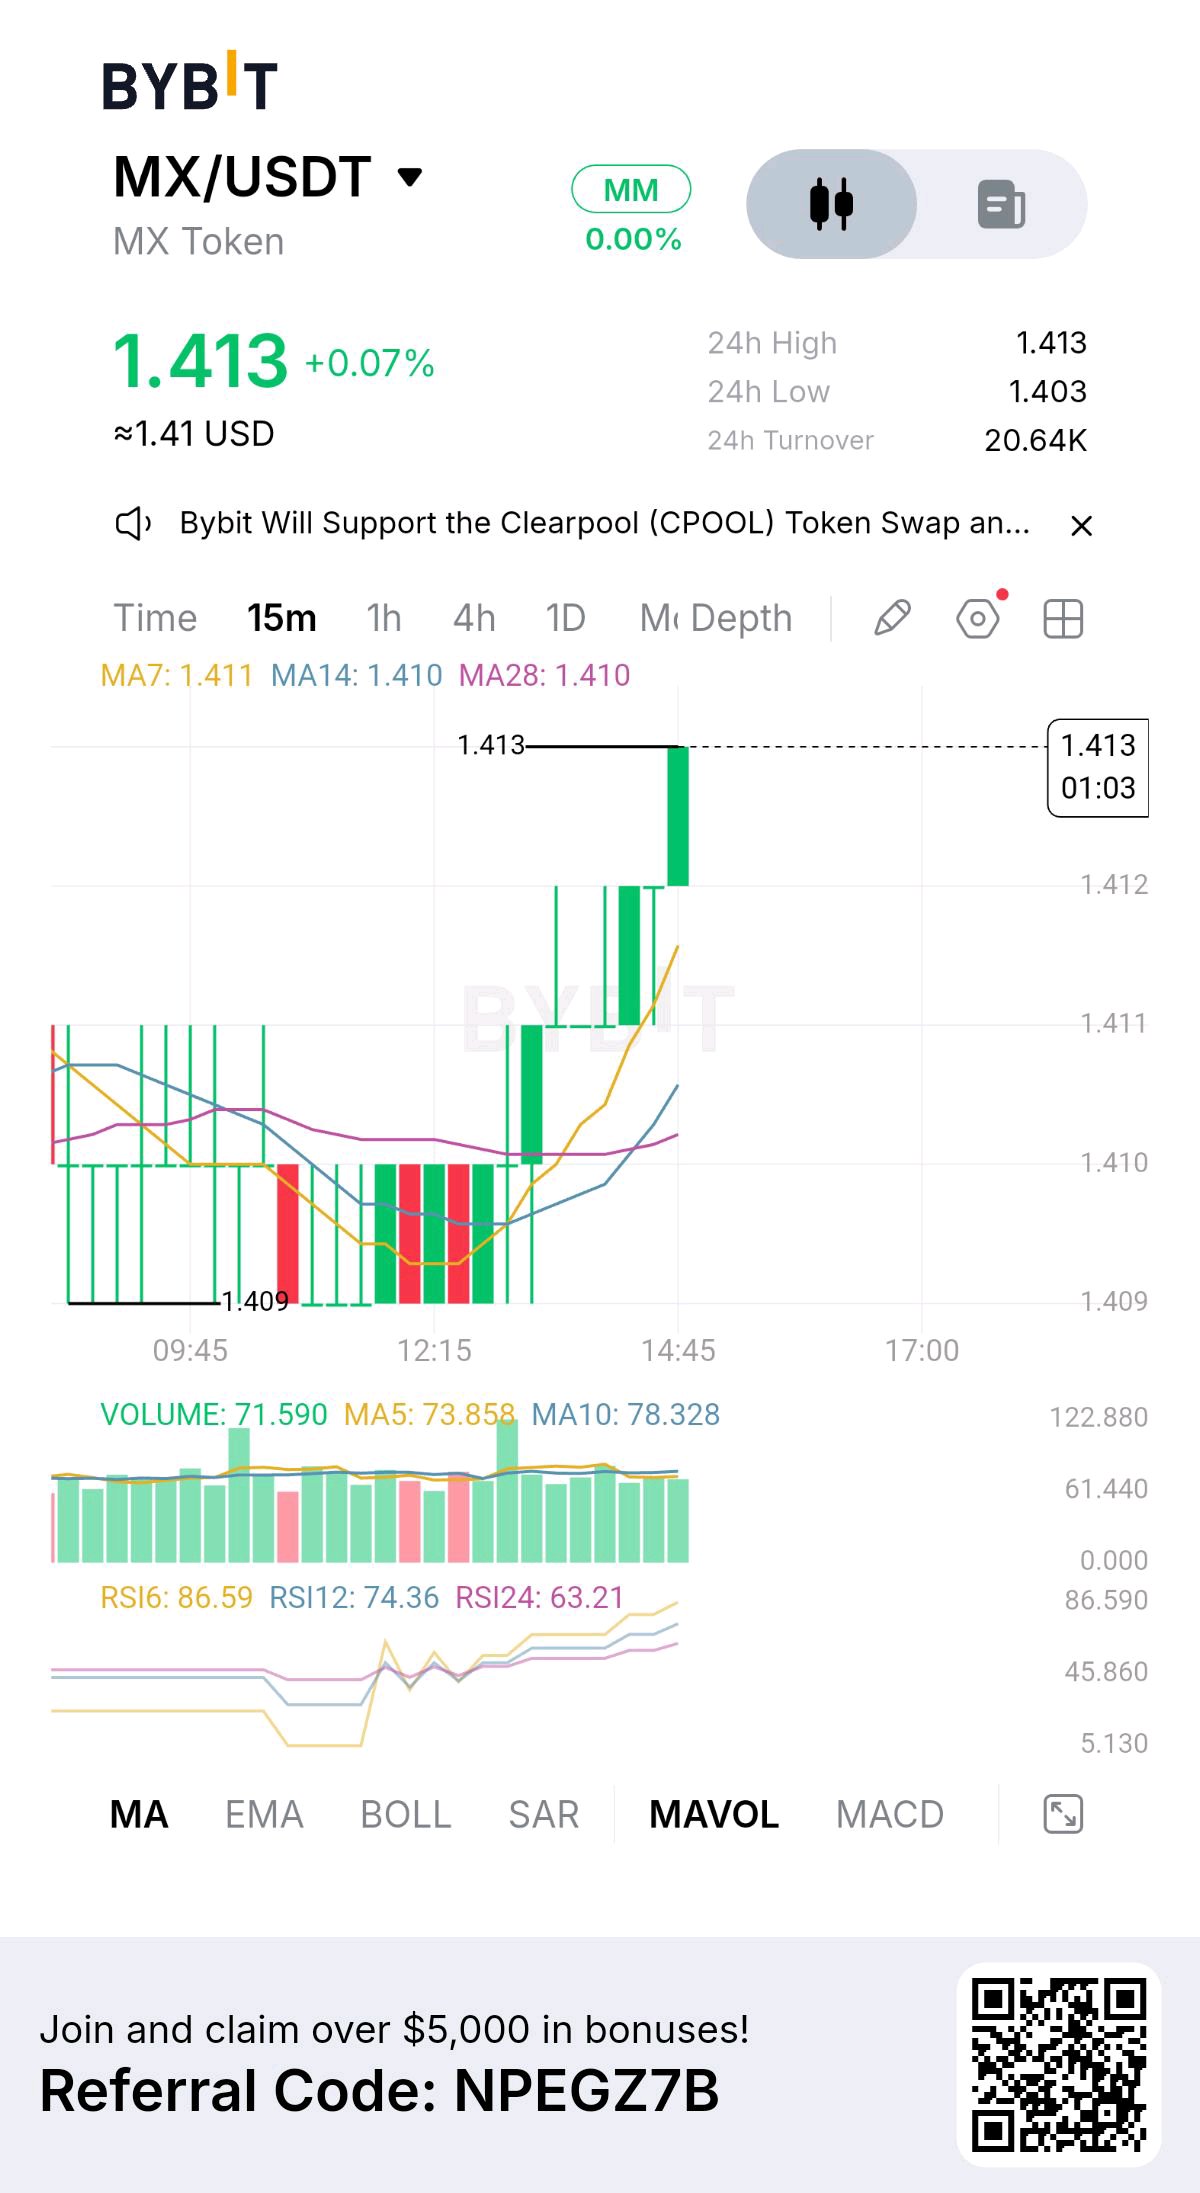
MX has remained relatively stable around $1.41, but one important detail stands out: the token is still underperforming, even without a major sell-off today. MX is trading near $1.409, down approximately 4% over seven days and 25% over 30 days. Its market capitalization is around $133.7M, with roughly 94.95M tokens circulating. The daily technical picture remains bearish, with 12 sell signals against only 2 buy signals in the latest indicator snapshot. The first battle is around $1.41. Buyers need to establish support here and reclaim the nearby $1.45–$1.50 region before a meaningful recovery becomes convincing. Until then, sideways movement should not automatically be interpreted as accumulation. The fundamental story is closely connected to the MEXC ecosystem. MX benefits from exchange-related utility, including eligible trading-fee deductions, while the MX Token 2.0 framework emphasizes buybacks and burns. MEXC previously announced that circulating supply had reached its 100M-token target. That creates a potentially supportive supply structure, but buybacks alone cannot guarantee price appreciation. There is also a regulatory overhang. Recent U.S. Treasury action involving MEXC has introduced uncertainty around the associated exchange. This is a possible sentiment risk, not a proven explanation for every MX price movement. Key figures $1.409 — Current price snapshot $1.41 — Immediate price battle $1.45–$1.50 — Recovery confirmation zone $133.67M — Market capitalization 94.95M — Circulating supply $4.92M — Reported 24H volume -4.02% — Seven-day performance -25.33% — 30-day performance Bullish confirmation: Hold above $1.41 and reclaim $1.50 with stronger volume. That would provide the first meaningful evidence that selling pressure is easing. Bearish confirmation: A sustained breakdown below $1.40 would weaken the current consolidation and increase the risk of another downward leg. Risk Management: I would avoid treating a quiet price chart as proof of a bottom. The daily technical structure remains bearish, and exchange-related uncertainty can change sentiment quickly. Wait for a confirmed reclaim rather than anticipating one. MX has a buyback-and-burn narrative, but the market ultimately needs something stronger: sustained demand that can turn reduced supply into actual price strength. $MXUSDT #ByXIMPACT
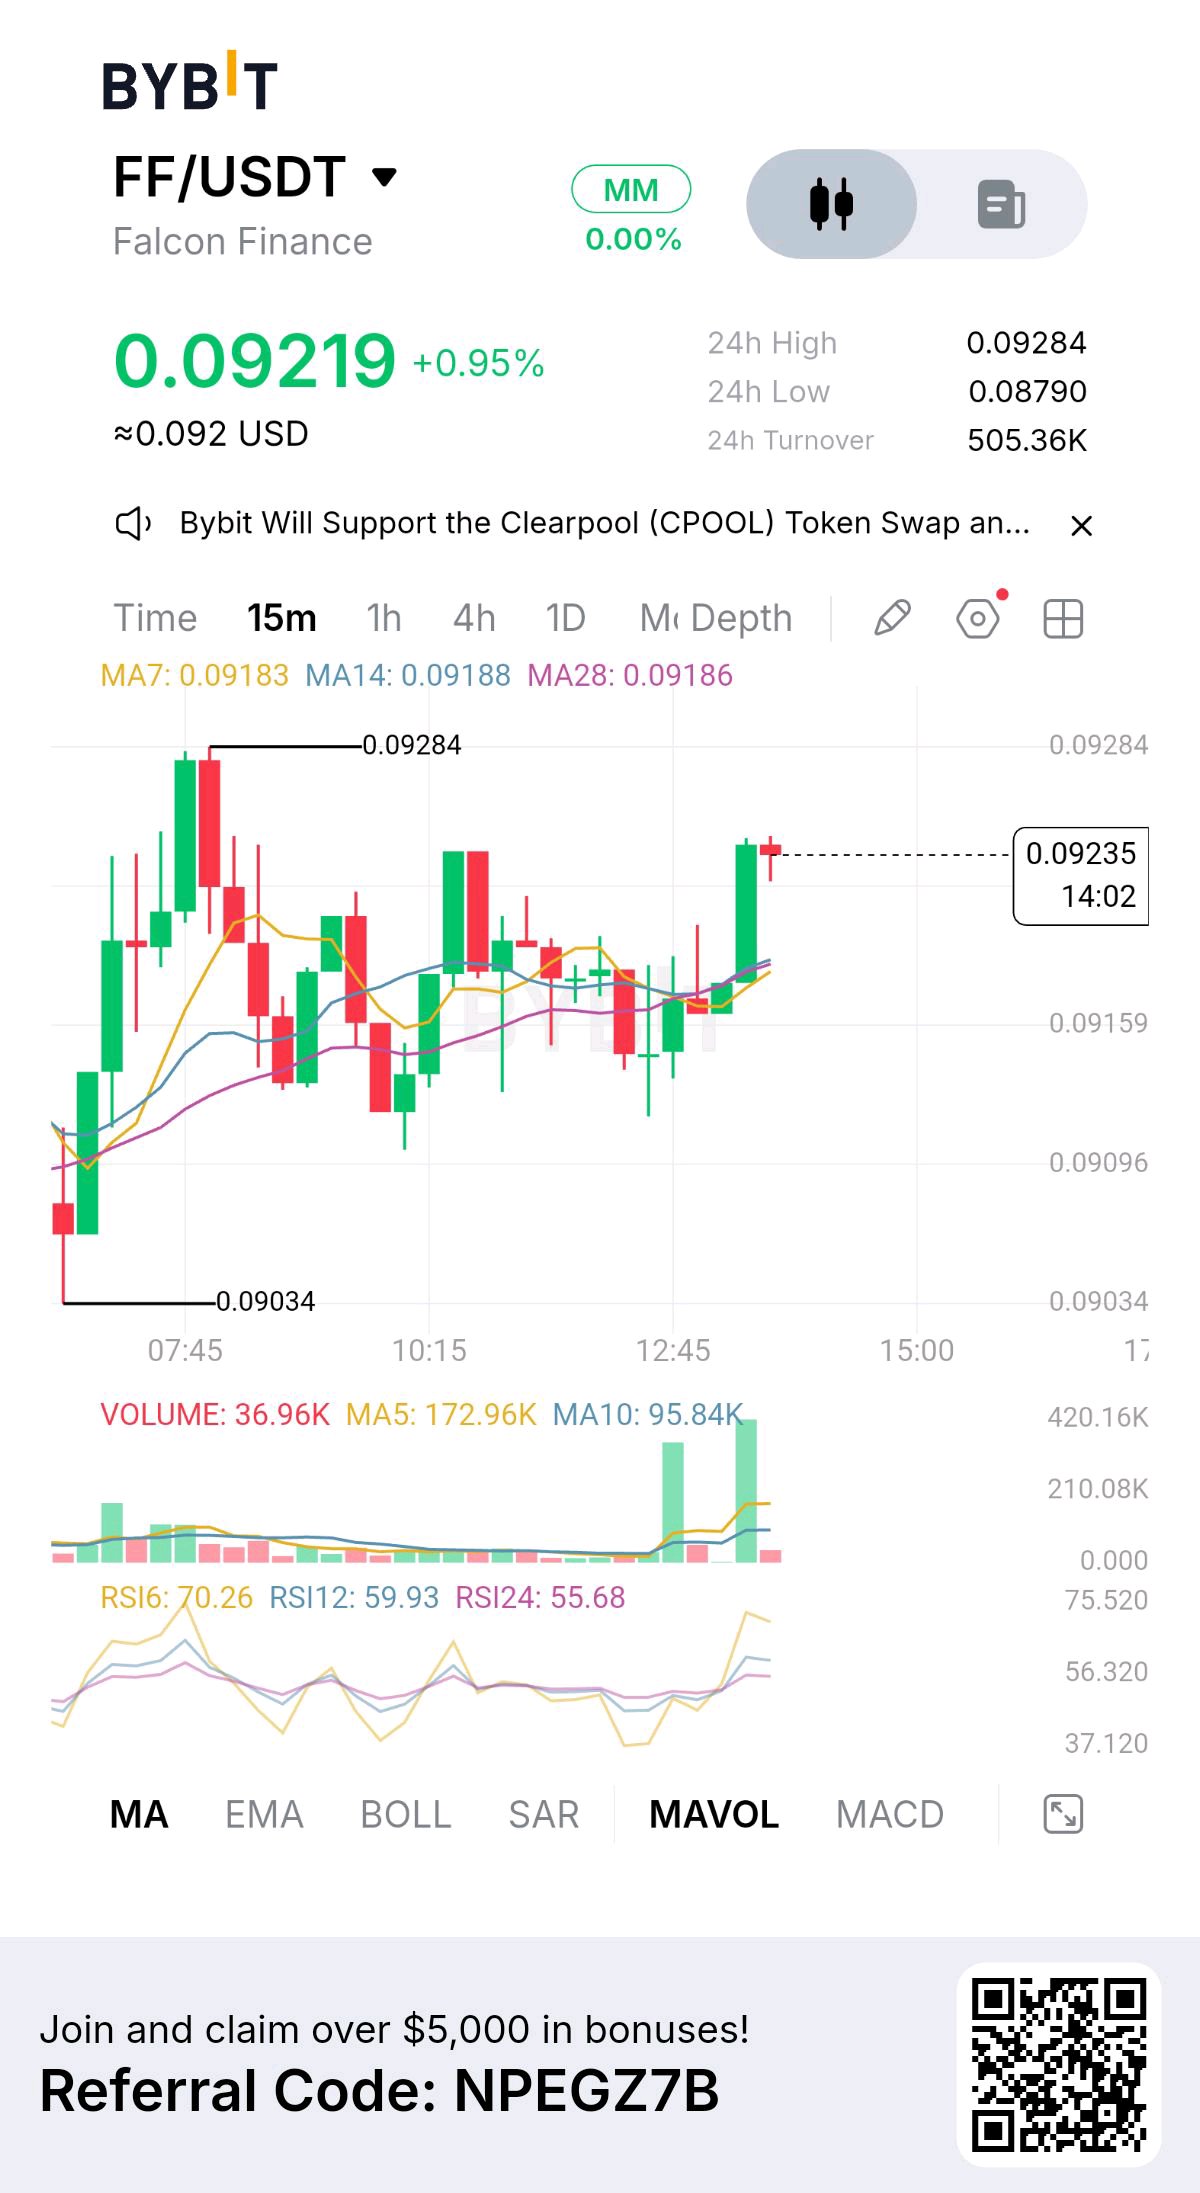
Falcon Finance is showing signs of recovery while much of the market remains under pressure. But I’m more interested in whether this move can survive the next token unlock than in the latest green candles. FF is trading around $0.0919, up approximately 2.3% over 24 hours and 7.2% over seven days. Price has moved from the $0.084 area toward the $0.093 resistance zone. That is encouraging, but FF remains more than 86% below its all-time high. The recovery is real; a broader trend reversal is not yet established. The fundamental story is more interesting than a simple price bounce. Falcon's USDf model uses collateral to create an overcollateralized synthetic dollar, while sUSDf provides exposure to yield strategies. Greater collateral adoption could strengthen the ecosystem, but token demand still needs to translate into measurable usage and value capture. The immediate concern is supply. Around 75 million FF tokens are scheduled to unlock on November 28, followed by another substantial release on November 29. Together, these releases could increase available supply by more than 200 million tokens. Unlocks do not guarantee selling, but they create a meaningful liquidity test for any ongoing recovery. Key figures $0.0919 — Current price snapshot $0.0878 — 24H support reference $0.0929 — 24H resistance $0.0840 — Seven-day lower range $0.325B — Market capitalization 3.55B — Circulating supply 10B — Maximum supply November 28–29 — Upcoming unlock window Bullish confirmation: A clean breakout above $0.093, followed by a successful retest, would strengthen the recovery case. Sustained buying could then open the way toward the $0.10 psychological level. Bearish confirmation: Rejection near $0.093 followed by a loss of $0.0878 would weaken the current structure. A break below $0.084 would suggest sellers are regaining control. Risk Management: Futures funding is positive, meaning longs are paying shorts. That shows a cost for bullish positioning, but it does not confirm excessive leverage by itself. I would avoid chasing the current recovery before resistance is reclaimed, especially with scheduled supply approaching. The real test for FF is not whether it can print another green candle. It is whether genuine demand can absorb new supply without losing the recovery structure. $FFUSDT #IMPACTbyTrade
INIT has recovered from its July lows, but the latest sell-off is testing whether that recovery has any real strength behind it. At approximately $0.1056, INIT is down 11.9% over seven days and remains more than 92% below its $1.442 all-time high. The recent 24H range is $0.09338–$0.1087. The $0.0934 area is the immediate support to defend, while $0.1087 is the first meaningful reclaim level. Until buyers recover that resistance, calling this a confirmed reversal would be premature. There is a fundamental reason the market remains cautious. Initia suffered a MoveVM security exploit on October 23, when an attacker extracted approximately $2.7M in assets. The team later announced that the network and rollups were operational again on November 2, with affected asset backing restored. That is meaningful progress, but restoring operations does not automatically restore investor confidence. Supply is another pressure point. The next scheduled INIT unlock is November 24. With only around 22% of the maximum supply currently circulating, future releases remain an important factor when assessing rallies. Key figures $0.1056 — Current price snapshot $0.09338 — 24H low $0.1087 — 24H high $23.47M — Market cap $29.05M — Futures open interest -5.70% — 24H OI change November 24 — Next scheduled unlock Bullish confirmation: Reclaim $0.1087 and hold above it. Stronger spot demand would make a recovery attempt more credible. Bearish confirmation: Lose $0.0934 and fail to recover it. That would leave the market vulnerable to another leg lower. Risk Management: Futures activity is unusually dominant, with reported futures volume around 19 times spot volume. Funding is also deeply negative in the latest aggregated snapshot. That can create short-squeeze potential, but it is not proof of a bottom. I would wait for price structure and spot participation to improve before treating a bounce as a trend reversal. INIT's next move depends on two things: whether buyers can rebuild confidence after the exploit, and whether demand can absorb upcoming supply. A green candle alone will not answer either question. $INITUSDT #IMPACTbyTrade
SPCXX is trading near $134.70, but the bigger question is whether buyers can defend this recovery before the next major supply event in SpaceX shares. Price is down approximately 3.6% over 24 hours, with a reported range of $134.61–$140.24. It remains roughly 40% below its $225.31 all-time high. The immediate battle is around $140.24; reclaiming that area would be the first sign that buyers are regaining control. On the downside, $134.60 is the near-term level to protect, while the wider seven-day range extends toward $133.30 and $148.17. The fundamental distinction is important. SPCXX is designed to represent SpaceX shares on a 1:1 backed basis through the xStocks structure. It provides economic exposure, not direct shareholder ownership. Unlike a typical crypto token, its supply mechanism is linked to the deposit and redemption of underlying shares. There is also a date worth watching: a reported SpaceX shareholder lock-up release is scheduled for December 8, potentially freeing up to 798 million underlying shares. That does not mean those shares will automatically be sold, but it creates a possible supply overhang for the underlying equity and deserves attention. Key figures $134.70 — Current price snapshot $140.24 — 24H resistance $134.61 — 24H low $133.30 — Wider weekly support reference $148.17 — Seven-day high $225.31 — All-time high $1.78M — Futures open interest -10.96% — 24H change in open interest Bullish confirmation: Reclaim $140.24 and hold above it with stronger spot participation. That would bring $148.17 back into focus. Bearish confirmation: Lose $134.60 and fail to reclaim it. That would expose the $133.30 area, with a deeper move potentially extending the correction. Risk Management: I would not treat a weekend price move as full confirmation while the underlying equity market is closed. Watch whether the token's move holds when traditional price discovery resumes. Open interest is also declining, suggesting positions are being reduced rather than a clear wave of fresh conviction entering. SPCXX offers continuous access to SpaceX-linked exposure, but 24/7 trading does not mean 24/7 confirmation from the underlying asset. The next meaningful signal is whether buyers can reclaim $140.24 and sustain it. $SPCXXUSDT #IMPACTbyTrade
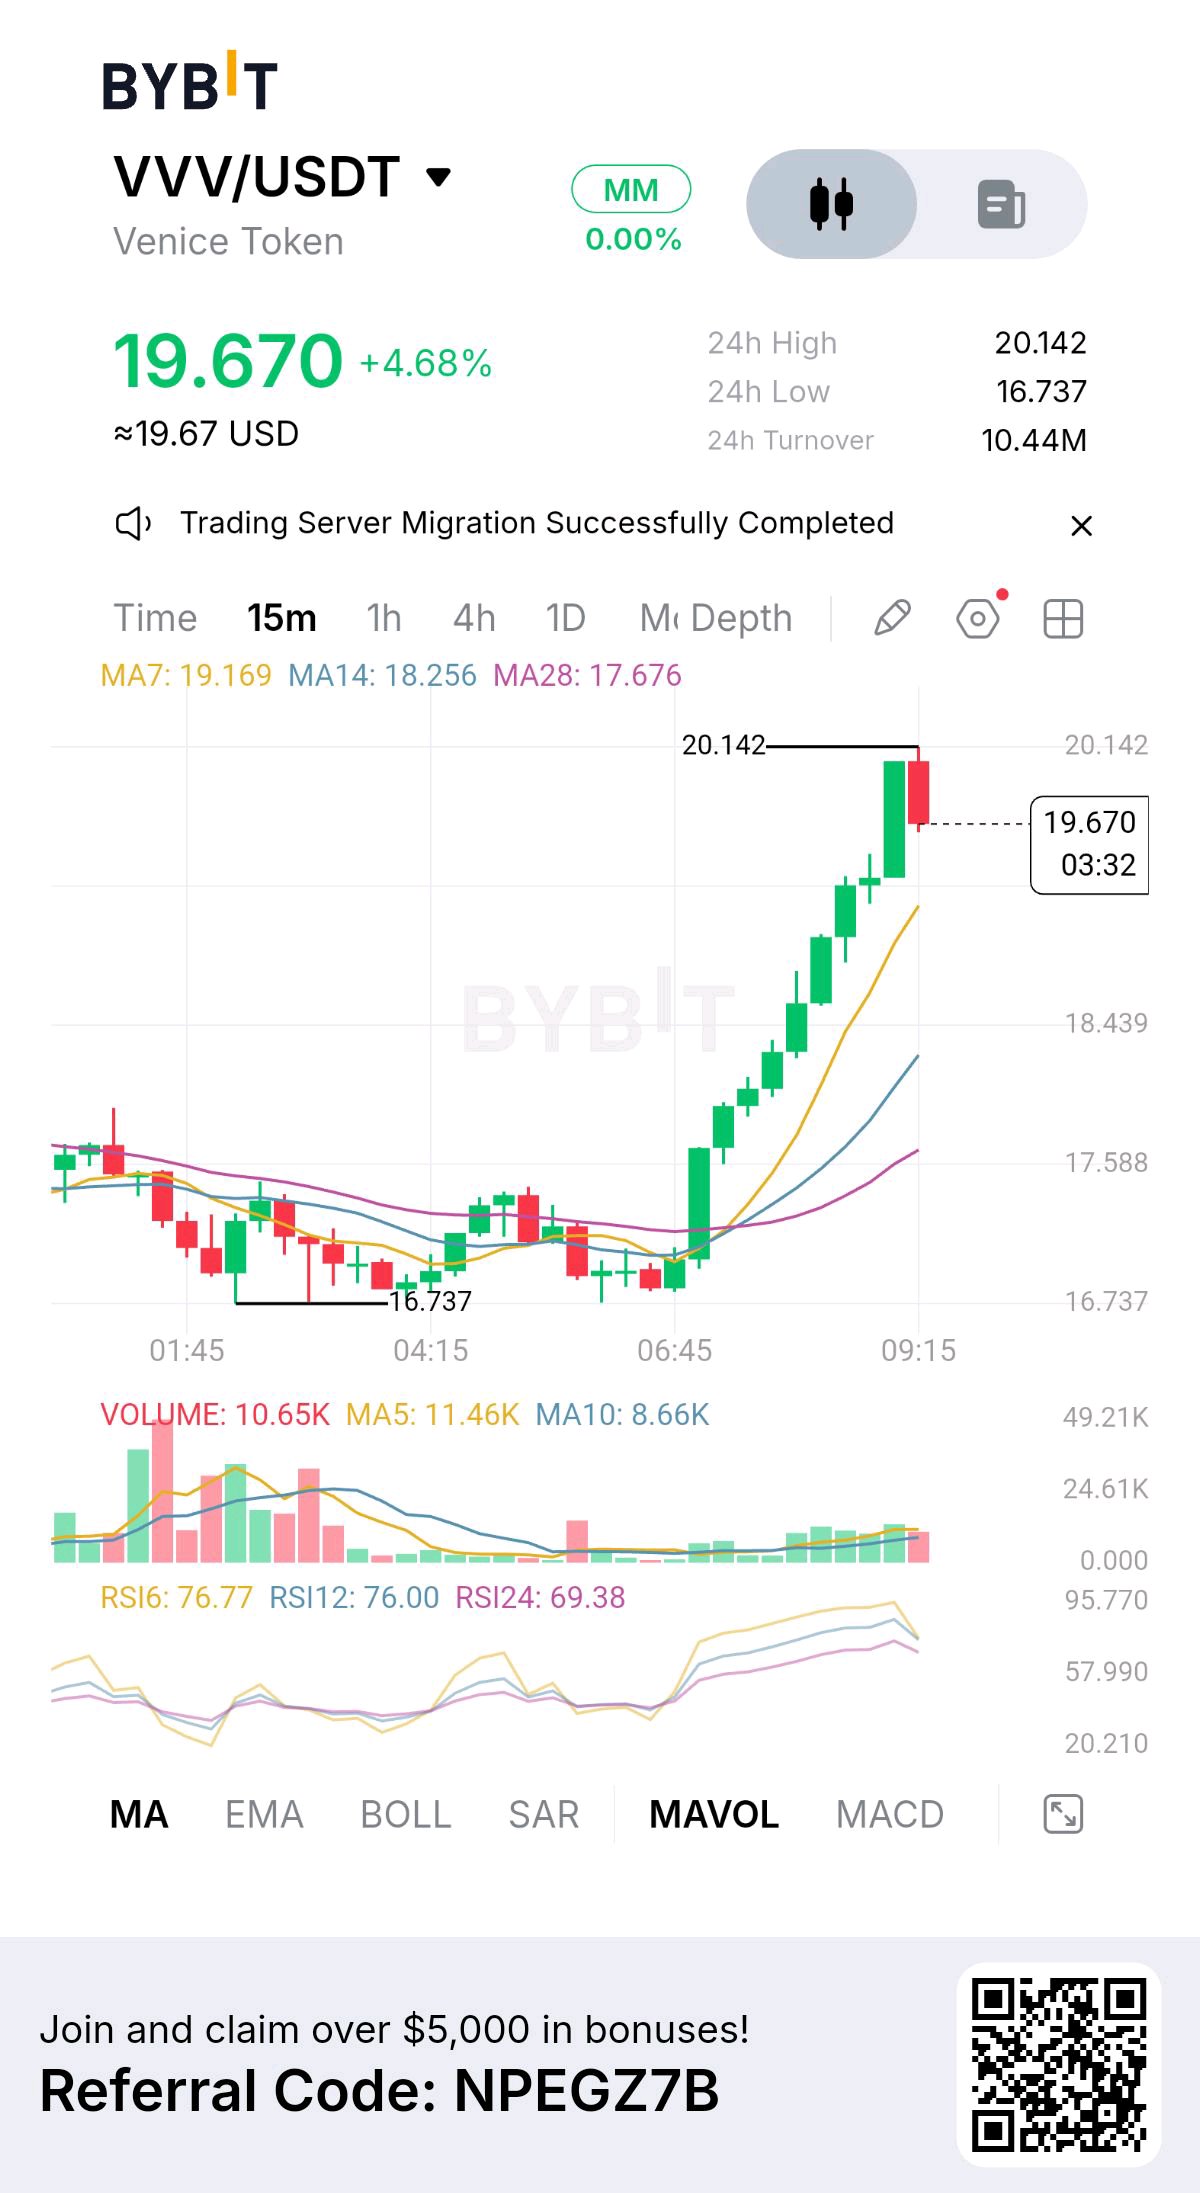
$VVVUSDT — Venice Token has lost nearly 50% from its September high, but something interesting is happening beneath the selling pressure. Short positioning is increasing while momentum approaches oversold territory. I'm watching whether this correction creates another opportunity or develops into a deeper breakdown. My daily chart shows VVV trading around $17.07, down approximately 10% over 24 hours and 15% over seven days. Price has fallen from its $34.51 September high, creating a clear sequence of lower highs. Daily RSI is around 33.4, while price remains below its 50-day and 200-day moving averages. The broader structure is bearish, but the current selling pressure deserves closer attention. The $15.73 Support Battle This is the most important downside reference on my chart. VVV recently tested approximately $15.73 before recovering toward $17.00. I want to see whether buyers can defend this area and establish a higher low. The first recovery obstacle is $17.44. Reclaiming this level would be an encouraging development, but $18.20 is the more important resistance. If buyers establish strength above it, the next recovery objective becomes $19.00, followed by the $20.00 psychological region. However, I won't assume that an oversold RSI automatically means the correction is finished. Something Interesting Is Happening in Derivatives VVV funding has turned negative near -0.0046% per four-hour period, meaning short positions are paying longs. Open interest has also declined approximately 7.39% over 24 hours to around $15.83 million. Meanwhile, short accounts represent approximately 56% of the tracked market positioning. This combination deserves attention. If buyers defend support and price begins recovering, short covering could provide additional momentum. But declining open interest can also indicate traders are simply closing positions. I need confirmation from price before treating this as a potential short squeeze. The Fundamental Story Behind Venice Venice is building private, censorship-resistant AI infrastructure, allowing users to access generative AI services with greater privacy. Its VVV token has an important role in the ecosystem through staking and access to platform resources. The interesting part is the connection between token staking and the platform's available inference capacity. Supply also deserves attention. Approximately 49 million VVV are circulating, and roughly 99.35% of the tracked allocation has been unlocked. There are no major cliff unlocks currently scheduled, although approximately 71,920 tokens continue entering circulation weekly through team vesting. Risk Management The $15.73 region is my immediate structural checkpoint. A sustained breakdown below it would seriously weaken the recovery argument and expose VVV to another leg lower. For the bullish scenario, I want buyers to defend support, reclaim $17.44, and establish strength above $18.20. Without a confirmed entry and protective stop, presenting an exact risk-to-reward ratio would be misleading. I'm interested in VVV because the combination of negative funding and oversold momentum could create an opportunity if buyers finally regain control. But the important distinction is between a short squeeze and a genuine trend reversal. The $20 target will remain secondary until Venice can prove something much more important: that buyers are willing to defend the $15.73 region and challenge the sequence of lower highs. That's the recovery I'm waiting to see. $VVVUSDT #IMPACTbyTrade
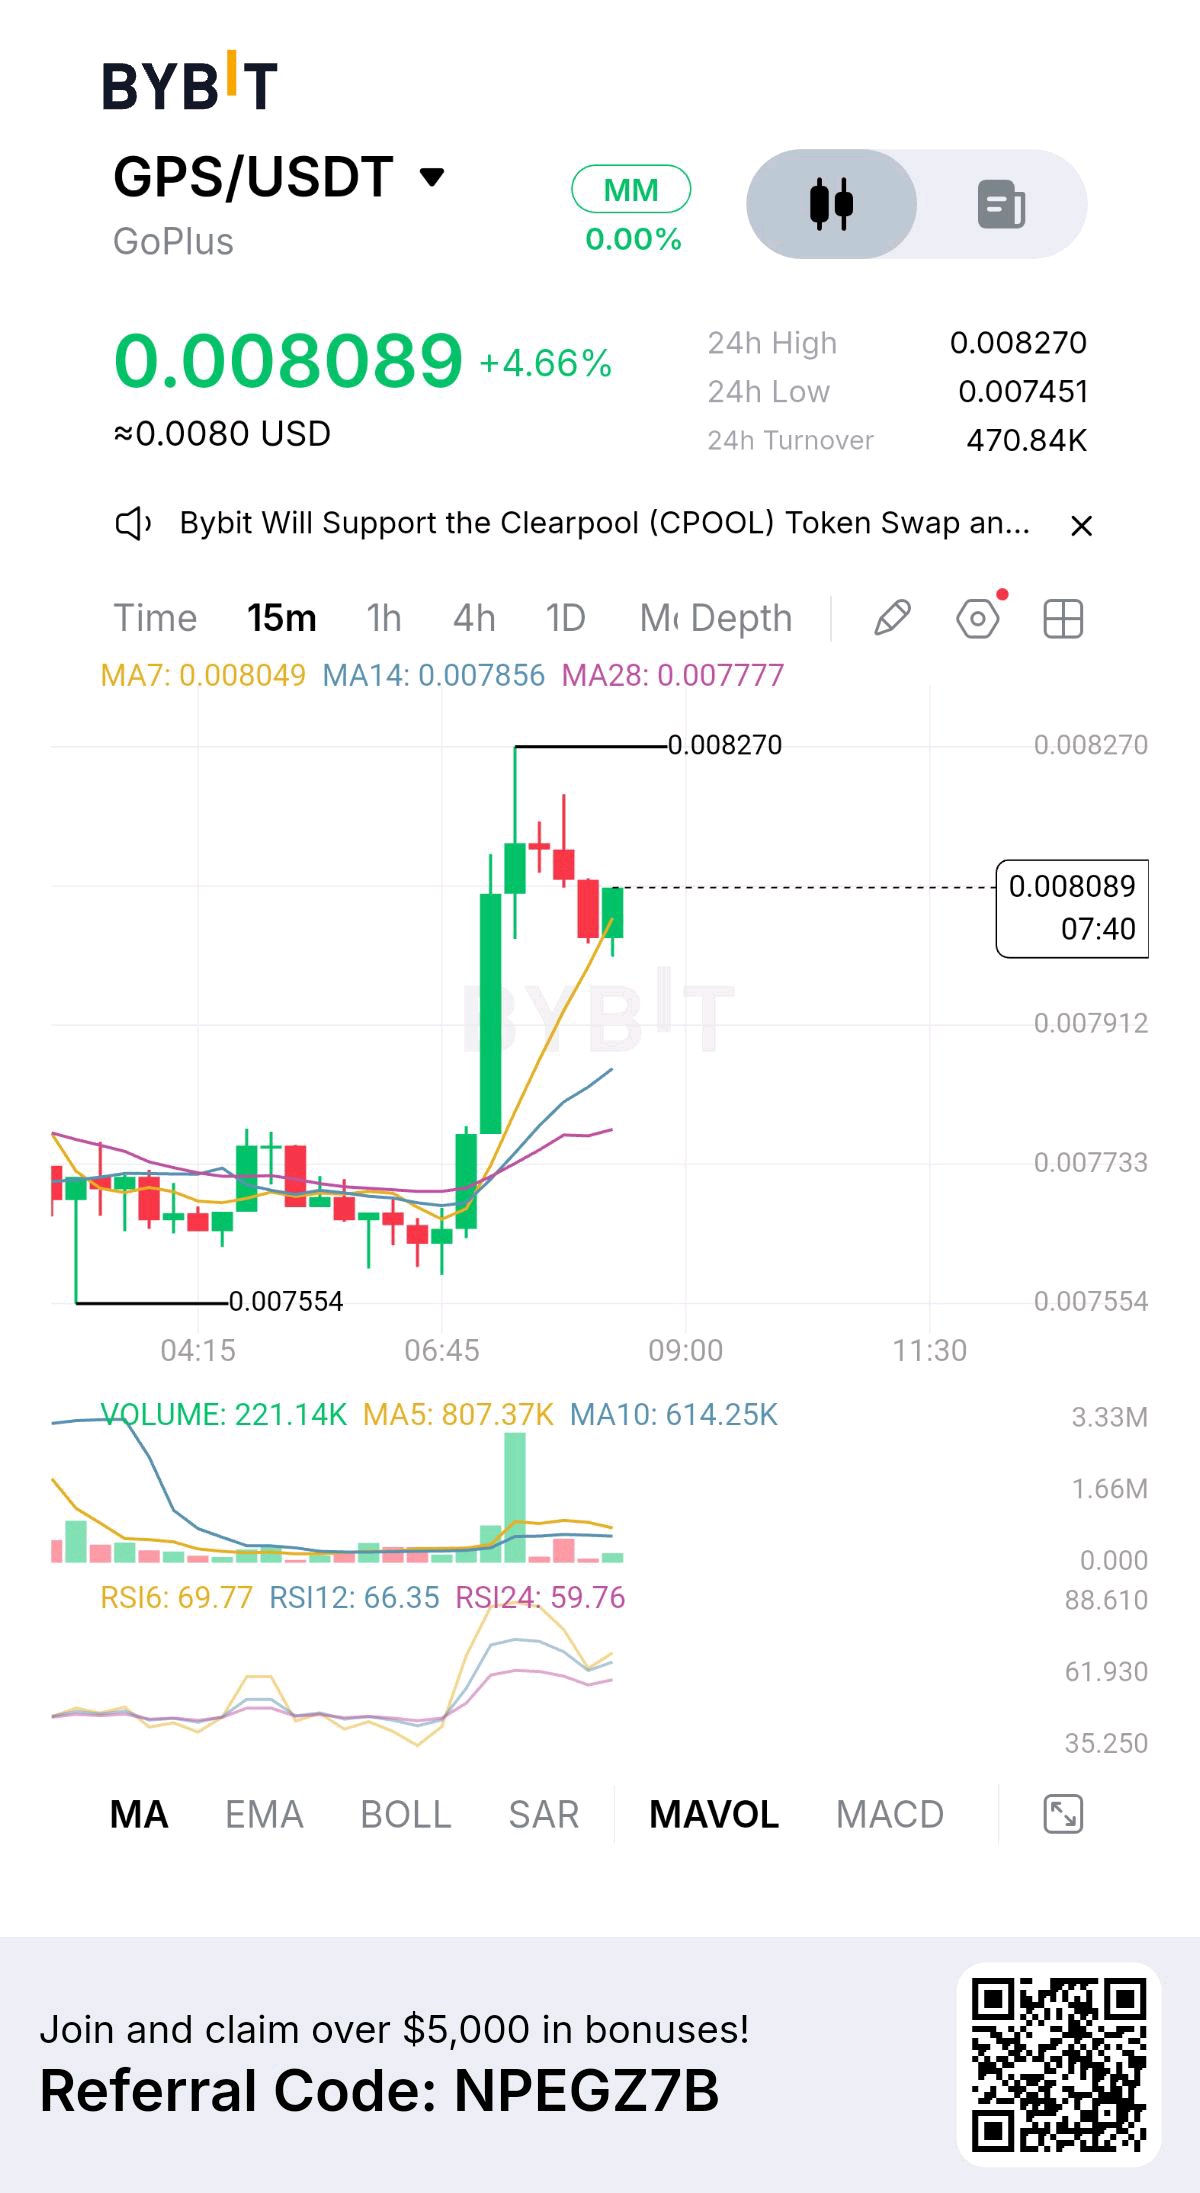
GPS is trying to stabilize, but the timing is uncomfortable: buyers are facing technical resistance just as a sizeable investor and insider unlock approaches. GoPlus Security is trading near $0.0077, down approximately 1–3.6% over 24 hours, depending on the market snapshot. Its recent daily range is around $0.007585–$0.008042, with the $0.0080 area acting as immediate resistance. The broader weekly performance remains slightly negative, and GPS is still more than 96% below its early-2025 peak near $0.22. The fundamental case is built around a problem that continues to grow with Web3: transaction security. GoPlus provides token-risk detection, malicious-address intelligence, phishing protection and transaction simulation APIs. Its security tools are integrated into external platforms, including DexScreener, while its official ecosystem is expanding into AI-agent security through products such as AgentGuard and DeepScan. The token's intended utility is more interesting than a simple governance narrative. GPS is designed for security-service payments, access to security intelligence, SafeToken services and staking by network contributors. However, the important distinction is adoption versus value capture. Current protocol tracking shows approximately $16.9K in fees over 30 days, with no reported direct revenue distributed to token holders. A growing security business does not automatically translate into equivalent buying pressure for GPS. The biggest near-term risk is supply. Approximately 5.86B GPS circulate against a 10B maximum supply. A reported 176.4M GPS unlock is scheduled for November 16, representing roughly 3% of current circulating supply. The allocation is attributed to private investors and insiders. Unlocking does not guarantee selling, but the market must absorb the additional available supply. Derivatives are also worth watching. Binance futures open interest is around $5.36M, with funding near +0.005% every four hours. Global long/short accounts are almost balanced, although top-trader positioning is considerably more long-heavy. This creates potential vulnerability if resistance rejects price. Key figures Price: ~$0.0077 Market cap: ~$45M 24H range: $0.007585–$0.008042 Circulating supply: ~5.86B GPS Maximum supply: 10B GPS 30D protocol fees: ~$16.9K Futures open interest: ~$5.36M Funding: +0.005% / 4H Next unlock: 176.4M GPS, November 16 Bullish confirmation: A sustained break above $0.00804, followed by stronger spot buying, would improve the recovery structure. Absorbing the unlock without a major price reaction would be an additional sign of demand. Bearish confirmation: Losing $0.007585 would weaken the current structure. If the unlock brings increased exchange deposits and selling pressure, GPS could revisit lower support zones. GoPlus is addressing a real infrastructure problem, and its security products give the project a credible use case. But the next few sessions will reveal whether market demand is strong enough to absorb new supply. I would rather see that confirmation than anticipate it. $GPSUSDT #IMPACTbyTrade
$BNBUSDT — BNB has fallen below $600, and I'm watching whether the current selloff is approaching exhaustion or preparing for another leg lower. The next support reaction could determine whether buyers finally regain control. My daily chart shows a strong bearish structure. BNB is trading around $580, down approximately 8% over 24 hours. Daily RSI is near 21, indicating deeply oversold conditions. Price is also trading below its major daily moving averages, while MACD remains negative. This is significant selling pressure, not an ordinary pullback. The $572 Support Battle This is the immediate level I want buyers to defend. BNB has approached this region following an aggressive decline, and a convincing reaction could create an opportunity for a short-term recovery. My first resistance is $600, followed by $615.60. However, $635.81 is the more important obstacle. A convincing daily close above that level would provide stronger evidence that buyers are regaining control. If the recovery develops, $646.99 and eventually $663 become the next upside references. On the downside, a sustained breakdown below $572.43 would expose $548.54, followed by the larger $523 region. The Fundamental Strength Behind BNB There's an important difference between BNB and many speculative altcoins. Its demand is connected to an established blockchain ecosystem. BNB powers transactions across BNB Smart Chain, opBNB and BNB Greenfield. It also serves as a governance asset and provides utility throughout the broader ecosystem. Another important development is the 37th quarterly BNB burn, completed on October 19. Approximately 1.646 million BNB were permanently removed, leaving around 131.51 million tokens in the remaining supply at that time. This continuing reduction in supply supports BNB's long-term scarcity mechanism. However, token burns cannot independently reverse aggressive market selling. What Derivatives Are Telling Me BNB futures open interest is approximately $338 million, down around 5.8% over 24 hours. Funding has moved close to zero, while approximately $6.2 million in positions have been liquidated, predominantly from long positions. This suggests leveraged exposure is being reduced as price falls. It could help remove excessive speculation, but it doesn't confirm that institutional or spot buyers have returned. Risk Management The $572.43 area is my immediate structural checkpoint. A sustained breakdown below it would seriously weaken the recovery argument and expose $548.54. For the bullish scenario, I want buyers to defend support, reclaim $600, and establish strength above $615.60 before considering a larger recovery toward $635.81. Without a confirmed entry and protective stop, assigning an exact risk-to-reward ratio would be misleading. I'm interested in BNB's longer-term fundamentals, particularly its established ecosystem and recurring token burns. But the current chart still belongs to sellers. The opportunity I'm watching isn't simply buying BNB because RSI is oversold. It's whether buyers can defend $572 and turn this aggressive correction into a genuine market structure recovery. Until that happens, patience matters more than chasing a bounce. $BNBUSDT #IMPACTbyTrade
$BTCUSDT — Bitcoin has lost the $67,000 region, and I'm watching whether the current selloff is approaching exhaustion or preparing for another leg lower. The next daily closes could determine the direction of the entire altcoin market. My daily chart shows a clearly bearish structure. BTC is trading around $64,443, down approximately 5.8% over 24 hours and 15.1% over seven days. Daily RSI is near 20, indicating deeply oversold conditions. Price has also fallen below its 200-week moving average, an important level that has historically attracted significant attention during major corrections. However, oversold conditions alone cannot confirm a market bottom. The $62,750 Support Battle This is my next important downside reference. Bitcoin has already lost the $66,450–$67,000 region, and buyers need to reclaim that area before I become more confident about a recovery. My first recovery resistance is $65,000, followed by $66,450. A convincing reclaim of $67,900, near the 200-week moving average, would provide stronger evidence that buyers are returning. Beyond that, $70,200 becomes the next important obstacle. If BTC establishes strength above this region, the larger $73,000–$75,000 resistance zone becomes a realistic recovery objective. But if sellers push below $62,750, the broader bearish structure could accelerate toward the $60,000 psychological region. The Institutional Demand Problem One development I won't overlook is the continued withdrawal of institutional capital. US spot Bitcoin ETFs recorded approximately $1.07 billion in weekly outflows, marking their second consecutive week with more than $1 billion in redemptions. Bitcoin has now experienced seven consecutive trading sessions of ETF outflows. This suggests institutional demand has weakened considerably during the correction. Derivatives positioning also deserves attention. Futures open interest has declined approximately 7.1% to $6.23 billion on the tracked market, while funding remains slightly positive around 0.003%. This combination suggests leveraged exposure is contracting, but the market hasn't completely removed its long-side positioning. Another support breakdown could therefore trigger additional liquidations. Risk Management The $62,750 region is my immediate downside checkpoint. A sustained breakdown below it would expose Bitcoin to the $60,000 area. For the bullish scenario, I want buyers to reclaim $65,000, recover $66,450, and establish strength above $67,900. Without a confirmed entry and protective stop, presenting an exact risk-to-reward ratio would be misleading. I'm interested in Bitcoin's recovery potential because daily RSI is deeply oversold and leveraged positions have already experienced substantial liquidation pressure. But I won't confuse selling exhaustion with a confirmed reversal. The most important question isn't whether Bitcoin can produce a relief bounce from these levels. It's whether buyers can recover the lost $67,000 region and turn it into support again. Until that happens, the larger trend remains under pressure, and protecting capital matters more than chasing an oversold recovery. $BTCUSDT #IMPACTbyTrade
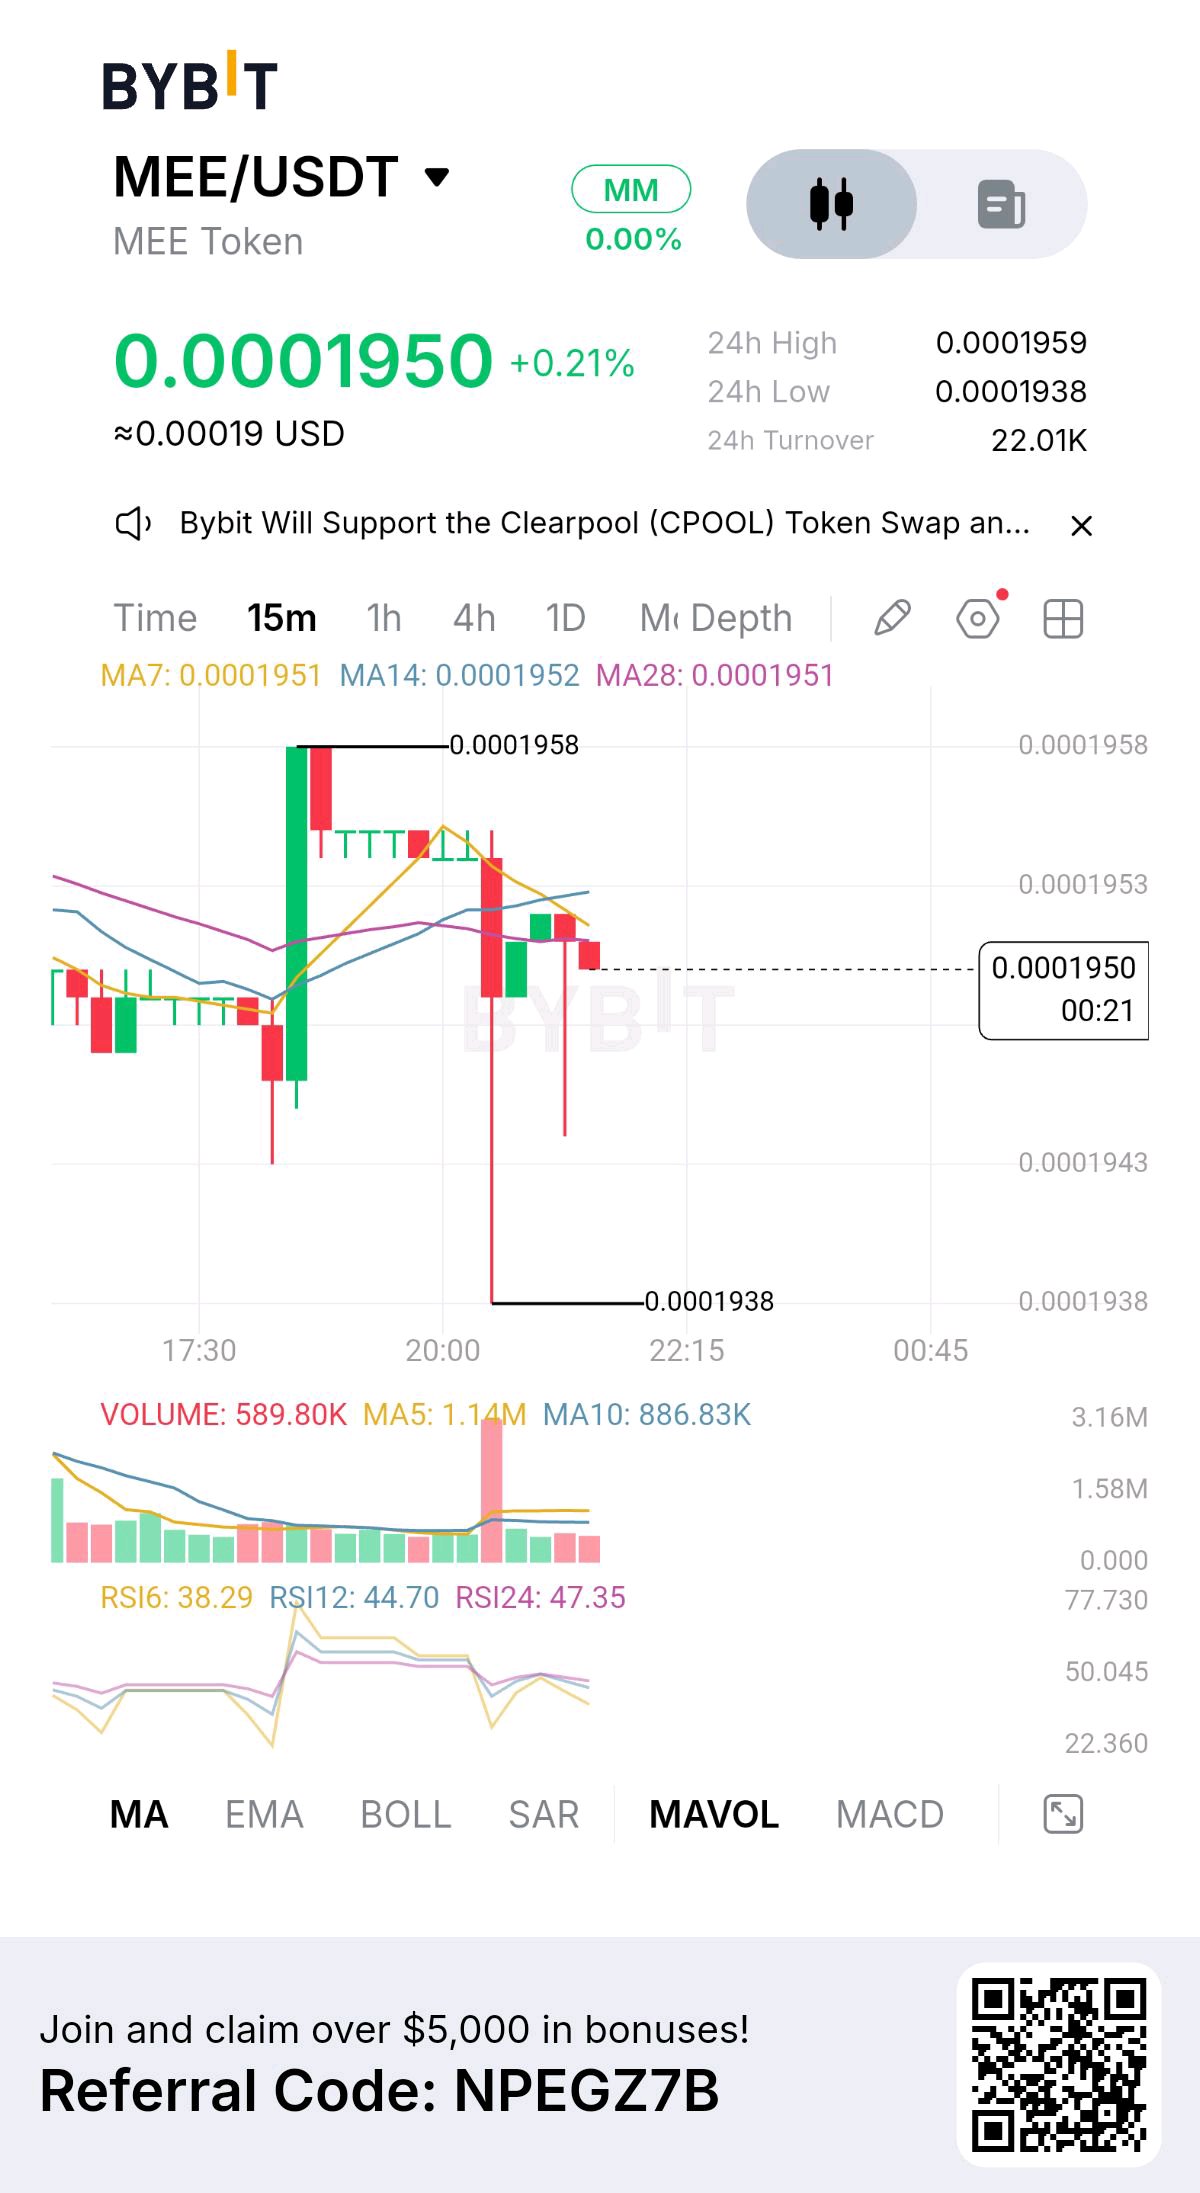
$MEEUSDT — MEE is showing early signs of stabilization after an extended decline, but there's one problem I won't ignore: the market is extremely thin, and even a relatively small amount of buying or selling can produce a disproportionate price move. My daily chart references show MEE trading around $0.000195, with approximately 0.1% movement over 24 hours and a 6.4% recovery over seven days. Price recently recovered from the $0.0001769 area toward $0.0002591 before giving back much of that move. That's important. Buyers have demonstrated some interest, but the rejection from the weekly high suggests that selling pressure remains present. The $0.000196 Resistance Battle The $0.0001960–$0.0001990 region is my immediate resistance area. Buyers need to overcome this range and establish acceptance above it before I become more confident about another recovery. Beyond that, $0.0002100 becomes an important psychological reference. A stronger breakout could open the way toward $0.0002300, followed by the recent $0.0002591 high. On the downside, $0.0001910 is the immediate support reference, followed by $0.0001830. The $0.0001769 weekly low is the more important level I want buyers to protect. The Medieval Empires Opportunity MEE has an interesting utility narrative through Medieval Empires, a blockchain-based multiplayer strategy game built around historical warfare, territorial expansion, and digital ownership. The token provides access to several in-game benefits, including VIP status, land-related opportunities, staking benefits, voting power, and selected game features. This creates a connection between token ownership and actual gameplay participation. However, the important question is whether the project can attract enough active players to generate sustainable demand for MEE. A gaming token needs more than an attractive concept. Player retention, in-game economic activity, and continued development will determine whether its utility becomes meaningful. The Supply and Liquidity Problem MEE has a maximum supply of 3 billion tokens, with approximately 559.4 million currently reported in circulation. That's only around 18.6% of maximum supply. An important distinction is that the published vesting schedule indicates that scheduled unlocks have finished, but a large portion of the total supply is still outside reported circulation. Unlocked supply and circulating supply are not necessarily the same thing. There's another concern. Reported 24-hour trading volume is only around $29,000, with market capitalization near $109,000. Order-book depth is also extremely limited. This means even a relatively small transaction can move the price significantly. I would treat MEE as a high-risk, low-liquidity opportunity rather than a normal trading setup. Risk Management The $0.0001910 area is my immediate support reference. Losing it would weaken the current stabilization attempt and expose the $0.0001830 region. For the bullish scenario, I want buyers to reclaim $0.0001990, establish a higher low, and eventually overcome $0.0002100. Without a confirmed entry and protective stop, assigning an exact risk-to-reward ratio would be misleading. Slippage and execution risk are particularly important with this level of liquidity. I'm interested in MEE's gaming utility, but I won't confuse a small weekly recovery with a confirmed bullish reversal. The real opportunity depends on two things: whether Medieval Empires can generate meaningful player demand and whether MEE can develop enough market liquidity to support a sustainable recovery. For now, the $0.0001769 low is the important downside reference, while $0.0001990 is the first hurdle buyers need to overcome. $MEEUSDT #IMPACTbyTrade
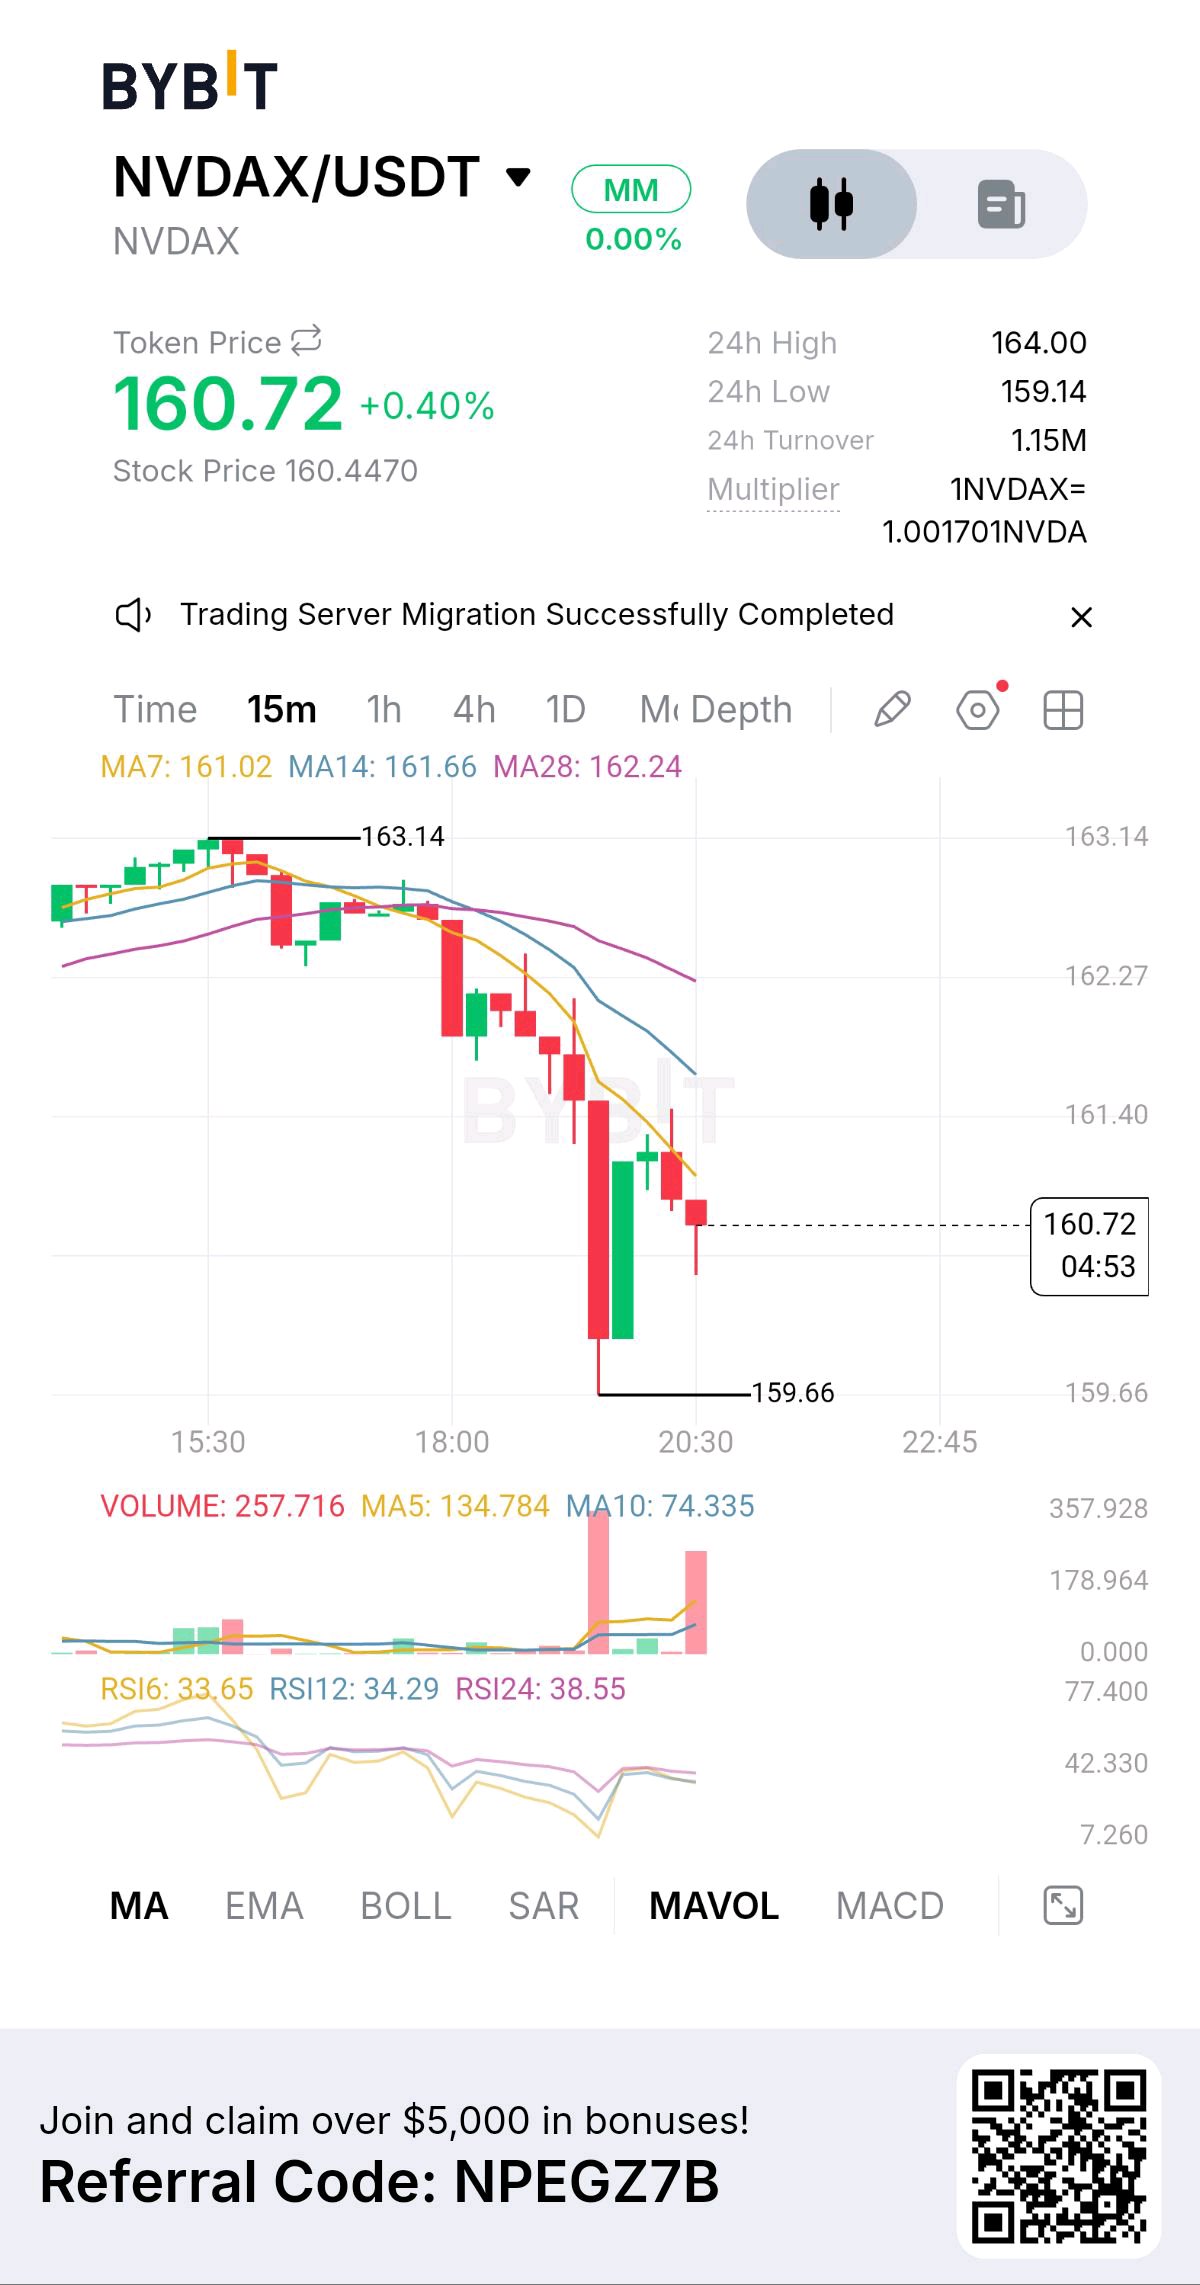
$NVDAXUSDT — NVIDIA's tokenized stock is approaching an important support area, but I'm watching something much bigger than a technical bounce: whether buyers can regain confidence ahead of the November 17 earnings announcement. My daily chart shows a clear deterioration in momentum. NVDAX is trading around $162, down approximately 3.2% over 24 hours and 13.9% over seven days. Price has fallen from its October all-time high of $242.89 and recently traded as low as $158.67. The current structure remains bearish, with sellers defending recovery attempts. This is no longer just a routine pullback. The $158.67 Support Battle This is the immediate level I want buyers to defend. A convincing reaction from this region, followed by a higher low, would give me an early reason to consider a recovery. My first resistance is $167.64. Reclaiming this level would be encouraging, but $171.80 is the more important obstacle. If buyers overcome that resistance and establish strength above it, the next recovery objectives become $174.50 and $178.33. However, losing $158.67 would seriously weaken the recovery argument. My next important downside references are $156.95 and $153.11. The Fundamental Development That Changed Everything There is an important company-specific development behind this weakness. On November 12, NVIDIA officially announced that Jensen Huang had resigned as CEO, with CFO Colette Kress appointed as interim CEO while the board searches for a permanent successor. This is a major leadership transition for one of the most important companies in the AI industry. The board has stated that operations, customer commitments, and the product roadmap are expected to continue without interruption. The next major catalyst is November 17, when NVIDIA reports its third-quarter fiscal 2027 results. Previously, the company guided for approximately $108 billion in quarterly revenue. I believe the earnings announcement and management commentary could become important catalysts for the next directional move. What Derivatives Are Telling Me NVDAX futures volume is approximately $7.64 million against $3.09 million in spot volume. Open interest stands near $3.89 million, while funding is unusually elevated around 0.1608%. This is something I won't ignore. Positive funding means long positions are paying shorts, and elevated funding increases the cost of maintaining leveraged exposure. Meanwhile, open interest has declined approximately 2.48% over 24 hours. Price weakness combined with contracting open interest suggests positions are being reduced rather than showing clear fresh accumulation. Risk Management The $158.67 region is my immediate structural checkpoint. A sustained breakdown below it would expose $156.95 and potentially $153.11. For the bullish scenario, I want buyers to defend support, reclaim $167.64, and establish strength above $171.80. Without a confirmed entry and protective stop, assigning an exact risk-to-reward ratio would be misleading. I'm interested in NVDAX's recovery potential, but there's an important distinction: this token provides economic exposure to NVIDIA shares through a tokenized tracker certificate. It isn't direct ownership of NVIDIA stock or shareholder voting rights. The November 17 earnings announcement could change market sentiment, but I won't anticipate the outcome. For me, the real opportunity depends on whether buyers can defend $158.67 and turn the current weakness into a genuine recovery before the next major company announcement. $NVDAXUSDT #IMPACTbyTrade
$XRPUSDT — XRP has fallen below $1 for the first time in months, but I'm watching whether this breakdown becomes another major leg lower or creates the conditions for a meaningful recovery. My daily chart shows a market under considerable selling pressure. XRP is trading around $0.99, down approximately 11% over seven days. The recent decline has broken the lower boundary of its multi-month descending triangle, leaving the $0.979–$0.985 region as the most important immediate support. Daily RSI is around 20–22, indicating deeply oversold momentum. However, price remains below its major moving averages, and MACD is still bearish. Sellers haven't lost control yet. The $0.985 Support Battle This is the level I don't want buyers to lose. XRP previously established support around this region in August, making the current retest particularly important. If buyers defend $0.979–$0.985 and reclaim $1.00, my first recovery objective becomes $1.065. Beyond that, $1.10–$1.12 is the next important resistance region. But I need to see more than an oversold bounce. A convincing daily close above $1.12 would provide stronger evidence that the breakdown is losing momentum. On the downside, a sustained weekly close below $0.979 would seriously weaken the recovery argument and expose XRP to the $0.90–$0.95 region. The larger downside reference is around $0.85. Why I'm Watching Institutional Demand The recent decline hasn't happened in isolation. Broader crypto weakness, hotter US inflation data, stronger rate expectations, and institutional ETF outflows have all contributed to the pressure. US spot XRP ETFs have also recorded consecutive sessions of withdrawals, including approximately $18 million in combined outflows across two recent sessions. There is another interesting development. Large XRP holders reportedly accumulated approximately 16.5 million XRP during the decline. This suggests some investors are absorbing available supply, but accumulation alone cannot reverse a bearish market. The difference between buying interest and an actual change in market structure is what matters now. Risk Management The $0.979–$0.985 region is my immediate structural checkpoint. A sustained breakdown below it would invalidate the near-term support argument and bring $0.90 into consideration. For the bullish scenario, I want buyers to defend this region, reclaim $1.00, and establish a higher low before challenging $1.065 and $1.12. Without a confirmed entry and protective stop, assigning an exact risk-to-reward ratio would be misleading. I'm interested in XRP's recovery potential because the current RSI readings show extreme selling pressure. But I won't confuse an oversold market with a confirmed bottom. The real opportunity isn't simply buying XRP below $1. It's whether buyers can defend the August support, absorb continued selling, and turn this breakdown into a genuine reversal. That is the evidence I need before becoming confident about a larger recovery. $XRPUSDT #IMPACTbyTrade