Smangoge
Suleiman Mohammed
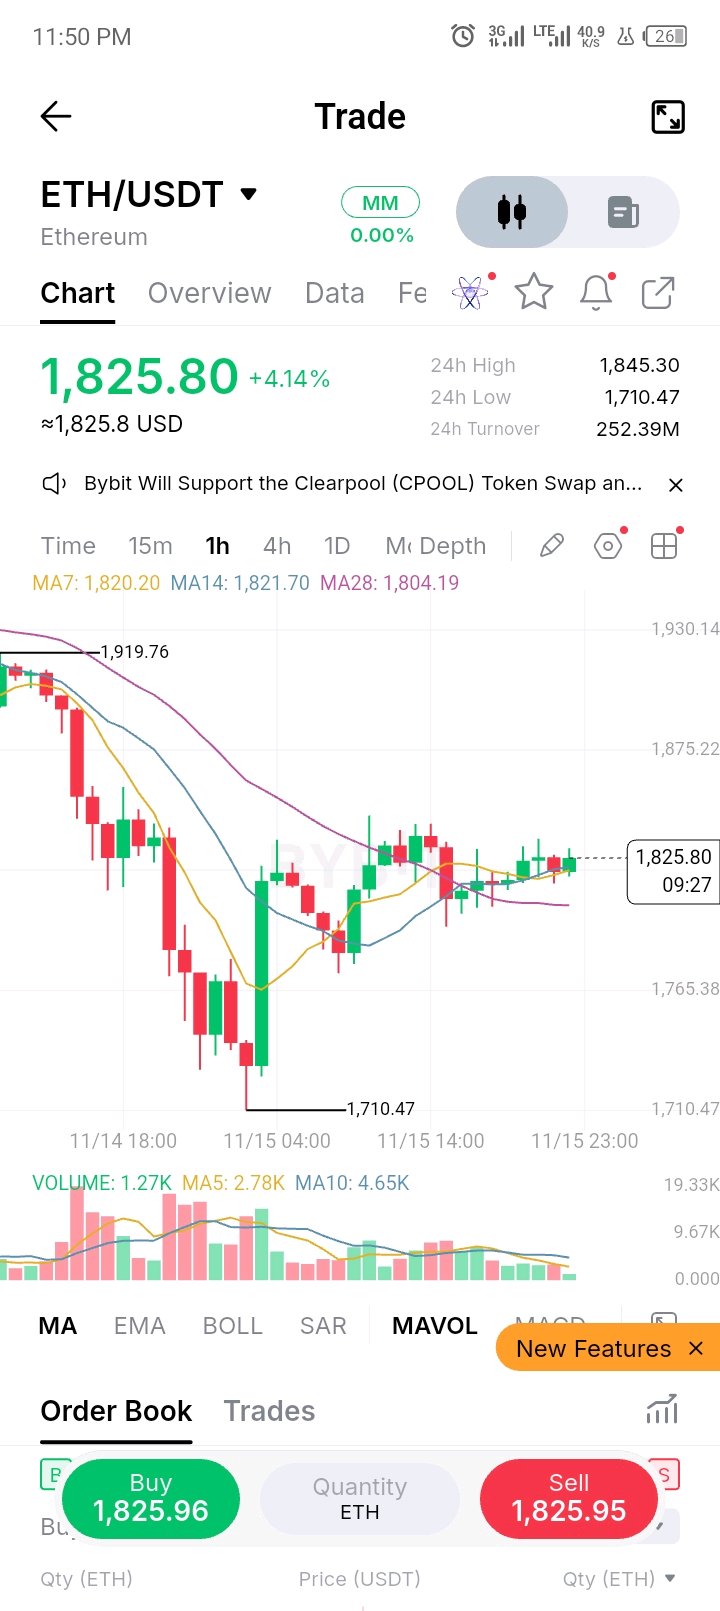
$ETHUSDT reclaimed all its MAs and bounced 6.7% off 1,710.47. Is the bottom in, or is 1,845.30 the trap? Context ETH is about 20% off the 2,271.33 high on this chart and has given back most of its run from 1,710.47. Price is 1,825.80 (+4.14%) after a low of 1,710.47, sitting 0.31% above the 7-day average: MA7 (1,820.20), with MA14 (1,821.70) and MA28 (1,804.19) below, all stacked in bullish order. It's late Sunday, and the 1h candle is about 30 minutes old. Turnover and volume 24h turnover is about 252.39M USDT, roughly 138K ETH, about 0.46x the 5-day average of 2.78K and 0.27x the 10-day (4.65K) on this 1h candle alone. The 5-day average is running below the 10-day, so volume has been shrinking into the bounce, and today's candle has already traded 1.27K. The flush came on real volume, which is how washouts tend to look, though it doesn't prove it's over. Momentum Price is above all three MAs and the MAs are starting to turn up. The last bounce was sold into 1,919.76, then price made a lower low at 1,710.47, then reclaimed 1,820.20. Momentum is turning, so I want a reaction before I act. A reclaim plus a hold sets up a bounce, but a bounce without a close above the wall is just a bounce. Support and resistance Support: 1,804.19 (MA28), about 1,820.20 (MA7), then 1,710.47 (24h low), not a proven level below. Resistance: 1,845.30 (24h high, now the wall), about 1,875.22 (next level), 1,919.76 (earlier high), then 2,271.33. Level to watch 1,804.19 - 1,820.20 is the floor, with the MAs as the line. A 1h close under 1,804.19 would open 1,765 and below. On the upside, 1,845.30 is the wall, where the 24h high meets the round number. Trade plan Bounce: buy 1,804 - 1,820 only on a reaction (a rejection wick or a 1h close holding above 1,820.20), stop under 1,795. Targets are 1,845.30 and 1,875.22, roughly 1.5R and 2.5R from 1,812. Continuation (short, or simply no longs): wait for a retest of 1,845.30 that gets rejected, stop above 1,855. Targets are 1,820.20 and 1,804.19, roughly 1.5R and 2.2R from 1,845. I'm not buying 1,825.80 in the middle of a +4.14% candle. The stop belongs under 1,804.19, and the first resistance at 1,845.30 is only about 19 above, so it pays under 1R. Risk note ETH ranged about 7.9% in the last 24 hours (1,710.47 to 1,845.30), weekend liquidity is thinner, and wicks can run through any level, so size matters more than entry. Oversold readings can stay oversold. MA levels are zones, not exact lines. Levels come from my own chart. Not financial advice. Is the bottom in, or is 1,845.30 the trap? The reaction at 1,845.30 will say. For education only, not financial advice. $ETHUSDT#ByXIMPACT
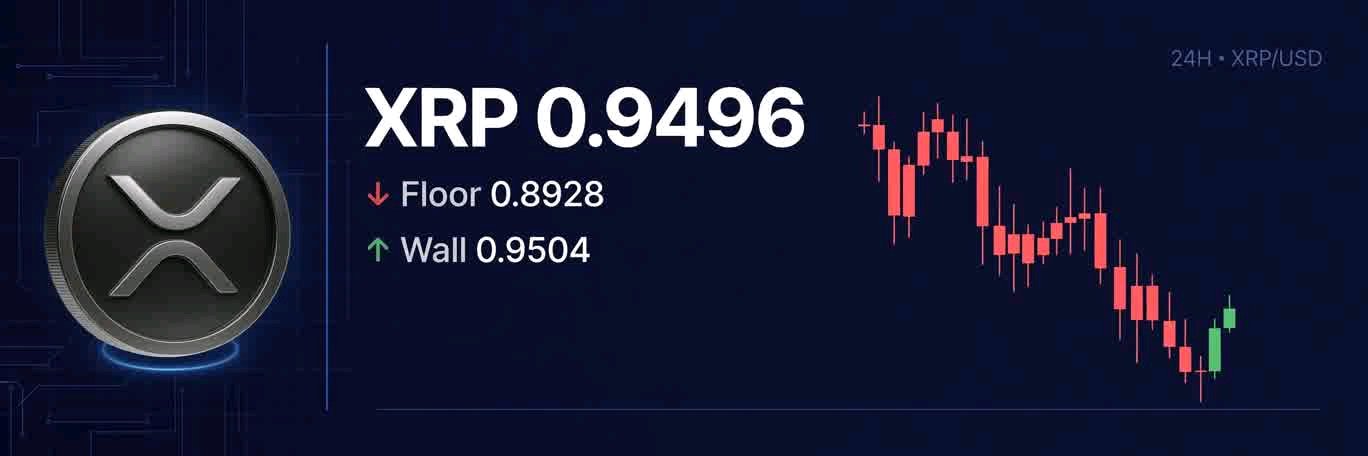
$XRPUSDT is sitting right on its MA7 at 0.9496. Is this the hold, or is 0.8928 next? Context XRP is about 15% off the 1.1168 high on this chart and has given back most of its run from 0.8928. Price is 0.9496 (+0.22%) after a low of 0.8928, sitting 0.08% below the 7-day average: MA7 (0.9504), with MA14 (0.9751) and MA28 (1.0086) above, all stacked in bearish order. It's a Sunday, and the 4h candle is about 2 hours old. Turnover and volume 24h turnover is about 47.09M USDT, roughly 49.5M XRP, about 0.30x the 5-day average of 6.04M and 0.24x the 10-day (7.55M) on this 4h candle alone. The 5-day average is running below the 10-day, so volume has been shrinking into the decline, and today's candle has already traded 1.84M in its first hours. The flush came on real volume, which is how washouts tend to look, though it doesn't prove it's over. Momentum Price is just under MA7 and below MA14 and MA28, and the MAs are fanned out pointing down. The last bounce was sold into 0.9794, then price made a lower low at 0.8928. Momentum is still falling, so I want a reaction before I act. Oversold plus a volume flush sets up a bounce, but a bounce without a close above the wall is just a bounce. Support and resistance Support: 0.8928 (24h low), about 0.89 (round number), then 0.85, not a proven level. Resistance: 0.9504 (MA7, now flipped), about 0.9751 (MA14), 0.9794 (24h high), 1.0086 (MA28), then 1.1168 (earlier high). Level to watch 0.8928 - 0.91 is the floor, with today's low as the line. A 4h close under 0.8928 would open 0.85 and below. On the upside, 0.9504 - 0.9751 is the wall, where the flipped MA7, the MA14 and the 24h high meet. Trade plan Bounce: buy 0.8928 - 0.91 only on a reaction (a rejection wick or a 4h close back above 0.9504), stop under 0.885. Targets are 0.9751 and 0.9794, roughly 1.5R and 1.6R from 0.90. Continuation (short, or simply no longs): wait for a retest of 0.9504 - 0.9751 that gets rejected, stop above 0.985. Targets are 0.91 and 0.8928, roughly 1.8R and 2.5R from 0.962. I'm not buying 0.9496 in the middle of a +0.22% candle. The stop belongs under 0.8928, and the first resistance at 0.9504 is only about 0.0008 above, so it pays under 1R. Risk note XRP ranged about 9.7% in the last 24 hours (0.8928 to 0.9794), weekend liquidity is thinner, and wicks can run through any level, so size matters more than entry. Oversold readings can stay oversold. MA levels are zones, not exact lines. Levels come from my own chart. Not financial advice. Is the washout done, or is 0.85 next? The reaction at 0.9504 will say. For education only, not financial advice.$XRPUSDT#ByXIMPACT
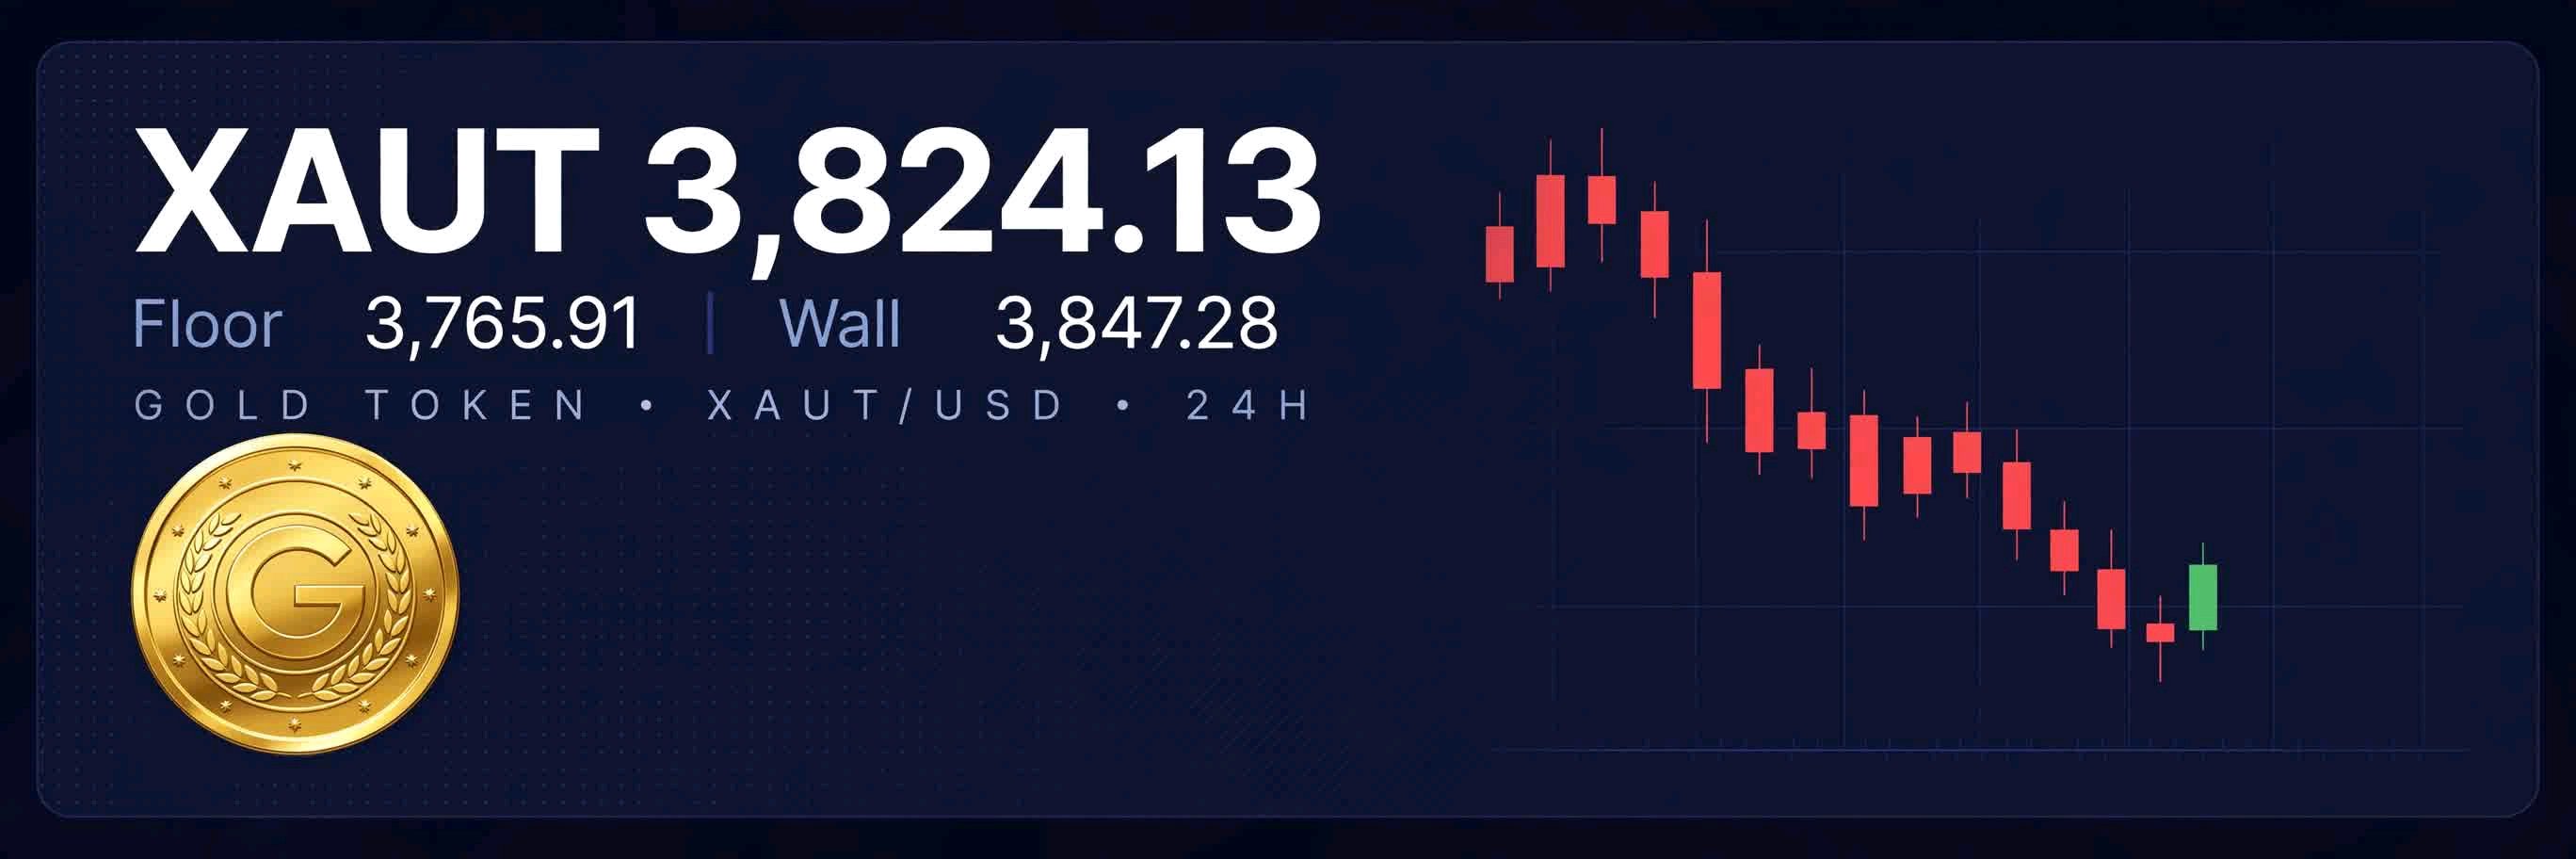
$XAUTUSDT is sitting right on its MA7 at 3,824.13. Is this the hold, or is 3,765.91 next? Context XAUT is about 7.4% off the 4,130.11 high on this chart and has given back most of its run from 3,765.91. Price is 3,824.13 (-1.05%) after a low of 3,765.91, sitting 0.01% above the 7-day average: MA7 (3,823.68), with MA14 (3,847.28) and MA28 (3,901.76) above, all stacked in bearish order. It's a Sunday, and the 4h candle is about 2 hours old. Turnover and volume 24h turnover is about 13.04M USDT, roughly 3,410 XAUT, about 0.11x the 5-day average of 472.865 and 0.12x the 10-day (411.342) on this 4h candle alone. The 5-day average is running above the 10-day, so volume has been expanding into the decline, and today's candle has already traded 50.568 in its first hours. The flush came on real volume, which is how washouts tend to look, though it doesn't prove it's over. Momentum Price is on MA7 but below MA14 and MA28, and the MAs are fanned out pointing down. The last bounce was sold into 3,866.49, then price made a lower low at 3,765.91. Momentum is still falling, so I want a reaction before I act. Oversold plus a volume flush sets up a bounce, but a bounce without a close above the wall is just a bounce. Support and resistance Support: 3,765.91 (24h low), about 3,750 (round number), then 3,700, not a proven level. Resistance: 3,847.28 (MA14, now flipped), about 3,866.49 (24h high), 3,901.76 (MA28), then 4,130.11 (earlier high). Level to watch 3,765.91 - 3,790 is the floor, with today's low as the line. A 4h close under 3,765.91 would open 3,750 and below. On the upside, 3,847.28 - 3,866.49 is the wall, where the flipped MA14 and the 24h high meet. Trade plan Bounce: buy 3,765 - 3,790 only on a reaction (a rejection wick or a 4h close back above 3,847.28), stop under 3,750. Targets are 3,866.49 and 3,901.76, roughly 1.5R and 2.5R from 3,780. Continuation (short, or simply no longs): wait for a retest of 3,847.28 - 3,866.49 that gets rejected, stop above 3,870. Targets are 3,790 and 3,765.91, roughly 1.8R and 2.5R from 3,855. I'm not buying 3,824.13 in the middle of an -1.05% candle. The stop belongs under 3,765.91, and the first resistance at 3,847.28 is only about 23 above, so it pays under 1R. Risk note XAUT ranged about 2.7% in the last 24 hours (3,765.91 to 3,866.49), weekend liquidity is thinner, and wicks can run through any level, so size matters more than entry. Oversold readings can stay oversold. MA levels are zones, not exact lines. Levels come from my own chart. Not financial advice. Is the washout done, or is 3,750 next? The reaction at 3,847.28 will say. For education only, not financial advice.#ByXIMPACT
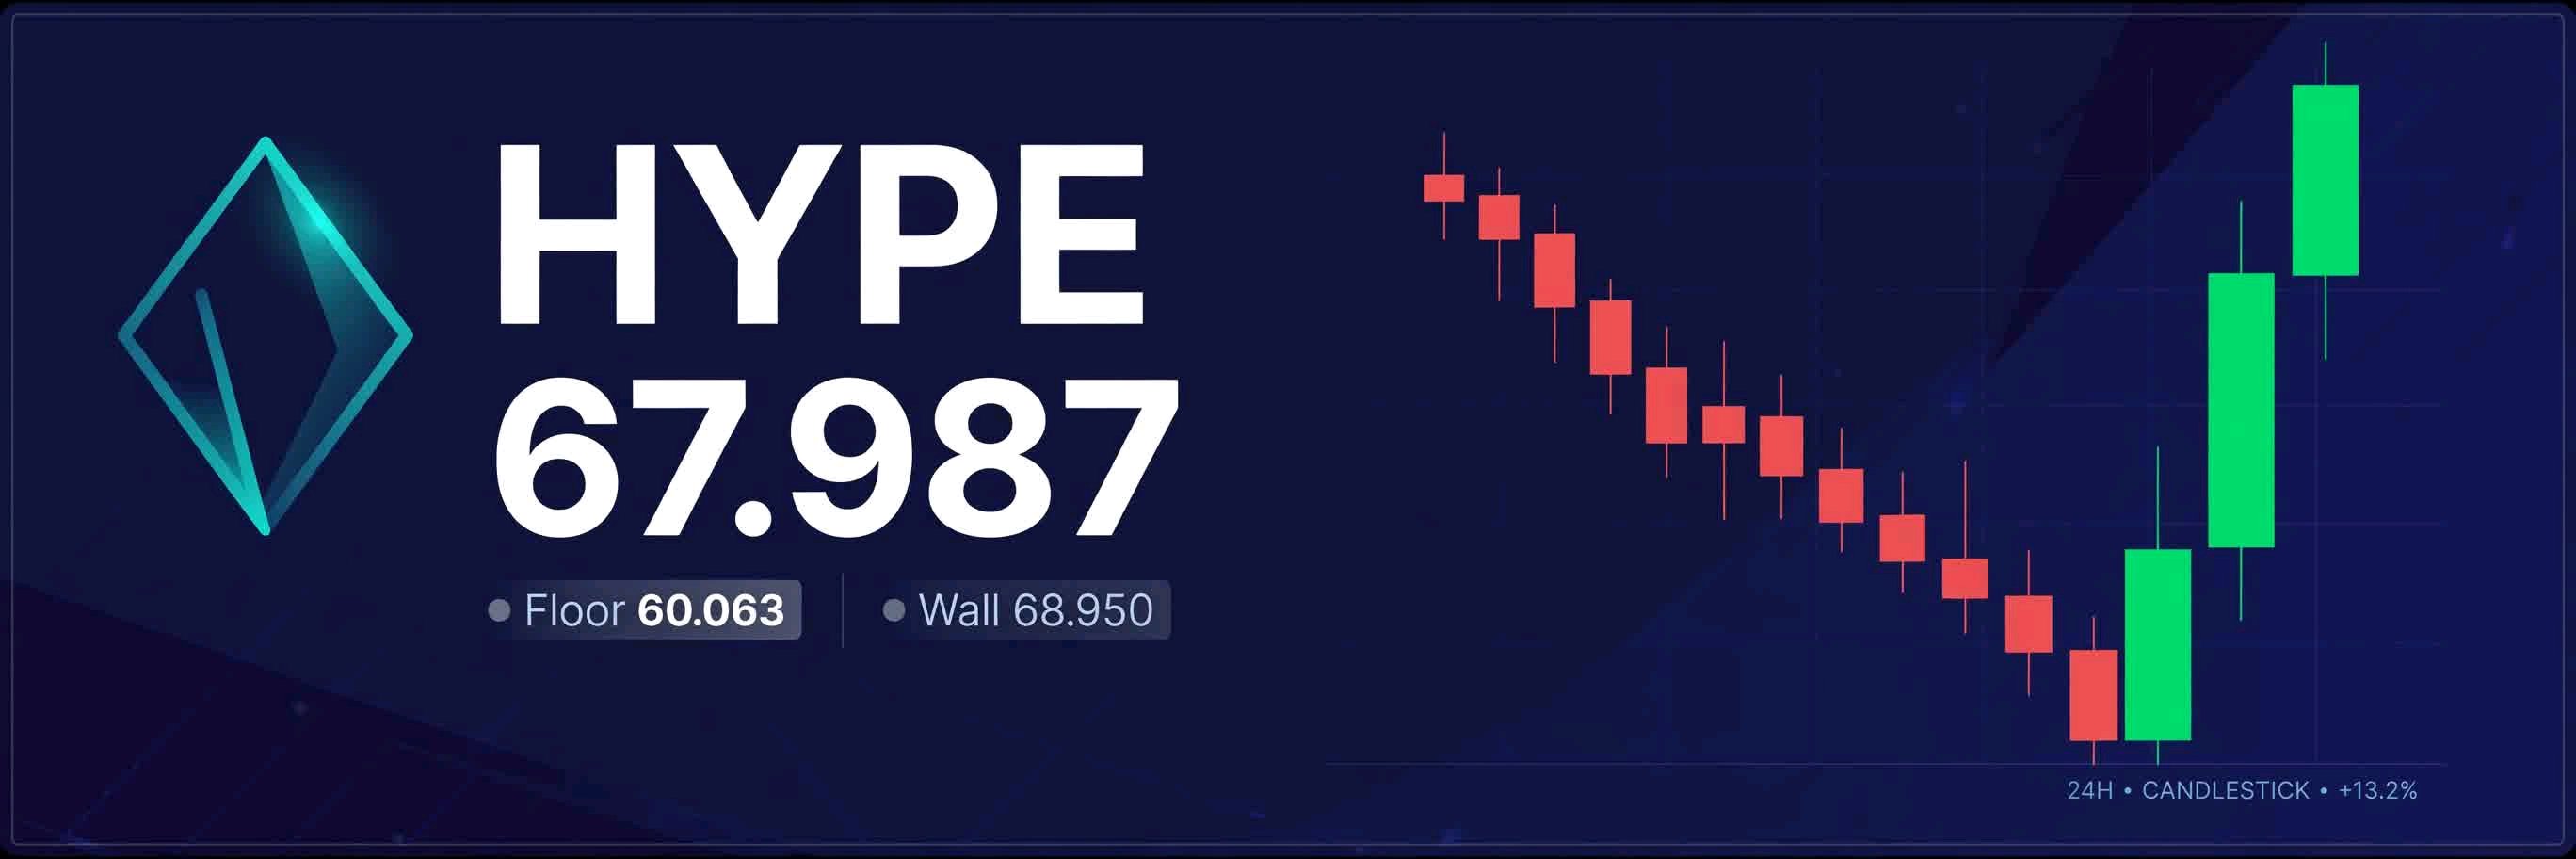
$HYPEUSDT reclaimed 66.478 and bounced 13.2% off 60.063. Is the bottom in, or is 68.950 the trap? Context HYPE is 11.4% off the 76.763 high on this chart. Price is 67.987 (-1.66%) after a low of 60.063, sitting 2.3% above MA7 (66.478), but still under MA14 (68.950) and MA28 (70.502). That means the bounce is back above the first average, but the wall is still above. I am not chasing this green candle. My method is simple: no break = no trade. I wait for retest + 4H close confirmation. Turnover and volume 24h turnover is about 89.21M USDT. Today's 4h candle has already traded 133.52K, vs MA5 225.22K and MA10 167.33K. Volume expanded into the flush — that's a washout signature — but the bounce candle has not yet closed above the wall with volume. No close, no trade. Momentum Price is above MA7 but below MA14/MA28. The last bounce was sold into 69.193, then price made a lower low at 60.063. Until we get a 4H close above 68.950, momentum is still down. A bounce without a close is just a bounce. Support and resistance Support: 60.063 (24h low), about 60.00 (round number), then 58.00, not proven. Resistance: 68.950 (MA14, now the wall), about 69.193 (24h high), 70.502 (MA28), then 76.763. Level to watch 60.063 - 62.00 is the floor. A 4H close under 60.063 opens 58.00. On the upside, 68.950 - 69.193 is the wall. That is the retest zone I am waiting for. Trade plan — RoYoK method I do NOT buy 67.987 in the middle. Plan A — Long on confirmation: Let price retest 66.478 - 67.987, then get a 4H close back above 68.950 with volume at or above average. Entry ∼69.10. Stop under 66.478. Targets: 70.502 and 76.763. Plan B — No trade: If price retests 68.950 - 69.193 and gets rejected with a 4H close back under 68.950, I stay out. No break = no trade. Next level down is 60.063. Plan C — Short on rejection only: Only after rejection + 4H close under 68.950, stop above 69.50, targets 66.478 and 60.063. Risk note HYPE ranged 15.2% in 24h (60.063 to 69.193), weekend liquidity is thinner, wicks can run through any level, so size matters more than entry. MA levels are zones, not exact lines. Levels come from my own chart. Not financial advice. Are you chasing the green candle, or waiting for the retest + 4H close like me? For education only, not financial advice. $HYPEUSDT#ByXIMPACT
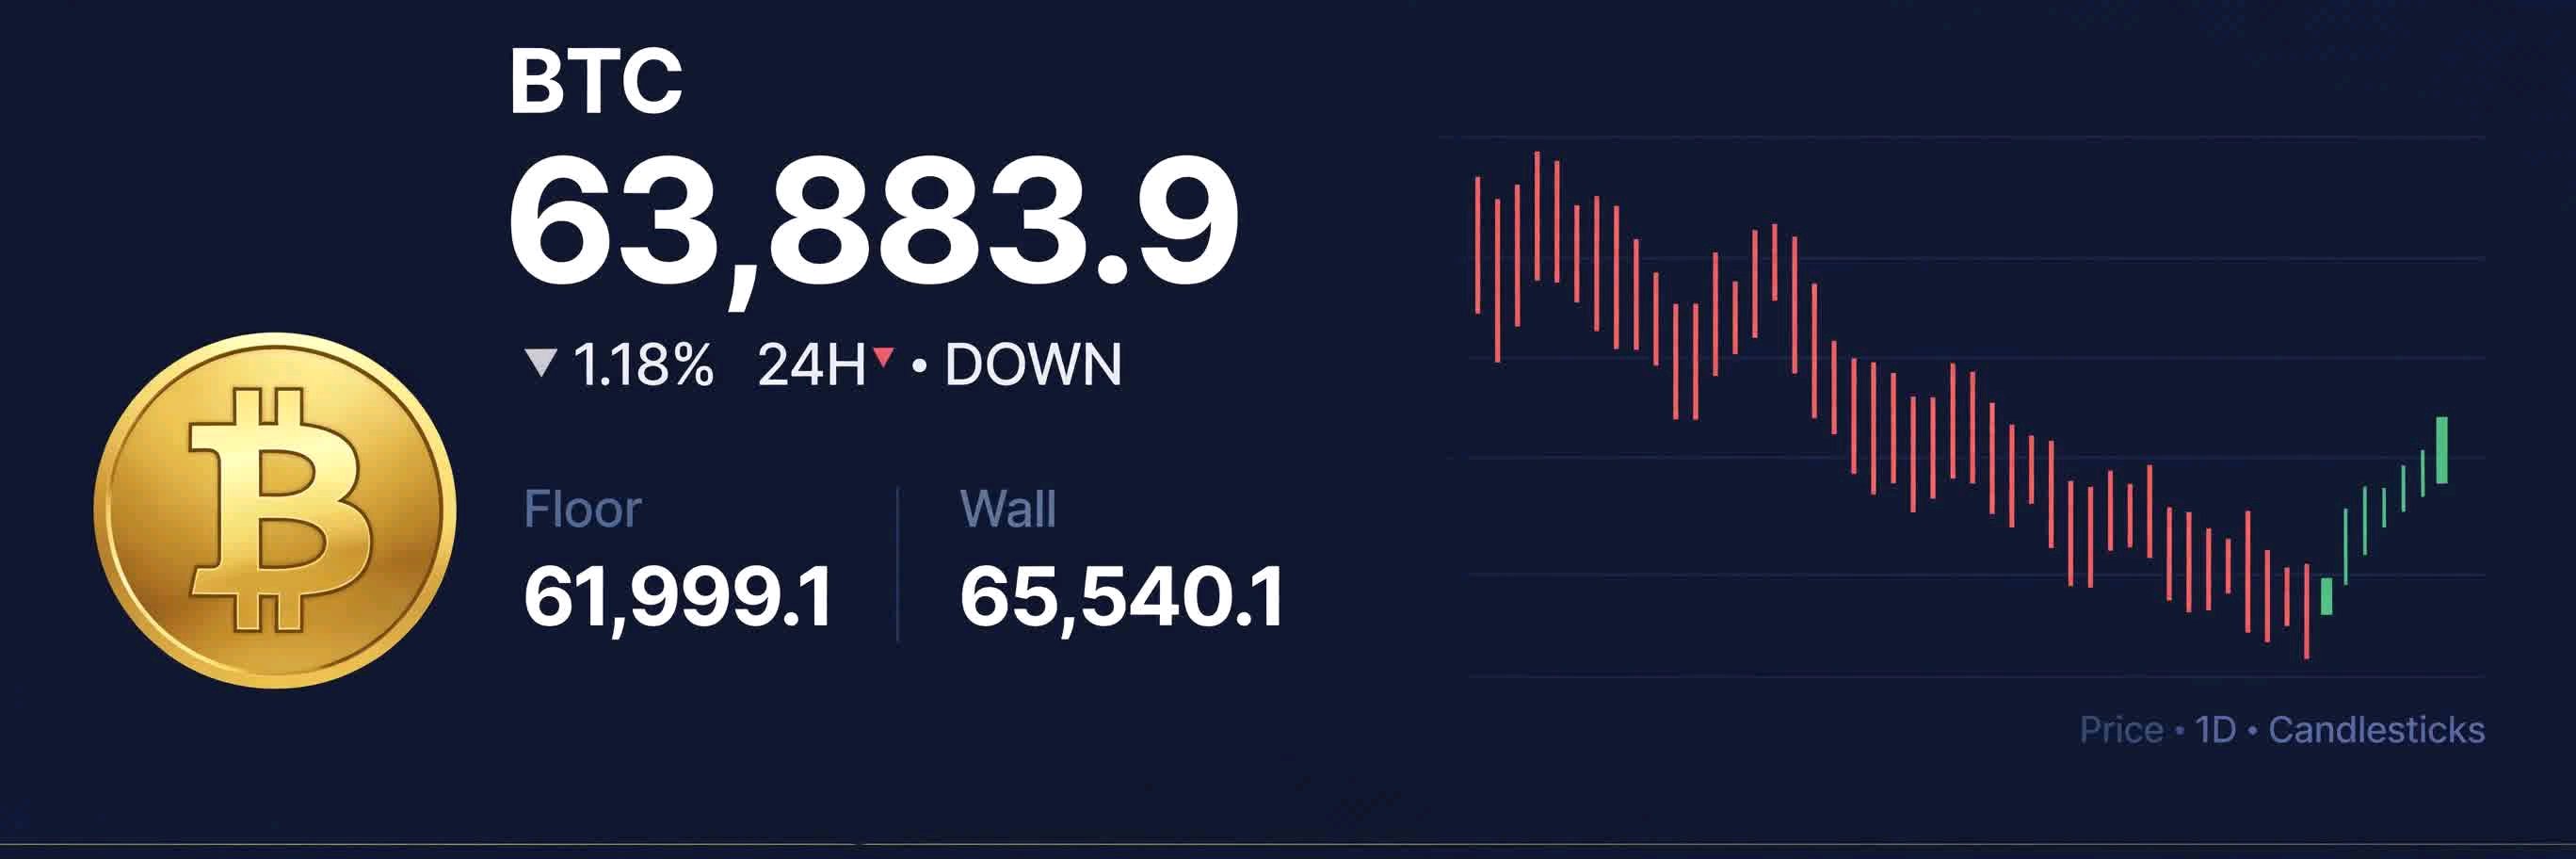
$BTCUSDT lost the 65,540 level, the 7-day averages and everything it had been defending, then bounced 3.0% off 61,999.1. The bounce is real, and the question is whether it can take back 65,540.1, which is now the wall. Context BTC is about 15.5% off the 75,603.4 high on this chart and has given back most of its run from 61,999.1. Price is 63,883.9 (-4.71%) after a low of 61,999.1, sitting 2.5% under the 7-day average: MA7 (65,540.1), with MA14 (67,048.0) and MA28 (70,197.6) above, all stacked in bearish order. It's a Sunday, and the 4h candle is only about 1 hour old. Turnover and volume 24h turnover is about 1.15B USDT, roughly 18K BTC, about 0.61x the 5-day average of 3.29K and 0.76x the 10-day (2.65K) on this 4h candle alone. The 5-day average is running above the 10-day, so volume has been expanding into the decline, and today's candle has already traded 2.02K in its first hour. The flush came on real volume, which is how washouts tend to look, though it doesn't prove it's over. Momentum Price is below all three MAs and the MAs are fanned out pointing down. The last bounce was sold into 67,527.1, then price made a lower low at 61,999.1. Momentum is still falling, so I want a reaction before I act. Oversold plus a volume flush sets up a bounce, but a bounce without a close above the wall is just a bounce. Support and resistance Support: 61,999.1 (24h low), about 62,000 (round number), then 60,000, not a proven level. Resistance: 65,540.1 (MA7, now flipped), about 67,048.0 (MA14), 67,527.1 (24h high), 70,197.6 (MA28), then 75,603.4 (earlier high). Level to watch 61,999.1 - 62,500 is the floor, with today's low as the line. A 4h close under 61,999.1 would open 60,000 and below. On the upside, 65,540.1 - 67,048.0 is the wall, where the flipped MA7, the MA14 and the 24h high meet. Trade plan Bounce: buy 62,000 - 62,500 only on a reaction (a rejection wick or a 4h close back above 65,540.1), stop under 61,800. Targets are 67,048.0 and 67,527.1, roughly 2.5R and 2.7R from 62,250. Continuation (short, or simply no longs): wait for a retest of 65,540.1 - 67,048.0 that gets rejected, stop above 67,600. Targets are 62,500 and 61,999.1, roughly 1.9R and 2.1R from 66,200. I'm not buying 63,883.9 in the middle of an -4.71% candle. The stop belongs under 61,999.1, and the first resistance at 65,540.1 is only about 1,656 above, so it pays under 1R. Risk note BTC ranged about 8.9% in the last 24 hours (61,999.1 to 67,527.1), weekend liquidity is thinner, and wicks can run through any level, so size matters more than entry. Oversold readings can stay oversold. MA levels are zones, not exact lines. Levels come from my own chart. Not financial advice. Is the washout done, or is 60,000 next? The reaction at 65,540.1 will say. For education only, not financial advice. $BTCUSDT#ByXIMPACT
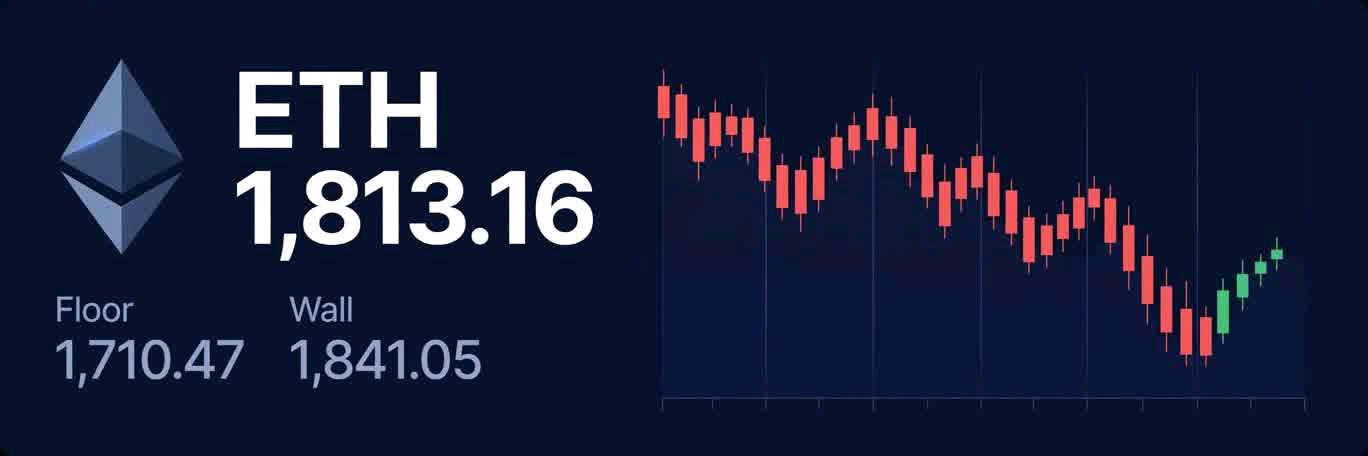
$ETHUSDT lost the 1,841 level, the 7-day averages and everything it had been defending, then bounced 6.0% off 1,710.47. The bounce is real, and the question is whether it can take back 1,841.05, which is now the wall. Context ETH is about 20% off the 2,271.33 high on this chart and has given back most of its run from 1,710.47. Price is 1,813.16 (-4.64%) after a low of 1,710.47, sitting 1.5% under the 7-day average: MA7 (1,841.05), with MA14 (1,887.08) and MA28 (1,967.64) above, all stacked in bearish order. It's a Sunday, and the 4h candle is only about 1 hour old. Turnover and volume 24h turnover is about 368.06M USDT, roughly 203K ETH, about 0.1x the 5-day average of 35.50K and 0.14x the 10-day (26.10K) on this 4h candle alone. The 5-day average is running above the 10-day, so volume has been expanding into the decline, and today's candle has already traded 3.56K in its first hour. The flush came on real volume, which is how washouts tend to look, though it doesn't prove it's over. Momentum Price is below all three MAs and the MAs are fanned out pointing down. The last bounce was sold into 1,919.76, then price made a lower low at 1,710.47. Momentum is still falling, so I want a reaction before I act. Oversold plus a volume flush sets up a bounce, but a bounce without a close above the wall is just a bounce. Support and resistance Support: 1,710.47 (24h low), about 1,700 (round number), then 1,650, not a proven level. Resistance: 1,841.05 (MA7, now flipped), about 1,887.08 (MA14), 1,919.76 (24h high), 1,967.64 (MA28), then 2,160.42 (earlier floor). Level to watch 1,710.47 - 1,750 is the floor, with today's low as the line. A 4h close under 1,710.47 would open 1,700 and below. On the upside, 1,841.05 - 1,887.08 is the wall, where the flipped MA7, the MA14 and the 24h high meet. Trade plan Bounce: buy 1,710 - 1,750 only on a reaction (a rejection wick or a 4h close back above 1,841.05), stop under 1,700. Targets are 1,887.08 and 1,919.76, roughly 2.5R and 3.0R from 1,730. Continuation (short, or simply no longs): wait for a retest of 1,841.05 - 1,887.08 that gets rejected, stop above 1,920. Targets are 1,750 and 1,710.47, roughly 1.8R and 2.5R from 1,865. I'm not buying 1,813.16 in the middle of an -4.64% candle. The stop belongs under 1,710.47, and the first resistance at 1,841.05 is only about 28 above, so it pays under 1R. Risk note ETH ranged about 12% in the last 24 hours (1,710.47 to 1,919.76), weekend liquidity is thinner, and wicks can run through any level, so size matters more than entry. Oversold readings can stay oversold. MA levels are zones, not exact lines. Levels come from my own chart. Not financial advice. Is the washout done, or is 1,700 next? The reaction at 1,841.05 will say. For education only, not financial advice. $ETHUSDT#ByXIMPACT
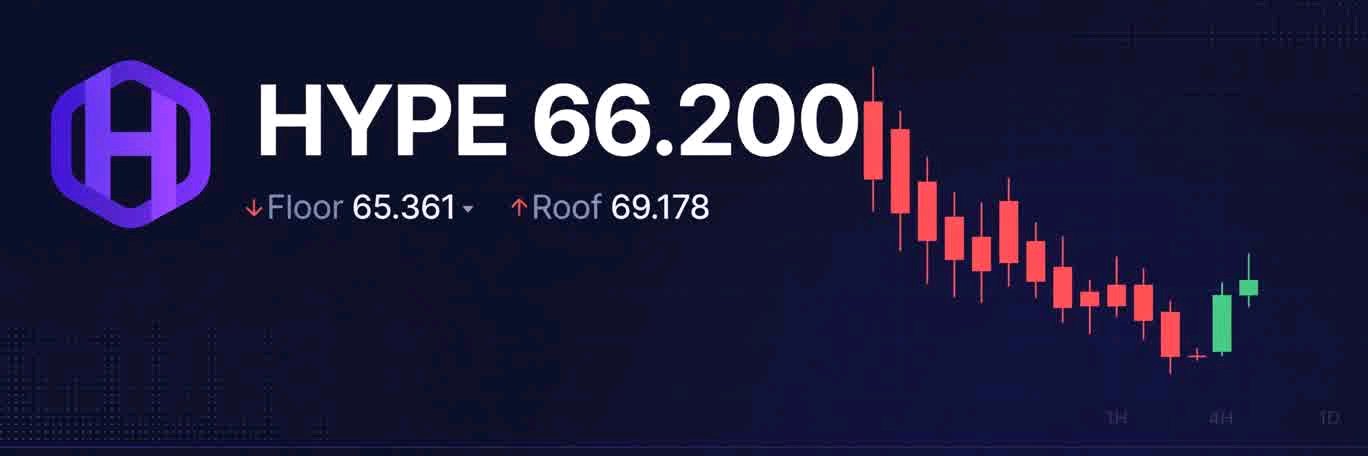
🚀 HYPE UNDERCUT 69.526 AND SNAPPED BACK. NOW IT HAS TO PROVE IT. $HYPEUSDT, 4h, 66.200 (-8.68%). Bias: neutral, constructive only while 65.361 holds. The 69.526 level got tested again and undercut: the 24h low is 65.361. But price is back above it, trading at 66.200. A dip under a well-watched level that gets bought straight back is a failed breakdown, and those can be worth trading. They also fail, which is why the proof comes before the trade. Structure: the highs keep stepping down, 78.133 on this chart, about 73.109 on the bounce, 72.637, and now 66.200. The lows have come back to the same floor, so HYPE is stuck in the lower half of a range between 65.361 and 78.133. A trend change needs a push through that last lower high at 73.109, and then 78.133. The averages are bunched in a 2.3-point band above price: MA7 69.178, MA14 70.627, MA28 71.525. Price is 4.3% under the MA7. Resistance: 69.178 (MA7), then 70.627 (MA14), then 71.525 (MA28), then about 73.109 (the 24h high). Support: 65.361 (the reclaimed low). Below that, 65 is a round number, 64 is next, not a proven level. Volume: MA5 at 687.43K is above MA10 at 630.21K, but today's 481.93K with about 60% of the candle done is on pace for roughly 117% of the 5-day average. There was real activity on the undercut. Plan: I want the hold confirmed, not guessed. Price dips back toward 65.361 - 66.200, then a 4h candle closes above 66.200 with a lower wick and volume at or above the 4h average. No close, no trade. Entry ∼66.30. Stop 65.10, under the undercut low. On 1.20 of risk: TP1 69.178 = 2.39R TP2 70.627 = 3.60R TP3 71.525 = 4.35R A 4h close under 65.361 and I'm out. A daily close under it says the floor is gone for good, with 64 next. HYPE reacts to BTC and macro headlines and order books can thin out overnight, so I'd use limit orders and size for the stop. Not advice. For education only, not financial advice. $HYPEUSDT#ByXIMPACT
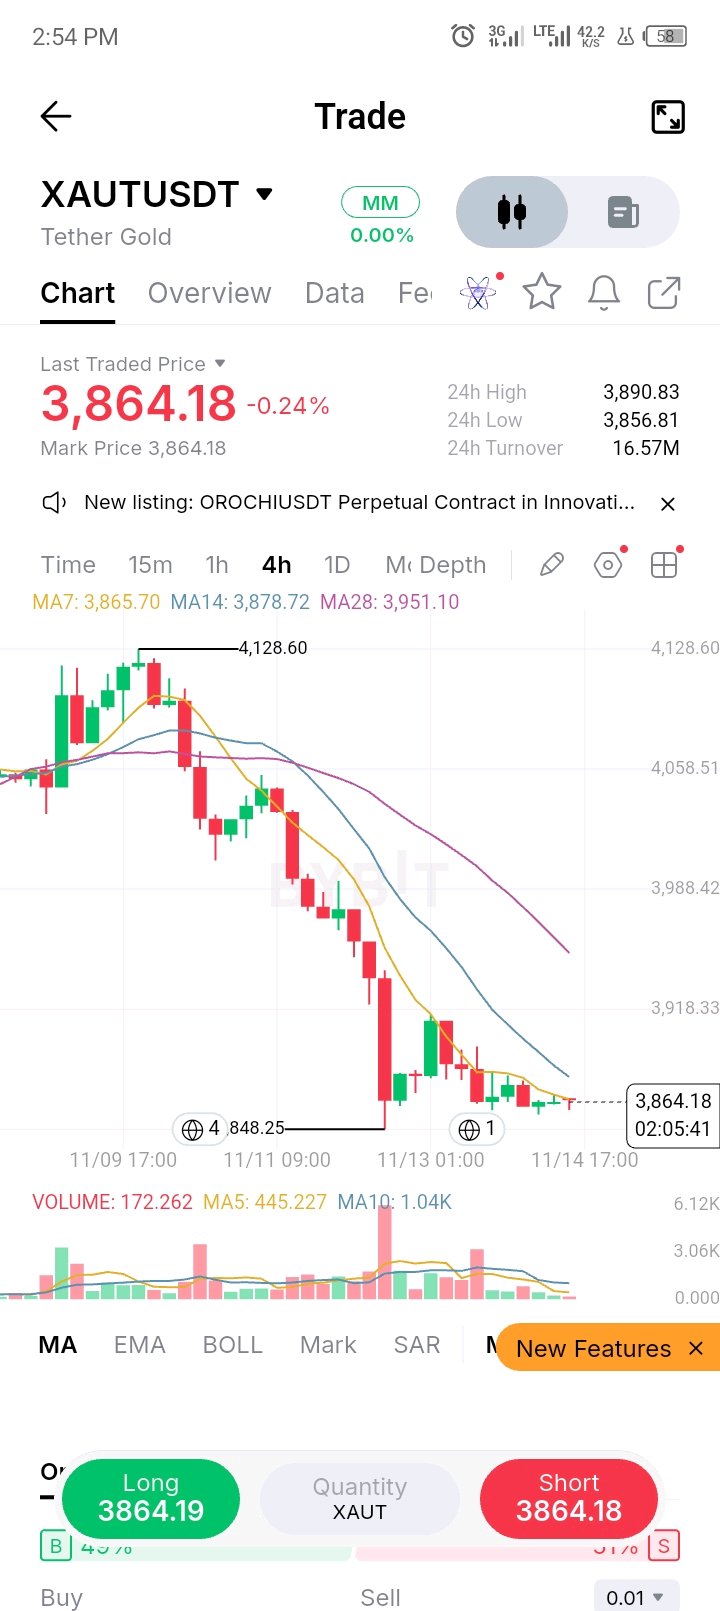
🚀 XAUT UNDERCUT 3,848 AND SNAPPED BACK. NOW IT HAS TO PROVE IT. $XAUTUSDT, 4h, 3,864.18 (-0.24%). Bias: neutral, constructive only while 3,856.81 holds. The 3,848 level got tested again and undercut: the 24h low is 3,856.81. But price is back above it, trading at 3,864.18. A dip under a well-watched level that gets bought straight back is a failed breakdown, and those can be worth trading. They also fail, which is why the proof comes before the trade. Structure: the highs keep stepping down, 4,128.60 on this chart, about 3,918.33 on the bounce, 3,890.83, and now 3,864.18. The lows have come back to the same floor, so XAUT is stuck in the lower half of a range between 3,856.81 and 4,128.60. A trend change needs a push through that last lower high at 3,890.83, and then 3,918.33. The averages are bunched in a 85-point band above price: MA7 3,865.70, MA14 3,878.72, MA28 3,951.10. Price is 0.04% under the MA7. Resistance: 3,865.70 (MA7), then 3,878.72 (MA14), then 3,951.10 (MA28), then about 3,890.83 (the 24h high). Support: 3,856.81 (the reclaimed low). Below that, 3,848.25 is the chart low, 3,800 is next, not a proven level. Volume: MA5 at 445.227 is below MA10 at 1.04K, but today's 172.262 with about 60% of the candle done is on pace for roughly 64% of the 5-day average. The bounce is quiet so far. There was real activity on the undercut, but the bounce has not confirmed it yet. Plan: I want the hold confirmed, not guessed. Price dips back toward 3,856.81 - 3,864.18, then a 4h candle closes above 3,864.18 with a lower wick and volume at or above the 4h average. No close, no trade. Entry ∼3,866. Stop 3,845, under the undercut low. On 21 of risk: TP1 3,865.70 = -0.02R TP2 3,878.72 = 0.60R TP3 3,951.10 = 4.14R A 4h close under 3,856.81 and I'm out. A daily close under it says the floor is gone for good, with 3,800 next. XAUT reacts to gold spot, dollar and macro headlines and order books can thin out overnight, so I'd use limit orders and size for the stop. Not advice. For education only, not financial advice. $XAUTUSDT#ByXIMPACT

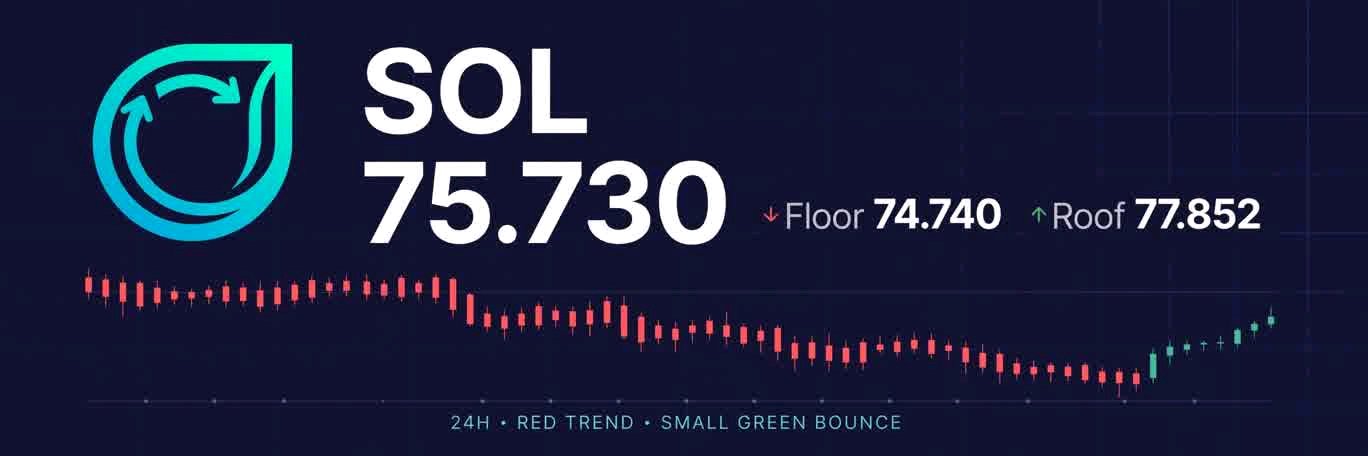
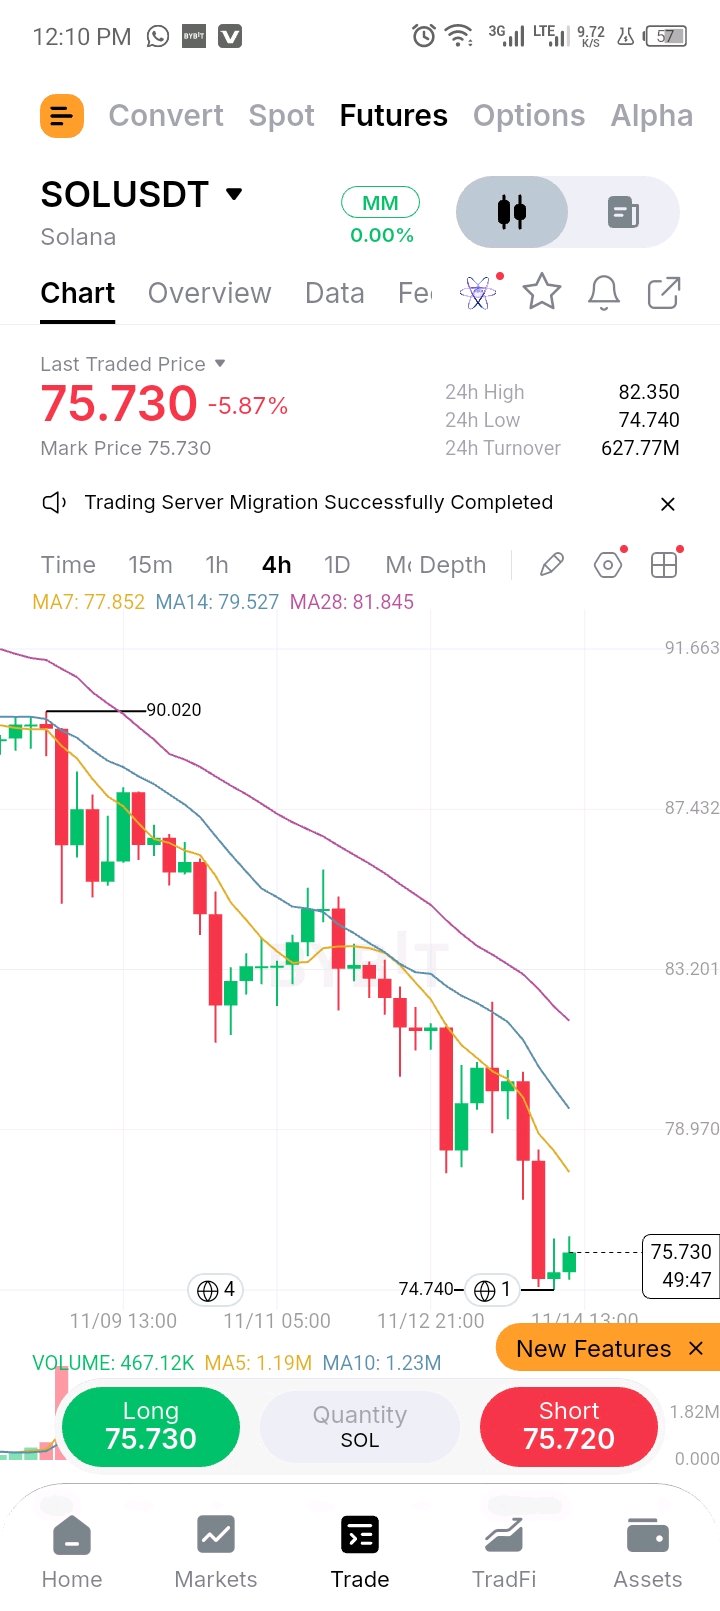
🚀 SOL UNDERCUT 77.92 AND SNAPPED BACK. NOW IT HAS TO PROVE IT. $SOLUSDT, 4h, 75.730 (-5.87%). Bias: neutral, constructive only while 74.740 holds. The 77.92 level got tested again and undercut: the 24h low is 74.740. But price is back above it, trading at 75.730. A dip under a well-watched level that gets bought straight back is a failed breakdown, and those can be worth trading. They also fail, which is why the proof comes before the trade. Structure: the highs keep stepping down, 90.020 on this chart, about 85.82 on the bounce, 82.350, and now 75.730. The lows have come back to the same floor, so SOL is stuck in the lower half of a range between 74.740 and 90.020. A trend change needs a push through that last lower high at 82.350, and then 85.82. The averages are bunched in a 4-point band above price: MA7 77.852, MA14 79.527, MA28 81.845. Price is 2.7% under the MA7. Resistance: 77.852 (MA7), then 79.527 (MA14), then 81.845 (MA28), then about 82.350 (the 24h high). Support: 74.740 (the reclaimed low). Below that, 74 is a round number, 73 is next, not a proven level. Volume: MA5 at 1.19M is below MA10 at 1.23M, but today's 467.12K with about 50% of the candle done is on pace for roughly 78% of the 5-day average. The bounce is quiet so far. There was real activity on the undercut, but the bounce has not confirmed it yet. Plan: I want the hold confirmed, not guessed. Price dips back toward 74.740 - 75.730, then a 4h candle closes above 75.730 with a lower wick and volume at or above the 4h average. No close, no trade. Entry ∼75.90. Stop 74.50, under the undercut low. On 1.40 of risk: TP1 77.852 = 1.39R TP2 79.527 = 2.59R TP3 81.845 = 4.36R A 4h close under 74.740 and I'm out. A daily close under it says the floor is gone for good, with 73 next. SOL reacts to BTC and macro headlines and order books can thin out overnight, so I'd use limit orders and size for the stop. Not advice. For education only, not financial advice. $SOLUSDT#ByXIMPACT
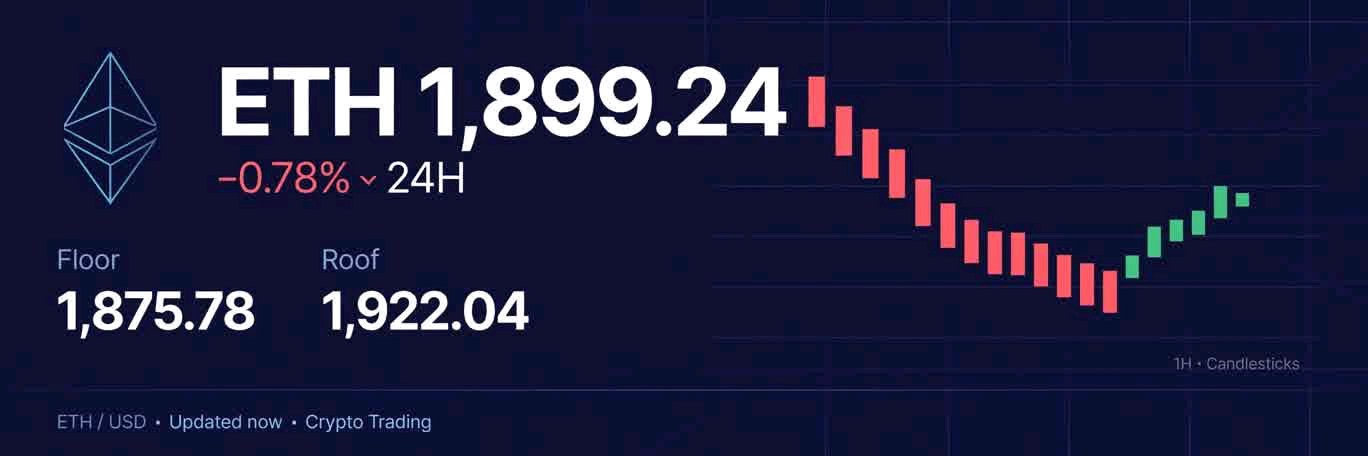
🚀 ETH UNDERCUT 1,895 AND SNAPPED BACK. NOW IT HAS TO PROVE IT. $ETHUSDT, 4h, 1,899.24 (-1.73%). Bias: neutral, constructive only while 1,875.78 holds. The 1,895 level got tested again and undercut: the 24h low is 1,875.78. But price is back above it, trading at 1,899.24. A dip under a well-watched level that gets bought straight back is a failed breakdown, and those can be worth trading. They also fail, which is why the proof comes before the trade. Structure: the highs keep stepping down, 2,245.04 on this chart, about 2,030.58 on the bounce, 1,988.67, and now 1,899.24. The lows have come back to the same floor, so ETH is stuck in the lower half of a range between 1,875.78 and 2,245.04. A trend change needs a push through that last lower high at 1,988.67, and then 2,030.58. The averages are bunched in a 94-point band above price: MA7 1,922.04, MA14 1,959.80, MA28 2,016.43. Price is 1.2% under the MA7. Resistance: 1,922.04 (MA7), then 1,959.80 (MA14), then 2,016.43 (MA28), then about 1,988.67 (the 24h high). Support: 1,875.78 (the reclaimed low). Below that, 1,875 is a round number, 1,850 is next, not a proven level. Volume: MA5 at 144.38K is below MA10 at 201.91K, but today's 518.16K is already 3.5x the 5-day average. There was real activity on the undercut. The bounce is starting to get volume. Plan: I want the hold confirmed, not guessed. Price dips back toward 1,875.78 - 1,899.24, then a 4h candle closes above 1,899.24 with a lower wick and volume at or above the 4h average. No close, no trade. Entry ∼1,905. Stop 1,865, under the undercut low. On 40 of risk: TP1 1,922 = 0.42R TP2 1,959 = 1.35R TP3 2,016 = 2.77R A 4h close under 1,875.78 and I'm out. A daily close under it says the floor is gone for good, with 1,850 next. ETH reacts to BTC and macro headlines and order books can thin out overnight, so I'd use limit orders and size for the stop. Not advice. For education only, not financial advice. $ETHUSDT#ByXIMPACT
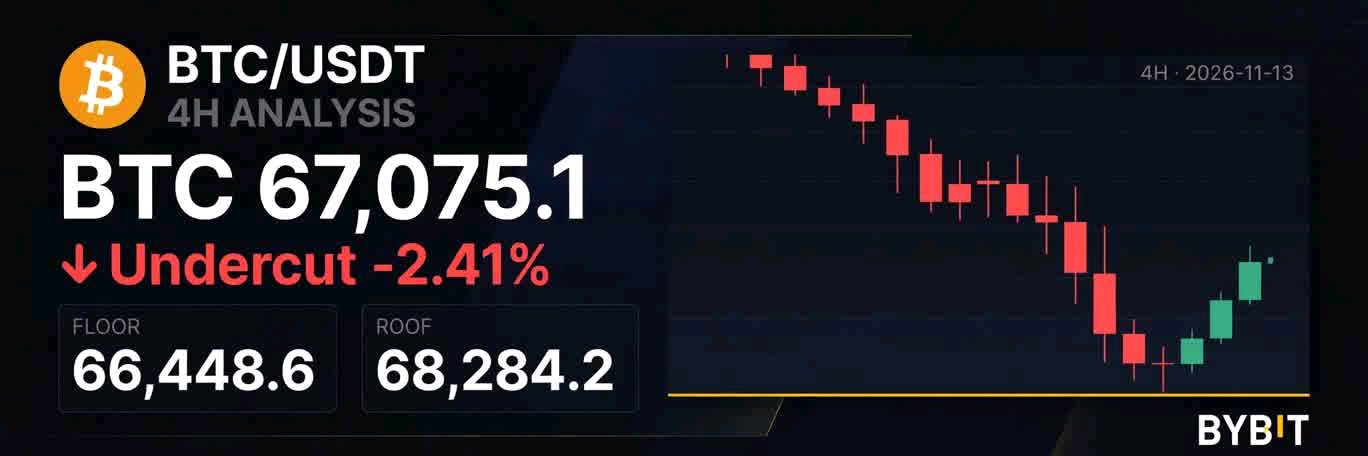
🚀 BTC UNDERCUT 67,563 AND SNAPPED BACK. NOW IT HAS TO PROVE IT. $BTCUSDT, 4h, 67,075.1 (-2.41%). Bias: neutral, constructive only while 66,448.6 holds. The 67,563 level got tested again and undercut: the 24h low is 66,448.6. But price is back above it, trading at 67,075.1. A dip under a well-watched level that gets bought straight back is a failed breakdown, and those can be worth trading. They also fail, which is why the proof comes before the trade. Structure: the highs keep stepping down, 76,241.5 on this chart, about 73,630.1 on the bounce, 70,217.2, and now 67,075.1. The lows have come back to the same floor, so BTC is stuck in the lower half of a range between 66,448.6 and 76,241.5. A trend change needs a push through that last lower high at 70,217.2, and then 73,630.1. The averages are bunched in a 3,897-point band above price: MA7 68,284.2, MA14 70,160.5, MA28 72,181.8. Price is 1.8% under the MA7. Resistance: 68,284.2 (MA7), then 70,160.5 (MA14), then 72,181.8 (MA28), then about 70,217.2 (the 24h high). Support: 66,448.6 (the reclaimed low). Below that, 66,000 is a round number, not a proven level. Volume: MA5 at 2.11K is below MA10 at 2.20K, but today's 583.025 with about 55% of the candle done is on pace for roughly 50% of the 5-day average. The bounce is quiet so far. There was real activity on the undercut, but the bounce has not confirmed it yet. Plan: I want the hold confirmed, not guessed. Price dips back toward 66,448.6 - 67,075.1, then a 4h candle closes above 67,075.1 with a lower wick and volume at or above the 4h average. No close, no trade. Entry ∼67,150. Stop 66,300, under the undercut low. On 850 of risk: TP1 68,284 = 1.33R TP2 70,160 = 3.54R TP3 72,181 = 5.92R A 4h close under 66,448.6 and I'm out. A daily close under it says the floor is gone for good, with 66,000 next. BTC reacts to macro headlines and order books can thin out overnight, so I'd use limit orders and size for the stop. Not advice. For education only, not financial advice.$BTCUSDT#ByXIMPACT
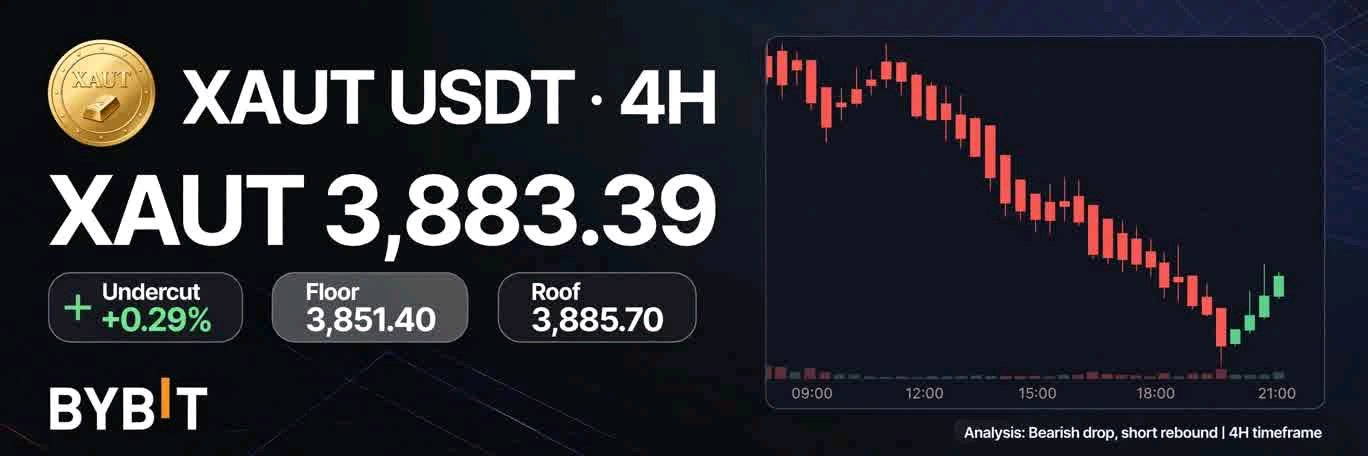
🚀 XAUT UNDERCUT 3,861 AND SNAPPED BACK. NOW IT HAS TO PROVE IT. $XAUTUSDT, 4h, 3,883.39 (+0.29%). Bias: neutral, constructive only while 3,851.40 holds. The 3,861 level got tested again and undercut: the 24h low is 3,861.78. But price is back above it, trading at 3,883.39. A dip under a well-watched level that gets bought straight back is a failed breakdown, and those can be worth trading. They also fail, which is why the proof comes before the trade. Structure: the highs keep stepping down, 4,130.11 on this chart, about 3,916.18 on the bounce, 3,990.75, and now 3,883.39. The lows have come back to the same floor, so XAUT is stuck in the lower half of a range between 3,851.40 and 4,130.11. A trend change needs a push through that last lower high at 3,916.18, and then 3,990.75. The averages are bunched in a 110-point band above price: MA7 3,885.70, MA14 3,921.22, MA28 3,995.83. Price is 0.06% under the MA7. Resistance: 3,885.70 (MA7), then 3,921.22 (MA14), then 3,995.83 (MA28), then about 3,916.18 (the 24h high). Support: 3,851.40 (the reclaimed low). Below that, 3,850 is a round number, 3,800 is next, not a proven level. Volume: MA5 at 348.928 is below MA10 at 391.592, but today's 62.883 with about 60% of the candle done is on pace for roughly 30% of the 5-day average. The bounce is quiet so far. There was real activity on the undercut, but the bounce has not confirmed it yet. Plan: I want the hold confirmed, not guessed. Price dips back toward 3,851.40 - 3,883.39, then a 4h candle closes above 3,883.39 with a lower wick and volume at or above the 4h average. No close, no trade. Entry ∼3,885. Stop 3,845, under the undercut low. On 40 of risk: TP1 3,885.70 = 0.02R TP2 3,921.22 = 0.90R TP3 3,995.83 = 2.77R A 4h close under 3,851.40 and I'm out. A daily close under it says the floor is gone for good, with 3,800 next. XAUT reacts to gold spot, dollar and macro headlines and order books can thin out overnight, so I'd use limit orders and size for the stop. Not advice. For education only, not financial advice. $XAUTUSDT#ByXIMPACT
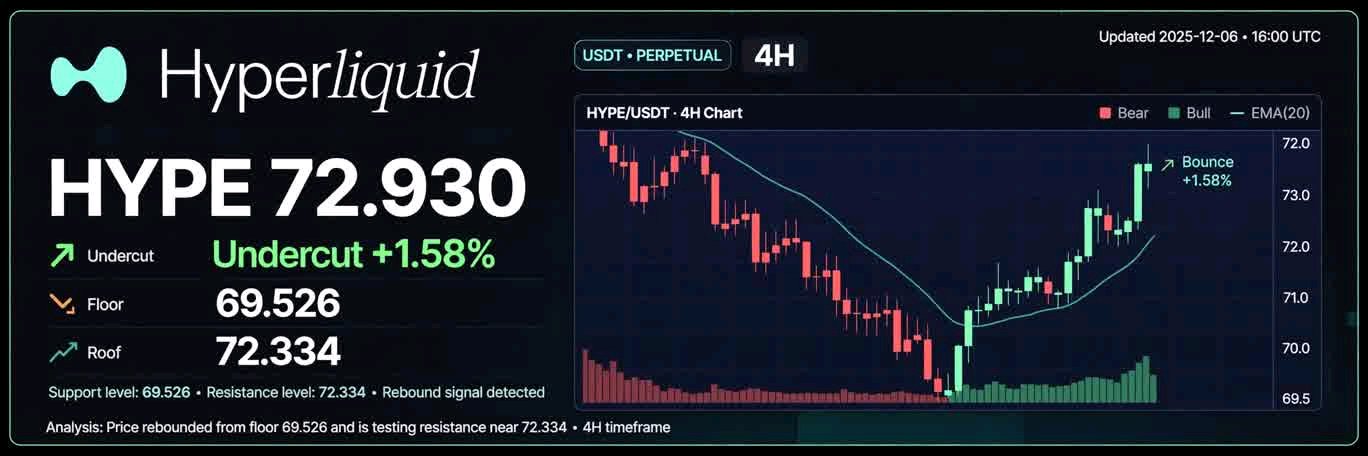
🚀 HYPE UNDERCUT 70 AND SNAPPED BACK. NOW IT HAS TO PROVE IT. $HYPEUSDT, 4h, 72.930 (+1.58%). Bias: neutral, constructive only while 69.526 holds. The 70 level got tested again and undercut: the 24h low is 69.921. But price is back above it, trading at 72.930. A dip under a well-watched level that gets bought straight back is a failed breakdown, and those can be worth trading. They also fail, which is why the proof comes before the trade. Structure: the highs keep stepping down, 78.217 on this chart, about 75.308 on the bounce, 73.838, and now 72.930. The lows have come back to the same floor, so HYPE is stuck in the lower half of a range between 69.526 and 78.217. A trend change needs a push through that last lower high at 75.308, and then 78.217. The averages are bunched in a 0.6-point band around price: MA7 72.334, MA14 72.199, MA28 72.806. Price is 0.8% above the MA7. Resistance: 72.806 (MA28), then 75.308 (24h high), then 78.217 (chart high). Support: 69.526 (the reclaimed low). Below that, 70 is a round number, 69 is next, not a proven level. Volume: MA5 at 116.81K is above MA10 at 87.31K, but today's 12.20K with about 60% of the candle done is on pace for roughly 17% of the 5-day average. The bounce is quiet so far. There was real activity on the undercut, but the bounce has not confirmed it yet. Plan: I want the hold confirmed, not guessed. Price dips back toward 69.526 - 72.930, then a 4h candle closes above 72.930 with a lower wick and volume at or above the 4h average. No close, no trade. Entry ∼73.00. Stop 69.30, under the undercut low. On 3.70 of risk: TP1 72.806 = -0.05R TP2 75.308 = 0.62R TP3 78.217 = 1.43R A 4h close under 69.526 and I'm out. A daily close under it says the floor is gone for good, with 69 next. HYPE reacts to BTC and macro headlines and order books can thin out overnight, so I'd use limit orders and size for the stop. Not advice. For education only, not financial advice. $HYPEUSDT#ByXIMPACT
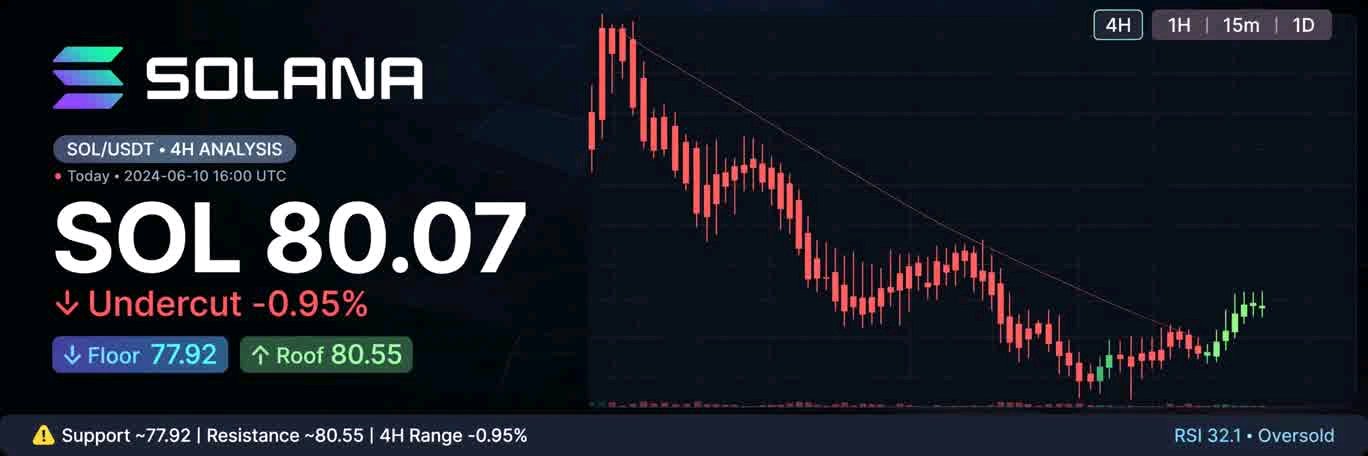
🚀 SOL UNDERCUT 78 AND SNAPPED BACK. NOW IT HAS TO PROVE IT. $SOLUSDT, 4h, 80.07 (-0.95%). Bias: neutral, constructive only while 77.92 holds. The 78 level got tested again and undercut: the 24h low is 77.92. But price is back above it, trading at 80.07. A dip under a well-watched level that gets bought straight back is a failed breakdown, and those can be worth trading. They also fail, which is why the proof comes before the trade. Structure: the highs keep stepping down, 90.39 on this chart, about 85.82 on the bounce, 82.38, and now 80.07. The lows have come back to the same floor, so SOL is stuck in the lower half of a range between 77.92 and 90.39. A trend change needs a push through that last lower high at 82.38, and then 85.82. The averages are bunched in a 3-point band above price: MA7 80.55, MA14 82.11, MA28 83.63. Price is 0.6% under the MA7. Resistance: 80.55 (MA7), then 82.11 (MA14), then 83.63 (MA28), then about 82.38 (the 24h high). Support: 77.92 (the reclaimed low). Below that, 78 is a round number, 77 is next, not a proven level. Volume: MA5 at 140.54K is above MA10 at 116.24K, but today's 123.66K with about 55% of the candle done is on pace for roughly 140% of the 5-day average. There was real activity on the undercut. Plan: I want the hold confirmed, not guessed. Price dips back toward 77.92 - 80.07, then a 4h candle closes above 80.07 with a lower wick and volume at or above the 4h average. No close, no trade. Entry ∼80.20. Stop 77.70, under the undercut low. On 2.50 of risk: TP1 80.55 = 0.14R TP2 82.11 = 0.76R TP3 83.63 = 1.41R A 4h close under 77.92 and I'm out. A daily close under it says the floor is gone for good, with 77 next. SOL reacts to BTC and macro headlines and order books can thin out overnight, so I'd use limit orders and size for the stop. Not advice. For education only, not financial advice. $SOLUSDT#ByXIMPACT
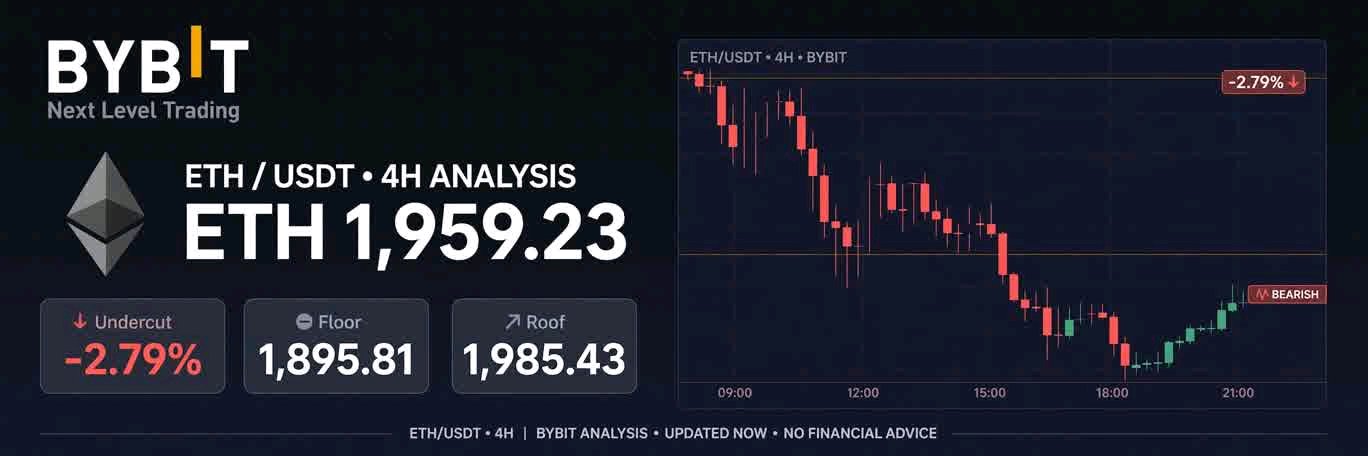
🚀 ETH UNDERCUT 1,900 AND SNAPPED BACK. NOW IT HAS TO PROVE IT. $ETHUSDT, 4h, 1,959.23 (-2.79%). Bias: neutral, constructive only while 1,895.81 holds. The 1,900 level got tested again and undercut: the 24h low is 1,895.81. But price is back above it, trading at 1,959.23. A dip under a well-watched level that gets bought straight back is a failed breakdown, and those can be worth trading. They also fail, which is why the proof comes before the trade. Structure: the highs keep stepping down, 2,251.50 on this chart, about 2,103.98 on the bounce, 2,030.58, and now 1,959.23. The lows have come back to the same floor, so ETH is stuck in the lower half of a range between 1,895.81 and 2,251.50. A trend change needs a push through that last lower high at 2,030.58, and then 2,103.98. The averages are bunched in a 76-point band above price: MA7 1,985.43, MA14 2,024.46, MA28 2,062.11. Price is 1.3% under the MA7. Resistance: 1,985.43 (MA7), then 2,024.46 (MA14), then 2,062.11 (MA28), then about 2,030.58 (the 24h high). Support: 1,895.81 (the reclaimed low). Below that, 1,900 is a round number, 1,850 is next, not a proven level. Volume: MA5 at 18.45K is above MA10 at 16.01K, but today's 15.67K with about 60% of the candle done is on pace for roughly 140% of the 5-day average. There was real activity on the undercut. Plan: I want the hold confirmed, not guessed. Price dips back toward 1,895.81 - 1,959.23, then a 4h candle closes above 1,959.23 with a lower wick and volume at or above the 4h average. No close, no trade. Entry ∼1,965. Stop 1,885, under the undercut low. On 80 of risk: TP1 1,985 = 0.25R TP2 2,024 = 0.74R TP3 2,062 = 1.21R A 4h close under 1,895.81 and I'm out. A daily close under it says the floor is gone for good, with 1,850 next. ETH reacts to BTC and macro headlines and order books can thin out overnight, so I'd use limit orders and size for the stop. Not advice. For education only, not financial advice.$ETHUSDT #ByXIMPACT
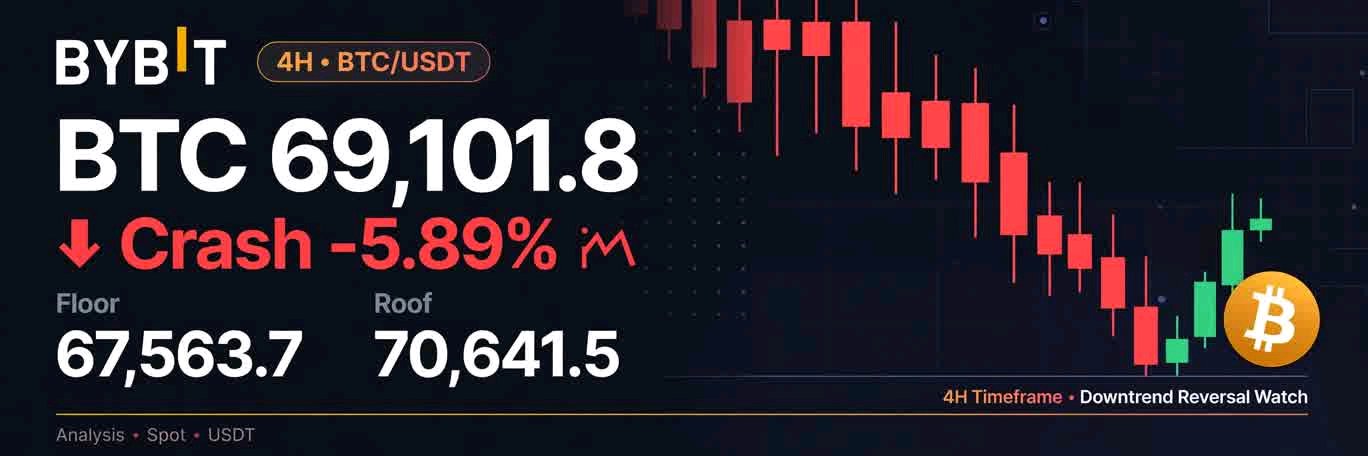
🚀 BTC UNDERCUT 68,000 AND SNAPPED BACK. NOW IT HAS TO PROVE IT. $BTCUSDT, 4h, 69,101.8 (-5.89%). Bias: neutral, constructive only while 67,563.7 holds. The 68,000 level got tested again and undercut: the 24h low is 67,563.7. But price is back above it, trading at 69,101.8. A dip under a well-watched level that gets bought straight back is a failed breakdown, and those can be worth trading. They also fail, which is why the proof comes before the trade. Structure: the highs keep stepping down, 76,241.5 on this chart, about 74,822.9 on the bounce, 73,630.1, and now 69,101.8. The lows have come back to the same floor, so BTC is stuck in the lower half of a range between 67,563.7 and 76,241.5. A trend change needs a push through that last lower high at 73,630.1, and then 74,822.9. The averages are bunched in a 2,725-point band above price: MA7 70,641.5, MA14 72,319.3, MA28 73,366.9. Price is 2.2% under the MA7. Resistance: 70,641.5 (MA7), then 72,319.3 (MA14), then 73,366.9 (MA28), then about 73,630.1 (the 24h high). Support: 67,563.7 (the reclaimed low). Below that, 67,000 is a round number, not a proven level. Volume: MA5 at 2.10K is above MA10 at 1.75K, but today's 953.403 with about 55% of the candle done is on pace for roughly 85% of the 5-day average. There was real activity on the undercut. The bounce is quiet so far. Plan: I want the hold confirmed, not guessed. Price dips back toward 67,563.7 - 69,101.8, then a 4h candle closes above 69,101.8 with a lower wick and volume at or above the 4h average. No close, no trade. Entry ∼69,200. Stop 67,400, under the undercut low. On 1,800 of risk: TP1 70,641 = 0.8R TP2 72,319 = 1.7R TP3 73,366 = 2.3R A 4h close under 67,563.7 and I'm out. A daily close under it says the floor is gone for good, with 67,000 next. BTC reacts to macro headlines and order books can thin out overnight, so I'd use limit orders and size for the stop. Not advice. For education only, not financial advice. $BTCUSDT #ByXIMPACT
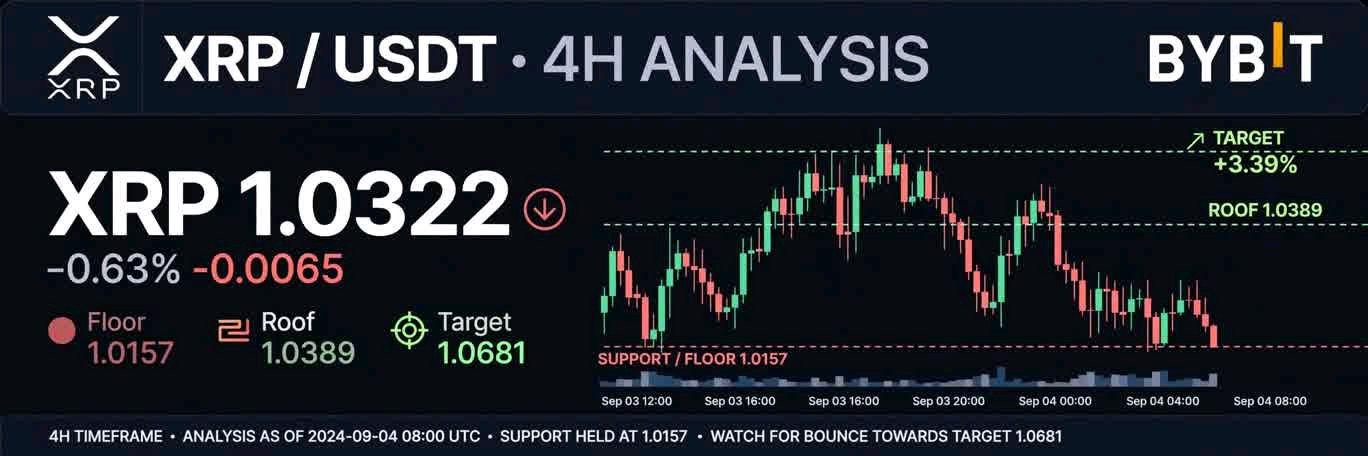
🚀 XRP 1.0322 — SLEEPING GIANT OR DEAD COIN, 1.0157 WILL ANSWER XRP is at 1.0322, -2.57% on the 4H. Forget squeeze. Forget knife. Forget box. Forget fight. This is silence. XRP fell from 1.1988 straight down to 1.0157, then stopped. No big bounce. No big dump. Just tiny candles, low volume, sitting on the floor. This is what a coin does before it either wakes up or dies. The Floor: 1.0157 XRP hit 1.0157 and is now at 1.0322 — 1.6% above it. That is not a bounce. That is just breathing. If bulls want to wake this giant, they must hold 1.0157 on the 4H close. If they lose it, there is nothing below. Open air to 1.00. The Roof: 1.0389 MA7 is 1.0389, MA14 is 1.0500, MA28 is 1.0776. All three are ABOVE price, stacked like a heavy roof. Price is at 1.0322, just below MA7. That is the first door. Close above 1.0389 = door opens to 1.0500. Close below 1.0157 = giant stays asleep, or dead. Volume: No MA5/MA10 visible on this chart, but turnover is 282.99M — 5x bigger than SOL and 10x bigger than HYPE today. The volume is there in the market, but not in the bounce. That means nobody is rushing to buy this floor yet. They are waiting. BTC Link: BTC is at 73,512.4, -0.23%. XRP is down -2.57% while BTC is down -0.23%. XRP is 11x weaker than BTC. If BTC holds 72,727.2, XRP can try to reclaim 1.0389. If BTC breaks, XRP will break 1.0157 first. 4H Close: 3 hours 55 minutes left. I don't trade the wick. I trade the close. Close above 1.0389 = I am bullish to 1.0681 Close between 1.0157 - 1.0389 = I wait, still sleeping, no trade Close below 1.0157 = I am out, dead coin, no trade 24H High: 1.0681 24H Low: 1.0157 24H Turnover: 282.99M My Plan — My Method: I don't buy sleeping coins. I designed my method for this exact moment. Step 1: Let XRP prove it can hold 1.0157 and close above it Step 2: Let it break 1.0389 and hold it Step 3: Only if both hold, I look for long to 1.0681 No hold at 1.0157 = No trade. I wait. I don't force it. My stop is just under 1.0157, my entry is NOT in this caption. My exact entry and stop are on my XRPUSDT widget below — tap it and tell me if my sleeping giant read is wrong. Tell me in the comments: Is XRP a sleeping giant that wakes up above 1.0389, or a dead coin that loses 1.0157? $XRPUSDT#IMPACTbyTrade
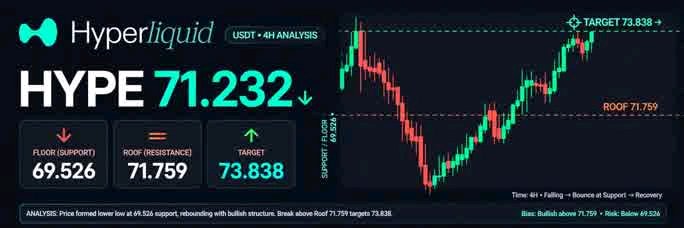
🚀 HYPE 71.232 — BULLS VS BEARS AT THE EDGE, ONE SIDE HAS TO WIN HYPE is at 71.232, -3.48% on the 4H. Forget squeeze. Forget knife. Forget box. This is a fight. Bulls and bears are standing at the edge, face to face. Bears pushed HYPE from 79.651 straight down to 69.526. Bulls caught it there, pushed it back to 71.232. Now nobody is moving. The next candle decides who wins. The Bulls Floor: 69.526 HYPE crashed to 69.526, bounced, and is now at 71.232. That 69.526 low is the bulls' last stand. If bulls hold it, the fight is still alive. If bears break it, bulls lose, next is 69.00, then open air. The Bears Roof: 71.759 MA7 is 71.759, MA14 is 72.047, MA28 is 73.625. All three are sitting ABOVE price, stacked like a wall built by bears. Price is at 71.232, just 0.52 below MA7. That is the edge. One green candle and bulls break the wall. One red candle and bears push it back to 69.526. Close a 4H candle ABOVE 71.759 = bulls win round one, next is 73.838 Close a 4H candle BELOW 69.526 = bears win, next is 69.00 Volume: 38.96K vs MA5 53.70K vs MA10 60.06K Volume is BELOW average. The fight is getting quiet. Neither side is throwing big punches right now. That means the next big volume candle will decide it. I don't trade in quiet. I wait for the loud candle. BTC Link: BTC is at 73,512.4, -0.23%. HYPE is down -3.48% while BTC is down -0.23%. HYPE is 15x weaker than BTC. If BTC holds 72,727.2, bulls can try to break 71.759. If BTC breaks, bears will win and HYPE will break 69.526 first. 4H Close: 1 hour 40 minutes left on this candle. I don't trade the wick. I trade the close. Close above 71.759 = I am bullish to 73.838 Close between 69.526 - 71.759 = I wait, still fighting, no trade Close below 69.526 = I am out, bears won, no trade 24H High: 73.838 24H Low: 69.526 24H Turnover: 24.38M My Plan — My Method: I don't pick a side in a fight. I designed my method for this exact moment. Step 1: Let one side win — bulls break 71.759, or bears break 69.526 Step 2: Wait for the retest of whichever side breaks — it must hold Step 3: Only then I follow the winner No winner = No trade. I wait. I don't force it. My stop is just under 69.526, my entry is NOT in this caption. My exact entry and stop are on my HYPEUSDT widget below — tap it and tell me if my fight read is wrong. Tell me in the comments: Do bulls win and break 71.759, or do bears win and break 69.526? $HYPEUSDT#IMPACTbyTrade
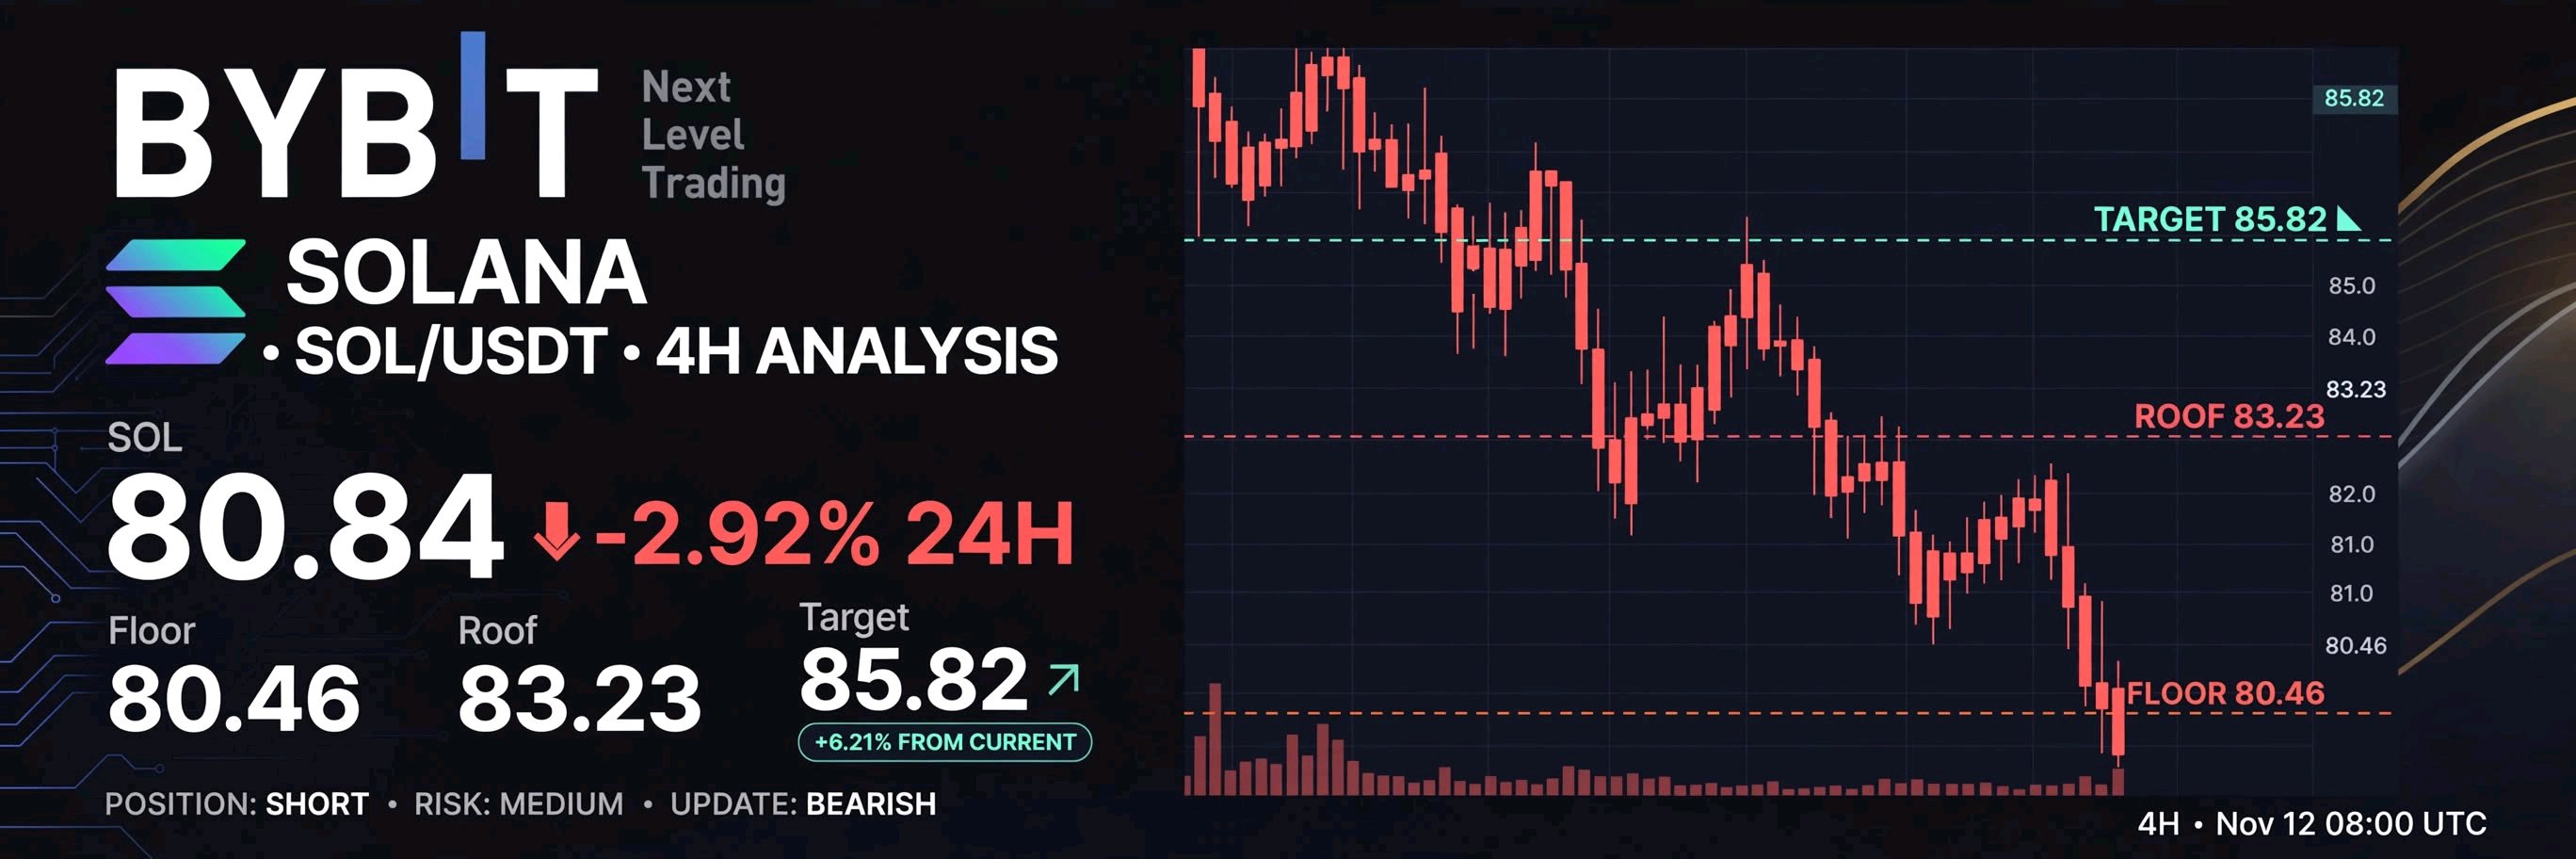
🚀 SOL 80.84 — TRAPPED IN THE BOX, ONE SIDE HAS TO BREAK SOL is at 80.84, -3.66% on the 4H. Forget squeeze. Forget falling knife. This is a box. SOL fell from 91.59 straight down to 80.46, then stopped. It hasn't bounced. It hasn't dumped further. It's just sitting on the floor of the box, trapped. The Box Floor: 80.46 SOL hit 80.46, bounced a tiny bit to 80.84, and is now sitting right on it. That is the floor. If it holds, SOL can breathe. If it breaks, next is 80.00, then open air. There is nothing below. The Box Roof: 83.23 MA7 is 83.23, MA14 is 83.33, MA28 is 85.46. All three are sitting ABOVE price, stacked on top of each other. Read that again. Price is below every single MA. That is not a roof, that is a ceiling made of three layers. SOL has to break through 83.23 first, then 83.33, then 85.46. That's 3 doors. Close a 4H candle ABOVE 83.23 = box breaks up, next is 85.82 Close a 4H candle BELOW 80.46 = box breaks down, next is 80.00 Volume: 187.77K vs MA5 81.72K vs MA10 81.63K Volume is WAY ABOVE average. 2.3x normal. This is not a quiet box. This is a fight. Sellers are dumping hard, buyers are trying to hold 80.46. Someone is going to lose. BTC Link: BTC is at 73,512.4, -0.23%. SOL is down -3.66% while BTC is down -0.23%. SOL is 15x weaker than BTC. If BTC holds 72,727.2, SOL can try to break 83.23. If BTC breaks, SOL will break 80.46 first. 4H Close: 1 hour 52 minutes left on this candle. I don't trade the wick. I trade the close. Close above 83.23 = I am bullish to 85.82 Close between 80.46 - 83.23 = I wait, still trapped, no trade Close below 80.46 = I am out, no trade, box broke down 24H High: 85.82 24H Low: 80.46 24H Turnover: 49.38M My Plan — My Method: I don't trade inside a box. I designed my method for this exact moment. Step 1: Let SOL pick a side — break 83.23 up, or break 80.46 down Step 2: Wait for the retest of whichever side breaks — it must hold Step 3: Only then I follow the break No break = No trade. I wait. I don't force it. My stop is just under 80.46, my entry is NOT in this caption. My exact entry and stop are on my SOLUSDT widget below — tap it and tell me if my box read is wrong. Tell me in the comments: Does SOL break the box up to 83.23, or down through 80.46? $SOLUSDT#IMPACTbyTrade
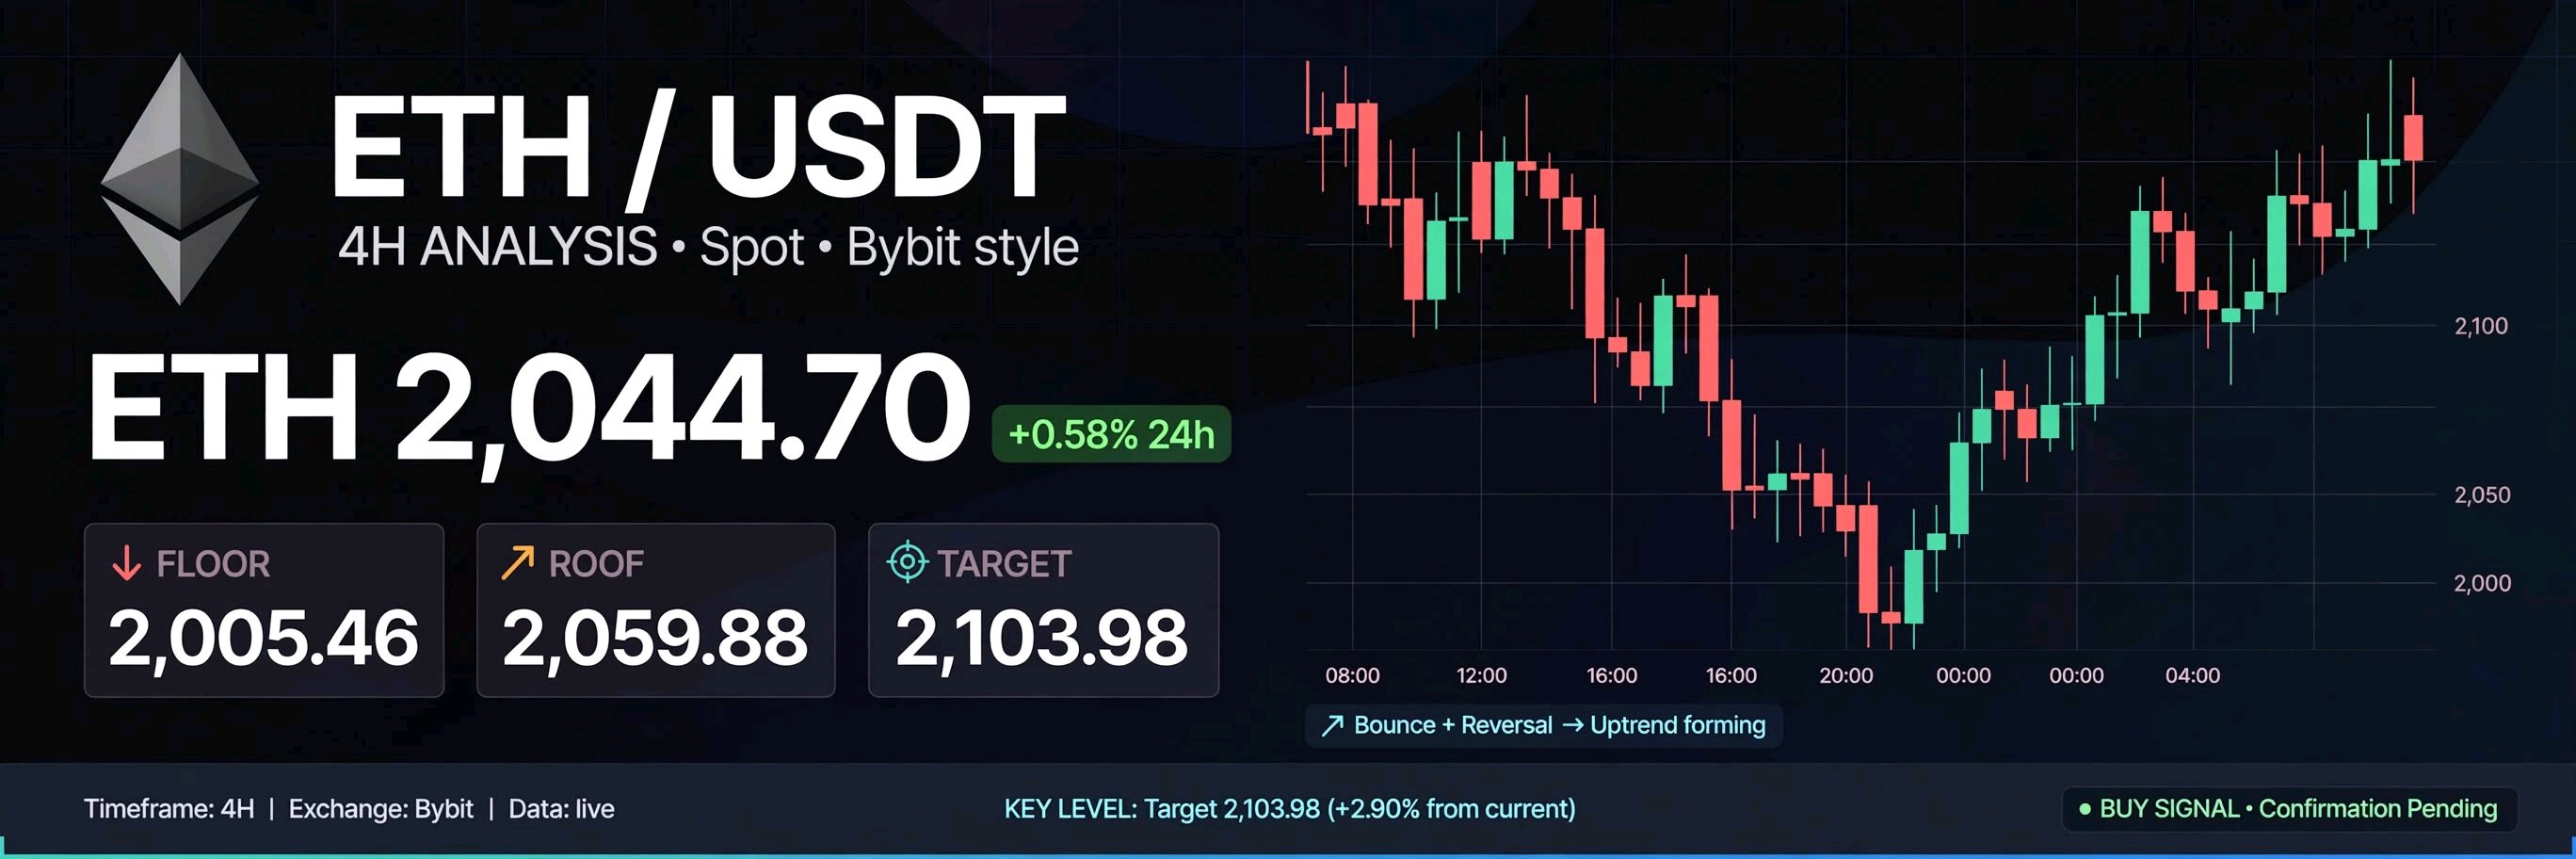
🚀 ETH 2,044.70 — FALLING KNIFE CAUGHT AT 2,005, NOW IT MUST PROVE IT ETH is at 2,044.70, -0.69% on the 4H. Forget the BTC squeeze. This is a different story. ETH fell like a knife from 2,254.49 straight down to 2,005.46. No bounce. No mercy. Then buyers finally caught it at 2,005.46 and pushed it back to 2,044.70. Now the question is not "will it squeeze?" The question is "was that catch real, or just a dead bounce before the next drop?" The Catch: 2,005.46 That is where the knife stopped. Three touches around 2,005.46, then a bounce. As long as price stays above 2,005.46, the catch is still valid. Below 2,005.46, the knife is falling again. The Test: 2,059.88 MA7 is 2,059.88. Price is sitting BELOW it — 2,044.70 vs 2,059.88. This is the test. ETH must get back above 2,059.88 to prove buyers are serious. Until then, sellers are still on top. The Wall: 2,118.60 MA14 is 2,063.14, MA28 is 2,118.60. Both are sitting ABOVE price. That is a wall. ETH has to climb through 2,063.14 first, then 2,103.98, then 2,118.60. One by one. Volume: 3.28K vs MA5 9.53K vs MA10 12.68K Volume is DOWN 65%. The catch at 2,005.46 had no power behind it. Buyers caught the knife, but they are not pushing yet. They are waiting to see if 2,005.46 holds on the close. BTC Link: BTC is at 73,512.4, -0.23%. ETH is down -0.69% while BTC is down -0.23%. ETH is weaker than BTC. If BTC holds 72,727.2, ETH can test 2,059.88. If BTC breaks, ETH will drop straight back to 2,005.46. 4H Close: 1 hour 00 minutes left. I don't trade the wick. I trade the close. Close above 2,059.88 = Catch is real, I look for long to 2,103.98 Close between 2,005.46 - 2,059.88 = Still proving, I wait Close below 2,005.46 = Catch failed, no trade 24H High: 2,103.98 24H Low: 2,035.94 24H Turnover: 162.00M My Plan — My Method: I don't catch falling knives. I designed my method for this exact moment. Step 1: Let ETH hold 2,005.46 on the 4H close Step 2: Let it break 2,059.88 and hold it Step 3: Only then I look for long to 2,103.98, then 2,118.60 No hold = No trade. I wait. I don't force it. My stop is just under 2,005.46, my entry is NOT in this caption. My exact entry and stop are on my ETHUSDT widget below — tap it and tell me if my catch read is wrong. Tell me in the comments: Was 2,005.46 a real catch, or just a bounce before another drop?$ETHUSDT#IMPACTbyTrade