LoraCrypto
5739Like0Shares222Fans388Follow
Ethereum ($ETH): The Smart Contract King Bleeds as Sellers Drive Price Toward Critical Lower Boundaries Ethereum remains the undisputed settlement layer for the majority of on-chain activity, DeFi, and institutional experiments. That fundamental position has not prevented a sharp corrective wave. After an expansion that carried price into the mid-$2,400s earlier this month, profit-taking and broader risk-off flows have produced a violent sell-off. At roughly $1,912, ETH is now down approximately 22% from its recent local high near $2,450 and is actively probing the critical $1,900–$1,905 zone that has defined the lower edge of the current range. **Moving Averages** Price sits well below the daily EMA200, currently near $2,298. The gap is substantial—roughly 17%—and the distance itself increases the risk of liquidity hunts and stop runs as market makers probe for residual bids beneath the average. The sell-off has been severe enough that even short-term EMAs have rolled over and are now acting as dynamic resistance, confirming that the dominant structure remains corrective rather than constructive. **Fibonacci Levels** From the recent swing high, price has already pierced the 1.0 extension and is pressing toward the 1.272–1.618 zone clustered around $1,880–$1,920. A clean loss of this band would open the path toward the 2.618 extension, which sits meaningfully lower and would represent a more aggressive price-discovery leg. For now, the market is treating the 1.0–1.272 confluence as the immediate battleground. **MACD** DIF: –108.2 | DEA: –82.4 | Histogram: –25.8 The indicator remains deeply submerged in negative territory. The histogram is still negative, yet the most recent bar has narrowed fractionally—early evidence of momentum exhaustion rather than a confirmed reversal. Until the histogram flips positive and the DIF crosses back above the DEA, any bounce must be viewed as a relief move inside a larger downtrend. **RSI** RSI6: 19.4 | RSI12: 26.1 | RSI24: 34.8 All three readings are in or near extreme oversold territory. RSI6 is particularly stretched, leaving the market vulnerable to a sharp but short-lived relief bounce. The divergence between the faster and slower RSIs, however, also leaves room for a further cascade if support fails before buyers step in with size. **Volume** Current volume is running below both the MA5 and MA10 on the daily chart and has been alarmingly thin relative to the size of the recent decline. Low participation undermines the validity of the move in both directions: it increases the chance of a sudden liquidity vacuum lower, while also making any bounce fragile until volume expands meaningfully on the way up. **Key Price Levels** - **Immediate Support:** $1,905–$1,900 (24-hour low and psychological floor, aligned with the 1.0–1.272 Fib confluence). A decisive break opens the abyss toward $1,850–$1,820. - **Critical Psychological Floor:** $1,850. Loss of this level would confirm a deeper corrective phase and likely trigger another wave of forced selling. - **Immediate Overhead Resistance:** $2,050 (recent breakdown level and 24-hour high area). - **Trend-Defining Resistance:** $2,298 (daily EMA200). Reclaiming this average would be the first structural signal that the corrective phase is losing control. - **Prior Structural Breakdown:** $2,250–$2,300 zone, which now acts as heavy supply. **What Comes Next?** The immediate outlook remains precarious. The market is compressed against lower boundaries with oversold readings but without confirming volume or momentum reversal. **Bearish Scenario** Failure to hold $1,900 triggers a cascade of liquidations. Stops beneath the psychological level accelerate the move, and price enters a brief period of discovery toward the $1,820–$1,850 pocket. Thin volume would amplify the speed of the decline. **Bullish Scenario** A relief rally requires a decisive reclaim of $1,980–$2,050 on expanding volume, followed by a higher low. Only then does the oversold RSI begin to matter. Anything short of that remains a dead-cat bounce inside the larger corrective structure. **My Market Perspective** The chart is squarely in the crosshairs of a severe corrective phase. The most important thing to watch is volume behavior at the $1,900 level—specifically whether bids arrive with conviction or whether the market simply walks lower on thin participation. Trying to catch this falling knife is a fool’s errand. Patience for a definitive higher low and a clear shift in momentum is the only disciplined path. Survival in this environment belongs to those who refuse to force trades while the market is still bleeding heavily. $ETHUSDT #ByXIMPACT
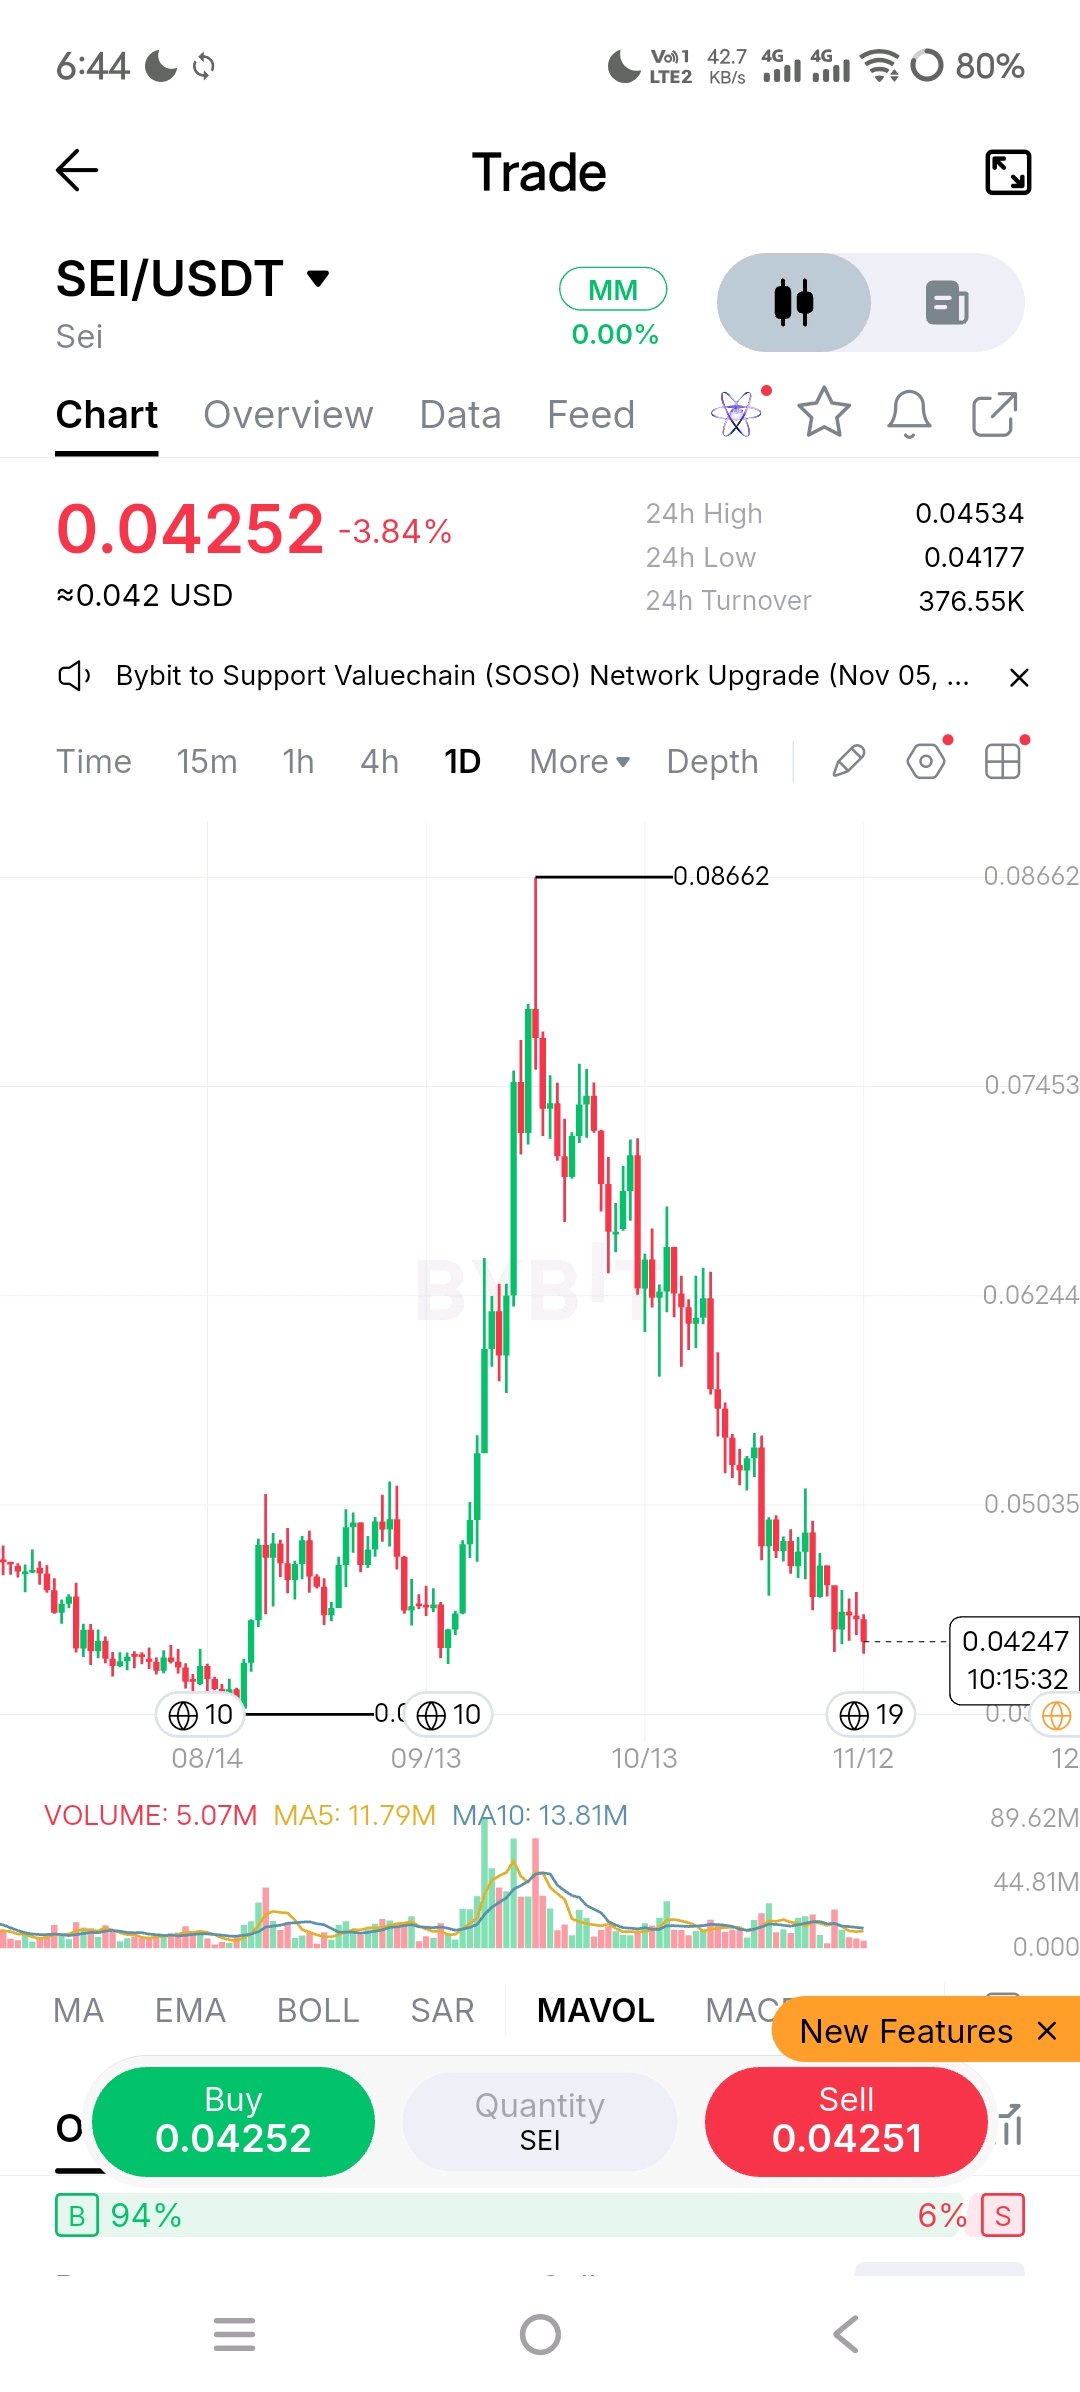
SEI is trading near multi-year lows just above its August 2026 bottom, while the network advances a major upgrade for institutional trading and tokenization. The key question is whether Giga upgrades and RWA activity can reverse years of underperformance, or if low usage and unlocks will keep the token stuck near cycle lows. Current Market Picture As of 12 November 2026, SEI trades near **$0.0425**, down ~3.5–4.5% in 24 hours and ~12% over the past week. It is down roughly 31–32% monthly and ~76% over the past year. Market cap is $285–325 million, with 24-hour volume typically $12–16 million. SEI remains ~96% below its March 2024 high of $1.14 and only about 10% above its August 2026 low near $0.0383. Market Structure Price sits well below the 50-day (~$0.060) and 200-day (~$0.055) moving averages, confirming a clear downtrend. Daily RSI is in the low-to-mid 30s (near oversold). Immediate support is $0.038–0.039; a break lower opens more downside. Reclaiming $0.045–0.050 would be the first positive signal. # The Bigger Market Story Sei is a high-speed Layer 1 built for trading and is moving to an EVM-only stack. SIP-6 (Autobahn) passed in early November, targeting 200,000 TPS and ~400 ms finality as part of the Giga upgrade. The network has attracted tokenized products from managers such as Apollo, BlackRock, and Ondo, plus a CoinShares staked SEI ETP. However, current metrics are modest: DeFi TVL near $20.8 million, ~15,000 active addresses, and limited DEX volume — well below earlier peaks. Bullish vs Bearish **Bullish:** Price near cycle lows + major technical upgrade and RWA traction could deliver outsized upside if usage improves. **Bearish:** Low TVL, weak daily activity, and ongoing unlocks show limited organic demand so far. Failure of Giga or broader weakness could break recent lows. Final Verdict SEI is a high-beta upgrade play near its cycle low. The decisive factor is whether Giga drives real growth in trading activity and TVL. Until then, price action around $0.038–0.039 will show if the market is basing or setting up for further downside. $SEIUSDT #ByXIMPACT

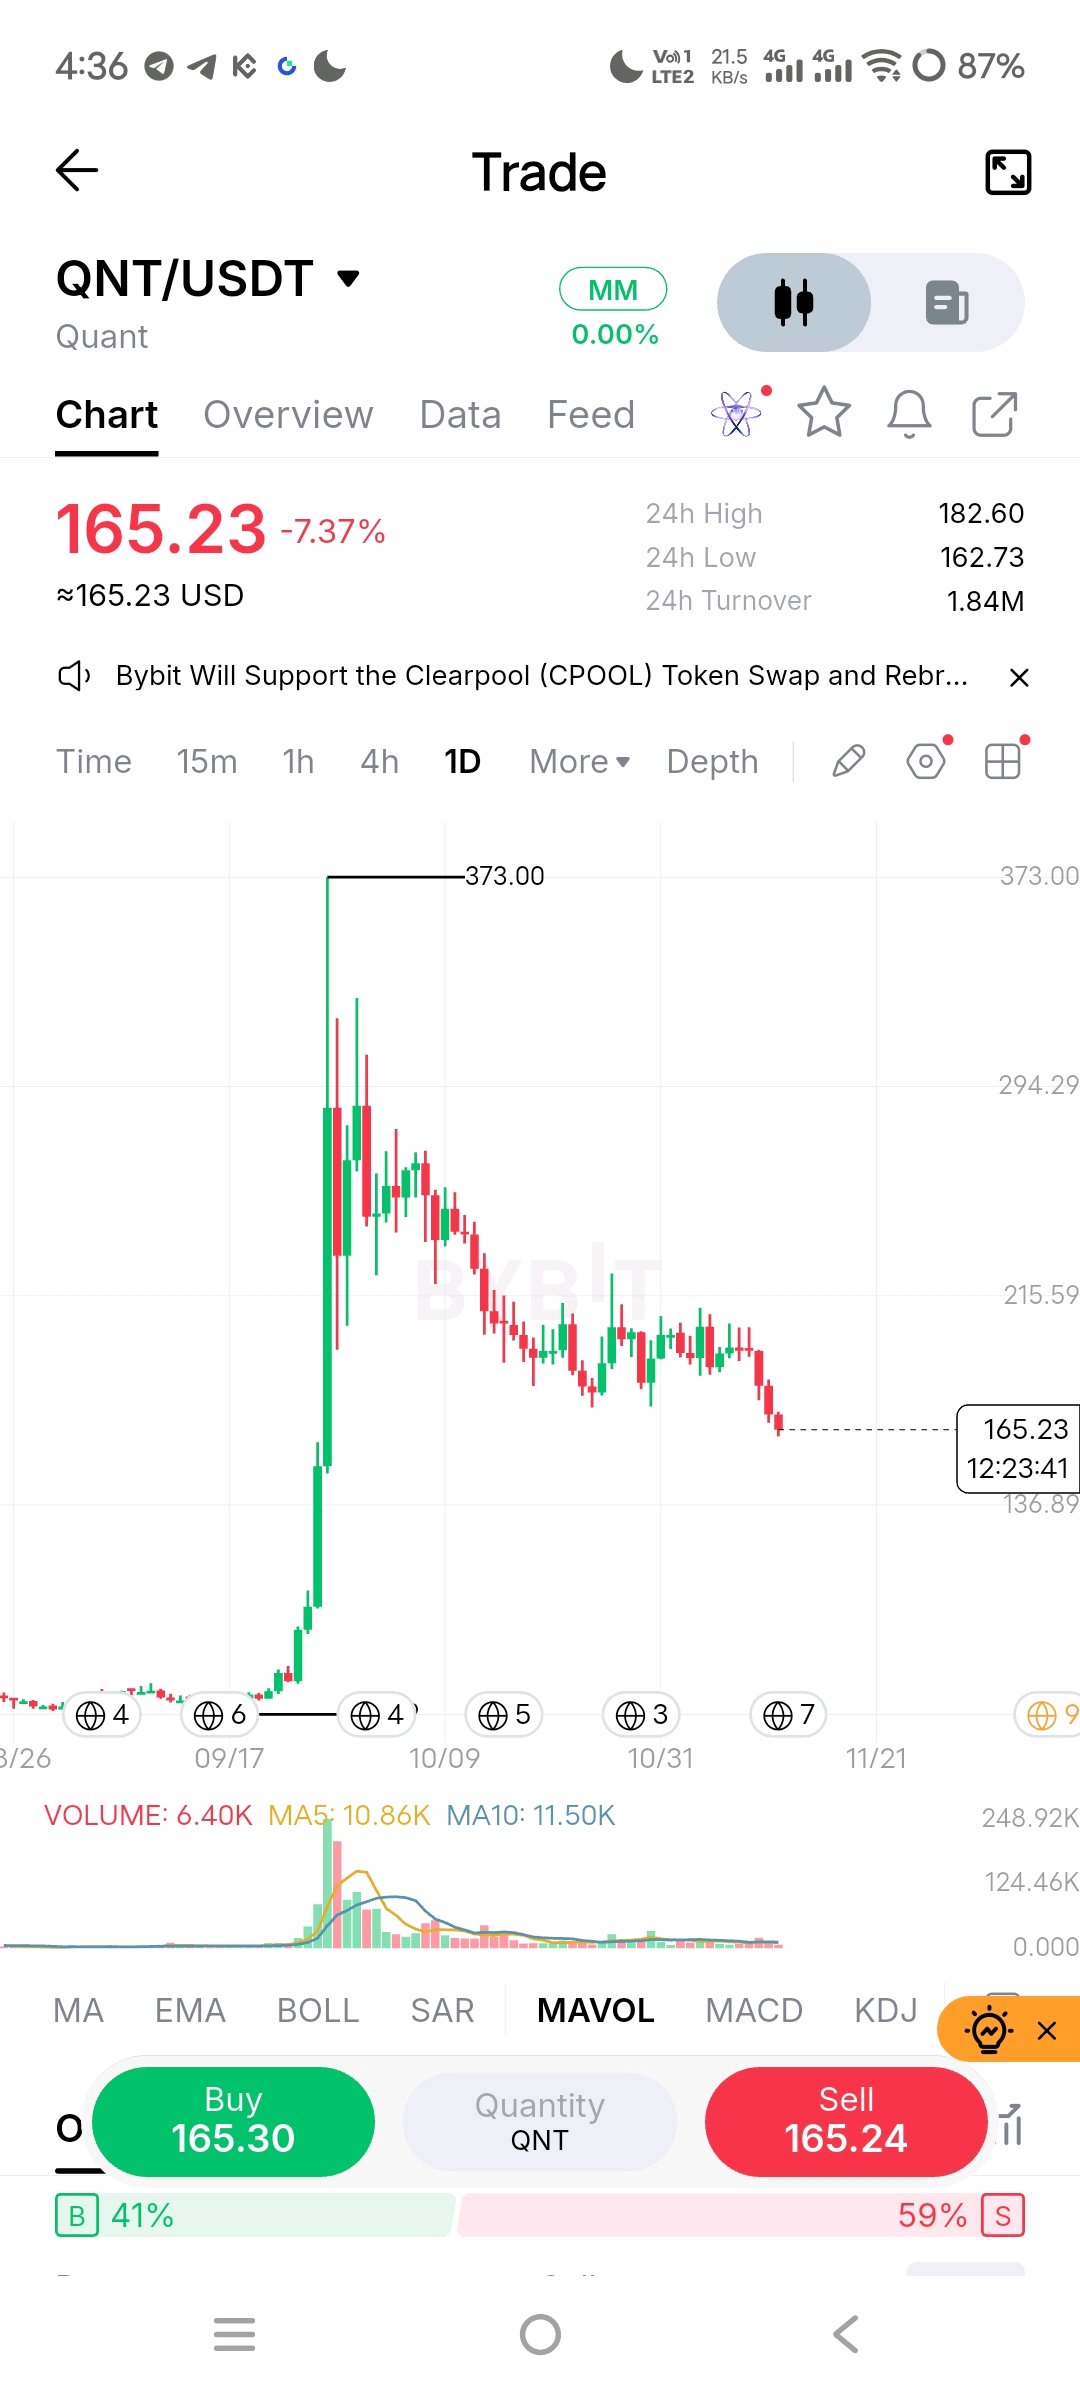
Quant Network: Bridging Chains Quant (QNT) operates as the native asset of the Quant Network, a protocol fundamentally designed to solve blockchain interoperability. Unlike traditional cross-chain bridges that lock assets in smart contracts, Quant’s core product, Overledger, functions as a blockchain operating system. It connects disparate distributed ledger technologies and legacy financial systems securely, without requiring network forks. A documented fact of QNT’s tokenomics is its strict supply model. The network has a hard maximum supply of approximately 14.61 million tokens, with all units already minted and in circulation. This fixed supply creates a deflationary pressure mechanism, especially as network usage potentially requires tokens to be locked or burned for licensing. From a market perspective, QNT is distinctly positioned as an institutional and enterprise-focused asset. The narrative heavily revolves around central bank digital currencies (CBDCs) and traditional finance integration. Quant has documented involvement in CBDC research, notably collaborating with the Bank of England, alongside various enterprise partnerships aimed at modernizing financial infrastructure. Analytically, the market interprets QNT not as a high-speed retail chain, but as critical backend infrastructure for global finance. The value proposition relies on the premise that the future of finance will be multi-chain and multi-asset, requiring a neutral, secure layer to facilitate communication between them. Overledger’s ability to interact with both public and private ledgers gives it a unique structural advantage in this specific niche. However, a clear distinction must be made between documented partnerships and actual commercial scale. While enterprise interest and pilot programs are factual, the transition from pilot phases to massive, revenue-generating commercial deployment is the primary analytical variable. In conclusion, the market is currently pricing in Quant’s strong institutional narrative, its proven interoperability technology, and its highly favorable fixed-supply tokenomics. Investors are valuing the project based on its potential to become the standard operating system for global finance. What still needs to be proven is large-scale, recurring commercial adoption of Overledger by traditional financial institutions. Until enterprise usage translates into measurable, sustained network revenue and widespread operational deployment, QNT will remain a highly promising infrastructure play waiting for its ultimate commercial catalyst. $QNTUSDT #ByXIMPACT

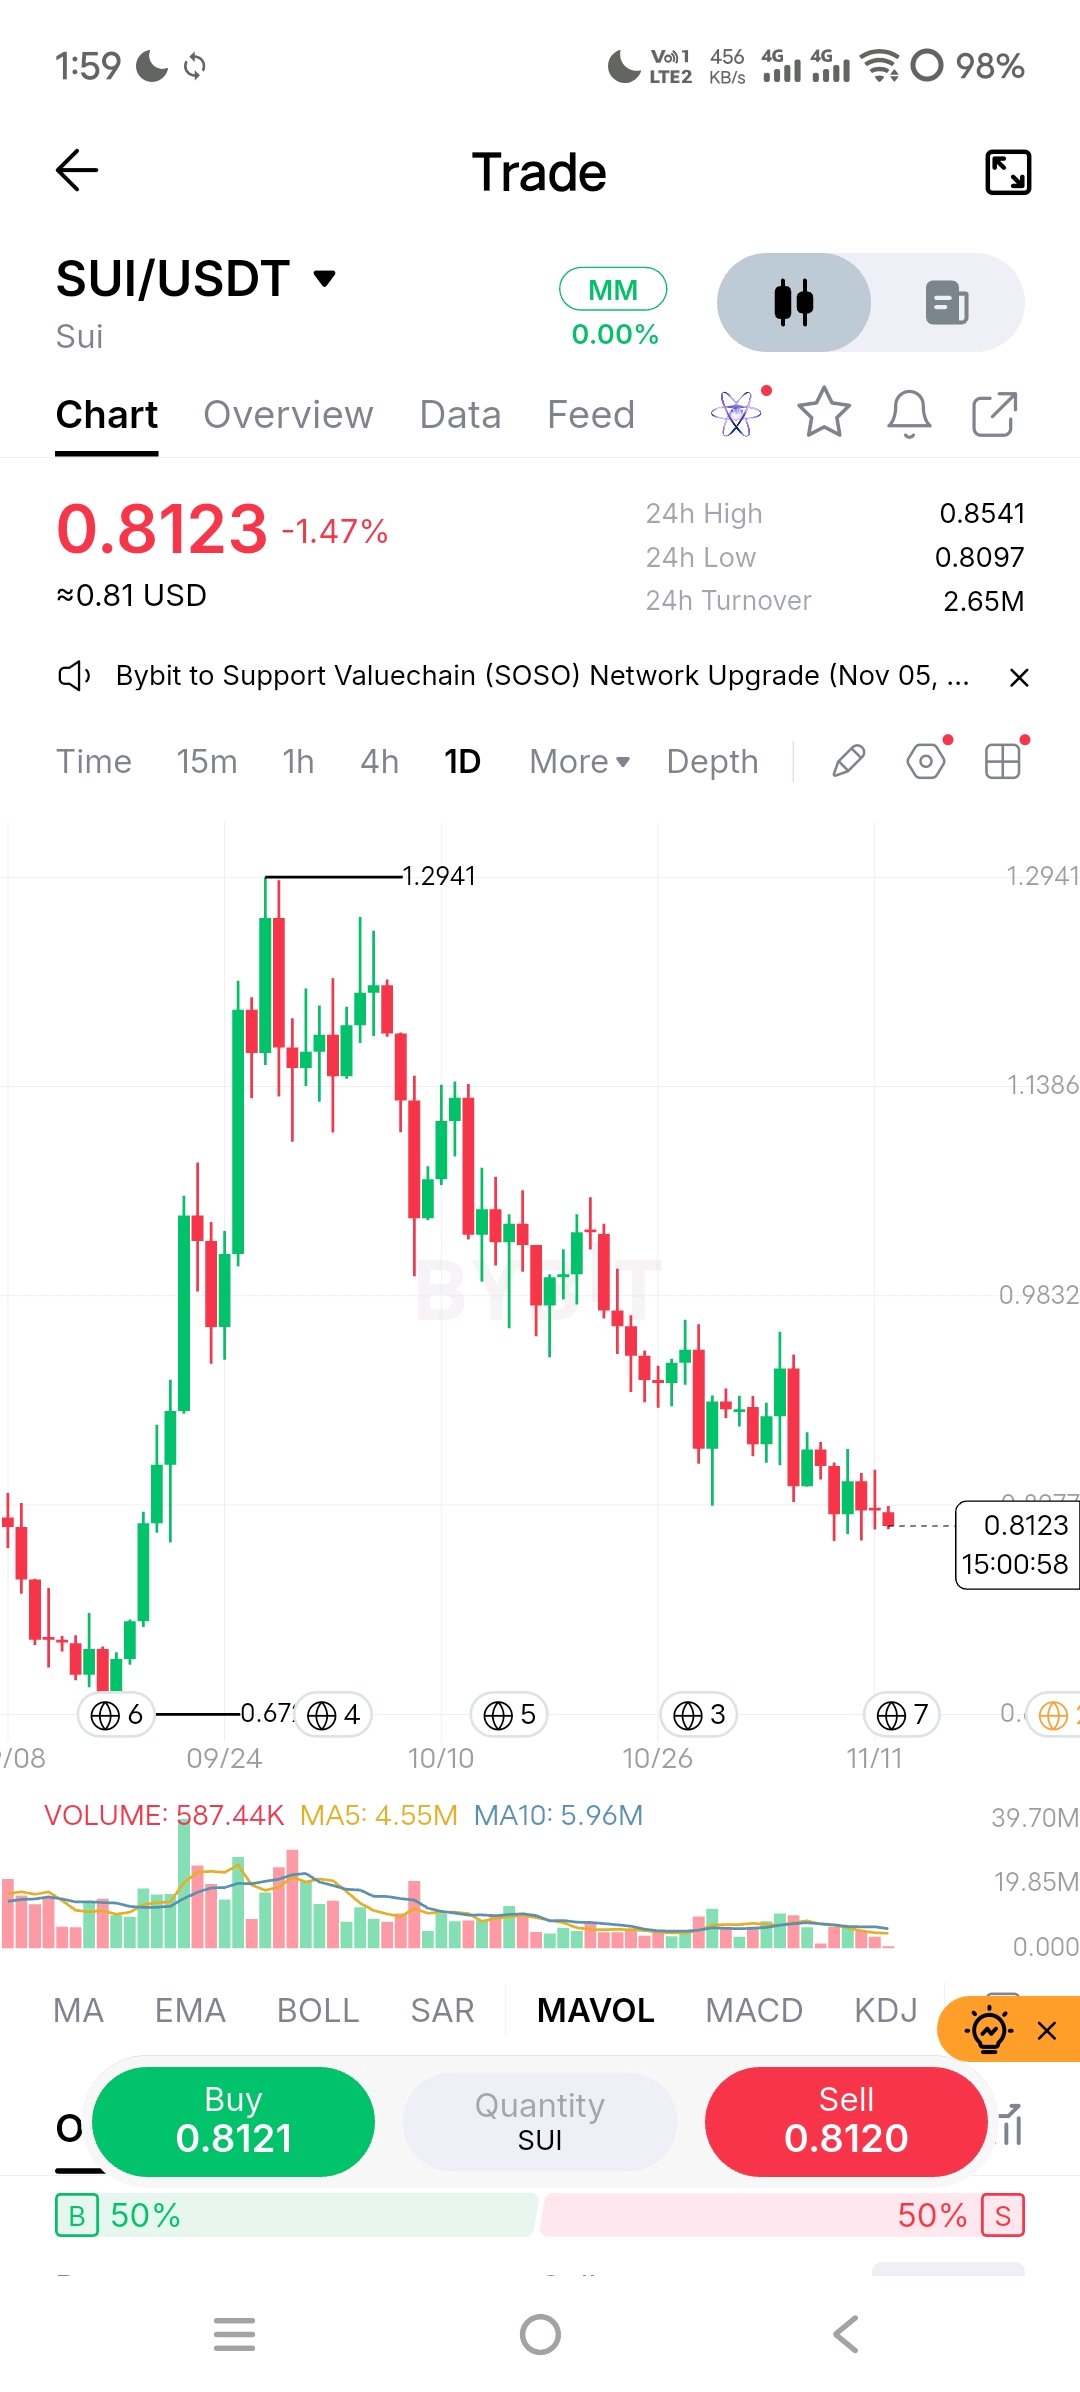
SUI is currently in a slow downtrend after a big price jump in September. The price is now around 0.81 USDT, sitting right above the important 0.80 support level. If it drops below 0.80, it could fall further to the 0.67 level. On the other hand, the 1.00 price mark is now a strong ceiling that is hard to break. Trading volume is very low right now. This means sellers are running out of coins to sell, but buyers are also not stepping in yet. The market is simply waiting for a clear direction. Behind the scenes, SUI faces two main challenges. First, it has tough competition from other fast blockchains like Solana. Second, new SUI tokens are regularly unlocked and given to early investors. This increases the total supply of coins, which naturally pushes the price down over time. For now, the best strategy is to wait and watch. Do not try to buy the dip yet. If the price stays above 0.80 and starts going up with higher trading volume, it could be a safe time to buy. But if it closes below 0.80, it is much safer to wait until it reaches the 0.67 level before making any moves. Patience is the best tool right now. $SUIUSDT #ByXIMPACT
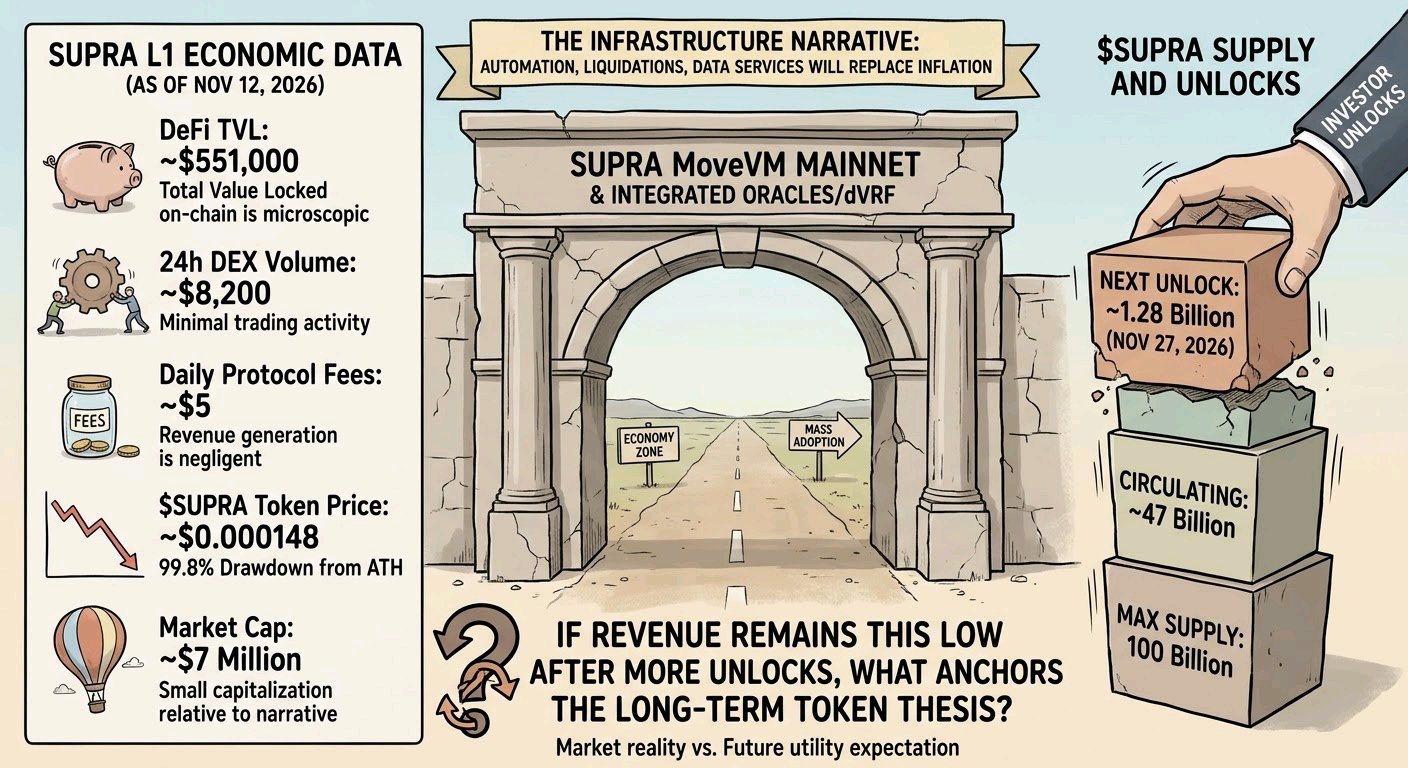
Two years after Supra’s MoveVM mainnet and $SUPRA TGE on November 27, 2024, DefiLlama shows roughly $551,000 in DeFi TVL and about $8,200 in 24-hour DEX volume as of November 12, 2026. Daily protocol fees sit near $5. CoinMarketCap lists the token at approximately $0.000148 with a ~$7 million market cap, circulating supply of ~47 billion out of a 100 billion maximum, and a 99.8% drawdown from the December 8, 2024 all-time high of $0.07345. The core claim is that native oracles, dVRF, automation, and AutoFi primitives built into the same Moonshot consensus layer will capture recurring revenue (liquidations, task fees, data services) and progressively replace inflationary block rewards. In practice the on-chain economy remains microscopic. Most reported oracle activity still occurs on external chains; the Supra L1 itself has not generated material fee income or sustained liquidity. Token unlocks continue (next scheduled release of ~1.28 billion tokens on November 27, 2026), while realized value capture has not scaled with the infrastructure narrative. The market treats the vertical-integration thesis as a near-term driver of demand and security. The observed data show that technical capability and cross-chain oracle presence have not yet translated into local economic activity capable of absorbing new supply or supporting the token’s utility functions. Until on-chain fees, TVL, or active AutoFi usage rise by orders of magnitude, the sustainability claim rests on future adoption rather than current mechanism performance. If native revenue generation remains this low after another year of unlocks, what still anchors the long-term token thesis? $SUPRAUSDT #ByXIMPACT
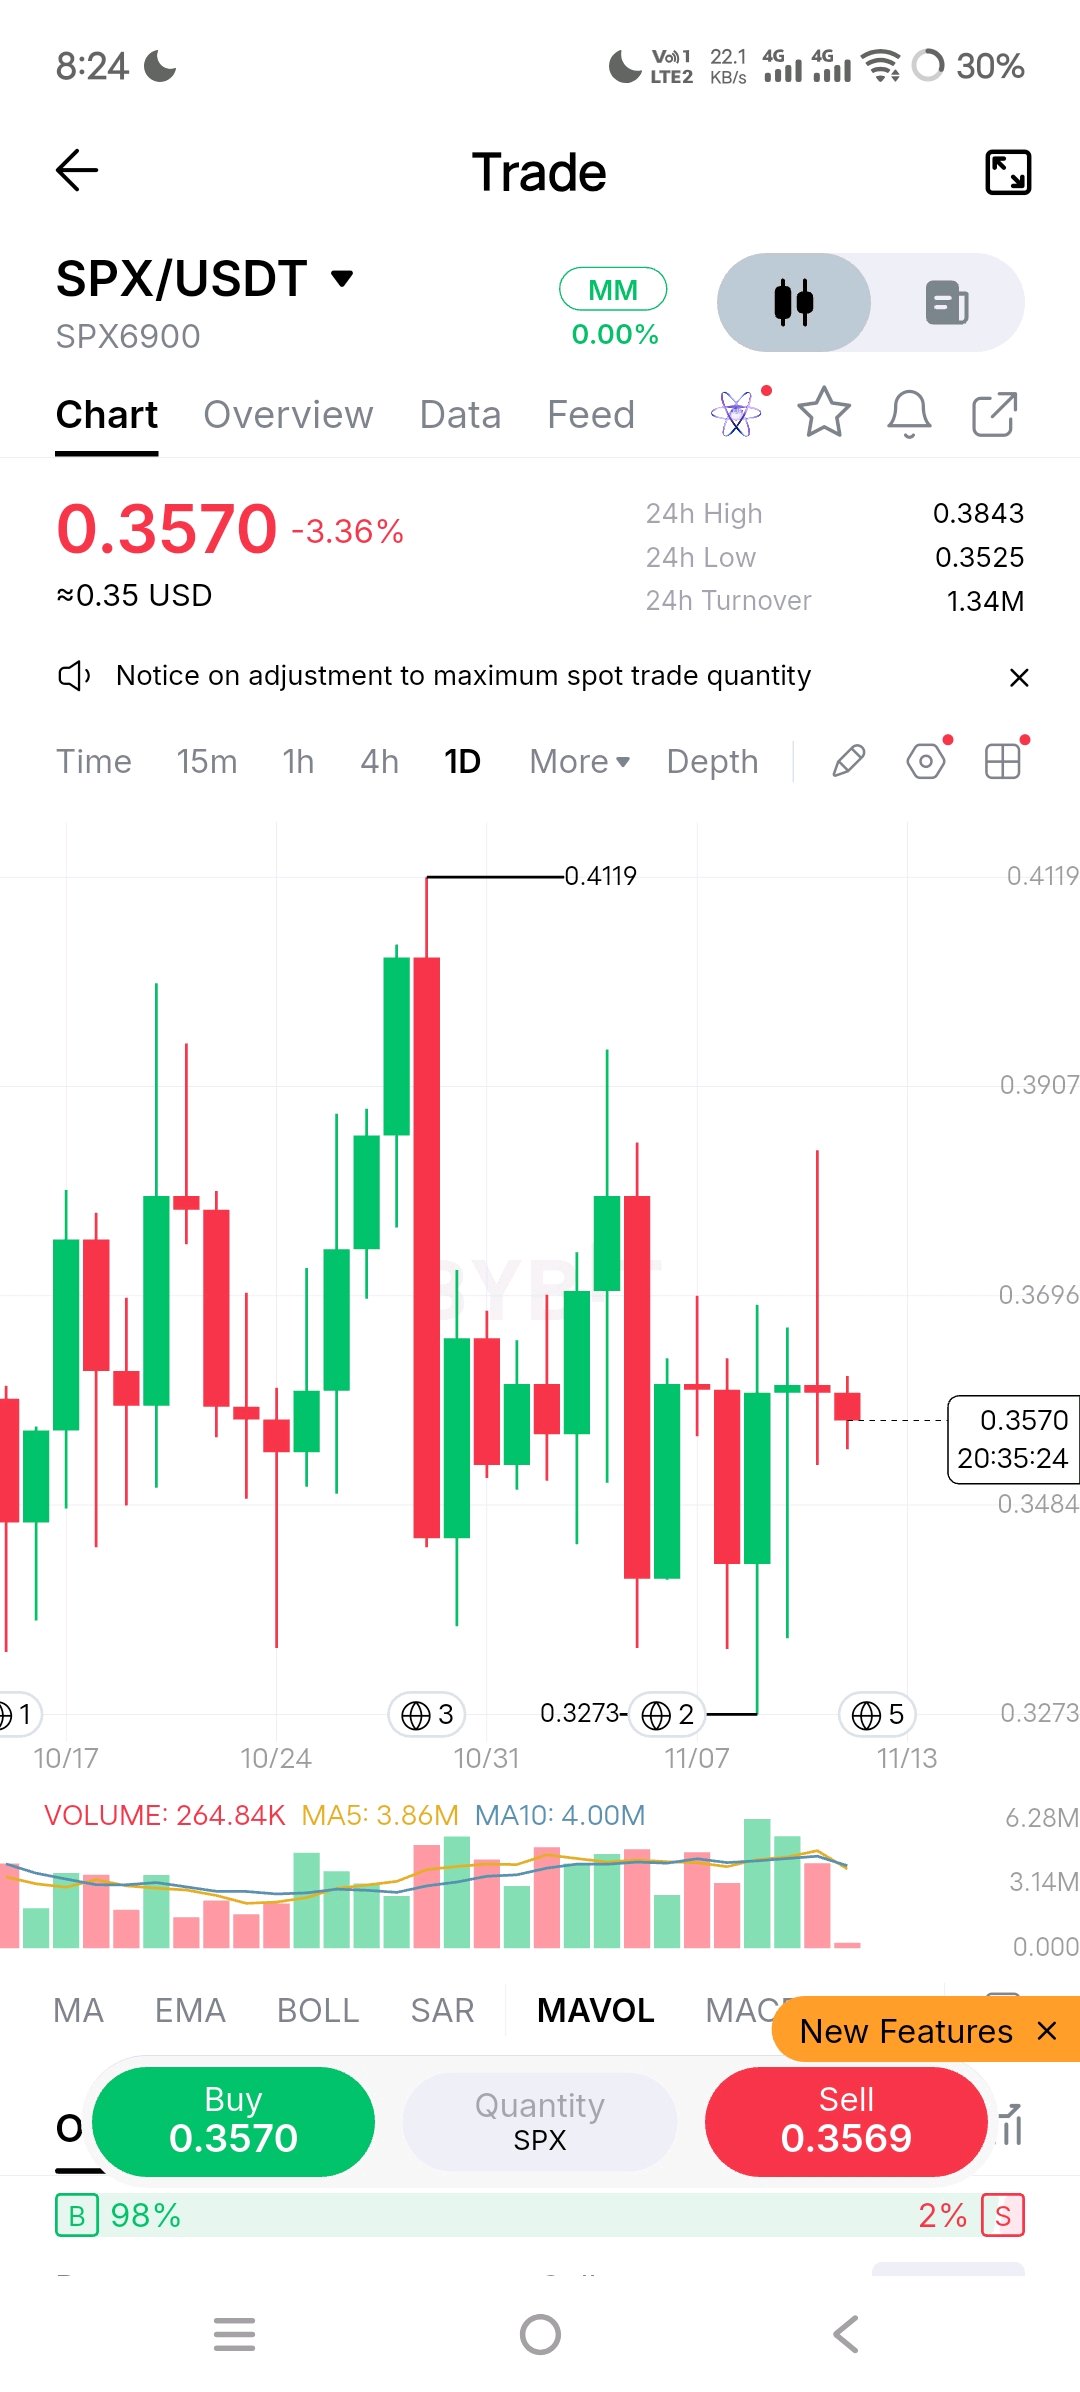
SPX/USDT – The Bleed Continues SPX sits at the intersection of speculative leverage and pure price discovery. After a sharp expansion that carried it toward 0.4119, the market has flipped into aggressive profit-taking. Price is now printing **0.3570**, down **-3.36%** on the day and probing critical lower boundaries after a decisive rejection from the recent local high. # Technical Indicators Breakdown **Moving Averages** Price remains deeply disconnected from the EMA200. The gap is wide enough to signal both liquidity hunting and potential further downside expansion. Until this gap begins to close with conviction, the structure stays firmly in corrective mode. **Fibonacci Levels** The current decline has already extended through the 1.0 and is testing deeper extensions. Price is interacting with the 2.618–3.618 zone, a region that frequently either produces violent capitulation or the first meaningful bounce. No clean reclaim has occurred yet. **MACD** DIF sits at approximately -0.0084, DEA at -0.0061, with the histogram still submerged in negative territory at -0.0023. A tiny green histogram bar has appeared on the latest candle—early, fragile evidence of momentum exhaustion, but nowhere near a confirmed crossover. **RSI** RSI6 is deeply oversold near 22. RSI12 is hovering around 28, and RSI24 remains weak near 34. The short-term readings are stretched enough to allow a relief bounce, yet the intermediate readings still leave the door open for another leg lower if sellers remain in control. **Volume** Current volume is **264.84K** against MA5 of 3.86M and MA10 of 4.00M. Volume is alarmingly thin. Moves on dead volume lack validity and often reverse violently once real participation returns. # Key Price Levels - **Immediate Support**: 0.3525 (24h low / aligned with recent Fib extension). A clean break here opens the abyss toward the next liquidity pocket near 0.3270–0.3300. - **Critical Psychological Floor**: 0.3400–0.3450. Losing this zone would accelerate liquidation cascades. - **Immediate Resistance**: 0.3650–0.3700 (first Fib reclaim zone). - **Trend-Defining Resistance**: EMA200 and the prior structural breakdown area near 0.3850–0.3900. Reclaiming and holding above this region is the minimum requirement for any meaningful shift in character. # What Comes Next? The immediate outlook remains precarious. Price is balanced on a thin edge with low conviction volume. **Bearish Scenario** A decisive break and close below 0.3525 triggers another wave of liquidations. Price discovery to the downside accelerates, targeting the 0.3270 region and potentially lower as trapped longs exit. **Bullish Scenario** A relief rally requires two things: a sharp surge in volume and a clean reclaim of 0.3650–0.3700 that holds on the retest. Without that combination, any bounce remains a dead-cat move. My Market Perspective SPX is currently in the crosshairs of a severe corrective phase. The most important thing to watch is **volume**. Thin volume on further downside is dangerous; thin volume on any bounce is equally suspect. Trying to catch this falling knife is a fool’s errand. Wait for a definitive higher low paired with expanding volume and a reclaim of key resistance before considering long exposure. Discipline is the only edge that survives these environments. Stay patient. The market will eventually show its hand—until then, capital preservation is the only trade that matters. $SPXUSDT #ByXIMPACT
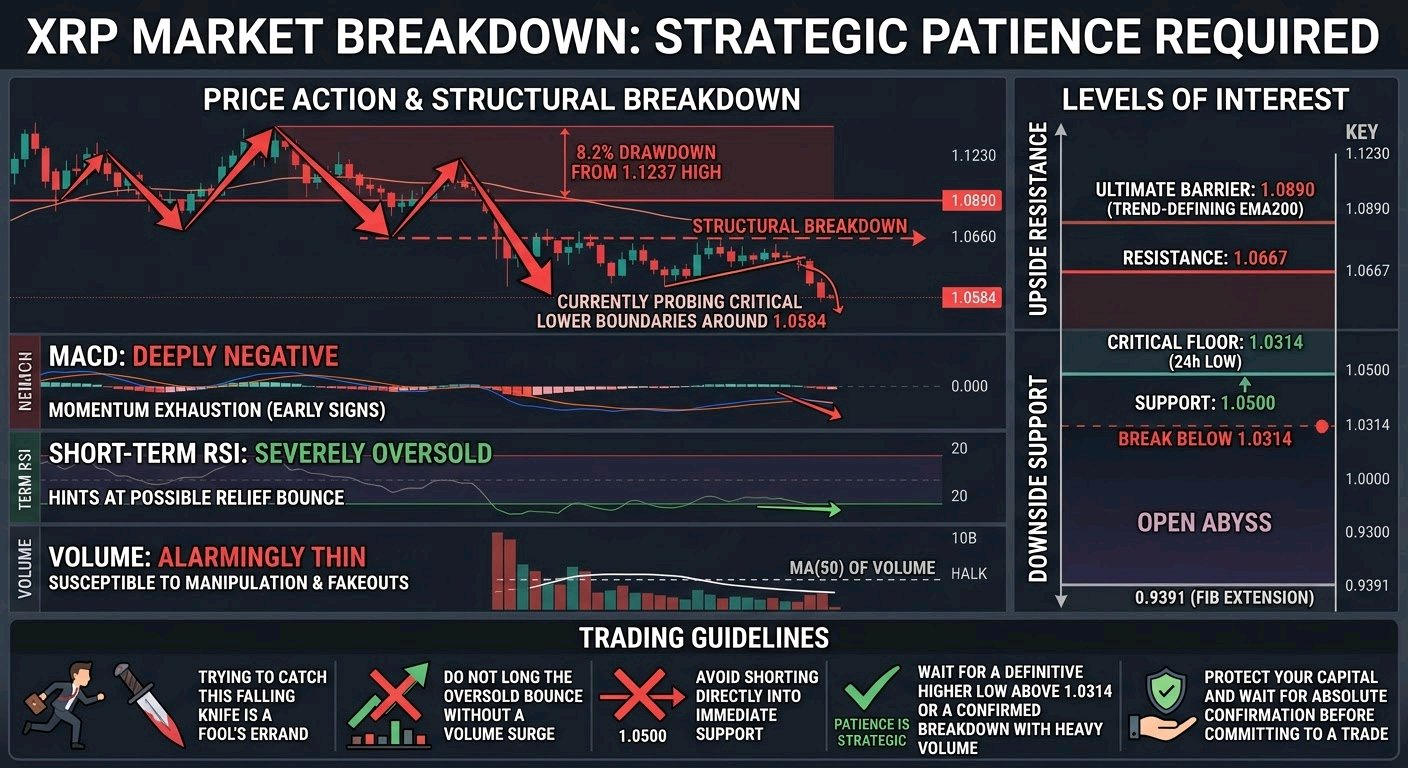
XRP is bleeding heavily after a violent expansion, currently probing critical lower boundaries around 1.0584 following an 8.2 percent drawdown from the 1.1237 high. The asset is in a structural breakdown, trading well below the 1.0890 EMA200. Technically, the MACD remains deeply negative despite early signs of momentum exhaustion, and the short-term RSI is severely oversold, hinting at a possible relief bounce. However, volume is alarmingly thin, sitting at less than half the moving average, making any current price action highly susceptible to manipulation and fakeouts. Immediate support rests at 1.0500, with the critical structural floor at the 24h low of 1.0314. A decisive break below 1.0314 opens the abyss toward 1.0000 and the 0.9391 Fibonacci extension. On the upside, resistance looms at 1.0667, with the trend-defining 1.0890 level acting as the ultimate barrier for any meaningful recovery. Trying to catch this falling knife is a fool's errand. Do not long the oversold bounce without a volume surge, and avoid shorting directly into immediate support. Wait for a definitive higher low above 1.0314 or a confirmed breakdown with heavy volume. Patience is strategic. Protect your capital and wait for absolute confirmation before committing to a trade. $XRPUSDT #ByXIMPACT
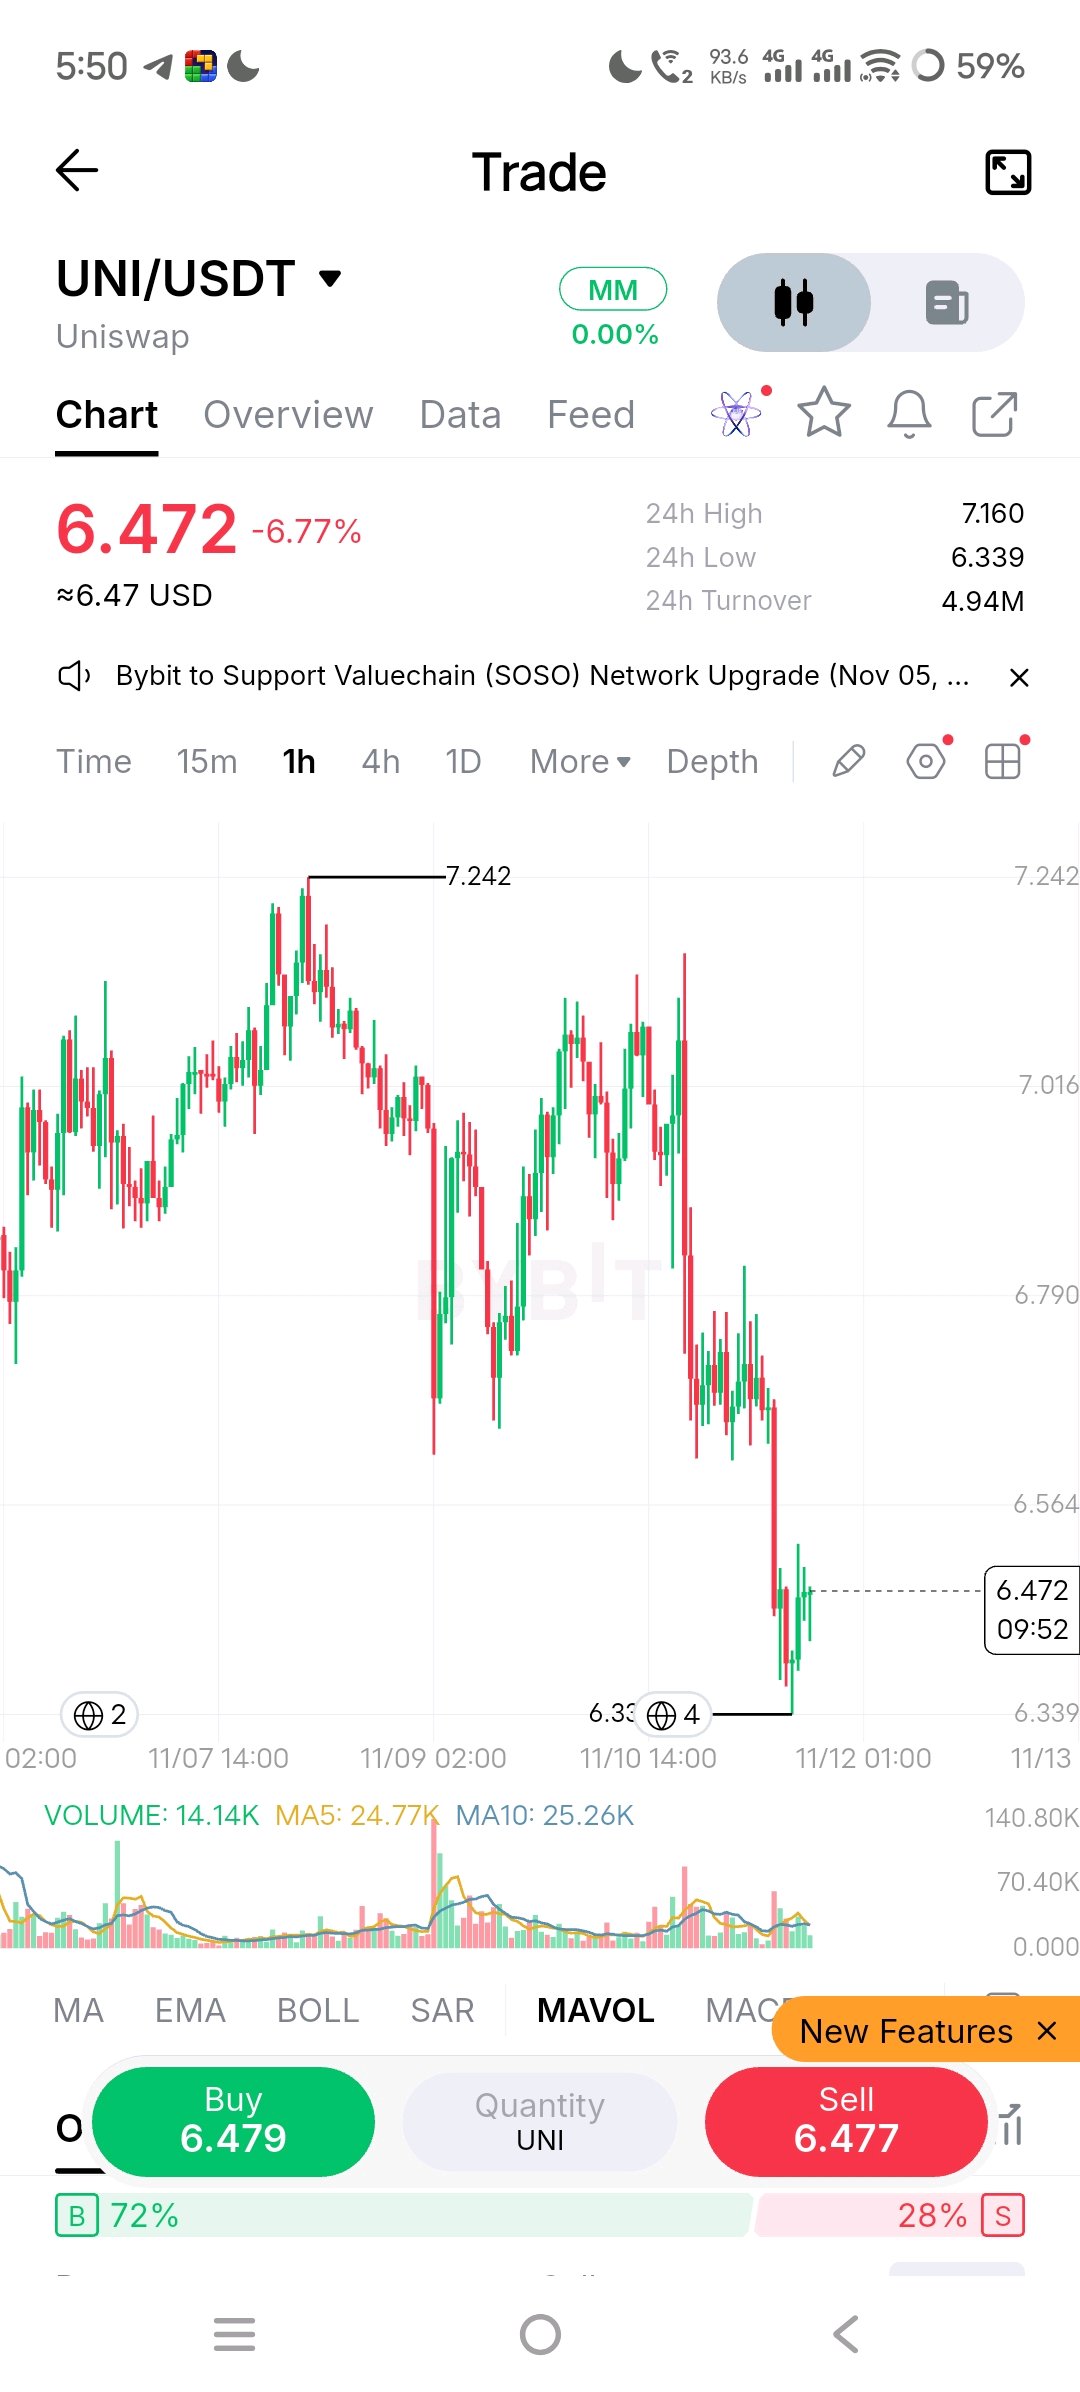
$UNI has bled out violently from 7.242 to 6.472 (-6.77%), probing critical lower boundaries in a desperate search for a floor. **Technical Breakdown:** Price is detached from the EMA200 (~6.85), signaling extreme selling pressure. We’ve smashed through Fib levels (6.69, 6.54) and are now at the 1.0 extension. MACD is deeply negative but hinting at exhaustion, while RSI6 is severely oversold at 26.4. Most alarming: volume is dead (14.14K vs 24K MA), suggesting this bounce lacks genuine buyer conviction. **Key Levels:** * **Support:** 6.339 (24h Low). A break here opens the abyss to 6.00. * **Resistance:** 6.564 (Immediate), 6.790 (Trend Defining). **What Comes Next:** If 6.339 fails, expect a liquidation cascade down to 6.00. Bulls need to reclaim 6.564 with heavy volume immediately, or this is just a dead cat bounce. **My Perspective:** This falling knife is dangerous. The low-volume recovery to 6.472 is a massive red flag indicating short-covering, not accumulation. Do not FOMO. Wait for a definitive higher low or a high-volume breakout above 6.564. Survival requires discipline, not heroism. Sit on your hands until confirmation arrives. $UNIUSDT #ByXIMPACT
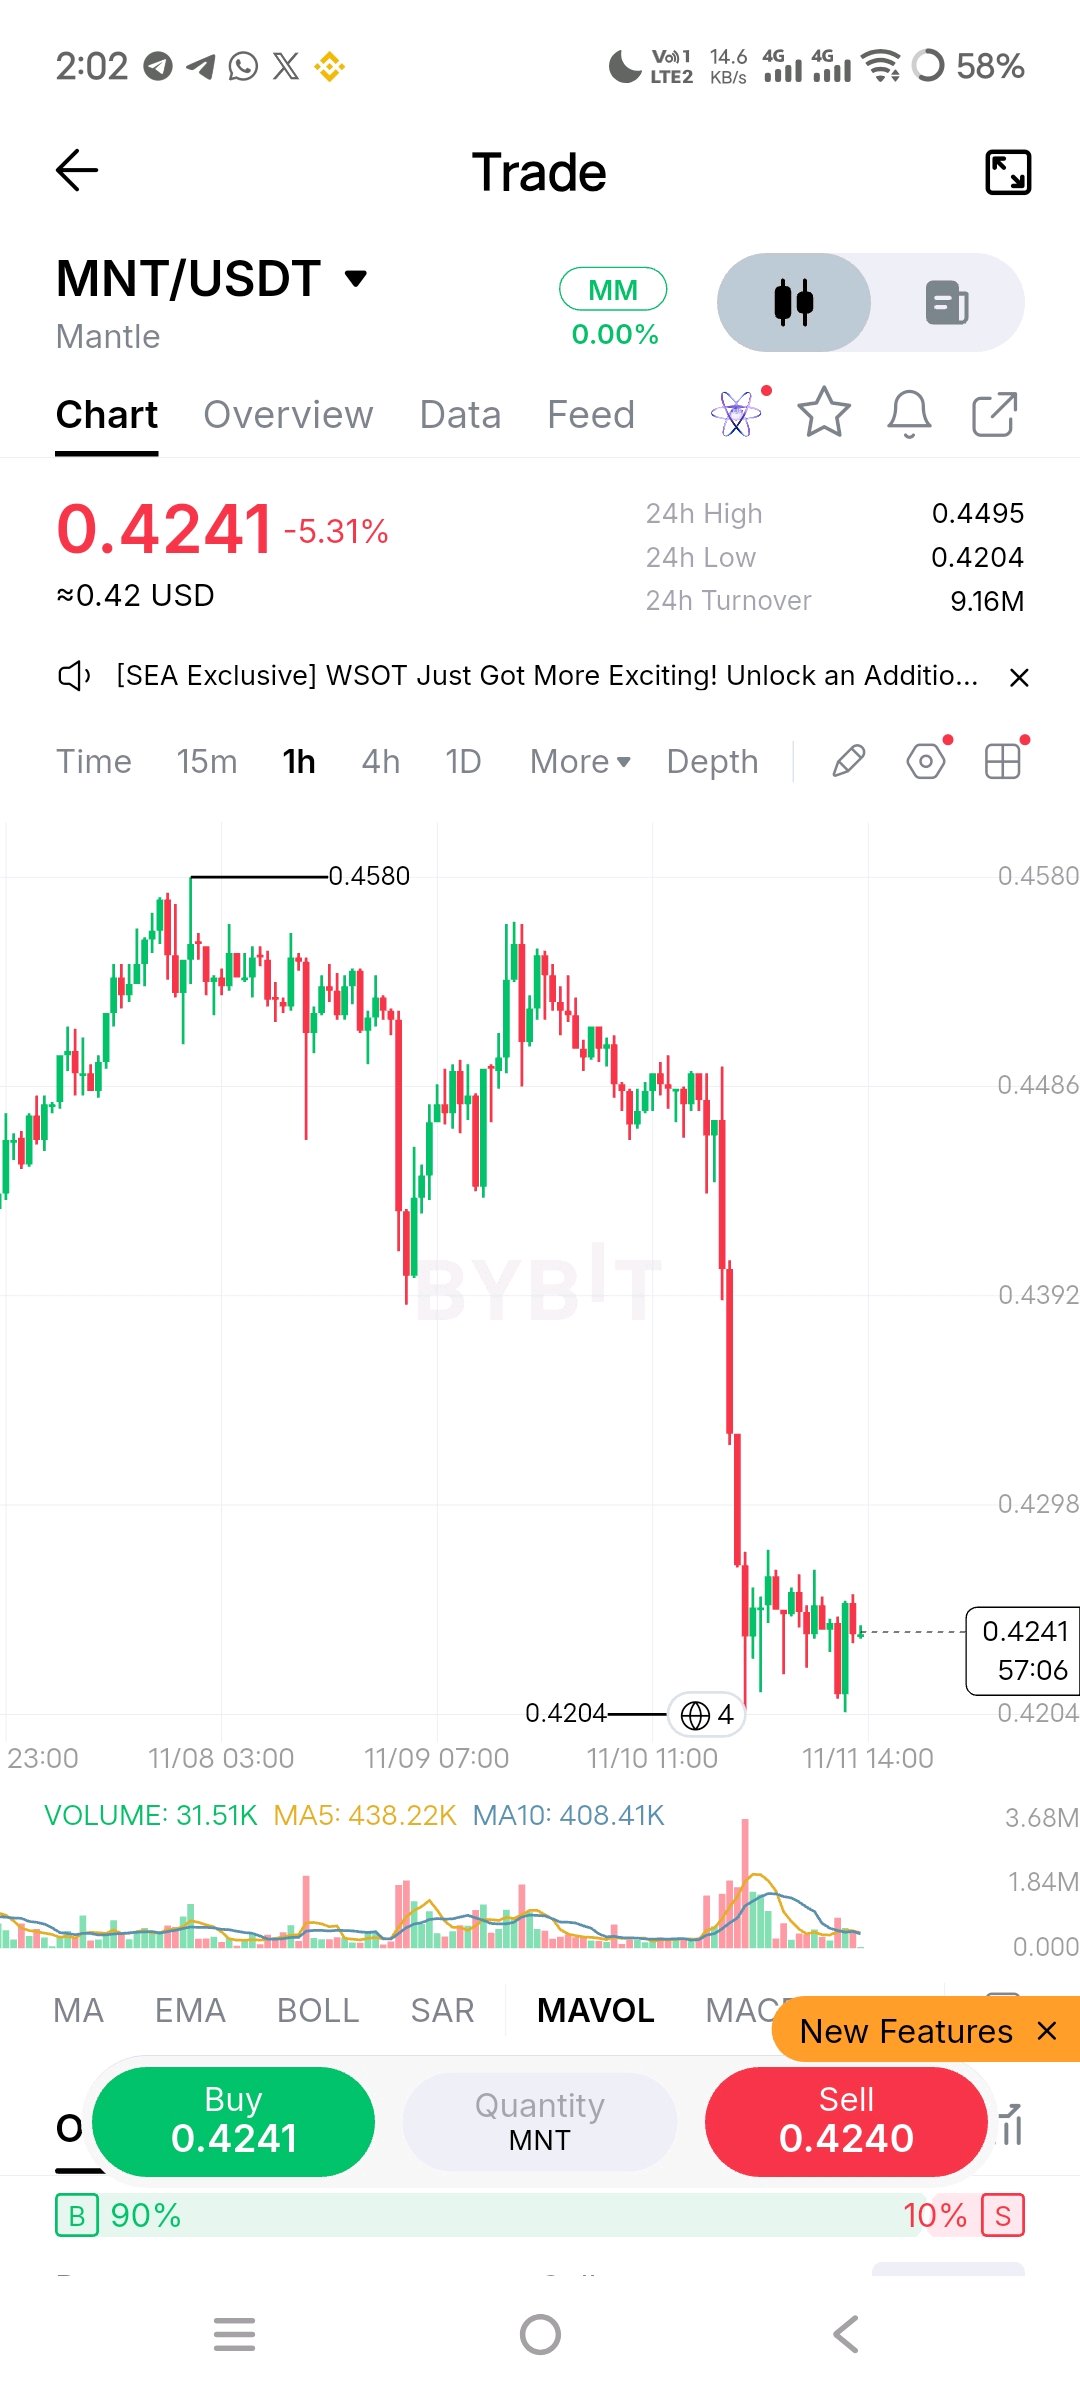
$MNTUSDT: The Mantle Illusion Shatters as Sellers Take Control Mantle ($MNT) positioned itself as a heavyweight Layer 2 contender, riding a massive treasury and aggressive ecosystem expansion. But narratives don't pay the bills when the tape turns red. Following a violent wave of speculative expansion, the asset is now bleeding heavily in a sharp, unforgiving correction. Profit-taking has turned into outright capitulation. Currently trading at **$0.6420**, has suffered a brutal **45% drawdown** from its local high of $1.1850. The price action is now probing critical lower boundaries, and the bulls are staging a desperate search for a floor. *** ### Technical Indicators Breakdown **Moving Averages & Trend Structure** The price is currently trading dangerously far below the **EMA200 at $0.8250**. This massive gap highlights the sheer severity of the sell-off. When an asset disconnects this far from its long-term mean, it creates a massive liquidity void. In these zones, manipulation risks skyrocket, and thin order books can lead to exaggerated, violent wicks in both directions. **Fibonacci Levels** We are watching a textbook retracement of the last major impulse leg. The price violently rejected the 1.0 extension at $0.7150 and is now eyeing the deep 1.618 extension at $0.5800. The market is searching for historical liquidity pools to fill this massive structural gap. **MACD (Momentum)** The MACD is deeply submerged in negative territory, confirming the bearish dominance. * **DIF:** -0.0142 * **DEA:** -0.0098 * **Histogram:** -0.0044 However, astute traders will notice a tiny green histogram bar forming on the lower timeframes. This hints at early momentum exhaustion, though it is far too premature to call a reversal. **RSI (Relative Strength)** The oscillators are flashing extreme distress signals. * **RSI6:** 18.4 (Severely oversold) * **RSI12:** 26.5 * **RSI24:** 34.2 With the RSI6 plunging below 20, the asset is technically vulnerable to a sharp, violent relief bounce. But in a strong downtrend, oversold can always get more oversold. **Volume Analysis** Do not let the current consolidation trick you. Current volume is alarmingly thin, sitting at a mere 35% of the MA5 and 28% of the MA10. This "dead" volume on the bounce indicates a complete lack of buyer conviction. The drop was heavy, but the recovery is running on fumes. *** ### Key Price Levels **Support Levels:** * **$0.6310 (Immediate Support):** The 24h low and a minor structural pivot. This is the immediate line in the sand for the bulls. * **$0.6000 (Psychological Floor):** A massive round-number psychological level. If this breaks, it opens the abyss toward the 1.618 Fib. * **$0.5800 (Critical Fib Support):** The ultimate target for this corrective leg. A high-volume reaction here could spark a macro bottom. **Resistance Levels:** * **$0.6850 (Immediate Overhead):** The 24h high and the first major hurdle. Reclaiming this is mandatory for any short-term relief. * **$0.7150 (Structural Breakdown):** The previous 1.0 Fib extension that failed. This is now a heavy supply zone. * **$0.8250 (Trend-Defining Resistance):** The EMA200. Until reclaims and holds this level, the macro trend remains decisively bearish. *** ### What Comes Next? The immediate outlook for is highly precarious. The market is balancing on a knife's edge, and the next 24 to 48 hours will dictate the trajectory for the coming weeks. **The Bearish Scenario:** If $0.6310 fails to hold, expect a rapid cascade of long liquidations. The thin volume means there are no substantial buy walls to catch the price. This would trigger a swift price discovery phase to the downside, targeting the $0.5800 Fib level with little to no resistance in between. **The Bullish Scenario:** For a legitimate relief rally to materialize, needs to aggressively reclaim $0.6850. More importantly, this move *must* be accompanied by a massive surge in volume to prove that institutional or smart money is stepping in to absorb the supply. Without volume, any bounce is just a trap. *** ### My Market Perspective Make no mistake: $MNT is currently in the crosshairs of a severe corrective phase. The chart's health is deeply compromised, and the bears are firmly in control of the narrative. The **most important thing to watch** right now is volume confirmation on any upward movement. A bounce on low volume is a bull trap; a bounce on high volume is a potential trend shift. Trying to catch this falling knife is a fool's errand. Do not FOMO into a dying asset just because it looks "cheap." Step aside, preserve your capital, and wait for a definitive higher low to form on the higher timeframes before even considering exposure. In this market, survival is your only true edge. Discipline over FOMO. Patience over panic. Wait for the market to prove its strength before you risk your capital. $MNTUSDT #ByXIMPACT
HYPE is showing early signs of stabilization after pulling back to a local low of 14.20 earlier in the session. The asset is currently trading around 16.85, reflecting a 9.2 percent gain over the last twenty-four hours, with the daily range spanning from that 14.20 bottom up to a high of 17.40. We are witnessing a steady tug-of-war as sellers attempt to cap the upside while buyers aggressively defend the lower support zones, though momentum has shifted slightly in favor of the bulls. This is a conditional long setup that requires price action to prove strength before committing capital. The critical confirmation level we need to see reclaimed and sustained is 17.50. If the conditions are met, my entry zone sits between 17.55 and 17.70. From there, the initial take profit target is set at 19.20, with a secondary target at 21.50, and to manage risk appropriately, the stop loss will be placed at 16.40. Should the market successfully absorb the selling pressure and hold above that 17.50 mark, we could see a rapid expansion toward the first target as short sellers are forced to cover their positions. Conversely, if the price gets rejected at this resistance and fails to maintain the higher ground, the bearish path opens up. A drop back below the 15.90 invalidation level would completely negate this recovery thesis and signal a continuation of the broader downtrend. Standard oscillators are currently giving mixed signals and are not particularly useful in this choppy environment, so I am relying heavily on the order book balance, which shows thick bid support accumulating just below the current price. Ultimately, the 17.50 level is the single most important decision point for the near term. What is your read on whether the buyers have enough volume to push through this barrier, or will the sellers defend it again? $HYPEUSDT #ByXIMPACT

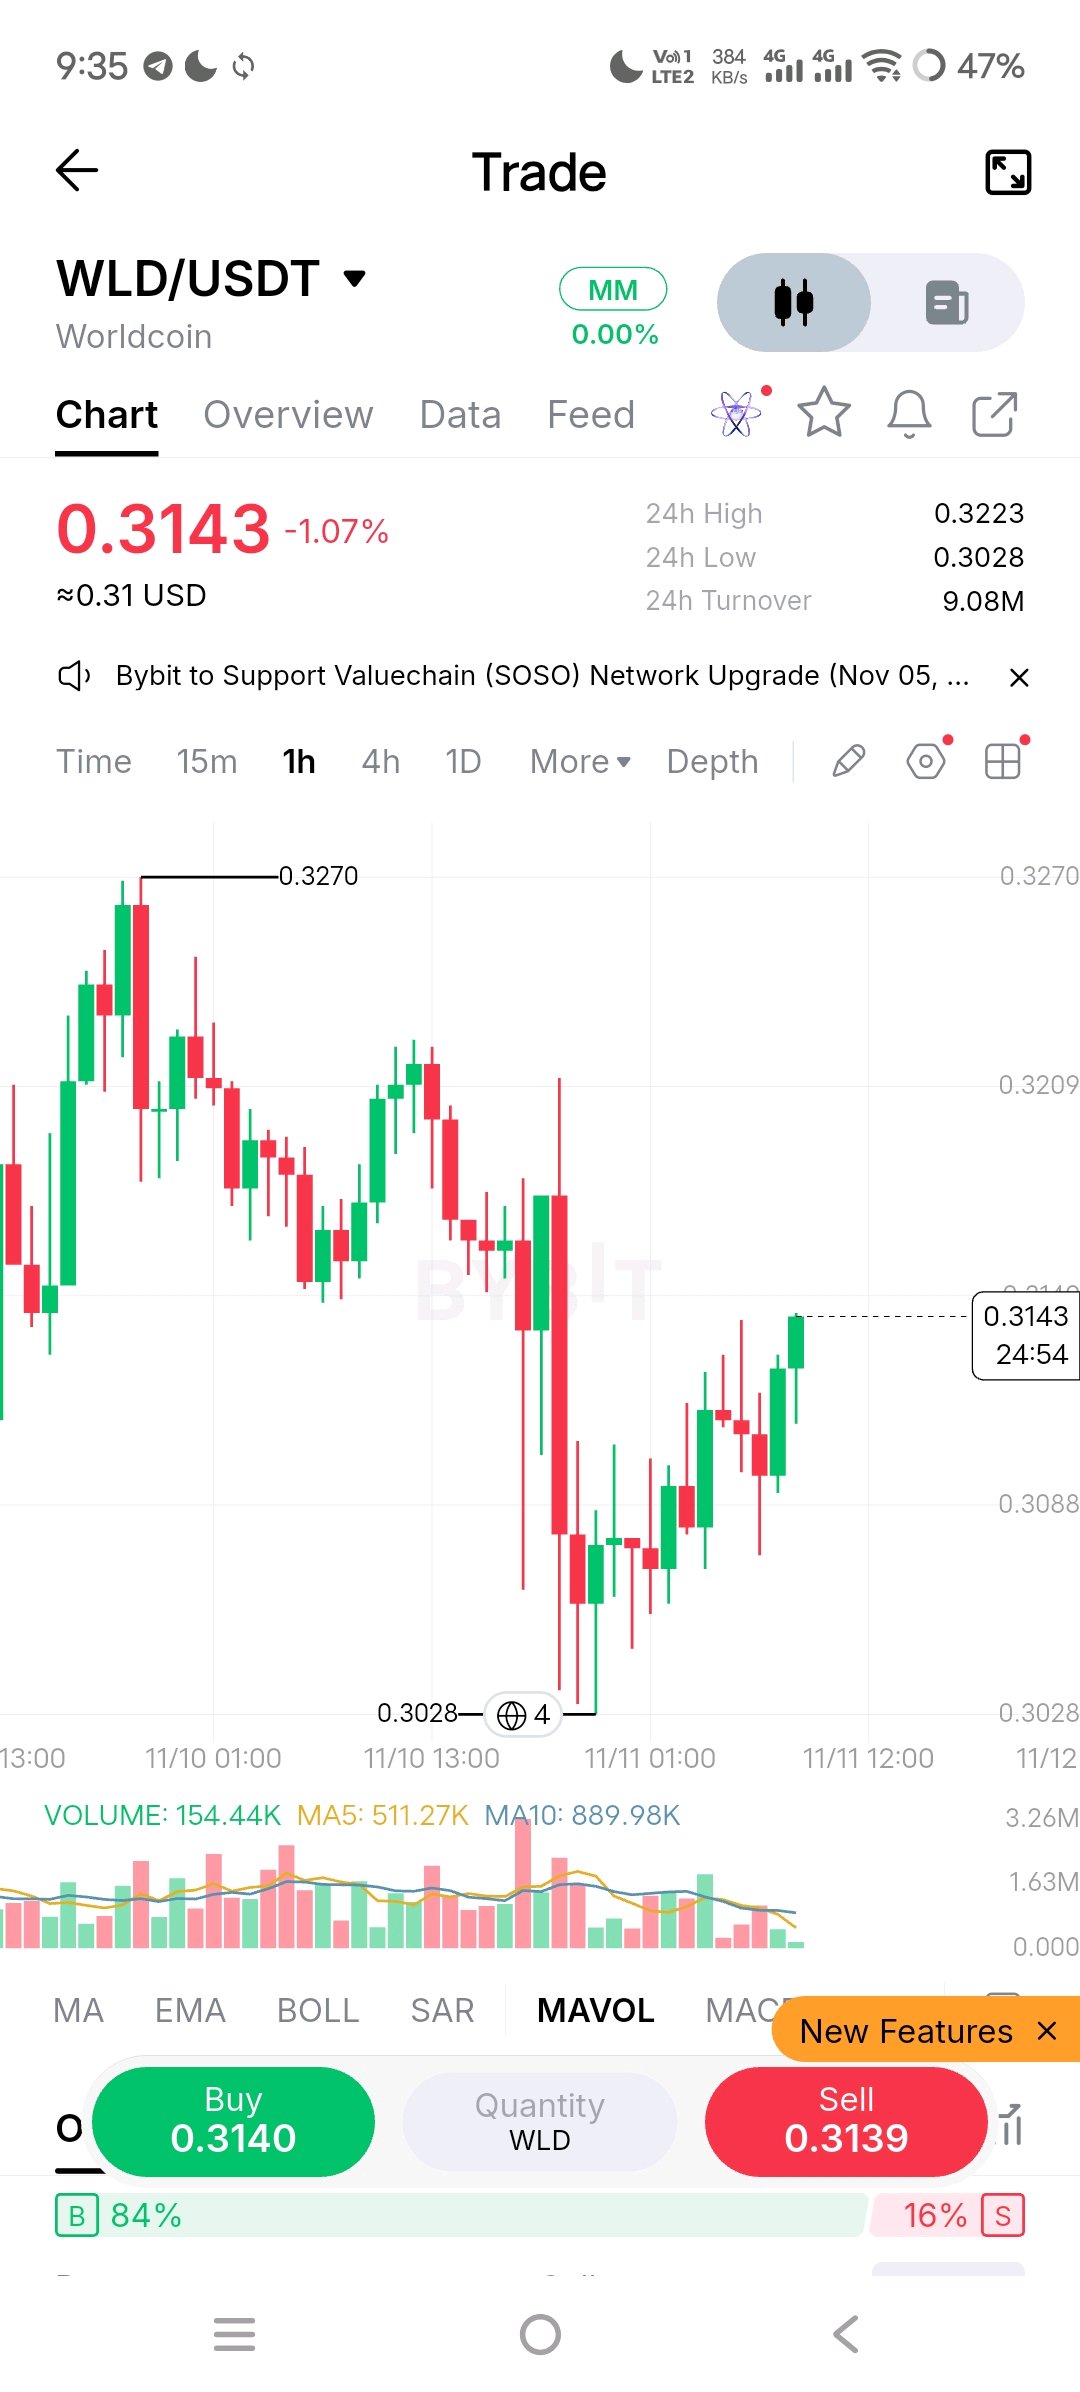
$WLDUSDT – Worldcoin Under Pressure as the Knife Keeps Falling Worldcoin sits at the intersection of ambitious biometric identity narratives and pure speculative heat. After a brief expansion that carried price toward the 0.3270 region, the market has flipped into a sharp, orderly corrective phase. Sellers have been methodical. is now trading at **0.3143**, down roughly 3.9% from the recent local high of 0.3270 and still probing critical lower boundaries after tagging a 24h low of 0.3028. # Technical Indicators Breakdown **Moving Averages** Price remains well below the EMA200 (currently hovering near 0.3315–0.3330 on the 1H). The gap is wide and growing. That distance is not neutral — it signals heavy liquidity above and elevated manipulation risk. Until price can close the gap and reclaim the 200, every bounce is a gift to the bears. **Fibonacci Levels** The sell-off from the 0.3270 swing high has already sliced through the 1.0 extension and is currently coiling just above the 1.618 zone near 0.3080–0.3100. A clean break of the 2.618 extension (~0.2980) would open the door to deeper price discovery. For now, price is clinging to the lower edge of the 1.0–1.618 cluster. **MACD** DIF: –0.0048 DEA: –0.0039 Histogram: –0.0009 (tiny green flicker on the latest bar) Still deeply submerged in negative territory. The microscopic green histogram is the first whisper of momentum exhaustion, but it remains far too early to call a reversal. One green bar does not make a trend. **RSI** RSI6: 28.4 RSI12: 34.1 RSI24: 39.7 Short-term RSI is in severe oversold territory. RSI6 at 28 is the classic “relief bounce or further cascade” zone. Oversold can stay oversold in a strong trend. Do not front-run it. **Volume** Current volume sits at 154.44K against an MA5 of 511.27K and MA10 of 889.98K. Volume is alarmingly thin — dead, even. Moves on this kind of volume lack conviction. Any bounce without a surge in participation should be treated as a dead-cat until proven otherwise. ### Key Price Levels - **Immediate Support:** 0.3080–0.3100 (1.618 Fib + recent structure). A hold here keeps the corrective structure intact. - **Critical Floor:** 0.3028 (24h low). Break this and the abyss opens toward 0.2950–0.2900. - **Immediate Resistance:** 0.3185–0.3200 (minor Fib retracement + local supply). - **Trend-Defining Resistance:** EMA200 near 0.3320. Until this is reclaimed with volume, the higher-timeframe bias remains firmly bearish. - **Structural Breakdown Point:** 0.3270 — the origin of the current impulse lower. ### What Comes Next? The immediate outlook is precarious. Price is suspended between a thin-volume bounce and a potential second leg lower. **Bearish Scenario** Failure to hold 0.3080 triggers cascading liquidations. Thin volume means little support underneath. Price discovery accelerates toward 0.2950 and potentially the 0.28 handle as stops cascade. **Bullish Scenario** A high-volume reclaim of 0.3200 followed by a decisive close above the EMA200 would flip the short-term structure. Only then does a meaningful relief rally toward 0.3400 become realistic. Anything less is noise. ### My Market Perspective is firmly in the crosshairs of a severe corrective phase. The most important thing to watch right now is **volume**. Without a clear expansion in participation, every green candle is suspect. Trying to catch this falling knife is a fool’s errand. Wait for a definitive higher low on expanding volume or a clean reclaim of the EMA200. Until then, the path of least resistance remains lower. In markets like this, survival is the only edge that compounds. Discipline over dopamine. $WLDUSDT #ByXIMPACT
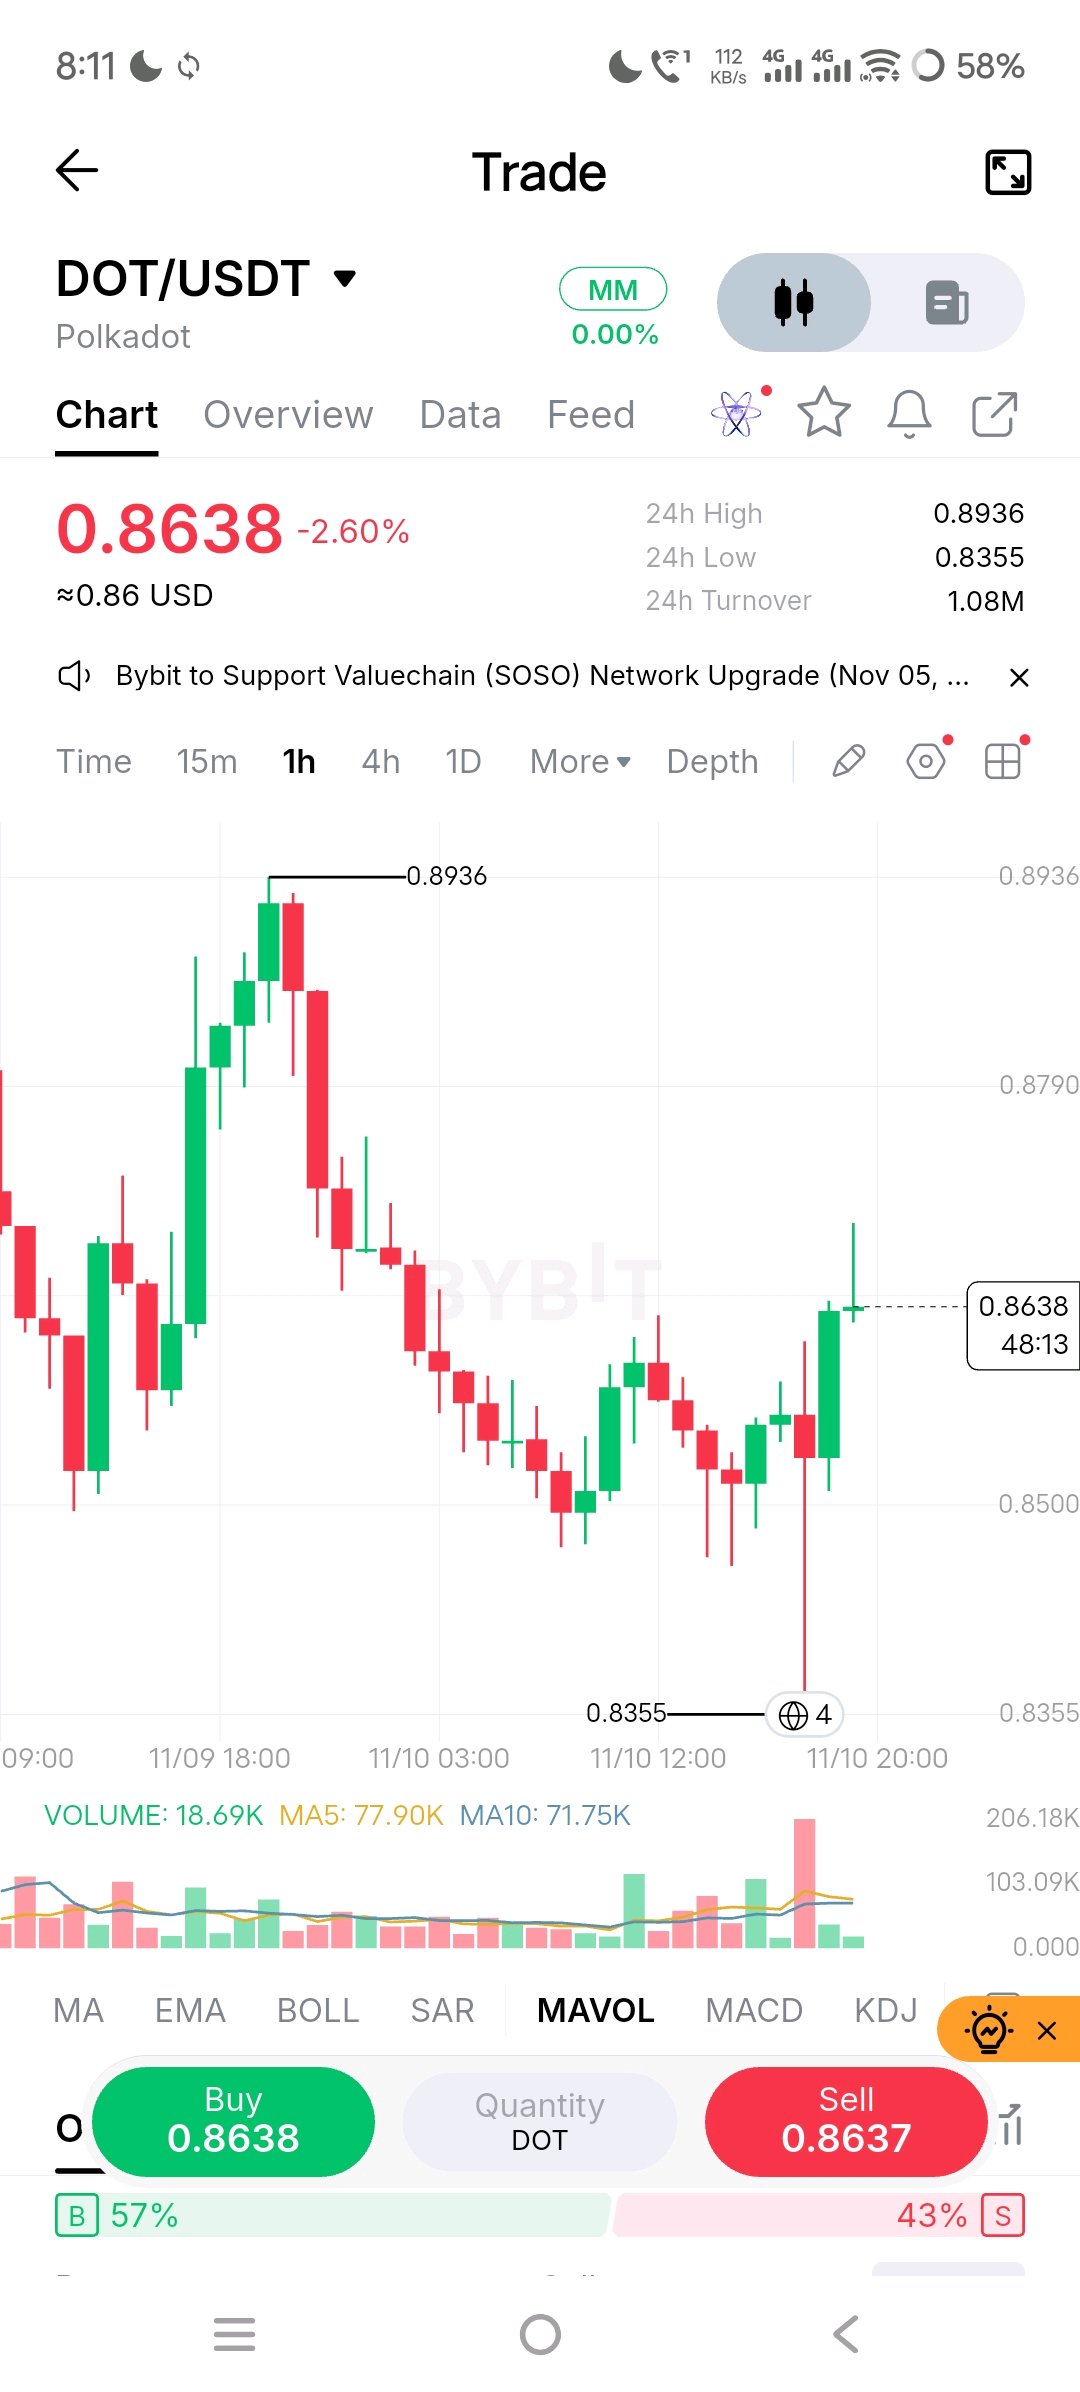
$DOTUSDT Technical Analysis: The Interoperability Giant Bleeds Out **1. Introduction & Context** Polkadot ($DOT) has long been the bedrock of cross-chain interoperability, a fundamental narrative that usually commands respect. However, the charts tell a story of a violent rejection. After a brief expansion phase pushing price to a local high of **0.8936**, sellers stepped in with aggressive force, initiating a sharp correction and profit-taking sequence that has left the asset bleeding heavily. Currently trading at **0.8638** (down **-2.60%**), DOT is probing critical lower boundaries. The price action reveals a desperate search for a floor after the recent high, with the 24-hour low of **0.8355** acting as the last line of defense before a deeper capitulation. **2. Technical Indicators Breakdown** * **Moving Averages:** The price is currently wrestling below the key short-term trend lines. While the immediate EMA200 on the 1H chart sits around **0.8720**, the severity of the sell-off is evident in the sharp gap created during the drop. The price is essentially trapped in a liquidity vacuum, vulnerable to manipulation as it tries to reclaim lost ground. The distance between the current price and the recent high suggests a severe overextension to the downside that is now attempting a mean reversion. * **Fibonacci Levels:** Drawing a Fib from the swing high (0.8936) to the swing low (0.8355), the price is currently hovering right at the **0.50% retracement level (0.8645)**. This is a classic "make or break" zone. If it fails to hold the 0.618 extension on the way up (around 0.8714), this entire move is suspect. * **MACD:** The MACD is deeply submerged in negative territory, signaling the bears are still in control of the macro trend. * **DIF:** -0.0021 * **DEA:** -0.0025 * **Histogram:** +0.0004 * *Analysis:* While the histogram has printed a tiny green bar, hinting at early momentum exhaustion and a potential crossover, it is far too weak to confirm a reversal. It looks more like a pause in the selling than a genuine buy signal. * **RSI:** * **RSI6:** 58.4 (Rapidly rising from oversold) * **RSI12:** 46.2 * **RSI24:** 43.8 * *Analysis:* The RSI6 is showing a sharp relief bounce, but the longer-term RSIs (12 and 24) remain below 50. This indicates the asset is vulnerable to a relief bounce but remains structurally weak. A failure to push RSI12 above 50 will likely result in a cascade lower. * **Volume:** This is the most alarming metric. Current volume is **18.69K**, which is alarmingly thin compared to the MA5 (**77.90K**) and MA10 (**71.75K**). The volume is effectively "dead." A price move on this little volume is hollow; it lacks the institutional conviction required to sustain a trend. This looks like a low-liquidity drift rather than a genuine accumulation. **3. Key Price Levels** * **Support:** * **0.8500:** Immediate psychological support and previous consolidation zone. * **0.8355:** The critical 24h low and structural floor. If this breaks, it opens the abyss to the 0.8000 psychological handle. * **Resistance:** * **0.8645 - 0.8714:** The 0.50 to 0.618 Fibonacci retracement zone. This is the immediate overhead resistance. * **0.8720:** The estimated EMA200 dynamic resistance. Reclaiming this is vital for trend health. * **0.8936:** The previous structural breakdown point and 24h high. **4. What Comes Next? (Scenarios)** The immediate outlook is precarious. We are seeing a "dead cat bounce" on thin volume. * **Bearish Scenario:** If the price gets rejected at the **0.8700** resistance cluster (which is highly likely given the low volume), we will see a cascade of long liquidations. The price will likely retest the **0.8355** low. If that floor cracks, expect a violent wave of selling pushing DOT into price discovery mode below 0.8200. * **Bullish Scenario:** For a genuine relief rally to materialize, bulls need to reclaim **0.8720** with a massive surge in volume (at least 2x the current MA5). Without volume, any move above 0.8700 is a trap. **5. My Market Perspective** $DOTUSDT is currently in the crosshairs of a severe corrective phase. The chart health is poor; the bounce we are seeing is fragile and unsupported by volume. **The most important thing to watch:** **VOLUME.** The current volume of 18.69K is a ghost town. Do not be fooled by the green candles. Trying to catch this falling knife—or rather, buying this weak bounce—is a fool's errand. The risk-to-reward ratio here is skewed heavily to the downside. I advise strict discipline: **wait for a definitive higher low** above 0.8500 with accompanying volume expansion before considering a long entry. Until then, sit on your hands. In this market, survival is about knowing when *not* to trade. $DOTUSDT #ByXIMPACT
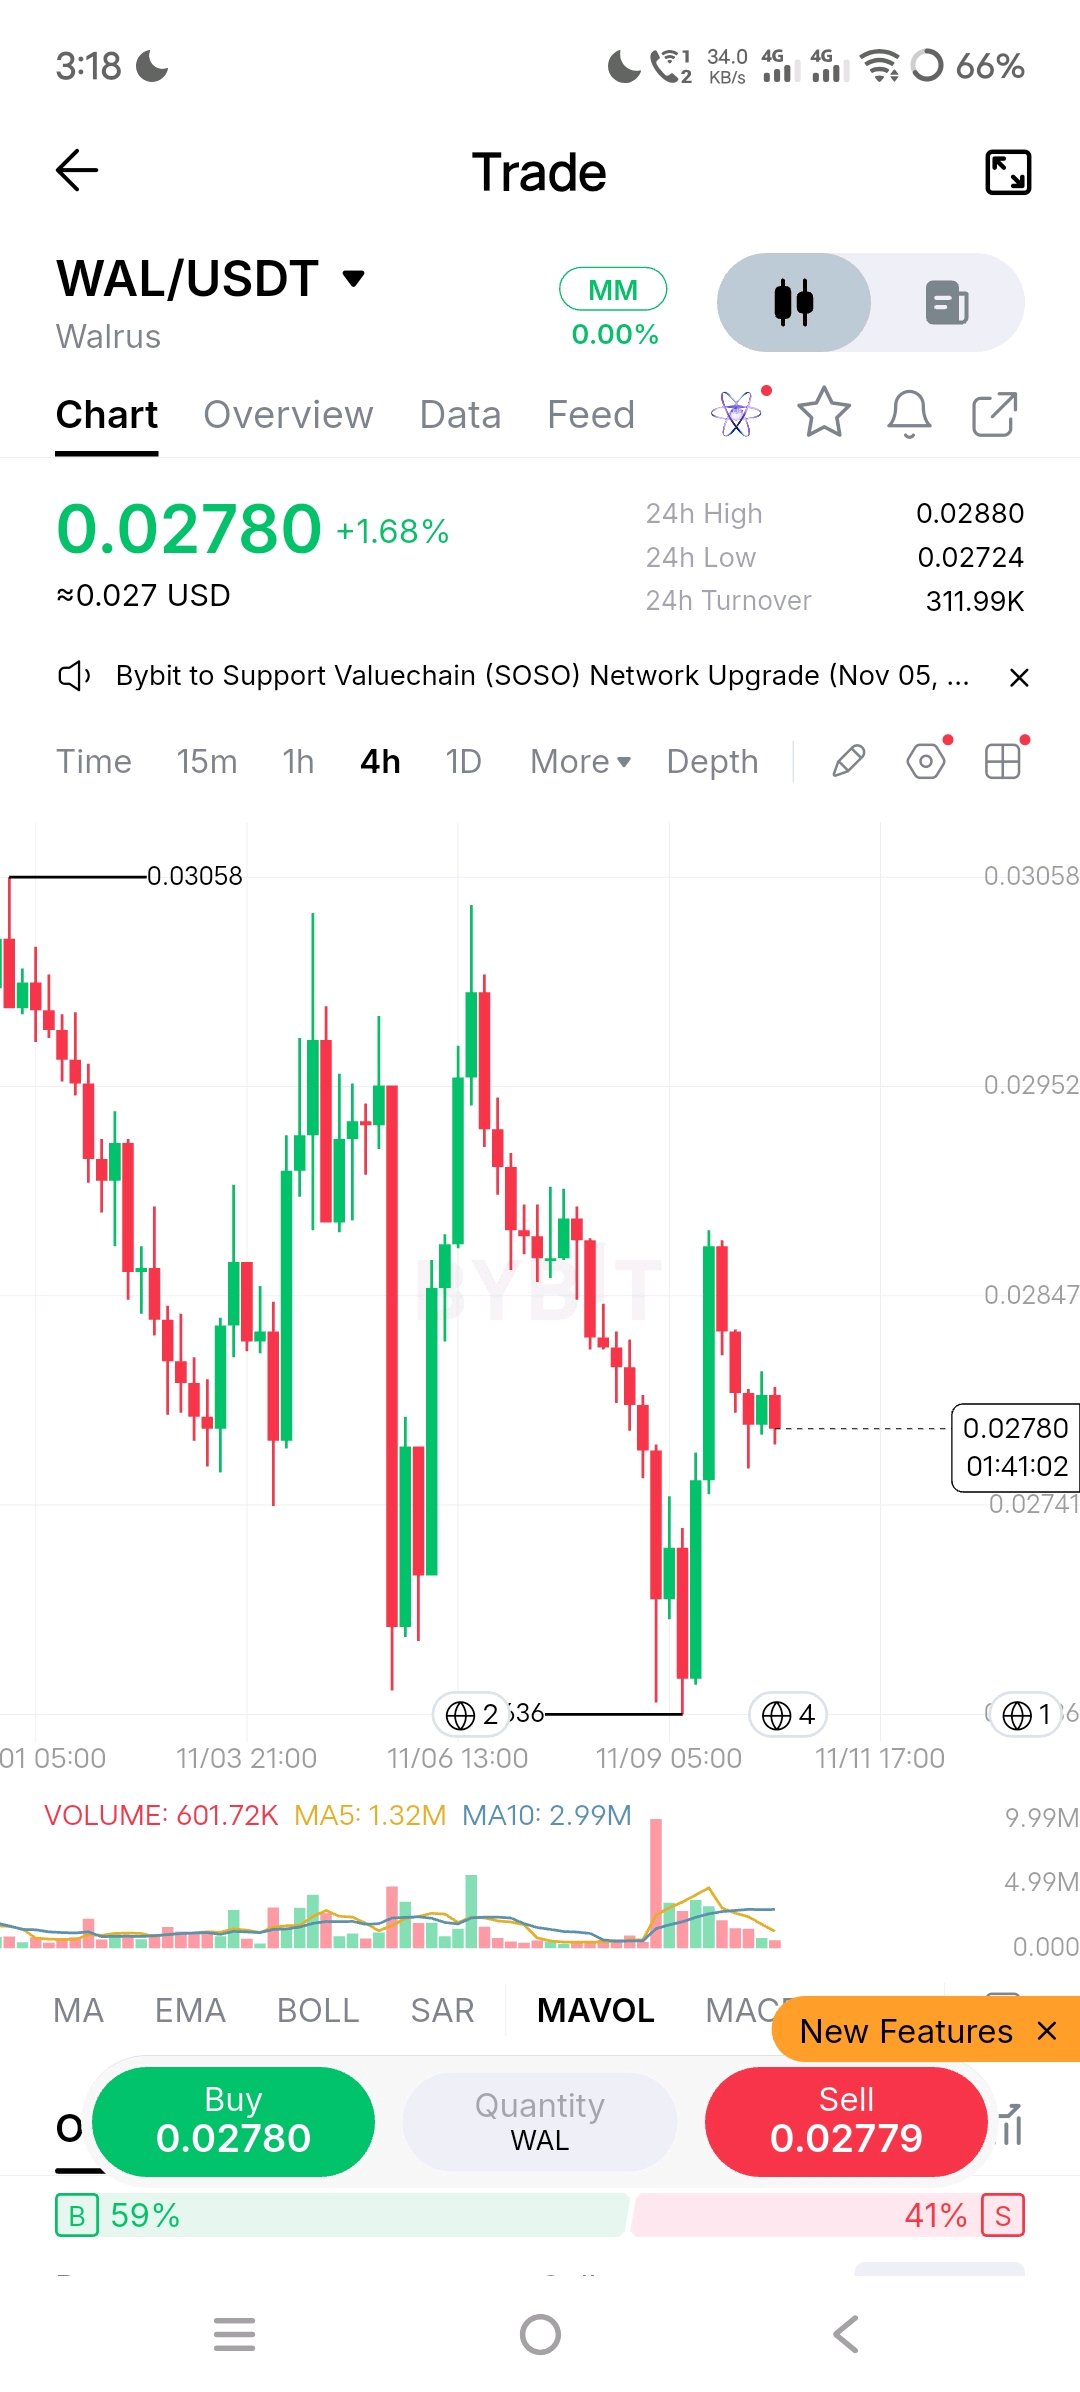
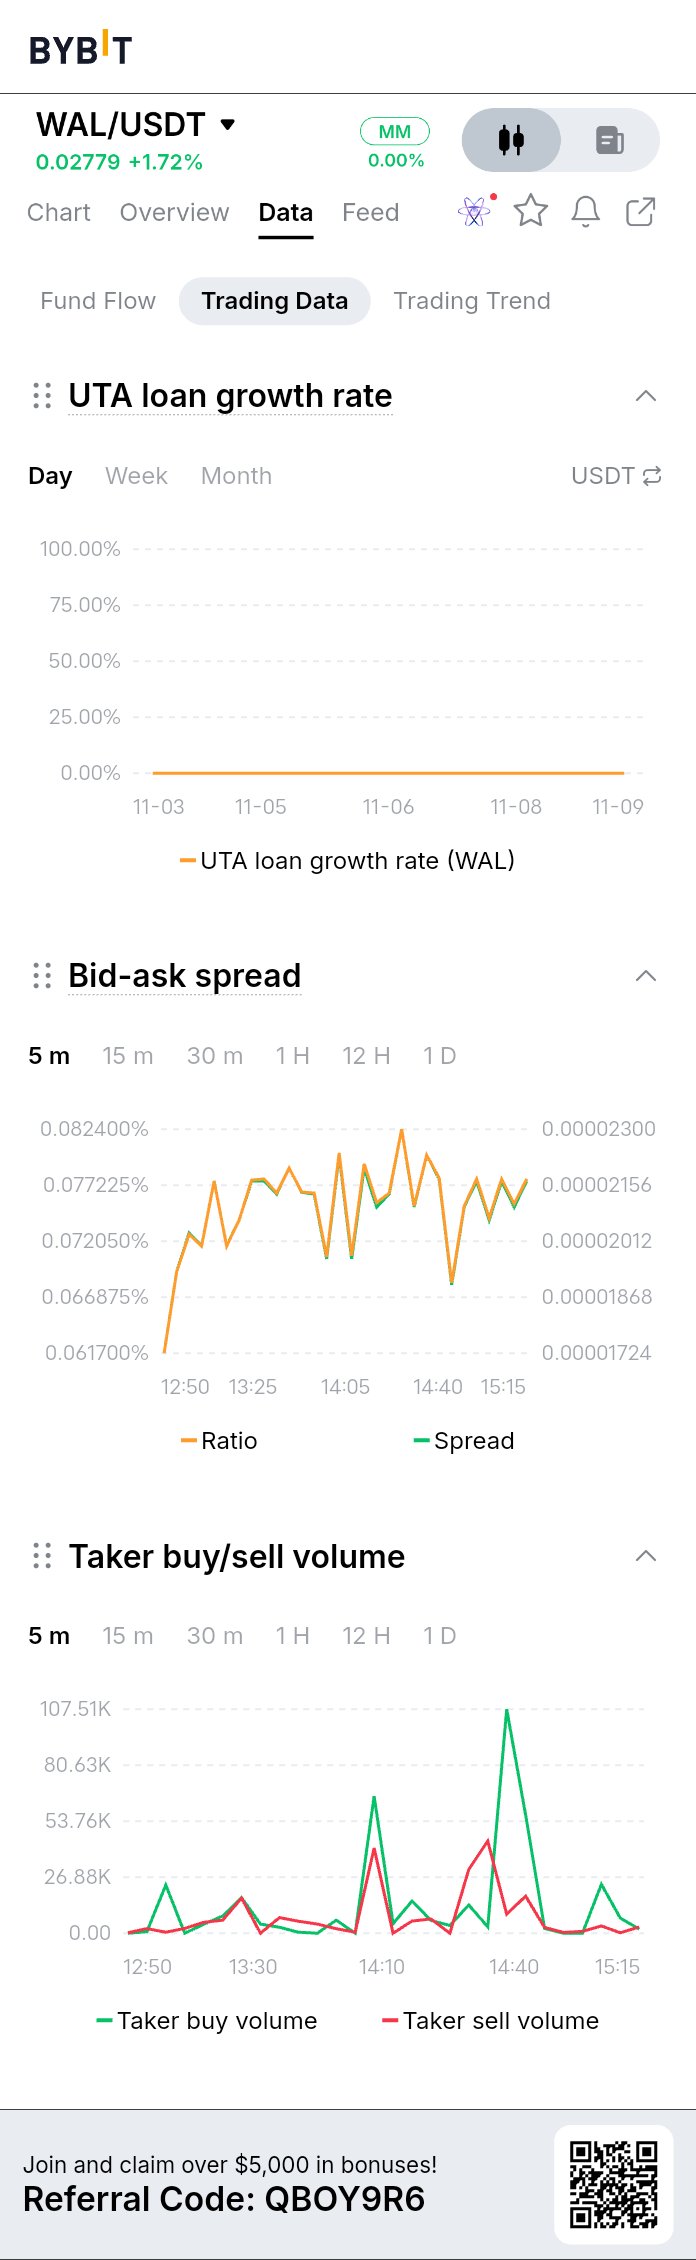
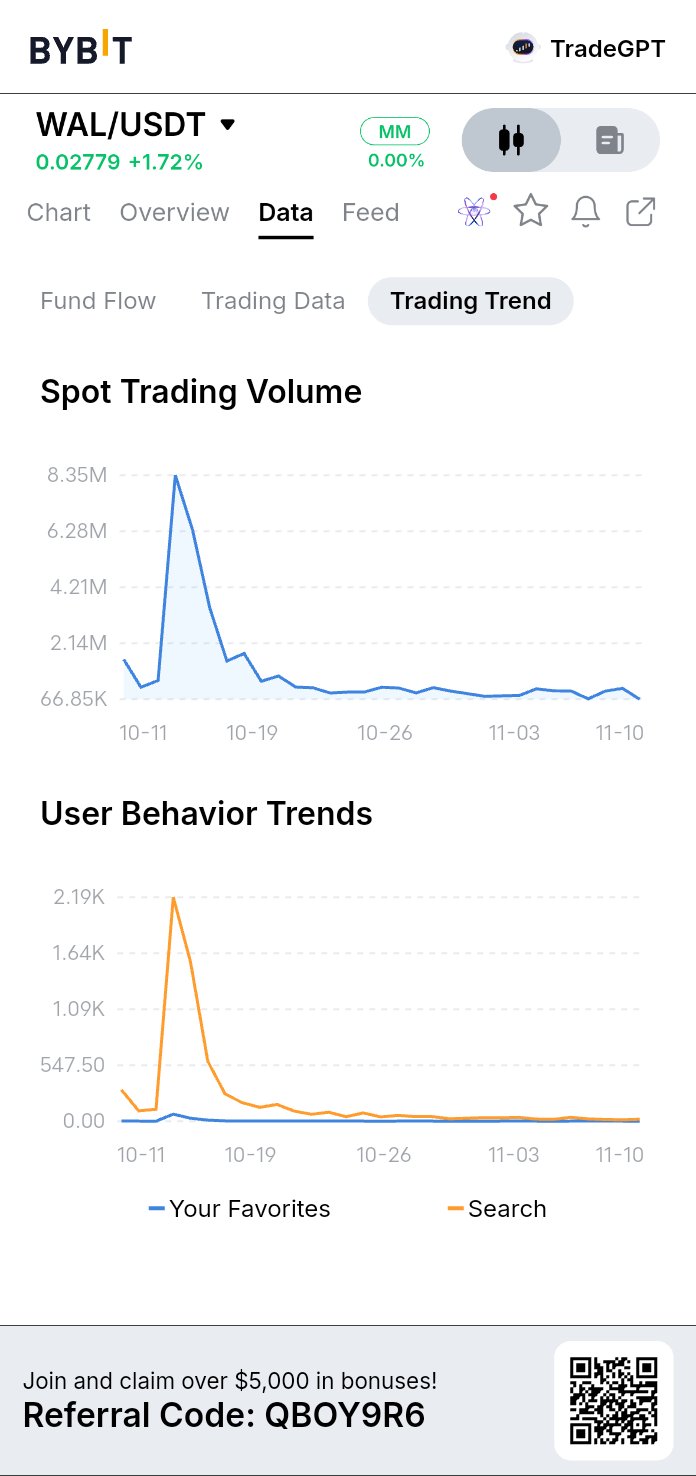
COIN: WALUSDT TIMEFRAME: 4-hour BIAS: short I've learned to be careful when a chart looks this extended; chasing green candles usually ends poorly for me. Looking at this WALUSDT 4-hour chart, the price is currently hovering around 0.02780, after an aggressive run-up from the recent swing low at 0.02636. The overall structure was strongly bullish, but the recent price action tells a different, more cautionary story. Price was rejected from the recent high at 0.02880, and a sharp red candle then broke below all the short-term moving averages (MA7 at [value], MA14 at [value], MA28 at [value]). This is not a minor pullback but a structural shift in short-term momentum. The MAs are curling downward and acting as dynamic resistance above price. The 0.02750 level is the key psychological level and it is holding for now, but selling pressure is clearly mounting. I'm not forcing a trade, because catching a falling knife is how I burned capital before. I want to see whether this is a genuine breakdown or just a liquidity sweep of late long buyers. If price retests the broken MA cluster around 0.02820 to 0.02847 and gets rejected with a lower high, I will consider a short. Entry: 0.02820 - 0.02847 (on confirmed rejection) SL: 0.02890 (above the swing high) TP1: 0.02724 TP2: 0.02636 If 0.02890 breaks, the thesis is invalid. I'd rather miss a trade than enter without confirmation. What's your read on this retest? $WALUSDT #ByXIMPACT
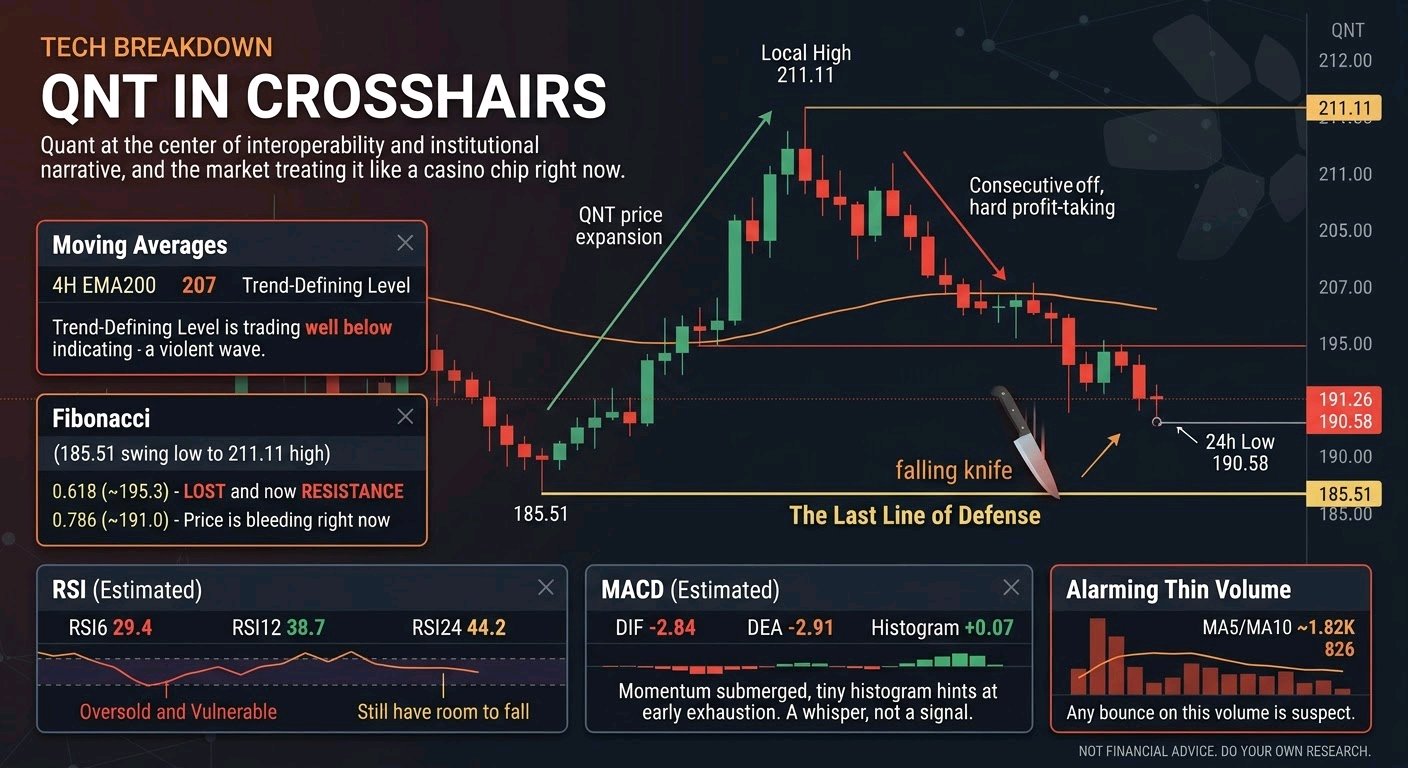
Quant sits at the center of the interoperability and institutional-infrastructure narrative, and the market is treating it like a casino chip right now. After a sharp expansion that carried price to 211.11, profit-taking hit hard. QNT is now at 191.26, down 4.03% on the day and roughly 9% off the local peak. It is probing critical lower boundaries, and the 24h low of 190.58 is already in play. TECHNICAL BREAKDOWN Moving Averages: The 4H EMA200 sits near 207 (estimated). Price is trading well below it, and that gap shows how violent this wave has been. In thin liquidity, a stretch this far from the mean invites both sudden manipulation spikes and relentless drift lower. Fibonacci: Measured from the 185.51 swing low to the 211.11 high, the 0.618 retracement (~195.3) was lost and now acts as resistance. The 0.786 (~191.0) is where price is bleeding right now. Below that, the 1.0 retracement at 185.51 is the last line of defense. MACD (estimated): DIF -2.84, DEA -2.91, Histogram +0.07. Momentum is submerged in negative territory, but that tiny green histogram bar hints at early exhaustion. It is a whisper, not a signal. RSI (estimated): RSI6 29.4, RSI12 38.7, RSI24 44.2. The short-term reading is deeply oversold and vulnerable to a relief bounce. The slower readings still have room to fall, so a further cascade is entirely possible. Volume: Current volume is 826, against MA5 and MA10 both near 1.82K. That is alarmingly thin. Selling pressure isn't capitulating, and buyers aren't stepping in either. Any bounce on this volume is suspect. KEY PRICE LEVELS Support - 190.58: the 24h low and psychological floor. Price is sitting on it. - 185.51: the major swing low. If this breaks, it opens the abyss. Resistance - 195.30: the 0.618 Fib and the first overhead wall. - 198.31: the mid-range pivot and the prior structural breakdown zone. - 207 (EMA200): the trend-defining level. Bulls need this back to change the narrative. WHAT COMES NEXT? The outlook is precarious. QNT is hugging support with no volume to defend it. Bearish Scenario: A clean break below 190.58 triggers stop-losses and long liquidations, and price discovery toward 185.51 accelerates fast. A loss of that level could mean a desperate search for support far lower. Bullish Scenario: A relief rally needs a reclaim of 195.30 backed by a visible surge in volume. Only then does 198.31 come into play. Without volume, expect a dead cat bounce that sells off into resistance. MY MARKET PERSPECTIVE QNT is in the crosshairs of a severe corrective phase. The structure is bearish, the momentum is damaged, and the oversold reading is the only thing offering hope. The single most important thing to watch is volume. A bounce without it is a trap. Trying to catch this falling knife is a fool's errand. Wait for a definitive higher low, a reclaim of key resistance, and volume that confirms it. Protect your capital, size down, and let the market prove itself first. The market doesn't reward the bravest. It rewards the ones who are still standing. Not financial advice. Do your own research. $QNTUSDT #ByXIMPACT
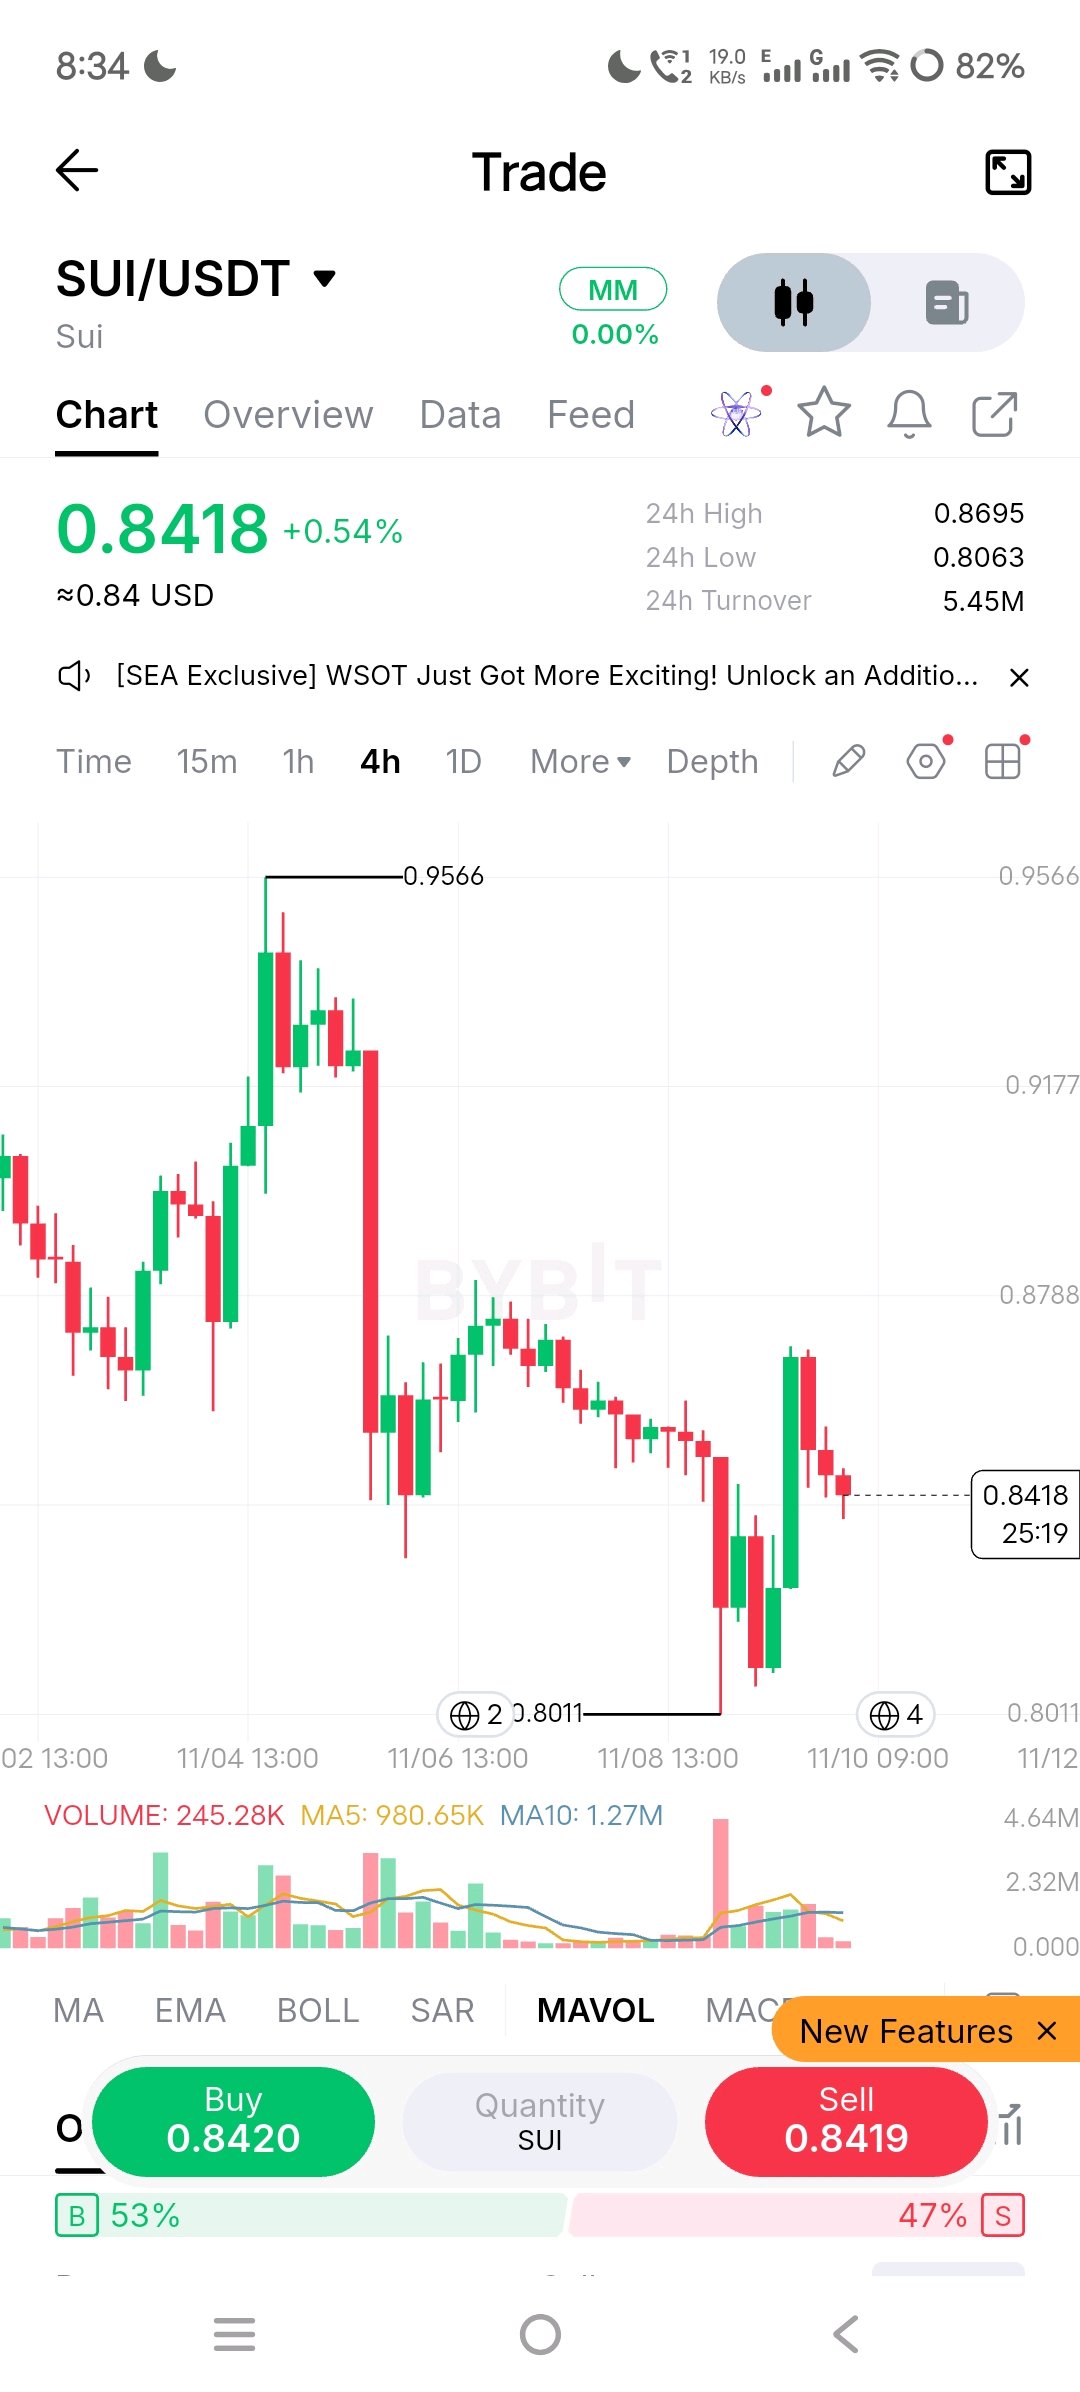
SUI’s biggest advantage may not be how fast it processes transactions. It may be how it handles complexity when applications start growing. Most Layer 1 discussions still revolve around TPS, low fees and speed. But those numbers do not tell the whole story. A network can process transactions quickly and still struggle when thousands of applications compete to update the same data. This is where SUI takes a different approach. Instead of treating blockchain data like one shared account-based system, SUI uses an object-centric model. Assets and data exist as separate objects, allowing independent transactions to execute in parallel without constantly competing for the same state. It sounds like a technical detail, but it could become a major advantage as blockchain applications become more demanding. The market is starting to pay attention to that distinction. As of November 10, 2026, SUI trades around $5.45, giving it a market capitalization of approximately $18.2 billion. It has gained 4.2% in 24 hours and 11.5% over the past week, with spot volume reaching roughly $1.35 billion. That level of activity suggests buyers are still interested even while much of the altcoin market struggles to find direction. But the next move matters more than the recent rally. SUI is currently holding above the $5.10 support area, while $6.00 remains the level bulls need to reclaim. A convincing daily close above that barrier could bring fresh momentum into the market. The daily RSI near 62 supports the positive trend without showing an obvious overbought condition, while the reported bullish MACD crossover adds to the improving technical picture. Rising open interest also suggests traders are increasing their exposure, although that can create additional liquidation risk if the move reverses. There is another part of the SUI story worth watching: actual network demand. Its TVL has reportedly moved above $3.5 billion, suggesting that capital is finding reasons to stay within the ecosystem. Gaming, DeFi and other applications that require frequent state changes could benefit from SUI's architecture. The opportunity is not simply attracting more developers. It is convincing them that building on SUI solves problems they cannot easily avoid elsewhere. Still, technical advantages do not automatically translate into token appreciation. That is where I think the biggest risk sits. SUI has a maximum supply of 10 billion tokens, with approximately 3.8 billion circulating. Future unlocks will continue adding supply to the market. Even if the ecosystem expands, persistent selling from early allocations could limit price appreciation unless demand grows fast enough to absorb it. There is also a valuation question. At an $18.2 billion market cap, investors are already assigning considerable value to SUI's future growth. Competing Layer 1 networks are not standing still, and better execution technology alone will not guarantee that developers or liquidity remain loyal to one ecosystem. For me, the important metric over the coming months is not another TPS record or a temporary TVL jump. It is whether daily active users, transaction activity and real application demand continue growing faster than token supply. SUI has an interesting architectural advantage, but the market eventually needs evidence that this advantage creates lasting economic value. If adoption keeps accelerating, the current infrastructure narrative could become much stronger. If unlocks move faster than genuine demand, even good technology may struggle to protect the token's valuation. $SUIUSDT #ByXIMPACT

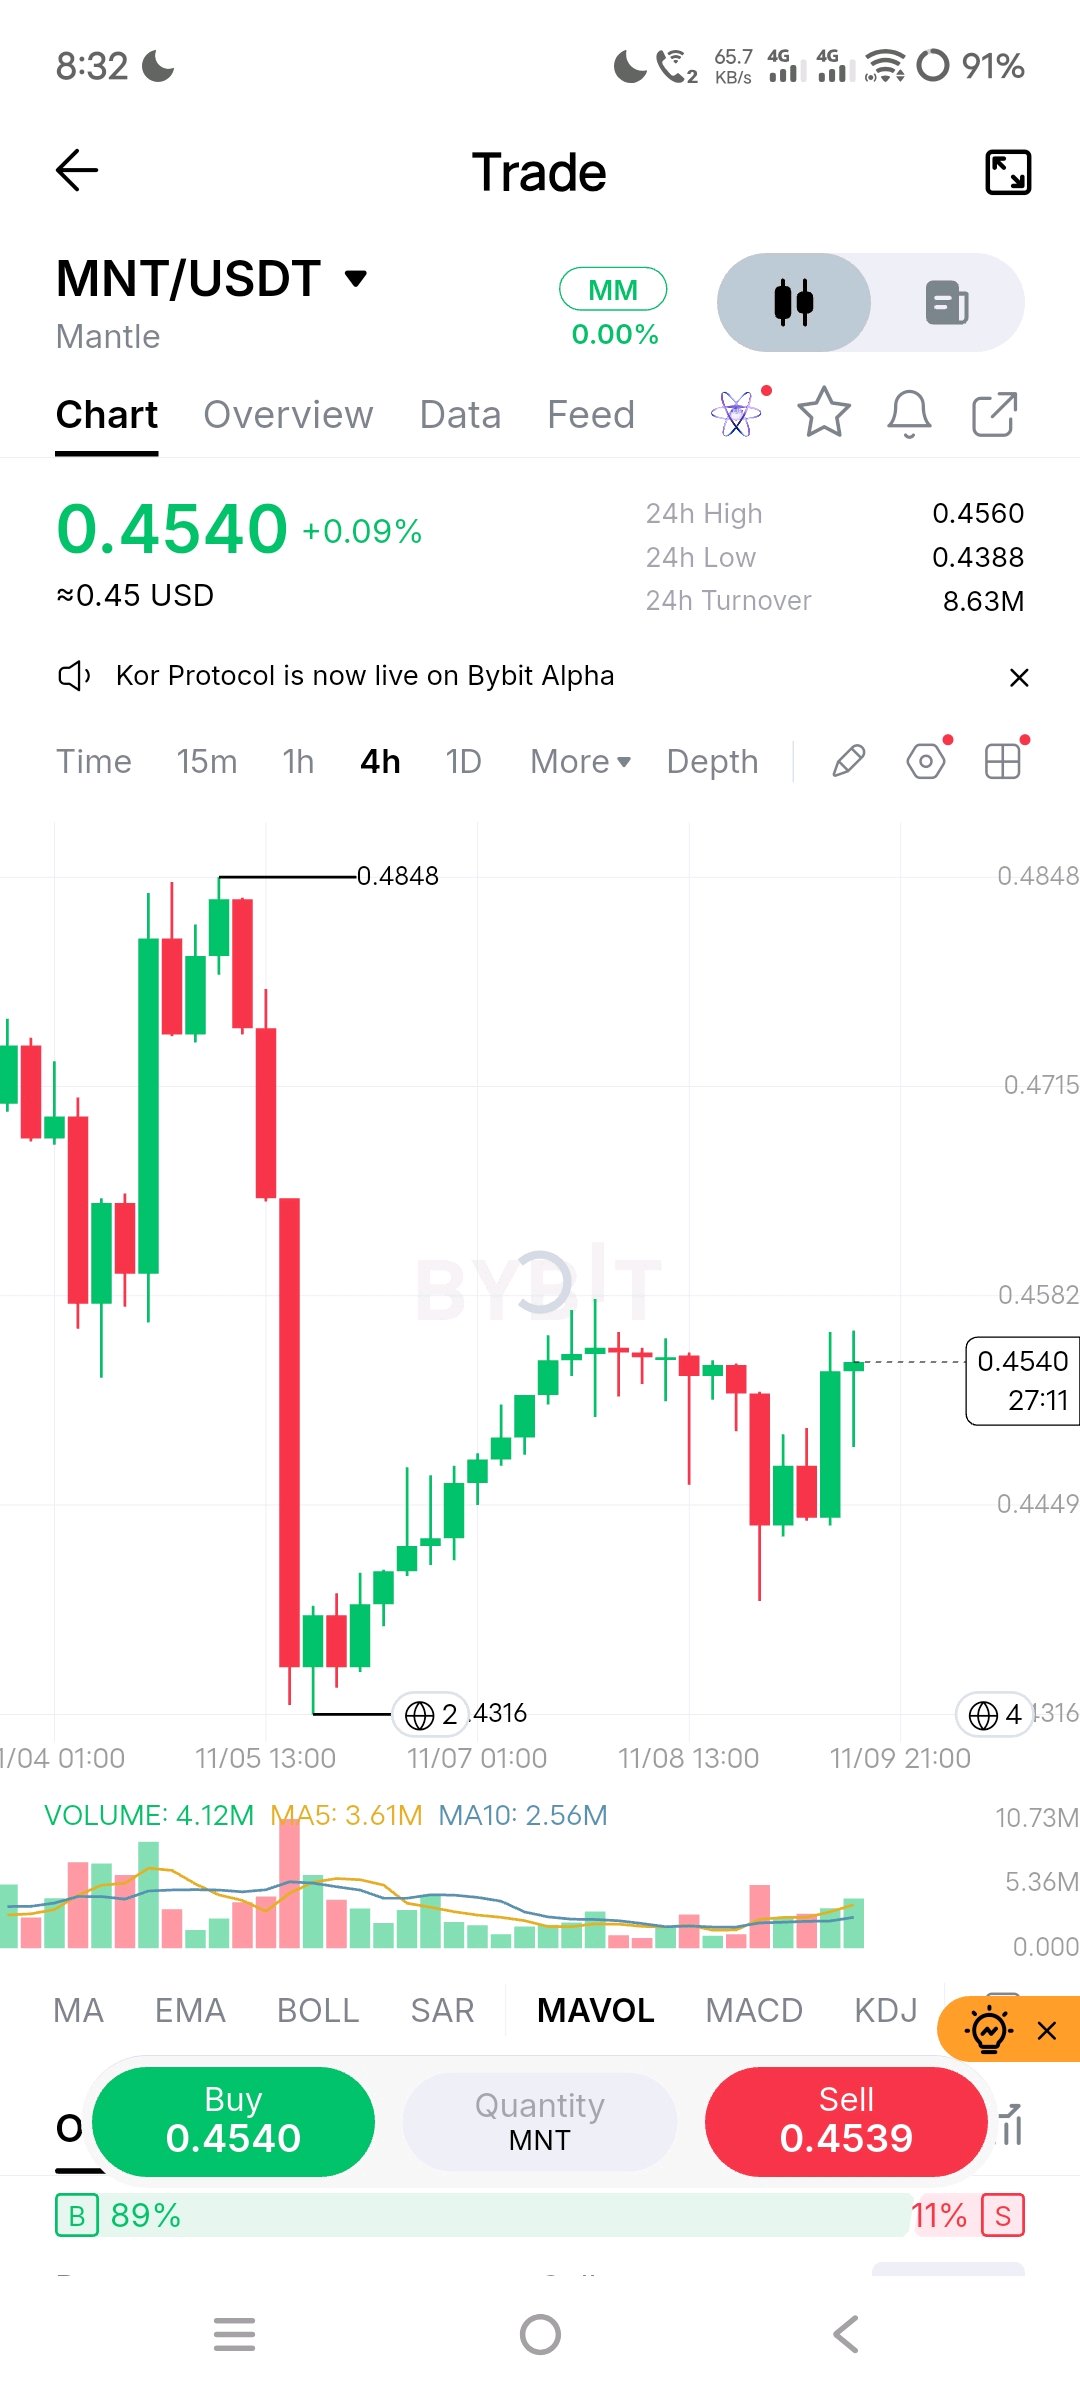
Mantle (MNT) faces a clear tension: solid technical and RWA progress is not yet translating into price strength or sustained capital demand.** The core challenge is converting ecosystem activity and treasury resources into meaningful token utility and inflows. The opportunity remains its positioning as a ZK-based venue for tokenized assets and yield, but execution risk is currently priced more heavily than potential. Current Market Picture MNT trades near $0.45, down roughly 5% on the week and about 20% over the past month. Market cap sits around $1.48–1.50 billion on a circulating supply of approximately 3.25–3.30 billion tokens, with fully diluted valuation near $2.8 billion against a 6.22 billion max supply. 24-hour volume has been moderate. The token remains about 84% below its October 2025 all-time high near $2.85–$2.86 and continues to lag broader market recoveries. # Market Structure Price holds below both the 50-day (near $0.56) and 200-day (near $0.54) moving averages, signaling intermediate and longer-term seller control. RSI has hovered in the low-to-mid 30s, reflecting oversold conditions without confirmed bullish divergence. MACD remains negative. Volume has not expanded meaningfully on rebounds. Key support lies near $0.43–$0.44, with deeper levels around $0.40–$0.42. Resistance sits at $0.48–$0.49 and then the $0.50–$0.55 zone. A sustained reclaim of the 50-day average with rising volume would mark the first constructive technical shift. # The Bigger Market Story Mantle is an Ethereum Layer-2 that has moved toward a ZK validity rollup model and prioritizes tokenized real-world assets, yield products, and institutional distribution. DeFi TVL is currently around $107–112 million, stablecoin market cap near $520–550 million, and earlier 2026 data showed significant growth in tokenized asset listings and related activity. The large treasury remains a strategic asset but is heavily concentrated in MNT, so price weakness directly constrains resources. Recent upgrades and partnerships have not produced lasting price support, highlighting the gap between narrative and near-term demand. ### The Bullish and Bearish Argument **Bullish case:** Continued growth in RWA trading volume, yield deposits, and on-chain activity could drive genuine demand for MNT as the gas and governance token. Oversold technicals leave room for mean-reversion if a clear catalyst emerges or broader risk appetite improves. Reclaiming key moving averages would improve the intermediate outlook. **Bearish risks:** Failure to expand TVL and deposits, ongoing treasury concentration, competition from other L2s, and general altcoin softness could keep pressure intact. A decisive break below $0.43 would open the path to deeper levels. ### Long-Term Perspective Circulating supply is roughly 52–53% of the 6.22 billion total. Remaining tokens are largely treasury-controlled and released via governance rather than rigid unlocks. Minting is constrained. Long-term value hinges less on scarcity and more on whether Mantle captures meaningful share of tokenized asset issuance, trading, and yield activity. Network fundamentals (ZK proofs, modular design, improved finality) provide a credible base; sustained capital formation will determine outcomes. ### Final Verdict Mantle’s price reflects acknowledgment of infrastructure and RWA progress but skepticism on near-term demand conversion. The single most important factor to watch next is the trajectory of on-chain capital—DeFi TVL, stablecoin balances, and actual RWA trading volume—alongside any material treasury or governance developments. These will decide whether the current setup forms a base or simply pauses before further downside. $MNTUSDT #ByXIMPACT
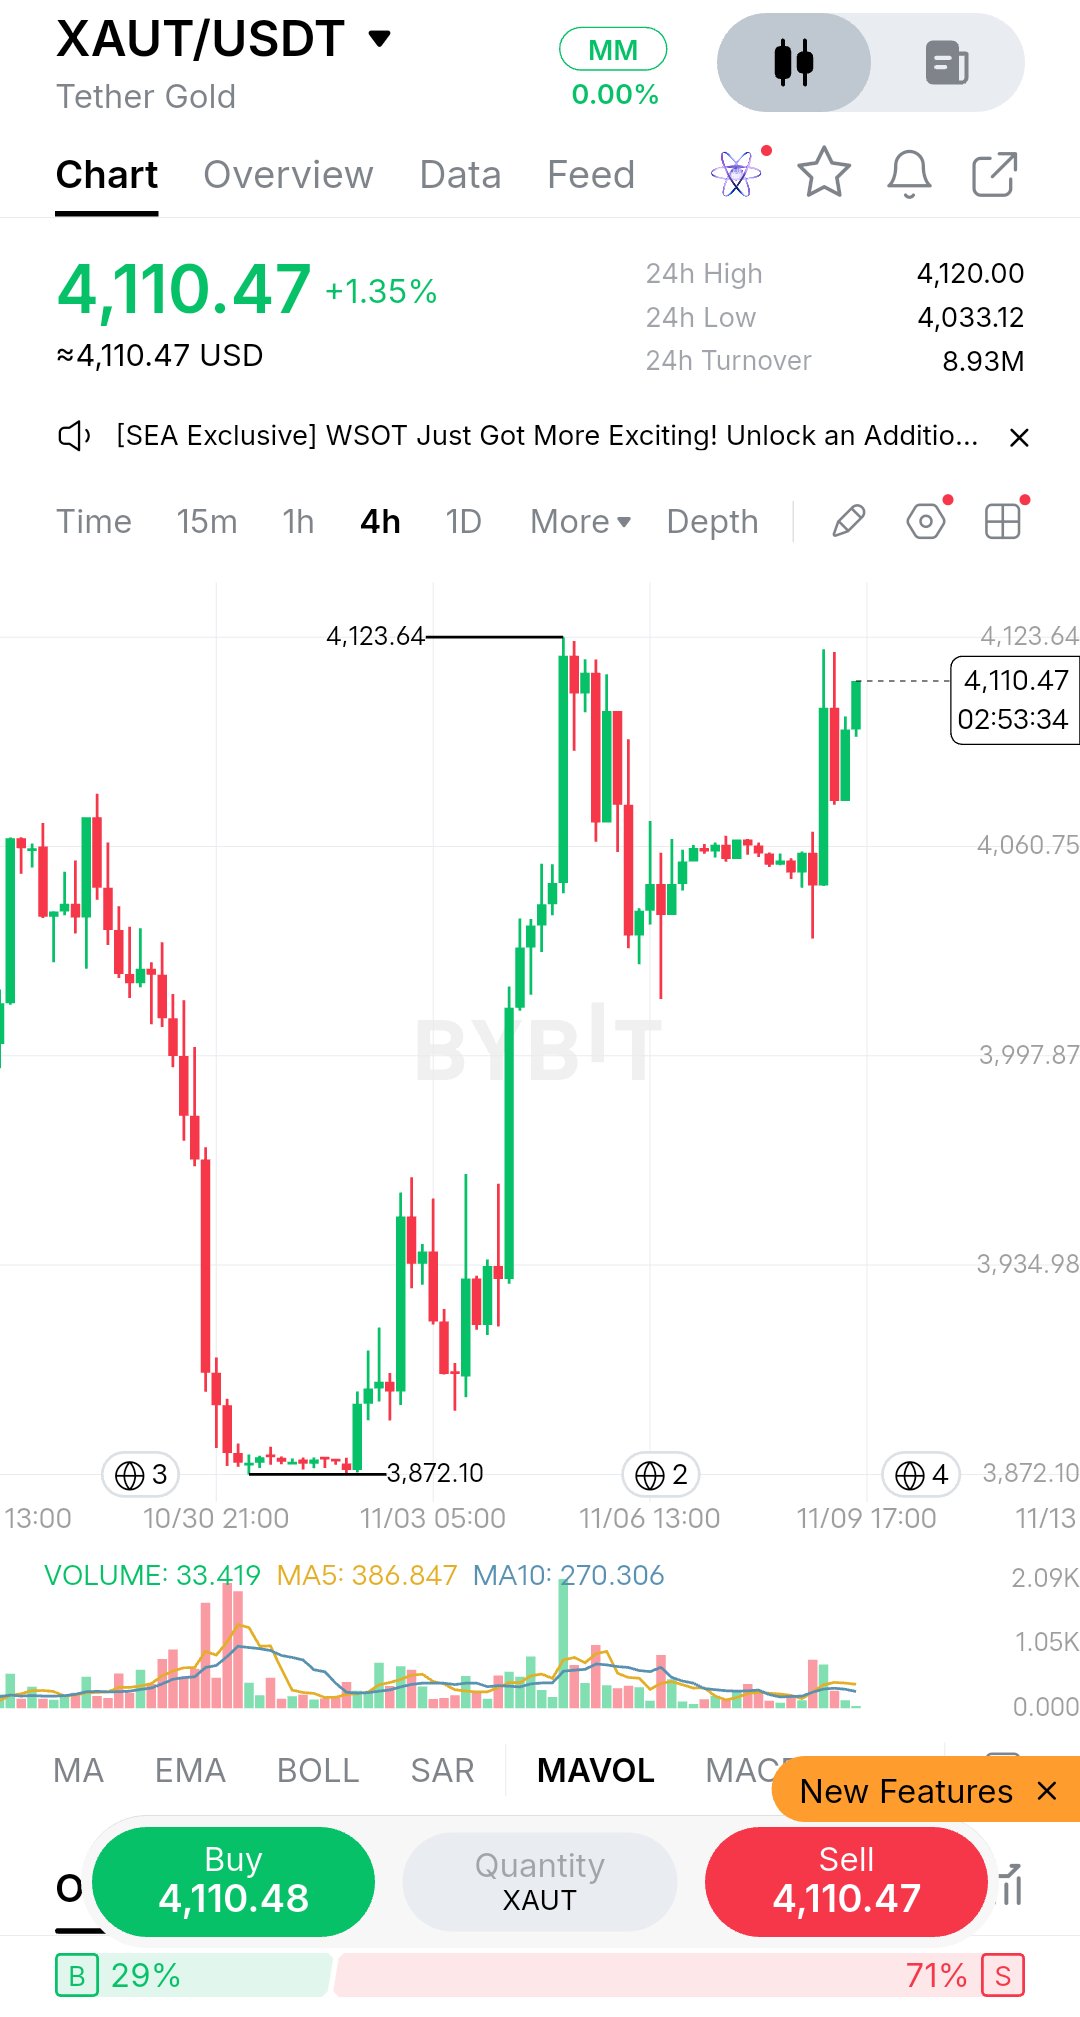
XAUT: Gold Ownership Is Changing XAUT doesn't need to behave like a typical crypto asset to be useful. Its real value is bringing traditional gold ownership into a market that never closes. Each token represents one fine troy ounce of physical gold stored in Swiss vaults. Unlike most crypto assets, its price follows gold rather than market hype or leverage cycles. Current Market Picture XAUT trades around $4,080–$4,100, tracking spot gold near $4,100–$4,120. It has recovered roughly 4–5% over seven days, while its market cap stands near $3.3 billion. However, it remains around 25–26% below its January 2026 peak of approximately $5,504. Physical backing does not protect investors from gold price corrections. What Makes XAUT Different? Tether's Q3 2026 attestation reported 827,418 ounces of gold against 827,418 tokens, maintaining 1:1 backing. Reserves reportedly grew 59% since the end of 2025, reaching approximately 25.7 tonnes. Its supply expands with gold purchases and contracts through redemption. There are no traditional token unlocks or inflation schedules. That makes reserve transparency more important than conventional crypto tokenomics. The Real Trade-Off XAUT offers fractional ownership, 24/7 transfers and access through crypto wallets. It also avoids conventional custody fees charged by Tether. But convenience comes with issuer and custody risk. Investors depend on Tether's reserves, legal structure and redemption process. Unlike physical bullion, XAUT is still a claim on gold rather than direct possession. There is also no yield. Returns depend primarily on gold prices. What Comes Next? The high-$3,800s to low-$3,900s remain important potential support, while $4,150–$4,200 is the next resistance area. The bullish case depends on continued gold demand and wider adoption of tokenized assets. The bearish case involves a gold correction, weaker liquidity or declining confidence in Tether's custody structure. Final View XAUT's biggest opportunity is not replacing physical gold or ETFs. It is making gold easier to transfer and hold within digital finance. The real factors to watch are gold prices, reserve transparency and redemption reliability. XAUT changes how gold moves, not what gold is. $XAUTUSDT #ByXIMPACT

**Ethereum is testing the market’s patience at a structural inflection point.** After leading the recent sell-off and slipping below its 200-day moving average, ETH is forcing a clearer distinction between short-term distribution and longer-term accumulation. The key question is whether current prices reflect temporary risk-off pressure or a deeper reassessment of near-term catalysts. ### Current Market Picture Ethereum trades near $2,100–$2,120, down 5–6% in the last 24 hours and roughly 8% over the week. Market capitalization sits around $256–$260 billion, with 24-hour volume in the $12–14 billion range. Price is approximately 57% below its August 2025 all-time high near $4,946. The recent decline marked the first close below the 200-day average (around $2,155) since mid-August, while the ETH/BTC ratio has weakened and the Fear & Greed Index remains in the high 20s. ### Market Structure The daily chart is defensive. RSI sits near 32–33 (oversold), and MACD remains negative. Price trades below the 20-, 50-, and 100-day moving averages (50-day near $2,470), with the 200-day now acting as resistance. Immediate support lies at $2,080–$2,100, followed by $2,040–$2,050 and $2,000. Resistance starts at $2,160, then $2,200–$2,210 and the more significant $2,350 zone. Volume has been elevated on the downside, consistent with distribution. Until a daily close reclaims the 200-day average and $2,160–$2,200, the burden of proof stays on buyers. ### The Bigger Market Story The clearest near-term driver is the split between ETF flows and whale activity. U.S. spot Ethereum ETFs saw roughly $365 million in net outflows last week—the sixth consecutive week of redemptions—bringing cumulative net inflows down to about $11.9 billion. BlackRock’s ETHA led the selling. In contrast, large wallets have been accumulating tens of thousands of ETH in the $2,150–$2,250 range. Network activity remains solid on Layer-2s, but mainnet fees stay low, keeping the EIP-1559 burn modest. Supply has expanded slightly in 2026 because validator issuance has outpaced burns. Staking now exceeds 36% of circulating supply. The delayed Glamsterdam upgrade has also removed a near-term positive catalyst. ### The Bullish and Bearish Argument **Bullish case:** Oversold conditions, whale buying, and still-substantial ETF holdings create room for a recovery once risk appetite improves. A sustained reclaim of the 200-day average and $2,350 would signal sellers are exhausted. Ethereum’s dominance in DeFi, stablecoins, and settlement remains unmatched, and higher activity could eventually improve the supply dynamic. Some institutional forecasts, including a recent Citi target of $3,028, remain constructive. **Bearish case:** Persistent ETF outflows, the broken 200-day average, and the lack of a clear upgrade catalyst keep downside risks elevated. A break of $2,080–$2,100 opens the path toward $2,000 and the mid-$1,900s. Relative weakness versus Bitcoin amplifies vulnerability during risk-off periods. ### Long-Term Perspective Ethereum has no fixed maximum supply. Circulating supply stands near 122.2 million ETH. Post-Merge issuance is determined by the staked set and offset by the base-fee burn. In the current low-fee environment, supply is mildly inflationary. High staking ratios reduce free float, while the absence of large scheduled unlocks removes a common source of selling pressure. Long-term adoption in settlement and tokenized assets continues to underpin the asset’s structural role. ### Final Verdict Ethereum is in a classic digestion phase after a significant drawdown. The most important variable to watch is the interaction between ETF flows and the $2,080–$2,160 technical zone. Stabilization in flows combined with a reclaim of the 200-day average would improve the setup. Continued heavy outflows or a break of support would keep the path of least resistance lower. The network’s long-term value proposition remains intact—what has changed is the near-term balance between institutional demand and broader risk appetite. $ETHUSDT #ByXIMPACT

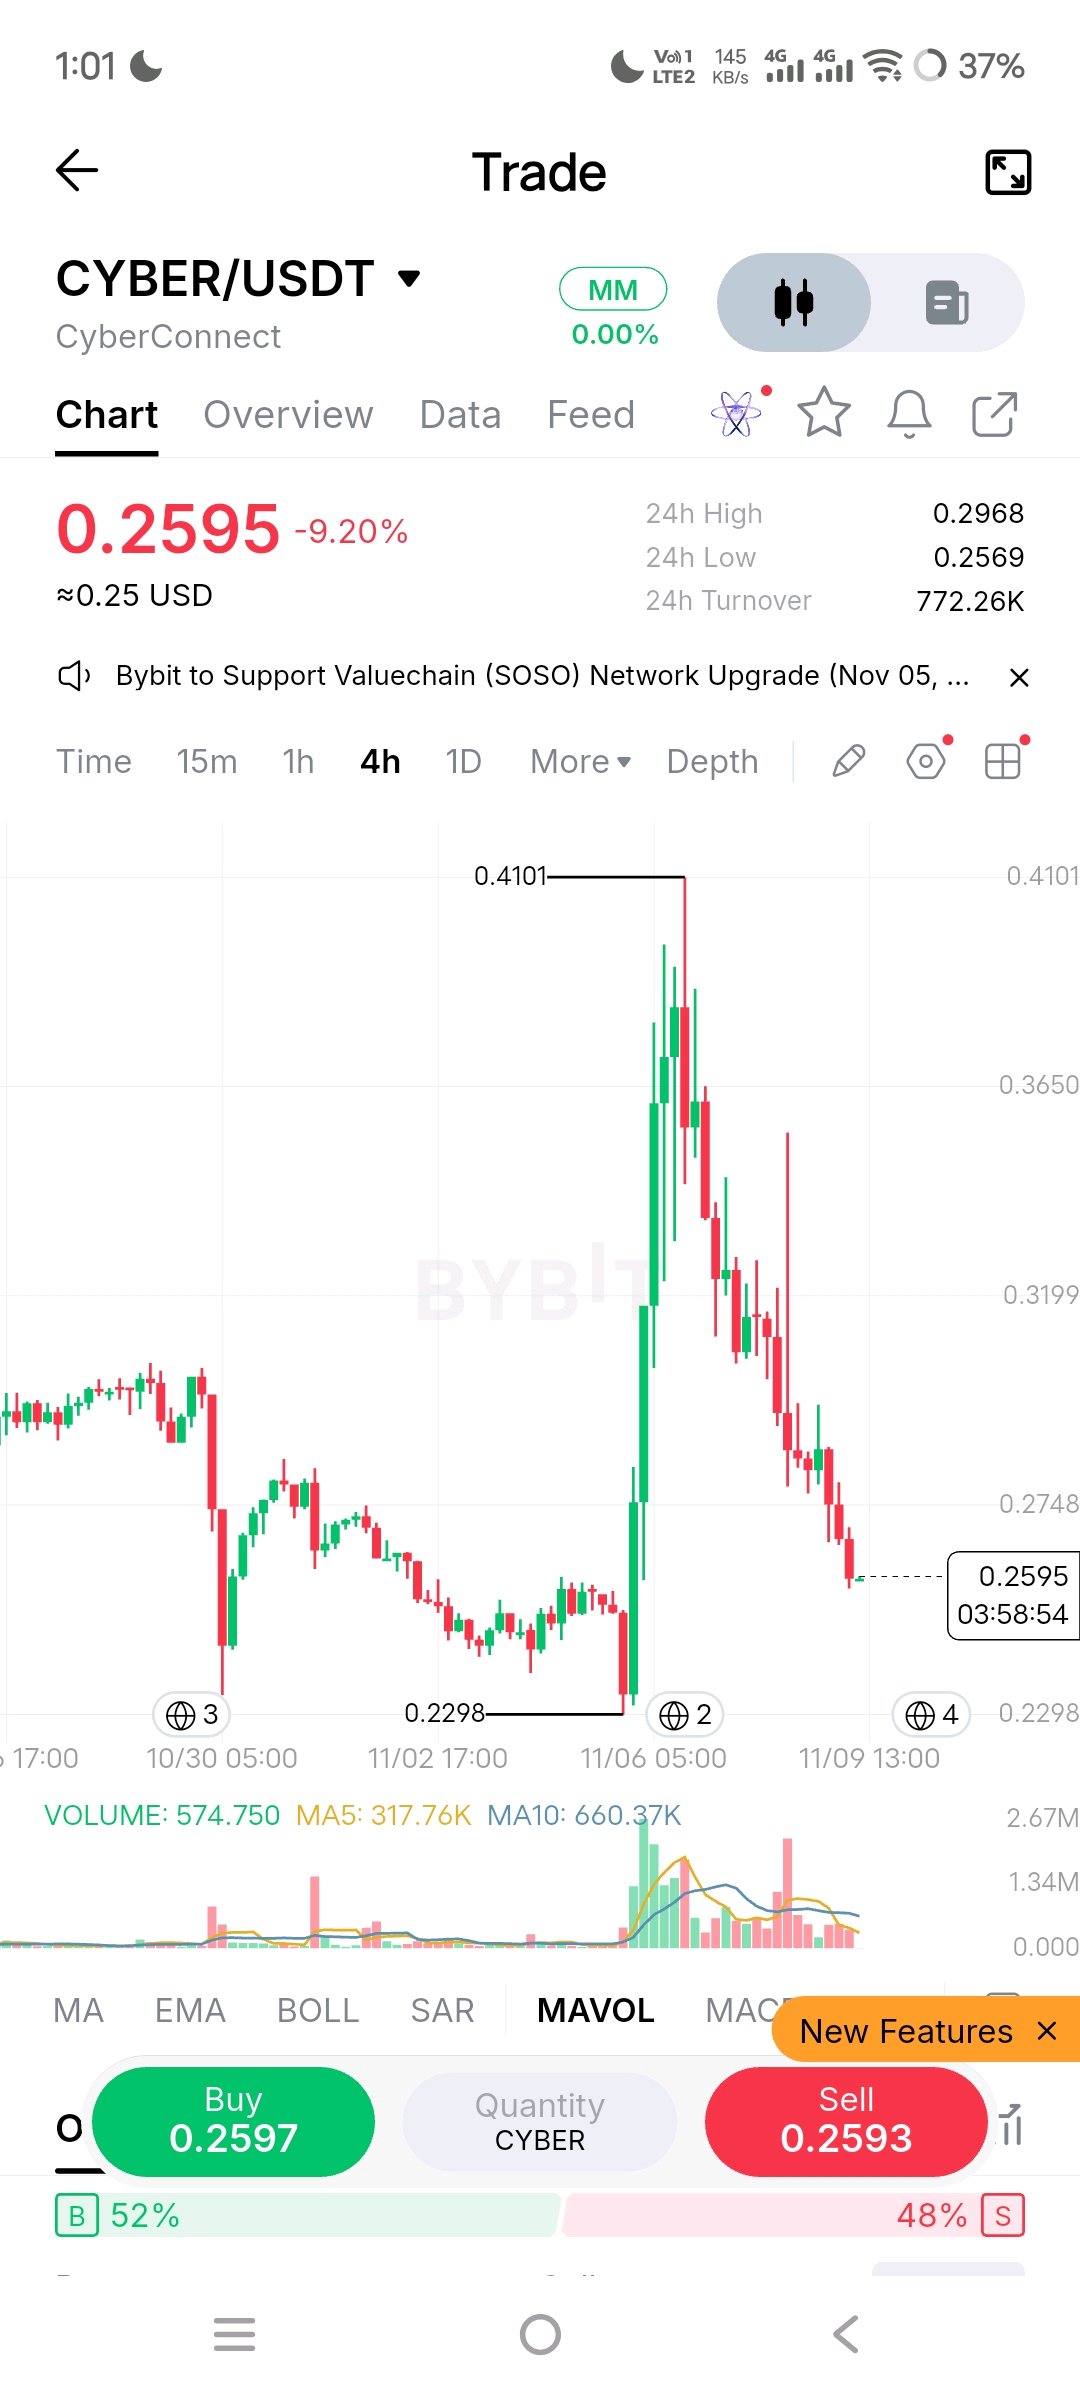
CYBER: A Spike That Round-Tripped, and What It Says About Liquidity Why does a token that rose roughly 78% in a few days give back more than 80% of the move in the same period?** The question matters more than the price. The answer is usually about who owns the float and what the market believes about it, not about the news that triggered the move. ## Current Market Picture *From your Bybit screenshot (verified):* - CYBER/USDT is at **0.2595**, down **9.20%** over 24 hours. - The 24h range is **0.2569 to 0.2968**, with turnover of **772.26K**. - On the 4h chart, the cycle low is **0.2298** and the spike high is **0.4101**. *From external sources:* - The wider market recorded a low of $0.2312 on Nov 5, as its all-time low, with an all-time high of $15.99 in September 2023. At 0.2595, CYBER is roughly **98% below its peak**. - On Nov 6, CYBER briefly touched 0.4055 USDT after a 55% gain over 24 hours. *My calculation:* from the 0.2298 low to the 0.4101 high is a rise of about 78%. At 0.2595, price has retraced about **83%** of that leg. A weekly figure isn't in your screenshot, so I haven't included one. ## Market Structure *Analytical opinion based on the 4h chart:* - **Support:** 0.2569 is the 24h low and the immediate floor. Below it, 0.2298 is the line that matters, since it is the base from which the entire spike launched. - **Resistance:** 0.2748 is the first overhead level. The next is 0.3199, which sits near the midpoint of the spike range. A recovery that can't reclaim 0.2748 on volume is a bounce, not a reversal. - **Volume:** the spike candles carried the heaviest volume on the chart, and the decline was orderly rather than panicked. The latest bar's volume of 574.75 is above its 5-period average (317.76K) but below the 10-period average (660.37K), which points to cooling participation after the blow-off. - **Order book:** the 52/48 buy-sell split is essentially neutral and tells you little. I can't verify the 50-day MA, 200-day MA, RSI or MACD from this screenshot, so I haven't put numbers on them. After a drop like this, I'd expect the daily RSI to have fallen from overbought to weak, but check that on your own chart. ## The Bigger Market Story Two catalysts are visible. 1. **The buyback narrative.** On Nov 8, Cyber said it had repurchased about $13 million worth of CYBER over the past year. That is a large number next to a market cap that looks to be in the high teens of millions at today's price (my estimate, from circulating supply figures of 63–67M). It is a single brief report, though, and the purchases were spread over a year at much higher prices. 2. **Korean liquidity.** CYBER has a history of Upbit-driven moves. Its August 2025 listing sparked a 133% price surge, and at one point Upbit held about 33% of circulating supply. That figure is dated, but concentrated exchange balances help explain why pumps in this token are violent and fade fast. The project itself has repositioned from a social graph protocol to an Ethereum L2 built on the OP Stack for social apps and AI agents. Nothing I found shows a new product milestone behind this week's rally. ## Bullish vs. Bearish Case **Bullish:** Price has held above the 0.2298 base, so the structure isn't broken. A sustained reclaim of 0.2748 and then 0.3199 would suggest buyers are defending higher lows. Continued buybacks would also matter, if they are confirmed on-chain. **Bearish:** The spike was fully faded, and the fade is the dominant signal. A close below 0.2569 followed by a break of 0.2298 would invalidate any recovery thesis and put price at fresh lows. This is a thin, low-cap token where a few large wallets can set the direction. ## Long-Term Perspective - Max supply is **100M**. Circulating supply varies by source, from about 62.65M to roughly 67M elsewhere. Check this yourself, because the discrepancy changes the market cap. - That leaves roughly a third of supply yet to enter circulation, which is a structural overhang. - A scheduled unlock on **Nov 13** will release 511.12K CYBER, about 0.51% of total supply. At today's price that is roughly $133K (my calculation). It is small, but in a thin market even small releases can affect sentiment. ## Final Verdict CYBER is trading as a **liquidity event, not a fundamental re-rating**. The spike showed how quickly attention can arrive, and the retracement showed how little is holding it there. The single most important thing to monitor is whether **0.2569/0.2298 holds on a closing basis**. Support that holds after a full retracement means the sellers are exhausted. A break means the last demand zone has failed. $CYBERUSDT #ByXIMPACT
Hyperliquid (HYPE) has rapidly positioned itself as a formidable player in the decentralized perpetuals exchange sector. Unlike many protocols that rely on existing Layer 1 or Layer 2 networks, Hyperliquid operates on its own purpose-built Layer 1 blockchain. This architecture is designed specifically to handle high-frequency trading, utilizing a custom consensus mechanism and an on-chain order book that mimics the latency of centralized exchanges. From a factual standpoint, the network has demonstrated impressive metrics. It has consistently captured a significant share of decentralized exchange (DEX) trading volume, frequently rivaling established centralized platforms. The protocol’s total value locked (TVL) and daily active users have shown substantial growth, driven by a highly engaged community and a massive airdrop distribution that rewarded early adopters and active traders. Analytically, the current market setup reflects a strong premium placed on Hyperliquid’s technological differentiation and user acquisition capabilities. Traders are gravitating toward the platform due to its deep liquidity, low fees, and seamless user experience. The HYPE token acts as the primary governance and utility asset within this ecosystem, capturing value from the network's expanding economic activity. However, a clear distinction must be made between documented network activity and long-term sustainability. While the airdrop and initial incentive programs successfully bootstrapped liquidity and volume, the market must now evaluate whether this traction is organic. The analytical challenge lies in determining if the platform can retain its user base once promotional yields normalize. Furthermore, as a platform offering leveraged trading, Hyperliquid operates in a highly scrutinized regulatory environment. The protocol's ability to navigate potential compliance hurdles without stifling its permissionless nature remains a critical variable. In conclusion, the market is currently pricing in Hyperliquid’s proven technological execution and its rapid capture of DEX market share. The token reflects optimism regarding its ability to maintain high throughput and user engagement. What still needs to be proven is whether the platform can sustain its trading volumes purely on the merit of its product rather than financial incentives, and how it will adapt to an increasingly complex global regulatory landscape for derivatives trading. $HYPEUSDT #ByXIMPACT