Bit Beacon
1985Like0Shares122Fans183Follow
Zameer Saab
Zameer Saab
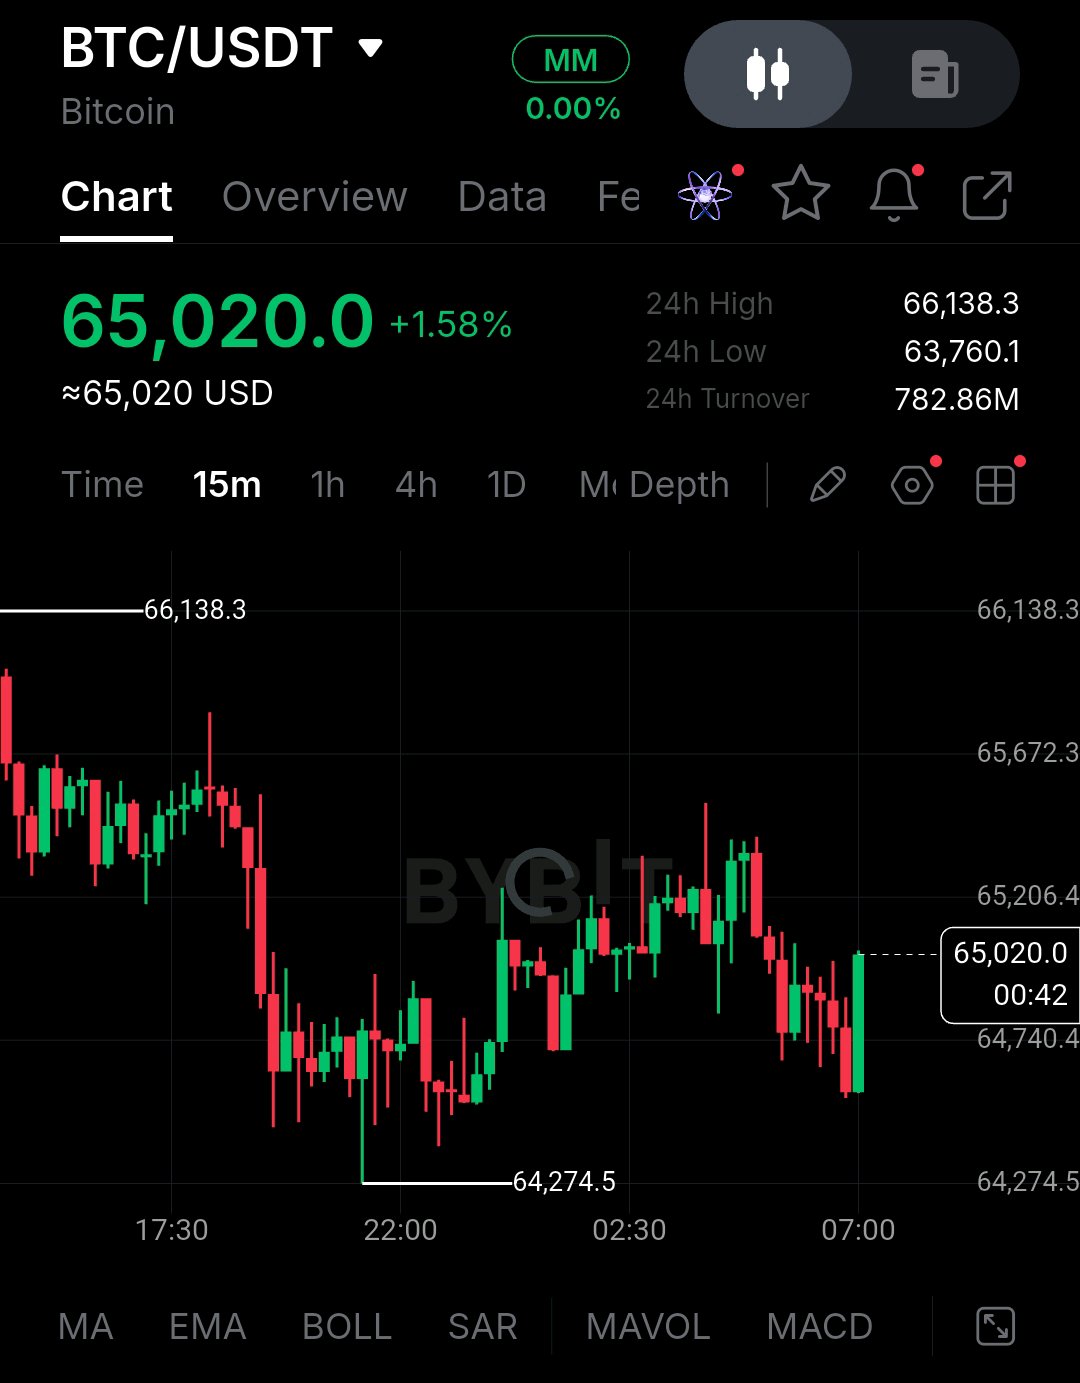
Bitcoin is attempting a short-term recovery near $65,020, up 1.58% in the latest chart snapshot. However, the broader market remains under pressure, with BTC struggling to regain bullish momentum after a significant correction. The immediate support levels are $64,274 and $63,760, while resistance stands at $65,206, $65,672 and $66,138. Institutional Developments Institutional adoption remains a long-term strength for Bitcoin, particularly through US spot Bitcoin ETFs. However, recent ETF outflows indicate weakening institutional demand. This highlights an important difference: Bitcoin's infrastructure continues growing, but capital inflows are needed to support price recovery. On-Chain Activity Bitcoin's network remains active, with approximately 465,786 daily transactions and 647,586 active addresses in the latest available dataset. Its network activity demonstrates continued usage, although transaction growth does not automatically translate into stronger buying demand. Supply and Tokenomics Bitcoin's maximum supply remains fixed at 21 million BTC, with approximately 20.11 million already circulating. The 2024 halving reduced mining rewards from 6.25 BTC to 3.125 BTC. The next halving, expected around 2028, will reduce issuance further. This declining supply supports Bitcoin's long-term scarcity narrative, but demand remains essential. Derivatives Market - Futures open interest: $41.45B - 24H OI change: -3.79% - Funding rate: -0.0013% - Futures volume: $70.55B - Spot volume: $7.01B - 24H liquidations: $249.35M Declining open interest suggests traders are reducing exposure, while negative funding indicates short-side positioning pressure. Key Market Levels - Current chart price: $65,020 - Support: $64,274 - Secondary support: $63,760 - Resistance: $65,206 - Major resistance: $66,138 - Circulating supply: 20.11M BTC - Maximum supply: 21M BTC Bullish and Bearish Scenarios Bullish: BTC needs to defend $64,274 and reclaim $65,206. A breakout above $66,138, supported by stronger spot volume and renewed ETF inflows, would strengthen recovery expectations. Bearish: Losing $64,274 could expose $63,760. Continued ETF outflows and weak spot demand would increase downside pressure. Final Outlook Bitcoin still has three major fundamental strengths: limited supply, institutional infrastructure and a globally active network. However, fundamentals alone cannot reverse a market correction. Stronger spot demand, improving ETF flows and resistance breakouts are needed. The key level I am watching is $66,138. Can Bitcoin reclaim it and turn this recovery attempt into a sustainable reversal? $BTCUSDT #ByXIMPACT
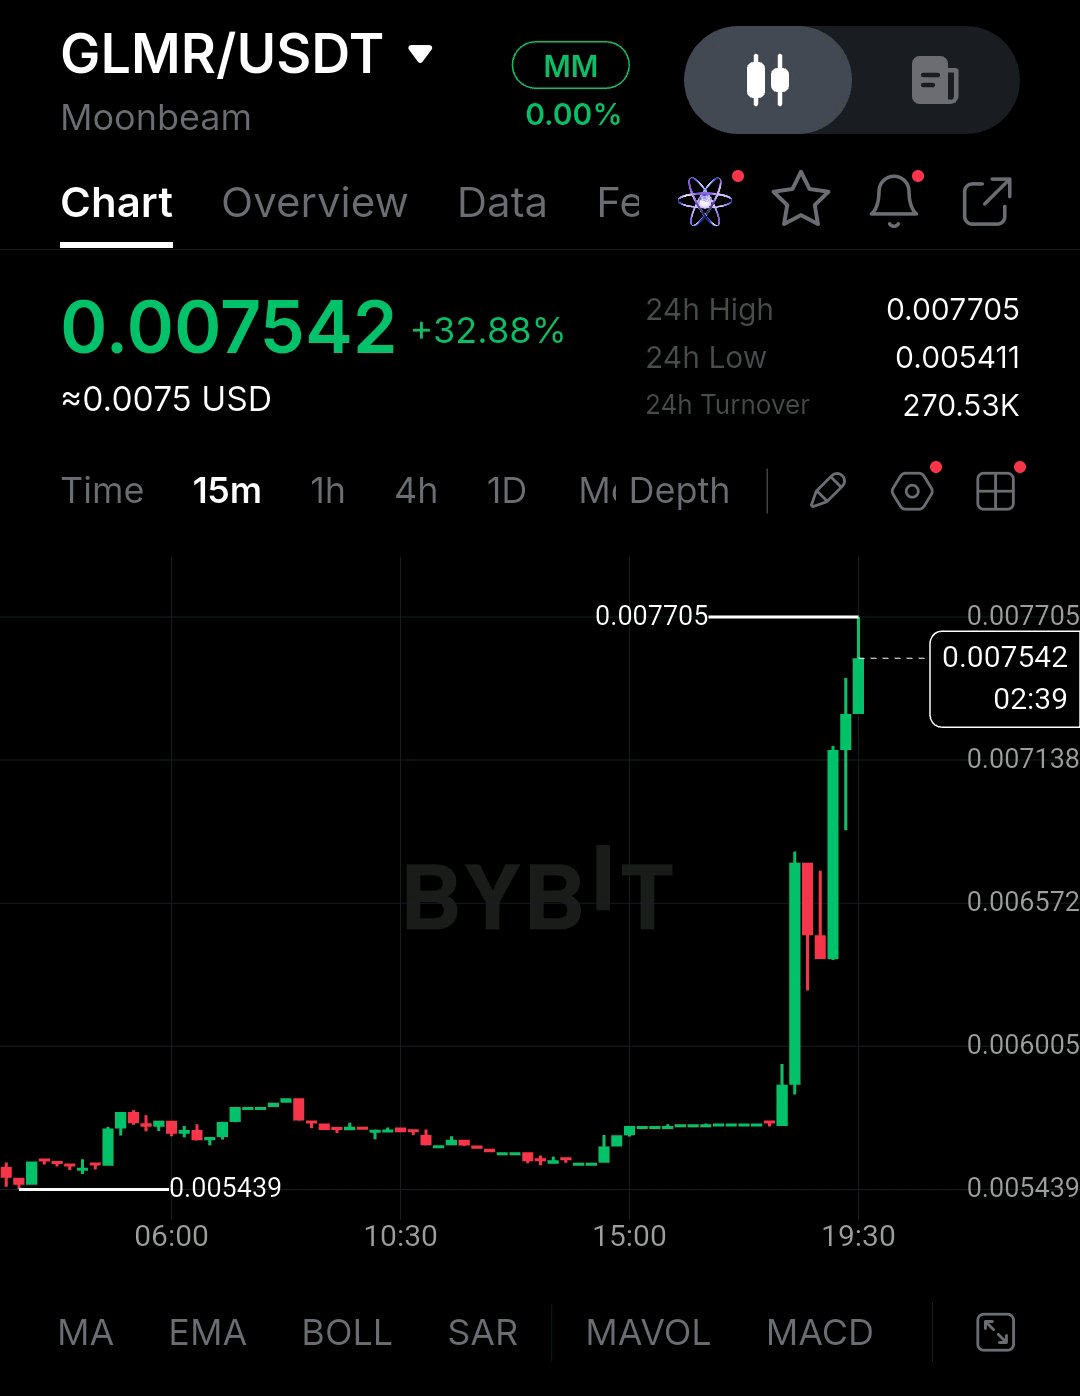
Moonbeam (GLMR) is showing a strong short-term recovery, but the bigger question is whether this momentum can turn into sustainable growth. According to the supplied Bybit chart, GLMR is trading at $0.007542, up 32.88% in 24 hours. It recovered from approximately $0.005439 and reached a high of $0.007705. The immediate resistance is $0.007705, while support sits around $0.007138 and $0.006572. A breakout needs confirmation before calling this a genuine trend reversal. Ecosystem and fundamentals Moonbeam has announced its migration from Polkadot to Base through a 1:1 GLMR token migration, alongside a new focus on decentralized AI-agent communication and on-chain settlement. This creates a new growth opportunity, but the real test is adoption. Active users, transactions, liquidity and settlement volume must increase before the new narrative translates into meaningful token demand. The legacy Moonbeam network entered maintenance mode, so its historical activity should not be confused with growth on Base. Tokenomics and supply Reported token data indicates approximately 1.1–1.22 billion GLMR circulating, depending on the data provider. A modeled unlock of approximately 4.55 million GLMR is scheduled for November 20, 2026. Moonbeam also introduced a 100% transaction-fee burn policy in March 2025. However, meaningful burns require meaningful network activity. Market positioning Reliable aggregate open-interest and funding-rate figures are currently unavailable. Therefore, the recent rally cannot confidently be attributed to leveraged futures demand. Key figures - Price: $0.007542 (chart snapshot) - 24H change: +32.88% - 24H high: $0.007705 - 24H low: $0.005411 - Immediate support: $0.007138 - Lower support: $0.006572 - Market cap: approximately $6.92M (separate market-data snapshot) - Upcoming modeled unlock: 4.55M GLMR Bullish and bearish scenarios Bullish: A sustained breakout above $0.007705, followed by a successful retest and increasing spot demand, could strengthen the recovery. Bearish: Losing $0.007138 could weaken momentum, while a breakdown below $0.006572 could expose further downside. Final conclusion GLMR has three important developments worth watching: its migration to Base, its AI-agent infrastructure strategy, and its token supply mechanisms. However, a new narrative is not enough. The project still needs measurable adoption, real economic activity and consistent token demand. The next major test is $0.007705. Can buyers break this resistance and turn the current recovery into a sustainable trend? $GLMRUSDT #ByXIMPACT
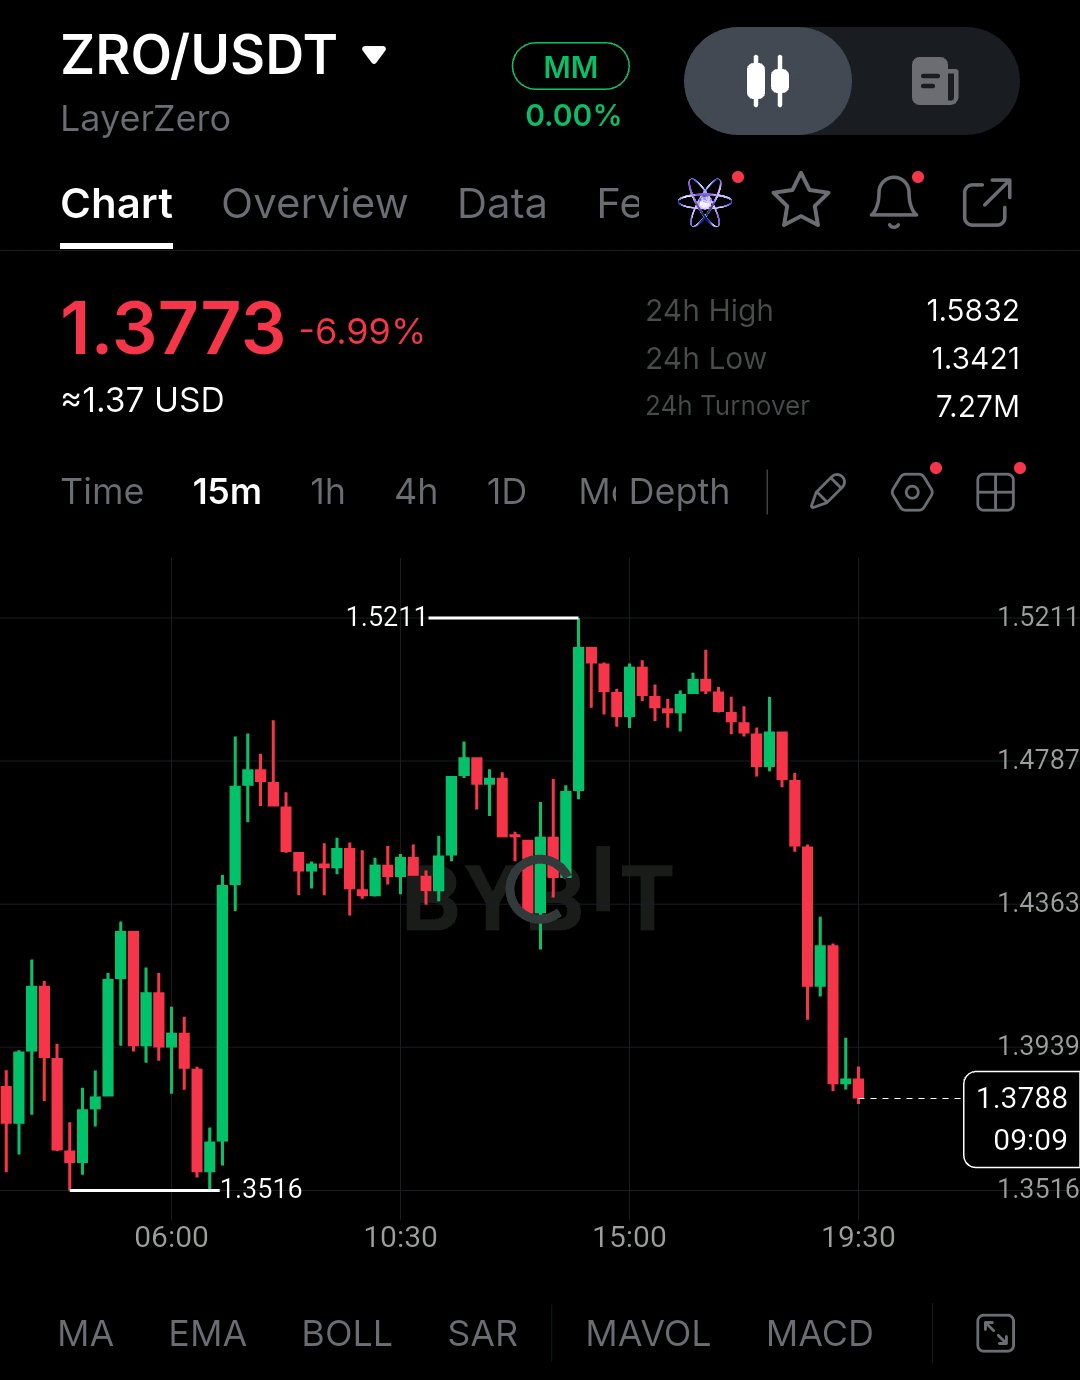
ZRO is facing a critical market test. The token is trading around $1.3773, down 6.99% in 24 hours, after failing to hold its intraday high of $1.5211. Sellers are controlling the short-term structure, while $1.3516 remains an important support level. Fundamentals and Ecosystem Growth LayerZero continues expanding its cross-chain infrastructure. Its OFT standard supports stablecoin projects such as USDt0 and PYUSD, while its ecosystem has processed over $300 billion in reported lifetime cross-chain volume. Its institutional ambitions are also growing through Zero and developments involving 21X AG. These developments strengthen the long-term infrastructure story, but adoption does not automatically create buying demand for ZRO. Network Activity and Tokenomics Reported network TVL stands around $16.64 billion, with approximately $411,219 in 30-day fees. ZRO has a maximum supply of 1 billion tokens, with approximately 405.97 million circulating. The Foundation reports 2.72 million ZRO purchased through buybacks. However, the upcoming November token unlock could introduce additional selling pressure. The protocol fee switch also remains inactive, making future value capture an important factor to watch. Derivatives Market Open interest stands near $137.25 million, while 24-hour futures volume is approximately $195.82 million. Long liquidations have significantly exceeded short liquidations, showing that leveraged buyers have faced considerable pressure. Important Market Levels - Current price: $1.3773 - Market cap: Approximately $563M - 24H change: -6.99% - 7D performance: -9.98% - Support: $1.3516 - Resistance: $1.4363 - Major resistance: $1.4787–$1.5211 - Circulating supply: 405.97M ZRO - Open interest: $137.25M Bullish and Bearish Scenarios For a recovery, ZRO needs to defend $1.3516, reclaim $1.4363 and break above $1.4787. Strong spot buying would make that recovery more convincing. On the other hand, losing $1.3516 could expose ZRO to further downside, especially with upcoming token unlocks and continued selling pressure. Final Conclusion LayerZero has three important strengths: expanding cross-chain adoption, institutional infrastructure development and a growing buyback mechanism. But the market still needs stronger spot demand, better token value capture and improved price structure. For now, $1.3516 is the key level to watch. The next important question is whether buyers can defend support and bring ZRO back above $1.4363. $ZROUSDT #ByXIMPACT
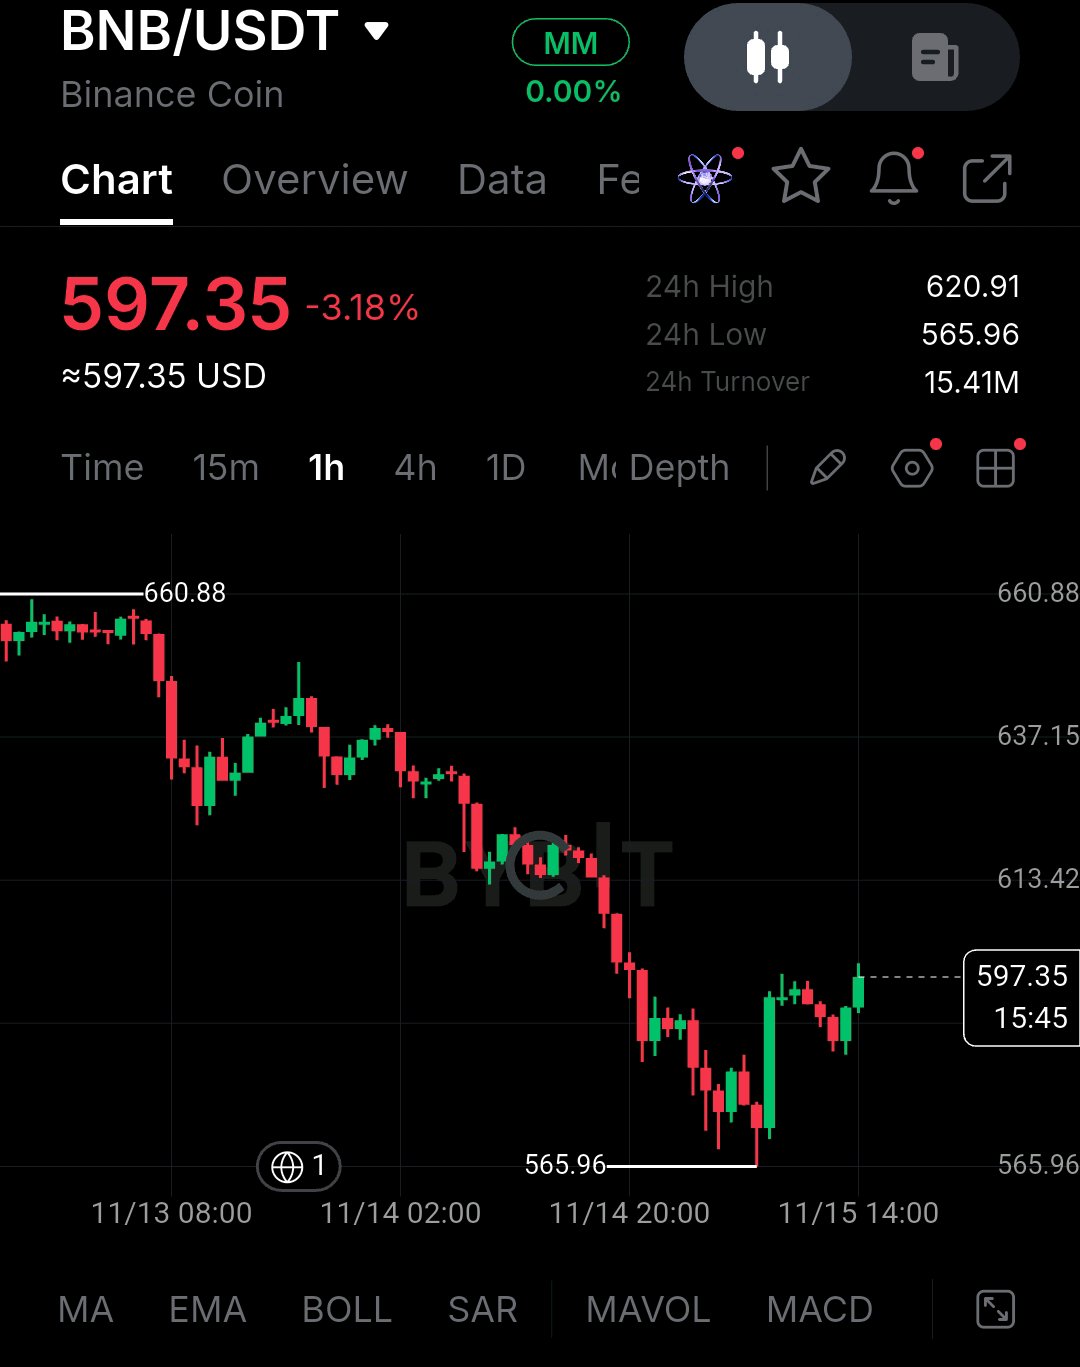
BNB is facing an important recovery test after a sharp decline. Currently trading around $597.35, down 3.18%, the chart shows selling pressure despite a recent bounce from $565.96. The immediate resistance stands at $600–$605, followed by $613.42 and $620.91. On the downside, $565.96 remains the key support to watch. Buyers need to reclaim resistance before a genuine trend reversal can be confirmed. Institutional Growth and Ecosystem BNB Chain continues expanding its institutional presence through tokenized financial products and integrations involving BlackRock, Franklin Templeton, VanEck, and Ondo Finance. These developments strengthen the ecosystem and demonstrate growing institutional interest. However, institutional activity does not automatically translate into direct BNB buying demand. On-Chain Activity BNB Chain continues recording significant network usage: - Daily transactions: Approximately 16.97 million - Active addresses: Approximately 3.16 million - Stablecoin supply: Approximately $13.64 billion - TVL: Approximately $4.47 billion These figures highlight strong ecosystem activity, although network growth still needs to translate into sustainable token demand. Tokenomics and Supply BNB completed its 37th quarterly burn on October 19, removing approximately 1.646 million BNB, worth around $1.197 billion at the time. Remaining supply stands near 131.51 million BNB, with a long-term target of 100 million. This creates gradual supply reduction, but stronger demand remains essential for price appreciation. Derivatives Market The derivatives market shows caution: - Open interest: ~$959.36 million - 24H OI change: -3.95% - Funding rate: +0.0011% - 24H liquidations: ~$18.54 million Most liquidations came from long positions, suggesting leveraged bullish traders faced considerable pressure. Key Market Levels - Current price: $597.35 - 24H change: -3.18% - Support: $565.96 - Resistance: $600–$605 - Major resistance: $620.91 - Market cap: Approximately $77.59 billion Bullish vs Bearish Outlook Bullish: Holding $565.96 and reclaiming $605 could open the way toward $613.42 and $620.91. Strong spot volume would provide additional confirmation. Bearish: Losing $590 could weaken the recovery, while a breakdown below $565.96 would signal renewed selling pressure. Final Conclusion BNB still has three major fundamental strengths: expanding institutional adoption, substantial on-chain activity, and a continuing token-burning mechanism. However, strong fundamentals alone cannot reverse a weak market structure. For now, $565.96 is the critical support, while $620.91 is the key resistance. The next major signal will be whether buyers can reclaim resistance with genuine spot demand or sellers regain control. $BNBUSDT #IMPACTbyTrade
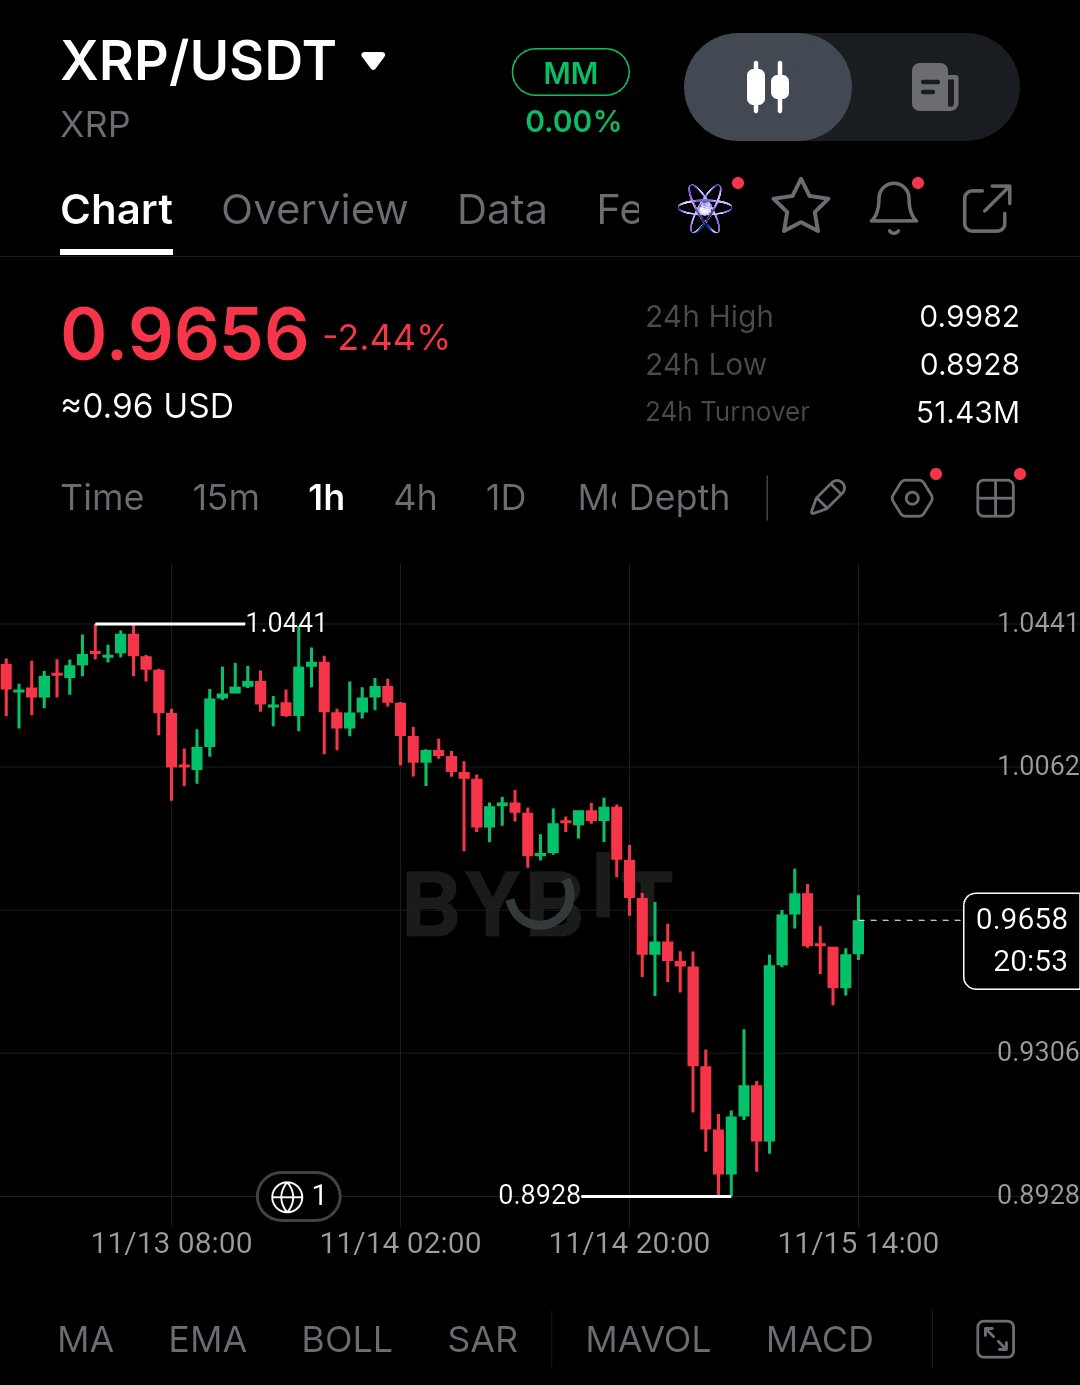
XRP is attempting a recovery after a sharp sell-off, but buyers still need to prove their strength. XRP is trading around $0.9656, down 2.44% in 24 hours. The chart shows a 24-hour high of $0.9982 and a low of $0.8928, with approximately $51.43 million in reported Bybit turnover. The 1-hour chart shows a bearish structure with lower highs and lower lows. However, buyers stepped in around $0.8928, triggering a recovery toward $0.9656. This is encouraging, but a confirmed trend reversal has not happened yet. 1. Institutional Developments Ripple continues expanding its institutional presence. - Standard Chartered is expanding digital asset custody support involving XRP and RLUSD. - BNY is supporting XRP and RLUSD through its digital asset custody platform. - Coinbase has expanded RLUSD availability. - Robinhood is exploring further institutional settlement opportunities with Ripple. - Ripple is also expanding tokenized finance and payment-related initiatives. These developments strengthen the XRP ecosystem. However, institutional adoption does not automatically translate into direct buying demand for XRP. 2. On-Chain Activity XRPL continues processing significant network activity. Recent reported figures include: - Daily transactions: 1.72 million - Active accounts: approximately 29,966 - Daily payments: 456,714 - Stablecoin supply: approximately $852 million - DeFi TVL: approximately $28.18 million - Daily network fees: approximately $1,439 The network is being used, but relatively low fees show that increased activity does not necessarily create substantial value for XRP holders. 3. Tokenomics and Supply XRP has a maximum supply of 100 billion tokens, with approximately 63.52 billion currently circulating. Ripple releases XRP from escrow, with unused amounts generally returned to escrow. Transaction fees are permanently burned. Unlike Bitcoin, XRP has no mining rewards or scheduled halving. The main supply consideration is whether market demand can absorb available tokens and potential selling pressure. 4. Derivatives Market The futures market shows reduced leverage and significant long liquidations. - Futures open interest: approximately $1.99 billion - 24H OI change: -8.54% - Futures volume: approximately $4.80 billion - Funding rate: -0.0019% - 24H liquidations: approximately $47.63 million - Long liquidations: approximately $43.49 million This suggests leveraged traders are reducing exposure. A sustainable recovery needs stronger spot buying rather than another short-lived leveraged bounce. 5. Important Market Figures | Metric | Value | |---|---:| | Current price | $0.9656 | | 24H change | -2.44% | | Market cap | ~$60.68B | | 7D performance | -14.33% | | Spot volume | ~$1.29B | | Immediate support | $0.9306 | | Major support | $0.8928 | | Immediate resistance | $0.9982 | | Higher resistance | $1.0062 | | Circulating supply | 63.52B | | Maximum supply | 100B | | Stablecoin supply | ~$852M | | Open interest | ~$1.99B | | 24H OI change | -8.54% | 6. Bullish and Bearish Scenarios Bullish confirmation: XRP needs to hold $0.9306 and break above $0.9982. A successful reclaim of $1.0062 would strengthen the recovery structure. Increasing spot volume, improving liquidity and stabilizing open interest would provide additional confirmation. Bearish confirmation: Losing $0.9306 could expose XRP to another test of $0.8928. A breakdown below that level would weaken the recovery attempt and increase downside risk. 7. Final Market Conclusion XRP has meaningful long-term developments supporting its ecosystem, particularly institutional custody, RLUSD expansion and growing payment infrastructure. However, its price structure remains weak, stablecoin liquidity needs attention, and derivatives positioning shows that leveraged buyers are under pressure. The difference between Ripple's business growth and XRP's actual token demand remains the most important factor to watch. My view: XRP has long-term potential, but the market needs stronger buying pressure before a sustainable recovery can be confirmed. For now, $0.9982 is the key resistance. Can XRP reclaim this level and finally bring buyers back into control? $XRPUSDT #IMPACTbyTrade
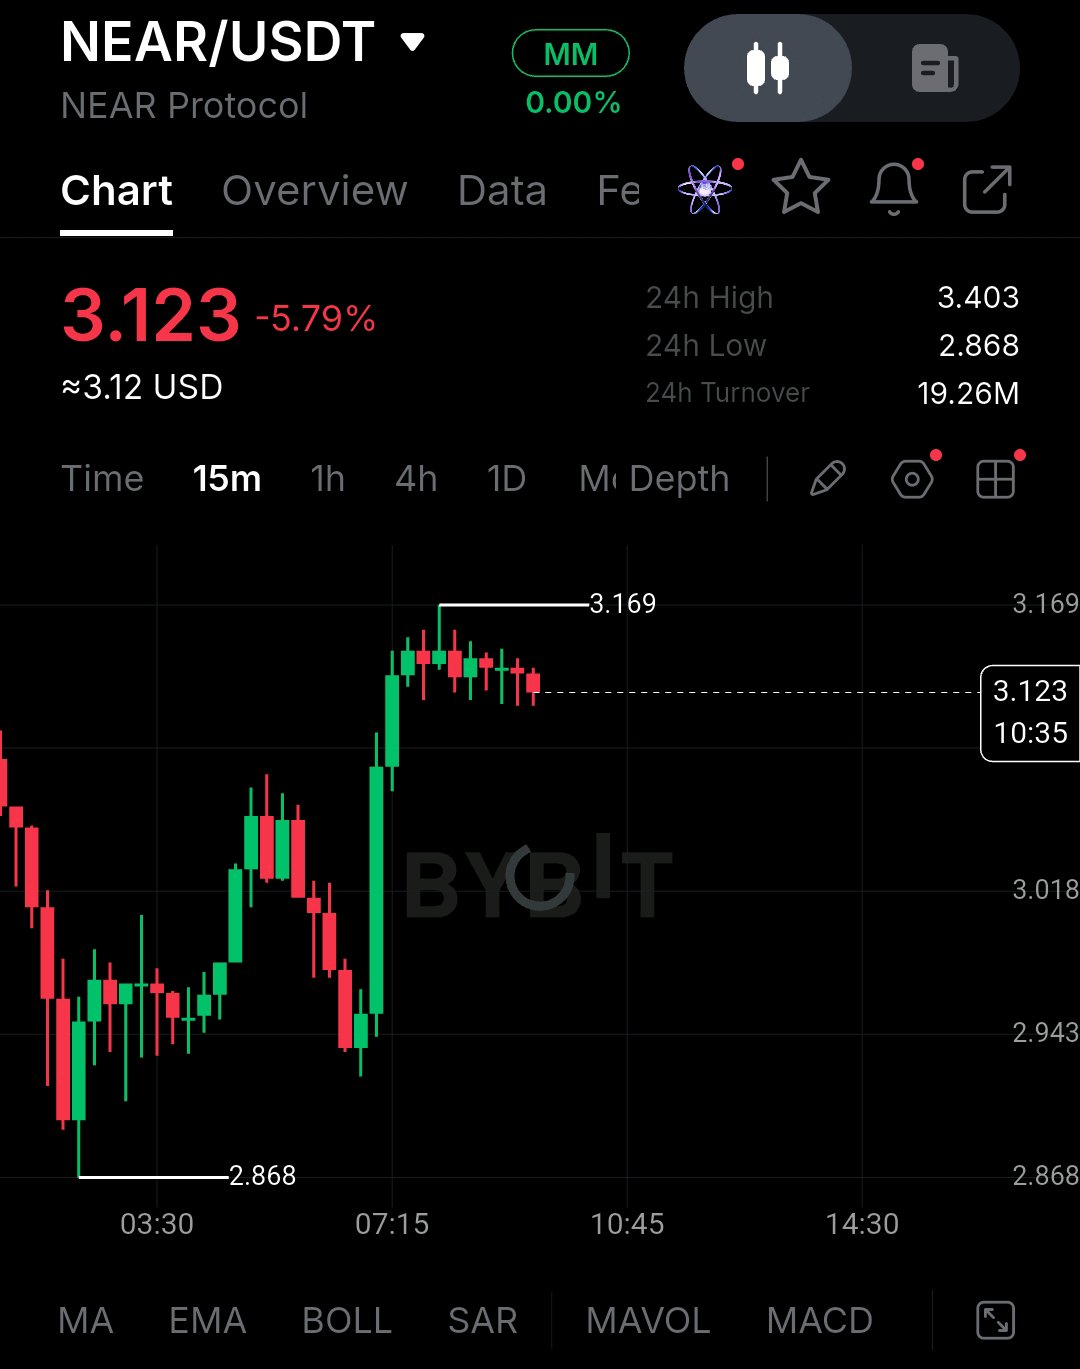
NEAR Protocol is showing an interesting market structure. The token is trading around $3.123, down 5.79%, despite a strong intraday recovery from its $2.868 low. Buyers pushed the price toward $3.169, but the market is now struggling to break above that resistance. The 24-hour high stands at $3.403, while reported turnover on the uploaded chart is 19.26 million USDT. The bigger picture remains weak, with NEAR still trading significantly below its all-time high. Key levels: Immediate support sits at $3.018, followed by $2.943 and $2.868. Resistance stands at $3.169, with $3.403 as the next major hurdle. Institutional Developments and Ecosystem Growth NEAR continues expanding its institutional and cross-chain infrastructure. Its integration with Talos brings NEAR Intents closer to institutional trading platforms, allowing clients to access liquidity across multiple blockchain networks. NEAR reported more than $37 billion in cumulative Intents volume and over $4 billion during the preceding 30 days. Another important development is NEAR Business, which targets business treasury management, payroll and cross-chain financial operations. These developments strengthen NEAR's long-term adoption story, but actual institutional demand for the NEAR token still needs to be demonstrated. On-Chain Activity NEAR's network continues showing meaningful activity. - Daily transactions: Approximately 1.04 million - Active addresses: 85,595 - Stablecoin supply: $133.39 million - DeFi TVL: $139.62 million - Daily network fees: Approximately $3,651 The transaction figures demonstrate network usage, while stablecoin liquidity supports its DeFi ecosystem. However, relatively low network fees show that growing adoption has not yet translated into substantial value capture for the network. Tokenomics and Supply Dynamics NEAR has introduced important changes to its tokenomics, including reduced inflation, transaction-fee burning and revenue-funded buybacks. Approximately 70% of transaction fees are burned, while the remaining 30% goes to interacting contracts. Key supply figures: - Circulating supply: Approximately 1.312 billion NEAR. - Original token distribution: 1 billion NEAR. - Reported buyback: 1 million NEAR. - Upcoming scheduled unlocks: None reported in the referenced snapshot. These mechanisms could reduce selling pressure over time, but sustained demand is necessary to support long-term price appreciation. Derivatives Market Analysis The derivatives market shows a significant reduction in leveraged exposure. - Futures open interest: $674.19 million - 24H OI change: -15.75% - Futures volume: $1.30 billion - Funding rate: -0.0025% - Total liquidations: $15.12 million - Long liquidations: Approximately $14.52 million The decline in open interest suggests traders are closing leveraged positions. Meanwhile, heavy long liquidations indicate that recent selling has particularly affected bullish traders. Negative funding shows short-side positioning, but it does not independently confirm a bullish reversal. Bullish and Bearish Scenarios Bullish confirmation: NEAR needs to defend $3.018 and reclaim $3.169 with strong buying volume. A confirmed breakout could open the way toward $3.403. Stronger spot demand and stabilizing open interest would make the recovery more convincing. Bearish confirmation: A breakdown below $3.018 could expose $2.943. If that level also fails, sellers could target the $2.868 session low. Continued spot selling and weak market sentiment would increase downside risk. Final Market Conclusion NEAR has three important fundamental strengths: expanding institutional infrastructure, growing cross-chain activity and improving tokenomics. However, strong fundamentals alone cannot guarantee a price recovery. The market still needs stronger spot demand, sustainable ecosystem revenue and confirmation from price action. For now, $3.169 is the key resistance to watch. A successful reclaim could strengthen the recovery narrative, while losing $2.943 would put buyers under renewed pressure. The real question is whether NEAR's growing ecosystem can finally translate into sustainable demand for its token. $NEARUSDT #ByXIMPACT
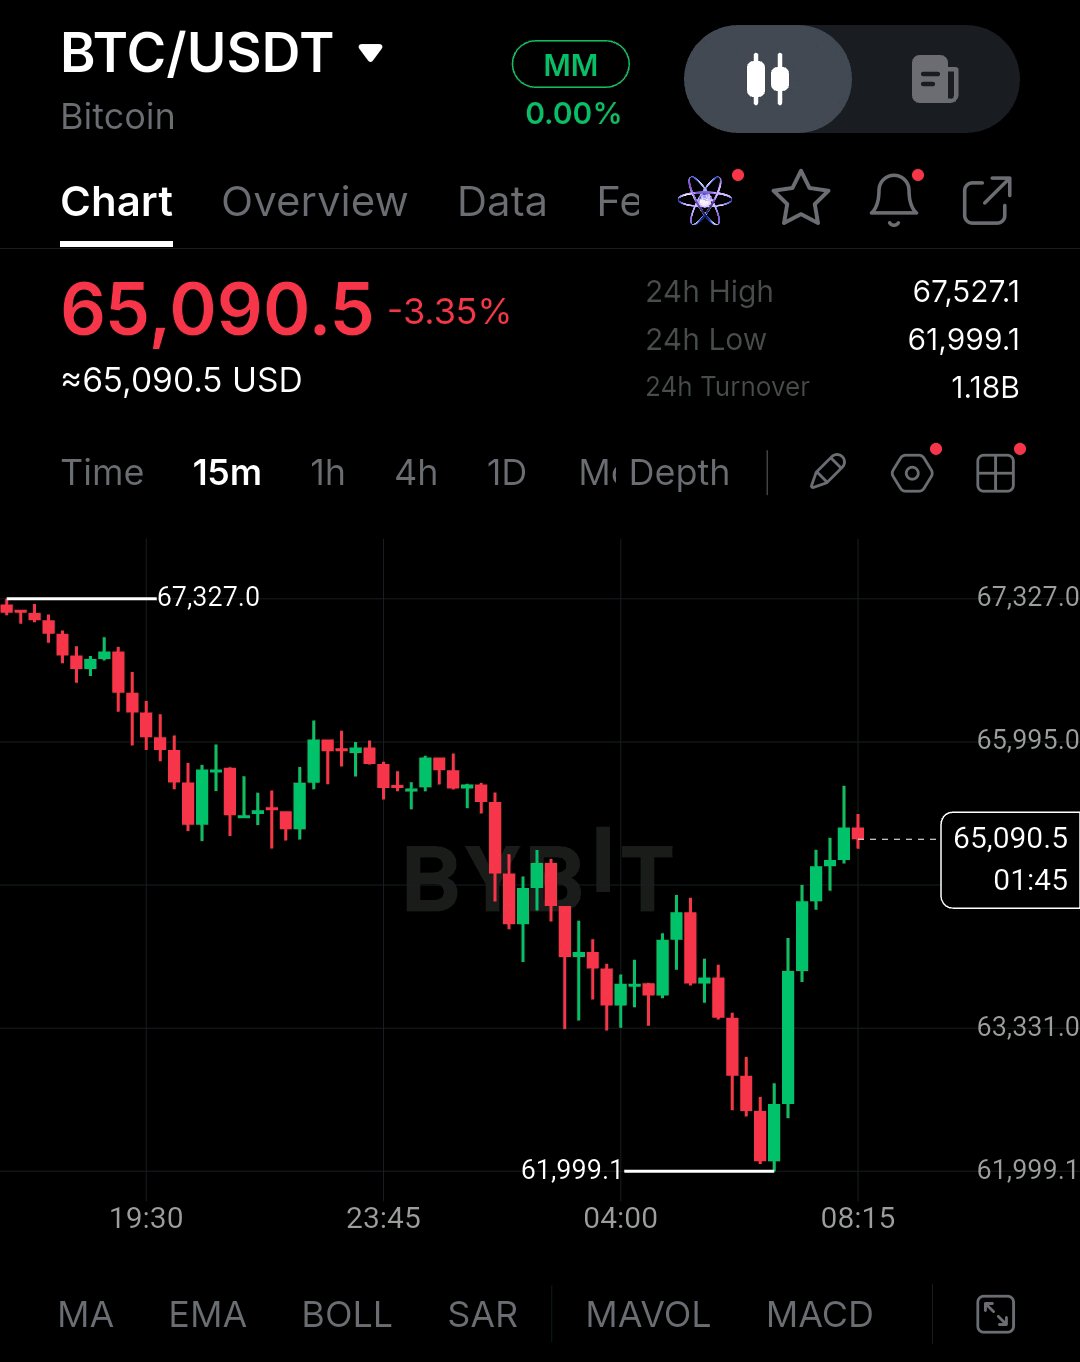
Bitcoin is showing signs of recovery after a sharp sell-off, but buyers still have an important challenge ahead. BTC is trading around $65,090, down 3.35%, after falling from $67,327 to a recent low of $61,999. The bounce from $61,999 is encouraging, as buyers have stepped in and pushed the price higher. However, the overall short-term structure remains under pressure. One recovery move is not enough to confirm a trend reversal. Institutional Activity and Market Sentiment Bitcoin continues to benefit from institutional adoption and spot ETF infrastructure. However, recent ETF outflows suggest that institutional buying pressure is not yet strong enough to support a convincing recovery. This is an important difference: Bitcoin's long-term fundamentals remain attractive, but the market still needs fresh capital and consistent spot demand. Bitcoin Network and Supply Bitcoin's network continues to demonstrate real activity, with hundreds of thousands of active addresses and substantial daily transactions. Its biggest long-term advantage remains its limited supply. - Maximum supply: 21 million BTC. - Circulating supply: Approximately 20.11 million BTC. - Current block reward: 3.125 BTC. - Next halving: Expected around 2028. The next halving will reduce new Bitcoin issuance to 1.5625 BTC per block. This strengthens Bitcoin's scarcity, although demand must still be strong enough to absorb available selling pressure. Derivatives Market: Caution Remains The derivatives market is showing signs of deleveraging. Open interest has fallen approximately 8.75%, while negative funding indicates a slight bearish bias. Around $784 million in liquidations have also been reported, with the majority coming from long positions. This suggests that many leveraged bullish traders have already been forced out. Such conditions can help reset the market, but they do not guarantee an immediate recovery. Important Price Levels to Watch Based on the 15-minute chart: - Current price: $65,090 - Immediate resistance: $65,995 - Major resistance: $67,327 - 24H high: $67,527 - Immediate support: $63,331 - Major support: $61,999 Bullish Scenario If Bitcoin reclaims $65,995 and successfully holds above it, buyers could attempt another move toward $67,327 and $67,527. A breakout supported by stronger spot volume and improving institutional flows would make the recovery more convincing. Bearish Scenario If Bitcoin fails to break resistance and loses $63,331, selling pressure could increase again. A breakdown below $61,999 would weaken the recovery structure and expose BTC to further downside. My Final Take Bitcoin still has strong long-term fundamentals: limited supply, institutional investment infrastructure and an established blockchain network. But fundamentals alone cannot reverse a weak market structure. The next recovery needs stronger spot demand, improving ETF flows and confirmation from price action. For now, I am watching $65,995 very closely. Reclaiming this level could be the first meaningful sign of strength, while another rejection could put $63,331 and $61,999 back in focus. The important thing is patience. Don't chase every green candle, and don't ignore the risk of another rejection. Cash is a position. Wait for confirmation before taking the next trade. $BTCUSDT #ByXIMPACT
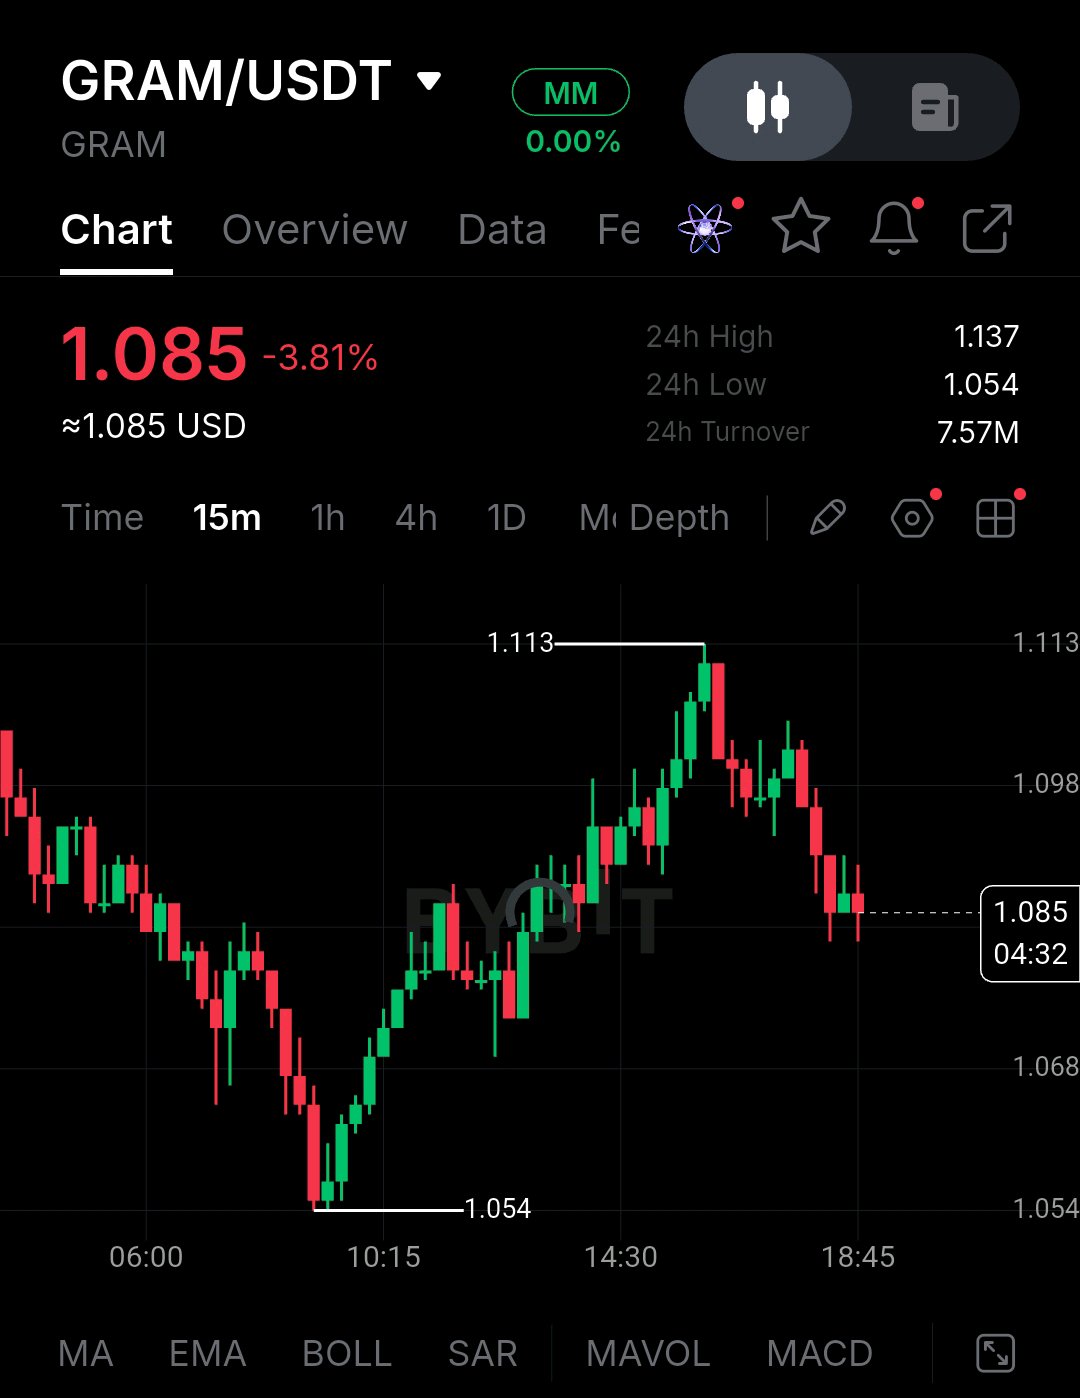
GRAM is facing renewed selling pressure despite encouraging ecosystem developments. According to your uploaded Bybit chart, GRAM is trading at **$1.085, down 3.81%aq, after recovering from $1.054 and reaching $1.113 before sellers took control again. The immediate question is whether buyers can defend $1.080 or whether the price will revisit its intraday low. 1. Market Overview GRAM has an estimated market capitalization of $3.08 billion, while its seven-day performance remains around -2.7%. Its all-time high was $8.25, leaving the token approximately 87% below its historical peak. Important technical levels: - Support: $1.080 and $1.054 - Resistance: $1.098 and $1.113 - Major intraday resistance: $1.137 The short-term structure remains cautious. Buyers need to reclaim resistance before a stronger recovery can be confirmed. 2. Institutional Developments and Ecosystem Growth Telegram's growing connection with GRAM remains an important fundamental development. Telegram founder Pavel Durov highlighted GRAM's potential and reported more than one million self-custodial wallet activations within 48 hours. TON Strategy also reported holding approximately 235.1 million GRAM as of September 30, 2026, with substantial holdings deployed in staking. These developments show growing ecosystem and institutional involvement. However, adoption does not automatically translate into immediate token demand. 3. On-Chain Activity Network activity remains meaningful: - Daily transactions: ~4.24 million - Active addresses: ~215,311 - New addresses: ~83,047 - Stablecoin supply: ~$585.94 million - DeFi TVL: ~$41.42 million These figures indicate continued network usage. However, the challenge is converting ecosystem activity into sustainable demand for GRAM itself. 4. Tokenomics and Supply GRAM has approximately 5.283 billion total tokens, with around 2.857 billion circulating. An important event is approaching on November 22, 2026, when approximately 36.58 million GRAM tokens are scheduled to unlock. This represents additional potential selling pressure. No recent confirmed token burn or upcoming halving has been established in the available data. 5. Derivatives Market The derivatives market is showing caution: - Futures open interest: ~$113.39 million - 24H OI change: -7.88% - Funding rate: -0.0271% - Futures volume: ~$130.19 million - Spot volume: ~$27.46 million - 24H liquidations: ~$934,740 Negative funding and declining open interest suggest traders are reducing leveraged exposure. Long liquidations account for most of the reported liquidation activity. This indicates that buyers are currently facing pressure rather than aggressive bullish positioning. 6. Key Figures | Metric | Value | |---|---:| | Current price | $1.085 | | Market cap | ~$3.08B | | 7D performance | ~-2.7% | | Support | $1.080 | | Major support | $1.054 | | Resistance | $1.098 | | Major resistance | $1.113 | | Daily transactions | ~4.24M | | Stablecoin supply | ~$585.94M | | Circulating supply | ~2.857B | | Upcoming unlock | 36.58M GRAM | | Open interest | ~$113.39M | | OI change | -7.88% | | Funding rate | -0.0271% | q 7. Bullish and Bearish Scenarios Bullish scenario: GRAM needs to hold $1.080 and reclaim $1.098. A confirmed breakout above $1.113 could open the way toward a retest of $1.137. Stronger spot buying and improving open interest would provide additional confirmation. Bearish scenario: Losing $1.080 would weaken the structure, while a breakdown below $1.054 would put the recovery attempt at risk. Continued long liquidations and weak spot demand could reinforce selling pressure. 8. Final Market Conclusion GRAM has three important fundamental strengths: Telegram's distribution network, growing institutional participation, and millions of daily network transactions. However, token unlocks, weak derivatives positioning and the current price decline remain important risks. The ecosystem story is encouraging, but sustainable price appreciation requires stronger demand and confirmation from the spot market. For now, $1.113 is the level I am watching closely. Can GRAM reclaim this resistance, or will sellers push the price back toward $1.054? $GRAMUSDT #IMPACTbyTrade
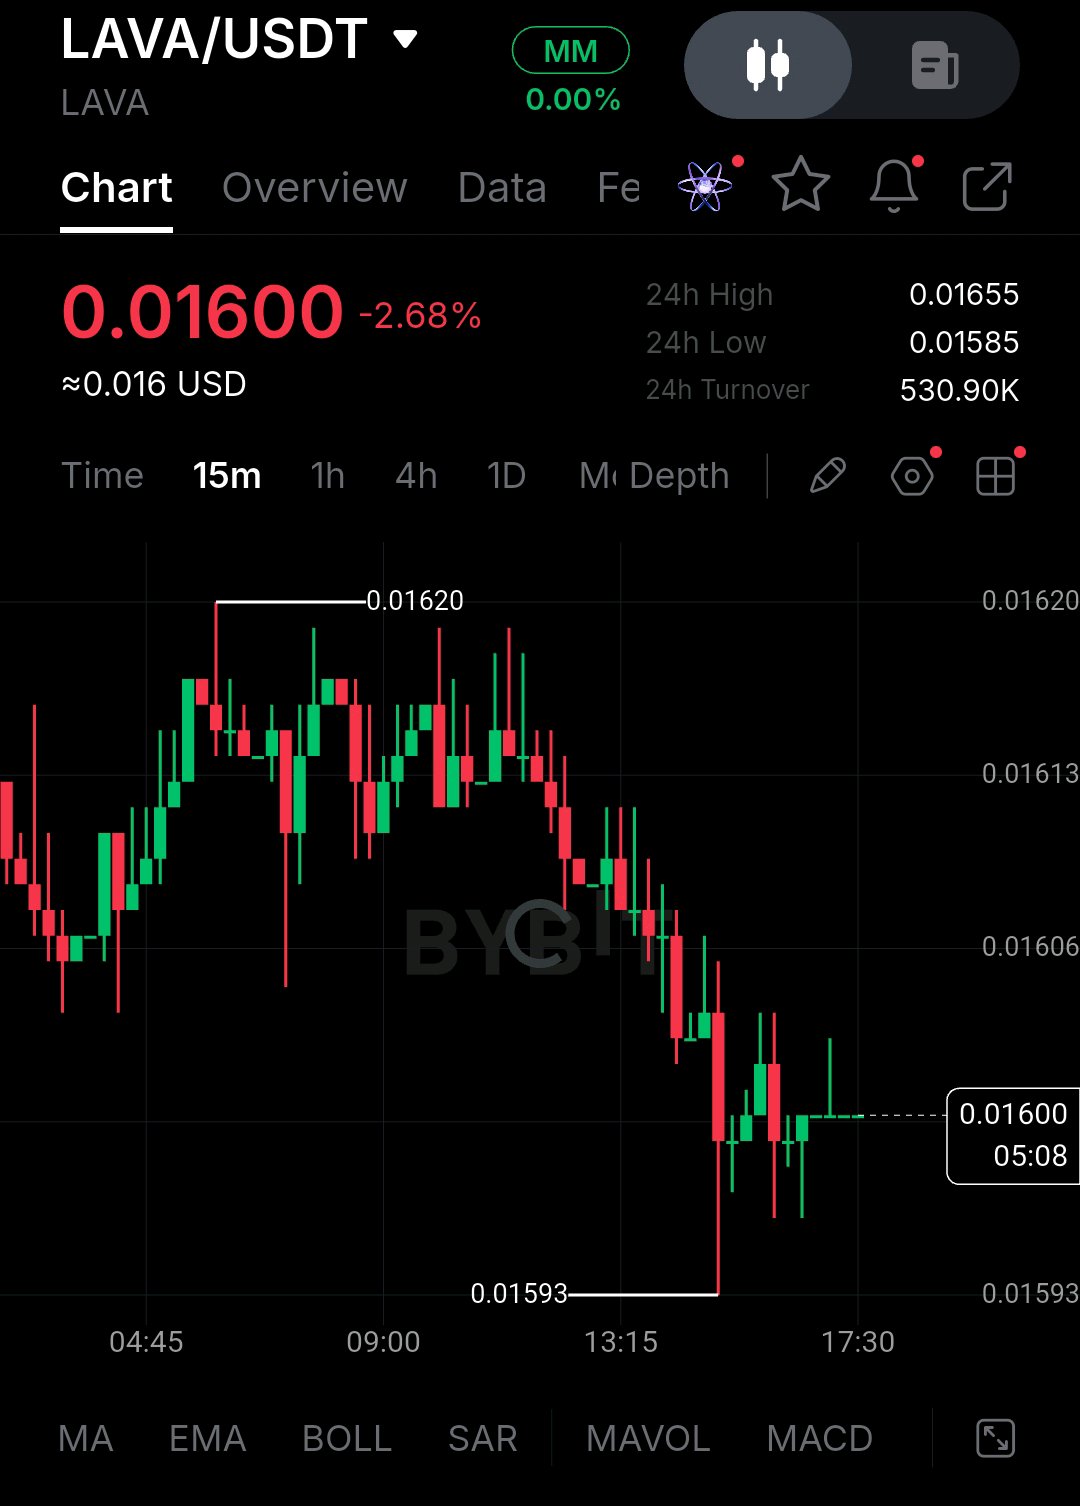
LAVA is facing short-term selling pressure despite showing positive weekly performance. At the time of the uploaded chart, the token was trading around $0.01600, down 2.68% in 24 hours. Its seven-day performance remains approximately 4.5% positive. The 24-hour high was $0.01655, while the low was $0.01585. Immediate support sits around $0.01593–$0.01585, with resistance at $0.01606, $0.01613 and $0.01620. The price is still approximately 93.5% below its all-time high of $0.2482. Lava Network's fundamental strength comes from its decentralized RPC infrastructure, connecting blockchain applications with reliable data providers. Its ecosystem supports projects including NEAR, Starknet, Filecoin and Axelar. The project has reported more than $3.5 million in protocol revenue since August 2024, demonstrating real infrastructure activity. Another development is Lava's selection for a proposed real-estate tokenization sandbox involving BHL Group. However, this remains an early-stage agreement, not confirmed deployed capital. On the supply side, LAVA has a maximum supply of 1 billion tokens, with approximately 640 million circulating. Around 21.4 million tokens are scheduled to unlock on November 30, 2026, potentially increasing selling pressure. Derivatives data remains limited, with no reliable aggregate futures open interest or funding-rate figures available. Therefore, spot volume and actual price behavior remain important indicators. Key market figures: - Current price: $0.01600 - Market cap: ~$10.29M - 24H volume: ~$704K - 7D performance: +4.5% - Support: $0.01593–$0.01585 - Resistance: $0.01606–$0.01620 - Circulating supply: ~640M - Maximum supply: 1B - Upcoming unlock: 21.4M LAVA Bullish scenario: Holding $0.01593 and reclaiming $0.01606 could open the way toward $0.01613 and $0.01620. A breakout above $0.01620 with stronger volume would provide better confirmation of buyer strength. Bearish scenario: Losing $0.01593 and breaking below $0.01585 would signal continued weakness and a failed recovery attempt. Overall, LAVA has promising infrastructure fundamentals, growing ecosystem opportunities and reported protocol revenue. However, upcoming token unlocks and weak short-term price action remain important risks. The key question now is whether buyers can defend $0.01585 and push LAVA back above $0.01620. $LAVAUSDT #ByXIMPACT
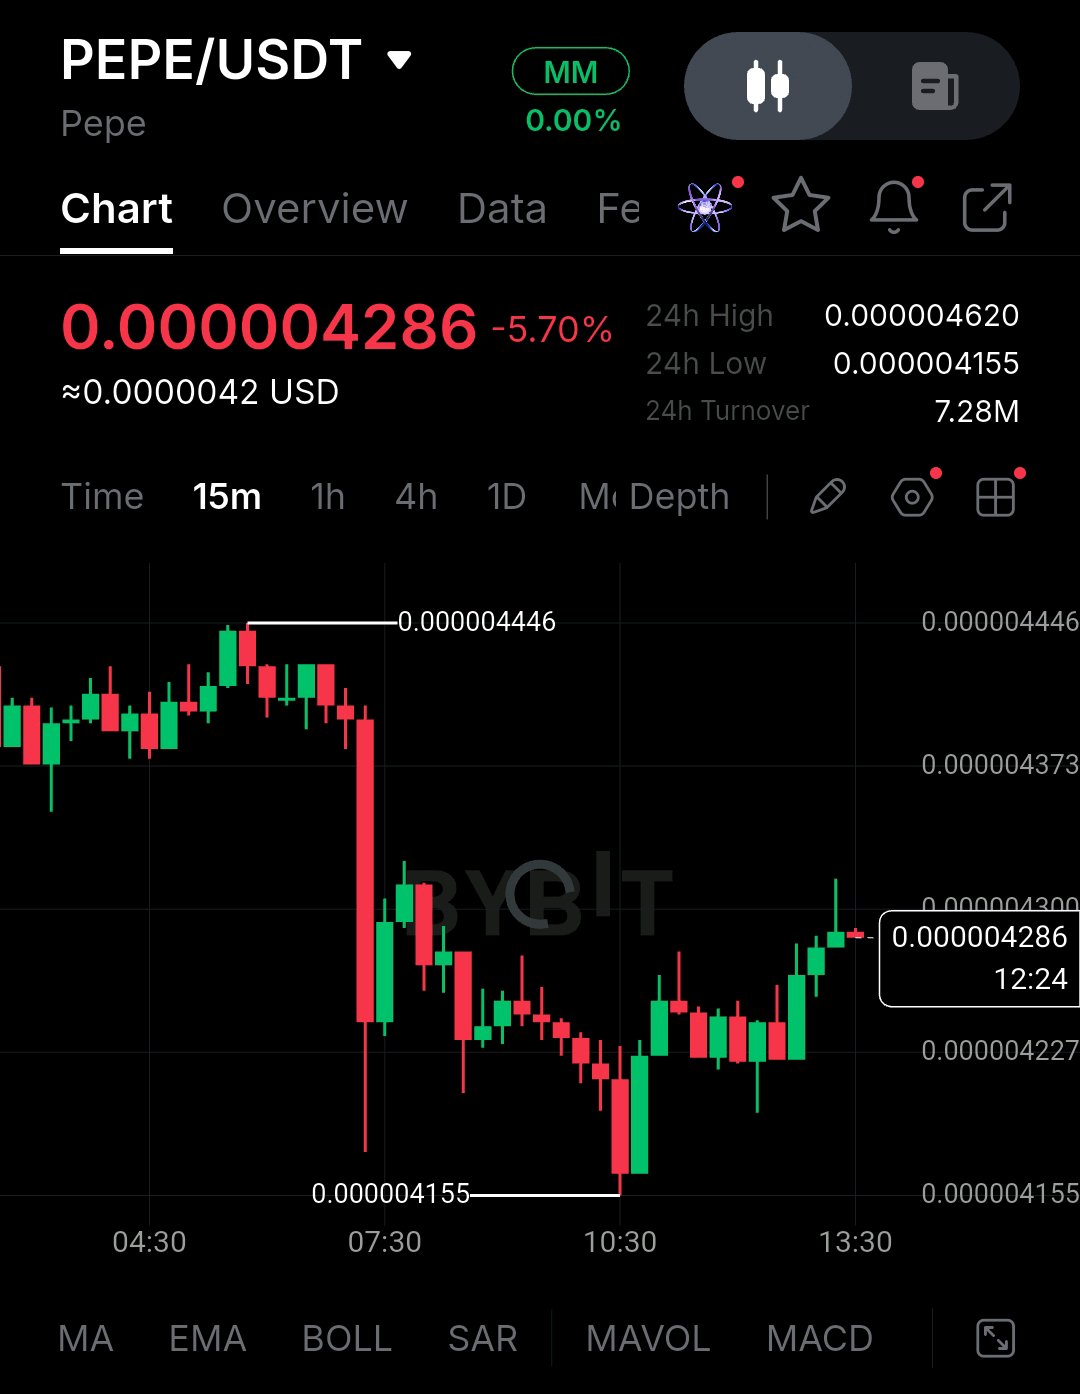
PEPE is attempting a short-term recovery after a sharp sell-off, but buyers still need to confirm a trend reversal. The token is trading at $0.000004286, down 5.70% in 24 hours. Its 24-hour high stands at $0.000004620, while the low is $0.000004155. The chart shows sellers taking control after PEPE rejected $0.000004446. Buyers have started recovering, but resistance near $0.000004300 and $0.000004373 remains important. Institutional Developments Canary Capital has filed an S-1 registration statement for a proposed PEPE ETF. This is an important step toward traditional investment access, but registration does not mean approval or confirmed institutional buying. PEPE's main demand drivers remain exchange accessibility, community interest and speculative trading. On-Chain and Tokenomics PEPE operates as an ERC-20 token on Ethereum, with approximately 413.77 trillion tokens in circulation. Around 6.9 trillion PEPE were historically burned in October 2023. There is no scheduled halving or regular inflation reduction. A fixed supply can support scarcity, but meaningful demand is still necessary for price appreciation. Derivatives Market The available market snapshot shows: * Open interest: $269.57M * 24H OI change: -8.10% * Futures volume: $429.44M * Funding rate: +0.0006% * Liquidations: $1.07M Falling open interest suggests traders are reducing exposure. Long liquidations also indicate that leveraged buyers have faced pressure. Key Market Levels | Metric | Value | | ------------------ | ------------ | | Current price | $0.000004286 | | 24H change | -5.70% | | Market cap | $1.78B | | Spot volume | $108.41M | | 7D performance | -12.23% | | Support | $0.000004155 | | Resistance | $0.000004300 | | Major resistance | $0.000004373 | | Circulating supply | 413.77T | Bullish and Bearish Scenarios Bullish: PEPE needs to defend $0.000004155 and reclaim $0.000004300. A breakout above $0.000004373, supported by stronger spot volume, could open the way toward $0.000004446. Bearish: Losing $0.000004155 would weaken the recovery structure and increase downside risk. Weak spot demand and continued selling pressure would strengthen the bearish case. Final Outlook PEPE has three developments worth watching: its proposed ETF, established exchange liquidity and fixed token supply. However, fundamentals alone cannot reverse a weak market structure. Buyers must demonstrate real demand rather than relying on leveraged speculation. The next major test is whether PEPE can hold $0.000004155 and reclaim $0.000004373. Until then, patience matters more than chasing a recovery. $PEPEUSDT #ByXIMPACT
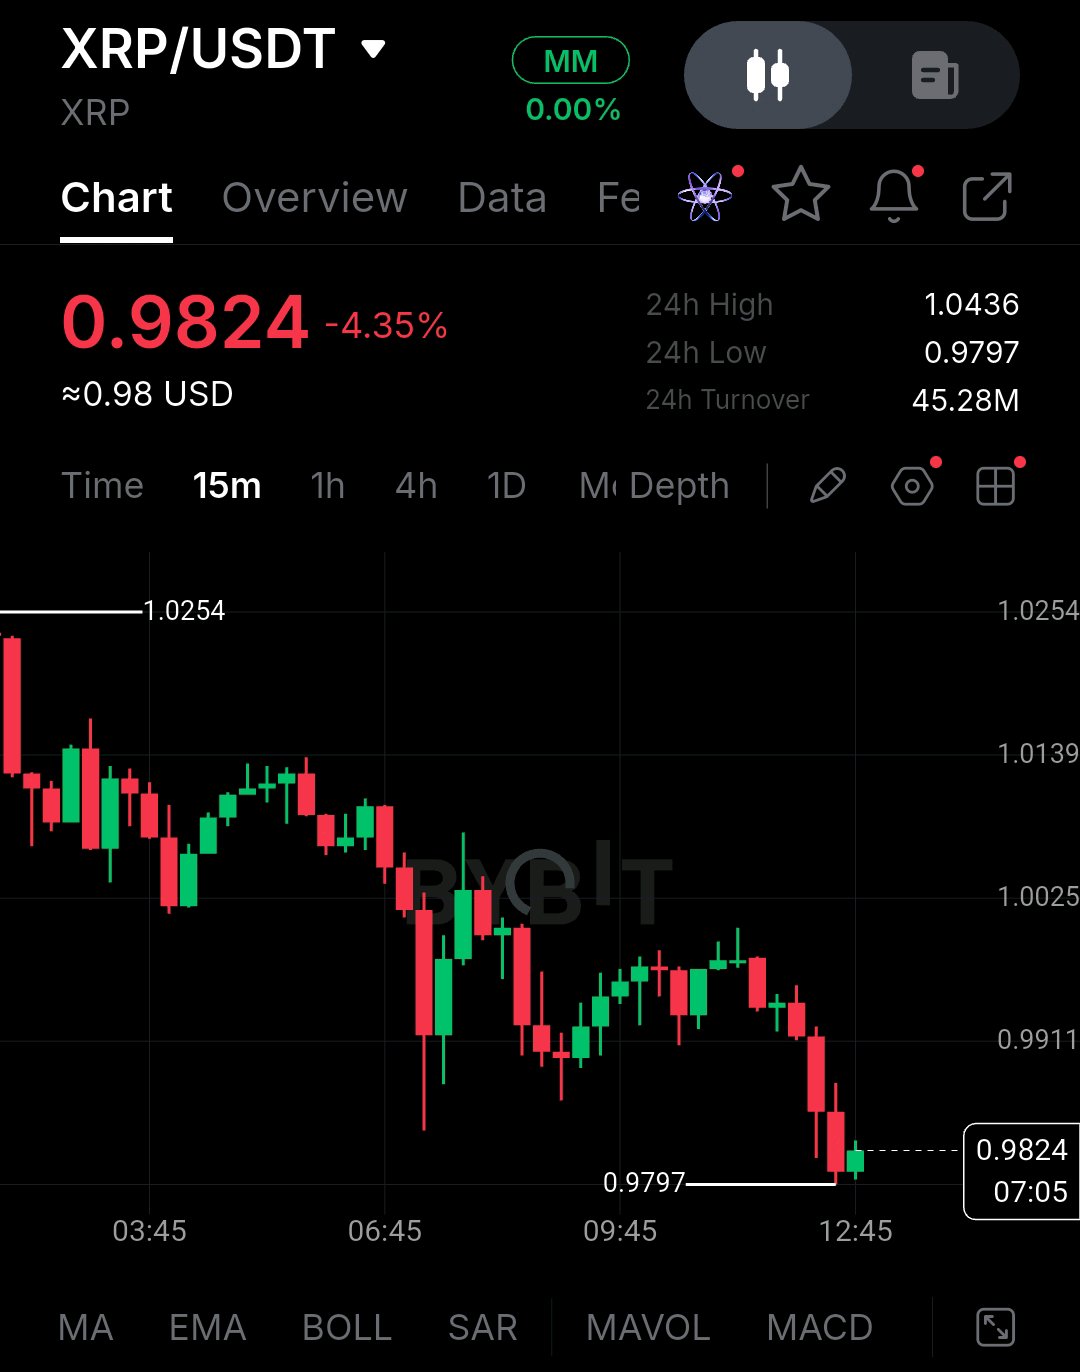
XRP is trading around **$0.9824, down 4.35%, according to the uploaded 15-minute chart. Price has dropped from the $1.0436 high and is now testing critical support near $0.9797. Despite short-term weakness, XRP's broader seven-day performance remains positive at approximately 14.48%, with market capitalization around $62.84 billion and 24-hour trading volume near $2.49 billion. Institutional Growth Ripple continues expanding its institutional footprint. Its relationships with BNY and Standard Chartered are strengthening digital asset custody and financial infrastructure. Meanwhile, RLUSD's wider distribution is creating additional opportunities for the XRP Ledger ecosystem. However, institutional adoption does not automatically translate into direct XRP buying demand. On-Chain Activity The XRP Ledger recorded approximately 4.46 million daily transactions and 61,813 active addresses. Stablecoin supply stood around $852 million. Network activity is encouraging, but the important question is whether this growth creates meaningful demand for XRP itself. Tokenomics and Supply XRP has a maximum supply of 100 billion tokens. Its transaction fees are permanently burned, while Ripple's monthly escrow releases remain an important supply consideration. The next scheduled release is December 1, 2026, with up to 1 billion XRP becoming eligible for release. Not all released tokens enter circulation. Derivatives Market Aggregate futures open interest is approximately $2.20 billion, down 0.91% over 24 hours. Funding is slightly negative, while liquidations have heavily affected leveraged longs. This suggests traders remain cautious, and leveraged bullish positions are still under pressure. Key Market Levels - Current price: $0.9824 - Immediate support: $0.9797 - Resistance: $0.9911 - Next resistance: $1.0025 - Major resistance: $1.0139 - 24H high: $1.0436 Bullish Scenario If XRP holds $0.9797 and reclaims $0.9911, buyers could attempt a recovery toward $1.0025 and $1.0139. Strong spot volume would make this recovery more convincing. Bearish Scenario A confirmed breakdown below $0.9797 would weaken the structure further. Increasing selling volume and continued long liquidations could create additional downside pressure. Final Thoughts XRP has three important long-term strengths: institutional expansion, growing RLUSD adoption and an established blockchain ecosystem. But strong fundamentals alone cannot reverse a weak market structure. For now, I am watching $0.9797 closely. Can buyers defend this support and push XRP back above $1.0025, or will sellers maintain control? Cash is a position. Confirmation matters more than anticipation. $XRPUSDT #ByXIMPACT
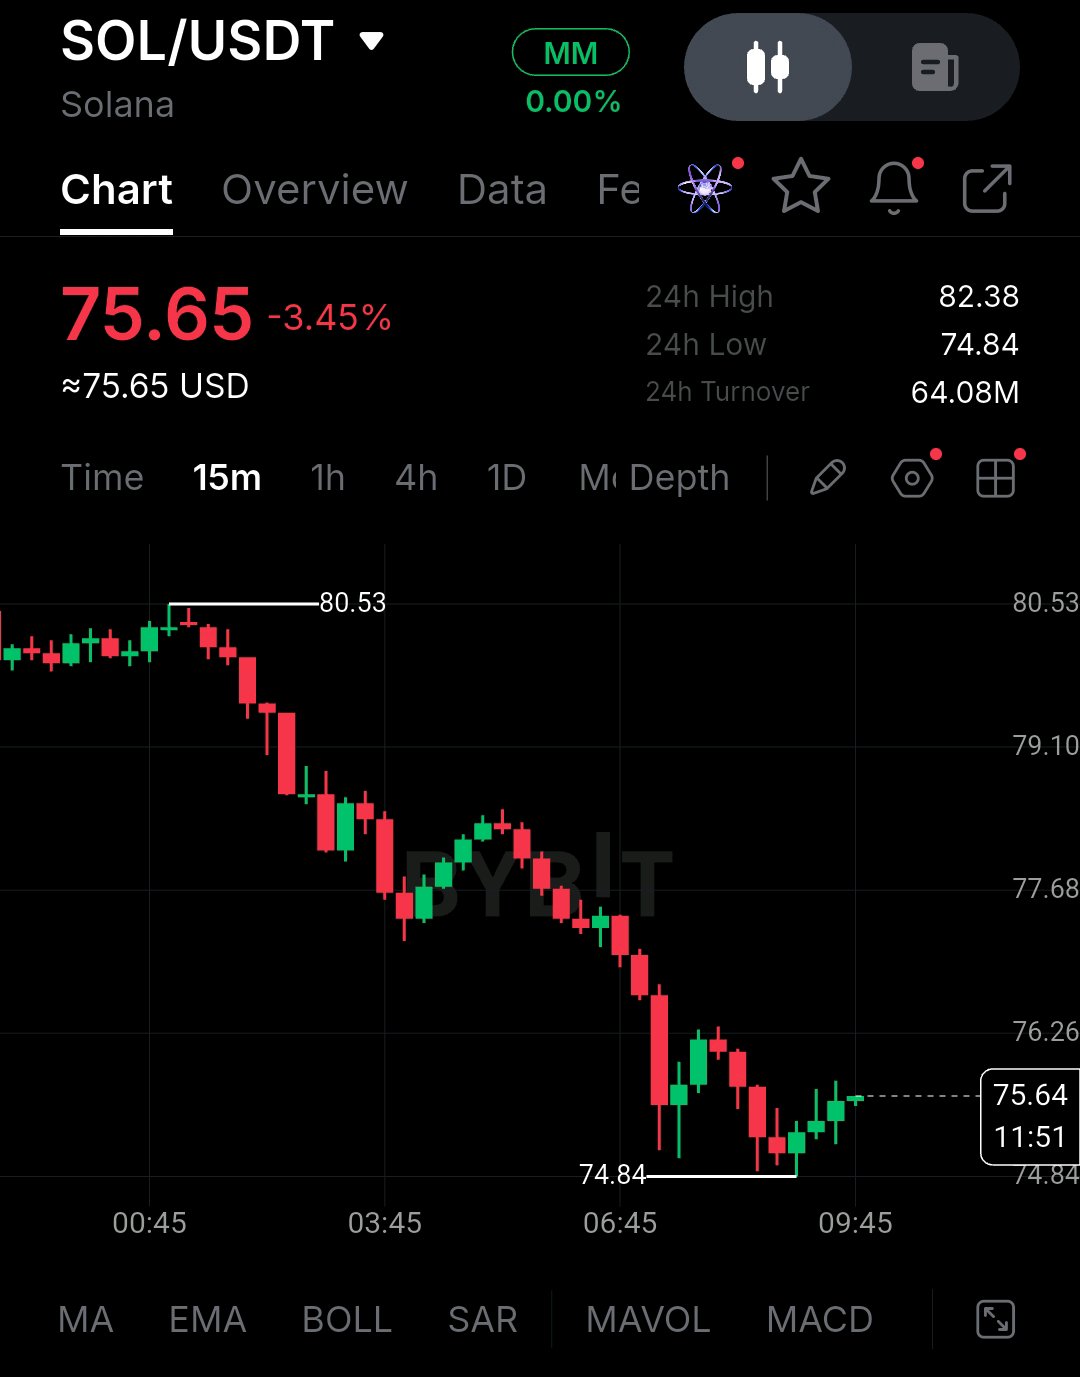
Solana is facing an important market test as selling pressure continues despite growing institutional adoption and ecosystem development. SOL is trading around $75.65, down 3.45%, according to your uploaded 15-minute chart. Price recently tested $74.84 after rejecting the $80.53 area. The market structure remains bearish, with lower highs and lower lows dominating the chart. Key technical levels: - Support: $74.84 - Resistance: $76.26 - Next resistance: $77.68 - Major resistance: $79.10–$80.53 Institutional Developments and Ecosystem Growth Solana continues attracting institutional attention. JPMorgan's tokenization initiatives, Samsung Wallet's USDC integration, Fiserv's financial infrastructure and Western Union's USDPT launch demonstrate growing real-world adoption. Solana investment products have also attracted approximately $1.43 billion in cumulative ETF inflows. However, recent daily flows remain mixed, showing that institutional demand is not consistently strong. These developments strengthen Solana's long-term position, but integrations do not automatically translate into direct SOL buying. On-Chain Activity Solana's network continues processing substantial activity. - Daily transactions: 100.65 million - Active addresses: 2.57 million - Stablecoin supply: $14.11 billion - DeFi TVL: $4.93 billion - Daily network fees: Approximately $447,433 These figures demonstrate meaningful network usage. However, declining DEX volume suggests that trading activity is losing some momentum. Tokenomics and Supply Dynamics Solana has an inflationary supply model with no fixed maximum supply. - Circulating supply: 591.51 million SOL - Total supply: 637.49 million SOL - Non-circulating supply: Approximately 45.98 million SOL Its inflation rate gradually declines toward a long-term target of 1.5%. Additionally, 50% of base transaction fees are burned. These mechanisms help manage supply growth, but continued issuance means demand must remain strong to support long-term price appreciation. Derivatives Market The derivatives market shows signs of leveraged positions being reduced. - Open interest: $4.60 billion - 24H OI change: -7.77% - Funding rate: +0.0044% per 8 hours - Futures volume: $7.34 billion - Long liquidations: Approximately 92% of liquidations Falling open interest and heavy long liquidations suggest leveraged buyers are under pressure. The market needs stronger spot demand rather than excessive leverage. Bullish and Bearish Scenarios Bullish scenario: SOL must defend $74.84 and reclaim $76.26. A sustained move above $77.68 could open the way toward $79.10 and $80.53. Improving spot volume and ETF inflows would strengthen the recovery case. Bearish scenario: Losing $74.84 could extend selling pressure. Weak spot demand, additional long liquidations and declining open interest would increase downside risks. Final Market Conclusion Solana has three important fundamental strengths: growing institutional adoption, substantial on-chain activity and expanding financial infrastructure. However, strong fundamentals alone cannot reverse a bearish market structure. ETF demand, spot buying and derivatives positioning still need to improve. For now, $74.84 is the level I am watching most closely. Holding support and reclaiming $76.26–$77.68 could signal the beginning of a recovery. Losing support would keep sellers in control. The real question is whether buyers can finally turn Solana's growing fundamentals into sustained market demand. $SOLUSDT #IMPACTbyTrade
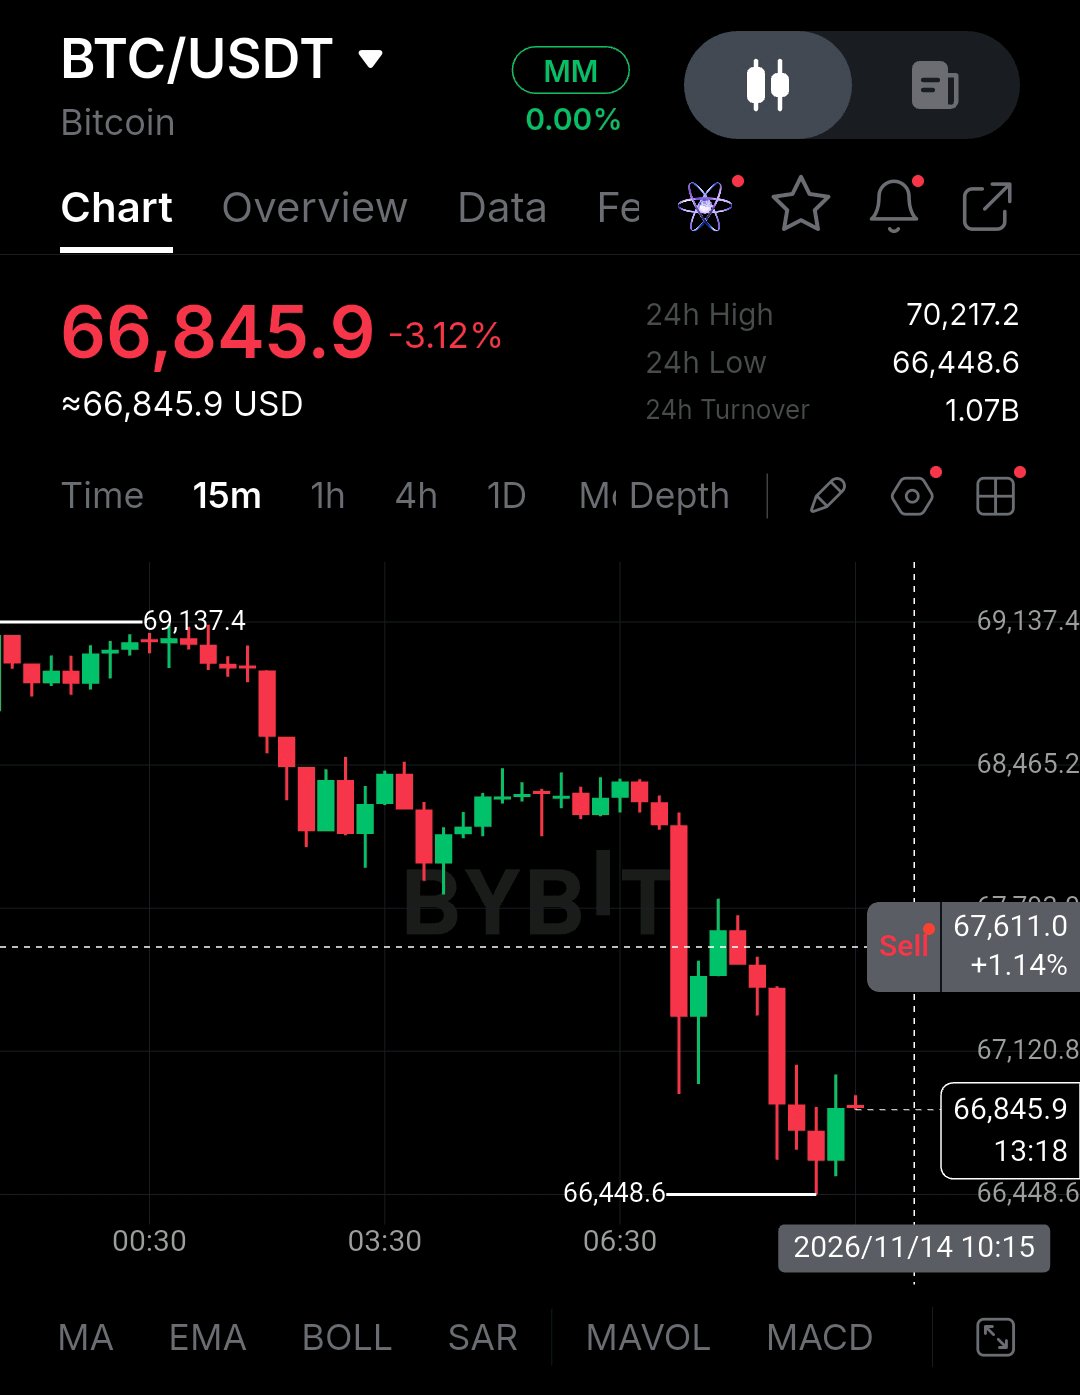
Bitcoin (BTC) — Market Research & Price Analysis November 14, 2026 | BTC/USDT Bitcoin is facing strong selling pressure, with its short-term market structure turning bearish. BTC is trading around **$66,845.90, down 3.12% over 24 hours, while its seven-day performance stands at approximately -10.54%. The immediate support sits at **$66,448.60**, while resistance is located around $67,611 and $68,465. Bitcoin needs to reclaim these levels before a stronger recovery can be considered. Despite its strong long-term fundamentals, current price action shows that sellers remain in control. # Institutional Developments Institutional adoption remains an important part of Bitcoin's long-term growth. Spot Bitcoin ETFs have created a direct investment channel for traditional financial institutions and investors. However, recent ETF withdrawals indicate weakening institutional demand. Approximately $284.1 million in net outflows was recorded on November 12. This matters because sustained ETF demand can absorb available Bitcoin supply, while continued withdrawals reduce an important source of buying pressure. On-Chain Activity Bitcoin continues to process significant network activity, with approximately 565,437 daily transactions and 647,560 active addresses in the November 11 dataset. However, transaction activity declined 11.63% over seven days. This suggests that network usage is not expanding consistently. Average transaction fees were approximately $0.47. The network remains active, but stronger adoption does not automatically translate into immediate buying demand. Tokenomics and Supply Bitcoin's maximum supply remains fixed at 21 million BTC, with approximately 20.11 million already circulating. The April 2024 halving reduced mining rewards from 6.25 BTC to 3.125 BTC per block. The next halving is expected around 2028, reducing rewards to 1.5625 BTC. This predictable reduction in new supply supports Bitcoin's long-term scarcity narrative. However, demand must remain strong enough to absorb existing selling pressure. Derivatives Market The derivatives market is showing signs of position reduction. - Futures open interest: $46.62 billion - 24H OI change: -6.98% - Futures volume: $87.07 billion - Spot volume: $8.32 billion - Funding rate: +0.0031% per 8 hours - Total liquidations: $644.62 million - Long liquidations: $585.84 million The dominance of long liquidations indicates that bullish leveraged traders have taken significant losses. Declining open interest also suggests traders are reducing exposure. This is not yet a convincing environment for aggressive bullish positioning. Key Market Figures | Metric | Value | |---|---:| | Current price | $66,845.90 | | 24H change | -3.12% | | 7D change | -10.54% | | Market cap | ~$1.37T | | 24H spot volume | ~$8.32B | | Immediate support | $66,448.60 | | Resistance 1 | $67,611 | | Resistance 2 | $68,465 | | Circulating supply | ~20.11M BTC | | Daily transactions | 565,437 | | Open interest | $46.62B | | 24H OI change | -6.98% | # Bullish and Bearish Scenarios Bullish scenario: Bitcoin must defend $66,448.60 and reclaim $67,611. A breakout above $68,465 would provide stronger evidence of improving momentum. Increasing spot demand, improving ETF flows and higher lows on the 15-minute chart would strengthen the recovery case. Bearish scenario: A confirmed breakdown below $66,448.60 could expose Bitcoin to further downside. Continued ETF withdrawals, weak spot demand and declining market participation would increase selling pressure. A temporary bounce should not be mistaken for a confirmed trend reversal. Final Market Outlook Bitcoin's fixed supply, institutional investment infrastructure and established blockchain network remain three major long-term strengths. However, the current market needs stronger spot demand, improving institutional flows and confirmation from price action before these fundamentals can translate into sustainable appreciation. For now, $66,448.60 is the level I am watching most closely. Holding this support could open the door to recovery, while losing it would increase the risk of another bearish move. Patience matters. Cash is a position, and protecting capital comes before chasing a recovery. $BTCUSDT #ByXIMPACT
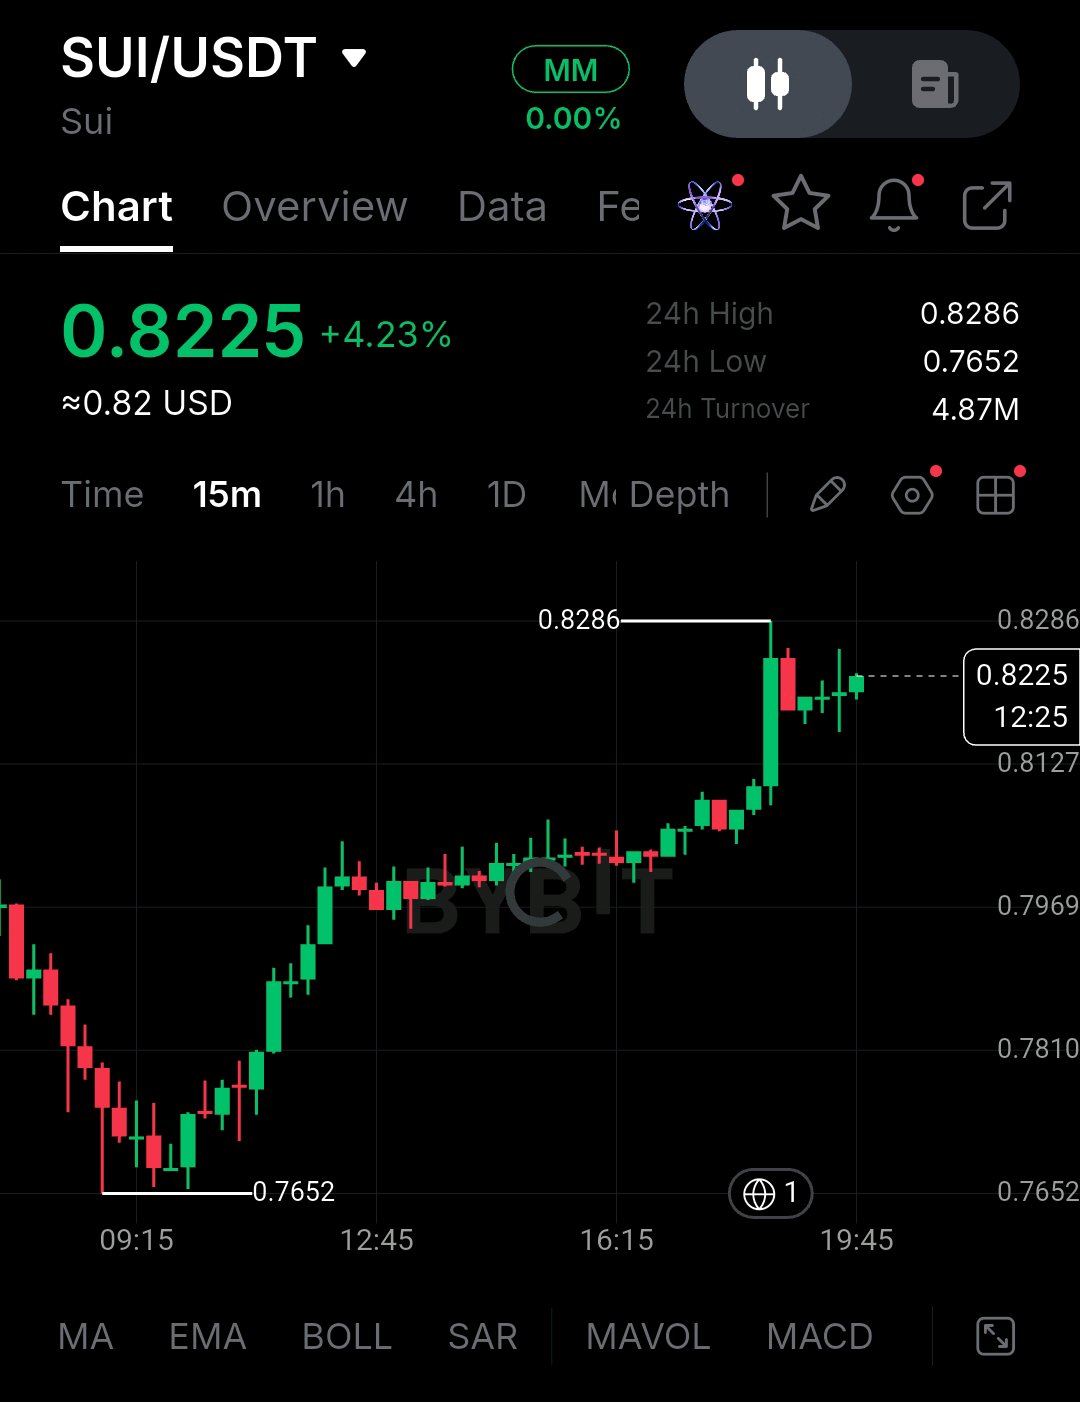
SUI is showing renewed buying interest, trading around $0.8225, up 4.23%, according to your Bybit chart. Price recovered from the $0.7652 low and is now approaching the $0.8286 resistance. However, the broader seven-day performance remains negative at approximately 7%, showing that the latest recovery still needs confirmation. Market capitalization is approximately $3.4 billion, with circulating supply near 4.14 billion SUI. Coinucation +1 Fundamentally, Sui continues expanding its ecosystem. One important development is its integration with tZERO, bringing institutional-grade infrastructure for tokenized securities, custody, trading and settlement. This creates new adoption opportunities, although institutional infrastructure does not automatically translate into immediate SUI buying demand. sui.io On-chain activity remains meaningful. DefiLlama reports approximately $394 million in DeFi TVL, $537.8 million in stablecoins, 44,241 active addresses and 59.43 million daily transactions. However, network fees remain relatively modest, so transaction growth should not automatically be interpreted as stronger token value capture. DefiLlama Supply remains an important consideration. SUI has a maximum supply of 10 billion tokens, with approximately 41.4% circulating. There is no regular halving mechanism. Scheduled unlocks continue creating potential selling pressure, with further releases expected in December 2026. SUI Token Supply and Schedule +1 Derivatives positioning also deserves attention. Recent market data shows approximately $480 million in futures open interest, negative funding and futures volume substantially exceeding spot volume. This suggests leveraged positioning remains important, while negative funding indicates bearish positioning pressure. CoinGlass +1 Key Figures * Current price: $0.8225 * 24H change: +4.23% * Market cap: Approximately $3.4B * 7D performance: Approximately -7% * Circulating supply: 4.14B SUI * Maximum supply: 10B SUI * DeFi TVL: $394.27M * Stablecoin supply: $537.8M * Daily transactions: 59.43M * Futures open interest: Approximately $480M Market Outlook Bullish confirmation: SUI needs to break and hold above $0.8286. A sustained move above this resistance could strengthen the recovery, provided spot buying volume supports the breakout. Bearish confirmation: Failure around $0.8286 could bring another test of $0.8127, followed by the important $0.7969 and $0.7652 support areas. Final Conclusion SUI has three important fundamental strengths: expanding institutional infrastructure, growing DeFi activity and a substantial stablecoin ecosystem. However, continued token unlocks and relatively modest network fees remain challenges. The immediate question is simple: Can SUI break $0.8286 and turn this recovery into a sustainable trend? $SUIUSDT #ByXIMPACT
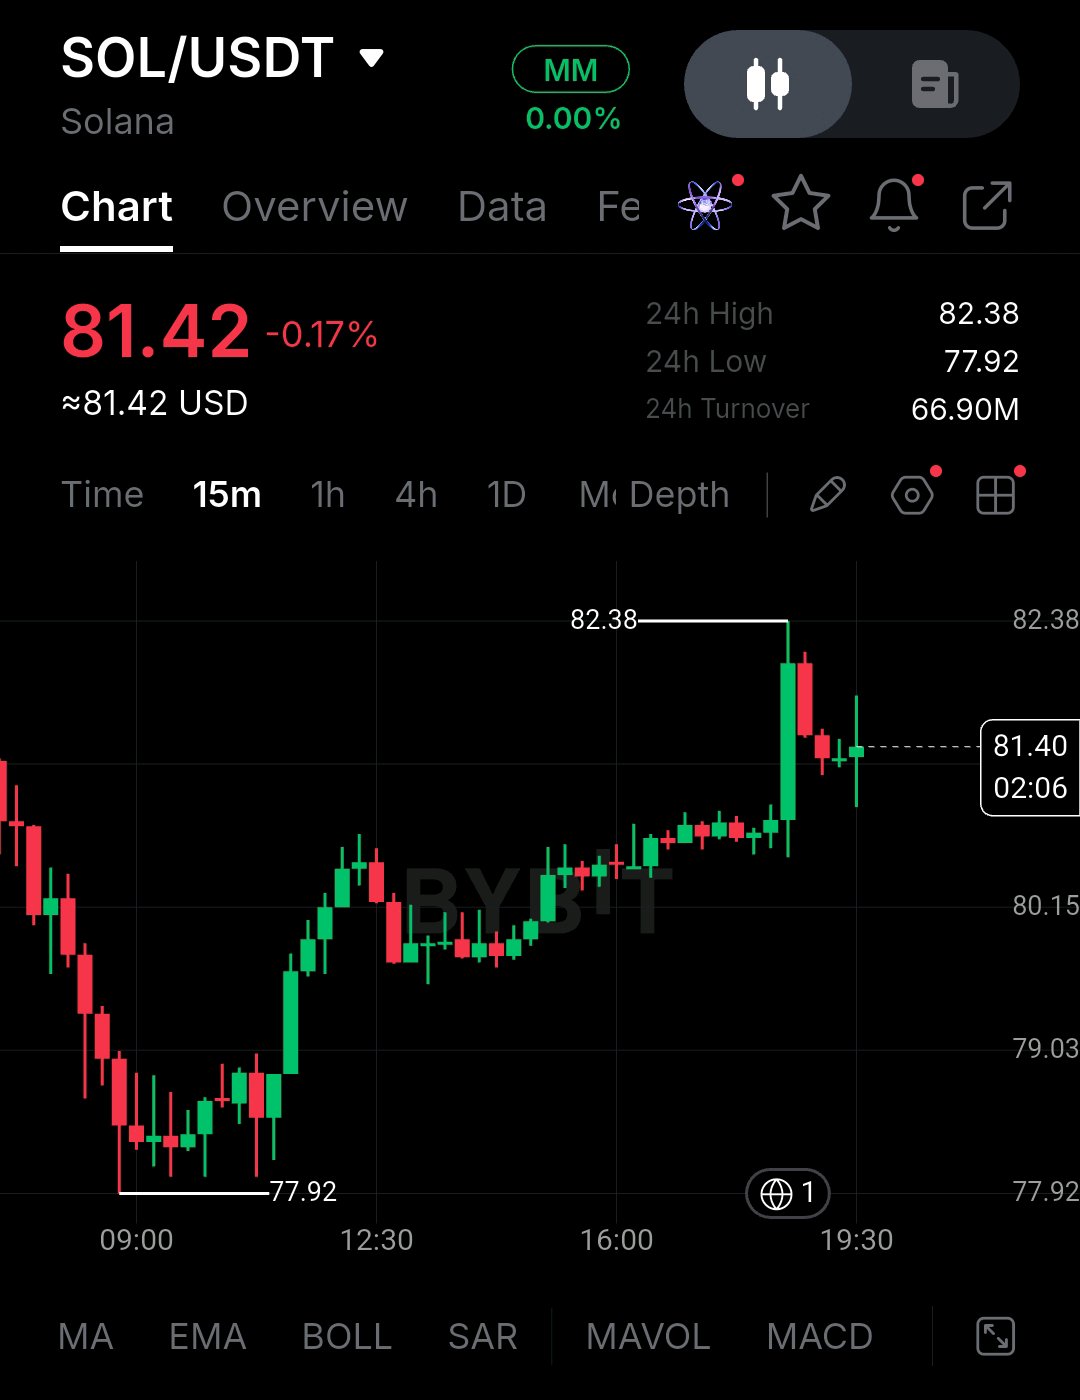
Solana is showing signs of a short-term recovery, but buyers still have an important resistance level to overcome. SOL was trading around $81.42 in the uploaded Bybit chart, down 0.17%. The 24-hour high was $82.38, while the low stood at $77.92. Price recovered from $77.92 and moved above $80 before facing rejection near $82.38. This shows improving short-term momentum, but the broader market structure still needs confirmation. The latest November 13 market snapshot places SOL around $80, with a market capitalization near $47.3 billion and approximately $3.37 billion in 24-hour trading volume. SOL remains around 73% below its all-time high of $293.31. Institutional adoption is becoming an important part of Solana's growth story. J.P. Morgan-related tokenized money-market products, Samsung Wallet's USDC integration and Western Union's stablecoin expansion demonstrate growing real-world use cases. Solana's reported real-world asset value has also reached approximately $5 billion. However, these developments do not automatically translate into direct demand for SOL. On-chain activity remains significant. Solana has approximately $5 billion in DeFi TVL, $14.11 billion in stablecoin supply, 2.57 million daily active addresses and more than 100 million daily transactions. Its DEX ecosystem also continues to process substantial trading volume. The challenge is turning this network activity into sustainable token demand. Solana's tokenomics also deserve attention. Its circulating supply is approximately 591.51 million SOL, with total supply around 637.49 million. SOL has no fixed maximum supply or traditional halving schedule. Its inflation rate declines over time, while 50% of base transaction fees are burned. Staking issuance, however, continues to introduce new supply. The derivatives market looks more cautious. Aggregate futures open interest is approximately $4.76 billion, down 9.57% over 24 hours. Funding is slightly negative at around -0.0027%, while reported liquidations reached approximately $57.56 million, mostly affecting long positions. This suggests leveraged bullish traders have faced significant pressure. Key figures: * Current price: ~$80 * Market cap: ~$47.3B * 24H volume: ~$3.37B * 7D performance: -10.96% * Stablecoin supply: ~$14.11B * DeFi TVL: ~$5B * Daily transactions: ~100.65M * Circulating supply: ~591.51M SOL * Open interest: ~$4.76B * 24H OI change: -9.57% * Funding rate: -0.0027% Bullish scenario: SOL needs to reclaim $81.40 and break above $82.38 with stronger spot volume. Sustained ETF inflows and improving network liquidity would provide additional support. Bearish scenario: A breakdown below $78.10–$77.92 could weaken the recovery structure. Increasing selling pressure and further long liquidations would make the situation more concerning. Solana has three important fundamental strengths: institutional adoption, strong network activity and an expanding financial ecosystem. However, declining market performance, ongoing token issuance and weaker derivatives positioning remain risks. The fundamentals are developing, but the price still needs confirmation. The next important test is $82.38. Can SOL reclaim this level with genuine buying demand, or will sellers push it back toward $77.92? Cash is a position. Patience matters more than forcing a trade. Market figures are approximate snapshots, while technical levels are taken from the uploaded chart. This is market research, not financial advice. $SOLUSDT #IMPACTbyTrade
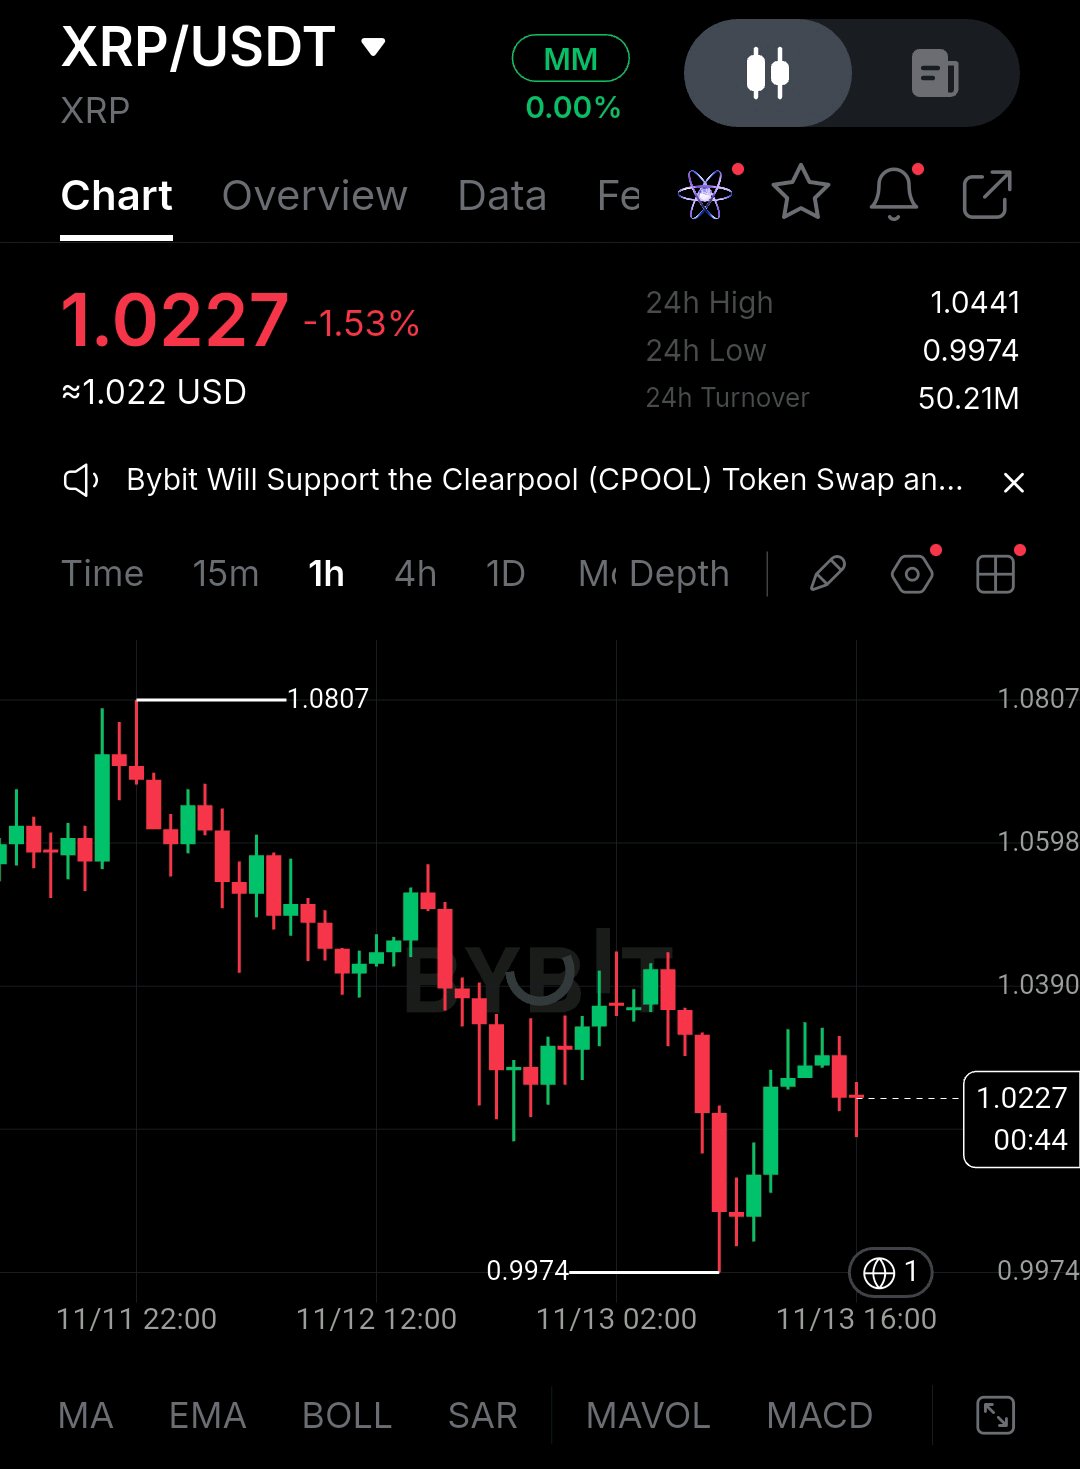
XRP is facing an important market test as institutional adoption continues to grow, but its price structure remains under pressure. Currently trading at $1.0227, XRP is down 1.53% over 24 hours. Buyers recently defended $0.9974, but the recovery is still facing resistance. The key support is around $1.00, while resistance sits at $1.0390 and $1.0598. A breakout above these levels could open the way toward $1.0807. Fundamentally, Ripple continues expanding its institutional presence through payment infrastructure, digital asset custody, and ecosystem development. Its relationship with BNY adds another important step toward institutional adoption. However, XRP still faces challenges around token supply, relatively low network fee revenue, and whether ecosystem growth creates lasting demand for the token. Its 100 billion maximum supply and ongoing escrow releases remain important factors. The bullish case depends on holding $1.00 and reclaiming resistance with stronger buying volume. A breakdown below $0.9974 could bring renewed selling pressure. XRP has strong long-term potential, but the real test is whether institutional adoption can translate into sustainable demand for the token. $XRPUSDT #ByXIMPACT
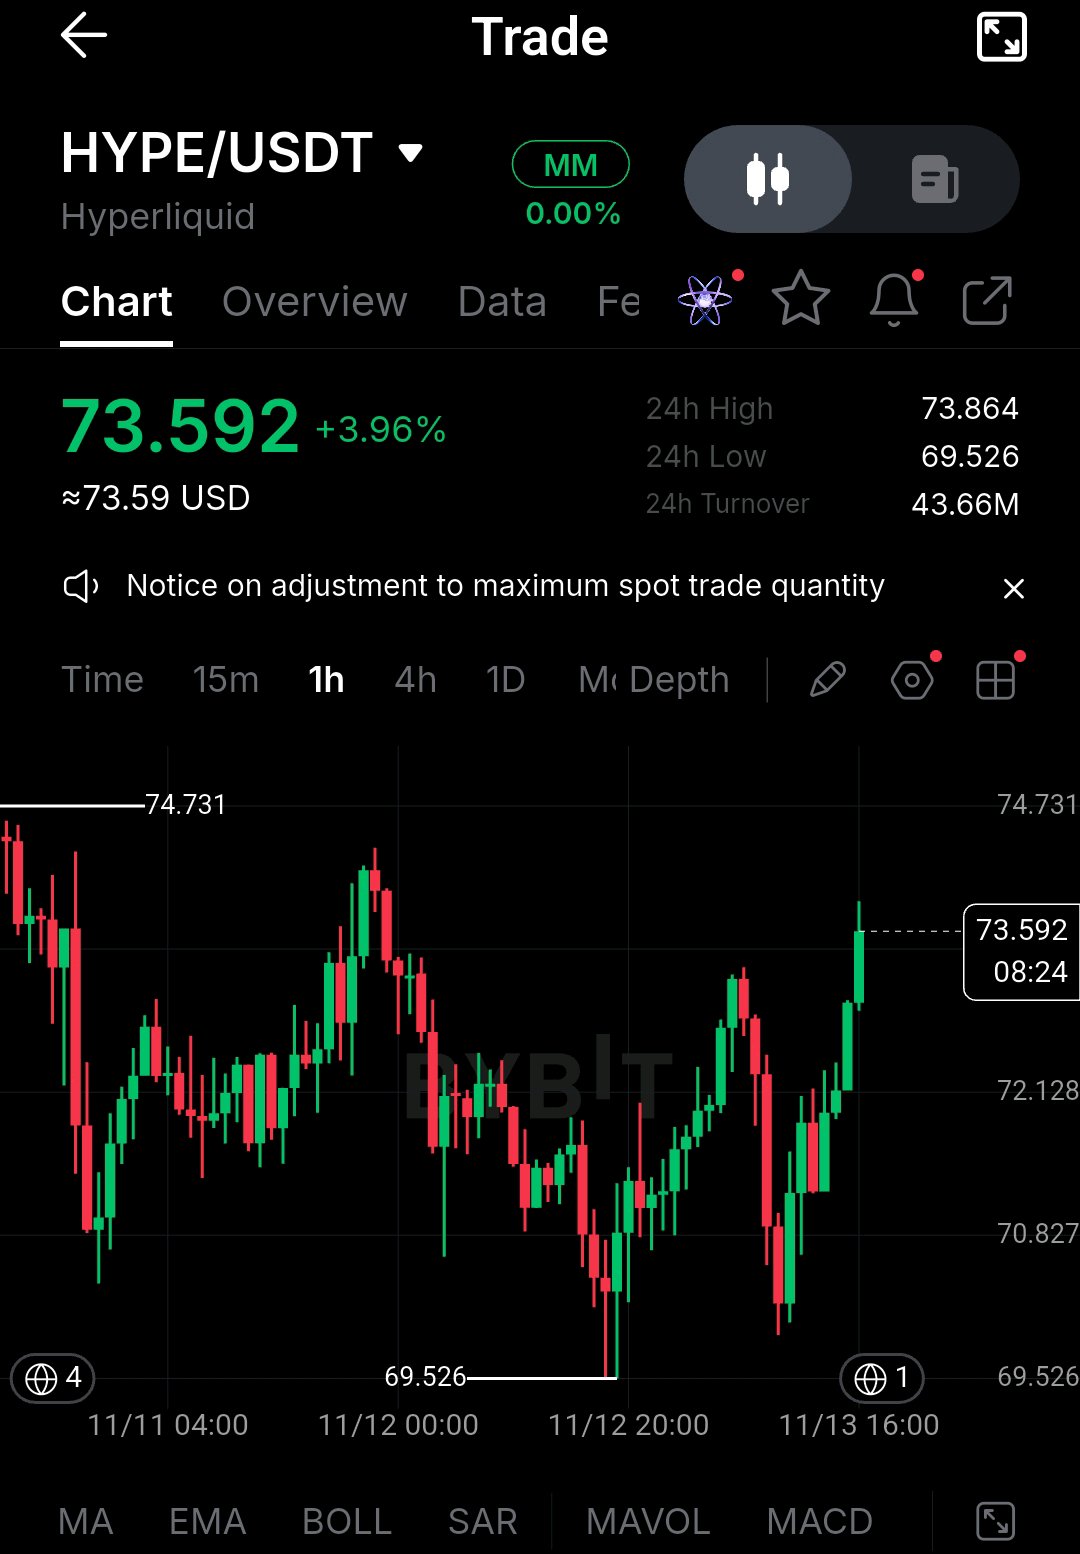
HYPE (Hyperliquid) is showing signs of recovery, trading at $73.592, up 3.96% on the supplied chart. Buyers have pushed price upward from the $69.526 low, but the real test is approaching. The immediate resistance sits around $73.864–$74.00. Holding above $72.128 could keep the recovery intact, while losing this level may expose $70.827 and potentially $69.526 again. Fundamentally, Hyperliquid has several strong drivers. Its perpetual trading platform generates substantial activity, HyperEVM is expanding the ecosystem, and the Assistance Fund uses eligible protocol fees to purchase HYPE. These mechanisms connect network usage with token demand. On-chain activity remains meaningful, with approximately $6.4 billion in stablecoin supply and $2.3 billion in DeFi TVL in the latest available snapshot. However, declining weekly trading activity and the upcoming November 29 token unlock remain risks. Derivatives data also deserves attention, as open interest is elevated and recent long liquidations show how quickly leveraged positions can come under pressure. My focus is simple: HYPE needs a confirmed breakout above $74, supported by real spot demand. The fundamentals are promising, but sustainable price growth requires market confirmation. Will buyers finally turn this recovery into a breakout, or will $74 remain a strong rejection zone? .$HYPEUSDT #IMPACTbyTrade
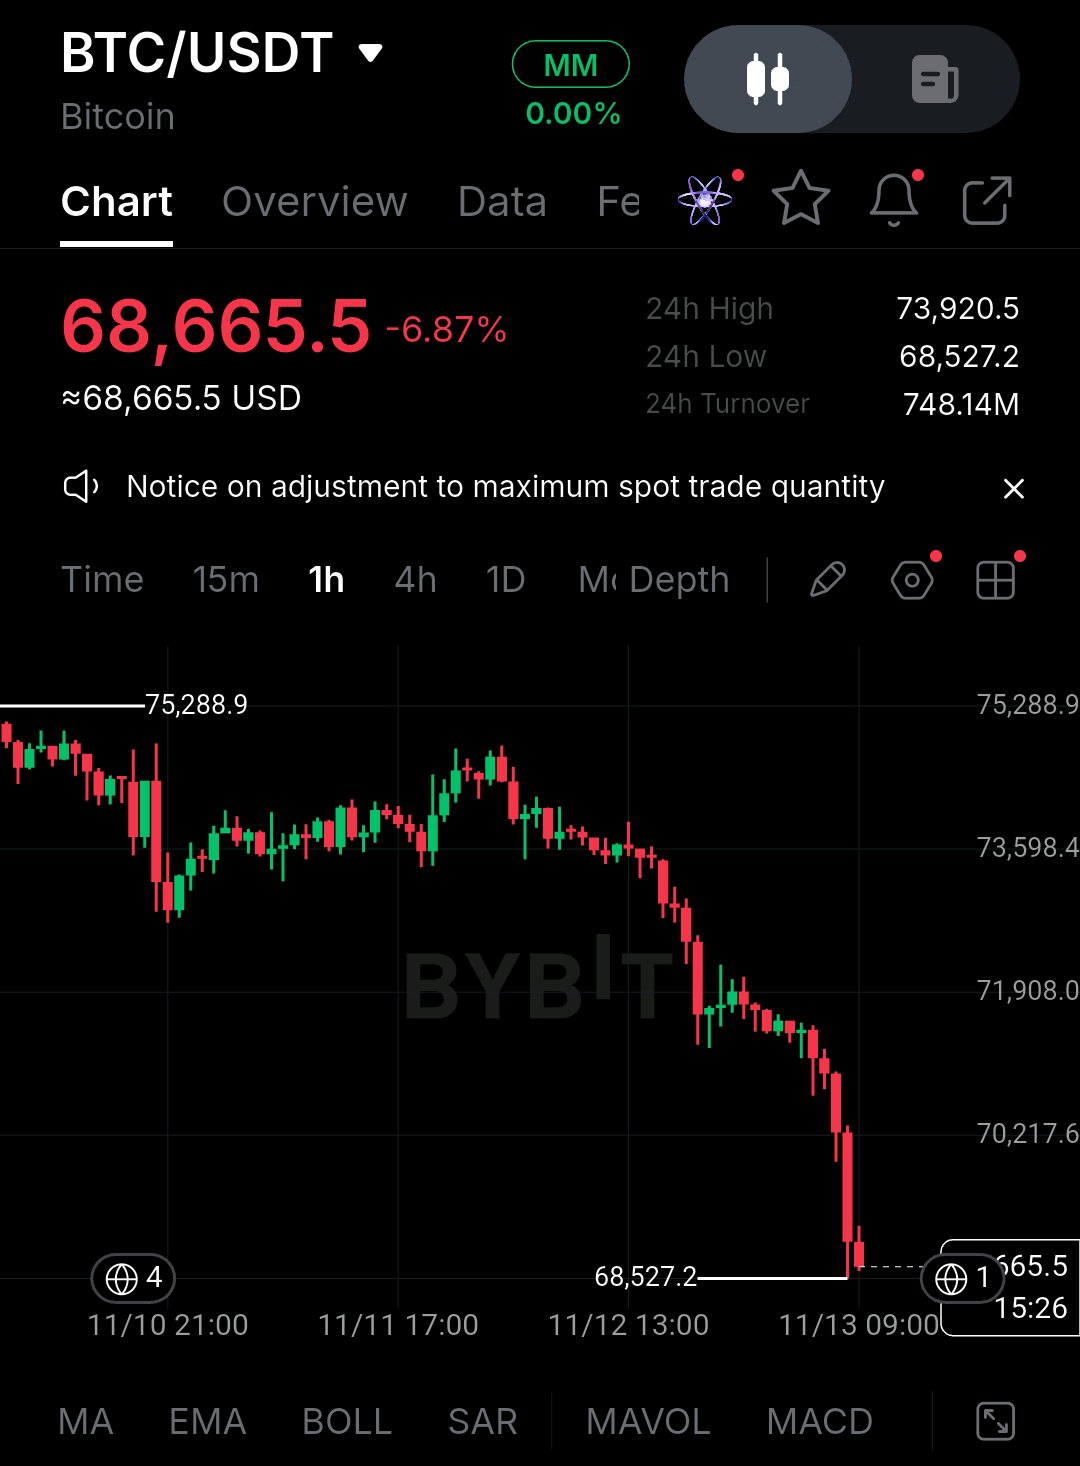
Bitcoin is facing a critical support test as sellers push the price lower. BTC is trading around $68,665, down 6.87% in 24 hours and approximately 7.24% over seven days. Market capitalization stands near $1.41 trillion. The 1-hour chart shows a clear bearish structure, with lower highs and lower lows. The immediate support is at $68,527, while $70,217 is the first resistance Bitcoin needs to reclaim. Institutional Demand Under Pressure US spot Bitcoin ETFs accumulated approximately 79,800 BTC during Q3, but recent November outflows show that institutional demand has weakened. Long-term holder selling also remains an important concern. On-Chain and Supply Fundamentals Bitcoin processed approximately 491,457 transactions in the latest reported daily reading. Its circulating supply is around 20.11 million BTC, with a maximum supply of 21 million. The next halving, expected in 2028, will reduce block rewards from 3.125 to 1.5625 BTC. Derivatives Market Open interest stands near $49.42 billion, down 3.13% over 24 hours. Funding is slightly positive at 0.0077%, while approximately $479 million in positions were liquidated, mostly longs. This suggests leveraged buyers are under pressure and market sentiment remains cautious. Key Levels to Watch - Support: $68,527 - Resistance: $70,217 - Next resistance: $71,908 - Major resistance: $73,598–$73,920 Market Outlook Bullish confirmation requires BTC to defend $68,527 and reclaim $70,217 with stronger spot buying. A breakdown below support would keep the bearish structure intact. Bitcoin still has strong long-term fundamentals, including institutional infrastructure, limited supply and continued network activity. However, fundamentals alone cannot reverse selling pressure. My view: This is a moment for patience, not forced entries. I want to see buyers defend support and reclaim resistance before considering a stronger recovery. Cash is a position. Confirmation matters more than predictions. $BTCUSDT #ByXIMPACT
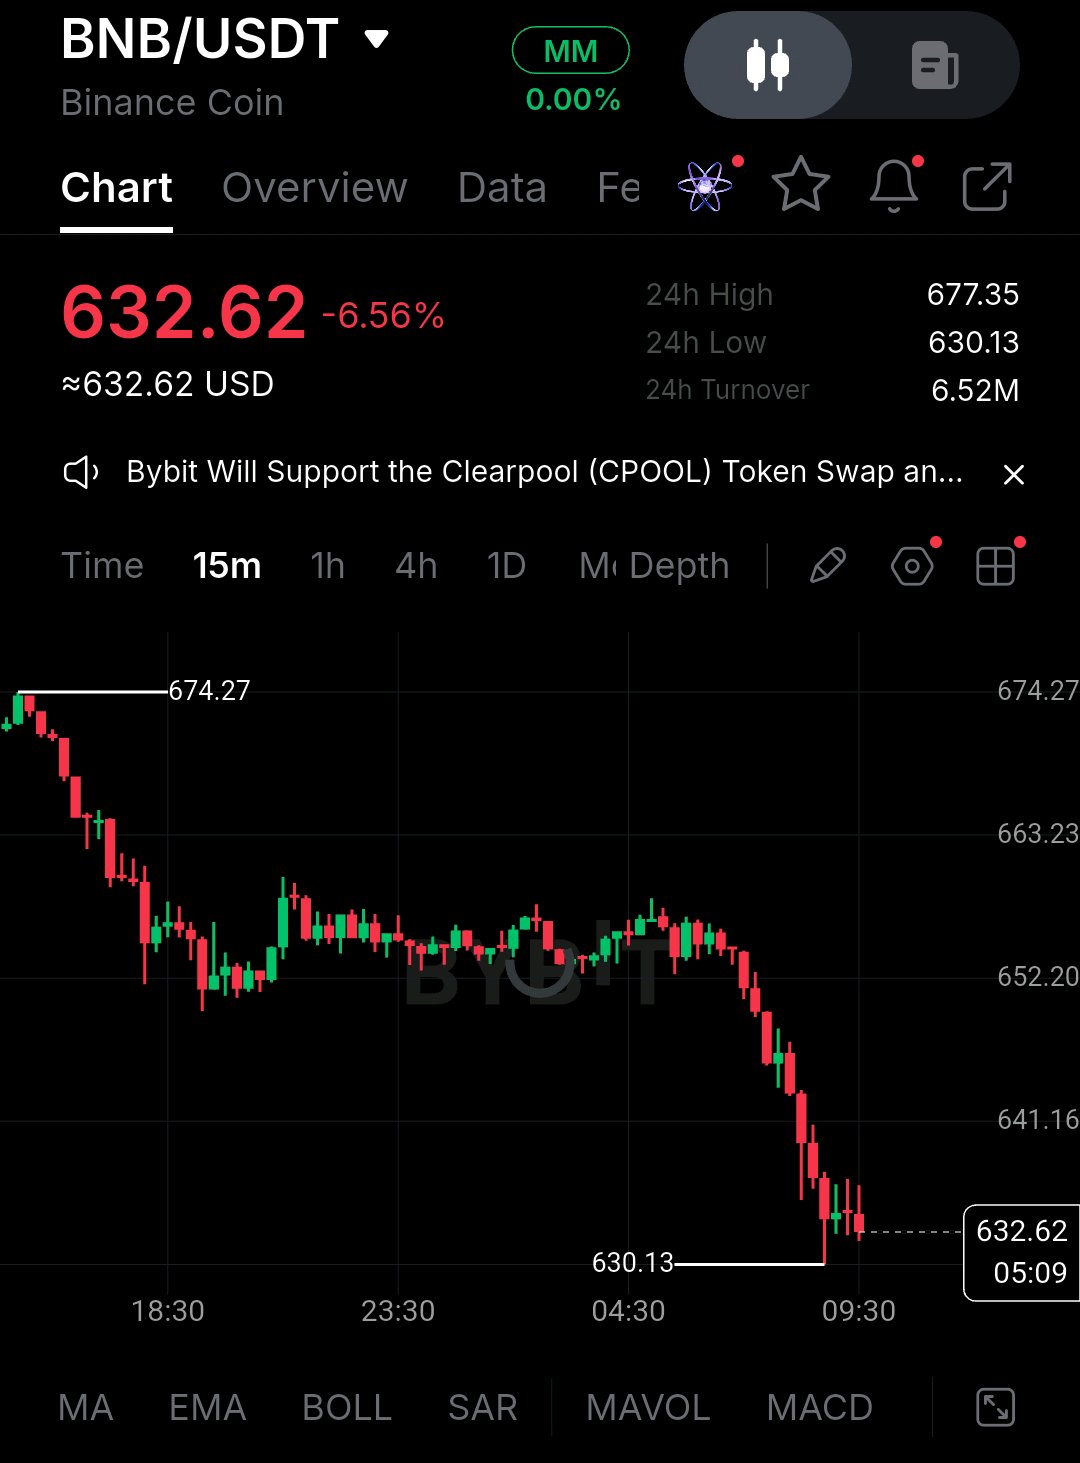
BNB is facing significant selling pressure, trading around $632.62, down 6.56% in the screenshot. The 24-hour high stands at $677.35, while the price has dropped close to the $630.13 support. The 15-minute chart shows a clear bearish structure, with lower highs and lower lows. Buyers failed to defend the $652 region, allowing sellers to push the price toward fresh intraday lows. Key levels to watch: - Support: $630.13 - Resistance: $641.16 - Major resistance: $652.20–$663.23 Ecosystem and Institutional Growth BNB Chain continues expanding beyond ordinary crypto transactions. Institutional financial products, tokenized assets and real-world asset integrations are strengthening its ecosystem. These developments matter because they bring traditional financial activity onto blockchain infrastructure. However, ecosystem expansion does not automatically create immediate buying pressure for BNB. On-Chain Activity BNB Chain recorded approximately 16.31 million daily transactions, while stablecoin supply stood near $11.97 billionin the latest reported snapshot. This demonstrates meaningful network usage, although transaction growth must translate into sustainable fees and actual token demand to support long-term valuation. Tokenomics and Supply BNB completed its 37th quarterly burn on October 19, removing approximately 1.646 million BNB, worth around $1.197 billion at the time. The reported remaining supply was approximately 131.51 million BNB. The long-term objective remains reducing supply toward 100 million. This is structurally positive, but reduced supply alone cannot guarantee price appreciation. Derivatives Market The derivatives picture remains cautious: - Open interest: $1.05 billion - 24H OI change: -4.97% - Futures volume: $747.42 million - Funding rate: +0.0014% - Long liquidations: $6.57 million - Short liquidations: $45,930 The heavy imbalance in liquidations suggests leveraged buyers have taken significant losses. Declining open interest also indicates traders are reducing exposure. Bullish vs Bearish Outlook Bullish scenario: BNB needs to defend $630.13, reclaim $641.16 and eventually break $652.20–$663.23 with stronger spot volume. Bearish scenario: A confirmed breakdown below $630.13 would keep sellers in control and increase the risk of further downside. Final Conclusion BNB has three important fundamental strengths: growing network activity, expanding institutional adoption and continuous token burns. However, the current market structure remains weak. Fundamentals are improving, but price action has not confirmed a recovery. I am watching $630.13 closely. Will buyers defend this support, or will sellers trigger another move lower? Cash is a position. There is no need to force a trade before confirmation. $BNBUSDT #ByXIMPACT
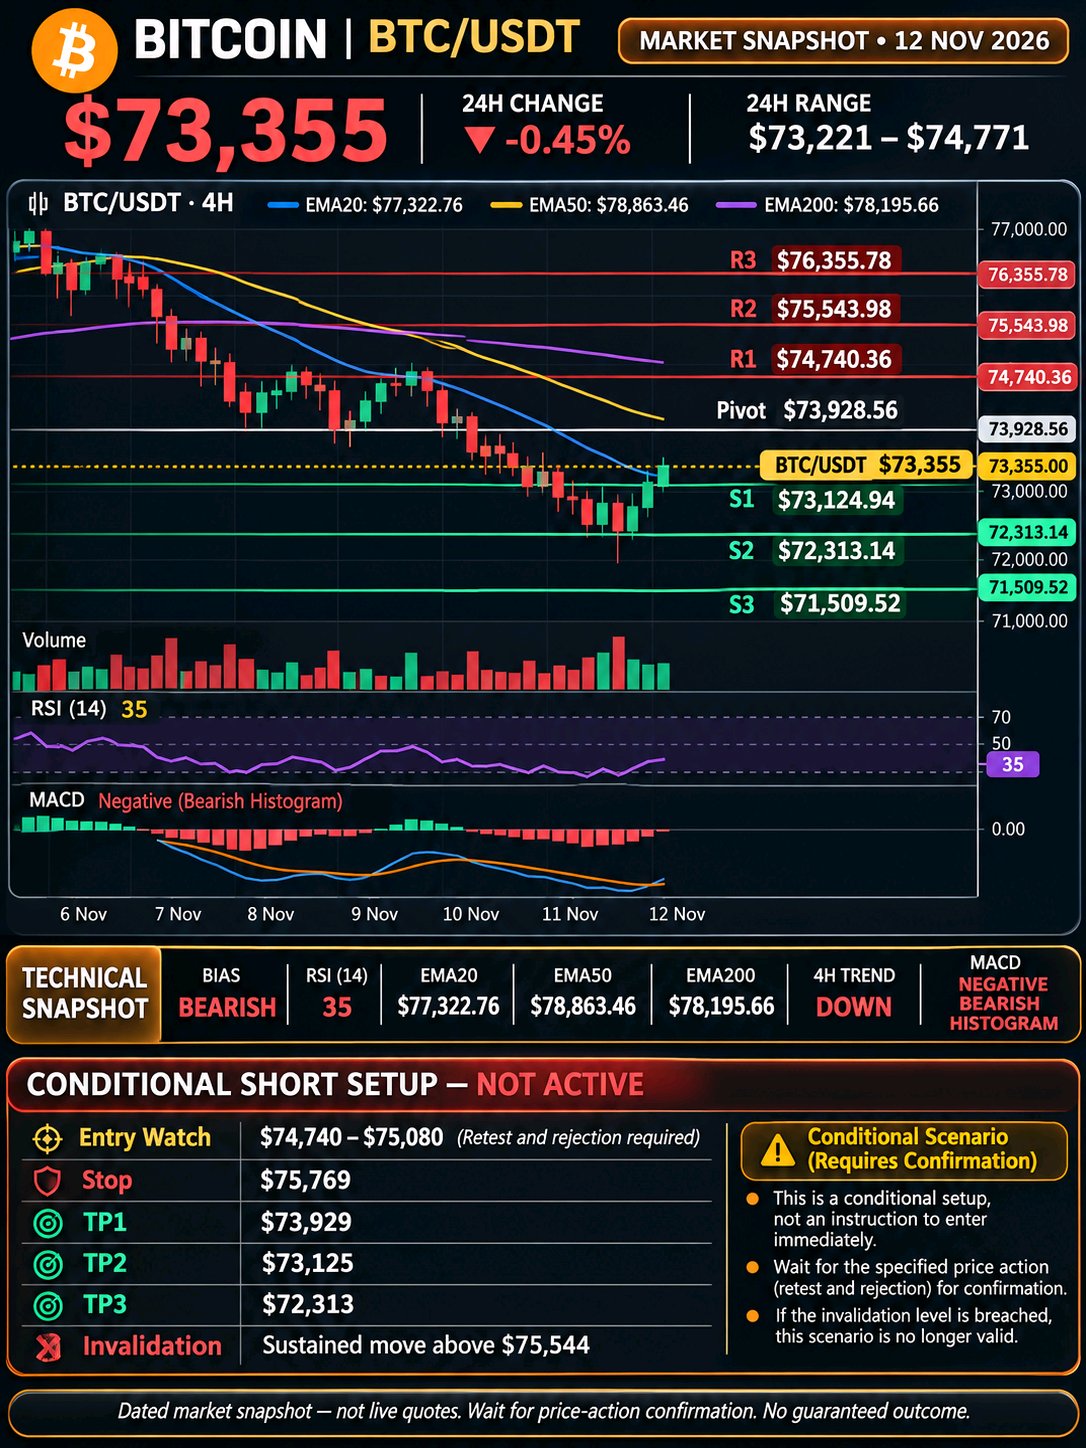
### $BTCUSDT $BTCUSDC — Bitcoin Market Analysis Bitcoin is at a level where the next confirmed move matters more than chasing short-term momentum. I am watching the current market structure closely, because the reaction around key support and resistance will determine whether buyers can extend the recovery or sellers regain control. This analysis focuses on verified market context rather than assuming a bullish or bearish setup without chart confirmation. Bitcoin has pulled back toward the $73,000 support area after losing momentum from its previous recovery. The market is now testing an important zone, but buyers have not yet delivered a convincing reversal. What is happening technically? * RSI (14): Around 34–35, showing weak momentum and approaching oversold territory. * MACD: Daily momentum remains bearish, although the 4H histogram shows an early improvement. This is not yet a confirmed reversal. * Moving Averages: BTC remains below important short-term moving averages, keeping selling pressure in focus. * Volume: Spot trading activity has weakened, making a strong recovery harder to confirm. RSI, MACD +2 Key levels I am watching Current market price ### $73,389 Resistance 1 $74,740–$75,080 Resistance 2 $75,544–$76,210 Support 1 $73,125 Support 2 $72,313–$72,000 Indicative technical levels, not guaranteed execution prices. Vexoda +2 Execution Strategy and Risk Management My approach is to wait for confirmation rather than buy simply because RSI is approaching oversold. * Potential entry: Only after a confirmed bullish reaction around $72,300–$73,100. * Confirmation: Reclaim of $74,740 with improving volume. * TP1: $74,740–$75,080. * TP2: $75,544. * TP3: $76,210. * Invalidation: A decisive daily breakdown below $72,000 would weaken the recovery thesis. These are conditional scenario levels, not a live trading signal. A stop should be placed according to the confirmed entry and market volatility. My final view I am not calling this a confirmed bottom yet. Bitcoin needs to reclaim resistance and show stronger buying participation before I become confident about a sustained recovery. If $73,000 fails, the $72,000 area becomes increasingly important. Cash is also a position, and protecting capital comes first. What is your view on BTC? Are you expecting a recovery toward $76,000, or could Bitcoin test $70,000 first? #ByXIMPACT