
JONSENS
2615Like0Shares52Fans43Follow
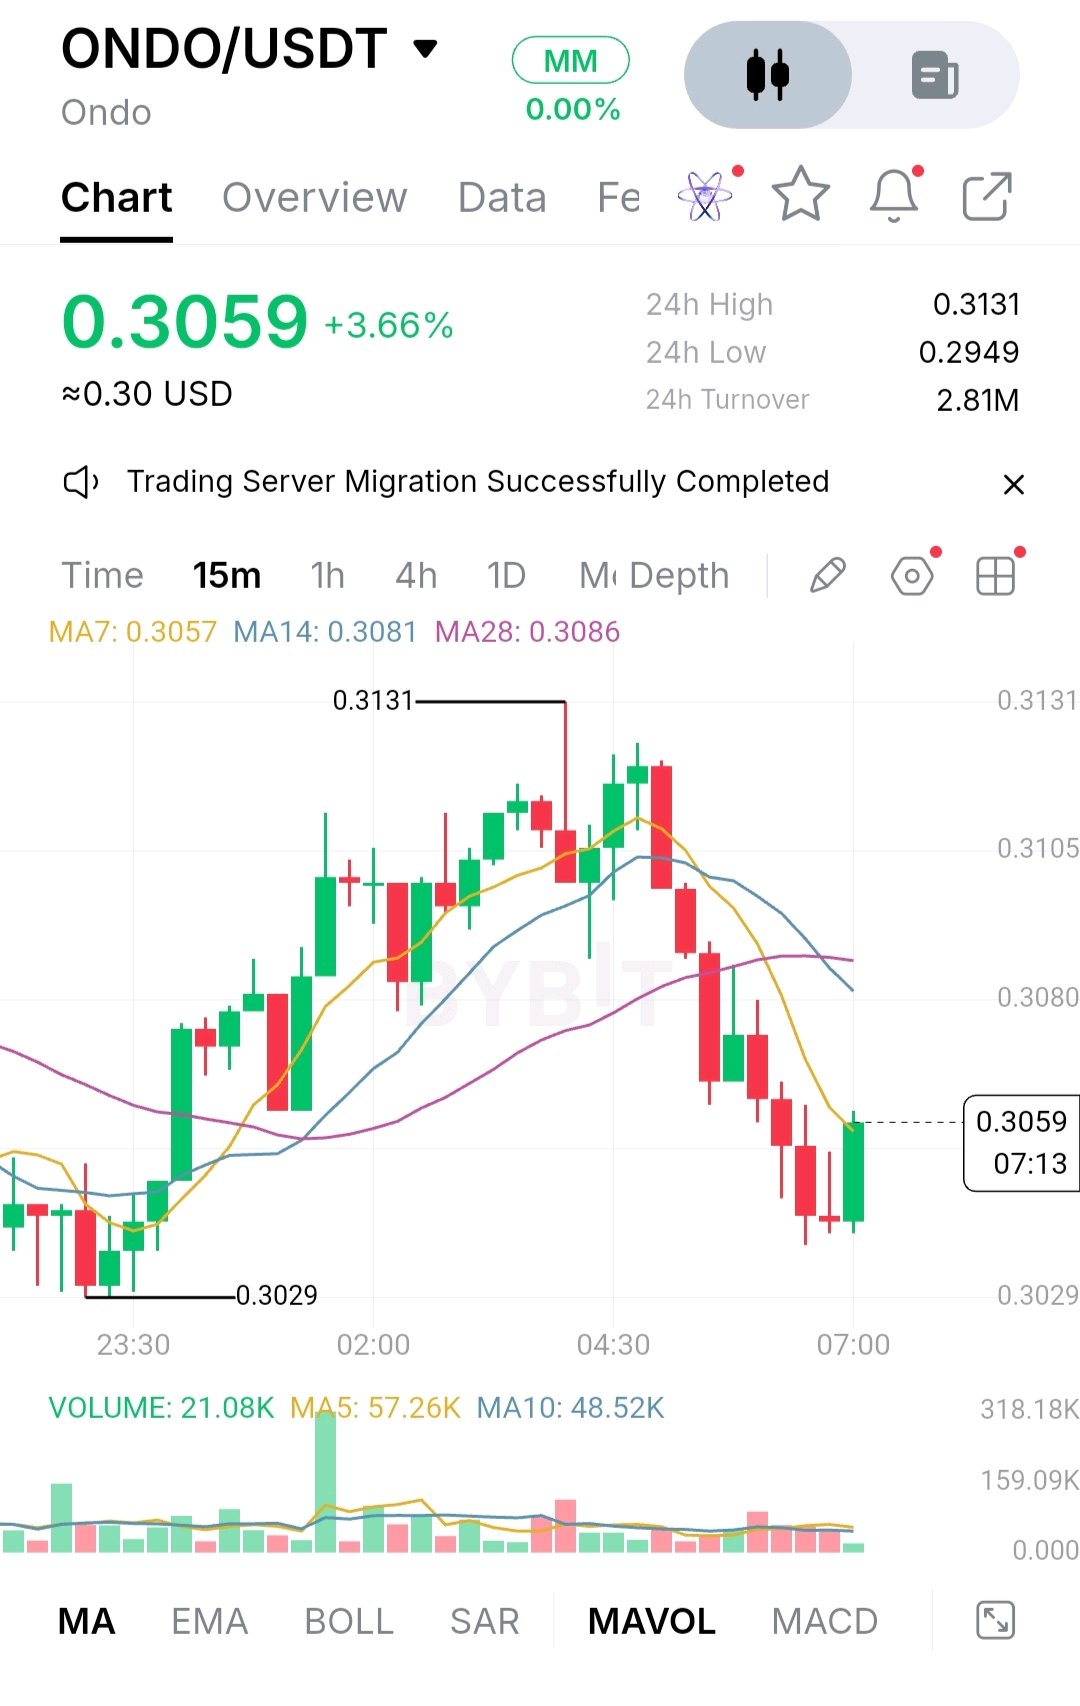
ONDO/USDT: Buyers Are Trying to Recover, But the Pressure Has Not Disappeared There is something worth paying attention to in ONDO's recent price action. Buyers managed to push the price higher, but when it approached $0.3131, the momentum quickly faded. Now the token is trading around $0.3059, attempting to recover some of those losses. The question is whether buyers genuinely see value at these levels or are simply taking advantage of a temporary pause in selling. A Bounce That Still Needs Convincing ONDO is showing a 3.66% daily gain, which initially looks positive. However, looking at the 15-minute chart tells a more complicated story. After reaching $0.3131, the price experienced a noticeable pullback. Sellers gradually took control, pushing ONDO below its 14-period and 28-period moving averages. The latest recovery has brought it close to the seven-period average at $0.3057, but the other two averages, sitting at $0.3081 and $0.3086, are still above the current price. That matters because a recovery becomes more convincing when buyers can reclaim these levels and hold them. So far, ONDO has only managed to slow the decline. Trading activity raises another question. The displayed volume is 21.08K, below both the five-period average of 57.26K and the ten-period average of 48.52K. This suggests that the latest bounce is happening without particularly strong participation. Are Buyers Stepping In or Are Sellers Simply Taking a Break? This is probably the most important question facing ONDO right now. The reaction around $0.3029 suggests that buyers are still willing to defend lower prices. However, the rejection near $0.3131 shows that sellers have not disappeared either. There is not enough evidence to call this accumulation just yet. A few green candles can improve sentiment, but sustained buying, particularly when price approaches resistance, is what would make the recovery more believable. The Bigger Picture Behind Ondo Ondo has a business model that gives it a meaningful place in the growing real-world asset sector. Its ecosystem focuses on bringing traditional financial products, including US Treasuries and other financial instruments, onto blockchain networks. Institutional interest and ecosystem expansion could support its long-term relevance. Still, investors should distinguish between the success of Ondo's platform and the actual value captured by the ONDO token. Its governance role does not mean that every new integration automatically creates additional token demand. Future token unlocks are another factor worth watching because additional circulating supply can influence market sentiment and selling pressure. Where the Market Needs to Make a Decision For now, $0.3050–$0.3029 is the immediate support area. Below that, $0.2949 becomes an important level to watch. On the upside, ONDO needs to reclaim $0.3080–$0.3086 before buyers can seriously challenge $0.3105 and the previous high of $0.3131. A convincing move above $0.3131, supported by stronger volume, would improve the recovery outlook. On the other hand, losing $0.3029 would suggest that sellers are still controlling the short-term direction. What Matters Most Now? There is no real reason to rush into a trade while the market is still searching for direction. Buying immediately means facing nearby resistance, while selling directly into support also carries its own risks. ONDO has shown that buyers are still present, but showing up once is not the same as taking control. $ONDOUSDT #ByXIMPACT
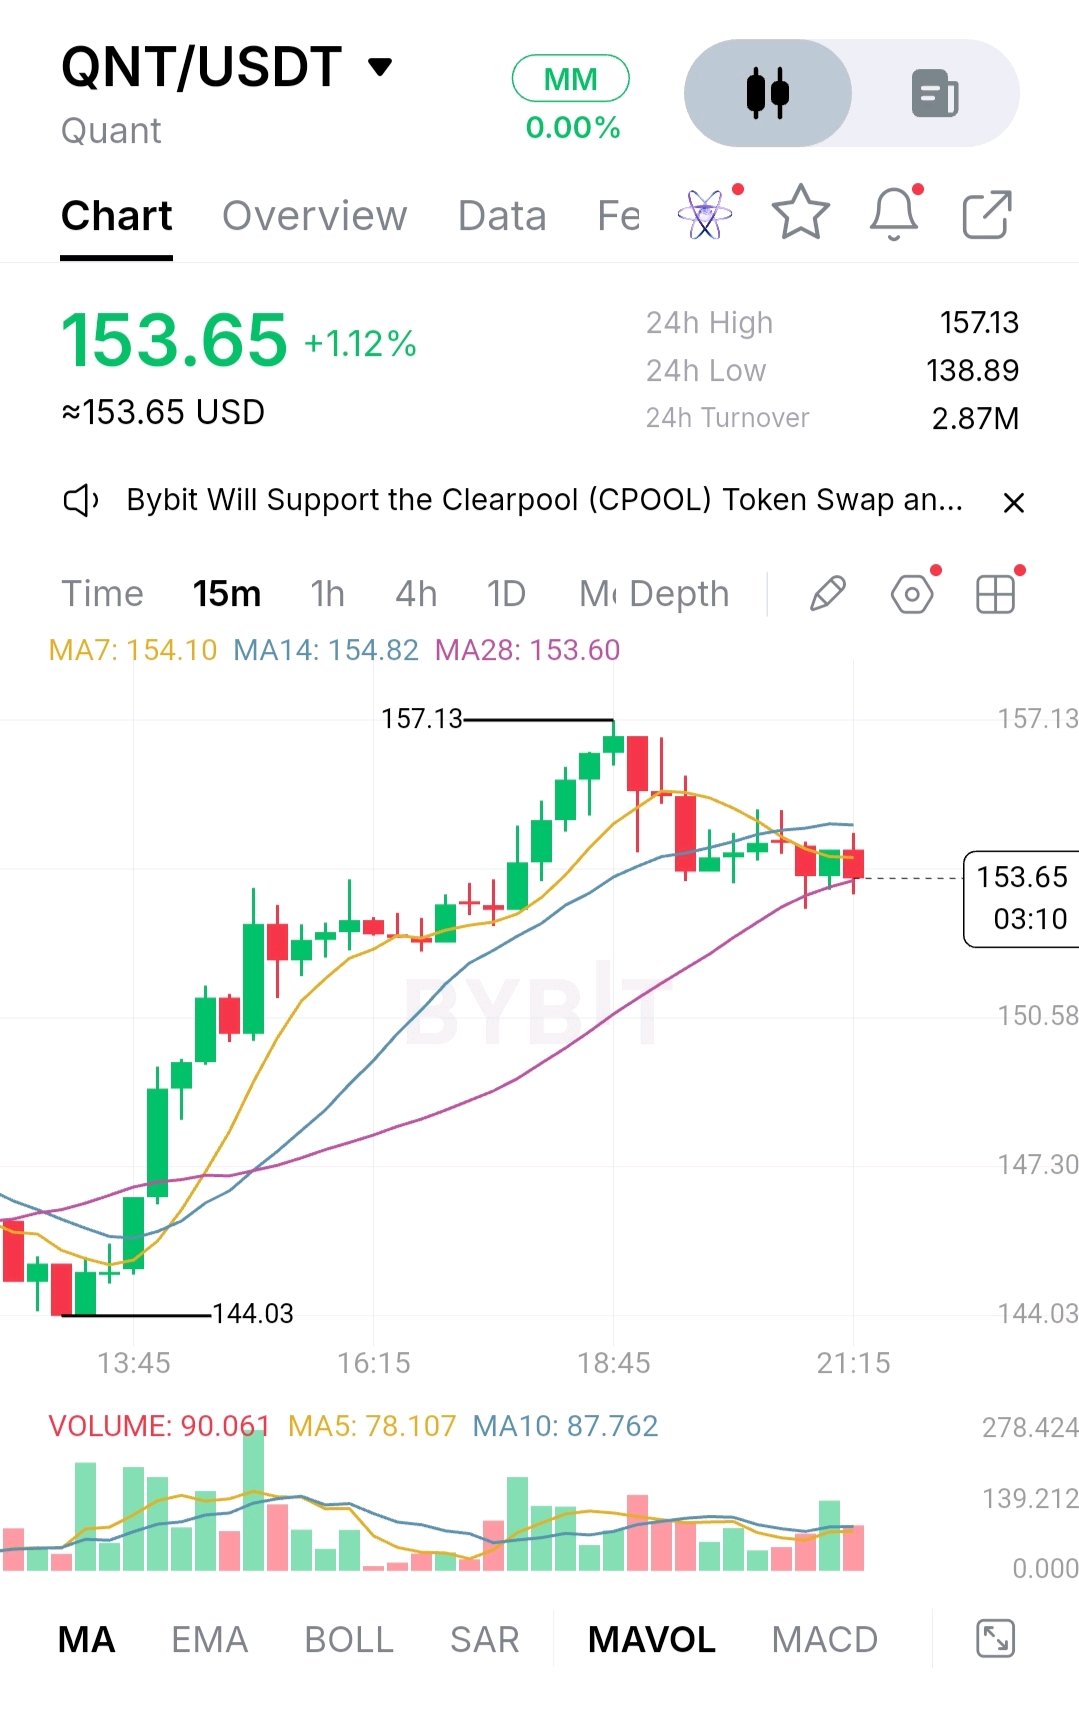
QNT/USDT: Buyers Have Stopped the Slide, but Is That Enough? Quant has had an interesting run, but the latest price action raises a question worth paying attention to: are buyers genuinely stepping back into the market, or is the recent recovery simply losing momentum? Looking at the Bybit chart, QNT climbed from $144.03 to $157.13 before pulling back towards $153.65. The price has not given back the entire rally, which is encouraging. However, the market is beginning to move sideways, and that suggests buyers are becoming more cautious at these levels. There is a small but important detail in the moving averages. QNT is trading around its 28-period average at $153.60, while the shorter averages remain above the current price at $154.10 and $154.82. In other words, the initial buying pressure has cooled. Volume has also eased compared with the stronger activity during the upward move. For now, the chart shows consolidation rather than a convincing second wave of buying. The next question is who is actually supporting the price. A rebound is much more meaningful when spot buyers are willing to absorb selling pressure. Derivatives activity and liquidation figures can provide useful context, but they cannot prove that investors are accumulating QNT. Without clear confirmation from spot demand, it would be premature to call this a new bullish phase. Quant's longer-term story is worth considering separately. Its Overledger technology is designed to connect different blockchain networks with existing financial infrastructure. The company has also been developing its Fusion Rollup and pursuing institutional interoperability initiatives. These developments give the project a tangible use case beyond market speculation. QNT plays a role in accessing the ecosystem, although growing interest in Quant's technology does not automatically translate into increased demand for the token. On the chart, $154.10–$154.82 is the first area buyers need to reclaim. Above that, attention returns to $157.13. A convincing break and successful retest would make the recovery more interesting. On the other side, $152.13 is the first level worth defending, followed by $150.58 and $149.03. Losing these supports could put the recent recovery under greater pressure. What makes sense from here? Chasing QNT around $153.65 does not offer a particularly attractive opportunity. Buyers would be better served by waiting for a confirmed move above resistance. Meanwhile, a sustained break below $152.13 could give sellers another opportunity, especially if price fails to recover that level. For now, QNT is caught between a recovery that has not fully developed and selling pressure that has not completely disappeared. The important thing is not how quickly QNT can rise again. It is whether buyers are willing to support the price once the excitement of the previous rally has faded. That's where the market's real strength will become visible. $QNTUSDT #ByXIMPACT
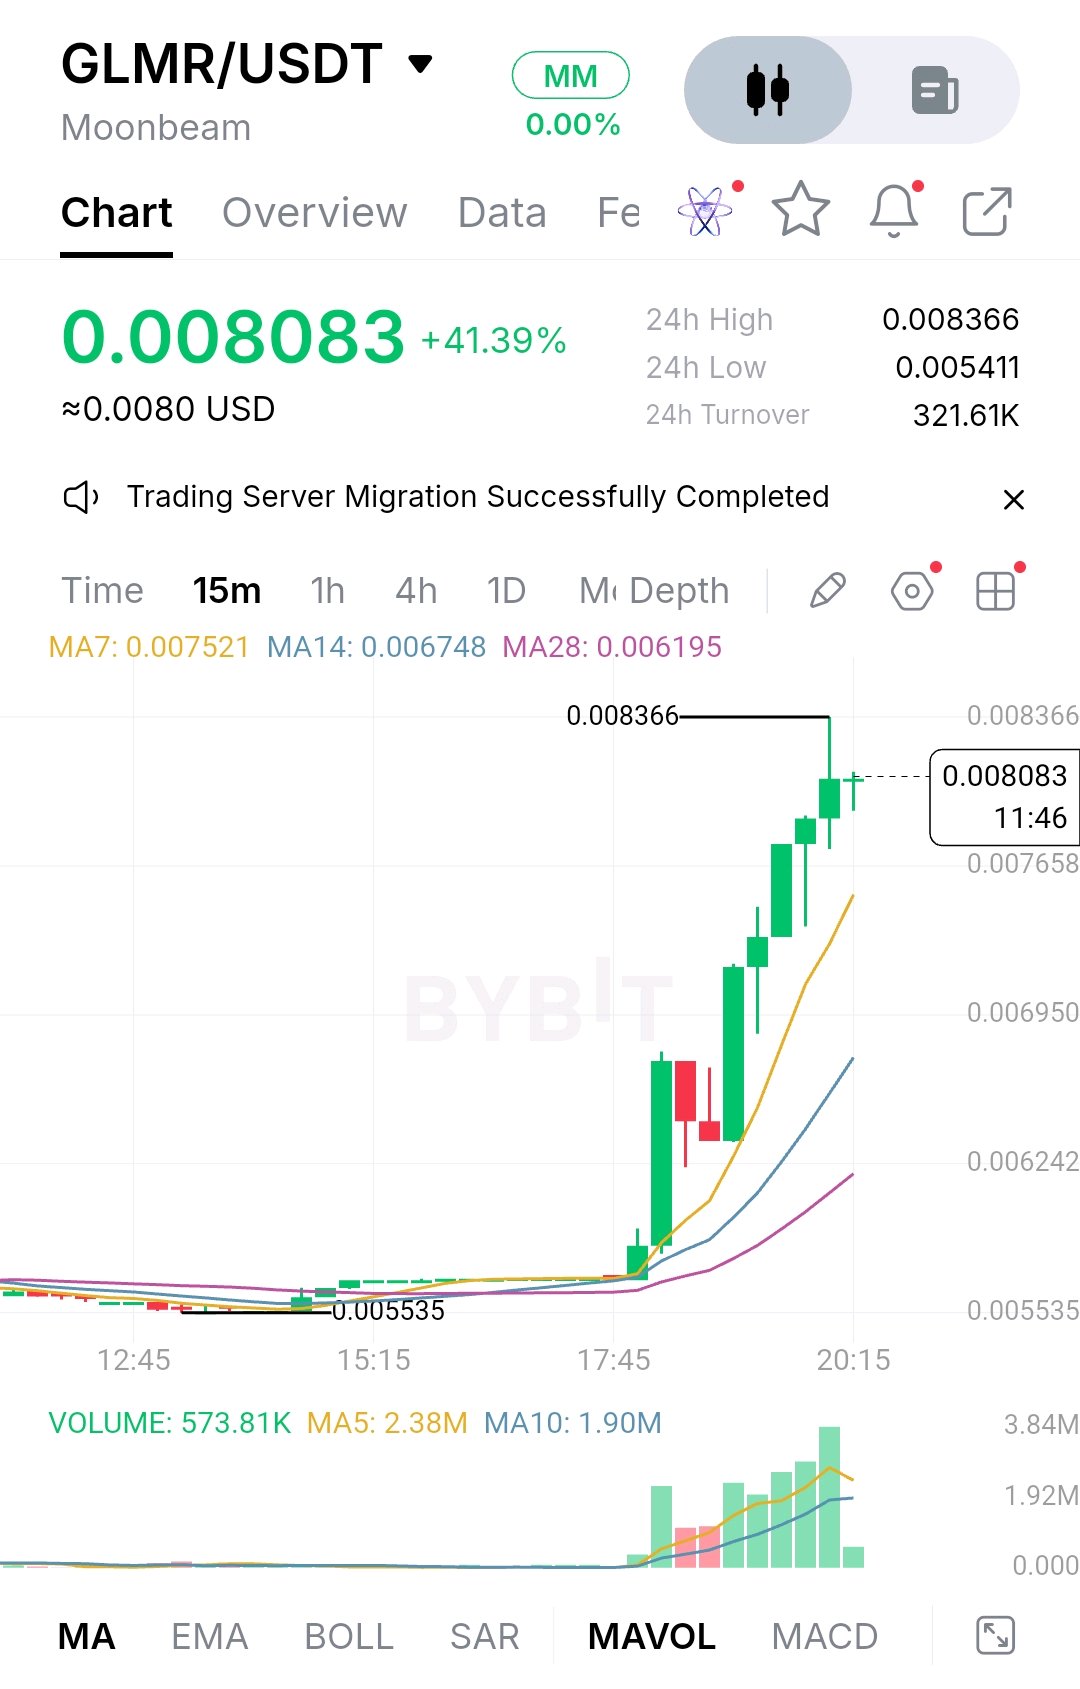
GLMR/USDT: The Rally Was Impressive, But Can Moonbeam Hold On to Its Gains? Something interesting happened with GLMR. After spending considerable time trading around much lower prices, the token suddenly attracted buyers and surged more than 41% in 24 hours. At first glance, it looked like the beginning of a meaningful recovery. But there is a question worth asking before getting carried away: are traders starting to believe in GLMR again, or did the market simply get caught up in a burst of excitement? The Bybit chart showed GLMR reaching $0.008366 after climbing from approximately $0.005535. Trading volume expanded alongside the move, and the short-term moving averages turned higher. There was clearly some buying strength behind the rally. However, the subsequent price retreat tells another part of the story. A later November 15 market snapshot placed GLMR around $0.005679. That means the market gave back a substantial portion of its gains. CoinGlass also showed a 24-hour trading range of $0.005414–$0.005973, with spot volume around $689,000. Positive net inflows are encouraging, but they are not enough on their own to prove that larger investors are accumulating. <Cite refs={["turn664203search2"]}/> More Than Just Another Crypto Rally There is a bigger story developing around Moonbeam itself. The project has moved away from its original Polkadot parachain model and migrated GLMR to Base on a 1:1 basis. Its new direction involves an AI-agent settlement network, designed to let autonomous software agents discover services, negotiate transactions and settle payments. <Cite refs={["turn664203search0","turn806654search2"]}/> This is an interesting change, especially because GLMR is intended to support assurance pools for agent services and potentially give participants a share of buyer-paid fees. Still, there is a difference between having an interesting idea and building a successful business around it. The official documentation describes the assurance program as not yet open. Until real users, transactions and fee generation become visible, the potential economic benefits remain largely unproven. <Cite refs={["turn806654search4","turn806654search5"]}/> What Should Traders Watch Now? The latest reported range puts $0.005414–$0.005973 at the centre of the immediate price battle. Buyers need to reclaim the upper boundary and hold above it to give the recovery some credibility. A move below the lower boundary would suggest sellers are still controlling the market. The earlier rally also left overhead reference levels around $0.00662, $0.00695, $0.00728 and $0.00770. These could become relevant again if buyers manage to rebuild momentum. For now, neither a long nor a short offers a sufficiently convincing entry with verified confirmation and risk protection. Waiting for the market to establish direction makes more sense than chasing another sudden move. GLMR has already shown that it can attract attention. What it still needs to show is that people have a reason to stay, invest and use the ecosystem after the excitement fades. That's the difference between a temporary rally and a recovery worth believing in. $GLMRUSDT #ByXIMPACT
HYPE/USDT: Buyers Have Made Their Move, But Can They Keep the Momentum Alive? There is something worth watching in HYPE right now. The price has recovered quite strongly, but the interesting part is what happened after that recovery. Instead of pushing straight towards another high, buyers have slowed down, leaving the market moving sideways around $68. Looking at the 15-minute Bybit chart, HYPE is trading near $68.102, with a reported daily high of $69.008 and a low of $60.063. Earlier, the price found support around $64.652 before making a sharp upward move. That recovery clearly brought buyers back into the market. However, the recent candles suggest that the enthusiasm behind the move is no longer as strong as it was initially. The moving averages tell a similar story. MA7 is around $68.233, MA14 is at $68.129, and MA28 sits lower at $67.255. Price is currently struggling around the shorter averages, while the longer average remains underneath it. Volume has also cooled compared with the activity seen during the rally. This doesn't automatically mean the recovery is over. It simply tells us that buyers need to show more commitment before the market can justify another move higher. Beyond the Candles Hyperliquid is more than just another speculative token. Its ecosystem combines decentralised perpetual trading, spot markets and HyperEVM, while HYPE plays an important role in the network through staking and gas-related utility. The platform's trading activity and continued ecosystem development could support long-term interest in the token. However, token supply and scheduled unlocks remain important considerations. Growing platform adoption does not guarantee that HYPE's market price will rise at the same pace. A Market Caught Between Two Decisions Traders who bought near $64.652 may already be sitting on attractive gains. Some could choose to secure profits around $69, while others may be waiting for a convincing breakout before entering. That hesitation could explain why price has struggled to make further progress. For now, $69.008 is the level buyers need to overcome. On the downside, $67.255 deserves attention because it aligns with the longer moving average shown on the chart. A convincing break below that area would weaken the recovery. A long position becomes more interesting after a strong close above $69.008 and a successful retest. On the other hand, a sustained move below $67.255 followed by a failed recovery would make the bearish scenario worth considering. Neither setup is confirmed at present, so chasing the market carries unnecessary risk. What Really Matters Now HYPE has already shown that buyers can move the price higher. The unanswered question is whether they are prepared to defend those gains when selling pressure returns. A breakout supported by stronger volume would make the recovery more convincing. Failure to hold nearby support would tell a very different story. For now, the most sensible approach is patience. A market can look strong because sellers have stepped aside, but only consistent buying can prove that demand is genuinely there. $HYPEUSDT #ByXIMPACT

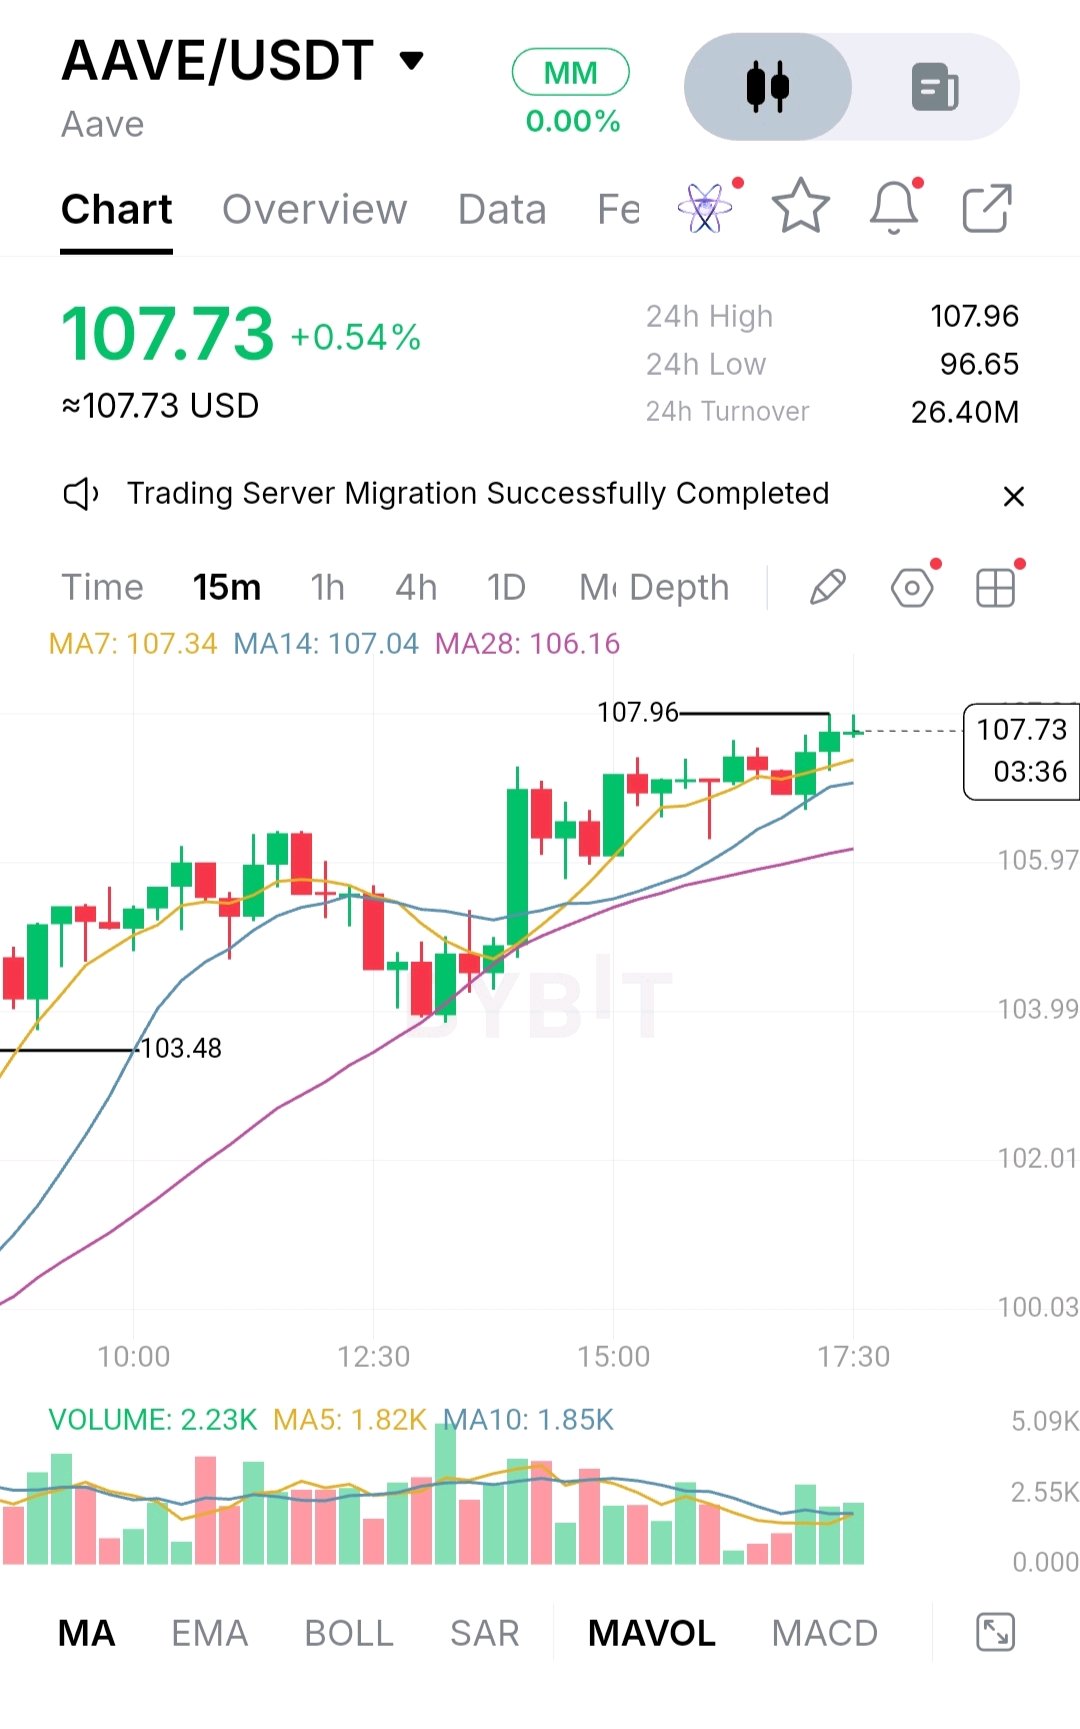
AAVE/USDT: Buyers Are Back, But Is This Recovery Strong Enough to Last? There is something interesting about AAVE's recent price action. After struggling around the lower end of its intraday range, the token managed to recover and push toward the $108 area. That naturally raises a question: are buyers starting to regain confidence, or is this simply a temporary bounce after sellers have taken some profit? The Bybit chart provided shows AAVE trading at $107.73, up 0.54%, with an intraday low of $96.65 and a high of $107.96. On the 15-minute timeframe, price has moved above all three displayed moving averages. The MA7 sits at $107.34, the MA14 at $107.04 and the MA28 at $106.16. That is encouraging for short-term momentum, although it is too early to call it a confirmed trend reversal. A separate market snapshot showed AAVE trading around $105.39, with a 24-hour decline of 3.91% and a range between $96.52 and $109.75. The difference between these observations highlights why the timing of market data matters. More importantly, the broader trend still needs convincing evidence of improvement. What is happening between buyers and sellers? The derivatives market offers another piece of the puzzle. Reported futures volume was approximately $402.55 million, compared with $75.99 million in spot trading. Open interest also declined by 3.97%, while long liquidations made up most of the reported liquidation activity. This suggests that leveraged traders have faced considerable pressure. Some of the recent recovery could therefore come from reduced selling pressure rather than a sudden wave of fresh buying. There is a difference between sellers stepping aside and buyers taking control, and AAVE still needs to prove the latter. The bigger picture behind AAVE Price movements aside, Aave remains an important name in decentralized finance. Its protocol allows users to lend crypto assets and borrow against their collateral. The expansion of Aave V4 across networks including Avalanche, Arc and Base is a meaningful development for its ecosystem. The AAVE token also has governance and staking-related utility, while the DAO's buyback program provides another mechanism for connecting protocol activity with token demand. Still, ecosystem development does not automatically translate into higher market prices. What should traders watch? The $103.48 area stands out as an important previous intraday low on the supplied chart. Meanwhile, the separate market snapshot identifies $109.75 as a nearby ceiling and $96.52 as an important downside boundary. A convincing move above $109.75, followed by a successful retest, would strengthen the recovery argument. A loss of $96.52 would put buyers in a much more difficult position. For now, neither a long nor a short has sufficiently clear confirmation. Chasing the latest candle could mean entering just as the market reaches an important decision point. AAVE's challenge is no longer just recovering lost ground. It is showing that buyers are willing to stand their ground when the market gives sellers another opportunity. $AAVEUSDT #ByXIMPACT
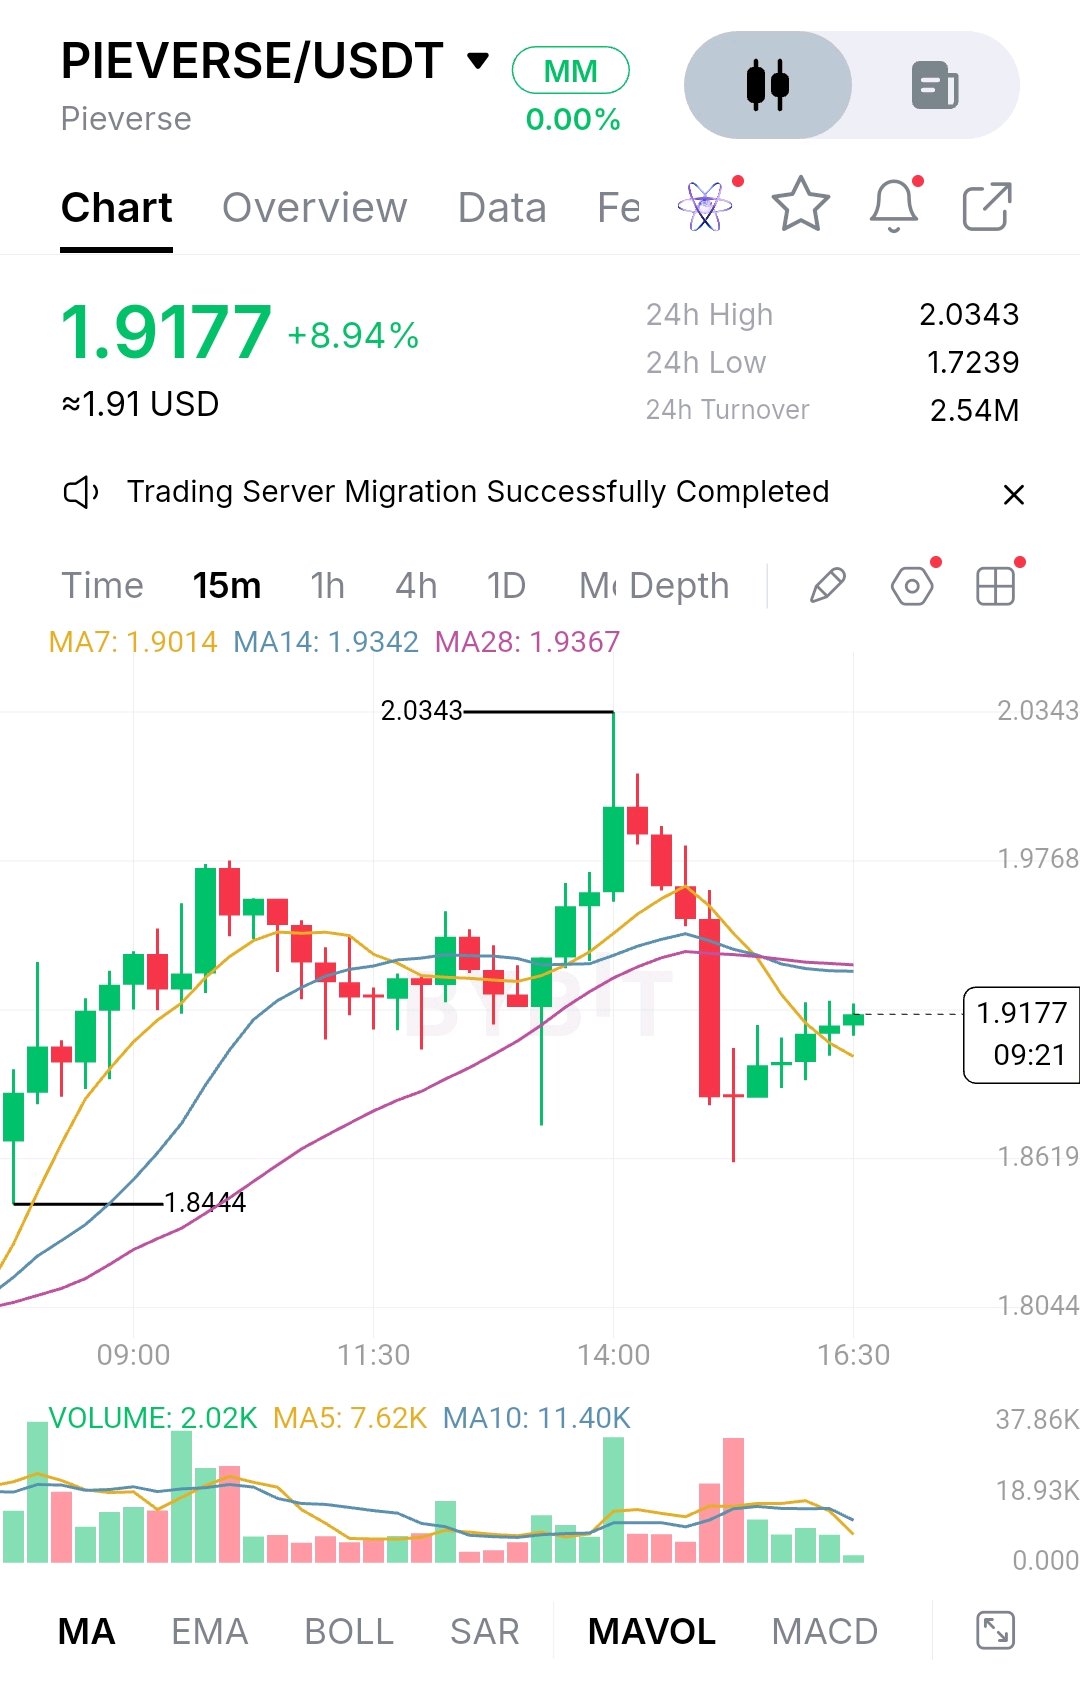
PIEVERSE/USDT: Buyers Are Back, But Is the Recovery Strong Enough? PIEVERSE has made an impressive recovery, but there is something about the latest price action that deserves attention. Despite gaining nearly 9% in 24 hours, the market is still struggling to move beyond the area where sellers previously stepped in. So, is this the beginning of another upward move, or are buyers simply taking advantage of a temporary pause in selling? At the time of the supplied chart, PIEVERSE is trading around 1.9177 USDT, with a 24-hour high of 2.0343 and a low of 1.7239. The chart shows that buyers managed to recover after a sharp drop toward 1.86. However, the rebound has not yet erased the weakness created by the earlier sell-off. There is another detail worth watching. Price is above the MA7 at 1.9014, but still below the MA14 at 1.9342 and MA28 at 1.9367. This suggests that short-term buying interest has improved, although the broader intraday momentum has not fully turned bullish. Trading volume also remains relatively light during the recovery, raising questions about how much conviction is behind the move. What Is Happening Behind the Price? Supply could become an important factor for PIEVERSE. The project has a maximum supply of one billion tokens, and its allocation structure includes tokens reserved for investors and the team. A scheduled unlock of approximately 33.4 million tokens around November 14 has also attracted attention. This does not automatically mean selling pressure will follow, but traders will likely watch closely for any increase in available supply. On the development side, Pieverse is working on blockchain-based payment documentation, verifiable transactions and AI-powered agents. These products give the project a broader direction beyond short-term speculation. Its long-term success, however, will depend on whether people actually use these products and whether that activity creates meaningful demand for the token. The Market's Psychological Battle After the move toward 2.03, some traders may prefer to secure profits rather than risk another decline. Others might be entering now because they fear missing a second rally. This creates an interesting situation: if price fails to move higher, late buyers could quickly become sellers. Important Levels to Watch - Immediate support: 1.88–1.90 - Major support: 1.8619–1.8444 - Immediate resistance: 1.934–1.937 - Next resistance: 1.9768 - Major resistance: 2.0343 A convincing break above 2.0343, supported by stronger volume, would improve the bullish outlook. On the other hand, losing 1.8444 could expose the market to another decline toward 1.7239. Final Market Outlook PIEVERSE is showing signs of recovery, but the current price action is not strong enough to confirm a sustained trend reversal. Buyers need to demonstrate that they can push through resistance rather than simply defend lower prices. For now, chasing the rally carries unnecessary risk. A confirmed breakout or a clear breakdown would provide a more meaningful trading opportunity. The real question is not how much PIEVERSE has recovered, but whether buyers are willing to keep buying when the price gets expensive. $PIEVERSEUSDT #ByXIMPACT
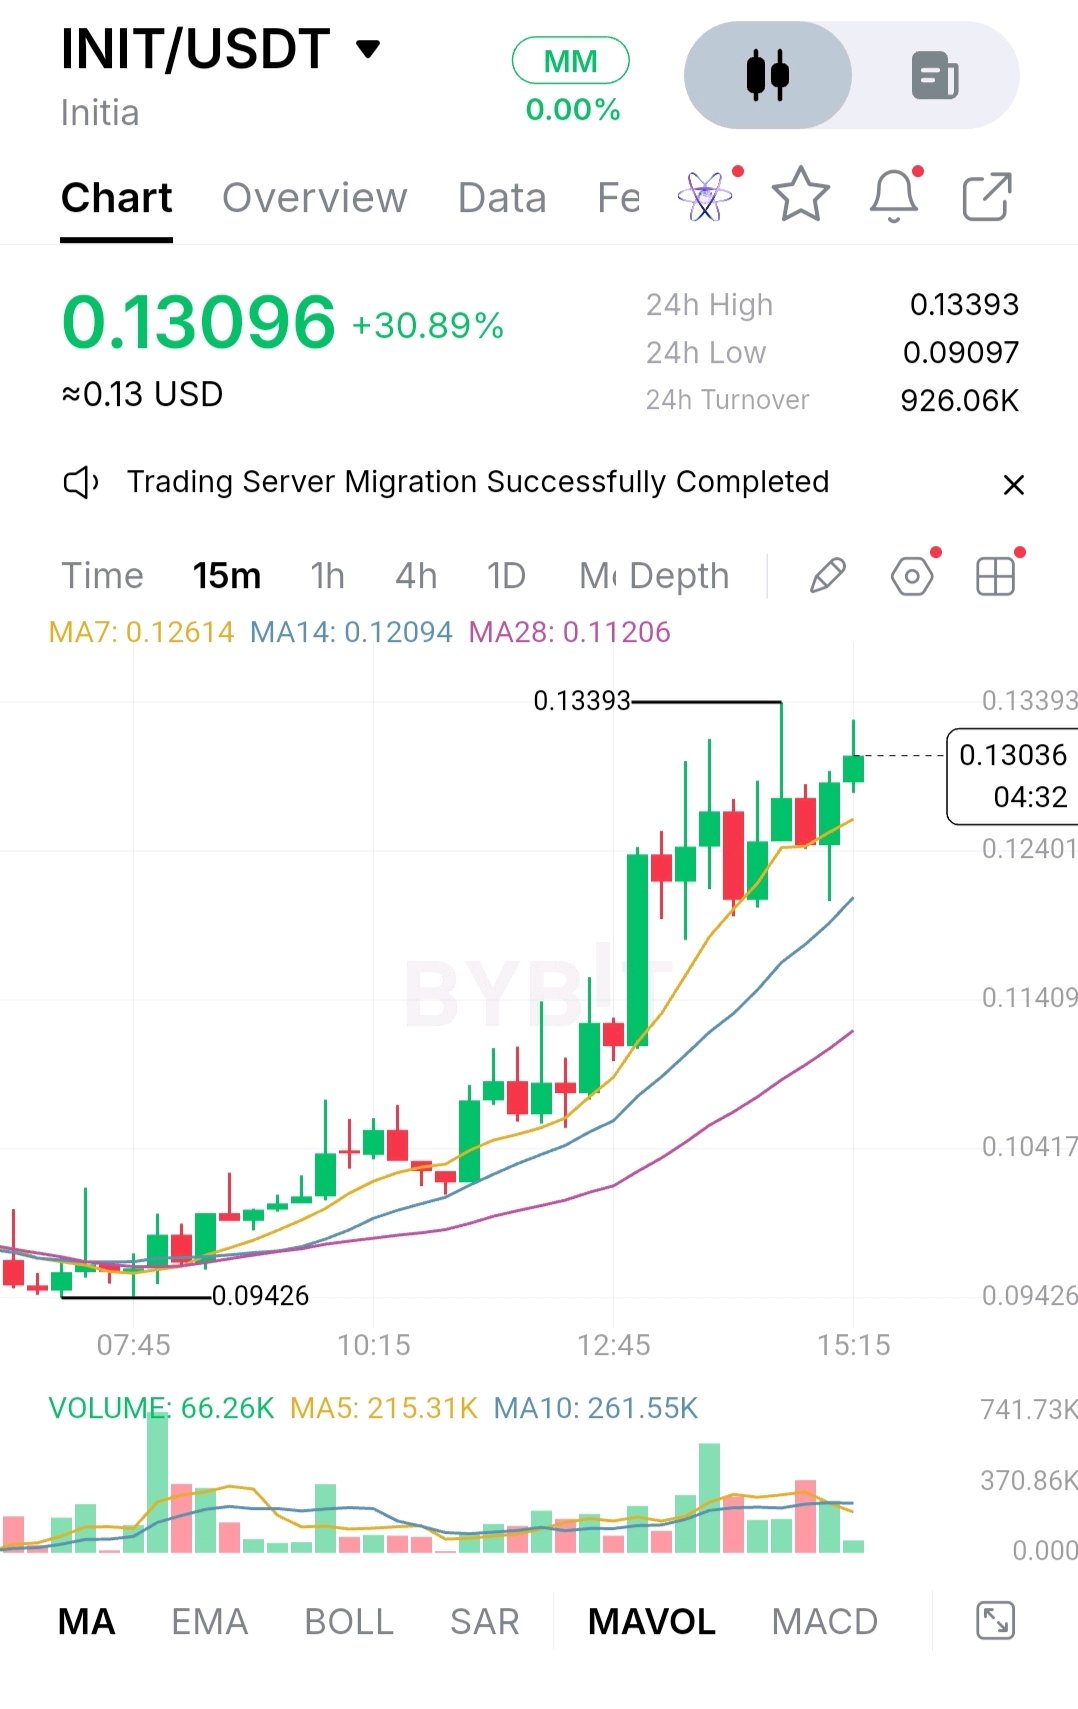
INIT/USDT: Buyers Have Pushed the Price Higher, But Can They Keep the Momentum Alive? Something interesting is happening with INIT. The token has gained nearly 31%, yet the bigger question is whether this rally has enough buying strength behind it to continue, or whether traders are simply taking advantage of a sudden burst of momentum. According to the supplied Bybit chart, INIT is trading around $0.13096. Earlier in the session, it touched $0.09097 before climbing to a high of $0.13393. That's a considerable move, especially over such a short period. Looking at the 15-minute chart, buyers still have the advantage. The price is trading above all three displayed moving averages: MA7 at $0.12614, MA14 at $0.12094 and MA28 at $0.11206. Their upward positioning suggests that short-term momentum remains positive. But there is something worth watching. Trading volume has cooled considerably in the latest candle. The displayed volume is 66.26K, compared with the MA5 and MA10 volume averages of 215.31K and 261.55K. This doesn't automatically mean the rally is ending, but it does suggest that buyers need to show more commitment if they want to push through resistance at $0.13393. The Bigger Picture Behind INIT Price action isn't the only thing investors should be considering. Initia is building an ecosystem designed to connect application-specific blockchains through its Interwoven Stack. Its technology supports EVM, MoveVM and WasmVM environments, while INIT serves several purposes, including transaction fees, staking and governance. However, the project has recently faced serious security concerns. On November 10, Initia disclosed another exploit involving compromised cloud credentials and forged IBC withdrawals across five rollups. Approximately $3.27 million in assets were reportedly affected. The network was halted while the team worked on infrastructure reconstruction. This matters because market confidence and actual ecosystem health are two different things. A token can recover quickly on an exchange without the underlying project having fully recovered. Supply is another consideration. Approximately 219 million INIT tokens are circulating, against a maximum supply of one billion. A scheduled unlock on November 24 could introduce additional selling pressure, depending on how recipients handle their allocations. Are Buyers Really Taking Control? The current rally suggests renewed interest, but it is too early to call it accumulation. Traders who entered around $0.09 are already sitting on substantial gains. Some may decide to secure profits rather than wait for another move higher. Meanwhile, those buying near $0.13 risk becoming trapped if momentum fades. The key is how INIT behaves when it approaches resistance. If buyers continue stepping in during pullbacks, that would provide stronger evidence of genuine demand. If every recovery attempt attracts sellers, the rally may struggle to maintain its progress. The Levels Worth Watching - $0.13393: Immediate resistance and the session high. - $0.124–$0.126: First important demand area. - $0.1209: Secondary support. - $0.1120: Deeper support around the longer moving average. - $0.09097: The recent session low. A sustained move above $0.13393, followed by a successful retest, would strengthen the bullish case. On the other hand, losing $0.124 could expose INIT to a deeper correction. A potential long trade would require a confirmed breakout and retest. A short opportunity would become more interesting if price rejects resistance and subsequently loses $0.124. Neither setup is confirmed at present, so chasing the current price carries unnecessary risk. What Comes Next for INIT? For now, the market is sending two different messages. The chart shows buyers making an impressive comeback, while the project's recent security problems and upcoming token unlock leave questions about longer-term confidence. The next important developments will be the network's recovery, restoration of affected assets and evidence that ecosystem activity is returning. Perhaps the most important question isn't how high INIT can climb during this rally, but whether the project can rebuild enough confidence to justify the higher price. That's the difference between a temporary market rebound and a recovery with something substantial behind it. Market research based on the supplied Bybit screenshot and available project information. RSI, MACD, live order-book depth and derivatives positioning have not been independently verified. $INITUSDT #ByXIMPACT
Midnight (NIGHT/USDT): Buyers Have Brought the Rally Back to Life, but the Hard Part May Be Just Beginning Something Has Changed in NIGHT's Price Action After spending time near the lower end of its recent trading range, Midnight is showing signs of renewed buying interest. NIGHT has climbed from $0.04548 to $0.05015, putting the market in a considerably stronger position than it was earlier in the session. But there is a question worth asking before getting carried away with the recovery: are buyers genuinely becoming more confident, or is the market simply experiencing a temporary break from selling pressure? The distinction matters, especially with price now approaching an area where sellers could become active again. The Chart Is Improving, but the Rally Needs Confirmation One encouraging detail is the way NIGHT has recovered above its short-term moving averages. The MA7 is sitting at $0.04969, the MA14 at $0.04941 and the MA28 at $0.04814. Price is holding above all three, suggesting that buyers currently have the upper hand. The recovery from $0.04548 has also produced a sequence of higher price swings. That is a welcome change in short-term structure. Still, the market has not cleared its most important nearby obstacle. The $0.05129 high remains firmly in focus. Until buyers can move above this level and hold their ground, there is still a possibility that the rally could lose momentum. Why Midnight Deserves Attention Beyond the Chart Midnight has an interesting proposition in the blockchain space. Rather than treating privacy as an optional feature, the project is building its ecosystem around selective disclosure and zero-knowledge technology. The idea is relatively straightforward: applications should be able to verify important information without exposing everything behind it. Its NIGHT token also has a connection to network activity through DUST, which is used to pay for transactions and computational resources. That gives the project a meaningful utility narrative, although the real test will be whether developers and users adopt the ecosystem at a scale that creates lasting demand. The Levels Traders Should Watch For now, $0.0490–$0.0494 represents the first important support area. A deeper move toward $0.0481 could test whether buyers are still willing to defend the recovery. On the upside, $0.0507–$0.05129 is the immediate resistance zone. A convincing breakout above $0.05129, followed by a successful retest, would provide a stronger argument for further upside. Conversely, losing $0.0490 could indicate that buyers are beginning to lose control. There is no reason to force a trade while price remains between these boundaries. The Real Test Is Still Ahead NIGHT has recovered impressively, but a strong session does not necessarily mark the beginning of a lasting uptrend. Buyers now need to demonstrate that they are willing to support higher prices, even when early participants start taking profits. That is what makes the next reaction around $0.05129 so important. The interesting question is no longer whether NIGHT can rise. It is whether the market is finally willing to pay more for it and stay there. $NIGHTUSDT #ByXIMPACT

NEAR Protocol (NEAR/USDT): Sellers Have Taken Control, but Is the Pressure Starting to Fade? Something interesting is happening with NEAR. Despite the sharp decline, the more important question now is whether sellers still have enough strength to push the price significantly lower, or whether the market is approaching a point where buyers may finally step in. At the time of the supplied Bybit screenshot, NEAR was trading around $3.097, down 11.84% in 24 hours. The price had slipped close to its daily low of $3.083, a sign that buyers had struggled to defend higher levels. A market that has lost its footing Looking at the 15-minute chart, the weakness becomes easier to understand. NEAR spent some time moving sideways around $3.30 before sellers gradually took control. Once the price slipped below that range, the decline accelerated, with several consecutive bearish candles pushing it towards $3.083. The moving averages tell a similar story. MA7 sits at $3.166, MA14 at $3.222 and MA28 at $3.279. With all three above the current price, the short-term trend remains under pressure. There is also an important detail in the volume bars. Trading activity increased during the heavier selling candles, suggesting that the decline attracted meaningful participation. That makes the current weakness harder to dismiss as ordinary market noise. Are buyers stepping in, or simply waiting? This is where things become interesting. A price approaching its daily low can attract bargain hunters, but that does not mean a recovery is already underway. The $3.083 area is the first level worth watching. If buyers manage to defend it and push NEAR back above $3.15, a short-term recovery could develop. However, repeated attempts to reclaim higher prices that quickly fail would suggest sellers are still controlling the market. The chart does not provide enough order-book depth or RSI and MACD readings to confirm buying absorption or a momentum reversal. For now, calling this accumulation would be premature. The bigger picture behind NEAR NEAR Protocol has a broader story beyond its current price action. Its sharded blockchain architecture is designed to improve scalability, while its cross-chain technology and NEAR Intents aim to make interactions between different blockchain networks easier. These developments give the ecosystem a meaningful long-term proposition. However, strong technology and rising ecosystem interest do not automatically translate into immediate token demand. The market still needs to see sustained usage and economic value flowing back to the token. What comes next? For now, $3.083 remains the immediate support to watch. On the upside, $3.15 is the first recovery hurdle, followed by $3.22 and $3.28. A sustained move above these levels would improve the short-term picture. On the other hand, a decisive break below $3.083 would leave the market vulnerable to another leg lower. The real test for NEAR is not whether it can produce a green candle after this decline. It is whether buyers are willing to keep purchasing once the initial selling pressure returns. Until that becomes clear, patience may be more valuable than trying to catch the bottom.$NEARUSDT #ByXIMPACT
PEPE/USDT: Is the Selling Pressure Finally Pushing Buyers Away? There is something interesting about PEPE's latest decline. The price isn't just moving lower; it's struggling to attract buyers whenever it tries to recover. And that may be more important than the nearly 10% loss itself. Looking at the Bybit 15-minute chart, PEPE was trading around 0.000004053 USDT, with a daily decline of 9.97%. Earlier, buyers managed to push the price toward 0.000004340, but that recovery didn't last. Sellers gradually took control, and the price moved back toward the session low of 0.000004027. The moving averages tell a similar story. MA7 sits at 0.000004115, MA14 at 0.000004194 and MA28 at 0.000004242. PEPE is trading below all three, which makes a quick recovery more difficult. Selling volume also increased during the decline, suggesting that the move was supported by genuine trading activity rather than a few isolated trades. Buyers Are Being Put to the Test The important question now is whether buyers are willing to step in at lower prices. A decline like this can create opportunities, but it can also reveal how quickly market confidence disappears. Traders who bought during the earlier recovery may now be looking for an exit, while others could be waiting for a clearer sign that selling pressure is slowing. There is not enough evidence in the screenshot alone to call this accumulation. A convincing change would require stronger buying volume and a recovery that holds above previous resistance. What Makes PEPE Different? Unlike cryptocurrencies supported by network fees or established financial applications, PEPE depends heavily on community interest, internet culture and speculative demand. That gives the token considerable exposure to changes in market sentiment. When enthusiasm returns to memecoins, PEPE can attract attention quickly. But when liquidity moves elsewhere, demand can disappear just as quickly. Its large token supply is another consideration. A limited supply narrative does not automatically translate into higher prices when buyers are unwilling to purchase the available tokens. The Levels Worth Watching The first important level is 0.000004027. This is the session low shown on the chart. If sellers push below it and price fails to recover, further weakness becomes possible. On the upside, 0.000004115 is the first hurdle. Beyond that, the 0.000004194–0.000004242 region could prove difficult to reclaim. The earlier high around 0.000004340 is another important resistance area. Potential Long Setup - Entry: Only after a confirmed recovery above 0.000004242. - Confirmation: Successful retest with stronger buying activity. - TP1: 0.000004340. - TP2: 0.000004536. - TP3: Not established from the available chart. - Stop Loss: Below the confirmed retest low. Potential Short Setup - Entry: Following a confirmed breakdown below 0.000004027. - Confirmation: Failed attempt to reclaim support. - TP1–TP3: Require additional lower-timeframe and historical price data. - Stop Loss: Above the failed-retest high. What Needs to Change? PEPE doesn't necessarily need a dramatic rally to improve its outlook. It needs to show that buyers are becoming more confident and are prepared to defend lower prices. For now, sellers have the advantage. But the next meaningful clue will come from how price behaves around 0.000004027. A falling market tells us that sellers are active. What happens when they finally slow down will tell us whether buyers were waiting all along or have simply lost interest. $PEPEUSDT #ByXIMPACT

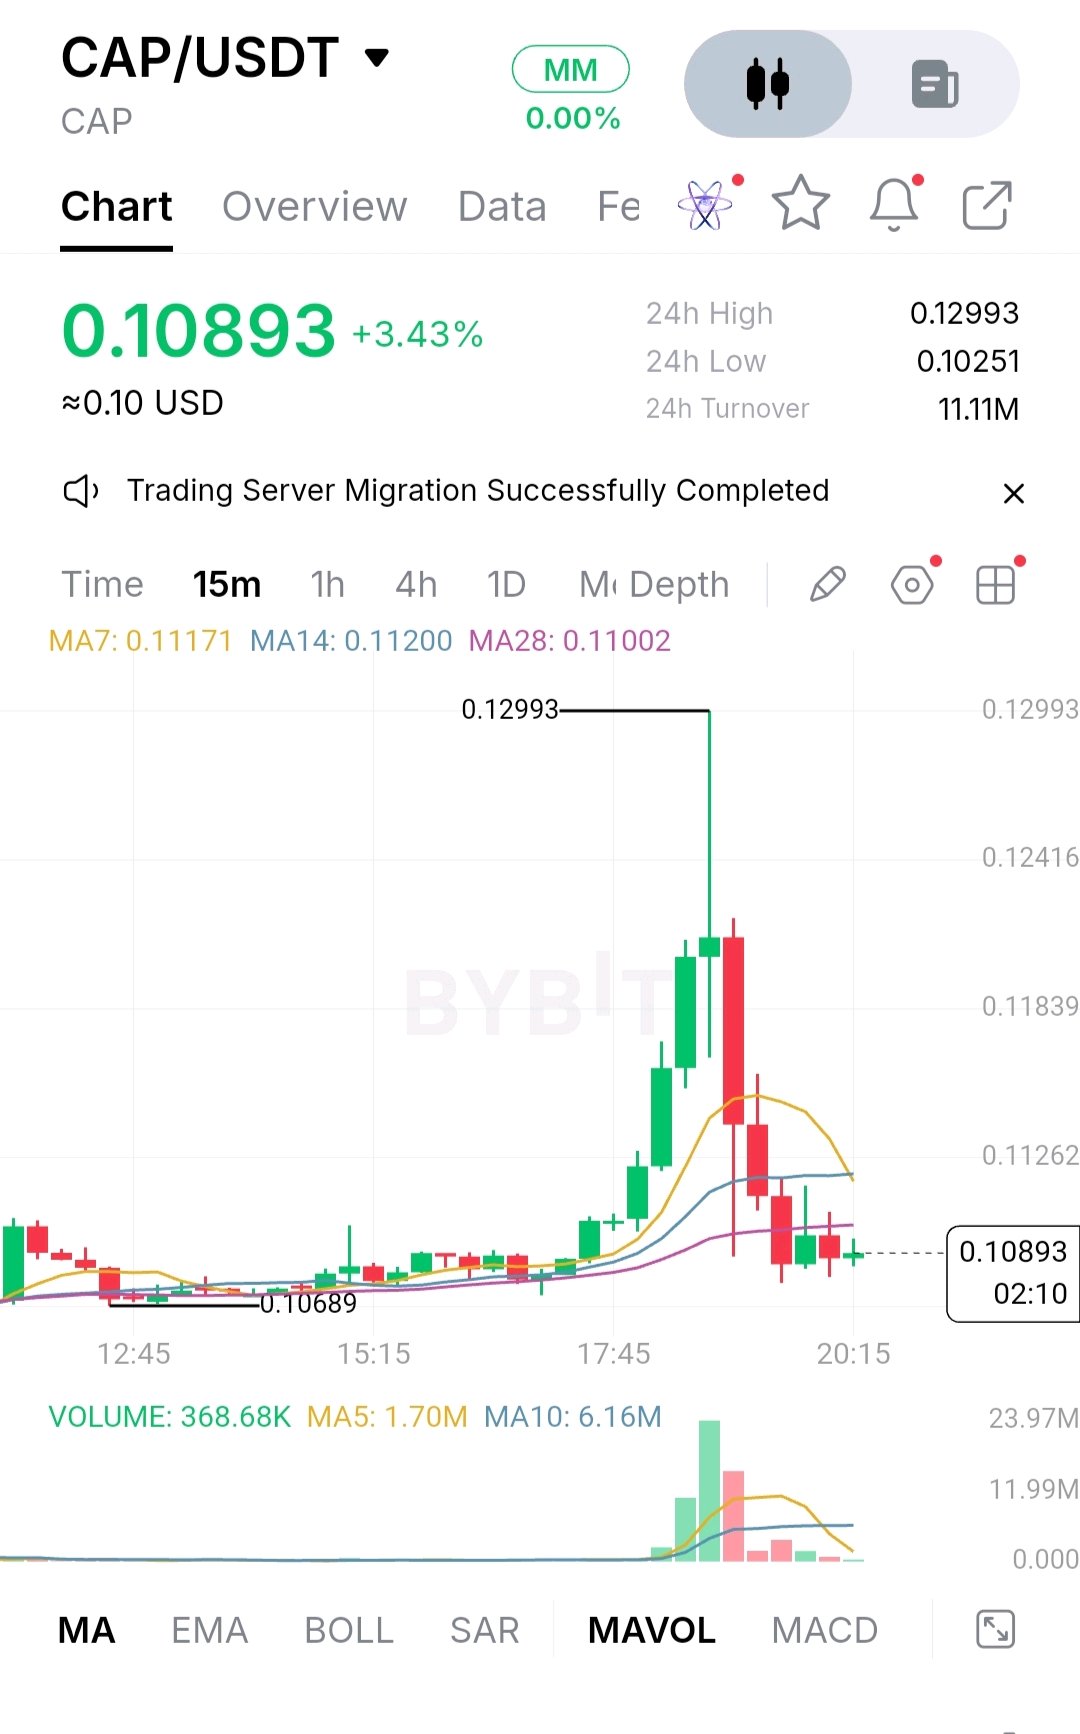
CAP/USDT: Buyers Made Their Move, But Why Couldn't They Hold the Rally? Something interesting happened with CAP recently. Buyers suddenly stepped in, pushed the price sharply higher, and briefly brought the market close to $0.130. But instead of building on that momentum, the token quickly gave back a large portion of its gains. That leaves an important question: were buyers genuinely interested in CAP at higher prices, or was the rally simply an opportunity for existing holders to take profits? At the time of the supplied Bybit screenshot, CAP was trading around $0.10893, showing a 3.43% daily gain. Despite the positive percentage, the price action tells a less convincing story. The rejection from $0.12993 suggests that selling pressure increased considerably as the token moved higher. Looking at the 15-minute chart, CAP is now trading below its short-term moving averages. The MA7 sits at $0.11171, MA14 at $0.11200 and MA28 at $0.11002. This isn't particularly encouraging for buyers. Until the price manages to recover these levels, the recent rally remains vulnerable to further selling. Volume also deserves attention. Trading activity increased significantly during the upward move, but participation faded as the price started falling. That doesn't automatically mean large investors are distributing their holdings, but it does suggest that the initial enthusiasm hasn't translated into sustained buying pressure. There is another side to CAP that shouldn't be overlooked. Its underlying protocol operates in the DeFi sector, focusing on dollar-denominated financial products, yield opportunities and institutional credit markets. Products such as cUSD and stcUSD give the ecosystem a practical purpose beyond token speculation. Still, having an interesting product doesn't automatically guarantee stronger demand for its token. Reported ecosystem TVL, protocol fees, actual revenue and token supply all matter when assessing whether the project is building lasting value. CAP also has a maximum supply of 10 billion tokens, making future circulating supply an important consideration. For the immediate market structure, $0.10689 is the first level buyers need to protect. Losing it could bring the price back toward the 24-hour low of $0.10251. On the upside, reclaiming $0.11200 would be an encouraging first step. Beyond that, $0.11522 and $0.11841 are worth watching as potential recovery barriers. A sustained move above these areas would make the bullish argument considerably stronger. For now, neither chasing a long position nor blindly betting against the market looks particularly attractive. Waiting for confirmation could be the more sensible decision. Ultimately, CAP's next move will depend on something more important than a sudden price spike: whether buyers are willing to keep supporting the token once the excitement surrounding its rally has faded. $CAPUSDT #ByXIMPACT
Bitcoin Drops Below $66,000: Are Buyers Preparing a Recovery or Is More Selling Ahead? Bitcoin is showing signs of exhaustion, but that doesn't necessarily mean the selling is over. After another sharp decline, BTC is approaching an area where buyers may finally have to make their presence felt. The interesting part is that the market has started reacting near its recent low, yet there is still little evidence that sellers have completely lost control. On the Bybit 15-minute chart, BTC/USDT was trading around $65,958.6, down 4.15%. Earlier, Bitcoin reached $67,527.1 before losing ground throughout the session. The decline eventually pushed price to $65,815, where a small recovery began to develop. The Chart Is Telling a Bearish Story What stands out is how consistently Bitcoin has struggled to recover. Each attempt to move higher has been followed by renewed selling, leaving the market with a series of lower prices. The moving averages reinforce this weakness. The MA7 is sitting at $66,320.6, followed by MA14 at $66,679.5 and MA28 at $66,952.2. With all three above the current price, buyers have several obstacles to overcome before the short-term picture starts improving. Selling volume also increased during the sharper downward candles. That suggests the decline attracted stronger participation rather than being caused by a quiet loss of momentum. Is Anyone Willing to Buy This Dip? The $65,815 level deserves attention because it marks the lowest point shown on the chart. Bitcoin managed a modest rebound after touching it, but it would be premature to call that accumulation. There is an important difference between buyers stepping in and sellers simply taking a break. To make the recovery convincing, BTC needs to hold above its recent low, attract stronger buying volume and eventually reclaim the nearby moving averages. If price falls below $65,815 without a meaningful recovery, the current weakness could continue. Bitcoin's Bigger Picture Short-term price movements don't change what makes Bitcoin important. Its network operates without a central authority, its supply is capped at 21 million coins, and its proof-of-work system provides a decentralized way to transfer and store value. Institutional access through spot ETFs has also made Bitcoin more accessible to traditional investors. However, institutional demand can fluctuate, and long-term adoption does not prevent sharp corrections when market confidence weakens. What Traders Might Be Thinking Anyone who bought near $67,000 may now be looking for an opportunity to exit without taking a larger loss. This could create additional selling whenever Bitcoin attempts a recovery. At the same time, short sellers may become more confident after seeing several consecutive bearish candles. A sudden move higher could force some of them to close positions, adding buying pressure. The Levels That Matter Now - Immediate support: $65,815 - Further psychological support: $65,000 - First resistance: $66,320 - Next resistance: $66,680 - Major short-term resistance: $66,952 A recovery above $66,952, supported by stronger volume, would provide the first meaningful improvement in the short-term structure. A decisive break below $65,815 would strengthen the bearish case. For now, neither chasing a short nor rushing into a long looks particularly attractive. Waiting for confirmation makes more sense than trying to predict the next candle. The Real Test for Bitcoin Bitcoin has reached a point where the next reaction could reveal a lot about market confidence. Buyers need to show that they are willing to defend lower prices, while sellers will want to prove that every recovery remains an opportunity to sell. The important question isn't whether Bitcoin can bounce from here. It's whether that bounce can attract enough genuine demand to change the direction of the market. $BTCUSDT #ByXIMPACT

Injective (INJ): The Bounce Above $8 Looks Promising, But Buyers Still Have Something to Prove There is an interesting situation developing around Injective. After spending time under selling pressure, INJ has managed to recover towards $8.00, bringing some optimism back into the market. It is now trading around $8.02, up 7.78% over the past 24 hours. That is a respectable recovery, but one question remains: are buyers genuinely returning, or is this simply a temporary bounce after the recent decline? A recovery that isn't quite convincing yet Looking at the 15-minute chart, INJ has moved up from its recent low of $7.912. Buyers managed to push the price higher, but the recovery started losing momentum as it approached the $8.15 area. There is another detail worth watching. The three moving averages are sitting above the current price, with MA7 at $8.063, MA14 at $8.068 and MA28 at $8.089. In other words, INJ still has some work to do before the short-term trend starts looking healthier. For now, $8.09 is an important area to reclaim. A move above it could bring fresh buying interest, while another rejection may encourage short-term traders to take profits. Are buyers actually taking control? The encouraging part is that buyers managed to defend the $7.912 low and bring INJ back towards $8.00. However, one recovery is not enough to establish a lasting change in market sentiment. The volume information in the screenshot also doesn't provide enough evidence to confirm sustained accumulation. What matters now is whether buyers continue showing up when the price approaches resistance. If buying activity improves alongside a move above $8.09, the recovery would become more convincing. Without that participation, another rejection remains a realistic possibility.# Beyond the chart: Why Injective matters Injective is more than a speculative trading token. Its blockchain is designed for decentralized finance, with applications involving trading, derivatives and tokenized financial assets. The INJ token plays a role in staking, governance and the network's broader economic system. Its buyback-and-burn mechanism also connects ecosystem activity with token supply. These features give Injective a longer-term investment narrative, although actual adoption and network activity will ultimately matter more than announcements or market excitement. The levels traders should watch The $7.98–$8.02 region is the immediate area buyers need to defend, while $7.912 remains the more important visible support. On the upside, $8.063–$8.089 is the first hurdle. Beyond that, traders should watch $8.147, followed by $8.264 and the recent high of $8.382. A sustained move above $8.15 could create a better opportunity for bullish continuation. On the other hand, losing $7.912 would put the recovery under serious pressure. What happens from here? Personally, the most interesting part of INJ's current setup is not the 7.78% gain. It is whether the market can hold on to that recovery. Buyers have already shown they can push the price higher. Now they need to show they can defend those gains. $INJUSDT #ByXIMPACT
HYPE/USDT: Buyers Had Their Moment, but Can They Hold the Recovery? Hyperliquid's recent price action raises an interesting question: are buyers genuinely interested in pushing HYPE higher, or did the market simply run out of sellers for a while? Looking at the supplied 15-minute Bybit chart, HYPE is trading around $72.64, up 1.34%. Earlier, the token climbed from roughly $71.21 to $75.308, but the rally eventually lost steam. Instead of continuing higher, price turned lower, giving back a noticeable portion of its gains. That rejection matters. It suggests that buyers were willing to chase higher prices, but not enough of them remained interested to sustain the move.# What the chart is telling us The short-term picture has weakened. HYPE is trading below its displayed moving averages: MA7 at $72.956, MA14 at $73.641 and MA28 at $73.443. These readings show that recent momentum has shifted in favour of sellers. The decline also came with several noticeable red-volume candles. That suggests increased selling activity, although it does not establish whether the pressure came from profit-taking, liquidations or larger holders reducing exposure. For now, the market appears to be searching for support rather than preparing for an obvious breakout.# There is more behind HYPE than its price Hyperliquid has built its reputation around fast, on-chain trading, particularly perpetual futures. Its ecosystem is also expanding through HyperEVM and permissionless markets introduced through HIP-3. This matters because HYPE has a connection to the economic activity of its ecosystem. Trading fees, staking and the Assistance Fund's token purchases all contribute to its broader value proposition. However, strong platform activity does not guarantee immediate appreciation in the token. Supply is another factor. Future token unlocks and emissions could create selling pressure, particularly when market sentiment weakens. Where traders could get caught off guard After a rally toward $75, some buyers may still be holding positions opened at higher prices. If the market struggles to recover, those traders could decide to exit near the next bounce. At the same time, aggressive short sellers may become vulnerable if HYPE suddenly reclaims resistance. This creates the possibility of sharp movements in either direction.# The levels worth watching | Level | Significance | | ------------ | ----------------- | | $71.21 | Important support | | $69.92 | Daily low | | $72.10–72.40 | Near-term demand | | $73.20–73.65 | Resistance | | $74.25 | Recovery hurdle | | $75.308 | Previous high | Potential long: Above $73.65 following a successful retest. Targets: $74.25, $74.80 and $75.30. Stop: $72.95. Potential short: Below $72.10 after a failed reclaim. Targets: $71.21, $70.50 and $69.92. Stop: $72.95. These are conditional scenarios, not confirmed trading signals. The decision ahead HYPE does not necessarily need another dramatic rally to improve its outlook. It needs buyers to demonstrate that they are willing to defend higher prices. A sustained move above $73.65 would be an encouraging first step. Losing $71.21, on the other hand, would make the recent recovery considerably harder to trust. For now, the most sensible approach is patience. The next meaningful move will tell us whether the recent decline was simply a pause in an otherwise healthy recovery or the beginning of a deeper correction. $HYPEUSDT #ByXIMPACT

Cardano (ADA): The Rally Is Fading, and Buyers Now Have Something to Prove Something interesting happened on Cardano's 15-minute chart. ADA managed to climb toward $0.1749, but the buying interest behind that move didn't last. Instead of building on the gains, the price turned lower, giving back much of the advance. The question now is whether this is simply a pause or the beginning of another leg down. At the time of the Bybit screenshot, ADA was trading around **$0.1697**, showing a 0.71% daily gain. The 24-hour range stood between $0.1660 and $0.1758. On the surface, the daily performance looks positive, but the shorter timeframe tells a different story. The rejection near $0.1749 is worth watching. After reaching that level, ADA struggled to move higher and eventually produced several consecutive red candles. The price also slipped below its short-term moving averages. MA7 was at $0.1723, MA14 at $0.1722 and MA28 at $0.1717. With all three sitting above the current price, buyers have some work to do before the short-term picture improves. Where buyers and sellers stand The recent decline suggests sellers are becoming more comfortable at higher prices. However, one rejection is not enough to conclude that a larger distribution phase is underway. Trading volume increased during the earlier upward move, but the market subsequently reversed. What matters now is whether buyers return around the recent low near $0.1693 or allow the price to move toward $0.1660. Without reliable order-book depth, exchange-flow and derivatives data, it would be premature to claim that large investors are accumulating or that leveraged traders are being liquidated. Cardano's bigger picture There is more to ADA than its short-term price action. Cardano is a proof-of-stake blockchain that supports smart contracts, decentralized applications and staking. ADA is used for transaction fees, staking and network governance. The project continues to develop its technology and governance system, but development alone does not guarantee stronger token demand. What ultimately matters is whether more users, developers and businesses find reasons to use the network. ADA also has a maximum supply of 45 billion tokens, making long-term demand and circulating supply important factors in its valuation. The levels worth watching The immediate support area sits around $0.1693, with $0.1660 representing the next important downside level. A break below these areas could expose ADA to further weakness. On the upside, $0.1717–$0.1734 is the first area buyers need to recover. A sustained move above $0.1758 would provide stronger evidence that the recent selling pressure is fading. Potential Long Setup. - Entry: $0.1717–$0.1734 after a confirmed reclaim and retest. - Confirmation: Strong buying volume and improving momentum. - TP1: $0.1758 - TP2: $0.1782 - TP3: $0.1824 - Stop Loss: $0.1689 Potential Short Setup. - Entry: $0.1717–$0.1734 following a clear rejection. - Confirmation: Bearish candle close and continued selling pressure. - TP1: $0.1689 - TP2: $0.1660 - TP3: $0.1636 - Stop Loss: $0.1758 These are conditional scenarios based on the available chart, not confirmed trading signals. What happens from here? ADA is approaching a point where its next move could reveal much about market sentiment. Buyers need to show that they are willing to defend lower prices and push the market back above resistance. Sellers, meanwhile, will want to keep every recovery limited. $ADAUSDT #ByXIMPACT

KOR Protocol: Buyers Have Pushed the Price Higher, but the Real Test Is Still Ahead A Strong Bounce Doesn't Always Mean a Trend Has Changed KOR Protocol has given traders something to talk about after climbing 27.30% in 24 hours. At the time of the supplied Bybit screenshot, the token was trading around $0.000401. That's a considerable recovery, but looking beyond the percentage gain reveals a market that still has some convincing to do. The price previously reached $0.000504 before sellers stepped in and dragged it down to approximately $0.000386. Buyers managed to bring it back, but they haven't yet shown that they can sustain the recovery. That's the part worth watching.# The Chart Tells a More Complicated Story One detail stands out: KOR is trading below all three moving averages shown on the 15-minute chart. MA7 is at $0.000413, MA14 at $0.000415 and MA28 at $0.000424. In simple terms, the recent recovery hasn't been strong enough to reclaim these short-term trend levels. Until that changes, sellers still have a reason to remain confident. The area between $0.000413 and $0.000424 is therefore important. A move above it, supported by convincing trading activity, would improve the picture. A rejection there could bring the recent lows back into focus.# Are Buyers Strong Enough to Absorb Selling Pressure? This is where things get interesting. After reaching $0.000504, KOR experienced a noticeable pullback. Some holders may simply be taking profits, while others could be using the recovery to exit positions they have been holding at a loss. The question is whether fresh buyers are willing to take the other side of those sales. The available chart shows trading activity, but it doesn't provide enough evidence to confirm large-scale accumulation or distribution. Calling this a confirmed buying opportunity would therefore be premature. There Is More to KOR Than Its Price KOR Protocol is focused on bringing blockchain infrastructure into the creative industry, particularly intellectual-property ownership, licensing and payments. Its ecosystem includes products such as Korus, Pacer and Streamline. The broader idea is to give creators better ways to manage and monetize their work. That is an interesting direction, but the long-term value of the token will depend on whether people actually use these products and whether that activity creates meaningful demand for KOR. Its maximum supply of 10 billion tokens is another factor investors should keep in mind, particularly as additional tokens enter circulation. What Traders Might Be Thinking A 27% recovery can easily bring hesitant traders back into the market. Nobody wants to miss a sudden rally. But there's another side to that excitement. Traders who bought earlier may see the bounce as their chance to sell without taking such a large loss. This creates a situation where buying interest and selling pressure can increase at the same time.# The Levels Worth Watching - $0.000386: Immediate support. - $0.000313: Major downside reference. - $0.000413–$0.000424: First resistance zone. - $0.000431–$0.000459: Further recovery territory. - $0.000504: Previous swing high and major resistance. Potential Long: A convincing 15-minute close above $0.000424, followed by a successful retest, could offer an opportunity to target $0.000459 and eventually $0.000504. A protective stop should be placed below the confirmed retest low. Potential Short: If KOR loses $0.000386 and fails to reclaim it, traders could watch for a move toward $0.000313. Risk should be controlled above the failed recovery structure. Neither setup is confirmed yet. RSI, MACD and live order-book information are also needed for stronger confirmation. The Bigger Question KOR has recovered a meaningful portion of its recent losses, but the market hasn't answered the most important question: are buyers genuinely interested in holding these higher prices, or are they simply taking advantage of a temporary bounce? For now, $0.000424 is an important level to watch. A rally gets attention when it starts. It earns credibility when buyers are still there after sellers have had their say. $KORUSDT #ByXIMPACT

Solana (SOL/USDT): The Rally Is Losing Steam Near $82.38. Are Buyers Ready for Another Push? Solana has made a decent recovery, but there's something interesting about the way price is behaving now. Buyers managed to lift SOL from the $78 area, yet the moment it approached $82.38, selling pressure started to appear. That raises a simple question: are buyers strong enough to push higher, or are some traders already taking their profits? At the time of the supplied chart, SOL was trading around $81.33, up 0.31%. The recovery looks encouraging, but the latest candles suggest the market is not ready to give buyers an easy ride.# What the chart is telling us Looking at the 15-minute timeframe, SOL has gradually recovered from its earlier low near $78.05. The price moved higher, spent some time consolidating and eventually produced a stronger upward candle. One detail worth watching is the position of the moving averages. MA7 sits at $81.13, MA14 at $80.87 and MA28 at $80.45. All three are below the current price, which gives the short-term structure a bullish appearance. Volume also increased noticeably during the push toward $82.38. That's encouraging, although the rejection that followed suggests some traders were happy to sell into that strength. We don't have RSI, MACD or verified Fibonacci readings in the supplied chart, so it would be misleading to pretend those indicators confirm the move.# Are buyers actually taking control? This is where things get interesting. A sharp green candle can attract attention, but what happens afterward usually tells us much more. If buyers genuinely want higher prices, they need to keep defending the area around $80.45–$80.87 and eventually challenge $82.38 again. Repeated rejection near the same resistance, however, could indicate that sellers are comfortable supplying SOL at those levels. There is another factor worth considering: leveraged traders. Liquidations and changes in futures positioning can produce sudden price movements without creating lasting spot demand. A short-covering rally can look impressive, but it doesn't necessarily mean long-term buyers have entered.# Solana's bigger picture Beyond the chart, Solana has several reasons to remain on investors' radar. Its network supports decentralized finance, payments, tokenized assets and high-speed trading applications. SOL is also used for transaction fees and staking, giving the token a practical role within the ecosystem. Network development and growing real-world asset activity could strengthen its long-term appeal, although ecosystem growth does not guarantee immediate appreciation in SOL's price. The levels traders should watch The immediate question is whether SOL can turn resistance into support. Immediate support: $80.45–$80.87 Major support: $79.13 Critical lower support: $78.05–$77.92 Immediate resistance: $82.38 Potential upside area: $83.35–$83.48 Potential Long Setup: A sustained 15-minute close above $82.38, followed by a successful retest, would offer a stronger bullish case. Entry and targets should be established from the confirmed breakout structure rather than guessed in advance. Potential Short Setup: A rejection near $82.38 followed by a decisive break below $79.13 could create a bearish opportunity. A failed recovery toward that level would provide additional confirmation. Neither setup is confirmed yet. What happens from here? For now, Solana is caught between improving short-term momentum and resistance that buyers haven't managed to overcome. The bulls have done enough to bring the price back into contention, but they still have something to prove. Sellers, meanwhile, have an opportunity to turn the $82.38 rejection into a deeper pullback. The next meaningful move will depend less on how impressive the last green candle looked and more on whether buyers are willing to step in when prices stop moving in their favor. A rally is easy to celebrate. Holding on to those gains is where real market strength begins. $SOLUSDT #ByXIMPACT

AVAX/USDT: Buyers Are Back, But Can They Push Beyond $8.45? AVAX has made an interesting comeback. After slipping toward $7.998, buyers gradually stepped in and pushed the price higher. But something deserves attention here: the closer Avalanche gets to $8.45, the more important it becomes to see whether buyers are genuinely willing to keep pushing or simply taking advantage of a temporary pause in selling. At the time of the screenshot, AVAX was trading around $8.443, showing a 0.29% gain. Its 24-hour range stood between $7.998 and $8.459. On the 15-minute chart, the recovery looks encouraging, with higher lows forming and price gradually moving upward. The moving averages are also supporting the short-term trend. MA7 is at $8.420, MA14 at $8.406 and MA28 at $8.338. This tells us that recent momentum is leaning toward buyers. However, there is one detail worth watching: trading volume is relatively quiet at 2.56K, below its five-period average of 3.09K. Price is climbing, but participation has not yet shown the strength needed to make the breakout convincing. Where the Real Battle Begins The $8.45 region is now the level everyone should be watching. AVAX has approached this area, but getting above it and staying there are two different things. Buyers need stronger volume and a solid candle close above resistance to show that demand is actually increasing. On the other side, $8.40–$8.42 is the first support area. If sellers push price below it, attention could shift toward $8.33–$8.34, followed by $8.22. The previous low of $7.998 remains an important downside reference. Beyond the Charts Avalanche has more going on than short-term price movements. Its blockchain supports smart contracts, decentralized applications and customizable networks. Its growing involvement in institutional tokenization also gives the ecosystem a longer-term growth story. Still, adoption alone does not guarantee higher AVAX prices. Real network activity and demand for the token matter just as much. What Comes Next? If buyers manage to break $8.459 with convincing volume and hold it on a retest, the recovery could gain another leg. But if price repeatedly fails around this level and loses $8.40, sellers may get another opportunity to take control. For now, chasing the price just below resistance does not look particularly attractive. Waiting for confirmation makes more sense than trying to predict every move. One Thing Worth Remembering AVAX has already shown that buyers are interested. Now they need to prove they have the strength to do more than just recover. Because sometimes the hardest part of a rally isn't getting the price higher. It's convincing the market that the move deserves to continue. $AVAXUSDT #ByXIMPACT

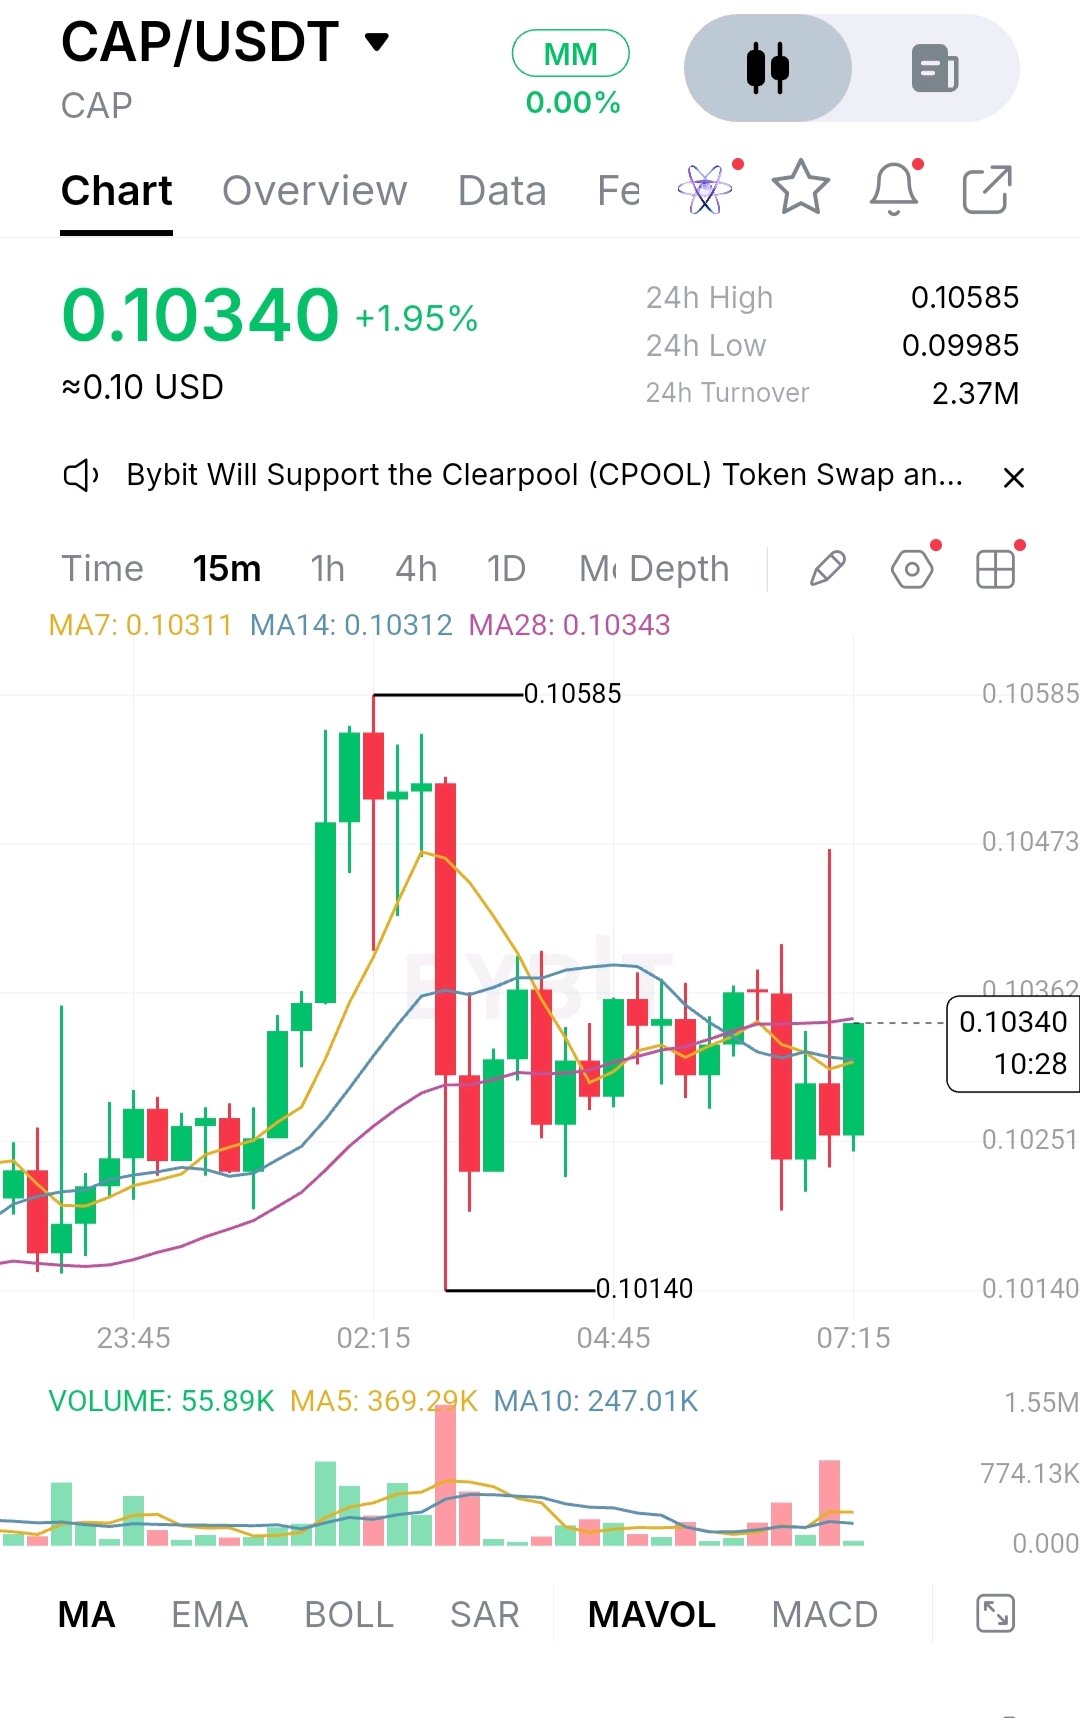
CAP/USDT – Is This Recovery Finally Gaining Strength? One thing caught my attention while looking at CAP's chart: buyers managed to bring the price back after a sharp drop, but they're still struggling to push it through the next resistance. So, is this the beginning of another move up, or just a temporary recovery? At the time of the screenshot, CAP was trading around $0.10340, up 1.95%.Earlier, the price reached $0.10585 before sellers stepped in and pushed it down toward $0.10140. Since then, buyers have been trying to regain control. They're making an effort, but the market hasn't given us a strong enough reason to call it a confirmed bullish reversal just yet. Here's what I'm watching closely. The short-term moving averages are sitting almost on top of each other: - MA7: $0.10311 - MA14: $0.10312 - MA28: $0.10343 This tells us that momentum is relatively undecided. Neither side has established clear control. Volume also needs attention. The latest displayed reading is 55.89K, considerably lower than the MA5 and MA10 volume averages. In other words, the current recovery could use more buying participation.# Where Could CAP Go From Here? I'm keeping my eyes on two important areas. On the upside: $0.10470 is the first level buyers need to overcome. If they manage to break above it with convincing volume, the previous high of $0.10585 could come back into play. On the downside:$0.10250 is an area worth watching, while $0.10140 is the more important short-term support. Losing that level could put $0.09985 back in focus. A Quick Look Beyond the Chart CAP is connected to a DeFi credit ecosystem focused on bringing institutional lending and decentralized capital together. That's an interesting direction, but the token's supply structure also matters. Around 1.56 billion CAP are circulating against a maximum supply of 10 billion, making future token releases an important consideration. My Take Personally, I wouldn't rush into a position here. If buyers reclaim $0.10470 with strong volume, the bullish case becomes more interesting. But if sellers push the price below $0.10140, the recovery could quickly lose its appeal. For now, CAP is sitting at a decision point. The real strength of a recovery isn't measured by how quickly a coin bounces. It's measured by whether buyers are willing to stand their ground when the selling starts again. That's exactly what CAP needs to prove next. Based on the supplied chart snapshot. Not financial advice. $CAPUSDT #ByXIMPACT
LAVA/USDT: A Nice Recovery, But Can Buyers Keep It Going? One thing I find interesting about LAVA right now is that the price has recovered, but buyers don't seem to be pushing with the same strength as before. After a decent upward move, the market has slowed down and started moving sideways. This makes me wonder whether buyers are taking a short break before another move or whether sellers are slowly gaining confidence. Looking at the Bybit chart, LAVA is trading around $0.01630, up 4.29%. During the last 24 hours, it reached $0.01676 and dropped as low as $0.01550. The 15-minute chart shows that buyers made a strong move from the lower price area. However, after reaching higher levels, the momentum started fading. Price is now moving around $0.01630, which tells me the market is still trying to find its direction. The moving averages are also worth watching. MA7 is at $0.01639, MA14 at $0.01635, and MA28 at $0.01629. Price has slipped below the two shorter averages, showing that the immediate buying pressure has cooled. Still, it is holding close to the longer average, so I wouldn't call this a complete breakdown. Volume tells another part of the story. There was noticeable activity during the initial jump, but trading became quieter afterward. Buyers have shown that they can move LAVA higher, but now they need to prove they can maintain that interest. There is also a real project behind the token. Lava Network focuses on decentralized blockchain data infrastructure, helping applications and developers access blockchain information through RPC providers. LAVA has roles in staking and network participation. However, the project's long-term value will depend on whether real usage and demand continue to grow. Here are the price levels I'm keeping an eye on: - Immediate support: $0.01629–$0.01635 - Stronger support: $0.01565–$0.01550 - Near resistance: $0.01648–$0.01650 - Major resistance: $0.01676 Personally, I wouldn't rush into a trade here. If LAVA breaks above $0.01650 with stronger volume and holds that level on a retest, the bullish case becomes more interesting. On the other hand, losing $0.01565 could put the recent recovery under pressure. For now, I'm watching rather than chasing the move. LAVA has shown some strength, but the next step needs confirmation. A green candle can attract attention, but holding higher prices is what really earns the market's confidence. $LAVAUSDT #ByXIMPACT