
KnoxCrypto
5227Like0Shares102Fans58Follow
Spot Trader & Comunty Builder
Spot Trader & Comunty Builder
$ZILUSDT DELIVERS ALL THREE TARGETS SUCCESSFULLY ACHIEVED! Another strong move from Zilliqa ($ZIL)! Price followed the expected direction, with TP1, TP2, and TP3 all reached successfully. ZILUSDT Perpetual Current Price: $0.001179 24H Change: -14.99% All three targets have been completed, marking another successful trading opportunity. Congratulations to everyone who followed the analysis and captured this move. More market opportunities ahead. Stay focused, manage risk, and keep watching the charts! #WSOT2026

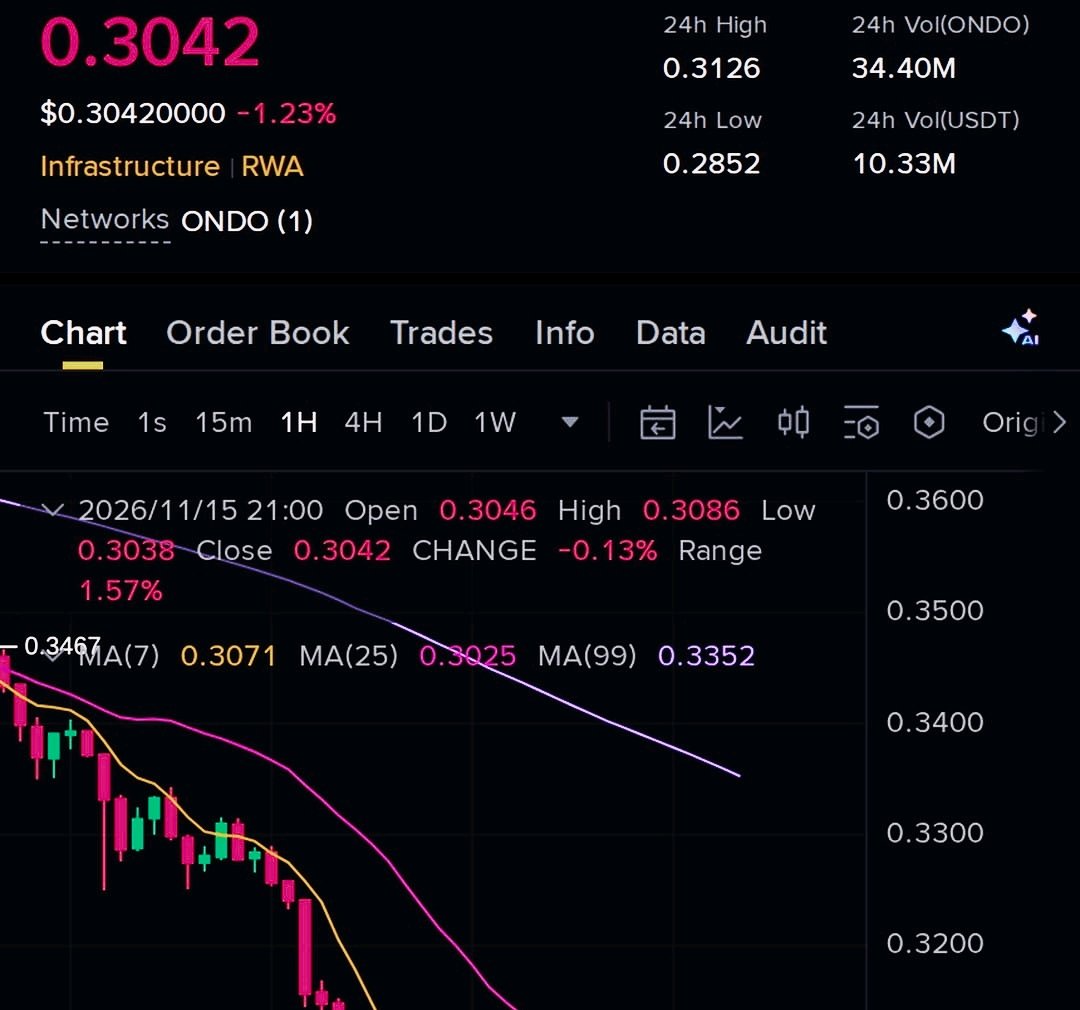
$ONDOUSDT FACES ANOTHER REJECTION SELLERS REMAIN IN CONTROL ONDO bounced toward a key resistance zone, but buyers failed to maintain upward momentum. Sellers quickly stepped in, suggesting that bearish pressure is still present and the recovery may be losing strength. The rejection around $0.3041–$0.3055 is an important area to watch. If price continues to struggle below this zone, further downside could develop. Key figures $0.3041–$0.3055 — Resistance and rejection zone $0.3122 — Level that would invalidate the bearish outlook $0.2941 — First downside support $0.2850 — Secondary support $0.2743 — Deeper downside level Bearish outlook: Continued rejection below resistance could keep sellers in control, with $0.2941 as the first important downside area. A breakdown could expose $0.2850 and potentially $0.2743. Bullish outlook: If ONDO reclaims resistance and establishes acceptance above $0.3055, bearish momentum could weaken. A move above $0.3122 would further challenge the current bearish structure. For now, ONDO remains under pressure, and the next reaction around resistance will be important. #WSOT2026

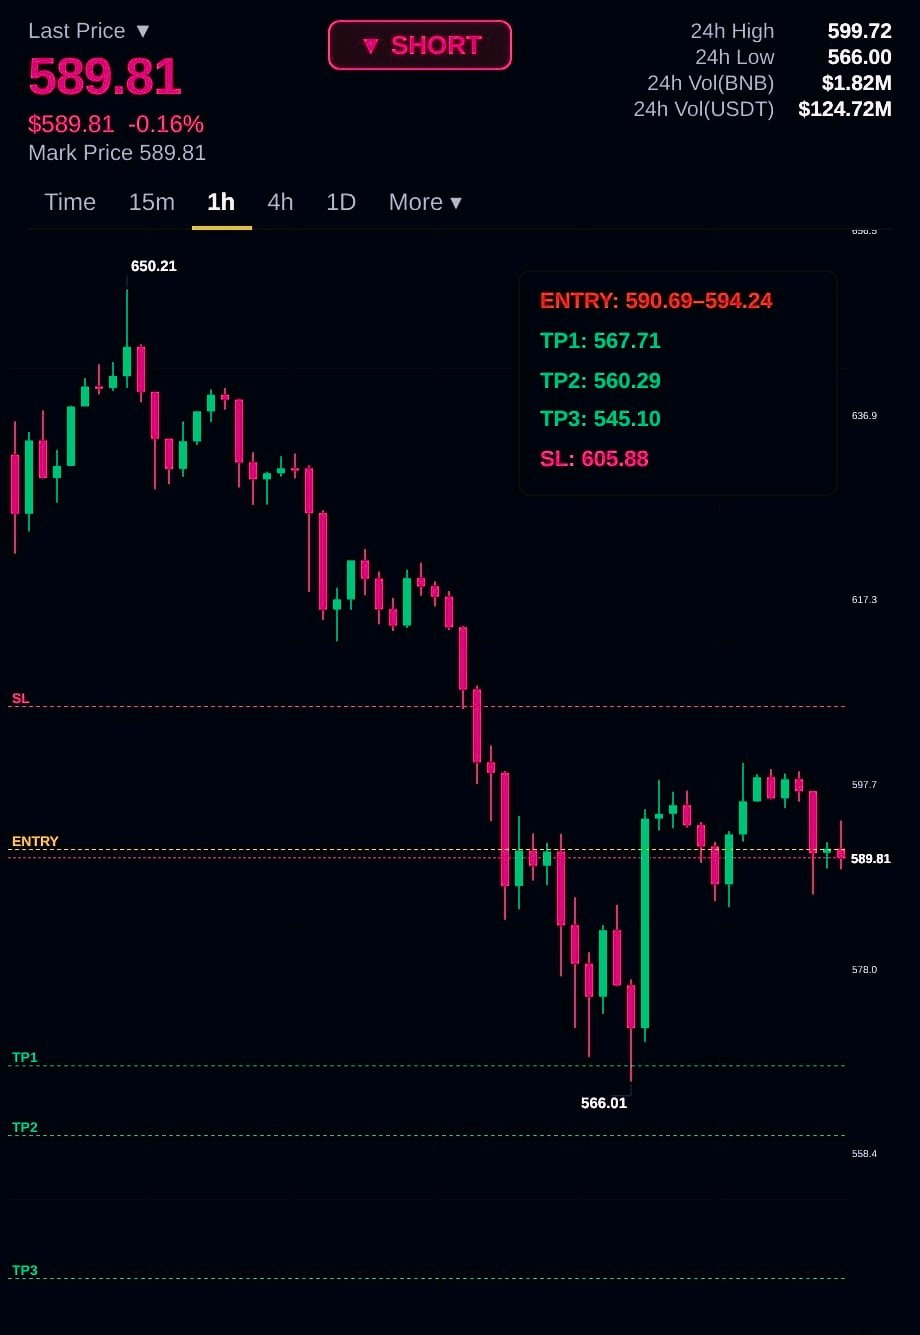
$BNBUSDT BEARS REMAIN IN CONTROL SELLING PRESSURE PERSISTS BNB is showing signs of weakness, with RSI currently around 43, indicating that bearish momentum remains stronger than buying pressure. The price is struggling to regain bullish strength, keeping the short-term outlook tilted toward the downside. Key figures $590.69–$594.24 — Entry zone $605.88 — Stop-loss level $567.71 — First downside target $560.29 — Second downside target $545.10 — Extended downside target Market outlook As long as BNB remains below the $594.24 region, sellers may continue to dominate. A rejection from this area could increase the possibility of further downside movement. However, a sustained recovery above $594.24 would weaken the bearish structure, while a move above $605.88 would invalidate this short-term bearish outlook. RSI: 43 — Momentum currently favors sellers, but further confirmation is important. Stay disciplined and manage risk carefully. #WSOT2026
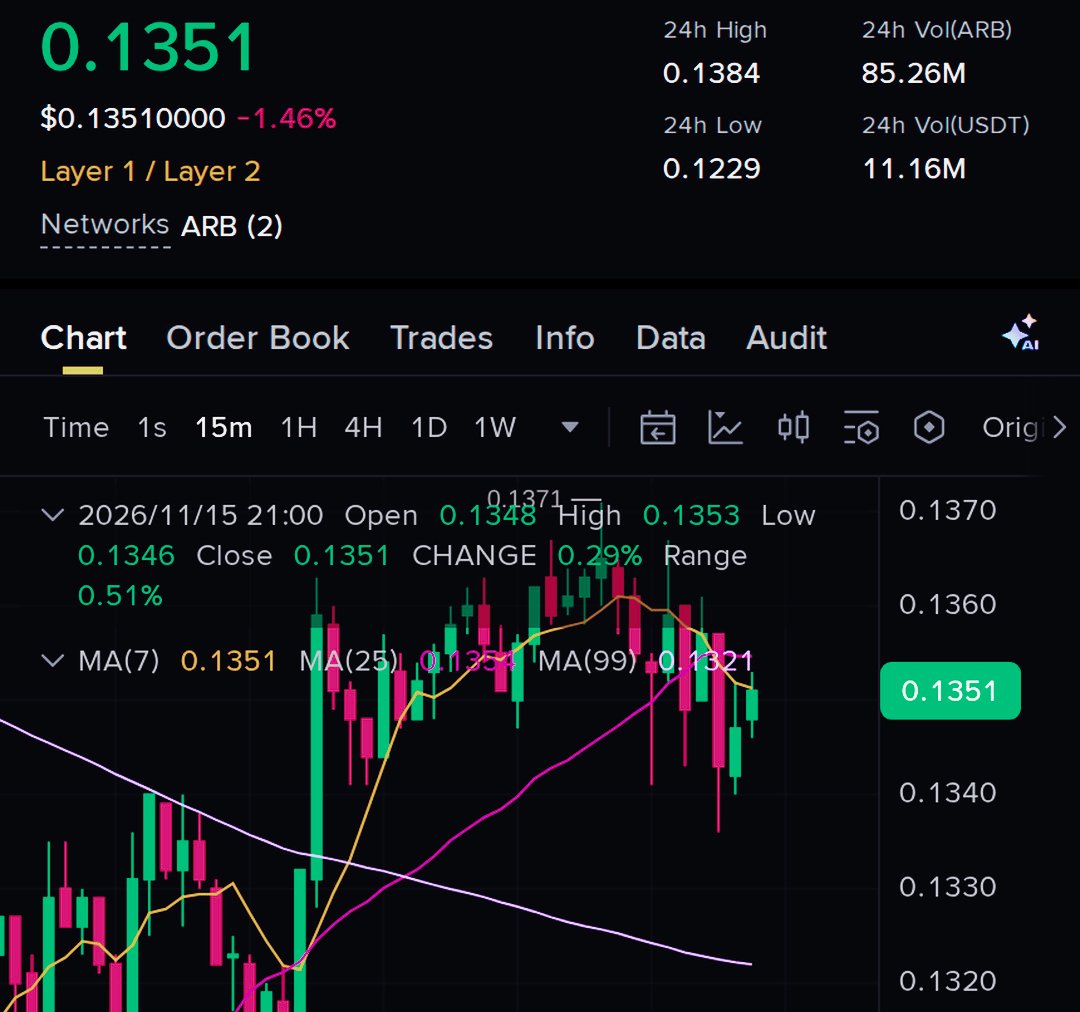
$ARBUSDT SHOWS RESILIENCE BUYERS ATTEMPTING TO REGAIN CONTROL. Arbitrum (ARB) is showing encouraging signs of strength after managing to hold its recent dip better than expected. Despite the broader market uncertainty, buyers are defending the current price region, suggesting that selling pressure may be gradually losing momentum. The reaction around $0.1348–$0.1352 is particularly important. Price stability in this area could help establish a short-term recovery structure, especially if buyers continue stepping in and prevent another breakdown. However, ARB still needs stronger buying volume to confirm that this bounce has enough momentum to develop into a sustained upward move. Key figures $0.1348–$0.1352 — Important demand zone where buyers are attempting to defend the price. $0.1382 — First resistance level and initial recovery checkpoint. $0.1406 — Next upside area if bullish momentum continues. $0.1449 — Higher resistance target in an extended recovery. $0.1328 — Critical support and invalidation level for the current bullish structure. Bullish scenario If ARB continues holding above the $0.1348 region, buyers could gradually push the price toward $0.1382. A successful move above this level would improve the short-term structure and potentially create room for a further recovery toward $0.1406. If buying pressure strengthens and volume supports the breakout, the $0.1449 region could become the next important area to watch. Bearish scenario The recovery remains vulnerable if buyers fail to defend the current demand zone. A sustained move below $0.1348 would indicate weakening demand and could bring additional selling pressure. Losing the $0.1328 support would invalidate the current bullish outlook and suggest that sellers have regained control of the short-term trend. Market outlook ARB is showing better resilience around its recent lows, which is an encouraging development for buyers. However, holding support is only the first step. The real confirmation will come from a sustained recovery above $0.1382, followed by stronger acceptance around $0.1406. For now, the key is whether buyers can turn this defensive price action into genuine upward momentum. #WSOT2026

$UNIUSDT FACES ANOTHER REJECTION SELLING PRESSURE RETURNS. Uniswap (UNI) is struggling to maintain its recovery as sellers step in again near an important resistance zone. The recent bounce has brought price back into an area where bearish pressure is becoming visible, suggesting that buyers are still having difficulty establishing control. The rejection around $5.12–$5.148 deserves attention. If UNI continues failing to hold above this region, the recovery could lose momentum and open the door for another downside move. However, confirmation from price action remains important before expecting a deeper correction. Key figures $5.12–$5.148 — Immediate resistance and rejection zone. $4.972 — First downside level to watch. $4.849 — Secondary support if sellers maintain control. $4.679 — Deeper downside area in case of extended weakness. $5.241 — Invalidation level for the bearish setup. Bearish scenario If UNI remains below the resistance zone, sellers could continue controlling the short-term structure. A breakdown below $4.972 may increase downside pressure toward $4.849. Further weakness across the broader crypto market could expose the $4.679 region. Bullish scenario On the other hand, a strong recovery above $5.148 could challenge the bearish outlook. If buyers manage to reclaim resistance and hold above it, selling pressure may gradually weaken. A move toward $5.241 would be an important signal that the current bearish structure is losing strength. Market outlook UNI is showing hesitation after its latest recovery attempt, with resistance continuing to attract sellers. The next move will depend on whether buyers can reclaim the $5.14 area or sellers manage to push price toward lower support. Stay focused on confirmation and manage risk carefully rather than reacting to every short-term move. #WSOT2026

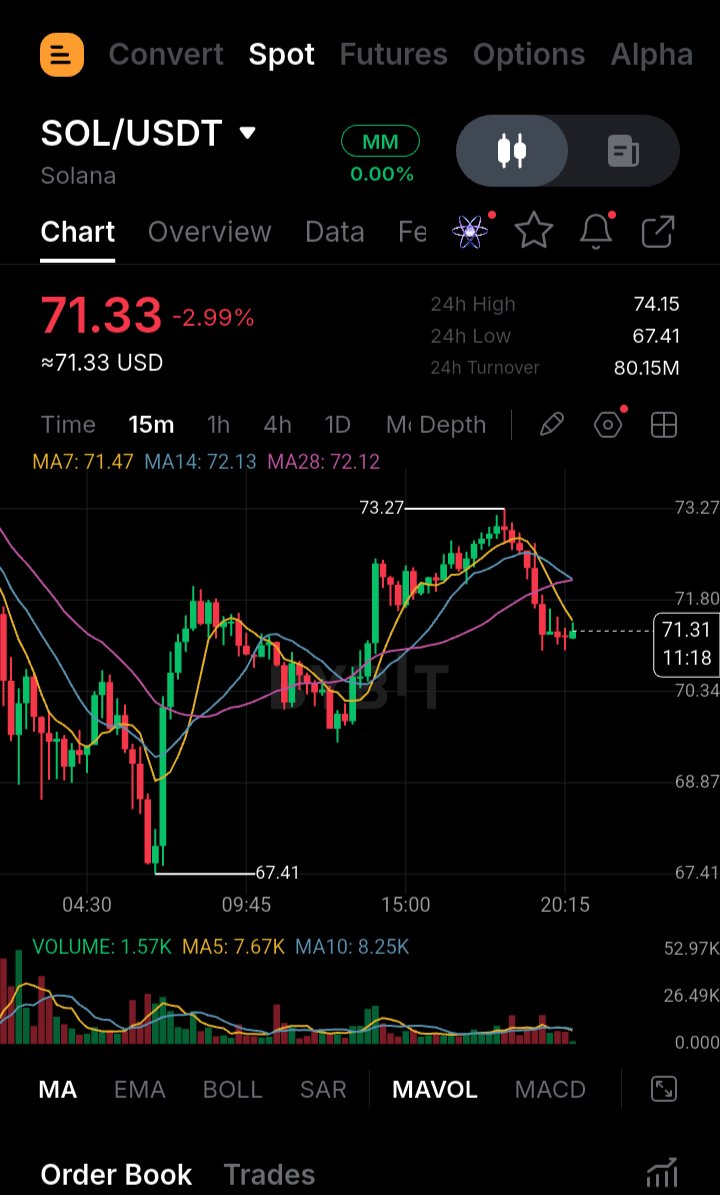
$SOLUSDT FACES SELLING PRESSURE BEARS WATCHING FOR A DEEPER CORRECTION Solana is showing signs of weakness after struggling to maintain upward momentum near a key resistance area. Buyers have attempted to push the price higher, but selling pressure is becoming more noticeable, suggesting that the recovery may be losing strength. The current structure favors a cautious bearish outlook, especially if SOL continues to face rejection around the 71.30 region. A failure to reclaim this area could give sellers another opportunity to push the price toward lower support levels. Key figures $71.14–$71.30 — Important resistance and entry zone. $69.09 — First downside level to monitor. $67.30 — Secondary support if selling pressure increases. $65.52 — Deeper downside level in an extended correction. $73.39 — Invalidation level for the bearish structure. Bearish scenario If SOL fails to break above the resistance zone and continues forming lower highs, sellers could regain control. A sustained move below $69.09 would strengthen downside momentum and potentially expose the $67.30 region. If market-wide weakness continues, the $65.52 area could also come into focus. Bullish scenario However, if buyers manage to reclaim $71.30 and establish acceptance above resistance, the bearish outlook could weaken. A recovery toward $73.39 would invalidate the current downside structure and suggest that buyers are regaining control. Market outlook SOL remains under pressure near resistance, but confirmation is important before assuming another major decline. Watch the reaction around $71.14–$71.30 and how price behaves near the first support. Leverage mentioned: 24x. Risk management remains essential in volatile market conditions. #WSOT2026

$2.05B IN CRYPTO POSITIONS WIPED OUT AS LONGS FACE MASSIVE PRESSURE The crypto market has experienced a major liquidation wave over the past 24 hours, affecting 329,339 traders. Long traders absorbed most of the damage, accounting for approximately $1.922 billion (93%) of total liquidations. The largest individual wipeout was a $16.17 million ETH position on Binance. Meanwhile, ETH is trading around $1,831.38, down 3.21%. Is this massive sell-off clearing excessive leverage before a potential market rebound, or could further downside still be ahead? The next move could reveal whether buyers are ready to step back in or sellers remain in control.$ETHUSDT $NEARUSDT #WSOT2026

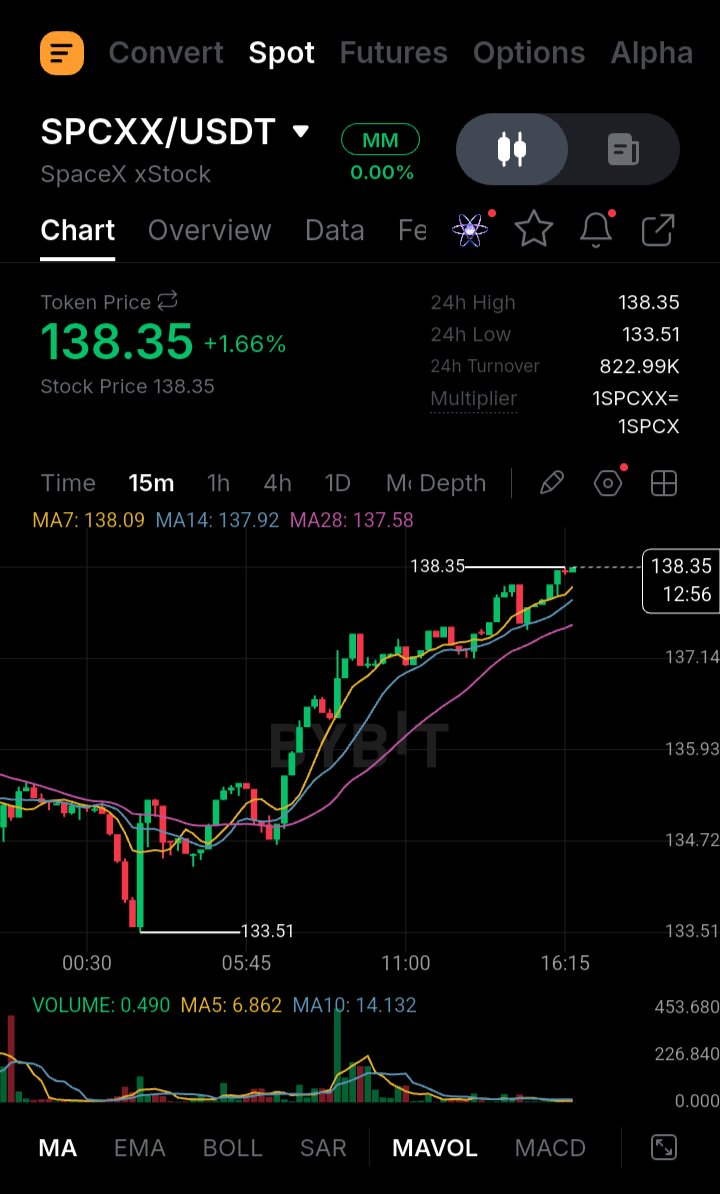
$SPCXXUSDT RECOVERY MOMENTUM BUILDING CAN BUYERS PUSH TOWARD $148.50? SPCX is showing encouraging signs of recovery after buyers stepped in around the $133.00 support region and prevented further downside. Price has climbed from $133.55 to $138.33, indicating that buying interest is gradually returning after the recent correction. The latest rebound suggests that sellers are losing some control, but bulls still need to overcome nearby resistance before a stronger upward move can develop. The $139.40 level is particularly important because a decisive breakout above this area could attract additional buying pressure and strengthen the recovery structure. Key figures $138.33 — Current price area $133.00–$133.55 — Major support zone $139.40 — Immediate resistance and breakout level $142.70 — Next upside objective $148.50 — Extended recovery level Bullish Scenario If SPCX continues holding above $133.00, buyers may have an opportunity to extend the current recovery. A sustained move above $139.40 would be an important confirmation of improving momentum and could open the way toward $142.70. If bullish pressure remains strong beyond that level, the next area to watch would be $148.50. Reaching this zone would indicate a more substantial recovery rather than just a temporary bounce. Bearish Scenario On the downside, failure to break above $139.40 could lead to another period of consolidation or a short-term pullback. Losing the $133.00 support zone would weaken the recovery structure and suggest that sellers are regaining control. Market Outlook SPCX is showing early signs of renewed buying interest, but confirmation is still needed. The reaction around $139.40 will be important in determining whether this recovery can develop into a stronger rally. Can SPCX bulls secure a breakout above $139.40 and push toward $142.70, or will sellers interrupt the recovery? #WSOT2026

$ADAUSDT SHOWS RECOVERY STRENGTH AFTER RECLAIMING $0.1539 BUYERS TRY TO REGAIN CONTROL Cardano is showing renewed buying interest after recovering from the $0.1430 support area and pushing back above the important $0.1539 level. This recovery suggests that buyers are attempting to regain control after the recent downside pressure. The latest price movement is encouraging, but the bigger question is whether ADA can maintain its position above the reclaimed level and attract enough buying volume to extend the recovery. The $0.1539 area is now an important level to monitor. If buyers successfully defend it during upcoming pullbacks, it could gradually become a stronger support zone rather than acting as previous resistance. However, a brief move above resistance is not enough to confirm a sustained trend reversal. Consistent buying activity and stronger volume will be important. Key figures $0.1430 — Previous support and recent recovery base $0.1539 — Important reclaimed price level $0.1539–$0.1548 — Current breakout and retest area $0.1580 — First major upside resistance $0.1600 — Psychological resistance and important market level $0.1630 — Higher resistance and potential recovery objective $0.1500 — Important downside level to monitor Bullish market scenario: If ADA continues holding above $0.1539, buyers could maintain the recovery structure and attempt another move toward $0.1580. A convincing breakout above this resistance, supported by stronger volume, would improve the short-term outlook and potentially open the way toward $0.1600. If buying pressure remains consistent beyond $0.1600, the next important area to watch would be $0.1630. A successful move above these resistance levels could indicate that market sentiment is gradually shifting in favor of buyers. Bearish market scenario: On the other hand, failure to maintain $0.1539 could weaken the current recovery. If sellers push ADA back below this level and buyers fail to reclaim it, the market may experience another pullback. A move toward $0.1500 would become important to monitor, as losing this area could increase downside pressure and bring the previous $0.1430 support zone back into focus. Overall market structure: ADA is showing early signs of recovery, but the market still needs stronger confirmation before calling this a sustained bullish reversal. The most important factor now is whether buyers can turn $0.1539 into reliable support. Trading volume, Bitcoin's overall direction, and ADA's reaction around nearby resistance levels will help determine whether this recovery has enough strength to continue or whether sellers will regain control. For now, $0.1539 remains the level that deserves the closest attention. #WSOT2026

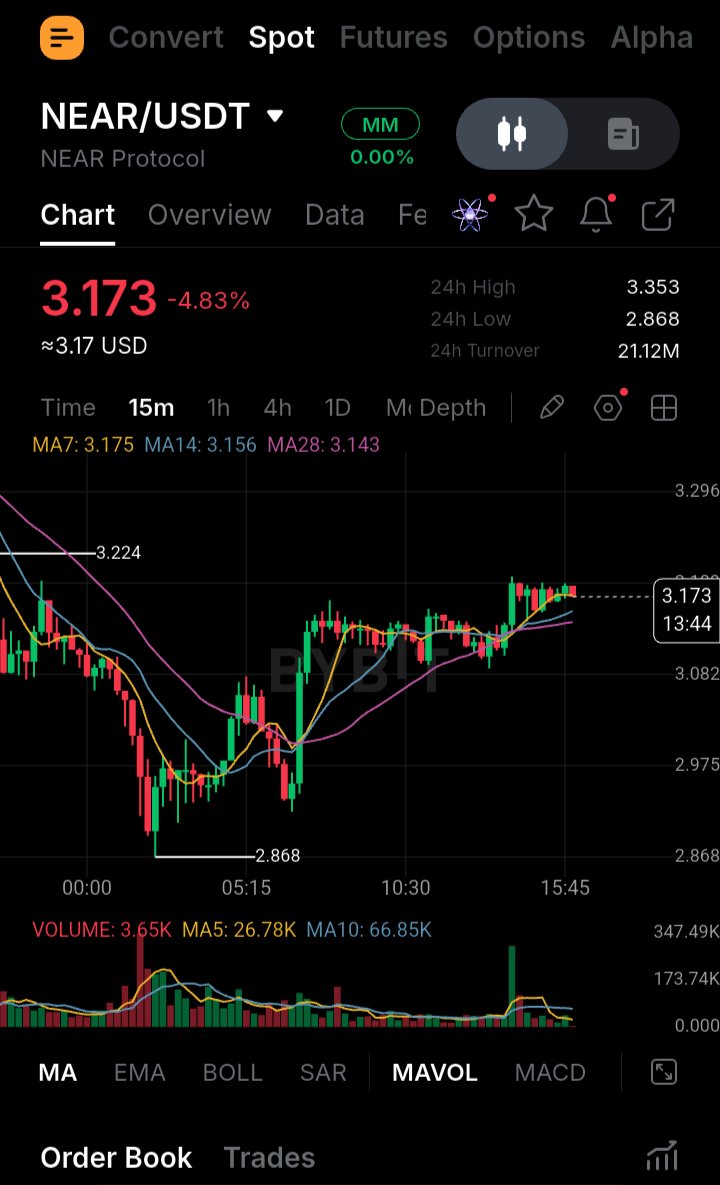
$NEARUSDT BULLISH MOMENTUM: BUYERS DEFEND $3.087 SUPPORT AS RECOVERY CONTINUES NEAR is showing signs of renewed buying interest after bouncing from the $3.0870 support zone. Price is currently trading around $3.183, indicating that buyers are attempting to maintain control and extend the recovery. The key area to watch is $3.130–$3.087. As long as buyers continue defending this zone, the bullish structure remains intact. A strong breakout above $3.198, supported by increasing trading volume, could provide further momentum for an upward move. Key figures $3.183 — Current market price $3.130–$3.087 — Major support and demand zone $3.198 — Important breakout resistance $3.220 — First upside target $3.300 — Secondary resistance $3.400 — Major upside objective $3.050 — Critical downside invalidation level Bullish scenario: If NEAR holds above the support zone and successfully breaks through $3.198 with strong volume, buyers could push the price toward $3.220. Continued momentum may open the way toward $3.300, with $3.400 becoming the next major upside objective. Bearish scenario: However, losing the $3.087 support could weaken the recovery and bring sellers back into control. A deeper move below $3.050 would invalidate the current bullish setup and suggest further downside risk. Market outlook: NEAR is showing encouraging recovery signals, but confirmation is still important. Watch the $3.198 breakout level, support strength, trading volume, and Bitcoin's direction before drawing conclusions. The next move will depend on whether buyers can turn this recovery into a sustained bullish continuation. #WSOT2026
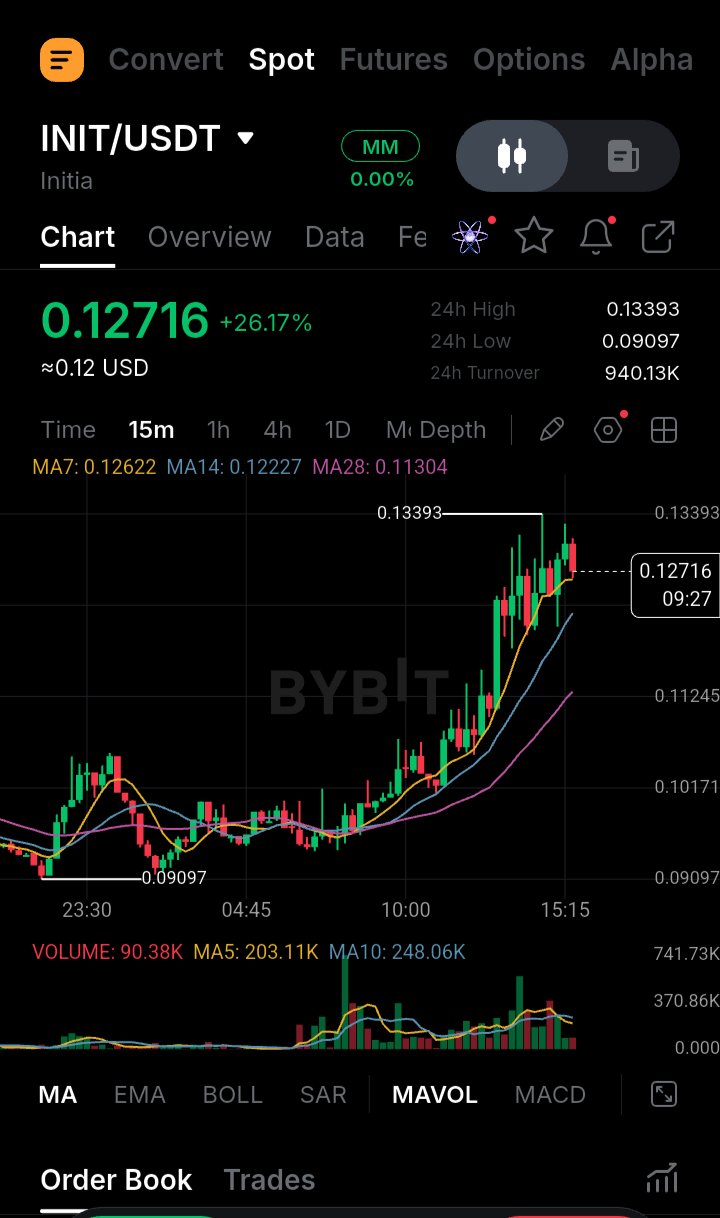
$INITUSDT SHOWS STRENGTH AFTER 32% RALLY CAN BUYERS PUSH TOWARD $0.15? INIT is showing encouraging bullish momentum following its recent 32% surge. Buyers are attempting to maintain control, with the $0.1320 area becoming an important level to watch. As long as price stays above this zone, the recovery structure remains constructive. A move above $0.1397 could attract additional buying interest and create room for a continuation toward $0.1450 and potentially $0.1520. Key figures $0.1320–$0.1340 — Important support and price-holding zone. $0.1397 — Key resistance and bullish breakout level. $0.1450 — Next upside area. $0.1520 — Higher resistance target. Bullish Scenario: Holding above $0.1320 and breaking through $0.1397 could strengthen upward momentum and support a move toward $0.1450–$0.1520. Bearish Scenario: Losing $0.1320 could weaken the recovery structure, while a drop below $0.1270 would put the bullish outlook under further pressure. Market Outlook remains worth watching, but confirmation above resistance is important before assuming the rally has more room to run. #WSOT2026

Tom Lee sees the crypto crash as temporary, believing current market pressures won't derail the bigger supercycle. Is he right, or is more downside coming? $NVDA


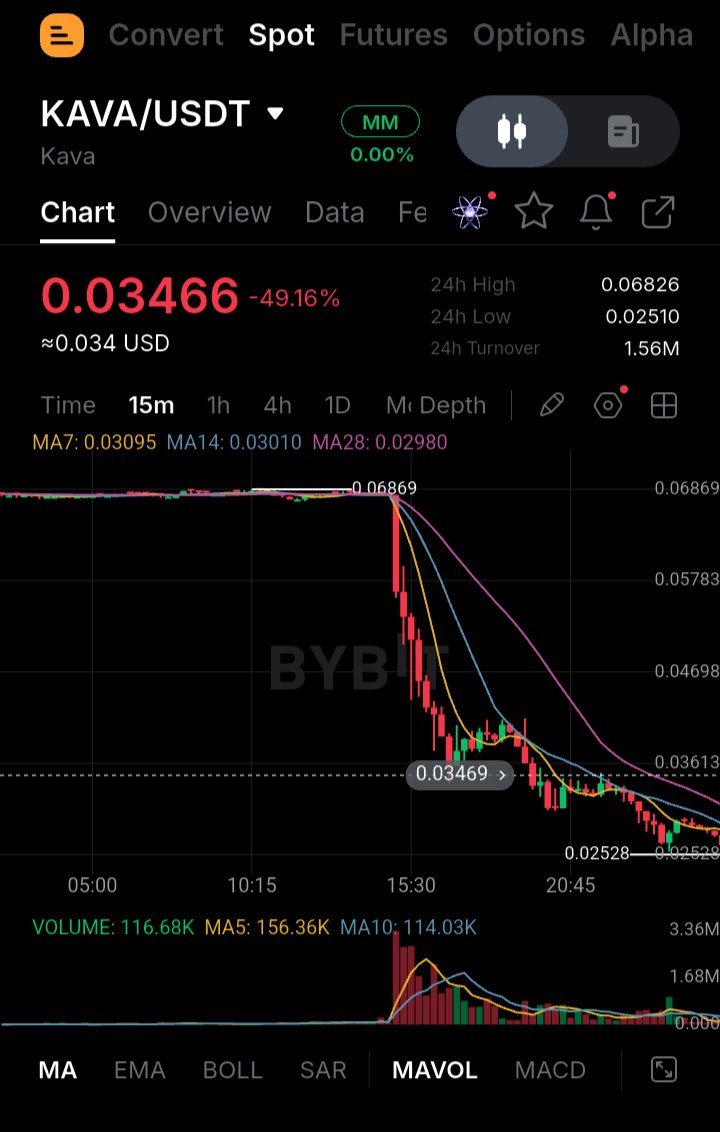
$KAVAUSDT SHOWING EARLY RECOVERY SIGNS $0.043 BACK IN FOCUS? has experienced a significant decline of more than 52%, but recent price action suggests that buyers are starting to defend the $0.025 support area. The rebound toward $0.03234 indicates that selling pressure may be easing, although a confirmed trend reversal is still needed. Key figures $0.03234 — Current price area $0.02500 — Major support zone to watch $0.03700 — First important resistance $0.04300 — Next upside level if recovery continues Bullish scenario: If KAVA continues holding above $0.025, buyers could gradually regain control. A sustained move above $0.03234 would strengthen the recovery outlook, with $0.037 and eventually $0.043 becoming important resistance areas. Bearish scenario: Despite the recent bounce, the broader market structure remains weak. If buyers fail to maintain momentum and KAVA loses the $0.025 support, renewed selling pressure could push the price toward lower levels. For now, the $0.025 zone remains the most important level to monitor. The next move will depend on whether buyers can turn this relief bounce into a stronger recovery. Is $KAVA preparing for a genuine comeback, or are we simply seeing a temporary relief rally?

Tom Lee Sees the Recent Crypto Sell-Off as a Temporary Setback, Not the End of the Bull Cycle. Tom Lee believes the latest pressure across crypto markets is being driven by several external factors rather than a breakdown in the long-term market outlook. He points to Nvidia-related margin calls, investors reducing exposure ahead of the anticipated Anthropic IPO, the release of previously frozen hack-related funds, growing concerns around AI disruption, and increased US scrutiny of chip exports. Despite these challenges, Lee remains confident that the broader crypto supercycle is still intact. In his view, the current weakness is part of a temporary phase, and these market pressures could fade with time. But what do you think? Is this simply a short-term correction before the next major crypto rally, or could the market face more downside before recovering? #WSOT2026 $NAVXUSDT $ETHUSDT


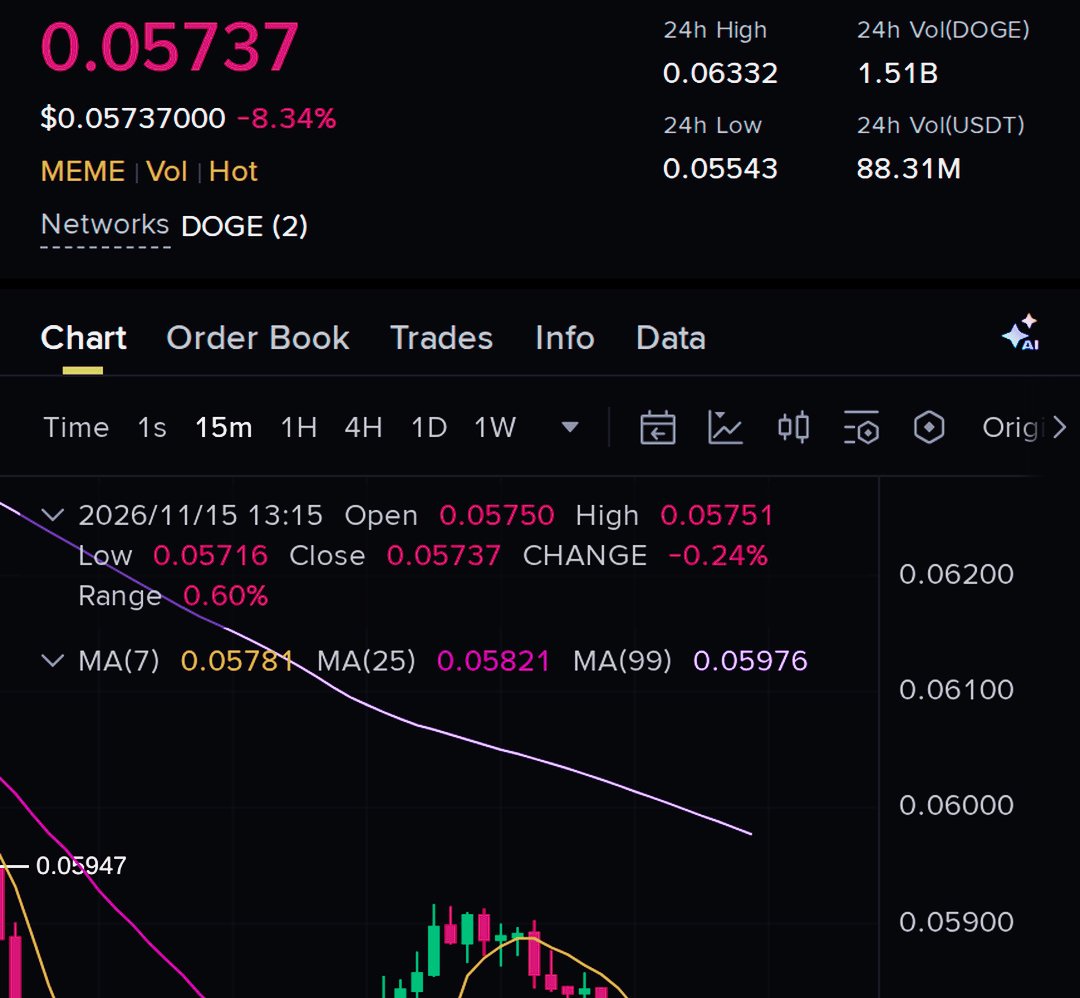
$DOGEUSDT BEARISH MOMENTUM REMAINS IN FOCUS Dogecoin is still struggling to regain its previous support area, suggesting that buyers have not yet shown enough strength to reverse the current short-term weakness. Every unsuccessful recovery attempt keeps selling pressure relevant, while the inability to establish a stronger position above the previous support zone gives sellers an advantage. The important factor here is how DOGE reacts around its current price region. If buyers continue failing to defend this area, another downward move could develop. However, a sudden recovery and strong buying volume could challenge the bearish structure. Key figures Entry Zone: 0.05735–0.05747 — Area being monitored for potential bearish continuation. TP1: 0.05569 — First downside reference. TP2: 0.05425 — Next important downside level. TP3: 0.05282 — Deeper downside target if selling pressure accelerates. Stop Loss: 0.05867 — Level that would invalidate this setup. Leverage: 40x — High-risk leveraged position. Bearish Scenario If DOGE continues trading below its recovery zone and sellers maintain control, the price could gradually move toward 0.05569. A decisive break below this level may expose the next support around 0.05425. If broader market weakness continues, 0.05282 could become another important area to watch. Bullish Scenario On the other hand, if DOGE manages to reclaim its lost support and sustain buying pressure, the bearish outlook could start weakening. A move toward 0.05867 would invalidate the current setup and indicate that buyers are regaining control. Market Outlook For now, the short side remains the focus because DOGE has not demonstrated a convincing recovery. However, 40x leverage carries significant liquidation risk, so position sizing and risk management are especially important. #WSOT2026

Bitcoin Whales Are Accumulating While Smaller Players Reduce Exposure$BTCUSDT $DOGEUSDT Despite Bitcoin's sharp 24% correction, large holders appear to be taking a different approach. Data from CryptoQuant shows that wallets holding more than 1,000 BTC added approximately 47,000 BTC during the market downturn. On the other side, mid-sized investors have been reducing their holdings, while overall Bitcoin demand has weakened to its lowest point since April 2025. This creates an interesting market dynamic: major holders are increasing their exposure while broader demand remains under pressure. The key question now is whether whale accumulation can eventually outweigh selling pressure and support Bitcoin's next recovery phase. #WSOT2026

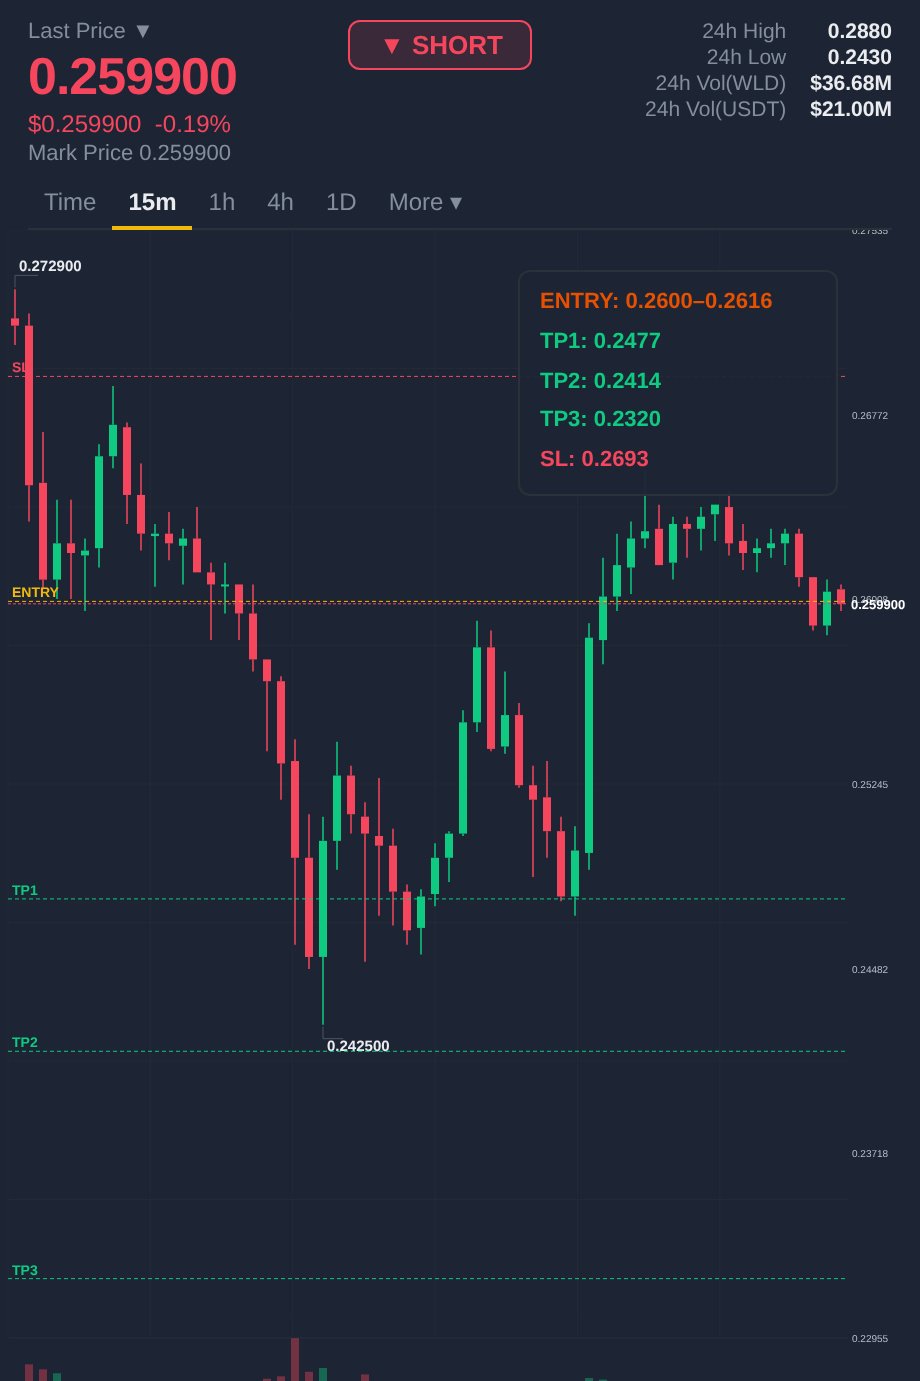
$WLDUSDT is showing signs of a potential bearish reversal after facing rejection near resistance. Momentum needs close attention, especially as RSI has cooled down to 42. Negative funding at -0.044% also highlights unusual positioning in the derivatives market. If sellers maintain pressure, WLD could revisit lower support zones. Key figures $0.2600–$0.2616 — Resistance and rejection zone $0.2693 — Important invalidation level $0.2477 — First downside support $0.2414 — Secondary support $0.2320 — Major downside level Market outlook A sustained rejection below resistance could strengthen bearish momentum and increase the possibility of further downside. However, a move above $0.2693 would weaken the bearish outlook. Watch price action and volume for confirmation before drawing conclusions. #WSOT2026

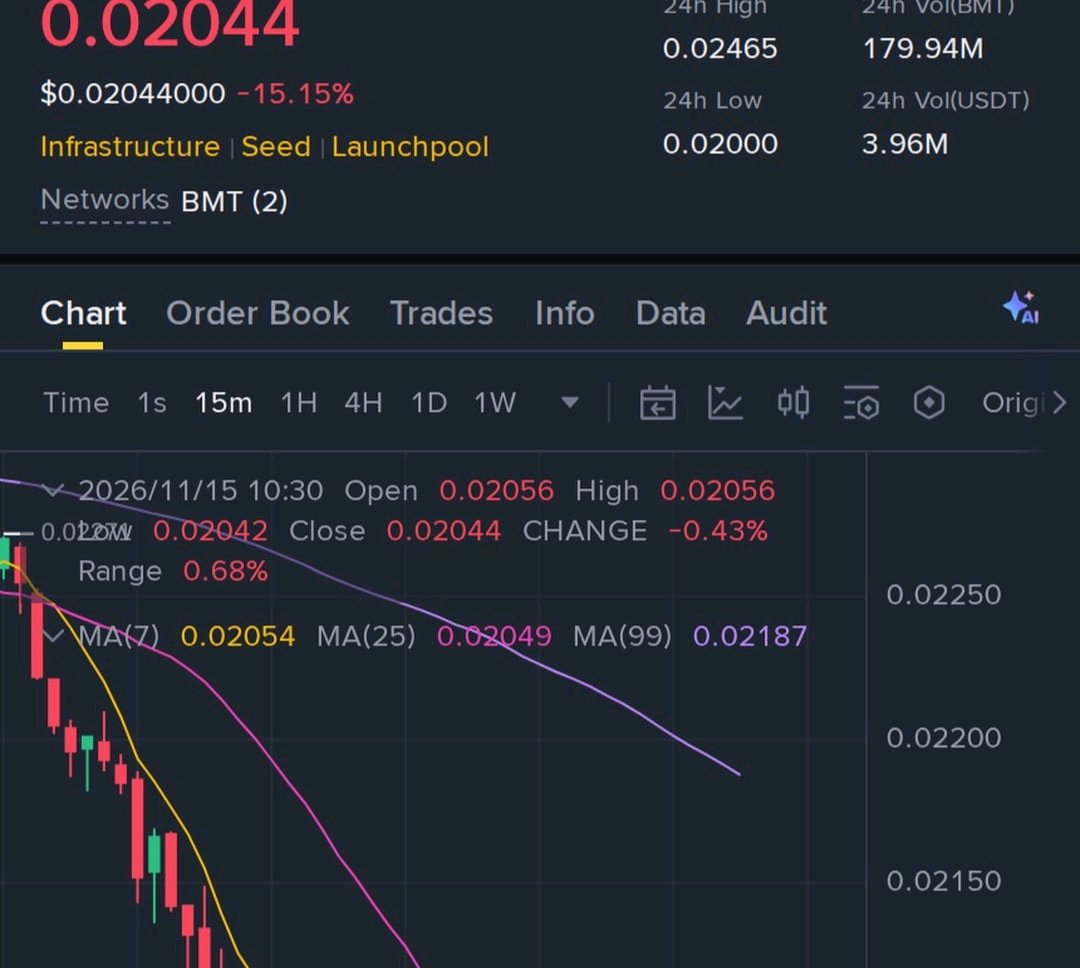
$BMTUSDT is showing potential signs of a bullish recovery, and buyers could step in if the price manages to hold its nearby support zone. After recent price movements, a successful bounce could open the door for another upward move. Keeping this long setup on watch with approximately 46x leverage. Entry Zone: 0.02038–0.02045 Key figures - 0.01980 — First upside target - 0.01929 — Second upside target - 0.01878 — Third upside target - 0.02088 — Risk level A strong bounce from the current area could support a recovery, but confirmation from buying volume is important before expecting further upside. #WSOT2026
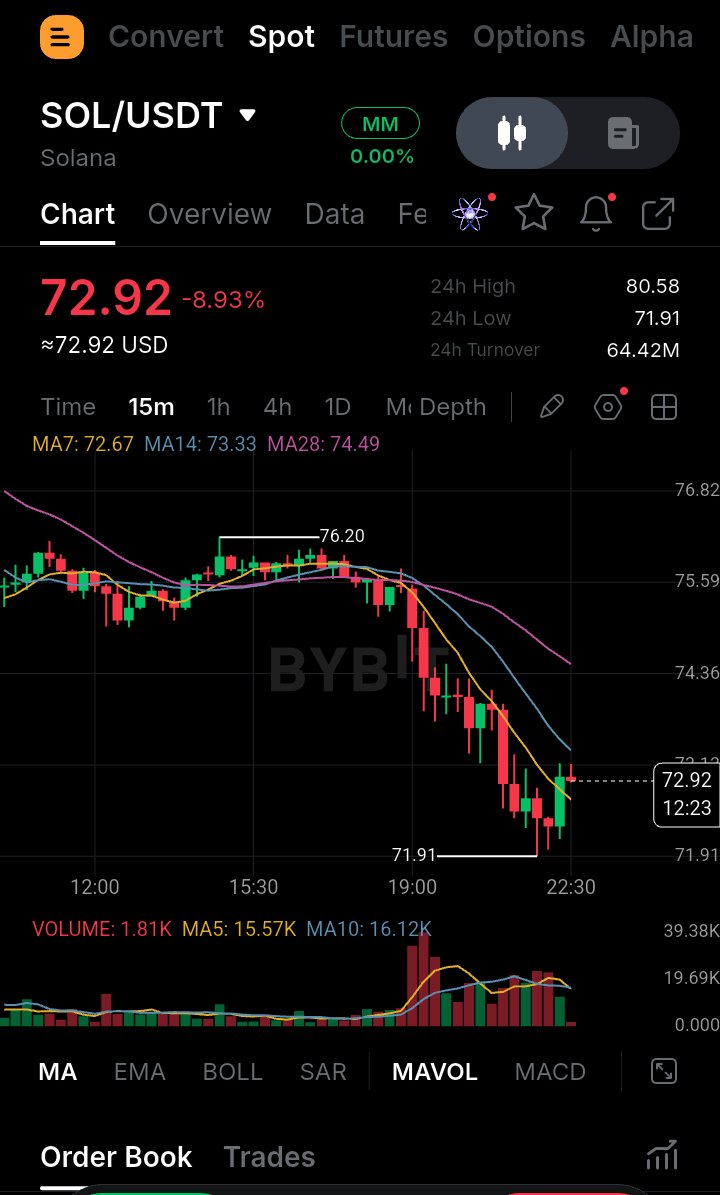
$SOLUSDT Market Analysis: Bears Are Testing Lower Support Solana is showing continued bearish pressure as sellers attempt to push the price below its recent support structure. With SOL trading around $72.96, the market remains vulnerable to further downside if buyers fail to defend the current region. Key figures $76.50 — Upper resistance area $73.50 — Important short-term price zone $72.96 — Current reference price $71.80 — First downside support $70.00 — Psychological support level $68.50 — Next potential support $66.00 — Deeper downside area Bearish Scenario If SOL fails to reclaim the $73.50–$76.50 region, selling pressure could remain dominant. A sustained move below $71.80 may expose the $70.00 and $68.50 support zones, while continued weakness could bring $66.00 into focus. Bullish Scenario On the other hand, a strong recovery above $76.50 could weaken the bearish structure. A move toward $80.50 would be an important sign that buyers are regaining control. For now, SOL remains under selling pressure, and traders should watch how price reacts around nearby support before drawing conclusions. #WSOT2026

$HYPEUSDT Shows Bullish Potential as Buyers Defend Key Support HYPE is attracting attention as buyers attempt to defend the current support zone on the 1H timeframe. The RSI is around 30, indicating oversold conditions and the possibility of a short-term recovery. Funding is currently at +0.002%, while price action suggests buyers are stepping in around the $65.80–$66.20 region. However, sustained buying pressure will be important to confirm a stronger upward move. Key figures - $65.80–$66.20 — Important support and reaction zone - $63.81 — Critical downside level - $68.16 — First upside resistance - $68.50 — Next resistance area - $69.80 — Higher recovery target - RSI: 30 — Oversold territory - Funding Rate: +0.002% Bullish Scenario If HYPE continues holding support and buying volume increases, a recovery toward $68.16 and $68.50 could develop. A sustained move above these levels may open the way toward $69.80. Bearish Scenario If buyers fail to defend the current zone, selling pressure could push price lower. A break below $63.81 would weaken the bullish recovery outlook. HYPE is at an important technical area, and the next reaction from buyers could determine its short-term direction. #WSOT2026