Bit_Space77
83Like0Shares22Fans47Follow
$BTC Since Day Zero •|• #Bybit KOL & CMC & Web3 Growth 📈💹 Content Creator 💫
$BTC Since Day Zero •|• #Bybit KOL & CMC & Web3 Growth 📈💹 Content Creator 💫
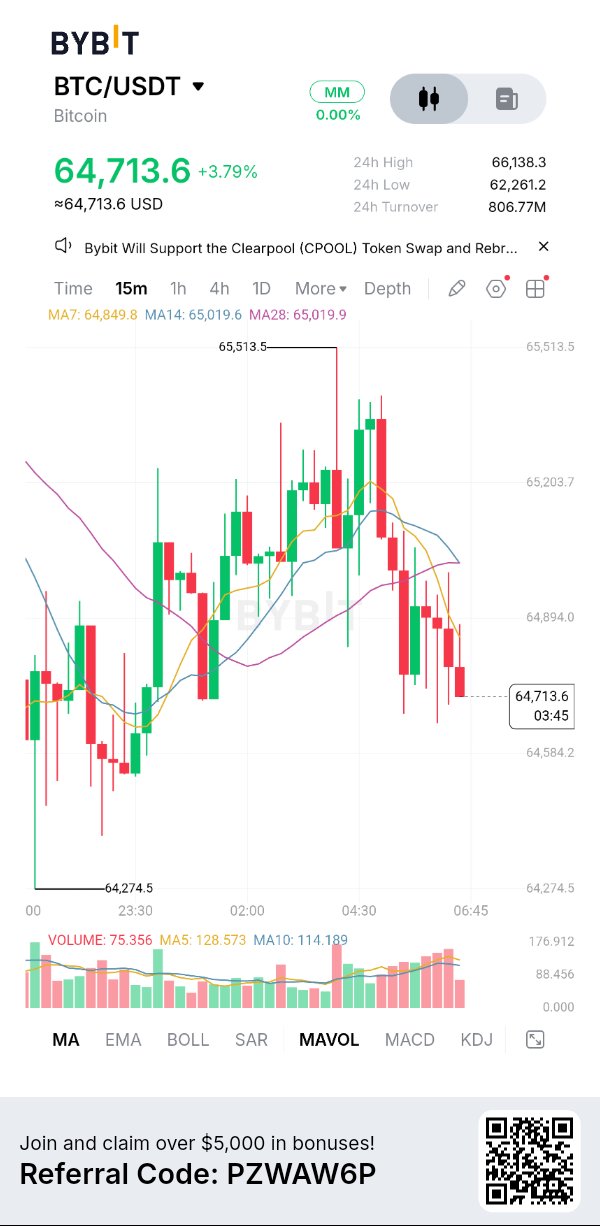
Bitcoin is showing a serious battle between exhausted sellers and buyers desperately searching for a floor. After suffering a massive correction from the $87,000 region, BTC is now hovering around $65,000, and the broader daily structure remains heavily damaged. What makes this situation particularly interesting is that the market is approaching a critical demand region where the next reaction could determine whether Bitcoin stabilizes or extends its correction even further. Looking closely at the daily chart, Bitcoin is trading significantly below its major moving averages. The EMA50 is around $77,131, while the EMA200 is near $77,735 on the reference daily analysis. This leaves a substantial resistance structure overhead, confirming that the broader trend remains under pressure. The RSI is sitting around 24, deeply inside oversold territory. Meanwhile, the daily MACD histogram remains negative, showing that bearish momentum is still a major concern. However, I would not ignore the possibility of a temporary relief rally after such an aggressive decline. Here is what I am watching closely: 📉 Critical Support Zone: Bitcoin is approaching the $62,830–$62,180 region. This is an important support area where buyers need to demonstrate meaningful strength. A decisive daily close below this zone could expose BTC to another wave of downside pressure. 🎯 Downside Targets: If the current support fails, the next levels I am watching are $60,350 and $58,720. A sustained breakdown below these areas would indicate that the corrective structure is extending further. 📈 Recovery Scenario: On the upside, Bitcoin first needs to reclaim $66,937. Above that, the $68,565 region becomes the next important resistance. A convincing move beyond $70,000 would provide stronger evidence that buyers are beginning to regain control. Momentum & Market Structure The most important thing right now is understanding the difference between an oversold market and a confirmed reversal. RSI near 24 tells us that selling pressure has been extremely aggressive, but it does not guarantee that the bottom is already in. Bitcoin can remain oversold while sellers continue controlling the trend. I want to see a meaningful change in market structure, stronger buying volume, and a confirmed higher low before considering a bullish shift. Trading Strategy & Risk Management I am not interested in chasing Bitcoin with a fresh short position after such an extended decline. Selling directly into major support without confirmation can expose traders to an aggressive relief bounce. My focus is on two possible scenarios. If BTC bounces toward the $66,937–$68,565 resistance region and sellers produce a clear rejection, a potential lower-high short setup could develop. I would require a confirmed entry, a stop-loss above the resulting swing high, and a worthwhile risk-to-reward ratio. On the other hand, if buyers successfully defend the $62,180 support region, establish a higher low, and reclaim nearby resistance, a short-term recovery opportunity could emerge. A sustained daily breakdown below $62,180 would invalidate the immediate recovery scenario. Conversely, a strong reclaim above $68,565 would weaken the bearish continuation thesis and bring the $70,000 region into focus. Bitcoin is at a critical technical decision point. The market has already experienced substantial damage, but the next move still needs confirmation. I would rather miss the first part of a recovery than enter blindly and risk unnecessary losses. Respect the trend, protect your capital, and let price action reveal the next opportunity. $BTCUSDT #ByXIMPACT
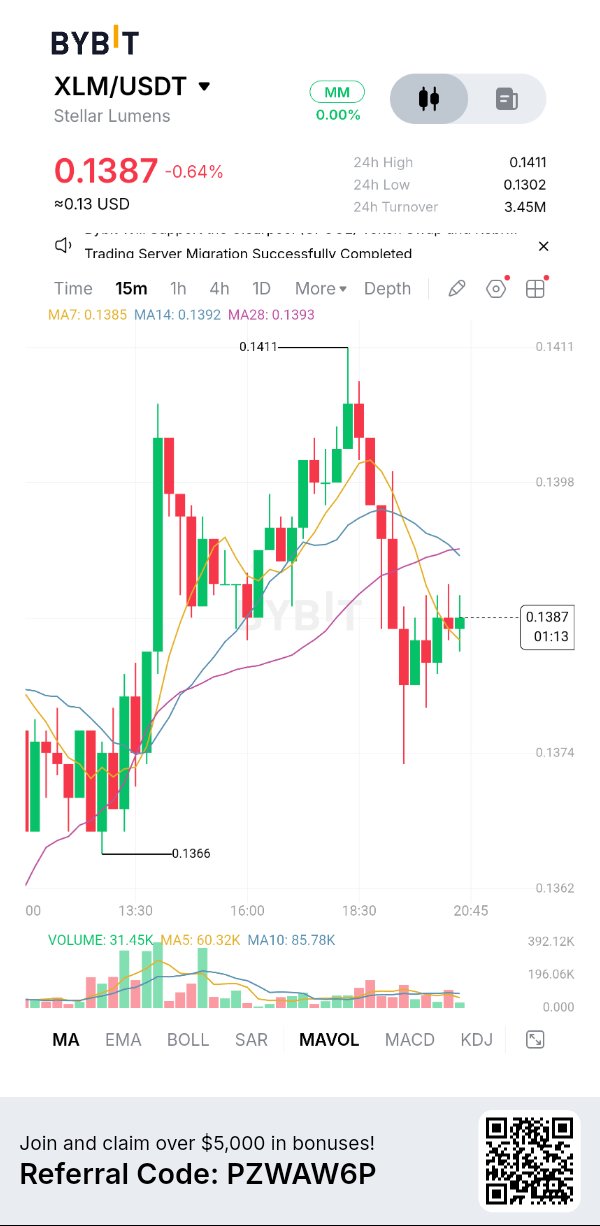
Stellar is showing serious technical weakness, and the current price action suggests that sellers are still controlling the broader market structure. After struggling to maintain its previous bullish momentum, XLM has slipped into a deeper corrective phase, with price trading around the $0.138–$0.140 region. What makes this situation particularly interesting is that the market is approaching an important support area where buyers will need to demonstrate real strength to prevent another leg lower. Looking at the daily chart, XLM is trading significantly below its 20-day and 50-day moving averages, which are approximately $0.1555 and $0.1793 respectively. This positioning confirms that the recovery structure remains damaged. The daily RSI is sitting around 26–28, placing Stellar close to oversold territory. Meanwhile, MACD remains bearish, indicating that downside momentum has not yet produced a convincing reversal. Here is what I am watching closely: 📉 Critical Support Zone: The $0.1325–$0.1283 region is the first important demand area. If sellers manage to break below this zone with strong momentum, the market could experience another wave of downside pressure. 🎯 Downside Targets: A confirmed breakdown below $0.1283 would bring $0.1215 into focus. If that level also fails to attract buyers, the deeper $0.1147 region becomes another potential downside target. 📈 Recovery Scenario: On the upside, XLM first needs to reclaim the $0.1425 resistance. A stronger move above $0.1442 would provide an early indication that buyers are attempting to regain control. However, the bigger challenge remains the $0.1555–$0.1611 region, where stronger resistance could emerge. Momentum & Market Structure One important detail I don't want traders to overlook is the RSI approaching oversold territory. This condition can create opportunities for a relief bounce, but it does not automatically confirm that the market has reached its bottom. The broader trend remains under pressure, and I want to see a meaningful improvement in buying volume, a higher low, and a confirmed break above resistance before considering a bullish shift. Trading Strategy & Risk Management I am not interested in blindly buying XLM simply because it has experienced a significant decline. First, I want to see whether buyers can defend the $0.1283 demand area and establish a stronger recovery structure. On the bearish side, a weak relief rally followed by a rejection around the $0.1425–$0.1442 resistance zone could create another potential short opportunity. However, I would wait for a confirmed lower high, a clear entry, and a stop-loss above the resulting swing high. A decisive daily breakdown below $0.1283 would invalidate the immediate recovery scenario and expose the deeper support levels. Conversely, a sustained reclaim of $0.1611 would significantly weaken the current bearish outlook and suggest that buyers are finally making progress. Stellar is approaching an important technical decision point. The next meaningful move could come from either side, but I don't want to predict a reversal before the chart confirms it. For now, patience is my strategy. I am watching the support reaction, respecting the market structure, and prioritizing capital protection over chasing an uncertain move. Let XLM show its next direction before making the decision. $XLMUSDT #ByXIMPACT
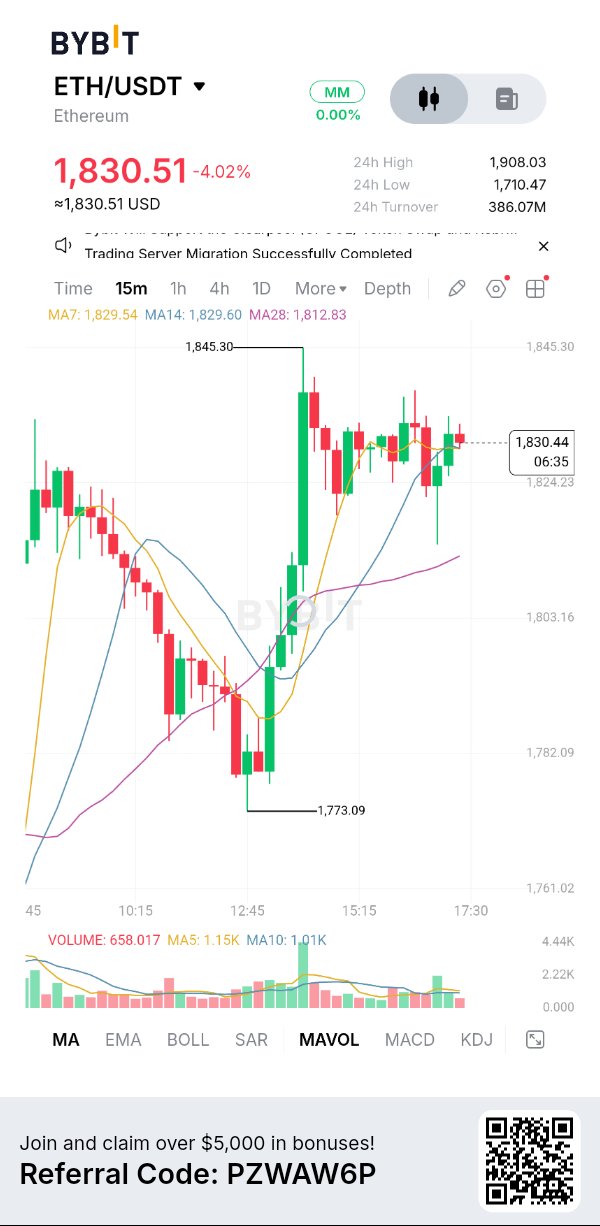
Ethereum is going through an extremely difficult phase, and the current market structure is sending a serious warning to traders. After losing significant ground from its previous highs, ETH is struggling to establish a convincing recovery, with sellers continuing to dominate the broader trend. What makes this situation particularly important is that price is now approaching a major support region where the next reaction could determine whether this correction extends further or buyers finally step in to defend the market. Looking at the daily chart, Ethereum is trading around the $1,800–$1,840 region as of November 15. Price remains significantly below its major moving averages, with the 50-day average near $2,398 and the 200-day average around $2,146. This positioning reflects substantial technical damage and leaves the broader trend under pressure. The daily RSI is hovering around 20–25, indicating deeply oversold conditions. Meanwhile, MACD remains below its signal line, showing that bearish momentum has not yet produced a convincing reversal. 📉 Critical Support Zone: The $1,730 region is the first important support I am watching. If sellers manage to secure a decisive daily close below this level, Ethereum could face another wave of selling pressure. 🎯 Downside Targets: A confirmed breakdown could expose the $1,687 support, followed by $1,604. If market weakness accelerates beyond those levels, the deeper $1,587 region becomes another important area to monitor. 📈 Recovery Scenario: On the upside, ETH needs to reclaim $1,840 first. A convincing move above $1,894 would provide a stronger signal that buyers are returning. Beyond that, the $2,019 region becomes the next major resistance before the broader moving-average structure comes back into focus. Momentum & Market Structure One thing I do not want to ignore is the extremely oversold RSI. Conditions like this can create powerful relief rallies, but oversold does not automatically mean the bottom is in. In a strong bearish environment, price can remain under pressure even when momentum indicators appear exhausted. The important question is whether buyers can convert this temporary selling exhaustion into a genuine structural recovery. I want to see stronger volume, a higher low, and a convincing reclaim of resistance before changing my overall outlook. Trading Strategy & Risk Management I am not interested in opening a long position simply because ETH has experienced a massive decline. First, I want to see buyers defend the $1,730 demand area and demonstrate enough strength to reclaim the $1,840–$1,894 resistance region. On the bearish side, a weak relief rally followed by a clear rejection could create another potential short opportunity. However, I would wait for a confirmed lower high, a defined entry, and a stop-loss above the resulting swing high rather than chasing an already extended red candle. A sustained breakdown below $1,687 would seriously weaken the recovery scenario and expose the deeper $1,604 support. Conversely, a strong daily reclaim above $1,894 would weaken the immediate bearish outlook and bring higher resistance levels into focus. Ethereum is approaching an important decision point. There is potential for a meaningful reaction in either direction, but I want confirmation rather than predictions. Protecting capital matters more than catching the exact bottom. For now, I am watching the support reaction, respecting the broader trend, and waiting for the market to reveal its next move. $ETHUSDT #ByXIMPACT