Black Jude
5346Like0Shares208Fans429Follow
trader | Crypto enthusiastic | Ten years of experience in Crypto trading | Expert in analysis
trader | Crypto enthusiastic | Ten years of experience in Crypto trading | Expert in analysis
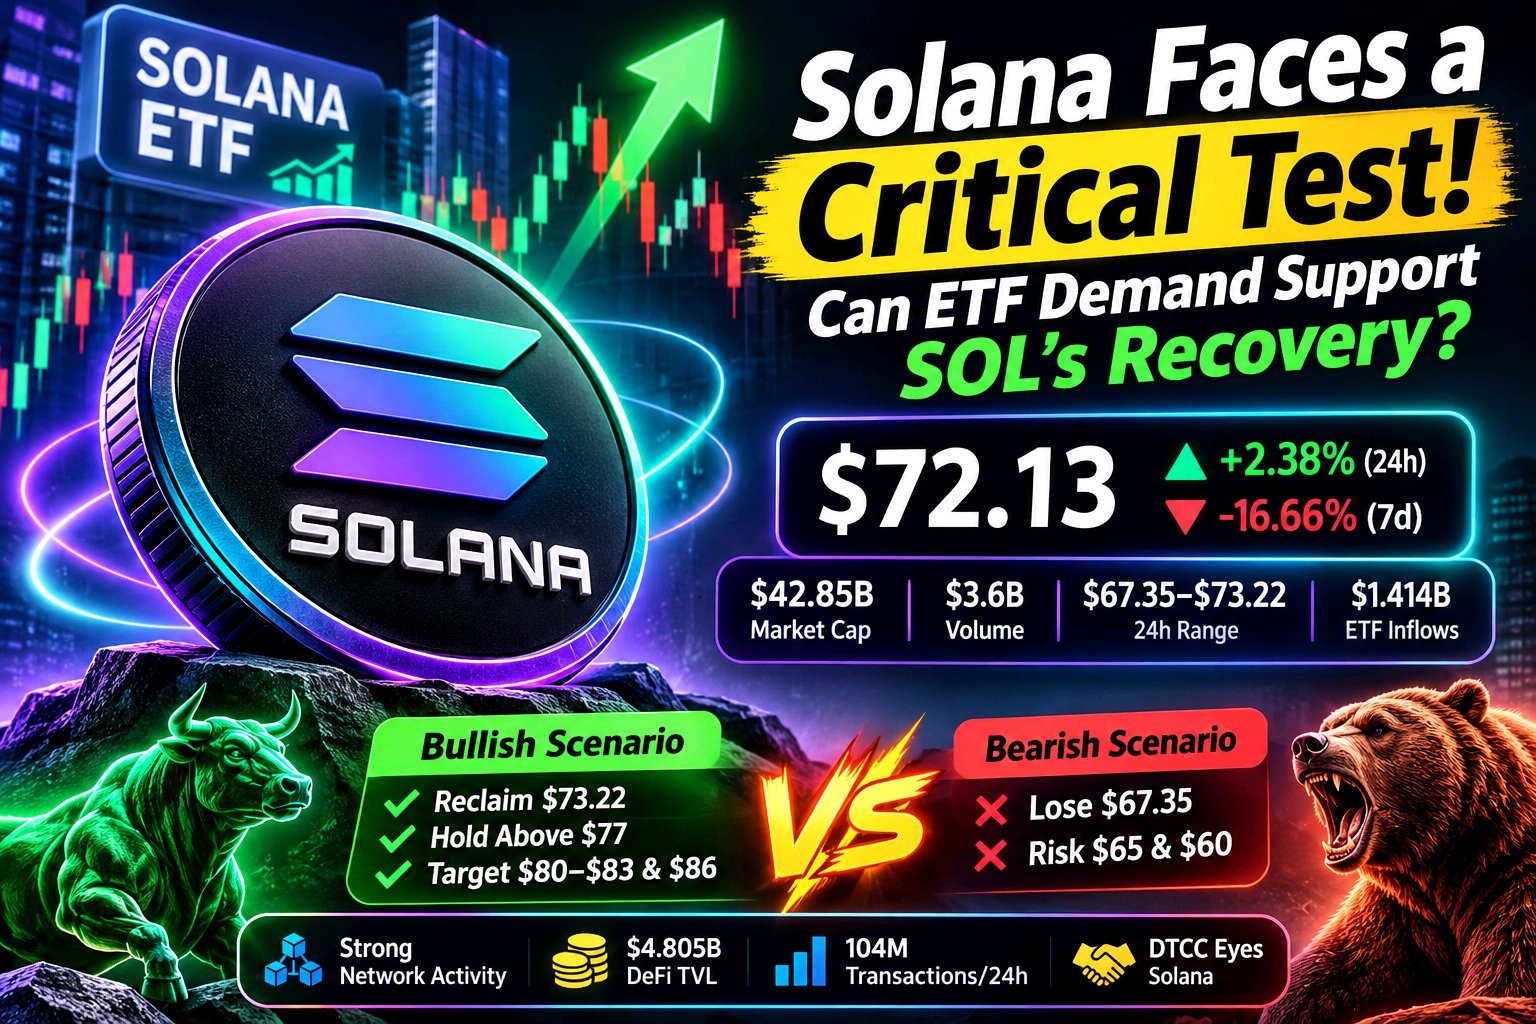
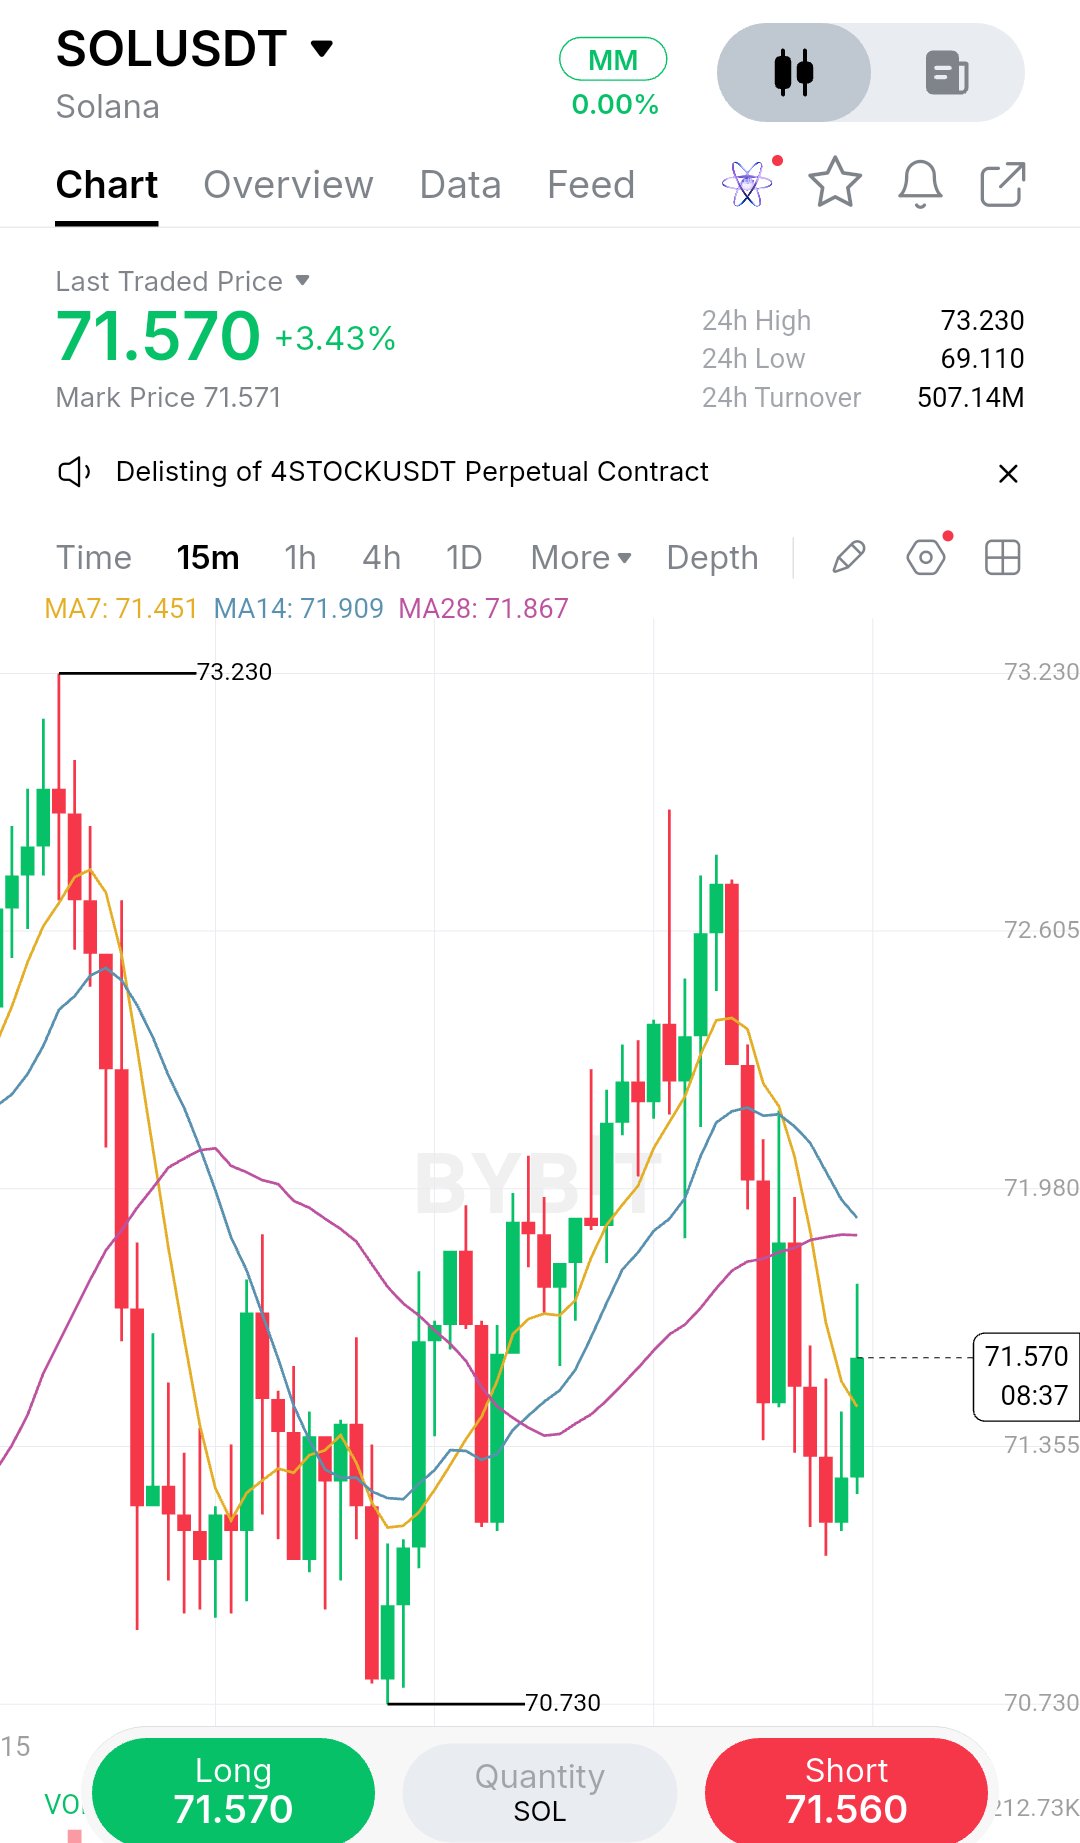
Solana is showing a mixed picture. Network activity remains strong, but SOL has dropped more than 16% over the past seven days. Meanwhile, spot ETF inflows are showing signs of recovery, and derivatives markets have experienced a significant reduction in leverage. The key question is whether institutional buyers can support the market or whether this rebound will lose momentum. SOL is trading around $72.13, with a market cap of approximately $42.85 billion and daily trading volume near $3.6 billion. Although the price has recovered 2.38% in 24 hours, its weekly performance remains weak at -16.66%. The recent trading range is $67.35–$73.22, making these levels important for the next move. Institutional activity is showing some positive signs. U.S. spot Solana ETFs recorded around $1.69 million in net inflows on November 12, ending five consecutive sessions of outflows. Total cumulative inflows remain near $1.414 billion. This suggests institutional interest has not disappeared, but one positive session is not enough to confirm a lasting trend. Solana's network fundamentals also remain meaningful. DeFi TVL stands around $4.805 billion, while stablecoin supply is approximately $13.96 billion. The network processed roughly 104 million transactions in 24 hours, generated around $448,750 in fees, and recorded $1.386 billion in daily DEX volume. However, weekly DEX activity declined by 19.11%, showing that ecosystem activity is also facing some pressure. Another development worth watching is DTCC's tokenization initiative, which has identified Solana among the blockchain networks being considered for future integration. This could create opportunities for Solana in traditional finance, although actual adoption and measurable usage will determine its long-term importance. Derivatives positioning has also changed considerably. Aggregate perpetual open interest is around $4.13 billion, with funding rates negative at approximately -0.0102% every eight hours. Around $23.24 million in positions were liquidated over 24 hours, including $14.63 million in long positions. Reduced leverage may help create a healthier market structure, but it does not automatically mean a bullish reversal is coming. Key levels to watch: - Resistance: $73.22, $77 and $80–$83. - Major upside target: $86. - Support: $67.35 and $65. - Further downside risk: $60. For bulls, reclaiming $73.22 and holding above $77 with stronger spot buying would improve the recovery outlook. On the other hand, losing $67.35 could bring renewed selling pressure. My view is that Solana still has strong infrastructure, meaningful DeFi liquidity and growing institutional exposure. But strong network activity doesn't automatically translate into higher SOL demand. I want to see consistent ETF inflows and stronger spot buying before considering this recovery convincing. For now, the market looks interesting, but confirmation is still missing. $SOLUSDT #ByXIMPACT
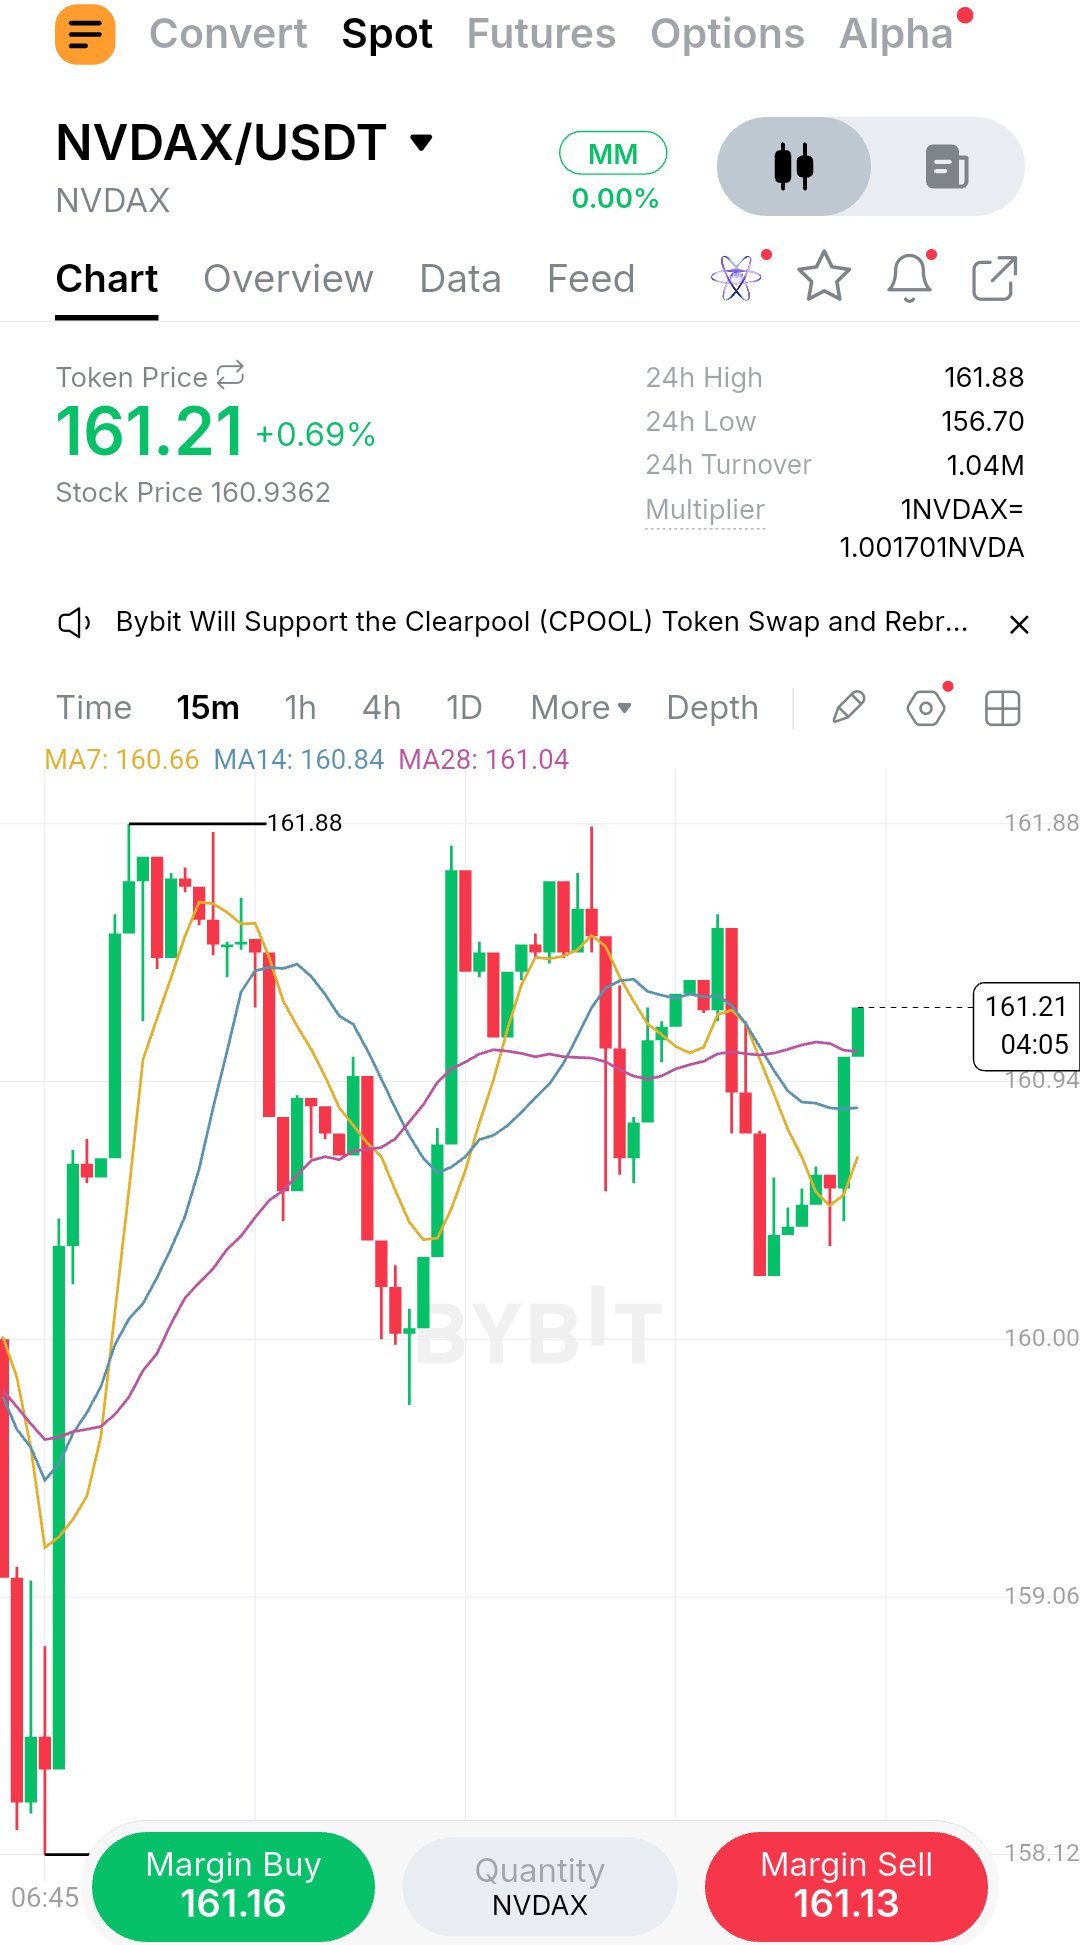
NVDAX is caught between two powerful forces: uncertainty surrounding NVIDIA's leadership and the continued strength of the AI industry. After losing more than 10% in a week, the token is approaching an important period that could determine its next direction. Trading around $160.59, NVDAX currently has a market capitalization of approximately $93.98M. Its seven-day performance stands at -10.75%, while the monthly decline has reached nearly 25%. The $155 zone is the immediate area buyers need to protect. On the upside, $162.64 is the first hurdle, followed by $165.75. A convincing breakout could bring $170 and eventually $180 into view. However, the bigger story goes beyond the chart. NVIDIA's reported leadership transition has created another layer of uncertainty for investors. Jensen Huang's departure after decades at the helm would represent a major strategic shift. CFO Colette Kress is reportedly stepping in as interim CEO while the company considers its next permanent leader. Maintaining confidence in NVIDIA's AI strategy and execution will be a major challenge. All eyes are now on November 17, when NVIDIA is scheduled to release its Q3 FY2027 results. The previous quarter delivered $96.2B in revenue, including $89B from Data Center operations. Management's earlier revenue outlook pointed toward approximately $108B for the upcoming quarter. These numbers make one thing clear: AI infrastructure demand remains the central factor investors will be evaluating. Derivatives data also deserves attention. Open interest has dropped to roughly $3.50M, down 11.52% in 24 hours, while funding remains negative at -0.0759% per eight hours. Futures volume is approximately $20.69M compared with just $1.41M in spot activity. This suggests speculative trading is still dominating the market. Negative funding could create conditions for a short squeeze, but falling open interest shows that some traders are stepping away rather than increasing exposure. One important point: NVDAX is a tokenized tracker linked to NVIDIA shares, not direct ownership of the company's stock. Its blockchain liquidity, spreads and counterparty risks can also influence its performance. Levels I'm watching: - Support: $155.33 - Immediate resistance: $162.64 - Major breakout level: $165.75 - Bullish targets: $170 and $180 - Downside levels: $150 and $148.80 My view is simple: NVIDIA's earnings could become the turning point for NVDAX. Strong results and positive guidance may help rebuild confidence, while disappointing numbers or continued leadership concerns could put further pressure on the token. I'm more interested in actual AI demand, Data Center revenue and spot buying than temporary derivatives movements. Until buyers reclaim $165.75, I would remain cautious about calling this a confirmed recovery. $NVDAXUSDT #ByXIMPACT
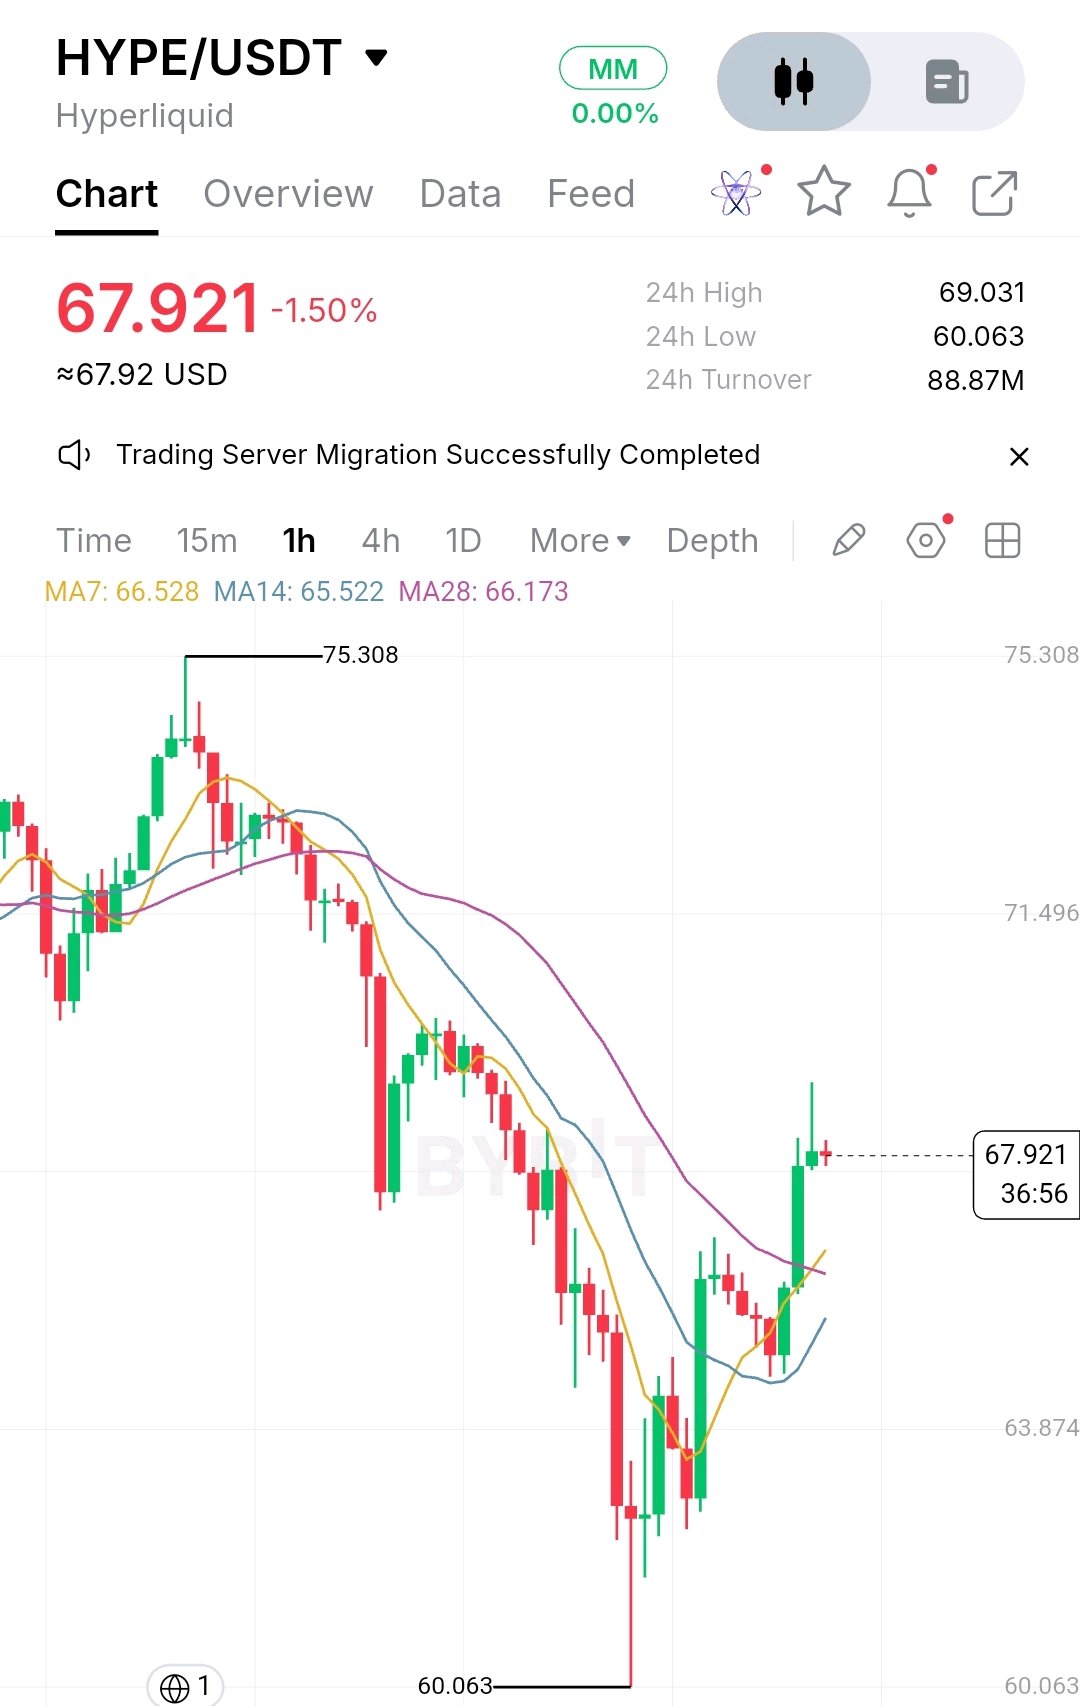
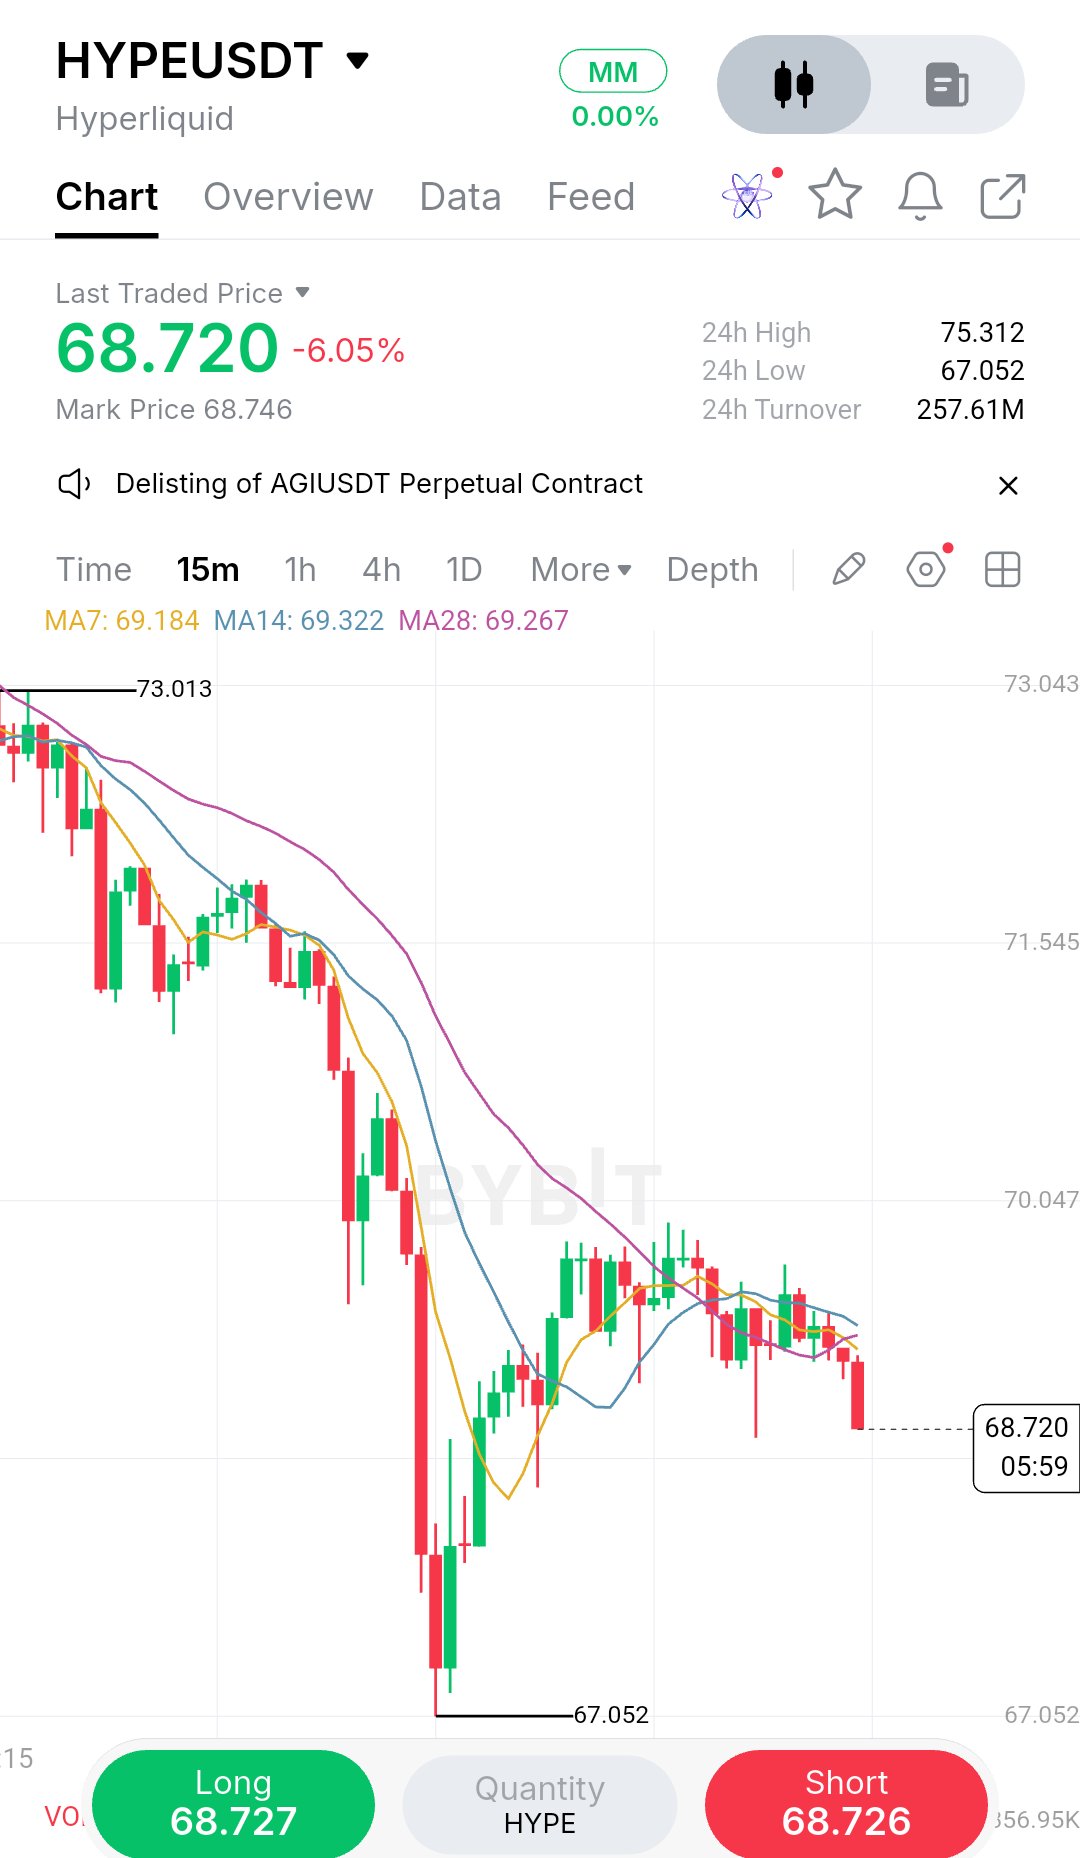
Hyperliquid (HYPE) is attempting to recover after a significant decline, with buyers showing renewed interest around the $60 support zone. According to the latest chart, HYPE is trading near $67.92, down approximately 1.50% over the last 24 hours. The price recently dropped from a high of $75.30 to a low of $60.06 before starting its recovery. What makes this movement interesting is that buyers are slowly regaining short-term control. On the 1-hour chart, HYPE has moved above all three moving averages: - MA7: $66.528 - MA14: $65.522 - MA28: $66.173 This is an encouraging development because trading above these averages suggests improving short-term momentum. However, the market still has some important levels to overcome. Resistance Levels: The first major resistance is around $69.00. If buyers manage to break above this level and maintain momentum, the next possible targets are $71.50 and $75.30. Support Levels: On the downside, $66.00 is an important short-term support area. If price loses this level, sellers could push HYPE toward $63.87. The stronger support remains near $60.06. My Market Outlook: I think HYPE is showing an interesting recovery after its recent selling pressure. Buyers are becoming more active, and the moving averages are showing signs of improvement. However, I don't consider this a confirmed bullish reversal yet. A strong breakout above $69 with healthy trading volume would make the recovery more convincing. For now, I'm watching the $66 support and $69 resistance closely. The next move around these levels could tell us whether buyers are ready to take control again. Let's see if HYPE can maintain this momentum. #IMPACTbyTrade $HYPEUSDT
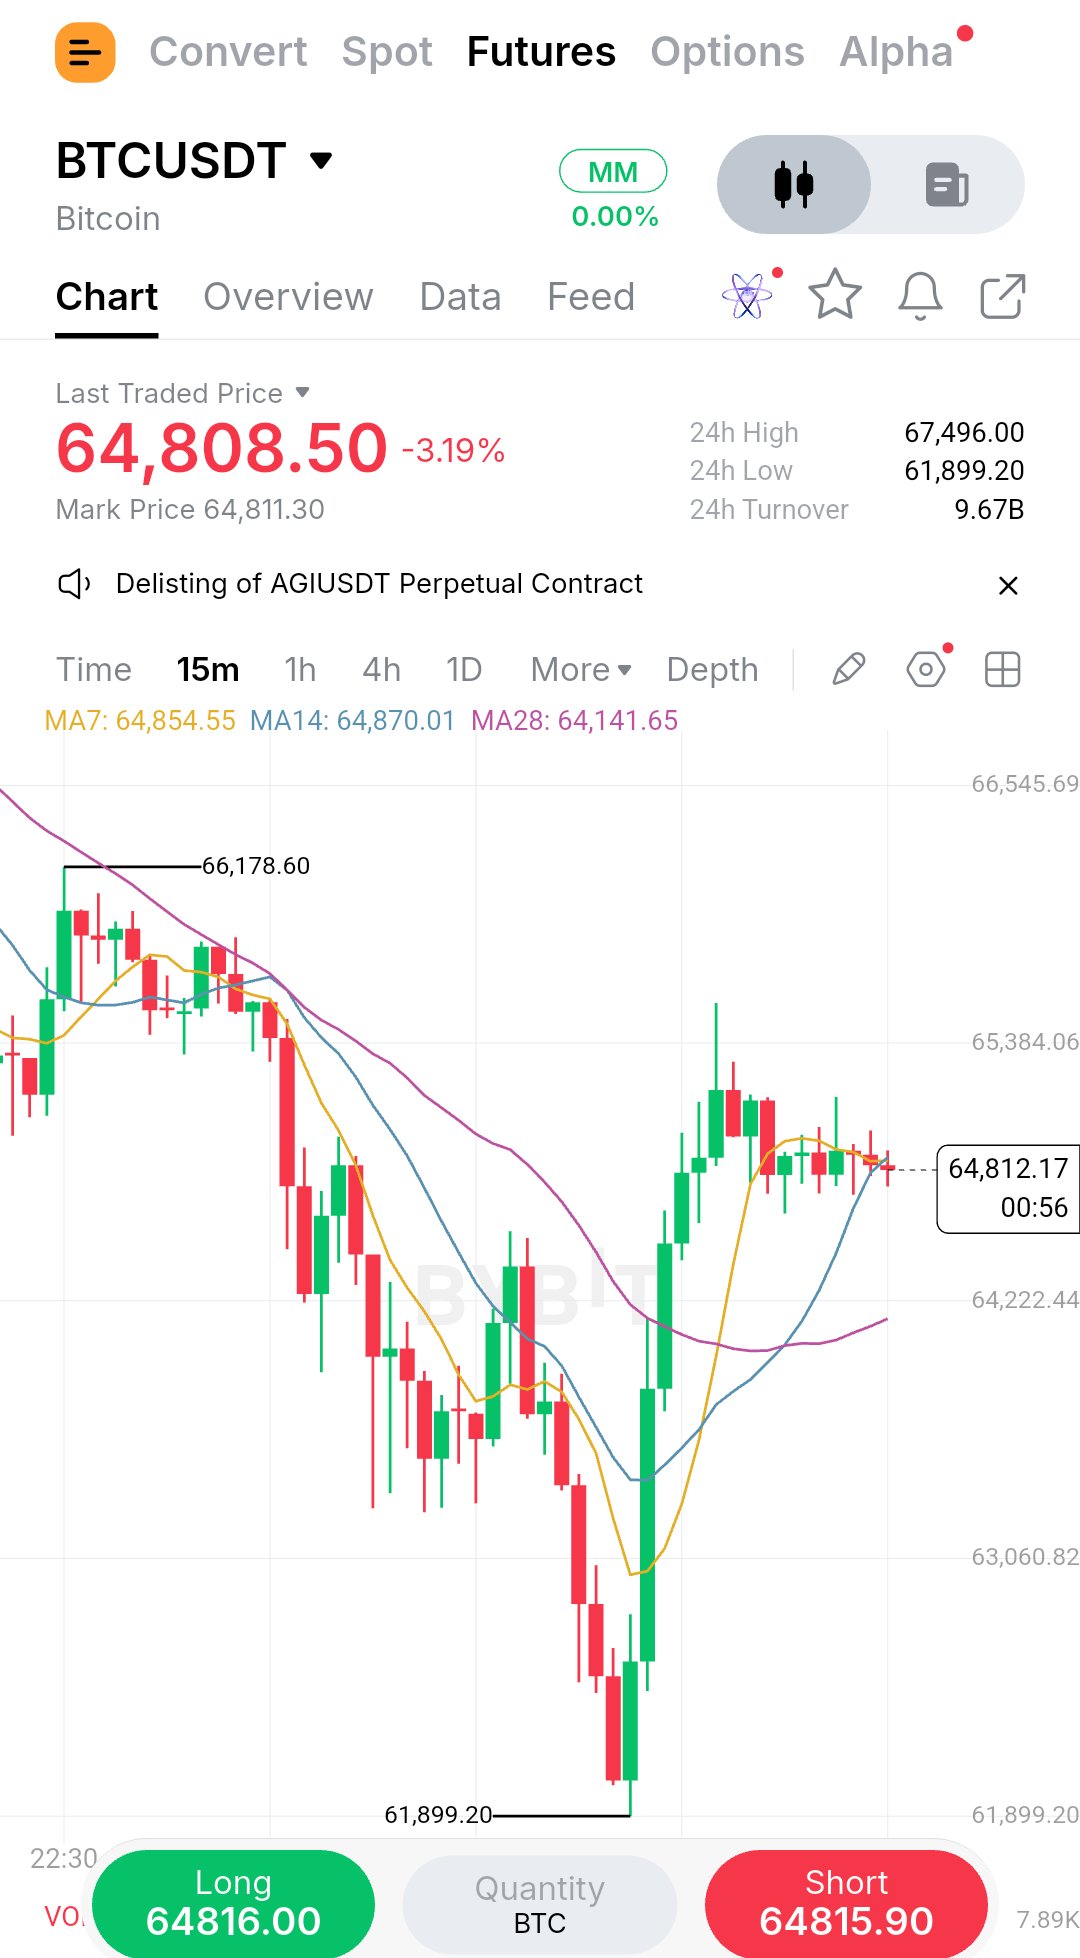
Bitcoin’s recent bounce is worth watching, but I’m not treating it as confirmation that the correction is over. Reclaiming the marked zone would be an important sign that buyers are starting to regain control. However, if BTC continues trading below it, that same area could become strong resistance. My long-term Bitcoin outlook remains bullish because I've already built my exposure. But in the short term, I'm staying cautious until the market shows a clear structural recovery. The $60K–$63K zone remains a key area to watch, and another retest is still possible. My final invalidation level is $57,800. A sustained weekly close below it would force me to reconsider my bullish thesis. I'm not interested in blindly buying every dip or assuming every bounce is the bottom. Risk management matters more than emotional conviction. My long-term target remains $100K, but Bitcoin must first rebuild its damaged market structure. I still believe in Bitcoin. I'm simply adapting my strategy to what the market is showing me right now. $BTCUSDT #IMPACTbyTrade
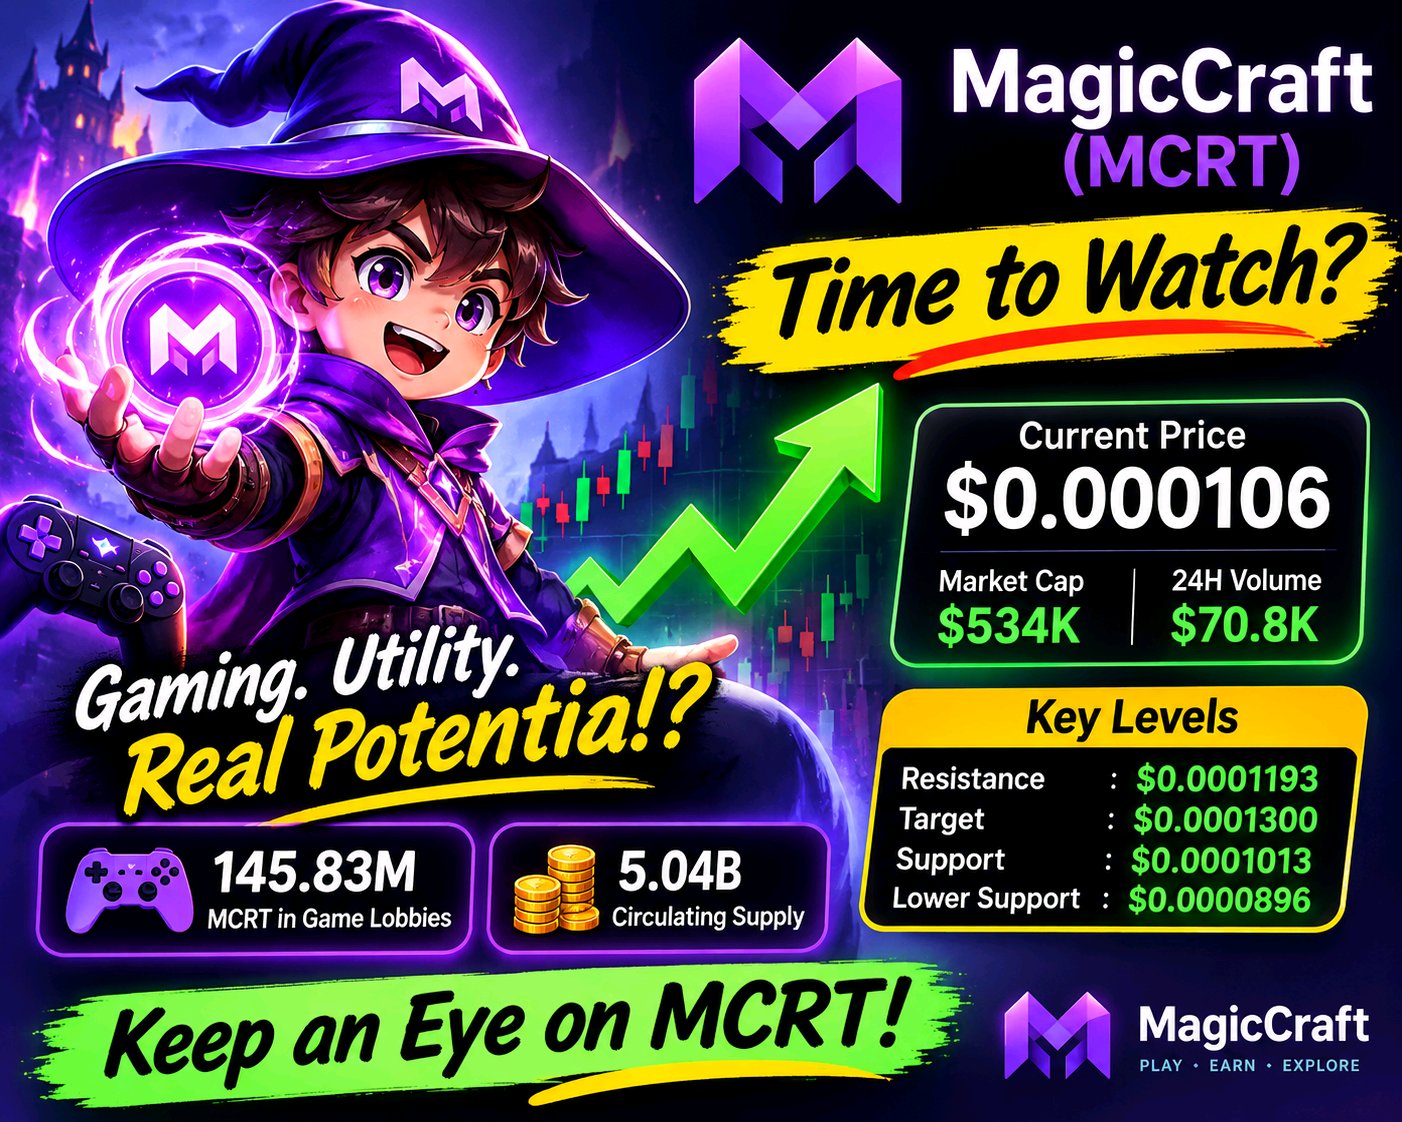
MagicCraft is catching market attention again, but the real challenge is turning a quick price surge into sustainable momentum. MCRT is hovering around $0.000106, with a market cap near $534K and daily trading volume of approximately $70.8K. Despite the recent rebound, the token remains far below its previous peak, highlighting how much ground it still needs to recover. What makes MagicCraft interesting is its gaming ecosystem. The project combines PvP and PvE gameplay with optional Web3 features, allowing players to explore the game without immediately connecting a wallet. MCRT adds utility through selected game activities, marketplace functions and ecosystem payments. However, there's one important gap: Gaming activity doesn't automatically create token demand. The project reports 145.83M MCRT recorded across game lobbies, but consistent player participation and actual token usage are what really matter. Supply is another factor to watch. Around 5.04B tokens are circulating against a 10B maximum supply. A further 20M MCRT unlock is scheduled for November 21, while relatively thin liquidity could amplify selling pressure. Important price levels: - Resistance: $0.0001193 - Bullish target: $0.0001300 - Immediate support: $0.0001013 - Lower support: $0.0000896 A convincing move above resistance with rising volume could strengthen the recovery. On the other hand, losing immediate support may bring sellers back into control. My take: MagicCraft has an actual gaming product and an ecosystem worth watching, but the token still needs stronger evidence of real demand. Until that happens, I would treat this rebound cautiously rather than assume a new bullish trend has started. $MCRTUSDT #ByXIMPACT
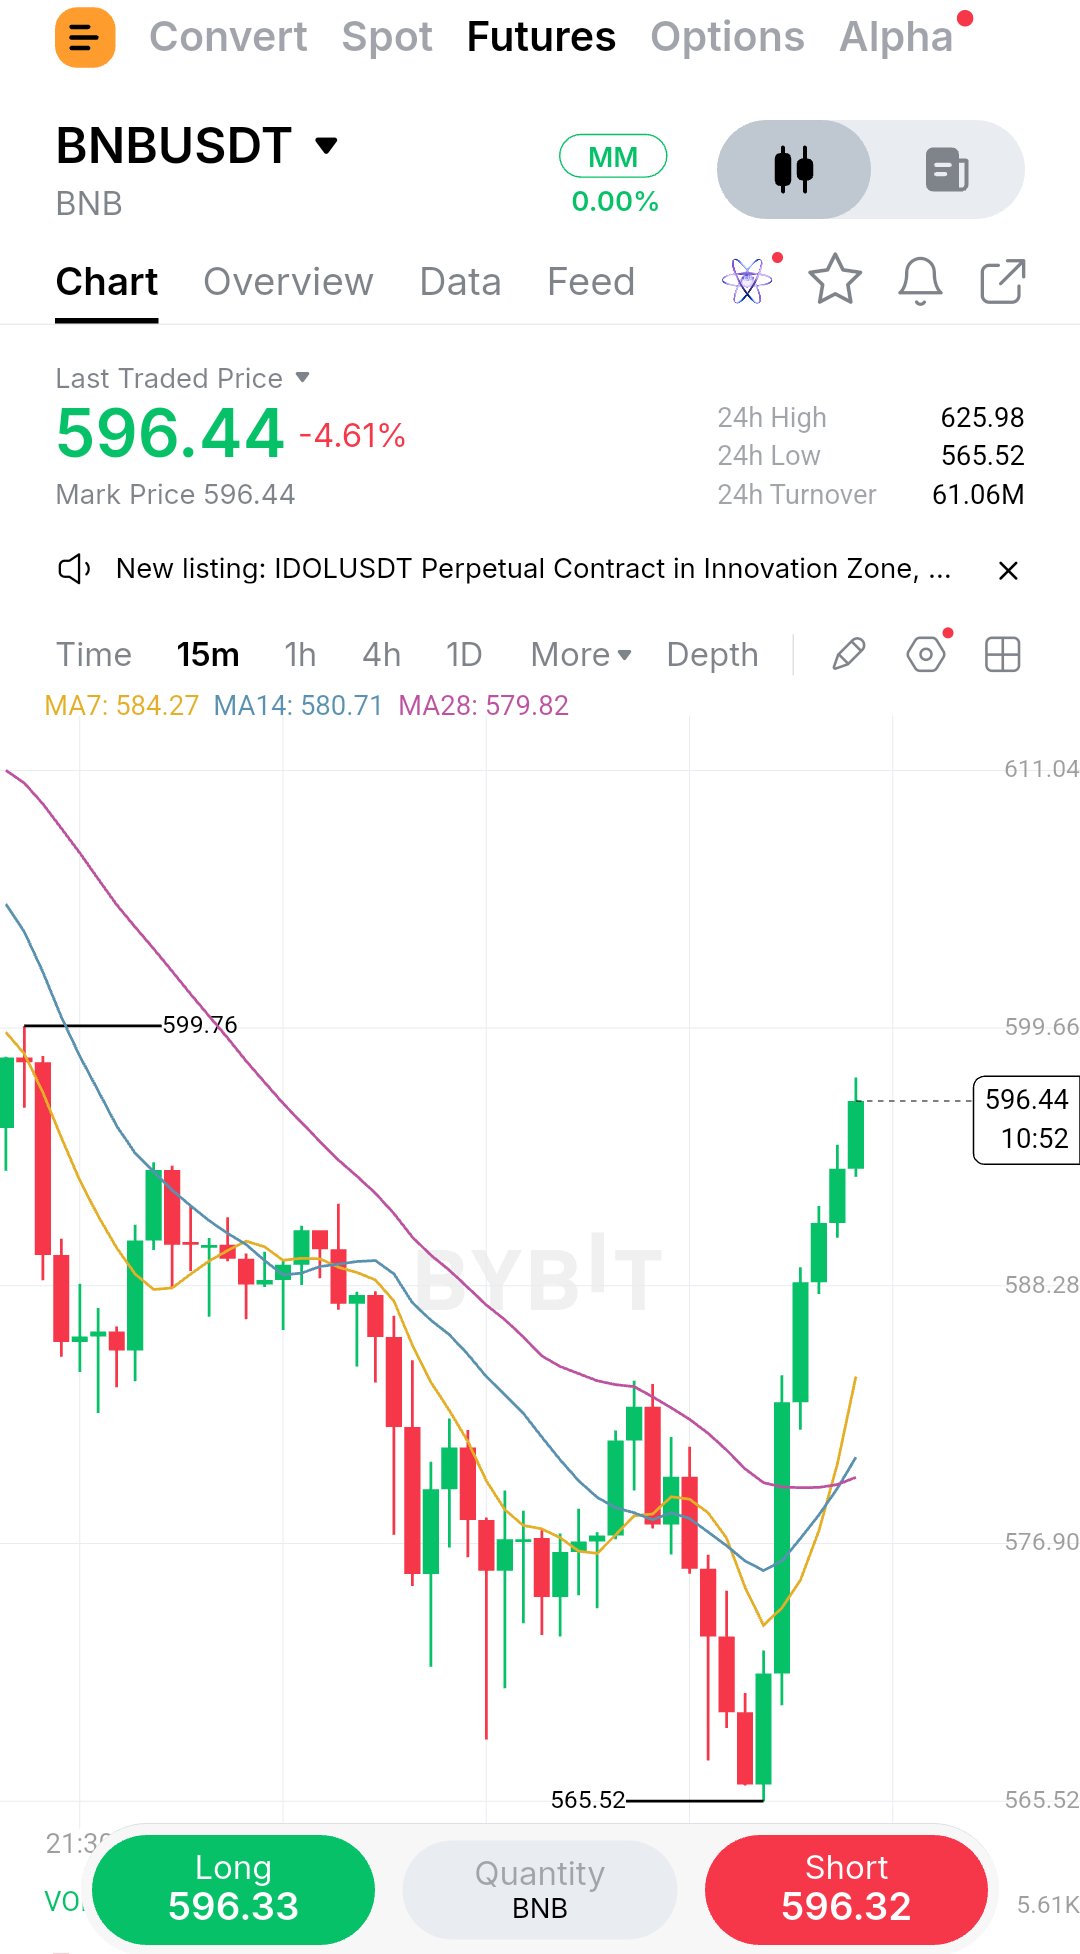
BNB is facing a major disconnect between network performance and market sentiment. While BNB Chain continues to process millions of transactions, the token is experiencing significant selling pressure. BNB is trading near $581, down approximately 8.6% in 24 hours and 16.4% over the past week. The immediate support zone sits around $577, while $600 is the first level bulls need to reclaim. Interestingly, the network fundamentals remain relatively strong. BNB Chain recorded around 12.3 million smart-contract deployments in Q3, while network revenue increased 54% to $54.2 million. Daily transactions also remain near 17.5 million. However, there are warning signs. Daily active addresses declined 14%, DeFi deposits dropped around 10.7% in seven days, and futures open interest fell to approximately $952 million. The latest quarterly Auto-Burn removed another 1.646 million BNB, reducing circulating supply and supporting the long-term scarcity narrative. Still, token burns alone cannot protect price when broader market selling takes control. Key market levels: - Current price: ~$581 - Immediate support: $577 - First resistance: $600 - Major resistance: $636 - Market cap: ~$76.62B - 24H liquidations: ~$15.65M - Futures open interest: ~$952M Bullish scenario: If BNB holds $577 and reclaims $600, buyers could attempt a move toward $636. Strong spot demand would make this recovery more convincing. Bearish scenario: Losing $577 could trigger another wave of selling, especially if long liquidations continue and DeFi capital keeps declining. My view is simple: BNB still has a strong ecosystem, real network activity and a meaningful burn mechanism. But right now, price action is telling a different story. I would rather see BNB reclaim $600 before considering this correction a genuine recovery. $BNBUSDT #IMPACTbyTrade
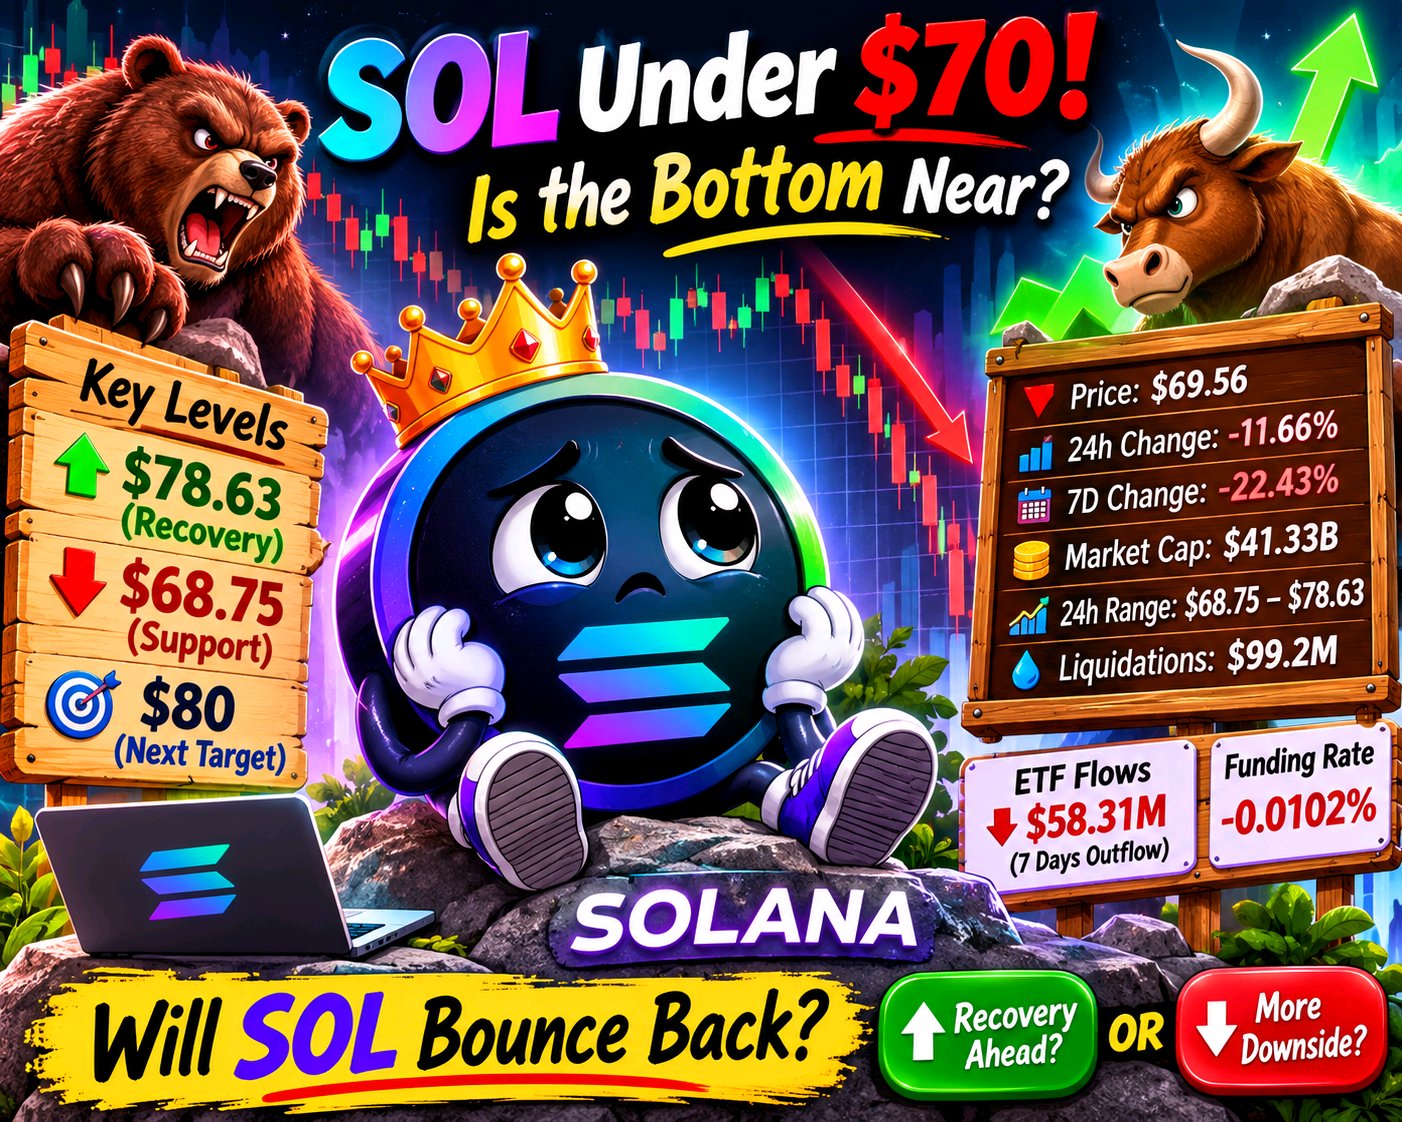
Solana is facing serious selling pressure, and the latest decline is exposing weaknesses across both spot and derivatives markets. SOL is hovering around $69.56, down 11.66% in 24 hours and more than 22% over the past week. With price approaching the $68.75 low, bulls are running out of room to defend the current structure. What's making this decline more concerning is the lack of strong institutional support. US spot SOL ETFs have experienced seven straight days of withdrawals, with roughly $58.31M leaving during that stretch. Derivatives are also showing signs of a major shakeout: - Open interest has fallen to approximately $4.08B. - Nearly $99.2M in positions have been liquidated. - Around 97% of liquidations came from leveraged longs. - Funding has slipped into negative territory at -0.0102%. - Futures trading activity remains significantly higher than spot volume. This suggests excessive bullish leverage has been cleared, but buyers have yet to demonstrate enough genuine demand to reverse the trend. Levels I'm watching: - Critical support: $68.75 - First recovery target: $78.63 - Next upside zone: $80 A successful defense of $68.75 followed by a move above $78.63 could bring recovery hopes back into the picture. However, losing support would increase the risk of another sharp decline. Solana's long-term ecosystem and institutional adoption story remain interesting, especially with future tokenization developments on the horizon. But right now, price action matters more than promises. My view: I'm not rushing to call this a bottom. I want to see stronger spot buying, improving ETF flows, and buyers taking back important resistance before turning bullish on SOL. $SOLUSDT #ByXIMPACT
NVDAX is entering a challenging period, with falling NVIDIA shares, leadership uncertainty and a major earnings announcement approaching. This is no longer just another AI-driven momentum trade. Investors are now watching whether NVIDIA can maintain confidence in its long-term growth story. NVDAX is trading around $162, down approximately 3.2% in 24 hours and 13.9% over the past seven days. It has dropped roughly 33% from its October high of $242.89. The latest trading range sits between $158.67 and $171.80. Buyers are attempting to defend the lower support area, but the market has yet to show convincing recovery strength. The leadership situation adds another layer of uncertainty. NVIDIA's November 12 announcement reportedly introduced a major transition, with Jensen Huang stepping down as CEO and CFO Colette Kress taking over as interim CEO. Although the company expects its operations, customer commitments and product roadmap to continue normally, investors will want reassurance that leadership changes won't affect execution. The next major catalyst is November 17, when NVIDIA is scheduled to release its fiscal Q3 2027 results. Revenue growth, data-center performance, AI demand and forward guidance will be particularly important. Strong numbers could help restore market confidence, while disappointing guidance could put additional pressure on the stock. NVDAX also deserves some attention from a structural perspective. It is a tokenized tracker certificate designed to provide economic exposure to NVIDIA shares, reportedly backed 1:1 by the underlying security. However, holders do not receive normal shareholder voting rights. Its around-the-clock trading availability can also create price differences compared with NVIDIA shares during regular US market hours. Derivatives positioning is another concern. Futures open interest is approximately $3.89 million, while funding stands near +0.1608%. Futures volume is around 2.5 times spot volume. This suggests aggressive leveraged positioning, with long traders potentially exposed if NVIDIA shares continue declining. Key Market Levels - Current price: ~$162 - Market cap: ~$94M - 24H change: -3.2% - 7D change: -13.9% - Support zone: $158.67 - Resistance: $171.80 - Distance from ATH: ~33% - Futures open interest: ~$3.89M - Funding rate: +0.1608% - Next earnings: November 17 Bullish scenario: A strong recovery above $171.80, followed by sustained buying pressure, would provide the first meaningful sign of improvement. Positive earnings and stronger data-center guidance could open the door toward $180. Bearish scenario: Losing $158.67 decisively could trigger another downward move. Weak guidance, continued uncertainty or further weakness in NVIDIA shares could keep sellers in control. My view is that NVDAX needs more than a short-term bounce to establish a convincing recovery. Its performance remains closely tied to NVIDIA's underlying shares, and the upcoming earnings report could determine the next major direction. Until buyers reclaim resistance and demonstrate real strength, staying cautious makes more sense than chasing an early rebound. $NVDAXUSDT #ByXIMPACT

SHIB is approaching a price level that previously attracted strong buying interest, but the current market structure raises an important question: are buyers ready to defend it again? Price is hovering near $0.00000415, inside my key demand zone of $0.00000405–$0.00000425. Unlike the previous accumulation phase, SHIB has arrived here after a prolonged decline, with sellers maintaining control through consecutive lower highs. That makes this support test particularly important. I'm watching for signs of stabilization rather than expecting an immediate pump. Key Levels I'm Tracking: - Support: $0.00000405–$0.00000425 - First resistance: $0.00000475–$0.00000495 - Next target: $0.00000540–$0.00000570 - Major target: $0.00000610–$0.00000625 A successful defense of support, followed by stronger daily candles and a break in the bearish structure, could open the door to a recovery of roughly 47–51%. However, a daily close below $0.00000405 with no meaningful recovery would weaken the bullish scenario considerably. My Take: I'm watching SHIB with a bullish bias, but confirmation matters more than anticipation. This level could become the foundation for a meaningful rebound, provided buyers finally step in with conviction. The next move will tell us whether SHIB is preparing for a comeback or simply pausing before another leg down. $SHIBUSDT #ByXIMPACT

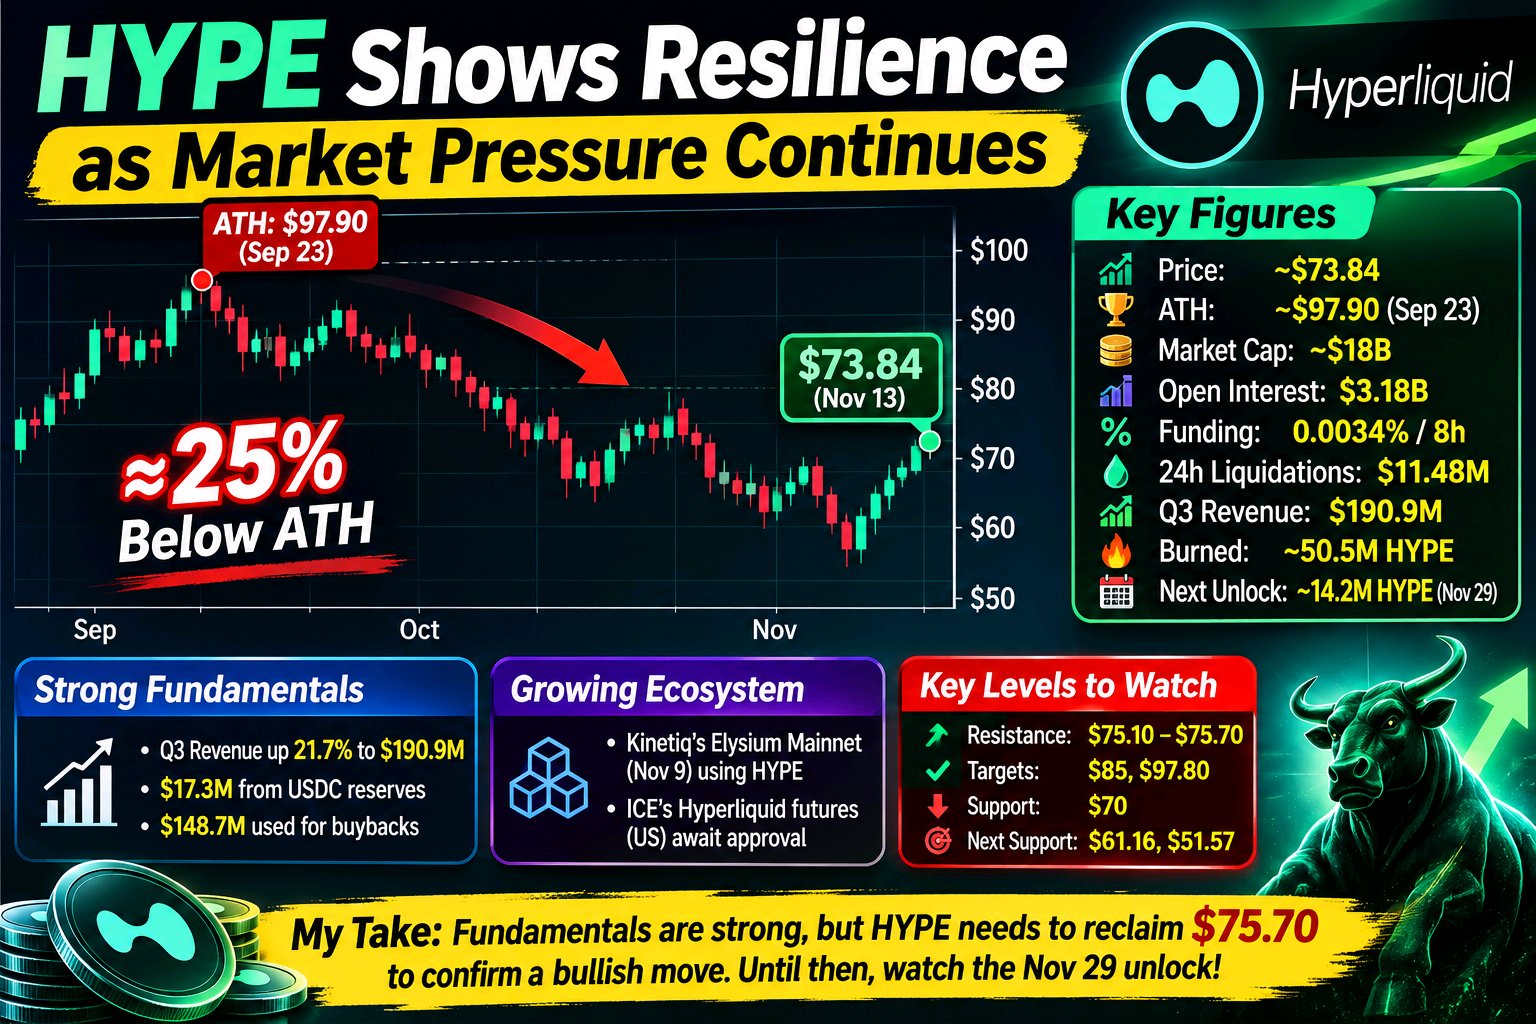
Hyperliquid is showing relative strength despite broader market weakness. After dropping below $70, HYPE recovered toward $73.84 following its Q3 report. However, the token remains around 25% below its September all-time high of $97.90. Fundamentals remain encouraging. Q3 revenue increased 21.7% to $190.9M, including $17.3M from USDC reserve income. Meanwhile, the Assistance Fund spent approximately $148.7M buying HYPE during the quarter. Around 50.5M tokens have been burned so far, representing roughly 5% of the maximum supply. Ecosystem development is another positive factor. Kinetiq launched its Elysium mainnet on November 9, using HYPE as its native gas token. This could expand the token's utility. ICE's proposed Hyperliquid-linked futures in the US are also worth watching, although regulatory approval is still pending. Derivatives data presents a mixed picture. Open interest stands near $3.18B, down 2.4% over 24 hours. Funding remains relatively neutral at 0.0034% per eight hours. Meanwhile, $11.48M in liquidations occurred, with approximately 98% coming from long positions. The biggest concern is upcoming token supply. Around 14.2M HYPE tokens are scheduled to unlock on November 29. That's approximately 5.6% of the current circulating supply and could create additional selling pressure. Key Levels to Watch - Resistance: $75.10–$75.70 - Bullish targets: $85 and $97.80 - Immediate support: $70 - Lower targets: $61.16 and $51.57 My Take: Hyperliquid's fundamentals are improving, and its buyback and burn mechanisms provide some support. However, strong fundamentals don't automatically mean the token price will recover. HYPE needs to reclaim $75.70 to show stronger bullish momentum. Until then, the November 29 unlock and broader market weakness remain important risks. $HYPEUSDT #IMPACTbyTrade
llBitcoin’s latest structure still favors the bears. After failing to sustain momentum near $87,401, BTC has lost both major moving averages, with EMA50 at $77,772 and EMA200 at $76,227 now acting as overhead resistance. Price is approaching a critical demand region between $62,272 and $68,554. This is where buyers need to step in. Daily RSI is around 12, suggesting extreme selling pressure. A relief bounce is possible, but oversold conditions alone don't signal a trend reversal. Here’s what I’m watching: $66,448: Recent low and immediate downside trigger. $62,272: Major structural support. $70,000: First important level bulls need to recover. $74,837: Reclaiming this supply area would weaken the bearish outlook. If support fails, BTC could extend its correction toward the lower end of the demand zone. I’m not looking to catch a falling knife. I want to see buyers defend support, build a bullish structure, and confirm momentum before considering a long. For now, the bearish setup remains active until price proves otherwise. The chart offers a possible scenario, not a guaranteed outcome. $BTCUSDT #IMPACTbyTrade

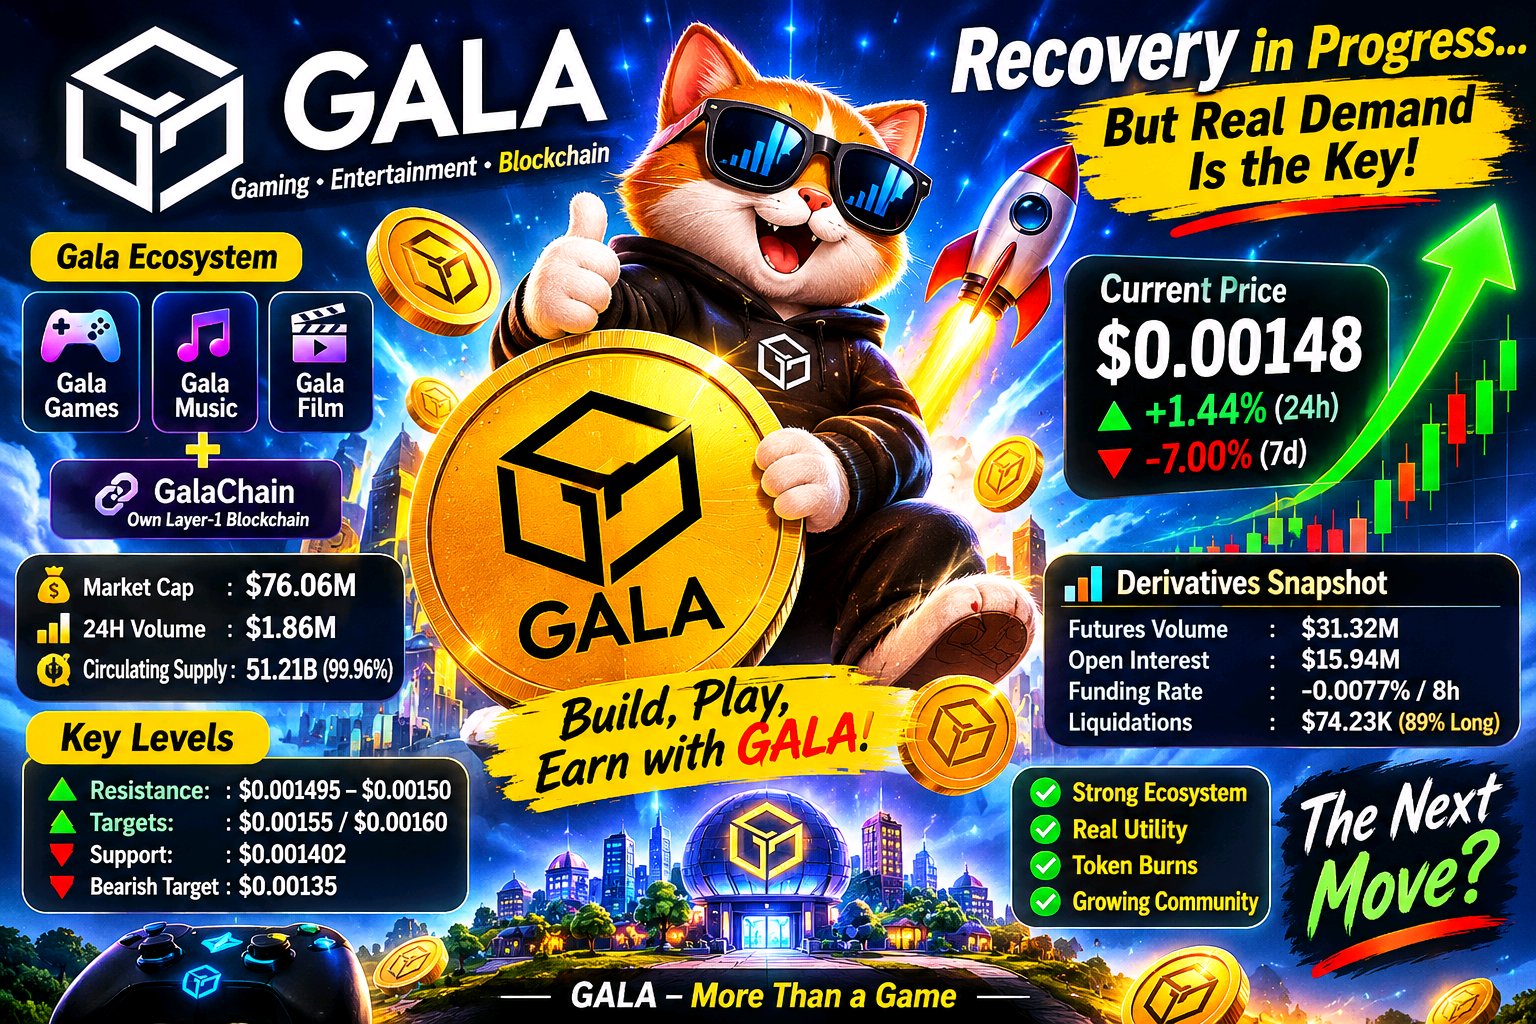
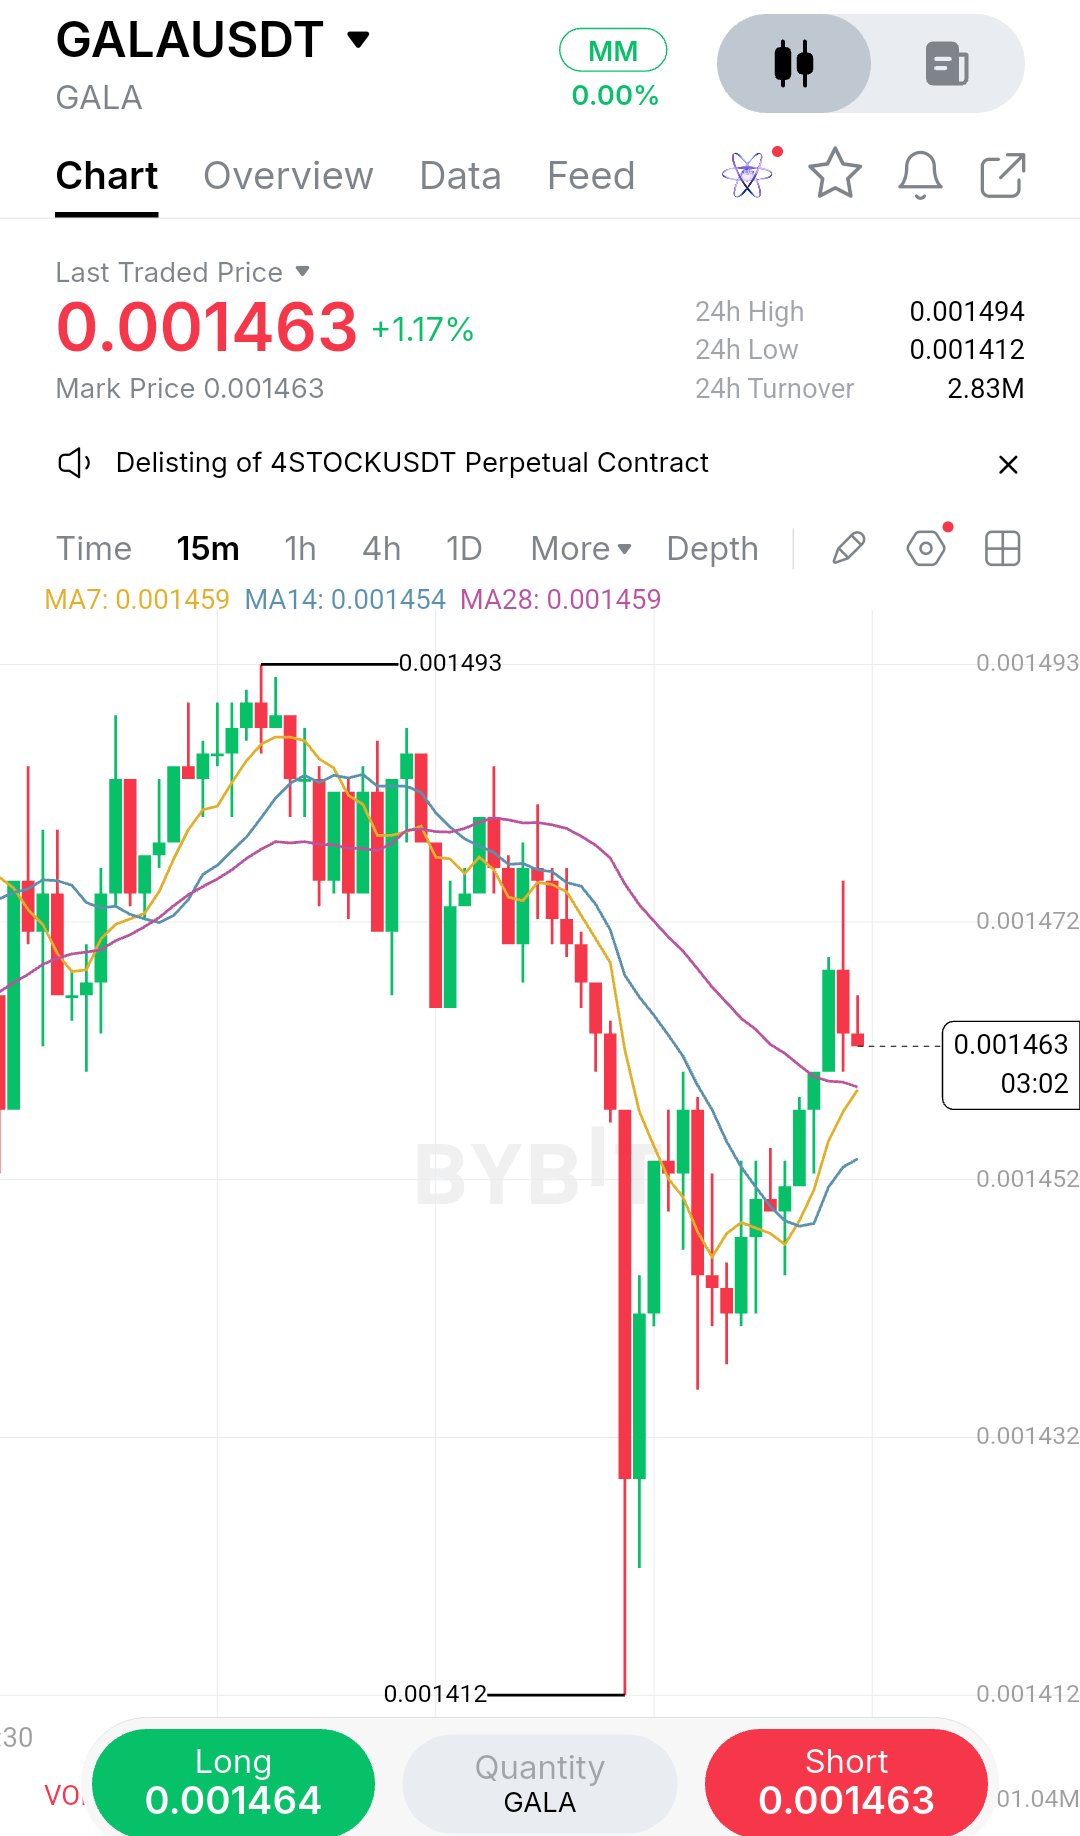
GALA is attempting a short-term recovery, but the bigger picture remains challenging. Almost the entire maximum token supply is already circulating, and the key question is whether Gala's growing entertainment ecosystem can generate enough real activity to support long-term demand. GALA is trading around $0.00148, gaining approximately 1.44% over 24 hours while remaining down nearly 7% over the past week. Its market capitalization is around $76.06M, with spot trading volume near $1.86M. The immediate resistance sits between $0.001495 and $0.00150. A convincing move above this zone could improve the short-term outlook. Fundamentally, Gala is trying to build more than a gaming platform. Its ecosystem includes Gala Games, Gala Music and Gala Film, supported by its own Layer-1 blockchain, GalaChain. GALA is used for ecosystem transactions and network gas, while certain transactions can contribute to token burns. Founder's Node operators also help support the network and receive GALA rewards. However, having multiple products does not automatically translate into token demand. What matters is whether more people are actively using these platforms, completing transactions and spending GALA within the ecosystem. The token supply is another important factor. Approximately 51.21B GALA is circulating against a maximum supply of 51.23B, meaning roughly 99.96% is already in circulation. This reduces uncertainty around major future unlocks, but node rewards can still introduce additional supply. For long-term sustainability, actual token burns and ecosystem demand need to balance those emissions. Derivatives activity also deserves attention. Futures volume is around $31.32M, compared with approximately $1.86M in spot volume. Open interest stands near $15.94M, while funding is negative at roughly -0.0077% per eight hours. This suggests bearish positioning, although it does not guarantee a reversal. Around $74.23K in positions were liquidated over 24 hours, with longs accounting for approximately 89%. Key market levels: - Current price: ~$0.00148 - Market cap: ~$76.06M - Resistance: $0.001495–$0.00150 - Support: $0.001402 - Bullish targets: $0.00155 and $0.00160 - Bearish target: $0.00135 My market view: GALA needs to break above $0.00150 with stronger spot buying to confirm a meaningful recovery. If buyers fail to defend the current range and price drops below $0.001402, further weakness toward $0.00135 becomes possible. I think Gala has an interesting foundation, but the real test is execution. More games, entertainment products and partnerships are not enough on their own. The ecosystem needs measurable user growth, stronger on-chain activity and sustainable token demand. That's what could make the difference between a temporary price recovery and genuine long-term progress. $GALAUSDT #ByXIMPACT
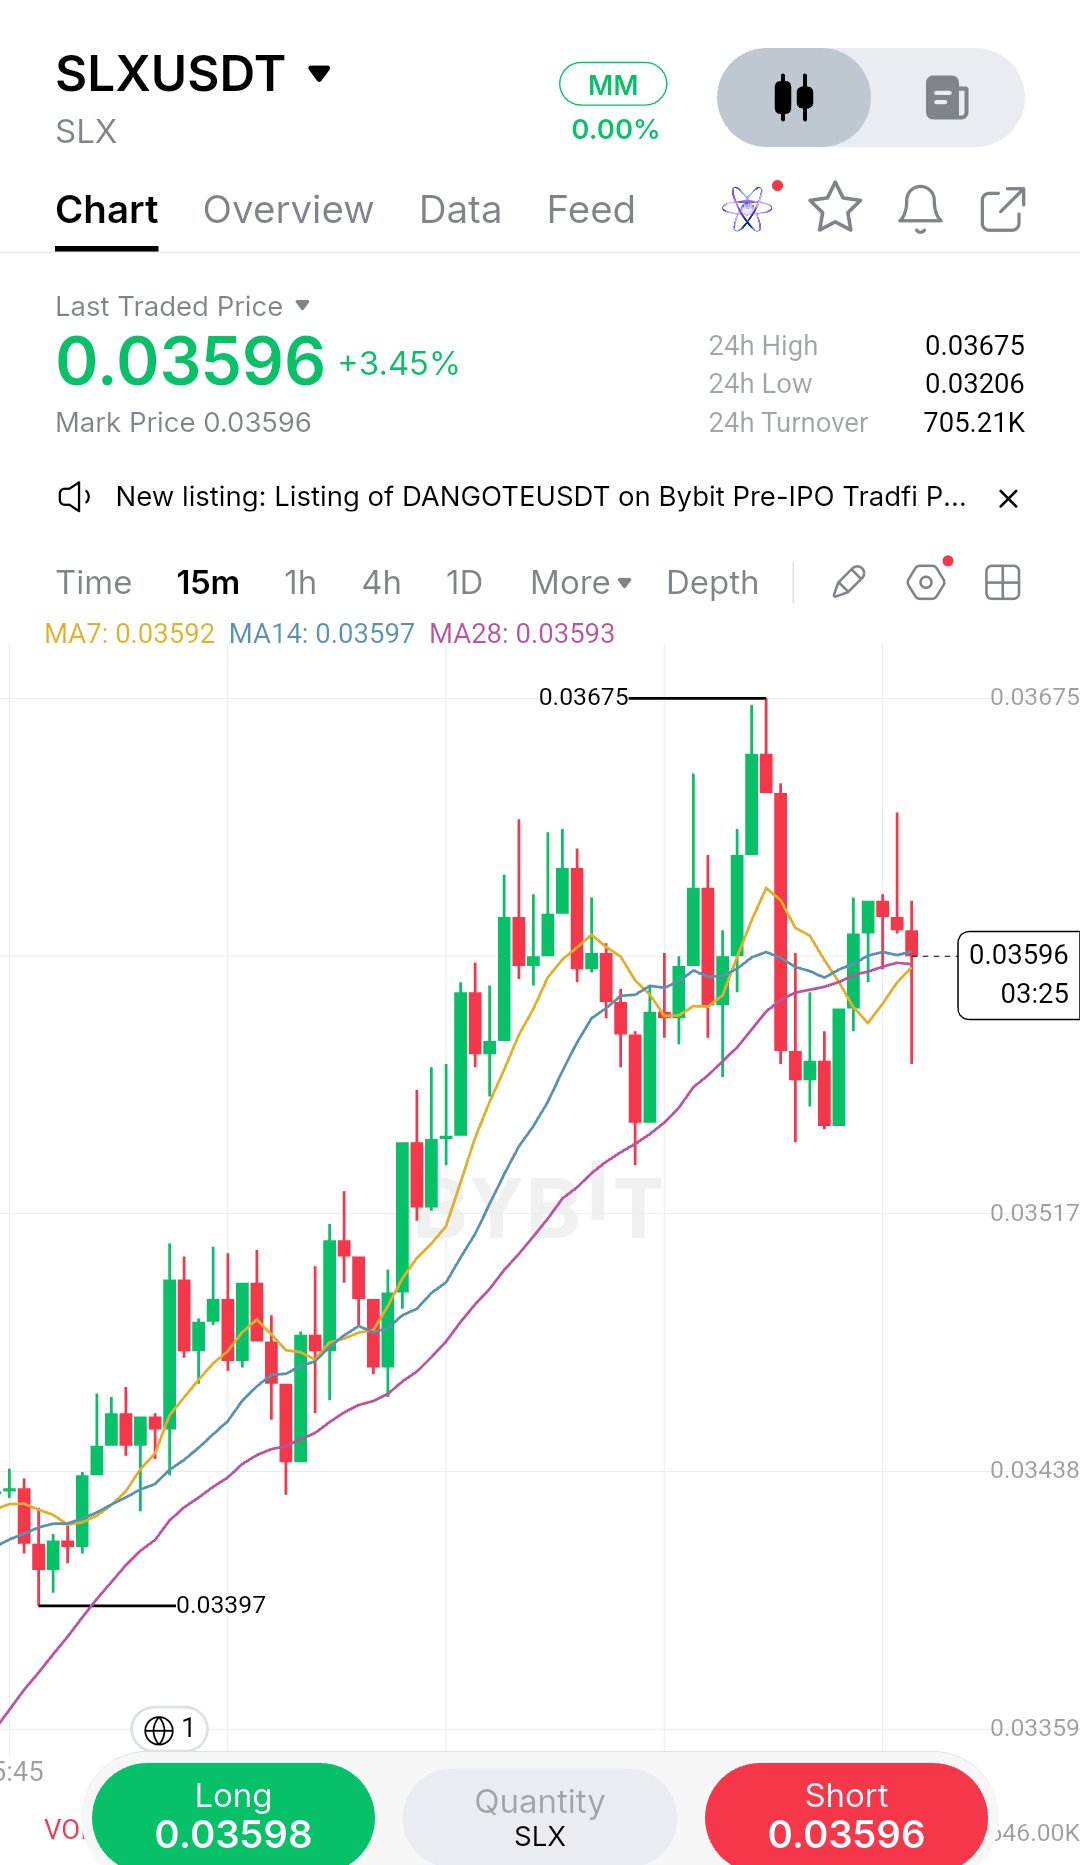
SLX is attempting to regain bullish momentum, but there is more to this recovery than price action. Solstice has developed a serious institutional-yield ecosystem with substantial capital behind it. However, the key question is whether that growth actually translates into value for SLX holders. The token is trading around $0.0365, gaining approximately 8.5% in 24 hours. Its market capitalization stands near $8.85M, with daily trading volume around $10.48M. Despite the rebound, SLX is still down roughly 12% over seven days. The $0.0366 level is the immediate resistance, and buyers need to reclaim it convincingly before a stronger recovery can develop. Solstice's core strength comes from its institutional-style yield infrastructure. Its ecosystem revolves around USX, a dollar-based settlement asset, and eUSX, which distributes returns generated through underlying investment strategies. The protocol focuses on bringing delta-neutral funding opportunities and institutional yield strategies into DeFi. The numbers show that the ecosystem has meaningful scale. Solstice holds approximately $201M in TVL, demonstrating that its products have attracted considerable capital. However, DeFiLlama reports only around $16.4K in protocol fees over the past 30 days, with protocol revenue and earnings recorded at zero. This distinction matters because yield is distributed to eUSX holders instead of being retained as protocol revenue. In other words, a growing ecosystem does not automatically mean increasing value for SLX holders. The token has several ecosystem utilities, including staking through stSLX, governance participation, early access to vault capacity, credit eligibility and certain fee-related benefits. These features can create demand, but their long-term impact depends on actual participation and sustained product usage. Supply is another important concern. Around 242.85M SLX is currently circulating against a maximum supply of 1 billion. That means approximately 24.3% of the maximum supply is in circulation. An additional 17.26M SLX unlock is scheduled for November 25, representing roughly 7.1% of the current circulating supply. This upcoming distribution could create additional selling pressure if demand fails to absorb the new supply. Derivatives activity also deserves attention. Futures open interest is approximately $5.36M, while 24-hour futures volume has reached $16.11M, significantly exceeding spot volume of around $7.08M. Funding remains positive near 0.0100% per eight hours. This suggests bullish positioning, but excessive leverage can make recoveries vulnerable to sudden reversals. # Key Market Data - Price: ~$0.0365 - Market Cap: ~$8.85M - 24H Volume: ~$10.48M - 24H Price Change: +8.5% - 7D Performance: -12% - Circulating Supply: ~242.85M SLX - Maximum Supply: 1B SLX - TVL: ~$201M - 30D Protocol Fees: ~$16.4K - 30D Protocol Revenue: $0 - Futures Open Interest: ~$5.36M - 24H Futures Volume: ~$16.11M - Next Unlock: 17.26M SLX on November 25 Important Price Levels Bullish scenario: A confirmed breakout above $0.0366 could open the way toward $0.0400, with $0.0450 becoming a possible next target if buying pressure continues. Bearish scenario: A breakdown below $0.0325 could weaken the recovery and bring the November 13 low around $0.0320 into focus. Further downside could expose the $0.0300 area. My Take Solstice has a compelling foundation, and its institutional-yield approach gives it a different profile from many smaller DeFi projects. But I would not judge SLX purely by its TVL. The bigger challenge is connecting ecosystem adoption with actual token demand. Zero recorded protocol revenue, limited circulating supply and upcoming unlocks are factors that deserve serious attention. For now, the recovery is encouraging, but I want to see stronger spot buying, a confirmed resistance breakout and sustainable ecosystem growth before considering the bullish structure convincing. Product adoption is important, but real token value capture is what SLX ultimately needs to demonstrate. $SLXUSDT #ByXIMPACT

BARD has staged a remarkable recovery, gaining nearly 75% in 24 hours. However, the bigger question is whether this rally reflects genuine market demand or simply an aggressive derivatives-driven short squeeze. With a substantial token unlock approaching, traders should look beyond the headline price movement. BARD is trading around $0.1508, with a market capitalization estimated between $59.8M and $63.9M. Spot trading volume has reached approximately $93M, while the 24-hour price range stands between $0.0831 and $0.1595. The token is now testing an important resistance zone near $0.1595, making the next price reaction particularly important. Lombard's underlying ecosystem offers a compelling foundation. Its flagship LBTC provides Bitcoin exposure with yield generated through a covered-call strategy managed by Bitwise Investment Manager. Its BTC.b product offers another 1:1 Bitcoin representation focused on straightforward liquidity and pricing. The protocol also has integrations with major DeFi platforms such as Aave and Morpho, supporting more than 50 protocols across multiple networks. Still, a successful ecosystem doesn't automatically translate into stronger token economics. BARD primarily serves governance and network-security functions, including staking mechanisms supporting crosschain infrastructure through Chainlink CCIP and Symbiotic. Protocol activity, fees and actual revenue received by tokenholders must be evaluated separately. The financial metrics highlight this gap. Lombard reportedly holds approximately $677.4M in TVL, although that figure has declined 24.7% over 30 days. During the same period, protocol fees reached roughly $458K, while recognized protocol revenue stood near $43.7K. Reported holder revenue remains zero. This suggests that Lombard's infrastructure adoption has not yet established a clear direct value-accrual mechanism for BARD holders. Token supply is another important concern. Approximately 22.81M BARD tokens are scheduled to unlock on November 18. This represents around 5.8% of the circulating supply, potentially introducing additional selling pressure from investor, insider and community allocations. Derivatives activity is equally noteworthy. Open interest has surged to approximately $35.9M, representing nearly 393% growth in 24 hours. Futures volume has reached $881.6M, significantly exceeding spot volume. Funding has reportedly dropped to around -3.68%, while liquidations reached approximately $3.2M, with short positions accounting for roughly 72%. These figures point toward an aggressive short squeeze. However, without stronger spot demand, the rally could struggle to maintain its momentum once leveraged traders begin taking profits. Key Market Metrics - Price: ~$0.1508 - Market Cap: ~$59.8M–$63.9M - 24H Change: ~+75% - Spot Volume: ~$93M - 24H High: $0.1595 - Circulating Supply: ~396.56M BARD - Maximum Supply: 1B BARD - TVL: ~$677.4M - 30D Fees: ~$458K - 30D Protocol Revenue: ~$43.7K - Upcoming Unlock: 22.81M BARD - Open Interest: ~$35.9M - Futures Volume: ~$881.6M Technical Outlook Bullish scenario: A convincing breakout above $0.1595, supported by increasing spot buying, could open the way toward $0.17–$0.18. Holding above the breakout level would strengthen the recovery structure. Bearish scenario: Another rejection near $0.1595 followed by a move below $0.14 could weaken bullish momentum. Losing $0.12 would increase the possibility of a deeper correction toward $0.10. My Take Lombard has a legitimate position in Bitcoin-focused DeFi, and its products provide meaningful infrastructure value. But BARD still needs to demonstrate that ecosystem growth can translate into sustainable tokenholder benefits. The recent rally is impressive, yet rising leverage, negative funding and the November 18 unlock create a challenging setup. I would pay closer attention to sustained spot demand and how price behaves around $0.1595 rather than assuming the recent 75% surge guarantees another leg higher. For now, BARD has momentum, but whether it can turn that momentum into a sustainable recovery remains the real question. $BARDUSDT #ByXIMPACT

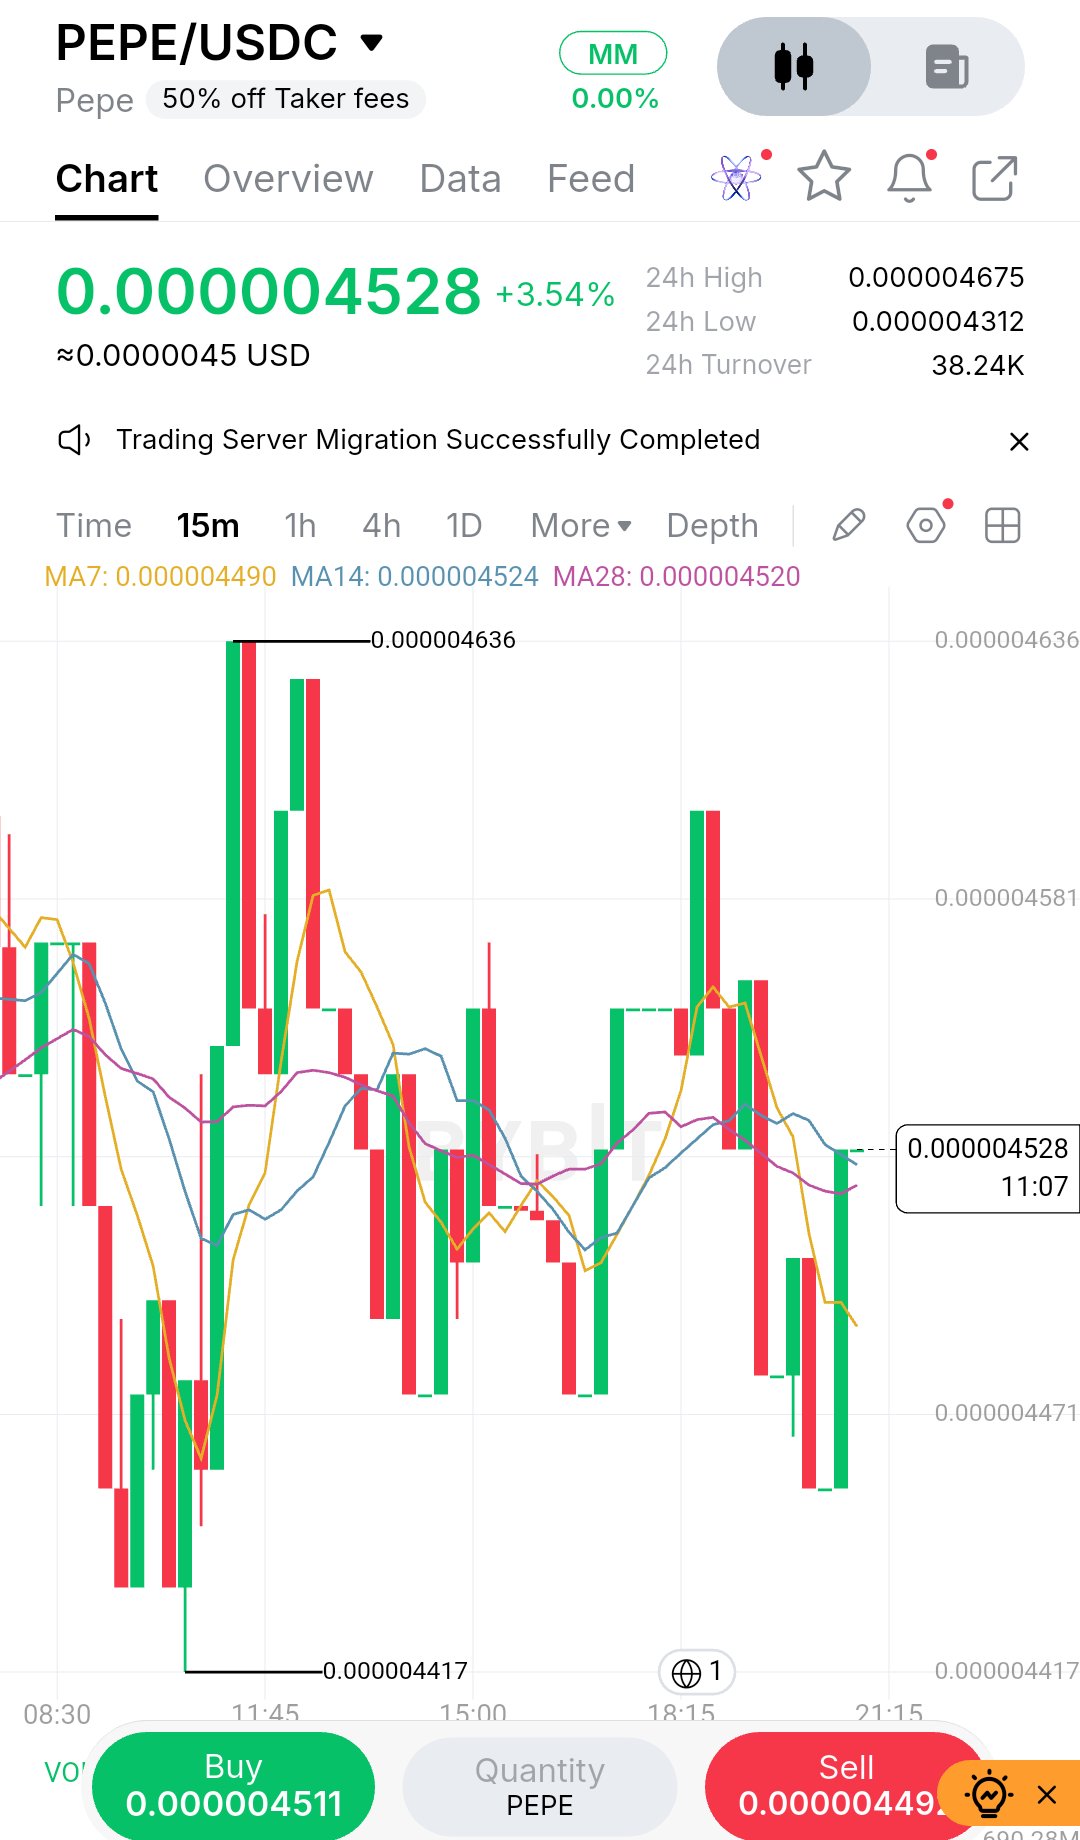
← SPEPEUSDT - I marked this area as a potential liquidity sweep, but I don't think the chart has earned that label yet. PEPE just suffered a sharp rejection from roughly $0.0000054 and returned almost directly to the rising structure that has supported the broader daily recovery. Price is now around $0.00000457, exactly where my ascending trendline and the $0.0000042- $0.00000455 reaction area begin to overlap. That confluence makes the location interesting. It does not make the reversal confirmed. For me, the next daily candle sequence matters more than the wick itself. The first test is whether PEPE can keep closing above the rising support instead of spending time below it. The second is whether buyers can recover the latest candle high around $0.00000468 and then begin trading back through the structure lost during the sell-off. If both happen, I would read the move below the local lows as rejection rather than successful acceptance lower. That would put the recent $0.0000054 high back into play. Only after that level is recovered would the upper channel area near $0.0000057 become a serious continuation objective. Risk Management If price starts accepting below the trendline and eventually loses the lower edge of my marked area around $0.0000042, then my bullish interpretation is wrong. In that case I would rather reassess the structure than keep defending the word "liquidity sweep." So I'm bullish here, but for a specific reason: PEPE has reached a location where buyers have the opportunity to prove that the larger rising structure is still alive. The blue arrow is my scenario. The reaction from this zone will decide whether the market agrees with it. $PEPEUSDT #IMPACTbyTrade
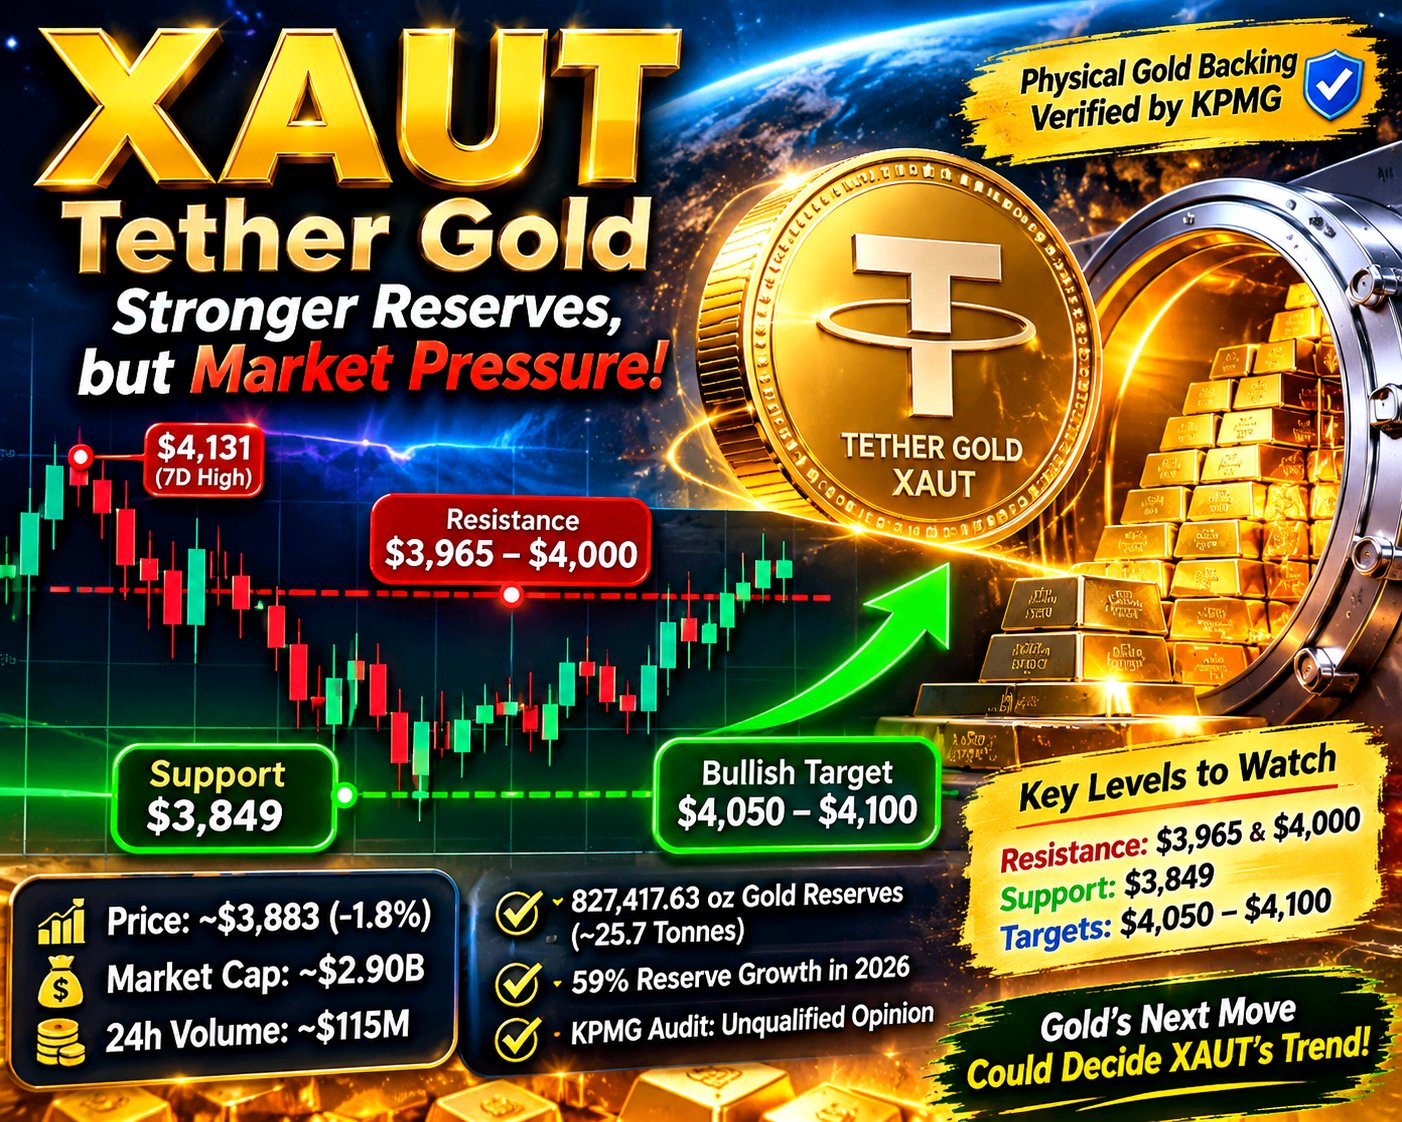
Tether Gold (XAUT) is facing an important market test. Confidence in its physical gold backing has improved following independent verification, while falling bullion prices continue to weigh on its market performance. The interesting part is that XAUT's physical reserves have expanded significantly even as gold prices have come under pressure. XAUT is trading around $3,883, down approximately 1.8% over 24 hours and 4.1% over seven days. Its market capitalization stands near $2.90B, with daily spot volume around $115M. Price is struggling below $4,000, making $3,965 the first important resistance level. On the downside, $3,849 remains a key support zone. A major development arrived on November 12, when KPMG U.S. issued an unqualified opinion on TG Commodities' 2025 financial statements after physically inspecting and counting the gold bars backing XAUT. At December 31, 2025, the company reported 520,089.350 fine troy ounces of allocated gold against 520,089.300 XAUT in circulation. The latest Q3 disclosure also showed substantial growth. Physical gold reserves reached 827,417.63 ounces, matching the number of XAUT tokens in circulation. That's approximately 25.7 tonnes of gold valued at $3.44B. Reserves reportedly increased 59% during 2026, while customer holdings grew 73% since the beginning of the year. However, the distinction matters: KPMG's audit covers the 2025 financial statements, not a real-time verification of current reserves. The newer Q3 figures come from a separate management disclosure. Market conditions remain challenging. Futures open interest is around $836.8M, while funding remains positive at approximately 0.0136% every eight hours. Around $1.05M in positions were liquidated, with nearly 97% coming from longs. Spot netflows also indicate approximately $7.5M in outflows. This combination suggests leveraged buyers remain exposed, particularly while prices continue declining. Key levels to watch - Resistance: $3,965 and $4,000 - Bullish targets: $4,050–$4,100 - Support: $3,849 - Lower downside area: $3,800 A sustained recovery above $4,000, supported by genuine spot demand and stronger bullion prices, could improve the bullish outlook. However, losing $3,849 would increase the risk of another downward move. My take XAUT's growing physical reserves and independent audit provide meaningful confidence in its backing. But strong reserves don't guarantee price stability. XAUT still follows the underlying gold market, and current derivatives activity shows that traders remain vulnerable. The real question now is whether gold can stabilize and buyers can push XAUT back above $4,000. $XAUTUSDT #ByXIMPACT
HYPE is more than just another speculative crypto token. Hyperliquid has built a business that generates substantial trading income, uses fees to purchase its native token and continues attracting institutional attention. However, strong fundamentals don't automatically guarantee an upward price trend. Trading around $72, HYPE is facing a critical battle between buyers defending $69–$70 and sellers protecting the $73.30–$75 resistance zone. A convincing breakout could open the door toward $79–$80, while losing support may send price toward $66–$67. What makes Hyperliquid interesting is its revenue model. The protocol generated approximately $89.6M in fees over 30 days, including $68.7M in protocol revenue. Its TVL remains substantial at roughly $7.75B, although the recent decline suggests liquidity conditions need monitoring. The buyback mechanism adds another layer to the investment case. Around 98–99% of protocol fees flow toward the Assistance Fund, which purchases HYPE directly from the market. Recent activity points to roughly $58M spent acquiring 829,300 tokens in 30 days. Institutional participation is another development worth watching. Hyperliquid Strategies increased its treasury holdings to approximately 38.5M HYPE, while its futures commission merchant application could potentially expand institutional access. But there is a catch: supply. With approximately 252.8M tokens circulating against a maximum supply of 1 billion, contributor unlocks could create consistent selling pressure. Buybacks help absorb demand, but their effectiveness depends on how many tokens are purchased compared with how many enter circulation. Leverage also adds risk. Open interest sits near $3.25B, funding remains positive, and recent liquidations have heavily affected long positions. That makes the $69–$70 support zone particularly important. My market outlook: - Bullish: Reclaim $73.30, hold above $75, and target $79–$80. - Bearish: Lose $69–$70 and watch for a possible move toward $66–$67. Hyperliquid has something many crypto projects struggle to prove: actual revenue and a mechanism that connects platform activity with token demand. The real question now is whether growing revenue and buybacks can overcome token unlocks, declining liquidity and competition. HYPE has the fundamentals. Now the market needs to prove its confidence. $HYPEUSDT #ByXIMPACT
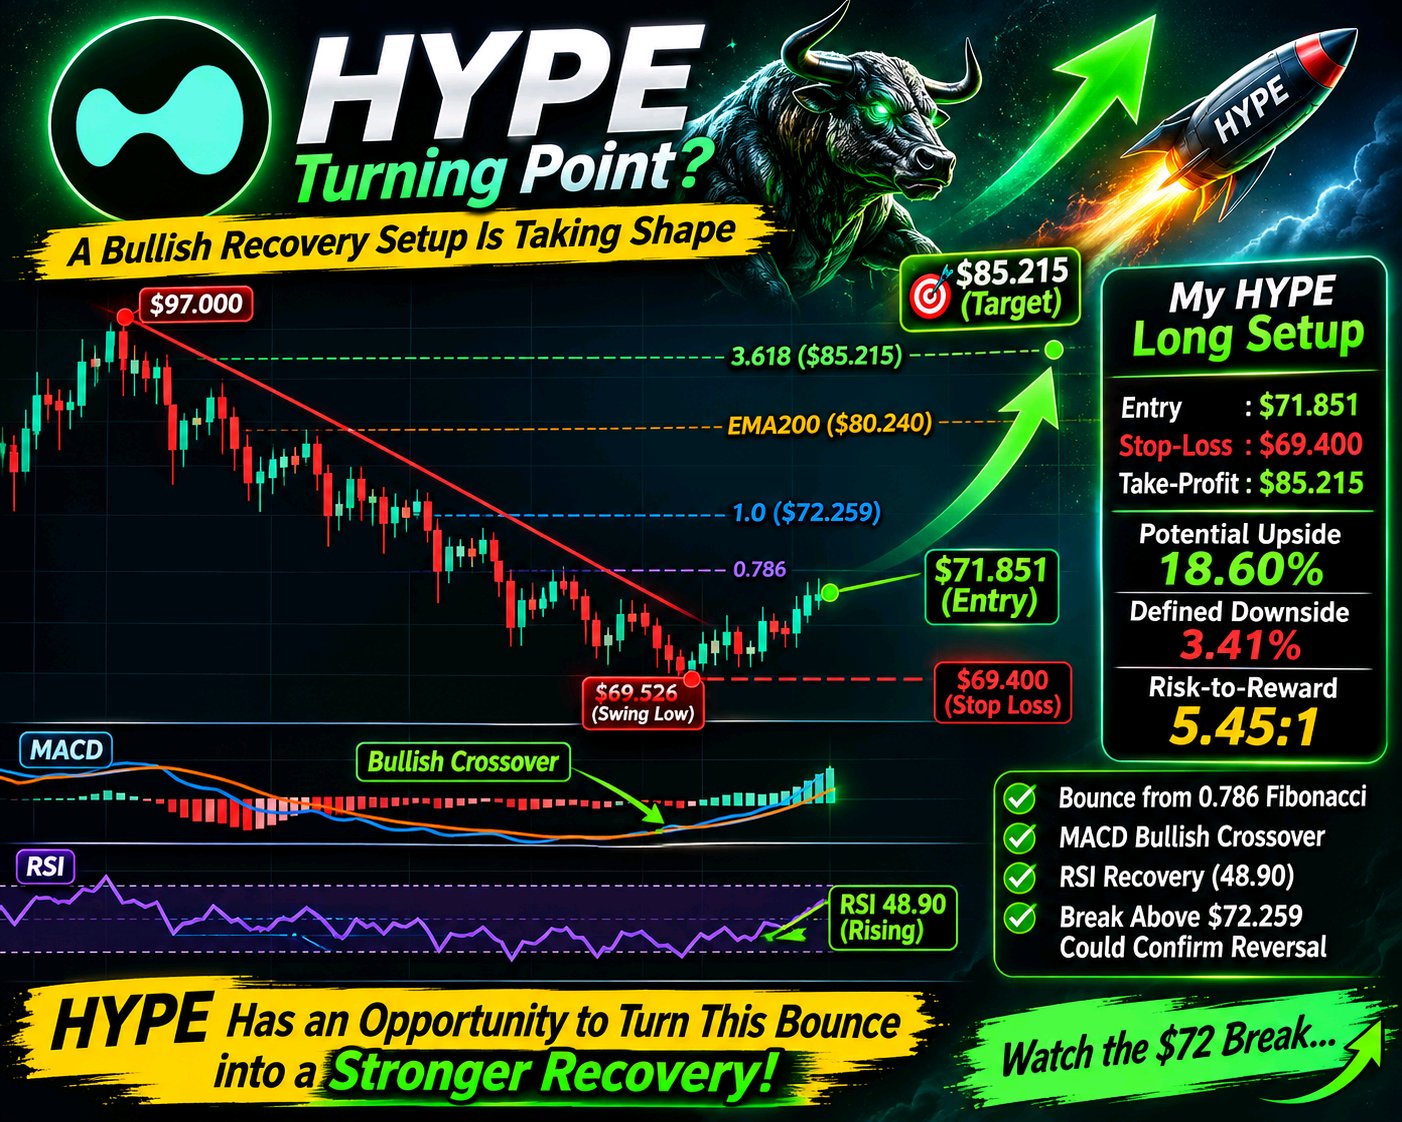
HYPE is showing early signs of a potential recovery after bouncing from the 0.786 Fibonacci level. The broader downtrend from $97 is still intact, but the 4H chart is starting to show a shift in momentum. Price recently touched $69.526 before recovering toward $71.85. Meanwhile, MACD has produced a bullish crossover with a positive histogram, while RSI has climbed to 48.90, moving above RSI12 at 43.80 and RSI24 at 41.07. These signals suggest selling pressure may be weakening, although a confirmed trend reversal is still needed. Key Levels I'm Watching The first important resistance is $72.259. A sustained breakout above this level, followed by a higher low, could strengthen the bullish structure. If buyers take control, the next upside targets are: - $80.266 – First major target - $80.240 – EMA200 resistance region - $85.215 – Final target My HYPE Long Setup Entry: $71.851 Stop-Loss: $69.400 Take-Profit: $85.215 Potential Upside: 18.60% Defined Downside: 3.41% Risk-to-Reward: 5.45:1 I'm treating this as a short-term recovery trade, not a return to my previous $100 prediction. If price breaks below $69.400, the setup is invalidated, and I won't move my stop-loss just to keep the trade alive. My focus is on confirmation, not blindly trusting indicators. MACD and RSI are improving, but buyers still need to break the lower-high structure. HYPE has an opportunity to turn this bounce into a stronger recovery. Now I'm watching whether buyers can deliver the confirmation. $HYPEUSDT #IMPACTbyTrade
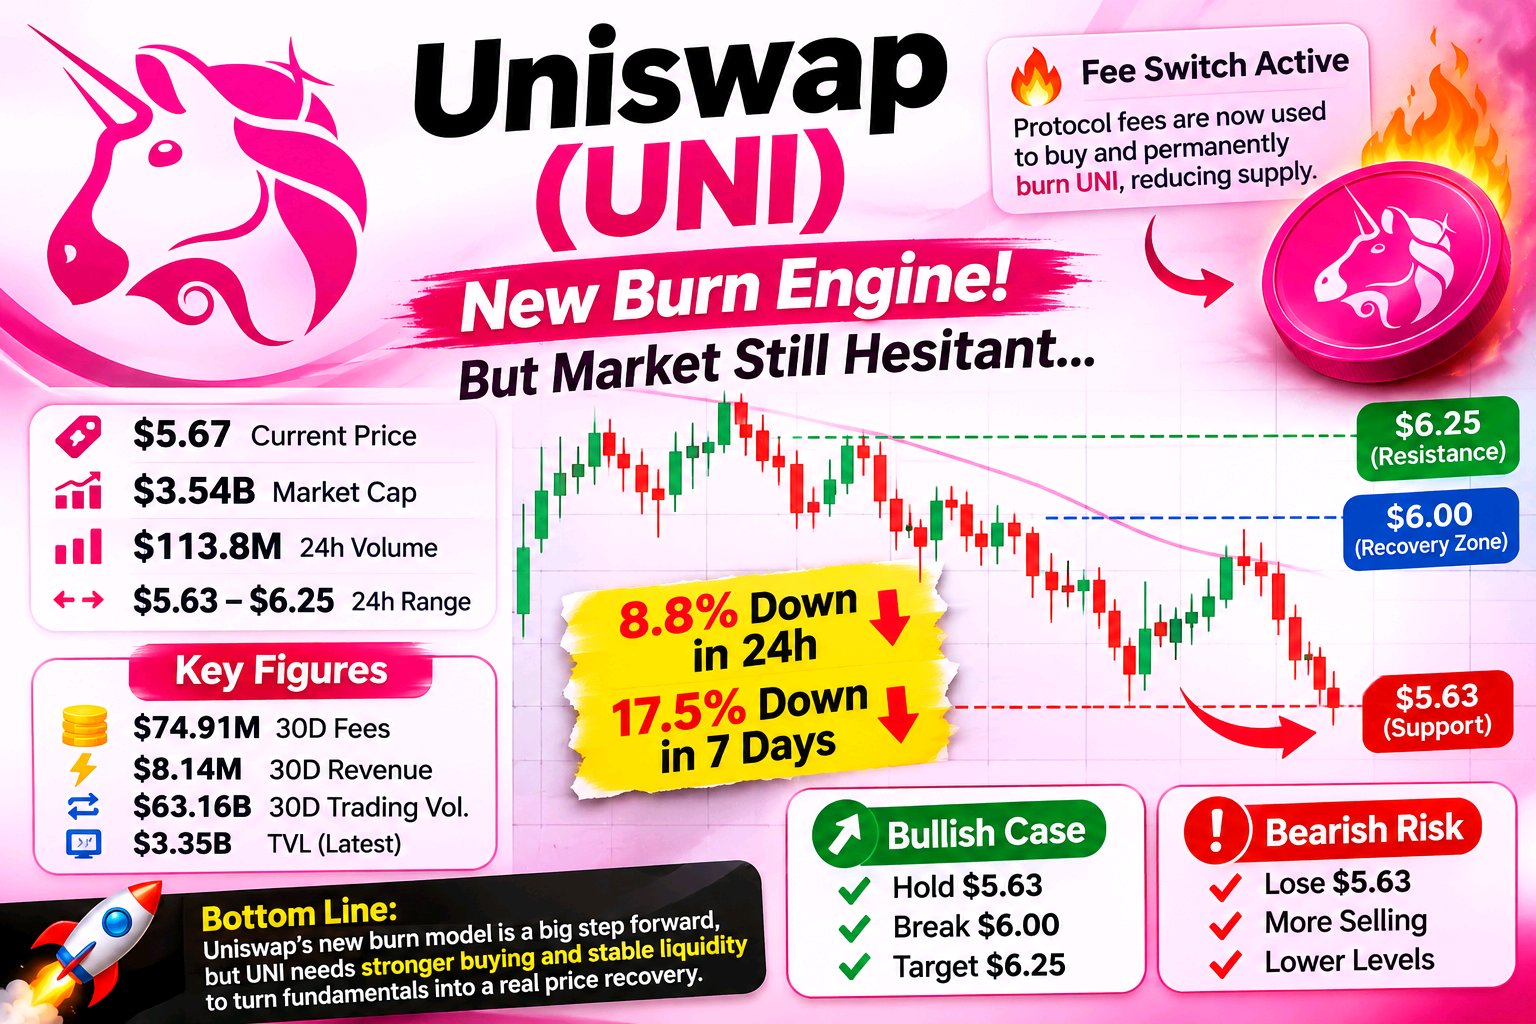
Uniswap is making a major shift in how UNI captures value. Its fee-switch mechanism now connects protocol activity with permanent token burns, creating a stronger economic link between platform usage and token supply. But there is a problem: the fundamentals are improving while market sentiment continues to deteriorate. UNI is hovering around $5.67, with an 8.8% daily decline and a 17.5% weekly loss. Selling pressure remains intense, and price is struggling to hold the $5.63 support zone. On the fundamental side, Uniswap has processed roughly $63.16B in monthly trading volume, generating $74.91M in fees and approximately $8.14M in protocol revenue. These figures highlight the scale of its business, while fee-funded UNI burns introduce a potential long-term supply catalyst. However, this doesn't mean UNI holders receive direct cash distributions. The benefit comes through reducing circulating supply over time. There are reasons to remain cautious. TVL has dropped around 13.1% over 30 days, futures open interest has contracted 13.05%, and spot markets are showing approximately $13.7M in net outflows. Nearly $4.22M in liquidations, mostly from long positions, adds further evidence of weakening bullish conviction. Levels I'm watching: - $5.63 — Critical support - $6.00 — First recovery target - $6.25 — Breakout confirmation zone If UNI protects $5.63 and reclaims $6.00, buyers could attempt a stronger recovery toward $6.25. Losing support, however, would leave the market vulnerable to another bearish move. My view: Uniswap is building a stronger economic foundation for UNI, but a better token model doesn't automatically create immediate buying demand. The real test is whether protocol revenue, consistent burns and recovering liquidity can eventually turn into sustained market strength. $UNIUSDT #ByXIMPACT
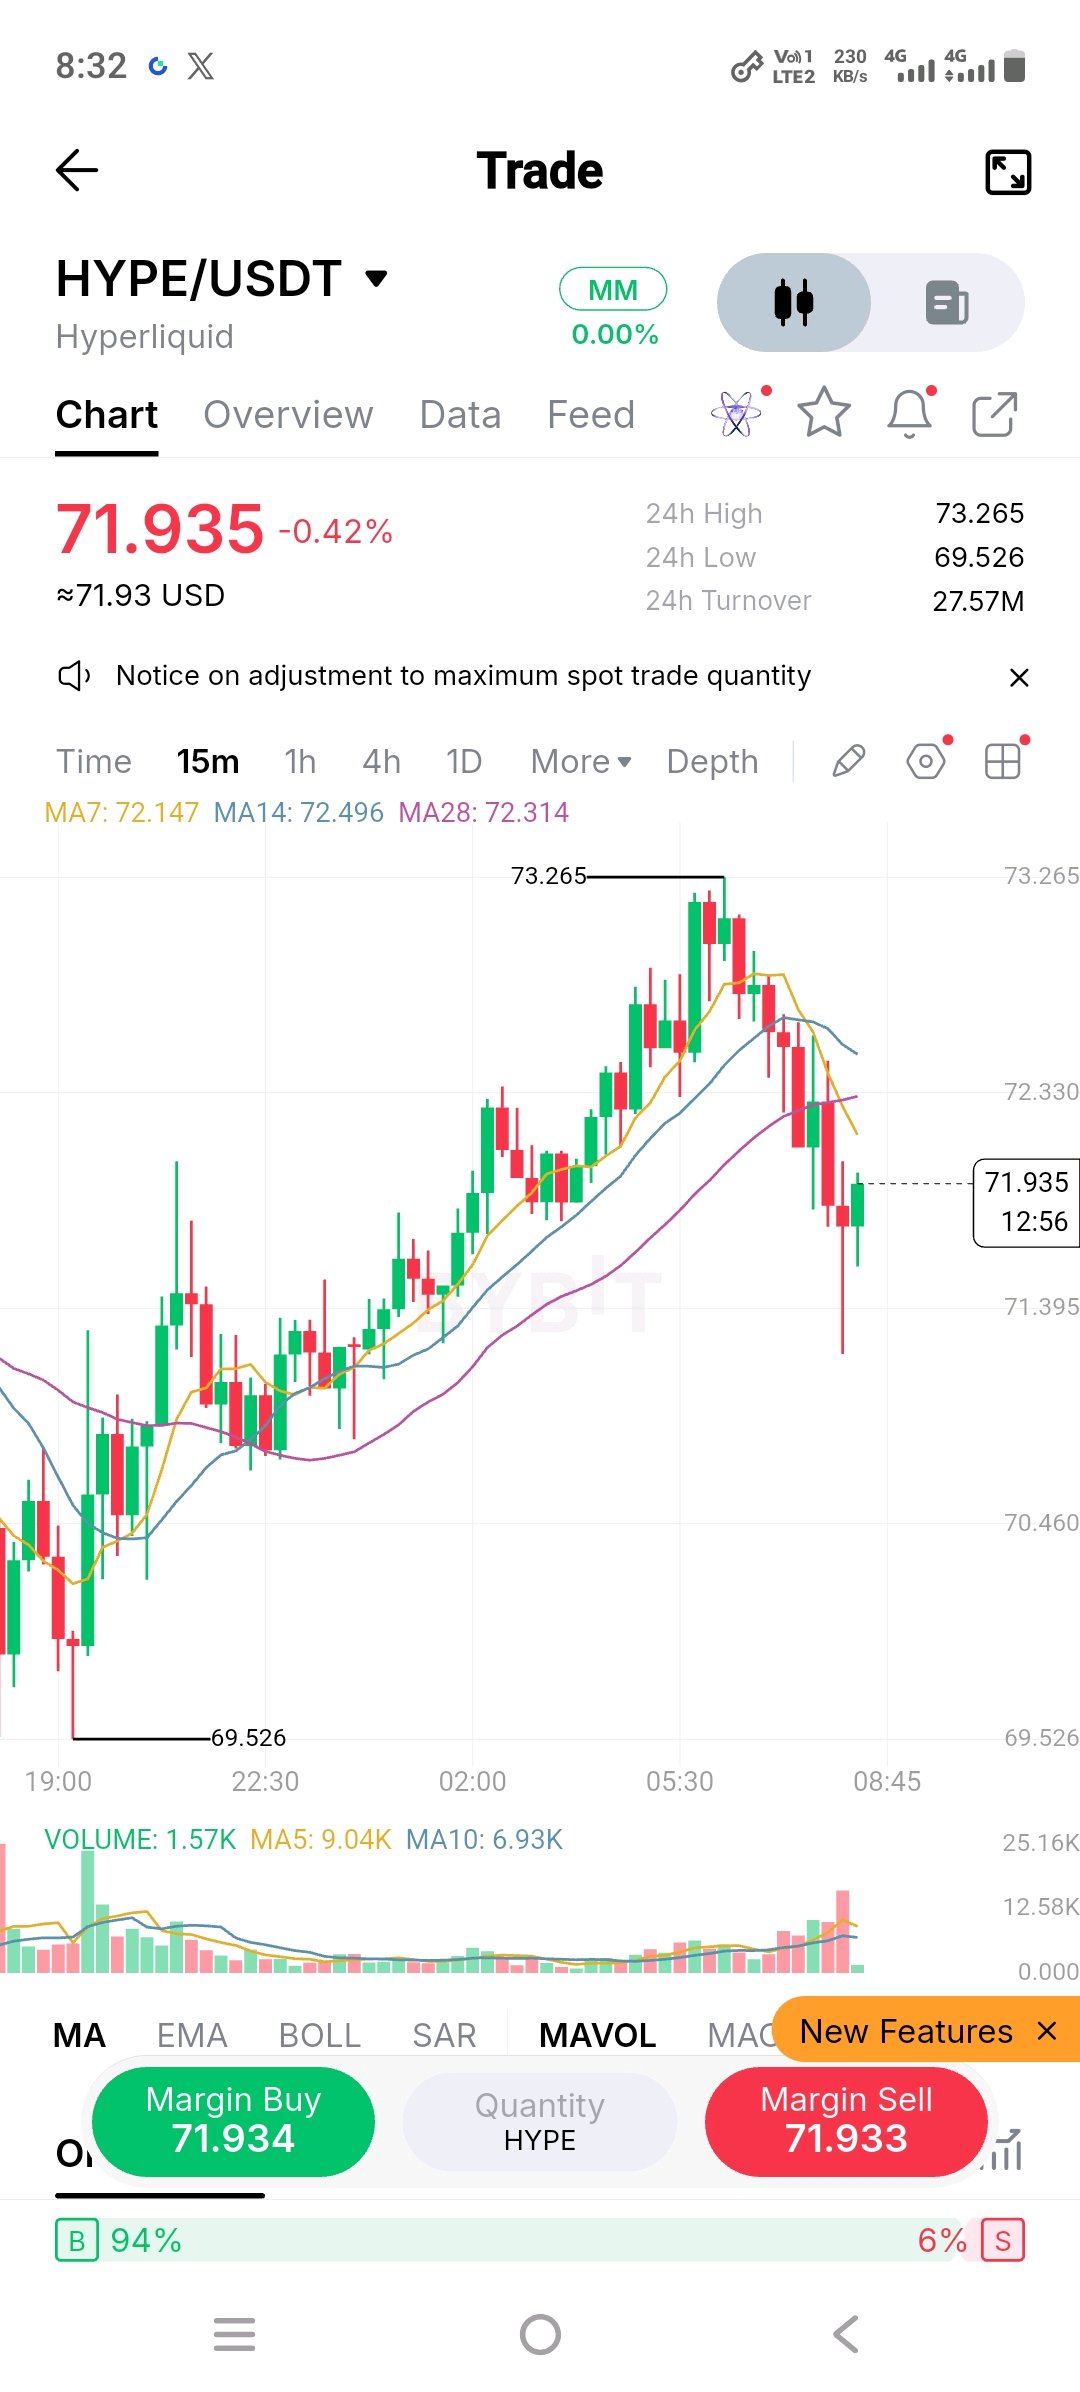
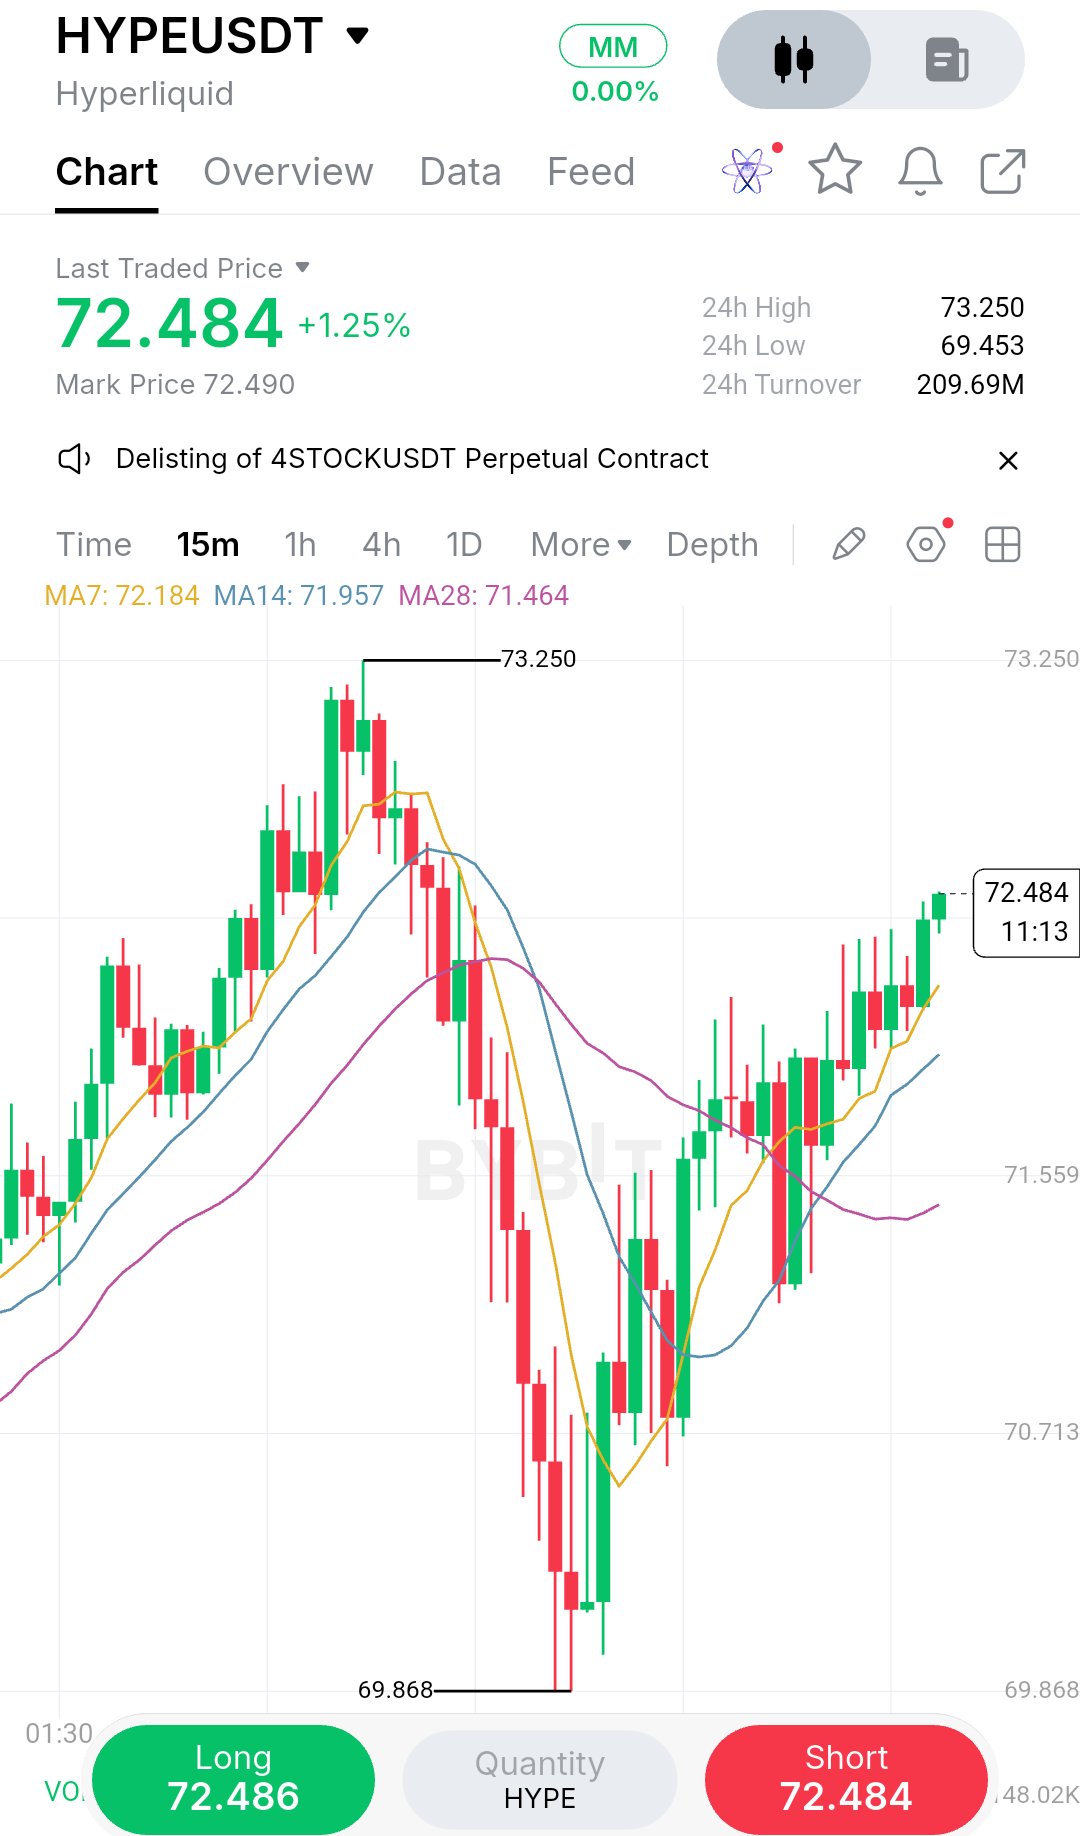
HYPE/USDT: Buyers Need to Prove Their Strength After a Sharp Pullback HYPE is approaching an important decision zone, and I am watching how buyers react after the rejection near $73.265. At the time of the supplied 15-minute chart, HYPE was trading around $71.935, down 0.42%. Price has slipped below all three moving averages: - MA7: $72.147 - MA14: $72.496 - MA28: $72.314 This tells me short-term momentum has weakened, even though the broader recovery structure has not completely broken. Key levels I am watching: - Immediate support: $71.40–$71.20 - Major support: $69.526 - First resistance: $72.15 - Strong resistance: $72.50 - Major upside level: $73.265 A recovery above $72.50, supported by stronger volume, could open the door for another attempt at $73.265. However, losing the $71.20 area could expose HYPE to another move toward lower support. There are also fundamental developments worth watching. Hyperliquid recently recorded approximately $75 million in gross fees over 30 days, while its Assistance Fund spent around $58 million buying HYPE. Upbit also listed HYPE on November 10 against KRW, BTC and USDT, expanding its trading access. These developments support the longer-term ecosystem story, but they do not guarantee an immediate price recovery. My strategy: I am not chasing this bounce. I want to see buyers reclaim the moving averages and confirm strength with volume before considering a LONG position. Risk management remains essential. The next move depends on whether buyers can turn this pullback into a recovery or sellers continue controlling the short-term trend.#ByXIMPACT $HYPEUSDT