Sajid Khan
1586Like0Shares47Fans73Follow
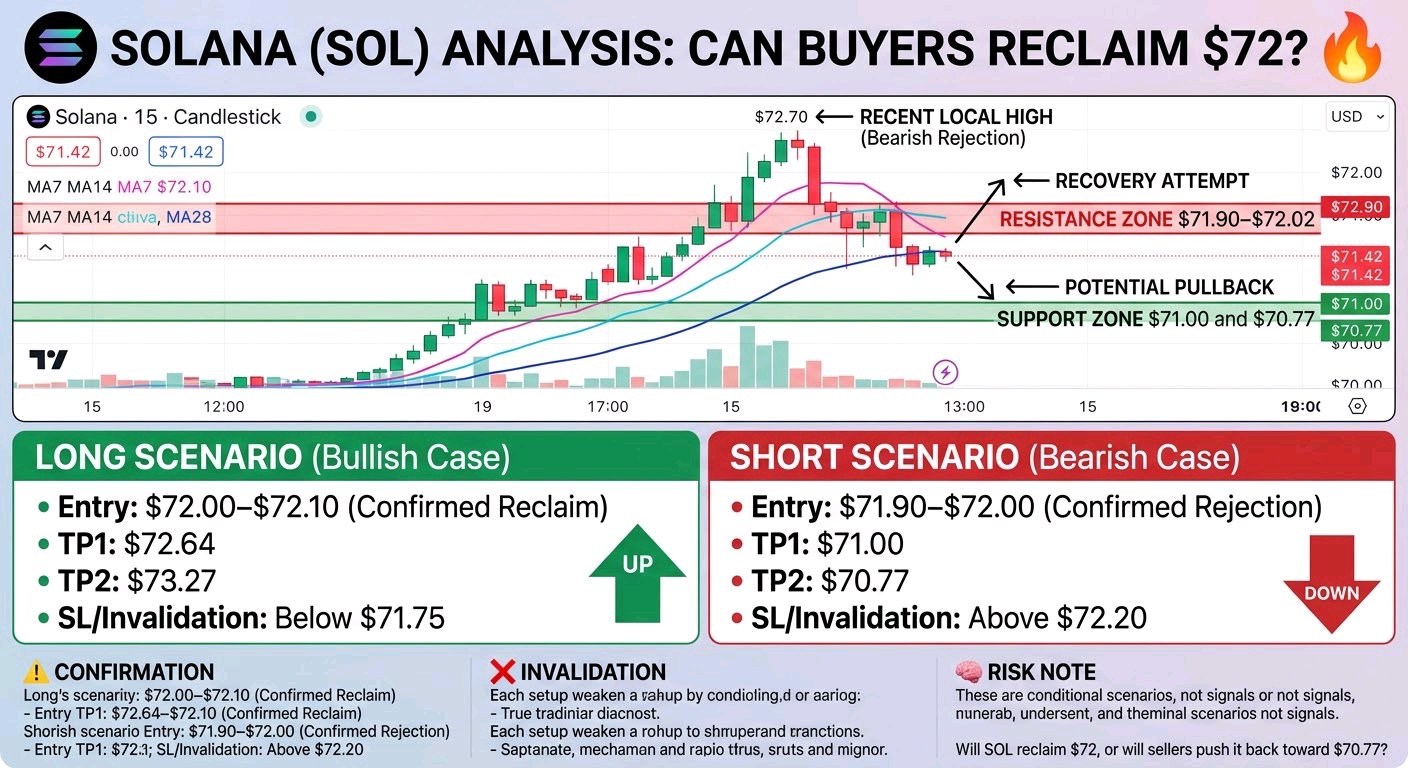
$SOLUSDT Faces a Critical Test: Can Buyers Reclaim $72? SOL is trading at $71.42, up 5.09% over 24 hours. However, the 15-minute chart shows a sharp pullback from the recent local high, followed by a small recovery. The next move around the moving-average resistance could determine short-term direction. Market Structure: Short-term structure looks bearish after the rejection near $72.6–$72.7. Price is currently below MA7 ($71.47), MA14 ($71.94), and MA28 ($71.90), showing that sellers still have an advantage. Key Support: $71.00 and $70.77 Key Resistance: $71.90–$72.02 and $72.64–$72.70 Potential Setup: LONG Scenario Entry: $72.00–$72.10 after a confirmed reclaim TP1: $72.64 TP2: $73.27 SL / Invalidation: Below $71.75 SHORT Scenario Entry: $71.90–$72.00 if price faces a confirmed rejection TP1: $71.00 TP2: $70.77 SL / Invalidation: Above $72.20 Confirmation: A strong 15-minute close above $72.00 could support a recovery attempt. Continued rejection around the moving averages may favor another move toward support. Invalidation: A sustained breakout above the resistance zone weakens the bearish scenario, while a decisive breakdown below $70.77 invalidates the current support-based recovery idea. Risk Note: These are conditional chart scenarios, not guaranteed signals. Wait for confirmation, manage position size, and always use appropriate stop-loss protection. Do you think SOL can reclaim $72, or will sellers push it back toward $70.77? #ByXIMPACT
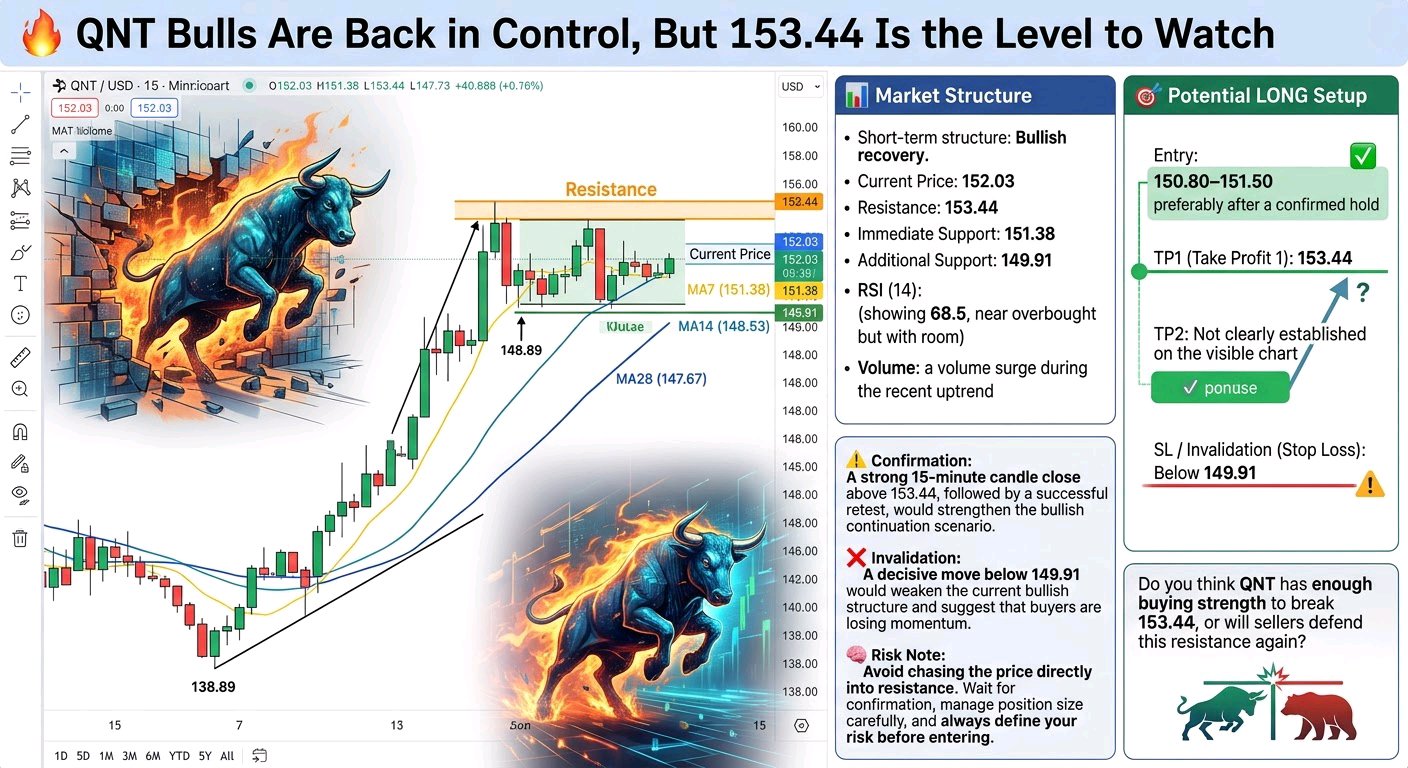
$QNTUSDT Bulls Are Back in Control, But 153.44 Is the Level to Watch QNT is showing an encouraging recovery on the 15-minute chart. After finding a bottom near 138.89, buyers pushed price strongly upward toward 153.44. Now the market is taking a short pause around 152.03. The next move around resistance could determine whether this recovery continues. Market Structure: * Short-term structure: Bullish recovery. * Current Price: 152.03 * Resistance: 153.44 * Immediate Support: 151.38 * Additional Support: 149.91 * MA7: 151.38 * MA14: 148.53 * MA28: 147.67 Price is trading above all three visible moving averages, suggesting buyers currently have the short-term advantage. However, resistance at 153.44 remains an important hurdle. Potential LONG Setup: Entry: 150.80–151.50, preferably after a confirmed hold. TP1: 153.44 TP2: Not clearly established on the visible chart. SL / Invalidation: Below 149.91. Confirmation: A strong 15-minute candle close above 153.44, followed by a successful retest, would strengthen the bullish continuation scenario. Invalidation: A decisive move below 149.91 would weaken the current bullish structure and suggest that buyers are losing momentum. Risk Note: Avoid chasing the price directly into resistance. Wait for confirmation, manage position size carefully, and always define your risk before entering. Do you think QNT has enough buying strength to break 153.44, or will sellers defend this resistance again? #ByXIMPACT
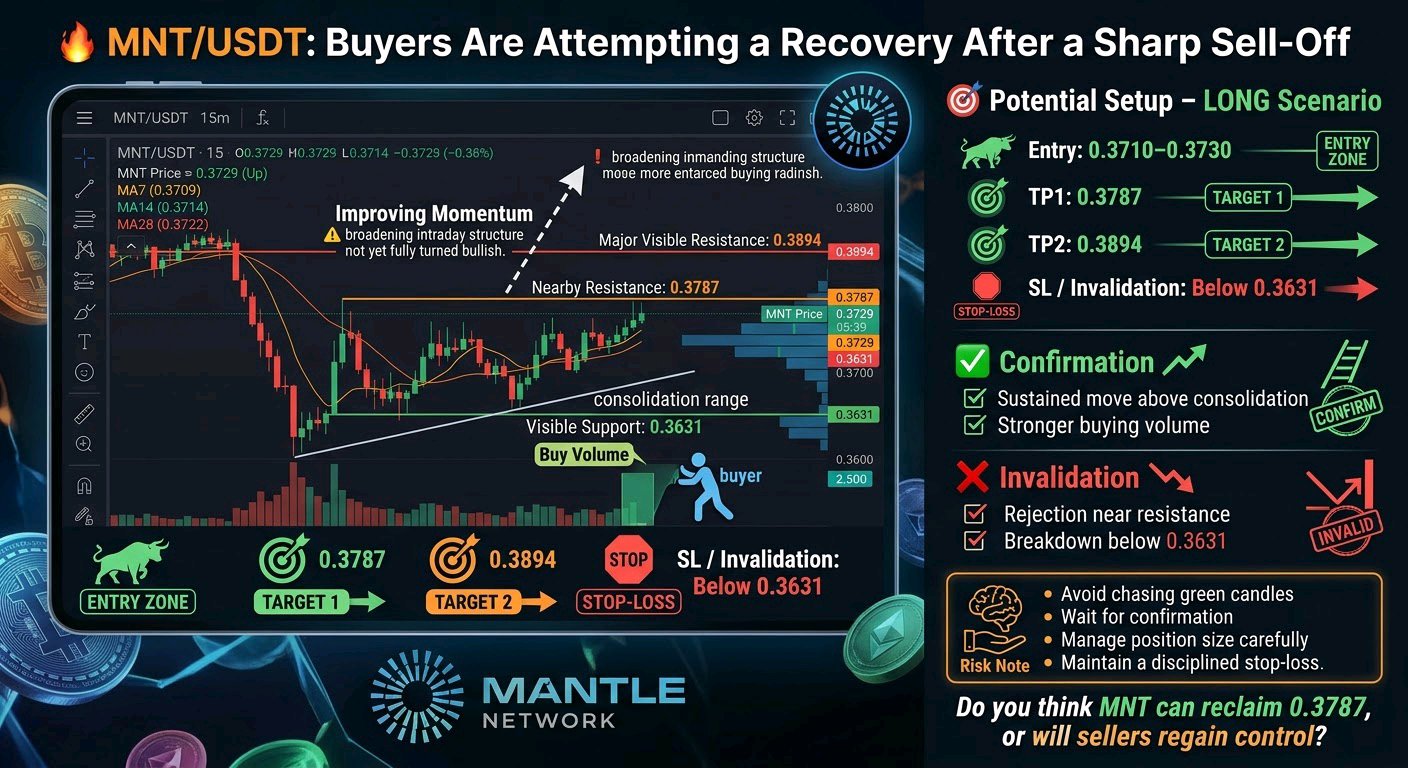
$MNTUSDT Buyers Are Attempting a Recovery After a Sharp Sell-Off MNT is showing early signs of recovery after a strong downward move. The price is currently around 0.3729, up from the visible low of 0.3631, but buyers still need to prove they can push through nearby resistance. Market Structure: The 15-minute chart shows a sharp bearish decline from the 0.3894 area, followed by a rebound and sideways consolidation. Price is now trading above the MA7 (0.3709), MA14 (0.3714), and MA28 (0.3722), suggesting improving short-term momentum. However, the broader intraday structure has not fully turned bullish. Visible support: 0.3631 Nearby resistance: 0.3787 Major visible resistance: 0.3894 Potential Setup – LONG Scenario: Entry: 0.3710–0.3730 TP1: 0.3787 TP2: 0.3894 SL / Invalidation: Below 0.3631 Confirmation: A sustained move above the nearby consolidation range, supported by stronger buying volume, would improve the bullish scenario. Invalidation: A rejection near resistance followed by a breakdown below 0.3631 would invalidate the recovery setup and strengthen the bearish outlook. Risk Note: Avoid chasing green candles. Wait for confirmation, manage position size carefully, and maintain a disciplined stop-loss. Do you think MNT can reclaim 0.3787, or will sellers regain control? #ByXIMPACT
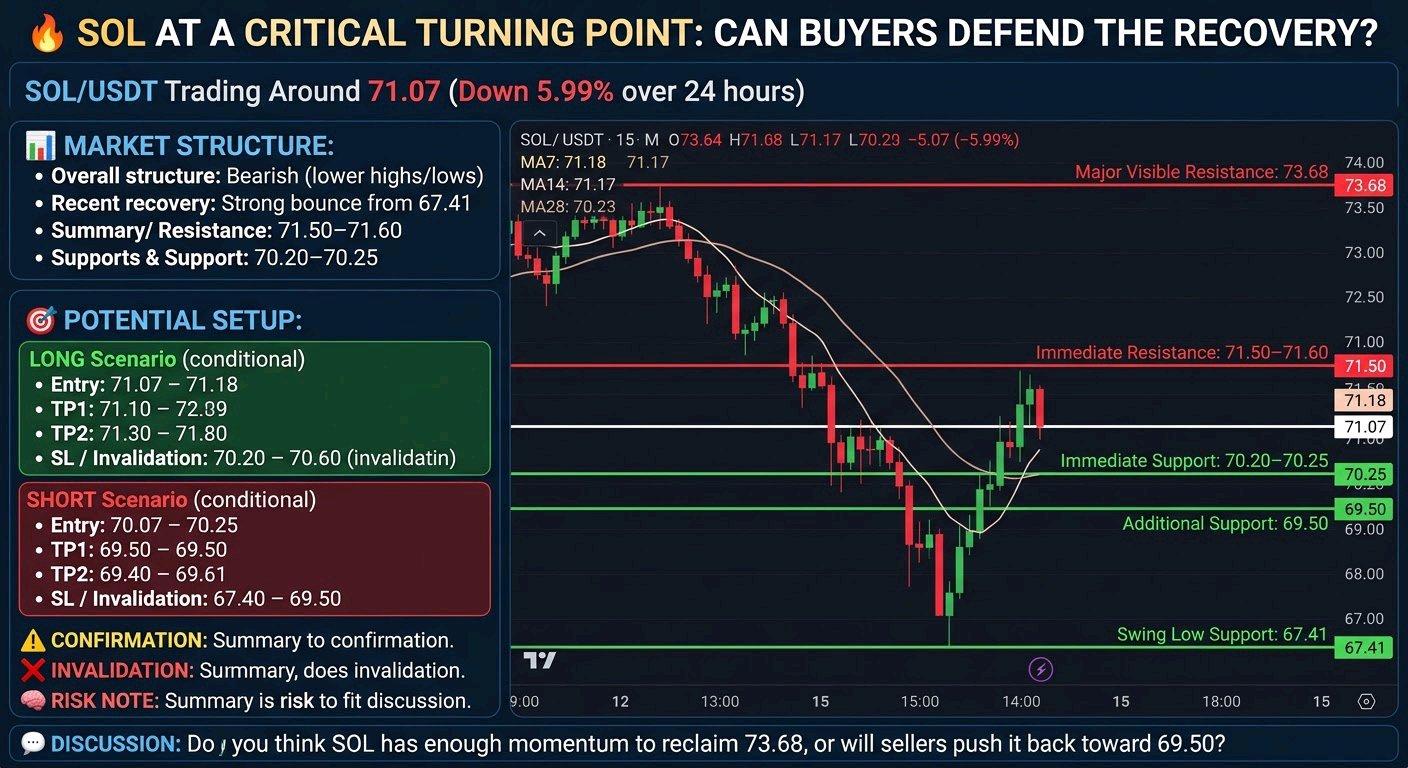
$SOLUSDT at a Critical Turning Point: Can Buyers Defend the Recovery? SOL/USDT is trading around 71.07, down 5.99% over 24 hours. The 15-minute chart shows a significant decline followed by a sharp recovery from 67.41. However, the latest candles suggest that bullish momentum is cooling near 71.50–71.60 resistance. Market Structure: * Overall structure: Bearish, with lower highs and lower lows. * Recent recovery: Strong bounce from 67.41. * Immediate resistance: 71.50–71.60. * Major visible resistance: 73.68. * Immediate support: Around 70.20–70.25. * Additional support: 69.50, followed by 67.41. MA7 (71.18) and MA14 (71.17) are slightly above the current price, while MA28 (70.23) remains below it. This suggests short-term hesitation after the rebound. Potential Setup: LONG Scenario (conditional) Entry: 71.20–71.60 after a confirmed breakout and successful retest. TP1: 71.60 TP2: 73.68 SL / Invalidation: Below 70.20 SHORT Scenario (conditional) Entry: 71.20–71.55 after clear rejection from resistance. TP1: 70.23 TP2: 69.50 SL / Invalidation: Above 71.75 Confirmation: For buyers, a strong 15-minute candle close above 71.60 would improve the recovery outlook. For sellers, rejection around resistance followed by a break below 70.20 would strengthen bearish continuation. Invalidation: A sustained breakout above resistance weakens the short scenario, while a breakdown below 70.20 weakens the immediate bullish recovery scenario. Risk Note: The market is sitting between short-term resistance and support. Avoid chasing candles. Wait for confirmation, use controlled position sizing, and always protect your capital with a defined stop-loss. Discussion: Do you think SOL has enough momentum to reclaim 73.68, or will sellers push it back toward 69.50? #ByXIMPACT
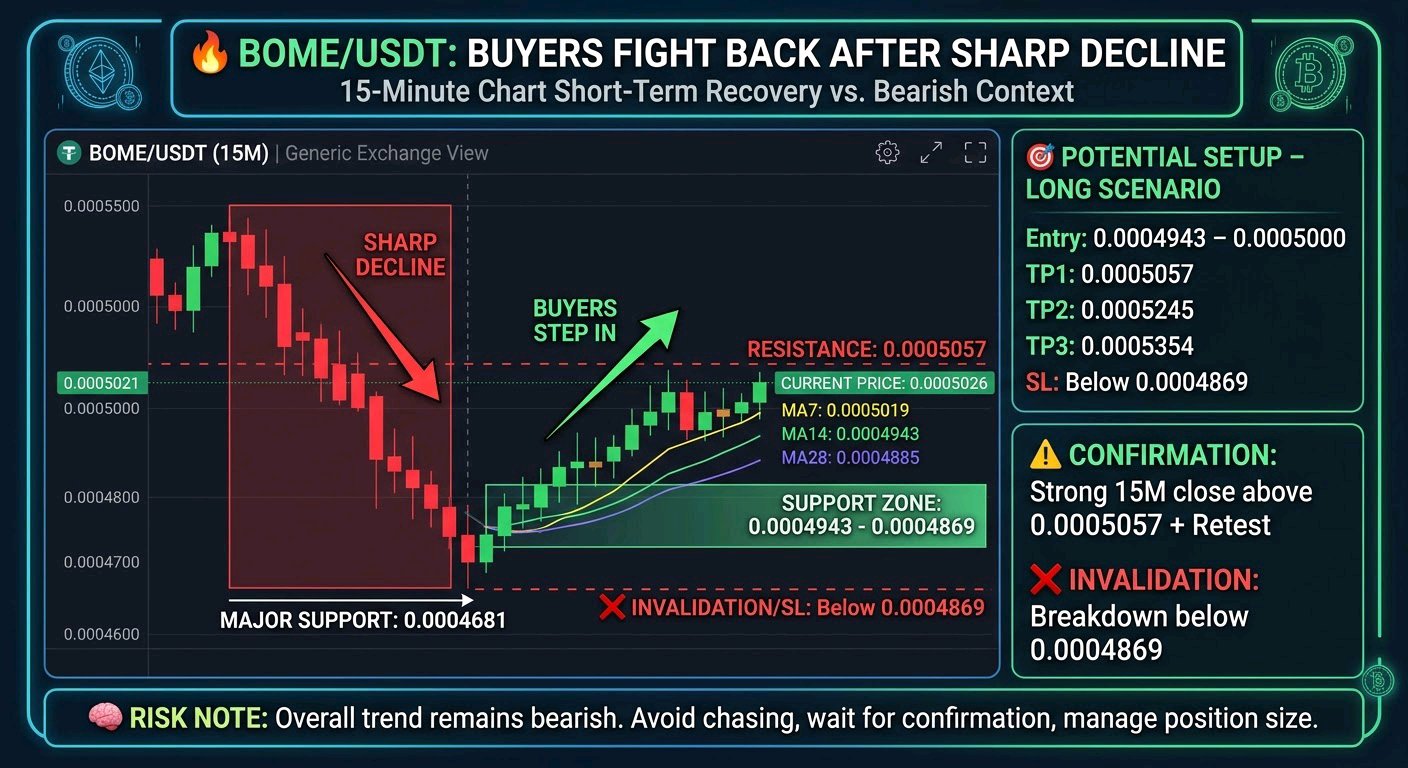
$BOMEUSDT Buyers Are Fighting Back After a Sharp Decline BOME is showing an encouraging short-term recovery on the 15-minute chart, but the bigger picture still deserves caution. After dropping toward 0.0004681, buyers stepped in and pushed the price back to 0.0005026. The question now is whether this recovery can turn into a stronger reversal. Market Structure: The broader structure remains bearish after the previous downward move. However, short-term momentum has improved. Current price: 0.0005026 MA7: 0.0005019 MA14: 0.0004943 MA28: 0.0004885 Price is currently above all three moving averages, suggesting improving short-term strength. Support: 0.0004943 – 0.0004869 Major support: 0.0004681 Resistance: 0.0005057 Potential Setup – LONG Scenario: Entry: 0.0004943 – 0.0005000 TP1: 0.0005057 TP2: 0.0005245 TP3: 0.0005354 SL / Invalidation: Below 0.0004869 Confirmation: A strong 15-minute candle close above 0.0005057, followed by a successful retest, would strengthen the bullish scenario. Invalidation: A breakdown below 0.0004869 could weaken the recovery and expose the major support around 0.0004681. Risk Note: The overall trend has not fully reversed yet. Avoid chasing green candles, manage position size carefully, and wait for confirmation before considering an entry. Do you think BOME can break 0.0005057 and continue its recovery, or will sellers take control again? #ByXIMPACT
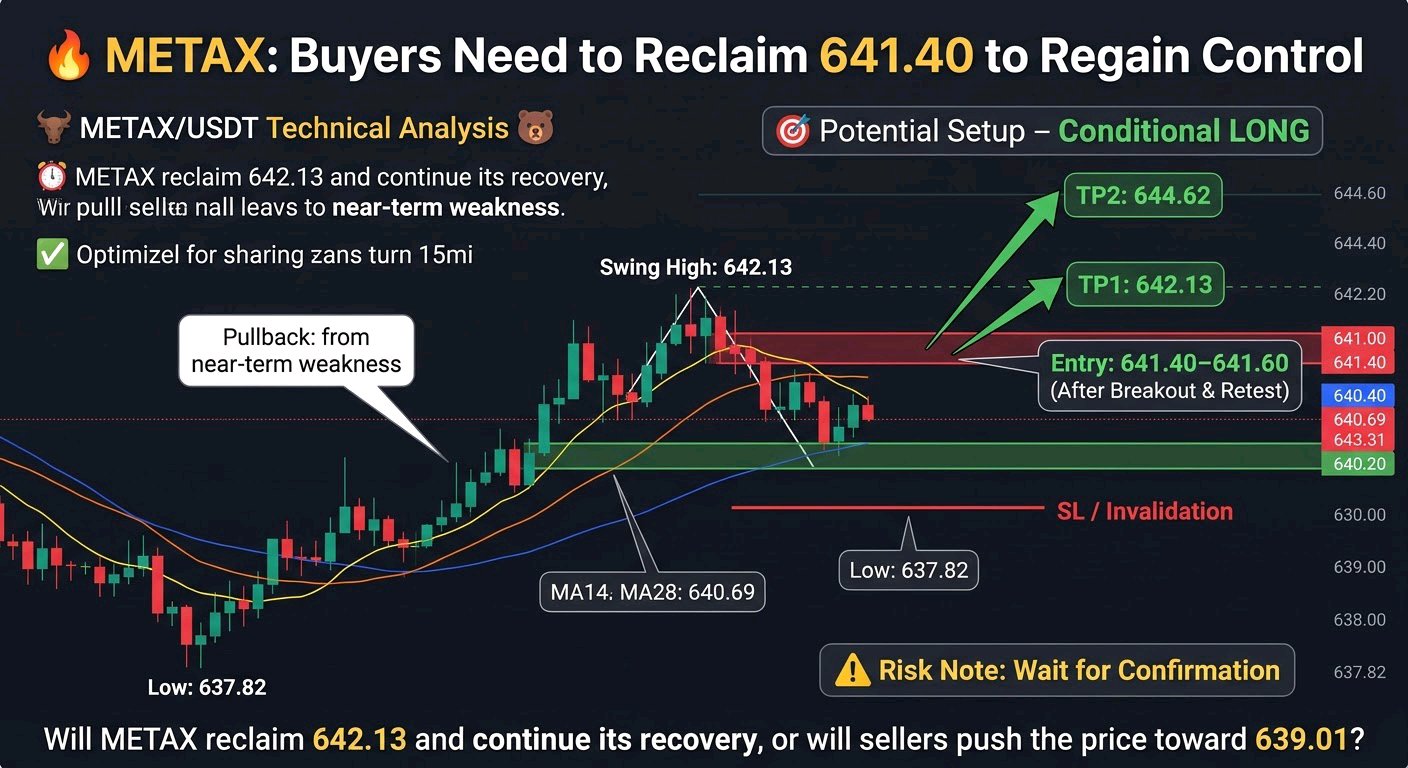
$METAXUSDT Buyers Need to Reclaim 641.40 to Regain Control METAX/USDT is showing an interesting recovery structure on the 15-minute chart, but the latest candles suggest that short-term buying momentum is cooling. Price is currently around 640.69, pulling back from the visible swing high of 642.13. Market Structure: The chart shows a recovery from 637.82 toward 642.13, followed by a short-term bearish pullback. Price is currently below MA7 (641.01), MA14 (641.39), and MA28 (641.09), suggesting near-term weakness. Support: 640.20, 639.01, and 637.82. Resistance: 641.00–641.40, followed by 642.13 and 644.62. Potential Setup – Conditional LONG: Entry: 641.40–641.60 after a confirmed breakout and retest. TP1: 642.13 TP2: 644.62 SL / Invalidation: Below 640.20. Confirmation: A strong 15-minute candle close above 641.40, followed by a successful retest, could strengthen the bullish continuation scenario. Invalidation: A sustained move below 640.20 would weaken this setup. A further decline toward 639.01 or 637.82 would indicate additional downside pressure. Risk Note: Avoid chasing candles. Wait for confirmation, manage position size carefully, and always define your risk before entering. Will METAX reclaim 642.13 and continue its recovery, or will sellers push the price toward 639.01? #ByXIMPACT
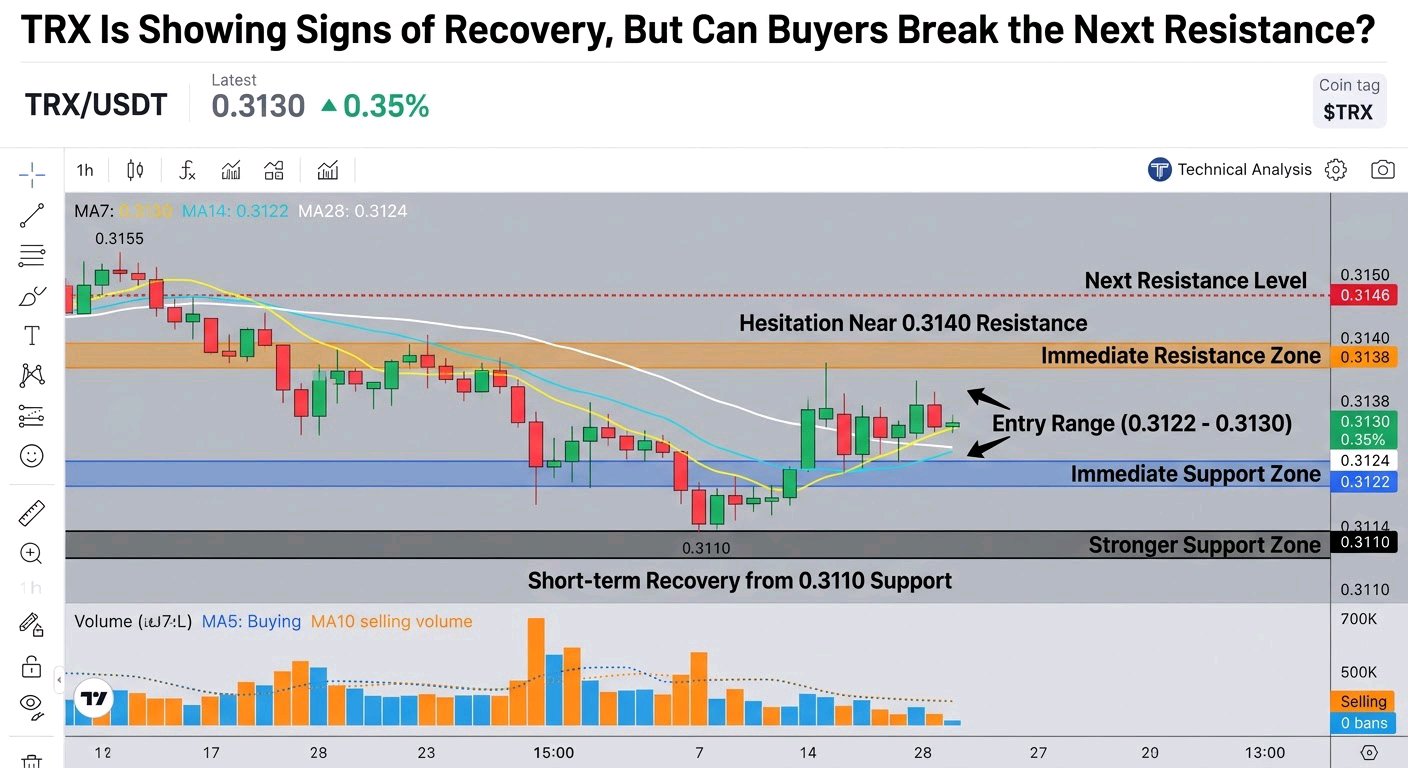
$TRXUSDT Is Showing Signs of Recovery, But Can Buyers Break the Next Resistance? TRX/USDT is trading around 0.3130, up 0.35% on the 1-hour chart. What catches my attention is the recovery from the recent 0.3110 area. Buyers have pushed price higher, although the latest red candle suggests some hesitation near the short-term resistance zone. Market Structure: The broader chart still reflects an earlier bearish move from approximately 0.3155. However, the latest recovery shows improving short-term momentum. - Immediate Support: 0.3122–0.3124 - Stronger Support: 0.3110–0.3114 - Immediate Resistance: 0.3138–0.3140 - Next Resistance: 0.3146 MA7 is at 0.3130, MA14 at 0.3122, and MA28 at 0.3124. Price is currently around these moving averages, showing a developing recovery structure. Potential Setup – LONG Scenario: Entry: 0.3122–0.3130 TP1: 0.3140 TP2: 0.3146 SL / Invalidation: Below 0.3109 Confirmation: A sustained move above 0.3135 followed by a breakout and hold above 0.3140 could strengthen the bullish scenario. Increasing buying volume would add confidence. Invalidation: A rejection near 0.3140 followed by a breakdown below 0.3122 would weaken the recovery. Losing the 0.3110 area would invalidate this bullish setup. Risk Note: The latest displayed volume is below its MA5 and MA10 volume averages. Avoid chasing candles, wait for confirmation, and use controlled position sizing with a predefined stop-loss. Do you think TRX has enough momentum to challenge 0.3140, or will sellers defend this resistance again? #ByXIMPACT
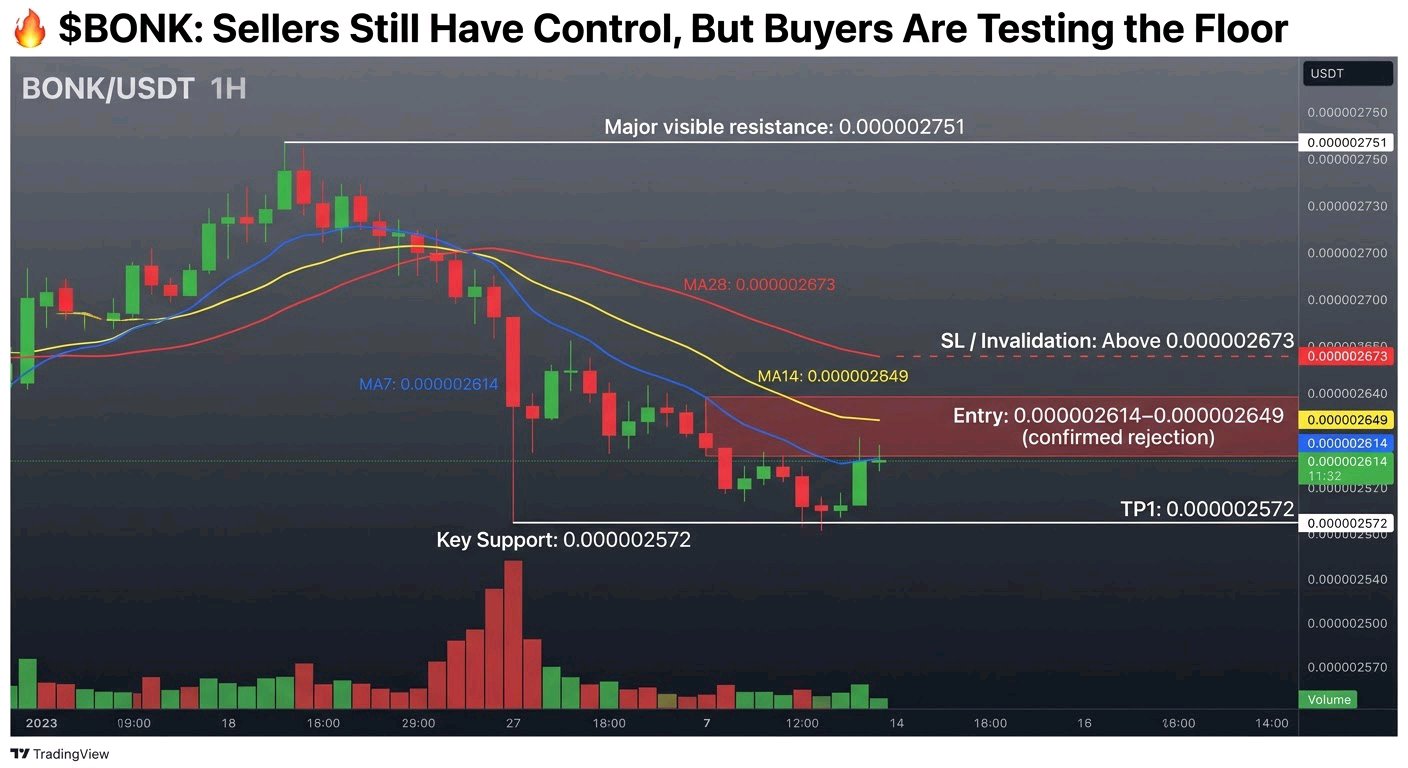
$BONKUSDT Sellers Still Have Control, But Buyers Are Testing the Floor BONK is showing clear weakness on the 1-hour chart, currently trading at 0.000002602, down 2.62%. After being rejected from the 0.000002751 high, price has moved lower and is now attempting a small recovery near the 0.000002572 support. Market Structure: The short-term structure remains bearish, with lower price movements and selling pressure visible on the chart. Price is trading below all three visible moving averages: - MA7: 0.000002614 - MA14: 0.000002649 - MA28: 0.000002673 Key Support: 0.000002572 Resistance Zones: - 0.000002614–0.000002649 - 0.000002673 - Major visible resistance: 0.000002751 Potential Setup – Conditional SHORT: Entry: 0.000002614–0.000002649 after a confirmed rejection TP1: 0.000002572 TP2: Not clearly identifiable from the visible chart SL / Invalidation: Above 0.000002673, depending on confirmation and risk tolerance. Confirmation: Sellers need to defend the moving-average resistance zone, while price should show renewed bearish momentum before considering this scenario. Invalidation: A sustained 1-hour move above 0.000002673 would weaken the bearish setup. A stronger recovery toward 0.000002751 would further challenge the current structure. Risk Note: The latest green candles suggest a possible short-term bounce, so chasing a short position here carries risk. Wait for confirmation, manage position size, and always define your risk before entering. Will BONK break below 0.000002572, or can buyers reclaim the moving averages and change the short-term structure? #ByXIMPACT
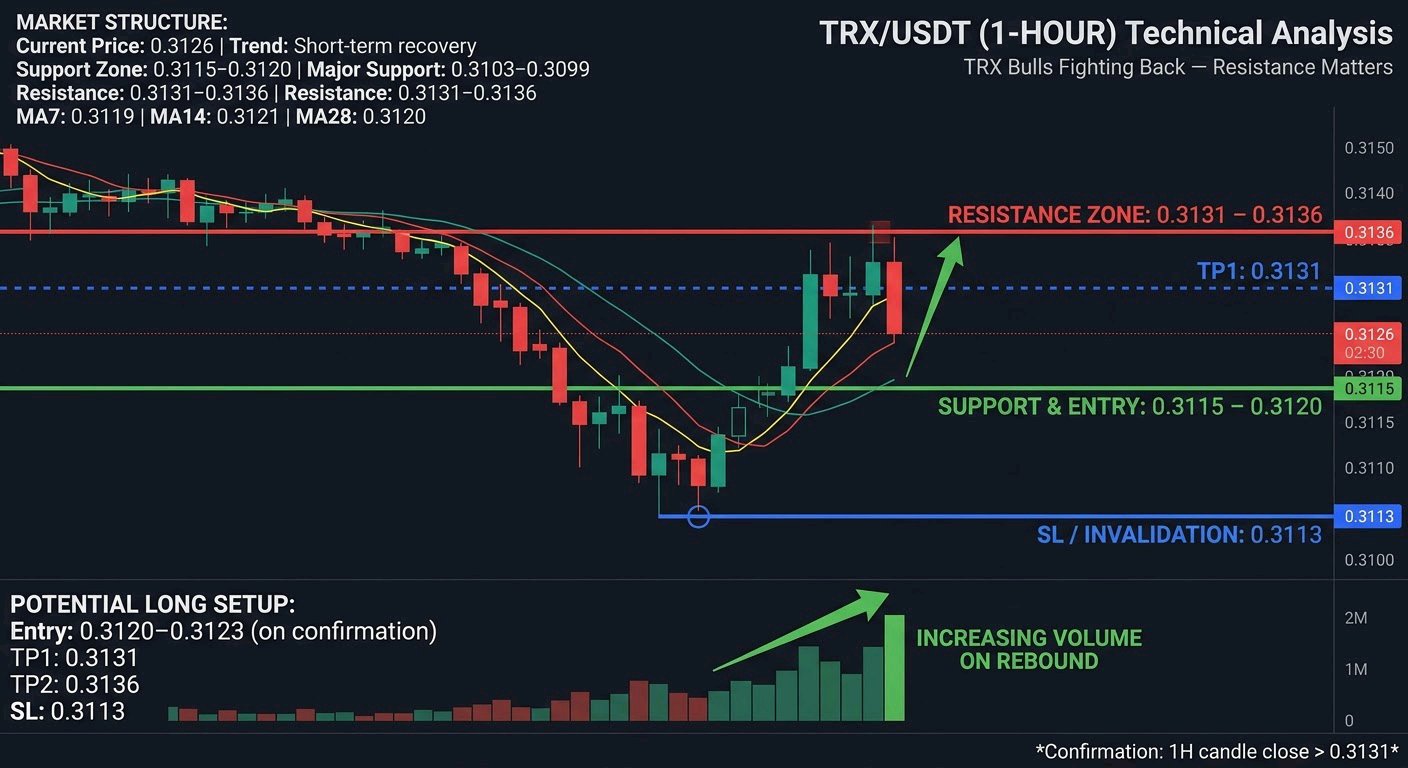
$TRXUSDT Bulls Are Fighting Back — But One Resistance Zone Still Matters TRX/USDT is showing signs of short-term recovery on the 1-hour chart after a sharp selling move. Buyers have pushed price back toward 0.3131, but the latest candle shows some hesitation near resistance. The next move depends on whether buyers can maintain this momentum. Market Structure: - Current Price: 0.3126 - Trend: Short-term recovery within a previously bearish structure. - Support Zone: 0.3115–0.3120 - Major Support: 0.3103–0.3099 - Resistance: 0.3131–0.3136 - MA7: 0.3119 | MA14: 0.3121 | MA28: 0.3120 Price is trading above the visible moving-average cluster, suggesting improving short-term momentum. Volume is also visible increasing around the recent rebound. Potential LONG Setup: Entry: 0.3120–0.3123 (only after support confirmation) TP1: 0.3131 TP2: 0.3136 SL / Invalidation: 0.3113 Confirmation: A convincing 1-hour candle close above 0.3131, followed by a successful retest, would strengthen the bullish scenario. Invalidation: A breakdown below 0.3115 would weaken the recovery setup and could expose the 0.3103 support area. Risk Note: Avoid chasing green candles. Wait for confirmation, manage position size carefully, and maintain a disciplined stop-loss. Do you think TRX can break above 0.3136, or will sellers defend this resistance again? #ByXIMPACT
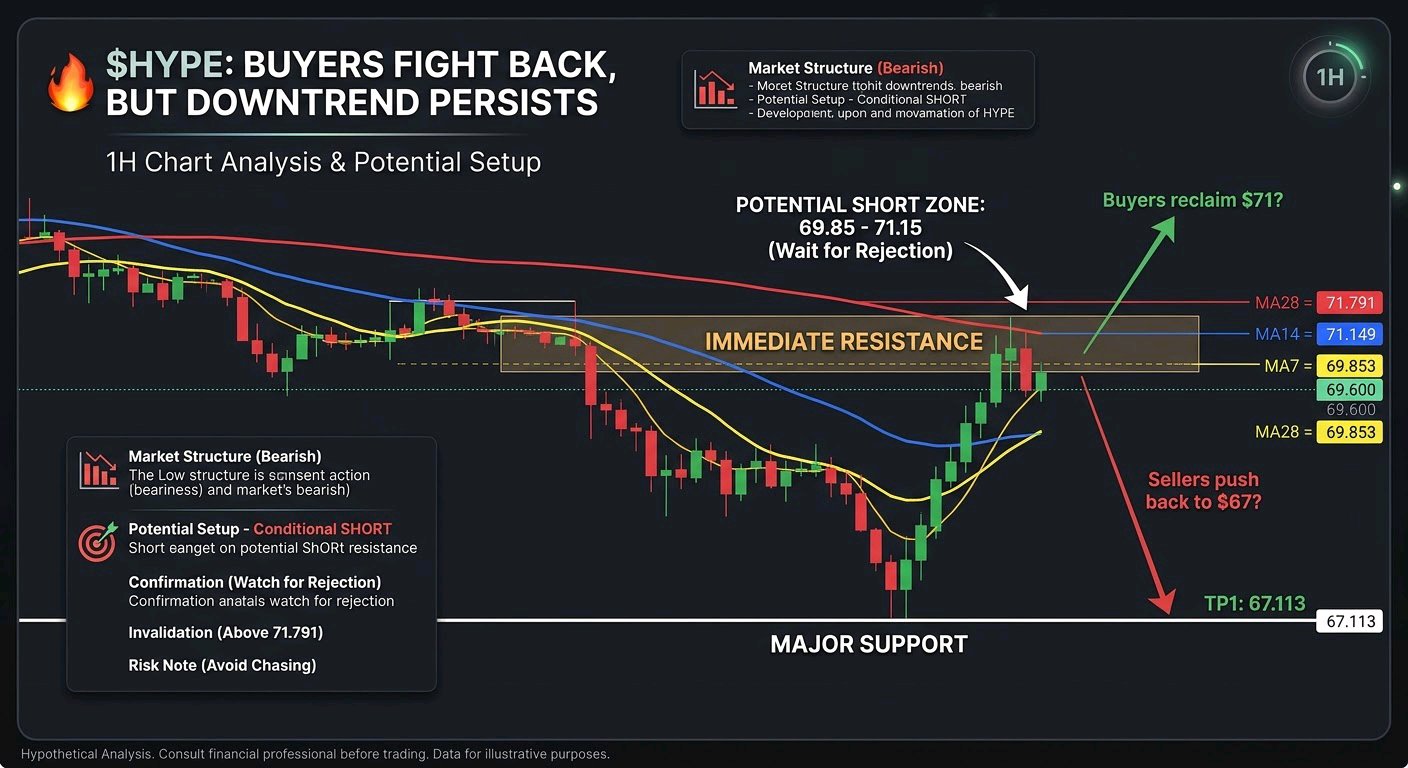
$HYPEUSDT Buyers Are Fighting Back, But the Downtrend Isn't Over Yet I've been watching HYPE on the 1-hour chart, and this latest reaction is worth paying attention to. After a sharp sell-off, price bounced from $67.113 and recovered to $69.600. However, the recovery still needs stronger confirmation before I consider it a trend reversal. Market Structure: The overall 1H structure remains bearish, with price trading below all three visible moving averages: - MA7: $69.853 - MA14: $71.149 - MA28: $71.791 Immediate resistance sits around $69.85–$71.15, while the major visible support is $67.113. The latest green candles show a recovery attempt, but sellers still have the advantage in the broader structure. Potential Setup – Conditional SHORT: Entry: $69.85–$71.15 (only after rejection confirmation) TP1: $67.113 TP2: Not clear from the available chart SL / Invalidation: Above $71.791 Confirmation: Watch for rejection around the moving averages and renewed selling pressure. A break below $67.113 could strengthen the bearish continuation scenario. Invalidation: A sustained recovery above $71.791 would weaken this short setup and suggest buyers are regaining control. Risk Note: Avoid chasing candles. Wait for confirmation, use a properly sized position, and always manage risk with a predefined stop-loss. Do you think HYPE can reclaim $71, or will sellers push it back toward $67? #ByXIMPACT
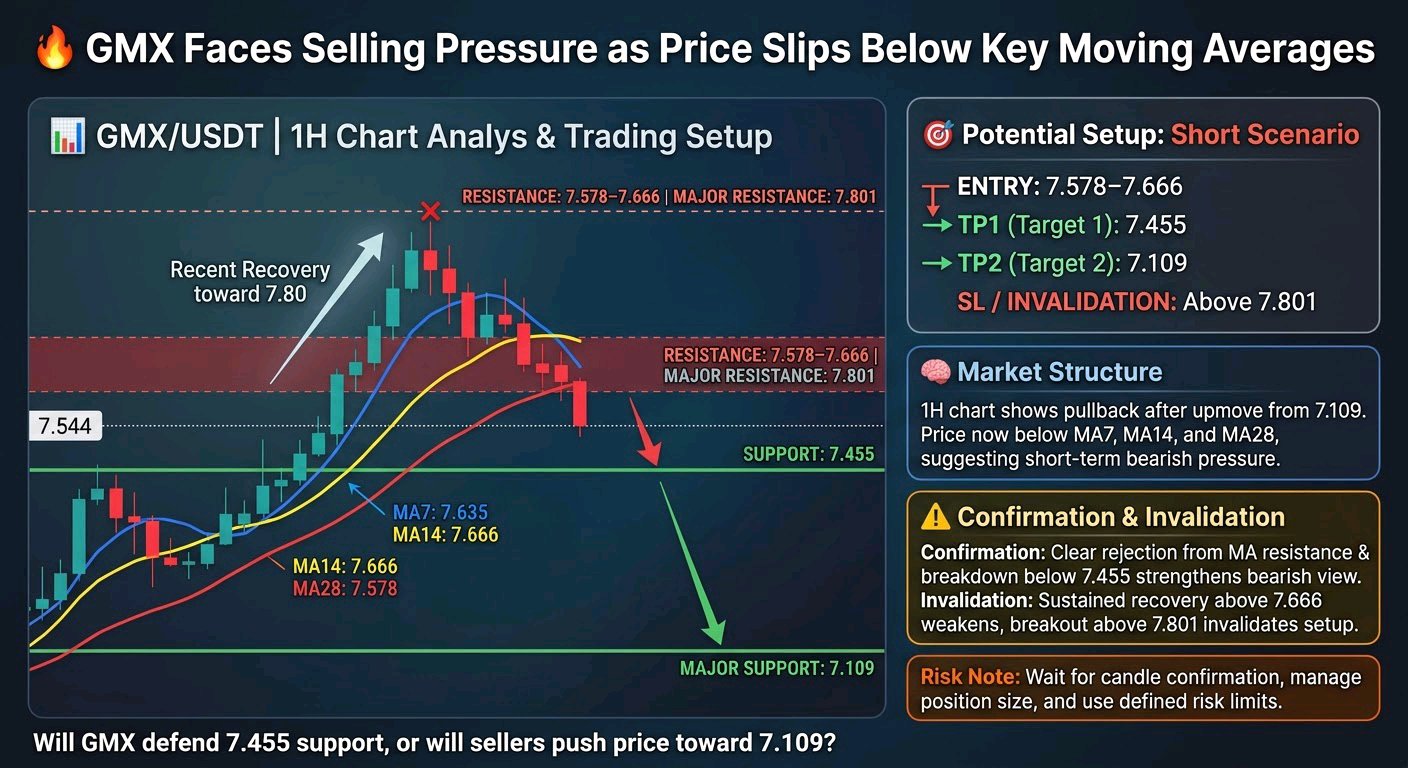
$GMXUSDT Faces Selling Pressure as Price Slips Below Key Moving Averages GMX/USDT is showing signs of short-term weakness after its recent recovery toward 7.80. The current price is 7.544, and sellers are pushing price lower. The next reaction around nearby support could determine the direction of the next move. Market Structure: The 1H chart shows a pullback following a strong upward move from 7.109. Price is now below MA7 (7.635), MA14 (7.666), and MA28 (7.578), suggesting short-term bearish pressure. Support: 7.455, followed by 7.109. Resistance: 7.578–7.666, with major resistance near 7.801. Potential Setup: Short scenario (conditional on rejection): Entry: 7.578–7.666 after bearish rejection TP1: 7.455 TP2: 7.109 SL / Invalidation: Above 7.801 Confirmation: A clear rejection from the moving-average resistance zone and a breakdown below 7.455 could strengthen the bearish scenario. Invalidation: A sustained recovery above 7.666 would weaken the bearish outlook. A breakout above 7.801 would invalidate this short scenario. Risk Note: Wait for candle confirmation, manage position size carefully, and avoid entering trades without a defined risk limit. Will GMX defend 7.455 support, or will sellers push price toward 7.109? #ByXIMPACT
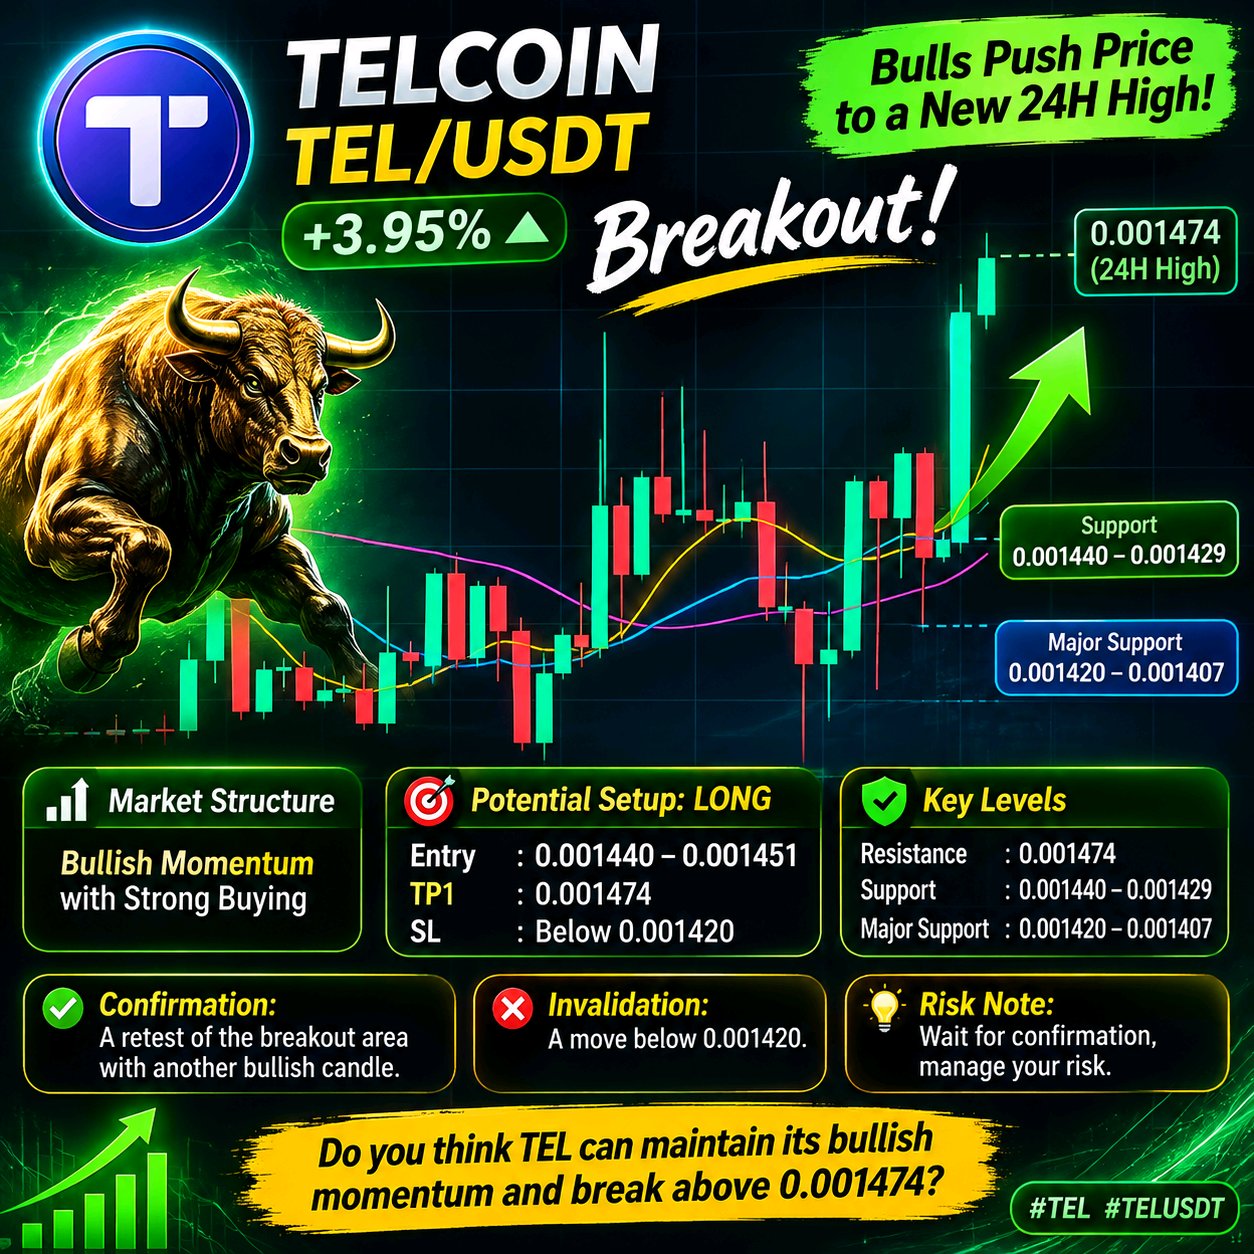
$TELUSDT BREAKOUT: Bulls Push Price to a New 24H High! TEL/USDT is showing strong bullish momentum on the 1-hour chart. Price has climbed to 0.001474 (+3.95%), reaching the visible 24-hour high. Buyers are currently controlling the move, but holding above the breakout area will be important. Market Structure: The short-term structure is bullish, with strong green candles pushing above previous consolidation. Price is trading above MA7 (0.001440), MA14 (0.001429), and MA28 (0.001420), supporting the bullish structure. Key Support: 0.001440 – 0.001429 Major Support: 0.001420 – 0.001407 Resistance: 0.001474 (24H High) Potential Setup: LONG Scenario Entry: 0.001440 – 0.001451 (potential pullback zone) TP1: 0.001474 TP2: Not clear from the visible chart. SL / Invalidation: Below 0.001420 Confirmation: A successful retest of the breakout area, followed by another bullish candle, could strengthen the continuation scenario. Invalidation: A sustained move below 0.001420 would weaken the current bullish structure and increase downside risk. Risk Note: Avoid chasing a sudden green candle. Wait for confirmation, manage position size, and always use a defined stop-loss. Do you think TEL can maintain its bullish momentum and break above 0.001474? #ByXIMPACT
$PEPEUSDT Buyers Are Defending the Recovery, But Resistance Remains PEPE is showing signs of recovery on the 1-hour chart after finding support near 0.000004293. Price is currently around 0.000004540, trading slightly above the MA7, MA14, and MA28. However, the next resistance test will be important to determine whether buyers can extend this move. Market Structure: The chart shows a previous bearish move followed by a recovery and short-term consolidation. Moving averages are clustered near the current price, suggesting a decision point. Support: 0.000004293 Resistance: 0.000004683 Major Resistance: 0.000004833 Potential Setup – LONG Scenario: Entry: 0.000004530–0.000004550 TP1: 0.000004683 TP2: 0.000004833 SL / Invalidation: Below 0.000004293 Confirmation: A convincing 1-hour candle close above 0.000004683, supported by stronger buying volume, could strengthen the bullish scenario. Invalidation: A breakdown below 0.000004293 would weaken the recovery structure and invalidate this setup. Risk Note: This is a conditional chart-based scenario, not a guaranteed trading signal. Manage position size carefully and never risk more than you can afford to lose. Do you think PEPE has enough strength to break 0.000004683, or will sellers defend this resistance again? #ByXIMPACT

$HYPEUSDT Bulls Fight Back — Is a Fresh Upside Move Taking Shape? HYPE/USDT is showing a strong recovery on the 1-hour chart after dropping toward the 70.00 area. Buyers have pushed price back near 72.00, but the next resistance zone will be important. Market Structure: The chart shows a sharp rebound from the visible 69.526 low. Price is currently trading around 71.953–72.068 and sitting above the displayed MA7, MA14 and MA28. Short-term momentum is improving, although confirmation is still needed. Key Support: 71.480, 70.503 and 69.526. Key Resistance: 72.458 and 73.265. Potential Setup — LONG Scenario: Entry: 71.80–72.05 (only if support holds) TP1: 72.458 TP2: 73.265 SL / Invalidation: Below 70.503 Confirmation: A strong 1H close above 72.458, followed by a successful retest, could strengthen the bullish scenario. Invalidation: A breakdown below 71.480 would weaken the recovery, while losing 70.503 would invalidate this bullish setup. Risk Note: Wait for confirmation, manage position size carefully and never risk more than you can afford to lose. These levels are chart-based scenarios, not guaranteed signals. Will HYPE break above 72.458 and challenge 73.265, or will sellers step in again? #ByXIMPACT

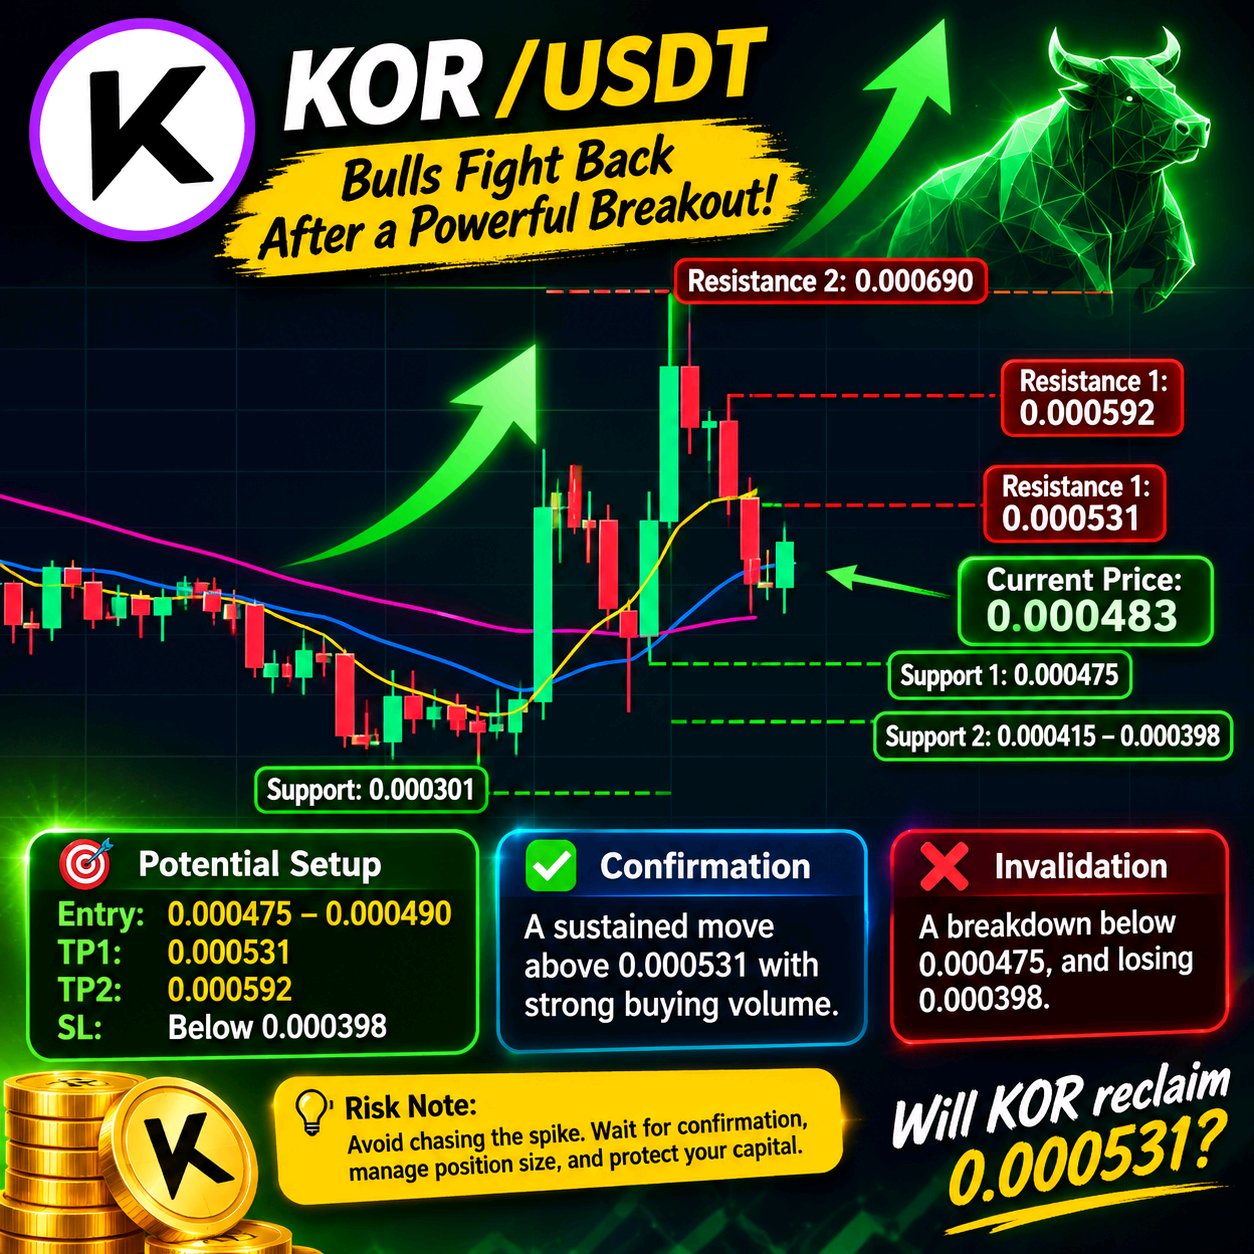
$KORUSDT Bulls Fight Back After a Powerful Breakout! KOR is showing an interesting recovery on the 1-hour chart after a sharp rally from 0.000301 to 0.000690. Price is now around 0.000483, with buyers attempting to regain momentum after the recent pullback. Market Structure: - Current Price: 0.000483 (+21.36%) - Trend: Short-term recovery, but volatility remains high. - Support 1: 0.000475 - Support 2: 0.000415–0.000398 - Resistance 1: 0.000531 - Resistance 2: 0.000592 - Major Resistance: 0.000690 Potential Setup: Scenario: LONG if support holds. Entry: 0.000475–0.000490 TP1: 0.000531 TP2: 0.000592 SL / Invalidation: Below 0.000398 Confirmation: A sustained move above 0.000531, supported by stronger buying volume, could strengthen the bullish recovery. Invalidation: A breakdown below 0.000475 would weaken the setup. Losing 0.000398 would invalidate this bullish scenario. Risk Note: Avoid chasing the recent spike. Wait for confirmation, manage position size, and always protect your capital. Will KOR reclaim 0.000531 and continue its recovery, or will sellers take control again? #ByXIMPACT
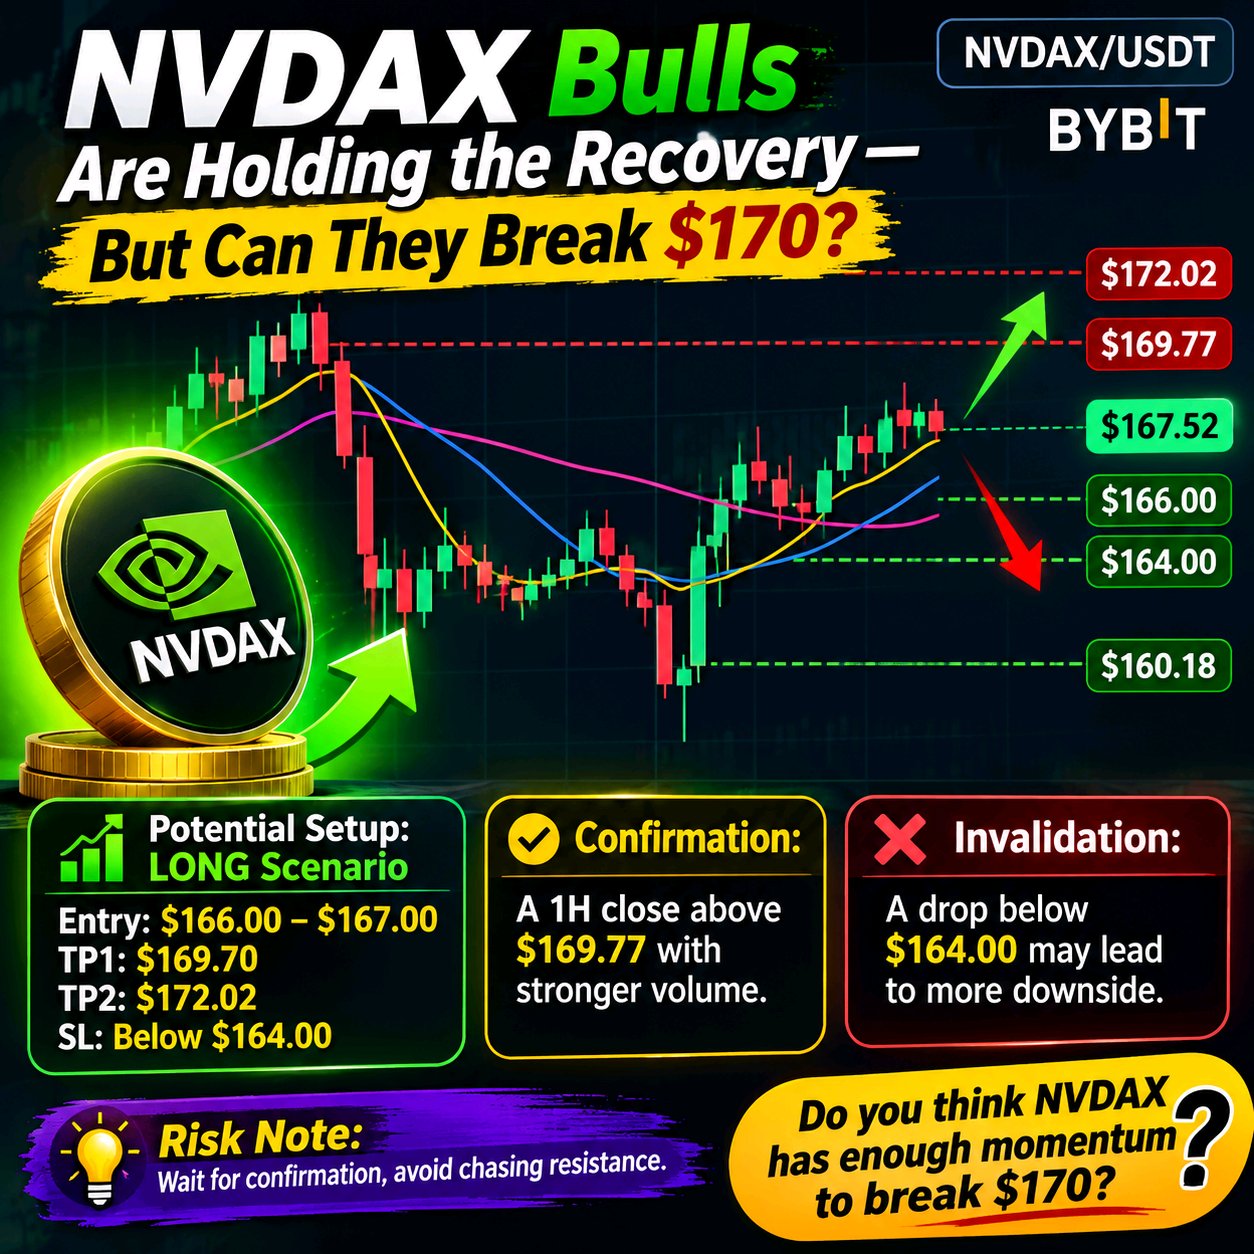
$NVDAXUSDT Bulls Are Holding the Recovery — But Can They Break $170? NVDAX is showing a noticeable recovery after its sharp decline toward $154.26. Price has climbed back to $167.52, but the latest candles suggest consolidation as buyers approach the $169–$170 resistance area. Market Structure: The 1H chart shows a strong rebound followed by sideways consolidation. Price is slightly below MA7 ($167.88), but remains above MA14 ($166.09) and MA28 ($164.05). This keeps the recovery structure alive, although short-term momentum needs confirmation. Key Support: $166.00, $164.00 and $160.18 Key Resistance: $169.77 and $172.02 Potential Setup: LONG Scenario Entry: $166.00–$167.00 after confirmation of support TP1: $169.70 TP2: $172.02 SL / Invalidation: Below $164.00 ⚠️ Confirmation: A convincing 1H close above $169.77, preferably supported by stronger volume, could strengthen the bullish breakout scenario. Invalidation: A sustained move below $164.00 would weaken the recovery structure and increase the possibility of a deeper pullback toward $160.18. Risk Note: Avoid chasing resistance. Wait for confirmation, manage position size carefully and maintain a disciplined stop-loss. Do you think NVDAX has enough momentum to break $170, or will sellers defend this resistance again? #ByXIMPACT
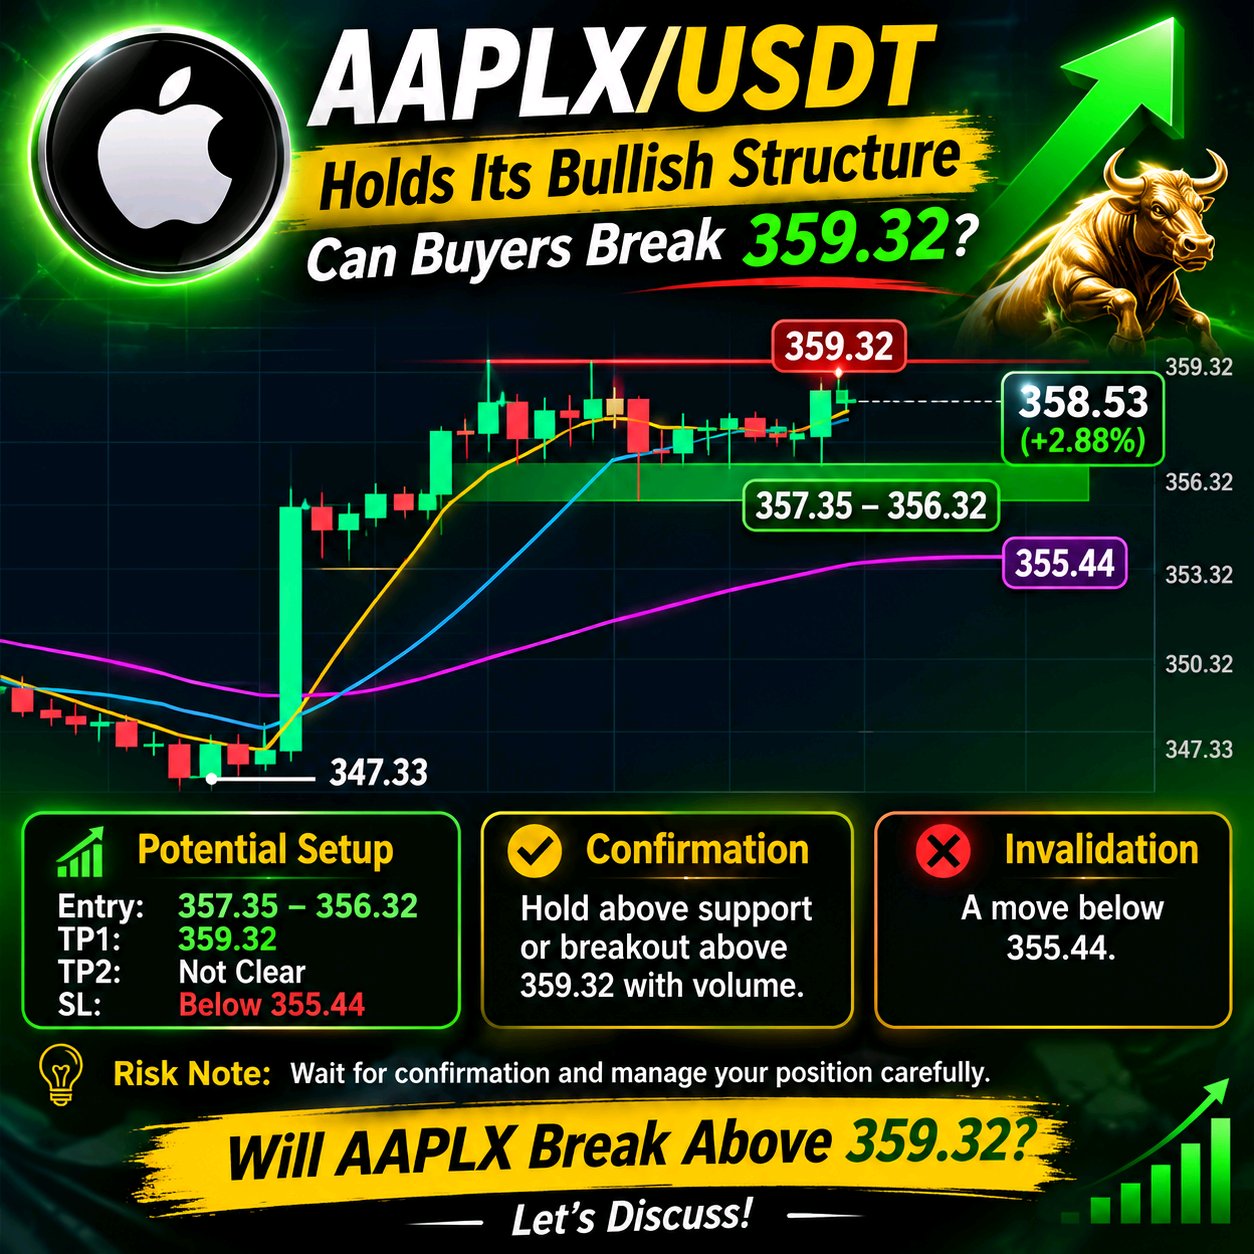
$AAPLXUSDT Holds Its Bullish Structure — Can Buyers Break 359.32? AAPLX/USDT is showing encouraging bullish momentum on the 1-hour chart. After a strong upward move from the 347.33 area, price is consolidating near 358.53, just below the visible resistance at 359.32. The next move around this level could be important. *Market Structure:** - Current Price: 358.53 (+2.88%) - Trend: Bullish - MA7: 357.62 - MA14: 357.35 - MA28: 355.44 - Resistance: 359.32 - Support Zone: 357.35–356.32 - Major Visible Support: 355.44 The moving averages are aligned bullishly, with price trading above all three. However, recent consolidation and relatively low latest volume suggest buyers still need to demonstrate strength. **Potential Setup:** - Entry: 357.35–356.32 (potential pullback zone) - TP1: 359.32 - TP2: Not clear from the visible chart - SL / Invalidation: Below 355.44 **Confirmation:** A successful hold above the support zone or a convincing breakout above 359.32 with stronger volume could strengthen the bullish scenario. **Invalidation:** A sustained move below 355.44 would weaken the current bullish structure. **Risk Note:** Wait for confirmation, manage position size carefully, and avoid chasing price near resistance. Will AAPLX break above 359.32, or will sellers defend this level again? #ByXIMPACT
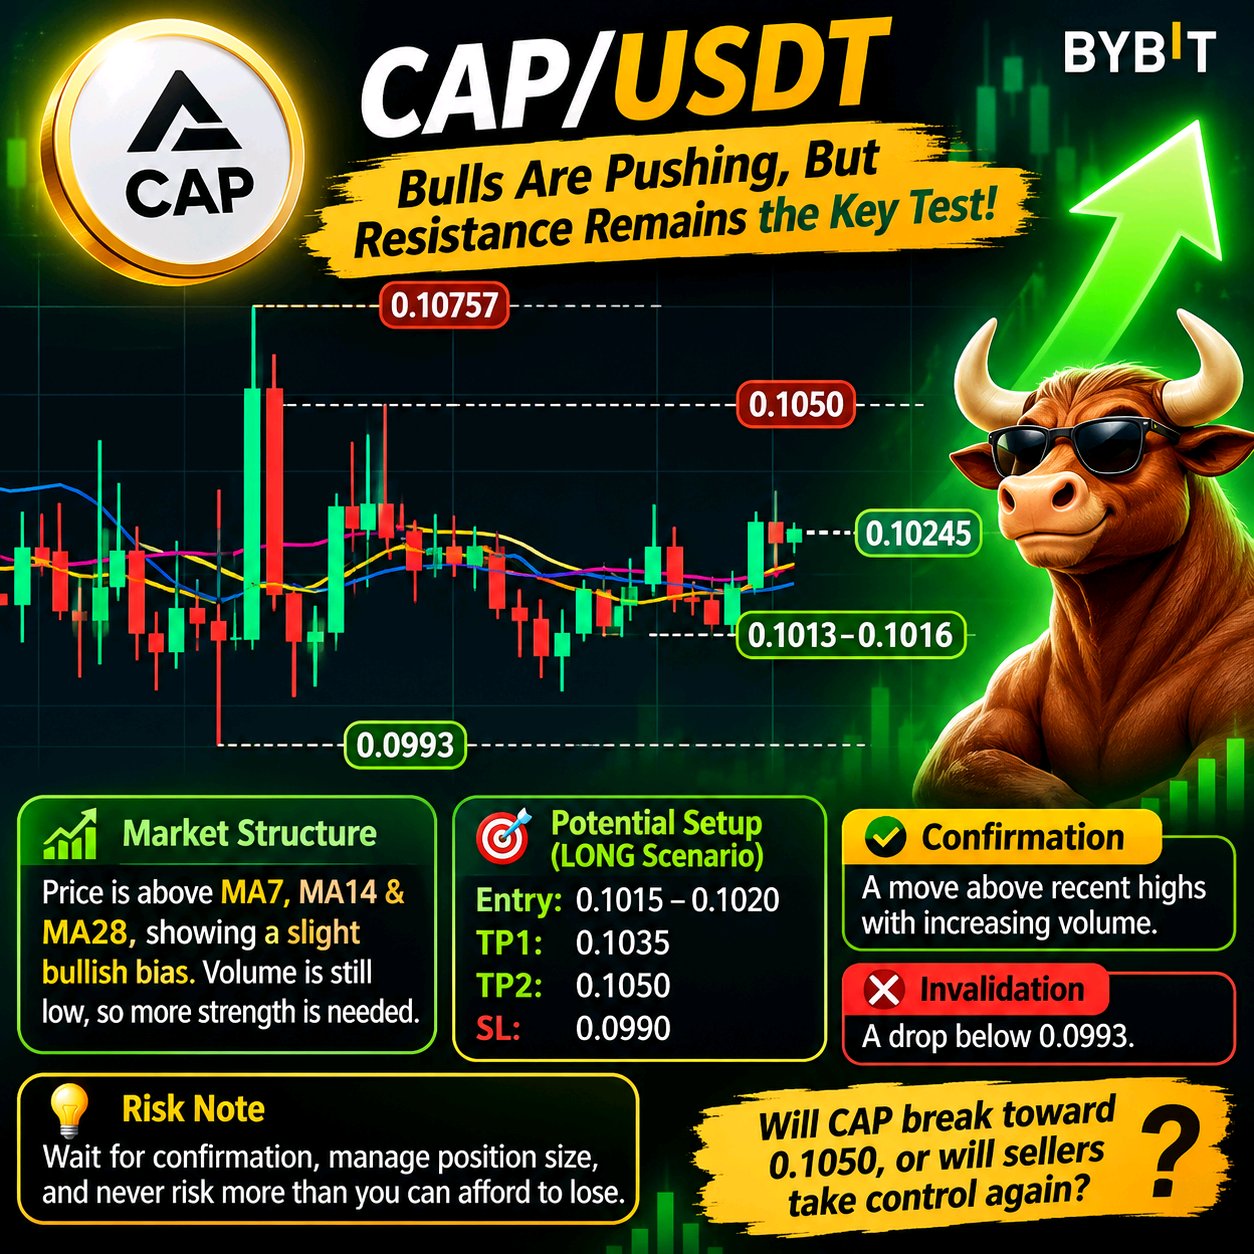
$CAPUSDT Bulls Are Pushing, But Resistance Remains the Key Test! CAP is showing a modest recovery on the 1H chart, trading around **0.10245 (+2.41%)**. Recent candles suggest buyers are attempting to build momentum after a period of sideways consolidation. **Market Structure:** The price is trading above MA7 (0.10166), MA14 (0.10133), and MA28 (0.10163), showing a slight bullish bias. However, volume at 162.28K remains below MA5 (276.02K) and MA10 (482.40K), so stronger participation is needed. Key Support: 0.1013–0.1016 Major Support: 0.0993 Resistance: 0.1050 Major Resistance: 0.10757 **Potential Setup – LONG Scenario:** Entry: 0.1015–0.1020 TP1: 0.1035 TP2: 0.1050 SL / Invalidation: 0.0990 **Confirmation:** A sustained move above the recent local highs with increasing volume could strengthen the bullish scenario. **Invalidation:** A decisive 1H breakdown below the MA cluster and especially 0.0993 would weaken the bullish structure. **Risk Note:** Wait for confirmation, manage position size carefully, and never risk more than you can afford to lose. Will CAP break toward 0.1050, or will sellers take control again? #ByXIMPACT
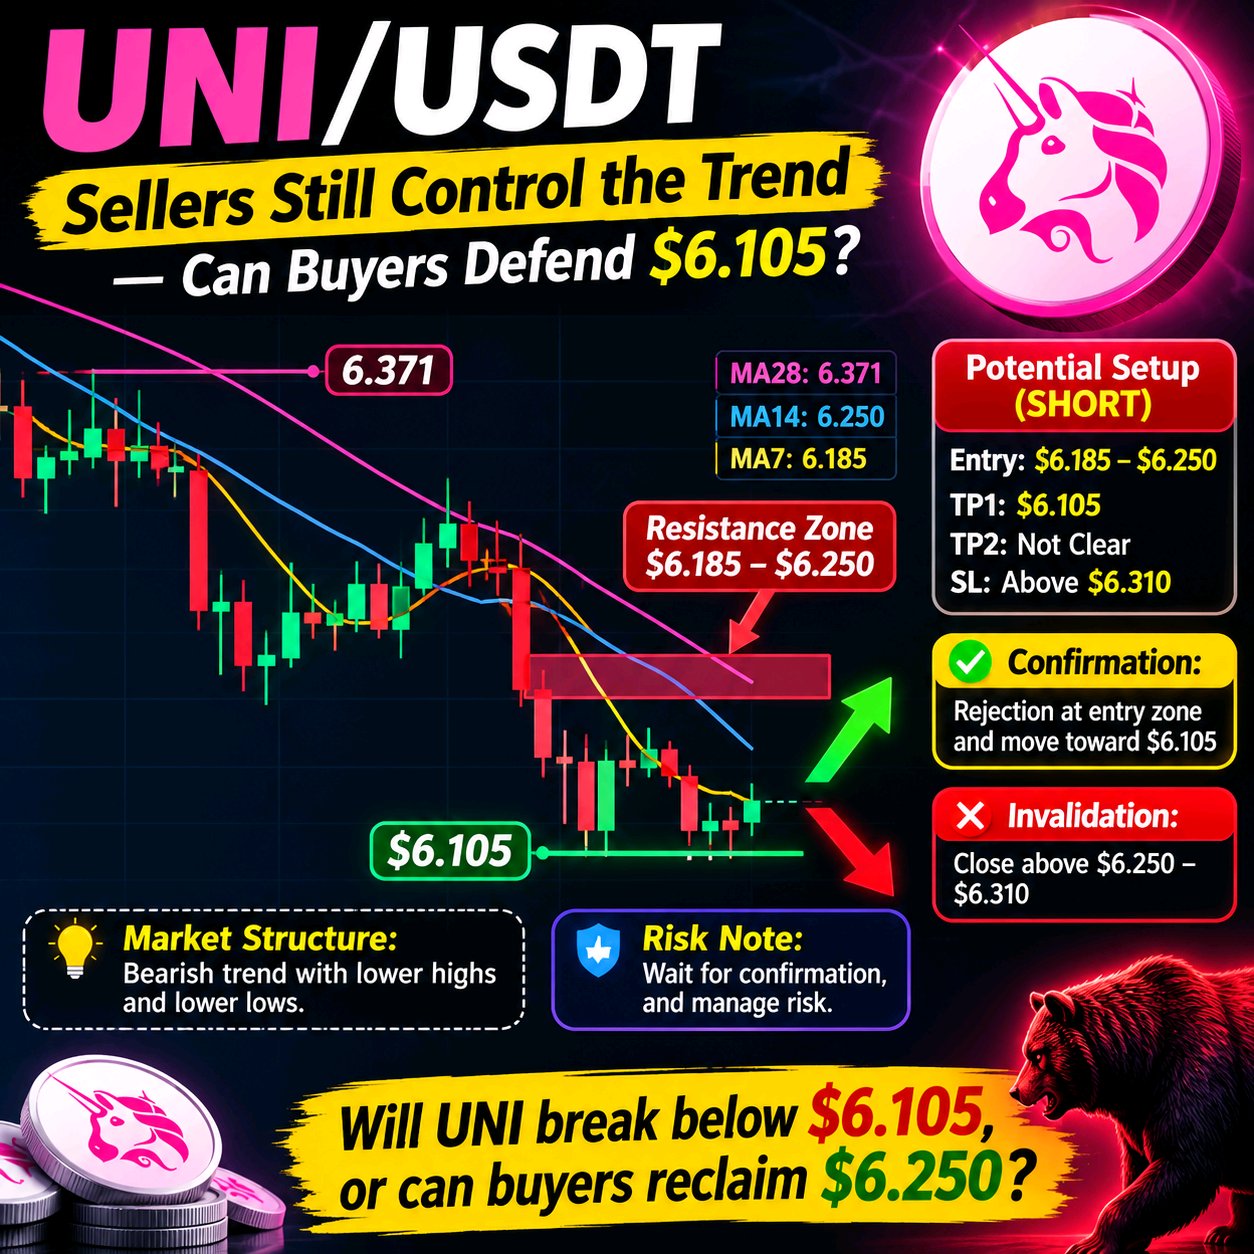
$UNIUSDT Sellers Still Control the Trend — Can Buyers Defend $6.105? UNI is trading at **$6.176**, down **3.11%**. The 1-hour chart shows continued bearish pressure, although price is attempting to stabilize near its recent low. **Market Structure:** UNI remains in a bearish structure with lower highs and lower lows. Price is trading below MA7 ($6.185), MA14 ($6.250), and MA28 ($6.371), keeping sellers in control. **Key Support:** $6.105 **Resistance Zones:** $6.185–$6.250, followed by $6.371. **Potential Setup – SHORT Scenario:** Entry: $6.185–$6.250 after bearish rejection TP1: $6.105 TP2: Not clear from the visible chart SL / Invalidation: Above $6.310 **Confirmation:** A rejection from the entry zone and a fresh move toward $6.105 would strengthen the bearish scenario. **Invalidation:** A sustained recovery above $6.250–$6.310 would weaken the short setup. **Risk Note:** Wait for confirmation, manage position size carefully, and avoid entering trades without a defined risk limit. Will UNI break below $6.105, or can buyers finally reclaim $6.250? #ByXIMPACT
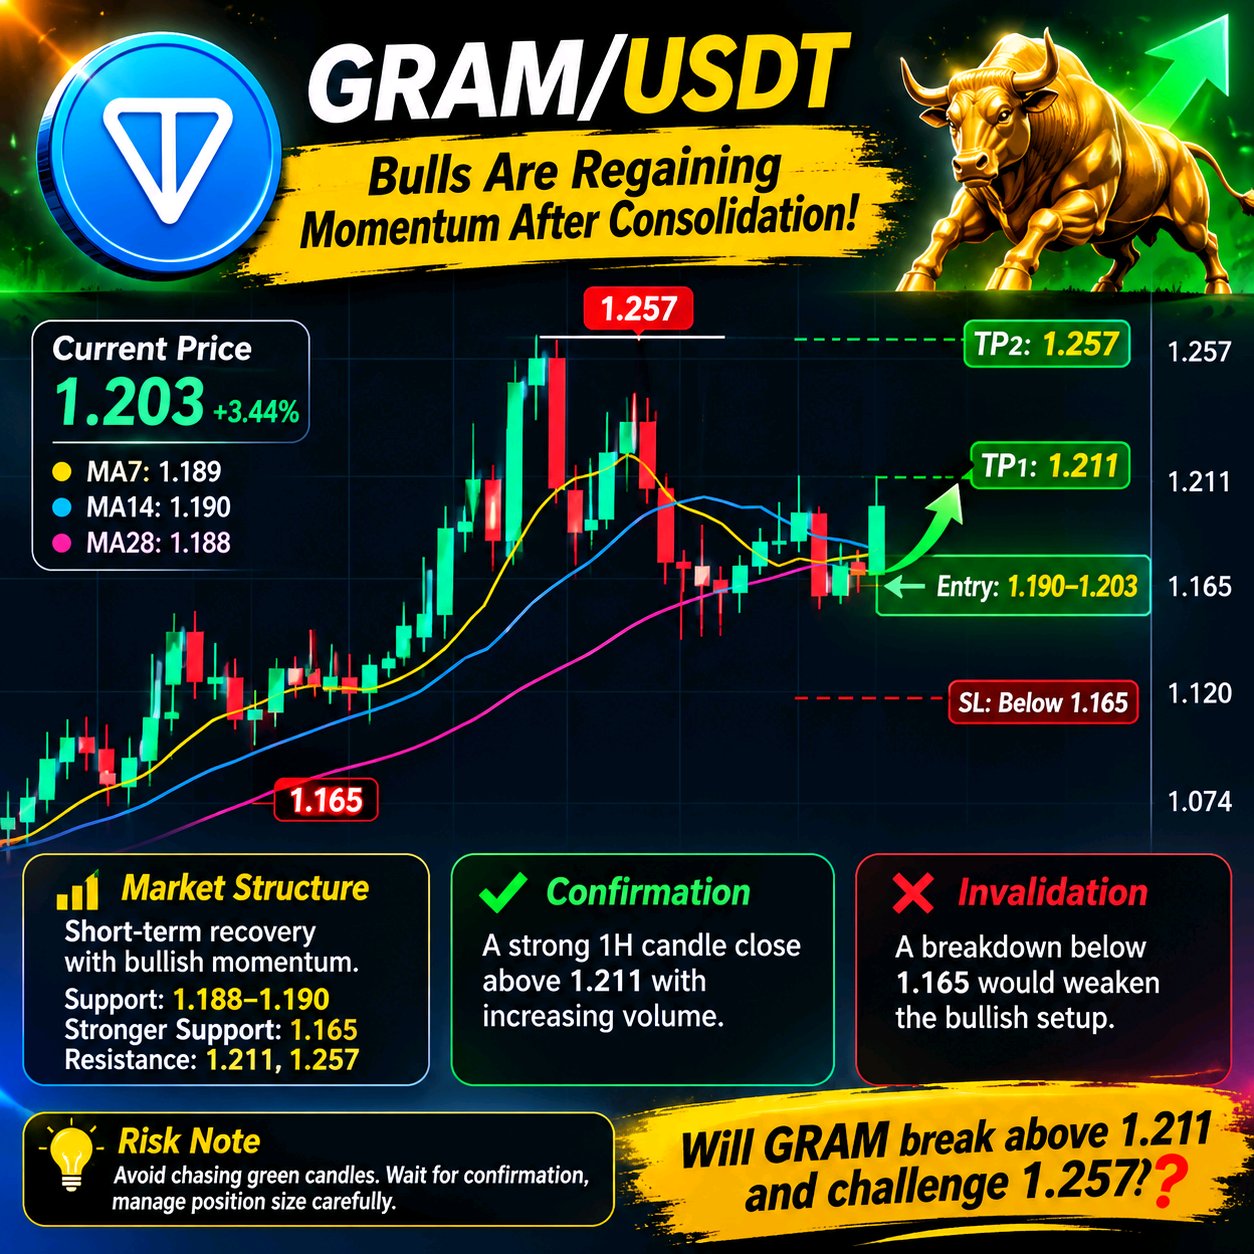
$GRAMUSDT Bulls Are Regaining Momentum After Consolidation! GRAM is showing encouraging strength on the 1-hour chart. After climbing toward 1.257, price experienced a pullback and entered a consolidation phase. The latest green candle suggests buyers are attempting to regain control. **Market Structure:** - Current Price: 1.203 (+3.44%) - Trend: Short-term recovery with bullish momentum. - Support Zone: 1.188–1.190 (MA cluster) - Stronger Support: 1.165 - Resistance: 1.211 - Major Resistance: 1.257 - MA7: 1.189 | MA14: 1.190 | MA28: 1.188 - Volume: 600.50K, above the displayed MA5 and MA10 volume averages. **Potential Setup – LONG Scenario:** Entry: 1.190–1.203, if support holds. TP1: 1.211 TP2: 1.257 SL / Invalidation: Below 1.165 ⚠️ **Confirmation:** A strong 1H candle close above 1.211, preferably supported by increasing volume, could strengthen the bullish scenario. **Invalidation:** A breakdown below 1.165 would weaken the recovery structure and invalidate this long setup. **Risk Note:** Avoid chasing green candles. Wait for confirmation, manage position size carefully, and maintain a disciplined stop-loss. Will GRAM break above 1.211 and challenge 1.257, or will sellers take control again? #ByXIMPACT