VenomRanaBNB
1940Like0Shares43Fans53Follow
Content Creator 😎 Technical Analysis, Trading ideas ✨
Content Creator 😎 Technical Analysis, Trading ideas ✨
$XRPUSDT Is This a Buying Opportunity or a Warning Sign? XRP has experienced significant selling pressure, making market confirmation especially important. I am watching Whether XRP can hold its recent lows. Whether buyers return with stronger volume. Whether the broader crypto market starts recovering. Trying to catch a falling market without confirmation can be risky. Smart traders watch price action instead of following emotions. XRP holders, are you staying patient or waiting for a stronger recovery signal? #IMPACTbyTrade

HYPERLIQUID (HYPE): Is the Market Underestimating Its Potential? Hyperliquid is an interesting project to watch in the decentralized trading sector. My focus is on three factors: 1. Growth in platform activity. 2. User adoption and ecosystem development. 3. Whether HYPE can regain market strength. Long-term potential and short-term price action are two different things. I want to see real ecosystem growth before becoming overly bullish. What matters more to you: HYPE's technology, adoption, or price performance? $HYPEUSDT #IMPACTbyTrade

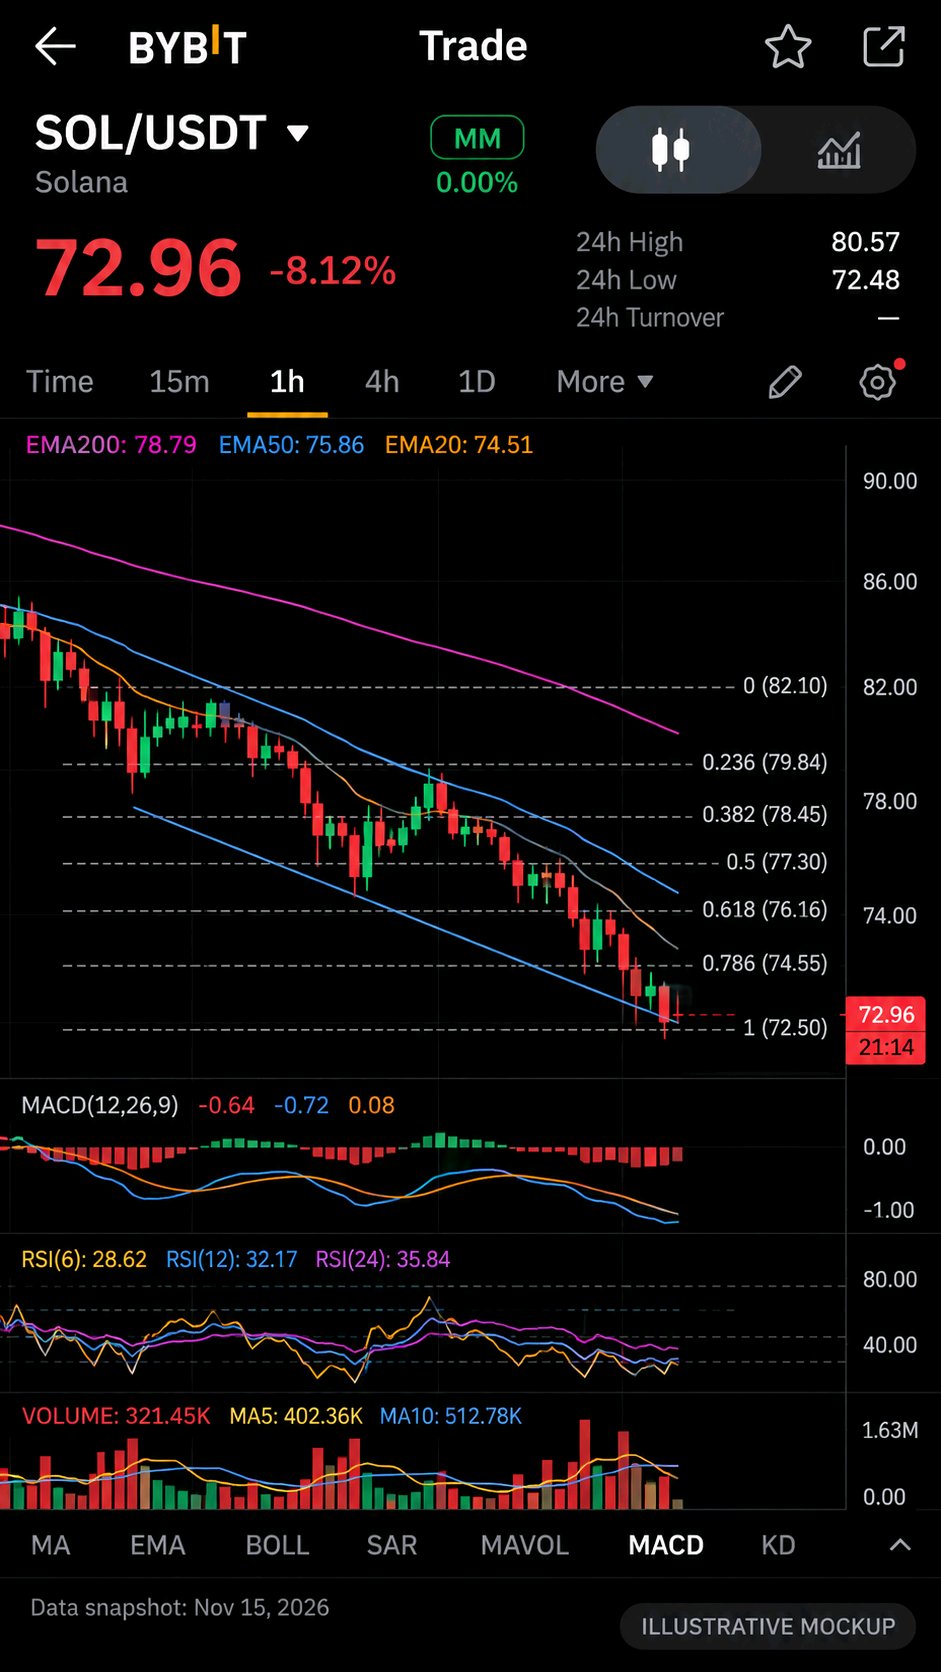
SOLANA ($SOLUSDT): Can Bulls Turn the Momentum Around? Solana is facing a challenging market environment, and traders are watching closely for signs of strength. Here are three things I am monitoring: Whether buyers defend the recent support area. Whether trading volume starts recovering. Whether SOL can build a stronger market structure. A recovery needs confirmation, not just hope. SOL community: Are you waiting for a bullish reversal or expecting more downside? #IMPACTbyTrade

ETHEREUM: A Critical Moment for ETH Bulls! Ethereum is facing an important test as market uncertainty continues. Here are three things worth watching: ETH's ability to hold its key support zone. Whether buying volume starts increasing. Whether ETH shows strength compared with Bitcoin. A strong recovery needs confirmation, not just optimism. Ethereum remains one of the most important assets to watch in the crypto market. ETH holders, are you bullish or bearish on the next move? Why? $ETHUSDT #IMPACTbyTrade

BITCOIN: Is This a Recovery or Just a Temporary Bounce? Bitcoin's recent market weakness reminds us that every bounce is not necessarily a trend reversal. The key things I am watching: Can buyers defend important support zones? Will trading volume confirm the recovery? Can BTC reclaim resistance with strong buying pressure? I believe patience and confirmation are more important than chasing every price movement. What do you think: Is Bitcoin preparing for a recovery, or could sellers remain in control? $BTCUSDT #IMPACTbyTrade

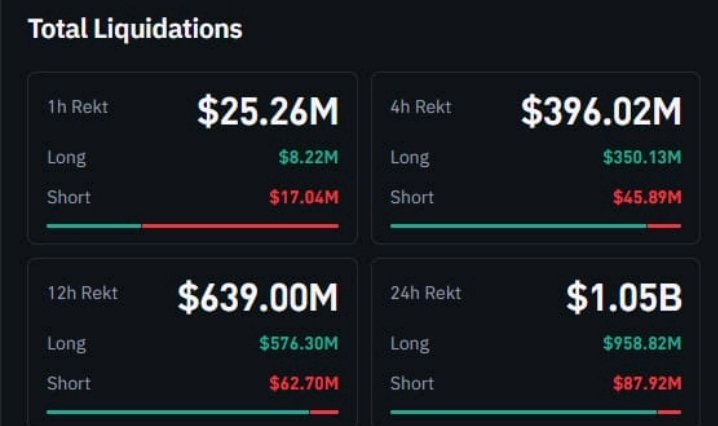
Over $1 billion in crypto liquidations in just 24 hours, with nearly $959 million coming from LONG positions. The market is reminding traders that leverage can be dangerous when momentum turns against you. Don't chase every move. Protect your capital and trade with a plan. Survival comes first. $BTCUSDT $ETHUSDT #ByXIMPACT
Ethereum is seeing a growing commitment to staking, yet its market price is moving in the opposite direction. That disconnect deserves more attention than another prediction about where ETH goes next. At $1,771.70, ETH is down 8.31% on the Bybit chart. The four-hour structure is firmly bearish. Price sits below the 7, 14 and 28-period moving averages, while RSI has fallen to 14.75. The $1,728.93 low is now an important level to watch. But the more interesting detail is happening beneath the price chart. According to Ethereum staking data recorded on November 13, approximately 922,423 ETH were waiting to enter staking, compared with 232,310 ETH waiting to exit. Around 36.28% of the total ETH supply was already staked. That suggests validator participation remains substantial even as market sentiment weakens. However, there is an important distinction between staking demand and actual market demand. Locking ETH into validators does not automatically create new spot buyers, nor does it guarantee price support. Network participation and token valuation are driven by different forces. For traders, the immediate question is whether ETH can defend $1,728.93. For long-term holders, the bigger question is whether growing network participation can eventually translate into stronger economic demand for ETH. Those two stories are not necessarily moving together. $ETHUSDT #ByXIMPACT
SOL biggest tokenomics misconception is that rising network activity automatically makes the token scarcer. It doesn't. The distinction lies in how Solana distributes transaction fees. According to its official documentation, only 50% of base transaction fees are burned. The other 50% goes to validators. More importantly, 100% of priority fees also goes to validators. That changes how network growth should be interpreted. Higher transaction demand can increase validator income without creating an equivalent reduction in SOL supply. Meanwhile, staking rewards are funded through protocol inflation. Solana's published monetary policy started at 8% annual inflation, declining by 15% each year toward a 1.5% long-term rate. Those rewards support network security, but they also introduce new SOL into circulation. The supply figures make this relevant. Solscan currently reports approximately 591.1 million SOL in circulating supply, with roughly 429.2 million actively staked. The chart shows SOL at $72, down 10.12%, with price trading below its major moving averages on the four-hour timeframe. The important question is not simply how much activity Solana generates. It is how much of that activity translates into sustainable value capture for SOL holders. Until fee generation and token scarcity become more closely aligned, network growth and token value remain two different measurements. $SOLUSDT #ByXIMPACT
HYPE is showing a sharp technical breakdown, but the more interesting question is whether Hyperliquid's underlying business can withstand the pressure on its token. The Bybit screenshot shows HYPE/USDT trading at $67.385, down 8.95%, with a 24-hour high of $74.639 and a low of $67.113. The price is approaching the session low, indicating that sellers remain in control. On the daily chart, HYPE is trading below all three displayed moving averages: MA7 at $72.281, MA14 at $77.138 and MA28 at $79.078. This alignment confirms a bearish short-term structure rather than an isolated intraday correction. Momentum is particularly weak. RSI6 stands at 16.16, RSI12 at 27.20 and RSI24 at 36.76. These readings indicate deeply oversold conditions, but oversold does not automatically mean a reversal. Meanwhile, MACD remains negative, with DIF at -3.327, DEA at -2.107 and histogram at -1.219. There is another important warning: displayed trading volume is 290.53K, below both the MA5 volume of 481.74K and MA10 volume of 435.81K. The decline is significant, but the screenshot does not yet show expanding volume confirming a strong capitulation or reversal. The deeper issue is the difference between Hyperliquid's protocol economics and HYPE's market valuation. Hyperliquid has a meaningful value-capture mechanism. According to its SEC-filed disclosures, 99% of protocol fees are allocated to the Assistance Fund, which purchases HYPE from the open market. By September 8, 2026, approximately 47.1 million HYPE had been acquired and permanently burned through this mechanism. This creates a direct connection between trading activity and token demand. The underlying business also shows substantial activity. Bitwise's Q3 2026 research reported $228.1 million in fees and reserve income, $730.1 billion in trading volume and average open interest of $12.7 billion. HIP-3 markets contributed $261.5 billion in volume, representing 36.5% of perpetuals activity. Amazon Web Services, Inc. Yet this is where the contradiction becomes important: strong protocol economics do not guarantee immediate price appreciation. HYPE still faces supply distribution and market-wide liquidity risks. Tokenomist reported approximately 49.47% of the maximum one-billion-token supply unlocked as of November 13, with further contributor vesting scheduled. Future supply entering circulation can offset some of the buying pressure generated by the Assistance Fund. For investors, the immediate technical levels matter. The $67.11 area is the first visible support from the screenshot. A sustained break below it would increase downside risk. On the recovery side, reclaiming $72.28 is the first meaningful test, followed by $77.14. These are moving-average reference levels, not confirmed resistance zones. The bullish thesis remains intact if trading activity, fee generation and HYPE burns remain strong while price stabilizes and recovers its daily averages. The bearish thesis strengthens if volume expands on further declines, support fails and circulating supply growth outweighs token purchases. My conclusion: Hyperliquid has demonstrated real trading demand and an unusually direct fee-to-token mechanism. But the market is currently questioning how much of that economic strength deserves to be reflected in HYPE's valuation. Is this a temporary market repricing of a strong protocol, or is HYPE entering a longer valuation reset despite its growing ecosystem? $HYPEUSDT #ByXIMPACT
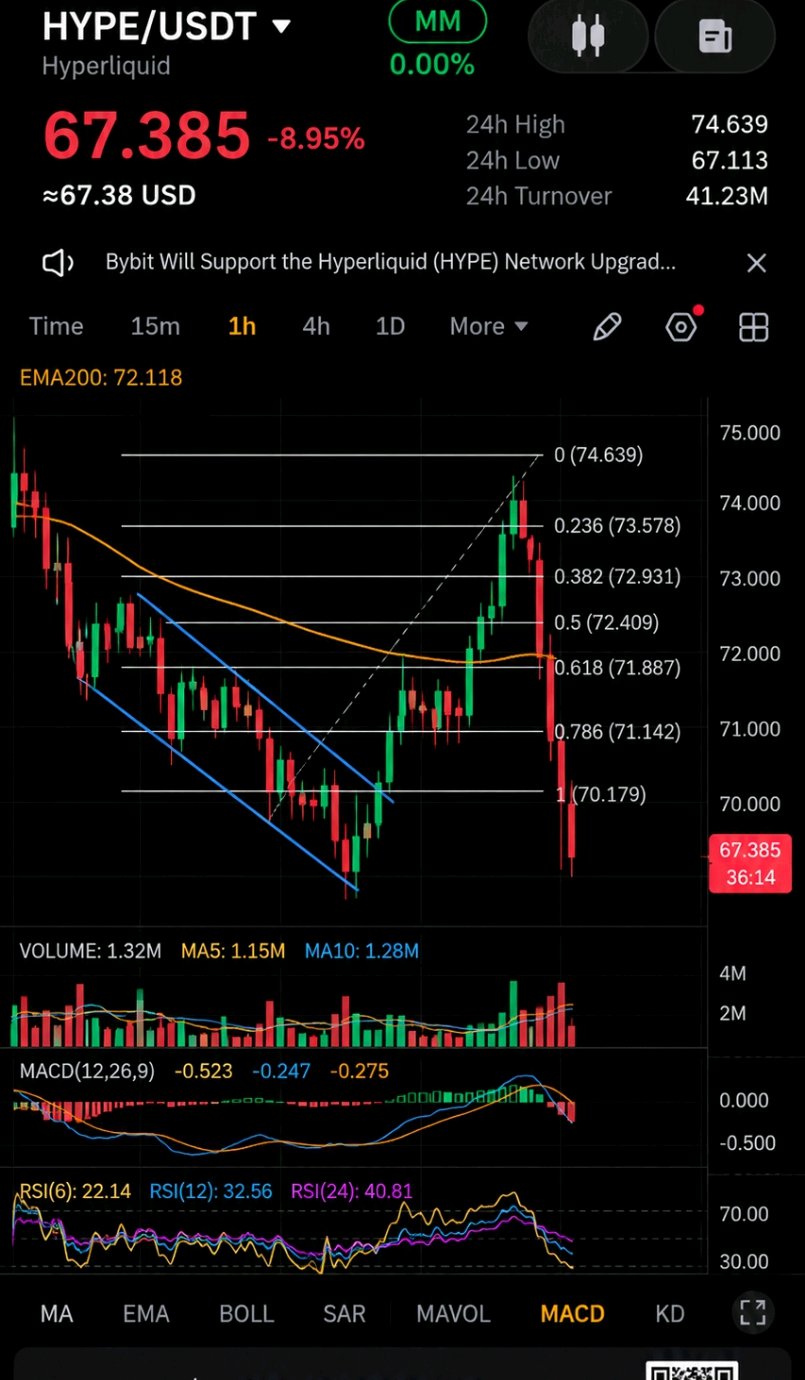
Bitcoin just closed a session below the short-term holder cost basis near $75,700 while the broader market’s cash reserves keep shrinking. Stablecoin supply has contracted by roughly $14 billion over the past 30 days the steepest drop since June 2022. That pool of dry powder on exchanges and on-chain is the fuel that normally absorbs sell pressure and funds rebounds. At the same time, U.S. spot Bitcoin ETFs have recorded consecutive days of net outflows, and short-term holders as a cohort now sit largely underwater. The result is a market that can still move sharply lower on modest selling because the usual buyers are either absent or themselves realizing losses. Miner flows to exchanges spiked in one recent window, but the larger picture is thinner liquidity rather than widespread capitulation. Long-term holders continue to control the majority of supply and have not flooded the market. Price action around $67,000 therefore reflects more than a simple technical breakdown. It reflects a temporary shortage of the very capital that has historically turned dips into accumulation opportunities. Whether that capital returns depends less on the next candle and more on whether the stablecoin contraction reverses. $BTCUSDT #ByXIMPACT
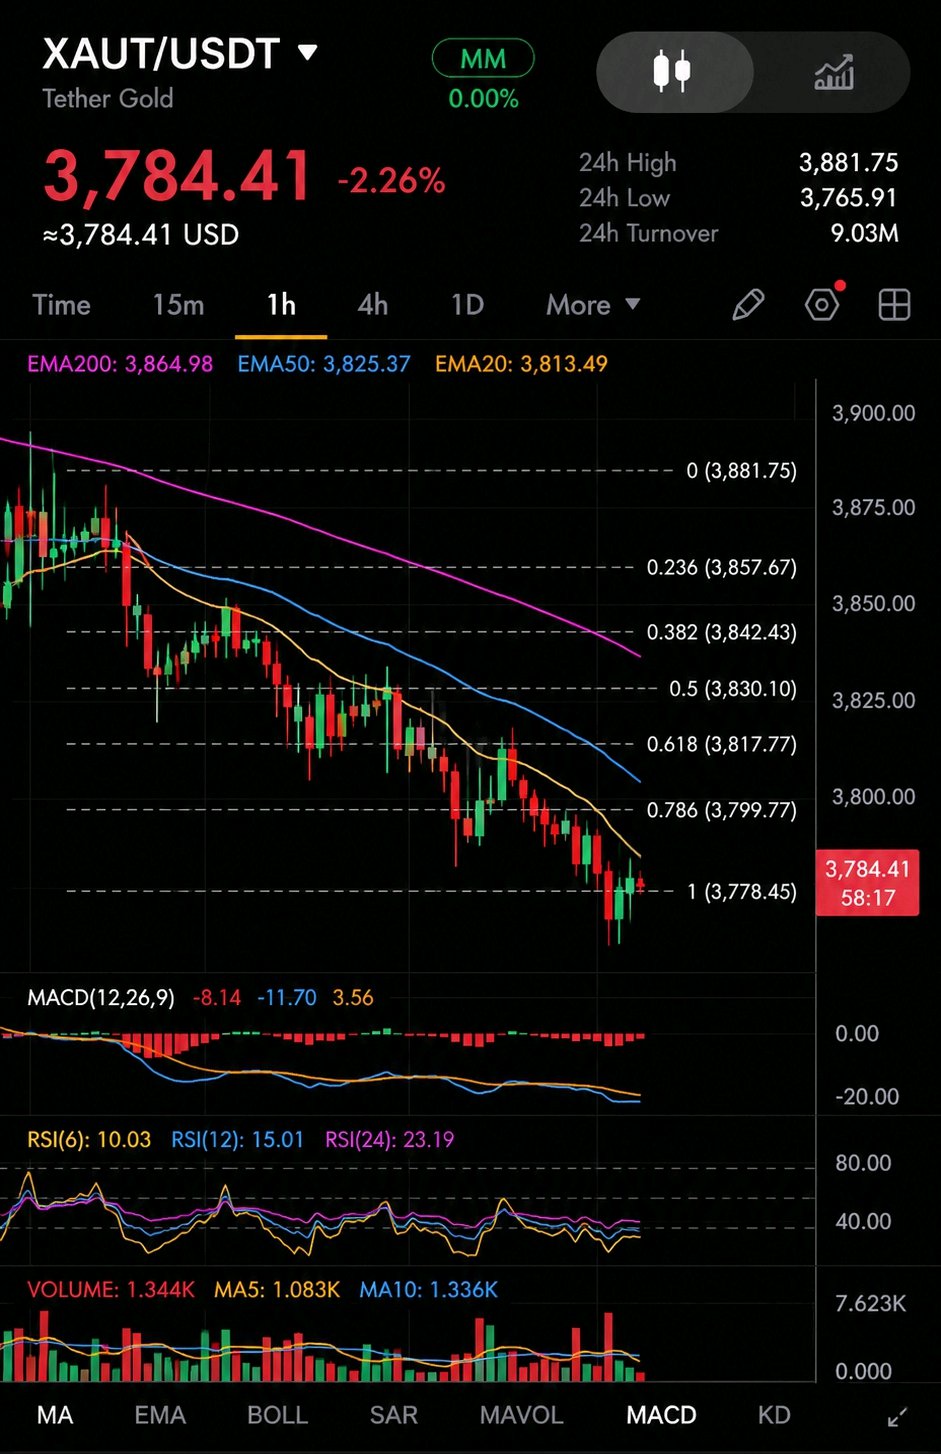
KPMG just counted every gold bar behind Tether Gold. The Big Four firm issued an unqualified opinion on TG Commodities’ 2025 financial statements and physically inspected each bar rather than relying only on custodian records. At year-end 2025 the audit confirmed 520,089 ounces of allocated London Good Delivery gold in Swiss vaults against the same number of XAUT tokens. That is a genuine step up from quarterly BDO attestations. Yet the audit is a snapshot of December 31, 2025. By the end of September 2026, Tether reported reserves had grown to roughly 827,000 ounces. Nearly 40 percent of today’s circulating supply was added after the period KPMG examined. Each XAUT is meant to represent an undivided ownership interest in a specific bar. The gold is held for token holders, not the issuer. Still, the custodian is a related party and remains unnamed in public disclosures. Redemption for physical metal requires a full Good Delivery bar — around 430 XAUT at current prices — so most holders exit through secondary markets rather than the vault. A full audit of last year’s books strengthens the historical claim. It does not continuously verify the bars added since. For a token whose entire value rests on physical metal, the gap between the audited date and the current supply is the detail that still matters. $XAUTUSDT #ByXIMPACT

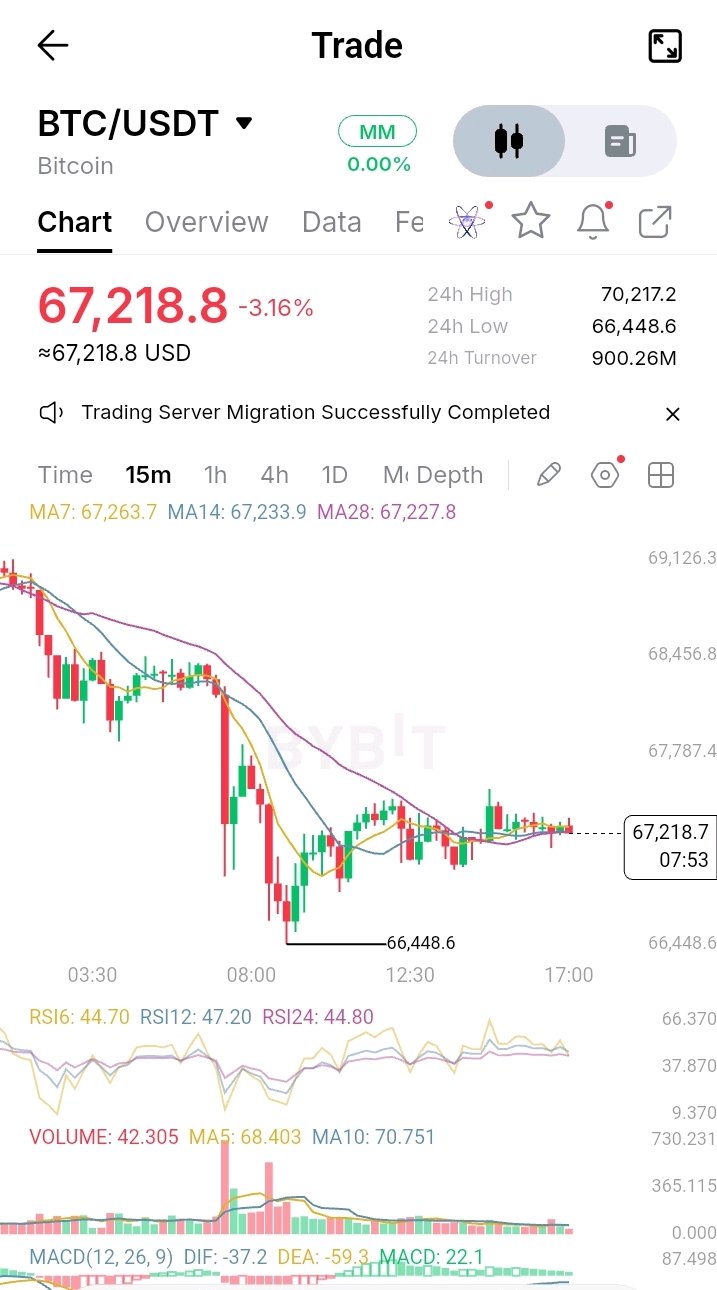
$NEARUSDT just voted to cut its maximum issuance another 36%, from 2.5% to 1.6%. Yet every 30 days the network still creates roughly five times more NEAR in dollar terms than its main revenue product buys back. The House of Stake approved HSP-029 on November 2. The reduction is gradual, starts months after ratification and still requires a nearcore release plus validator adoption before it binds. At the current ~1.31 billion supply and roughly $3.50 price, the existing 2.5% ceiling produces around $9–10 million of new tokens a month. NEAR Intents, the cross-chain router that has already processed tens of billions in volume, is capturing about $1.8 million a month for open-market buybacks. Even at the full 1.6% target the math remains lopsided. Issuance would still outpace today’s captured revenue by a clear multiple. The founder has noted the structural mismatch himself: demand arrives as dollar revenue while inflation is a fixed percentage of supply. A higher NEAR price means the same revenue retires fewer tokens against an unchanged print rate. Most of the newly minted tokens go to stakers. Unstaked holders face less dilution under the lower rate, but the core tension does not disappear. The first cut from 5% to 2.5% in late 2025 already halved daily issuance and has held. The second cut tightens the screw further. Whether Intents fee capture can grow fast enough to close the remaining gap is the number the market will keep testing. #ByXIMPACT
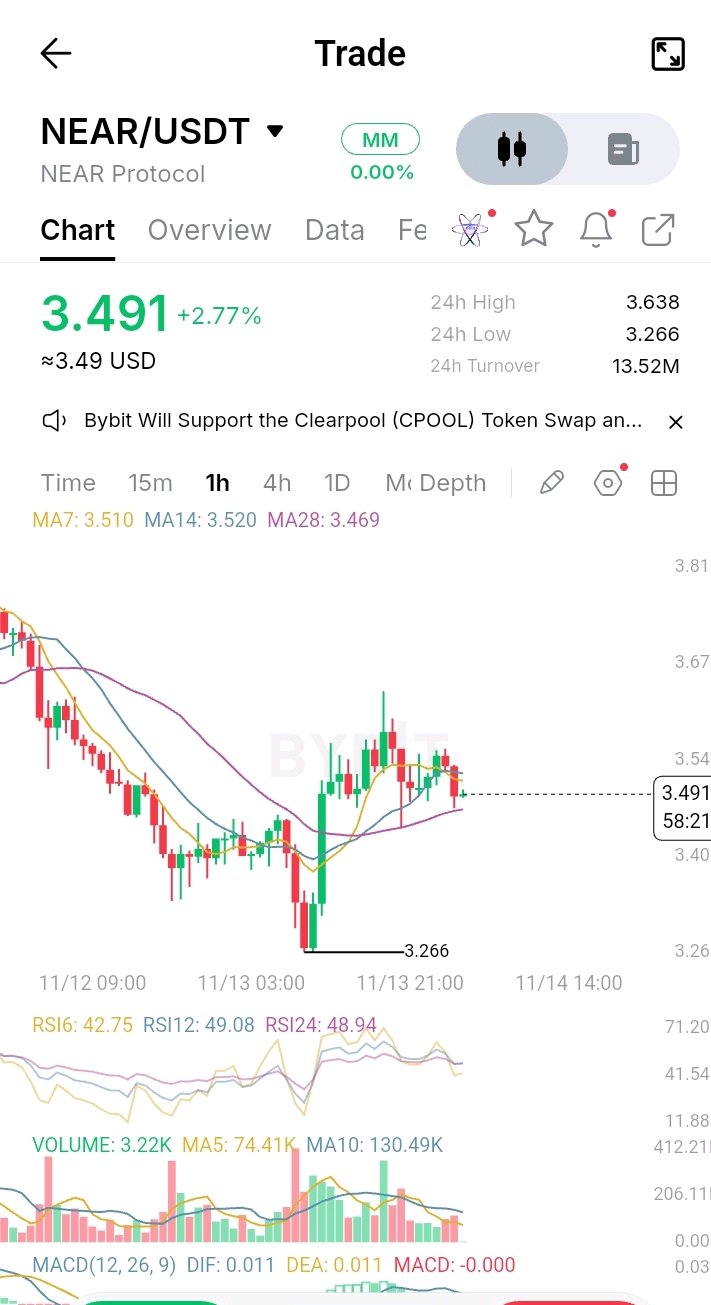
$ARXUSDT just ripped 14% on the 1-hour chart while RSI sits above 90. The move is happening on a float that is still only about 21% of the fixed 1 billion supply. That low circulating number is not an accident. At the June 2026 TGE, roughly 208.8 million ARX unlocked. Almost everything else early backers, core contributors, angels, validators sits behind a 12-month cliff. The first meaningful investor and team unlocks do not begin until June 2027. The more interesting detail is what the token is actually for. Computation fees on Arcium are paid in the host chain’s native asset, primarily SOL. Seventy percent of those fees go to node operators, 20% to recovery nodes, and 10% to the treasury. ARX itself is not the fee token. It is collateral that operators must stake to offer compute capacity, plus a governance token whose voting power scales with lock duration. This creates a structural lag. Demand for ARX only rises when operators need more collateral to expand capacity or when holders lock for governance influence. It does not rise automatically with every confidential computation the network processes. Until staking demand or governance activity scales meaningfully, the token’s value capture remains indirect. The current thin float amplifies every move in either direction. The same schedule that protected the market for the first year will start releasing larger tranches in mid-2027. Whether those unlocks meet genuine staking demand or simply hit the market is the open question the next six months will begin to answer. #ByXIMPACT

$SOLUSDT is testing $78 support while the network has produced blocks without a single halt for over 1,000 days and Alpenglow now targets 150 ms finality. Most of the original genesis allocations are long unlocked. Circulating supply sits near 591.5 million of roughly 637.5 million total. That looks clean on a surface dashboard. It is not the full picture. New SOL still arrives every epoch through staking rewards at the current ~3.56% inflation rate. On top of that, residual Alameda and FTX bankruptcy releases continue on a monthly cadence—approximately 637k SOL on the 11th of each month through early 2028. Add the remaining locked stake accounts that unlock on fixed dates and the next 90 days still inject roughly 1.14% new supply into the float. Staking currently locks about 68% of total supply and delivers a gross yield near 5.2%. That absorbs some pressure, but it does not eliminate the continuous issuance. Every new SOL paid to validators and stakers still expands the denominator that price must overcome. The contradiction is sharp. Network reliability and speed have improved dramatically since the last outage in February 2024. Institutional pipelines (DTCC tokenization targeting H2 2027, tokenized funds already live) are lengthening. Yet the supply schedule remains structurally expansive until the disinflation taper accelerates or demand grows faster than the roughly 22–23 million SOL issued annually at current rates. Holders who treat SOL as “fully unlocked” are measuring the wrong variable. The residual schedule and ongoing inflation are the variables that still matter. #ByXIMPACT
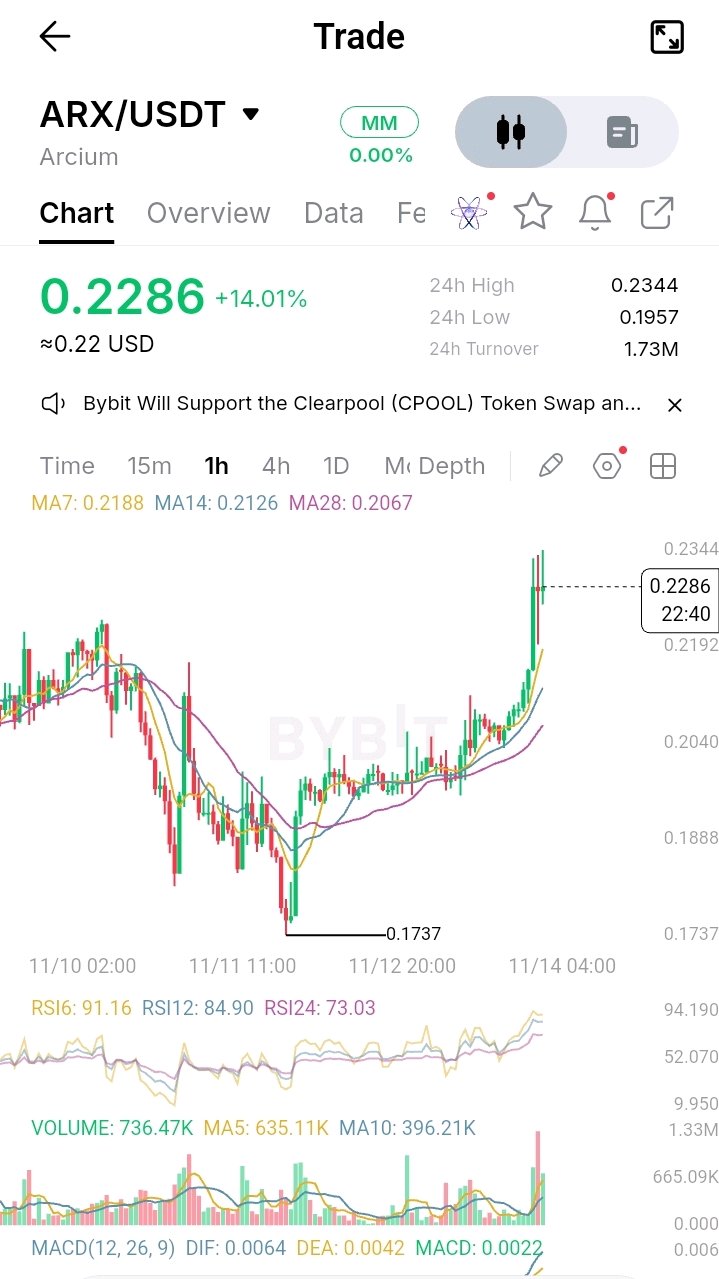
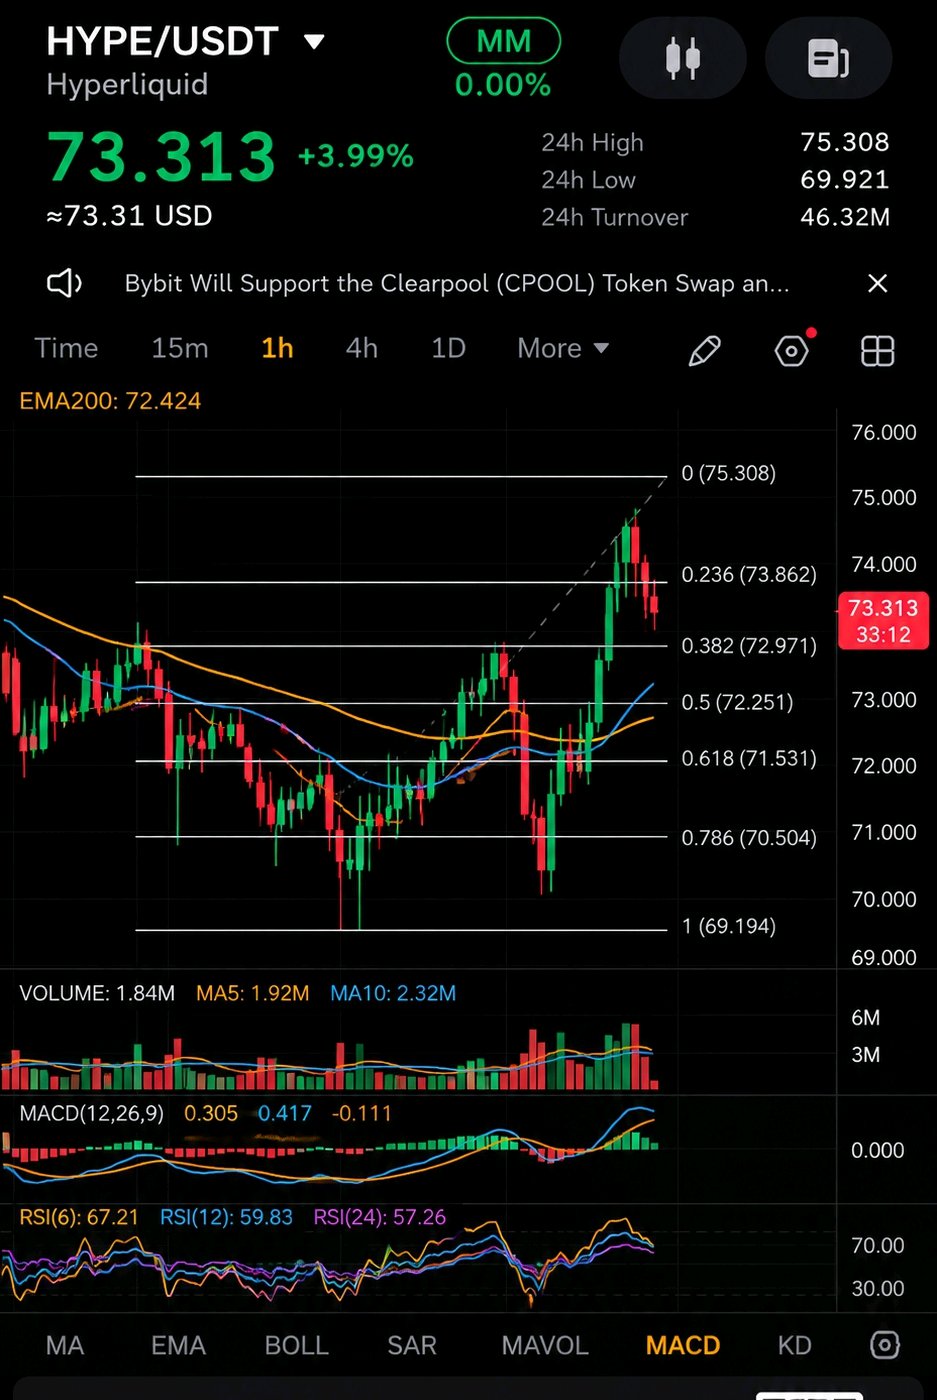
$HYPEUSDT trades near $73 after reclaiming the short-term moving averages, yet the more interesting number sits off the chart. Hyperliquid’s Assistance Fund has already accumulated and treated as burned more than 50 million HYPE roughly 5% of the original 1 billion max supply funded almost entirely by trading fees. That is not a one-time event. Every day the order book generates volume, a portion of those fees continues to buy HYPE and remove it from the effective supply. Meanwhile the circulating figure reported by most trackers sits around 25–30%. The remaining bulk is either reserved for future emissions, locked under contributor vesting that runs through 2027–2028, or staked. The one-year cliff on the 23.8% core-contributor allocation ended late 2025; actual monthly releases since then have been far smaller and more discretionary than the theoretical linear schedule many models assume. The result is a token that faces ongoing sell pressure from vesting while simultaneously experiencing continuous, protocol-native demand from its own fee stream. Most perpetual DEXs distribute fees or keep them in a treasury. Hyperliquid routes them into permanent removal. That mechanism does not eliminate unlock risk, but it does create a structural offset that pure emission schedules lack. Whether the burn rate can outpace future vesting and any increase in free float remains the open question. The data so far shows the buy-side from fees is real and measurable. The sell-side from unlocks is slower and less predictable than the calendars suggest. #ByXIMPACT
Bitcoin just flushed to a 24-hour low near 67,500 while already sitting at roughly 95.8% of its hard-capped 21 million supply. That number sounds scarce. The tradable reality is tighter still. On-chain estimates put the effective float coins that are neither lost, long-term held, nor locked in ETFs and similar vehicles closer to 29% of the total that will ever exist. Newly mined supply continues at about 450 BTC per day until the next halving. In a market where daily demand can run several times that figure, the available inventory is thinner than the circulating-supply headline suggests. The recent drop occurred against a backdrop of consecutive U.S. spot ETF outflows totaling roughly $1.5 billion across six sessions. When the institutional buyer steps back, the thin free float amplifies the move in both directions. Price does not need massive absolute volume to travel far; it only needs the marginal seller to meet limited willing buyers. This is not a new design feature. It is the mechanical result of a fixed issuance schedule colliding with years of accumulation and irreversible loss. The same scarcity that supports the long-term narrative also means short-term liquidity can evaporate faster than most charts imply. What remains uncertain is how quickly that float can expand again if sentiment turns. Until it does, every large outflow tests a market that is already more concentrated than the 20.11 million circulating figure advertises. $BTCUSDT #ByXIMPACT
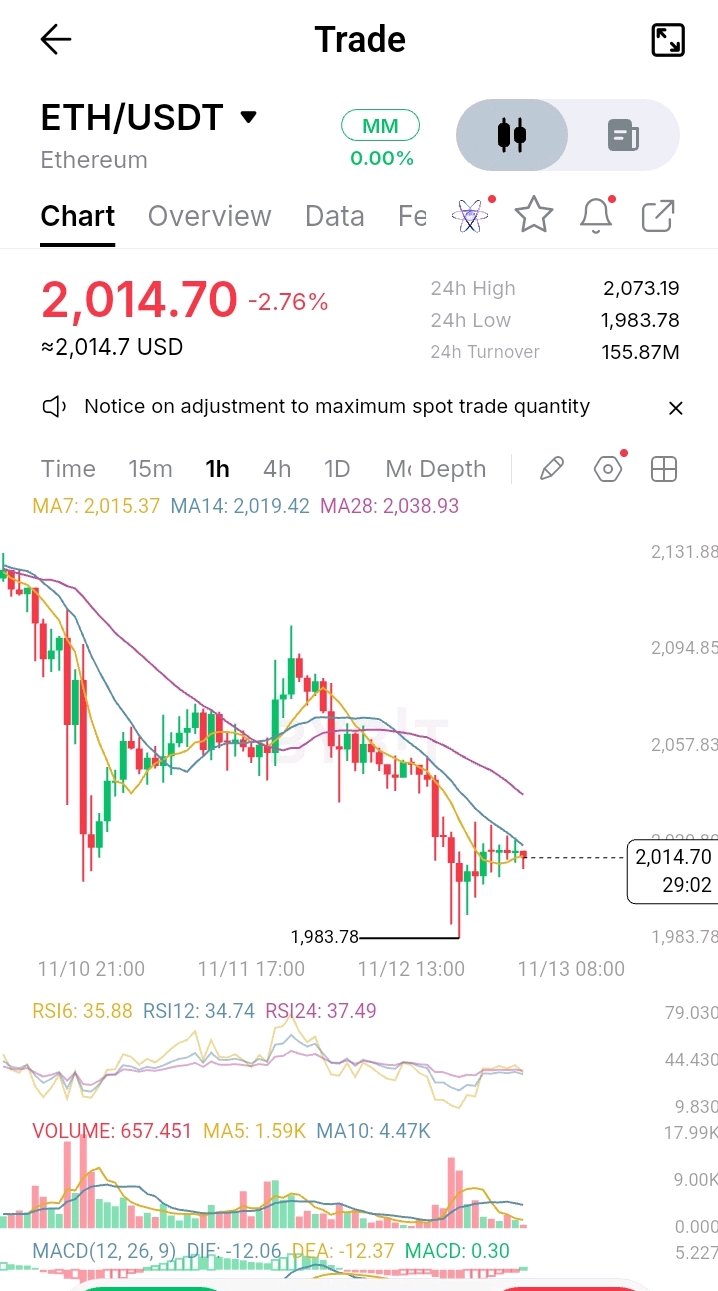
Ethereum's Bounce Hasn't Fixed the Damage Yet $ETHUSDT is hovering around $2,014 after another difficult session, and the 1-hour chart shows why I'm not rushing to call a bottom. The important move happened near $1,983.78. Buyers stepped in aggressively after that drop, preventing an immediate continuation lower. But the rebound has been relatively weak compared with the selling that came before it. That's the problem. Ethereum is still trading beneath its 1-hour moving averages, while RSI remains around 35. The market is showing some stabilization, but buyers haven't demonstrated enough strength to change the short-term picture. There is a narrow window for bulls to improve things. A move above $2,040 would be a meaningful first step, especially if ETH can stay above that level rather than briefly spike through it. From there, $2,057 is the next area worth testing. Failure to make that move could leave ETH vulnerable again. The $2,000 psychological level is nearby, but the more important reference is $1,983.78. Another visit to that low would put the current recovery attempt under pressure. Interestingly, MACD has started to improve slightly. That could mean the strongest part of the selling wave is fading, although it doesn't yet establish a bullish trend. I would rather miss the first part of a recovery than buy a bounce that has not proved itself. Do you think ETH has already found a short-term floor, or does it need another test of $1,984 before buyers can take control? #ByXIMPACT

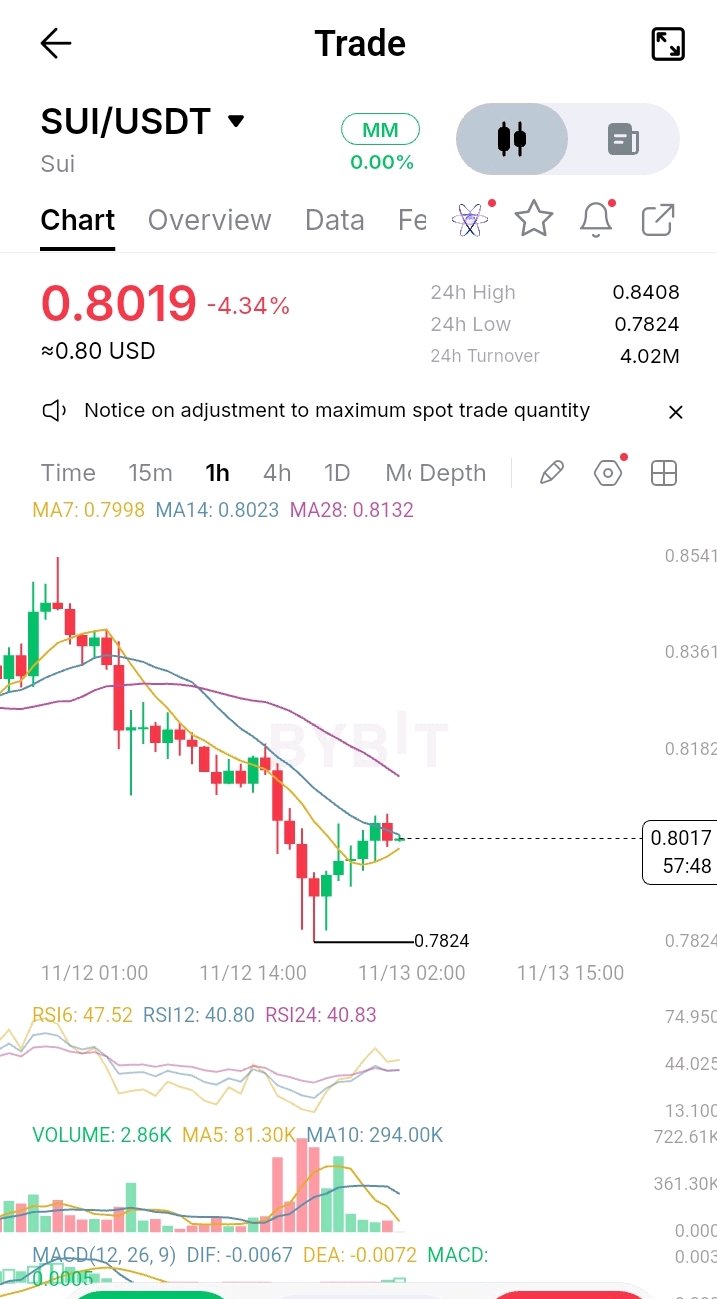
$SUIUSDT Is Recovering From $0.7824, But Buyers Haven't Won Back Control Yet SUI is trading near $0.8019 after falling 4.34% over the last 24 hours. The interesting part of this chart is that buyers have managed to push price away from the $0.7824 low, but the recovery is starting to lose momentum near a key resistance zone. I'm watching the $0.8023–$0.8132 area closely. This zone matters because it contains the 1-hour EMA14 and EMA28. SUI has recovered above its EMA7 at $0.7998, but it is still struggling to reclaim the higher averages. Until buyers take back this area, I see the move as a relief bounce rather than a confirmed trend reversal. There is one more detail worth watching: volume has cooled considerably after the heavy activity around the recent low. The rebound has not yet attracted the same participation as the selloff, which makes me cautious about calling it a strong recovery. If SUI reclaims $0.8132 and holds above it, the next area to watch is around $0.8182, followed by $0.8361. If the recovery fails, $0.7998 is the first nearby level to monitor. Losing that area could bring $0.7824 back into focus. The RSI readings are hovering around neutral to weak territory, while MACD is showing a slight improvement but remains below zero. That's an early sign of stabilizing momentum, not proof that the broader selling pressure has ended. Personally, I want to see SUI reclaim resistance with stronger volume before considering the recovery convincing. Is SUI building a base for another attempt higher, or are buyers simply running out of strength near $0.81? #IMPACTbyTrade

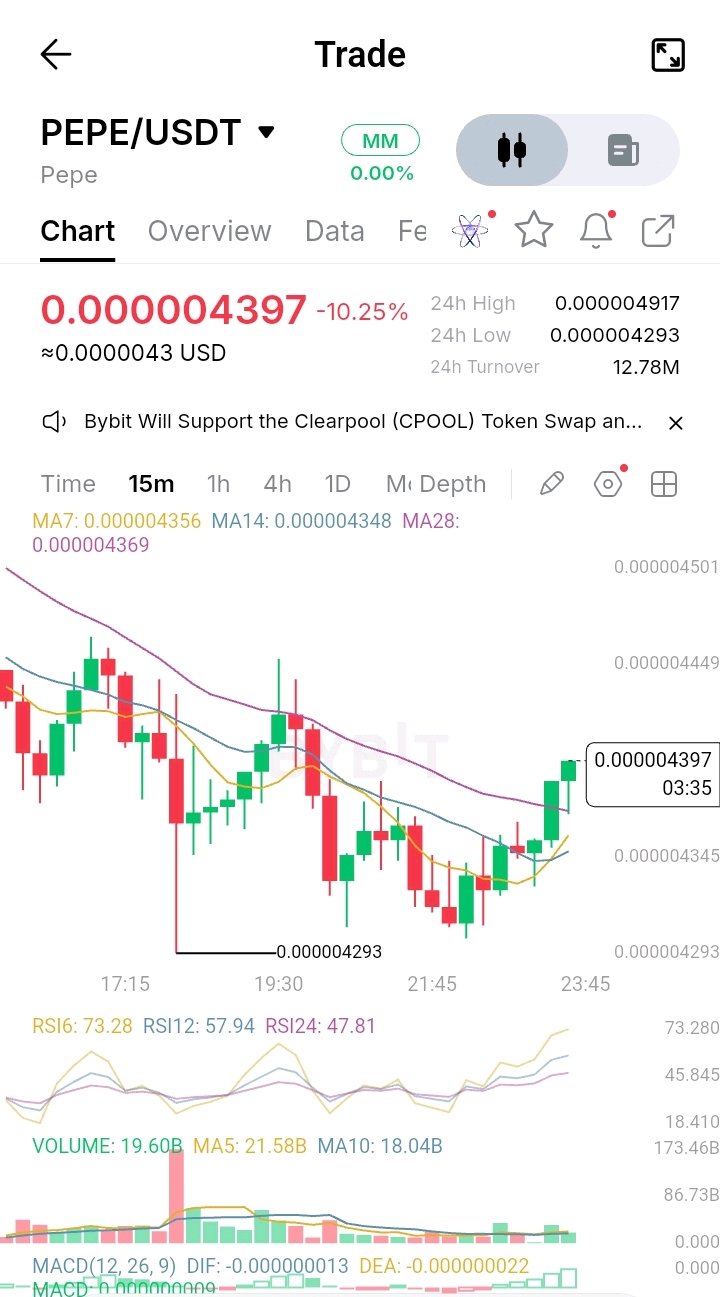
$PEPEUSDT Is Bouncing From $0.000004293, But Can Buyers Turn This Into a Real Recovery? PEPE is still down 10.25% over 24 hours, trading near $0.000004397. But the latest 15-minute chart shows something worth watching: buyers have stepped in after price touched $0.000004293 and pushed it back above the short-term moving averages. That recovery is encouraging, but there's a difference between a short-term bounce and a genuine change in trend. The interesting part is that PEPE has reclaimed the MA7, MA14 and MA28, currently clustered around $0.000004348–$0.000004369. Short-term RSI has also climbed to 73.28, showing that buying momentum has accelerated. However, that high RSI also makes me cautious about chasing the latest green candles. A brief pullback would not be surprising. I'm watching $0.000004369 as an important nearby support area. If buyers defend this zone, PEPE could attempt to challenge $0.000004449, followed by the $0.000004501 area. But if price falls back below the moving-average cluster, the recovery could lose momentum. The recent low at $0.000004293 remains the key downside level. One thing I don't want to overlook is the bigger picture: a 10.25% daily decline is still significant. The latest bounce needs follow-through before I start calling it a reversal. PEPE has shown that buyers are willing to defend the lows. Now I want to see whether they can defend the recovery. Would you trust this bounce, or wait for PEPE to break above $0.000004449 first? #IMPACTbyTrade
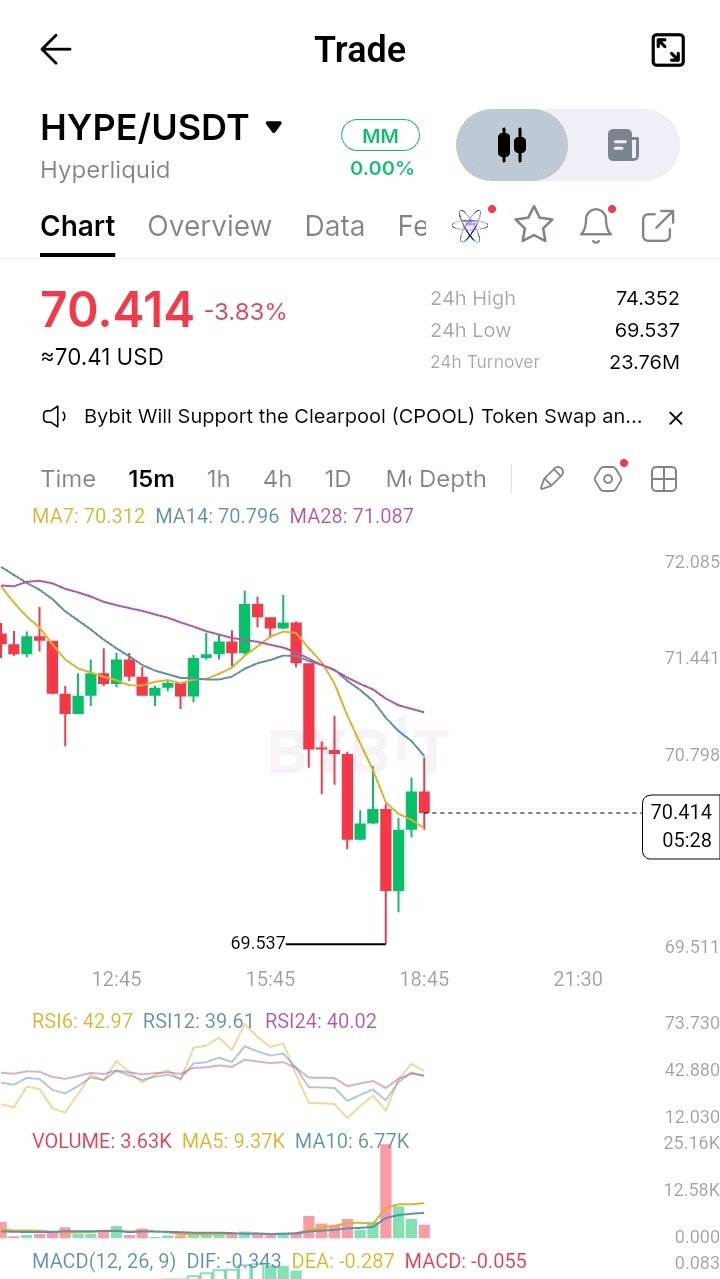
HYPE Bounced From $69.53, But the Recovery Is Facing Its First Real Test HYPE has dropped 3.83% over the last 24 hours and is trading around $70.41. What caught my attention on the 15-minute chart is not just the sharp selloff, but the reaction after price touched $69.537. Buyers stepped in and pushed HYPE back above $70, preventing an immediate continuation lower. That's encouraging, but I wouldn't confuse a bounce with a trend reversal. There is still a problem for the bulls. Price remains below the 14 and 28 moving averages, currently near $70.80 and $71.09. The short-term RSI readings are also below 50, while MACD remains negative. In other words, sellers still have the stronger short-term structure. I'm watching the $70.80–$71.10 area closely. If HYPE can reclaim this zone and hold it on a retest, the recovery could gain credibility, with $71.44 as the next resistance area. But if buyers fail here, the $69.537 low comes back into focus. A break below it could expose HYPE to another leg down. One detail I don't want to ignore is volume. The sharp move around the recent low came with a noticeable volume spike, but the latest volume has cooled. That means the rebound still needs stronger participation to prove that demand is returning. I wouldn't rush into a long just because HYPE bounced from the low. First, I want to see buyers reclaim resistance and defend it. Is this the beginning of a HYPE recovery, or just a temporary bounce before sellers return? $HYPEUSDT #IMPACTbyTrade