Crypto BOSS
129041Like92Shares1353Fans2Follow
📊 Crypto Boss 📈 Technical Analysis | Market Structure & Whale Dynamics 💎 Decoding Crypto Trends & Real-World Assets 👇 Explore Daily Setup & Deep Insights
📊 Crypto Boss 📈 Technical Analysis | Market Structure & Whale Dynamics 💎 Decoding Crypto Trends & Real-World Assets 👇 Explore Daily Setup & Deep Insights
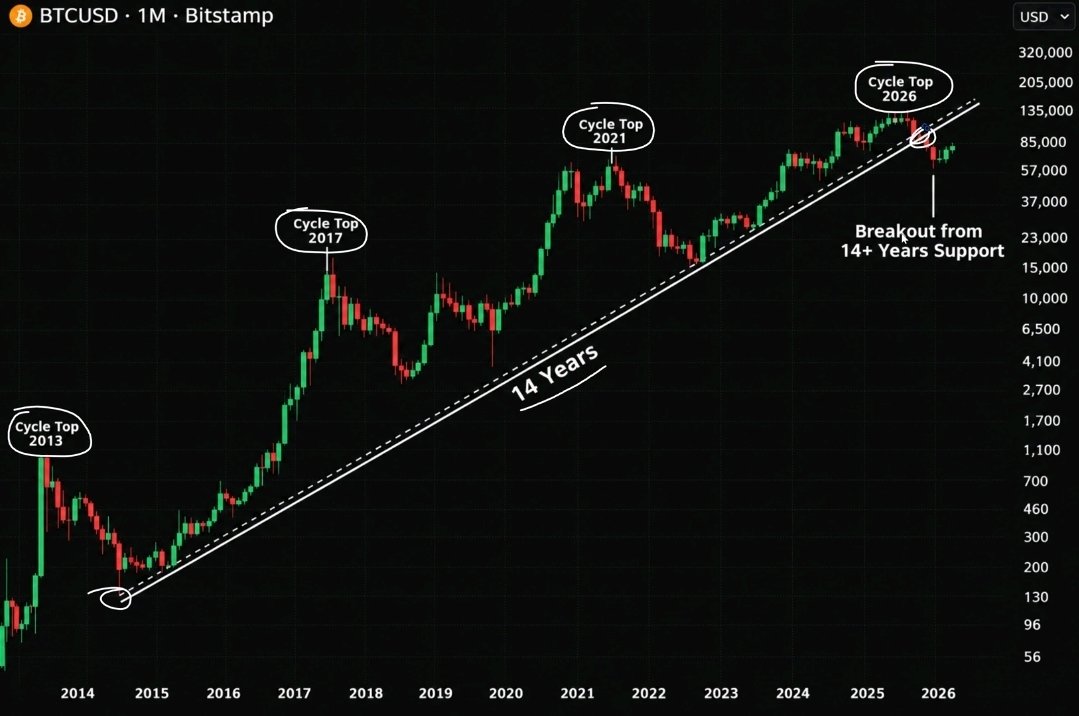
Bitcoin has finally broken below its 14-year trendline. And almost NOBODY understands how serious this could be. Look at the historical pattern: 2013 → Cycle Top. 2017 → Cycle Top. 2021 → Cycle Top. 2026 → Another major breakdown. For over a decade, this rising trendline has defined Bitcoin's long-term bullish structure. Now, for the first time, $BTC is trading BELOW it. But here's what everyone is MISSING: → Bitcoin has lost $70K. → The 200-week moving average near $68K has been breached. → $62K is the next critical level. → Below that, $58K comes back into play. This isn't just another ordinary correction. If Bitcoin fails to reclaim its broken support, we could be witnessing a MAJOR shift in the entire market cycle. One thing matters now: the MONTHLY CLOSE. A recovery could turn this into a massive BEAR TRAP. But a confirmed monthly breakdown would be a serious warning. Same Bitcoin. Different market structure. $BTCUSDT $SPCXXUSDT #ByXIMPACT

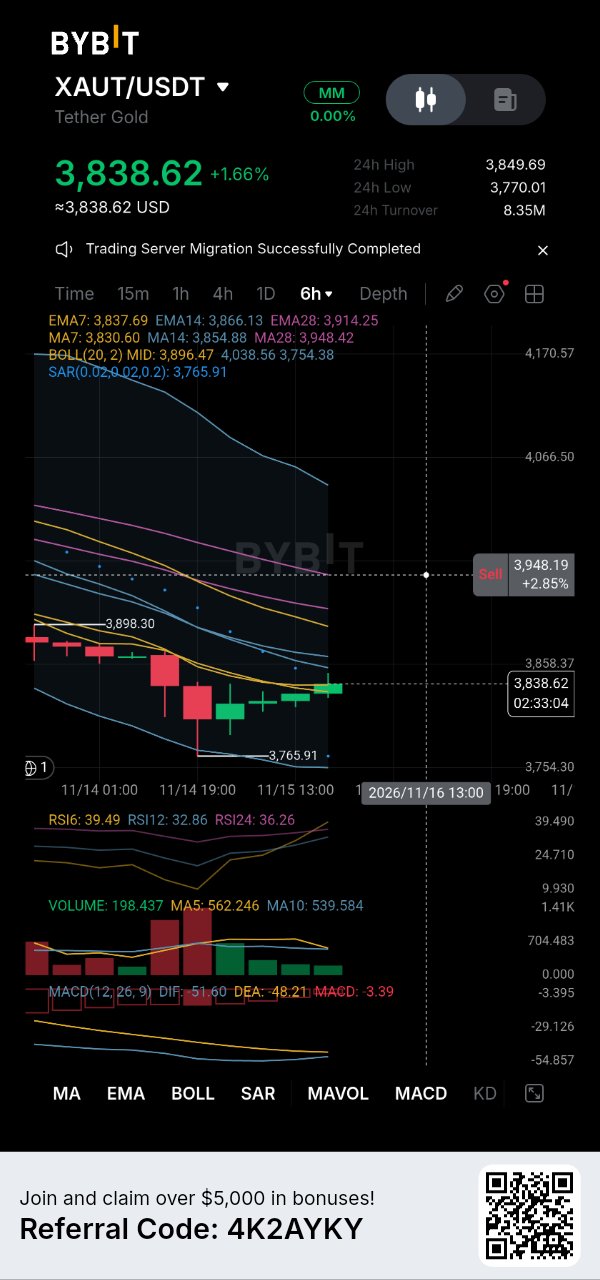
Tether Gold is trading near $3,838.62, up 1.6%, after falling toward the $3,765.91 area on the 6H chart. The latest candles show buyers attempting to stabilize the price. XAUT has moved back above EMA7 at $3,837.69 and MA7 at $3,830.60. That is an improvement, but I would not confuse short-term stabilization with a confirmed trend reversal. The bigger resistance remains overhead. EMA14 sits at $3,866.13, followed by the Bollinger midline at $3,896.47. A sustained move above these levels would provide stronger evidence that buyers are regaining control. Momentum still calls for patience. RSI6 is at 39.49, RSI12 at 32.86, and RSI24 at 36.26. MACD remains negative, with DIF at -51.60 against DEA at -48.21. The selling pressure may be easing, but bullish momentum has not been established. Volume adds another layer of caution: 198.4, compared with MA5 at 562.2 and MA10 at 539.6. The rebound is occurring with relatively limited participation. My focus is now on whether XAUT can hold $3,830 and reclaim $3,866. If it does, $3,896 becomes the next important test. Failure to hold the short-term averages could bring $3,800 and the previous low near $3,766 back into focus. I prefer to wait for confirmation rather than assign too much importance to a modest rebound. Is this the start of a stronger recovery, or simply a pause before another test of the lows? Not financial advice. $XAUTUSDT $BTCUSDT #ByXIMPACT

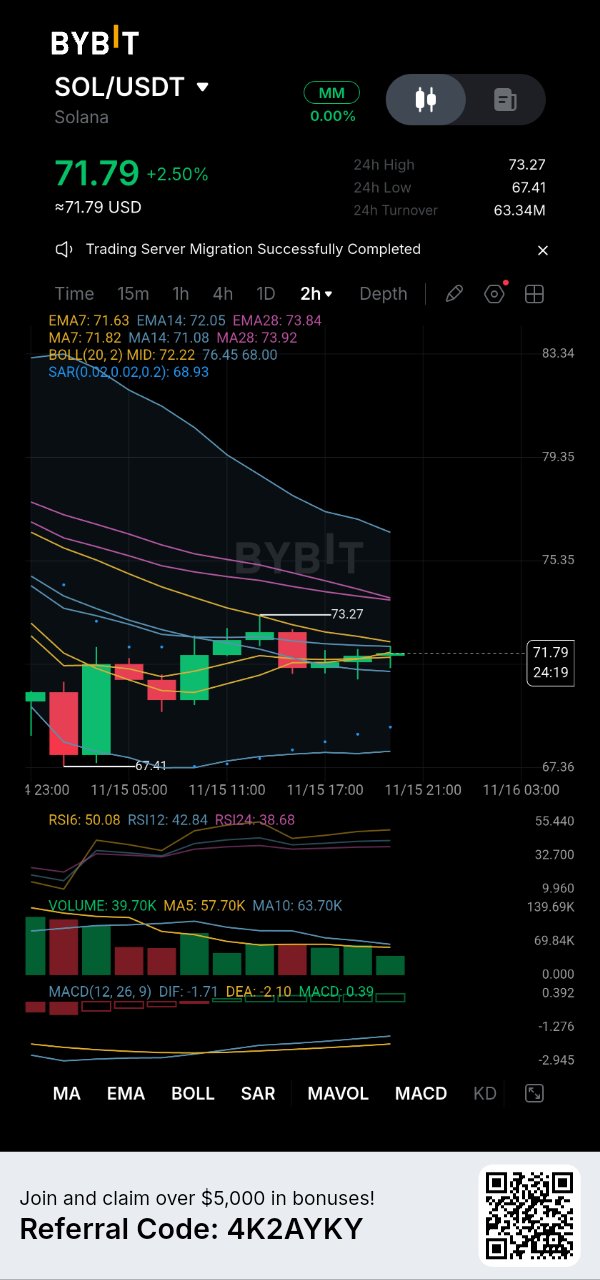
SOL is trading around $71.79, up 2.50% on the 2H chart, after recovering from the $67.41 low. What interests me is not the rebound itself, but whether buyers can turn this recovery into a more sustainable structure. There are some early improvements. RSI6 has returned to 50.08, and the MACD histogram has moved into positive territory at 0.39. Price is also holding near the short-term moving averages. However, the recovery still faces obstacles. The Bollinger midline around $72.22 and EMA14 near $72.05 form the first resistance zone. Above that, $73.27 is the recent local high, while the EMA28 around $73.84 remains another hurdle. Volume is the main caution: approximately 39.7K, below both the MA5 at 57.7K and MA10 at 63.7K. The price is recovering, but participation has not yet strengthened enough to confirm the move. My levels are straightforward: - Above $72.22: recovery gains credibility. - Above $73.27: buyers have a stronger case for continuation. - Below $71: momentum could weaken again. - Below $67.41: the current recovery structure would be invalidated. I would rather see SOL reclaim resistance with stronger volume than assume that one green move has changed the trend. The next few 2H candles should tell us more. Is SOL building a genuine recovery, or does it still need a deeper test of support? Not financial advice. $SOLUSDT $AAVEUSDT #ByXIMPACT

HYPE: 50.59 million tokens reportedly burned but the pace matters as much as the total. According to Odaily, citing Onchain Lens: - 47,700 HYPE were repurchased and burned over the reported 24-hour window. - Average purchase price: $66.37. - Purchase value: approximately $3.17 million. - Cumulative burns: 50.59 million HYPE, equivalent to 5.06% of maximum supply. What I find important is the distinction between cumulative supply reduction and current buying pressure. The latest 47,700-token burn represents roughly 0.094% of the cumulative total. It adds to the long-term reduction, but one strong day does not establish a sustainable trend. The $66.37 figure is a historical buyback average—not a guaranteed support level. Sellers can still overwhelm recurring purchases. My focus is net supply: tokens permanently removed versus tokens becoming available, alongside genuine demand. Burns alone do not tell us whether circulating supply is shrinking. For HYPE, the stronger thesis is sustained token removal not a headline dollar valuation or an automatic price target. Are you tracking daily burns or only the cumulative total? $HYPEUSDT $VVVUSDT #ByXIMPACT

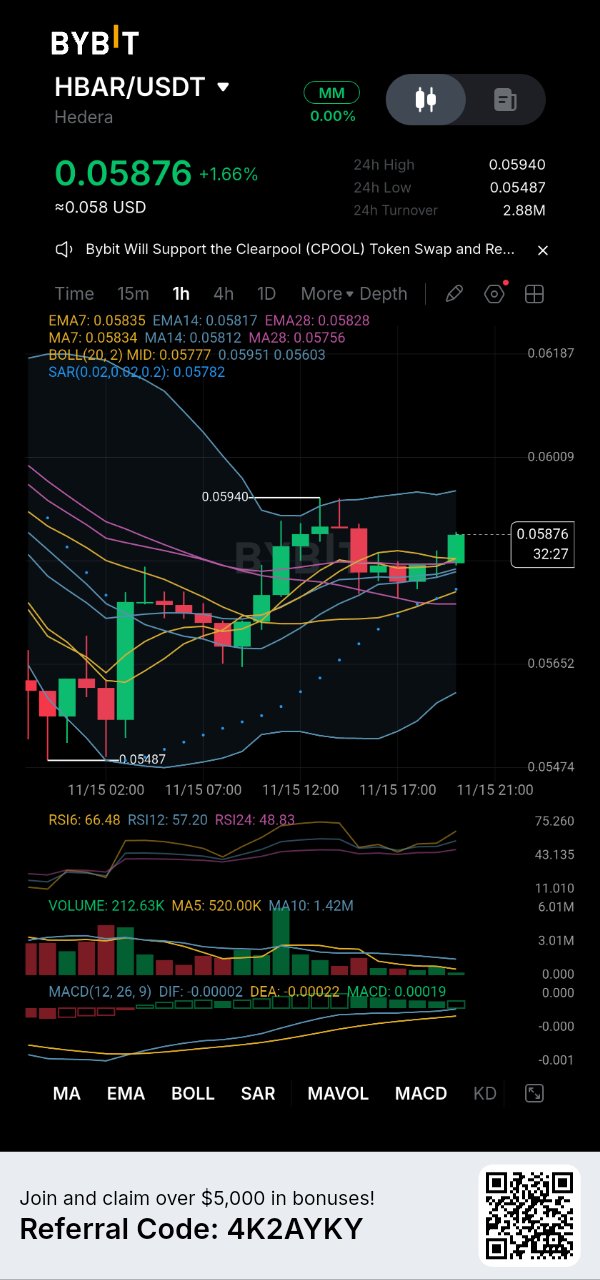
HBAR is methodically reclaiming lost ground, and I am keeping a tight leash on my active trade. The bears tried to dictate the narrative, but the buyers have firmly taken back the wheel. Looking at this 1-hour chart, the price defended the 0.05487 trench and is now driving upward to 0.05876. It is currently pressing against the moving average ribbon, testing the immediate ceiling. Here is my technical reality check: The Power: The MACD has just printed a fresh bullish cross, and the SAR dots are anchored below at 0.05782. The momentum has clearly swung in favor of the bulls. The Danger: The RSI is climbing at 66.48, and the price is staring down the upper Bollinger Band at 0.05951. Furthermore, the local high of 0.05940 is acting as a stubborn lid. A brief pause is expected before breaking through. The Foundation: The EMA cluster (0.05817 - 0.05835) is providing a solid, unyielding cushion, preventing any structural collapse. My Execution Strategy and Risk Management: I am avoiding the urge to chase the momentum here. My Plan for Existing Positions: Since my entry is already locked in from the lower base, I am sitting comfortably in the green. Treating this exact consolidation as the structural floor means buying now is buying the bottom. I am actively managing my winner to hold my ground and ride the continuation. My Ironclad Stop Loss: I have mapped a strict exit trigger just beneath the absolute swing low at 0.05400. If sellers drag the price below this threshold, the setup is void, and I cut the position instantly. No hesitation, just pure discipline. My Target: A decisive breakthrough above the recent 0.05940 peak to unlock further price discovery. I am trading the structure, safeguarding my capital, and letting the market play out. Are you managing your HBAR position through this setup with me? $HBARUSDT $INITUSDT #ByXIMPACT

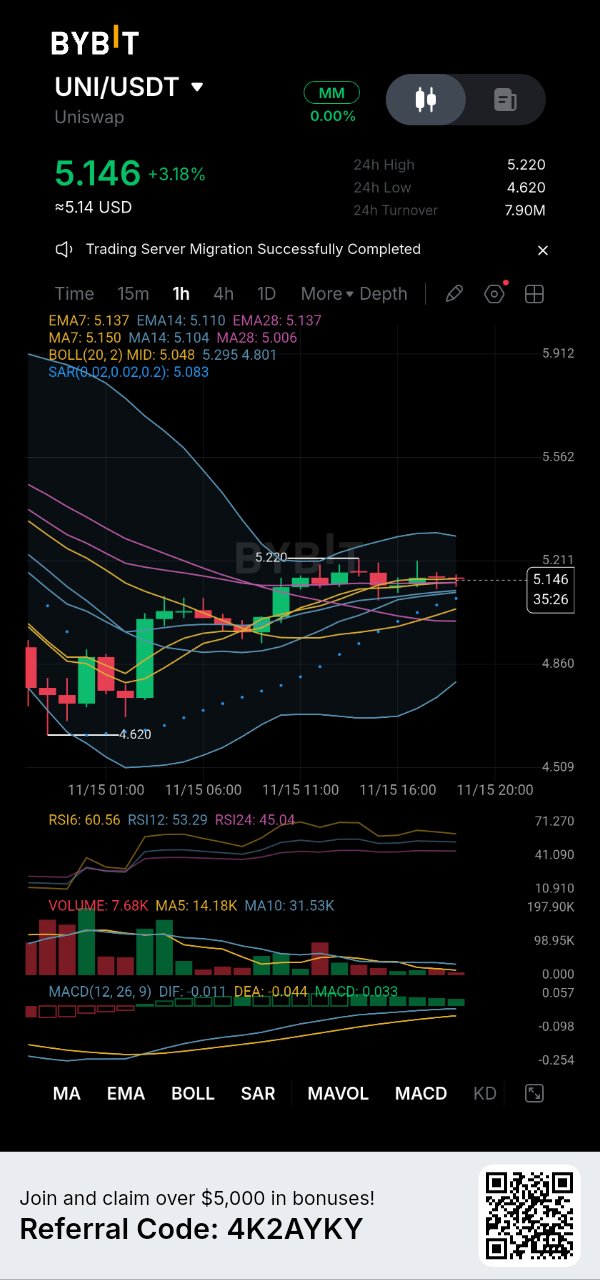
UNI is currently flexing immense resilience, and I am navigating my active trade through this vital testing phase. The bears tried to drag it down, but the buyers are firmly holding the line. Looking at this 1-hour chart, the bulls defended the 4.620 valley perfectly. After a strong bounce, the asset is now compressing tightly at 5.146, wrestling directly with the moving average ribbon to establish a new base. Here is my technical reality check: The Power: The MACD is displaying a clear bullish crossover with a green histogram, and the SAR dots at 5.083 are solidifying the upward bias. The Danger: The RSI is hovering neutrally at 60.56. Furthermore, the price is wrestling with the Bollinger Band midline (5.048) and facing immediate resistance at the local high of 5.220. The Foundation: The EMA cluster (5.110 - 5.137) forms a concrete bedrock, absorbing selling pressure and keeping the bullish structure intact. My Execution Strategy and Risk Management: I am executing with calculated precision, avoiding any emotional entries. My Plan for Existing Positions: Since my ticket is already green from the lower accumulation, I view this current pause as the ultimate ground floor. Treating this exact consolidation as the structural floor means buying now is buying the bottom. I am actively managing my winner to hold my ground and ride the continuation. My Ironclad Stop Loss: I have anchored my strict exit trigger just beneath the absolute swing low at 4.600. If sellers force a break below this threshold, the recovery is invalid, and I cut the position instantly. No hoping, just pure discipline. My Target: A decisive breakthrough above the recent 5.220 peak to unlock fresh price discovery. I am trading the structure, protecting my downside, and letting the market do the heavy lifting. Are you managing your UNI position through this setup with me? $UNIUSDT $GRAMUSDT #ByXIMPACT

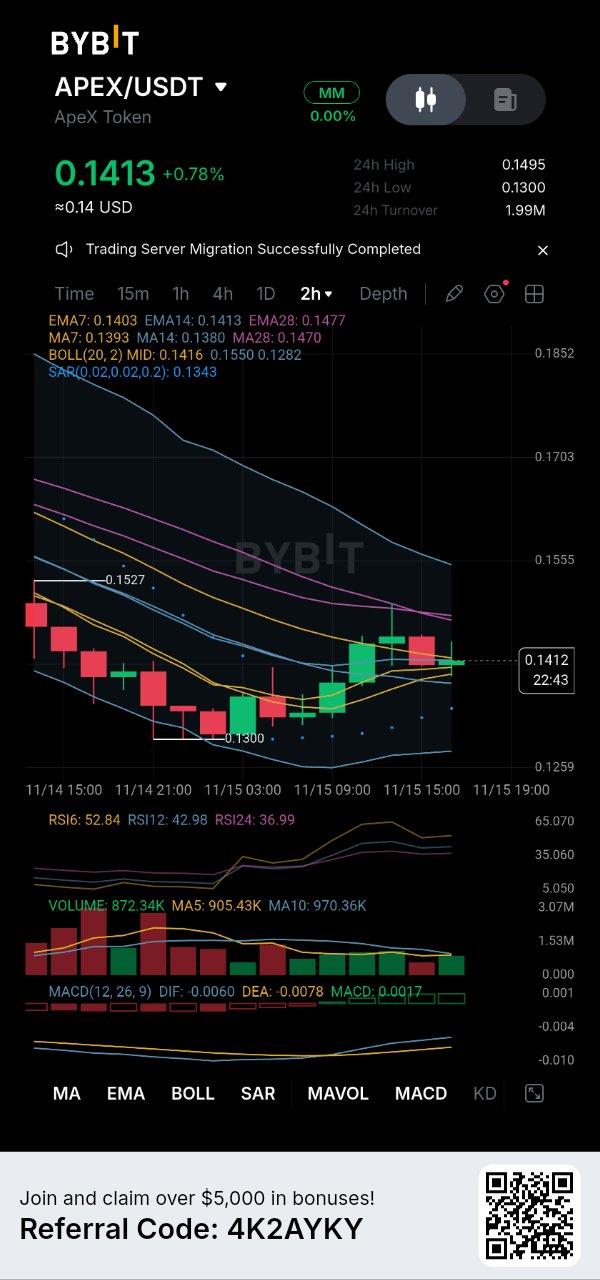
APEX is currently printing a convincing recovery pattern, and I am keeping a firm grip on my active position. The bears had their run, but the tide is quietly turning. Looking at this 2-hour chart, the asset clawed its way back from the 0.1300 abyss. It is now pressing against the EMA cluster at 0.1413, attempting to break the short-term downtrend and establish a new base. Here is my technical reality check: The Power: The MACD just executed a bullish cross with the histogram turning green, while the SAR dots act as a safety net below at 0.1343. The selling momentum is clearly exhausted. The Danger: The RSI sits at a cautious 52.84. Additionally, the EMA28 at 0.1477 remains a heavy overhead ceiling that must be shattered to confirm the trend reversal. The Foundation: The lower Bollinger Band at 0.1282 is holding strong, providing a sturdy bedrock for this recovery to build upon. My Execution Strategy and Risk Management: I am avoiding the urge to blindly chase green candles. My Plan for Existing Positions: Since my entry is already locked in from the lower bounce, I am in the green. Treating this consolidation as the definitive structural floor means buying now is buying the bottom. I am actively holding my ground to ride the upcoming continuation. My Ironclad Stop Loss: I have mapped a strict exit trigger just beneath the absolute swing low at 0.1280. If sellers drag the price below this threshold, the recovery is void, and I cut the position instantly. No hesitation. My Target: A decisive breakthrough above the recent 0.1495 peak to explore uncharted price territory. I am trading the structure, protecting my downside, and letting the market do the heavy lifting. Are you managing your APEX position through this setup with me? $APEXUSDT $GLMRUSDT #ByXIMPACT

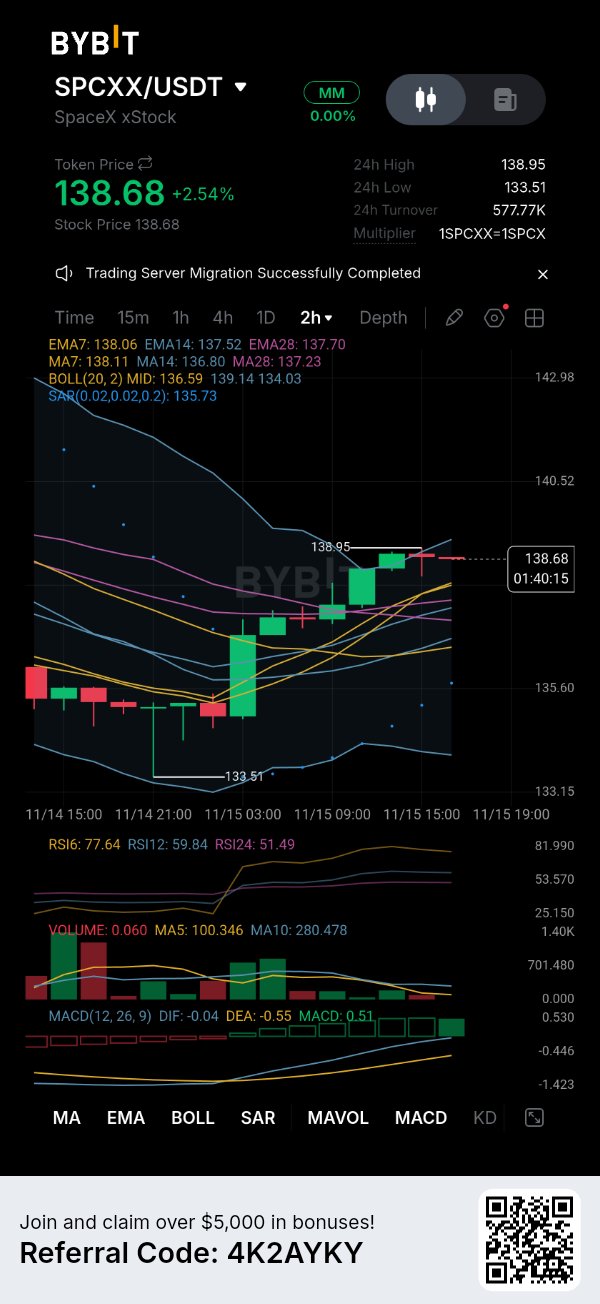
SPCXX just defended the $135 IPO price on a Sunday, and that's exactly the kind of level I like to watch. Around 21:00 on Nov 14 it dipped to $133.51, a little under the $135 SpaceX sold its shares at on June 12, and buyers took it straight back. At 03:00 a big green candle added about 1.9%, and it has stepped up since then to $138.95 at 15:00. At 17:00 it's $138.68, sitting right on top of the 7-period average at $138.06, up 2.54% on the day. RSI6 is near 78 on the 2h, so I'd rather let it come to me. The zone worth watching for a dip entry is $136.80 to $137.70, where the 14 and 28-period averages sit, and the idea is wrong if it closes under $136.00. A partial at the $138.95 high locks in the first leg, and the full move to $141.50 is worth about 3 to 1. Weekend liquidity is thin and Monday's open can gap, so I'd keep size small and place the stop with that in mind. What matters more to you on a stock like this: the IPO price as support, or the first Monday candle? Just my read, not advice. $SPCXXUSDT $NVDAXUSDT #ByXIMPACT

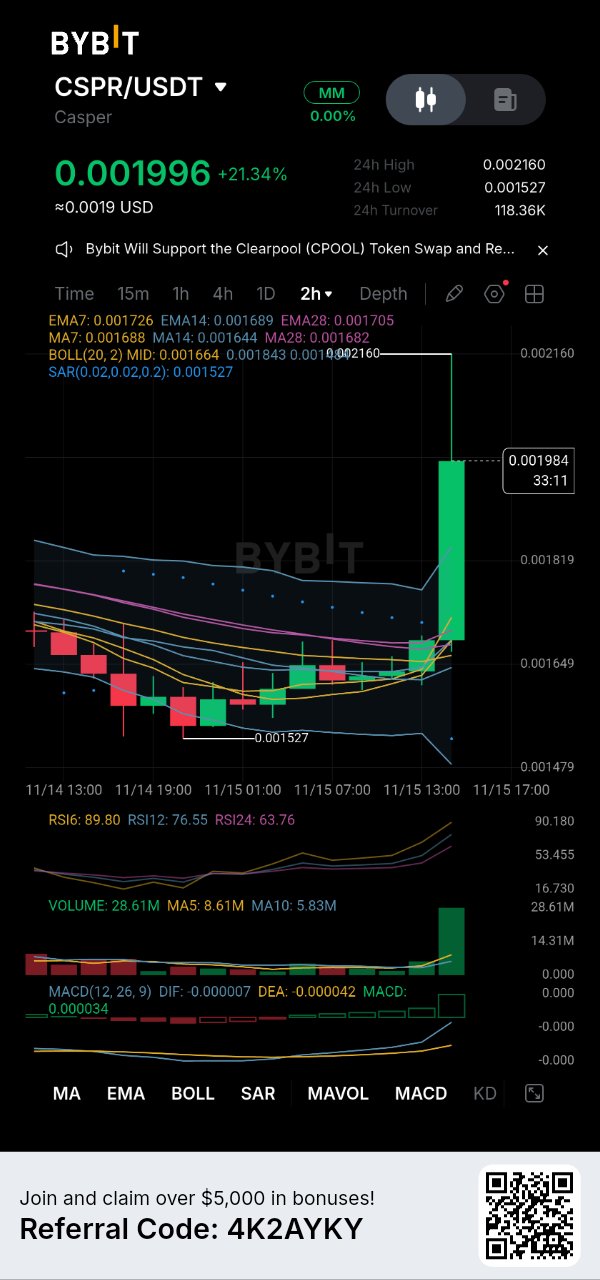
CSPR is showing an absolute volcanic eruption right now, and I am carefully navigating my active trade through this explosive volatility. The market is in a frenzy, but my discipline is keeping me anchored. I never let the roar of the crowd distort my risk assessment. Looking at this 2-hour chart, the bulls have executed a devastating vertical attack. We rocketed from a sleepy 0.001527 base straight to a towering peak of 0.002160. The EMA ribbon is left in the dust far below, acting as a distant parachute. Here is my technical reality check: The Power: The MACD is expanding with colossal green energy, and the SAR dots are cemented way down at 0.001527, confirming the buyers have absolute supremacy. The Danger: The RSI is flashing a blazing 89.80. This is extreme, dizzying altitude, and the price is floating wildly above the upper Bollinger Band. A sudden, violent snapback is practically guaranteed. My Execution Strategy and Risk Management: I am operating with calculated restraint. I am not going to chase the peak of this parabolic wick. My Plan for Existing Positions: Since my entry is already secured from the lower trenches, I am sitting on massive profits. Treating this exact consolidation as the structural floor means buying now is buying the bottom. I am actively managing my winner to hold my ground and ride the continuation. My Ironclad Stop Loss: I have anchored my strict exit trigger just beneath the absolute swing low at 0.001480. If sellers drag the price below this threshold, the entire thesis shatters, and I cut the trade instantly. No hoping, just pure discipline. My Target: Pure price discovery above the recent 0.002160 peak. I am trading the structure, protecting my downside, and letting the trend unfold. Are you managing your CSPR position through this massive surge with me? $CSPRUSDT $INITUSDT #ByXIMPACT

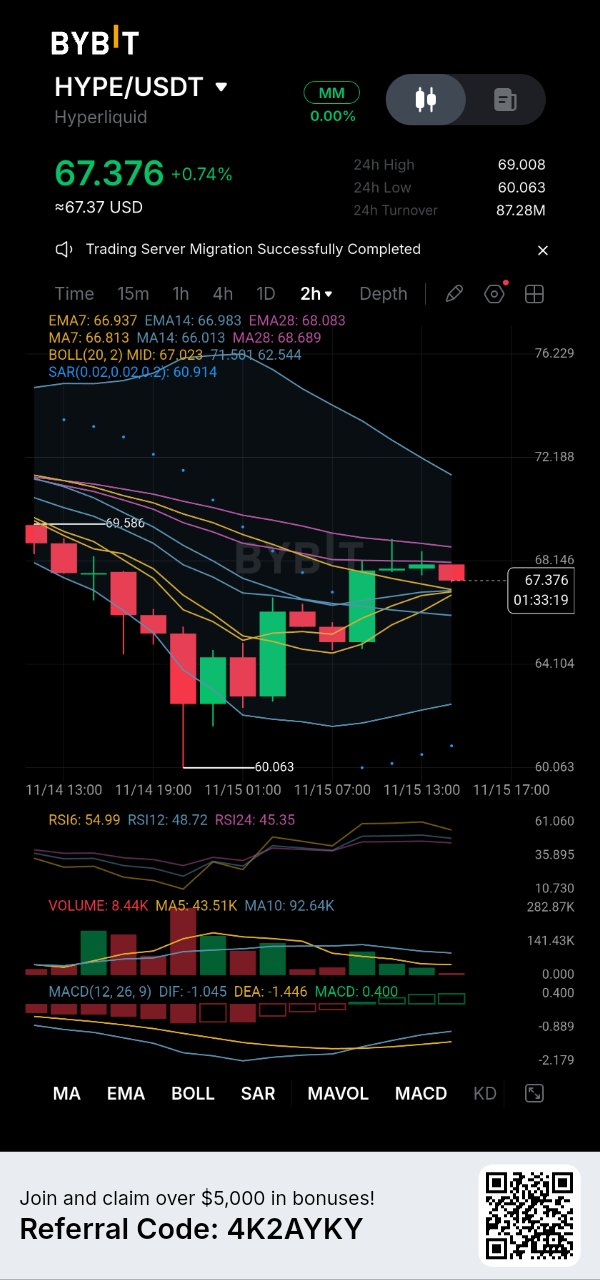
⚡ $HYPE: +12% bounce from $60 — a real reversal or just a correction inside a bigger drop? Price ripped from 60.063 to nearly 69 in a few sessions (+0.74% now at 67.37). Encouraging — but I don't buy the story before checking the evidence. My full read: 1️⃣ What fueled the bounce? The headline on the exchange: "Trading Server Migration Successfully Completed." Infrastructure stability after a migration often restores buyer confidence, especially in liquidity-sensitive assets like HYPE. 2️⃣ SAR gave an early signal 🟢 SAR flipped to 60.914 — comfortably below price. Dots now support buyers, but SAR is a lagging indicator by nature; never a foundation alone. 3️⃣ ⚠️ Volume spoils the party Current volume: 8.44K vs 92.64K average — under 10% of normal! A bounce on this volume = a move without soldiers. Either quiet accumulation is starting, or real participants are absent before a decision. That's the core question. 4️⃣ The real battle: the 68.1–68.7 resistance cluster • Price below EMA28 (68.083) and MA28 (68.689) — the bears' last line of defense • Neutral RSI (54.99 / 48.72 / 45.35) — no oversold, no overbought = indecision • MACD: DIF (1.045) above zero but crossed below DEA — momentum fading exactly where it should, at a decision zone • Bollinger: price at the mid-band (67.023) — the dividing line between continuation and breakout attempt 5️⃣ The levels this trade is managed around: • 69.008 — 24h high. Breaking it opens 71.58 (upper Bollinger band) • 66.0–66.9 — support cluster (EMA7 + MA7 + MA14). The buyers' vault • 62.54 — lower Bollinger band • 60.063 — the low. Losing it means the bounce was a complete illusion 🎯 My trading plan, with numbers: Primary scenario (buy the retest — conditionally): Entry: 66.50–66.90 (cluster retest) SL: 65.00 (below the cluster with breathing room) TP1: 69.00 | TP2: 71.50 R:R: ~1.7:1 to TP1, ~3.3:1 to TP2 ✅ Alternative (short the rejection): If 68.70–69.00 gets tapped and reverses with a clear rejection candle → short entry, stop above 69.60, targets 66.00 then 62.50 🧠 The biggest lesson: My strongest trades were the ones where I waited for confirmation instead of chasing the candle. HYPE is now at a crossroads: a 69 breakout on real volume = a serious buyer. Volume staying dead = this bounce gets sold. Real position attached via $HYPE $HYPEUSDT $GLMRUSDT #ByXIMPACT

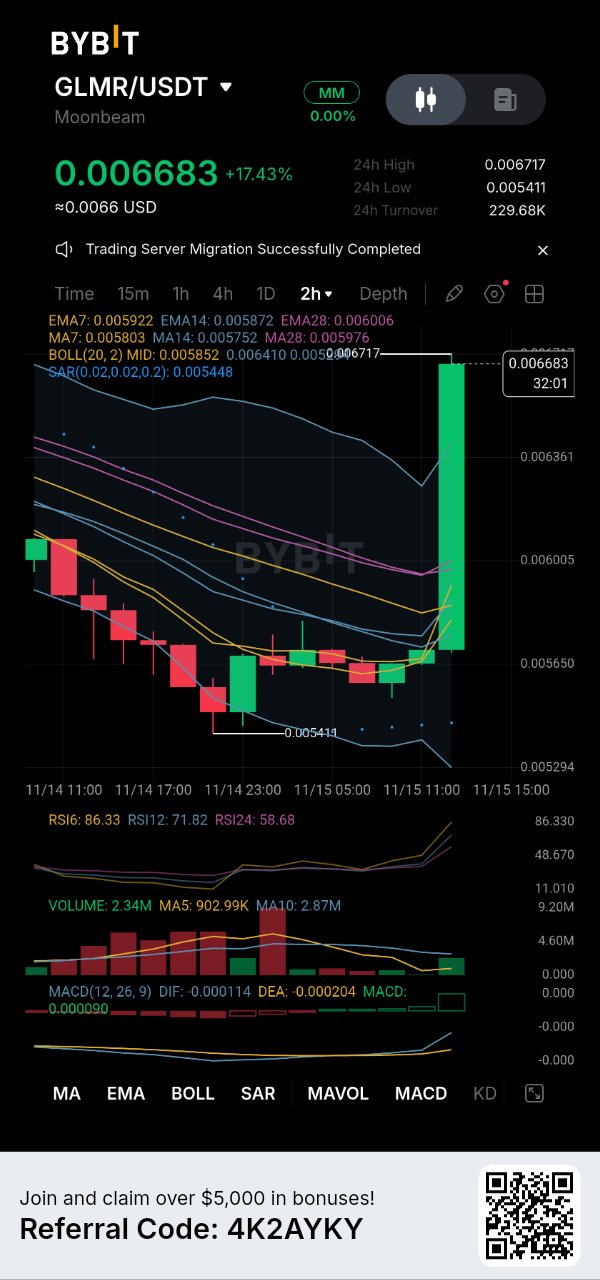
GLMR just shattered the silence with a massive breakout, and I am steering my active position through this explosive wave of momentum. The market was sleeping, but the bulls have definitely taken the wheel. Looking at this 2-hour chart, a sudden surge of volume propelled the price from a 0.005411 base straight to a 0.006717 peak. The asset is currently holding firm at 0.006683, completely reclaiming the moving average ribbon. Here is my technical reality check: The Power: The MACD is expanding aggressively with a vibrant green histogram, while the SAR dots are anchored way down at 0.005448, confirming the bulls are in total control. The Danger: The RSI is flashing an extreme 86.33, and the price is breaking far above the upper Bollinger Band (0.006410). This intense overbought signal means a brief retest or cool-off is highly likely before the next leg up. The Foundation: The entire EMA cluster (0.005872 - 0.006006) has been violently flipped, transforming from heavy resistance into a rock-solid bedrock beneath us. My Execution Strategy and Risk Management: I am executing with absolute discipline, refusing to let the green candles dictate my emotions. My Plan for Existing Positions: Since my ticket is already secured from the lower accumulation, I am sitting on a massive cushion. Treating this exact consolidation as the structural floor means buying now is buying the bottom. I am actively managing my winner to ride this explosive continuation. My Ironclad Stop Loss: I have anchored my strict exit trigger just beneath the absolute swing low at 0.005300. If sellers force a breach of this threshold, the breakout is void, and I cut the trade instantly. No hoping, just pure discipline. My Target: A decisive push above the recent 0.006717 peak to unlock uncharted price territory. I am trading the structure, protecting my downside, and letting the market do the heavy lifting. Are you holding your GLMR position through this breakout with me? $GLMRUSDT $INITUSDT #ByXIMPACT

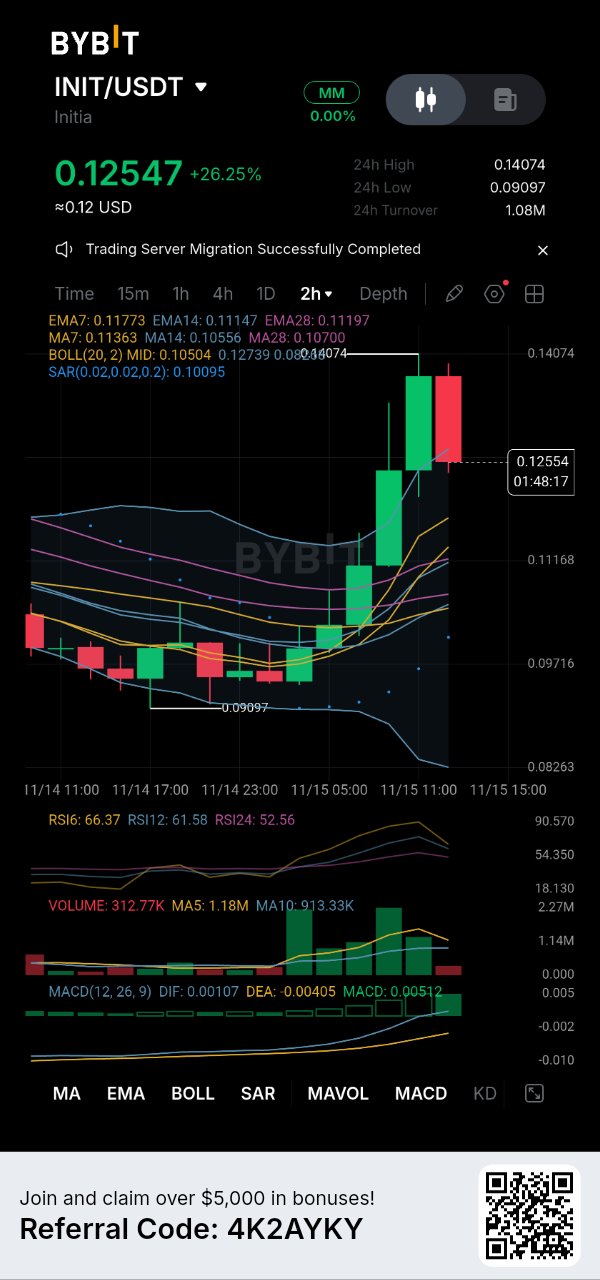
INIT just unleashed a staggering 26% vertical rally, and I am actively steering my open trade through this explosive wave of market euphoria. Looking at this 2-hour chart, the buyers went on an absolute rampage. After consolidating near the 0.09097 abyss, the asset launched a relentless offensive, shattering every resistance to hit a peak of 0.14074. It is currently catching its breath at 0.12547, holding firmly onto the massive gains. Here is my technical reality check: The Power: The MACD is expanding fiercely with a vibrant green histogram, while the SAR dots are planted far below at 0.10095, solidifying the bullish grip on the market. The Danger: The RSI is sitting at a heated 66.37, and the price is retreating slightly from the upper Bollinger Band (0.12739). This suggests a necessary cooldown phase before the next major thrust. The Foundation: The entire EMA cluster (0.11197 - 0.11773) has been violently reclaimed, turning former resistance into a robust concrete base. My Execution Strategy and Risk Management: I am executing with absolute precision, refusing to let the green candles dictate my emotions. My Plan for Existing Positions: Since I already secured my entry from the lower trenches, I am sitting on substantial gains. Treating this exact consolidation as the structural floor means buying now is buying the bottom. I am actively managing my position to hold my ground and ride the continuation. My Ironclad Stop Loss: I have anchored my strict exit trigger just beneath the absolute swing low at 0.09000. If sellers breach this barrier, the entire thesis is void, and I eject instantly. No hesitation, just pure discipline. My Target: A decisive breakthrough above the 0.14074 peak to explore uncharted price territory. I am trading the structure, protecting my downside, and letting the market do the heavy lifting. Are you managing your INIT position through this surge with me? $INITUSDT $NIGHTUSDT #ByXIMPACT

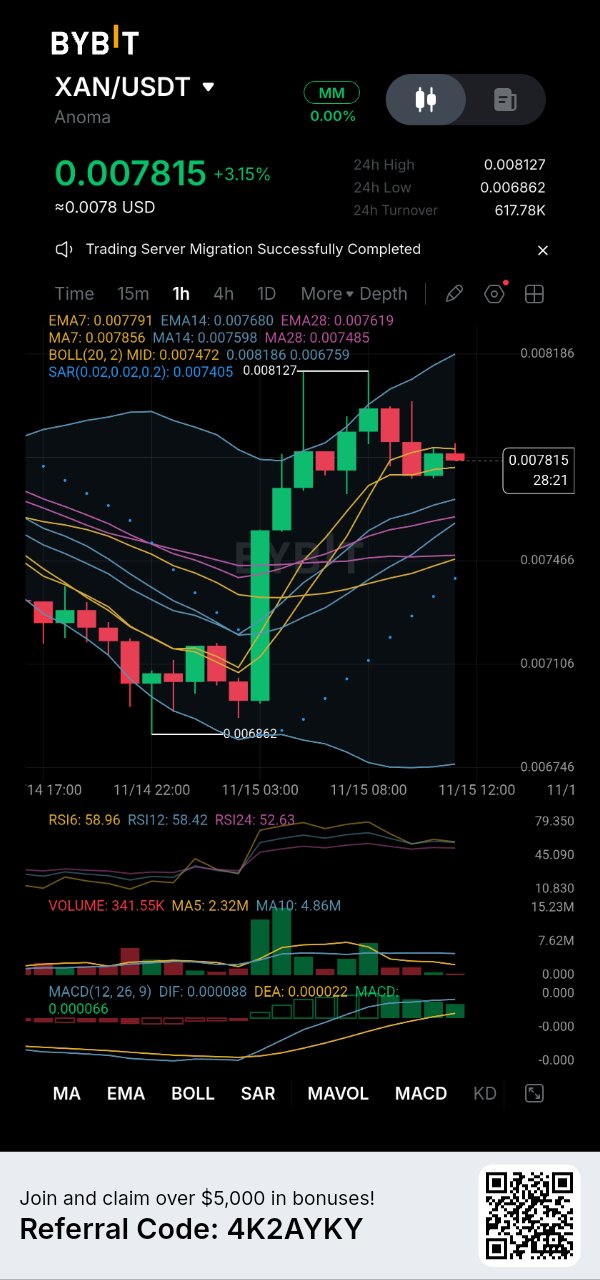
XAN is refusing to give back its recent gains. I am actively monitoring my open trade as the asset builds a fresh foundation above key support. Looking at this 1-hour chart, a sudden burst of volume launched the price from a 0.006862 base straight to a 0.008127 peak. The asset is now resting firmly at 0.007815, consolidating just above the moving average ribbon. Here is my technical reality check: The Power: The MACD is displaying solid green momentum, and the SAR dots are anchored far below at 0.007405, confirming the buyers are still holding the reins. The Danger: The RSI is sitting at a neutral 58.96, but the price is testing the upper Bollinger Band at 0.008186. This indicates we need a fresh surge in volume to break through the overhead ceiling. The Foundation: The EMA cluster (0.007619 - 0.007791) has been completely flipped into a sturdy support floor, absorbing any immediate selling pressure. My Execution Strategy and Risk Management: I am executing with pure logic, refusing to let the recent green candles cloud my judgment. My Plan for Existing Positions: Since I am already riding this wave, I am in profit. Treating this exact consolidation as the structural floor means buying now is buying the bottom. I am actively managing my winner to hold my ground and ride the continuation. My Ironclad Stop Loss: I am placing my strict stop loss just below the absolute swing low at 0.006800. If the price loses this structural floor, the momentum is dead, and I exit instantly. No hoping, just pure discipline. My Target: My primary target is pure price discovery above the recent high of 0.008127. I am trading the structure, protecting my downside, and letting the market do the heavy lifting. Are you managing your XAN position through this setup with me? $XANUSDT $NIGHTUSDT #ByXIMPACT

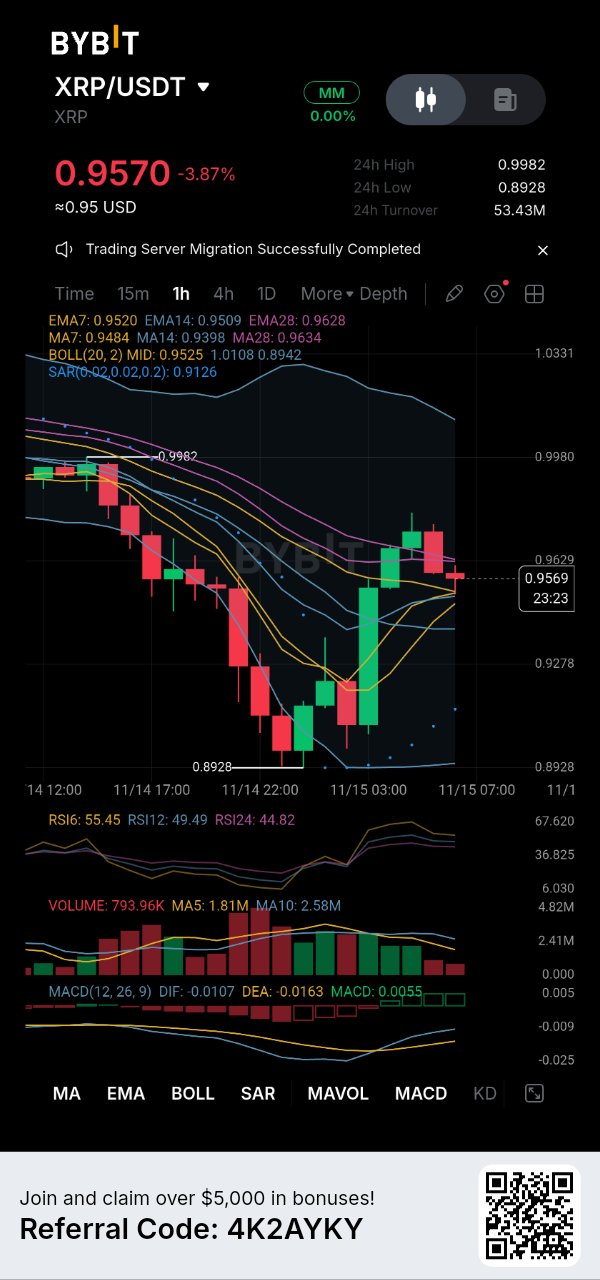
⚡ $XRP: Bounced from 0.8928 smart recovery or a liquidity trap? After a brutal -4.11% drop, XRP ripped from 0.8928 to ~0.97. Easy to get fooled by that momentum — but the devil is in the details: 1️⃣ What actually happened? The drop into 0.8928 wasn't random — it was a liquidity sweep below the prior swing low. Price broke down, collected stop-losses, then reversed violently. A pattern we see repeatedly before strong bounces. 2️⃣ The warning pros don't ignore ⚠️ Look at MAVOL: volume is fading with every new green candle. A bounce on shrinking volume = hesitant buyers, not institutional accumulation. Momentum weakens as price approaches 0.97. 3️⃣ The MA structure tells the truth: • Price above MA7 (0.9485) & MA14 (0.9398) → short-term buying pressure exists • But still below MA28 (0.9634) → the higher trend is bearish; so far this is just a correction 4️⃣ The levels I'm watching to the decimal: • 0.9982 — former support breakdown = now key resistance. Reclaiming it = a real reversal • 0.9485 / 0.9398 — the dynamic support cluster (MA7+MA14). Losing it instantly invalidates the bounce scenario • 0.8928 — the rebellion low. Breaking it opens a fresh, merciless leg down 🎯 My trading plan, with numbers: Primary scenario (short the correction): Entry: 0.9600–0.9630 (MA28 retest) SL: 0.9710 TP1: 0.9485 | TP2: 0.9398 | TP3: 0.9100 R:R ≈ 2.5:1 ✅ Alternative (reversal long) — only if: An hourly close above 0.9982 invalidates the bearish thesis → long targeting 1.0127 🧠 The biggest lesson: My worst trades came from chasing big green candles with no plan. Today I let price come to me — because the market rewards discipline, not urgency. $XRPUSDT $BTCUSDT #ByXIMPACT #ByXIMPACT

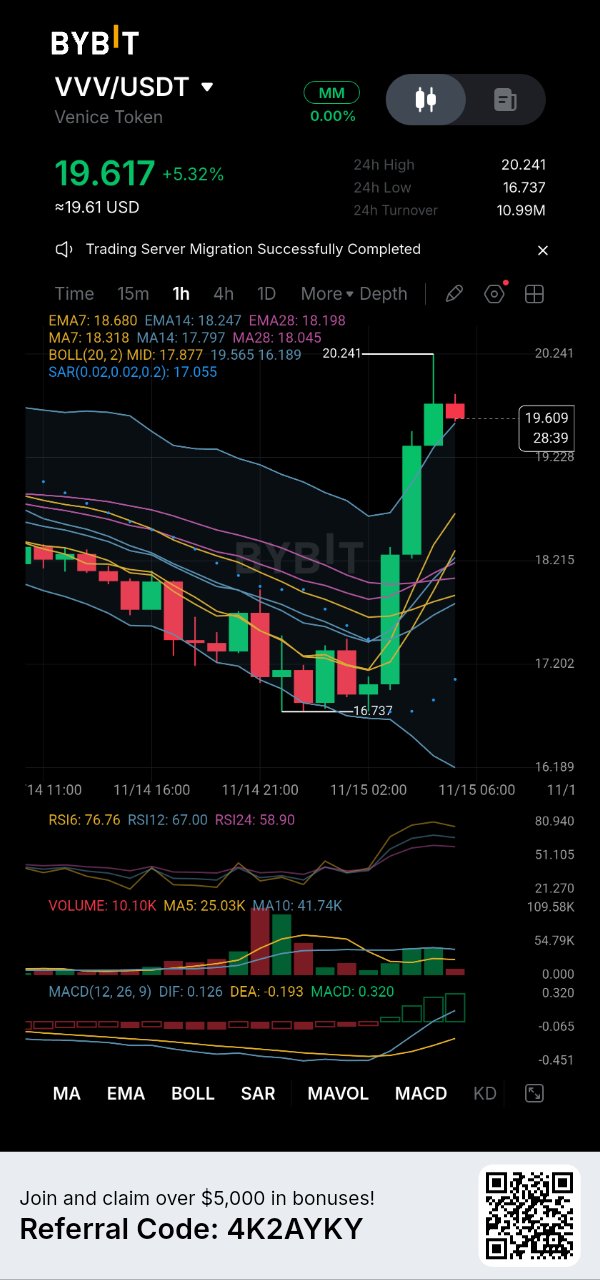
VVV just engineered a spectacular vertical ascent, and I am carefully steering my active trade through this explosive wave of volatility. The chart is glowing, but my focus remains locked on protecting capital. Looking at this 1-hour chart, the buyers completely hijacked the narrative. After bottoming out at 16.737, the asset launched a relentless offensive, shattering resistance to hit a 20.241 peak. It is currently holding strong at 19.617, digesting the rapid climb. Here is my technical reality check: The Power: The MACD is expanding massively with a towering green histogram, and the SAR dots are anchored far below at 17.055, validating the sheer force of this uptrend. The Danger: The RSI is flashing a heated 76.76, and the price is heavily interacting with the upper Bollinger Band (19.565). This extreme overbought reading signals that a short-term cool-off or retest is highly probable. The Foundation: The entire EMA cluster (18.198 - 18.680) has been completely reclaimed, forming a robust concrete floor beneath the price. My Execution Strategy and Risk Management: I am executing with absolute discipline, refusing to let the green candles dictate my emotions. My Plan for Existing Positions: Because my ticket is already deep in the green from the lower breakout, I view this current pause as the ultimate ground floor. Treating this exact consolidation as the structural floor means buying now is buying the bottom. I am actively managing my winner to hold my ground and ride the continuation. My Ironclad Stop Loss: I have mapped my strict exit trigger just beneath the absolute swing low at 16.500. If sellers manage to drag the price below this threshold, the setup is void, and I cut the trade instantly. No hoping, just pure discipline. My Target: A decisive breakthrough above the recent 20.241 peak to unlock further price discovery. I am trading the structure, protecting my downside, and letting the market do the heavy lifting. Are you managing your VVV position through this surge with me? $VVVUSDT $PIEVERSEUSDT #ByXIMPACT

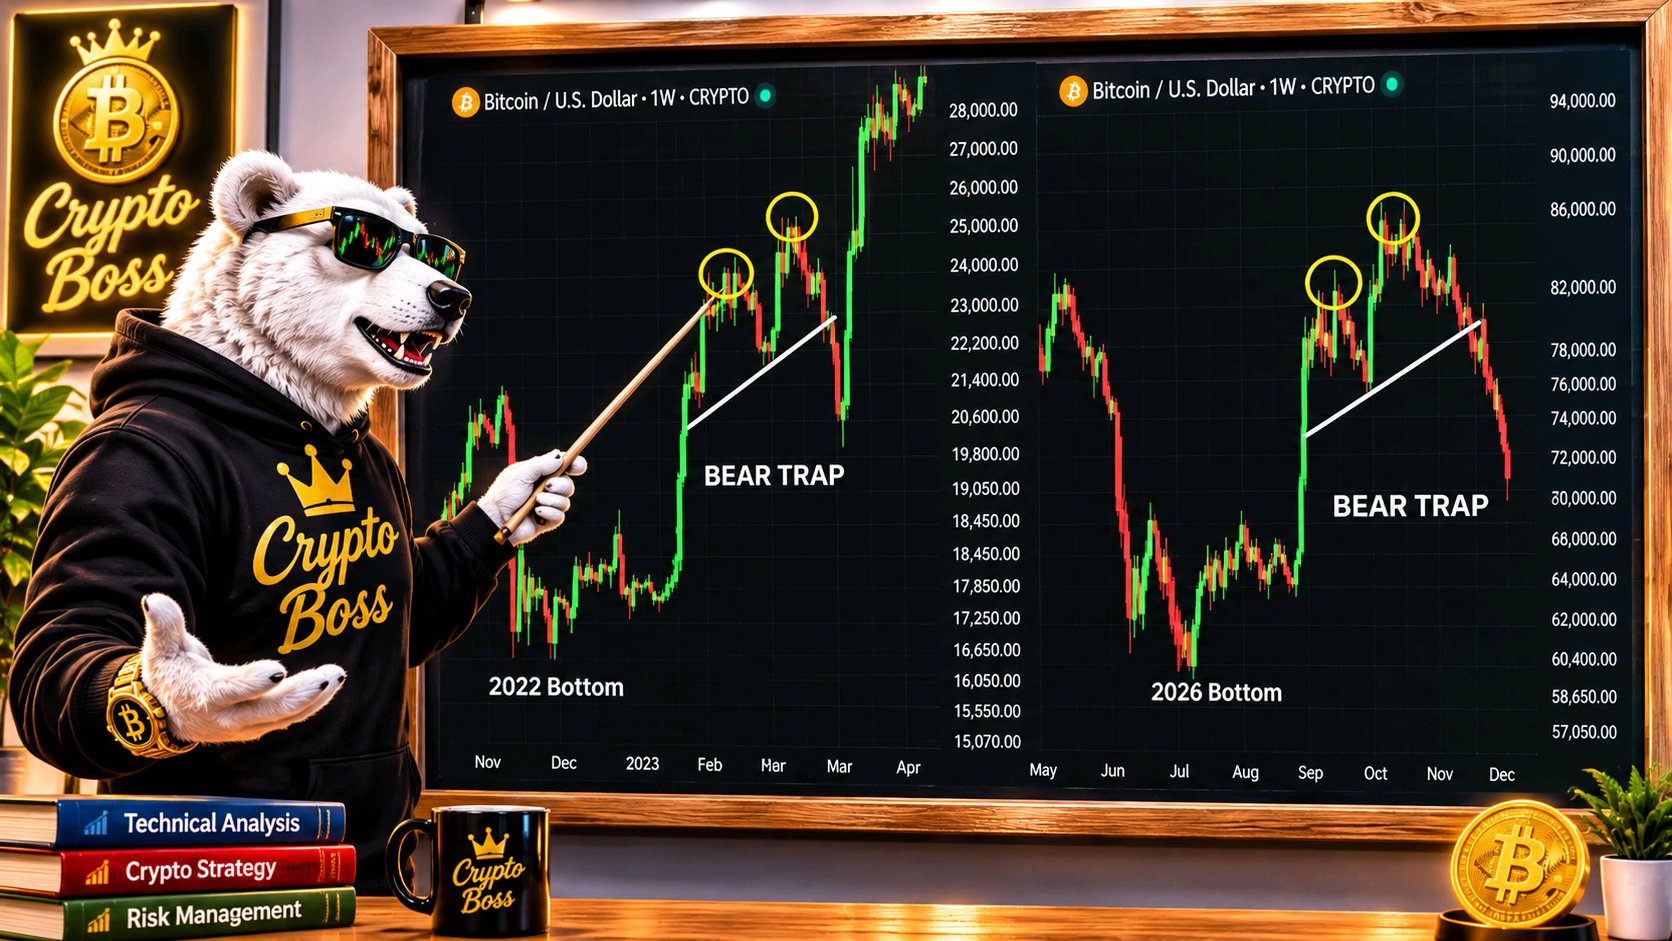
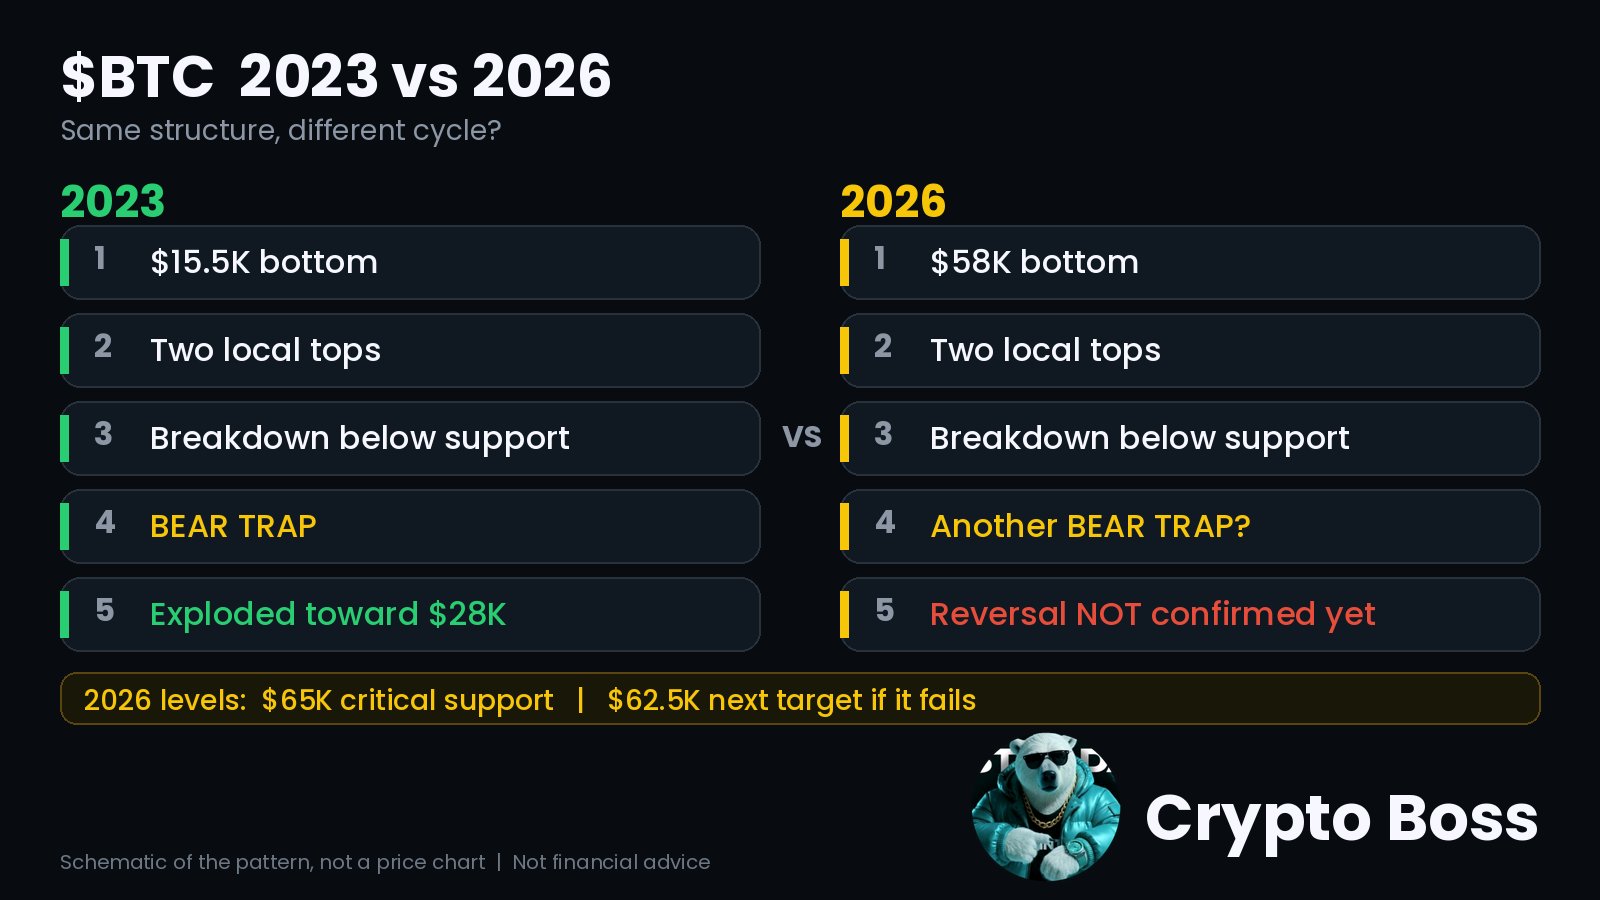
🚨 BITCOIN 2023 vs 2026: SAME STRUCTURE?
Look at these two charts side by side. $BTCUSDC is repeating a pattern. 2023: → $15.5K bottom → Two local tops → Breakdown below support → BEAR TRAP → Bitcoin exploded toward $28K 2026: → $58K bottom → Two local tops → Breakdown below support → Another BEAR TRAP? Same structure. Different cycle. Then and now, the breakdown was followed by the same sequence: 1️⃣ Support breaks 2️⃣ Leveraged longs get liquidated 3️⃣ Bears pile into shorts 4️⃣ Selling pressure exhausts 5️⃣ Price reverses, trapping everyone who shorted the breakdown What just happened in 2026: - $1.64B liquidated in 24 hours - $916M in Bitcoin futures liquidations - $1.88B withdrawn from spot Bitcoin ETFs this month That is a leverage wipeout, the same kind of flush that came before the 2023 reversal. But the reversal is NOT confirmed yet. Levels: $65K → critical support $62.5K → next downside target if it fails A sharp reclaim of broken support strengthens the bear trap scenario. I publicly called the $16K bottom in 2022. I believe we're approaching another major turning point. $BTCUSDT #ByXIMPACT
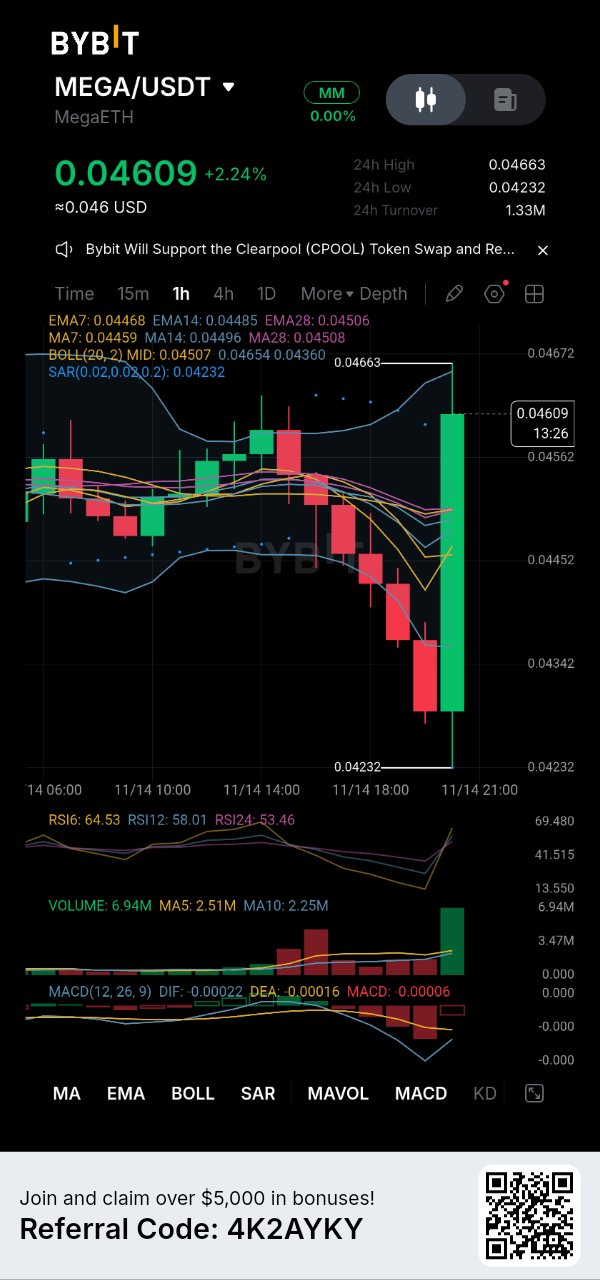
MEGA just executed a violent short squeeze, and I am meticulously overseeing my active trade as the bulls reclaim lost territory with sheer force. Looking at this 1-hour chart, the bears had driven the price down to a brutal 0.04232 trench. However, a massive volume injection triggered a fierce V-shaped bounce, catapulting the asset straight to a 0.04663 peak. It is currently stabilizing at 0.04609, holding firmly onto the recovery. Here is my technical reality check: The Power: The MACD is curling sharply upward with the red histogram fading fast. Furthermore, the SAR dots are anchored far below at 0.04232, confirming the bulls have seized the momentum. The Danger: The RSI has spiked aggressively to 64.53, and the price is interacting directly with the upper Bollinger Band (0.04654). This suggests a brief consolidation or minor retest is needed to sustain the climb. The Foundation: The entire EMA cluster (0.04468 - 0.04506) has been violently reclaimed, transforming former overhead resistance into a solid concrete floor. My Execution Strategy and Risk Management: I am playing this smart. I am not going to FOMO and buy the absolute top of this move. My Plan for Existing Positions: Since my entry is already secured from the lower accumulation, I am sitting comfortably in profit. Treating this exact consolidation as the structural floor means buying now is buying the bottom. I am actively managing my winner to hold my ground and ride the continuation. My Ironclad Stop Loss: I have anchored my strict exit trigger just beneath the absolute swing low at 0.04150. If the price loses this structural floor, the recovery is a fakeout, and I exit instantly. No hoping, just pure discipline. My Target: My primary target is pure price discovery above the recent high of 0.04663. I am trading the structure, protecting my downside, and letting the market do the heavy lifting. Are you managing your MEGA position through this reversal with me? $MEGAUSDT $PIEVERSEUSDT #ByXIMPACT

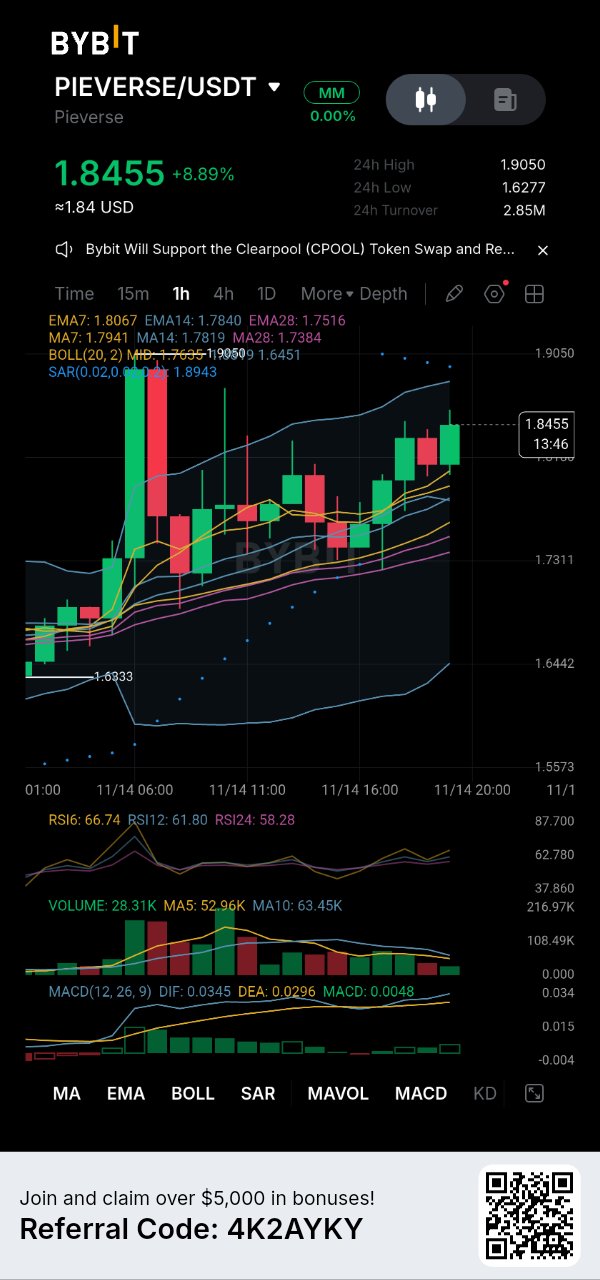
Crypto Boss sees an interesting battle developing in $PIEVERSE, and I'm paying attention to what happens after this sharp rally. PIEVERSE is trading around $1.8455, up 8.89%, but what interests me most isn't the percentage gain. It's how price is behaving after its powerful move from the $1.6277 area. The first thing I noticed is that the short-term structure has improved considerably. Price is trading above EMA7 ($1.8067), EMA14 ($1.7840), and EMA28 ($1.7516). This tells me buyers have managed to establish control over the short-term trend. There's another encouraging detail. MACD remains positive, with DIF at 0.0345 above DEA at 0.0296. RSI readings are also relatively strong, with RSI6 at 66.74. Momentum currently favors buyers, although I don't want to mistake strength for unlimited upside. But there's one challenge I cannot ignore. The $1.9050 area is the immediate resistance I'm watching. Price has approached this region but hasn't established a confirmed breakout above it. Meanwhile, trading volume at 28.31K is below its MA5 and MA10 averages, suggesting that the latest advance still needs stronger participation. Here's how I'm approaching the next move: If buyers push through $1.9050 with expanding volume, I'll have a stronger reason to expect another upward leg. If the breakout fails, I'll be watching the $1.80–$1.78 region first. Holding that area would help preserve the current bullish structure, while a deeper pullback toward $1.75 would require a fresh assessment. I'm encouraged by what PIEVERSE is showing, but I want confirmation at resistance rather than chasing the green candles. For me, the real question isn't how much $PIEVERSE has already gained. It's whether buyers have enough conviction to take it beyond $1.9050. Would you trust this momentum to deliver another breakout, or wait for a healthier retest first? $PIEVERSEUSDT #ByXIMPACT

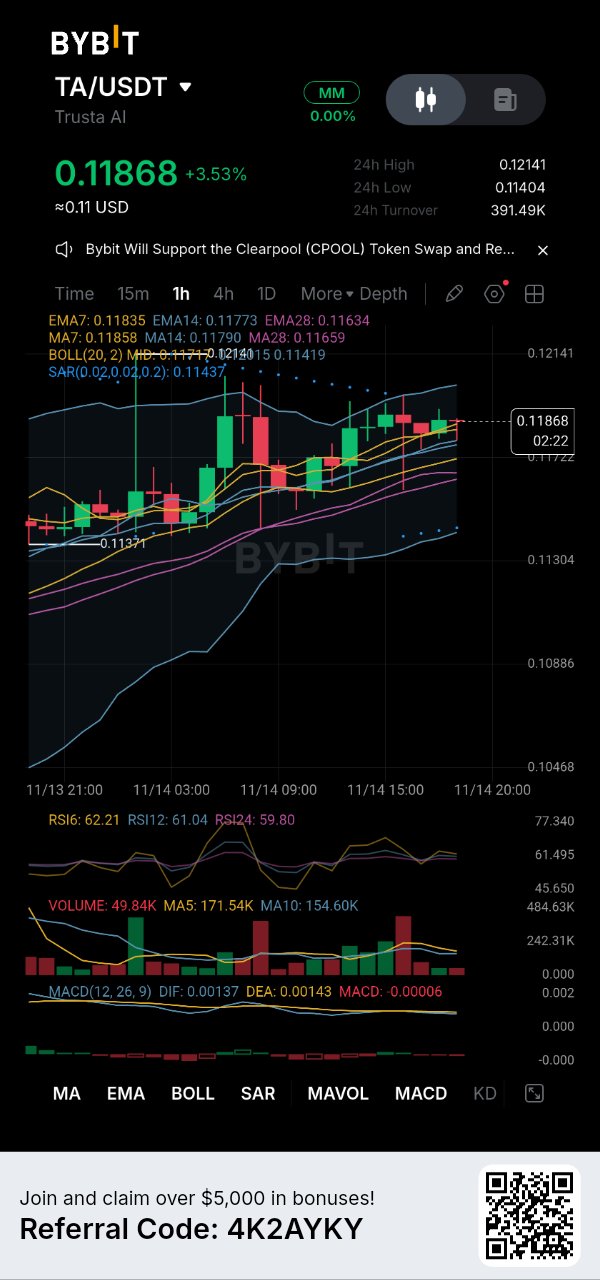
TA/USDT is trading around $0.1187, up about 3.5% on the day, with a 24h range of $0.1140 to $0.1214. On the 1h chart the trend is still up, but the momentum is cooling. What's bullish - Price is above all its moving averages, and they are stacked in order: MA7 (0.1186) > MA14 (0.1179) > MA28 (0.1166). - SAR sits below price at 0.1144, which keeps the short-term trend up. - RSI is around 60 to 62, strong but not overbought. - Price is pressing the upper half of the Bollinger Bands. What's not - Volume is fading: the latest bar is about 50K against a 5-bar average near 172K. - MACD is flat near zero, with the signal line just above the MACD line. - Liquidity is thin: 24h turnover is only about $391K. Levels on the 1h chart - Support: $0.1172 (Bollinger mid), then $0.1144 (SAR and lower band) - Key low: $0.1137. A 1h close below it breaks the structure. - Resistance: $0.1201 (upper band), then the 24h high at $0.1214 - Breakout trigger: a close above $0.1214 on rising volume My read: the trend is intact, but without volume this move can fade. I'd wait for volume to confirm instead of chasing. Does TA break $0.1214, or get rejected at the upper band? Not financial advice. Low-liquidity token, trade small. $TAUSDT #ByXIMPACT

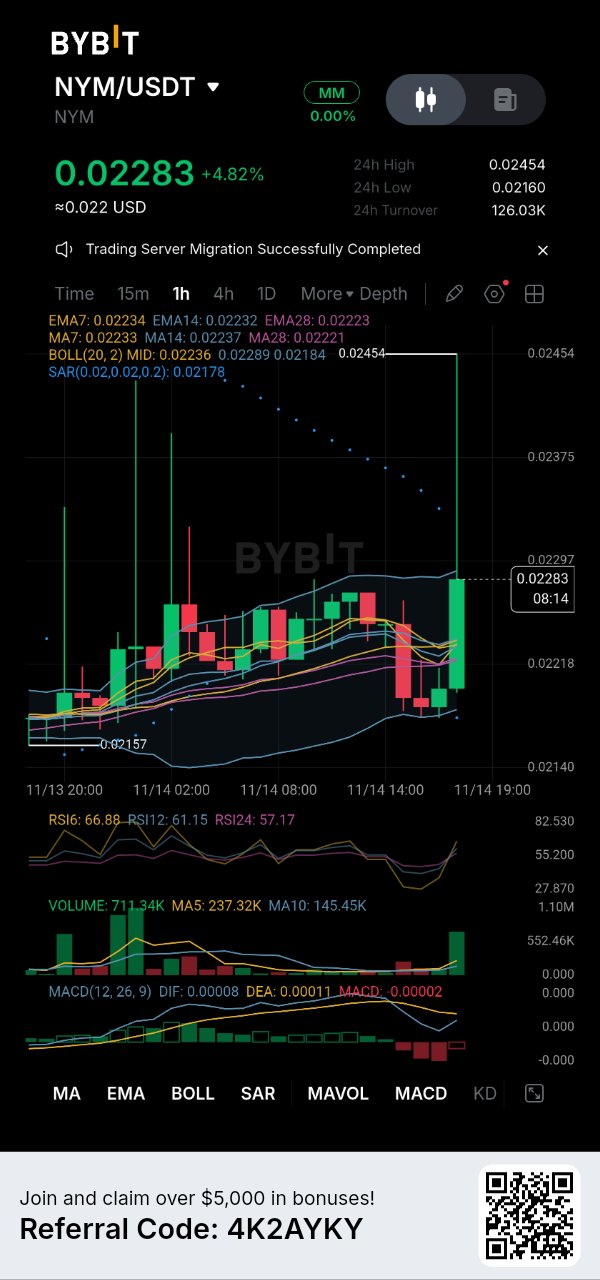
NYM just delivered a brutal wake-up call to the bears, and I am precisely navigating my active trade through this explosive expansion. Scanning the 1-hour chart, the asset was trapped in a tight sideways drift near the 0.02157 base. That silence was shattered by a massive green candle, rocketing the price to a 0.02454 peak. It is currently taking a breath at 0.02283, holding firmly onto the recent gains. Here is my technical reality check: The Power: The MACD is curling upward toward a bullish cross, and the SAR dots are anchored deep at 0.02178, validating the sudden shift in control. The Danger: The RSI is heating up at 66.88, and the price is actively challenging the upper Bollinger Band at 0.02289. This extreme touch warns that a brief pullback is highly likely. The Foundation: The entire EMA ribbon (0.02223 - 0.02234) has been reclaimed, acting as a sturdy springboard for the price. My Execution Strategy and Risk Management: I am executing with strict discipline, refusing to let FOMO dictate my moves. My Plan for Existing Positions: Because my ticket is already green from the lower levels, I am comfortably positioned. Treating this exact consolidation as the structural floor means buying now is buying the bottom. I am actively managing my winner to hold my ground and ride the continuation. My Ironclad Stop Loss: My hard invalidation line is anchored just beneath the absolute swing low at 0.02100. If sellers force a break below this threshold, the breakout is a trap, and I cut the position instantly. No hesitation. My Target: A decisive breakthrough above the 0.02454 peak to unlock further price discovery. I am trading the structure, protecting my downside, and letting the market do the heavy lifting. Are you managing your NYM position through this breakout with me? $NYMUSDT #ByXIMPACT