Gop Gop
4491Like0Shares268Fans705Follow
nawazsangi786s@gmail.com
nawazsangi786s@gmail.com
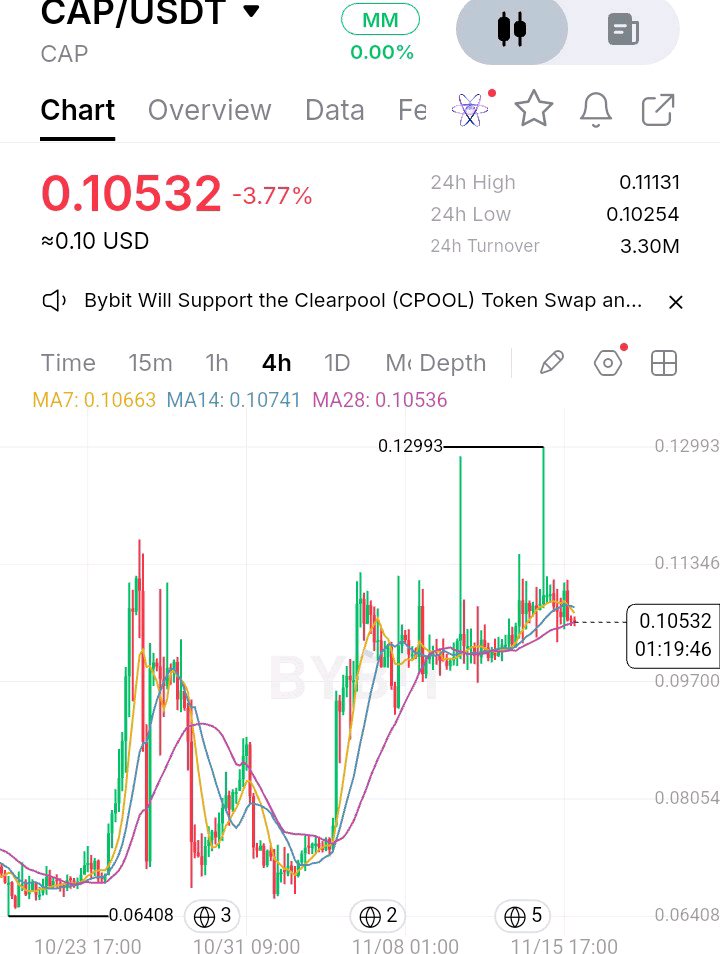
#ByXIMPACT $CAPUSDT CAP/USDT is showing signs of short-term weakness after its recent recovery. Price is currently trading around $0.10532, down 3.77%, as sellers attempt to push the market lower from its recent consolidation range. Although CAP previously made a strong move from the $0.08 area toward $0.11, buyers are now struggling to maintain upward momentum. The next reaction around support could determine whether this is simply a healthy pullback or the beginning of a deeper correction. Current Market Picture and Key Levels CAP is trading near $0.10532, slightly below its MA7 ($0.10663) and MA14 ($0.10741), while remaining close to its MA28 ($0.10536). This suggests that short-term momentum is weakening, although the broader recovery structure has not completely broken down. Important technical levels: - Immediate support: $0.1025–$0.1040 - Major support: $0.0970–$0.1000 - Immediate resistance: $0.1066–$0.1075 - Strong resistance: $0.1113–$0.1135 - Major upside resistance: $0.1200–$0.1299 A sustained move above $0.1075 could improve short-term momentum. However, losing $0.1025 on a confirmed 4H candle close could expose the lower support region. Trading Setup Current bias: Neutral to bearish until resistance is reclaimed. Rather than entering immediately, I would prefer to wait for confirmation. Potential Long Setup: - Entry condition: 4H breakout above $0.1075 followed by a successful retest. - Stop-loss: Below the confirmed retest low. - TP1: $0.1113 - TP2: $0.1135 Potential Short Setup: - Entry condition: Confirmed 4H breakdown below $0.1025, followed by a failed recovery. - Stop-loss: Above the breakdown-retest high. - TP1: $0.1000 - TP2: $0.0970 These are conditional scenarios, not active entry signals. Exact stop placement should depend on the price action after confirmation. Why This Setup Matters One important detail traders might overlook is that CAP is currently trading very close to its MA28, around $0.10536. This moving average could become an important short-term decision point. The recent recovery brought price significantly higher, but the current pullback shows that buyers have not yet established strong control above the $0.1075–$0.1113 resistance region. Volume also deserves attention. The displayed volume is approximately 3.38M, below the MA10 volume reading of 10.66M. This does not provide strong confirmation of renewed buying pressure. Chasing a long position during this pullback could be risky. Waiting for a confirmed breakout or a clear support reaction offers a more disciplined approach. Risk Management Keep position sizes reasonable and define your stop-loss before entering. Avoid increasing exposure simply because price approaches support. If CAP loses $0.1025 with strong selling pressure, the bullish recovery scenario becomes weaker. On the other hand, a successful reclaim of $0.1075 could shift short-term momentum back toward buyers. Patience and confirmation are more important than forcing a trade in the middle of a consolidation range. What do you think about CAP's next move? Will buyers defend $0.1025 and push toward $0.1113, or are sellers preparing for another breakdown? DYOR. This is market commentary, not financial advice. #WSOTShowYourAITradeToEarn10USDT #WSOT2026 $HYPEUSDT

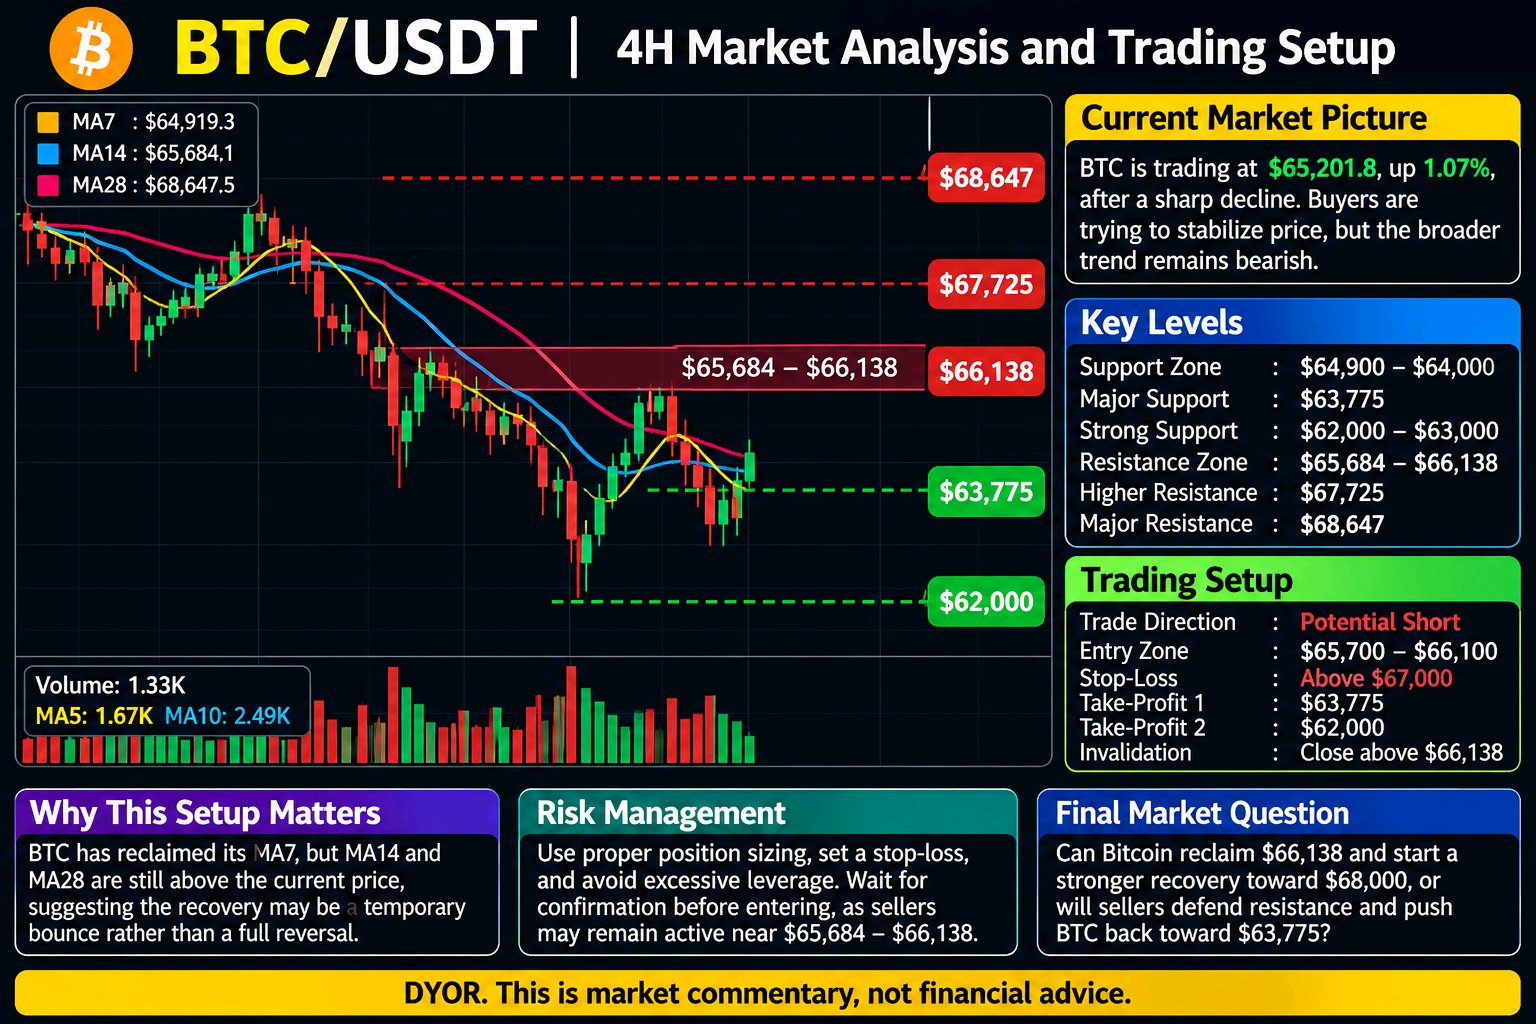
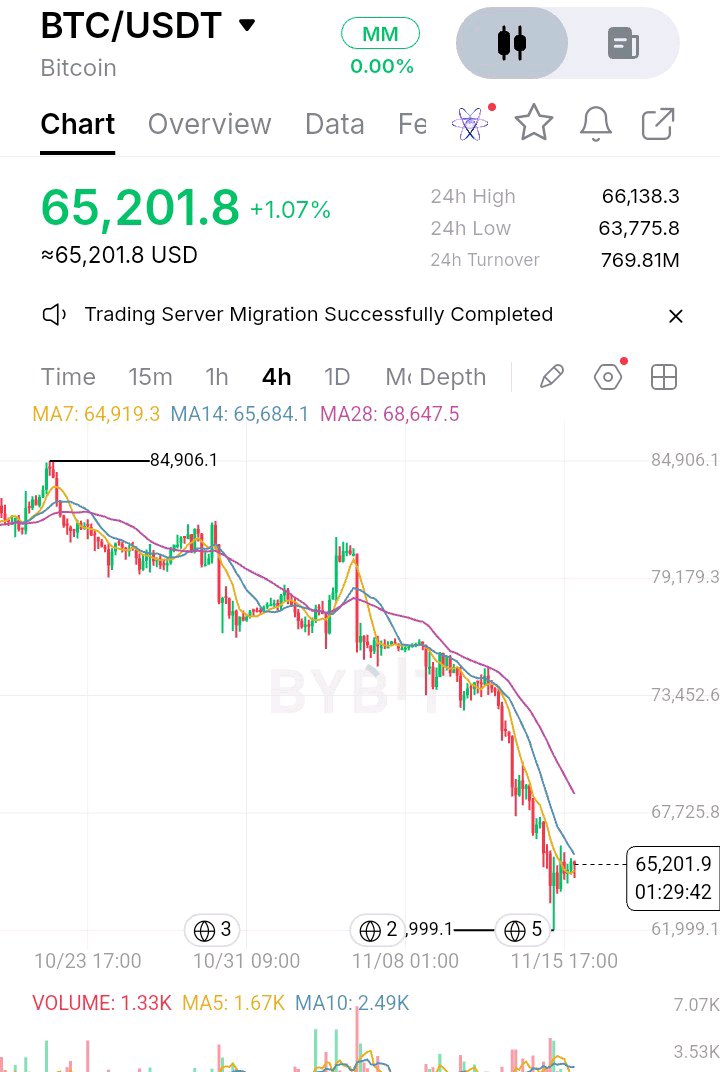
#ByXIMPACT $BTCUSDT Market Analysis and Trading Setup Bitcoin is attempting a short-term recovery after a sharp decline, but the broader 4H structure remains bearish. BTC is currently trading around $65,201.8, up 1.07%, with buyers trying to stabilize price after the recent sell-off toward the $63,000 area. Although the latest bounce is encouraging, Bitcoin still needs to reclaim important moving-average resistance before a stronger bullish reversal can be considered. # Current Market Picture and Key Levels On the 4H chart, BTC is trading at $65,201.8. The moving averages show that short-term momentum is improving, but the broader trend remains under pressure. Moving averages: * MA7: $64,919.3 * MA14: $65,684.1 * MA28: $68,647.5 Price has moved above MA7 but remains below MA14 and MA28, suggesting that buyers are recovering some short-term strength without confirming a trend reversal. Important technical levels: * Immediate support: $64,900–$64,000 * Major support: $63,775 * Strong support: $62,000–$63,000 * Immediate resistance: $65,684–$66,138 * Higher resistance: $67,725 * Major resistance: $68,647 * Bullish breakout: Above $66,138 * Bearish breakdown: Below $63,775 ## Trading Setup Trade Direction: Potential Short – Confirmation Required The broader bearish structure makes a rejection from resistance an important scenario to watch. * Potential entry: $65,700–$66,100 after a confirmed bearish rejection. * Stop-loss: Above $67,000. * TP1: $63,775 * TP2: $62,000 * Invalidation: A strong 4H breakout and sustained move above $66,138 would weaken the bearish scenario. An alternative bullish setup could develop if BTC breaks above $66,138 and successfully retests that level as support. ### Why This Setup Matters One important detail traders might overlook is that Bitcoin has reclaimed its MA7, but the MA14 and MA28 are still positioned above the current price. This suggests that the recent recovery could be a temporary relief bounce rather than the beginning of a sustained bullish trend. Volume also deserves attention. The displayed volume is 1.33K, compared with MA5 volume of 1.67K and MA10 volume of 2.49K. Stronger buying participation would help confirm whether buyers can challenge the resistance zone. Chasing the current bounce carries risk because sellers may become active around $65,684–$66,138. Waiting for a confirmed breakout or rejection provides a more disciplined approach. ### Risk Management Avoid excessive leverage and protect your capital with sensible position sizing. Always define your stop-loss before entering a trade and respect technical invalidation. If BTC cannot reclaim $66,138, downside pressure may return. However, a convincing breakout above this level could shift short-term momentum in favor of buyers. ### Final Market Question Can Bitcoin reclaim $66,138 and start a stronger recovery toward $68,000, or will sellers defend resistance and push BTC back toward $63,775? DYOR. This is market commentary, not financial advice #WSOT2026 #WSOTShowYourAITradeToEarn10USDT $SOLUSDT
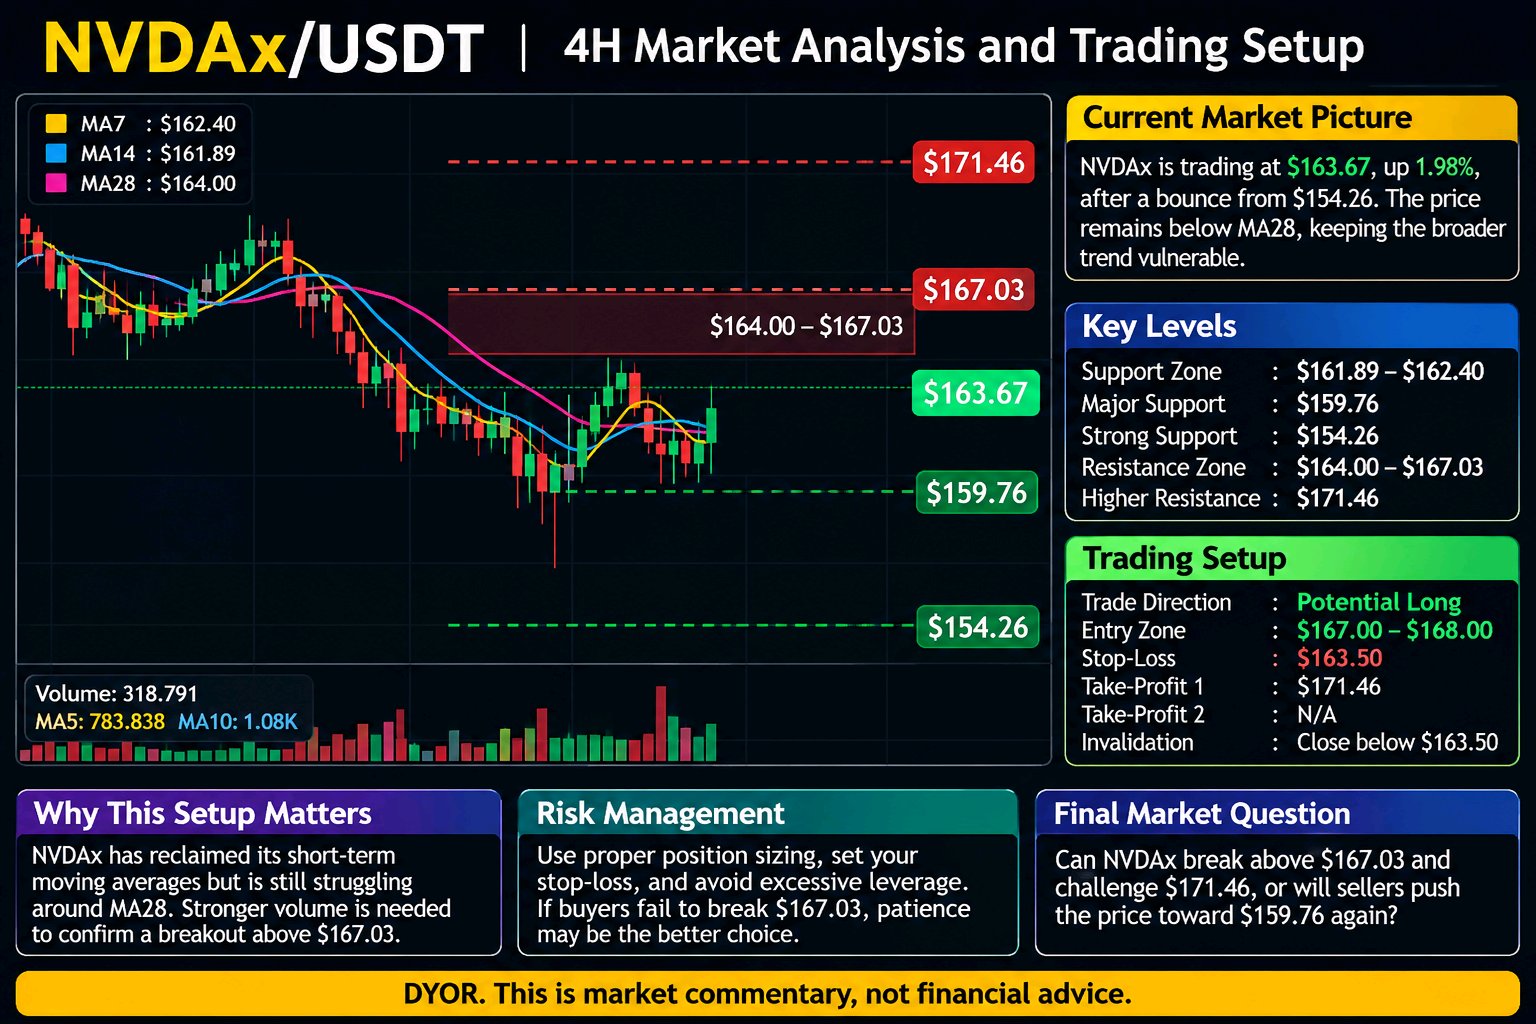
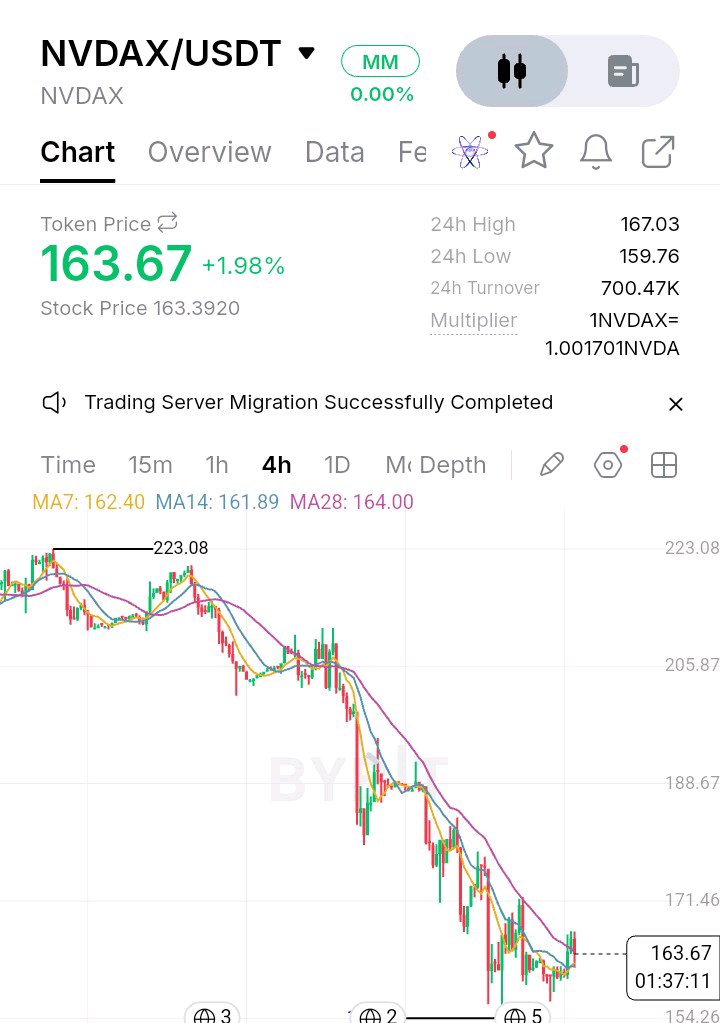
#ByXIMPACT $NVDAXUSDT NVDAx is attempting a short-term recovery after a prolonged bearish move, but the broader chart still shows considerable selling pressure. Price has bounced from the recent low near $154.26 and is now trading around $163.67. Buyers are gradually regaining momentum, although the next resistance zone will determine whether this recovery can develop into a stronger reversal. # Current Market Picture and Key Levels On the 4H chart, NVDAx is trading at $163.67, up 1.98%. The price remains below its major moving-average resistance, keeping the broader trend vulnerable. Moving averages: * MA7: $162.40 * MA14: $161.89 * MA28: $164.00 Price has recovered above MA7 and MA14, which suggests improving short-term momentum. However, MA28 at $164.00 remains an important resistance. Important technical levels: * Immediate support: $161.89–$162.40 * Major support: $159.76 * Strong support: $154.26 * Immediate resistance: $164.00–$167.03 * Higher resistance: $171.46 * Bullish breakout: Above $167.03 * Bearish breakdown: Below $159.76 # Trading Setup Trade Direction: Potential Long – Breakout Confirmation Required I would avoid chasing the current recovery and wait for a convincing breakout. * Potential entry: $167.00–$168.00 after a confirmed breakout and successful retest. * Stop-loss: $163.50 * TP1: $171.46 * TP2: No reliable second target established from the displayed chart. * Invalidation: A sustained move below $163.50 after the breakout would weaken the bullish setup. A rejection near $164–$167 followed by a breakdown below $161.89 could instead signal renewed bearish pressure. ## Why This Setup Matters One important detail traders might overlook is that NVDAx has reclaimed its short-term moving averages but is still struggling around MA28. This creates a difference between improving short-term momentum and the broader bearish market structure. Volume also deserves attention. The displayed volume is 318.791, compared with MA5 volume of 783.838 and MA10 volume of 1.08K. The recovery therefore needs stronger trading participation to support a convincing breakout. Entering immediately after a recovery can be risky because sellers may defend the $164–$167 resistance area. A confirmed 4H close above $167.03, followed by a successful retest, would provide stronger evidence of buyer strength. ### Risk Management Avoid excessive leverage and keep position sizes appropriate for your risk tolerance. Always define your stop-loss before entering and respect technical invalidation. If buyers fail to overcome $167.03, patience may be more valuable than forcing a long position. A breakdown below $159.76 would increase the risk of another move toward $154.26. ### Final Market Question Can NVDAx break above $167.03 and challenge $171.46, or will sellers use the current recovery to push the price toward $159.76 again? DYOR. This is market commentary, not financial advice. #WSOTShowYourAITradeToEarn10USDT $XRPUSDT #WSOT2026
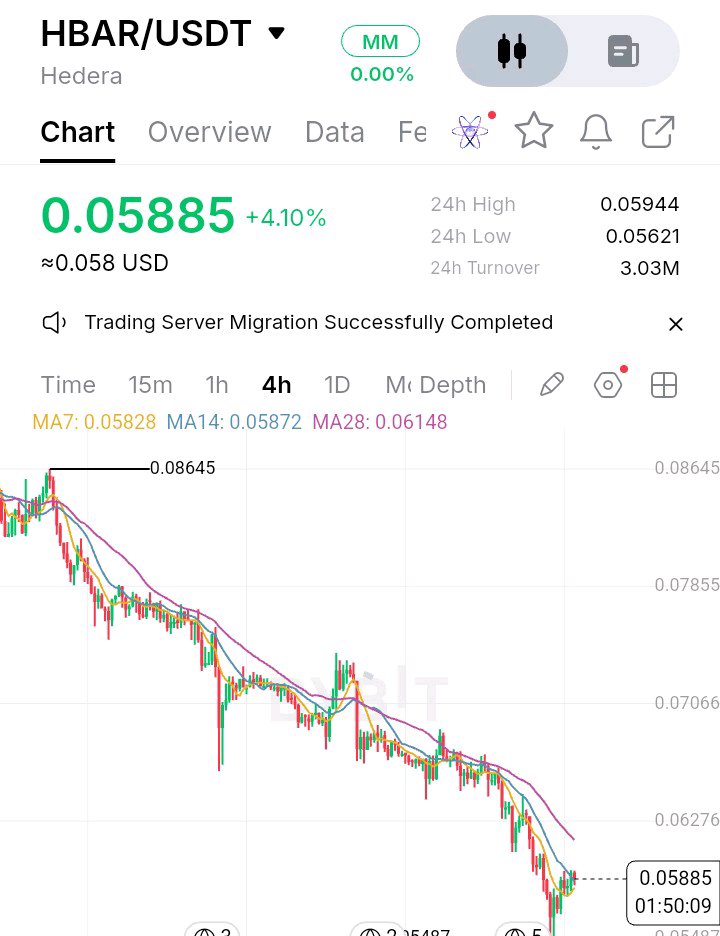
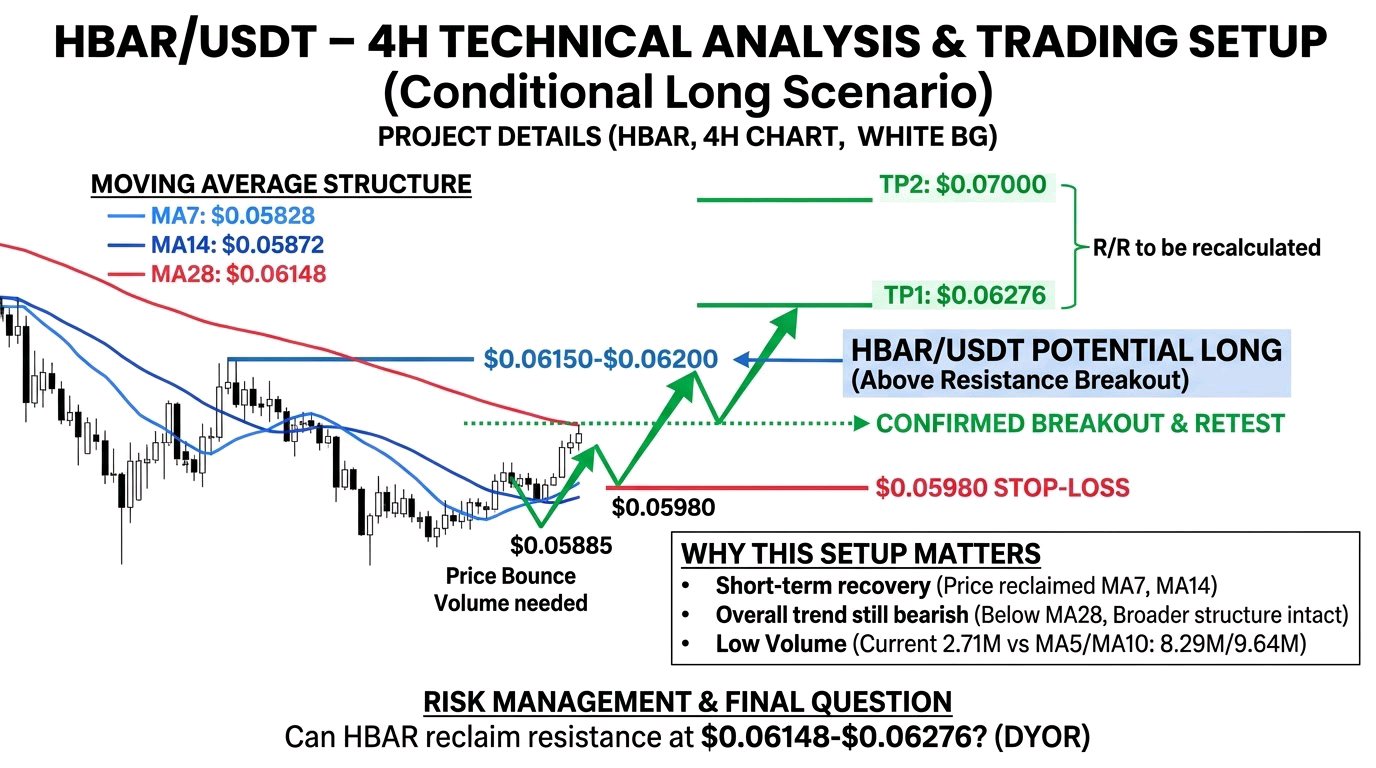
#ByXIMPACT $HBARUSDC /USDT 4H Technical Analysis and Trading Setup HBAR is showing signs of a short-term recovery after an extended bearish trend, but the latest bounce has not yet confirmed a full reversal. Buyers have stepped in near the recent lows, pushing price back toward $0.05885. The key question now is whether this recovery can overcome the next resistance zone or whether sellers will regain control. # Current Market Picture and Key Levels On the 4H chart, HBAR is trading around $0.05885, up 4.10%. The recent 24-hour range is $0.05621–$0.05944. The moving averages show improving short-term momentum: * MA7: $0.05828 * MA14: $0.05872 * MA28: $0.06148 Price has reclaimed MA7 and MA14, which is encouraging for buyers. However, it remains below MA28, indicating that the broader bearish structure is still intact. Important technical levels: * Immediate support: $0.0580–$0.0570 * Major support: $0.05487–$0.05621 * Immediate resistance: $0.05944–$0.06000 * Major resistance: $0.06148–$0.06276 * Bullish breakout: Above $0.06276 * Bearish breakdown: Below $0.05487# Trading Setup Trade direction: Potential Long – Confirmation Required Rather than chasing the current recovery, I would wait for buyers to establish strength above resistance. * Potential entry: $0.06150–$0.06200 after a confirmed breakout and successful retest. * Stop-loss: $0.05980 * TP1: $0.06276 * TP2: $0.07000 * Invalidation: A sustained move below $0.05980 after the breakout would weaken the bullish setup. This is a conditional scenario, not a confirmed entry signal. The risk-to-reward should be recalculated using the actual execution price. # Why This Setup Matters The most interesting detail is the difference between short-term recovery and the broader trend. Although HBAR has moved above its MA7 and MA14, the MA28 remains considerably higher at $0.06148. This means buyers are recovering momentum, but they still have an important technical barrier to overcome. Another detail worth watching is volume. The displayed current volume is 2.71M, compared with MA5 volume of 8.29M and MA10 volume of 9.64M. The rebound therefore needs stronger participation to support a convincing breakout. Entering after a sharp bounce can be risky because early buyers may take profits near resistance. A confirmed 4H breakout followed by a successful retest would provide stronger evidence of buyer control. # Rsk Management Avoid entering with excessive leverage or increasing position size after a losing trade. Define your stop-loss before execution and keep position sizing proportional to your account risk. If HBAR fails to break above $0.06148–$0.06276, the recovery could lose momentum and price may revisit lower support zones. Final Market Question Can HBAR reclaim the $0.06148–$0.06276 resistance zone and turn this recovery into a genuine trend reversal, or will sellers defend the moving-average resistance again? DYOR. This is market commentary, not financial advice. #WSOT2026 #JensenHuangExitTestsNvidiasAILeadership #WSOTShowYourAITradeToEarn10USDT #USInflationRunsHotAndRateHikeBetsRise $SOLUSDT
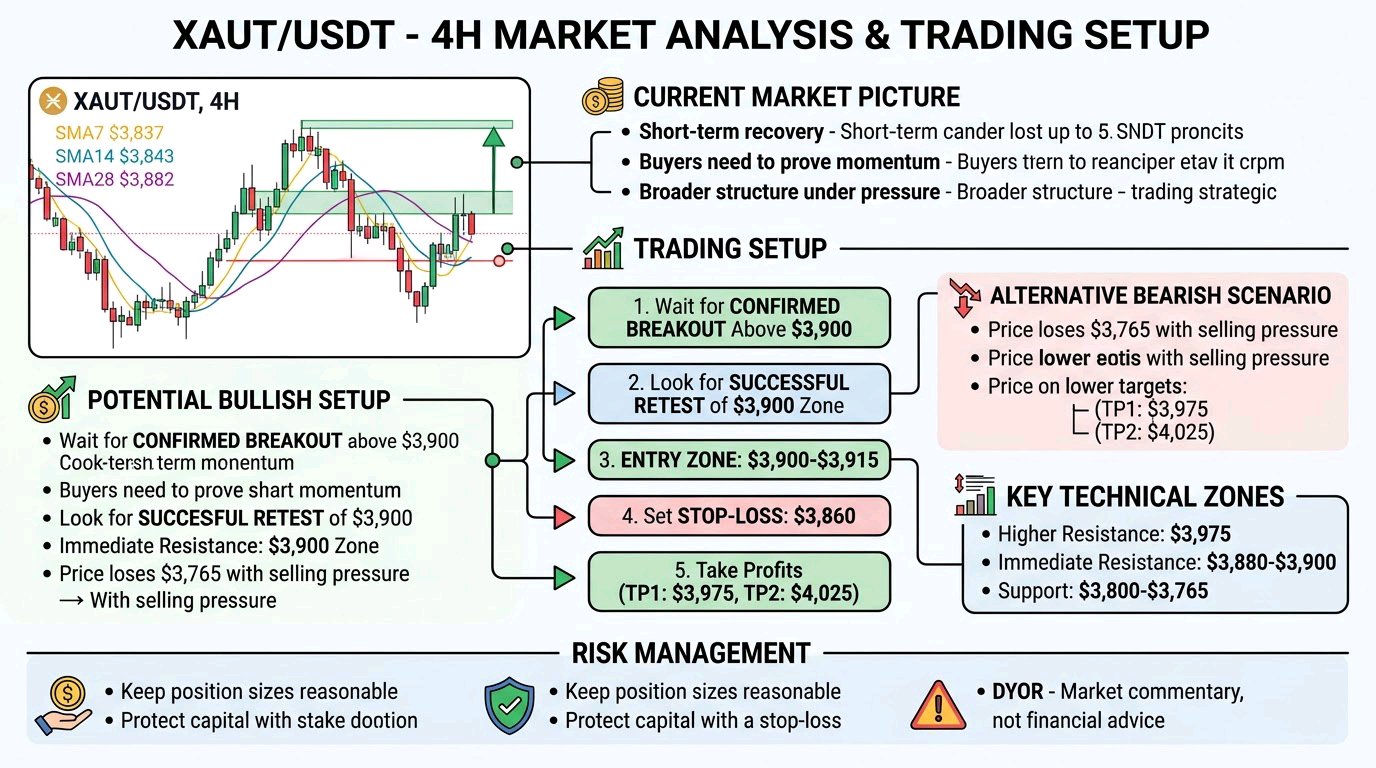
#ByXIMPACT $XAUTUSDT /USDT is showing a short-term recovery after a strong bearish move, but buyers still need to prove that this rebound is more than a temporary relief rally. On the 4H chart, Tether Gold is trading around $3,855.79, up 1.38%. Price has bounced from the recent support area near $3,765–$3,800. However, the broader structure remains under pressure after a series of lower highs and lower lows.# Current Market Picture and Key Levels The moving averages show an important battle: * MA7: $3,837.15 * MA14: $3,843.77 * MA28: $3,882.07 Price has moved above the short-term moving averages, suggesting improving buying momentum. However, the MA28 near $3,882 remains an important resistance. Key technical zones: * Support: $3,800–$3,765 * Immediate resistance: $3,880–$3,900 * Higher resistance: $3,975 * Bullish breakout level: Above $3,900 * Bearish breakdown level: Below $3,765 # Trading Setup Wait for confirmation The safer approach is to avoid chasing the current bounce and wait for a confirmed breakout or a fresh rejection. Potential bullish setup: * Entry zone: $3,900–$3,915 after a confirmed breakout and successful retest. * Stop-loss: $3,860 * TP1: $3,975 * TP2: $4,025 * Invalidation: A sustained 4H move back below $3,860 would weaken the bullish breakout scenario. The alternative bearish scenario becomes relevant if price loses $3,765 with strong selling pressure. These are conditional levels, not an active confirmed signal.# Why This Setup Matters The interesting detail is that XAUT has recovered above its MA7 and MA14, but remains below its MA28. This creates a short-term momentum improvement without confirming a complete trend reversal. Another important factor is the previous rejection around $4,080–$4,100. Sellers have already demonstrated strength in that region, making it important not to assume that one recovery candle will reverse the broader structure. Current market data also shows XAUT trading around the $3,860–$3,880 area, keeping the nearby resistance zone relevant. CoinGlass +1 Entering after a sharp recovery can expose traders to a sudden pullback. Waiting for a 4H candle close above resistance and a successful retest offers a more structured opportunity# Risk Management Keep position sizes reasonable and always define risk before entering a trade. Avoid excessive leverage, protect capital with a stop-loss, and do not move your invalidation level simply because the market moves against your position. If buyers cannot reclaim $3,900, patience may be more valuable than forcing a trade. Do you think XAUT can reclaim $3,900 and continue toward $3,975, or will sellers push the price back toward $3,800? DYOR. This is market commentary, not financial advice. #WSOTShowYourAITradeToEarn10USDT $LAVAUSDT
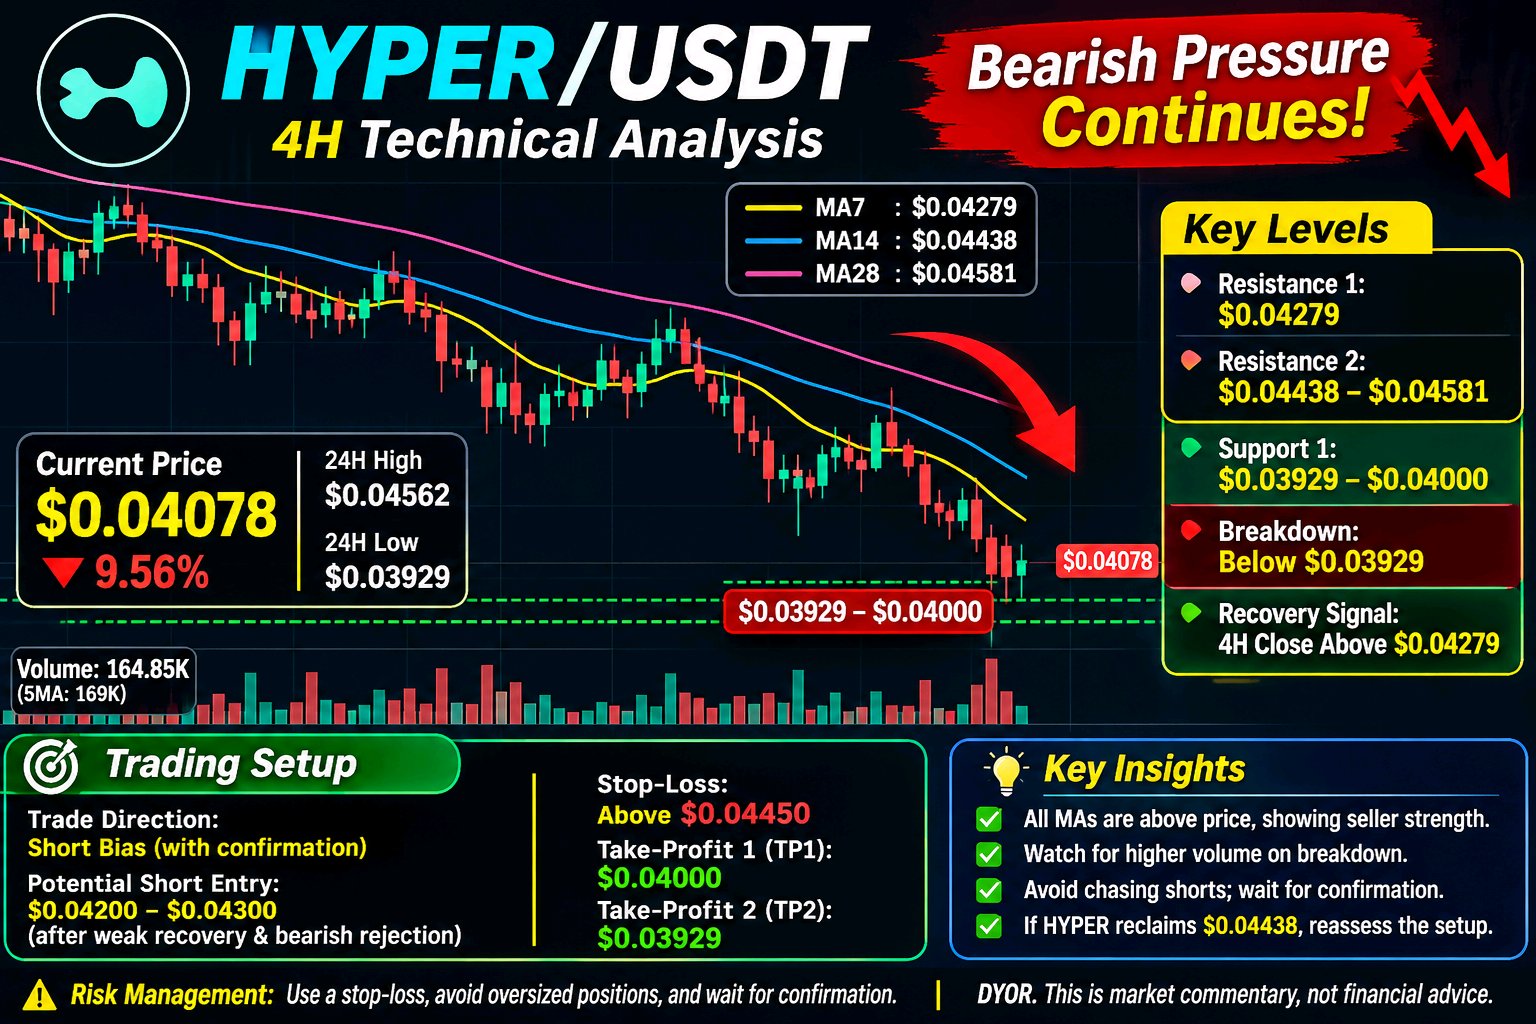
#ByXIMPACT $HYPERUSDT is showing strong bearish pressure on the 4H chart, with sellers maintaining control as price continues to print lower highs and lower lows. The recent decline has pushed HYPER down to $0.04078, putting the market close to an important support area. Although a short-term bounce is possible, buyers have not yet shown convincing signs of a reversal. Current Market Picture and Key Levels HYPER is currently trading around $0.04078, down 9.56%. The 24-hour high is $0.04562, while the low stands at $0.03929. The moving averages reinforce the bearish structure: - MA7: $0.04279 - MA14: $0.04438 - MA28: $0.04581 Important levels to watch: - Immediate support: $0.03929–$0.04000 - Immediate resistance: $0.04279 - Stronger resistance: $0.04438–$0.04581 - Bearish breakdown: Below $0.03929 - Potential recovery signal: A sustained 4H close above $0.04279. Trading Setup Trade direction: Short bias, but confirmation is needed. Potential short entry: $0.04200–$0.04300 after a weak recovery and bearish rejection. Stop-loss: Above $0.04450. Take-profit 1 (TP1): $0.04000 Take-profit 2 (TP2): $0.03929 Technical invalidation: A sustained 4H recovery above the $0.04438 resistance area would weaken this short setup. These are conditional levels, not a confirmed entry signal. The current price is already close to support, so chasing a short here carries additional risk. Why This Setup Matters One important detail is the position of all three moving averages above the current price. This alignment indicates that sellers still have the stronger technical advantage. Another detail worth watching is volume. Current displayed volume is approximately 164.85K, compared with a 5-period volume average of 169K. Selling pressure is evident, but a meaningful increase in volume during a support breakdown would provide stronger confirmation. Entering after an extended decline can be dangerous because short-covering and bargain buying may trigger a sudden bounce. Waiting for a resistance retest or a confirmed support breakdown offers a more disciplined approach. Risk Management Avoid opening oversized positions during high volatility. Use a predefined stop-loss, maintain sensible position sizing, and wait for confirmation before executing. If HYPER reclaims resistance, reassess the bearish outlook rather than holding onto an invalidated setup. The next important battle is around $0.03929. Will sellers break this support, or can buyers defend it and trigger a recovery? DYOR. This is market commentary, not financial advic $HYPEUSDT
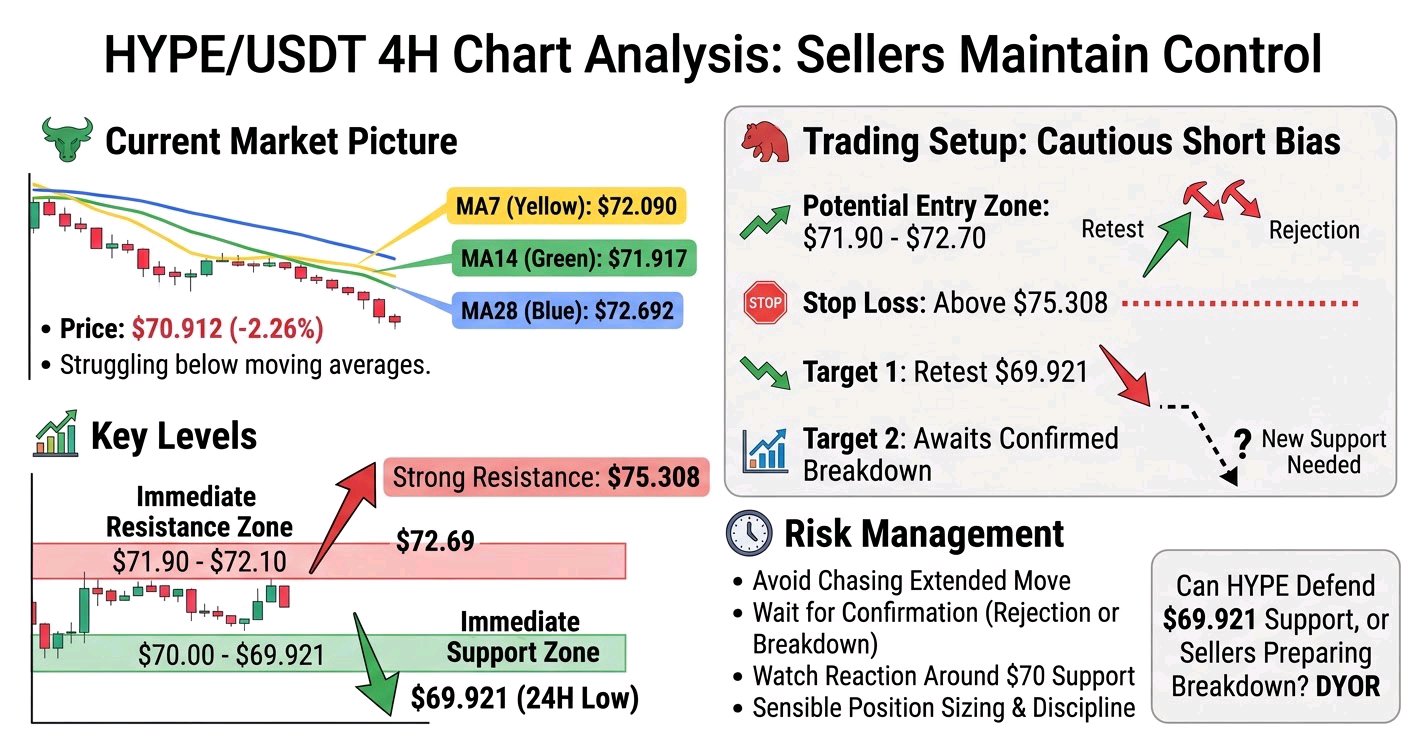
#ByXIMPACT $HYPERUSDT s struggling to regain bullish momentum, and the 4H chart continues to show sellers maintaining control. Price is currently trading around $70.912, down 2.26%, after an extended decline from the $97.087 swing high. Buyers are attempting to stabilize the price, but the recovery remains weak while HYPE trades below its key moving averages. Current Market Picture and Key Levels Immediate support is around $70.00–$69.921, with $69.921 marking the visible 24H low. A decisive 4H breakdown below this zone could increase selling pressure. On the upside, initial resistance sits around $71.90–$72.10, followed by $72.69 and the stronger $75.308 resistance area. Trading Setup The current structure favors a cautious SHORT bias, but confirmation is important. A potential entry zone is $71.90–$72.70 if price retests this area and shows clear rejection. A protective stop-loss can be placed above $75.308. The first downside objective is a retest of $69.921. A second target should only be established after a confirmed breakdown reveals the next support zone. If buyers reclaim $72.70 and sustain a move higher, the bearish setup weakens. Why This Setup Matters One important detail traders might overlook is that all three displayed moving averages are above the current price: MA7 at $72.090, MA14 at $71.917, and MA28 at $72.692. This alignment reflects continued short-term selling pressure. Another concern is the declining structure of lower highs and lower lows. However, selling directly into support around $69.921 could be risky. Waiting for a confirmed breakdown or a rejection near resistance offers a more disciplined approach than chasing an extended downward move. Risk Management Avoid entering a short position simply because the chart looks bearish. Watch the reaction around $70 and wait for confirmation. Keep position sizes sensible, respect your stop-loss, and reassess the setup if price starts reclaiming the moving averages. Can HYPE defend the $69.921 support zone, or are sellers preparing for another breakdown? DYOR. This is market commentary, not financial advice $HYPEUSDT #WSOTShowYourAITradeToEarn10USDT
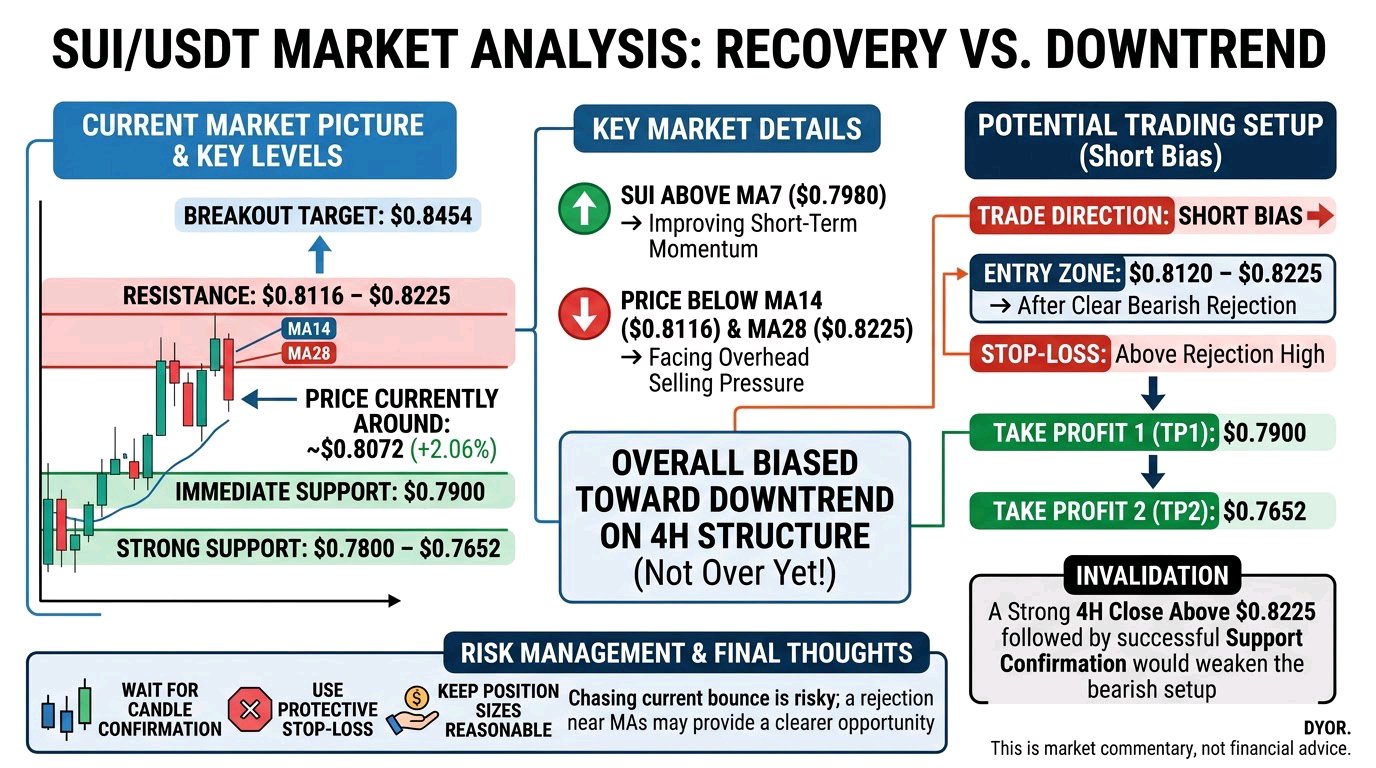
$SUIUSDT ut the 4H Downtrend Is Not Over Yet SUI is attempting a short-term recovery after dropping toward $0.7652. Price is currently trading around $0.8072, up 2.06%, but the bigger 4H structure still shows a bearish trend. Buyers are showing some strength, although a confirmed reversal is still missing. Current Market Picture and Key Levels Immediate support is forming around $0.7900, with stronger support near $0.7800–$0.7652. On the upside, resistance stands around $0.8116–$0.8225, where the MA14 and MA28 are positioned. A sustained breakout above $0.8225 could open the way toward $0.8454. Potential Trading Setup Trade direction: Short bias, subject to confirmation. Entry zone: $0.8120–$0.8225 after a clear bearish rejection. Stop-loss: Above the confirmed rejection high. TP1: $0.7900 TP2: $0.7652 Invalidation: A strong 4H close above $0.8225 followed by successful support confirmation would weaken the bearish setup. Why This Setup Matters One important detail is that SUI has moved above its MA7 at $0.7980, showing improving short-term momentum. However, price remains below MA14 at $0.8116 and MA28 at $0.8225. This means the recovery is still facing overhead selling pressure. Chasing the current bounce could be risky. A rejection near the moving averages may provide a clearer opportunity, while a confirmed breakout would require reassessing the bearish outlook. Risk Management Wait for candle confirmation before entering. Keep position sizes reasonable, use a protective stop-loss, and avoid trading directly into resistance without a clear signal. Protecting capital matters more than catching every price movement. Can SUI reclaim $0.8225 and reverse its 4H trend, or will sellers push it back toward $0.7652? DYOR. This is market commentary, not financial advice $BTCUSDT
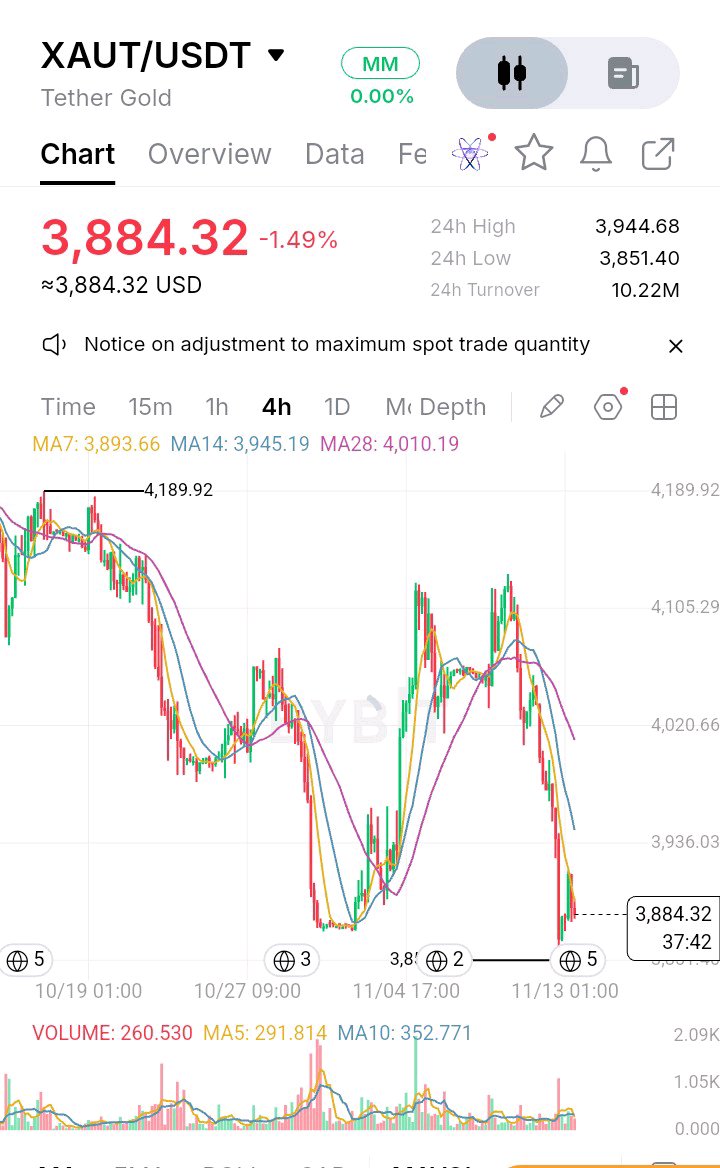
#ByXIMPACT $XAUTUSDT Sellers Remain in Control as Gold Tests Critical Support XAUT/USDT is showing strong bearish pressure on the 4H chart. Price is currently trading around 3,884.32, down 1.49%, following a sharp rejection from the 4,100–4,110 region. Although buyers have attempted a small recovery from the recent low, the broader market structure still favors sellers. Current Market Picture and Key Levels The immediate support zone is around 3,851–3,860, with 3,851.40 marking the visible 24H low. A decisive breakdown below this area could expose further downside. On the upside, immediate resistance stands around 3,893–3,900, followed by stronger resistance near 3,945. The 4H moving averages also indicate weakness: MA7 is at 3,893.66, MA14 at 3,945.19, and MA28 at 4,010.19. Price remains below all three averages. Trading Setup: Conditional SHORT Entry zone: 3,893–3,945, only after a confirmed bearish rejection. Stop-loss: Above 3,970. TP1: 3,851. TP2: No reliable lower target can be established from the visible chart; reassess after a confirmed support breakdown. Invalidation: A sustained 4H recovery above 3,945–3,970 would weaken the bearish setup. Why This Setup Matters The important detail is the alignment of all three moving averages above the current price. This suggests that sellers still have control over the broader 4H structure. However, price is already close to important support. Opening a short position after an extended decline could expose traders to a sudden relief bounce. A confirmed breakdown below 3,851 followed by a failed retest would provide stronger bearish evidence. Risk Management Avoid chasing the current move. Wait for confirmation, use a protective stop-loss, and calculate position size according to your risk tolerance. If support holds and buyers reclaim resistance, staying out may be the better decision. Will XAUT break below 3,851 and continue its decline, or can buyers defend this support and initiate a recovery? DYOR. This is market commentary, not financial advic #WSOT2026 #SanDiskAnnounces8For1StockSplit
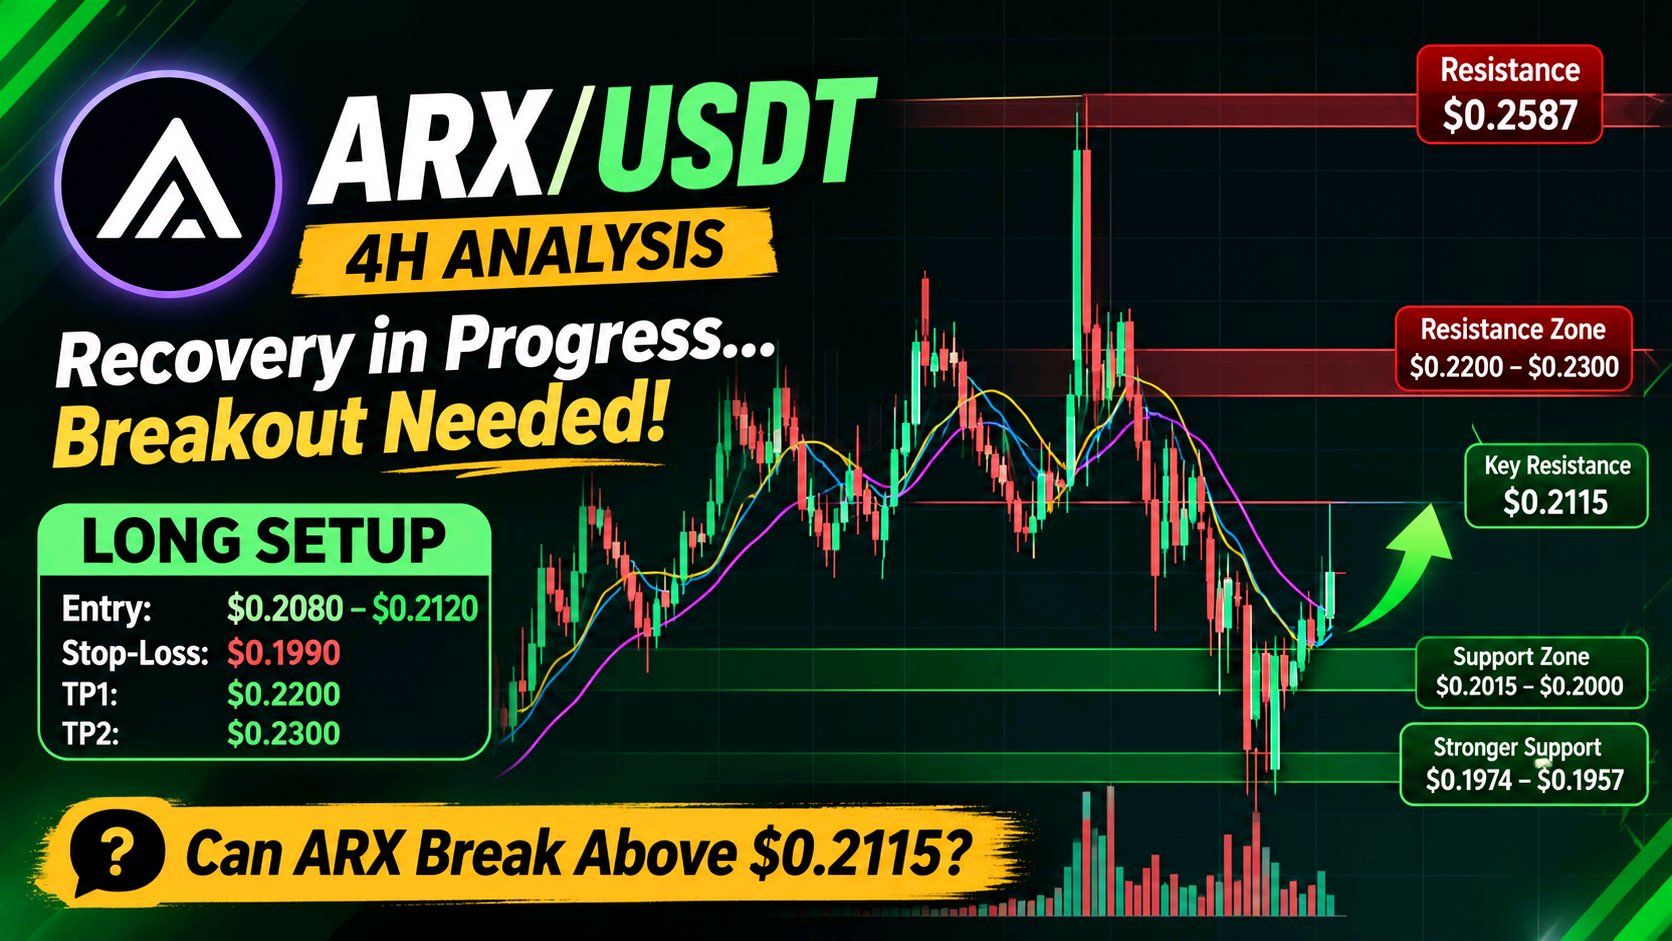
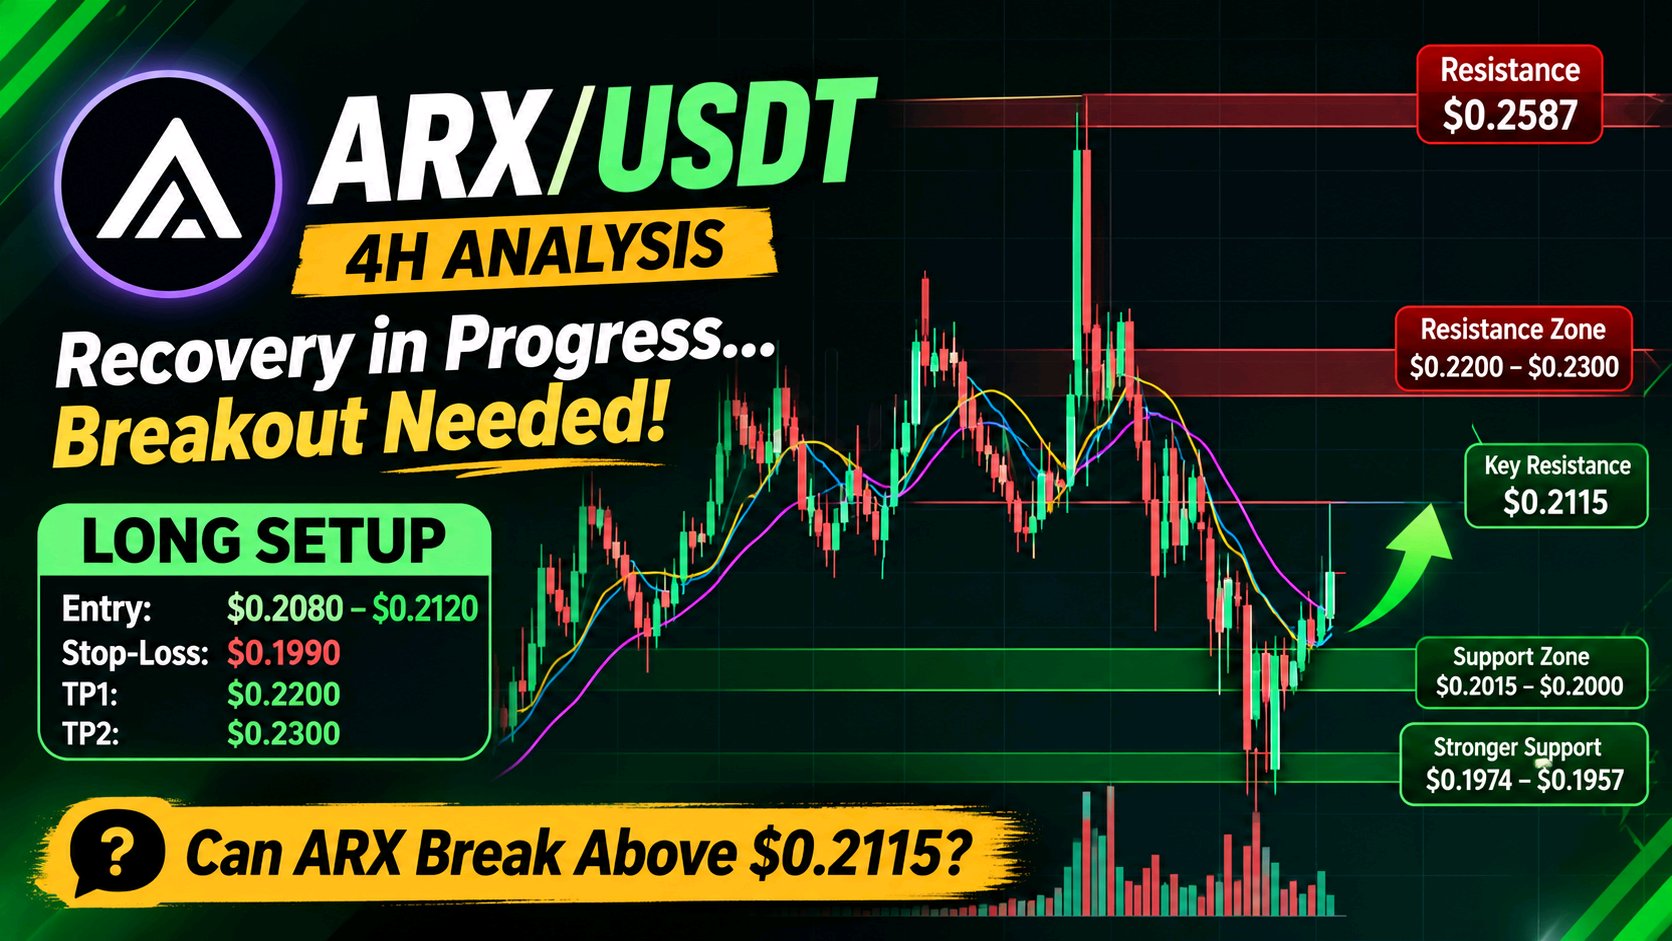
#ByXIMPACT $ARXUSDT s showing signs of a short-term recovery, but the next resistance zone will determine whether buyers can turn this bounce into a stronger bullish move. On the 4H chart, Arcium is trading around $0.2072, up 5.07%. Price has recovered from the recent lows and moved back above the three displayed moving averages, suggesting that buying momentum is gradually improving. However, the broader structure still needs confirmation before calling this a full trend reversal. Current Market Picture and Key Levels The important levels to watch are: - Immediate support: $0.2015–$0.2000 - Stronger support: $0.1974–$0.1957 - Immediate resistance: $0.2115 - Next resistance zone: $0.2200–$0.2300 - Major overhead resistance: Around $0.2587 The $0.2115 level is particularly important. A strong 4H candle close above it could strengthen the bullish recovery, while rejection may bring another retest of the support zone. Potential Trading Setup: LONG A bullish entry should only be considered after ARX breaks above $0.2115 and successfully retests that level. - Potential entry: $0.2080–$0.2120 after confirmation - Stop-loss: $0.1990 - TP1: $0.2200 - TP2: $0.2300 Invalidation: A sustained 4H move below $0.1990 would weaken the recovery setup and suggest that sellers are regaining control. Why This Setup Matters One detail worth watching is the relationship between price and the moving averages. MA7 is around $0.2015, MA14 around $0.1974, and MA28 around $0.2013. Price is currently trading above all three, which is an encouraging short-term development. However, the recent recovery is approaching the $0.2115 resistance. Traders should not confuse a moving-average reclaim with a confirmed breakout. Another important factor is volume. The chart shows previous periods of significant trading activity, but the latest breakout attempt still needs stronger volume confirmation to establish buyer conviction. Chasing the current green candle could expose traders to a rejection near resistance. Waiting for a confirmed breakout and retest offers a more disciplined approach. Risk Management Keep position sizing reasonable and define your maximum acceptable loss before entering. A stop-loss is essential, particularly because ARX has shown considerable volatility on the 4H chart. If buyers fail to reclaim $0.2115, staying patient may be better than forcing a trade. Final Question: Can ARX break above $0.2115 and build a stronger bullish structure, or will sellers push the price back toward $0.2000? DYOR. This is market commentary, not financial advice #PiecesOf8
#ByXIMPACT $ARXUSDT s showing signs of a short-term recovery, but the next resistance zone will determine whether buyers can turn this bounce into a stronger bullish move. On the 4H chart, Arcium is trading around $0.2072, up 5.07%. Price has recovered from the recent lows and moved back above the three displayed moving averages, suggesting that buying momentum is gradually improving. However, the broader structure still needs confirmation before calling this a full trend reversal. Current Market Picture and Key Levels The important levels to watch are: - Immediate support: $0.2015–$0.2000 - Stronger support: $0.1974–$0.1957 - Immediate resistance: $0.2115 - Next resistance zone: $0.2200–$0.2300 - Major overhead resistance: Around $0.2587 The $0.2115 level is particularly important. A strong 4H candle close above it could strengthen the bullish recovery, while rejection may bring another retest of the support zone. Potential Trading Setup: LONG A bullish entry should only be considered after ARX breaks above $0.2115 and successfully retests that level. - Potential entry: $0.2080–$0.2120 after confirmation - Stop-loss: $0.1990 - TP1: $0.2200 - TP2: $0.2300 Invalidation: A sustained 4H move below $0.1990 would weaken the recovery setup and suggest that sellers are regaining control. Why This Setup Matters One detail worth watching is the relationship between price and the moving averages. MA7 is around $0.2015, MA14 around $0.1974, and MA28 around $0.2013. Price is currently trading above all three, which is an encouraging short-term development. However, the recent recovery is approaching the $0.2115 resistance. Traders should not confuse a moving-average reclaim with a confirmed breakout. Another important factor is volume. The chart shows previous periods of significant trading activity, but the latest breakout attempt still needs stronger volume confirmation to establish buyer conviction. Chasing the current green candle could expose traders to a rejection near resistance. Waiting for a confirmed breakout and retest offers a more disciplined approach. Risk Management Keep position sizing reasonable and define your maximum acceptable loss before entering. A stop-loss is essential, particularly because ARX has shown considerable volatility on the 4H chart. If buyers fail to reclaim $0.2115, staying patient may be better than forcing a trade. Final Question: Can ARX break above $0.2115 and build a stronger bullish structure, or will sellers push the price back toward $0.2000? DYOR. This is market commentary, not financial advice #PiecesOf8
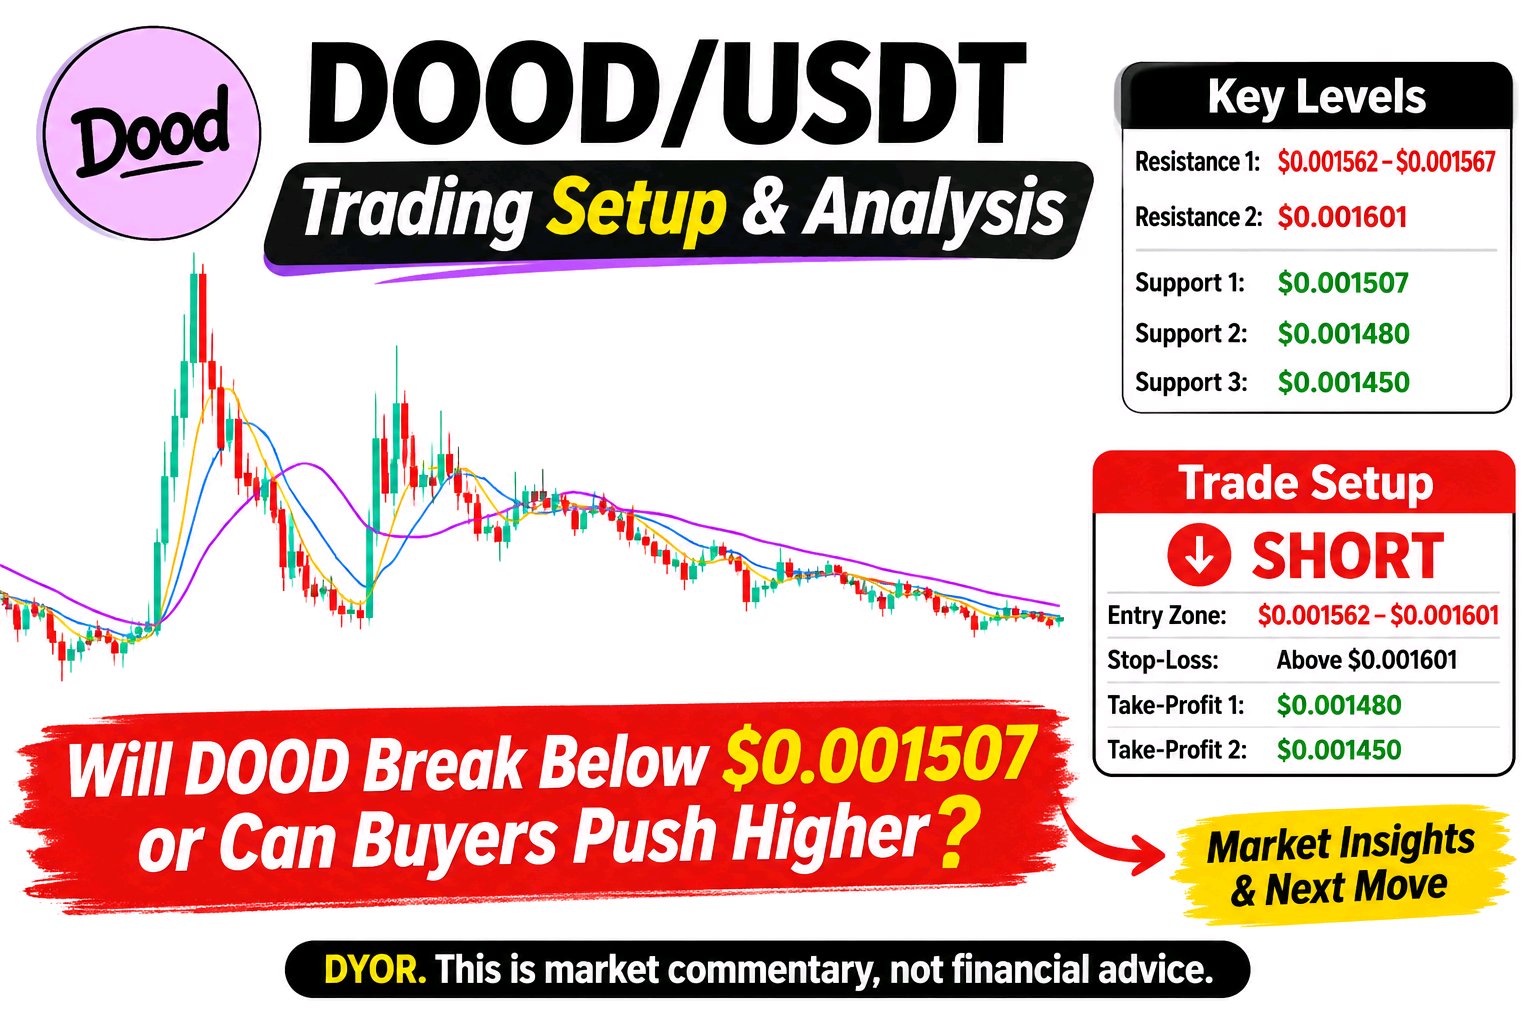
#ByXIMPACT $DOODUSDT is showing a weak recovery attempt, but the broader 4H structure remains bearish. Price is currently trading around $0.001545, struggling to move above the short-term moving averages. The chart continues to show lower highs and gradual selling pressure, suggesting buyers have not yet established control. Current Market Picture: Immediate support is around $0.001507, which aligns with the visible 24H low. A breakdown below this level could expose DOOD to further downside. On the upside, initial resistance sits around $0.001562–$0.001567, followed by stronger resistance near $0.001601. The moving averages (MA7: $0.001541, MA14: $0.001562, MA28: $0.001601) indicate that the broader short-term trend remains under pressure. Trading Setup: The preferred bias is SHORT, but confirmation is important. A rejection around $0.001562–$0.001601 could offer a potential short opportunity. A confirmed breakdown below $0.001507, followed by a failed retest, would provide additional bearish confirmation. Stop-loss should be placed above the confirmed rejection high. Potential downside objectives are $0.001480 and $0.001450, provided selling momentum continues. No reliable risk-to-reward ratio can be established without a confirmed entry and stop-loss. Why This Setup Matters: One important detail is declining trading activity. The displayed volume is 3.91M, below both the volume MA5 of 11.79M and MA10 of 13.87M. This suggests participation has weakened, making a strong directional move less convincing without fresh volume. Another overlooked factor is the distance between current price and MA28, which continues to act as overhead resistance. Chasing a short after an extended decline could be risky; waiting for a resistance rejection or confirmed support breakdown offers a more disciplined approach. Risk Management: Avoid entering solely because the chart looks bearish. Use sensible position sizing, maintain a predefined stop-loss, and watch for a 4H candle close before confirming a breakdown. A sustained move above $0.001601 would weaken the bearish outlook and require reassessment What do you think? Will DOOD break below $0.001507, or can buyers push the price back above $0.001567? DYOR. This is market commentary, not financial advice #BitcoinHitsTwoMonthLowAfterUSMidterms
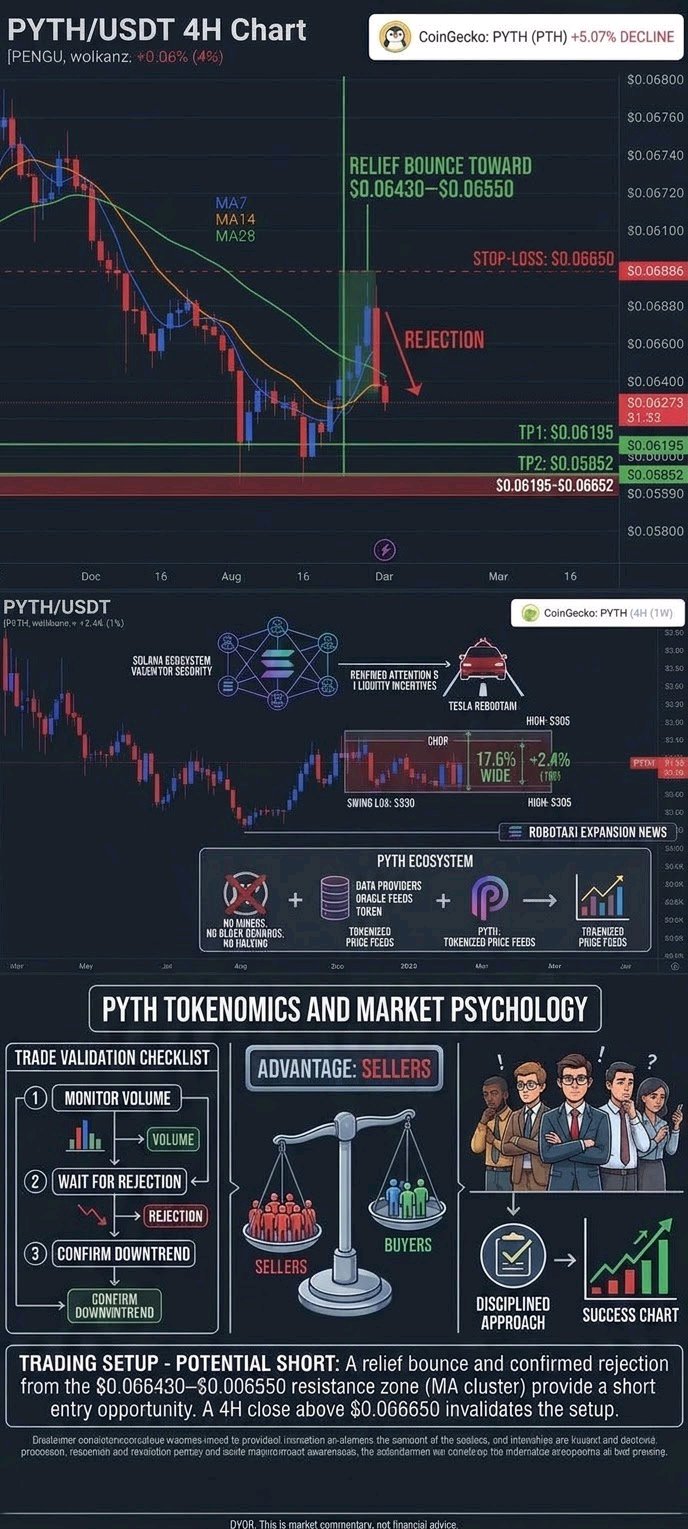
#ByXIMPACT $PYTHUSDT Sellers Maintain Control as Price Struggles Below Key Moving Averages PYTH is facing renewed selling pressure on the 4H chart, with price currently trading around $0.06273, down approximately 6.90%. The recent rejection near $0.06886 has weakened the recovery attempt, and sellers are once again pushing price toward the lower end of its consolidation range. The short-term structure remains bearish, with price trading below the MA7, MA14, and MA28. Current Market Picture and Key Levels: Immediate support is developing around $0.06195, while the more important historical support sits near $0.05852. On the upside, the first resistance zone is $0.06430–$0.06475, followed by stronger resistance around $0.06558. A sustained move above this area could improve the recovery outlook, while a clean breakdown below $0.06195 may expose the next downside support. Potential Trading Setup – SHORT: Entry Zone: $0.06430–$0.06550, preferably after a confirmed bearish rejection. Stop-Loss: $0.06650. TP1: $0.06195. TP2: $0.05852. The bearish setup becomes weaker if PYTH reclaims the moving-average resistance zone and establishes sustained 4H closes above it. Why This Setup Matters: The important detail is that all three moving averages are currently positioned above the market price, suggesting that sellers still have the short-term advantage. However, PYTH is already trading close to immediate support. Chasing a short position at current levels could expose traders to a sudden relief bounce. A more disciplined approach would be to wait for a recovery toward resistance and observe whether buyers can sustain that move or sellers step in again. A high-volume breakdown below $0.06195 would provide additional bearish confirmation. Risk Management: Avoid entering simply because the price is falling. Wait for confirmation, use sensible position sizing, and respect the stop-loss. If support holds and buyers reclaim resistance, reassess the bearish outlook rather than forcing the trade. What do you think: Will PYTH break below $0.06195 and move toward $0.05852, or can buyers defend this support and trigger a recovery? DYOR. This is market commentary, not financial advice. #BitcoinHitsTwoMonthLowAfterUSMidterms
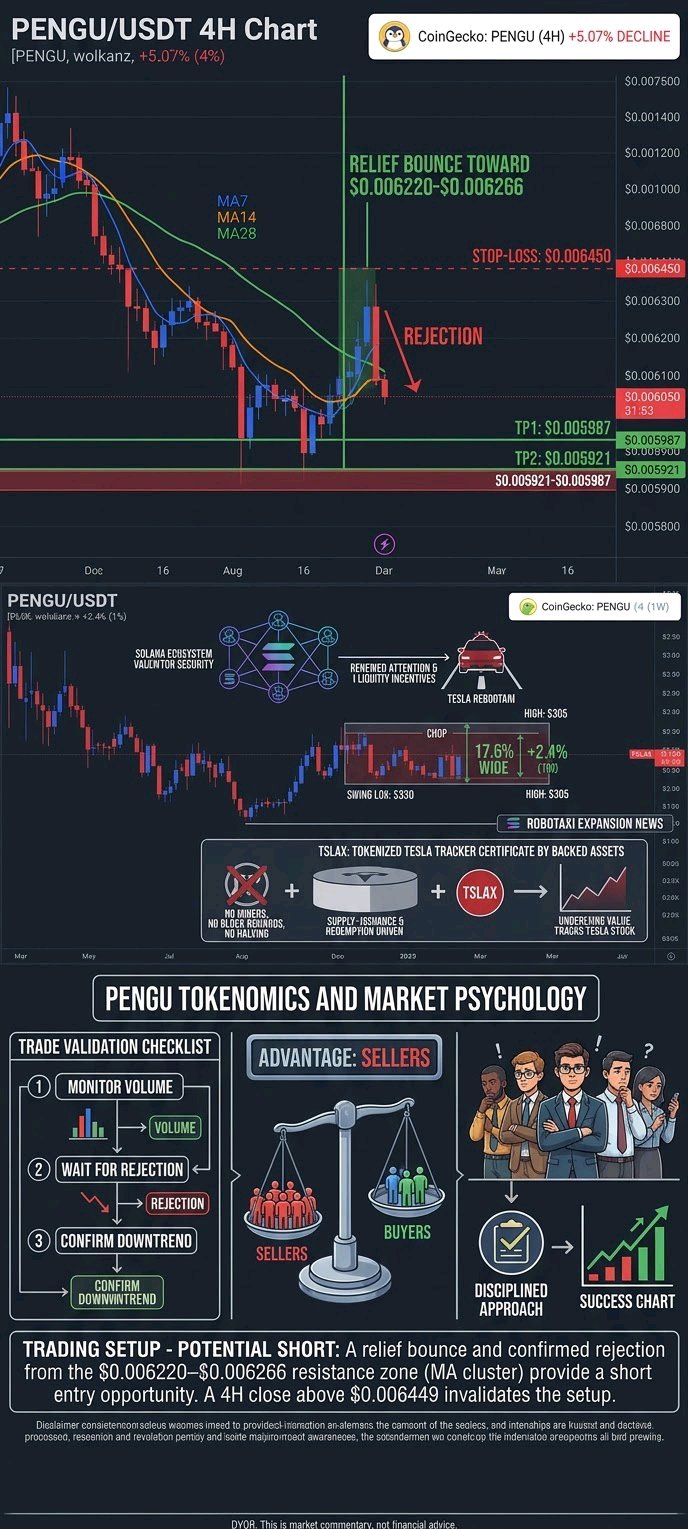
#ByXIMPACT $PENGUUSDT remains under bearish pressure on the 4H chart, with price trading around $0.006050 after a 5.07% decline. The broader structure continues to show lower highs and lower lows, while buyers have struggled to establish a meaningful recovery. For now, sellers appear to have the advantage. Current Market Picture: Immediate support is located around $0.005987–$0.005921. A decisive breakdown below $0.005921 could expose PENGU to further downside. On the upside, resistance sits around $0.006220–$0.006266, where MA7, MA14, and MA28 are clustered. The stronger resistance zone is near $0.006449. Trading Setup – Potential SHORT: Rather than chasing the current decline, I would watch for a relief bounce toward $0.006220–$0.006266 followed by bearish rejection. A confirmed rejection could provide a short entry opportunity, with a stop-loss above $0.006450. TP1 is $0.005987, while TP2 is $0.005921. A sustained 4H close above $0.006449 would weaken this bearish setup and invalidate the immediate short idea. Why This Setup Matters: The alignment of all three moving averages above the current price reinforces the bearish structure. Another important detail is that PENGU is already trading close to its recent support. Opening a fresh short position directly at these levels carries the risk of entering just before a relief bounce. Waiting for a retest and rejection offers a more disciplined approach. Volume should also be monitored to determine whether sellers are gaining strength during any support breakdown. Risk Management: Avoid oversized positions and never enter simply because the price is falling. Wait for confirmation, maintain a defined stop-loss, and adjust position size according to your risk tolerance. If buyers reclaim the moving averages, reassess the bearish outlook rather than forcing the trade. Will PENGU break below $0.005921 and extend its decline, or can buyers defend this support and trigger a recovery? DYOR. This is market commentary, not financial advice #BitcoinHitsTwoMonthLowAfterUSMidterms alb
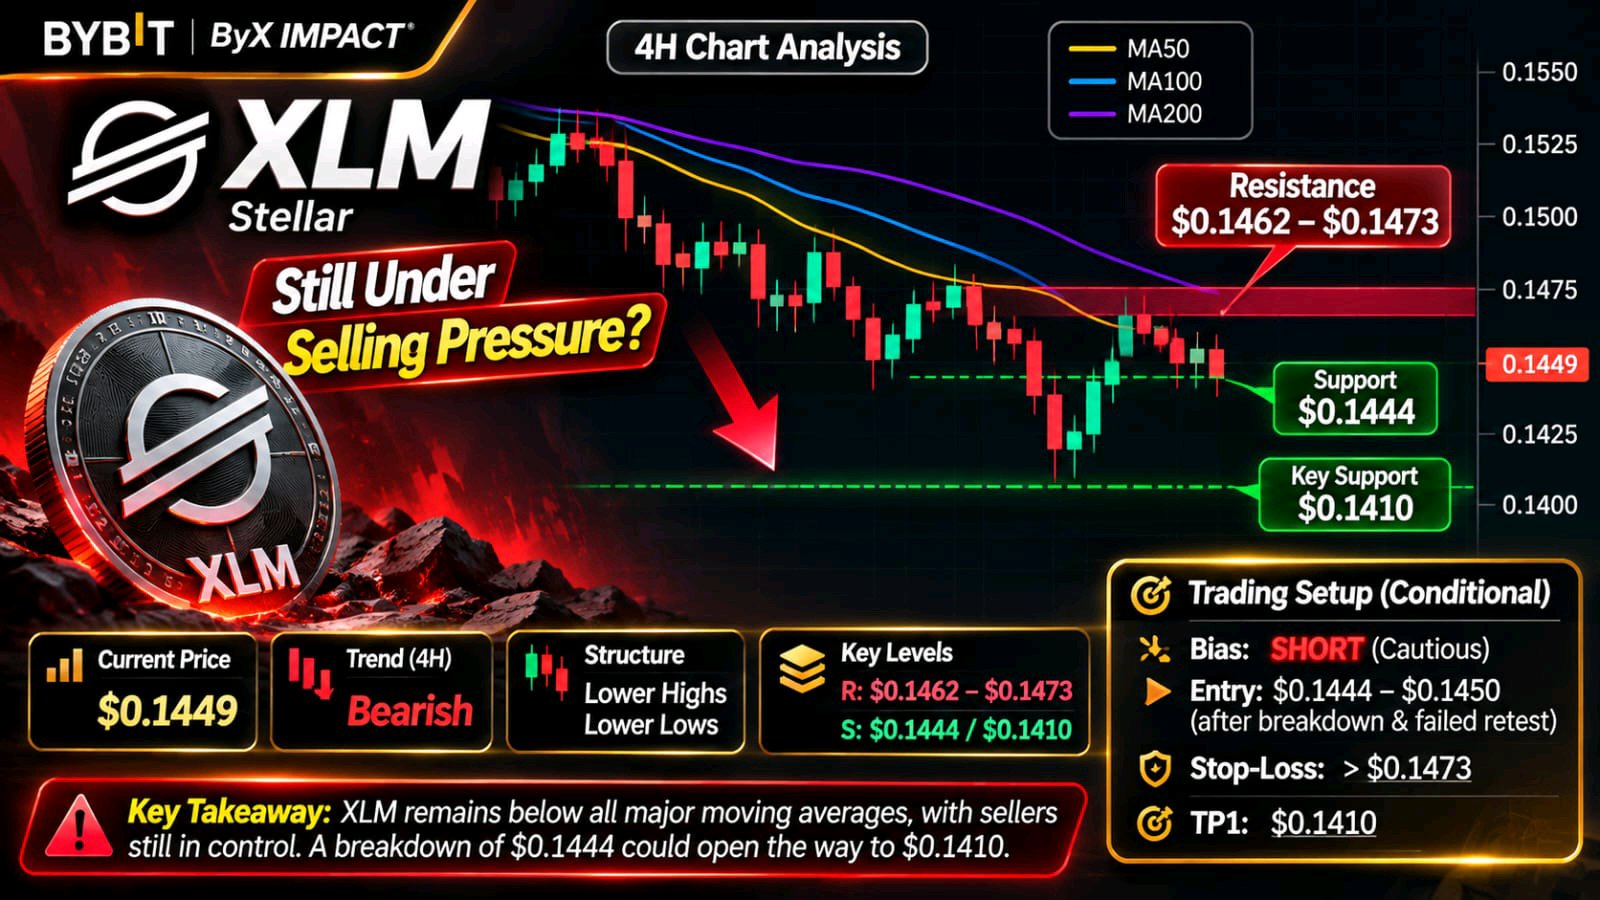
#ByXIMPACT is still under selling pressure, and the 4H chart shows little evidence of a meaningful trend reversal. Stellar is trading around $0.1449, with price remaining below all three moving averages, suggesting sellers continue to control the short-term structure. Current Market Picture: Immediate support sits around $0.1444, while stronger structural support is near $0.1410. Resistance is concentrated around $0.1462–$0.1473, where the moving averages are positioned. A sustained recovery above $0.1473 could improve the short-term outlook, while a confirmed breakdown below $0.1444 would increase downside risk. Trading Setup: The current structure favors a cautious SHORT bias, but entering directly into support carries additional risk. A 4H candle close below $0.1444, followed by a failed retest, could offer a potential short entry around $0.1444–$0.1450. Stop-loss: above $0.1473. TP1: $0.1410. TP2: No reliable lower target is established by the visible chart, so further targets require fresh price confirmation. Why This Setup Matters: XLM has been forming lower highs and lower lows, while price remains below its moving averages. One detail worth watching is the recent reaction around $0.1410: buyers managed to defend this level, meaning another immediate short entry could become vulnerable to a bounce. Volume confirmation on a breakdown would make the bearish scenario more convincing. Risk Management: Avoid chasing the decline near support. Wait for a confirmed breakdown and retest, keep position size controlled, and respect the stop-loss. A sustained move above $0.1473 would weaken the bearish setup and require reassessment. Will XLM finally break below $0.1410, or can buyers reclaim $0.1473 and trigger a recovery? DYOR. This is market commentary, not financial advice $XLMUSDT
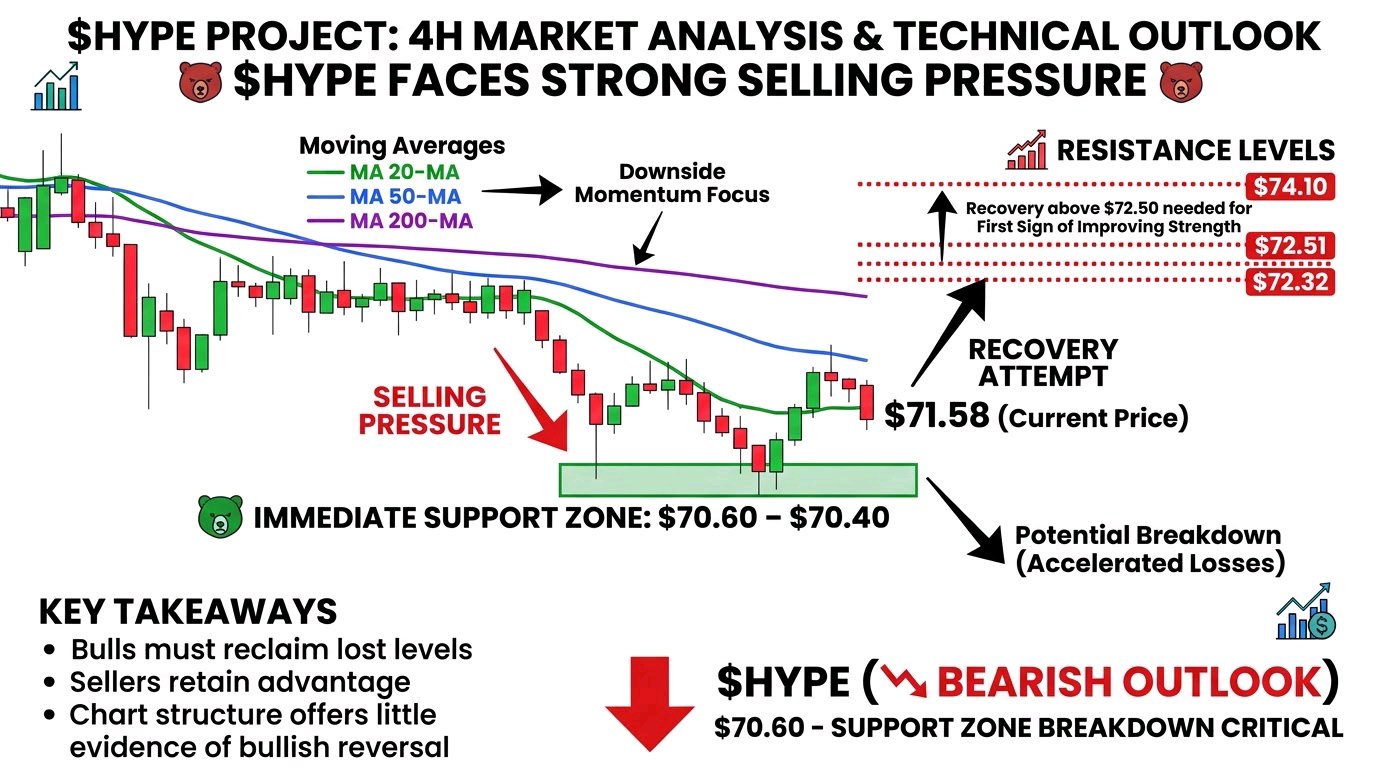
$HYPEUSDT HYPE is still facing strong selling pressure, and the 4H structure offers little evidence of a bullish reversal. Trading near $71.58, price remains below all three moving averages, keeping downside momentum in focus. The $70.60–$70.40 region is the immediate support zone. A decisive breakdown could accelerate losses, while a recovery above $72.50 would be the first sign of improving strength. Resistance: $72.32 – $72.51 – $74.10 Support: $70.60 – $70.40 Bulls need to reclaim lost levels before expecting a meaningful recovery. Until then, sellers retain the advantag $DOGEUSDT
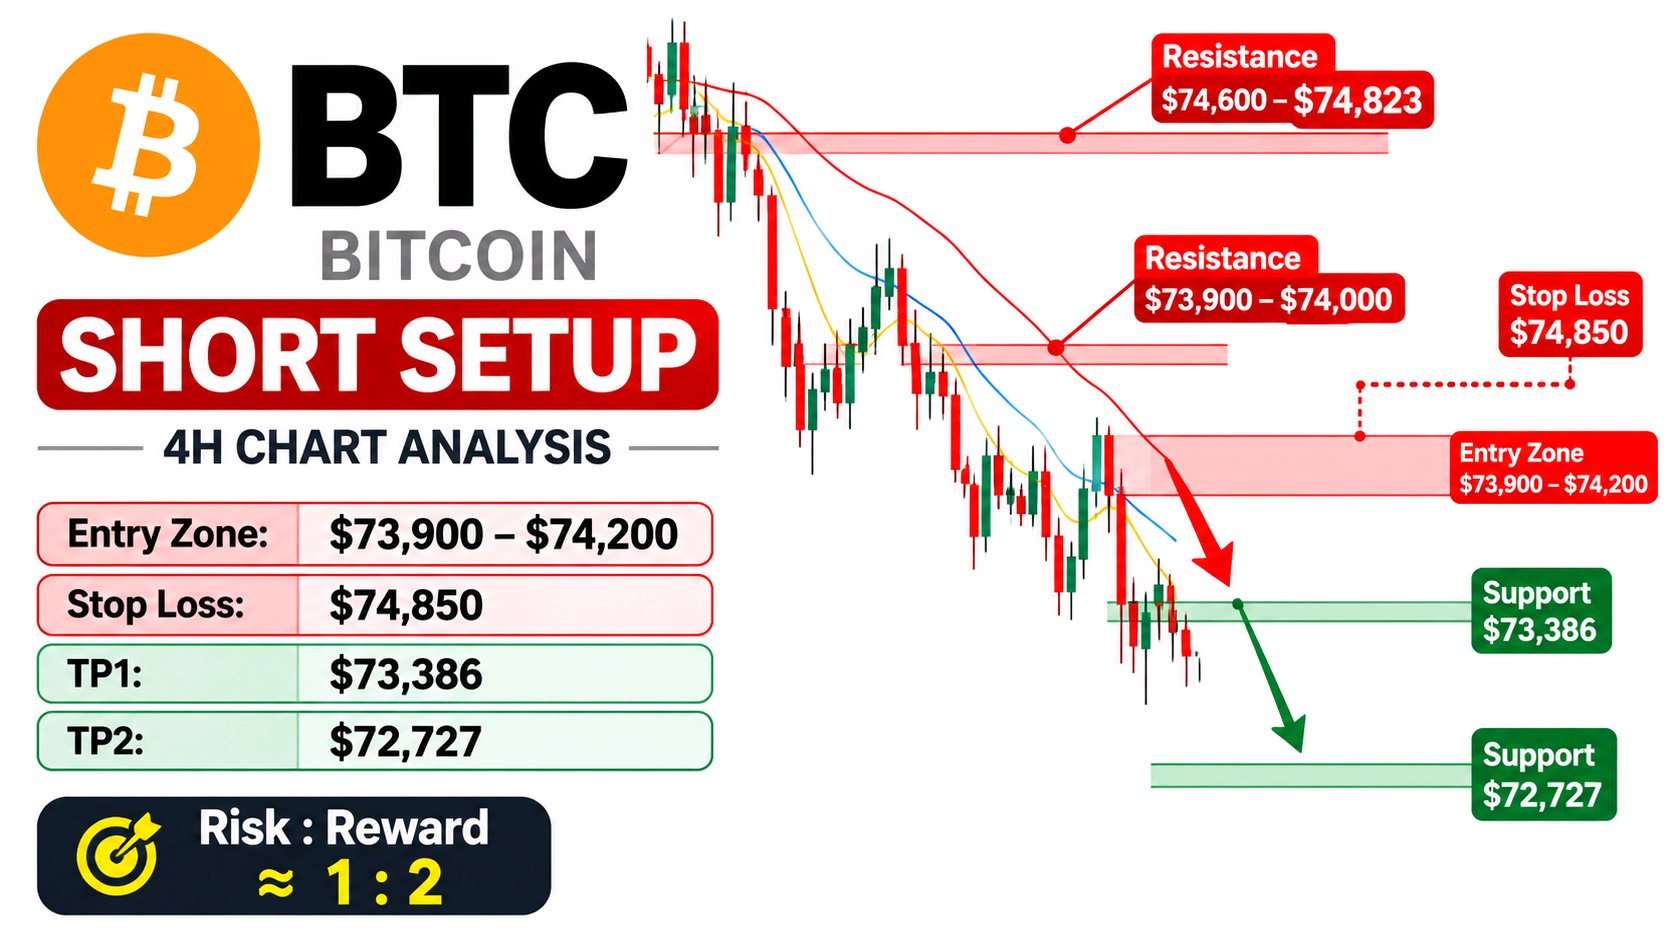
$SUPRAUSDT is still struggling to recover, and the 4H chart continues to favor sellers. Price is trading around $73,618, below all three key moving averages, showing that buyers have not yet regained control. Current Market Picture: The immediate support zone is $73,386–$72,727. A breakdown below $72,727 could open the door to further downside. Resistance sits around $73,900–$74,000, followed by stronger resistance near $74,600–$74,823. Trading Setup: SHORT Potential Entry: $73,900–$74,200 after bearish rejection. Stop Loss: $74,850. TP1: $73,386 TP2: $72,727 Invalidation: A sustained 4H close above $74,823 would weaken this bearish setup. Why This Setup Matters: BTC is forming lower highs and lower lows, while price remains below MA7 ($73,929), MA14 ($73,937), and MA28 ($74,612). This alignment reflects continued selling pressure. One detail worth watching is the narrow consolidation near recent lows. Sellers may be losing immediate momentum, so chasing a short at current support carries additional risk. A rejection from resistance or a confirmed support breakdown would provide stronger evidence. Risk Management: Avoid entering blindly. Wait for confirmation, protect your capital with a stop-loss, and use sensible position sizing. If BTC reclaims resistance, reassess rather than forcing the trade. Do you think BTC will break below $72,727 next, or will buyers finally defend this support? DYOR. This is market commentary, not financial advice. $BTCUSDT #USInflationRunsHotAndRateHikeBetsRise #WSOT2026 #AITechSelloffErases2Point5TrillionFromNasdaq100 #BitcoinHitsTwoMonthLowAfterUSMidterms #NovUSCPIWatch
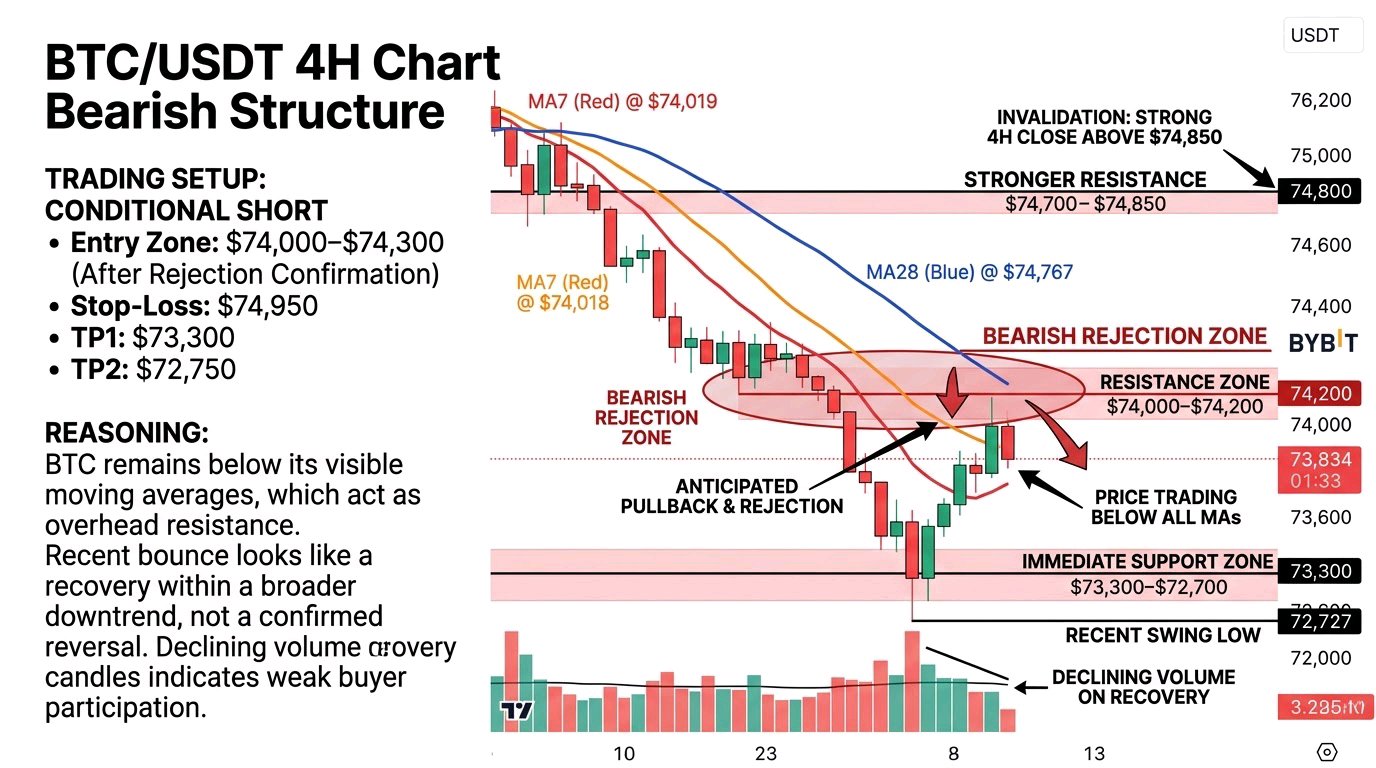
BTC is still showing a bearish structure on the 4H chart, and the recent recovery has not yet provided convincing evidence of a trend reversal. Price is around $73,834, trading below all three visible moving averages: MA7 at $74,019, MA14 at $74,128, and MA28 at $74,767. The immediate support zone is $73,300–$72,700, with $72,727 marking the recent visible swing low. Resistance sits around $74,000–$74,200, followed by the stronger $74,700–$74,850 zone. A sustained 4H close above the upper resistance could improve the bullish outlook, while a breakdown below $72,700 would expose BTC to further downside. Trading setup: Conditional SHORT I would avoid chasing BTC at current levels. A more reasonable setup is to wait for a pullback into $74,000–$74,300 and look for bearish rejection on the 4H timeframe. * Entry zone: $74,000–$74,300 after rejection confirmation. * Stop-loss: $74,950. * TP1: $73,300. * TP2: $72,750. * Invalidation: A strong 4H close above $74,850 would weaken this bearish setup. The reasoning is straightforward: BTC remains below its visible moving averages, which are acting as overhead resistance. The recent bounce looks more like a recovery within a broader downtrend than a confirmed reversal. One detail worth watching is the declining volume on the latest recovery candles. Buyers need stronger participation to establish a sustainable move upward. Live market snapshots also show BTC trading around the $73,600–$74,100 area, so execution levels should be adjusted to the actual Bybit price. CoinGlass +1 Risk management matters here. Do not enter simply because price approaches resistance. Wait for rejection, protect the position with a stop-loss, and size the trade according to your risk tolerance. If BTC breaks resistance convincingly, abandon the short idea rather than fighting the market. Will BTC reject the $74,000–$74,300 resistance zone again, or can buyers finally reclaim $74,850 and change the 4H structure? DYOR. This is market commentary, not financial advic. $BTCUSDT
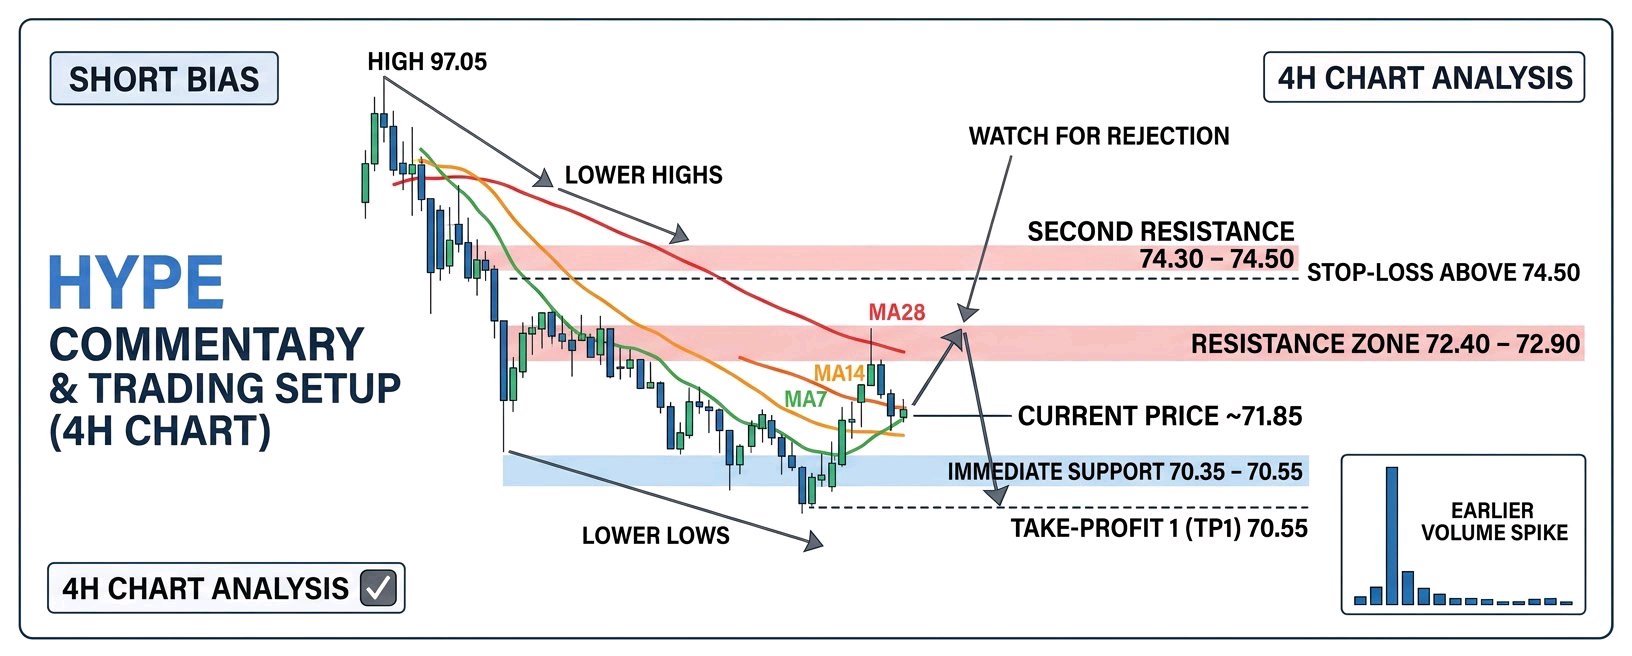
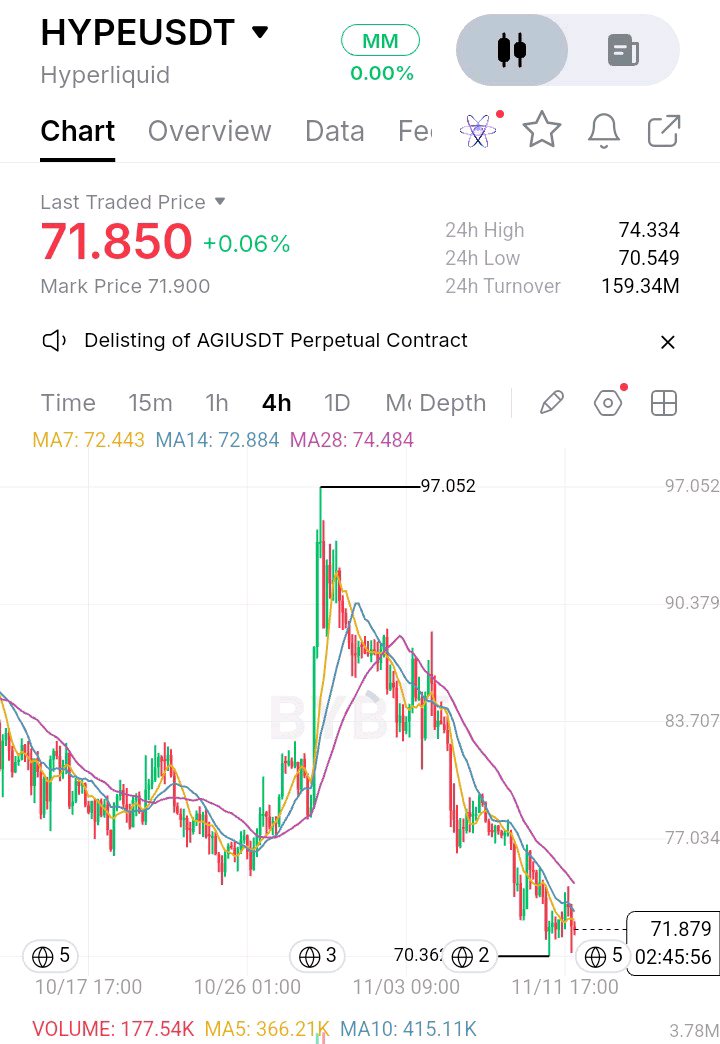
HYPE is still struggling to regain bullish momentum after falling sharply from the 97.05 high. On the 4H chart, price is trading around 71.85, with lower highs and lower lows keeping sellers in control. Key levels to watch: Immediate support sits around 70.35–70.55. A decisive 4H close below this zone could expose further downside. Resistance is positioned at 72.40–72.90, followed by 74.30–74.50. Buyers need to reclaim these moving-average levels before a meaningful recovery becomes more convincing. Trading setup: SHORT bias, but confirmation is needed. Watch for a rejection around 72.40–72.90 for a possible short entry. A stop-loss above 74.50 would protect against a stronger recovery. TP1 is 70.55, while TP2 should be determined after a confirmed breakdown and retest, as the screenshot does not establish a reliable lower target. A sustained move above 74.50 would invalidate the bearish setup. What stands out is that all three moving averages (MA7, MA14 and MA28) are above the current price and pointing into a bearish structure. Another overlooked detail is the earlier volume spike near the 97.05 peak, which has not translated into sustained buying momentum. Chasing shorts close to 70.35 is risky because support is nearby. Waiting for a pullback or confirmed breakdown offers better discipline. Risk management: Avoid oversized positions, use a protective stop-loss and wait for a confirmed 4H candle close. No setup is worth chasing without proper risk-to-reward. Will HYPE defend the 70.35 support zone, or are sellers preparing another breakdown? DYOR. This is market commentary, not financial advice $HYPEUSDT #WSOT2026 #BitcoinHitsTwoMonthLowAfterUSMidterms #USInflationRunsHotAndRateHikeBetsRise #AITechSelloffErases2Point5TrillionFromNasdaq100 #DeutscheBankLaunchesDigitalAssetCustody $DOGEUSDT
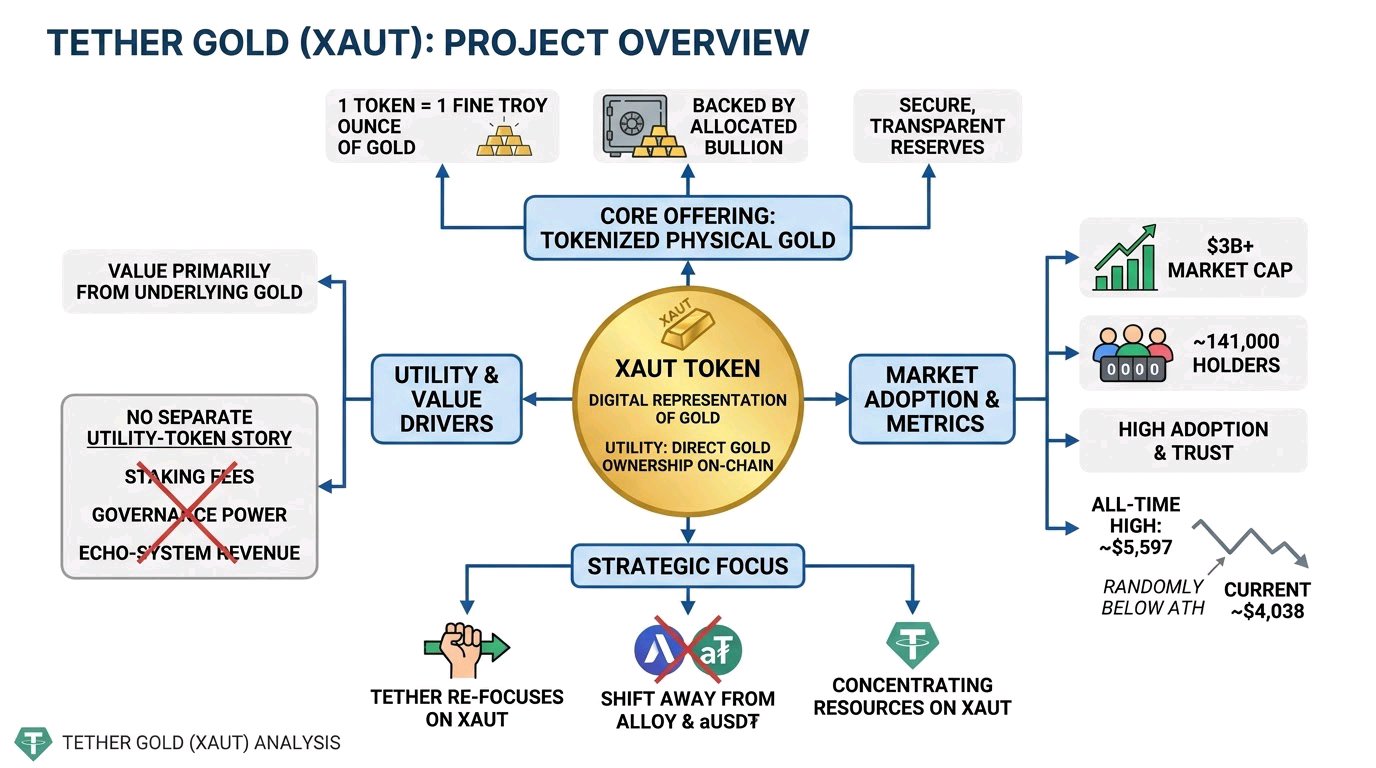
Tether Gold has quietly built a $3B+ market cap and around 141,000 holders, yet XAUT is still trading near $4,038, roughly 28% below its $5,597 all-time high. The product is straightforward: tokenized physical gold, backed by allocated bullion and designed to bring gold ownership onto blockchain rails. Tether has also shifted its focus away from Alloy and its aUSD₮ collateralized product, choosing to concentrate resources on XAUT and its core gold-backed offering. What hasn't followed is a separate utility-token story. XAUT does not capture protocol fees through staking or governance. Its value comes primarily from the underlying gold, not from growing blockchain activity. The adoption is real. But XAUT is ultimately a digital representation of gold, not a token whose value compounds with ecosystem usage $XAUTUSDT #WSOTPicktoEarn10U #WSOT2026 #USPayrollsAndRateDecisionsDriveMacroWeek #OilVolatilityTracksIranPeaceTalks #BOERateDecision $DOGEUSDT