♨️Hot girl 👑
4308Like0Shares100Fans114Follow
👑 Royal Blood, Silent Personality♨️
👑 Royal Blood, Silent Personality♨️
AVAX daily chart still locked in a clear downtrend
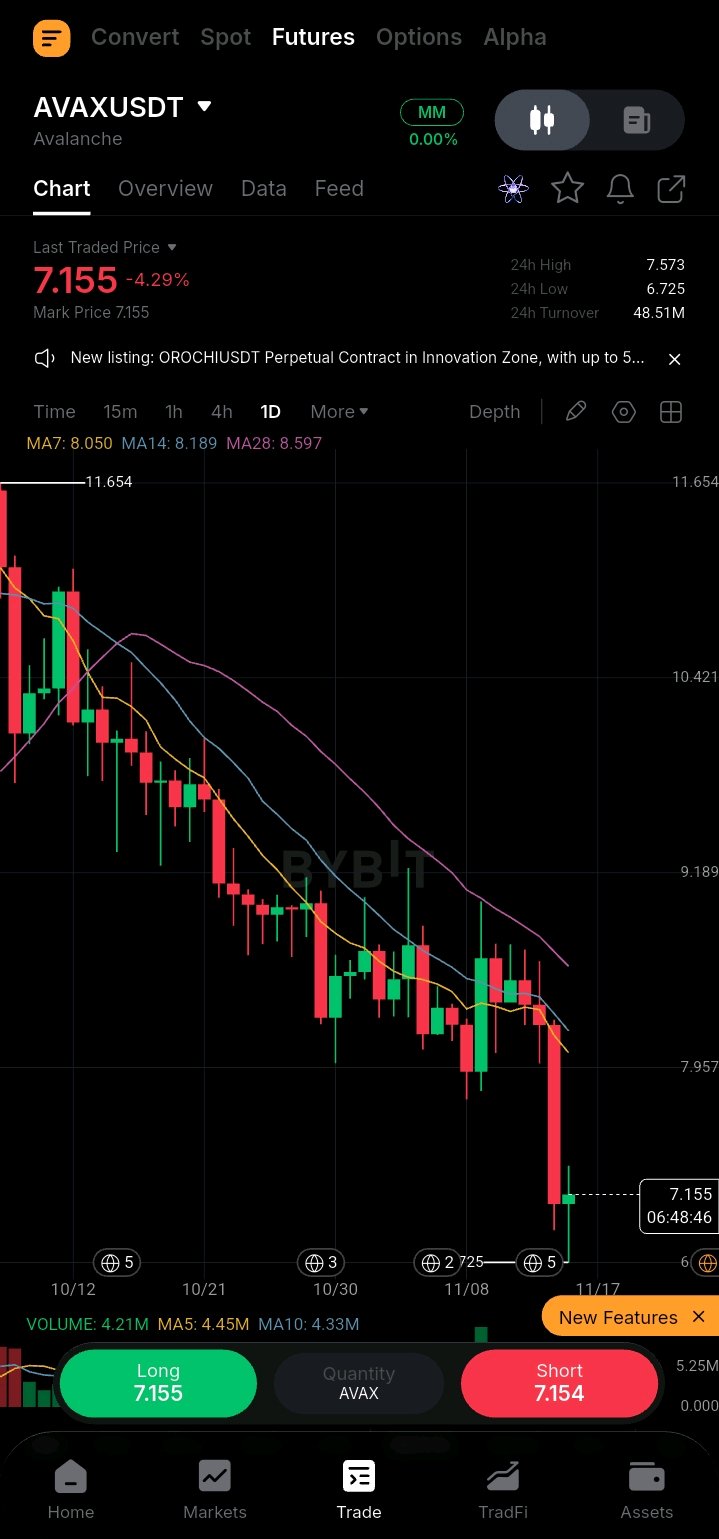
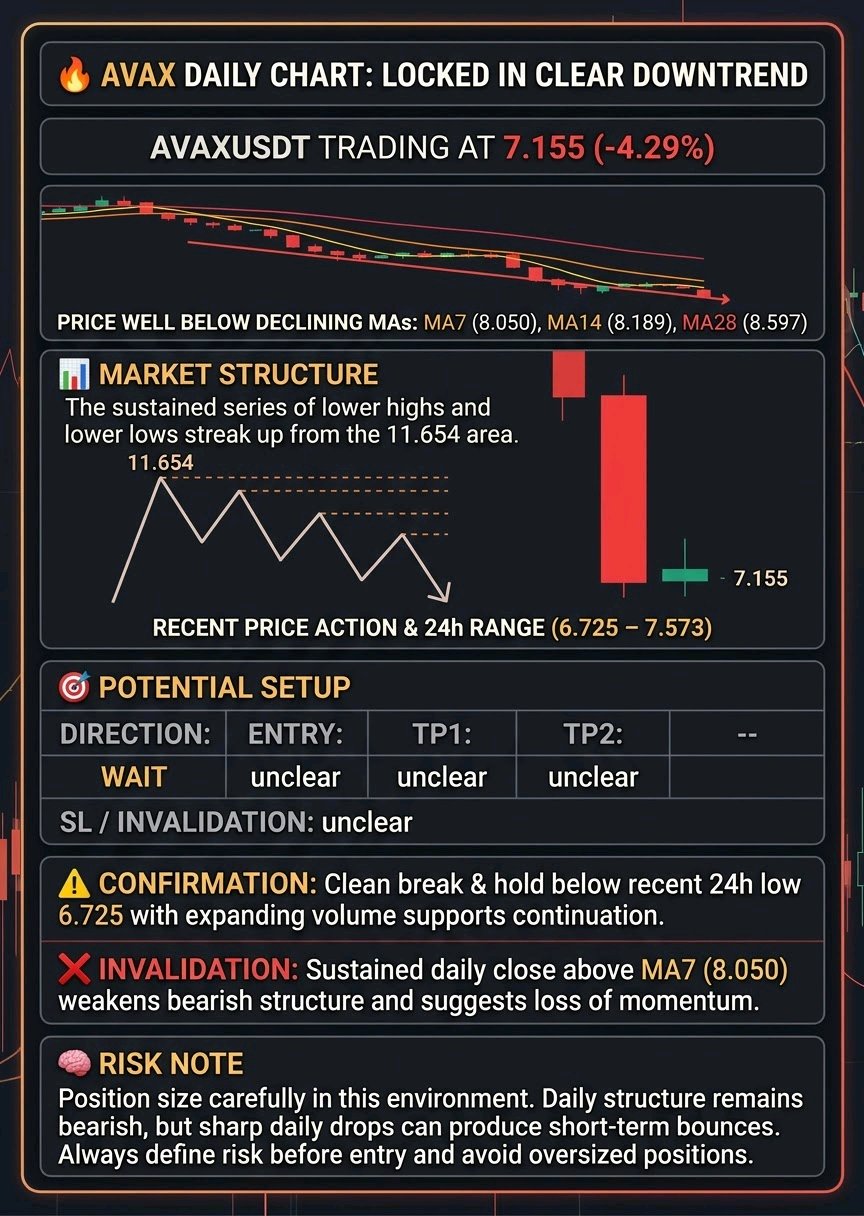
$AVAXUSDT is trading at 7.155 after a sharp -4.29% move, sitting well below the declining MA7, MA14 and MA28 on the daily timeframe. 📊 Market Structure: The chart shows a sustained series of lower highs and lower lows from the 11.654 area down to current levels. Price remains under the downward-sloping moving averages (MA7 at 8.050, MA14 at 8.189, MA28 at 8.597), confirming the bearish structure. A large red candle printed recently, followed by a small green candle near 7.155. 24h range sits between 6.725 and 7.573. 🎯 Potential Setup: Direction: WAIT Entry: unclear TP1: unclear TP2: unclear SL / Invalidation: unclear ⚠️ Confirmation: A clean break and hold below the recent 24h low of 6.725 with expanding volume would support continuation of the downtrend. Reclaiming and holding above the declining MA7 would be the first sign of potential stabilization. ❌ Invalidation: A sustained daily close back above the MA7 (currently 8.050) would weaken the immediate bearish structure and suggest the downtrend is losing momentum. 🧠 Risk Note: Position size carefully in this environment. The daily structure remains bearish, but sharp daily drops can produce short-term bounces. Always define risk before entry and avoid oversized positions. #IMPACTbyTrade
🔥 XAUT/USDT: Downtrend Below Key MAs
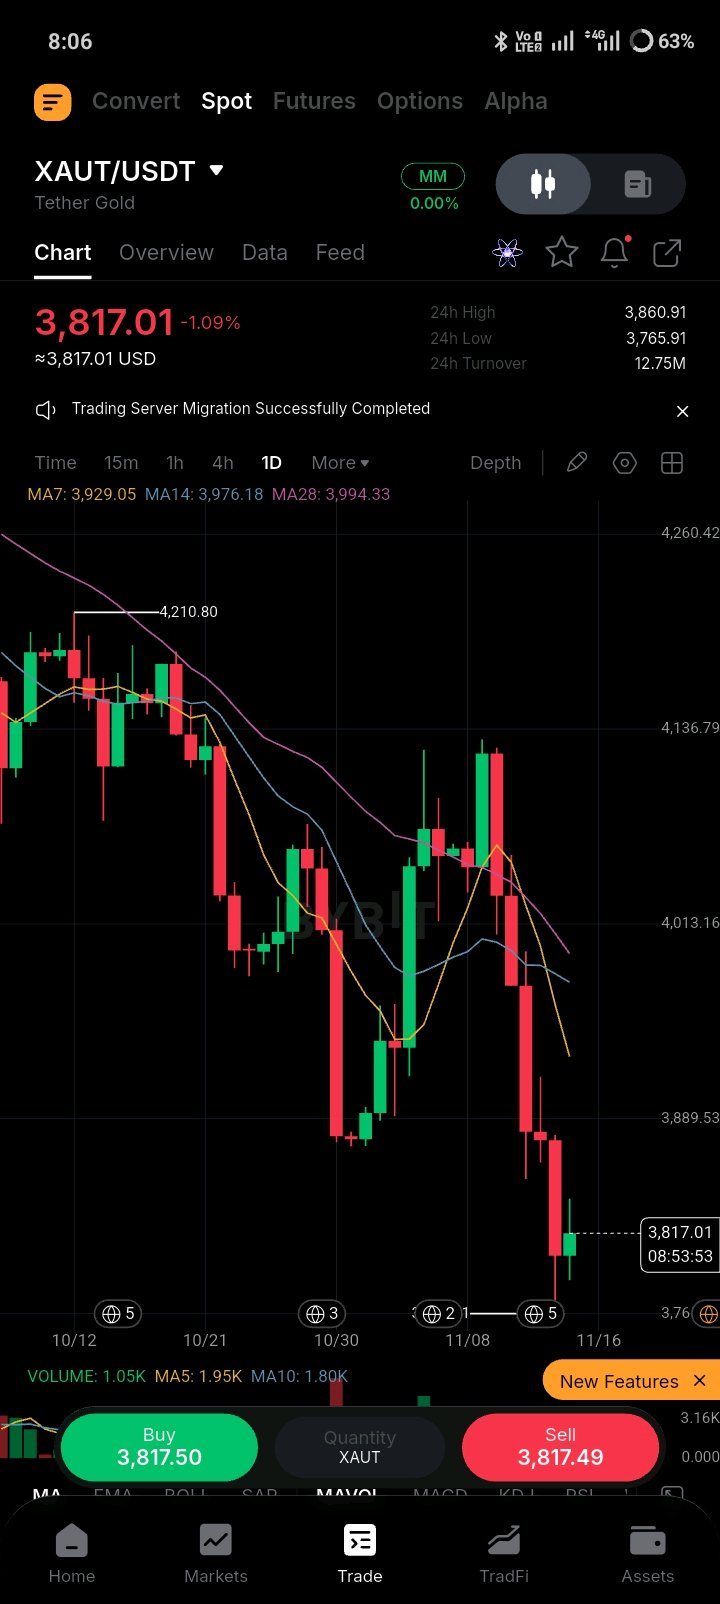
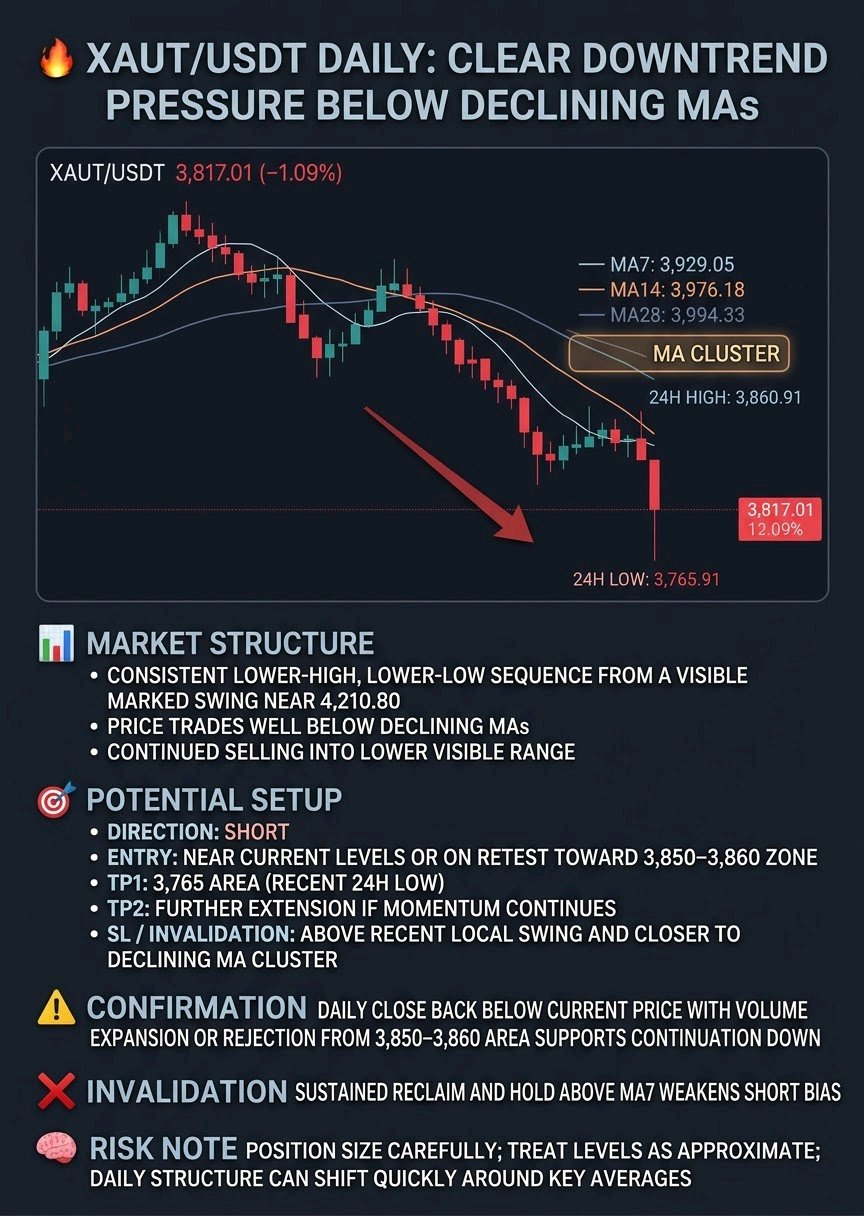
$XAUTUSDT Price is sitting at 3,817.01 after a noticeable slide, printing -1.09% on the day and trading well beneath the visible moving averages. 📊 Market Structure: The daily chart shows a consistent lower-high, lower-low sequence from the marked swing near 4,210.80. Price remains below the MA7 (3,929.05), MA14 (3,976.18) and MA28 (3,994.33), all of which are sloping downward. The most recent candles reflect continued selling pressure into the lower end of the visible range, with the 24h low at 3,765.91 and 24h high at 3,860.91 framing the immediate action. 🎯 Potential Setup: Direction: SHORT Entry: Near current levels or on any retest toward the 3,850–3,860 zone TP1: 3,765 area (recent 24h low) TP2: Further extension if momentum continues SL / Invalidation: Above the recent local swing and closer to the declining MA cluster ⚠️ Confirmation: A clean daily close back below the current price with volume expansion or rejection from the 3,850–3,860 area would support continuation of the down move. ❌ Invalidation: A sustained reclaim and hold above the MA7 would weaken the short bias and suggest the immediate selling pressure is easing. 🧠 Risk Note: Position size carefully and treat any levels as approximate; daily structure can shift quickly around key averages. #IMPACTbyTrade
HYPEUSDT: Sweeping Lows After a Steep Decline
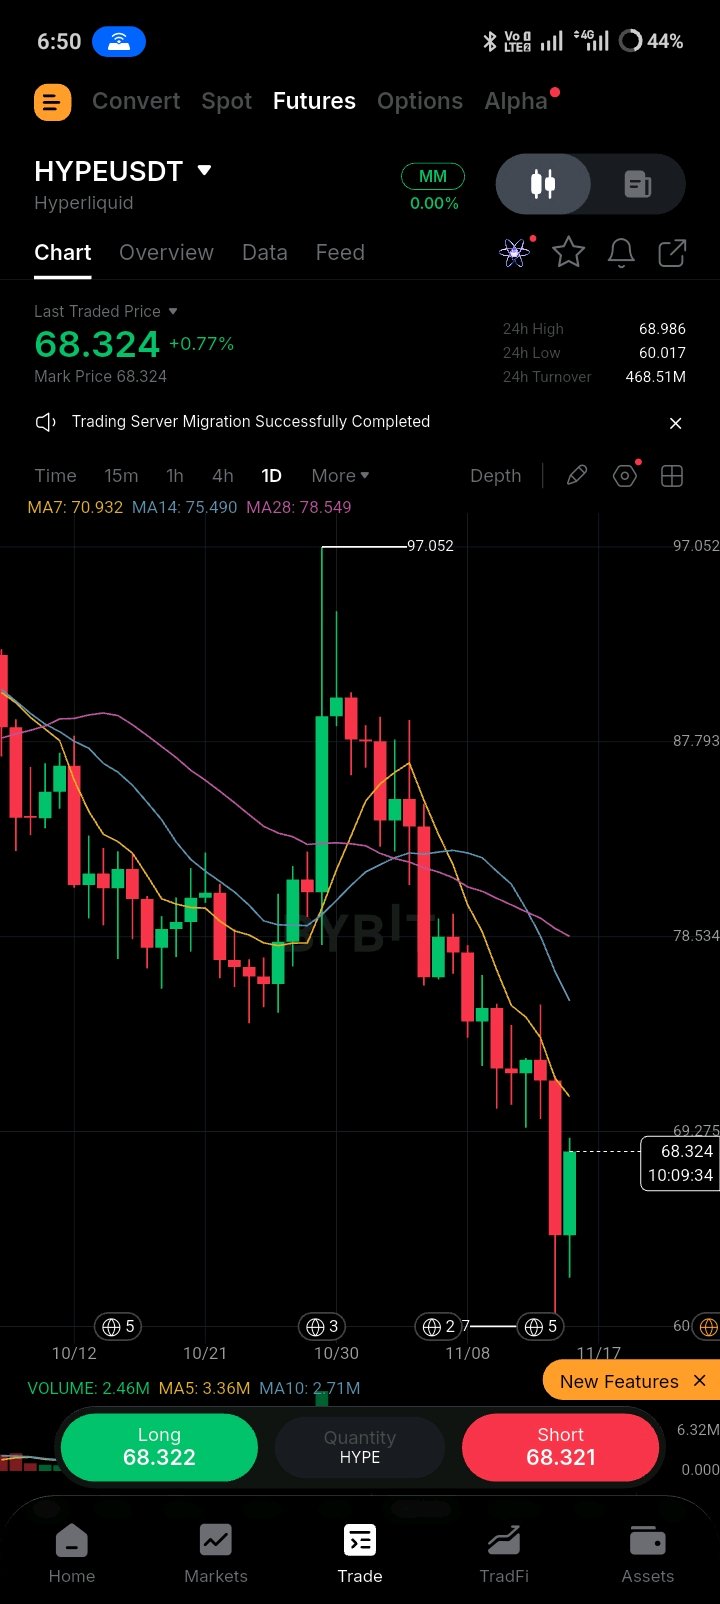
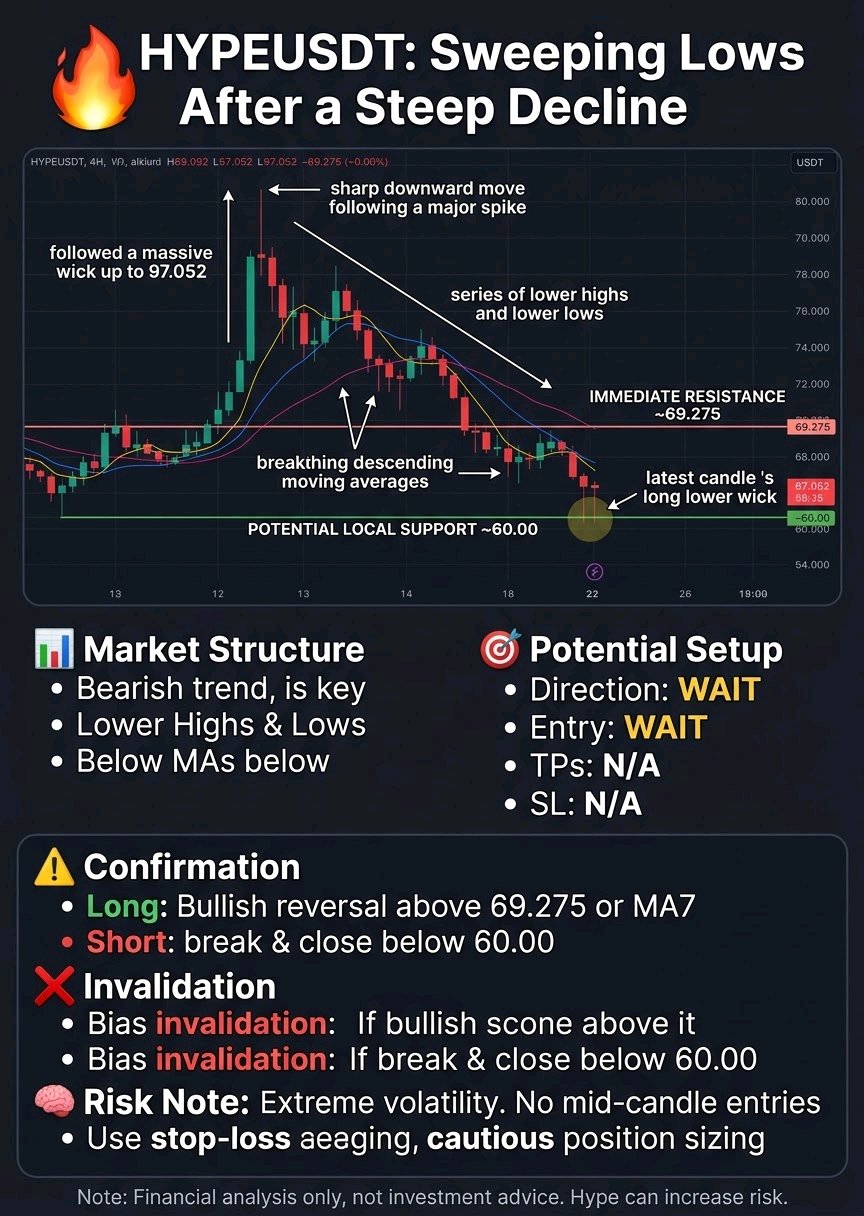
$HYPEUSDT Price action on HYPEUSDT shows a sharp downward move following a major spike, with the latest candle sweeping down to a new local low near 60.00 before bouncing. 📊 Market Structure: The visible trend is heavily bearish on this timeframe. After a massive wick up to 97.052, the price has printed a series of lower highs and lower lows, breaking below the 4H moving averages (MA7, MA14, MA28). The current price is testing a potential local support area around the 60.00 psychological level, having formed a long lower wick on the recent candle. Immediate resistance is seen near the 69.275 level and the descending moving averages. 🎯 Potential Setup: Direction: WAIT Entry: WAIT TP1: N/A TP2: N/A SL / Invalidation: N/A ⚠️ Confirmation: A long setup would require a clear bullish reversal signal, such as a strong green candle closing above the 69.275 level or the MA7. A short setup would need to see the price break and close firmly below the 60.00 support level to continue the downtrend. Currently, the chart shows a pause in momentum, making it risky to enter without further confirmation. ❌ Invalidation: For a long bias, a breakdown and close below the 60.00 support invalidates the setup. For a short bias, a strong close above the 69.275 resistance would invalidate the idea of immediate continuation. 🧠 Risk Note: The market is extremely volatile, as seen by the massive spike and subsequent crash. Avoid entering positions mid-candle without clear confirmation. Always use a stop-loss and manage your position size carefully, as sudden wicks can trigger unexpected liquidations. #IMPACTbyTrade
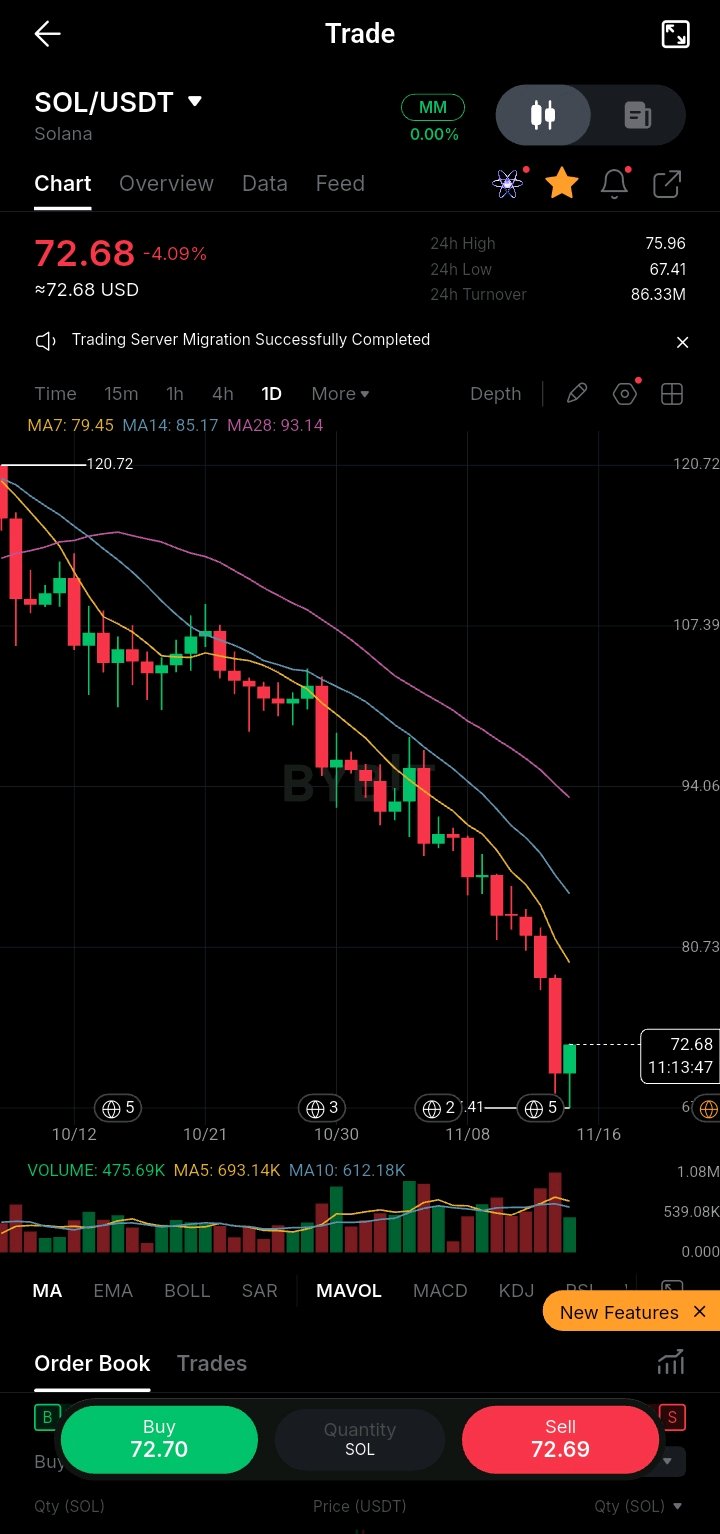
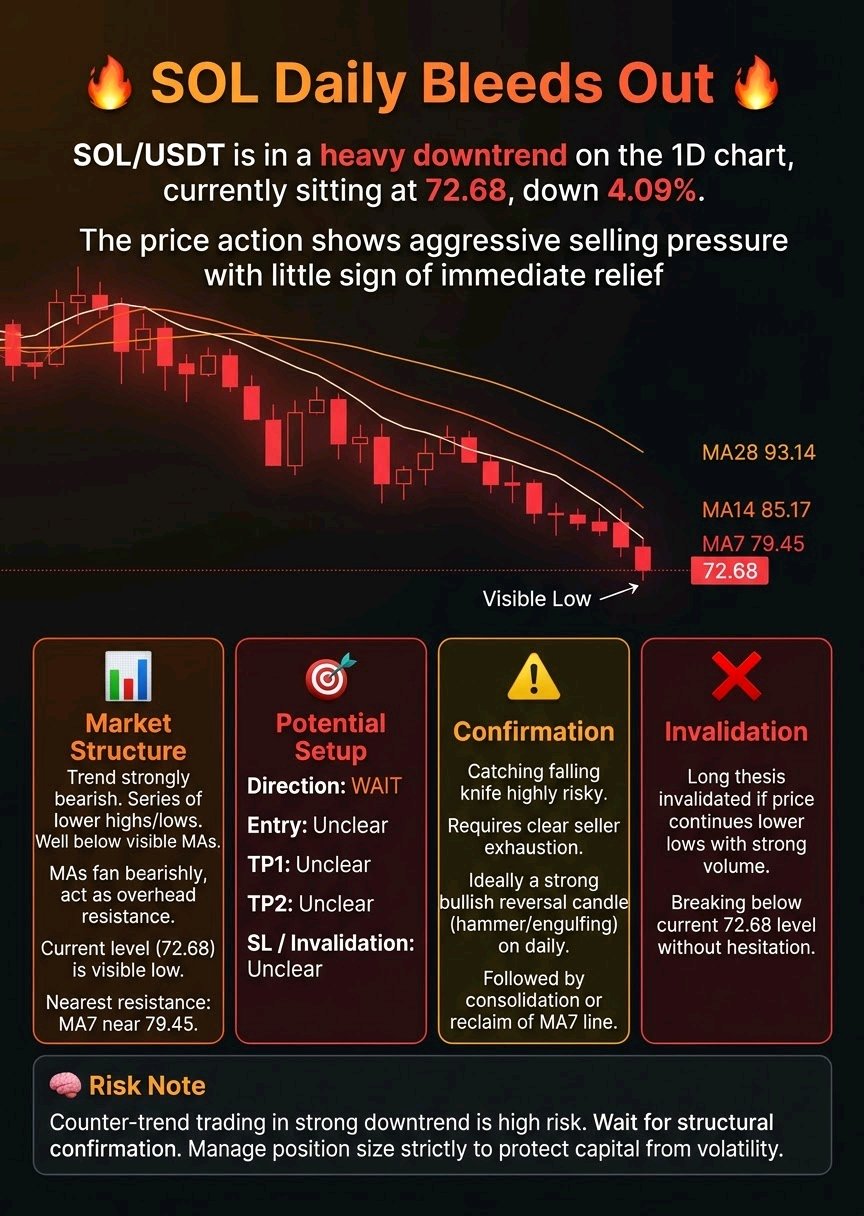
SOL Daily Bleeds Out
$SOLUSDT is in a heavy downtrend on the 1D chart, currently sitting at 72.68, down 4.09%. The price action shows aggressive selling pressure with little sign of immediate relief. 📊 Market Structure: The trend is strongly bearish. SOL has printed a series of lower highs and lower lows, cascading well below the visible moving averages (MA7: 79.45, MA14: 85.17, MA28: 93.14). These MAs are fanned out bearishly and act as overhead dynamic resistance. The current level (72.68) is the visible low, with the nearest resistance being the MA7 near 79.45. 🎯 Potential Setup: Direction: WAIT Entry: Unclear TP1: Unclear TP2: Unclear SL / Invalidation: Unclear ⚠️ Confirmation: Catching this falling knife is highly risky. A valid setup requires clear seller exhaustion—ideally a strong bullish reversal candle (hammer/engulfing) on the daily, followed by consolidation or a reclaim of the MA7 line. ❌ Invalidation: Any long thesis is invalidated if price continues to print lower lows with strong volume, breaking below the current 72.68 level without hesitation. 🧠 Risk Note: Counter-trend trading in a strong downtrend is high risk. Wait for structural confirmation and manage position size strictly to protect capital from sudden volatility. #IMPACTbyTrade

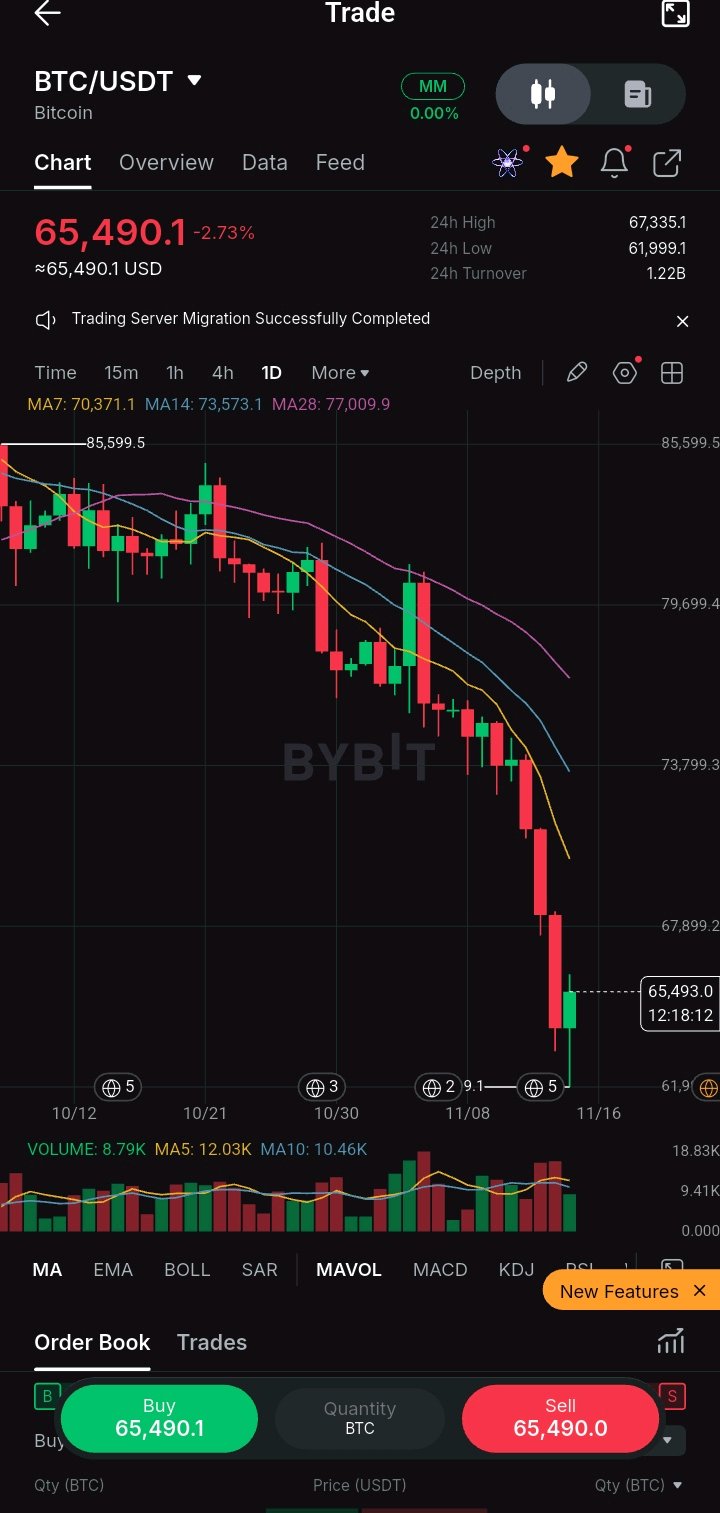
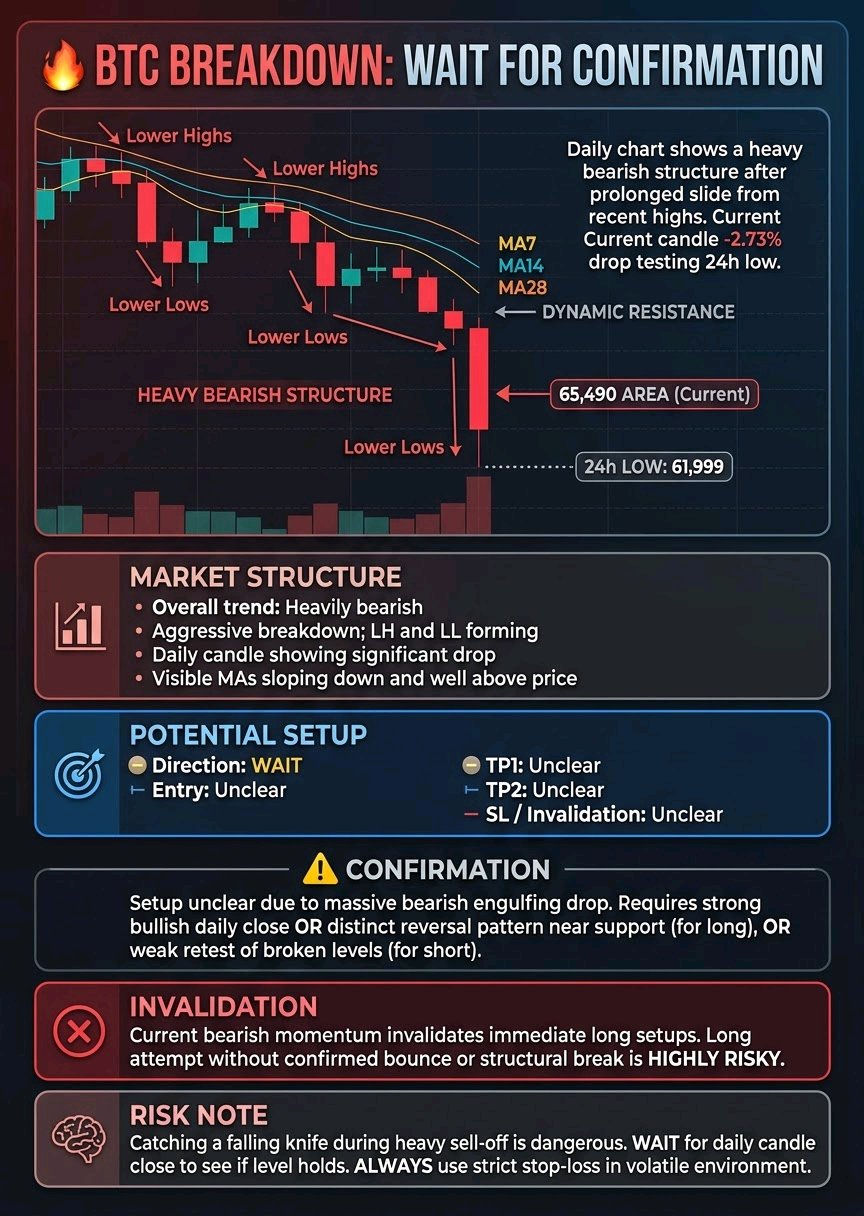
BTC Breakdown: Wait for Confirmation
$BTCUSDT The daily chart shows a heavy bearish structure, with Bitcoin currently printing a sharp red candle down to the 65,490 area after a prolonged slide from recent highs. 📊 Market Structure: The overall trend is heavily bearish. Price has aggressively broken down, forming a series of lower highs and lower lows. The current daily candle is showing a significant drop of -2.73%, currently testing the 24h low around 61,999. All visible moving averages (MA7, MA14, MA28) are sloping downward and sit well above the current price action, acting as dynamic resistance. 🎯 Potential Setup: Direction: WAIT Entry: Unclear at current levels TP1: Unclear TP2: Unclear SL / Invalidation: Unclear ⚠️ Confirmation: Because the current daily candle is a massive bearish engulfing drop with no signs of bottoming structure yet, a setup is unclear. Confirmation for a long would require a strong bullish daily close or a distinct reversal pattern forming near a support level. A short setup would require a weak retest of the broken levels. ❌ Invalidation: The current bearish momentum invalidates immediate long setups. Any long attempt without a confirmed daily bounce or structural break is highly risky. 🧠 Risk Note: Catching a falling knife during a heavy sell-off is dangerous. Wait for the daily candle to close to see if this level holds as support, and always use a strict stop-loss if you choose to engage in this volatile environment. #IMPACTbyTrade

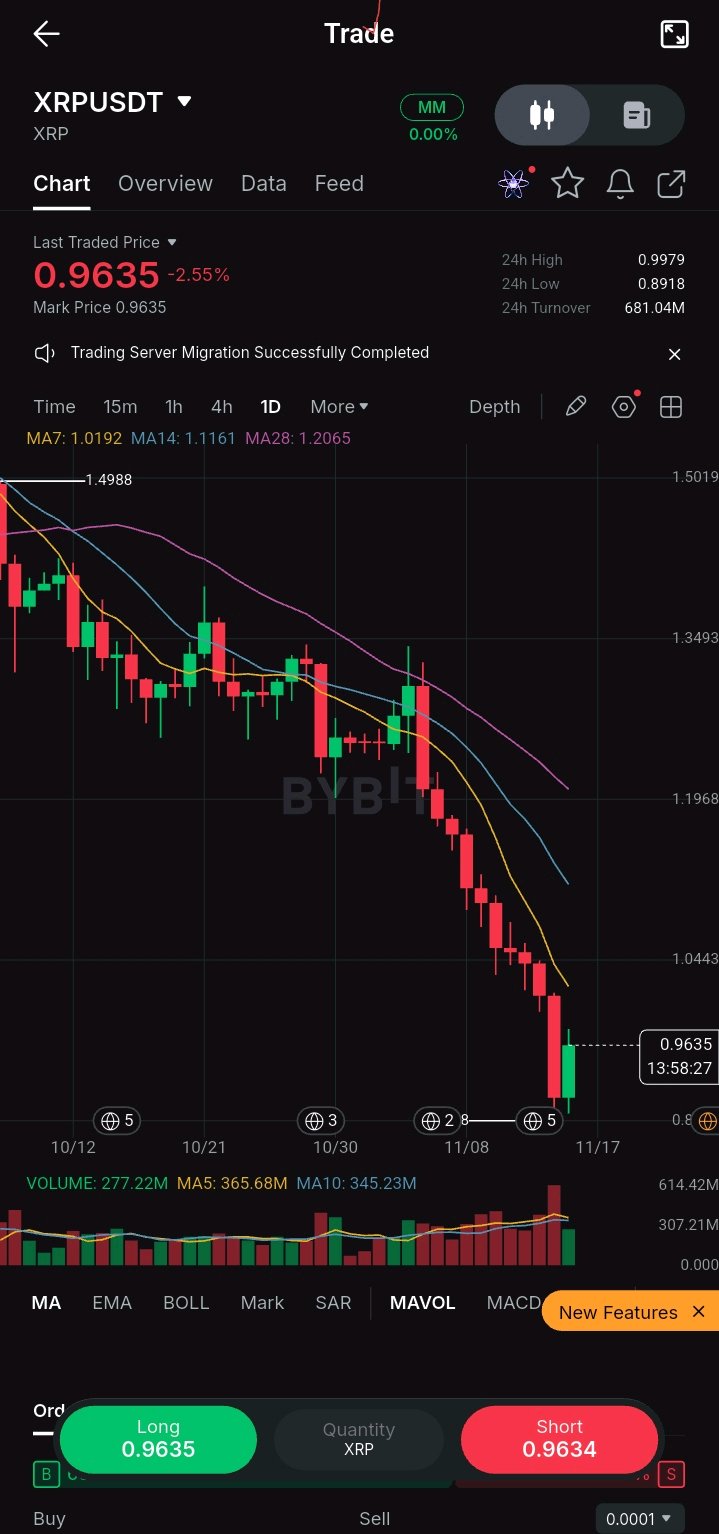
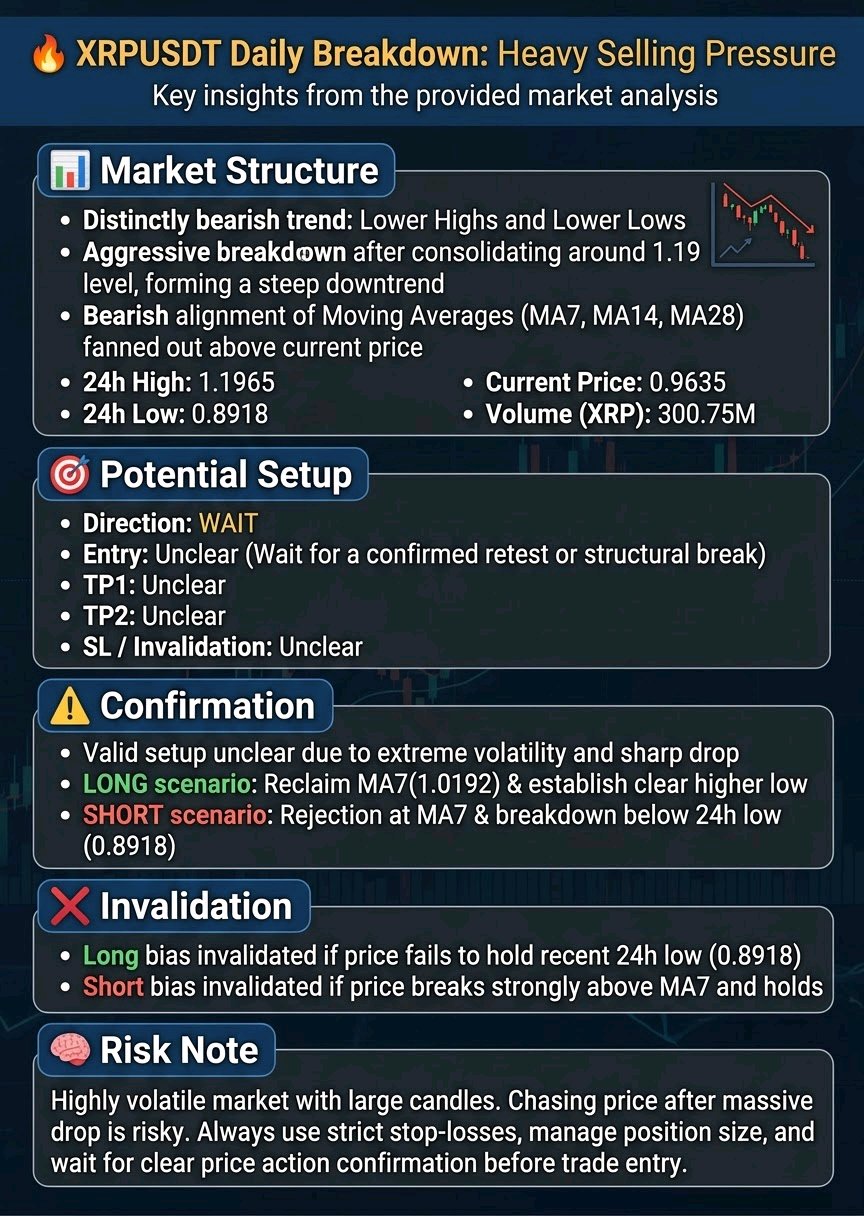
XRPUSDT Daily Breakdown: Heavy Selling Pressure
The $XRPUSDT daily chart shows a significant bearish structure, having fallen sharply from recent highs. Price is currently attempting to find a floor after a steep drop, printing a green candle near the 0.96 level. 📊 Market Structure: The overall trend is distinctly bearish, characterized by a series of lower highs and lower lows. After consolidating around the 1.19 level, the price broke down aggressively, forming a steep downtrend. The moving averages (MA7 at 1.0192, MA14 at 1.1161, MA28 at 1.2065) are fanned out in a bearish alignment above the current price, acting as dynamic resistance. The 24h low is visible at 0.8918, with the current price hovering around 0.9635. 🎯 Potential Setup: Direction: WAIT Entry: Unclear (Wait for a confirmed retest or structural break) TP1: Unclear TP2: Unclear SL / Invalidation: Unclear ⚠️ Confirmation: A valid setup is currently unclear due to the extreme volatility and the recent sharp drop. For a potential LONG scenario to be considered, the price would need to reclaim the MA7 (1.0192) and establish a clear higher low. For a SHORT scenario, a rejection at the MA7 followed by a breakdown below the 24h low (0.8918) would confirm trend continuation. ❌ Invalidation: Any long bias would be invalidated if the price fails to hold the recent 24h low of 0.8918 and continues to create new lows. A short bias would be invalidated if the price breaks strongly above the MA7 and holds that level. 🧠 Risk Note: The market is highly volatile with large candles. Chasing the price after such a massive drop is risky. Always use strict stop-losses, manage your position size, and wait for clear price action confirmation before entering a trade. #IMPACTbyTrade
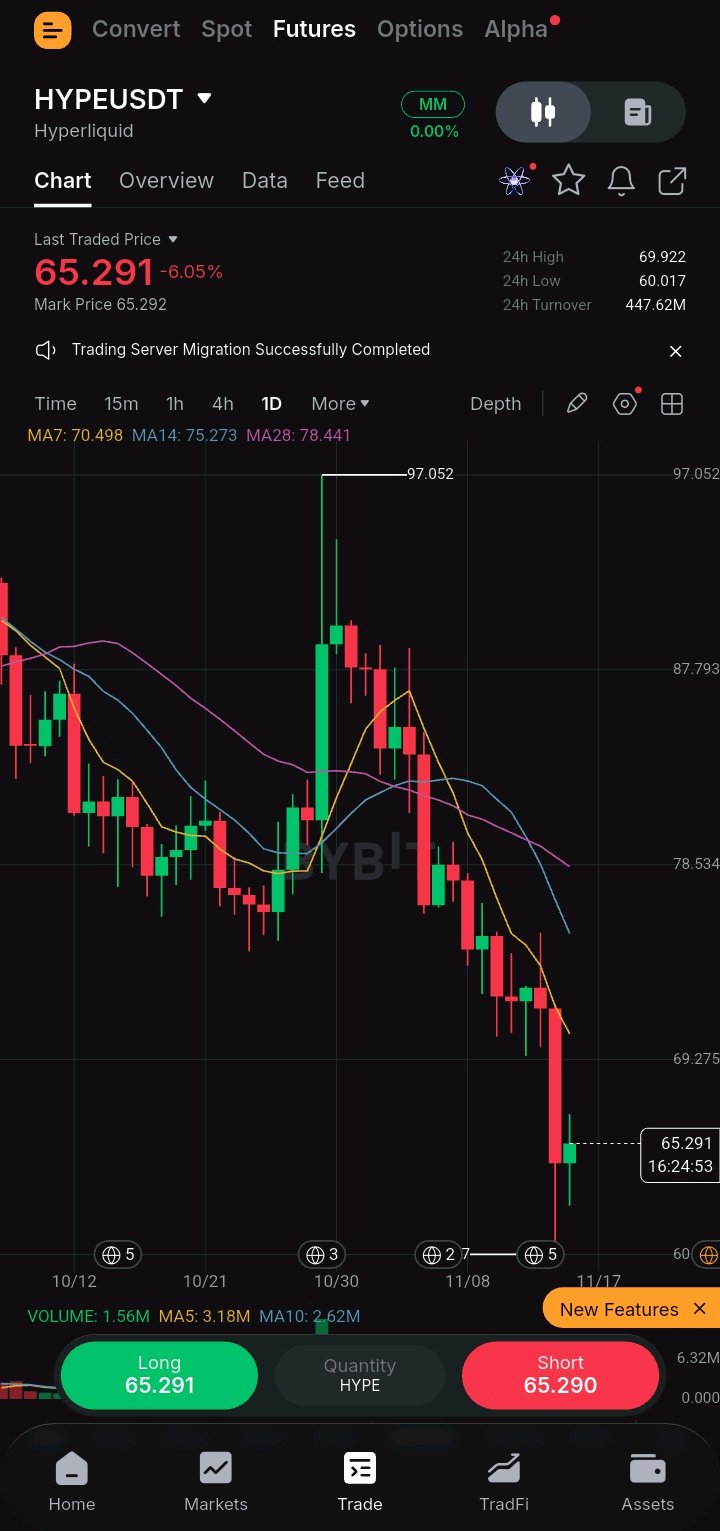
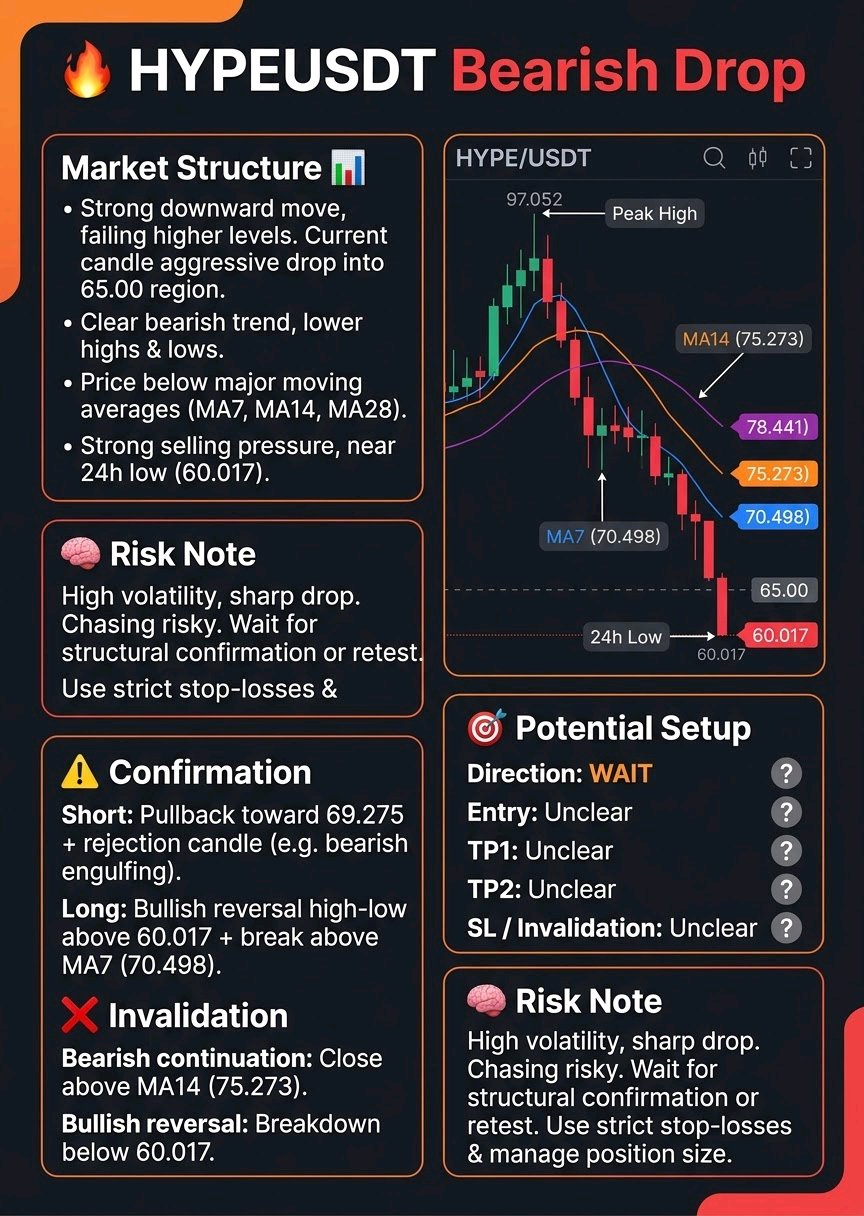
HYPEUSDT Bearish Drop
$HYPEUSDT The recent price action on HYPEUSDT shows a strong downward move after failing to hold higher levels, with the latest candle dropping aggressively into the 65.00 region. 📊 Market Structure: The chart displays a clear bearish trend on the current timeframe. After peaking at the visible high of 97.052, the price has formed a series of lower highs and lower lows, breaking below the moving averages (MA7 at 70.498, MA14 at 75.273, MA28 at 78.441). The current price is trading near the 24h low of 60.017, sitting significantly below all major moving averages, indicating strong selling pressure. 🎯 Potential Setup: Direction: WAIT Entry: Unclear TP1: Unclear TP2: Unclear SL / Invalidation: Unclear ⚠️ Confirmation: A clear confirmation for a short setup would require a minor pullback toward the 69.275 level followed by a rejection candle (like a bearish engulfing or a long upper wick) to show sellers are still defending that area. Alternatively, a long setup would need a strong bullish reversal candle forming a higher low above the 60.017 support, combined with a break back above the MA7 (70.498). ❌ Invalidation: For a bearish continuation, a strong daily close above the MA14 (75.273) would invalidate the immediate downtrend. For a bullish reversal, a breakdown below the 60.017 level would invalidate any short-term long thesis. 🧠 Risk Note: The current price action is highly volatile with a sharp drop. Chasing the price here is risky; waiting for a clear structural confirmation or a retest of key levels is crucial. Always use strict stop-losses and manage your position size carefully, as the market is moving fast. #IMPACTbyTrade
🔥 AVAX Faces Strong Bearish Pressure
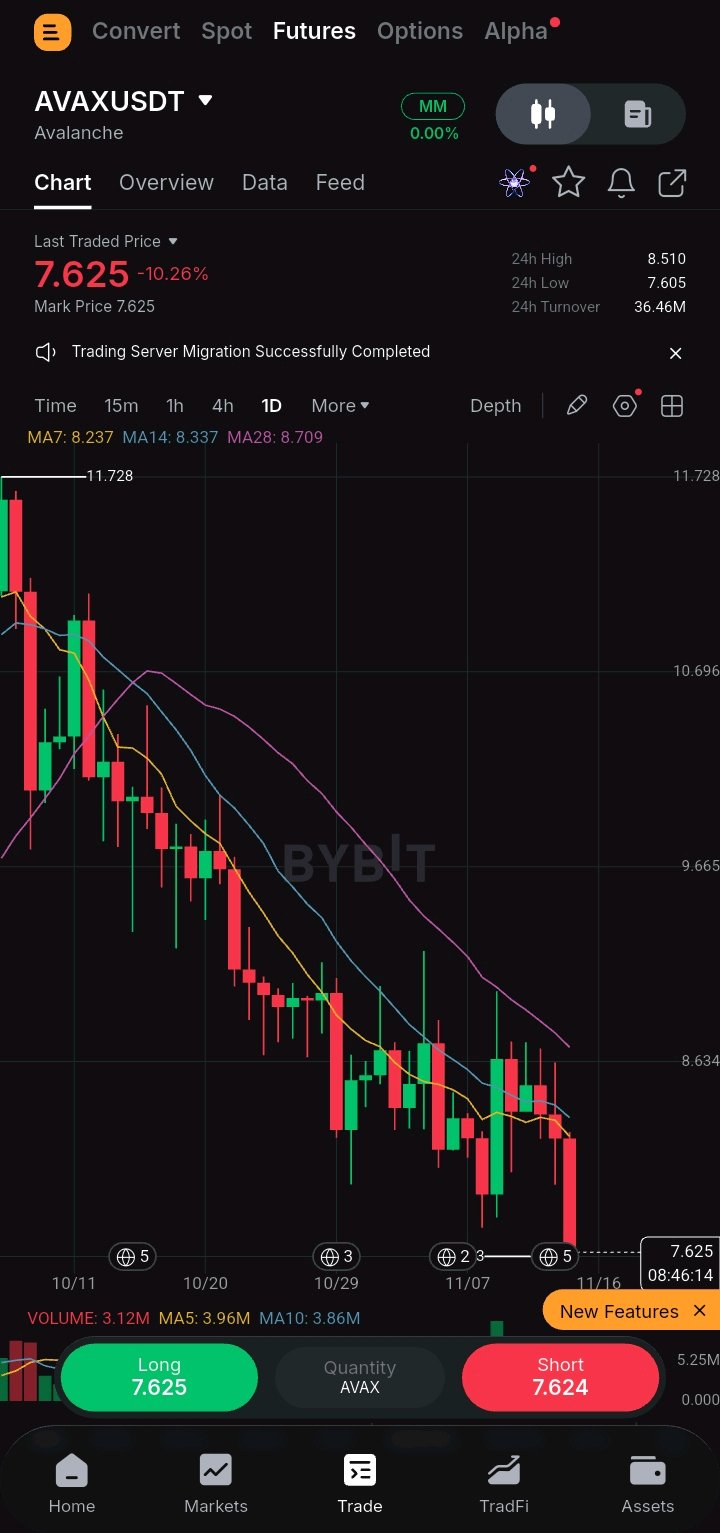
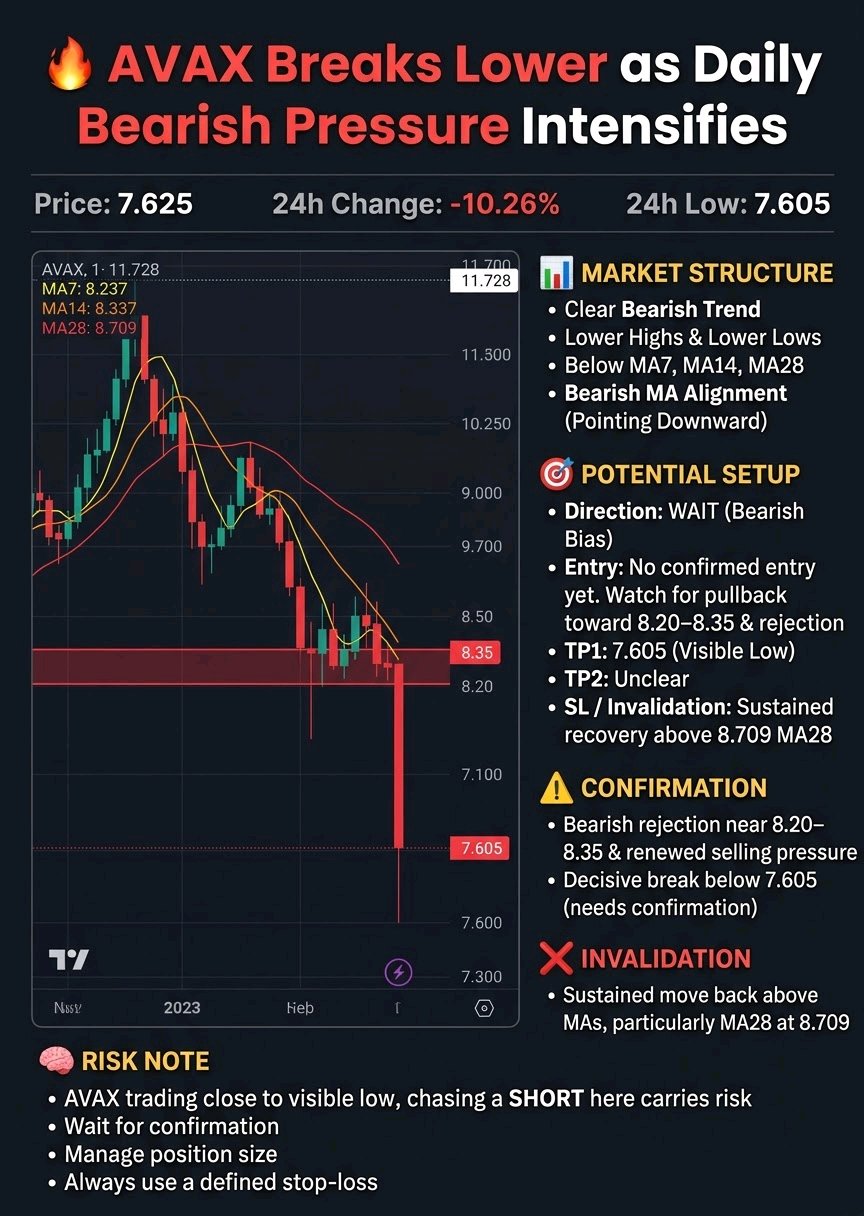
$AVAXUSDT is showing renewed selling pressure, with price dropping to 7.625 after a sharp 10.26% decline. The latest daily candle highlights strong bearish momentum, pushing price close to its visible 24-hour low of 7.605. 📊 Market Structure: The 1D chart shows a clear bearish trend, with consistent lower highs and lower lows from the previous high near 11.728. Price is trading below all three moving averages: * MA7: 8.237 * MA14: 8.337 * MA28: 8.709 The moving averages are aligned bearishly and continue pointing downward. The 8.20–8.35 area represents potential dynamic resistance, while 7.605 is the immediate visible support. 🎯 Potential Setup: Direction: WAIT (Bearish Bias) Entry: No confirmed entry yet. Watch for a pullback toward 8.20–8.35 and possible rejection. TP1: 7.605 (visible low) TP2: Unclear SL / Invalidation: A sustained recovery above the 8.709 MA28 would weaken the bearish setup. ⚠️ Confirmation: A bearish rejection around the 8.20–8.35 zone, followed by renewed selling pressure, could provide confirmation for a SHORT opportunity. A decisive break below 7.605 would also need confirmation. ❌ Invalidation: A sustained move back above the moving averages, particularly MA28 at 8.709, would challenge the current bearish outlook. 🧠 Risk Note: AVAX is already trading close to its visible low, so chasing a SHORT here carries risk. Wait for confirmation, manage position size and always use a defined stop-loss. #IMPACTbyTrade

NEAR/USDT: Sellers Remain in Control
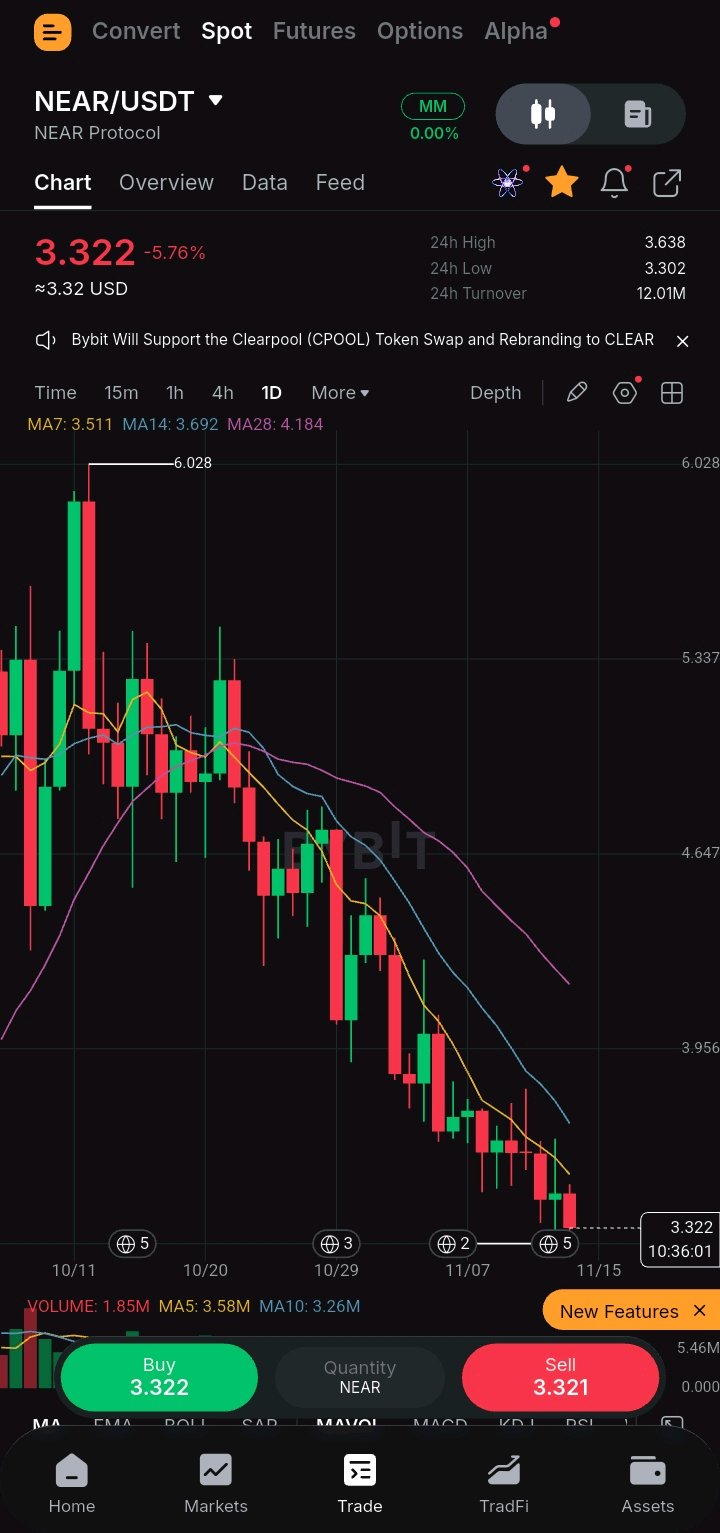
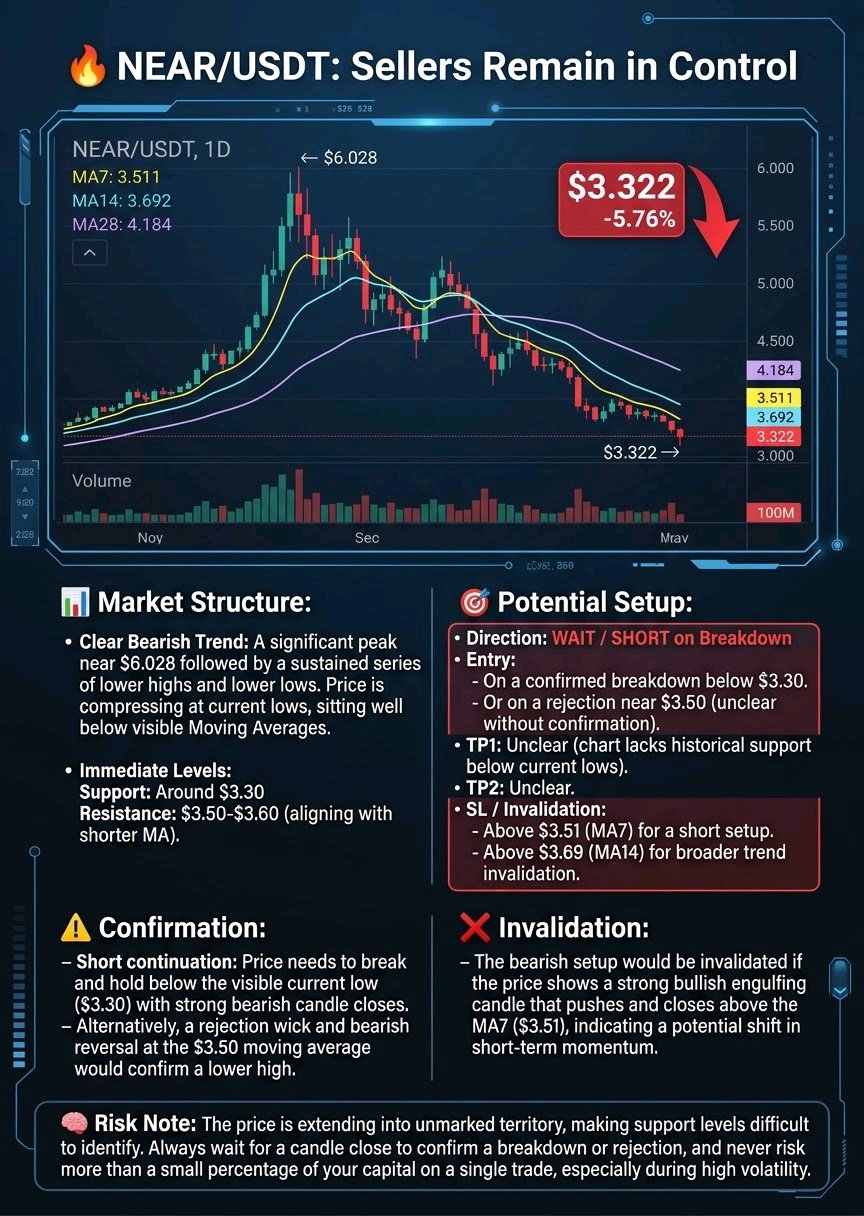
$NEARUSDT is currently trading at $3.322, down 5.76% on the day, with price action showing a steady continuation of the prevailing downtrend. 📊 Market Structure: The chart displays a clear bearish trend, having formed a significant peak near $6.028 before entering a sustained series of lower highs and lower lows. The price is currently compressing at the lows of this structure, sitting well below the visible moving averages (MA7: 3.511, MA14: 3.692, MA28: 4.184). Immediate visible support is holding around the current price near $3.30, while immediate resistance is found at the $3.50-$3.60 area, aligning with the shorter moving average. 🎯 Potential Setup: Direction: WAIT / SHORT on breakdown Entry: On a confirmed breakdown below $3.30, or on a rejection near $3.50 (unclear without further confirmation). TP1: Unclear (chart lacks historical support below current lows). TP2: Unclear. SL / Invalidation: Above $3.51 (MA7) for a short setup, or above $3.69 (MA14) for a broader trend invalidation. ⚠️ Confirmation: For a short continuation, the price needs to break and hold below the visible current low ($3.30) with strong bearish candle closes. Alternatively, a rejection wick and bearish reversal at the $3.50 moving average would confirm a lower high. ❌ Invalidation: The bearish setup would be invalidated if the price shows a strong bullish engulfing candle that pushes and closes above the MA7 ($3.51), indicating a potential shift in short-term momentum. 🧠 Risk Note: The price is extending into unmarked territory, making support levels difficult to identify. Always wait for a candle close to confirm a breakdown or rejection, and never risk more than a small percentage of your capital on a single trade, especially during high volatility. #IMPACTbyTrade
TRUMPUSDT Daily Downtrend Holds
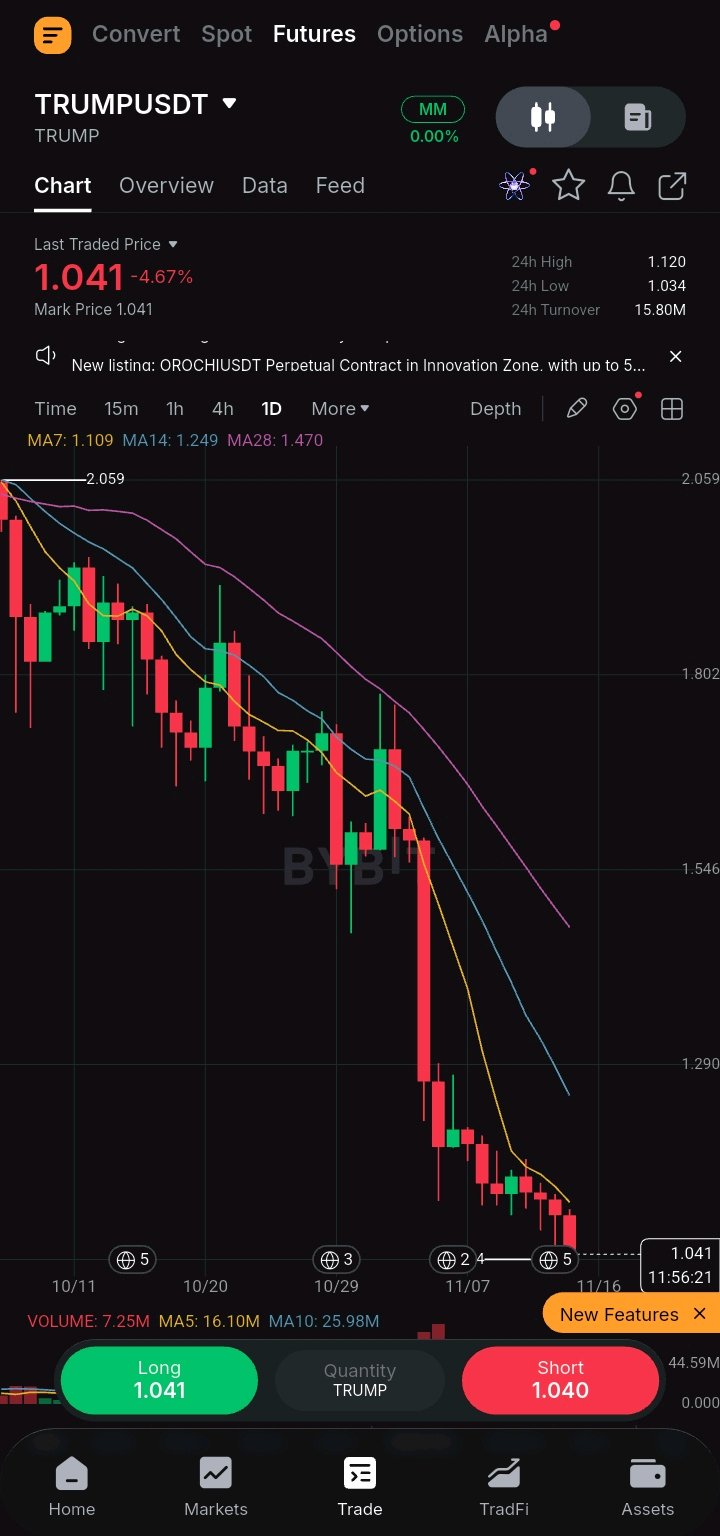
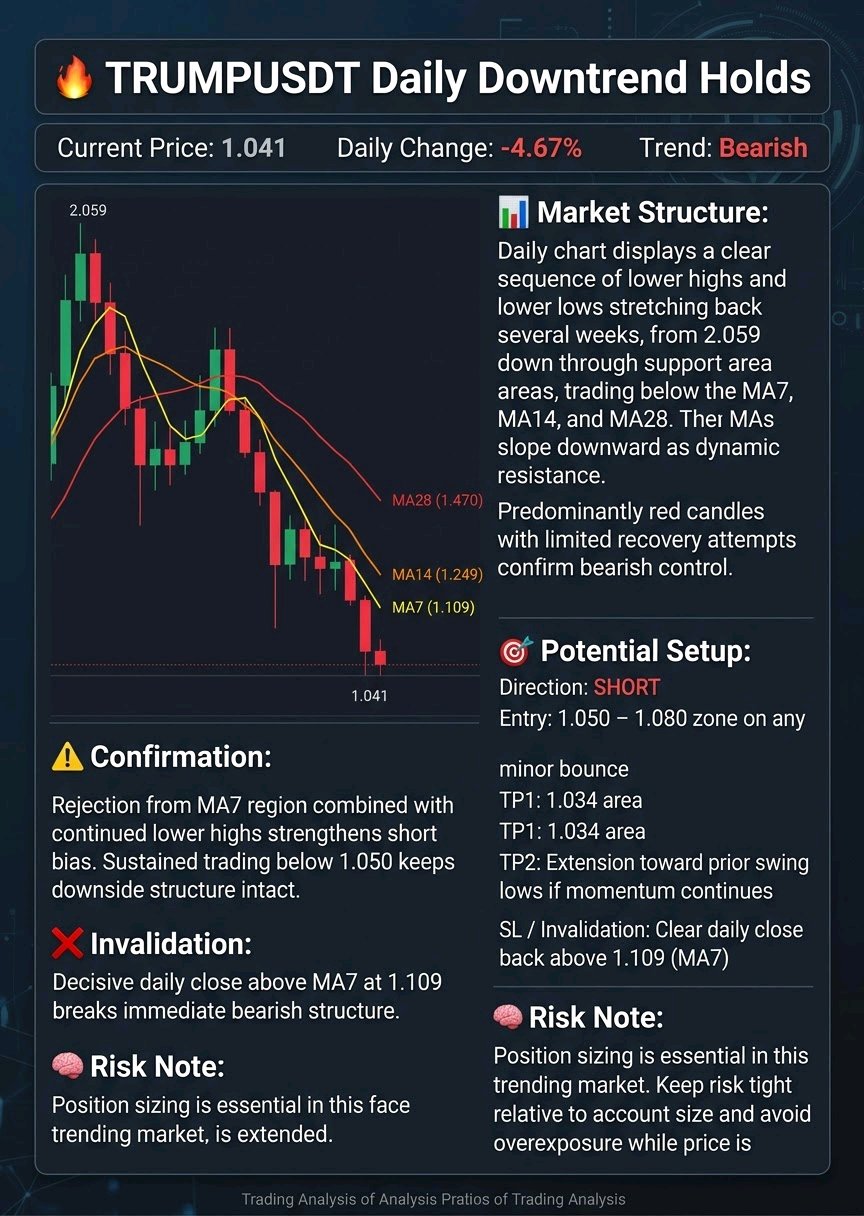
$TRUMPUSDT Price is currently sitting at 1.041 after another session of selling, down 4.67% on the day and trading just above the recent 24h low. 📊 Market Structure: The daily chart displays a clear sequence of lower highs and lower lows stretching back several weeks. Price has moved from the upper zone near 2.059 down through multiple support areas and is now trading well below the MA7 (1.109), MA14 (1.249) and MA28 (1.470). All three moving averages are sloping downward and acting as dynamic resistance. The most recent candles remain predominantly red with limited recovery attempts, confirming continued bearish control on this timeframe. 🎯 Potential Setup: Direction: SHORT Entry: 1.050 – 1.080 zone on any minor bounce TP1: 1.034 area TP2: Extension toward prior swing lows if momentum continues SL / Invalidation: Clear daily close back above 1.109 (MA7) ⚠️ Confirmation: A rejection from the MA7 region combined with continued lower highs would strengthen the short bias. Sustained trading below 1.050 keeps the downside structure intact. ❌ Invalidation: A decisive daily close above the MA7 at 1.109 would break the immediate bearish structure and force a re-evaluation of the trend. 🧠 Risk Note: Position sizing remains essential in a trending market like this. Keep risk tight relative to account size and avoid overexposure while price is extended. #IMPACTbyTrade

🔥 ENA/USDT: Sellers Remain in Control
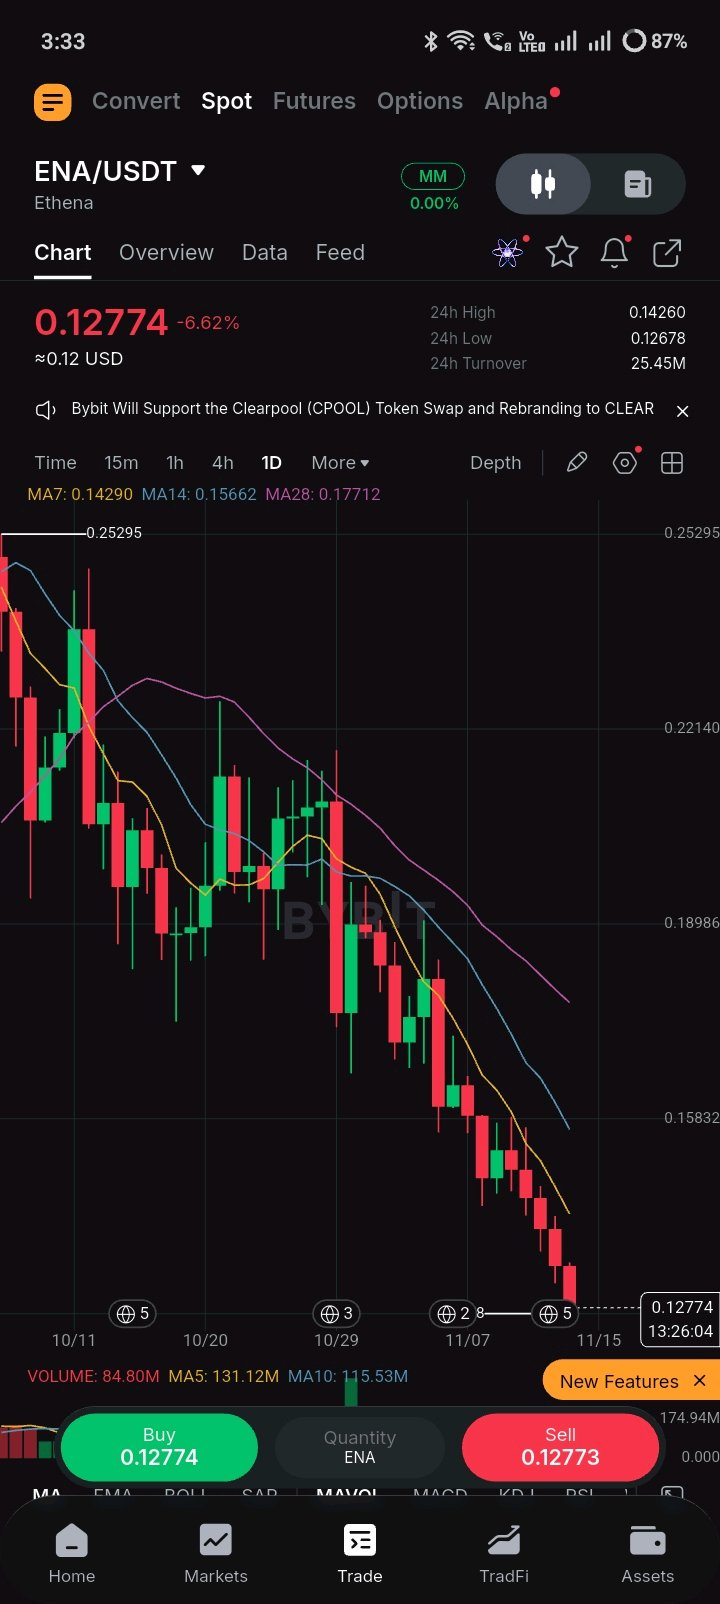
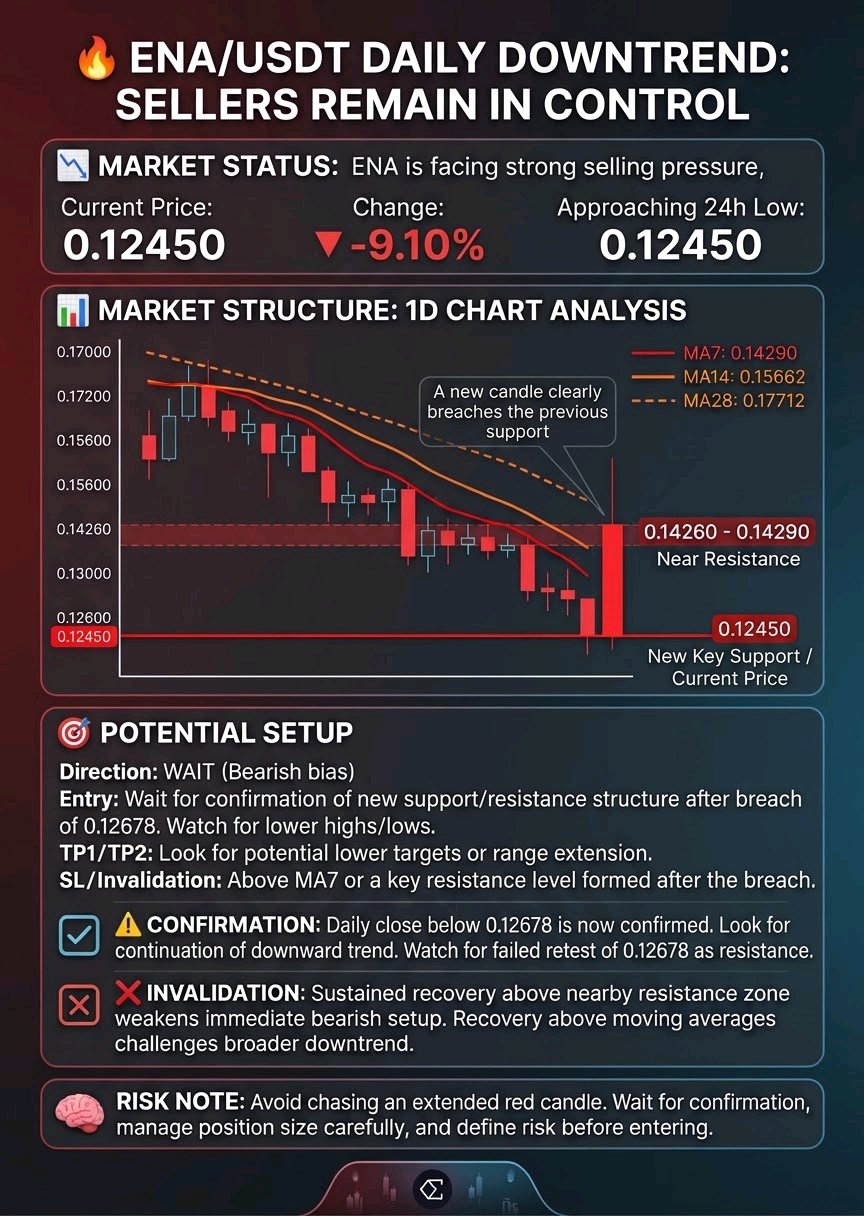
$ENAUSDT is facing strong selling pressure, currently trading at 0.12774, down 6.62%, and approaching its visible 24-hour low of 0.12678. The latest candles show continued bearish momentum with little evidence of a meaningful recovery. 📊 Market Structure: The 1D chart shows a clear sequence of lower highs and lower lows, confirming a sustained downtrend. Price is trading below all three visible moving averages: * MA7: 0.14290 * MA14: 0.15662 * MA28: 0.17712 All three moving averages are sloping downward, reinforcing the bearish structure. Key Support: 0.12678 Near Resistance: 0.14260–0.14290 🎯 Potential Setup: Direction: WAIT (Bearish bias) Entry: No confirmed entry yet. Watch for a pullback and rejection near 0.14260–0.14290. TP1: Unclear from the visible chart. TP2: Unclear from the visible chart. SL / Invalidation: Unclear; requires a confirmed entry structure. ⚠️ Confirmation: A daily close below 0.12678 could indicate further bearish continuation. A failed retest of this level would provide additional confirmation. ❌ Invalidation: A sustained recovery above the nearby resistance zone could weaken the immediate bearish setup. A stronger recovery above the moving averages would challenge the broader downtrend. 🧠 Risk Note: Avoid chasing an extended red candle. Wait for confirmation, manage position size carefully, and always define risk before entering. #IMPACTbyTrade
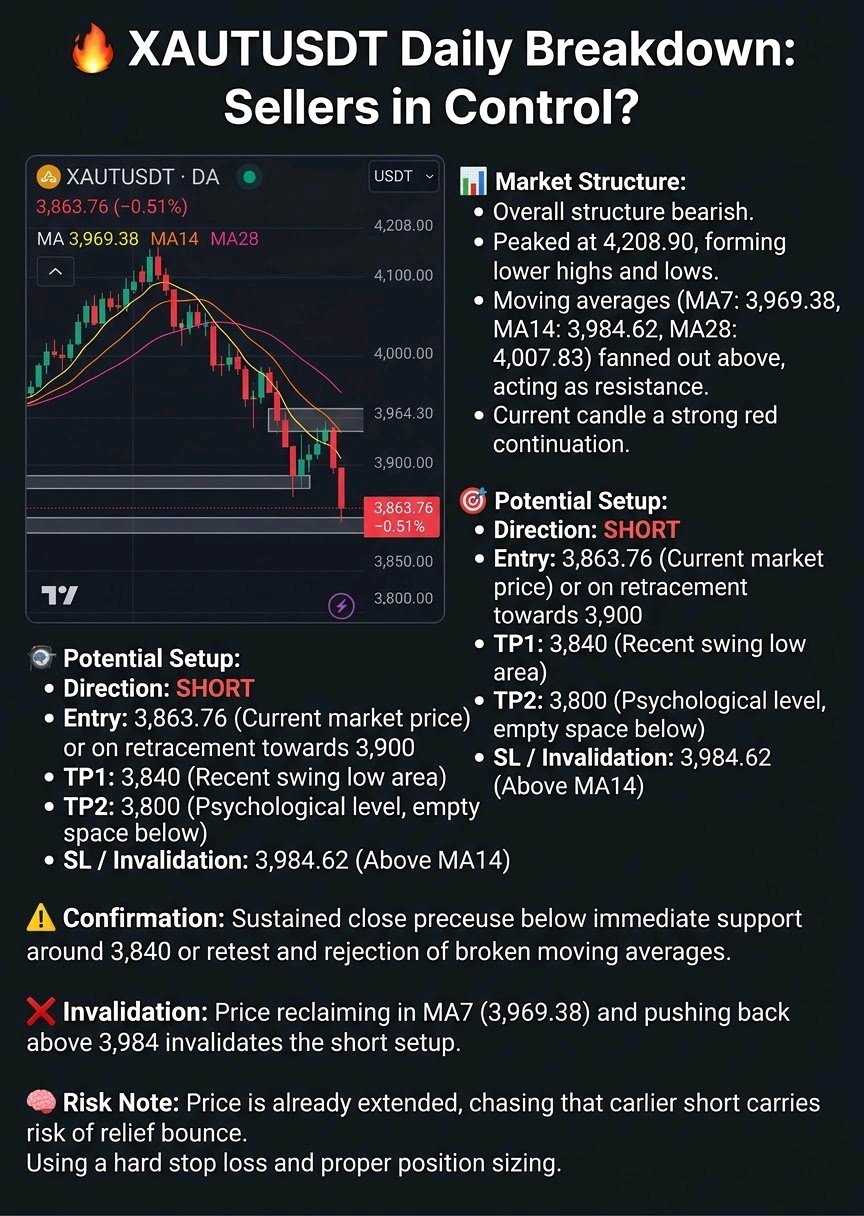
XAUTUSDT Daily Breakdown: Sellers in Control?
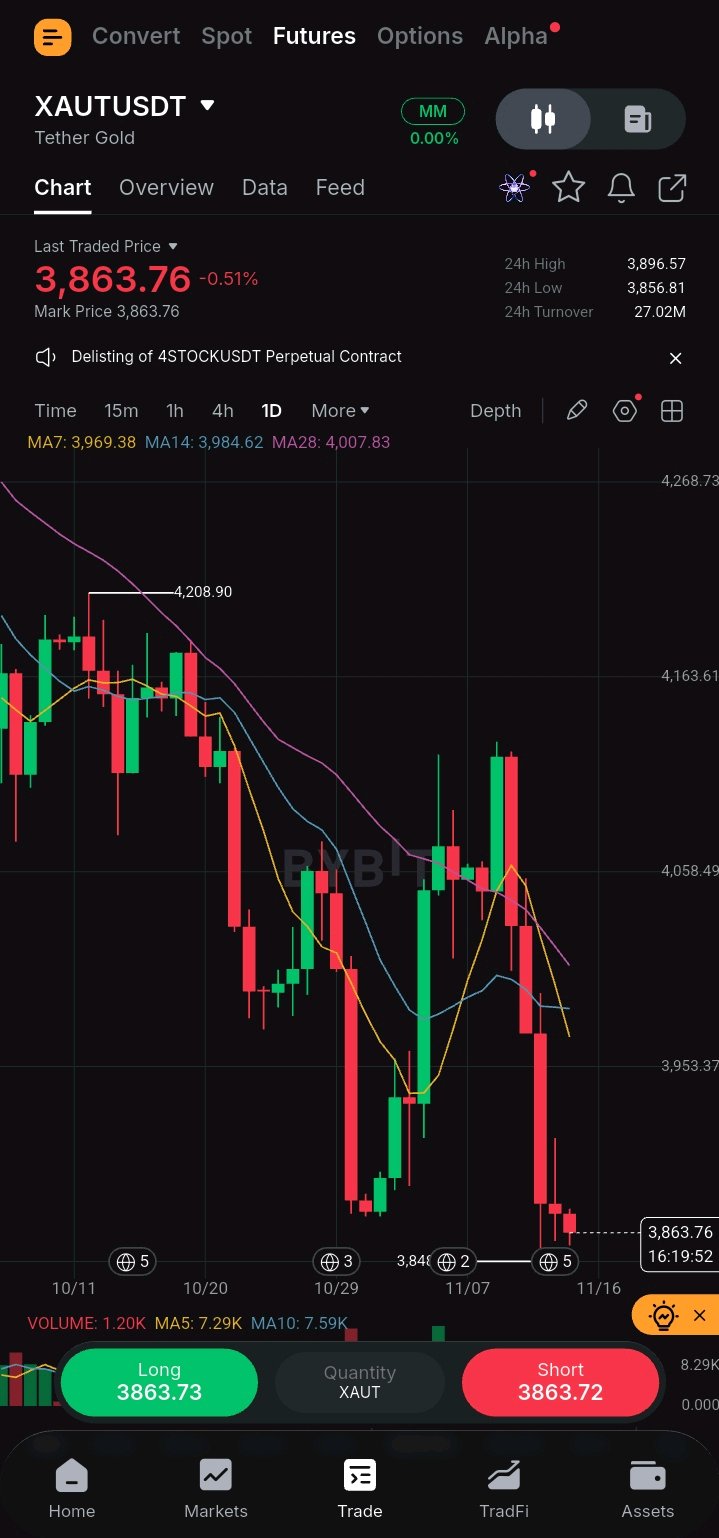
The $XAUTUSDT daily chart shows heavy selling pressure, with price currently trading at 3,863.76, down 0.51% and sitting well below the key moving averages. The recent price action has broken below previous consolidation zones. 📊 Market Structure: The overall structure is bearish. After peaking at 4,208.90, the price has formed a series of lower highs and lower lows. The moving averages (MA7: 3,969.38, MA14: 3,984.62, MA28: 4,007.83) are fanned out above the price, acting as dynamic resistance. The current daily candle is a strong red continuation candle, pushing towards recent lows. 🎯 Potential Setup: Direction: SHORT Entry: 3,863.76 (Current market price) or on a slight retracement toward 3,900 TP1: 3,840 (Visible recent swing low area on the chart) TP2: 3,800 (Psychological level, based on the chart's empty space below current lows) SL / Invalidation: 3,984.62 (Just above the MA14) ⚠️ Confirmation: A sustained close below the immediate support zone around 3,840, or a retest of the broken moving averages that gets rejected, would confirm the bearish momentum. ❌ Invalidation: If the price reclaims the MA7 (3,969.38) and pushes back above 3,984, the short setup is invalidated. 🧠 Risk Note: The price is already extended to the downside. Chasing the short here carries risk of a sudden relief bounce. Always use a hard stop loss and size your position to protect your capital. #IMPACTbyTrade

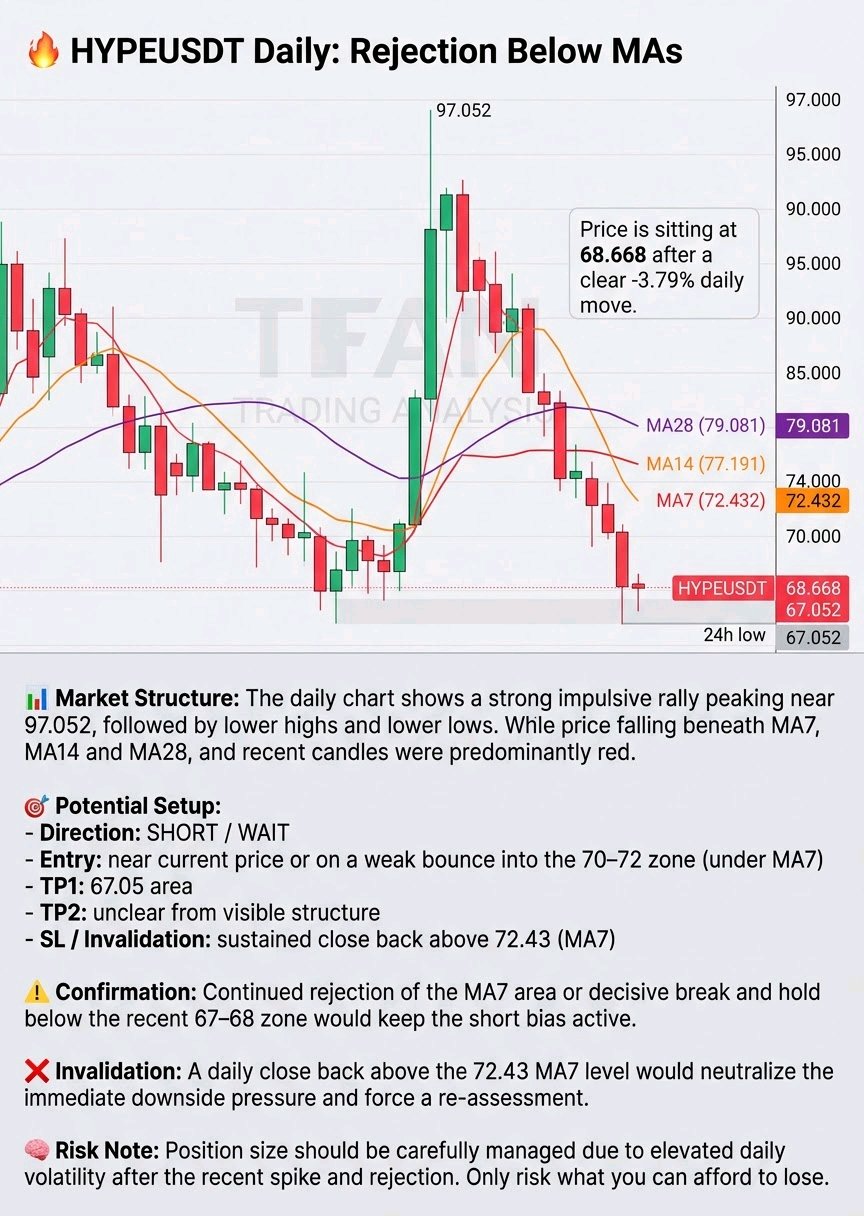
HYPEUSDT Daily: Rejection Below MAs
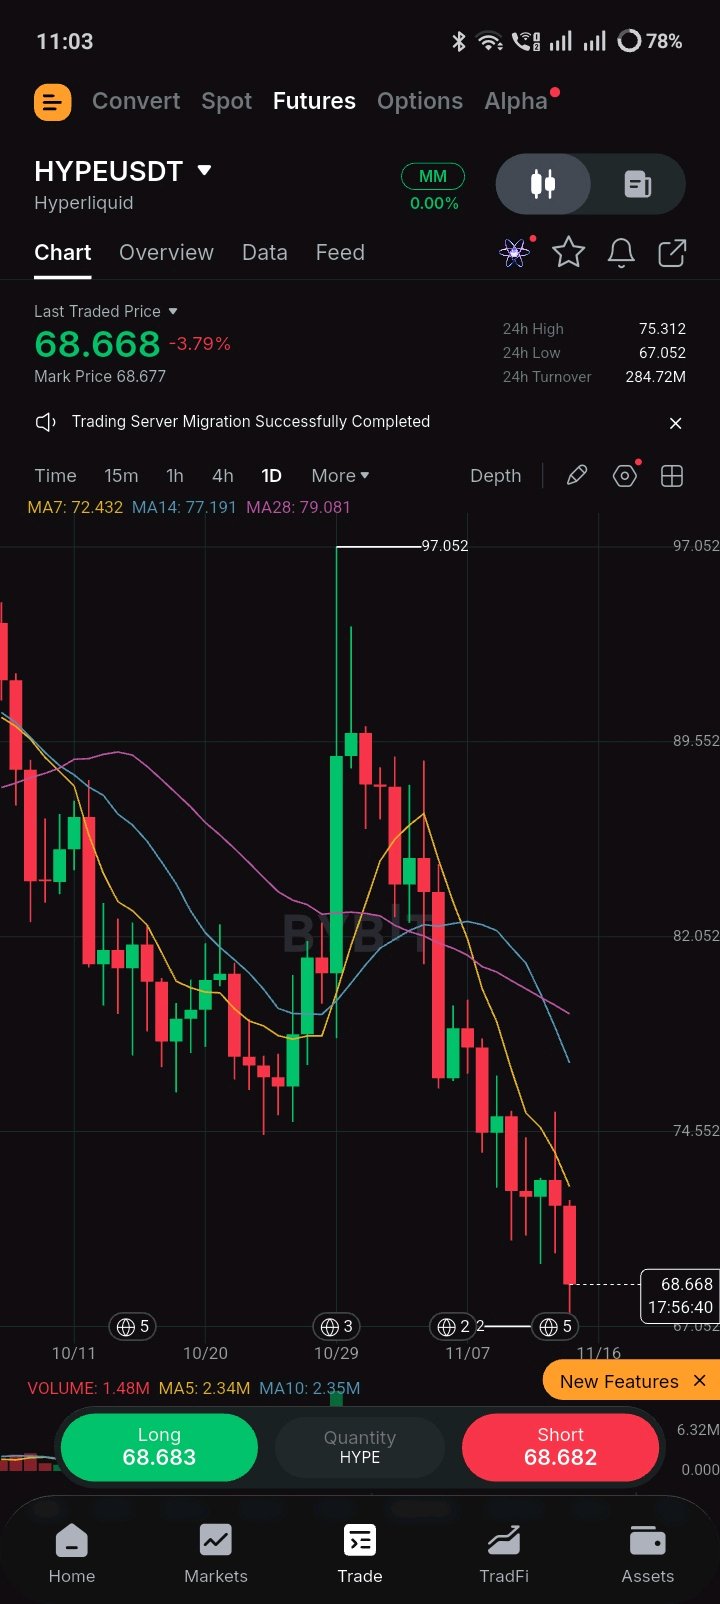
$HYPEUSDT Price is sitting at 68.668 after a clear -3.79% daily move, well below the three visible moving averages and continuing the pullback that started after the strong green spike toward 97. 📊 Market Structure: The daily chart shows a strong impulsive rally that peaked near 97.052, followed by a series of lower highs and lower lows. Price has now fallen beneath MA7 (72.432), MA14 (77.191) and MA28 (79.081). The most recent candles are predominantly red and the current level is close to the visible 24h low area around 67.052. 🎯 Potential Setup: Direction: SHORT / WAIT Entry: near current price or on a weak bounce into the 70–72 zone (under MA7) TP1: 67.05 area TP2: unclear from visible structure SL / Invalidation: sustained close back above 72.43 (MA7) ⚠️ Confirmation: Continued rejection of the MA7 area or a decisive break and hold below the recent 67–68 zone would keep the short bias active. ❌ Invalidation: A daily close back above the 72.43 MA7 level would neutralize the immediate downside pressure and force a re-assessment. 🧠 Risk Note: Position size carefully — daily volatility remains elevated after the recent spike and rejection. Only risk what you can afford to lose. #IMPACTbyTrade

PEPE Loses Short-Term Momentum After Rejection
The $PEPEUSDT 1D chart shows a sharp rejection from recent highs, with price currently sitting at 0.000004460. The asset is struggling to hold above key moving averages after a volatile trading session. 📊 Market Structure: The overall visible structure shows a recent push upward that faced heavy resistance near the 0.000005683 level, followed by a strong bearish daily candle. Price has now dropped below the MA7 (0.000004835) and MA14 (0.000004862), indicating short-term weakness. The MA28 is visible lower at 0.000004659, acting as the immediate support zone to watch. The current daily candle is attempting to stabilize, but the lower highs suggest a corrective phase. 🎯 Potential Setup: Direction: WAIT Entry: Unclear (Waiting for reaction at MA28 support) TP1: Unclear TP2: Unclear SL / Invalidation: Unclear ⚠️ Confirmation: A clear confirmation would be a daily candle close holding above the MA28 level (0.000004659) to show buyers are defending the trend, or a strong bounce off this zone. For a bearish continuation, a decisive close below the MA28 would confirm further downside. ❌ Invalidation: The setup is unclear until the current daily candle closes. A strong close back above the MA7 and MA14 would invalidate the short-term bearish momentum and suggest a return to the upside. 🧠 Risk Note: The chart shows high volatility with large wicks on both sides. Do not rush into a position; wait for a confirmed daily close before acting, and always manage your position size strictly given the current choppy conditions. #IMPACTbyTrade
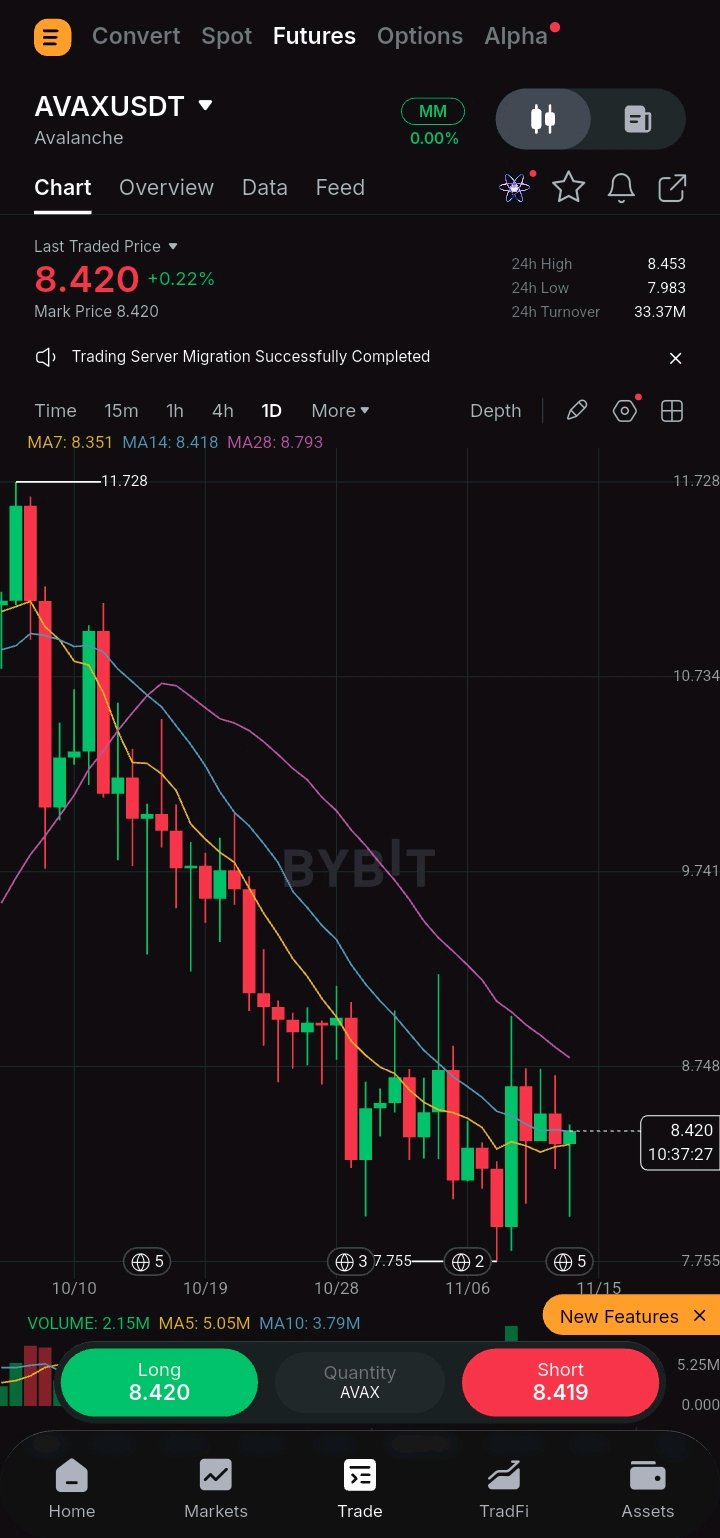
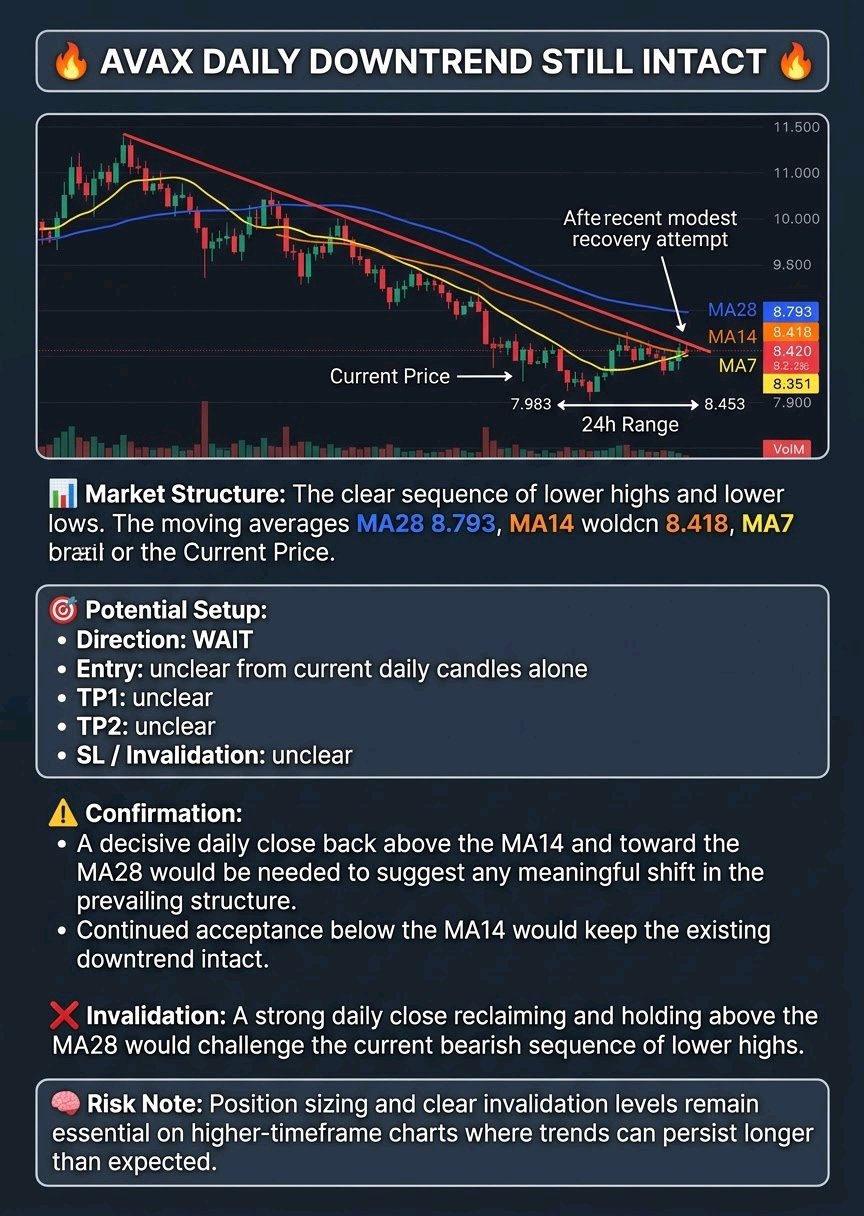
AVAX daily downtrend still intact
$AVAXUSDT is trading at 8.420 on the daily chart after a prolonged slide from the mid-11s, with the most recent candles showing a modest recovery attempt near the current levels. 📊 Market Structure: The chart displays a clear sequence of lower highs and lower lows from the left side of the screen through early November. Price sits below the MA28 at 8.793 while hovering around the MA14 at 8.418 and just above the MA7 at 8.351. The 24h range sits between 7.983 and 8.453, with volume markers visible along the lower edge. 🎯 Potential Setup: Direction: WAIT Entry: unclear from current daily candles alone TP1: unclear TP2: unclear SL / Invalidation: unclear ⚠️ Confirmation: A decisive daily close back above the MA14 and toward the MA28 would be needed to suggest any meaningful shift in the prevailing structure. Continued acceptance below the MA14 would keep the existing downtrend intact. ❌ Invalidation: A strong daily close reclaiming and holding above the MA28 would challenge the current bearish sequence of lower highs. 🧠 Risk Note: Position sizing and clear invalidation levels remain essential on higher-timeframe charts where trends can persist longer than expected. #IMPACTbyTrade

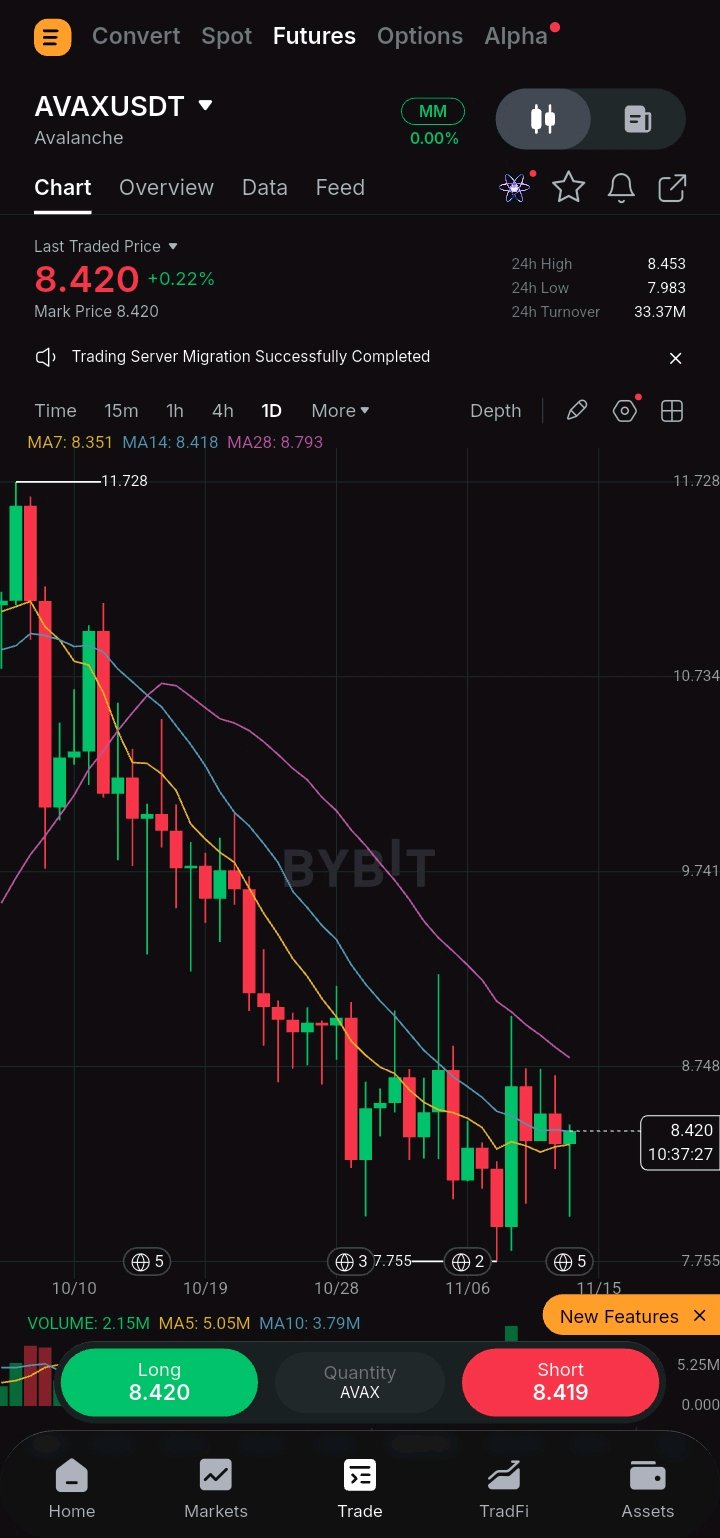
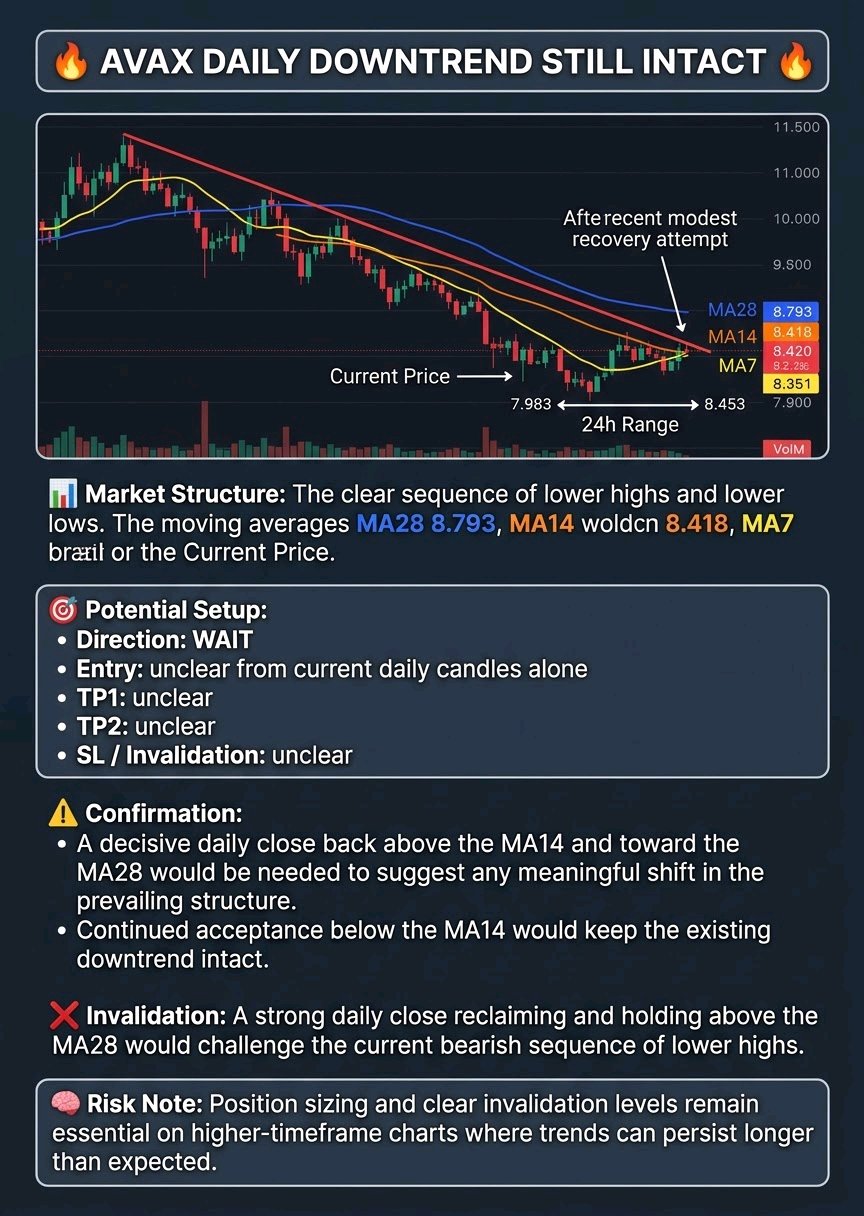
🔥 NEAR: Bearish Structure Persists
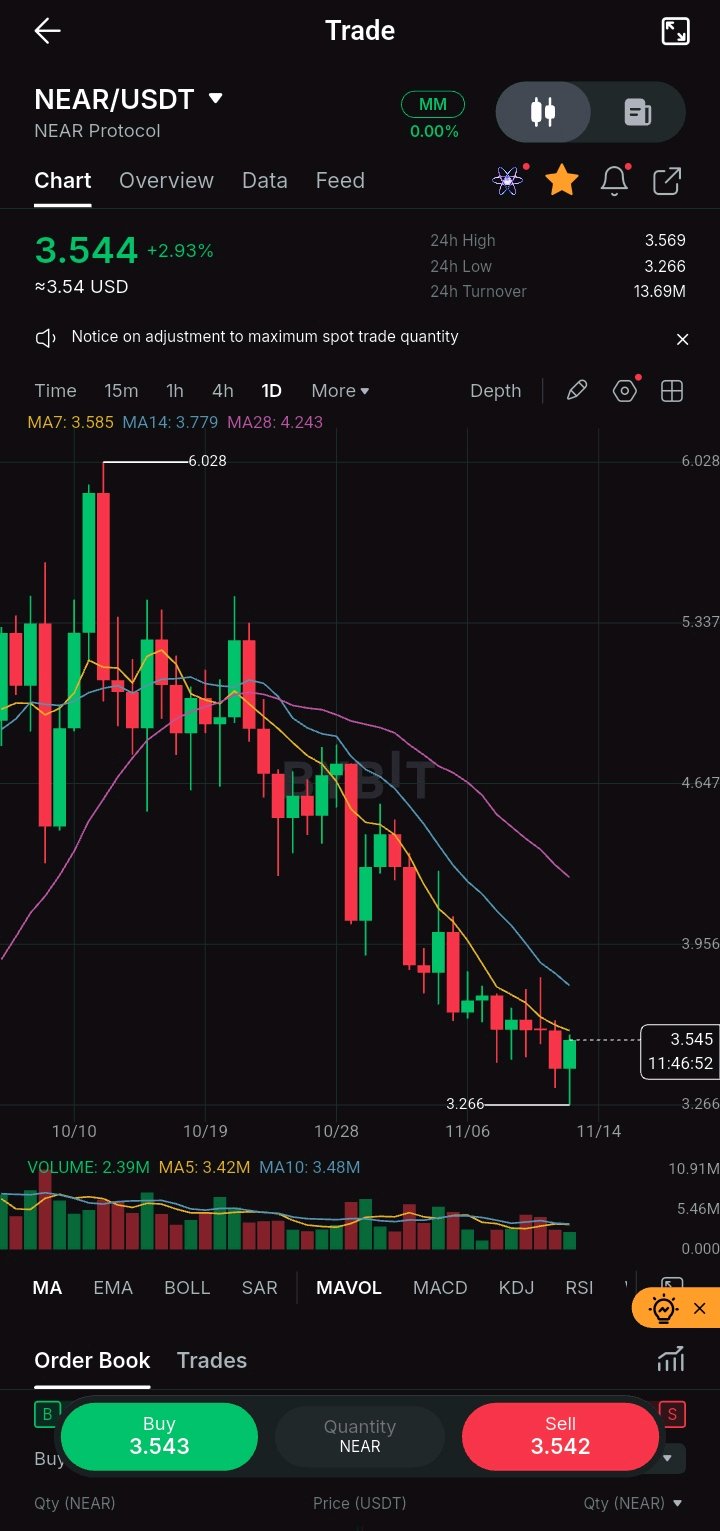
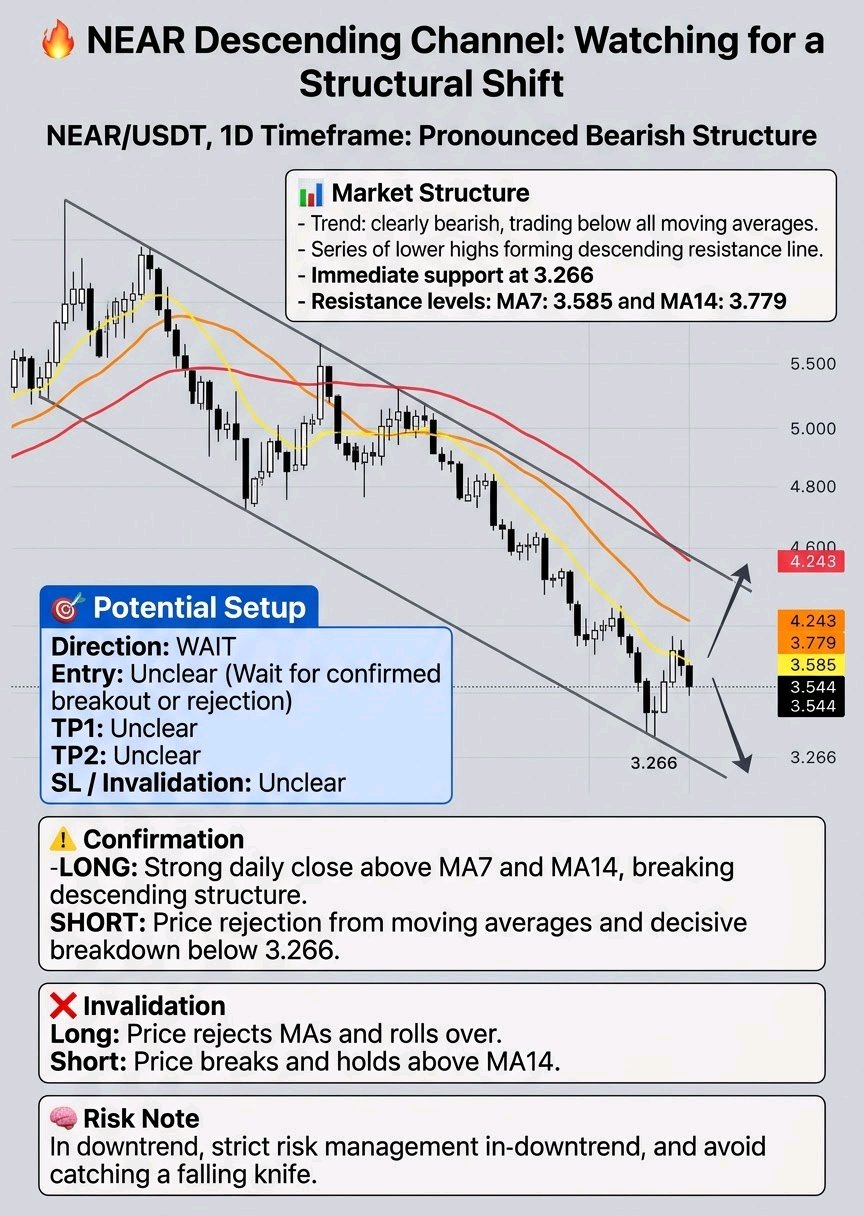
$NEARUSDT chart on the 1D timeframe reveals a pronounced bearish structure, with the price consistently printing lower highs and lower lows since the peak at 6.028. The recent price action shows a steady decline, culminating in a local low of 3.266 before a slight bounce to the current level of 3.544. 📊 Market Structure: The overarching trend is clearly bearish, with the price trading well below the visible moving averages (MA7 at 3.585, MA14 at 3.779, and MA28 at 4.243). The market has formed a series of lower highs, creating a visible descending resistance line. The immediate visible support rests at the recent swing low of 3.266. On the upside, immediate resistance is found at the MA7 level (3.585), followed by the MA14 (3.779) and the previous structural highs. 🎯 Potential Setup: Direction: WAIT Entry: Unclear (Wait for a confirmed breakout or rejection) TP1: Unclear TP2: Unclear SL / Invalidation: Unclear ⚠️ Confirmation: Given the current price action, a confirmed setup is not yet present. A valid LONG scenario would require a strong daily close above the MA7 and MA14, ideally breaking the descending resistance structure to confirm a shift in momentum. Conversely, a SHORT scenario would need to see the price reject the moving averages and break down decisively below the 3.266 support level to continue the bearish trend. ❌ Invalidation: For a potential long, the setup is invalidated if the price rejects the moving averages and rolls over. For a potential short, the idea is invalidated if the price breaks and holds above the MA14, signaling a potential trend reversal. 🧠 Risk Note: Trading in a strong downtrend requires strict risk management. Avoid catching a falling knife before a clear reversal pattern is confirmed. Always use a stop-loss and manage your position size according to your risk tolerance. #IMPACTbyTrade
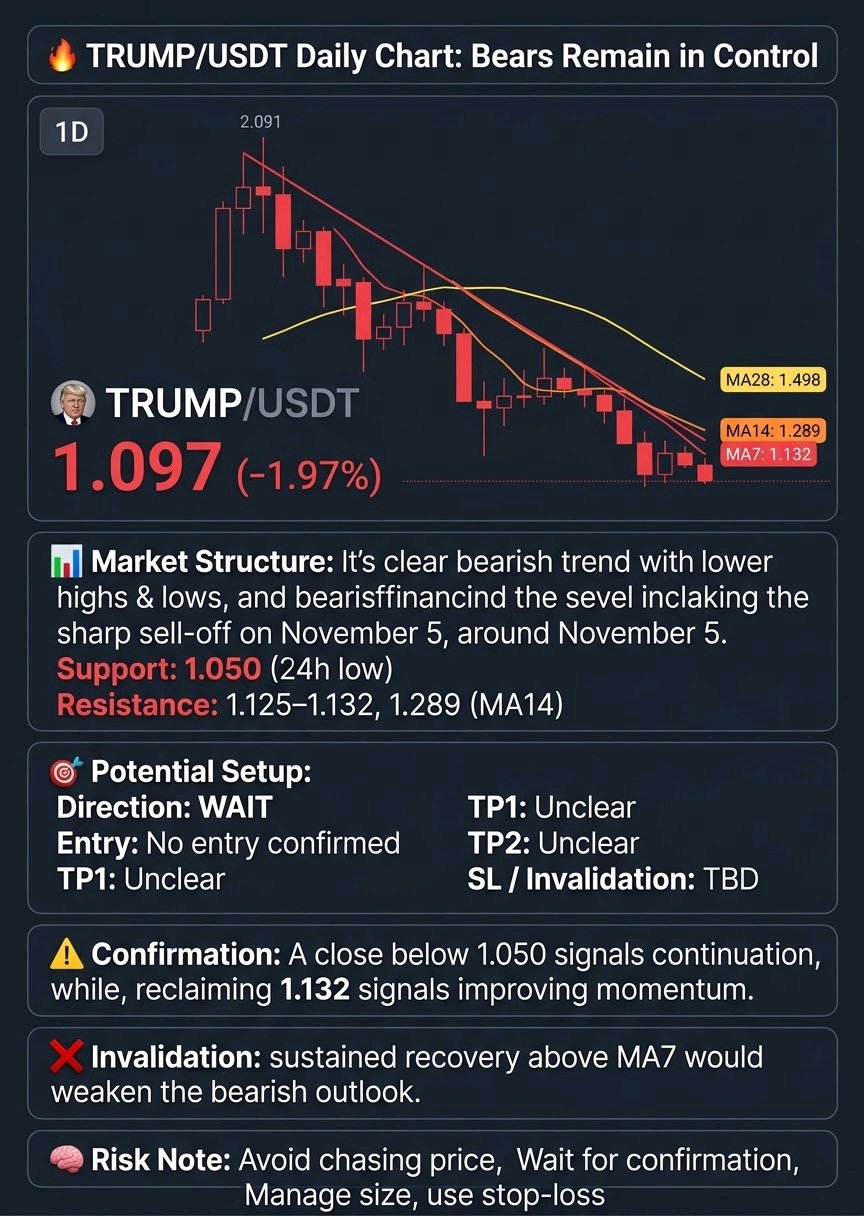
TRUMP/USDT Daily Chart: Bears Remain in Control
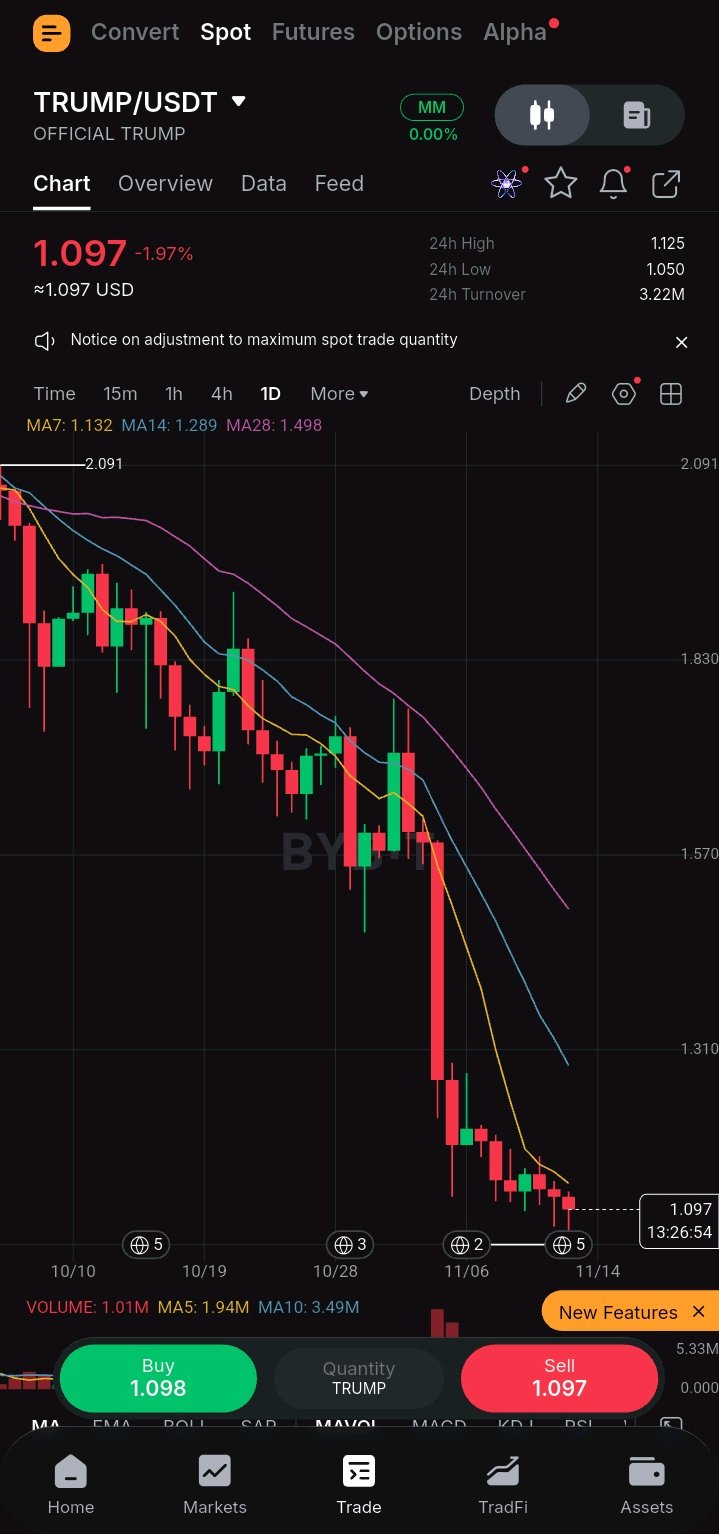
$TRUMPUSDT is struggling to find buying strength, currently trading at 1.097 after a 1.97% decline. Sellers continue to dominate the daily chart, keeping price under pressure near its recent lows. 📊 Market Structure: The 1D chart shows a clear bearish trend, with consistent lower highs and lower lows from the visible peak around 2.091. A sharp sell-off near November 5 accelerated the decline, followed by weak recovery attempts. All three visible moving averages remain above price: * MA7: 1.132 * MA14: 1.289 * MA28: 1.498 Support: 1.050 (visible 24h low). Resistance: 1.125–1.132, followed by the MA14 around 1.289. 🎯 Potential Setup: Direction: WAIT Entry: No confirmed entry yet. TP1: Unclear. TP2: Unclear. SL / Invalidation: To be determined after a confirmed setup. ⚠️ Confirmation: A decisive daily close below 1.050 could signal further bearish continuation. Alternatively, reclaiming 1.132 would be an early sign of improving short-term momentum. ❌ Invalidation: A sustained recovery above the MA7, followed by stronger price action, would weaken the immediate bearish outlook. 🧠 Risk Note: Avoid chasing price after an extended decline. Wait for confirmation, manage position size carefully and always use a suitable stop-loss. #IMPACTbyTrade

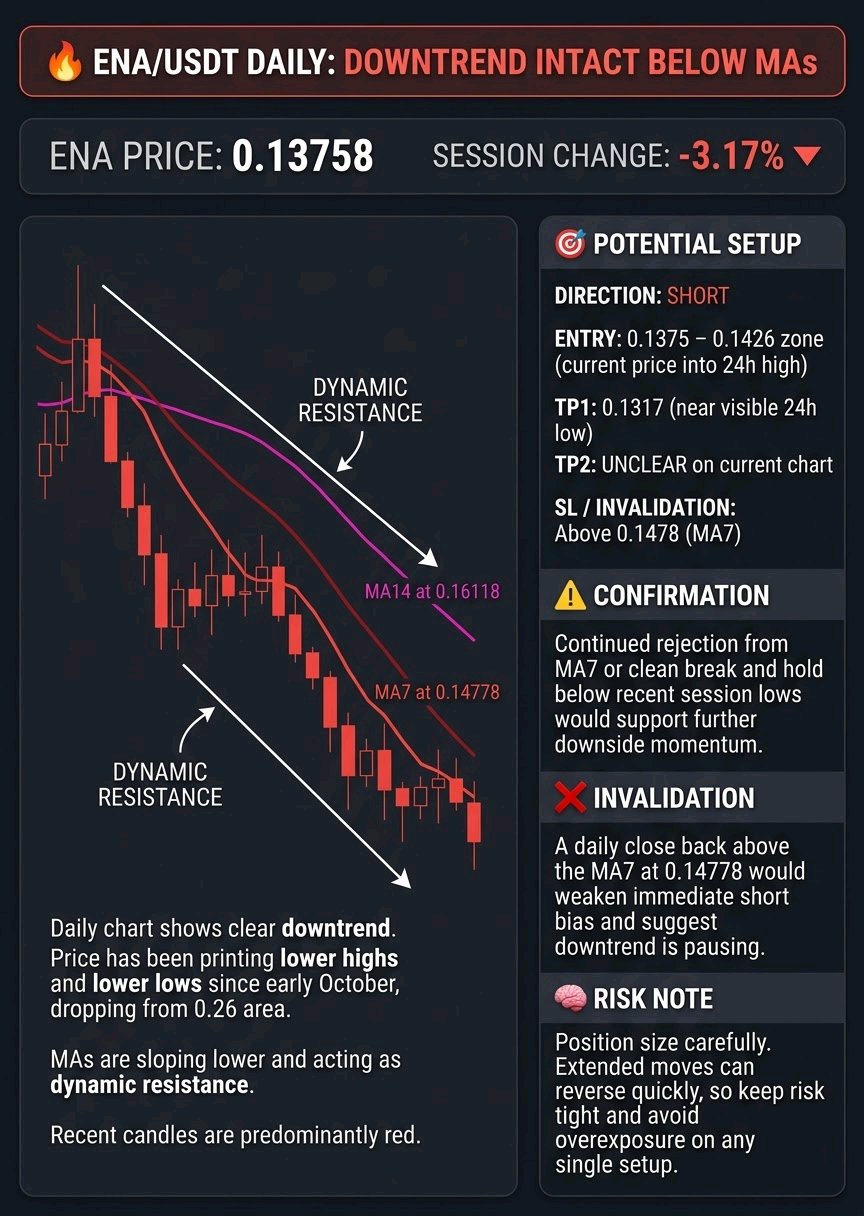
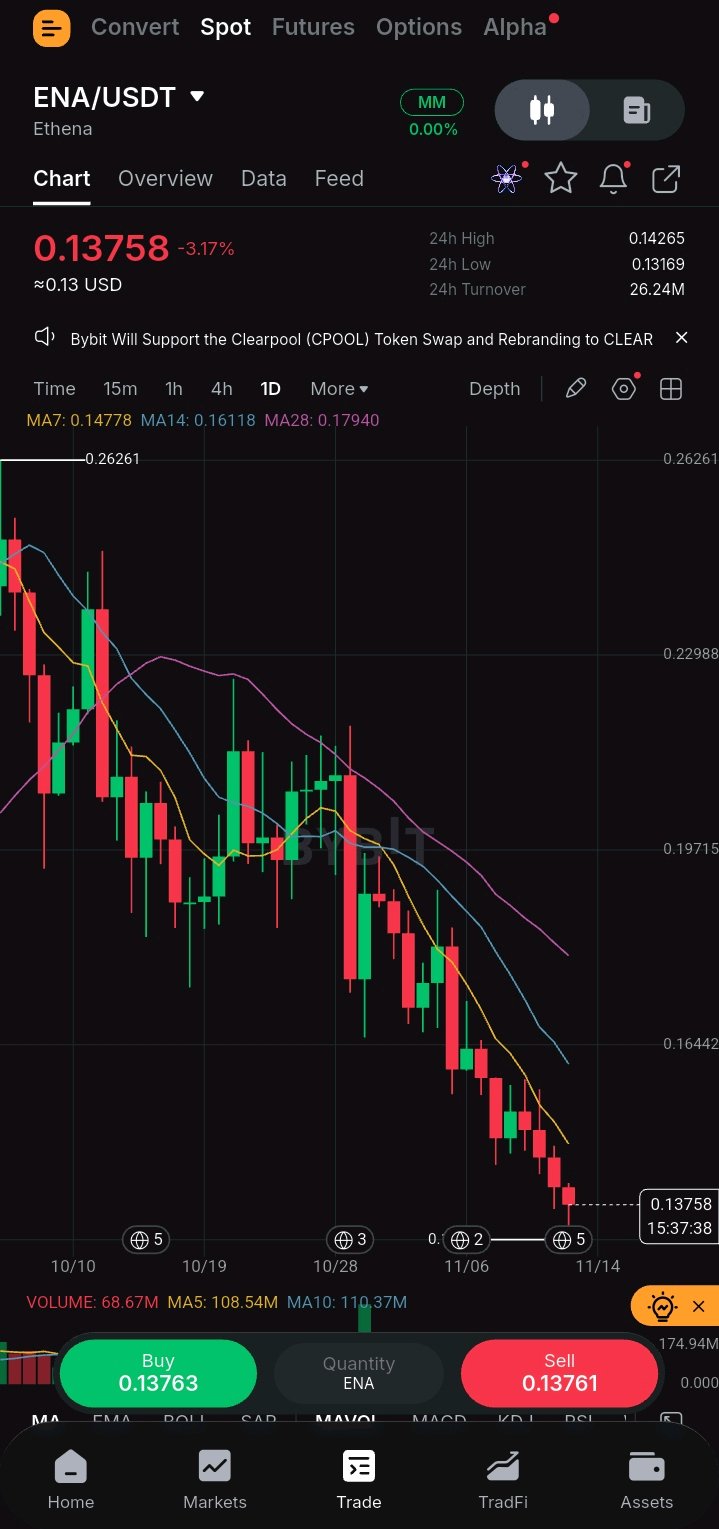
ENA/USDT Daily: Downtrend Intact Below MAs
$ENAUSDT is sitting at 0.13758 after another session of selling, down 3.17% on the day and still locked in the same downward path that has defined the chart for weeks. 📊 Market Structure: The daily chart shows a clear and persistent downtrend. Price has been printing lower highs and lower lows since early October, dropping from the 0.26 area toward the current levels. All three visible moving averages remain sloping lower (MA7 at 0.14778, MA14 at 0.16118, MA28 at 0.17940) and sit well above price, acting as dynamic resistance. Recent candles have stayed predominantly red with limited recovery attempts. 🎯 Potential Setup: Direction: SHORT Entry: 0.1375 – 0.1426 zone (current price into the 24h high) TP1: 0.1317 (near the visible 24h low) TP2: Unclear on the current chart SL / Invalidation: Above 0.1478 (MA7) ⚠️ Confirmation: Continued rejection from the MA7 or a clean break and hold below the recent session lows would support further downside momentum. ❌ Invalidation: A daily close back above the MA7 at 0.14778 would weaken the immediate short bias and suggest the downtrend is pausing. 🧠 Risk Note: Position size carefully. Extended moves can reverse quickly, so keep risk tight and avoid overexposure on any single setup. #IMPACTbyTrade

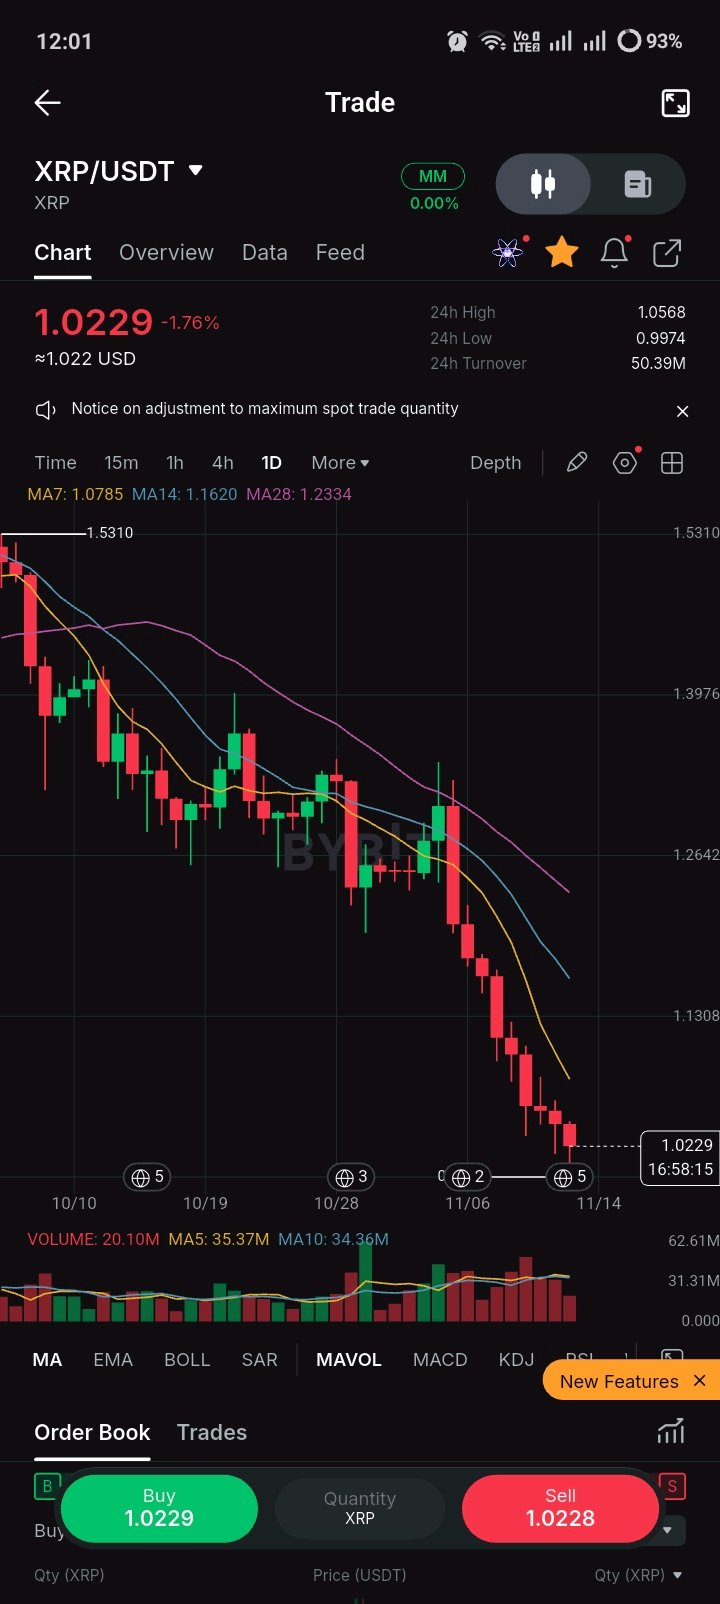
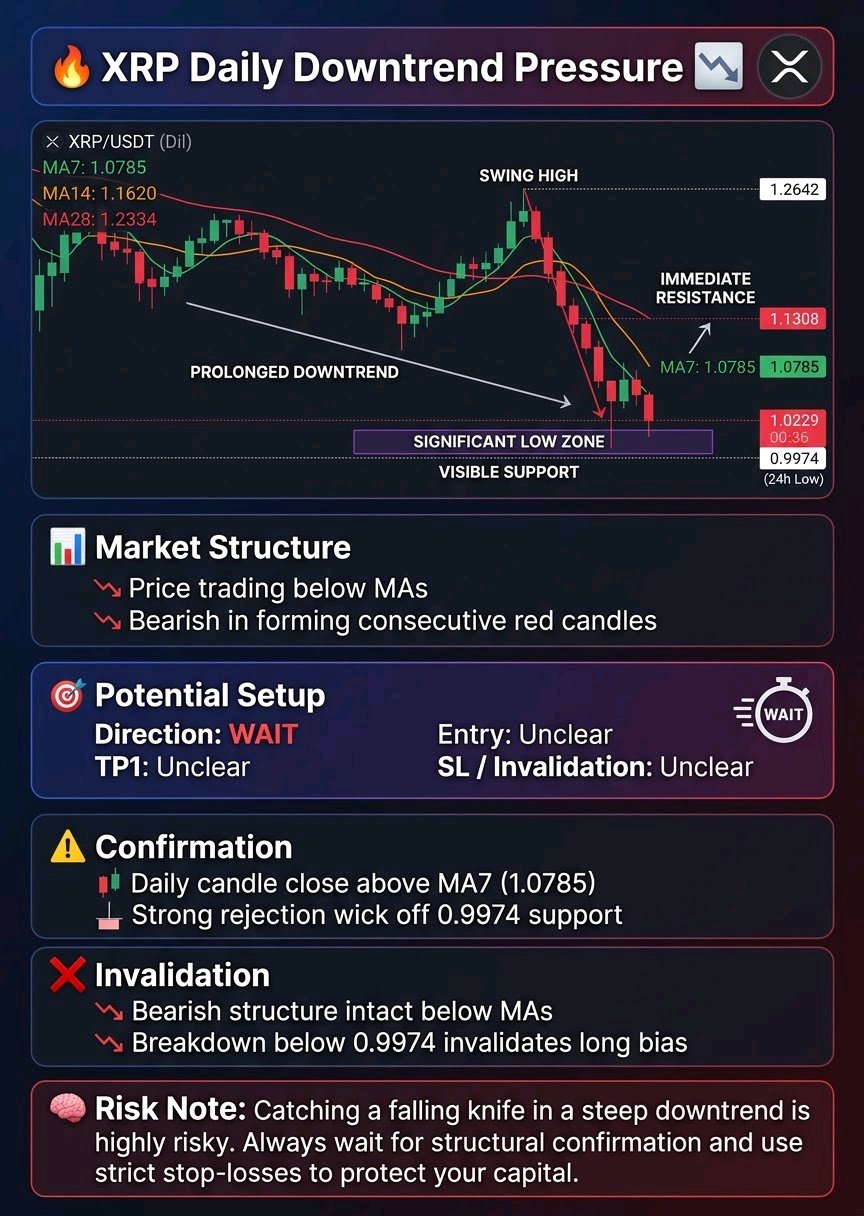
XRP Daily Downtrend Pressure
$XRPUSDT The daily chart for XRP/USDT shows a heavy bearish structure, with the current price sitting near 1.0229. The asset has experienced a prolonged downtrend, marked by consistent lower highs and lower lows, and is currently testing a significant low zone. 📊 Market Structure: The visible trend is clearly bearish, with the price trading well below the moving averages (MA7 at 1.0785, MA14 at 1.1620, and MA28 at 1.2334). The most recent price action shows a steep decline from the 1.2642 area down to the current 1.0229 level, forming consecutive red candles. Visible support is found at the current daily low of 0.9974, while immediate resistance aligns with the MA7 near 1.0785, followed by the recent swing high around 1.1308. 🎯 Potential Setup: Direction: WAIT Entry: Unclear due to high volatility and lack of reversal confirmation. TP1: Unclear TP2: Unclear SL / Invalidation: Unclear ⚠️ Confirmation: A confirmed setup would require a clear daily candle close above the immediate MA7 resistance (1.0785) or a strong rejection wick off the 0.9974 support level, indicating a potential shift in momentum. ❌ Invalidation: The bearish structure remains fully intact as long as the price continues to print lower highs below the short-term moving averages. A breakdown below the visible 24h Low of 0.9974 would invalidate any long bias and signal further downside. 🧠 Risk Note: Catching a falling knife in a steep downtrend is highly risky. Always wait for structural confirmation and use strict stop-losses to protect your capital. #IMPACTbyTrade
🔥 HYPE/USDT: Bearish Pressure Continues
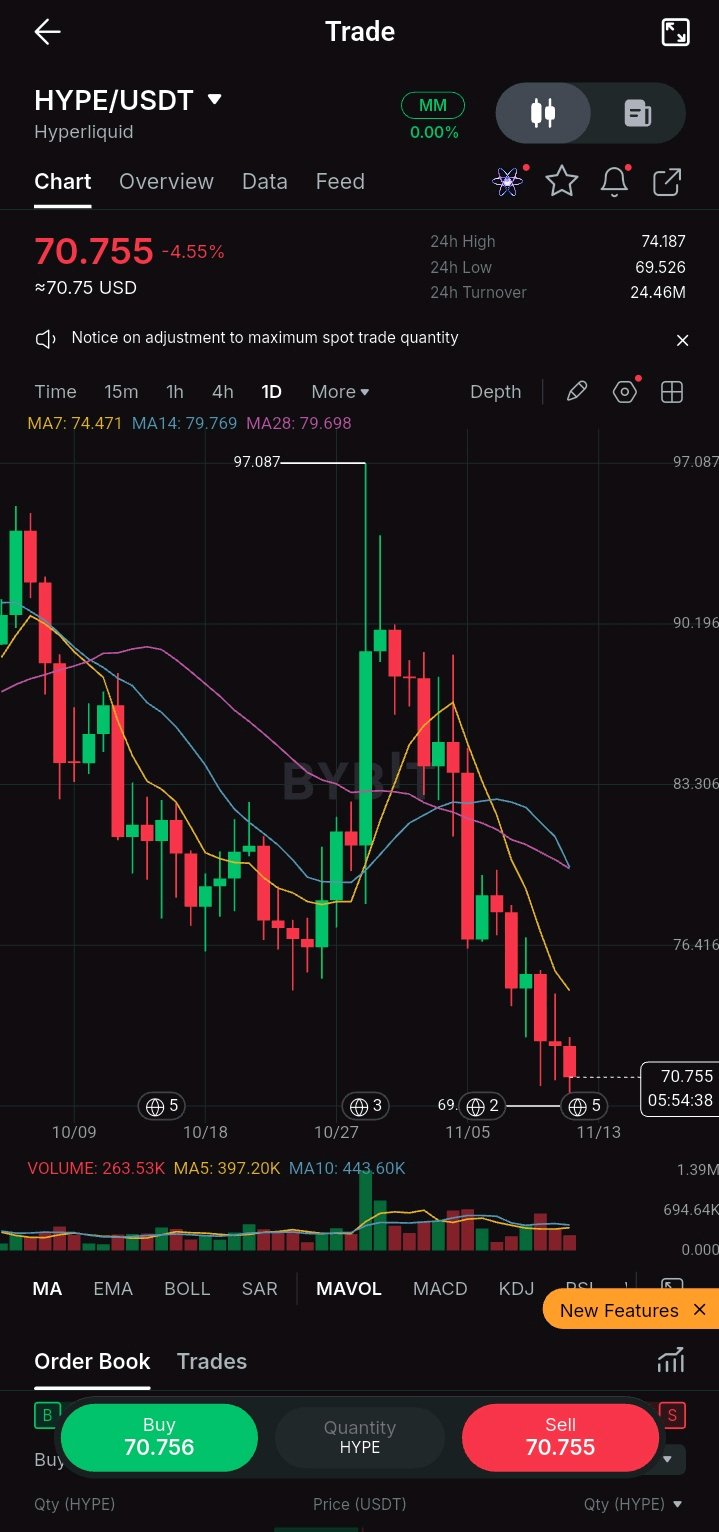
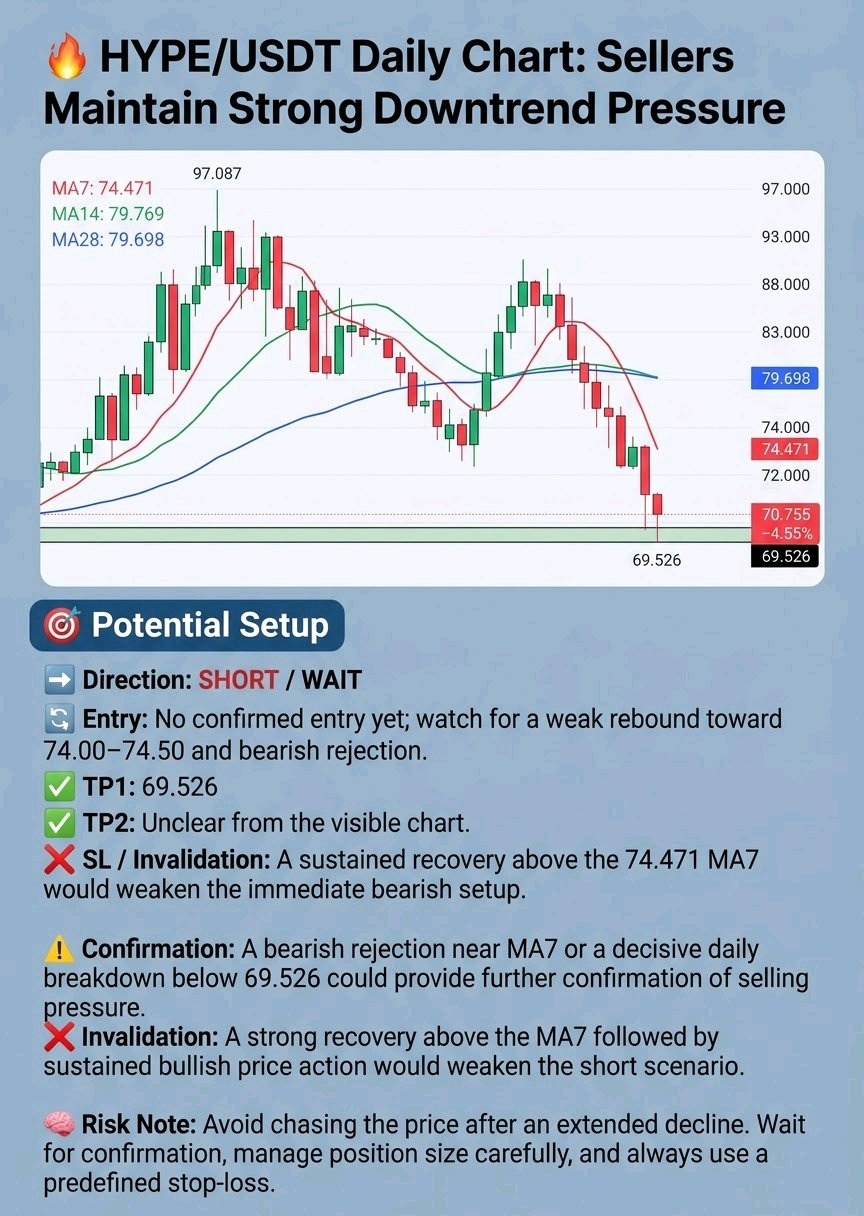
$HYPEUSDT is facing continued selling pressure, currently trading at 70.755, down 4.55%. Price is approaching the visible swing-low area near 69.526, with buyers yet to show a convincing recovery. 📊 Market Structure: The daily chart shows a clear bearish structure, with lower highs and lower lows following the major peak near 97.087. The recent recovery toward 90 failed, followed by another strong downward move. Price is trading below all three visible moving averages: * MA7: 74.471 * MA14: 79.769 * MA28: 79.698 The 69.526 area is the immediate visible support zone, while 74.471 is the first dynamic resistance to watch. 🎯 Potential Setup: Direction: SHORT / WAIT Entry: No confirmed entry yet; watch for a weak rebound toward 74.00–74.50 and bearish rejection. TP1: 69.526 TP2: Unclear from the visible chart. SL / Invalidation: A sustained recovery above the 74.471 MA7 would weaken the immediate bearish setup. ⚠️ Confirmation: A bearish rejection near MA7 or a decisive daily breakdown below 69.526 could provide further confirmation of selling pressure. ❌ Invalidation: A strong recovery above the MA7 followed by sustained bullish price action would weaken the short scenario. 🧠 Risk Note: Avoid chasing the price after an extended decline. Wait for confirmation, manage position size carefully, and always use a predefined stop-loss. #IMPACTbyTrade