
ZYVORX
13860Like0Shares207Fans203Follow
* Bybit Crypto Trader ⚡ | Daily Insights & Market Updates | Join using my link ⬇️
* Bybit Crypto Trader ⚡ | Daily Insights & Market Updates | Join using my link ⬇️
What stands out to me here is how aggressively sellers have controlled this chart since that 224.01 peak. QNT has been printing a steady stream of lower highs and lower lows on the 4H timeframe, and the recent flush down to 138.89 looked like it might break the entire structure completely. But that low was bought up hard, and now price is bouncing back to 158.40. The recovery is sharp, but I’m not convinced it’s anything more than a relief rally inside a broader downtrend. The key insight is simple: until price reclaims major structural resistance, this is still a bounce inside a downtrend. The recovery hasn't broken any significant swing highs yet, and the overhead supply from the previous breakdown zone is still sitting there waiting. I've been burned before trying to catch these falling knives too early, convinced the bottom was finally in, only to watch price roll over and make a fresh low without me. That painful lesson taught me to wait for confirmation rather than guess where the bottom is. The market doesn't reward impatience in these conditions—it punishes it. What I'm watching now is how price behaves as it approaches the 165-170 area. If sellers show up there with conviction, it's a clean short setup back toward the lows. If buyers push through with volume, I'll reassess. There's no need to force anything. Bias: Bearish until structure shifts. Entry: 165.00 (only after a 4H rejection and close back below this zone) Stop: 180.00 (above the recent lower high to give it room) TP1: 145.00 TP2: 138.89 TP3: 125.00 Invalidation: A 4H close above 180.00 would tell me the structure is shifting. If price keeps grinding up without a clear rejection, I won't chase it. Let the market show its hand first. Patience is the edge here. #ByXIMPACT$QNTUSDT
What caught my eye here was the violent rejection at 336.00. Price got flushed hard, sweeping a ton of stops and trapping late shorts, before printing a strong V-shaped recovery back up to 387. That tells me buyers are actively defending the range lows and aren't willing to let it break down further. The 4H structure shows a potential shift—we're printing a higher low compared to the previous dip, and price is now compressing beneath the 394-400 supply zone. This is where the market decides its next move. The key insight is that the bounce is holding, but momentum is stalling right at resistance. I've seen this before: a sharp recovery often lures in breakout buyers right before price chops sideways or reverses. That's why I'm not front-running it. I want to see if buyers can actually absorb the overhead supply at 414 or if this is just a lower high forming. Right now, it's a wait-and-see situation, and there's no shame in sitting on my hands. I remember a time I jumped into a similar V-shaped recovery too early, convinced the reversal was confirmed. Price stalled right at resistance, chopped around, and then dropped back to my stop before finally moving higher without me. That lesson stuck—confirmation matters more than catching the exact bottom. Bias: Neutral until confirmed. Entry: 400 (only after a clean 4H close above this level) Stop: 375 (below the recent consolidation support) TP1: 414 TP2: 430 TP3: 445 Invalidation: A 4H close back below 375. If price rejects here and rolls over, I won't fight it. No chasing, no guessing. Let the market prove itself first. #ByXIMPACT $TSLAXUSDT
I wasn't interested in this setup at first, but the way UNI is holding above 4.62 after that brutal drop from 7.81 demands a closer look. The 4H structure has been nothing but lower highs and lower lows, and sellers have been in complete control for days. But right now, price is grinding back toward 5.14, and the selling pressure is clearly slowing down. That low at 4.62 was bought up aggressively, and we're seeing a steady recovery rather than a weak, unconvincing bounce. The candles are getting smaller on the downside, and buyers are stepping in earlier on each dip. That tells me the momentum is shifting before the structure fully confirms it. I've been burned before buying the first bounce in a downtrend, though. It often turns into a lower high, and I end up holding a losing position while the market makes a fresh low. That lesson taught me patience. So instead of guessing the bottom, I'm waiting for a clean break and close above the local resistance. I need to see buyers prove they can reclaim the previous breakdown level before I commit any size. Here is the plan I’m working with: Entry: 5.25 (after a 4H close above this level) Stop: 4.85 (below the recent higher low to give the trade breathing room) TP1: 5.60 TP2: 6.00 TP3: 6.50 Invalidation: A 4H close back below 4.85 would tell me the bounce failed and sellers are still in control. The risk-to-reward here is solid if we get that clean breakout. But don't chase the initial move. Let the retest confirm the shift before committing. Patience is the real edge in these counter-trend setups. #ByXIMPACT $UNIUSDT
I’ve learned to be careful when a chart looks this heavy and one-sided. AAVE has been bleeding out relentlessly from that 140.89 peak, printing clear lower highs and lower lows the entire way down to 96.65. There was no real bounce that held, just relentless selling pressure. What catches my eye now is the reaction off that low—buyers stepped in aggressively and pushed price back to 106.70, but I’m not convinced this is anything more than a corrective bounce. The broader structure is still firmly bearish, and the momentum hasn't genuinely shifted yet. The key insight here is simple: until price reclaims the previous breakdown levels with conviction, sellers remain in control. A bounce into resistance is an opportunity to look for shorts, not to blindly buy the dip. I’ve been trapped before buying these oversold bounces too early, convinced the bottom was finally in, only to watch price roll over and make a fresh new low. That lesson stuck with me—catching falling knives without confirmation is a fast way to bleed an account. I’m watching the 110-112 area closely. That’s where the previous support turned into resistance. If sellers show up there again, it’s a clean short setup. Entry: 111.50 (after a clear rejection and a 4H close back below this zone) Stop: 118.00 (above the recent lower high to give the trade room) TP1: 100.00 TP2: 96.65 TP3: 90.00 Invalidation: A 4H close above 118.00 would tell me the structure is shifting. Don’t chase the bounce if it keeps grinding up without a clear rejection. Wait for the structure to confirm before committing any size. Patience is what keeps you alive in these downtrends. #ByXIMPACT $AAVEUSDT
What caught my attention here wasn’t the drop itself, but how orderly it was. From the 81,977 peak, this wasn’t a panic flush—it was a textbook series of lower highs and lower lows on the 4H. Every bounce got sold into, and the structure kept stepping down. That tells me sellers are still in control, and they’re not in a hurry. Price is now hovering around 64,687, essentially at the lowest point on this chart. I’m not interested in trying to catch this falling knife. Momentum is still clearly bearish, and there’s no confirmed reversal signal yet—no strong reclaim, no higher low, nothing that says buyers have stepped in. The chart is still printing lower highs, and until that changes, the path of least resistance remains down. The level I keep coming back to is the 70,500–71,000 zone. That’s where the previous breakdown accelerated, and it’s the most logical place for a relief bounce to stall. If price retraces into that area and prints a weak rejection candle—something with a long wick and a close back below the level—I’ll be interested in a short. That’s my confirmation. Without it, I sit on my hands. Entry: 70,800 on a confirmed rejection. Stop: 71,600, above the swing high that would invalidate the bearish structure. TP1: 68,000. TP2: 66,000. TP3: 64,000. Invalidation: a strong 4H close above 72,000. A lesson I’ve learned the hard way: chasing breakdowns this late usually means buying the bounce with your stop. Wait for the retest. If price just consolidates and rolls over without giving the entry, I let it go. No confirmation, no trade. #ByXIMPACT $BTCUSDT
What caught my attention here was the sheer violence of that recent pump. INIT spent hours grinding sideways, chopping around and sweeping down to 0.09097, and then suddenly printed a massive, impulsive green candle that blasted straight through local resistance up to 0.13393. That kind of aggressive move usually signals that buyers have completely taken over the order book and forced a short squeeze. Right now, price is pulling back to 0.12536, which is completely normal price action after a 25% spike. The important insight here is that this consolidation is actually healthy. If the market was truly weak, we would have already seen a full retrace back to the lows. Instead, the pullback is relatively shallow and holding well above the previous structural highs. This tells me the breakout wasn't just a fakeout—buyers are actively defending their positions. I’ve made the mistake of chasing huge green candles in the past, only to get trapped at the very top right before the retracement. It taught me a hard lesson: wait for the dust to settle and look for a higher low before entering. Here is the plan I’m working with: Entry: 0.12800 (Wait for a 4H close above this level to confirm the continuation) Stop: 0.11200 (Below the recent breakout candle's midpoint to give it breathing room) TP1: 0.13400 TP2: 0.14200 TP3: 0.15000 Invalidation: A 4H close back below 0.11200 would tell me the breakout failed and sellers are back in control. The risk-to-reward here is solid if we get that clean continuation. But if it just keeps pumping without a clean pullback, let it go. Do not chase the top. Let the setup come to you. Patience is the real edge. #ByXIMPACT$INITUSDT
The part of this chart I keep coming back to is that massive red candle right before the current push. GPS flushed down aggressively to 0.007451, likely sweeping a ton of early long stops and trapping breakout buyers, before immediately printing a strong, impulsive recovery. That kind of aggressive rejection tells me buyers are defending this range hard. It wasn't just a slow bleed; it was a violent liquidity grab followed by a V-shaped bounce. Now, price is sitting just under the 0.008295 high, consolidating in a tight flag on the 4H timeframe. The important insight here is momentum and market structure. Sellers had their absolute best chance to break the trend and push lower, but they failed. The subsequent recovery, followed by a series of higher lows, shows that buyers are actively absorbing supply. The current consolidation isn't showing weakness; it's showing compression. I’ve been burned before buying the first green candle after a flush, though. It often turns into a lower high or a fakeout because I was letting FOMO dictate my entry rather than waiting for structural confirmation. I learned that it's better to let the market prove it can clear resistance before jumping in. Here is the plan I’m working with: Entry: 0.00830 (Wait for a confirmed 4H close above this level) Stop: 0.00780 (Placed below the consolidation support to give it breathing room) TP1: 0.00870 TP2: 0.00910 TP3: 0.00950 Invalidation: A 4H close back below 0.00780 would tell me the setup failed and sellers are back in control. The risk-to-reward here is solid, especially if we get that clean breakout and retest. But if it pumps without giving a confirmed close above 0.00830, don’t chase it. Let the retest come to you. Patience is the real edge. #ByXIMPACT$GPSUSDT
I’ve learned to be extremely careful when price looks like it’s just stabilizing after a sharp drop. It’s easy to mistake a dead-cat bounce for a genuine reversal, but this MegaETH chart caught my attention because the 4H structure is telling a much more interesting story. After rejecting the 0.05299 high, sellers took firm control and pushed price down hard, sweeping liquidity around the 0.03942 level. But that low was aggressively bought up, and the subsequent price action is where things get compelling. The important insight here is that despite the heavy pullback, buyers are still stepping in and defending higher lows. The 0.04281 area held remarkably firm on the recent retest, creating a clear, established demand zone. I’ve made the mistake of shorting into these strong bounces before, only to watch price squeeze right back up in my face. This doesn't look like a trend reversal anymore; it looks like a classic continuation setup where the market is simply resetting before the next leg up. The momentum is shifting, and the current consolidation just below 0.04885 is the market catching its breath. I’ve learned that front-running these breakouts rarely pays. I’m waiting for the market to prove itself with a confirmed break above the current consolidation phase. If buyers can absorb the supply at the highs, the path of least resistance flips upward. Here is the plan I’m sticking to: Entry: 0.04950 (after a solid 4H close above this level) Stop: 0.04400 (below the recent higher low to give the trade room to breathe) TP1: 0.05200 TP2: 0.05500 TP3: 0.05800 Invalidation: A 4H close back below 0.04281 would tell me the structure is broken and sellers are back in control. The risk-to-reward here is solid if we get that clean breakout. But don’t chase the initial breakout candle. Let it close and confirm the structure shift before committing any size. Patience is the real edge here. #ByXIMPACT $MEGAUSDT
I have to be extremely careful with charts like this. That vertical spike to 0.0003 on MagicCraft was pure hype and thin liquidity, and the immediate fade that followed tells me everything I need to know. The smart money used that massive green candle as an exit liquidity event, dumping their bags on anyone who chased the breakout. Since then, it’s been a messy, choppy grind downward. What catches my eye right now is the current structure hovering around 0.000111. We had a sharp flush down to 0.0000849, a weak bounce, and now price is sitting heavy again, struggling to hold its ground. The key insight here is that this looks like a classic distribution phase playing out on the 4H chart. The previous bounce failed to make a higher high, and the overall momentum is clearly dying out. Sellers are aggressively stepping in on every single relief rally, keeping the pressure on. I’ve been trapped before trying to catch a falling knife on low-cap alts right after a massive pump—it’s a quick way to bleed an account dry. The volume here is incredibly thin, which makes the downside extremely slippery and prone to sudden, violent flushes. I’m watching the 0.000100 psychological level very closely. If it gives way with conviction, the path back down to the previous lows opens up quickly. I learned a long time ago that hoping for a V-shaped recovery on a dead chart is a losing game. You have to respect the lower highs. Here is the plan I’m working with: Entry: 0.000105 (on a confirmed 4H close below this level) Stop: 0.000120 (above the recent lower high to give it room) TP1: 0.000090 TP2: 0.000085 TP3: 0.000075 Invalidation: A 4H close back above 0.000120 would tell me sellers are losing control. The risk-to-reward here is decent, but don't chase a breakdown candle. Wait for the retest if it flushes hard. Patience pays on these illiquid setups. #ByXIMPACT $MCRTUSDT
I wasn’t interested in this setup at first, but the price action on the 4H chart is starting to demand attention. After that heavy, sustained drop from the 0.34 highs, sellers looked completely in control. But when I look at the recent structure, something shifted. Price flushed down to 0.2254, bounced, and then came back to test that exact same area—and it refused to break. That double-bottom formation at the range floor tells me buyers are actively defending this level. They absorbed the selling pressure twice and held the line. Now, price is pressing back up toward 0.2625, and we have a clear higher low forming, which is the first real sign that the downtrend is losing momentum. The key insight here is simple: the market structure is shifting from a series of aggressive lower highs into a potential range breakout. Sellers had their absolute best chance to push through 0.2254 and failed. Now, as price compresses into this current resistance zone, the path of least resistance is starting to tilt upward. But I’ve learned to wait for the neckline confirmation instead of front-running the pattern. Entering early on double bottoms is a habit that cost me before—price often sweeps the lows one more time to grab liquidity before making the real move. I’m not going to let the fear of missing out dictate my entry here. Here is the plan I’m working with: Entry: 0.2700 (only after a solid 4H close above this level) Stop: 0.2450 (below the recent higher low to give it breathing room) TP1: 0.2850 TP2: 0.3100 TP3: 0.3400 Invalidation: A 4H close back below 0.2450 would tell me the double bottom failed and sellers are still in charge. The risk-to-reward here is solid, especially if we get that clean breakout and retest. But if it pumps without giving a confirmed close above 0.27, let it go. Chasing here defeats the purpose and ruins the R:R. I’m waiting for the market to prove itself before I commit any size. #ByXIMPACT $JUPUSDT
I’ve been burned before by getting overly excited over a sharp V-shaped recovery, so I’m watching this Pieverse chart with a healthy dose of skepticism. After that massive parabolic run up to 2.23, the subsequent drop was brutal, but the way price is grinding back up from the 1.61 floor is genuinely interesting. It’s forming a clear higher-low structure on the 4H timeframe, and buyers are stepping in aggressively to reclaim lost ground. You can see the momentum shifting as the red candles get smaller and the green ones start pushing higher. What stands out to me most is the current consolidation just below 1.94. Sellers had their chance to push it lower and completely failed. Now, as price compresses in this tight range, it looks like a classic setup for a continuation push back toward the previous highs. The structure is improving, but I’m not going to front-run the breakout. The real test is the local resistance around the 1.95 level. If buyers can absorb the supply there, the path of least resistance flips back to the upside. I learned a long time ago that buying anticipation is expensive. Waiting for the actual confirmation saves capital. Here is the plan I’m sticking to: Entry: 1.96 (Wait for a solid 4H close above this level) Stop: 1.82 (Below the recent swing low to give the trade breathing room) TP1: 2.10 TP2: 2.20 TP3: 2.35 Invalidation: A 4H close back below 1.75. The risk-to-reward here is solid, especially if we get that clean breakout. But if it pumps without giving a confirmed close above 1.96, let it go. Chasing here defeats the purpose and ruins the R:R. I’m just waiting to see if buyers have the volume to break this ceiling. Are you taking this breakout or waiting for a pullback? #ByXIMPACT$PIEVERSEUSDT
The part of this chart that keeps my attention is how flat KII has gone after that sharp spike down to 0.08120. Price is drifting near 0.08504, but the 4H candles are tiny and overlapping, with no impulsive body reclaiming lost ground. Buyers are present, but they aren't pushing. That tells me sellers still control the structure, and the market is simply resting rather than reversing. A quiet range after a drop is not the same thing as accumulation, even if it sometimes looks like it on a first glance. I've learned to be careful with these quiet consolidations after a drop. A while back, I bought into a similar flat range, assuming it was accumulation before a reversal. It wasn't—price just kept grinding lower until my stop was tagged, and the move I expected happened without me. That taught me to wait for a confirmed close above resistance, not just sideways drift. Flat price action tells you the market is undecided, not that it's preparing to go higher. Right now, 0.08726 is the first real hurdle. It's the prior breakdown area and the first level buyers have to reclaim to show any genuine control. A 4H close above it would show buyers can absorb the supply sitting there. Until then, this remains a downtrend with a weak bounce, and the structure is still defined by the drop from 0.08928. Current Price: ~0.08504 Bias: Neutral until 0.08726 reclaim Entry: 0.08730 (on 4H close above) Stop Loss: 0.08120 (below the swing low) TP1: 0.08928 TP2: 0.09200 TP3: 0.09500 Invalidation: 4H close back below 0.08300 If price pushes up without giving that close, I'll sit it out. No need to force a trade without proof, and patience is usually the cheaper lesson. #ByXIMPACT$KIIUSDT
The part of this chart that grabs my attention is how steadily LAVA has climbed from 0.01228, printing a clean series of higher highs and higher lows along the way. That structure is intact, and I respect it. But the recent 4H candles near 0.01676 are getting smaller, with wicks on both sides. Buyers are still in control, but the momentum is clearly slowing as price presses into that high. That slowdown is the detail that matters—it tells me the market is deciding, not committing. I've learned to be patient with setups like this. A while back, I bought into a similar grind near resistance, assuming the next push would break through. Instead, price stalled, tagged my stop, and then broke out without me. The direction was right, but my entry was early, and that's all it took. That taught me to wait for a confirmed close above the high, not just a test of it. A wick through resistance is the market probing; a close above it is the market accepting. I only want to trade acceptance. Right now, 0.01676 is the gatekeeper. It's the prior swing high and the point where sellers previously stepped in. A 4H close above it would confirm buyers can absorb the supply there. Until then, this is a pause in an uptrend, not a breakout, and entering mid-range means inheriting unnecessary risk. Current Price: ~0.01617 Bias: Bullish continuation only above 0.01676 Entry: 0.01680 (on 4H close above) Stop Loss: 0.01450 (below the recent higher low) TP1: 0.01800 TP2: 0.01950 TP3: 0.02100 Invalidation: 4H close back below 0.01550 If price pushes through without giving that close, I'll sit it out. No need to chase a move that hasn't proven itself, and patience is usually the cheaper lesson. #ByXIMPACT $LAVAUSDT
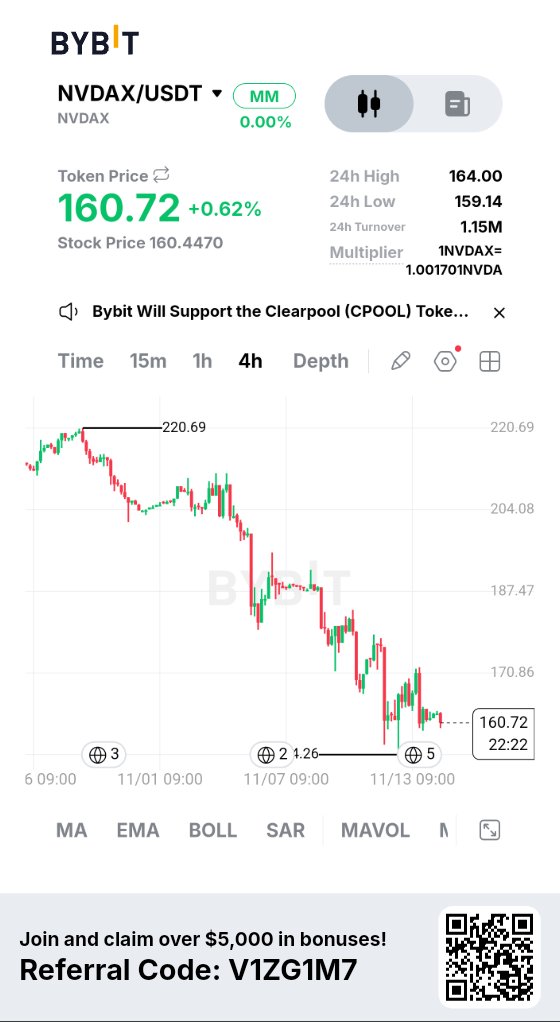
The part of this chart that stands out most is how little resistance the sellers have faced on the way down. NVDAX has been in a steady, relentless decline from 220.69, and the structure is a clean sequence of lower highs and lower lows. The current price near 160.72 is sitting close to the recent low, and the latest 4H candles are small with barely any lower wick, meaning buyers aren't stepping in with any real force. There's no absorption, no rejection, no sign that the selling is exhausting itself. I've learned the hard way not to buy into a slide like this, assuming a big drop means a bounce is due. It usually just keeps bleeding. I remember entering a similar setup, confident the market was oversold, only to watch price grind lower until my stop was taken. That lesson taught me to wait for a clear close above resistance before considering any reversal. Oversold conditions describe what already happened—they don't predict what comes next. Right now, 170.86 is the first real hurdle. It's the prior consolidation zone that broke down, and it's where this decline will either pause or continue. A 4H close above it would show buyers can absorb the supply sitting there. Until then, this remains a downtrend, and the structure is still defined by the long slide from 220.69. One green candle doesn't erase that. Current Price: ~160.72 Bias: Bearish until 170.86 reclaim Entry: 170.90 (on 4H close above) Stop Loss: 159.10 (below the swing low) TP1: 187.47 TP2: 204.08 TP3: 220.69 Invalidation: 4H close back below 162.00 If price pushes up without giving that close, I'll sit it out. No need to force a trade against a trend that hasn't shown any sign of turning, and patience is usually the cheaper lesson. #ByXIMPACT$NVDAXUSDT
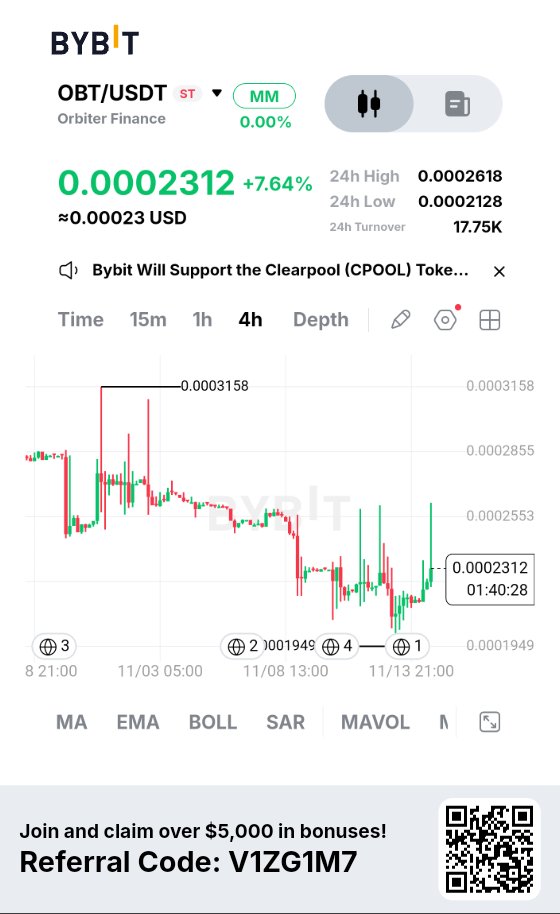
What stands out here is how many long upper wicks OBT has printed on the way down from 0.0003158. Every rally attempt into the 0.0002553 area got sold hard, and the structure remains a clean sequence of lower highs. Those wicks are not random—they're a visible record of buyers trying and failing. The current push near 0.0002312 is just the latest attempt, but the candle bodies are small and buyers haven't reclaimed anything meaningful. That pattern tells me sellers are still in control, even if they're not pressing aggressively right now. I've been trapped by this exact pattern before—buying a recovery into a prior rejection zone, convinced this time it would hold. It didn't. The wicks told the story before the close did, and I ignored them because I wanted the bounce to be real. That taught me to wait for a confirmed close above the level, not just a probe into it. A touch is the market testing; a close is the market accepting. I only want to trade the acceptance. Right now, 0.0002553 is the gatekeeper. It's the level where multiple rallies died, and it's the first real obstacle buyers have to clear. A 4H close above it would show buyers can absorb the supply sitting there. Until then, this is a bounce inside a downtrend, and the structure is still defined by the slide from 0.0003158. Current Price: ~0.0002312 Bias: Neutral until 0.0002553 reclaim Entry: 0.0002560 (on 4H close above) Stop Loss: 0.0001940 (below the swing low) TP1: 0.0002855 TP2: 0.0003158 TP3: 0.0003400 Invalidation: 4H close back below 0.0002100 If price pushes up without giving that close, I'll sit it out. No need to force a trade without proof, and patience is usually the cheaper lesson. #ByXIMPACT$OBTUSDT
The part of this chart that keeps my attention is how BR is pressing back toward the 0.49931 zone after that sharp rejection from 0.53223. Price recovered from the 0.40056 low, but the recent 4H candles are showing hesitation right below the prior breakdown area. Buyers are pushing, but they haven't reclaimed the level that matters. That hesitation is the key detail, because a recovery into a broken level is a test, not a confirmation. I've learned to be careful with these recoveries. A while back I bought a similar bounce into a broken support zone, assuming it would flip back to support. It didn't. Price stalled, my stop got tagged, and the move continued without me. That taught me to wait for a confirmed close above resistance, not just a touch. A wick through a level is the market probing; a close above it is the market accepting. I only want to trade acceptance, because that's where the follow-through actually lives. Right now, 0.49931 is the gatekeeper. It's the prior breakdown area and the first real obstacle buyers have to clear. A 4H close above it would confirm buyers can absorb the supply sitting there. Until then, this is a bounce inside a broader range, not a breakout, and the middle of that range is the worst place to be positioned. The structure is still defined by that rejection from 0.53223, and one green leg doesn't erase it. Current Price: ~0.46493 Bias: Neutral until 0.49931 reclaim Entry: 0.50000 (on 4H close above) Stop Loss: 0.40000 (below the swing low) TP1: 0.53223 TP2: 0.56000 TP3: 0.59000 Invalidation: 4H close back below 0.45000 If price pushes through without giving that close, I'll sit it out. No need to chase a move that hasn't proven itself, and there's always another setup waiting. #ByXIMPACT $BRUSDT
The part of this chart that keeps my attention is how NIGHT is consolidating just under the 0.04885 high after a strong run from 0.03529. The structure is clearly bullish—higher highs, higher lows—but the recent 4H candles are printing smaller bodies and upper wicks right beneath that prior peak. Buyers are still in control, but they're hesitating at resistance. That hesitation is the detail that matters, because a trend stalling at a high is not the same thing as a breakout continuing. I've learned to be careful when a trend stalls at a high. A while back I bought into a similar setup, assuming the next push would break through. It didn't. Price chopped sideways, tagged my stop, and then broke out without me. That taught me to wait for a confirmed close above the level, not just a touch. A wick through resistance is the market probing; a close above it is the market accepting. I only want to trade acceptance, because that's where the follow-through lives. Right now, 0.04885 is the gatekeeper. It's the prior swing high and the point where sellers previously stepped in. A 4H close above it would confirm buyers can absorb the supply sitting there. Until then, this is a pause in an uptrend, not a breakout, and entering mid-range means inheriting unnecessary risk. Current Price: ~0.04716 Bias: Bullish continuation only above 0.04885 Entry: 0.04890 (on 4H close above) Stop Loss: 0.04350 (below the recent higher low) TP1: 0.05200 TP2: 0.05600 TP3: 0.06000 Invalidation: 4H close back below 0.04500 If price pushes through without giving that close, I'll sit it out. No need to chase a move that hasn't proven itself, and patience is usually the cheaper lesson. #ByXIMPACT$NIGHTUSDT
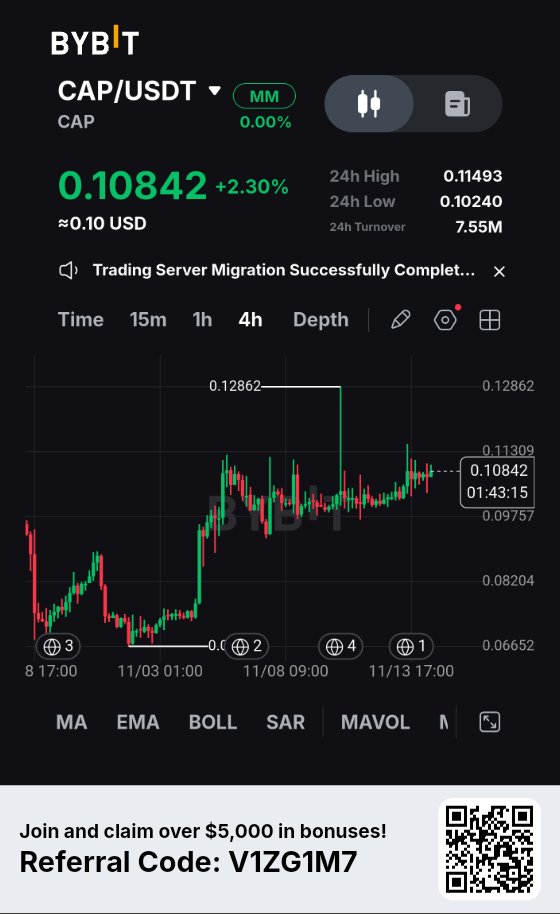
The part of this chart that keeps my attention is how CAP is grinding sideways just under the 0.11309 area, after that violent spike to 0.12862. Price recovered well from the 0.06652 low, building a steady series of higher lows along the way, but the recent 4H candles are small and overlapping right beneath that prior high. Buyers are present, but they aren't pushing through. That hesitation matters. A strong recovery that stalls at a known level is not the same thing as a breakout, and that distinction is where most of my past mistakes came from. I've learned to be careful when a chart looks strong but stalls at a known level. A while back, I bought into a similar setup, convinced the next push would clear resistance. It didn't. Price chopped, my stop got tagged, and the breakout happened without me. The lesson was simple: wait for a close above the level, not a touch. A wick through resistance is the market probing; a close above it is the market accepting. I only want to trade acceptance, because that's where the follow-through lives. Right now, 0.11309 is the gatekeeper. It's the prior swing high and the point where sellers previously took control. A 4H close above it would confirm buyers can absorb the supply sitting there. Until then, this is a range, not a breakout, and the middle of that range is the worst place to be positioned. Current Price: ~0.10842 Bias: Neutral until 0.11309 reclaim Entry: 0.11320 (on 4H close above) Stop Loss: 0.10200 (below the recent higher low) TP1: 0.12000 TP2: 0.12862 TP3: 0.13500 Invalidation: 4H close back below 0.10500 If price pushes through without giving that close, I'll sit it out. No need to chase a move that hasn't proven itself, and there's no penalty for waiting. #ByXIMPACT $CAPUSDT
The part of this chart that catches my attention is how FORT is pushing up from the 0.02026 low, but the structure above is still heavy. Price is near 0.02265, pressing into the 0.02419 area that capped the last bounce. That previous rejection is the key detail—buyers have tried here before and failed. The market remembers where it was refused, and that memory tends to matter more than a single strong candle. I've made the mistake of buying a recovery right into a prior rejection level, assuming this time would be different. It wasn't. Price stalled, my stop got tagged, and then it finally broke without me. That taught me to wait for a confirmed close above the level, not just a touch. A wick through resistance is the market probing; a close above it is the market accepting. I only want to trade acceptance, because that's where the follow-through lives. Right now, 0.02419 is the gatekeeper. It's the prior swing high and the point where sellers previously took control. A 4H close above it would show buyers can absorb the supply sitting there. Until then, this is a bounce inside a downtrend, and the structure remains defined by the long slide from 0.03600. One green leg doesn't erase that. Current Price: ~0.02265 Bias: Neutral until 0.02419 reclaim Entry: 0.02425 (on 4H close above) Stop Loss: 0.02020 (below the swing low) TP1: 0.02813 TP2: 0.03206 TP3: 0.03600 Invalidation: 4H close back below 0.02150 If price pushes through without giving that close, I'll sit it out. No need to force a trade without proof, and patience is usually the cheaper lesson. #ByXIMPACT$FORTUSDT
The thing that stands out most on this chart isn't the bounce—it's how little fight there was on the way down. CORN has been in a relentless, one-directional bleed from 0.02470 all the way down to 0.00972, and the structure shows almost no meaningful retracement along the way. That's not a market that's been chopping; that's a market that's been sold without pause. The current candles near the low are tiny, overlapping, and barely registering any upward wick, which tells me sellers aren't even being tested yet. There's no absorption, no rejection, no sign that buyers have stepped in with size. I've made the mistake of trying to catch a falling knife like this before, assuming a big decline meant the bottom was near. It wasn't. The market just kept grinding lower until my stop was taken, and then it continued without me. That taught me that oversold conditions are not a signal—they're just a description of what already happened. A chart can look exhausted and still have plenty of room to bleed. Right now, 0.00991 is the nearest reference point. It's the recent 24-hour high, but it's barely above current price, which shows how compressed this range has become. Until buyers can reclaim something meaningful, there's no structure to trade against. The trend is still down, the lows are still being tested, and there's no confirmation of a shift. Current Price: ~0.00972 Bias: Bearish until structure reclaims Entry: 0.01000 (on 4H close above) Stop Loss: 0.00920 (below the current low) TP1: 0.01261 TP2: 0.01664 TP3: 0.02000 Invalidation: 4H close back below 0.00950 If price just drifts sideways without confirmation, I'll stay out. Some charts are best watched, not traded, and this is one of them. #ByXIMPACT$CORNUSDT