BNB Insight
9259Like0Shares195Fans203Follow
$BTCUSDT is attempting to stabilize after a sharp sell-off, but the recovery is facing a more important test than simply holding above $64,000: can spot demand absorb selling pressure, or is this rebound being driven mainly by short-term derivatives activity? Bitcoin is trading near $64,804 in the supplied Bybit snapshot, up 3.42% over 24 hours. However, the broader move remains weak. BTC has fallen roughly 12.6% over seven days, while the recent decline pushed price toward $61,999 before buyers stepped in. Market Structure: The 4H chart remains bearish. BTC is below MA7 at $64,862, MA14 at $65,655 and MA28 at $68,633. On the 1H chart, price is also below MA7 ($65,058) and MA14 ($64,992), while the 15M structure shows sellers defending the $65,000 area. The immediate recovery therefore needs confirmation, not just green candles. The Derivatives Contradiction: CoinGlass data shows futures volume around $78.5B against spot volume of $7.56B — more than 10 times higher. Open interest is down 4.68% to approximately $41.6B, while 24H liquidations reached $335M. This combination points to significant leverage being removed rather than clear evidence of fresh, sustained accumulation. Funding remains close to neutral. Institutional demand is another concern: US spot Bitcoin ETFs recorded approximately $185.4M in net outflows on November 13. The November 10–13 period saw roughly $864M in cumulative outflows. Key Figures - Bybit price: $64,804.5 - 24H change: +3.42% - 24H high/low: $66,138 / $61,999 - Bybit turnover: $825.80M - Market cap: approximately $1.31T - Circulating supply: approximately 20.11M BTC - 7D performance: approximately -12.6% What Changes the Outlook? A sustained 4H reclaim of $65,655 would be the first meaningful improvement, followed by $68,633. Failure to hold $61,999 would put the recent recovery at risk. The key signal is not whether BTC can bounce, but whether spot buyers return strongly enough to support the move. Are we seeing early accumulation, or simply a relief rally during a broader deleveraging phase? NFA. DYOR. #ByXIMPACT

$ROBOUSDT is showing a small recovery, but the important detail is that price has not yet reclaimed the resistance structure that triggered the latest decline. Fabric Protocol is trading near $0.00397 in the supplied Bybit snapshot, up 1.28% over 24 hours, while the broader 4H structure remains under pressure. The immediate range is $0.00360–$0.00404, with turnover around $303.35K on Bybit. On the 4H chart, ROBO is above MA7 at $0.00392 but remains below MA14 at $0.00408 and MA28 at $0.00419. The 1H structure is more constructive: price is close to MA7 at $0.00398 and above MA14 at $0.00396 and MA28 at $0.00393. However, the 15M chart shows resistance around $0.00398–$0.00400. A short-term bounce is developing, but confirmation is still missing. The fundamental question is whether Fabric can turn its robotics and AI infrastructure vision into real network activity. Its whitepaper describes ROBO as a utility token for network fees and operational bonds, including refundable bonds posted by robot operators. This creates a potential usage-based demand mechanism, but actual adoption and network throughput remain the evidence to watch. Token supply is another important factor. Approximately 2.23B ROBO are circulating against a maximum supply of 10B, meaning only about 22.3% is currently in circulation. The gap between circulating supply and maximum supply deserves attention as future distribution can affect market pressure. Key figures Price: ~$0.00397 (Bybit snapshot) 24H change: +1.28% 24H range: $0.00360–$0.00404 Market cap: ~$8.85M 7D change: -9.19% Circulating supply: ~2.23B Maximum supply: 10B Open interest: ~$4.18M 24H liquidations: ~$92.43K Bullish confirmation: A sustained move above $0.00404, followed by a reclaim of $0.00408–$0.00419, would strengthen the recovery case. Bearish confirmation: Losing $0.00360 would put the recent low back under pressure. Fabric’s long-term proposition depends on real robotics and AI workload demand—not simply the AI narrative. Will actual network usage become strong enough to support ROBO demand? NFA. DYOR. #ByXIMPACT

$KSMUSDT is attempting to stabilize near $2.73 after a sharp decline, but the rebound has not yet changed the broader bearish structure. The key question is whether the $2.606 support zone can hold long enough for buyers to rebuild momentum. Kusama is trading around $2.738 in the supplied Bybit snapshot, down 3.79% over 24 hours. The session range is $2.606–$2.849, with turnover near $29.75K on Bybit. The 4H chart remains weak: price is only marginally above MA7 at $2.730, while MA14 at $2.849 and MA28 at $2.960 remain overhead. On the 1H chart, price is above MA7 ($2.734) and MA14 ($2.717), but still below MA28 ($2.739). That points to a short-term recovery attempt inside a larger downtrend. The wider market picture is also under pressure. Kusama’s market capitalization is around $52.45M, with approximately 19.15M KSM circulating and no fixed maximum supply reported. Its role as Polkadot’s experimental network gives developers a live environment to test upgrades, governance and parachain-related ideas. However, network utility alone does not guarantee immediate demand for KSM. Derivatives data shows open interest near $4.07M, funding around -0.0303%, and approximately $49.47K in 24-hour liquidations. Negative funding suggests bearish positioning, but it does not prove that a bottom is in. Key figures Price: $2.738 | 24H: -3.79% 24H high/low: $2.849 / $2.606 Market cap: ~$52.45M Circulating supply: ~19.15M KSM Open interest: ~$4.07M Funding: -0.0303% 24H liquidations: ~$49.47K Bullish confirmation: Holding $2.606 and reclaiming $2.849 would improve the recovery case, with $2.960 as the next major moving-average barrier. Bearish confirmation: A decisive break below $2.606 would expose KSM to further downside. Kusama needs sustained spot demand, not just a short-lived relief bounce. Will buyers defend $2.606 and reclaim $2.849, or is this recovery only a pause in the downtrend? NFA. DYOR. #ByXIMPACT

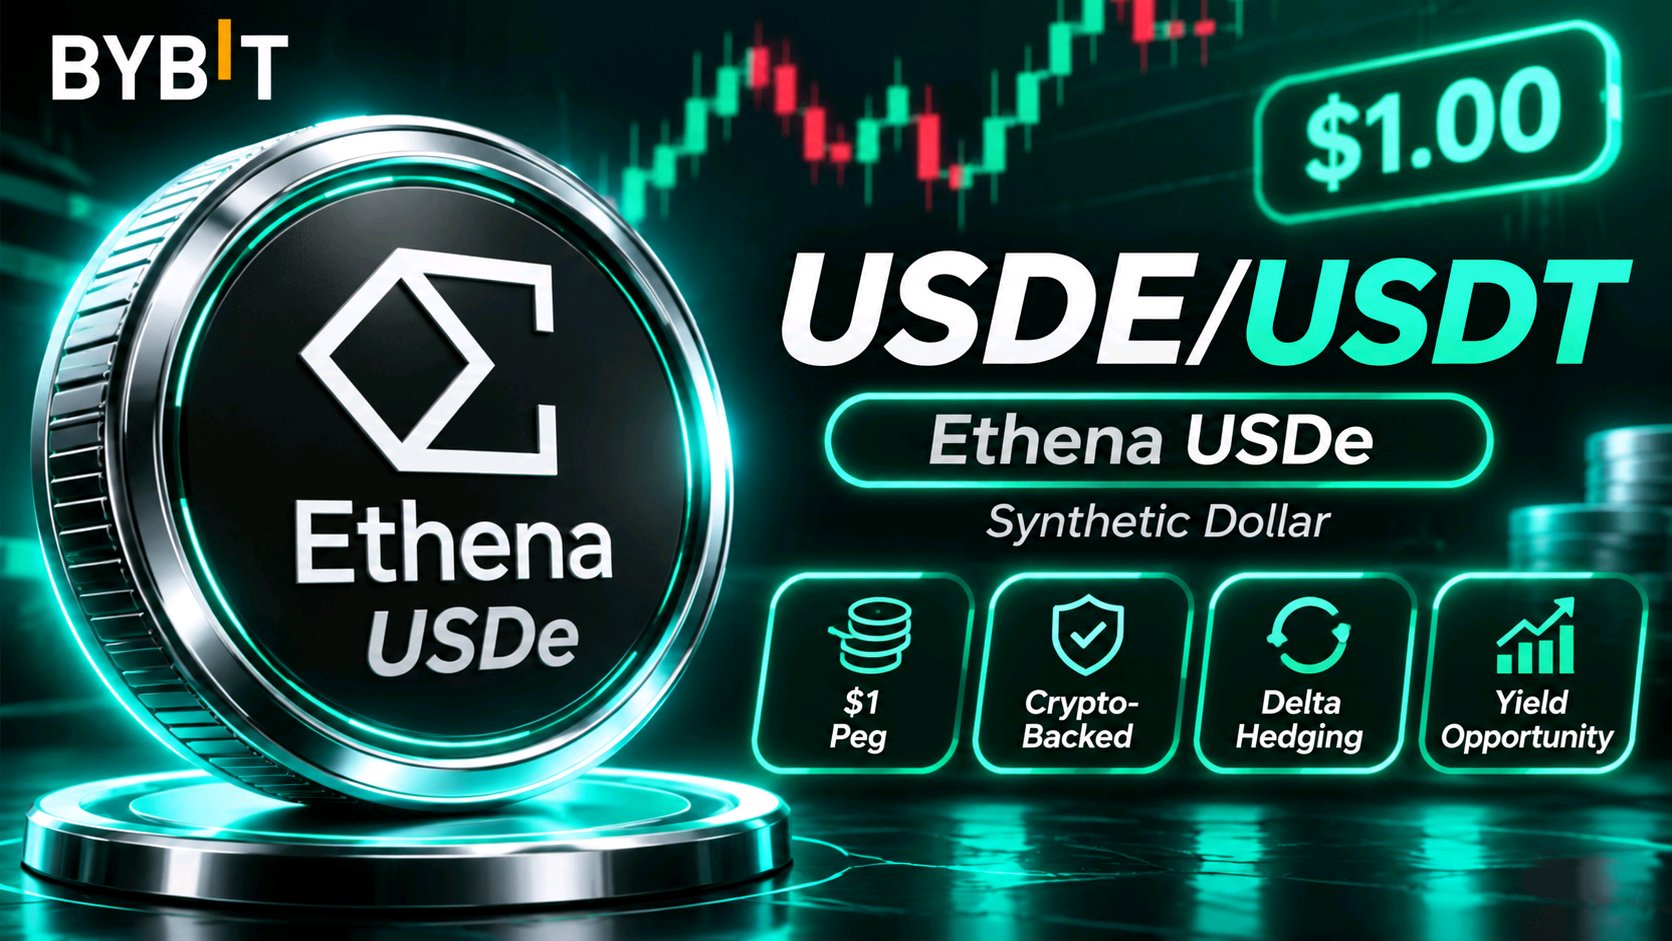
$USDEUSDT is holding close to its $1 peg, but the more important question is whether the structure behind this synthetic dollar remains resilient as its supply and market usage evolve. USDe is trading near $1.0003 in the Bybit chart snapshot, with a 24-hour change of approximately -0.01%. The session range is $0.9999–$1.0006, while Bybit turnover stands near $30.88M. On the 4H chart, price is around MA7 ($1.0003) but remains slightly below MA14 and MA28 ($1.0004). The 1H structure is recovering above its short-term averages, and the 15M chart shows a small rebound. However, the $1.0006 area remains an immediate resistance reference. The fundamental mechanism is what separates USDe from conventional fiat-backed stablecoins. Ethena uses crypto collateral and delta-hedging positions to maintain dollar exposure, with returns influenced by staking rewards and derivatives funding conditions. This creates a different risk profile: collateral quality, exchange counterparties, hedge execution and liquidity all matter. The scale is significant. USDe supply and market capitalization are around $4.9B, while DeFiLlama reports approximately $4.91B in USDe TVL. Yet scale alone does not eliminate risk. Ethena's own risk disclosures and governance updates make collateral composition, reserve coverage and counterparty exposure important areas to monitor. Key Figures Bybit price: ~$1.0003 24H change: -0.01% 24H high/low: $1.0006 / $0.9999 Bybit turnover: ~$30.88M Market capitalization: ~$4.89B Circulating supply: ~4.89B USDe Ethena USDe TVL: ~$4.91B 7D performance: approximately +0.06% Bullish confirmation: Holding the $1 peg and recovering above $1.0006 would support confidence in short-term price stability. Bearish confirmation: A sustained move below $0.9999 would deserve attention, particularly if accompanied by falling liquidity or weakening collateral confidence. USDe's real strength is not a temporary price premium; it is the ability to maintain reliable dollar exposure through changing market conditions. What matters more to you: the stability of the peg or the quality of the collateral and hedging system behind it? NFA. DYOR. #ByXIMPACT
$MEGAUSDT is showing a sharp recovery, but the important question is whether this breakout is supported by growing network activity or mainly short-term trading momentum. MEGA is trading around $0.05028, up 11.49% in the Bybit chart snapshot. The 24-hour range is $0.04232–$0.05103, with turnover near $2.62M. Price has reclaimed all three moving averages on the 4H chart: MA7 at $0.04632, MA14 at $0.04576 and MA28 at $0.04595. The 1H structure is also bullish, while the 15M chart shows price consolidating just below its short-term MA7. The fundamental picture deserves attention. MegaETH is designed as a high-performance Ethereum Layer 2 focused on low-latency execution. Its official token model connects MEGA to sequencer access, staking and ecosystem economics. The foundation also says yield generated through its native stablecoin, USDm, is intended to fund MEGA buybacks. However, adoption must translate into measurable economic activity. DeFiLlama reports approximately $8.8M in TVL, $22.91M in stablecoin supply and around $1,594 in 24-hour chain fees. These figures show an operating ecosystem, but they also highlight how much growth is still needed to justify a sustained valuation expansion. Key Figures Price: ~$0.05028 24H change: +11.49% 24H high/low: $0.05103 / $0.04232 Bybit turnover: ~$2.62M MegaETH TVL: ~$8.8M Stablecoin supply: ~$22.91M 24H chain fees: ~$1,594 Maximum supply: 10B MEGA Bullish confirmation: A decisive break above $0.05103, supported by stronger volume, could open the way toward the previous chart resistance near $0.05299. Bearish confirmation: Failure to hold the $0.048 area would weaken the breakout. A deeper pullback could retest the $0.045–$0.046 moving-average zone. The key issue is whether network adoption and token value capture can grow alongside price. Can MegaETH turn this recovery into a sustainable trend? NFA. DYOR. #ByXIMPACT

$SPCXXUSDT is attempting to recover after its recent decline, but the important question is whether this move reflects sustained demand or simply a short-term rebound in a relatively thin tokenized-equity market. On Bybit, SPCXX is trading near $137.90, up 1.36% over 24 hours. The session range is $133.51–$138.12, placing price close to its daily high. The 4H chart shows improvement: price has reclaimed MA7 at $136.31 and MA14 at $137.36, but remains below MA28 at $139.72. On the 1H chart, price is above all three moving averages, while the 15M structure is also positive. However, 4H volume remains below its MA5 and MA10 averages, suggesting that participation has not yet confirmed the recovery. The fundamental distinction is important. SPCXX is a tokenized tracker certificate issued by Backed Assets (JE) Limited, designed to follow SpaceX's share-price performance. It is not direct ownership of SpaceX shares and does not provide shareholder voting rights. The issuer's product information lists Ethereum and Solana-compatible token formats. It currently charges no management fee, although issuance and redemption fees of up to 0.50% may apply. This creates a different risk profile from an ordinary cryptocurrency: price exposure depends on the underlying private-company equity, while token liquidity, market access and issuer arrangements add separate considerations. The token's market price can also diverge from the underlying reference value during periods of thin liquidity. Key figures Price: ~$137.90 24H change: +1.36% 24H range: $133.51–$138.12 24H Bybit turnover: ~$845.60K 4H MA7: $136.31 4H MA14: $137.36 4H MA28: $139.72 Recent chart support: $133.51 Immediate resistance: $138.12 Bullish confirmation: A sustained break above $138.12, followed by a reclaim of $139.72–$140.38 with stronger volume, would strengthen the recovery case. Bearish confirmation: Failure near $138.12 and a move back below $136.31 could weaken momentum. A break below $133.51 would put the recent recovery at risk. The key issue is not simply whether SPCXX can rise with the SpaceX narrative, but whether its market liquidity can support that move. Would you trust this recovery before volume confirms it? NFA. DYOR. #ByXIMPACT

$SHIBUSDT SHIB is struggling to establish a floor after another sharp decline, and the derivatives data suggests this is not simply a spot-market correction. The key concern is that leveraged positions are being removed while genuine spot demand remains weak. On the Bybit chart, SHIB is trading near $0.000003866, down 6.55% over 24 hours. The session range is $0.000003698–$0.000004174, leaving immediate support at the recent low. The 4H structure remains bearish: price is below MA7 at $0.000003944, MA14 at $0.000004094 and MA28 at $0.000004237. The 1H chart shows a small recovery above MA14, but price remains below MA28, so this is not yet a confirmed reversal. Market-wide data shows SHIB down approximately 10.16% over seven days, with market capitalization near $2.30B and circulating supply around 589.24T tokens. This means almost the entire 590T maximum supply is already circulating. Token burns may support the long-term narrative, but meaningful supply reduction requires sustained burns at a scale large enough to affect this enormous circulating base. Derivatives reveal the more important contradiction. Futures open interest is approximately $23.67M, down 13.16% in 24 hours. Funding is negative near -0.0244%, while around $471K in positions were liquidated, approximately 92% from longs. Futures volume is roughly 2.2 times spot volume. Spot demand therefore remains the important confirmation still missing. Key figures Price: ~$0.000003866 (Bybit screenshot) 24H change: -6.55% 24H range: $0.000003698–$0.000004174 7D change: -10.16% Market cap: ~$2.30B Circulating supply: ~589.24T SHIB Open interest: ~$23.67M OI change: -13.16% Funding: -0.0244% 24H liquidations: ~$471K Bullish confirmation: Defending $0.000003698 and reclaiming $0.000004174 would be the first recovery signal. Stronger spot buying and stabilizing open interest would improve the case for a move toward the 4H moving averages. Bearish confirmation: A decisive break below $0.000003698 would expose SHIB to further downside, especially if spot selling continues. The leverage reset is visible, but a reduction in open interest alone does not create a bottom. SHIB needs sustained spot demand to prove that buyers are returning. Can SHIB attract genuine spot accumulation after this long liquidation, or will another support break extend the decline? NFA. DYOR. #ByXIMPACT

$ETHUSDT has broken sharply lower, and the important question is whether the rebound from $1,710 represents genuine spot demand or simply a pause after a leveraged sell-off. Ethereum is trading near $1,793, down approximately 5.86% over 24 hours. The latest Bybit range is $1,710.47–$1,919.76, placing price well below the session high. The 4H structure remains bearish: ETH is below MA7 at $1,838.18, MA14 at $1,885.64 and MA28 at $1,966.92. On the 1H chart, price is close to MA7 ($1,787.45) and MA14 ($1,792.41), but remains below MA28 at $1,840.39. Derivatives show the scale of the leverage reset. Across major exchanges, open interest is approximately $22.04B, down 4.36% in 24 hours. Around $465.27M in ETH positions were liquidated, with approximately 85% coming from longs. Funding is slightly negative at -0.0002%, while futures volume is roughly 14.5 times spot volume. This points to heavy derivatives activity, but does not yet prove sustained spot accumulation. Institutional flows offer a mixed signal. US spot ETH ETFs recorded a preliminary $2.3M net inflow on November 13, led by Fidelity, after substantial withdrawals earlier in the week. The latest 30-day flow picture remains negative at approximately $2.28B. Key figures - Price: ~$1,793 - 24H change: -5.86% - 24H range: $1,710.47–$1,919.76 - Market cap: ~$221.91B - Circulating supply: ~122.22M ETH - Futures open interest: ~$22.04B - 24H liquidations: ~$465.27M - Funding rate: -0.0002% - Futures/spot volume: ~14.5× Bullish confirmation: Defending $1,710.47 and reclaiming $1,919.76 would be the first meaningful recovery signal. Stronger spot demand and stabilizing open interest would improve the case for a durable bottom. Bearish confirmation: A decisive break below $1,710.47 could open another downside leg, particularly if ETF withdrawals and spot selling return. Ethereum's long-term role in the digital asset economy remains significant, but market structure must recover before calling this a bottom. Will spot buyers step in, or is the leverage reset still incomplete? NFA. DYOR. #ByXIMPACT

$BOMEUSDT is losing ground after another failed recovery attempt, and the latest decline is exposing a weakness that matters more for a meme asset: falling price is being accompanied by a significant reduction in leveraged exposure, while there is no clear fundamental cash-flow mechanism to establish a valuation floor. BOME is trading near $0.0004994 on the supplied Bybit chart, down 9.40% over 24 hours. The displayed daily range is $0.0004681–$0.0005568. Price is approaching the session low, making $0.0004681 the immediate support to watch. The broader market snapshot shows a seven-day decline of approximately 17.02%, a market capitalization near $33.75M and circulating supply around 68.87B BOME. The token is approximately 98.3% below its March 2024 all-time high of $0.02805. Derivatives indicate an aggressive positioning reset. Futures open interest stands near $10.63M, down 13.42% over 24 hours. Approximately $264.68K in liquidations were recorded, with 96% coming from longs. Funding is negative at roughly -0.0062%, while futures volume is approximately $24.63M against $2.80M in spot volume. Futures activity is therefore almost nine times spot volume, suggesting leveraged trading still dominates participation. BOME's original concept was to create a blockchain-based archive of meme culture on Solana. However, its market value remains largely dependent on community attention, liquidity and speculative demand rather than a clearly established recurring revenue model. One important distinction: approximately 99.9% of its 69B maximum supply is already circulating, so future dilution is less of a concern than demand deterioration. Key Figures Price: ~$0.0004994 (Bybit screenshot) Market cap: ~$33.75M 24H change: -9.40% (Bybit screenshot) 7D change: -17.02% 24H range: $0.0004681–$0.0005568 Open interest: ~$10.63M (-13.42%) 24H liquidations: ~$264.68K (96% longs) Funding rate: -0.0062% Circulating supply: ~68.87B BOME Bullish confirmation: Defending $0.0004681 and reclaiming $0.0005125 would be an initial recovery signal. Stronger spot buying and stabilizing open interest would improve confidence. Bearish confirmation: A decisive break below $0.0004681 would expose BOME to further downside. Continued weak spot demand would make a sustainable reversal harder to establish. BOME has an established place in Solana's meme culture, but community recognition alone cannot guarantee demand. I would want to see buyers defend support and spot participation improve before calling this a confirmed bottom. NFA. DYOR. #ByXIMPACT

$PIEVERSEUSDT is showing strong upside momentum, but the key question is whether this rally can overcome the supply pressure that comes with a relatively low circulating percentage. Price has pushed toward its recent high, while all three chart timeframes show buyers currently controlling the short-term structure. Market Structure: PIEVERSE is trading around $1.9096, up 13.55% on the supplied Bybit screenshot. The displayed 24H range is $1.6696–$1.9379, with turnover near $3.52M. On 4H, price is above MA7 ($1.7855), MA14 ($1.7190) and MA28 ($1.7126). The 1H chart confirms the bullish alignment, with all averages below price. On 15M, price also remains above MA7 ($1.8933), MA14 ($1.8431) and MA28 ($1.8203). However, the latest move is approaching resistance near $1.9379. Fundamental Context: Pieverse is developing payment infrastructure for Web3 businesses and AI-agent commerce. Its system focuses on verifiable timestamps, receipts and transaction records, while its x402b payment extension aims to support machine-to-machine transactions. PIEVERSE has proposed utility across governance, staking, platform payments, fee discounts and access to ecosystem features. The important distinction is that these use cases need sustained real adoption to translate into lasting token demand. Supply Risk: The whitepaper sets maximum supply at 1 billion tokens, allocating 20% to team and advisors, 15% to investors, 27.6% to community growth and 27.4% to ecosystem and marketing. A substantial portion remains outside circulation, making vesting and unlocks important variables. Key Figures - Bybit price: $1.9096 - 24H change: +13.55% - 24H high/low: $1.9379 / $1.6696 - Market cap: approximately $498M - Circulating supply: approximately 274.75M - Maximum supply: 1B PIEVERSE - Immediate resistance: $1.9379 A sustained break above $1.9379 could support further upside. Rejection may bring a retest of $1.89 and then the $1.78 area. Can Pieverse convert its AI-payment infrastructure into real token demand before future supply releases become a stronger market headwind? NFA. DYOR. #ByXIMPACT

$HYPEUSDT is showing an interesting divergence: the broader trend remains bearish, but short-term buyers have started pushing back after a sharp liquidity sweep toward $60.063. The key question is whether this rebound can develop into a genuine recovery or simply becomes another selling opportunity. Market Structure: HYPE is trading around $65.93, down 6.16% on the Bybit screenshot. The 24H range is $60.063–$70.737, with turnover near $84.11M. The 4H chart remains weak: price is below MA7 ($67.043), MA14 ($69.695) and MA28 ($70.885). However, the 1H chart has improved, with price above MA7 ($63.526) and MA14 ($64.998), while remaining below MA28 ($67.340). On 15M, price has reclaimed all three averages. This is an early recovery signal, not yet a confirmed higher-timeframe reversal. Fundamental Context: Hyperliquid has a distinctive value-capture mechanism. Its Assistance Fund receives 99% of protocol fees and uses them to purchase HYPE from the open market. A September 2026 SEC filing reported that 47.1M HYPE had been acquired and permanently removed from circulation. Another important development is HIP-3: by September 8, 2026, its markets represented approximately 30% of Hyperliquid's trailing 30-day trading volume, with over $548.1B cumulative volume since launch. HYPE is required as collateral for HIP-3 market deployments, creating a potential link between product expansion and token demand. Key Figures - Bybit price: $65.929 - 24H change: -6.16% - 24H high/low: $70.737 / $60.063 - Immediate resistance: $67.04–$67.34 - Higher resistance: $69.69–$70.88 - Rebound support: $63.50–$64.10 - Major downside reference: $60.063 A sustained reclaim of $67.34 would strengthen the recovery case. Rejection there could return attention to $63.50 and potentially $60.063. Can Hyperliquid's growing HIP-3 activity and fee-funded HYPE purchases provide enough support to overcome the current bearish chart structure? NFA. DYOR. #ByXIMPACT

$SOLUSDT is facing a serious market-structure breakdown, and the latest sell-off is raising a bigger question: is this simply a leveraged flush, or is the market repricing Solana's near-term risk? Market Structure: SOL is trading around $67.89 on the supplied Bybit chart, down approximately 12.28% over 24 hours. The displayed 24H range is $67.41–$77.39, with turnover near $82.60M. The 4H chart shows a clear bearish alignment: price is below MA7 ($72.93), MA14 ($76.39) and MA28 ($79.78). The 1H chart is equally weak, with all averages overhead at $69.91, $71.85 and $74.04. On 15M, price remains below MA7 ($68.91), MA14 ($69.28) and MA28 ($70.17). This is not yet a confirmed reversal. Derivatives Warning: A recent CoinGlass snapshot showed approximately $67.73M in 24H SOL liquidations, with 97% coming from longs. Open interest fell 10.83% to around $4.23B, while funding turned negative. This points to substantial long-position unwinding rather than a simple spot-market decline. Fundamental Context: Solana's October ecosystem developments included the Alpenglow mainnet upgrade, targeting approximately 150ms finality, and record RWA value of $5B. Institutional activity also expanded through tokenized funds and payment integrations. These developments strengthen the network's longer-term case, but they do not automatically prevent short-term price weakness. Key Figures - Bybit screenshot price: $67.89 - 24H change: -12.28% - 24H high/low: $77.39 / $67.41 - Immediate support: $67.41 - First resistance: $68.91–$70.17 - Derivatives OI snapshot: $4.23B, down 10.83% - 24H liquidations snapshot: $67.73M, 97% longs A sustained hold above $67.41 could create room for a relief bounce. A breakdown would keep downside risk elevated. Reclaiming $70.17 is an early recovery signal; the 4H averages remain the larger resistance zone. Will Solana's growing institutional adoption be strong enough to counter the current leverage-driven selling pressure? NFA. DYOR. #ByXIMPACT

$DATAUSDT is approaching a critical support area after another leg of selling. The price is down 3.03% on the Bybit screenshot, but the bigger concern is the alignment of the moving averages: sellers still control the 4H and 1H structure, while the latest 15M bounce has not yet reclaimed its full resistance band. Market Structure: DATA is trading around $0.0927, with a 24H high of $0.1002, low of $0.0915 and Bybit turnover of approximately $1.65M. On 4H, price remains below MA7 ($0.0959), MA14 ($0.0961) and MA28 ($0.0978). The 1H chart is similarly weak, with all three averages above price. On 15M, price has recovered above MA7 ($0.0923), but remains below MA14 ($0.0929) and MA28 ($0.0936). This looks more like an early relief bounce than a confirmed trend reversal. Fundamental Context: Data Network has repositioned around AI data infrastructure, focusing on sourcing, consent, provenance and quality verification for human-contributed training data. Its Trace and Poseidon components aim to make data records verifiable and usable by AI developers. The key question is whether this infrastructure can attract sustained customers and real economic activity. Supply Risk: Approximately 361.38M DATA are circulating against roughly 1.035B total supply. Data is also released continuously, with estimated weekly emissions of around 4.02M tokens. That continuing supply can add pressure when market demand is weak. Key Figures - Bybit price: $0.0927 - 24H change: -3.03% - 24H high/low: $0.1002 / $0.0915 - 4H resistance: $0.0959–$0.0978 - Market cap: approximately $33.1M - Circulating supply: approximately 361.38M DATA - 7D performance: approximately -18% A sustained hold above $0.0915 followed by a reclaim of $0.0936 would improve the short-term picture. Losing $0.0915 could extend the decline. Can Data Network turn its AI data infrastructure into enough real demand to overcome continuous token emissions? NFA. DYOR. #ByXIMPACT

$NIGHTUSDT is gaining momentum, but the most important signal is not simply the 12% daily rise. Price has broken above its recent consolidation zone, and expanding volume suggests that buyers are becoming more active. The challenge now is whether this move can hold above the breakout area. Market Structure: NIGHT is trading around $0.05002, up 12.13% on the Bybit screenshot. The 24H range is $0.04419–$0.05095, with turnover near $2.69M. The 4H chart is bullish: price is above MA7 ($0.04671), MA14 ($0.04591) and MA28 ($0.04495). The 1H chart shows the same alignment, with all three averages below price. On 15M, price is also above MA7 ($0.04971), MA14 ($0.04927) and MA28 ($0.04823). However, the recent rejection near $0.05095 makes this a level to watch closely. Fundamental Context: Midnight is building a privacy-focused blockchain using zero-knowledge technology. Its economic design separates NIGHT from DUST: holding NIGHT generates DUST, the renewable resource used for transactions and smart-contract execution. This distinction is important because NIGHT is not directly consumed as transaction gas. Tokenomics: Midnight's official tokenomics specifies a maximum supply of 24 billion NIGHT. The key long-term question is whether real network usage creates sustained demand for NIGHT and its DUST-generating utility. Key Figures - Bybit price: $0.05002 - 24H change: +12.13% - 24H high/low: $0.05095 / $0.04419 - 4H support: $0.04671–$0.04591 - Immediate resistance: $0.05095 - Maximum supply: 24B NIGHT A confirmed break above $0.05095 could extend the bullish move. Losing $0.04671 would weaken the short-term structure. Can Midnight turn its privacy technology into real network demand that supports NIGHT beyond speculative momentum? NFA. DYOR. #ByXIMPACT

$CAPUSDT is showing a strong breakout, but the sharp rejection from $0.12993 is an important warning: momentum has improved, yet buyers still need to prove they can defend the new price zone. Market Structure: CAP is trading around $0.11497, up 9.45% on the Bybit screenshot, with a 24H range of $0.10251–$0.12993 and turnover of 10.33M. On the 4H chart, price is above MA7 ($0.10843), MA14 ($0.10599) and MA28 ($0.10373), confirming a bullish moving-average structure. The 1H chart also remains above its three averages, although the pullback after the large green candle shows profit-taking. On 15M, price has slipped below MA7 ($0.11559), but remains above MA14 ($0.11214) and MA28 ($0.10991). Project Context: Cap is a DeFi credit protocol combining a digital dollar, credit platform and financial guarantee market. CAP is designed for governance and exposure to protocol-revenue-funded buybacks. This creates a potential connection between protocol activity and token value, but actual revenue and buyback execution matter more than the narrative alone. Supply Risk: Around 1.56B CAP is circulating against a 10B maximum supply. That means only about 15.6% is currently circulating, leaving substantial future dilution potential. Strong price action must therefore be evaluated alongside adoption and token unlocks. Key Figures - Bybit price: $0.11497 - 24H change: +9.45% - 24H high/low: $0.12993 / $0.10251 - 4H MA7/14/28: $0.10843 / $0.10599 / $0.10373 - Market cap: approximately $169M - Circulating supply: approximately 1.56B CAP A sustained move above $0.12993 would strengthen the breakout case. Failure to hold $0.109–$0.112 could invite a deeper retest. Can CAP turn this breakout into sustained growth despite its large remaining unlock supply? NFA. DYOR. #ByXIMPACT

$LUNCUSDT is testing the lower edge of its recent trading range, but the three-timeframe structure still favours sellers. At $0.00003664, LUNC is down 2.29% on the Bybit chart, sitting just above the 24H low of $0.00003644. The important question is whether this area attracts genuine buyers or simply becomes another pause before further downside. Market Structure: The 4H chart remains clearly bearish. Price is below MA7 at $0.00003713, MA14 at $0.00003749 and MA28 at $0.00003842. The 1H structure is also weak, with price below all three averages. On 15M, the averages are tightly clustered around $0.00003666–$0.00003679, showing short-term compression rather than a confirmed reversal. Key Levels: Immediate support is $0.00003644. A decisive breakdown could expose lower price discovery. On the upside, $0.00003679 is the first short-term hurdle, followed by $0.00003713–$0.00003749. Reclaiming $0.00003842 would be a more meaningful improvement in the 4H structure. Fundamental and Derivatives Context: LUNC’s circulating supply remains enormous at roughly 5.52 trillion tokens, while its market capitalization is around $200 million. Recent market data also shows negative futures funding and open interest near $13.8 million, suggesting bearish positioning is present. However, negative funding alone does not guarantee a price rebound; sustained spot demand is still needed. Key Figures - Bybit price: $0.00003664 - 24H change: -2.29% - 24H high/low: $0.00003800 / $0.00003644 - 4H resistance: $0.00003713–$0.00003842 - Market cap: approximately $200M - Circulating supply: approximately 5.52T LUNC A hold above $0.00003644 followed by a reclaim of the short-term averages could create room for a relief bounce. Losing support, however, would keep downside pressure dominant. Can LUNC attract enough spot buying to reverse this structure, or will sellers force another breakdown? NFA. DYOR. #ByXIMPACT

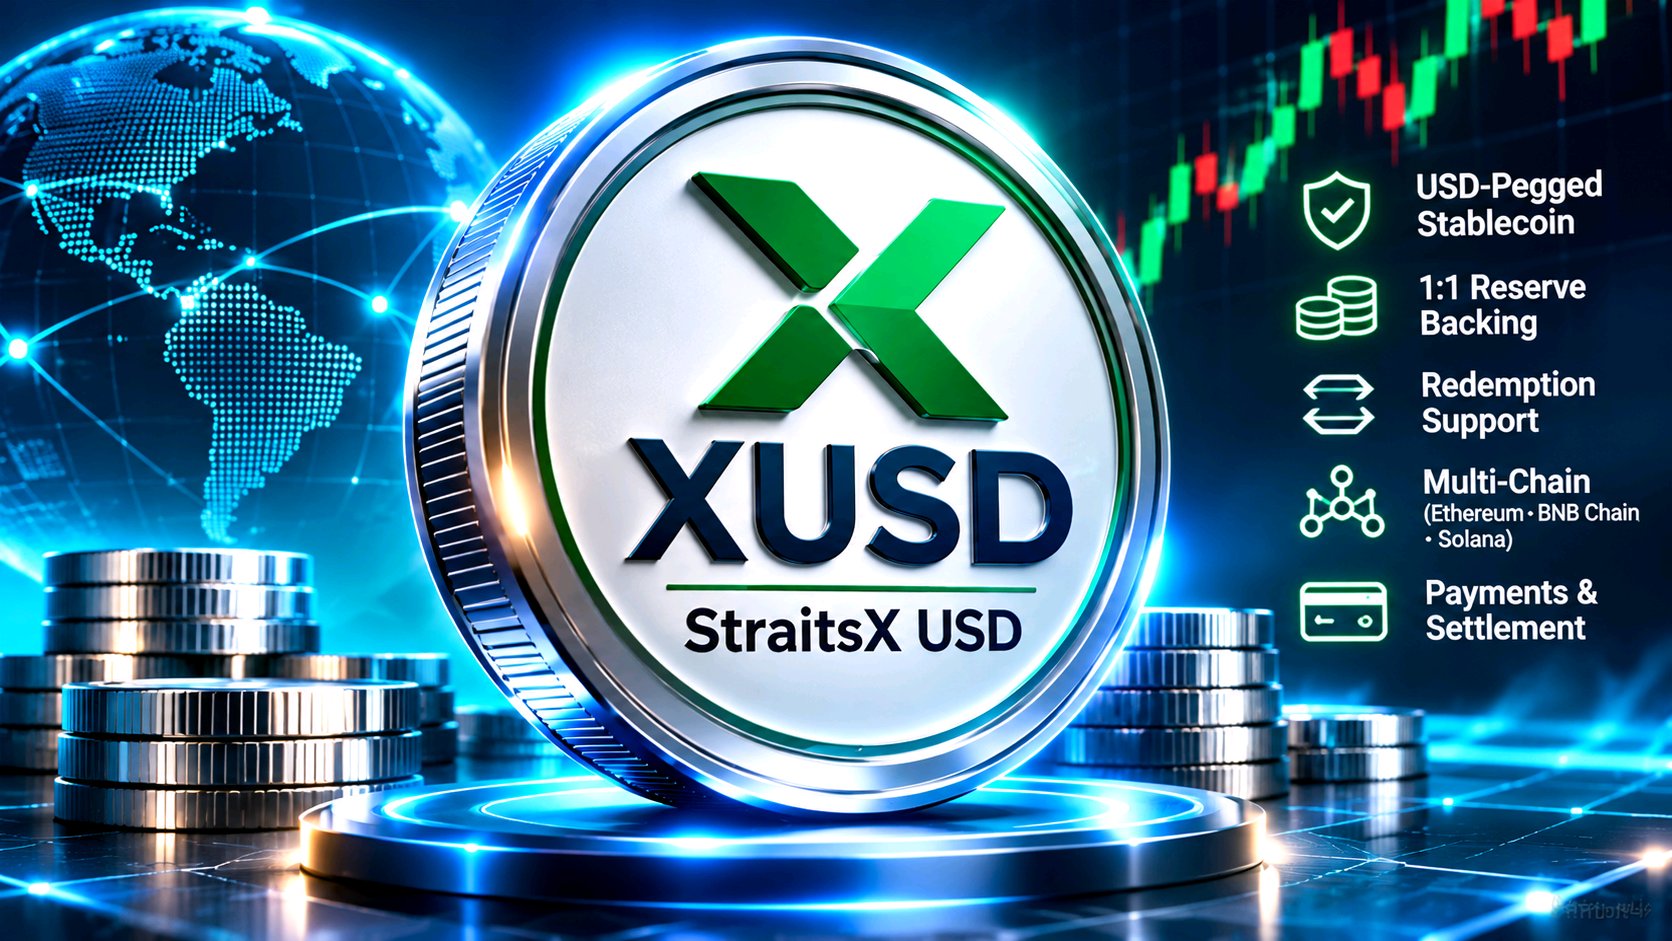
$XUSDUSDT is holding close to its $1.00 peg, but the real test for StraitsX is whether reserve transparency, redemption reliability and growing payment adoption can strengthen confidence in its stablecoin ecosystem. In the supplied Bybit chart, XUSD trades near $1.0007, down approximately 0.04% over 24 hours. Its 24H range is $1.0004–$1.0013, with turnover around $27.83K. The narrow range indicates relative peg stability rather than a conventional bullish or bearish trend. Fundamental Research: Reserve Backing and Real Utility StraitsX states that XUSD is backed by reserve assets equivalent to at least 100% of outstanding tokens. These assets are held in segregated trust accounts for token holders. Eligible users can mint and redeem XUSD through the StraitsX platform at a 1:1 USD reference rate, subject to account verification and applicable conditions. The important distinction is that reserve backing is not the same as guaranteed instant redemption under every circumstance. Reserve quality, banking arrangements and operational access remain essential risks to monitor. XUSD is designed for digital payments, cross-border transfers and business settlement. Its presence across Ethereum and BNB Smart Chain expands its potential reach, but network availability alone does not prove strong payment adoption or deep liquidity. Key Figures - Bybit price: ~$1.0007 - 24H change: ~-0.04% - 24H range: $1.0004–$1.0013 - Bybit turnover: ~$27.83K - Market capitalization: ~$41.13M - 24H market volume: ~$14.24M - Circulating supply: ~41.13M XUSD - Reserve backing requirement: At least 100% - Redemption reference: 1 XUSD = 1 USD - 7D movement: Approximately -0.02% in the latest external snapshot CoinGecko's latest market data also places XUSD close to its dollar peg, reinforcing the importance of stability rather than speculative price appreciation. Bullish Confirmation: Maintaining the $1.00 peg, increasing circulating supply, stronger trading liquidity and consistent reserve reporting would support wider adoption. Bearish Confirmation: A sustained deviation below $1.00, declining liquidity or concerns about reserve accessibility could weaken market confidence. XUSD's long-term success depends on converting stablecoin infrastructure into trusted, recurring payment usage. The real achievement is not a price rally, but reliable dollar access. Can StraitsX turn its multi-chain presence into stronger real-world payment adoption while maintaining confidence in its $1.00 peg? NFA. DYOR. #ByXIMPACT
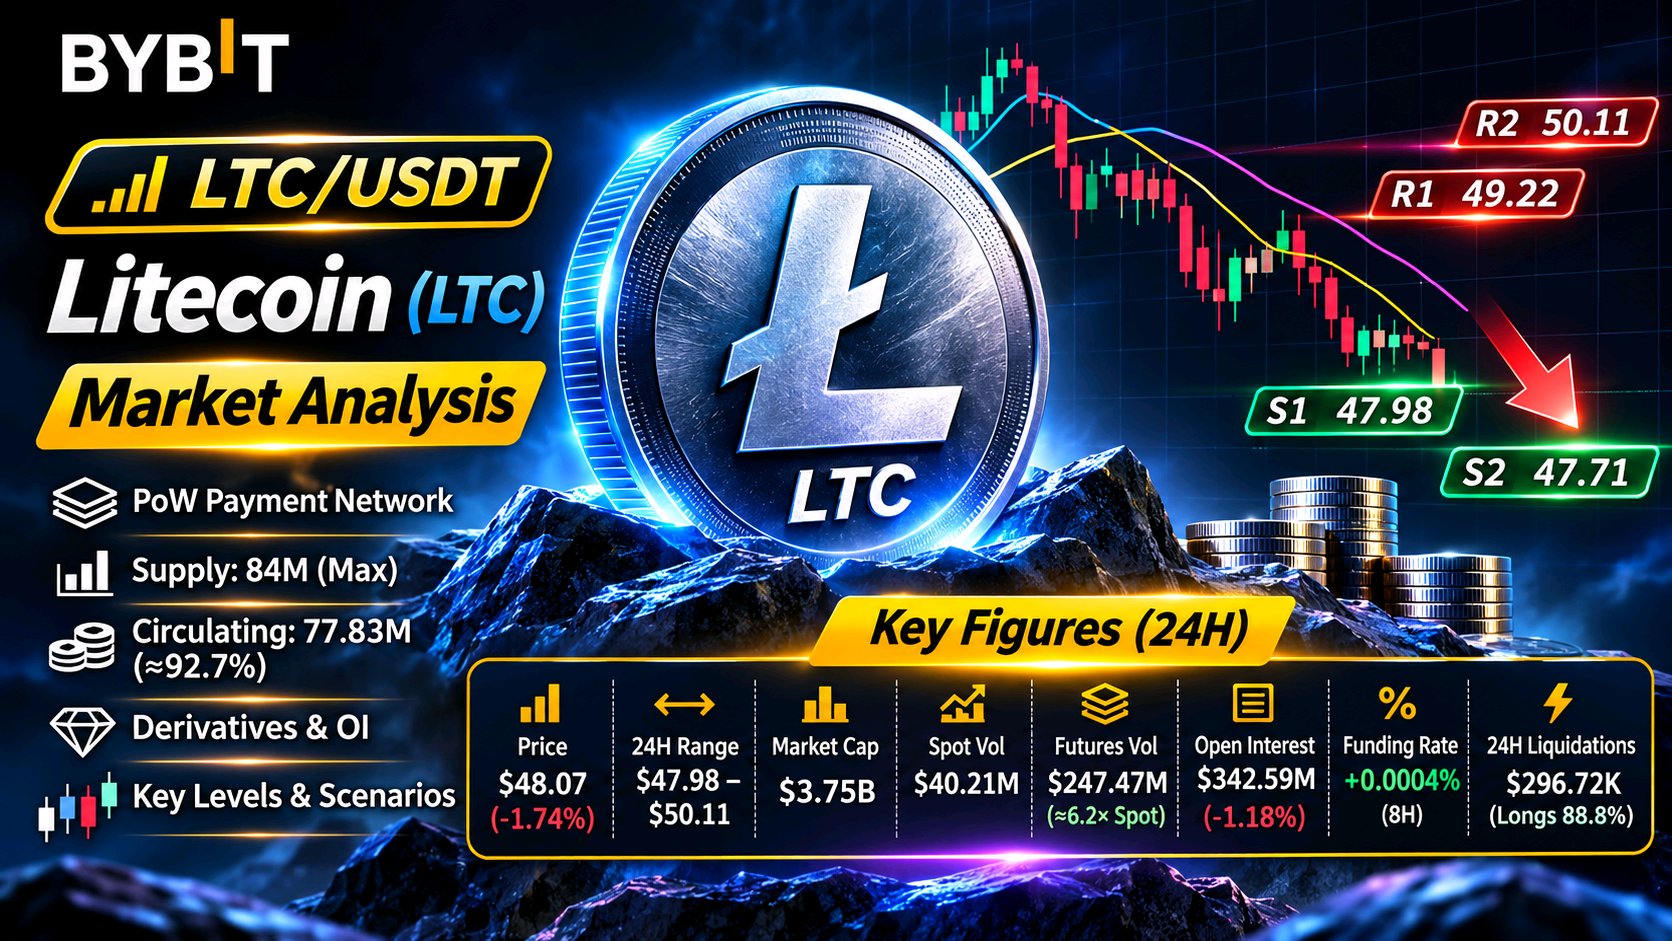
$LTCUSDT is approaching a critical support test: Litecoin has slipped below all three moving averages across the 15M, 1H and 4H charts, while derivatives positioning shows that leveraged activity remains substantially larger than spot trading. The question is whether buyers can defend $47.98 before another downside leg develops. Key Figures — 24H Market Snapshot In the supplied Bybit chart, LTC trades at $48.07, down 1.74%. The displayed 24H high is $50.11, low $47.98, and turnover approximately $3.85M. A separate market-wide snapshot from November 14 reports: - Price: $48.17 - Market capitalization: $3.75B - 24H spot volume: $40.21M - 24H futures volume: $247.47M - 7D performance: -7.55% - Circulating supply: 77.83M LTC - Maximum supply: 84M LTC - All-time high: $412.96, approximately 88.3% above the current price Derivatives Research — Leverage Versus Spot Demand The latest CoinGlass snapshot reports: - Open Interest: $342.59M, down 1.18% over 24H - OI/Market Cap: 9.13% - Weighted Funding Rate: +0.0004% per 8 hours - 24H Liquidations: $296.72K - Long Liquidations: $263.61K - Short Liquidations: $33.10K - Futures/Spot Volume Ratio: approximately 6.2x The important contradiction is that futures volume dominates spot activity while OI is declining. This suggests some existing positions are being reduced rather than a clear expansion of fresh leverage. Long liquidations account for roughly 88.8% of reported liquidations, showing that bullish positions absorbed most of the forced exits. Funding remains close to neutral, so the market is not displaying an extreme funding imbalance. Fundamental Context — Scarcity and Network Utility Litecoin remains a proof-of-work payment network with a fixed maximum supply of 84 million LTC. Approximately 92.7% of that supply is already circulating. Its established payment utility and long operating history support its relevance, but limited supply alone does not guarantee price appreciation. Sustainable demand and actual network usage remain essential. Technical Structure — Three-Timeframe Weakness On 4H, LTC is below MA7 ($48.93), MA14 ($49.11) and MA28 ($49.99). The 1H chart is also bearish, with all averages above price: $48.58, $49.03 and $49.11. On 15M, price remains below MA7 ($48.21), MA14 ($48.48) and MA28 ($48.61). Key Levels and Conditional Scenarios - Immediate support: $47.98–$47.71 - Resistance: $48.38, $48.61 - Stronger resistance: $49.03–$49.22 - Major recovery barrier: $49.99–$50.11 A sustained 1H recovery above $48.61 could open a move toward $49.03 and $49.22. A break above $50.11 would improve the broader recovery case. Conversely, losing $47.71 would expose LTC to further downside. Will Litecoin defend its $47.71–$47.98 support zone, or does declining open interest and heavy long liquidations suggest that the market needs another round of position cleansing? NFA. DYOR. #ByXIMPACT
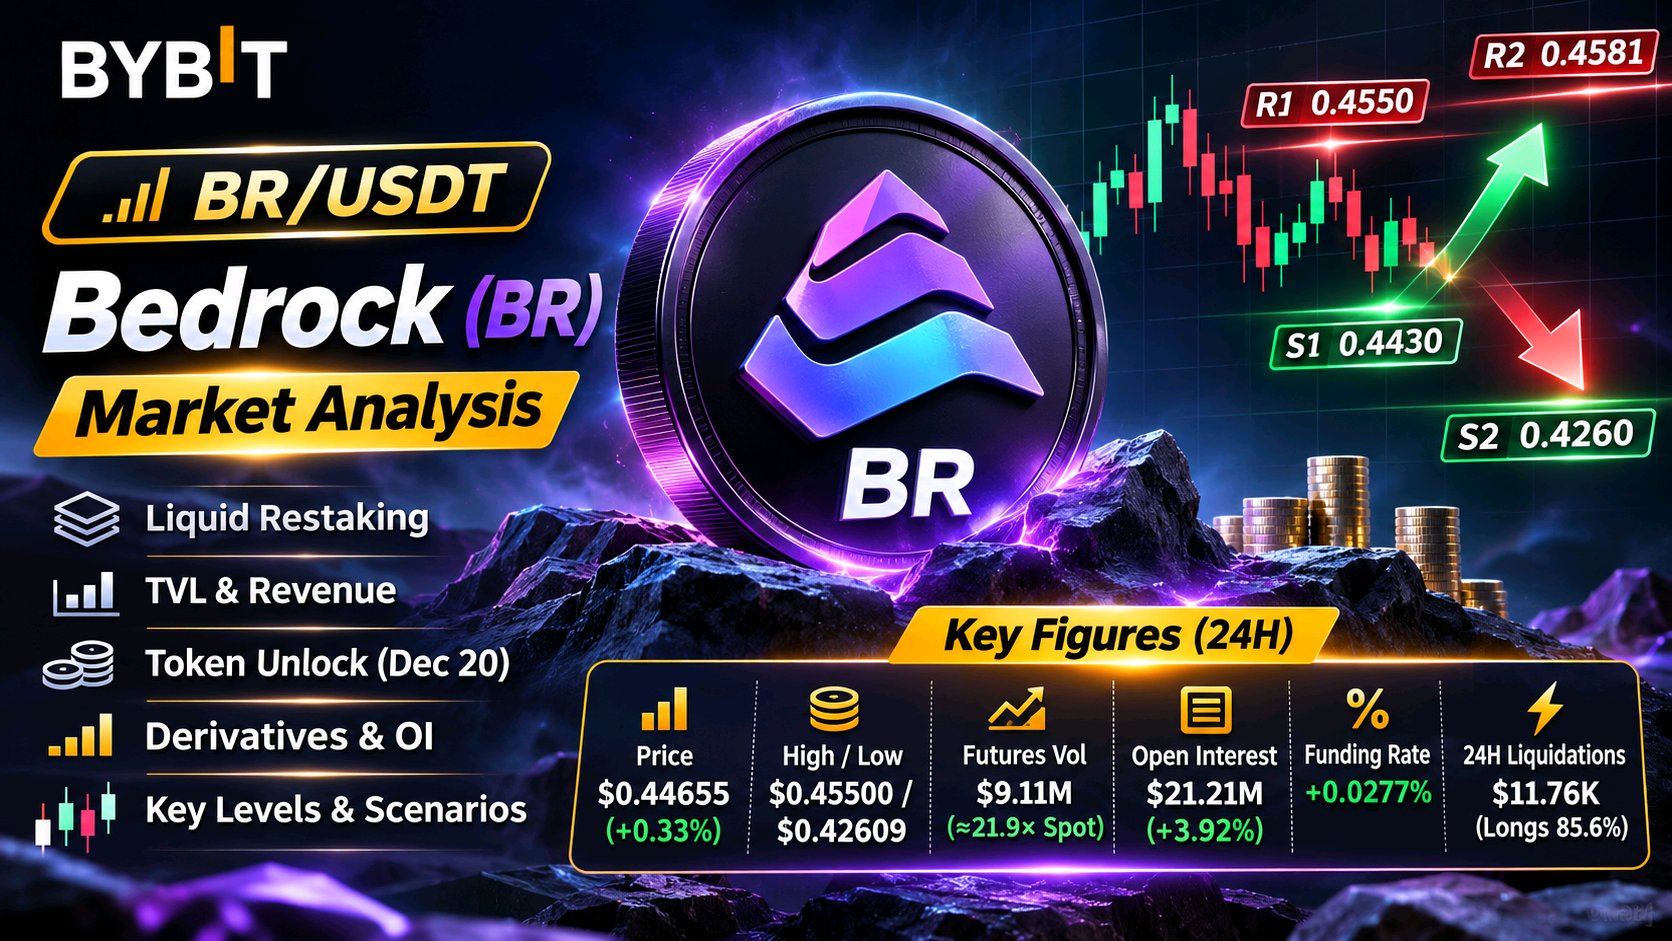
$BRUSDT is attempting to recover, but the derivatives market is sending a warning: futures volume is nearly 22 times spot volume. The real test is whether this leveraged activity can turn into sustained spot demand before the next major token unlock. 24H Market Snapshot: Price Versus Participation In the supplied Bybit chart, BR trades around $0.44655, with a 24H gain of approximately 0.28–0.33%. The session range is $0.42609–$0.45500, while turnover is approximately $138.95K. The separately updated CoinGlass market snapshot reports a market capitalization near $132.14M, 24H futures volume of $9.11M and spot volume of $415.54K. Futures activity is approximately 21.9 times spot volume. Derivatives: Where Positioning Becomes Important The latest reported figures show: - Open Interest: $21.21M, up 3.92% over 24H. - OI/Market Cap: 16.05%. - Weighted Funding Rate: +0.0277%. - 24H Liquidations: $11.76K — $10.06K longs and $1.71K shorts. - Spot Netflow: -$88.5K. - Futures Netflow: +$38.6K. This combination deserves attention. Rising OI with positive funding suggests growing leveraged participation and a cost for maintaining long positions. However, negative spot netflow alongside positive futures netflow shows that spot and derivatives demand are not confirming each other. The available snapshot does not provide a reliable numerical long/short ratio, so that figure should not be assumed. Fundamental Research: Adoption Versus Token Value Bedrock's ecosystem includes uniBTC, uniETH and uniIOTX, targeting liquid restaking across multiple networks. DeFiLlama reported approximately $281.27M TVL, but this had declined 27.4% over 30 days. During the same period, protocol fees were $63,041 while protocol revenue was only $6,913. That gap is important: ecosystem activity does not automatically translate into equivalent value for BR holders. Supply is another major consideration. Tokenomics tracking lists a December 20 unlock of approximately 70.8M BR, worth around $30.9M at its quoted valuation, equivalent to 7.1% of maximum supply. This could create additional selling pressure if demand remains weak. Technical Structure: Three Timeframes On 4H, price is above MA7 ($0.44318) and MA14 ($0.44414), but below MA28 ($0.45815). On 1H, price is above MA7 ($0.44151), MA14 ($0.44072) and MA28 ($0.44277). The 15M structure is also positive, with price above MA7 ($0.44562), MA14 ($0.44474) and MA28 ($0.43959). Key Levels and Conditional Scenarios Immediate resistance is $0.44904, followed by $0.45500 and the 4H MA28 near $0.45815. Support sits around $0.4430–$0.4410, followed by $0.4395, $0.4333 and the major chart low at $0.42609. A volume-backed 1H breakout above $0.44904 would strengthen the recovery case. Failure to hold $0.4410 would weaken momentum, while a break below $0.42609 would invalidate this recovery setup. Can Bedrock convert its leveraged trading activity into real spot demand before the December unlock increases the available supply? NFA. DYOR. #ByXIMPACT
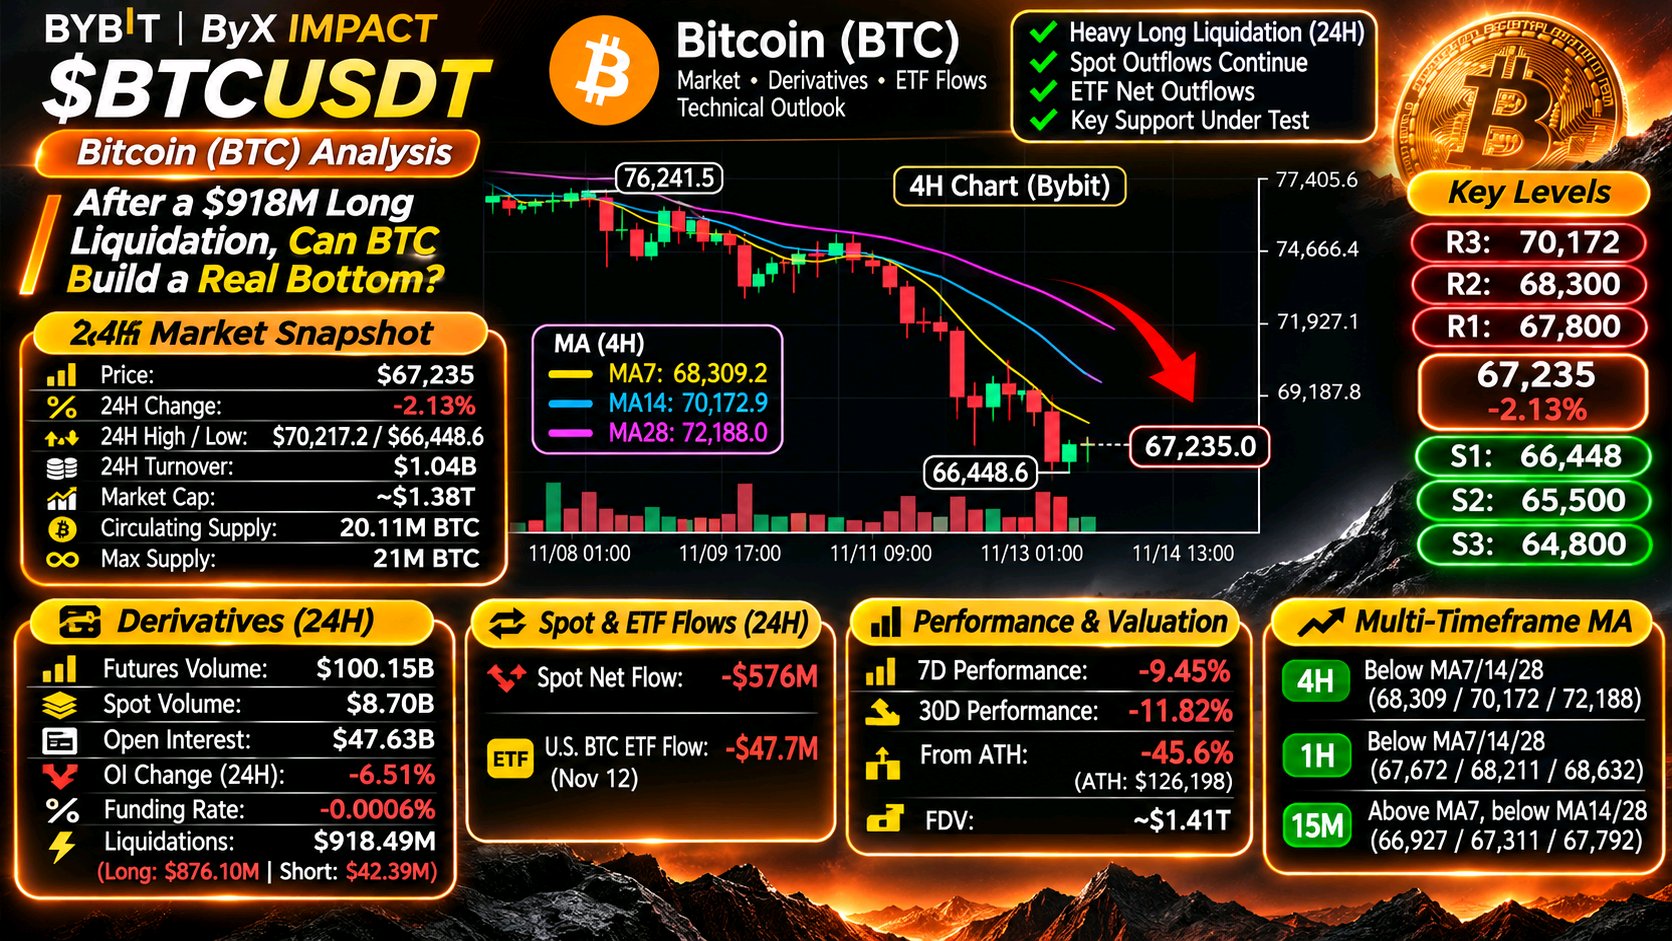
$BTCUSDT is showing a dangerous gap between short-term buying and the broader market trend. Bitcoin has bounced from $66,448.6, but the recovery is still struggling beneath its key moving averages. The important question is whether this is genuine accumulation or simply a temporary pause after leveraged traders were forced out. 24H Market Snapshot — Key Figures - Price: $67,235 - 24H Change: -2.13% - 24H High: $70,217.2 - 24H Low: $66,448.6 - Bybit screenshot turnover: approximately $1.04B - Market capitalization: approximately $1.38T - Circulating supply: approximately 20.11M BTC - Maximum supply: 21M BTC - 7D performance: approximately -9.45% Derivatives: the leverage imbalance The reported 24H derivatives figures show approximately $47.63B in BTC futures open interest, down 6.51%. Futures volume reached around $100.15B, compared with $8.70B in spot volume. Weighted funding was slightly negative at -0.0006%. Total BTC liquidations were reported near $918.49M, with approximately $876.10M coming from long positions. This is the overlooked detail: long traders absorbed most of the liquidation pressure, yet the market has not established a convincing reversal. Forced selling can reduce excessive leverage, but it cannot create lasting demand by itself. Spot Demand and Institutional Positioning Reported 24H spot flows showed approximately $576M in net BTC outflows. U.S. spot Bitcoin ETFs also recorded around $47.7M in net outflows on November 12. These figures suggest that institutional and spot demand still need to improve before the recovery can be trusted. Technical Structure — Three Timeframes The 4H chart remains bearish: BTC is below MA7 ($68,309), MA14 ($70,172) and MA28 ($72,188). The 1H chart also shows price below MA7 ($67,672), MA14 ($68,211) and MA28 ($68,632). On the 15M chart, price has recovered above MA7 ($66,927), but this is only a short-term improvement. Key Levels — Conditional Trading Plan - Support S1: $66,448 - Support S2: $65,500 - Support S3: $64,800 - Resistance R1: $67,800 - Resistance R2: $68,300 - Resistance R3: $70,172 - Bullish confirmation: 4H close above $68,300 with stronger volume - Bearish confirmation: sustained breakdown below $66,448 A confirmed recovery could open the way toward $69,187 and $70,172. Losing $66,448 would keep downside pressure active. These are conditional scenarios, not guaranteed targets. The real question: After such a heavy long-liquidation event, will spot buyers finally step in, or is Bitcoin still vulnerable to another downside move? NFA. DYOR. #ByXIMPACT