Wave1
Content Creator || Signal Provider|| BNB holder || Trader .
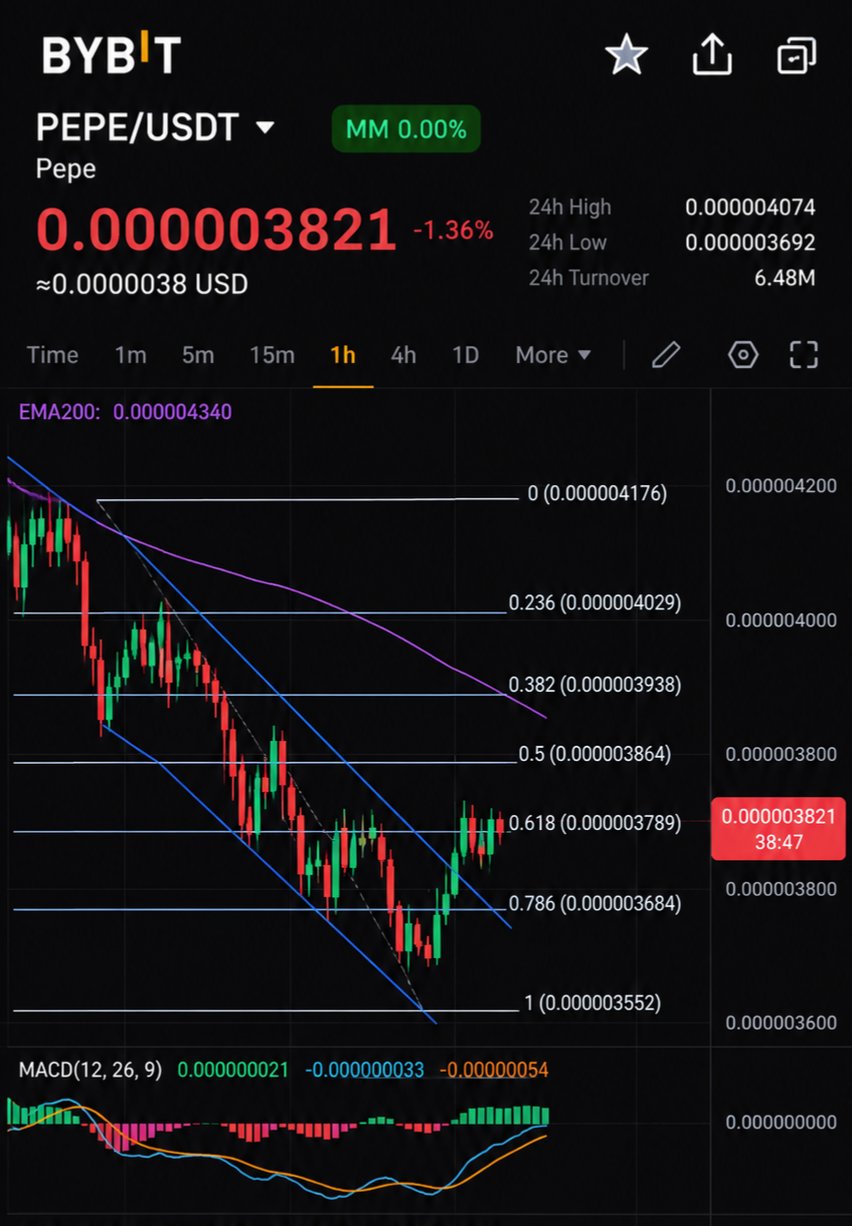
PEPE is showing a small recovery, but the 1H chart suggests buyers still have work to do. $PEPE is trading around $0.000003821, up 0.45% over 24 hours. However, price remains below all three key moving averages: MA7: $0.000003858 MA14: $0.000003902 MA28: $0.000003909 This is the level I’m watching closely. The recent bounce from $0.000003692 has not yet changed the short-term structure. PEPE needs to reclaim the $0.00000390 to $0.00000392 zone with stronger volume to show that buyers are gaining control. On the downside, $0.000003764 is the first important support, followed by the recent swing low at $0.000003692. My observation: PEPE is trying to stabilize after a sharp decline, but a green 24H reading alone does not confirm a trend reversal. The real signal will be whether buyers can reclaim resistance and sustain it with volume. $PEPEUSDT #ByXIMPACT
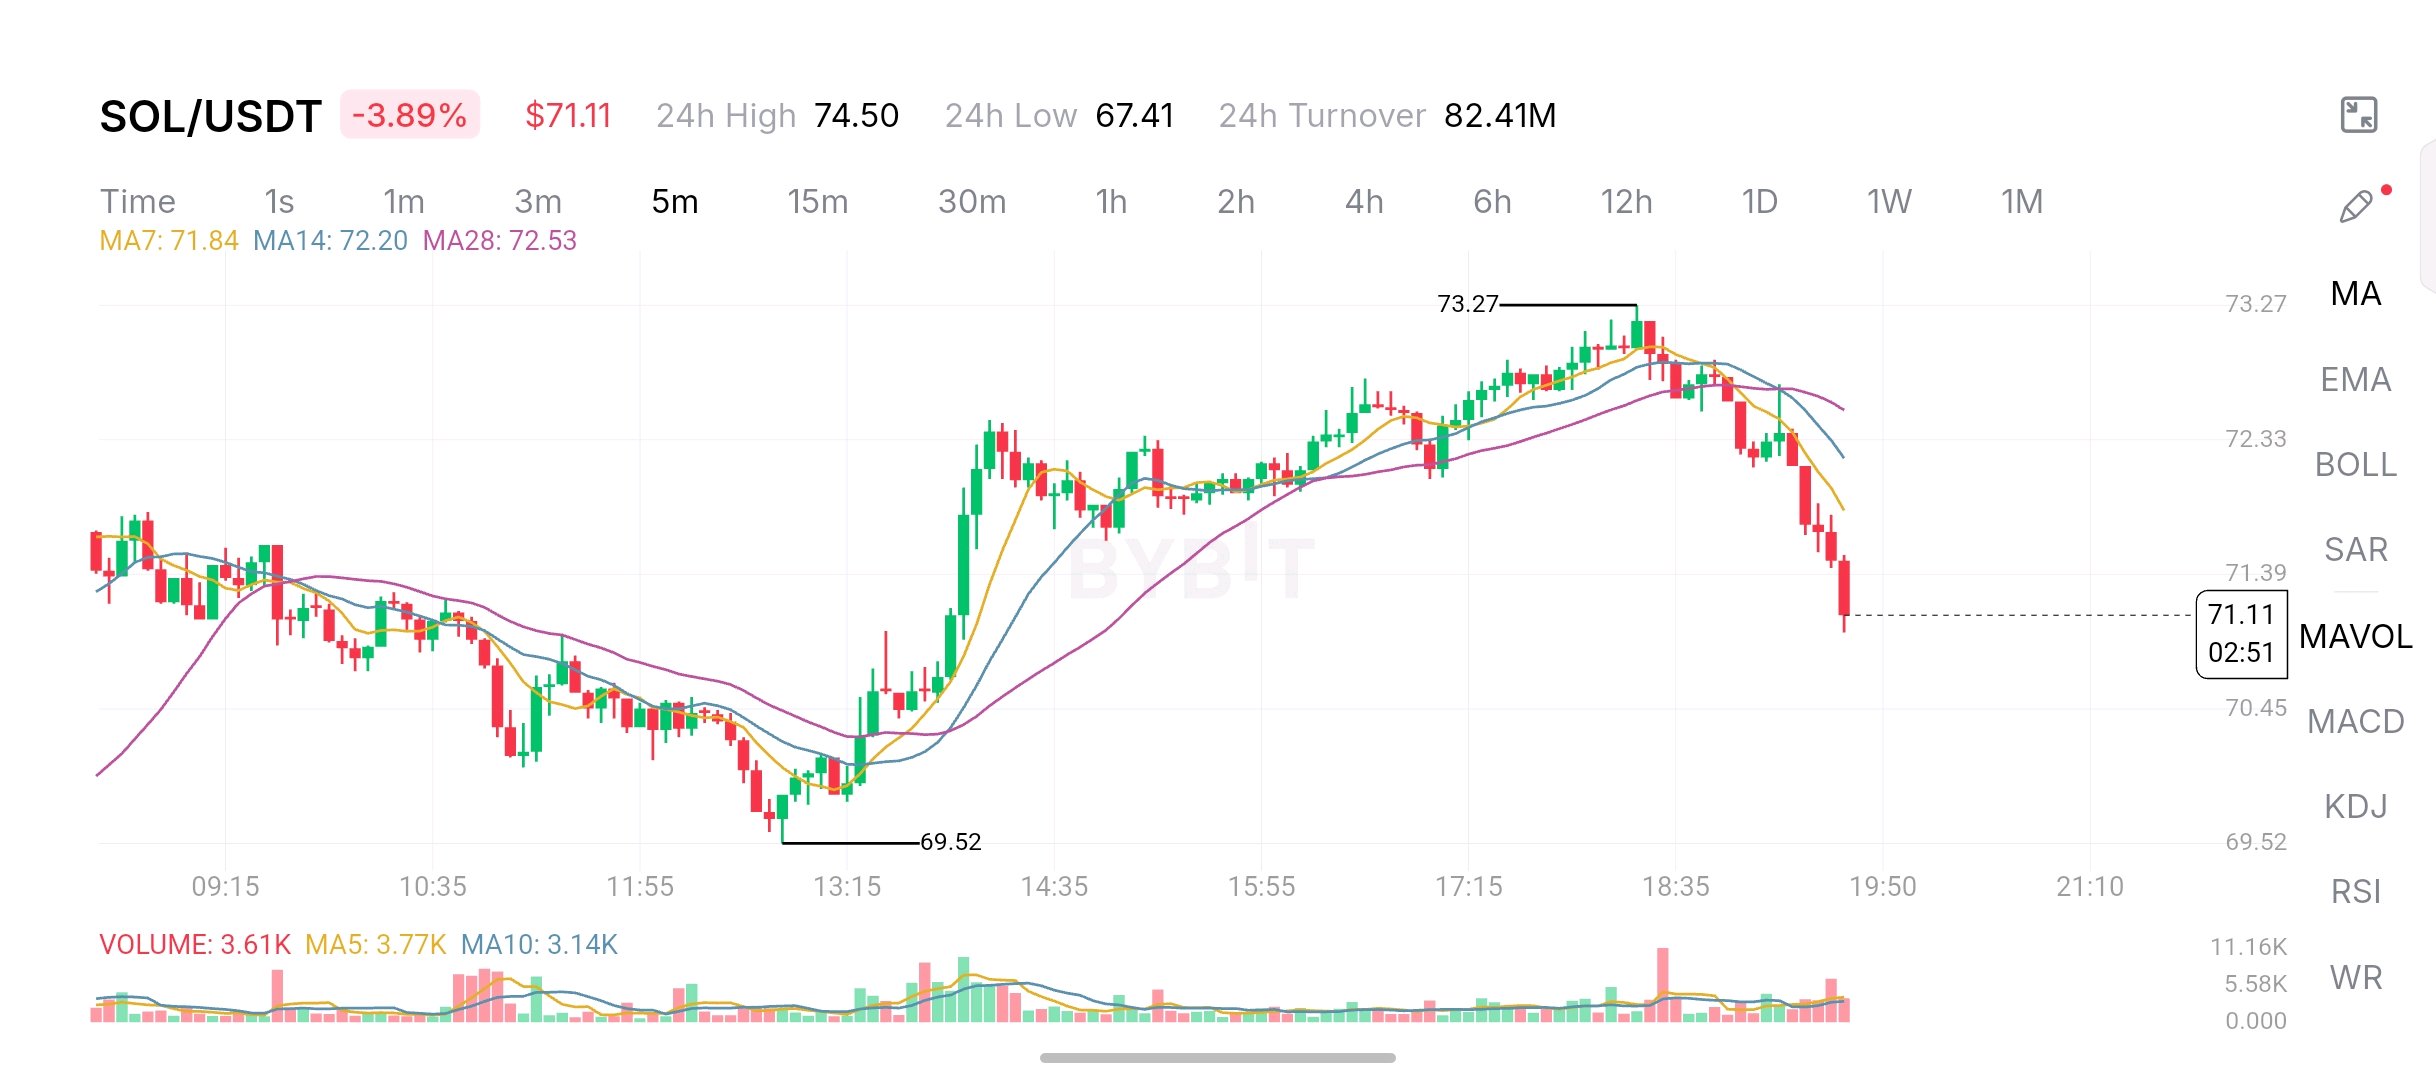
SOLANA IS LOSING MOMENTUM. SELLERS ARE TAKING CONTROL OF THE SHORT-TERM CHART. I have been watching SOL/USDT on the 5-minute timeframe, and the latest price action is showing a noticeable shift in momentum. SOL is trading around $71.11, down 3.89%, after failing to sustain its recovery toward the $73 area. What caught my attention is not just the decline itself, but how quickly sellers took control after the recent local high. What the chart is telling me SOL climbed from a visible intraday low of $69.52 to approximately $73.27 before losing momentum. Instead of building another higher high, the price started forming a downward move. The latest candles show stronger selling pressure, with SOL falling back toward $71. There is another important detail. The price is now trading below all three moving averages: - MA7: approximately $71.84 - MA14: $72.20 - MA28: $72.53 This alignment suggests that short-term momentum has turned bearish. Buyers need to reclaim these averages before I would consider the recovery convincing. Key Market Figures - SOL Price: $71.11 - 24H Change: -3.89% - 24H High: $74.50 - 24H Low: $67.41 - 24H Turnover: $82.41M - Visible Chart High: $73.27 - Visible Chart Low: $69.52 Levels I Am Watching The $71 area is the immediate level to watch. If SOL loses this area and selling volume increases, the next visible reference is around $70.45, followed by the $69.52 intraday low. On the recovery side, SOL needs to reclaim $71.84 first. A stronger move above $72.20 and $72.53 would provide better evidence that buyers are returning. Bullish Scenario I would become more interested in a recovery if SOL holds above $71, builds a higher low, and reclaims the moving-average cluster with stronger buying volume. Bearish Scenario If sellers continue pushing price below $71 while volume expands, the current weakness could extend toward the lower intraday levels. My Final Observation I am not treating this chart as a confirmed trend reversal, but the short-term structure has clearly weakened. One thing stands out to me: SOL managed to recover toward $73, but buyers could not defend that move. For now, I am watching whether $71 becomes support or whether sellers manage to push price lower. The next reaction around this level should tell us more than the current red candles alone. $SOLUSDT #ByXIMPACT
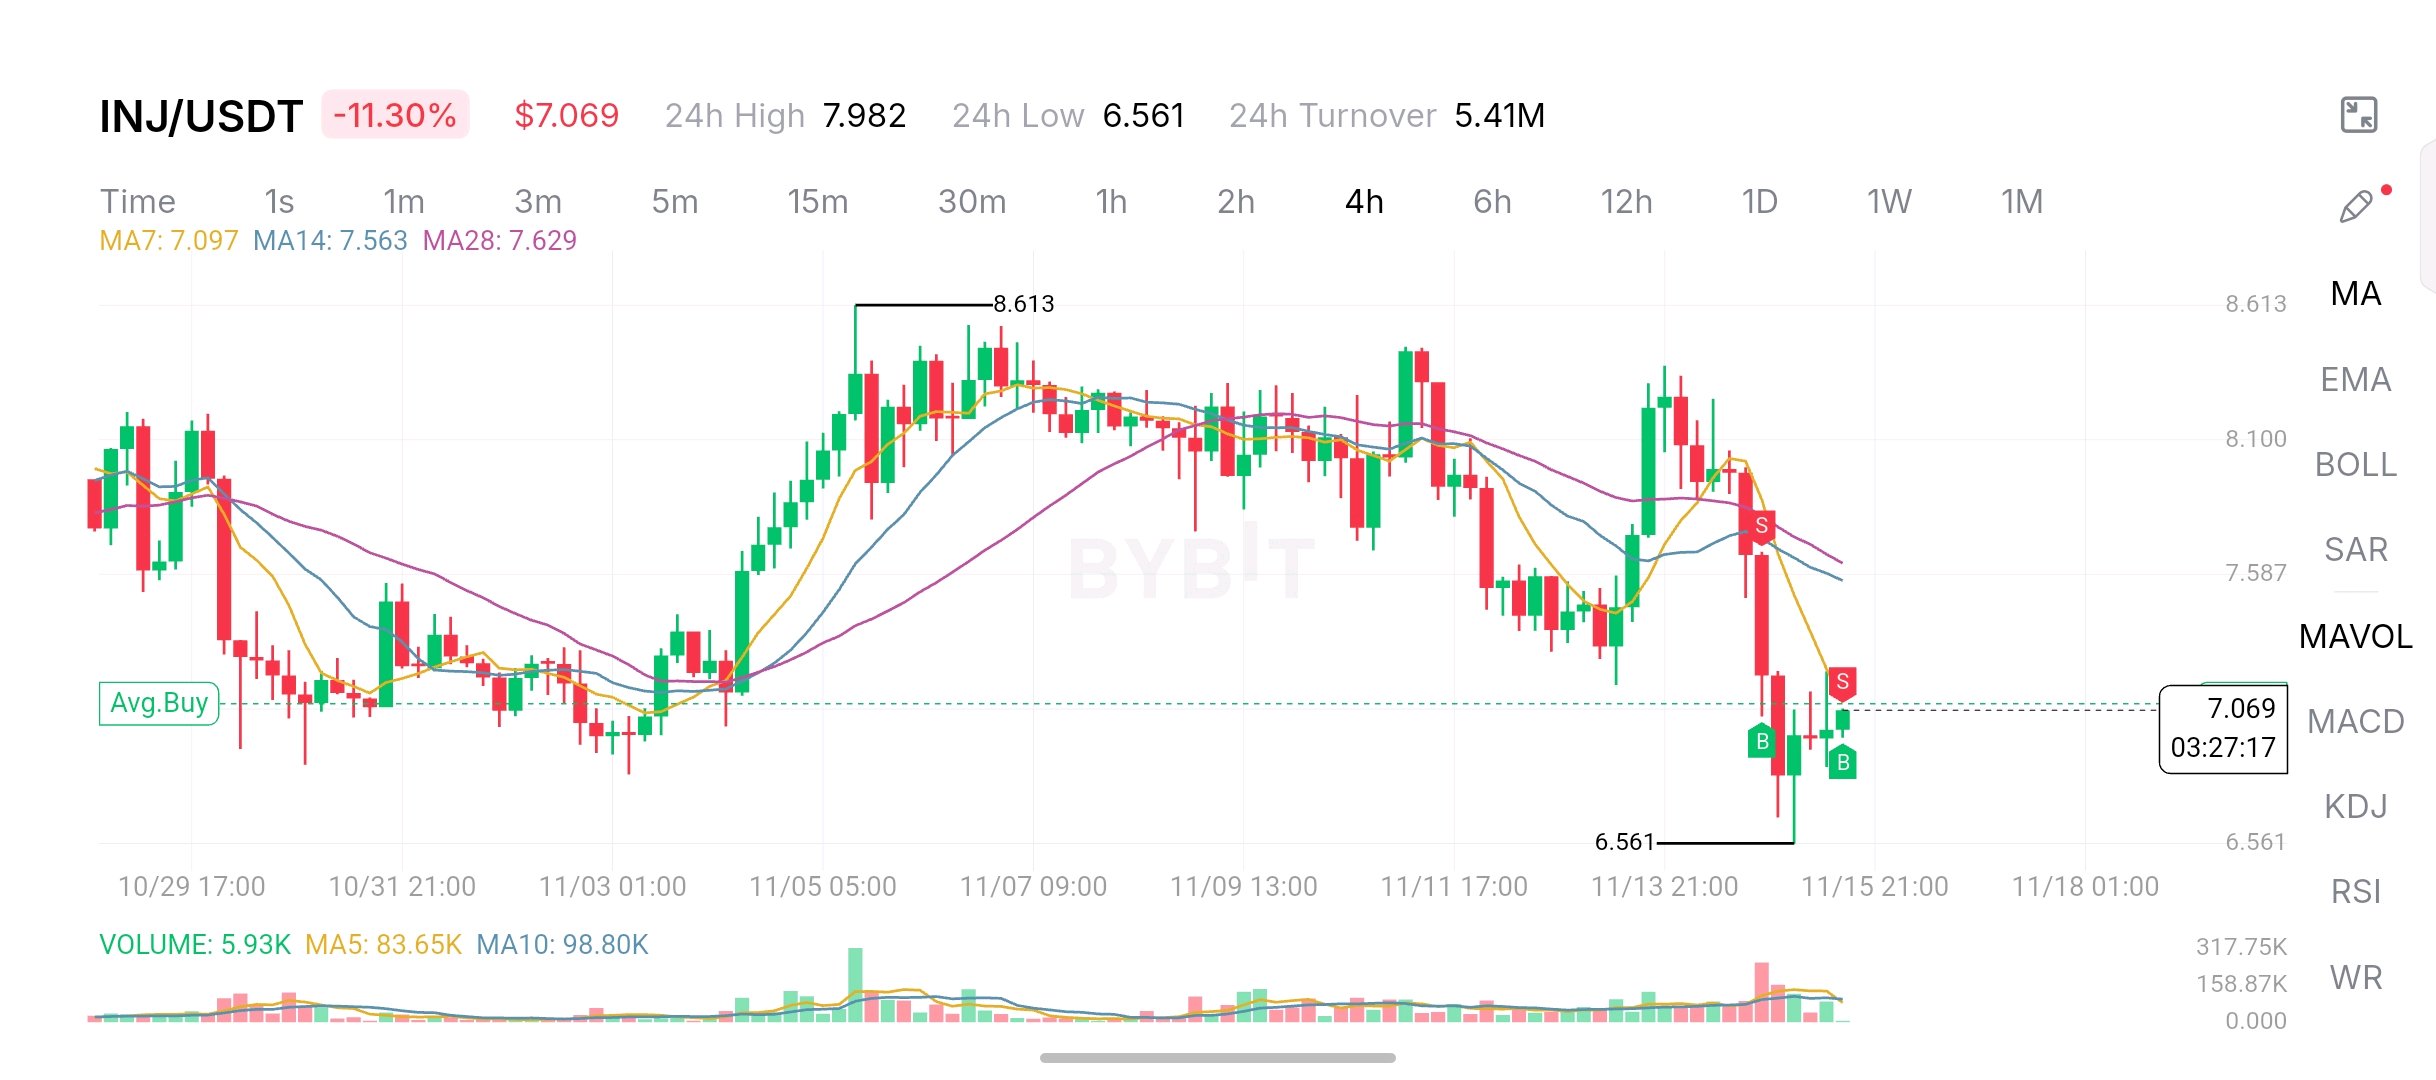
$INJ DROPS 11.30% AS SELLING PRESSURE RETURNS. THE $6.56 SUPPORT ZONE IS NOW CRITICAL! Injective is facing another difficult session, and the latest 4-hour chart shows that sellers are maintaining control despite a small recovery attempt. $INJ is currently trading around $7.069, down approximately 11.30% in 24 hours. The price has dropped from the recent swing high of $8.613 and recently touched $6.561 before bouncing back toward the $7.00 area. What caught my attention is the strength of the latest selling move. The recovery attempts have struggled to reclaim previous levels, while the moving averages continue pointing toward a weak short-term structure. Here are the important technical levels: • MA7: $7.097 • MA14: $7.563 • MA28: $7.629 Price is currently below all three moving averages. Even the short-term MA7 is slightly above the current price, showing that buyers still need to build momentum. Key levels I'm watching: - Immediate support: $6.561 - Psychological level: $7.00 - First resistance: $7.097 - Next resistance: $7.563 - Major resistance: $7.629 If buyers defend $6.561 and push price above $7.097, INJ could attempt a recovery toward the $7.56 area. However, losing the recent low would be a concerning development and could expose the chart to further downside pressure. Volume also deserves attention. The displayed volume is 5.93K, compared with MA5 at 83.65K and MA10 at 98.80K. This suggests the latest bounce has not yet demonstrated strong volume participation. My current observation: I'm not treating this bounce as a confirmed reversal. The broader 4-hour structure remains weak, and buyers need to reclaim important moving averages before the chart starts looking healthier. For now, the $6.561 support and $7.10 resistance are the two levels I'm watching most closely. The real question is whether buyers can turn this recovery attempt into sustained momentum or sellers will push INJ toward another low. $INJUSDT #IMPACTbyTrade
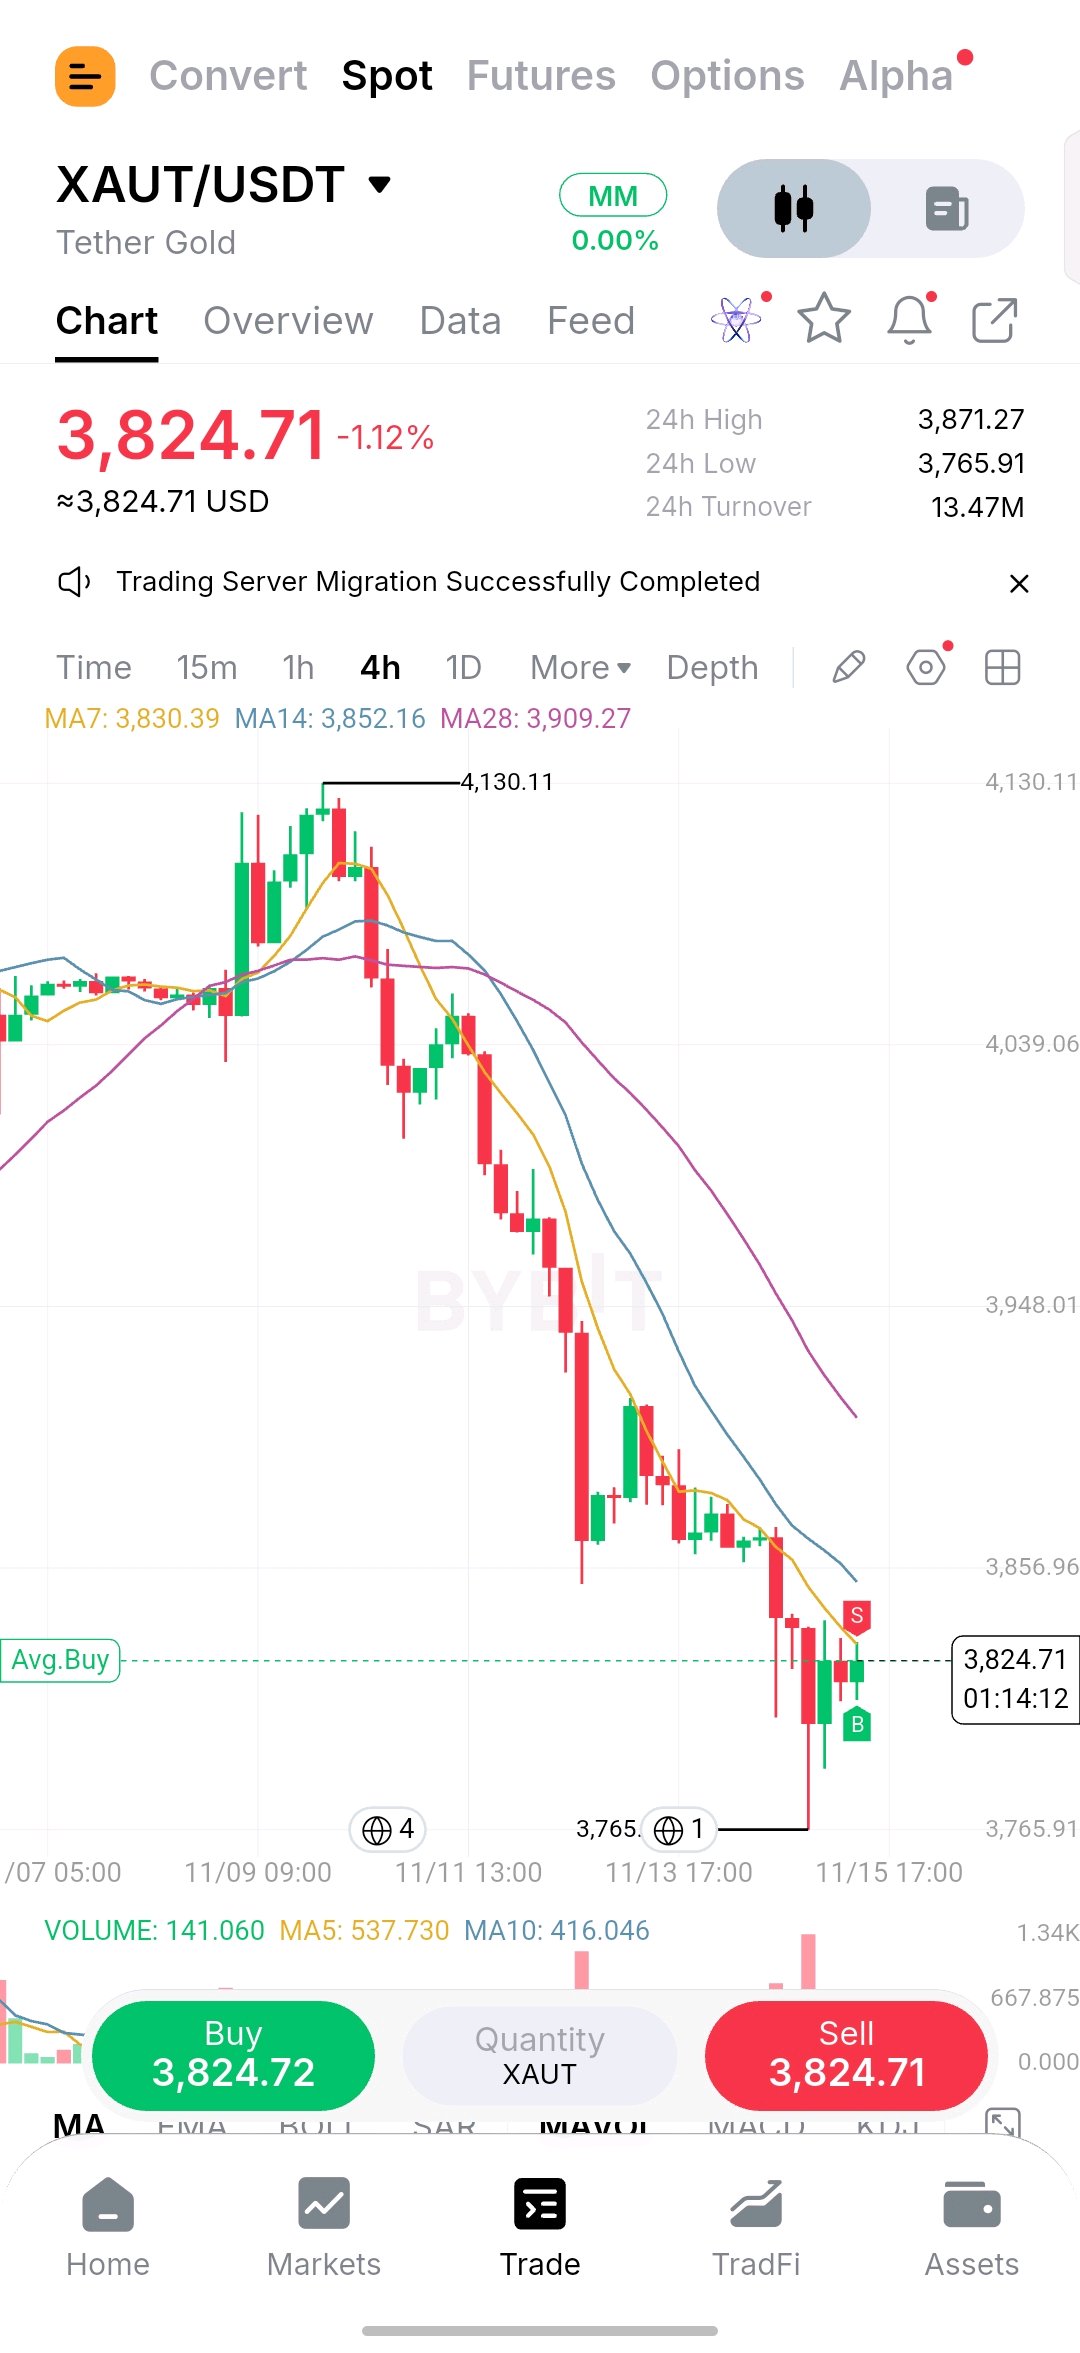
GOLD TOKEN $XAUT FACES SELLING PRESSURE AFTER A SHARP DROP FROM $4,130. CAN BUYERS DEFEND THE $3,765 SUPPORT? Tether Gold is showing a clear shift in momentum, and the latest 4-hour chart suggests sellers are still controlling the short-term direction. $XAUT is currently trading around $3,824.71, down approximately 1.12% in 24 hours. The price has fallen significantly from its recent swing high of $4,130.11 before reaching a daily low of $3,765.91. What caught my attention is the recent reaction around the $3,765 area. After an aggressive sell-off, buyers stepped in and pushed price back toward $3,824. However, this recovery is still facing several technical challenges. The moving averages are showing continued weakness: • MA7: $3,830.39 • MA14: $3,852.16 • MA28: $3,909.27 Price remains below all three moving averages. This indicates that the broader 4-hour structure is still bearish, despite the latest recovery attempt. Key levels I'm watching: - Immediate support: $3,765.91 - First resistance: $3,830.39 - Next resistance: $3,852.16 - Major resistance: $3,909.27 - Previous swing high: $4,130.11 If buyers successfully defend $3,765.91, XAUT could attempt another recovery toward the $3,850 region. However, a sustained move below the recent low would signal that selling pressure remains strong and could expose the market to further weakness. Volume is another important factor. Current displayed volume is 141.060, while MA5 stands at 537.730 and MA10 at 416.046. This suggests the latest bounce has not yet attracted strong volume participation. My current market observation: I'm watching whether this recovery can develop into a stronger move or simply becomes another temporary bounce within the downtrend. For me, reclaiming $3,852 and eventually $3,909 would be important signals of improving momentum. Gold-backed crypto assets are worth watching during uncertain market conditions, but the chart still needs confirmation. The $3,765 support zone is where the next important battle begins. $XAUTUSDT #ByXIMPACT
$PEPE IS FIGHTING TO RECOVER AFTER A SHARP 6.27% DROP. BUT BUYERS STILL HAVE A BIG CHALLENGE AHEAD. PEPE is showing continued weakness on the 4-hour chart, and the latest price action suggests sellers are still controlling the broader short-term trend. Currently trading around $0.000004016, PEPE is down approximately 6.27% in 24 hours. The price has fallen from a recent swing high of $0.000005617 and recently touched $0.000003692 before attempting a small bounce. What caught my attention is how sharply the market structure has changed. After reaching its recent high, PEPE started forming lower highs and lower lows. Every recovery attempt has struggled to maintain momentum, allowing sellers to push the price further down. The moving averages are telling an important story: • MA7: $0.000004002 • MA14: $0.000004211 • MA28: $0.000004488 Price is currently sitting just above MA7 but remains below MA14 and MA28. This means the latest bounce is showing some short-term strength, but a broader recovery is not confirmed yet. Here are the key levels I'm watching: - Immediate support: $0.000003692 - First resistance: $0.000004173 - Next resistance: $0.000004211 - Stronger resistance: $0.000004488 If buyers manage to defend the recent low and reclaim the resistance zone, PEPE could attempt a stronger recovery. However, losing $0.000003692 would weaken the structure further and bring additional downside pressure into focus. Another interesting detail is volume. Current displayed volume is 107.98B, while MA5 stands at 284.26B and MA10 at 330.24B. This suggests the latest price bounce has not yet been accompanied by strong volume participation. My current observation: I'm watching whether this small recovery can develop into something stronger. A few green candles are not enough to confirm a trend reversal. PEPE needs sustained buying volume and a successful reclaim of important moving averages. For now, the $0.000003692 support level is the key area on my watchlist. The next move depends on whether buyers can finally turn this recovery attempt into genuine momentum. $PEPEUSDT #ByXIMPACT
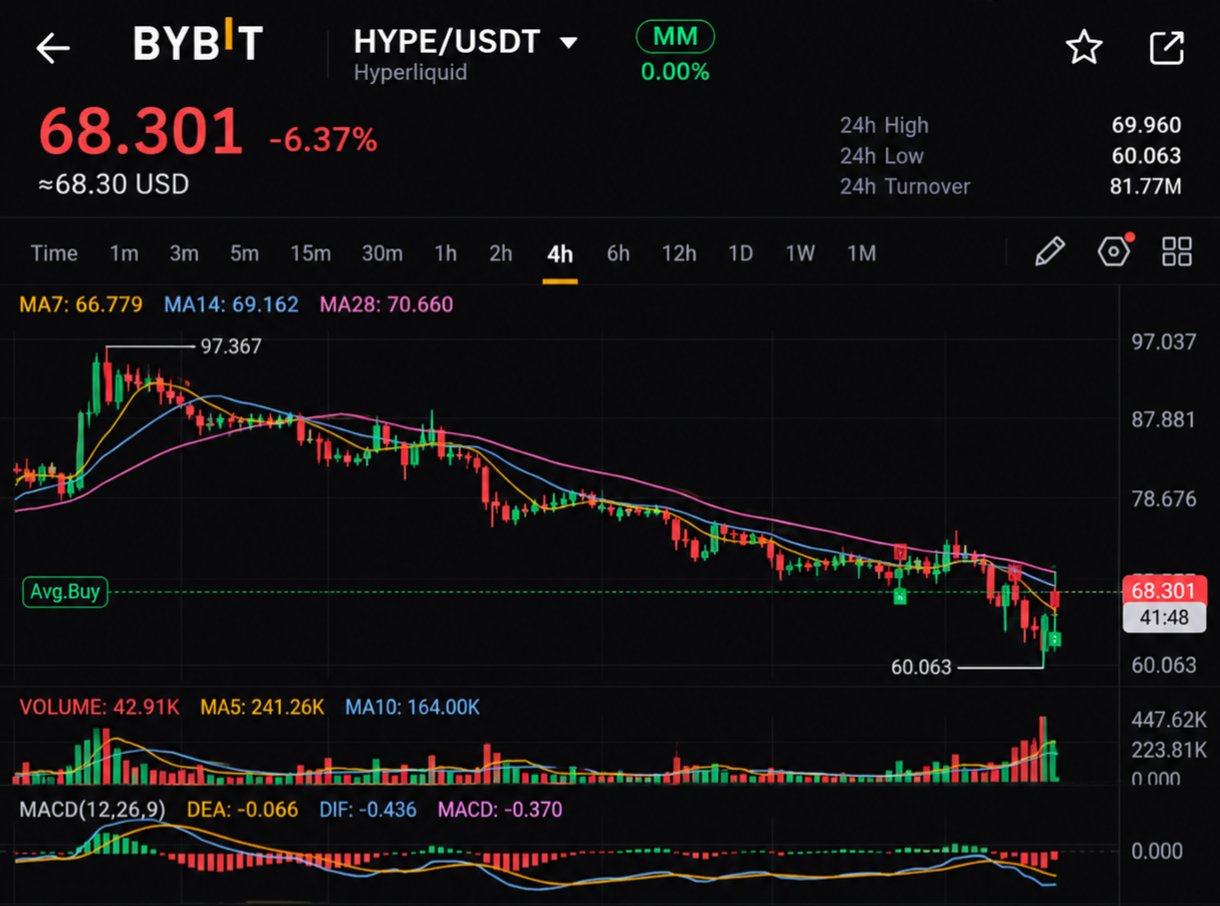
HYPE IS DOWN 6.37%, BUT BUYERS ARE DEFENDING THE $60 SUPPORT ZONE! Hyperliquid ($HYPE) is showing continued weakness on the 4H chart, but its latest price action is worth watching. HYPE is trading around $65.32, with a 24-hour high of $69.96 and a low of $60.06. Trading volume has also picked up during the recent sell-off. Here is what caught my attention: The price has dropped significantly from the $97 region, creating a clear sequence of lower highs and lower lows. The MA7 at $66.779, MA14 at $69.182 and MA28 at $70.660 are all above the current price. This tells me sellers still have control of the broader structure. Key levels I'm watching: - $60.06: Major support and recent swing low. - $66.78: First moving average resistance. - $69.18: MA14 resistance. - $70.66: MA28 resistance. MACD remains negative, while RSI readings are mixed, showing that momentum has not fully recovered despite the recent bounce. My focus now is simple: Can HYPE reclaim $67 and build enough strength to challenge the $69-$70 resistance zone? Or will another rejection bring the $60 support area back into play? The next reaction around these levels could reveal whether this is the beginning of a recovery or just a temporary pause in the downtrend. I'm watching the price action and volume closely. A strong bounce needs confirmation, not just green candles. $HYPEUSDT #IMPACTbyTrade

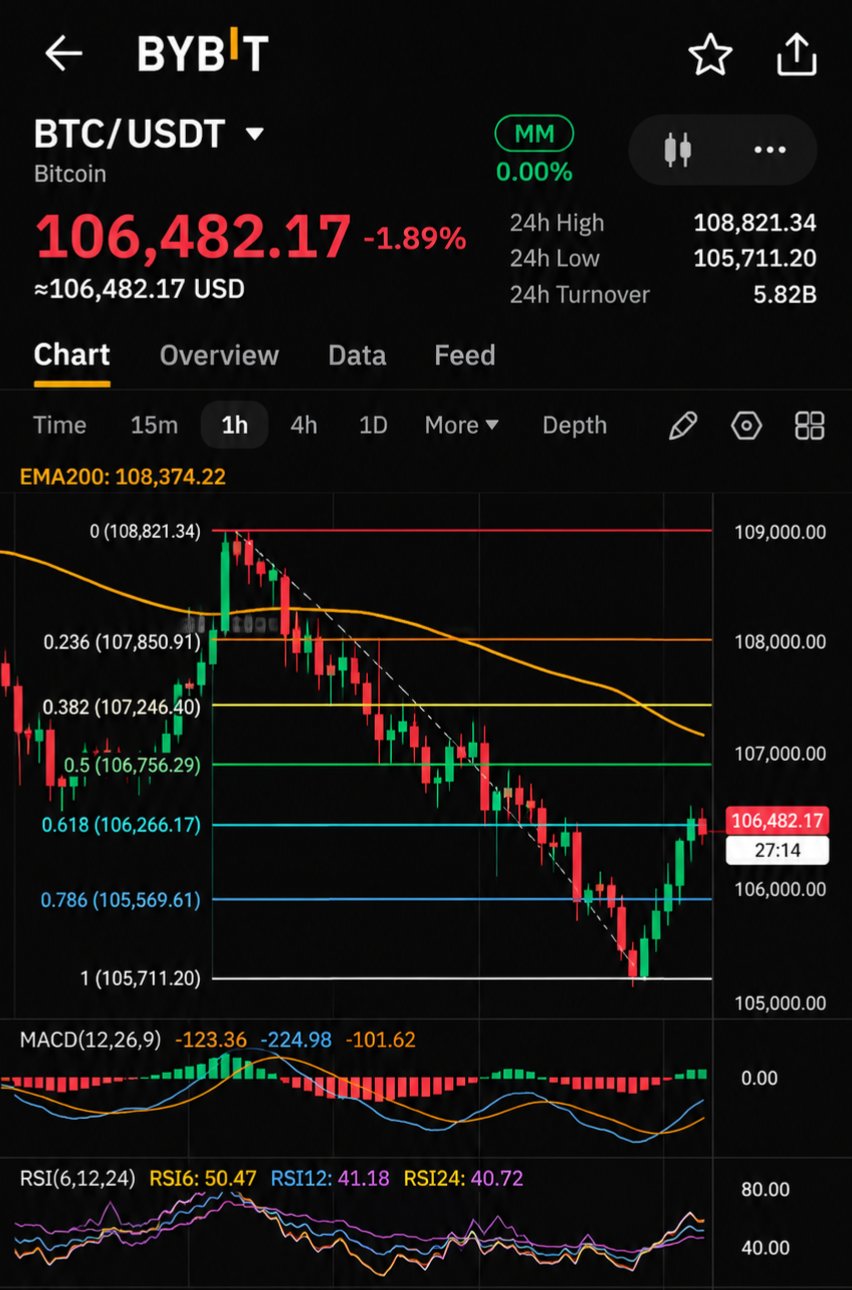
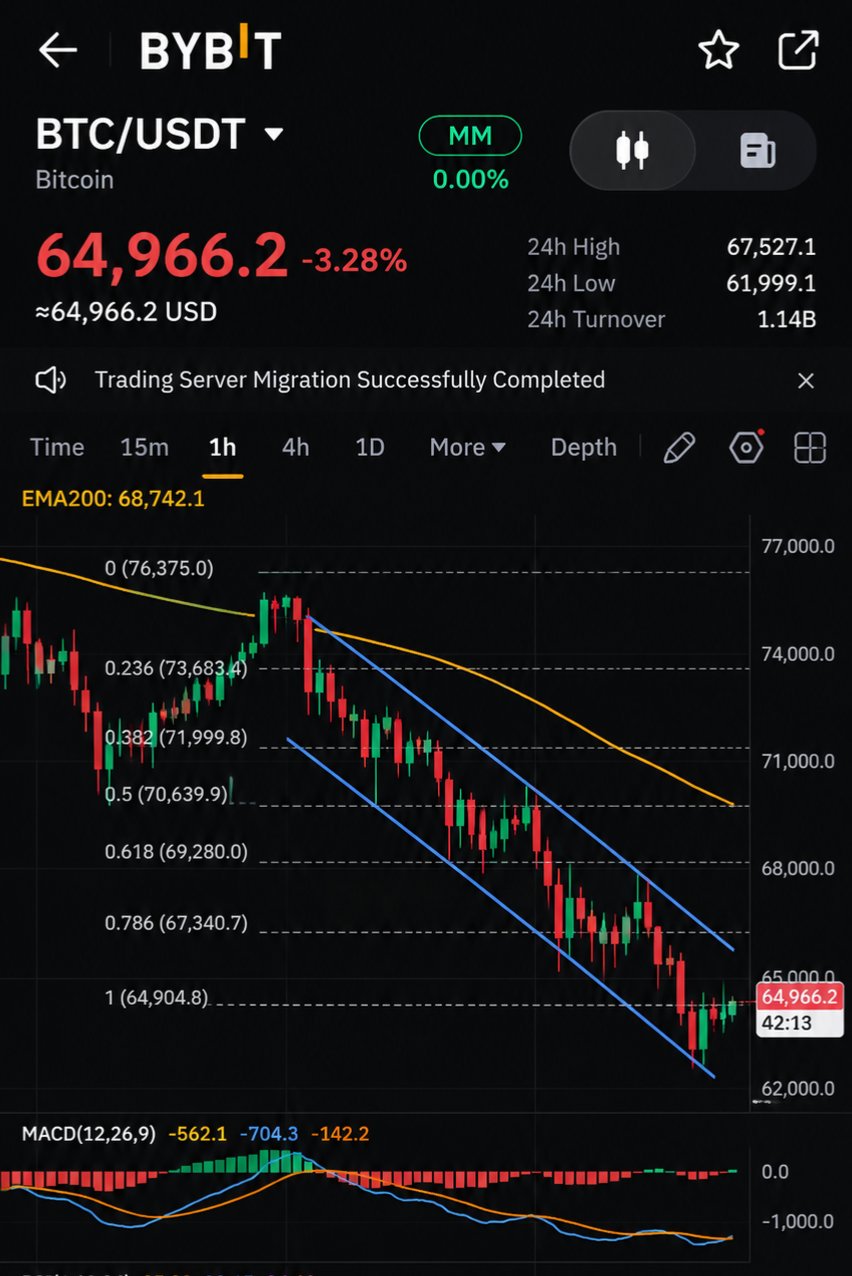
BITCOIN IS STRUGGLING TO RECLAIM $65K AS SELLING PRESSURE CONTINUES! Bitcoin is showing signs of a possible short-term recovery, but the 4-hour chart still tells a bearish story. BTC is currently trading around $64,966, down approximately 3.28% in 24 hours. The market has experienced a sharp decline from the $76,375 region, putting significant pressure on buyers. However, one important development caught my attention: Bitcoin recently tested the $62,000 support zone and managed to bounce back toward $65,000. This suggests that buyers are still defending lower levels, but the question is whether they have enough strength to reverse the current trend. Here are the key technical levels I'm watching: - $62,000: Major support area and recent session low. - $64,966: Current trading area where buyers are attempting to stabilize price. - $65,695: MA7 resistance. - $67,125: MA14 resistance. - $70,236: MA28 resistance and an important recovery level. All three moving averages are positioned above the current price and are trending downward. This indicates that sellers still have control over the broader 4H structure. What could happen next? If BTC reclaims $65,700 with convincing volume, it could open the door toward $67,100. A stronger recovery above that level would improve the short-term technical picture. On the other hand, another rejection could bring $62,000 back into focus. Losing that support would put additional pressure on the market. My observation: Bitcoin has bounced from support, but a bounce alone does not confirm a trend reversal. I'm watching volume, resistance levels and buyer strength before calling this a recovery. The next move around $62K to $67K could provide a much clearer picture of Bitcoin's direction. $BTCUSDT #IMPACTbyTrade

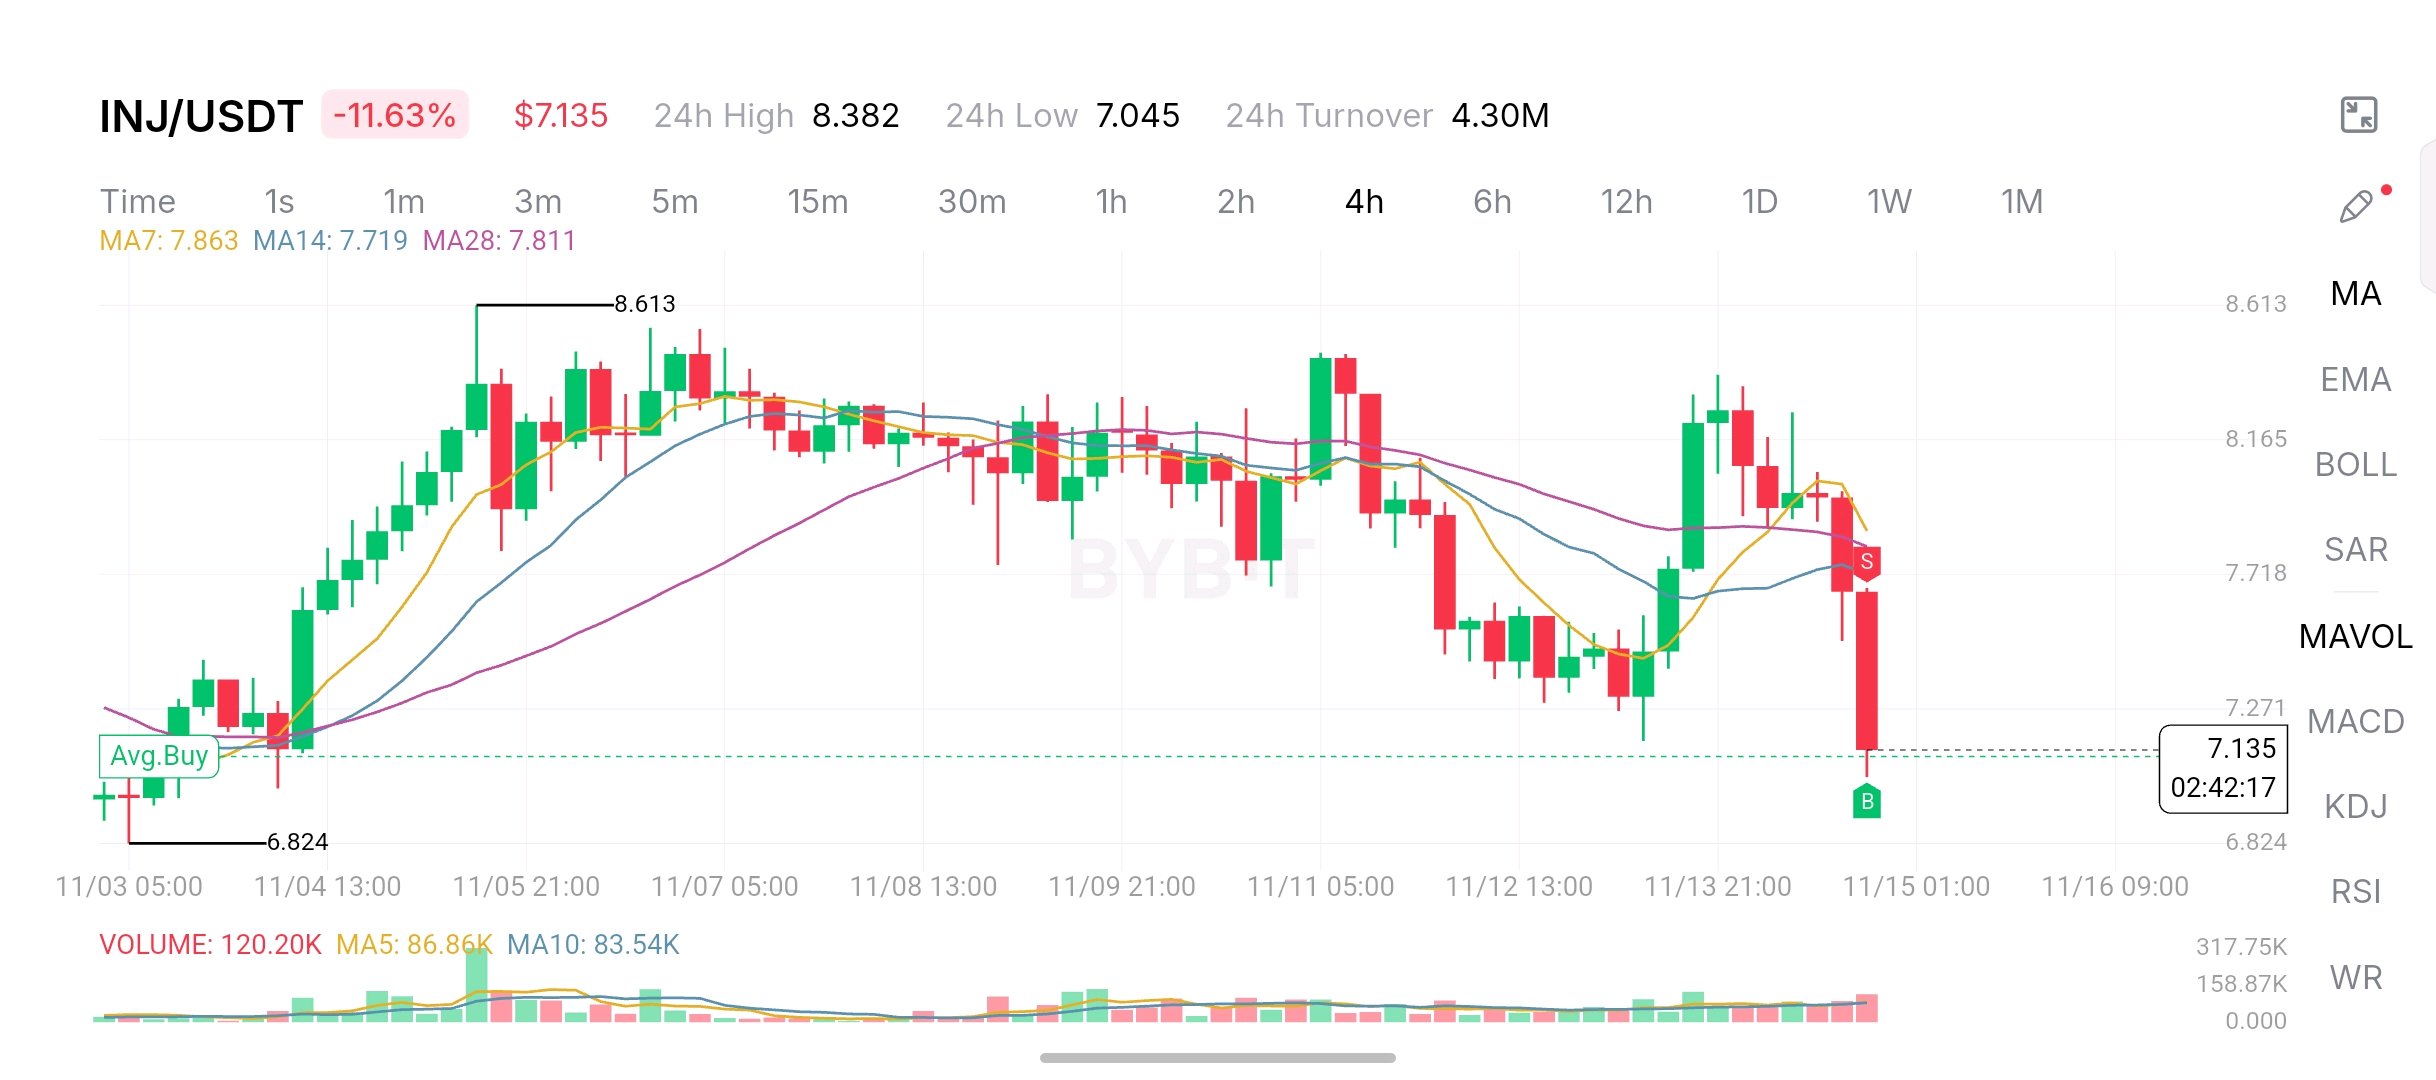
$INJ DROPS 11.63% AS SELLING PRESSURE HITS THE MARKET. THE $7 SUPPORT ZONE IS NOW IN FOCUS. Injective is showing a significant shift in short-term momentum, and the latest 4-hour chart deserves attention. is currently trading around $7.135, down approximately 11.63% in 24 hours. What makes this move interesting is the sharp rejection from the recent recovery area near $8.30, followed by a strong bearish candle pushing price toward its daily low of $7.045. Looking at the chart, buyers attempted to regain control during the November 13 recovery, but the latest move erased much of that progress. The moving averages are also showing weakness: • MA7: $7.863 • MA14: $7.719 • MA28: $7.811 Price is now trading below all three averages. This suggests that sellers currently have the advantage on the 4-hour timeframe. Here are the key levels I'm watching: - Immediate support: $7.045 - Next important support: $6.824 - First recovery resistance: $7.718 - Stronger resistance zone: $7.811 to $7.863 The $7.045 level is particularly important because it represents the recent 24-hour low. If buyers defend this area, INJ could attempt a recovery toward the moving average cluster. However, if selling continues and price loses this support, the previous swing low around $6.824 becomes an important downside reference. Another detail worth watching is volume. The chart shows approximately 120.20K volume, compared with MA5 at 86.86K and MA10 at 83.54K. This suggests increased activity around the latest move. My current observation: I'm not treating this sharp decline as an automatic buying opportunity. The market needs to show that buyers can defend support and reclaim important resistance levels. For now, needs a stronger response from buyers. The next 4-hour candles could be important in determining whether this is a temporary correction or the beginning of another bearish leg. Support defense, volume and a reclaim of the moving averages are what I'm watching next. $INJUSDT #IMPACTbyTrade
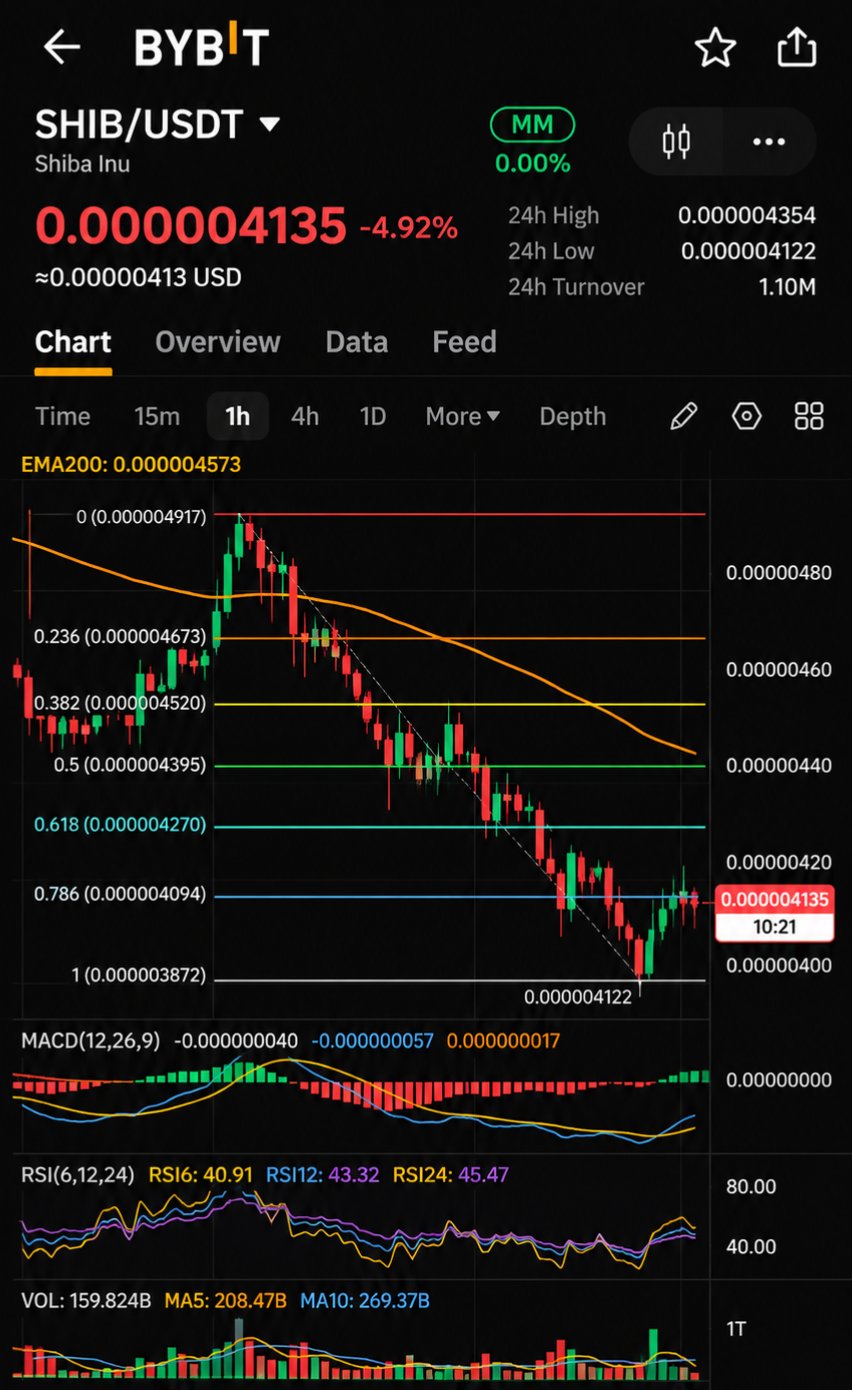
$SHIB IS UNDER PRESSURE AS SELLERS PUSH PRICE TOWARD A CRITICAL SUPPORT LEVEL! Shiba Inu is showing continued weakness, and the latest 4-hour chart suggests buyers still have work to do before any meaningful recovery can develop. $SHIB is currently trading around $0.000004135, down approximately 4.92% over the last 24 hours. The price has recently tested $0.000004122, putting this level at the center of my attention. What makes this setup interesting is the broader chart structure. SHIB has been forming lower highs and lower lows, indicating that sellers have maintained control over the recent price movement. The moving averages are also sending a cautious signal: • MA7: $0.000004208 • MA14: $0.000004251 • MA28: $0.000004336 All three averages are currently above the market price. This means SHIB needs stronger buying pressure to reclaim these levels and improve its short-term structure. Here are the important levels I'm watching: Support: $0.000004122 First resistance: $0.000004208 Next resistance: $0.000004251 Major moving average resistance: $0.000004336 If buyers successfully defend $0.000004122, we could see an attempt to recover toward the moving average cluster. However, a clear breakdown below this support would increase selling pressure and potentially expose SHIB to further downside. Another detail worth watching is trading volume. The current 24-hour turnover is approximately $1.10 million on the displayed market data. I want to see whether buying participation increases during a recovery rather than relying on a few green candles. My market observation: I'm not calling this a reversal yet. The overall 4H structure remains bearish, and reclaiming the moving averages will be an important first step. SHIB needs buyers to demonstrate strength at support. The next reaction around $0.000004122 could tell us a lot about where short-term momentum is heading. $SHIBUSDT #IMPACTbyTrade

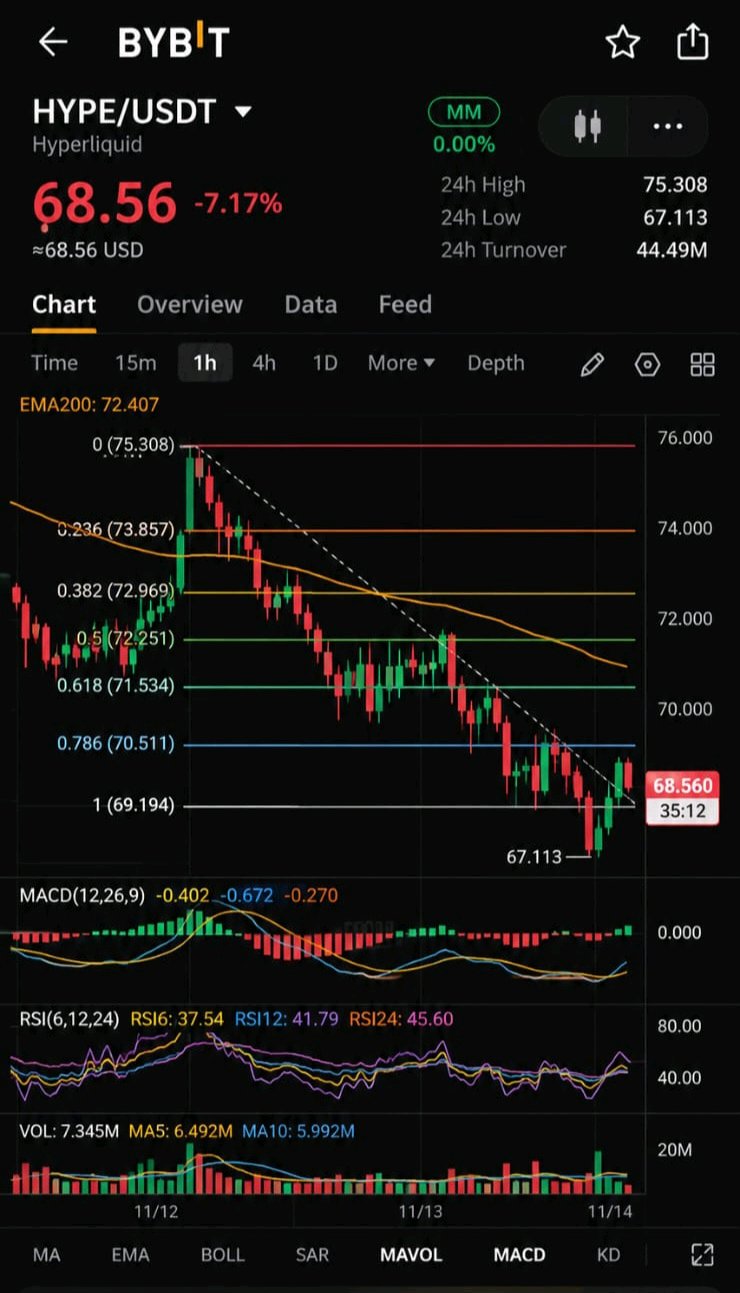
$HYPE FACES SELLING PRESSURE AS PRICE TESTS THE $67 SUPPORT ZONE. I've been watching Hyperliquid's chart, and the latest 4-hour structure shows that buyers are still struggling to regain control. $HYPE is currently trading around $68.56, down approximately 7.17% over the last 24 hours. The price recently dropped to $67.113 before attempting a small recovery. However, this bounce still needs confirmation. What stands out to me is the position of the moving averages. The current 4H moving average levels are: • MA7: $70.330 • MA14: $71.053 • MA28: $71.862 Price is trading below all three averages. This suggests that short-term momentum remains weak and sellers still have an advantage. The $67.11 level is the key area I'm watching. This level recently acted as the lowest point of the current move. If buyers manage to defend it and build stronger momentum, HYPE could attempt to recover toward $69.84, followed by the $70.33 resistance area. However, a sustained move below $67.11 would put further pressure on the chart and could open the door to another leg lower. There is another important detail: the moving averages are still positioned above the current price, creating multiple resistance areas that buyers need to overcome. Trading volume also deserves attention. The recent sell-off came with noticeable activity, so I want to see whether buying volume starts increasing during any recovery attempt. My current approach is simple: I'm not treating a small green candle as a confirmed reversal. I want to see HYPE reclaim important moving averages, hold above support, and show stronger buying participation. Hyperliquid remains an interesting ecosystem to follow, but its chart currently needs more strength. The next important signal will come from how HYPE reacts around $67.11 and whether buyers can reclaim the $70 area. For now, support defense and volume confirmation matter more than a quick bounce. $HYPEUSDT #IMPACTbyTrade

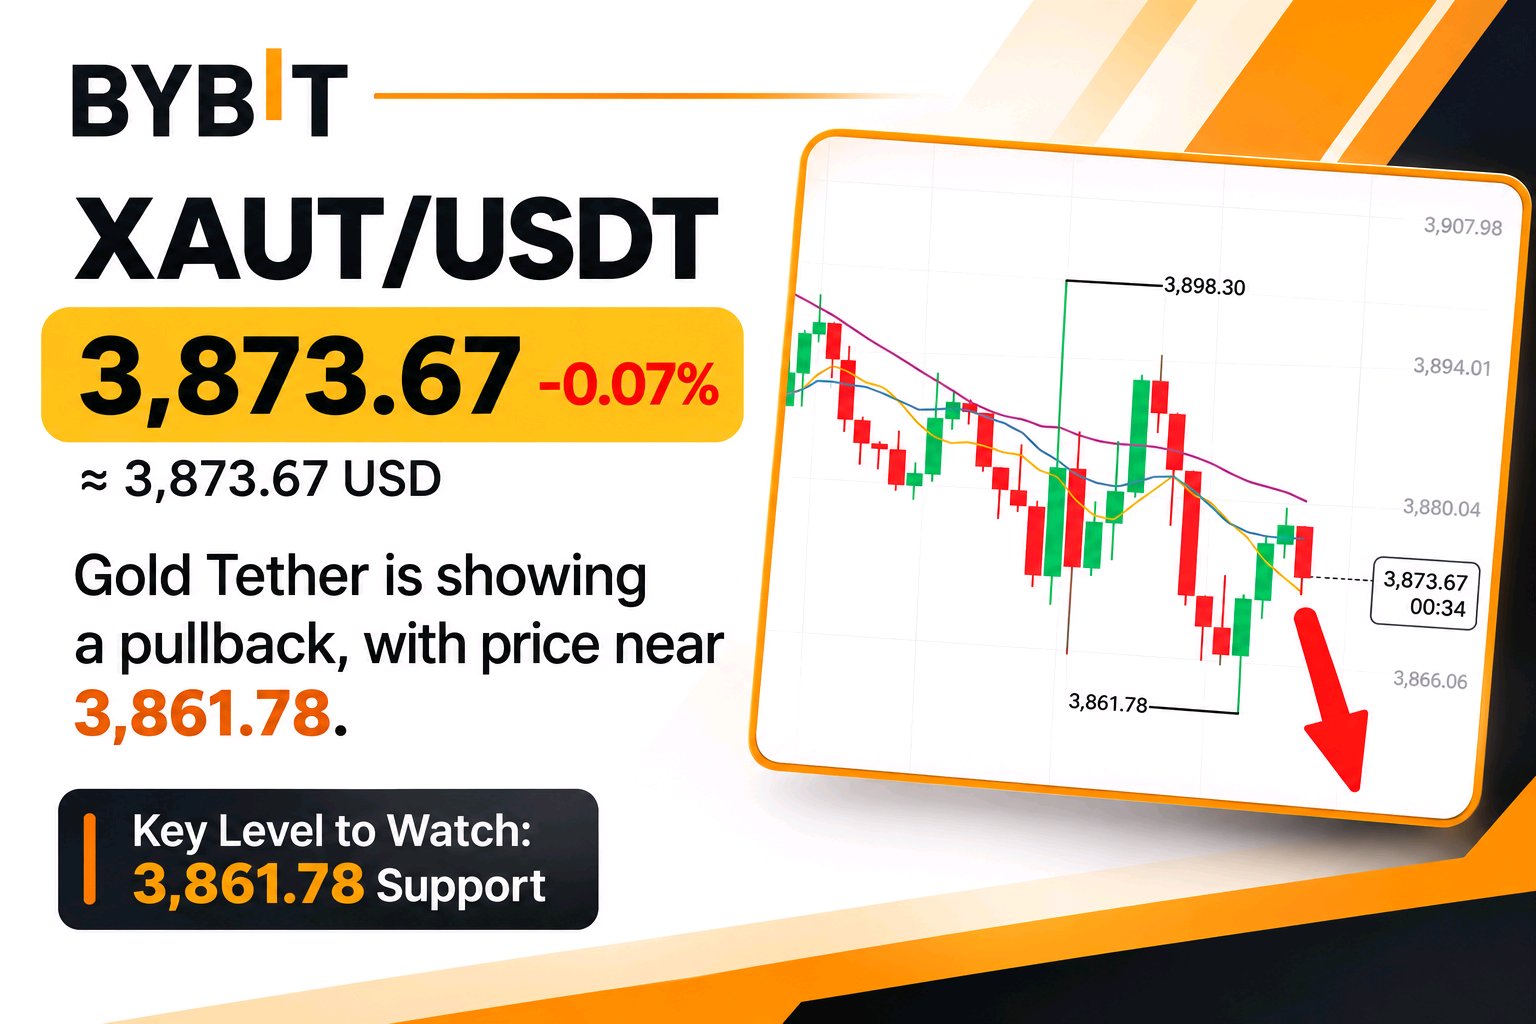
XAUT/USDT: Gold Faces Selling Pressure I'm watching XAUT closely. Gold is trading around $3,873.67, down 0.07%. The 15-minute chart shows sellers putting pressure on price after a recent bounce. Key level I'm watching is $3,861.78 support. A break below it could bring further downside pressure, while a recovery above the moving averages may improve momentum. For now, confirmation matters more than guessing the next move. $XAUTUSDT #WSOTShowYourAITradeToEarn10USDT #WSOT2026 #ShowMyRWATrades
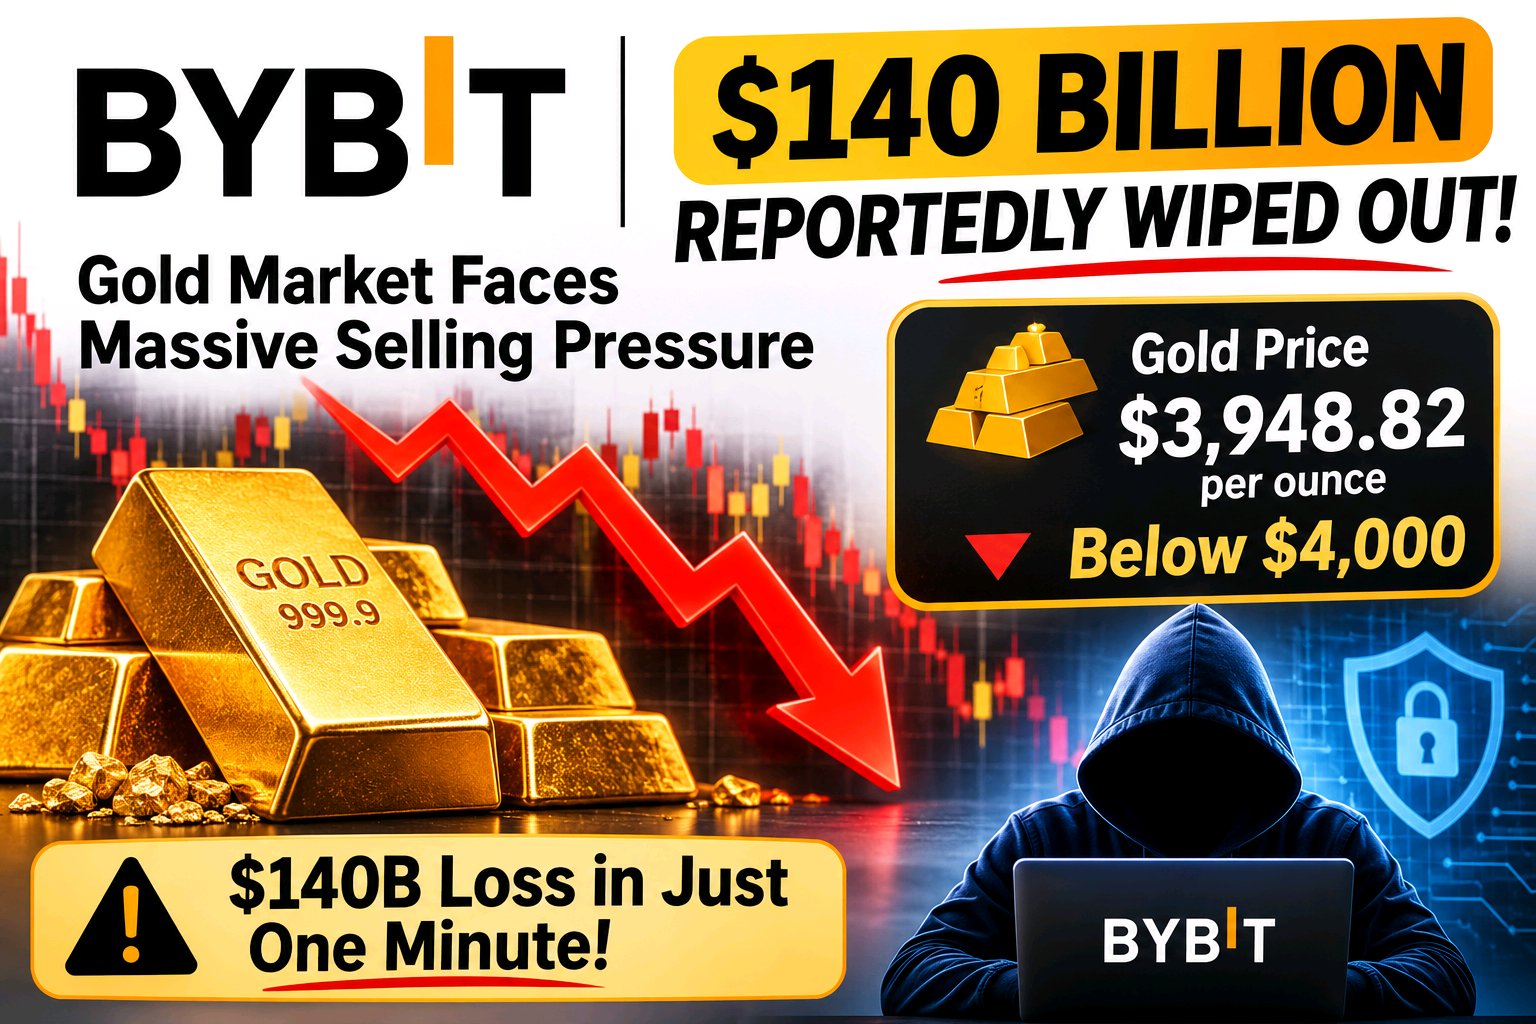
🚨 $140 BILLION REPORTEDLY WIPED OUT FROM GOLD MARKET VALUE IN JUST ONE MINUTE! Gold is facing intense selling pressure as prices fall below the important $4,000 per ounce level. According to Reuters, gold was trading around $3,948.82 on November 12, as a stronger US dollar and rising expectations of Federal Reserve rate hikes weighed on the precious metal. ⚠️ IMPORTANT: The reported $140 billion one-minute loss has not been independently verified. A decline in market value does not necessarily mean that the same amount of cash left the market. WHAT'S NEXT FOR GOLD? I'm watching whether buyers can defend current levels or if selling pressure continues. Will gold recover, or is more downside ahead? $XAUTUSDT #WSOT2026 #USInflationRunsHotAndRateHikeBetsRise #BitcoinHitsTwoMonthLowAfterUSMidterms
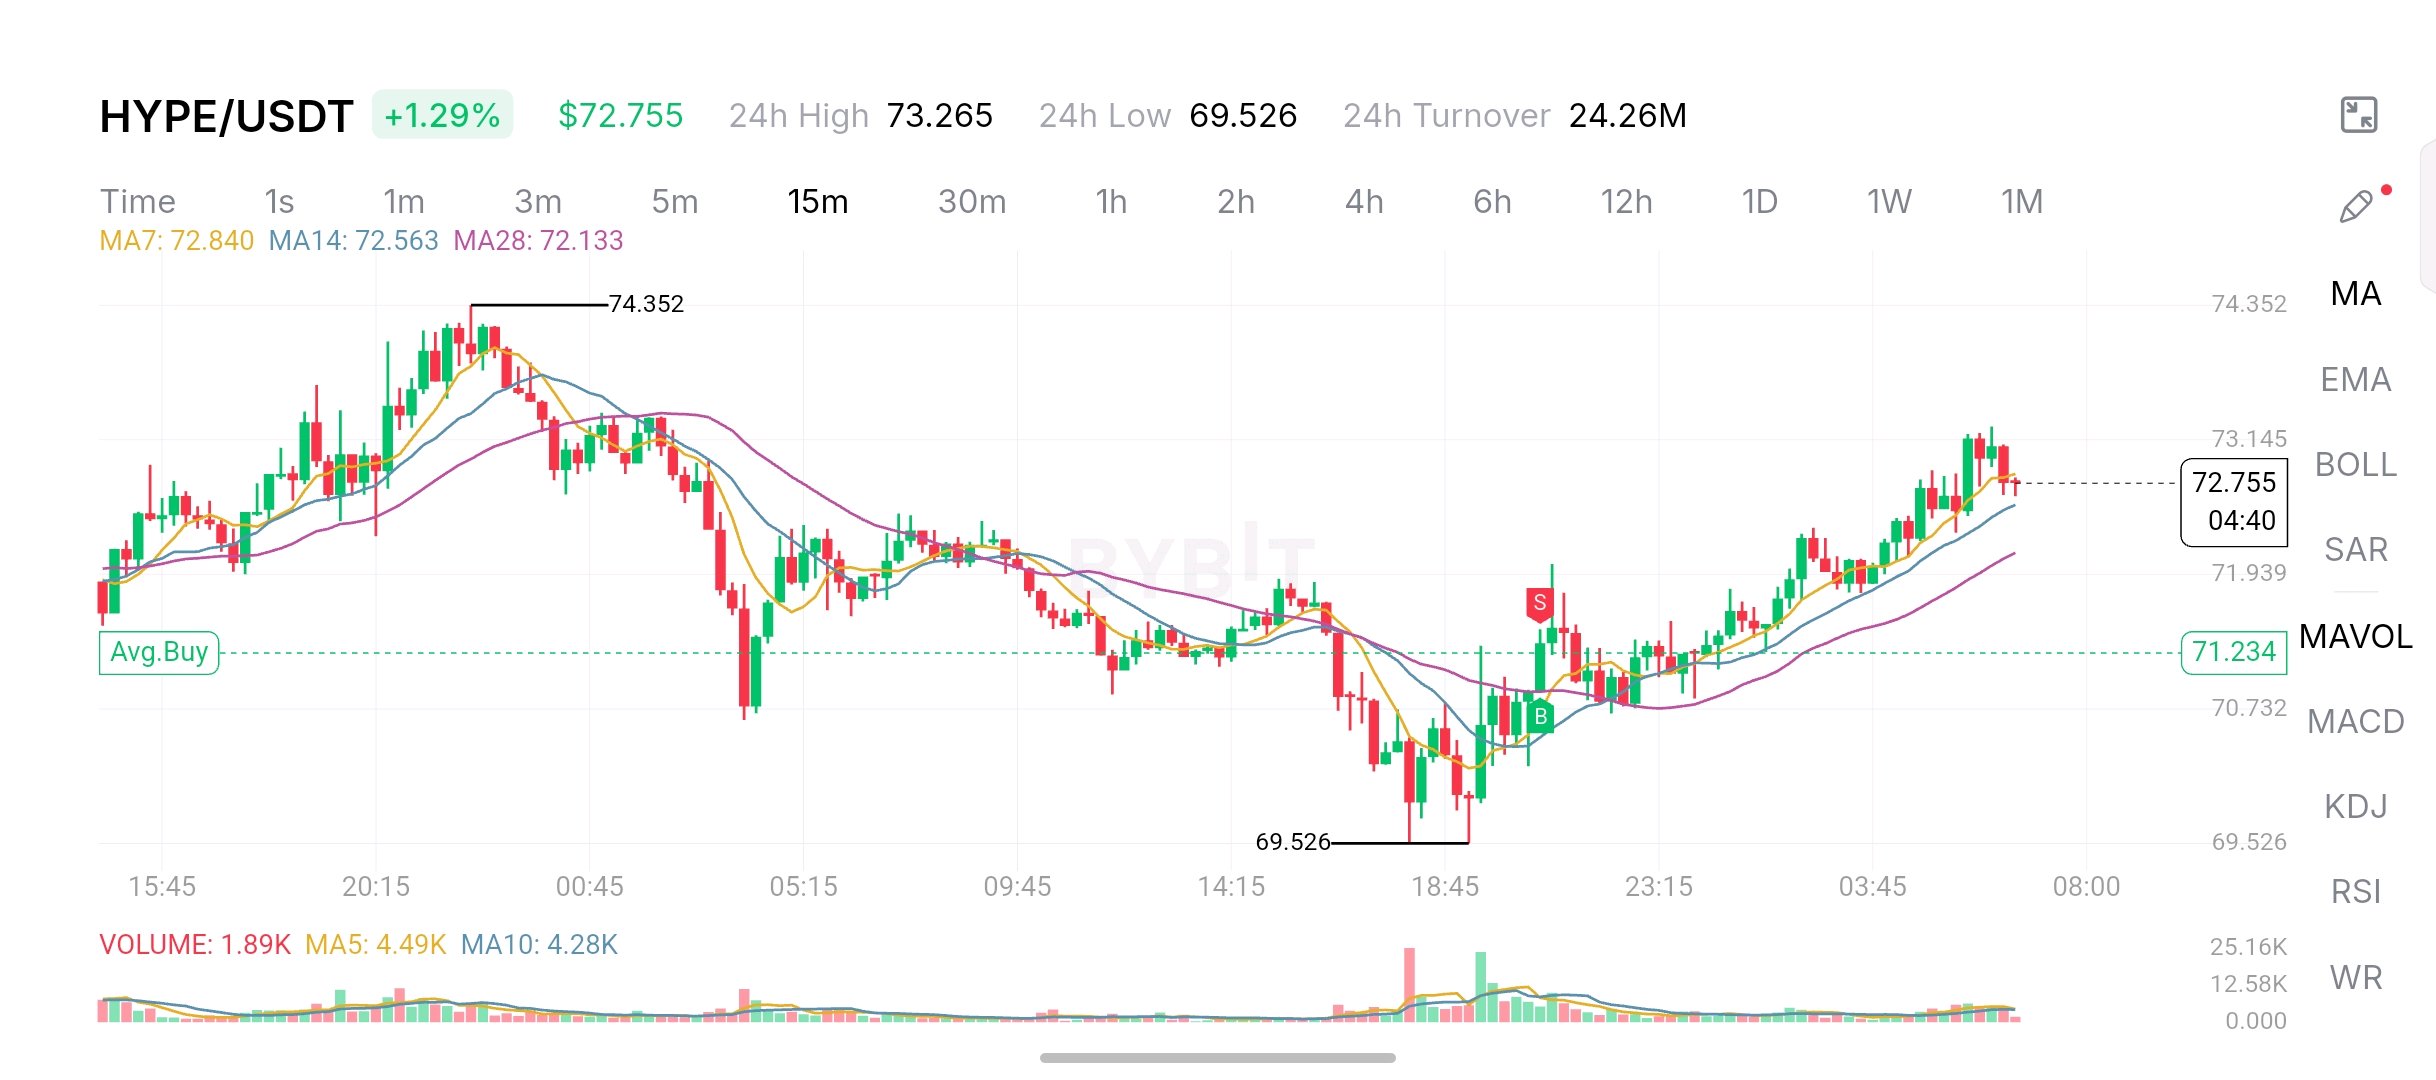
$HYPEUSDT IS SHOWING STRONG RECOVERY MOMENTUM! HYPE/USDT is trading around $72.755, up 1.29%, after recovering from the $69.526 low. On the 15-minute chart, buyers have pushed price back above the MA14 at $72.563 and MA28 at $72.133. However, price is facing short-term resistance near $73.145 to $73.265. Here are the levels I'm watching: • Resistance: $73.265 • Next upside area: $74.352 • Support: $72.563 • Lower support: $72.133 One detail worth watching is volume. The recent rally needs stronger participation to confirm further upside. My view: HYPE has regained short-term strength, but holding above the moving averages and breaking resistance will be key to sustaining momentum. I'm watching confirmation, not chasing the move. #USInflationRunsHotAndRateHikeBetsRise #WSOT2026 #BitcoinHitsTwoMonthLowAfterUSMidterms #ShowMyRWATrades
$BTC
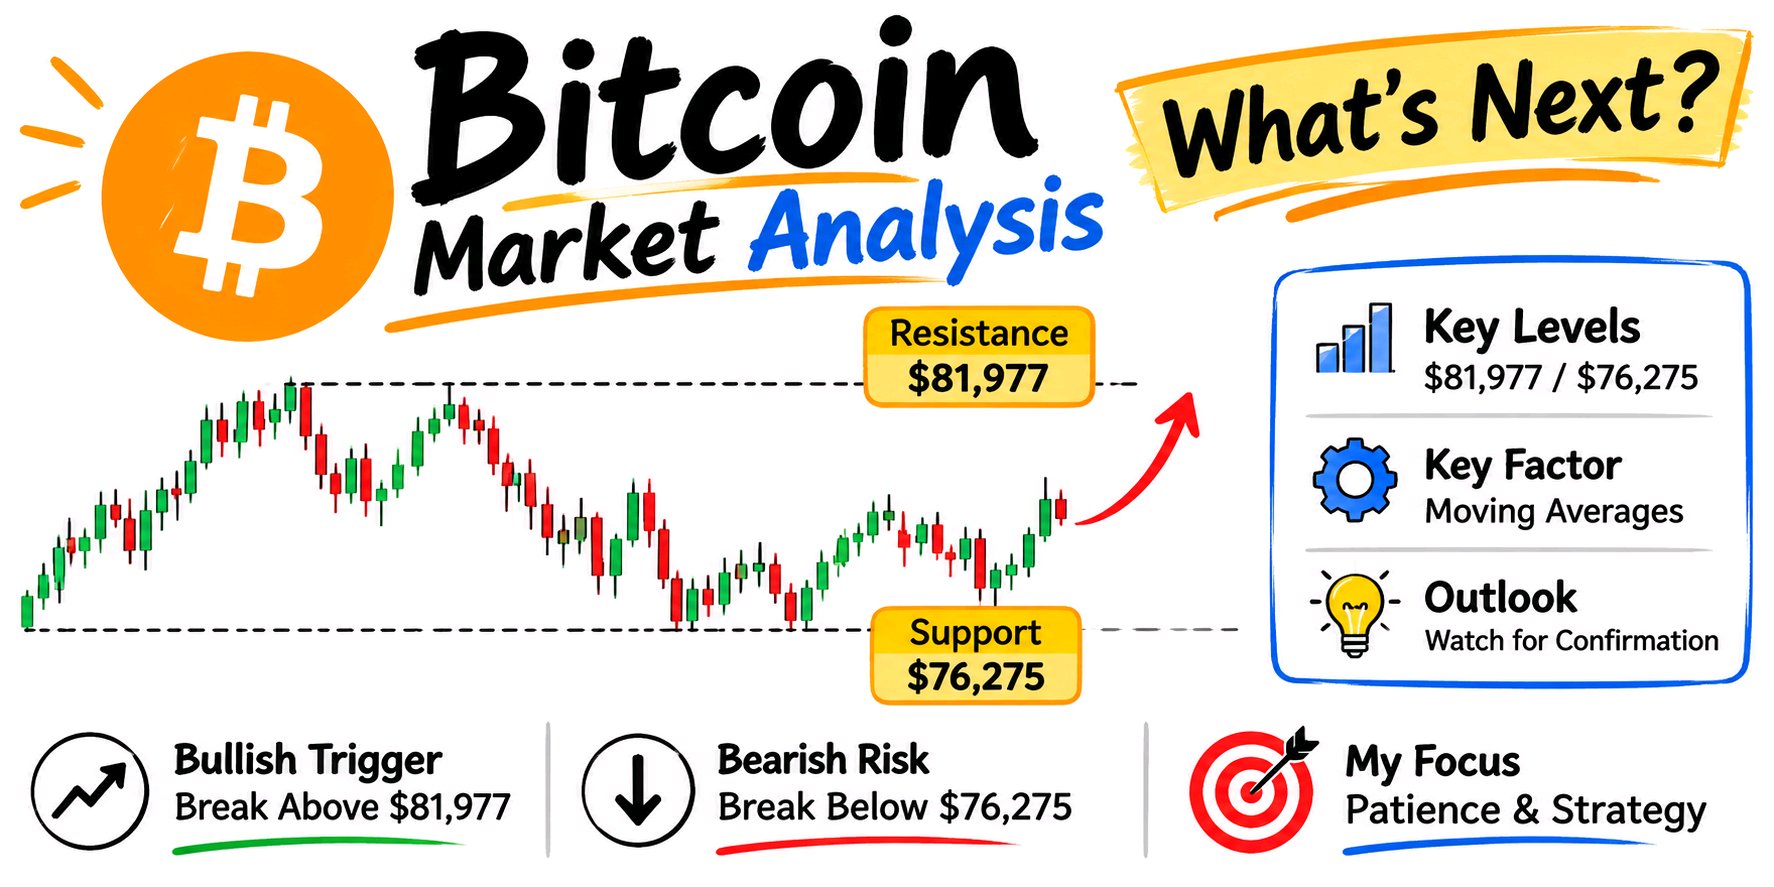
Bitcoin is more than just a price movement. It's a market worth understanding. I'm watching how trading volume, buyer activity and market sentiment shape BTC's next move. One thing I always focus on is confirmation rather than reacting to every price change. For me, successful trading starts with research, patience and understanding market structure. What's your focus right now: BTC accumulation or short-term trading? $BTCUSDC #WSOT2026 #USInflationRunsHotAndRateHikeBetsRise #AnthropicIPOTestsTheAIBoom
HYPE GOING ON TOP 📈
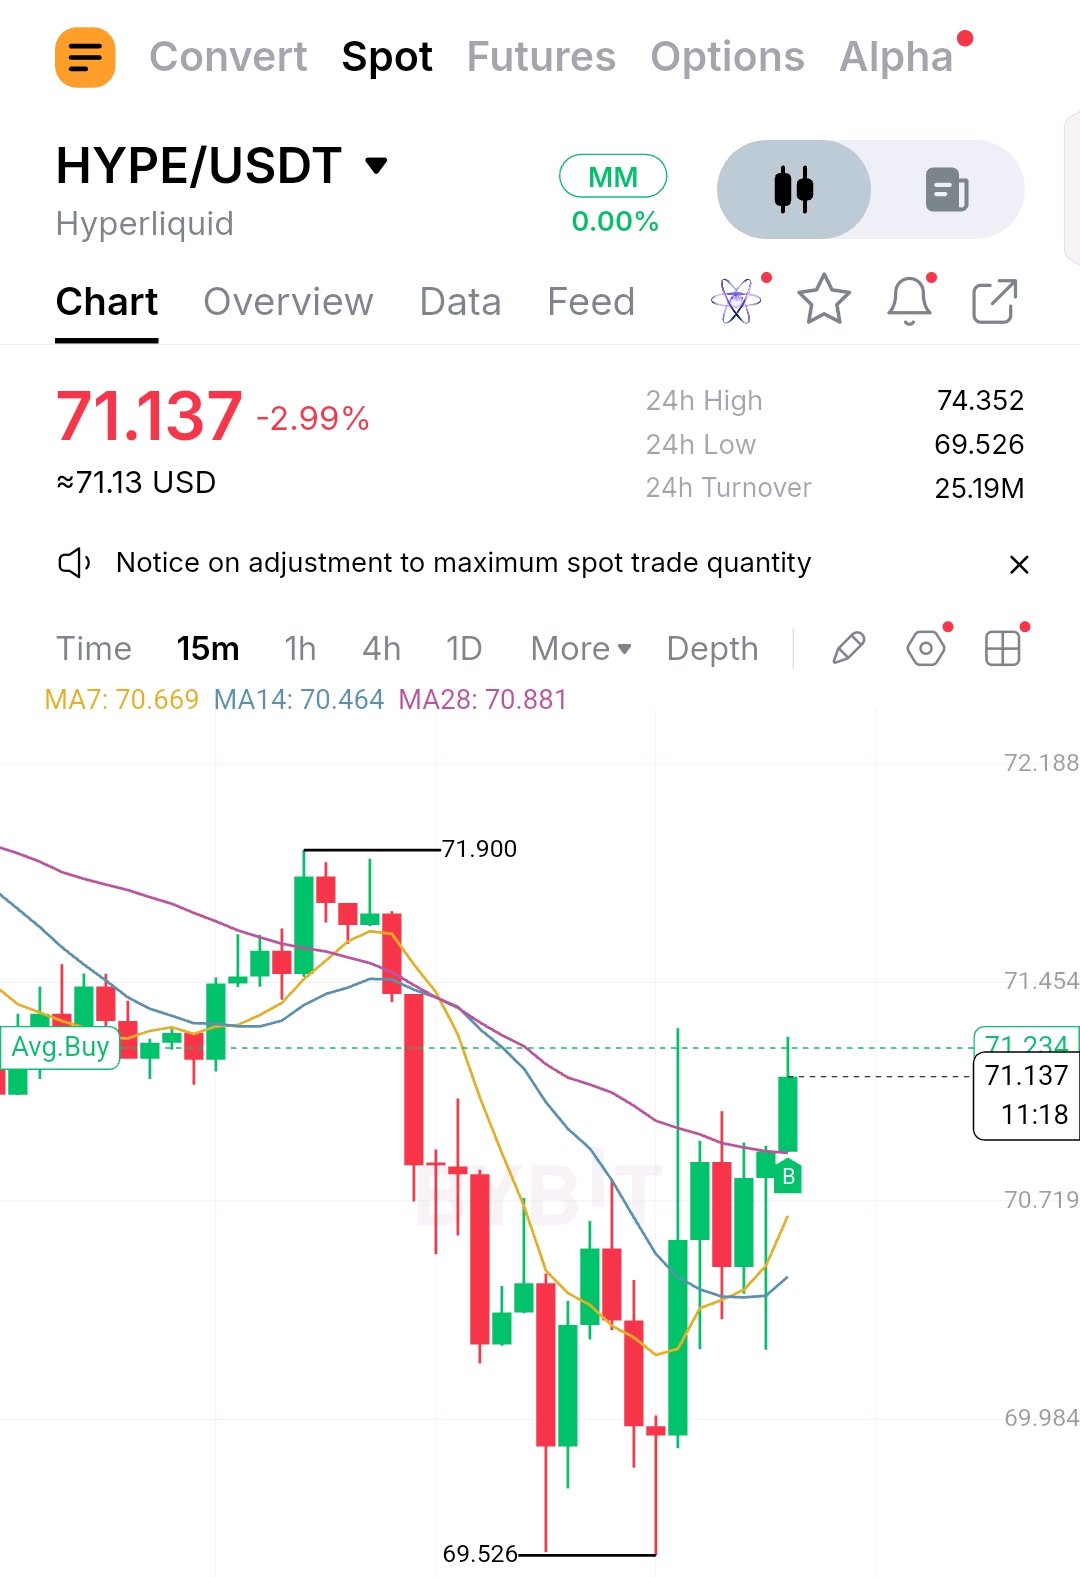
HYPE is showing signs of recovery after touching $69.526. Price is now around $71.137. I'm watching whether buyers can push through $71.45 and challenge $71.90. The recovery looks interesting, but confirmation matters more than a quick bounce. Watching volume closely. #HYPE #Bybit #WSOT2026 #USInflationRunsHotAndRateHikeBetsRise #BitcoinHitsTwoMonthLowAfterUSMidterms $HYPEUSDT
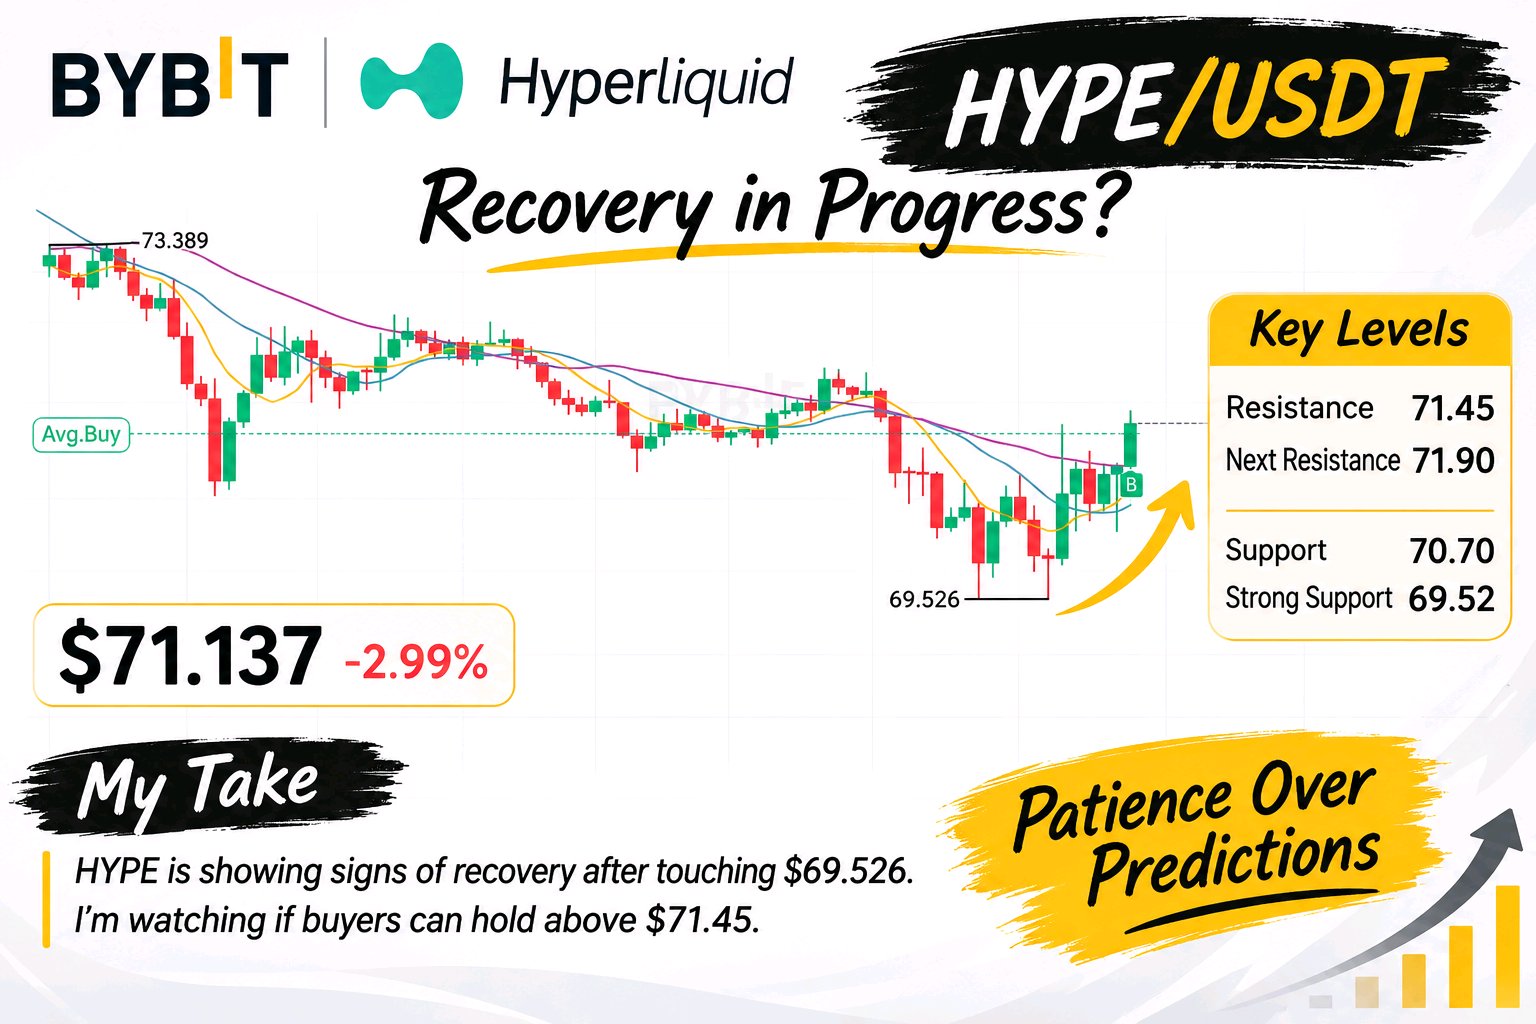
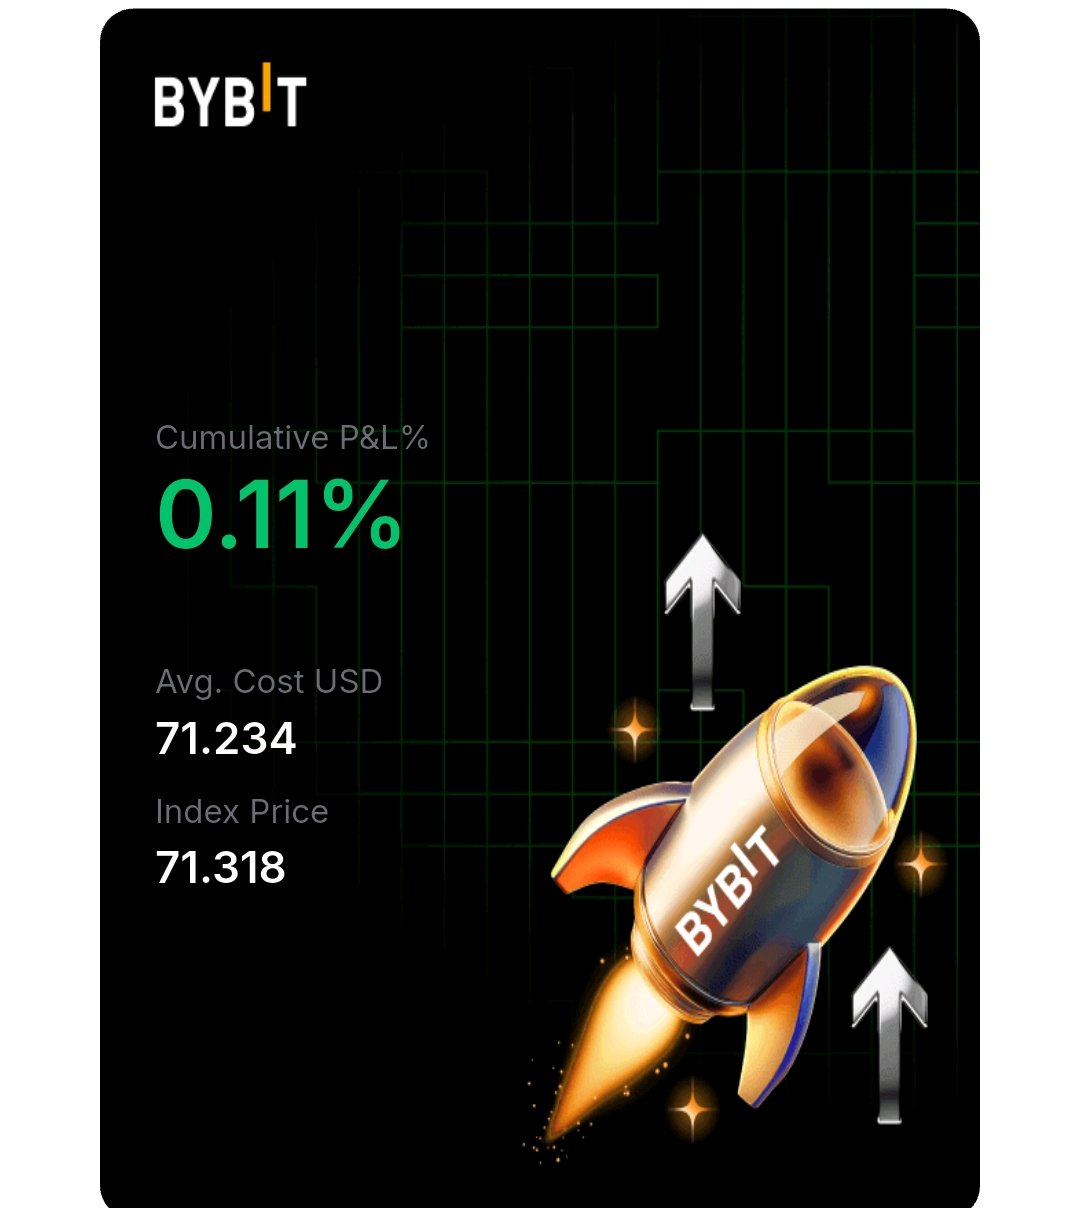
$HYPEUSDT is showing signs of recovery after touching $69.526. Price is now around $71.137. I'm watching whether buyers can push through $71.45 and challenge $71.90. The recovery looks interesting, but confirmation matters more than a quick bounce. Watching volume closely. $HYPERUSDT #WSOT2026 #ShowMyRWATrades