
Auram
830Like0Shares31Fans9Follow
3 events that could flip the market,
Three #events in less than two days could shift Wall Street's mood. But the most important number among them might be one that hasn't even been achieved yet. First event: #Nvidia's earnings, early Wednesday morning Riyadh time. These are the first results since Jensen Huang's departure. Everyone will be looking at the profits, but pay attention to the guidance for next quarter. Because the company might have beaten expectations, but the stock could still drop if management says future demand is weaker. Second event: #Fed minutes, Wednesday at 10 PM. The question: How many members were leaning toward an interest rate hike in October? If the hawkish sentiment was broader than what we saw in the vote, it could move the dollar, gold, and Bitcoin. But remember: this is minutes from a past meeting, not a new interest rate decision. Third event: #Anthropic IPO, with the first day of trading expected on Thursday. The valuation could reach around $64 billion according to the preliminary prospectus. But the real test: after the initial deal hype, can the stock maintain its IPO price? Nvidia will test demand, the Fed will move rate expectations, and Anthropic will test investor appetite. Which one of them could surprise the market the most? #SanDiskAnnounces8For1StockSplit #BitcoinHitsTwoMonthLowAfterUSMidterms $NVDAXUSDT $XRPUSDT

Are we waiting for a halving shock?
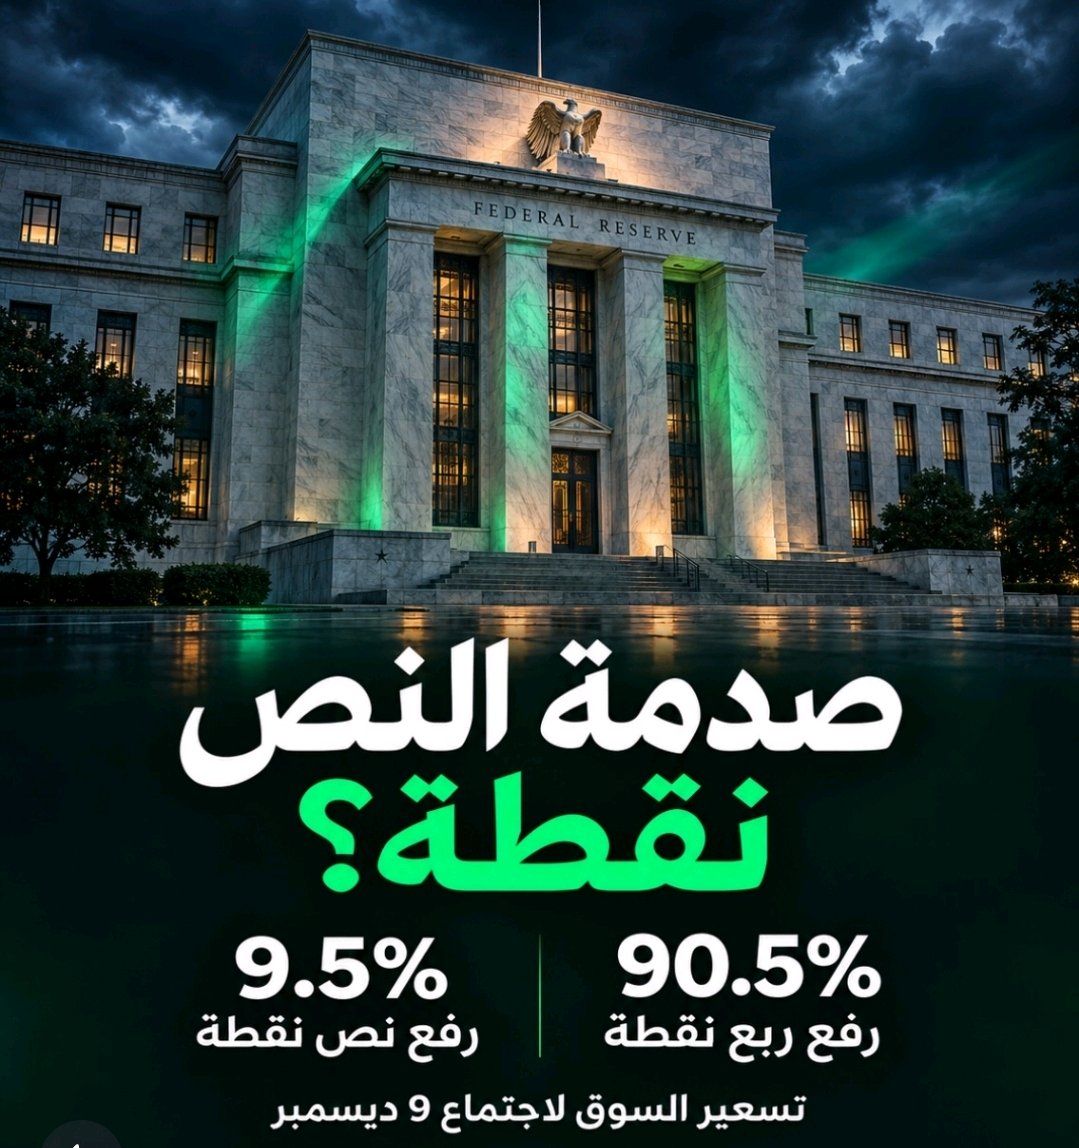
A week ago, Wall Street still gave a 24% chance that the #Fed would hold rates steady in December. But according to reports from some news platforms Friday evening, the hold has disappeared from pricing, and the market now sees a 90.5% probability for a quarter-point hike, and 9.5% for a half-point hike. Who opened the door? Christopher Waller, a member of the Federal Reserve Board of Governors. Before the #inflation data was released, he said a half-point hike was worth considering if core inflation hit 0.3% or higher. And then the number actually came in at 0.3%, versus the 0.2% that was expected. So, is what's coming going to be tough? The pressure could continue even if the Fed just does a quarter-point. The market had priced in a 67.5% probability of two hikes by January, and the yield on 10-year US #bonds exceeded 5.15%. Continued high yields make financing more expensive and put pressure on growth stock valuations. Before the December 9th decision, all eyes are on the Fed minutes on November 18th and the inflation data on November 25th. If the Fed hints at more hikes than the market has priced in, even a quarter-point could move the market strongly. This is not investment advice. #USInflationRunsHotAndRateHikeBetsRise $XRPUSDT $SOLUSDT
Congrats to whoever entered the ZEC short trade yesterday!
ZEC has dropped more than 40% from its September peak, with negative ETF outflows of $15-30 million in November, and 88% of long positions liquidated. · However, the RSI on the 4-hour timeframe is in deep oversold territory, and analysts warn that selling at $920 has a poor risk/reward ratio, and waiting for a bounce toward $980 – $1,000 is the wiser approach.
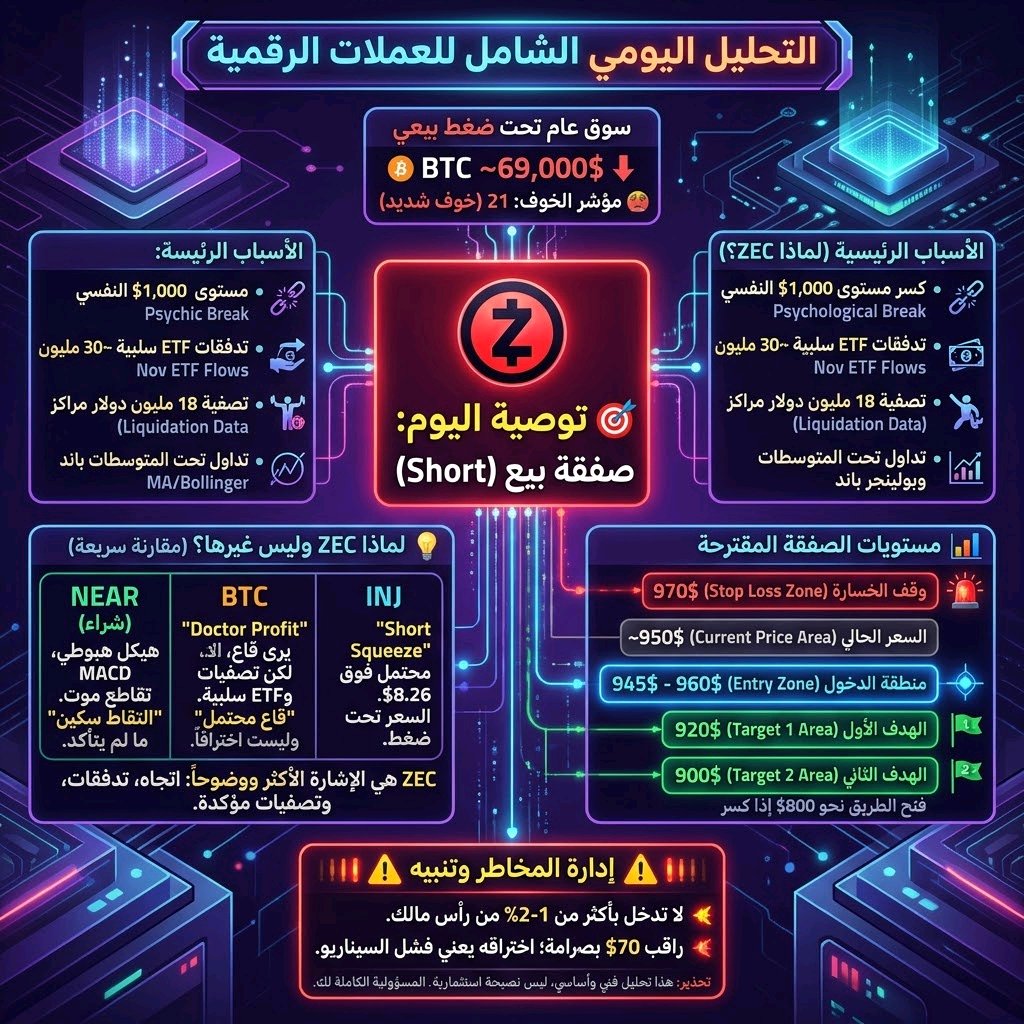
🎯 التوصية: صفقة بيع ZEC،
بعد تحليل بيانات اليوم، السوق العام لا يزال تحت ضغط بيعي ( #BTC حول 69,000$ بعد كسر 70,000$، ومؤشر الخوف عند 21)، لكن تبرز إشارة بيع (Short) واضحة وقوية على Zcash ( #ZECUSDT ),مدعومة ببيانات تصفية وتدفقات ETF سلبية تؤكد استمرار الضغط الهبوطي. 🎯 التوصية: صفقة بيع (Short) على #ZEC سبب الاختيار اليوم: ZEC تواجه ضغطاً بيعياً من عدة مصادر متزامنة، والاتجاه الهبوطي مؤكد: · كسر نفسي وتدفقات سلبية: كسر ZEC مستوى 1,000$** النفسي ووصل إلى قاع شهرين عند **962.85$,مع تدفقات خارجة من صناديق #ETF بقيمة ~30 مليون دولار في نوفمبر حتى 11 نوفمبر. · تصفيات جماعية للمراكز الشرائية: تم تصفية ~18 مليون دولار من المراكز المفتوحة في 24 ساعة، 72% منها كانت مراكز شراء (Longs)، مما يعني أن المشترين يتكبدون خسائر والضغط البيعي يتعزز. · فشل الارتدادات: السعر يتداول تحت المتوسط المتحرك لـ20 يوم (1,206$**) وتحت الحد السفلي لبولينجر باند (**1,005$)، وأي ارتداد هو مجرد "تصحيح فني بلا حجم تداول" وليس انعكاساً. 📊 مستويات الصفقة المقترحة · منطقة الدخول (Entry): 945$ – 960$ (السعر الحالي ~950$). · وقف الخسارة (Stop Loss): 970$ – اختراق هذا المستوى يُلغي السيناريو الهبوطي قصير المدى. · الهدف الأول (Target 1): 920$ – دعم فوري. · الهدف الثاني (Target 2): **900$** – مستوى نفسي مهم. إذا كسر السعر 900$، فقد يفتح الطريق نحو 800$، وهو نطاق تصفية محتمل أشار إليه المتداولون. 💡 لماذا ZEC وليس غيرها؟ · #NEAR (شراء): المحلل Michaël van de Poppe اشترى عند 3.51$، لكن الهيكل العام لا يزال هبوطياً (50 EMA عند 3.67$، 200 EMA عند 4.26$، وتقاطع موت على MACD). الإشارة شرائية لكنها "التقاط سكين" ما لم يتأكد الانعكاس. · BTC: محلل "Doctor Profit" يرى أن القاع عند 68,000$ وبدأ الشراء، لكن BTC لا يزال تحت ضغط تصفيات، والسيولة تخرج من ETFs. إشارة "قاع محتمل" وليست "اختراقاً مؤكداً". · $INJ : هناك إشارة "Short Squeeze" محتملة مع اختراق 8.26$، لكن السعر (7.42$) لا يزال تحت ضغط هبوطي، وكسر 7.19$ قد يفتح الطريق نحو 6.71$. الإشارة غير حاسمة. ZEC هي الإشارة الأكثر وضوحاً اليوم: اتجاه هبوطي مؤكد، تدفقات سلبية، وتصفيات جماعية تدعم استمرار البيع. ⚠️ إدارة المخاطر (تذكير أخير) المغامرة المحسوبة تعني أنك تتحمل المسؤولية الكاملة. ملاحظة حاسمة: أي خبر إيجابي مفاجئ (مثل إعلان تمويل جديد من Grayscale أو تطور إيجابي في صندوق ZCG) قد يرفع السعر فوق وقف الخسارة. لا تدخل بأكثر من 1-2% من رأس مالك، وراقب 970$ بصرامة؛ فاختراقه يعني فشل السيناريو الهبوطي ويجب الخروج فوراً. تنبيه: هذا تحليل فني وأساسي وليس نصيحة استثمارية. القرار النهائي والمسؤولية الكاملة لك. #ينخفض بيتكوين إلى أدنى مستوى له في شهرين بعد انتخابات منتصف المدة الأمريكية #موجة بيع في تقنيات الذكاء الاصطناعي تمحو 2.5 تريليون دولار من مؤشر ناسداك 100 $INJUSDT $ZENUSDT
🎯 Core recommendation: Buy INJ,
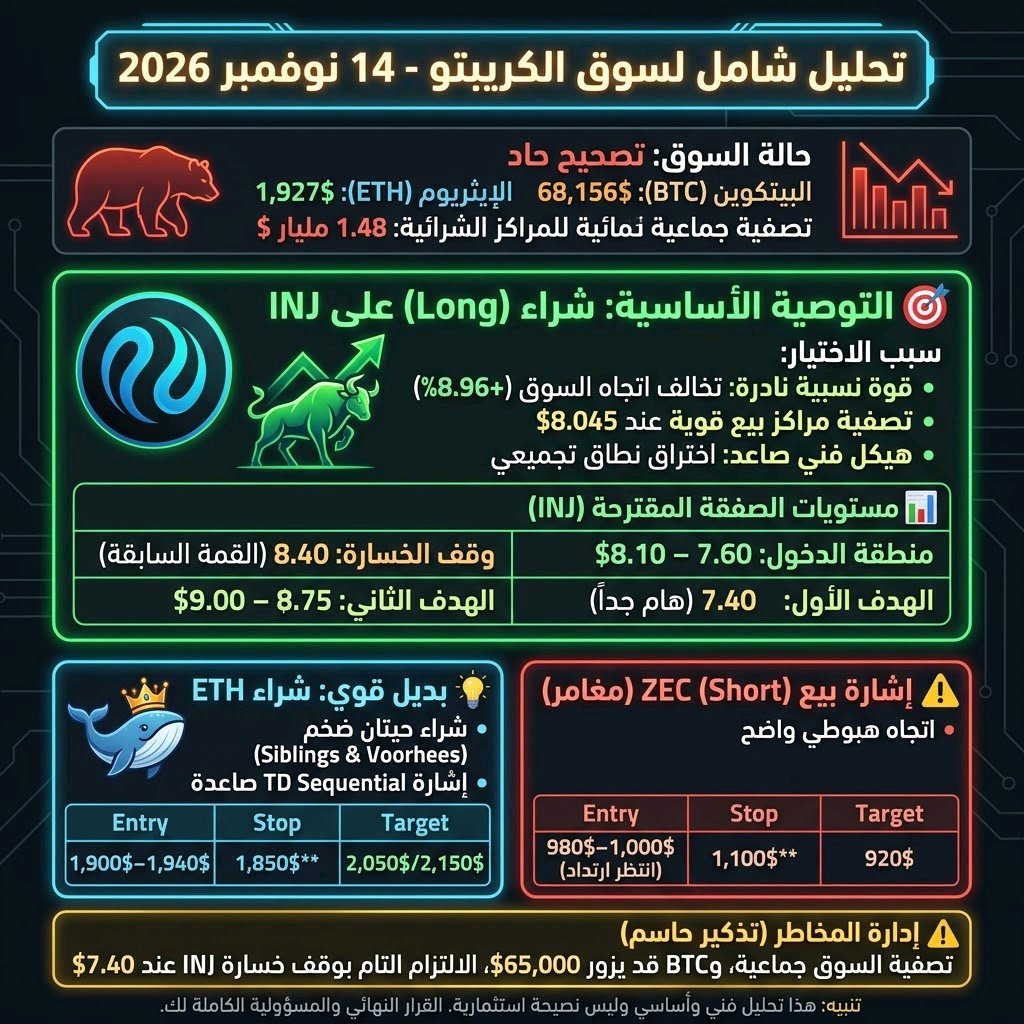
Amid this dip, #INJUSDT stands out with a strong Long signal, defying the market trend and rising by +8.96% while all major coins are falling. This is exactly the type of move you love: relative strength against the current, on a day of mass liquidation. After analyzing data for November 14, 2026, the general market is in a sharp correction (#BTC at $68,156 after breaking $70,000, and #ETH below $2,000 at $1,927). But in the midst of this decline, INJ stands out with a strong Long signal. 🎯 Primary Recommendation: Long #INJ Reason for selection: INJ isn't just rising; it's doing so for clear technical reasons: · Rare Relative Strength: While the whole market was crashing (BTC -4%, ETH -4%, SOL -4%), INJ rose by about 9% to be the best performer among the top 100 coins. The rise is supported by a real breakout from an accumulation range at $7.16**, with $3,057 in short positions liquidated at $8.045, confirming that sellers are losing money and driving the price higher. · Bullish Technical Structure: The price broke out of a sideways range and targeted $8.399** before retracing slightly. The moving averages (MA5 at $8.022 and MA20 at $7.991) are very close, meaning a new breakout above $8.26** could trigger a strong move. · Clear Demand Zone: Analysts point out that any pullback towards $7.60 – $7.80 (to cover the FVG gap) will represent a strong demand zone to continue the uptrend. 📊 Suggested Trade Levels (INJ) · Entry Zone: $7.60 – $8.10 (Entry can be split into two parts: one part near $8.00 and another at $7.70 if a pullback occurs). · Stop Loss: $7.40 – Breaking this level cancels the short-term bullish structure. · Target 1: $8.40 – The previous local high. · Target 2: $8.75 – $9.00 – If the price breaks through $8.40 with strong trading volume. 💡 Strong Alternative: Long $ETH (for those seeking more risk) If you want a trade based on "buying the dip" with confirmation from whales, ETH offers an interesting setup: · Massive Whale Buying: The wallet known as "7 Siblings" (noted for buying dips and selling at peaks) purchased 20,558 ETH worth $40.88 million over 3 days, averaging $1,988. Also, Erik Voorhees (founder of ShapeShift) bought 2,504 ETH worth $4.75 million at $1,896. · TD Sequential Signal: ETH gave a daily buy signal, with a first target at $2,150 (the 200-day moving average). · Levels: Entry $1,900 – $1,940, Stop Loss $1,850** (Coinbase support), Target 1 $2,050, and Target 2 $2,150. ⚠️ Short Signal for the Daring: $ZEC If you prefer shorting, ZEC is still in a clear downtrend, but caution is necessary: · ZEC has dropped more than 40% from its September peak, with negative ETF inflows of $15-30 million in November, and 88% of long positions have been liquidated. · However, the RSI on the 4-hour timeframe is deeply oversold, and analysts warn that shorting at $920** has a poor risk/reward ratio, and waiting for a bounce toward $980 – $1,000 is the wiser approach. ⚠️ Risk Management (A Final Reminder) Calculated risk means taking full responsibility. Crucial note: The market is in a state of mass liquidation ($1.48 billion exited the market), and BTC broke the $69,000 support, opening the way toward $65,000. INJ is relatively strong, but it is not immune; if the general sell-off continues, it may be dragged down with the market. Do not enter with more than 1-2% of your capital, and watch $7.40 strictly. Any break below it means the bullish scenario has failed and you must exit immediately. Disclaimer: This is technical and fundamental analysis, not investment advice. The final decision and full responsibility rest with you. #USInflationRunsHotAndRateHikeBetsRise $INJUSDT $ETHUSDT
🎯 Recommendation: ZEC sell position,
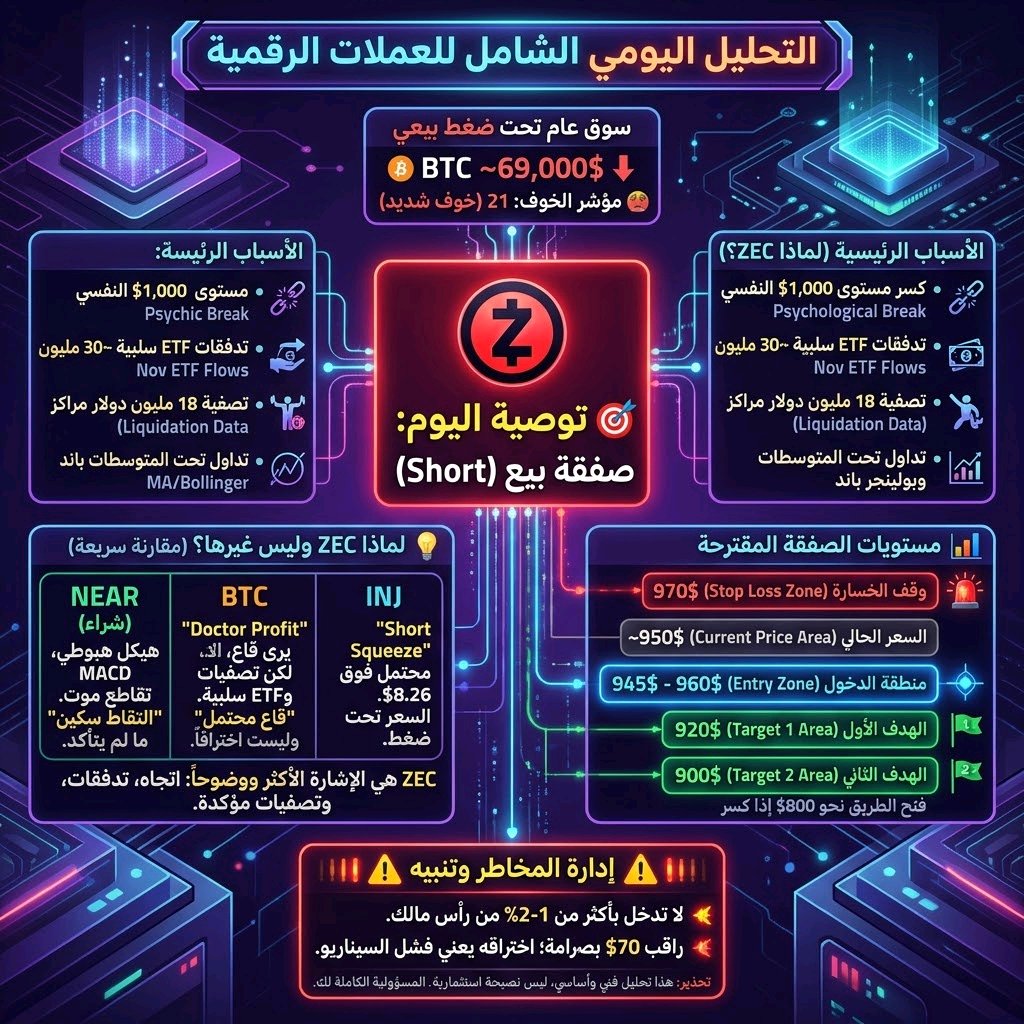
After analyzing today's data, the general market remains under selling pressure (#BTC around $69,000 after breaking $70,000, and the Fear & Greed Index is at 21), but a clear and strong Short signal is emerging on Zcash (#ZECUSDT), supported by liquidation data and negative ETF inflows that confirm the continued downward pressure. 🎯 Recommendation: Short position on #ZEC Reason for selection today: ZEC is facing selling pressure from several concurrent sources, and the bearish trend is confirmed: · Psychological break and negative inflows: ZEC broke the **$1,000** psychological level and reached a two-month low at **$962.85**, with outflows from #ETF funds of ~ $30 million in November up to November 11. · Mass liquidation of long positions: ~ $18 million of open interest was liquidated in 24 hours, 72% of which were Longs, meaning buyers are suffering losses and the selling pressure is intensifying. · Failed rebounds: The price is trading below the 20-day moving average (**$1,206**) and below the lower Bollinger Band (**$1,005**), and any rebound is just a "technical correction without volume" rather than a reversal. 📊 Suggested Trade Levels · Entry Zone: $945 – $960 (current price ~ $950). · Stop Loss: $970 – Breaching this level invalidates the short-term bearish scenario. · Target 1: $920 – Immediate support. · Target 2: **$900** – An important psychological level. If the price breaks $900, it could open the path toward $800, which is a potential liquidation range mentioned by traders. 💡 Why ZEC and not others? · #NEAR (Long): Analyst Michaël van de Poppe bought at $3.51, but the overall structure remains bearish (50 EMA at $3.67, 200 EMA at $4.26, and a death cross on the MACD). The signal is a buy but it's "catching a falling knife" unless a reversal is confirmed. · BTC: Analyst "Doctor Profit" sees the bottom at $68,000 and has started buying, but BTC is still under liquidation pressure, and liquidity is exiting ETFs. It is a "potential bottom" signal, not a "confirmed breakout." · $INJ: There is a potential "Short Squeeze" signal with a breach of $8.26, but the price ($7.42) is still under bearish pressure, and breaking $7.19 could open the path toward $6.71. The signal is inconclusive. ZEC is the clearest signal today: a confirmed downtrend, negative inflows, and mass liquidations support continued selling. ⚠️ Risk Management (Final Reminder) Calculated risk means you bear full responsibility. Crucial note: Any sudden positive news (such as a new funding announcement from Grayscale or a positive development in the ZCG fund) could push the price above the stop loss. Do not invest more than 1-2% of your capital, and monitor $970 strictly; breaching it means the bearish scenario has failed and you must exit immediately. Disclaimer: This is a technical and fundamental analysis, not investment advice. The final decision and full responsibility are yours. #BitcoinHitsTwoMonthLowAfterUSMidterms #AITechSelloffErases2Point5TrillionFromNasdaq100 $INJUSDT $ZENUSDT
Liquidity crisis rocks crypto!
🚨 Billions are flowing out of the #crypto market... and what's happening is more dangerous than just a price drop! #Bitcoin, #Ethereum, and altcoins are under heavy selling pressure, but the real problem isn't just the price... the problem is the liquidity disappearing from the market! 📉 The crypto market cap has dropped 9% in a week, reaching $2.54 trillion. 💰 Stablecoin supply has shrunk by $14.2 billion over the last 30 days, the fastest pace since June 2022. 🏦 Bitcoin #ETF funds saw outflows of about $1.66 billion over the last 30 days, coinciding with a decline in institutional demand. ⚠️ And what's more dangerous? The depth of the Bitcoin order book has dropped by about 33% at its weakest point, which means fewer sell orders could move prices much more violently. With the continued pressure from the US #Fed and Bitcoin's increasing sensitivity to Wall Street's moves, the market has become more prone to sharp volatility. However, there's an important point: some whale wallets have started accumulating, while other groups are still reducing their holdings! 📊 The question now is: Are we seeing a historic opportunity to accumulate, or has the market not hit bottom yet? In my opinion, the key to a real recovery isn't just rising prices, but the return of liquidity and real demand. 👇 What are your expectations? Is the drop over, or is the hardest part yet to come? #USPPITestsTheHigherForLongerTrade #USInflationRunsHotAndRateHikeBetsRise $BTCUSDT $XRPUSDT

News,
#News , New information indicates that #Democrats may present their own version of the #CLARITY Act after January 3rd, amidst discussions to transfer more powers to the #SEC and reduce the role of the #CFTC, with a focus on an "Investor Bill of Rights" (custody protection and withdrawal guarantees) 📉 Old disputes over ethics clauses may resurface, foreshadowing a fierce political and legislative battle at the beginning of 2027 ⚖️ 👇 In your opinion, who will back down? 🟢 Democrats 🔴 The White House #AITechSelloffErases2Point5TrillionFromNasdaq100 $APTUSDT $SUIUSDT

United States Department of the Treasury,
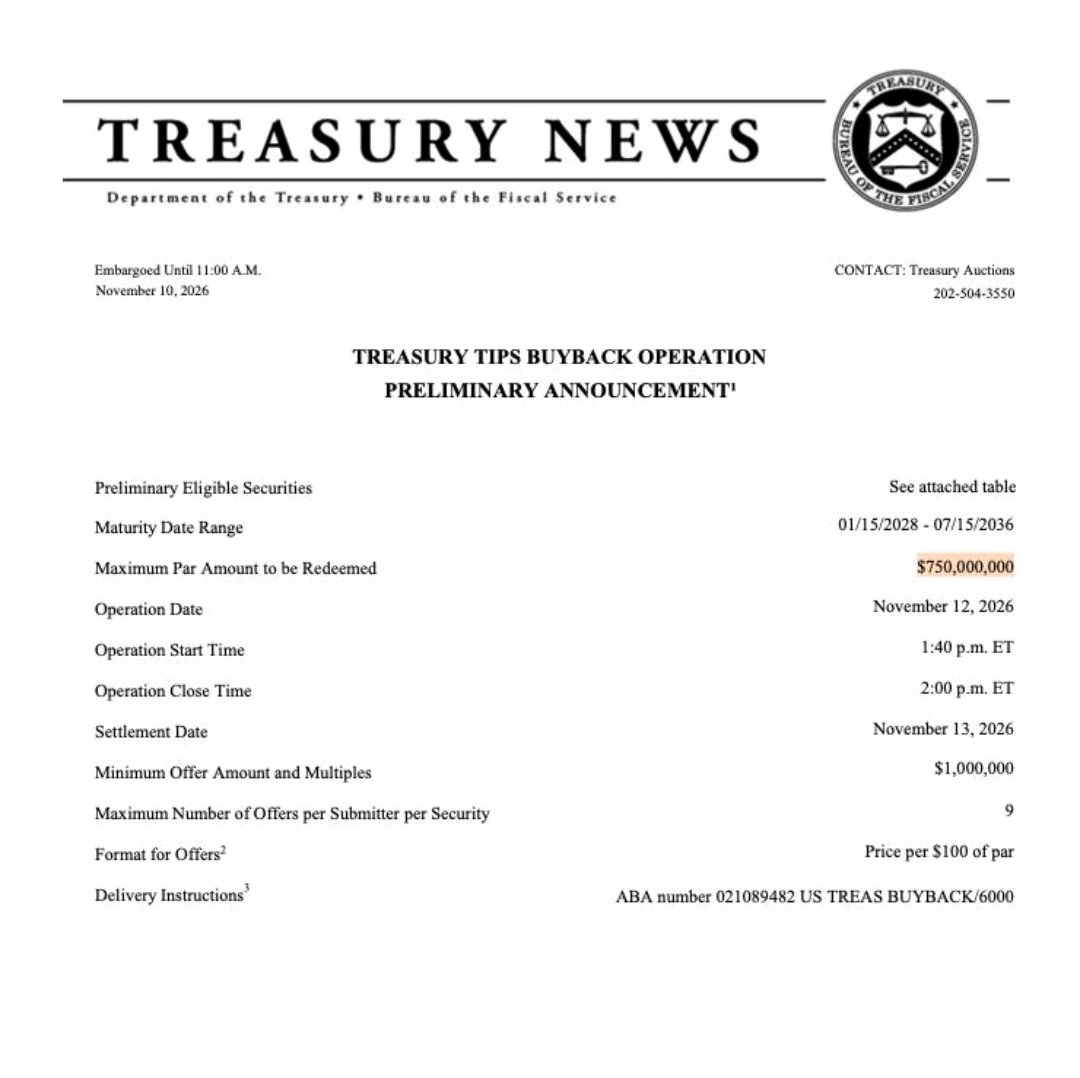
🇺🇸 #BREAKING: The U.S. Treasury will buy back up to $750 million of government debt today. The operation targets inflation-protected Treasury securities, giving bondholders an opportunity to sell older debt back to the government. These buybacks are designed to improve market liquidity, not inject new money into the economy like Fed quantitative easing. A distinction worth keeping in mind as investors assess liquidity conditions. #BitcoinHitsTwoMonthLowAfterUSMidterms $XRPUSDT $NEARUSDT
Strategy,
Why might index funds sell $2.8 billion worth of 'Strategy' shares? As the November 30 session closes, MSCI will exclude 'Strategy' (MSTR)—Michael Saylor's company known for its massive Bitcoin holdings—from key indices, including MSCI USA and MSCI World. This decision follows an adjustment to eligibility rules for companies whose assets and operational models make them more akin to investment funds. So, who might be selling? Funds that track these indices. When a stock is removed, funds must rebalance their portfolios to stay aligned with the index. In a previous estimate, J.P. Morgan suggested that the MSCI decision alone could lead to the sale of $2.8 billion in shares. The potential sell-off volume could increase if other index providers follow suit. For 'Strategy' shareholders, two factors are worth monitoring: the actual volume of selling at the time of rebalancing, and the movement of Bitcoin, which impacts the value of the assets the company holds. The question remains: Has the market already priced in the exit from the indices, or could the volume of selling at the time of execution still surprise investors and put pressure on the stock? This is not investment advice. #Strategy $BTCUSDT

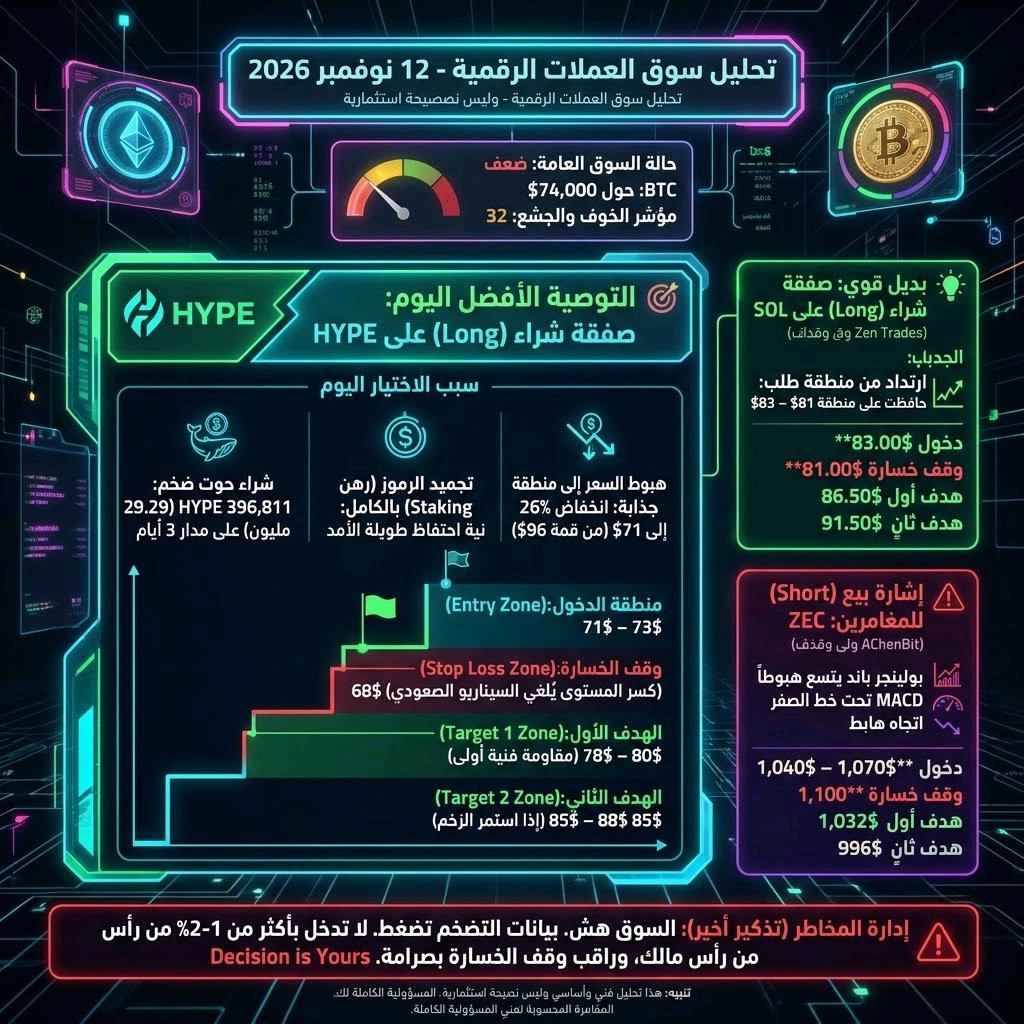
🎯 Recommendation: HYPE Buy Trade
After analyzing today's data, November 12, 2026, the general market remains weak (#BTC around $74,000 with the Fear and Greed Index dropping to 32). However, amidst this weakness, a Long signal for Hyperliquid (#HYPE) stands out as the most complete signal today, supported by a massive whale purchase and a full lock-up of tokens, which reflects strong confidence in future performance. 🎯 Recommendation: Long position on #HYPEUSDT Reason for today's selection: HYPE combines liquidity confirmation from whales with a price structure at a demand zone: · Massive whale purchase and token lock-up: A major player purchased 396,811 HYPE worth $29.29 million across several exchanges over three days, then deposited all purchased coins into staking about 6 hours before the announcement. This behavior (buying then locking) indicates an intention for long-term holding rather than quick speculation. · Price drop to an attractive zone: After #HYPE recorded a peak at $96, it dropped by 26% to reach $71 this month, providing a better entry point before any potential rebound. 📊 Suggested Trade Levels · Entry Zone: $71 – $73 (near the buying zone where the whale entered). · Stop Loss: $68 – Breaking this level invalidates the short-term bullish scenario. · Target 1: $78 – $80 – First technical resistance. · Target 2: $85 – $88 – If momentum continues. 💡 Strong Alternative: Long position on $SOL If you prefer to diversify risk, SOL offers a clear technical setup according to analyst Zen Trades: · Rebound from a demand zone: After falling from $125, #SOL maintained the demand zone of $81 – $83, and buyers began entering at the lows. · Levels: Entry $83.00, Stop Loss $81.00, Target 1 $86.50, and Target 2 $91.50. ⚠️ Short signal for the adventurous: #ZEC If you prefer a short position, there is a signal on ZEC from analyst AChenBit: · Reason: Bollinger Bands are widening downwards, MACD is below the zero line without a golden cross, and the general trend is bearish. · Levels: Entry $1,040 – $1,070, Stop Loss $1,100, Target 1 $1,032, Target 2 $996. ⚠️ Risk Management (Final Reminder) Calculated risk means you bear full responsibility. Crucial note: The general market is still fragile, and recent inflation data has pushed expectations towards an interest rate hike in December, which puts pressure on high-risk assets. Do not enter with more than 1-2% of your capital, and monitor the stop loss strictly. The HYPE trade is the most mature today due to liquidity confirmation, but the market is still not guaranteed. Disclaimer: This is a technical and fundamental analysis, not investment advice. The final decision and full responsibility are yours. #USInflationRunsHotAndRateHikeBetsRise $HYPEUSDT $SOLUSDT
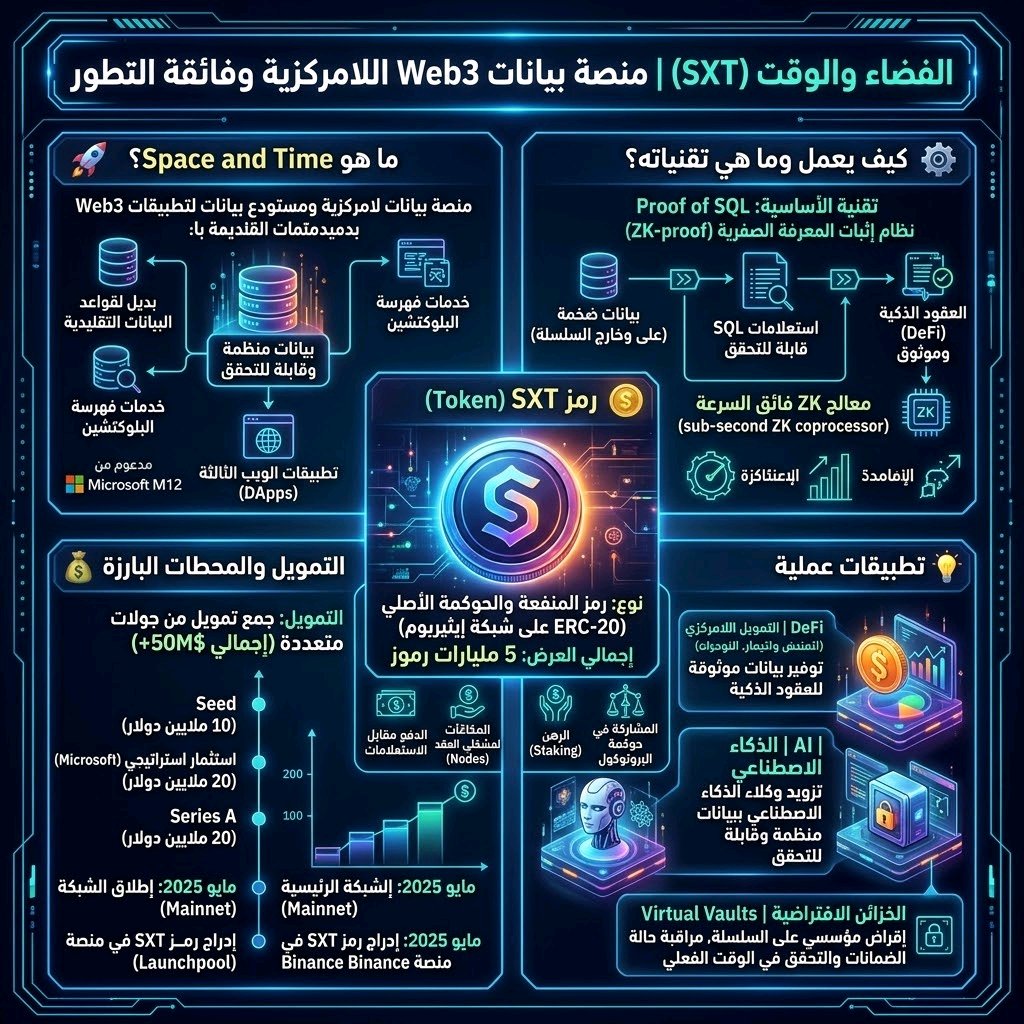
Information about SXT,
🚀 What is Space and Time (#SXT)? It is a decentralized data platform and data warehouse specifically designed for #Web3 applications. It acts as a decentralized alternative to traditional databases and blockchain indexing services, allowing applications to access structured and verifiable data at scale. The project is backed by Microsoft (via the #M12 fund). ⚙️ How it works and its technologies? The project is based on a core technology called Proof of SQL, a zero-knowledge (ZK-proof) system that enables advanced capabilities: · Verifiable Queries: Developers can run complex #SQL queries on massive datasets (both on-chain and off-chain), and then generate a cryptographic proof verifying that the query result is accurate and has not been tampered with. · Efficiency for Smart Contracts: Smart contracts can use these trusted results to execute their logic without the need to re-process raw data, saving on costs and improving scalability. · Speed: The Proof of SQL technology is described as a "sub-second ZK coprocessor." 🪙 #SXTUSDT Token · Type: The native utility and governance token of the platform, operating as an ERC-20 token on the Ethereum network. · Uses: Used to pay for query processing, rewards for node operators, staking, and participating in protocol governance. · Total Supply: 5 billion tokens. 💰 Funding and Milestones · Funding: The project raised funding across multiple rounds, starting with a $10 million seed round, followed by a $20 million strategic investment from Microsoft, and finally a $20 million Series A funding round. · Launch: The Mainnet was launched in May 2025. · Listing: The SXT token was listed on Binance in May 2025 as part of the Launchpool program. 💡 Practical Applications · Decentralized Finance (DeFi): Providing trusted data for smart contracts. · Artificial Intelligence (AI): Supplying AI agents with structured and verifiable data. · Virtual Vaults: A feature launched by the project for institutional on-chain lending, allowing lenders to monitor and verify the status of collateral in real-time. $SXTUSDT
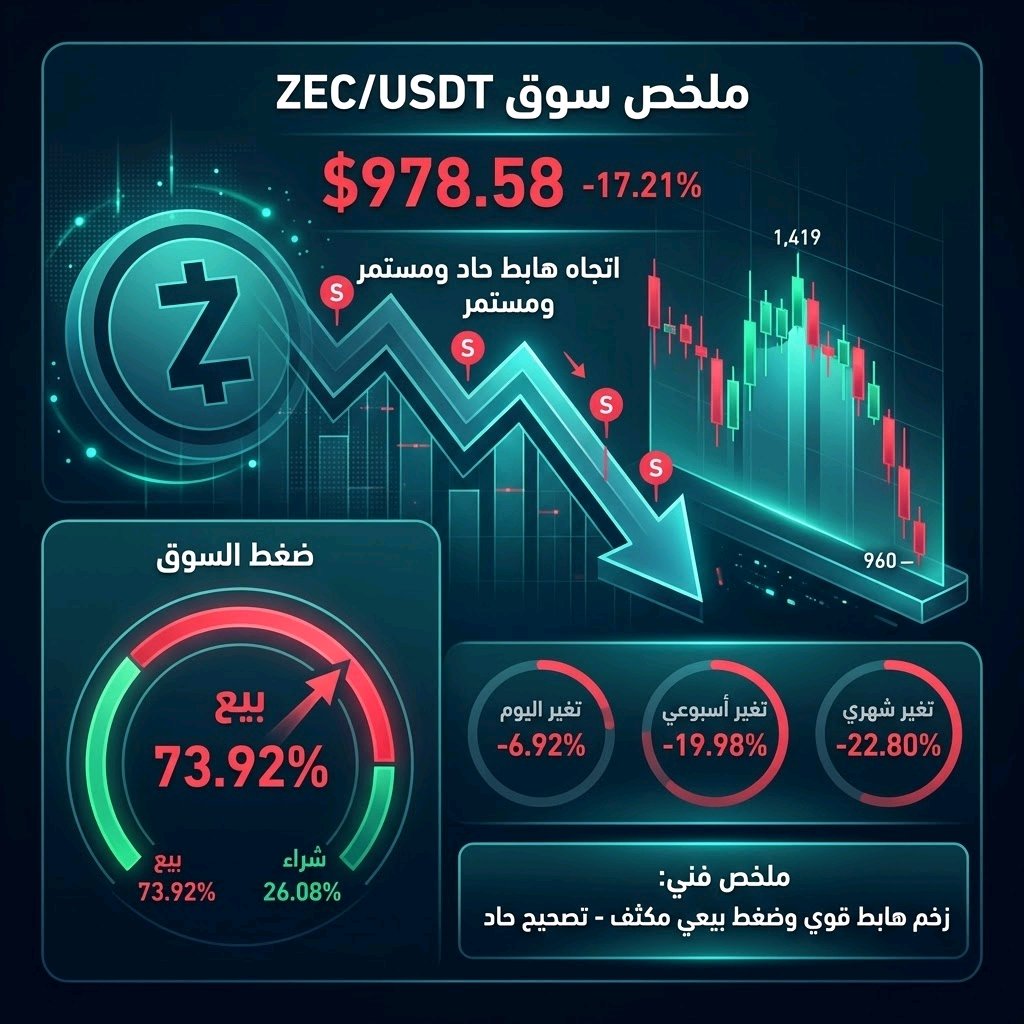
Technical analysis and potential trend,
By analyzing the data and technical indicators shown on the chart for the #ZECUSDT (perpetual) contract, we can read the current price movement and expected trend with objective accuracy: 1. Reading the current price situation: * Current Price: The price is trading around 978.58, recording a strong retreat and a sharp drop in recent sessions. * Daily Range (within 24 hours): High reached 1,199.91 and low reached 960.56. * Ratios and Time Changes: * Today's Change: Drop of approximately 6.92%. * 7-Day Change: Drop of 19.98%. * 30-Day Change: Drop of 22.80%. * (While longer-term returns like 90 and 180 days are still in positive territory, the current short-term momentum is suffering from a violent correction). * Market Sentiment (Order Book / Trading Deals): The ratio at the bottom of the screen shows a clear dominance of selling at 73.92% compared to 26.08% for buying, reflecting intense selling pressure and current dominance of the bears. 2. Technical Analysis and Potential Trend: * Short-term Trend: Strong down-trend. The recent red candles are long and consecutive, breaking important support levels down to a low at 960.56. * Price Action: After reaching the local peak near the 1,397 - 1,419 area, the price witnessed a strong profit-taking wave followed by accelerated selling pressures (large 'Sell' and 'Buy' markers can be observed on the chart). The sharp break below the 1,130 and 1,034 levels opened the door for further pressure towards testing the psychological support area at 960 and around it. * Potential Scenarios: * Corrective Rebound Scenario (Bounce / Relief Rally): Given the arrival at a support area near the daily low (960) and oversold conditions, a slight rebound may occur to correct the sharp decline towards the 1,030 - 1,050 zones to test them as new resistance before the trend continues. * Downward Continuation Scenario (Continuation): In case the current value (960.56) is broken firmly and with high trading volumes, the bearish momentum may push the price to new lower levels. Note: Digital markets are characterized by high volatility, and analyzing order flow and real-time liquidity on smaller timeframes provides a more accurate view for confirming entry or exit points.
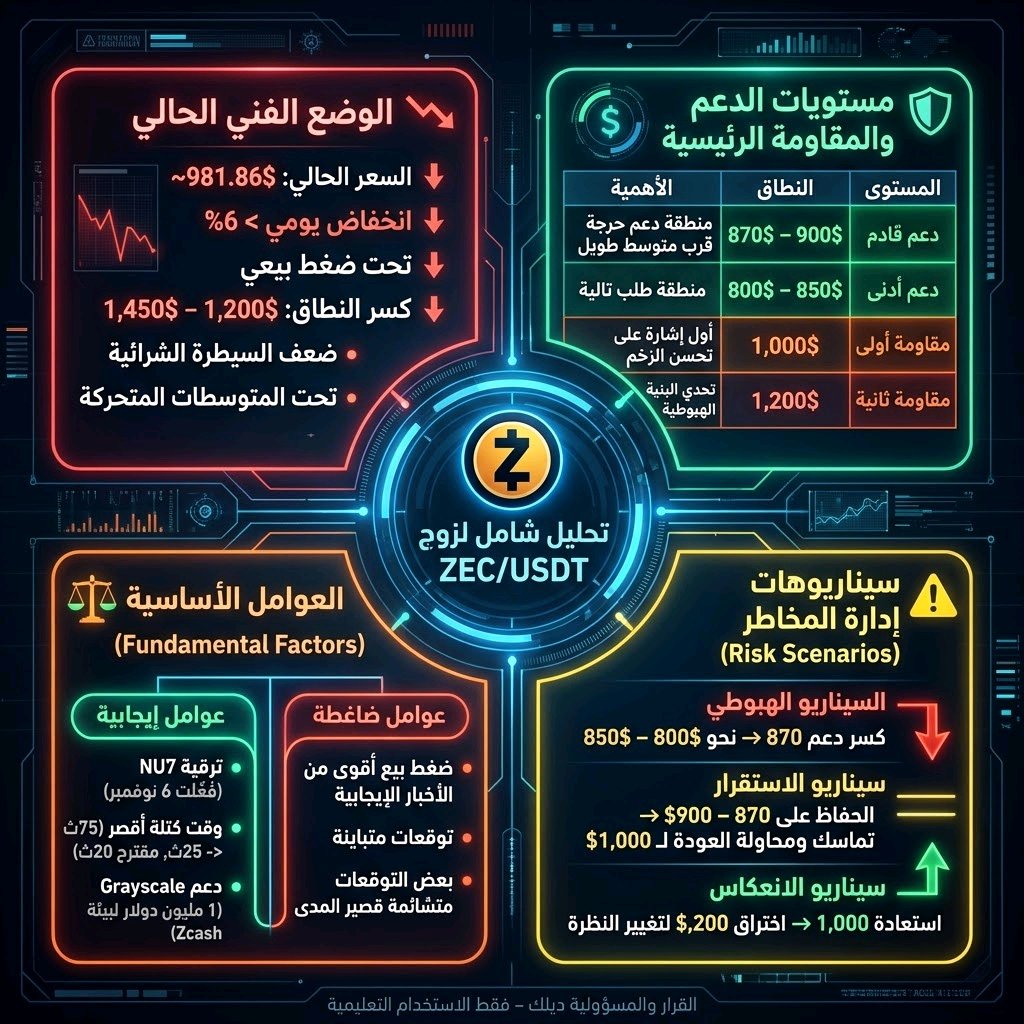
Comprehensive research and analysis on ZEC,
I will provide an objective analysis of the #ZECUSDT pair based on the latest available data, focusing on risks and scenarios. 📉 Current Technical Situation #ZEC is currently trading under clear selling pressure after breaking below a significant psychological and technical level: · Current Price: $ZEC is trading around $981.86, following a daily decline exceeding 6%. · Range Breakout: A previous accumulation range between $1,200 and $1,450 has been broken, indicating weak buying control in the short term. · Moving Averages: The price is now below short-term moving averages, weakening the technical structure temporarily. 🛡️ Key Support and Resistance Levels Level | Range | Importance --- | --- | --- Upcoming Support | $870 – $900 | A critical support zone near a long-term moving average; maintaining it may allow for stabilization. Lower Support | $800 – $850 | The next demand zone if the first support fails. First Resistance | $1,000 | Reclaiming this level is the first sign of improving momentum. Second Resistance | $1,200 | Breaking above this may challenge the current bearish structure. ⚖️ Fundamental Factors There is a balance between long-term supporting factors and short-term selling pressure: · Positive Factors: · #NU7 Upgrade: Activated on November 6th, reducing block time from 75 to 25 seconds, with a proposal to lower it to 20 seconds. · Institutional Support: #Grayscale announced a $1 million commitment to support the Zcash ecosystem. · Pressuring Factors: · The upgrade and Grayscale's support have not prevented the decline, suggesting that current selling pressure is stronger than the positive news. · There are mixed expectations; some are pessimistic in the short term, while others (such as Alliance DAO) predict it reaching very high levels ($5,000 - $20,000) in the very long term, which are high-risk projections. ⚠️ Risk Management Scenarios · Bearish Scenario (most technically likely at the moment): Continued selling and breaking the $870 support may open the way toward $800 – $850. · Stabilization Scenario: Maintaining $870 – $900 may lead to consolidation and an attempt to return toward $1,000. · Reversal Scenario: Reclaiming $1,000 first, then breaking through $1,200 to change the bearish outlook. Important Note: These markets are highly volatile, and the information above is for educational analysis only. The decision and responsibility lie with you alone. $ZENUSDT
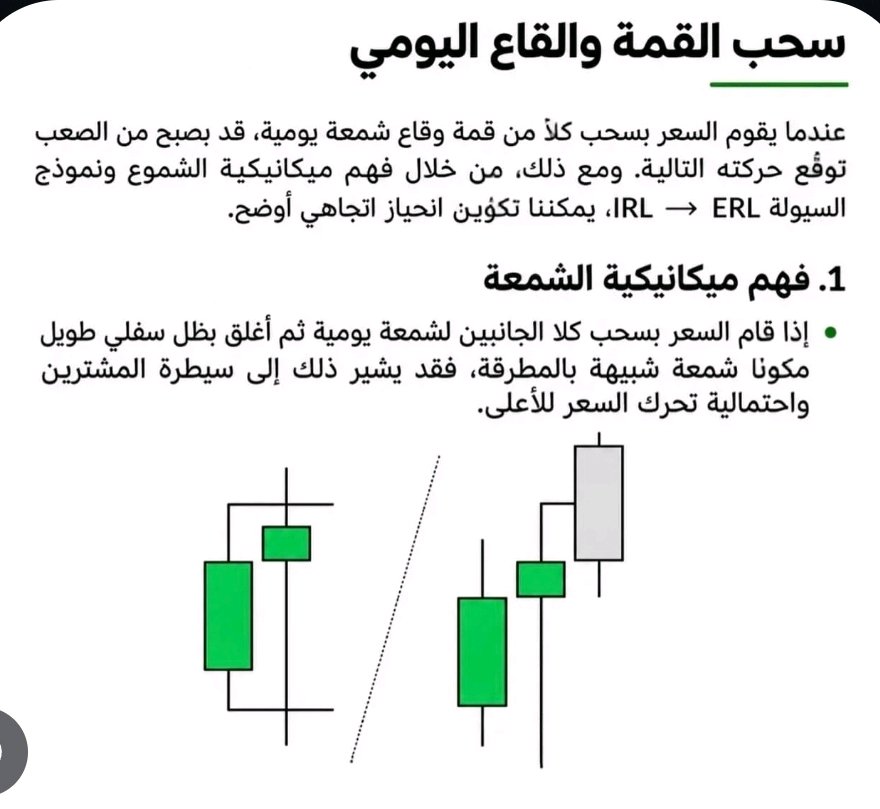
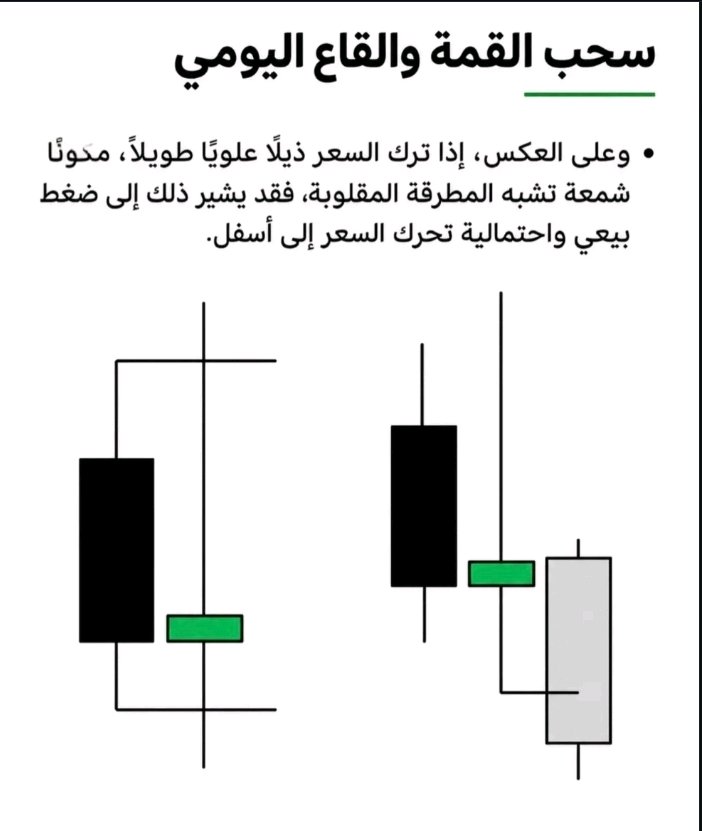
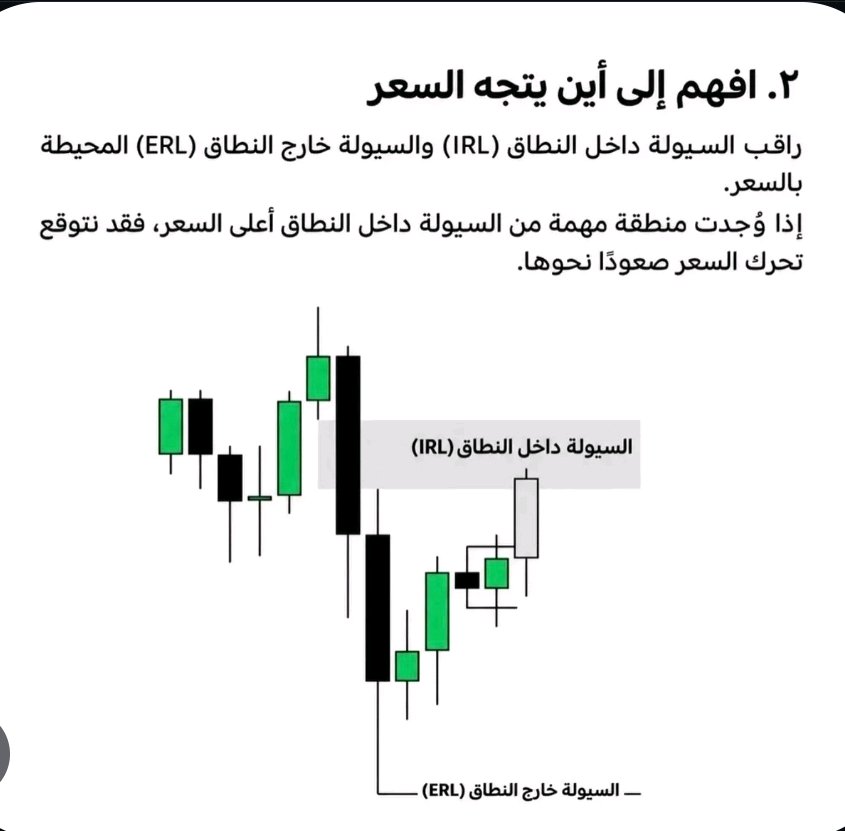
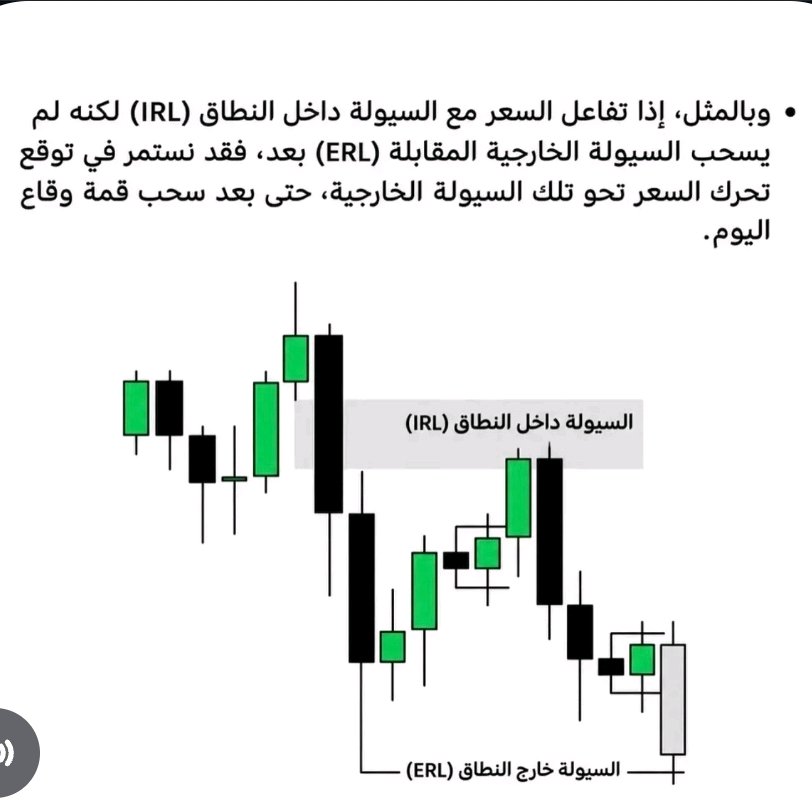
Learn to identify liquidity grab zones at peaks and troughs,
📊 Is it possible for the price to sweep the high and the low in the same day? And what could happen after such a move? One of the most important concepts in trading is the Liquidity Sweep. However, just because the price takes liquidity from above or below, doesn't mean it will immediately reverse. Let's understand how to read the move: 🔹 First: The lower wick of the candle If the price drops below the low and closes back above it, this could indicate a rejection of lower prices and the presence of buying interest. 🔹 Second: The upper wick of the candle If the price breaks above the high and closes back below it, there could be a rejection of higher prices and selling pressure. 🔹 Third: Where is the targeted liquidity? * #IRL: Liquidity found inside the price range. * #ERL: Liquidity found outside the price range. 🎯 What should you watch for? A liquidity sweep on its own is not a sufficient signal to enter a trade. The most important thing is to monitor the price's reaction after the sweep and wait for confirmation, such as a Market Structure Shift (#MSS) or a clear break of structure. 💡 Remember: It's not about knowing where the price swept liquidity; it's about understanding what it does afterwards. #Information #AnthropicIPOTestsTheAIBoom #USInflationRunsHotAndRateHikeBetsRise $XRPUSDT $NEARUSDT
🚨 Tech giants' stocks are taking a hard hit,
Are we facing a golden investment opportunity or the beginning of a bigger downtrend? #US_markets are witnessing a reassessment of tech and AI stocks amid concerns over rising financing costs, massive spending on data centers, and regulatory pressures. But the most important question is: Have #stock prices dropped due to weak business performance, or because of investor fears? 📊 The numbers reveal a different picture: 🔹 #NVIDIA: Quarterly revenue of $96.2 billion, up 106%, but the stock's valuation makes it sensitive to volatility. 🔹 #Alphabet: Revenue of $127.6 billion, and Go..ogle Clo..ud growth of 103%, reflecting the strength of its core business. 🔹 Bro..adcom: Revenue of $29.6 billion and free cash flow of $13.7 billion. 🔹 Meta: Revenue growth of 26% to $64.6 billion, despite pressures from increased spending. 🔹 Salesforce and Adobe: Strong businesses and recurring revenue, but competition in AI poses a challenge. 🔹 Oracle: Cloud infrastructure growth of 121%, against risks associated with expansion and financing costs. 📌 Institutions like Morgan Stanley and UBS believe the markets may have overreacted to AI-related risks. In my opinion, Alphabet and Meta are among the most notable stocks worth watching, while NVIDIA and Broadcom offer strong growth opportunities, but with higher risk. 🎯 Bottom line: A drop alone does not create an investment opportunity. The real opportunity emerges when the stock price falls below its fair value, while the company's business fundamentals remain strong. 💬 If you had to choose one stock for long-term investment, which one would you pick? ⚠️ This content is for educational purposes only and is not investment advice. $NVDAXUSDT $METAXUSDT


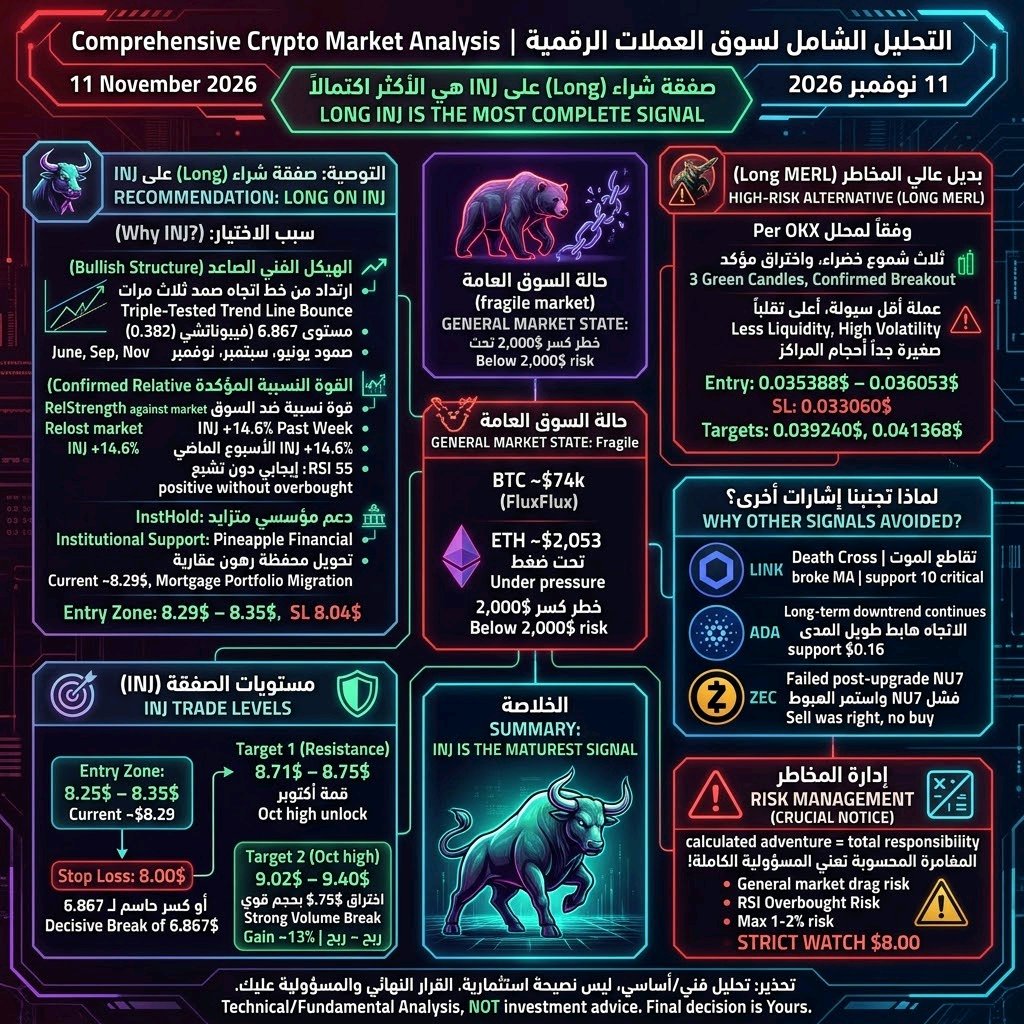
🎯 Recommendation: INJ buy order,
Analysis of data for November 11, 2026. The general market remains fragile (#BTC hovering around $74,000, and #ETH under pressure at $2,053 with the risk of breaking $2,000). However, amidst this weakness, a buy signal (Long) stands out for Injective ( #INJUSDT ) as the most complete signal, supported by a bullish technical structure and increasing institutional interest. 🎯 Recommendation: Long position on #İNJ Reason for today's selection: INJ combines confirmed relative strength, a bullish technical structure, and an entry point close to support: · Rebound from a trendline that held three times: INJ bounced from the $6.867 level (Fibonacci 0.382) which coincided with an upward trendline that held in June, September, and November, turning previous resistance into strong support. · Relative strength against the market: INJ has risen 14.6% over the past week, outperforming most altcoins, with RSI at 55 (positive without being overbought). · Institutional support: Pineapple Financial has started migrating its mortgage portfolio to chains via Injective, adding real institutional demand. · Close entry point: The current price (~$8.29) is close to the ideal entry zone ($8.29 – $8.35) identified by analysts, with a logical stop-loss at $8.04. 📊 Proposed trade levels · Entry Zone: $8.25 – $8.35 (Current price ~$8.29). · Stop Loss: $8.00** – Breaking this level invalidates the short-term bullish scenario. A decisive break at **$6.867 invalidates the entire bullish structure. · Target 1: $8.71 – $8.75 – Major resistance, breaking which opens the way toward October's peak. · Target 2: $9.02 – $9.40 – If the price breaks $8.75 with strong trading volume, the next target is the local October peak at $9.417 (about 13% higher than current levels). 💡 High-risk alternative (for those wanting a bigger adventure) If you are looking for higher risk, there is a buy signal (Long) on #MERL : · Entry Zone: $0.035388 – $0.036053 · Stop Loss: $0.033060 · Targets: $0.039240 then $0.041368 · Reason: Three consecutive green candles, and a confirmed breakout could attract new buyers. Warning: $MERL is a less liquid and higher volatility coin than INJ, and it is only suitable for very small position sizes. ⚠️ Why did we avoid other signals today? · $LINK: Approaching a Death Cross after breaking all moving averages, trading at $10.49. Crucial support at $10; breaking it opens the way for further decline. · ADA: Long-term downtrend continues, trading at $0.1776 (37% down from October's peak). Next support at $0.16. · ZEC: After the NU7 upgrade, the price failed to rise and continued to fall. The previous sell recommendation was correct, but there is no new buy signal yet. INJ is the most mature signal today: bullish structure, relative strength, and institutional support, with a close entry point and a clear stop-loss. ⚠️ Risk Management (a final reminder) Calculated risk means you bear full responsibility. Crucial note: the general market is in a bearish state, and any new sell wave could drag INJ with it despite its relative strength. RSI is approaching overbought areas on short timeframes, which may cause a temporary correction. Do not enter with more than 1-2% of your capital, and watch $8.00 strictly; breaking it means the short-term scenario has failed and you must exit. Disclaimer: This is technical and fundamental analysis, not investment advice. The final decision and full responsibility are yours. $INJUSDT
Interest rates,
🚨 #Interest rates ‼️ 🇺🇸 The probabilities of the Federal Reserve raising interest rates in December have risen to exceed 99%, given hints from Fed officials regarding an additional interest rate hike, which is extremely bad for the markets. US #Federal Reserve Governor Christopher Waller: 📌 A 50 basis point rate hike might be needed in December if core CPI inflation in October records 0.3% or more. 📌 I would support a 25 basis point rate hike next month even if the inflation rate improves in October compared to September. $SOLUSDT $NEARUSDT

3 chip stocks off Bank of America's list,
Nvidia is off Bank of America's 'US 1' list... so why is it still a 'Buy' rating? Bank of America has removed 3 stocks from the semiconductor sector from its 'US 1' list, which includes its top investment ideas among the US-listed stocks covered by its analysts. The stocks are Nvidia (#NVDA), Micron (#MU), and Lam Research (#LRCX). At the same time, the bank has maintained a 'Buy' rating for all three. So, what's the difference? A 'Buy' is the analyst's rating for the stock within their coverage. But being on the 'US 1' list means the stock is part of a narrower group of ideas that the bank prioritizes. That's why a stock can drop off the list while keeping its rating. What's interesting is that the decision affected three different links in the chip industry: Nvidia designs AI processors, Micron produces memory chips, and Lam Research manufactures chip-making equipment. And if you're following these stocks, the question worth watching is: will profit estimates or price targets change in future updates? That's what will help you understand if the #analysts' view on the stocks themselves is starting to change. This is not investment advice. $NVDAXUSDT $LRCUSDT

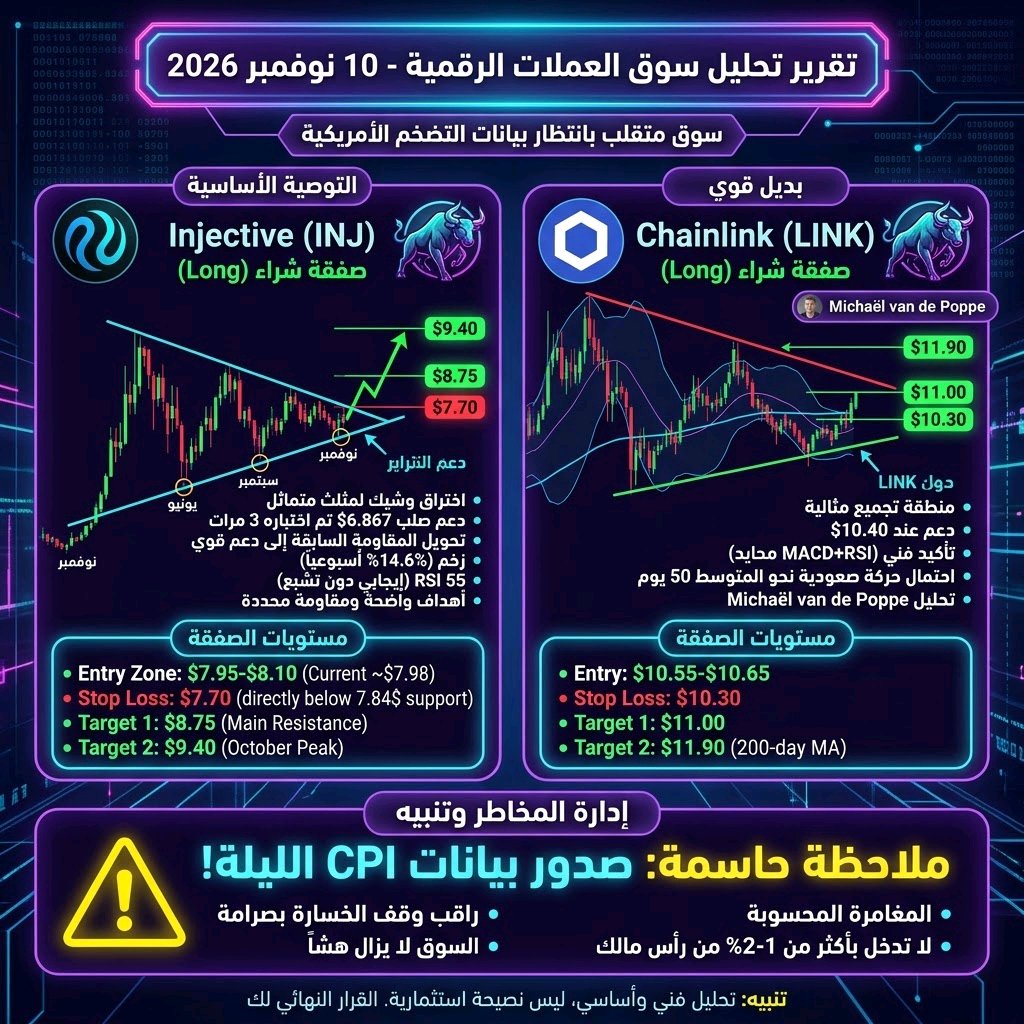
🎯 Main Recommendation: Long position on INJ,
After analyzing today's data, November 10, 2026, the most prominent integrated technical signal is on Injective (#INJUSDT), with a strong alternative on Chainlink (#LINKUSDT). The general market remains volatile while awaiting US inflation data, so today's best trades are those based on clear price structure rather than general market direction. 🎯 Primary Recommendation: Long position on #INJ Reason for selection: INJ combines a confirmed bullish structure, strong support, and an entry point close to critical levels: · Imminent technical pattern breakout: The price is trapped within a symmetrical triangle on the 2-hour timeframe and is approaching the breakout point. Any confirmed upward breakout could pave the way for a strong move. · Solid support tested three times: The price bounced from the $6.867 zone, which coincided with an uptrend line that held in June, September, and November, turning previous resistance into strong support. · Clear targets and defined resistance: First resistance is at $8.75 (breaking it opens the way to the October high), and an extended target at $9.417 (about 16% higher than current levels). Critical support is at $7.84, followed by $6.867. · Relative buying momentum: INJ achieved a 14.6% increase over the past week, outperforming most altcoins, with an RSI at 55 (positive, not overbought). 📊 Suggested Trade Levels (INJ) · Entry Zone: $7.95 – $8.10 (Current price ~$7.98). · Stop Loss: $7.70 (Break below the $7.84 support directly). · Target 1: $8.75 (Major resistance). · Target 2: $9.40 (October high). 💡 Strong Alternative: Long position on #LINK If you prefer to diversify risk, LINK offers an attractive technical setup according to some analysts, who believe that the general market bottom may have already formed: · Ideal accumulation zone: The price ($10.63) is within the Bollinger band, with support at $10.40 and first resistance at $11.06. · Technical confirmation: Golden cross on the MACD indicator at -0.12, with a neutral RSI at 45.71, supporting the possibility of an upward move towards the 50-day moving average at $10.96. · Levels: Entry $10.55 – $10.65, Stop Loss $10.30, Target 1 $11.00, and Target 2 $11.90 (200-day average). ⚠️ Risk Management (Final Reminder) Calculated risk means taking full responsibility. Crucial note: US inflation data (#CPI) is released tonight, and any upward surprise could pressure the entire market. Do not enter with more than 1-2% of your capital, and monitor your stop loss strictly. INJ is the most mature signal today, but the market remains fragile. Disclaimer: This is technical and fundamental analysis and not investment advice. The final decision and full responsibility are yours. #NovUSCPIWatch $INJUSDT $LINKUSDT
Bitcoin is solid,
#Bitcoin is holding steady while money is flowing out.. How? Bitcoin moved quietly on Tuesday morning, rising 0.3% to around $74,358 at 10:19 AM Riyadh time. But behind this calm movement, U.S. spot Bitcoin ETFs recorded net outflows of $201 million on Monday, following the exit of over $1.2 billion last week. How can the price go up while money is flowing out? Because ETFs are just a part of the market, and there are buyers on other platforms who might be absorbing some of the selling pressure. However, the continued outflows leave the question open regarding the sustainability of this rebound. In the background, traders are waiting for U.S. #inflation data. If the reading comes in higher than expected, it could strengthen bets on #interest rate hikes and weigh on risk appetite. At the same time, the midterm election results have opened up new questions about the direction of Congress regarding crypto regulation. Because of this, the next test is whether Bitcoin can maintain its gains if money continues to flow out of the ETFs after the inflation data is released. This is not investment advice. #CPITestsDecemberRateOutlook $BTCUSDT $BCHUSDT