NNADOZIECOVENANT
3331Like0Shares72Fans5Follow
YOUR MARKET ANALYST, AND NO.1 COMMUNITY BUILDER. That spot guy on BYBIT
YOUR MARKET ANALYST, AND NO.1 COMMUNITY BUILDER. That spot guy on BYBIT
China's economy right now
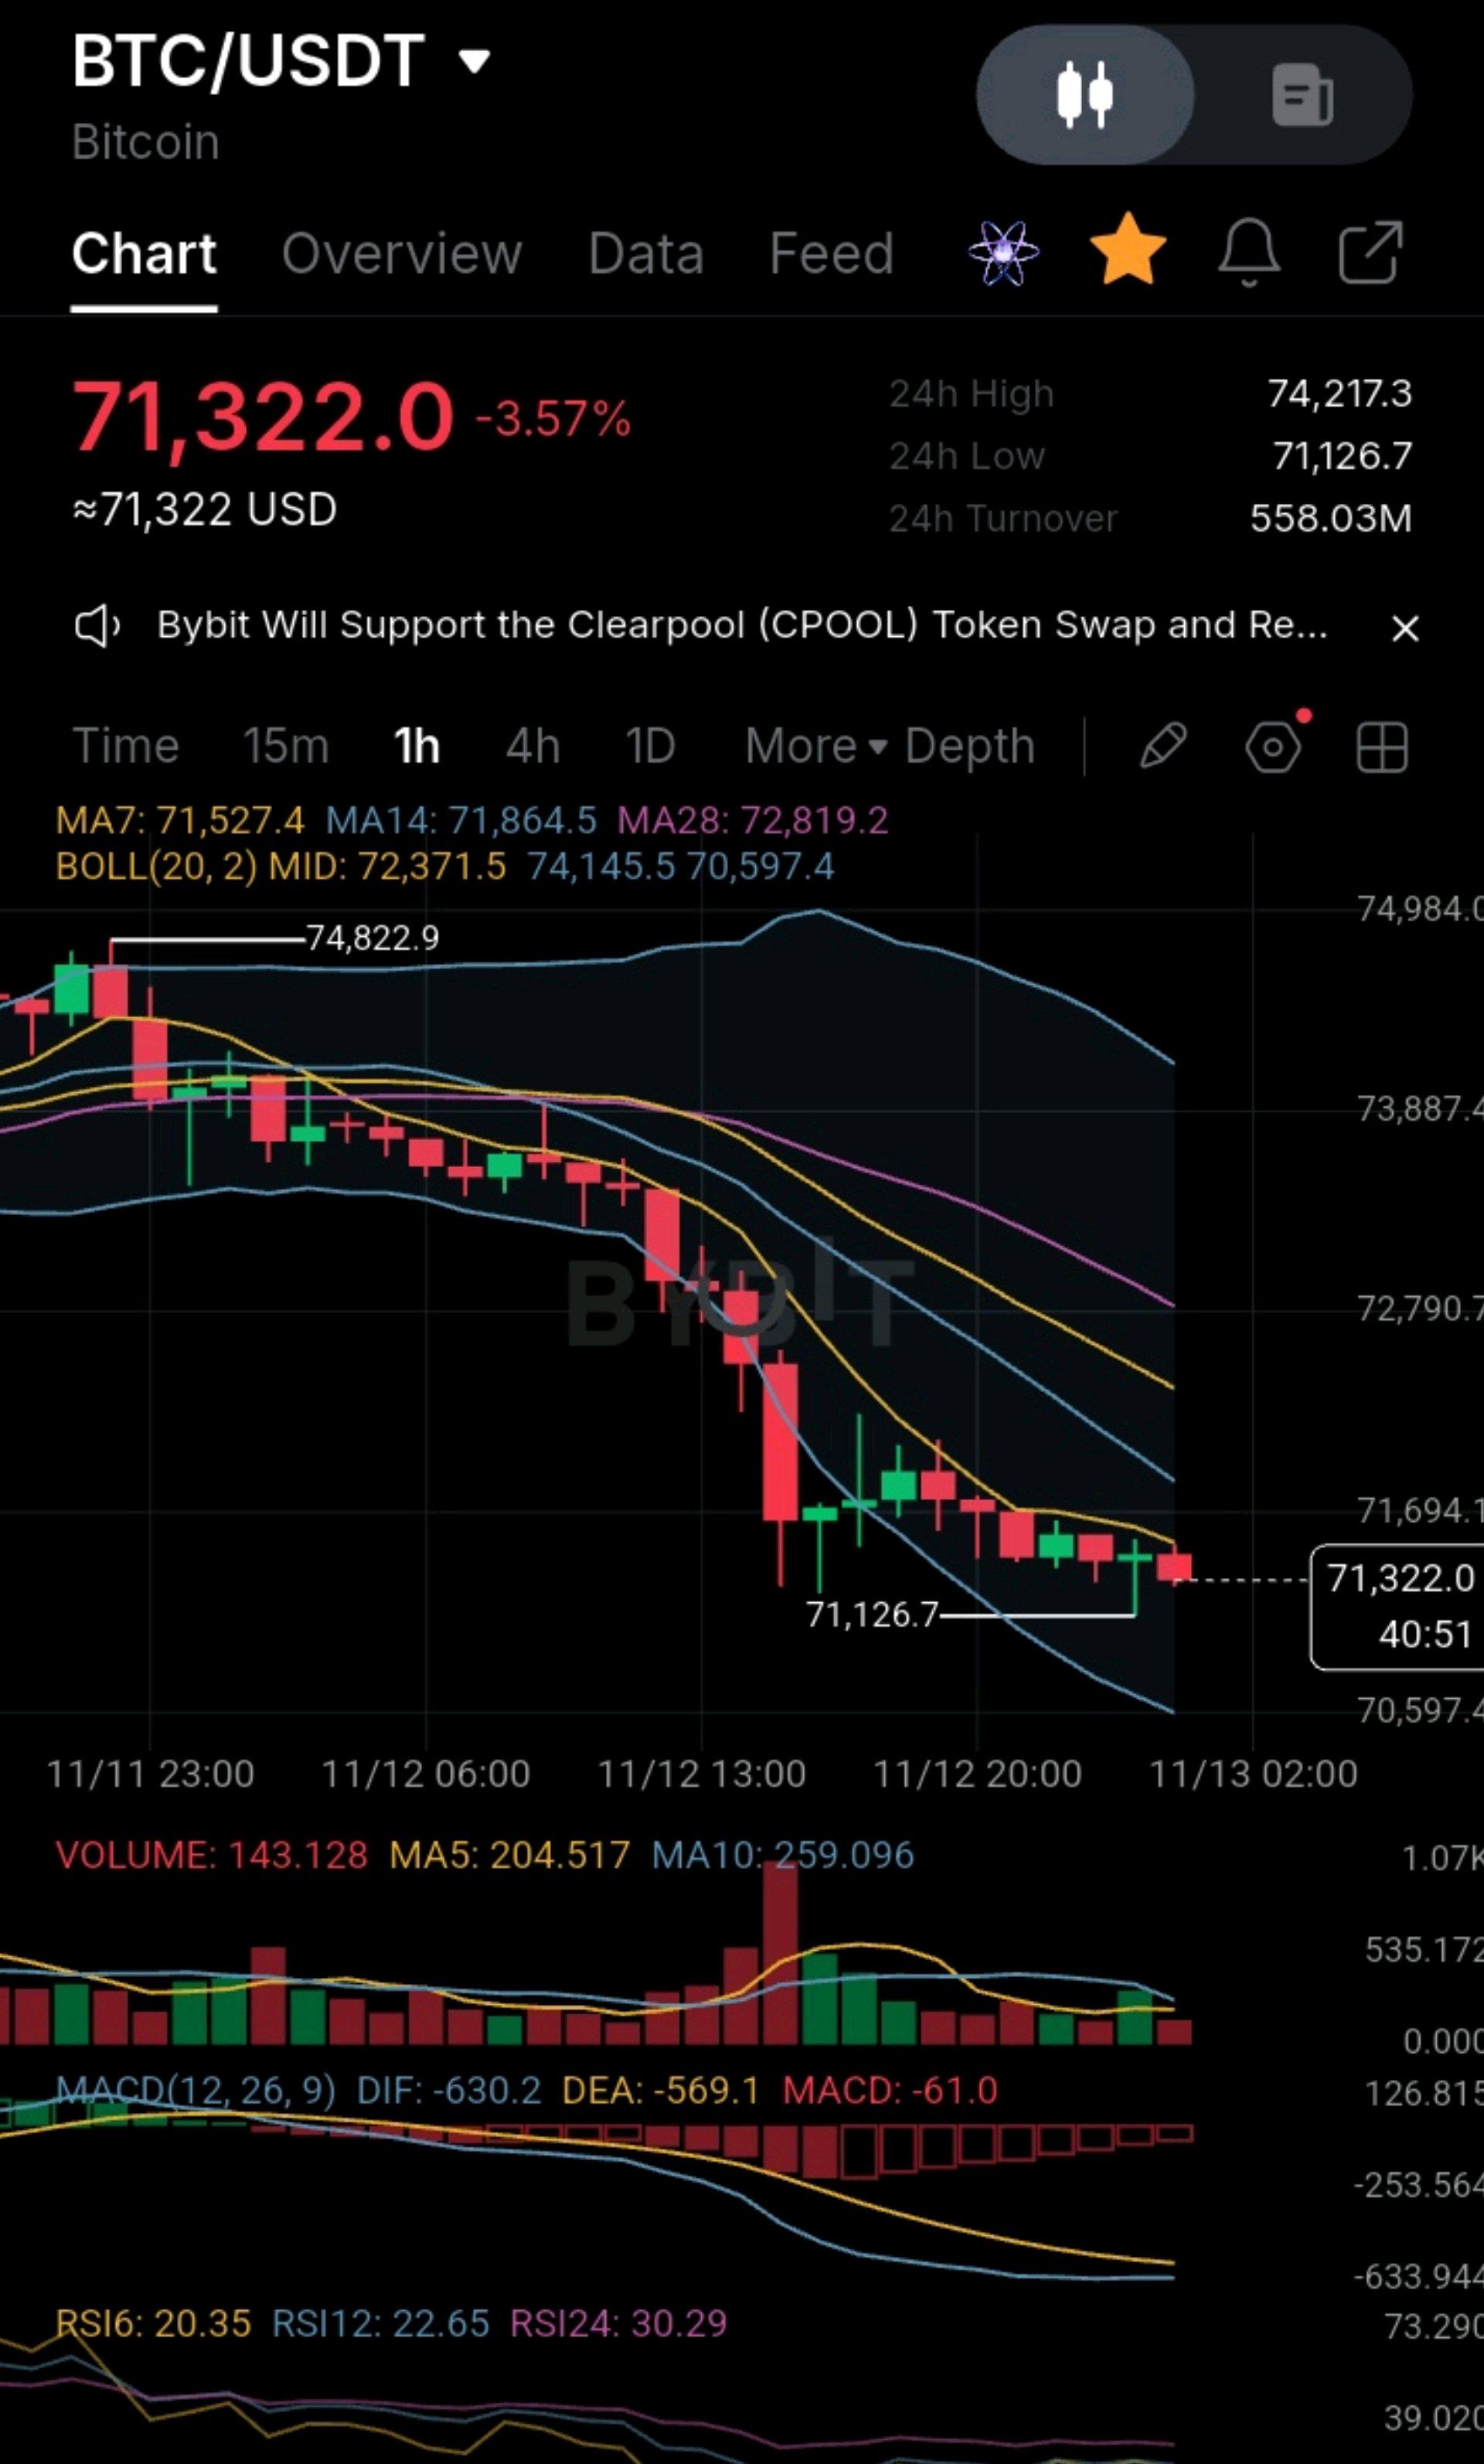
#ByXIMPACT #USInflationRunsHotAndRateHikeBetsRise #AnthropicIPOTestsTheAIBoom #SanDiskAnnounces8For1StockSplit #BitcoinHitsTwoMonthLowAfterUSMidterms Snapshot (13 November 2026): BTC is trading around $71,400, down about 4.1% in 24 hours and 5.8% over 7 days. A month ago it was near $82,400, and the all-time high is about $126,200. The Fear & Greed Index reads 29 (Fear). 🇨🇳 China's economy right now Prices: October producer prices rose 5.7% year on year, the fastest since June 2022, driven by mining and raw materials. Consumer prices rose only 0.7%, leaving a gap of about five percentage points. My reading is that this is cost pressure, not healthy demand, and it makes easing harder for Beijing. Growth: the picture is mixed. One report said third-quarter growth and September retail sales beat expectations, after a weak second quarter of 4.3%. Policy: the PBOC's latest quarterly report dropped its pledge to introduce incremental policies, and analysts see December's annual policy meeting as the next window for fresh stimulus. The central bank still acknowledged strong supply against weak demand. Yuan: the currency has rallied about 5% this year, and the PBOC raised the FX reserve ratio to 6%, effective November 15, to slow it. Stocks: Chinese equities had a record 12-week slide, and the central bank and regulators were set to meet on stock support. How China affects BTC Liquidity and credit. Some analysts argue that money and credit in the Chinese system have a profound impact on Bitcoin. New stimulus or credit growth would be a tailwind, and its absence is a headwind. Credit and money-supply figures are due this week. Risk appetite. Weak Chinese data and falling Chinese stocks tend to push global markets toward risk-off, which hits crypto. Currency and dollar. A stronger yuan usually goes with a weaker dollar, which helps BTC. But the US dollar index just hit a 19-month high, and the PBOC's FX move tightens onshore dollar liquidity slightly. Regulation. China's crackdown targets offshore exchanges, stablecoins and tokenized assets, so direct Chinese buying is limited. Beijing is instead pushing its digital yuan as a core part of its 2026-2030 plan. Is China the main driver? No. Reports note that US and European spot ETFs now dictate global crypto cycles, reducing the historical impact of Asian-led moves. The bigger recent pressures are US-side: a hot US inflation print sent BTC to its lowest since August and below the 200-day EMA at $76,418, and US spot ETFs lost $515M in October, their first monthly outflow since June. China is a secondary factor and mostly works through global risk sentiment. 📈 BTC scenarios (illustrative, not predictions) Base case, range-bound with downside bias: one outlook sees $70,000-$78,000 into late November. The 200-day average at $76,418 and the 100-day at $77,483 form a ceiling above price. Bearish case: a sustained break under $70,000 opens the way to about $69,000, then roughly $63,800. A repeat of 2022's November would put BTC near $65,500. Bullish case: reclaiming $73,000-$73,200 (the 200-day area), then about $78,000, with $79,300 as the next resistance. Reaching the mid-$80Ks would need a real change in macro conditions. Catalysts to watch: China's money and credit data this week, the November 15 FX rule, December's Chinese policy meeting, US ETF flows and the next US inflation print. Be careful with forecasts. They disagree wildly. 2026 ranges include $47,100 to $87,900 from one source and $74,900 by year-end with a $68,100-$82,400 range from another. In August, some sites projected $90,000-$105,000 for November, which has not happened. Nobody can reliably call the next move. My own lean is cautious: I'd stay defensive while BTC is below the 200-day average (about $76.4K), and I'd become more constructive only on a reclaim of that level with ETF inflows returning. For beginners: don't trade a headline about China without checking price levels, size small, use stops, and avoid leverage in a market sitting in "fear." This is analysis for discussion, not financial advice. Prices and forecasts change quickly, so check live data before acting. $BTCUSDT


WHALE POSITIONING (honest version)
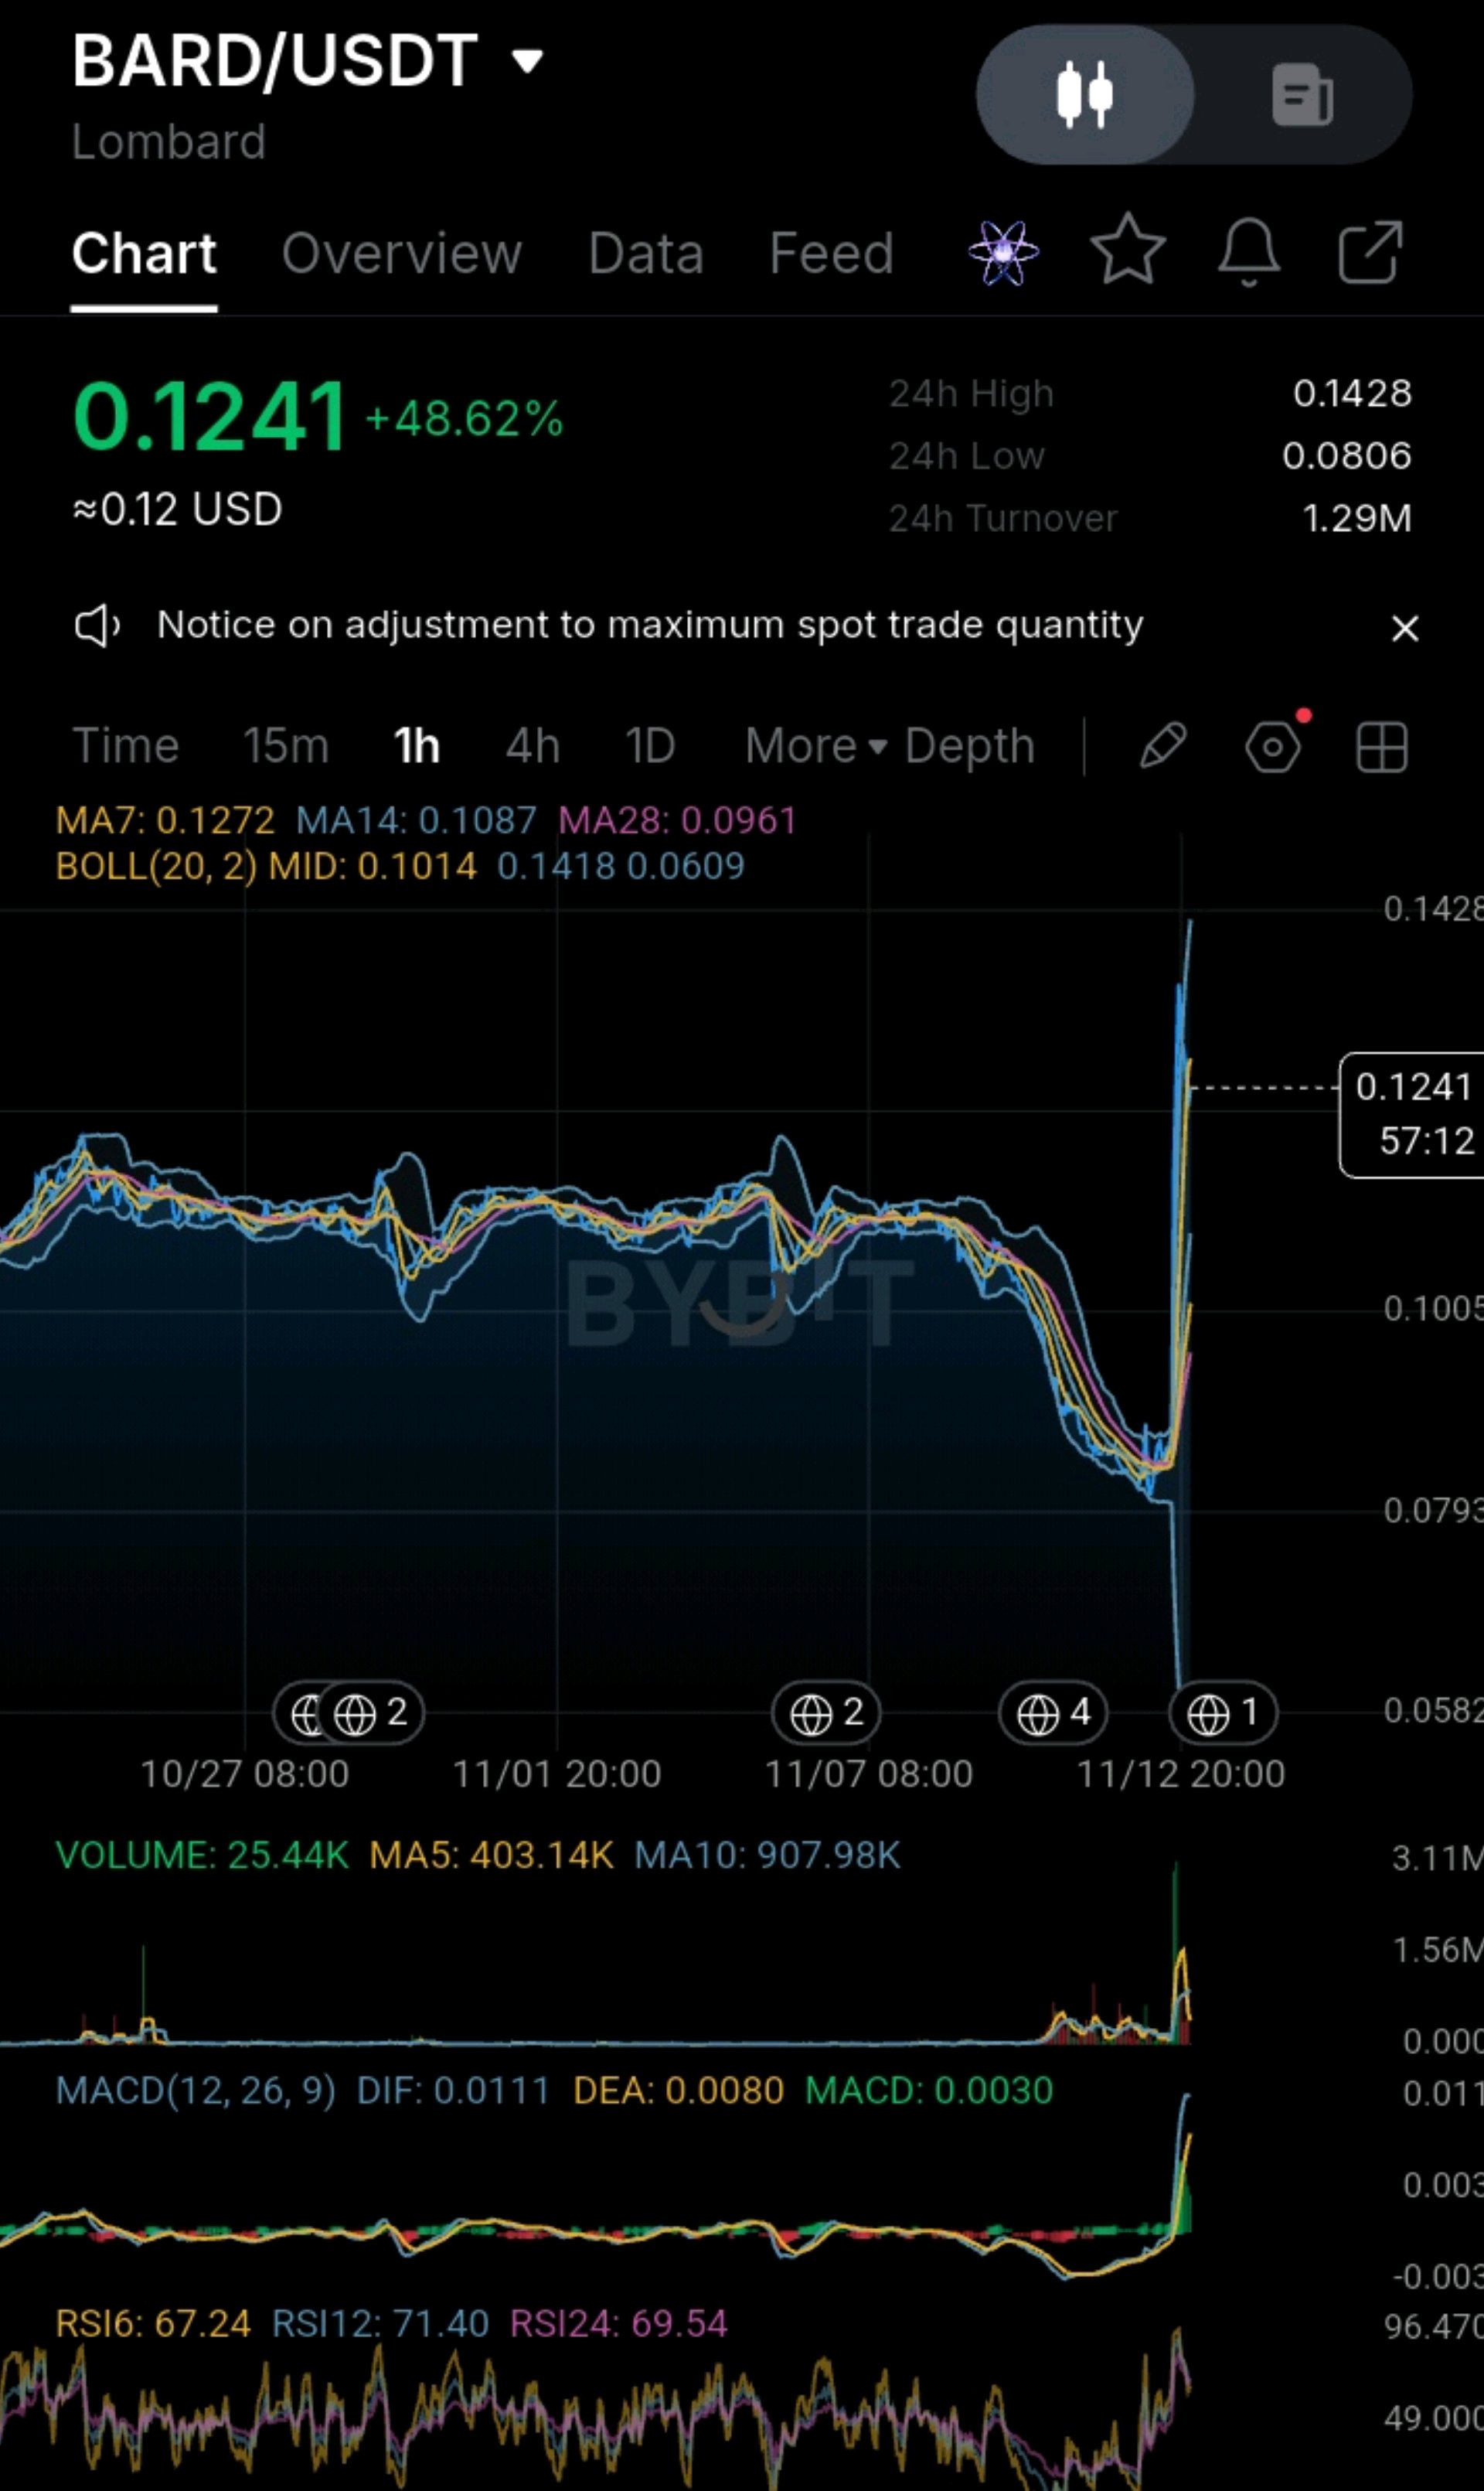
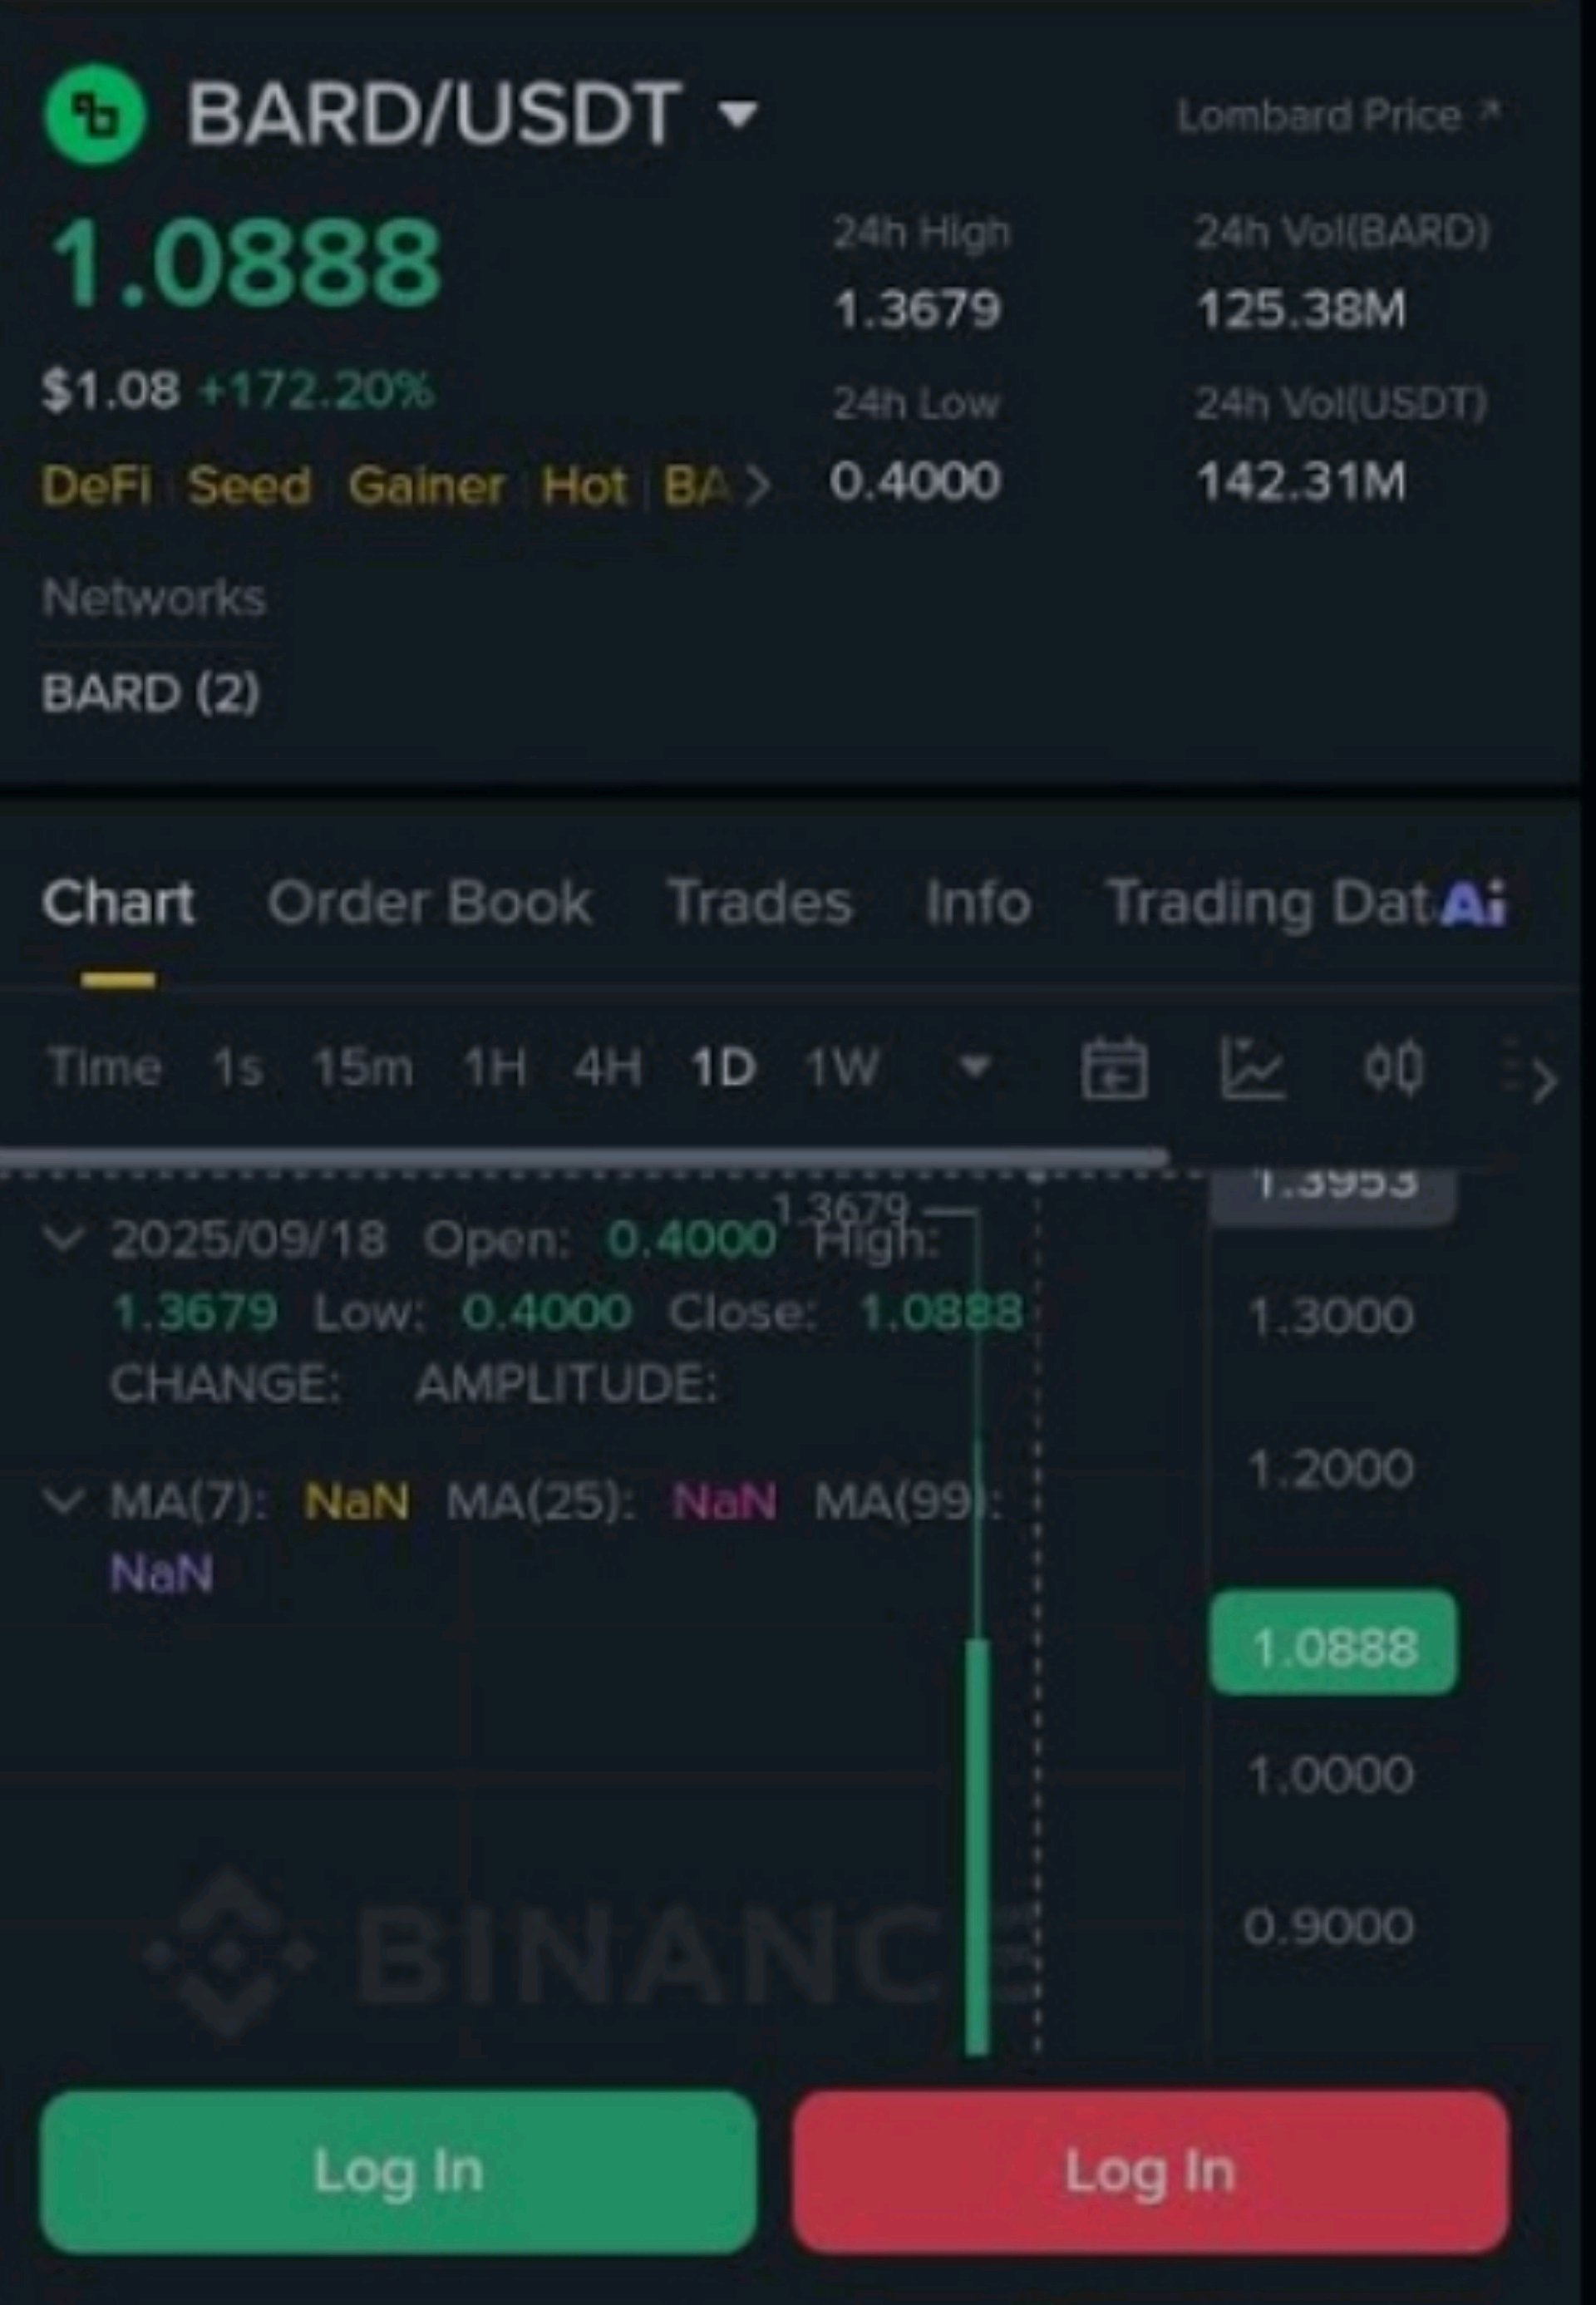
#IMPACTbyTrade #USInflationRunsHotAndRateHikeBetsRise #WSOT2026 #NovUSCPIWatch #USPayrollsAndRateDecisionsDriveMacroWeek 🐋 WHALE POSITIONING (honest version) BARD: the main whale-related risk is scheduled supply. Private investors were set to get 20% of the supply on a 12-month cliff with 36-month vesting, and the investor and team unlocks were reported to accelerate from September 2026. Large unlocks can add selling pressure, so check the current unlock dates. One older snapshot showed perps volume at about 14x spot, which suggests leveraged traders drive much of the action, but that data is undated. KOR: a new listing usually means concentrated early holders, a small float and heavy speculation. One snapshot showed about $1.1M of perp open interest and a positive funding rate of 0.0294% per 8 hours, meaning longs were paying to hold, which can unwind quickly. The Series A investors raised money at a $100M valuation in July 2026, so there may be early holders sitting on large, locked positions. That is a risk to verify, not a conclusion. Use Arkham and Nansen for labeled wallets, the explorer's holder page (Etherscan for BARD, Basescan for KOR), Coinglass for open interest and funding, and the projects' own docs for unlock dates. 📈 TECHNICAL INTERPRETATION BARD: a breakout that has started to retrace. Price is above the MA14 but below the MA7, volume is fading, and RSI is elevated (RSI6 67.24, RSI12 71.40, RSI24 69.54). Resistance is 0.1272 (MA7), then 0.1418 and 0.1428. Support is 0.1087 (MA14), 0.1014 (BB mid), 0.0961 (MA28), then 0.0806. KOR: a stronger trend that is dangerously stretched. The structure is bullish, but RSI6 at 75.45 and a gap of nearly 50% above the MA14 argue for patience. Resistance is 0.000629, then about 0.000680 (an estimate). Support is 0.000546 (upper band), about 0.000528 (the earlier spike zone), 0.000479 (MA7), then 0.000403/0.000396 and the 0.000301 low. Quick scorecard: Short-term trend: KOR is stronger. BARD has already lost its MA7. Momentum: both have fresh MACD crosses up. KOR's volume holds better, and BARD's is fading fast. Extension: BARD is less stretched. KOR is far more extended. Project maturity: BARD is clearly more established. KOR is days old. Overall risk: KOR is much higher, and BARD's is the unlock overhang. Best entry area: BARD is 0.1090-0.1130 (MA14). KOR is 0.000480-0.000500 (MA7), which is about 16-19% below the current price. 🧭 ADVICE TO BEGINNERS Don't chase a +45% candle. Both of these are better after a pullback than at the highs. Be extra careful with brand-new listings. KOR has already fallen roughly 98% from its listing-day high, and a bounce inside that is not a trend change. Check the unlock schedule. Heavy scheduled unlocks, like BARD's, can keep pressure on the price even when the chart looks good. Watch funding rates. A positive funding rate that stays high, as KOR's did in the snapshot, means longs are crowded and vulnerable. Use limit orders on thin tokens, since spreads and slippage cost real money. Always set a stop before you enter, and don't move it once you're in a trade. Risk only 1-2% of your account per trade. With stops this wide, that means a small position. Skip leverage until you're consistent. 🎯 MY VIEW On risk-adjusted terms, BARD is the better candidate: more established, less extended, and with a clear pullback zone. I'd want a bounce at the MA14 or a reclaim of 0.1272 on rising volume. KOR has the stronger chart right now, but it's a days-old, tiny-cap listing that is nearly 50% above its averages, so if you trade it, keep the size small and wait for a pullback to the MA7 zone. Neither is a chase here. Call to action: Which one holds up better if the market cools, $BARDUSDT or $KORUSDT? Drop your pick 👇 and set alerts at BARD 0.1272 / 0.0990 and KOR 0.000629 / 0.000440, then tell me whether you're waiting for a pullback or a breakout. This is technical analysis for discussion, not financial advice. New listings and small-cap tokens are highly volatile and you can lose your whole stake, so use your own risk limits and always use a stop. Market-cap and unlock figures come from data sites that disagree with each other and are not always dated, so check them live before relying on them. Tell me in the comment, the data site you use for research. $BTCUSDT $KORUSDT

MARKET STRENGTH AND WEAKNESS
#ByXIMPACT #USInflationRunsHotAndRateHikeBetsRise #AnthropicIPOTestsTheAIBoom #WSOT2026 #BitcoinHitsTwoMonthLowAfterUSMidterms $BARD vs $KOR 🥊 Which setup is stronger after a huge day? Both tokens are up 45-49% on the 1-hour chart, but they are very different assets in very different places. BARD is a more established protocol that has started to give back its spike. KOR is a days-old listing that has just pushed to a new 24h high. ⚡ MARKET STRENGTH AND WEAKNESS $BARD (0.1241, +48.62%) ✅ Strength: price is above the MA14 (0.1087), MA28 (0.0961) and the Bollinger midline (0.1014), so the breakout from the range holds. MACD crossed up (DIF 0.0111 vs DEA 0.0080). ✅ Strength: it is far less extended, at about 14% above the MA14. Lombard is also a real Bitcoin-staking protocol backed by Polychain, Franklin Templeton and Binance Labs. ⚠️ Weakness: price has already dropped back below the MA7 (0.1272) after the 0.1428 high was rejected at the upper band (0.1418). Volume is fading fast (MA5 403.14K vs MA10 907.98K). ⚠️ Weakness: the supply picture is heavy. Only 22.5% of the supply circulated at launch, and one report said investor and team allocations, about 45% of supply, move to full linear unlock from September 2026. The token is also far below its March 2026 all-time high of about $1.70. $KOR (0.000593, +44.99%) ✅ Strength: it is the cleaner short-term structure, with a higher low, a higher high and a new 24h high at 0.000629. Price is above MA7 (0.000479), MA14 (0.000403) and MA28 (0.000396), and MACD crossed up (DIF 0.000016 vs DEA -0.000009). ✅ Strength: turnover is solid for its size (2.46M), and volume is steady (218.68M vs a MA5 of 246.32M). ⚠️ Weakness: it is hugely extended, about 47% above the MA14 and above the upper band (0.000546), with RSI6 at 75.45 and a rejection wick at the top. ⚠️ Weakness: it is a brand-new listing. KOR launched with a world-premiere listing on KuCoin on November 4, 2026, and one data site showed a launch-day high of about $0.032, so even after today's jump the price is around 98% below that high. Only about 23% of the 10 billion supply was reported as circulating. ⚠️ Weakness: on my arithmetic, 0.000593 on 2.28B circulating tokens is a market cap of only about $1.4M, with a fully diluted value near $5.9M. That is a very small base for $2.46M of daily turnover. $BARDUSDT $KORUSDT

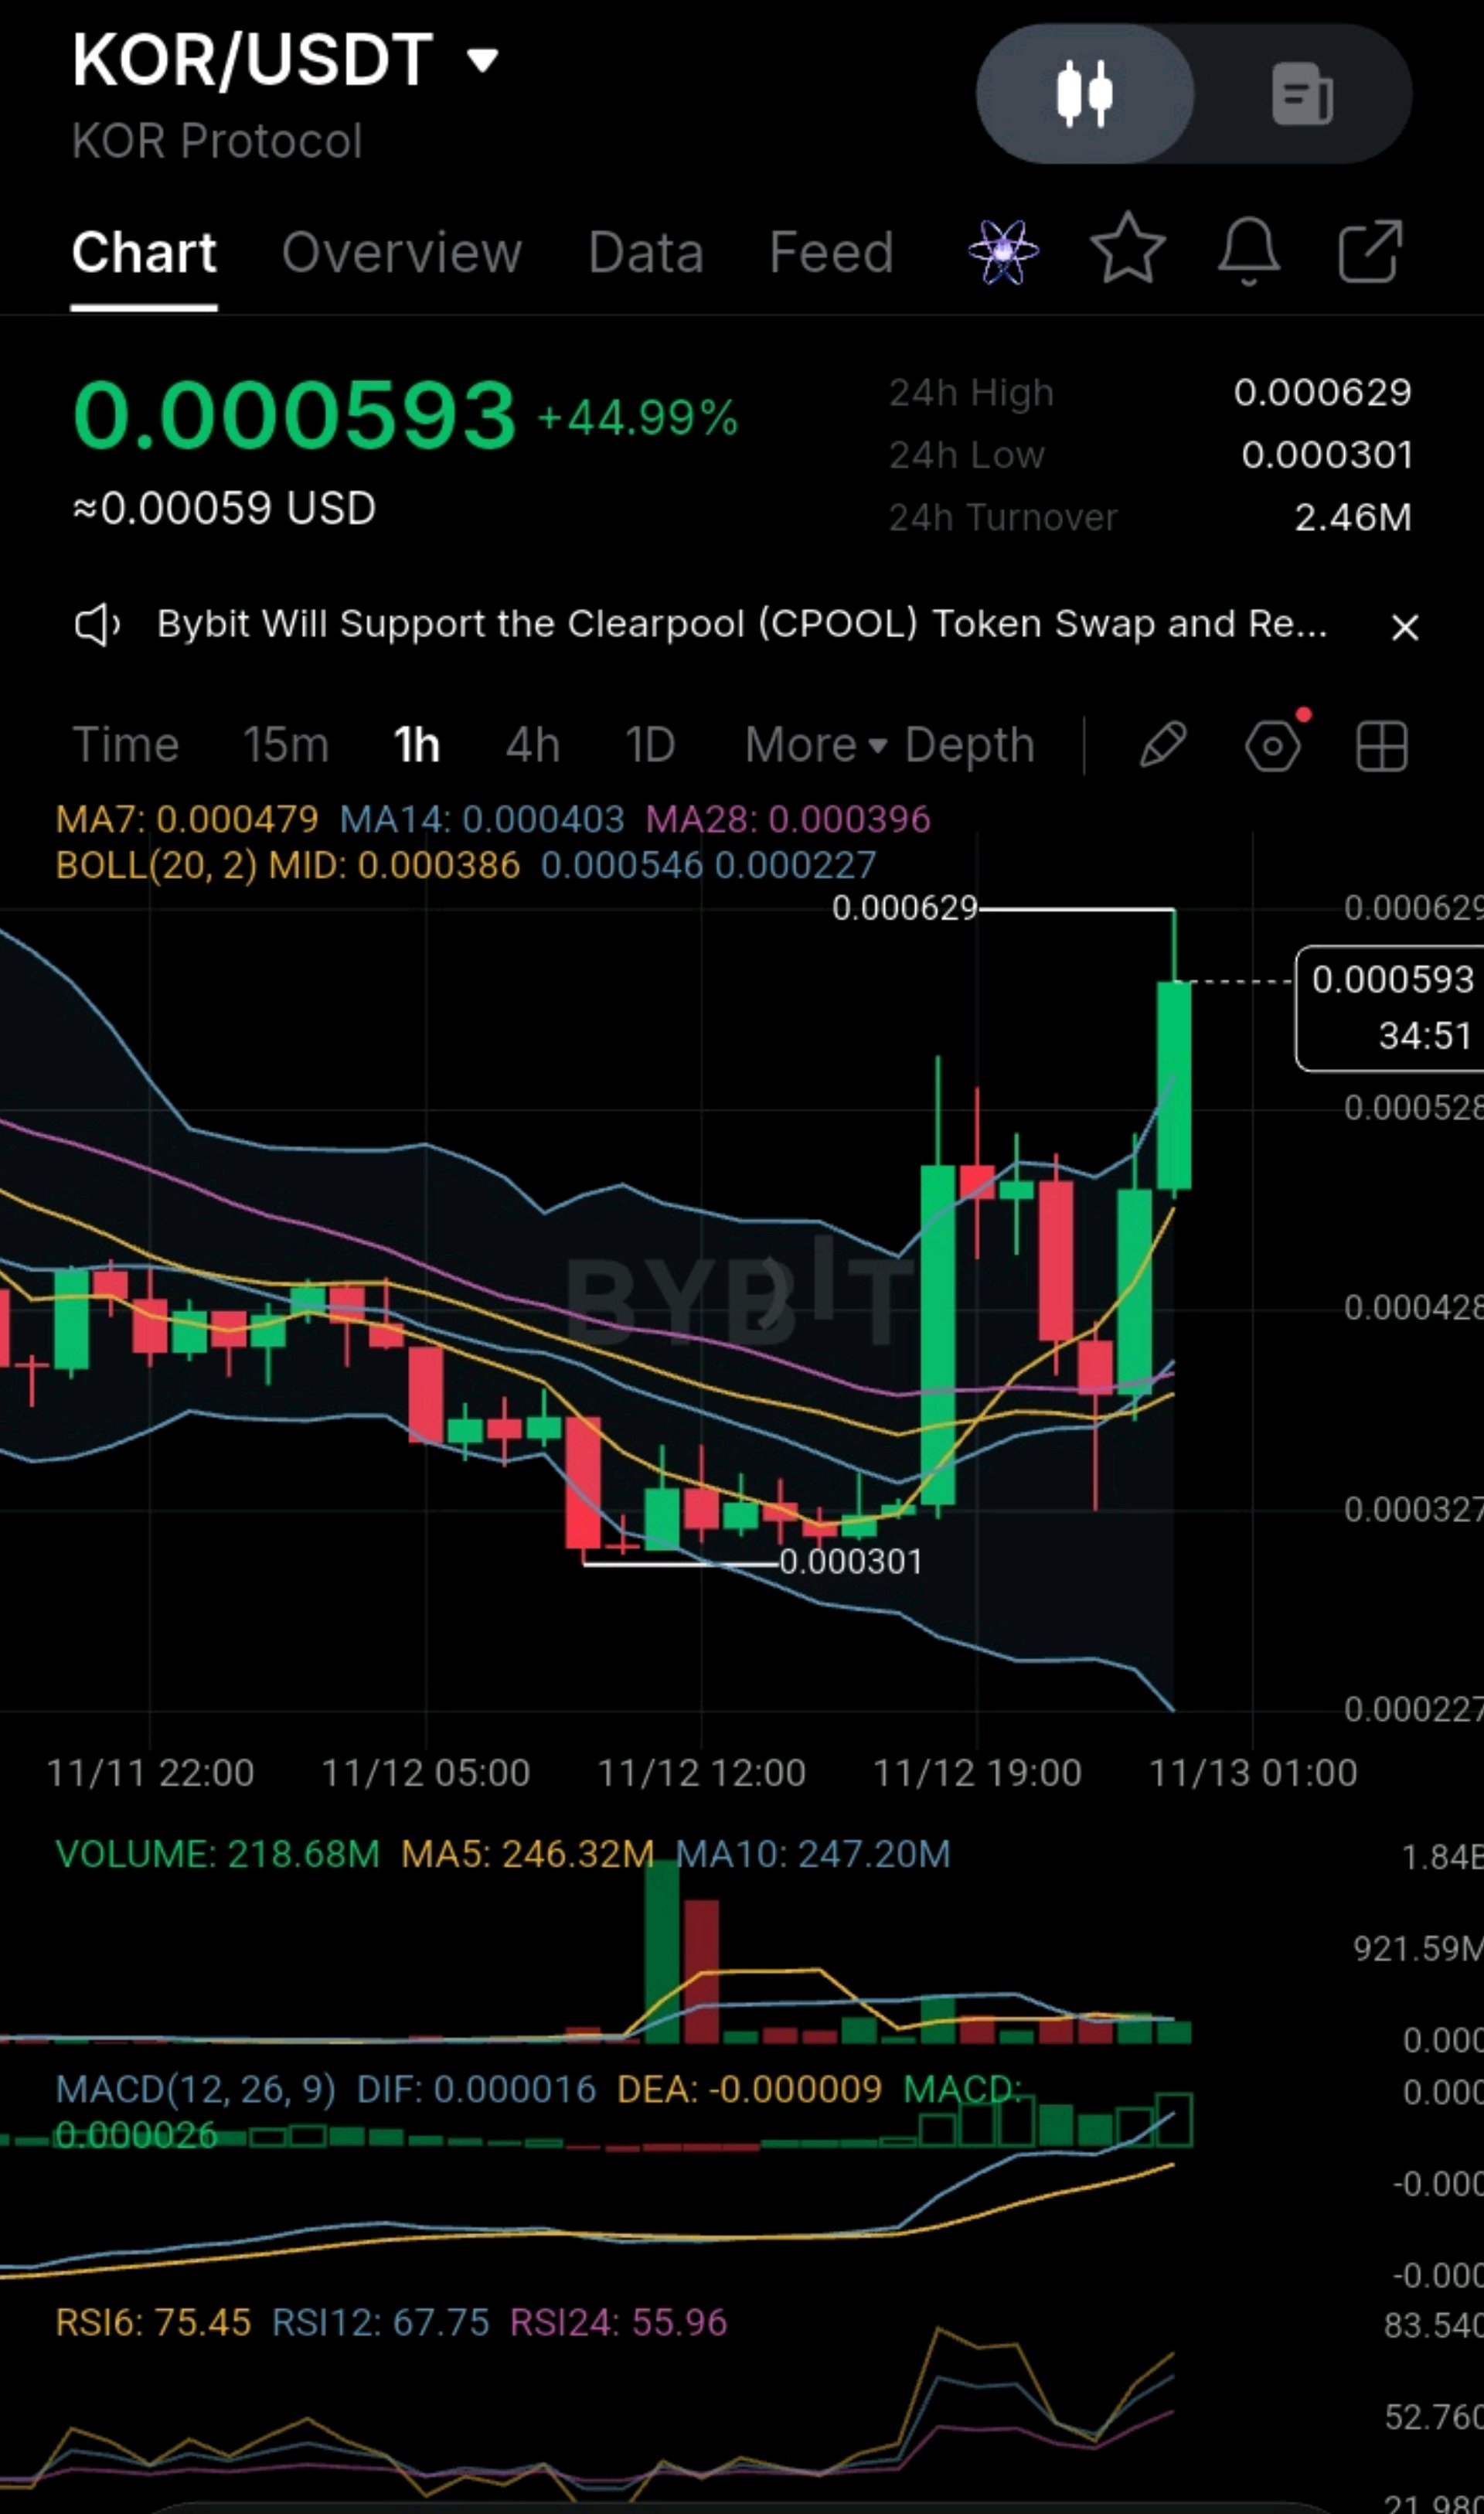
KOR drifted down
#IMPACTbyTrade #USInflationRunsHotAndRateHikeBetsRise #WSOT2026 #BitcoinHitsTwoMonthLowAfterUSMidterms #DeutscheBankLaunchesDigitalAssetCustody $KORUSDT: the biggest mistake in this setup would be treating a +45% vertical candle like confirmed support. Look at the 1H chart. KOR drifted down to a low of 0.000301, then launched on a huge volume candle and pulled back to about 0.00035. Buyers stepped in again and pushed price through the earlier high to a new 24h high of 0.000629. It is now trading at 0.000593, up 44.99% on the day. After a long decline, the market has found a floor, and that matters. The reaction from the 0.000301 low was strong. Buyers pushed KOR above the MA7 (0.000479), MA14 (0.000403) and MA28 (0.000396), showing that demand has not completely disappeared. But the latest push has already stalled near 0.000629 and is trading above the upper Bollinger Band (0.000546). That's an important detail. Buyers have shown strength on the way up, yet they haven't proven they can hold the highs. The 0.000629 peak was rejected with an upper wick, and current volume (218.68M) is below the MA5 (246.32M) and MA10 (247.20M), well under the first breakout bar. The candle is still open, so this can change. My Market Perspective The indicators add an interesting piece of evidence. MACD has crossed up (DIF 0.000016 above DEA -0.000009, histogram +0.000026), and the structure shows a higher low and a higher high. However, that movement happened in a very stretched market. RSI6 is 75.45 (RSI12 67.75, RSI24 55.96), and price is about 24% above the MA7 and nearly 50% above the MA14. For me, these are two separate developments: a real improvement in short-term structure, and a move that is too extended to chase. The path I've drawn isn't a straight upward projection. A pullback toward 0.000480-0.000528 (the MA7 and the earlier spike zone) could develop before another attempt at the highs. What would change the bigger picture is a convincing 1H close above 0.000629, followed by price holding that area on rising volume. If this happens, my upside objectives are: 0.000593 — Initial recovery objective 0.000629 — 24h high and key resistance 0.000680 — Extension estimate (not a hard level) These levels represent areas where I expect the market to face new decisions. R:R Management The pullback zone from the MA7 (0.000479) to the earlier spike area (about 0.000528) spans roughly 0.00005, about 10% of price. That is a relatively wide area, so entering anywhere inside it without a defined plan can create unnecessary exposure. My setup would be invalidated by a sustained 1H close below 0.000440. Below that, the 0.000403-0.000396 zone comes into play, and a break of that would put the 0.000301 low back in focus. For an actual trade, I want the entry and stop-loss to come from confirmed price structure. Position size and risk-to-reward must then be calculated using those values. As an example, from an entry near 0.000490 with a stop at 0.000440, the risk is about 10.2%. The first target at 0.000593 offers about 21.0% (2.1R), the 24h high at 0.000629 about 28.4% (2.8R), and 0.000680 about 38.8% (3.8R), all before costs. From the current price of 0.000593 with the same stop, the risk is about 25.8%, and the move to 0.000629 offers only about 6.1%, roughly 0.24R. Chasing turns an attractive setup into an unattractive one. A strong target cannot compensate for poorly controlled downside risk. I'm constructive on KOR's structure because of the higher low, the higher high and the fresh MACD cross. But the key issue now is whether the highs can be reclaimed on real volume, and whether the stretched price can cool off without losing the MA7. Would you wait for KOR to establish itself above 0.000629, or consider an opportunity if price pulls back into the 0.00048-0.00053 area? This is technical analysis for discussion, not financial advice. $KORUSDT
The important distinction
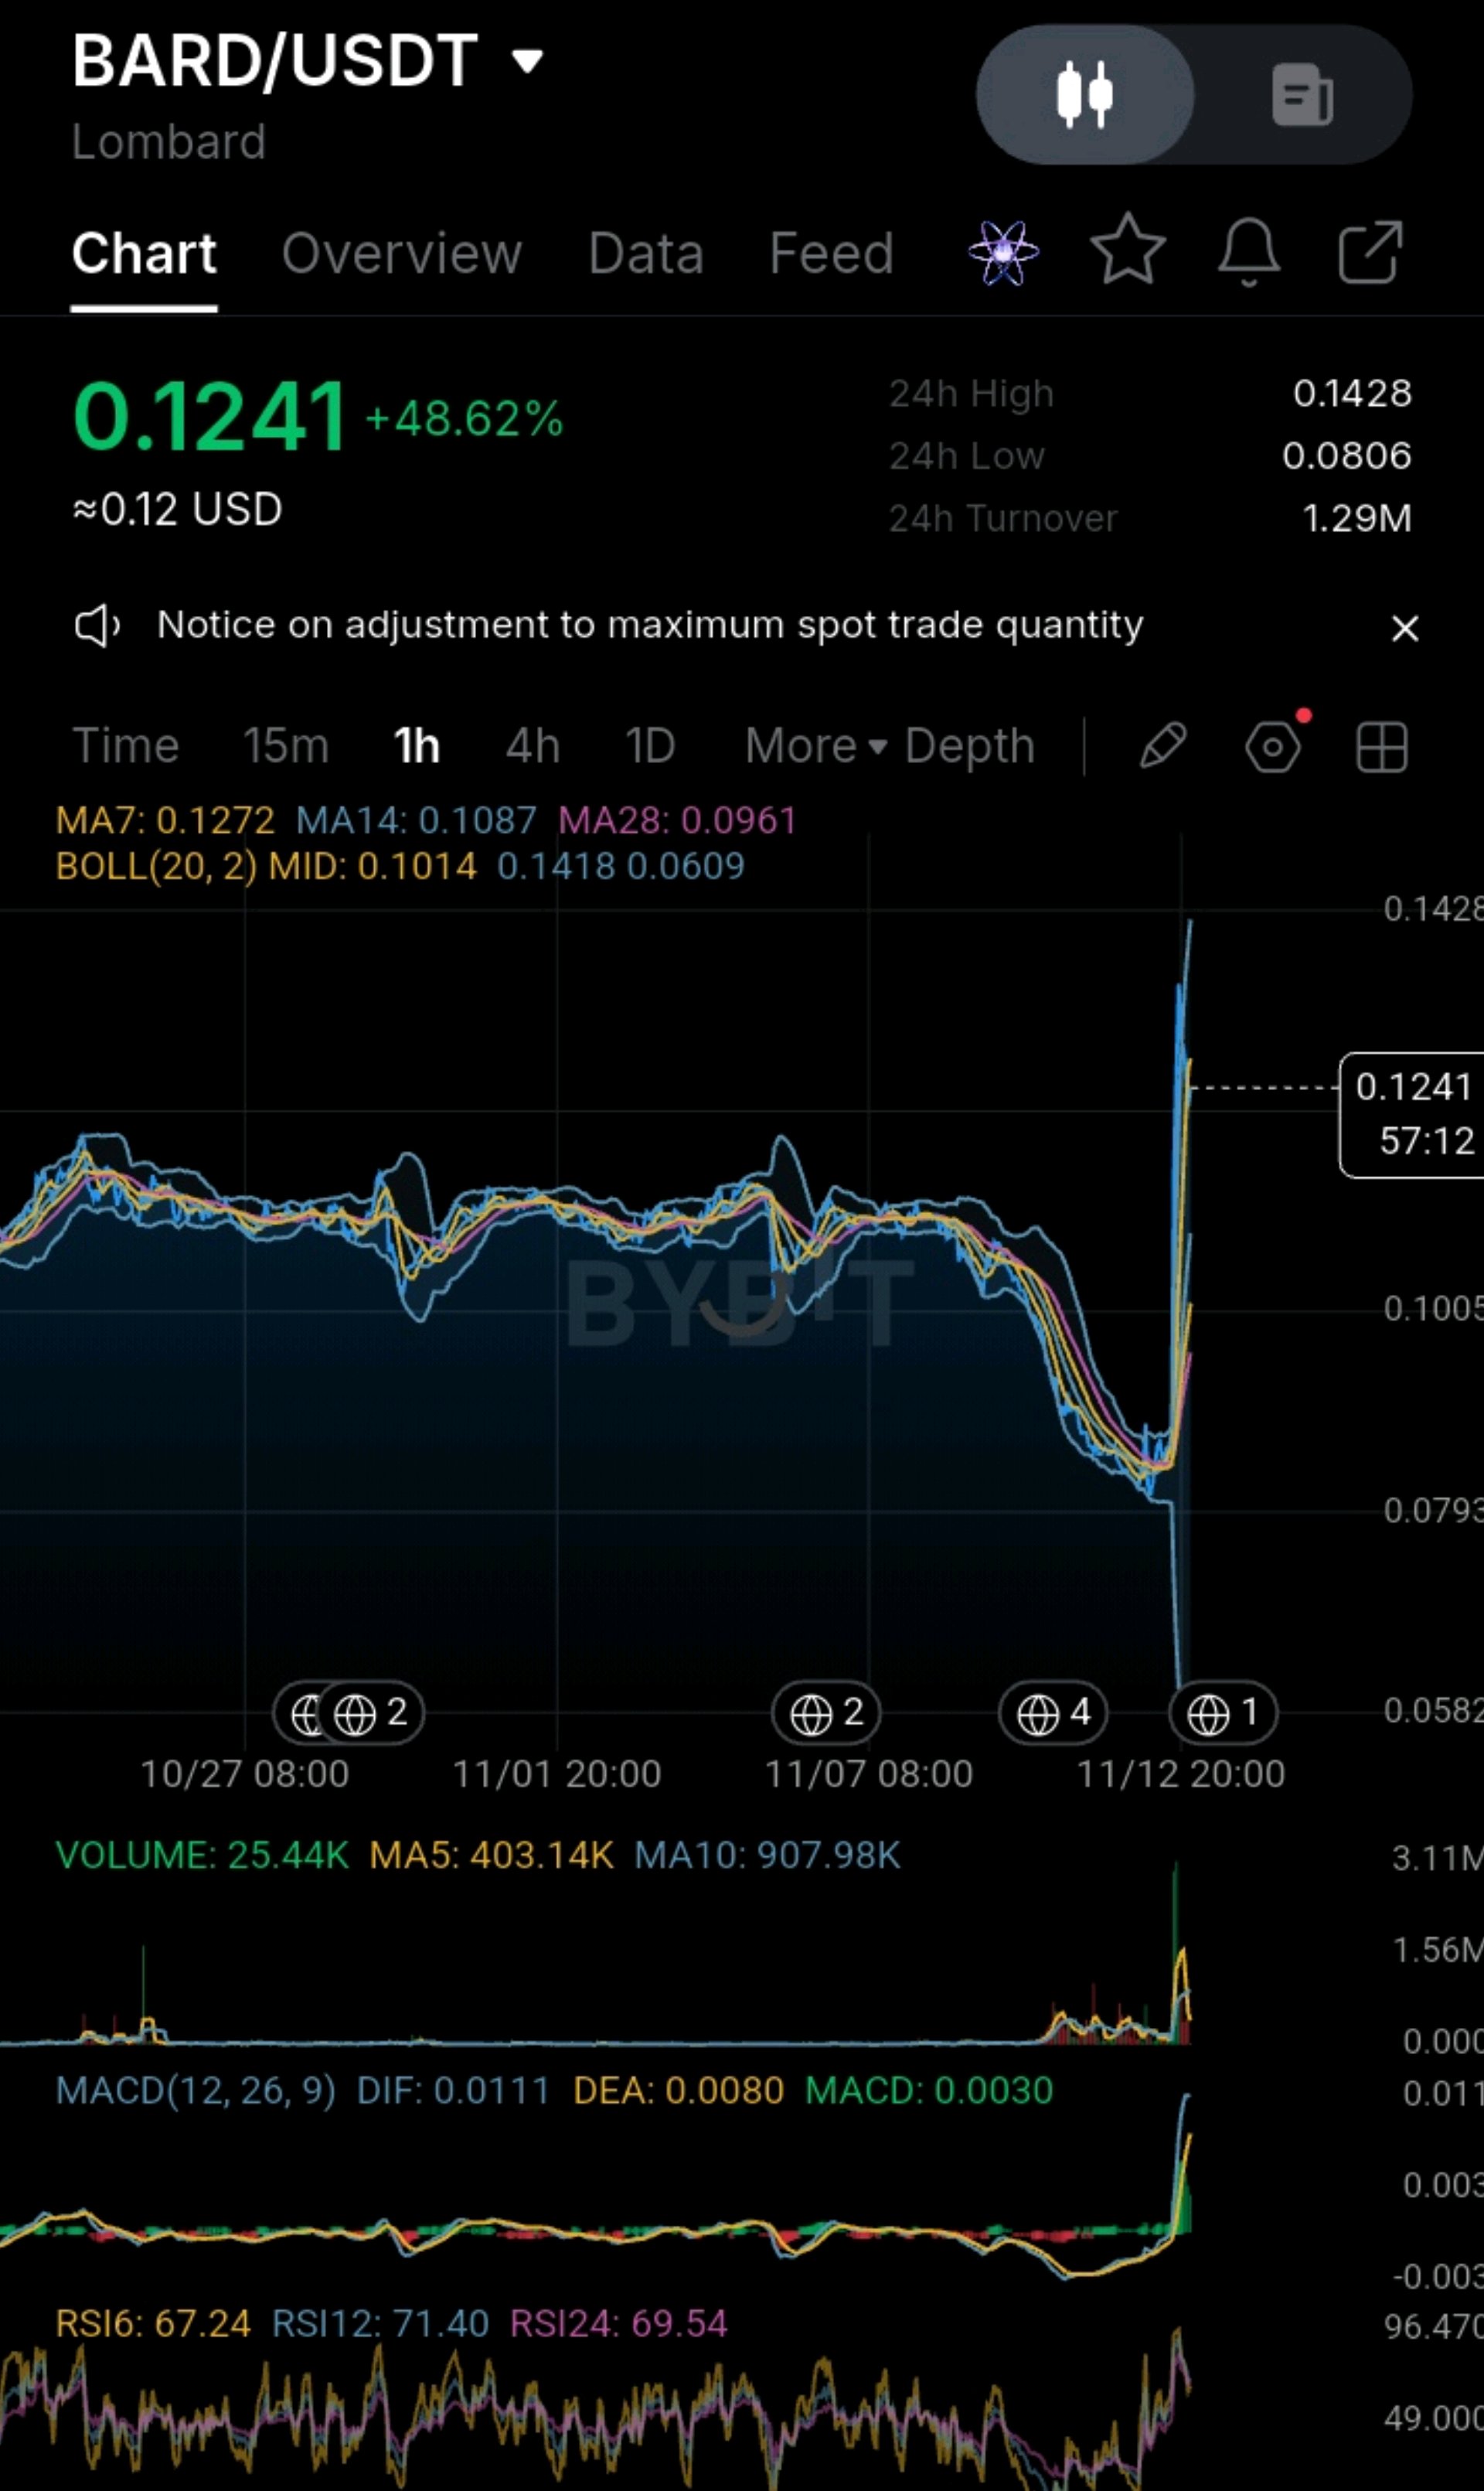
#ByXIMPACT #WSOT2026 #SanDiskAnnounces8For1StockSplit #BitcoinHitsTwoMonthLowAfterUSMidterms #AITechSelloffErases2Point5TrillionFromNasdaq100 $BARDUSDT has gone almost vertical, but the first pullback has already started. BARD is trading near 0.1241, up about 48.6% over 24 hours, after ranging for weeks and selling into a low near 0.0806. The 24h high is 0.1428, and turnover is about 1.29M. The move came out of a long, quiet range, and price has already slipped back below the MA7 (0.1272). The important distinction is between a breakout and a spike. The breakout is real in the sense that price is above the MA14 (0.1087), the MA28 (0.0961) and the Bollinger midline (0.1014), and MACD has crossed up (DIF 0.0111 vs DEA 0.0080). But a +48% move on thin turnover does not yet show that demand has been rebuilt, and it is a long way from the averages: about 14% above the MA14 and 22% above the midline. Momentum is elevated, not relaxed. RSI sits at 67 (RSI6), 71 (RSI12) and 69 (RSI24). The 0.1428 high came right at the upper band (0.1418) and was rejected, and volume has already cooled from the spike (MA5 403.14K vs MA10 907.98K). The current candle has just opened, so its volume reading means very little yet. Key levels Resistance: 0.1272 (MA7), then 0.1418 (upper band) and 0.1428 (24h high). Support: 0.1087 (MA14), 0.1014 (BB midline), 0.0961 (MA28), then the 0.0806 base. These are the areas where I expect the market to face new decisions. R:R Management The pullback zone around 0.1090-0.1130 is narrow, about 0.0040 in price, but the stop has to sit well below it. With an entry near 0.1100 and a stop at 0.0990, the risk is about 10%. That is a wide stop on a volatile token, so position size has to come down to keep the loss near 1-2% of the account. From those exact prices, the first target at 0.1272 offers roughly 1.6R, and the upper band at 0.1418 offers roughly 2.9R, before costs. Entering instead on a reclaim of 0.1272 with a stop under 0.1190 and a target of 0.1428 gives only about 1.5R, and that entry has less structural backing. For an actual trade, the entry and stop should come from confirmed structure, such as a bounce candle in the MA14 zone. Position size and risk-to-reward must then be calculated from those values. A strong target cannot compensate for poorly controlled downside risk. What would change the view A close below 0.0990 (under the midline) would weaken the setup. A move below the MA28 at 0.0961 would put the 0.0806 base back in play and could give back the whole move. A reclaim of 0.1272 on rising volume would strengthen the case. What this does not show The chart does not show a catalyst for the move, such as a listing or announcement, and it does not show who is trading it. Without wallet, derivatives or supply-release data, it would be a guess to say whether the volume was fresh demand or a handful of large accounts. Those should be checked before treating this as more than a technical move. I'm cautiously constructive on BARD's breakout, but only on a pullback with defined risk. The key issue now is whether buyers defend the MA14 zone or whether the move retraces toward the midline. Would you wait for BARD to reclaim 0.1272, or consider an opportunity if price returns to the 0.109-0.113 area? This is technical analysis for discussion, not financial advice. I wrote this as a market read, not a position update. Identify structure then you double down on it, that is the difference between the 1% from the 99%. $BARDUSDT

SUPRA vs NIGHT
#IMPACTbyTrade #WSOT2026 #AITechSelloffErases2Point5TrillionFromNasdaq100 #NovUSCPIWatch #USPayrollsAndRateDecisionsDriveMacroWeek SUPRA vs NIGHT — Comparative Market Analysis 1H Technical Outlook | 12 November 2026 Which coin has the stronger momentum? Which has better entry potential? Where might the whales be positioning? both coins are showing bullish structures, but they are at different stages of their market movements. SUPRA: Aggressive breakout, strong buying momentum, but significantly overbought. NIGHT: Strong upward movement followed by consolidation, with a healthier RSI but weakening momentum. My initial assessment: SUPRA has stronger immediate momentum, while NIGHT currently offers a more balanced technical setup. 1. Side-by-side comparison Chart time frame, 1H (1H) Price in screenshot, $0.0001450 ($0.04746) 24H change, +14.72%(+10.60%) RSI(6), 86.77 (59.90) RSI(12)82.59 (65.48) RSI(24), 75.40 (65.61) MACD, Bullish (Slightly bearish) Volume trend, Increasing (Declining) Price structure, Breakout (Consolidation) Immediate condition, Overextended (Cooling off) What this comparison tells us SUPRA is winning the momentum battle. Its breakout has stronger volume confirmation, and its MACD remains bullish. However, the extreme RSI readings make chasing the price dangerous. NIGHT is winning the short-term risk/reward setup. Its RSI is healthier, and it is consolidating above important moving averages. However, declining volume and a bearish MACD crossover mean another upward move is not yet confirmed. 2. Whale positioning — Where is the big money? This requires separating actual on-chain evidence from what a candlestick chart suggests. SUPRA: Whale assessment There are three important observations: SUPRA has recorded a sharp price increase accompanied by rising trading volume. CoinGlass reported positive spot net inflows in its November 11 snapshot, although the reported inflow was relatively small. SupraTools provides tracking for large wallet movements, staking, unlocks and exchange transfers. However, I cannot establish from the available evidence that large investors are accumulating SUPRA right now. Positive spot inflows alone do not prove whale buying. Whale interpretation: Possible accumulation, but confirmation is missing. NIGHT: Whale assessment NIGHT presents a more interesting ownership picture. Cardanoscan currently reports: Approximately 127,435 holders. Top 100 holders control approximately 81% of supply. Top 10 holders control approximately 59.2%. 16 wallets are classified as whales, holding approximately 66% of supply. Cardanoscan There is also evidence of significant large-wallet trading. Recent reported transactions include: A purchase of approximately 891,584 NIGHT. A sale of 500,000 NIGHT. Another purchase of approximately 476,202 NIGHT. A sale of approximately 488,139 NIGHT. Super Cardano Whale interpretation: Large holders are active, but their positioning is mixed. The concentration of NIGHT ownership is an important risk. Large holders can influence liquidity and price movements. Important distinction: A large wallet is not automatically a whale accumulating. Some large wallets belong to exchanges, treasury operations, foundations or custodians. My assessment: SUPRA: Momentum-led buying, with whale confirmation still needed. NIGHT: Concentrated ownership, with evidence of substantial buying and selling. Neither chart proves that whales are preparing for another pump. 3. Strengths and weaknesses SUPRA — Supra Strengths Strong bullish breakout. Increasing trading volume. Positive MACD momentum. Strong short-term buying interest. Potential for continuation if resistance breaks. Weaknesses RSI readings are dangerously elevated. Vulnerable to sudden profit-taking. A breakout failure could trigger a sharp retracement. Whale accumulation is not yet independently confirmed. Relatively small market depth can increase volatility. $SUPRAUSDT $NIGHTUSDT


Moving Averages
#ByXIMPACT #USInflationRunsHotAndRateHikeBetsRise #AITechSelloffErases2Point5TrillionFromNasdaq100 #NovUSCPIWatch #BybitAIEvolving 1. Market Structure: BULLISH 🟢 NIGHT has experienced a strong upward movement, climbing from approximately $0.04128 to $0.04885. However, the latest candles indicate that the rally is entering a consolidation phase. Key observations: Strong bullish breakout from the previous trading range. Price remains above the major moving averages. Buyers are defending the $0.0470–$0.0473 region. Recent candles suggest profit-taking after the initial rally. Interpretation: The overall 1H structure remains bullish, but upward momentum is cooling. 2. Moving Averages MA7 $0.04747 MA14 $0.04728 MA28 $0.04535 The moving averages remain bullishly aligned. MA7 is above MA14. MA14 is above MA28. Price remains above MA28. This supports the broader bullish structure. 3. Bollinger Bands Upper band $0.04946 Middle band $0.04635 Lower band $0.04324 Price is trading above the middle band and below the upper band. Unlike an extremely extended breakout, NIGHT is currently consolidating within the upper half of its Bollinger range. Interpretation: The bullish structure remains intact, although a further expansion towards the upper band requires renewed buying pressure. 4. Volume Analysis Current volume: 608.74K MA5: 1.55M MA10: 2.36M This is an important warning. Volume has declined considerably following the initial breakout. It suggests that buyers are becoming less aggressive at current levels. For another significant upward movement, NIGHT needs fresh buying volume. 5. MACD Analysis DIF: 0.00118 DEA: 0.00125 MACD: -0.00007 The MACD has turned slightly bearish. DIF is now below DEA, indicating a potential short-term bearish crossover. However, the negative histogram remains relatively small. Interpretation: Bullish momentum is weakening, but this alone does not confirm a complete trend reversal. 6. RSI Analysis RSI6: 59.90 RSI12: 65.48 RSI24: 65.61 Unlike an extremely overbought market, NIGHT's RSI readings remain relatively healthy. This leaves room for another upward movement if buyers return. However, declining RSI momentum should be monitored. 7. Important Price Levels Major resistance $0.04885 Next resistance $0.04946 Psychological resistance $0.05000 Immediate support $0.04700 Secondary support $0.04635 Stronger support $0.04535 Major support $0.04324 8. Trading Scenarios 🟢 Bullish Scenario If NIGHT maintains support around $0.0470–$0.0473: Buyers could attempt another test of $0.04885. A breakout above $0.04885 could expose $0.04946. A sustained breakout could open the psychological $0.05000 level. Confirmation requires increasing volume and a strengthening MACD. 🔴 Bearish Scenario If NIGHT loses $0.0470: Price could revisit $0.04635. Further weakness could expose $0.04535. A break below $0.04535 would weaken the current bullish structure considerably. 9. Final Verdict Market structure🟢 Bullish Moving averages🟢 Bullish Bollinger Bands🟢 Positive Volume🔴 Declining MACD🟡 Weakening RSI🟢 Healthy Overall Assessment: BULLISH, BUT CONSOLIDATING NIGHT has a stronger technical structure than a coin experiencing an exhausted, extremely overbought rally. However, three things deserve attention: Buying volume is declining. MACD has developed a bearish crossover. Price is struggling to move decisively above $0.04885. My trading position: I would avoid chasing NIGHT at $0.04746. I would watch for either a confirmed breakout above $0.04885 with volume or a healthy pullback towards $0.04635 followed by renewed buying pressure. The key level to watch is $0.04635. Holding this level would help preserve the current bullish structure.$NIGHTUSDT


SUPRA/USDT — 1H Technical Analysis
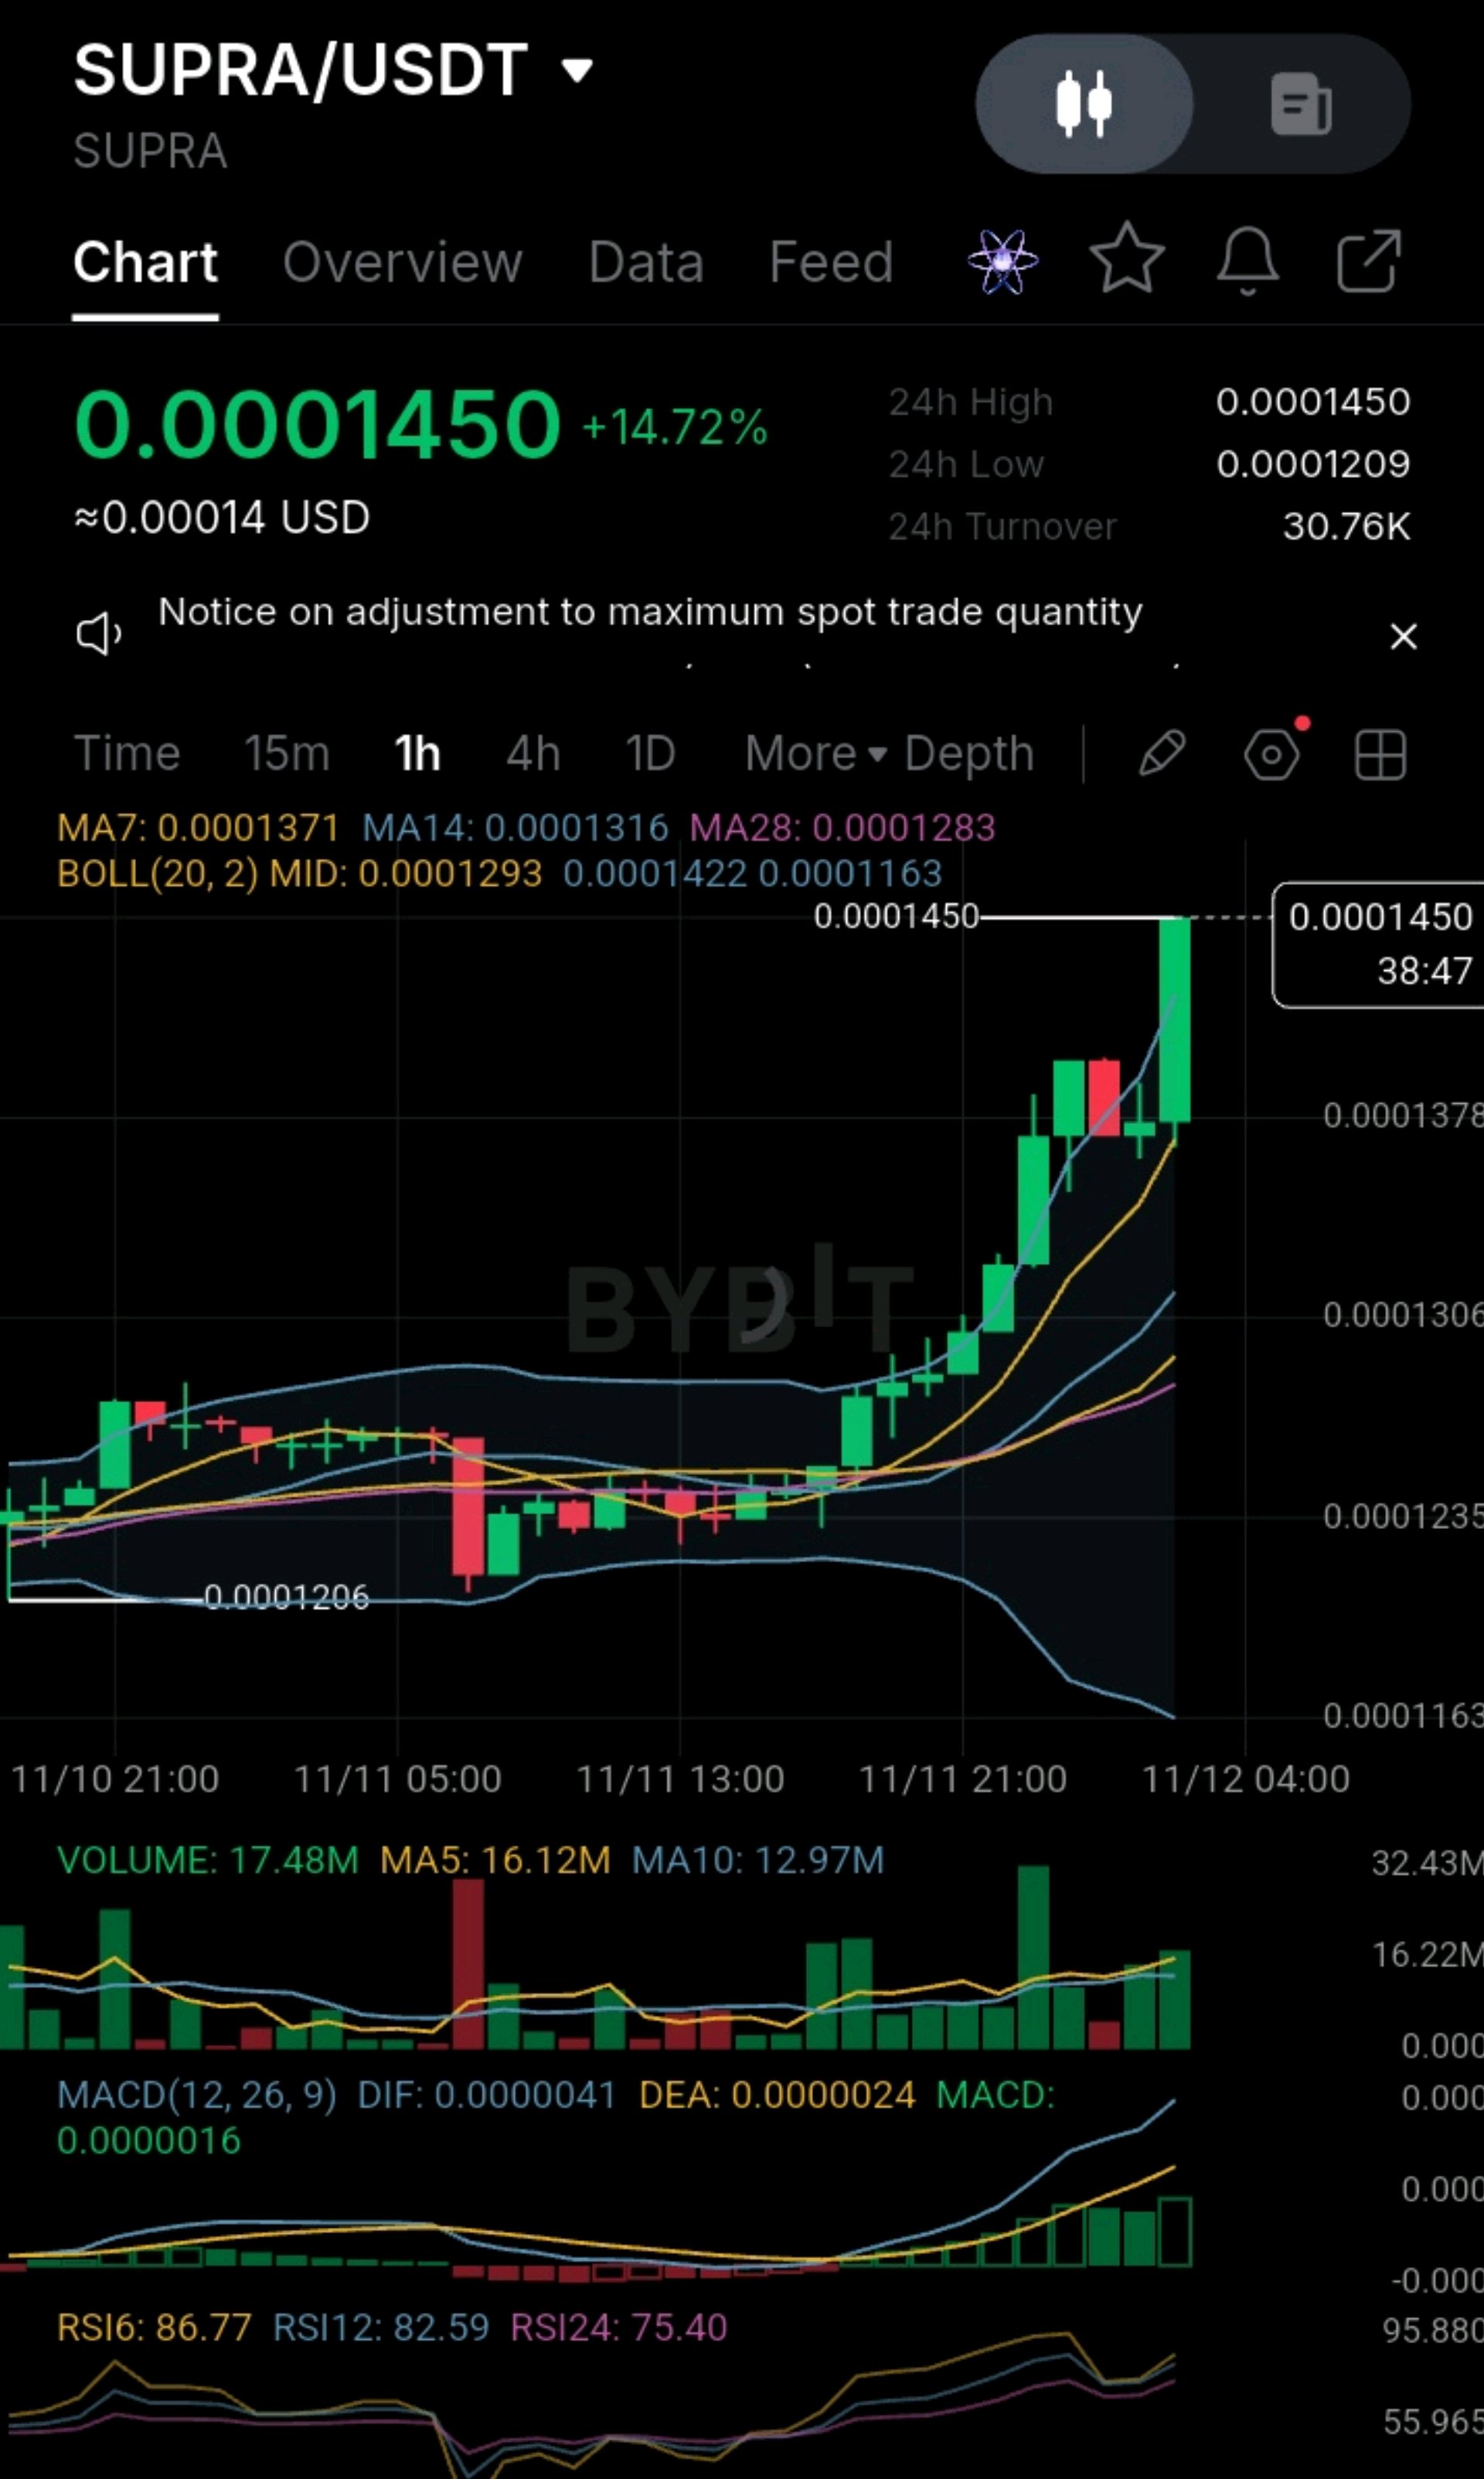
#IMPACTbyTrade #USInflationRunsHotAndRateHikeBetsRise #DeutscheBankLaunchesDigitalAssetCustody #AnthropicIPOTestsTheAIBoom #NovUSCPIWatch SUPRA/USDT — 1H Technical Analysis Current price: 0.0001450 24H change: +14.72% 24H high: 0.0001450 24H low: 0.0001209 1. Market Structure: BULLISH 🚀 SUPRA has broken out of its previous consolidation zone around 0.0001230–0.0001300. Strong consecutive bullish candles. Price has broken above the short-term moving averages. Buyers are showing increased momentum. The latest candle has reached a new 24-hour high. 2. Moving Averages MA7: 0.0001371 MA14: 0.0001316 MA28: 0.0001283 Interpretation: Bullish alignment. The shorter moving averages are above the longer ones, supporting the current upward trend. 3. Bollinger Bands Upper band: 0.0001422 Middle band: 0.0001293 Lower band: 0.0001163 Price is trading above the upper Bollinger Band. This indicates strong buying pressure but also suggests that the market may be overheating. 4. Volume Analysis Current volume: 17.48M MA5: 16.12M MA10: 12.97M Volume is increasing alongside the price breakout. This is encouraging because the upward movement has participation from buyers. 5. MACD DIF: 0.0000041 DEA: 0.0000024 MACD: 0.0000016 The MACD is bullish, with the DIF above the DEA. Positive momentum is still developing. 6. RSI — Important Warning ⚠️ • RSI6: 86.77 • RSI12: 82.59 • RSI24: 75.40 All three RSI readings are above 70. Interpretation: SUPRA is significantly overbought on the 1-hour timeframe. A short-term correction or profit-taking is possible. 7. Important Price levels Immediate resistance 0.0001450 Next resistance 0.0001500 Extended target 0.0001600 First support 0.0001378 Second support 0.0001306 Major support 0.0001235 8. Trading Outlook Bullish scenario: SUPRA breaks and sustains above 0.0001450. Volume continues increasing. A successful retest could open the way towards 0.0001500 and 0.0001600. Bearish scenario: Price fails to break 0.0001450. Buying volume declines. Price retreats towards 0.0001378 or 0.0001306.g Final Verdict 🟢 Trend: Bullish 🟢 MACD: Bullish 🟢 Volume: Increasing 🔴 RSI: Extremely overbought 🟡 Entry: Risky at current price; chasing the breakout is not advisable. My assessment: SUPRA has demonstrated a convincing bullish breakout, but the RSI readings suggest that entering immediately could expose traders to a sharp pullback. I would prefer a healthy retracement followed by renewed buying pressure before considering an entry. $SUPRAUSDT

Key levels
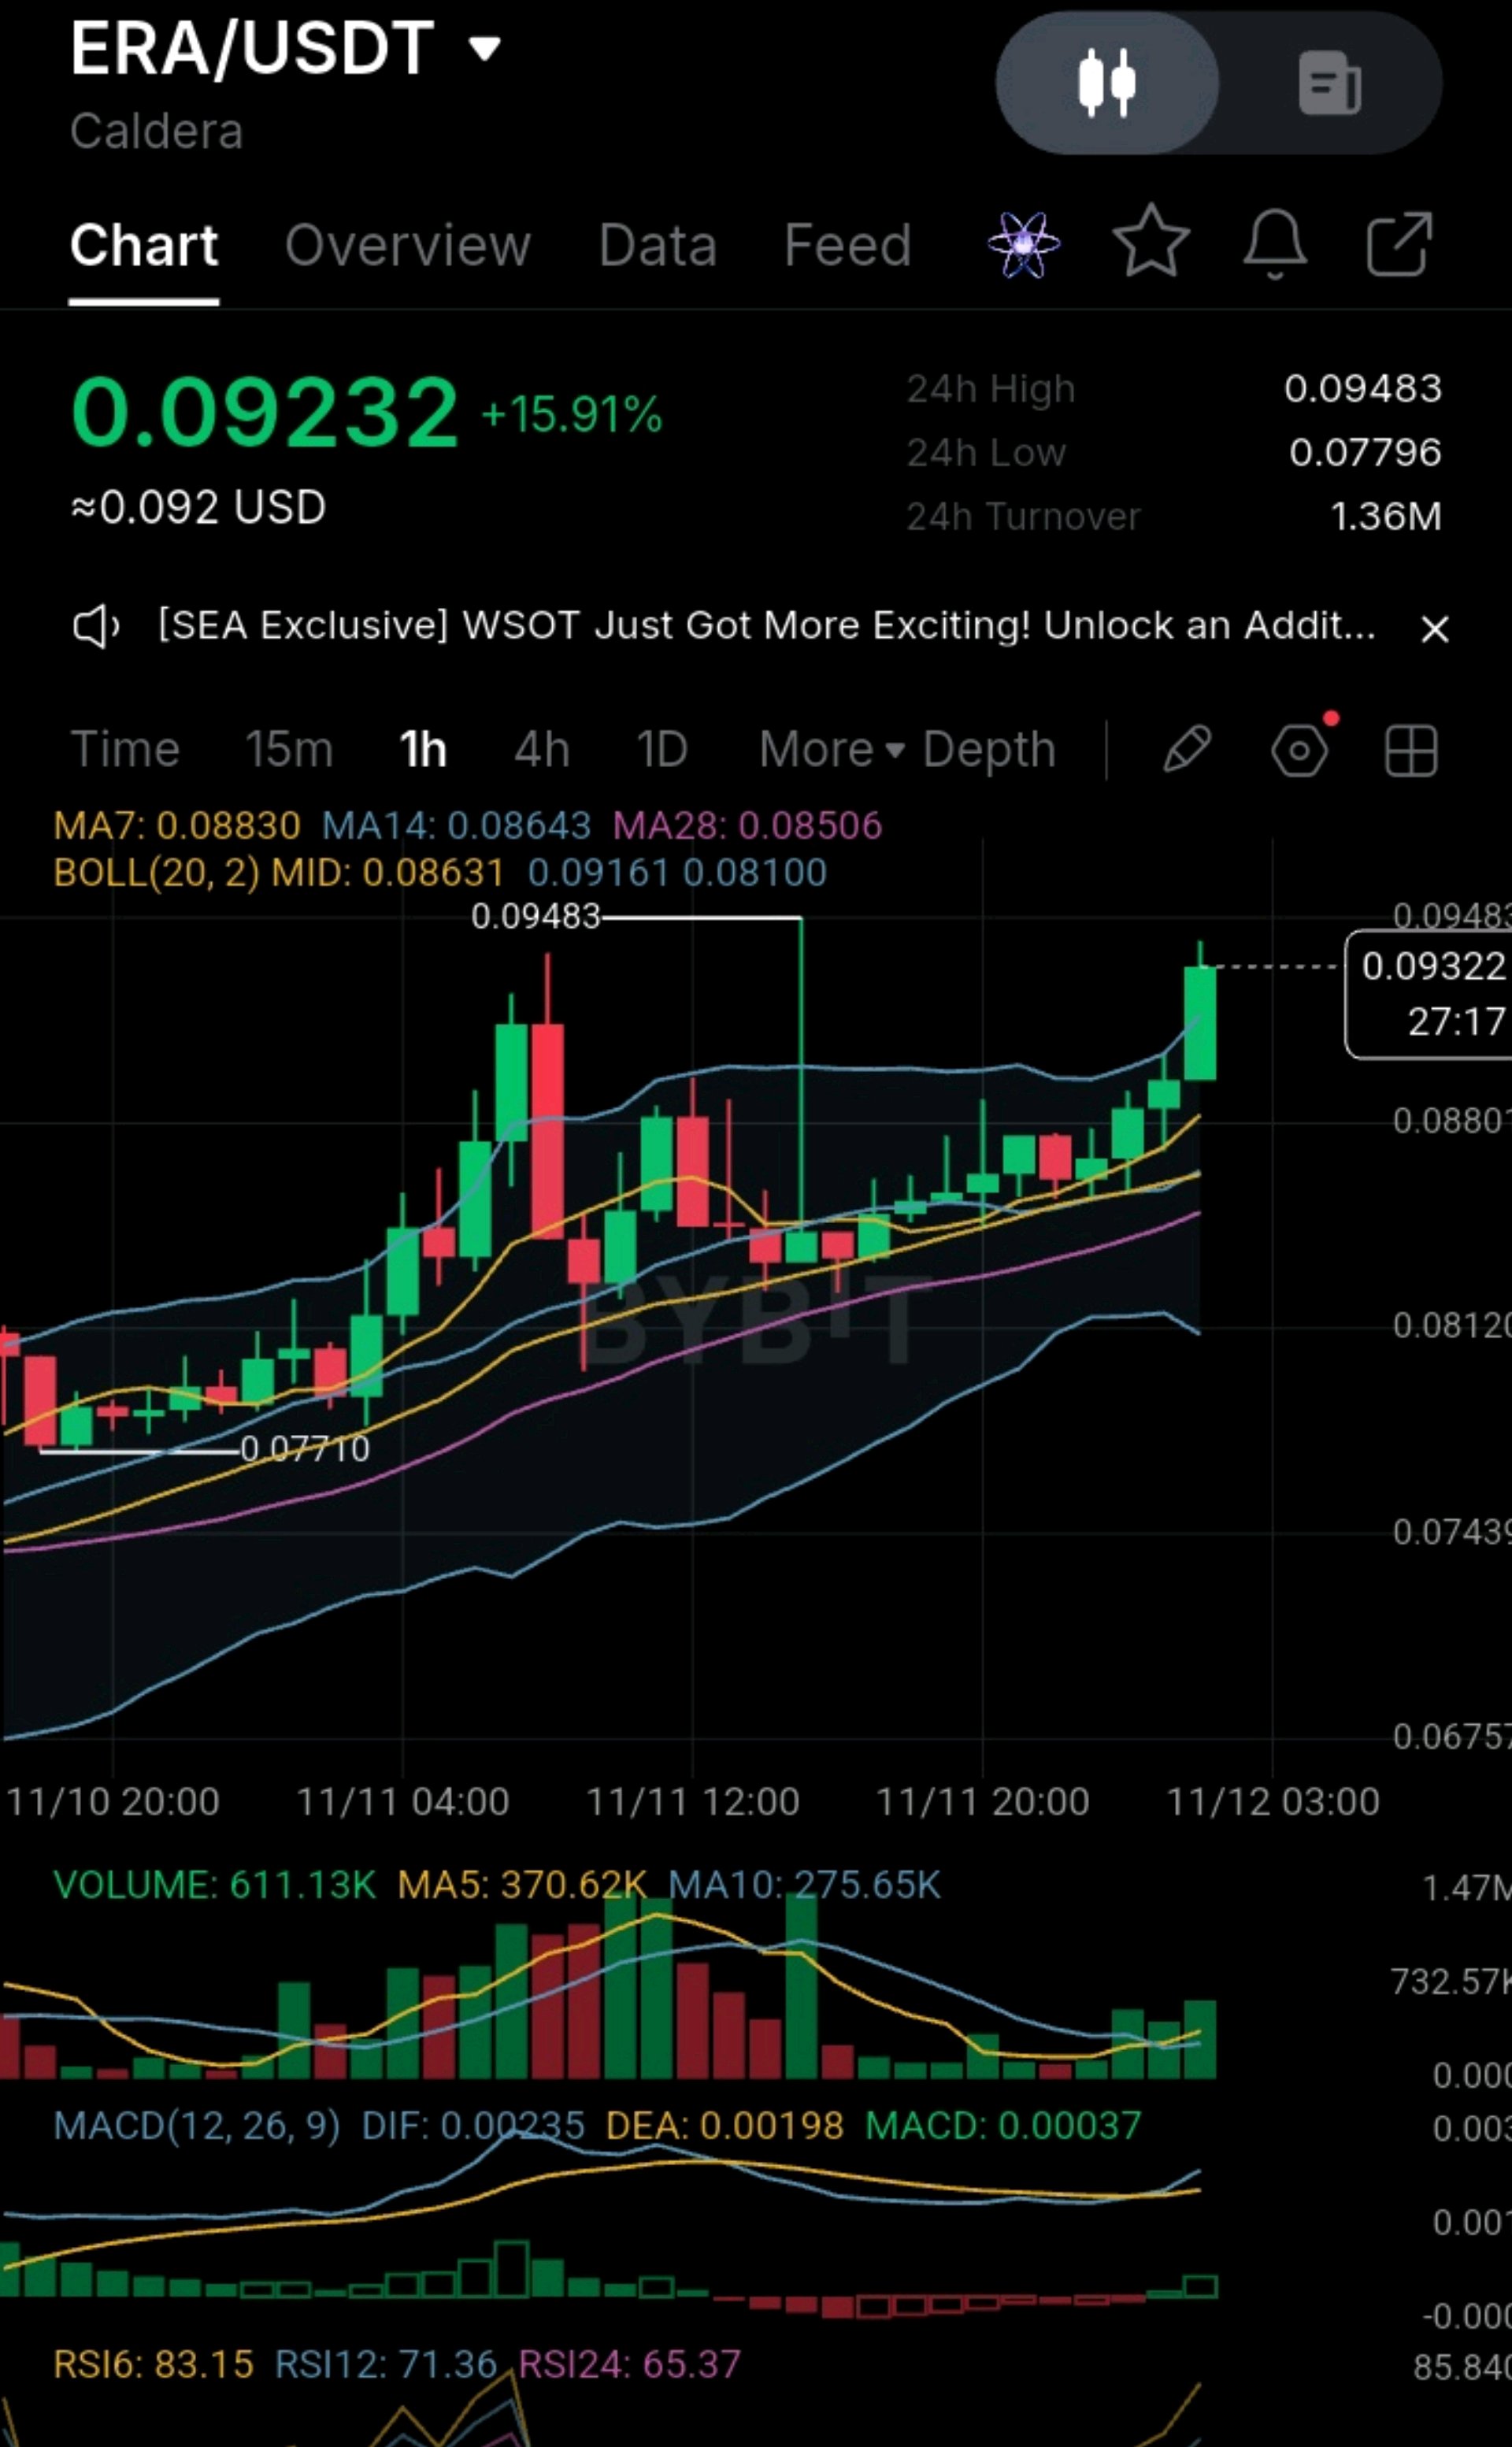
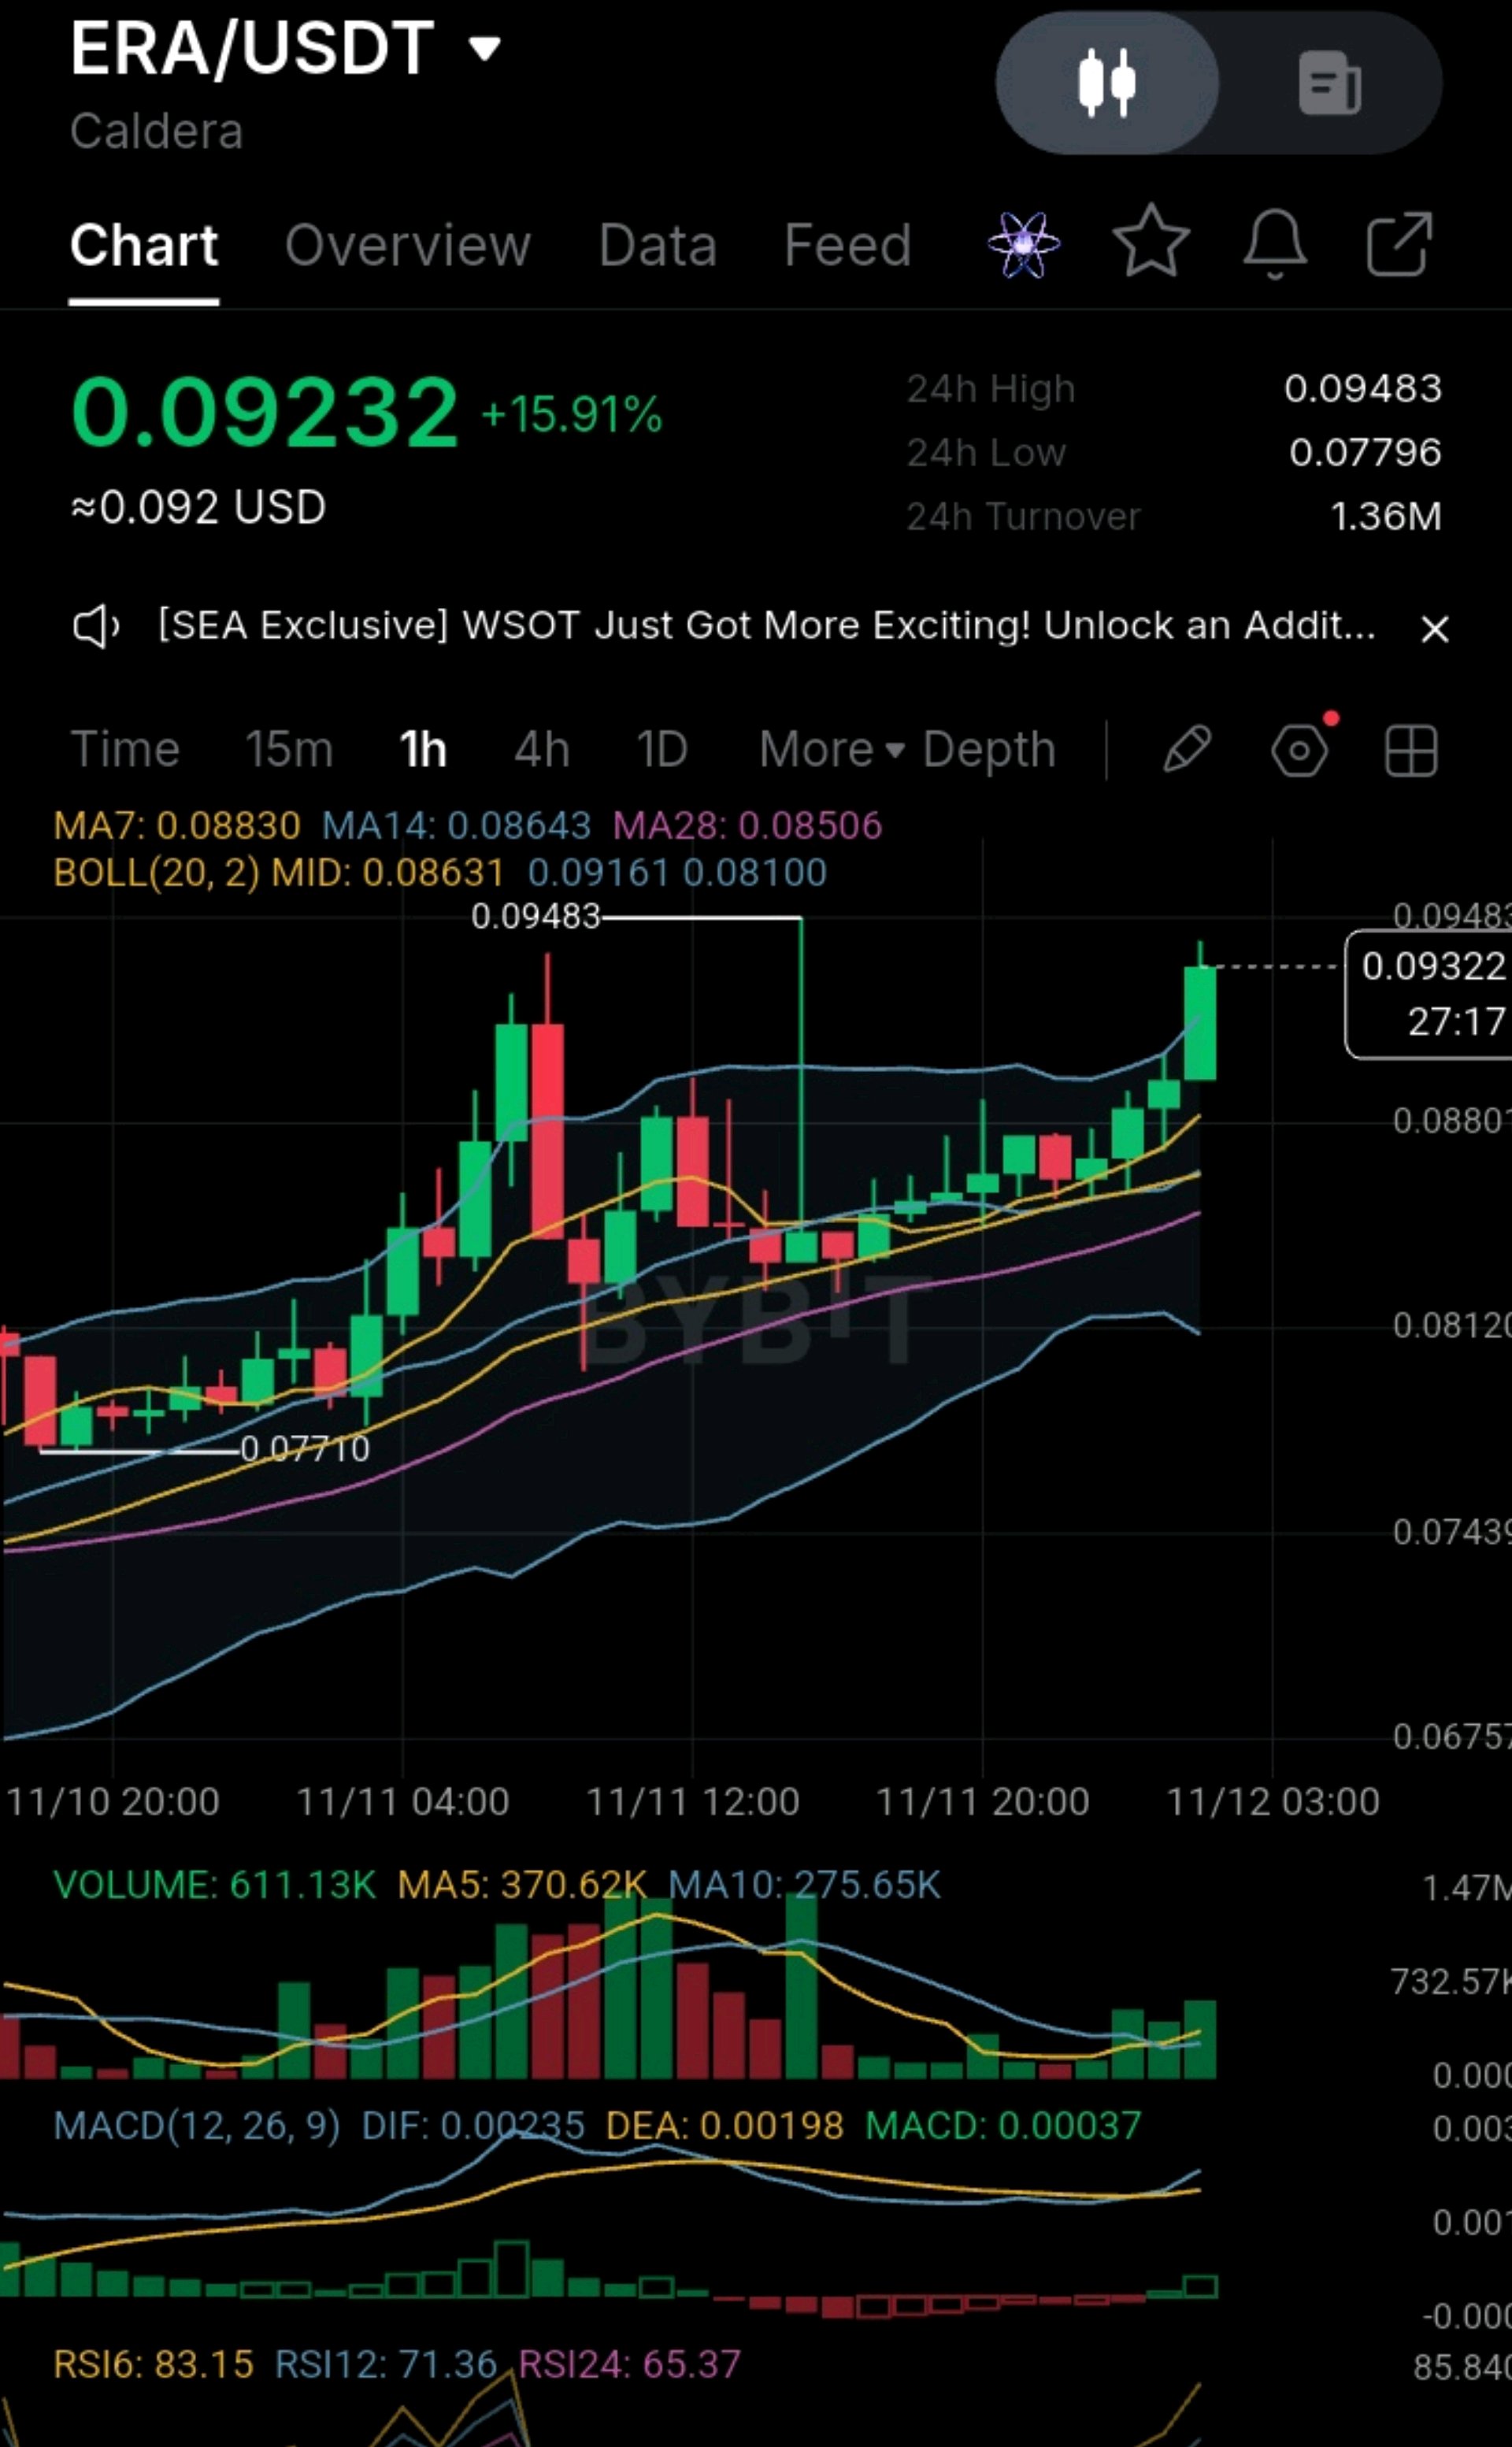
#ByXIMPACT #USInflationRunsHotAndRateHikeBetsRise #AITechSelloffErases2Point5TrillionFromNasdaq100 #BitcoinHitsTwoMonthLowAfterUSMidterms #USPayrollsAndRateDecisionsDriveMacroWeek ERA is pressing back into its 24h high after a clean staircase of higher lows. The next hourly closes decide whether it breaks out or fails at 0.0948 for the second time. Look at this 1-hour chart. ERA climbed from the 0.0771 low, spiked to 0.09483, pulled back and held above the moving averages, then rallied again. The latest green candle is pushing through the upper Bollinger Band and testing the prior high. Price is about 0.0923 to 0.0932, up 15.91% on the day, and the candle is still open with about 27 minutes left, so judge it at the close. The Power: Price is above MA7 (0.08830), MA14 (0.08643) and MA28 (0.08506), and the MAs are stacked in bullish order and rising. MACD has just crossed up (DIF 0.00235 vs DEA 0.00198, histogram +0.00037). Volume is confirming: the current bar (611.13K) is well above the MA5 (370.62K) and MA10 (275.65K). That is unusual after a pullback and favors the breakout attempt. The Exhaustion Risk: RSI6 is 83.15 (RSI12 71.36, RSI24 65.37), so the short term is overbought. Price is above the upper Bollinger Band (0.09161) and about 5% above the MA7, so the move is extended. 0.09483 is a prior rejection zone, and ERA is testing it for the second time. Double tests often fail without strong volume. Turnover is modest (1.36M), so reversals can be sharp. Key levels: Resistance: 0.09483 (24h high), then roughly 0.0990-0.1000 (an estimate near the round number, not a hard level) Support: 0.09161 (upper band), 0.08830 (MA7), 0.08643 (MA14), 0.08631 (BB mid), 0.08506 (MA28), then 0.0810 and the 0.0771 low Trade Plan (illustrative): Preferred entry: a pullback into 0.0885-0.0905, near the MA7 and the top of the recent consolidation, ideally with a bounce candle. Stop loss: 0.0860, just under the MA14 and the BB midline. A closing break below invalidates the setup. Target 1: 0.09483, about 1.5R from a 0.0895 entry. Target 2: 0.0990, about 2.7R. Breakout alternative: an hourly close above 0.09483 on rising volume, with a stop under 0.0910 and smaller size, since the stop sits far from a breakout entry. Position size: risk only 1-2% of your account on the stop distance. Take partial profit at Target 1 and move the stop to breakeven. If it goes wrong: below 0.0860, expect a slide to the MA28 (0.08506), then 0.0810 (the lower band), and a break of that would put the 0.0771 low in play. Verdict: this is one of the healthier setups because volume and MACD agree with the trend. But with RSI6 above 83 and a retest of a prior high, I'd rather wait for a pullback to the MA7 zone, or for a confirmed volume break above 0.09483, than buy at the highs. Call to action: Are you buying the dip to 0.0890, waiting for a confirmed break of 0.0948, or staying out until RSI cools? Set alerts at 0.09483 and 0.0860 so you don't miss either move. This is technical analysis for discussion, not financial advice. $ERAUSDT
My Upside Objective
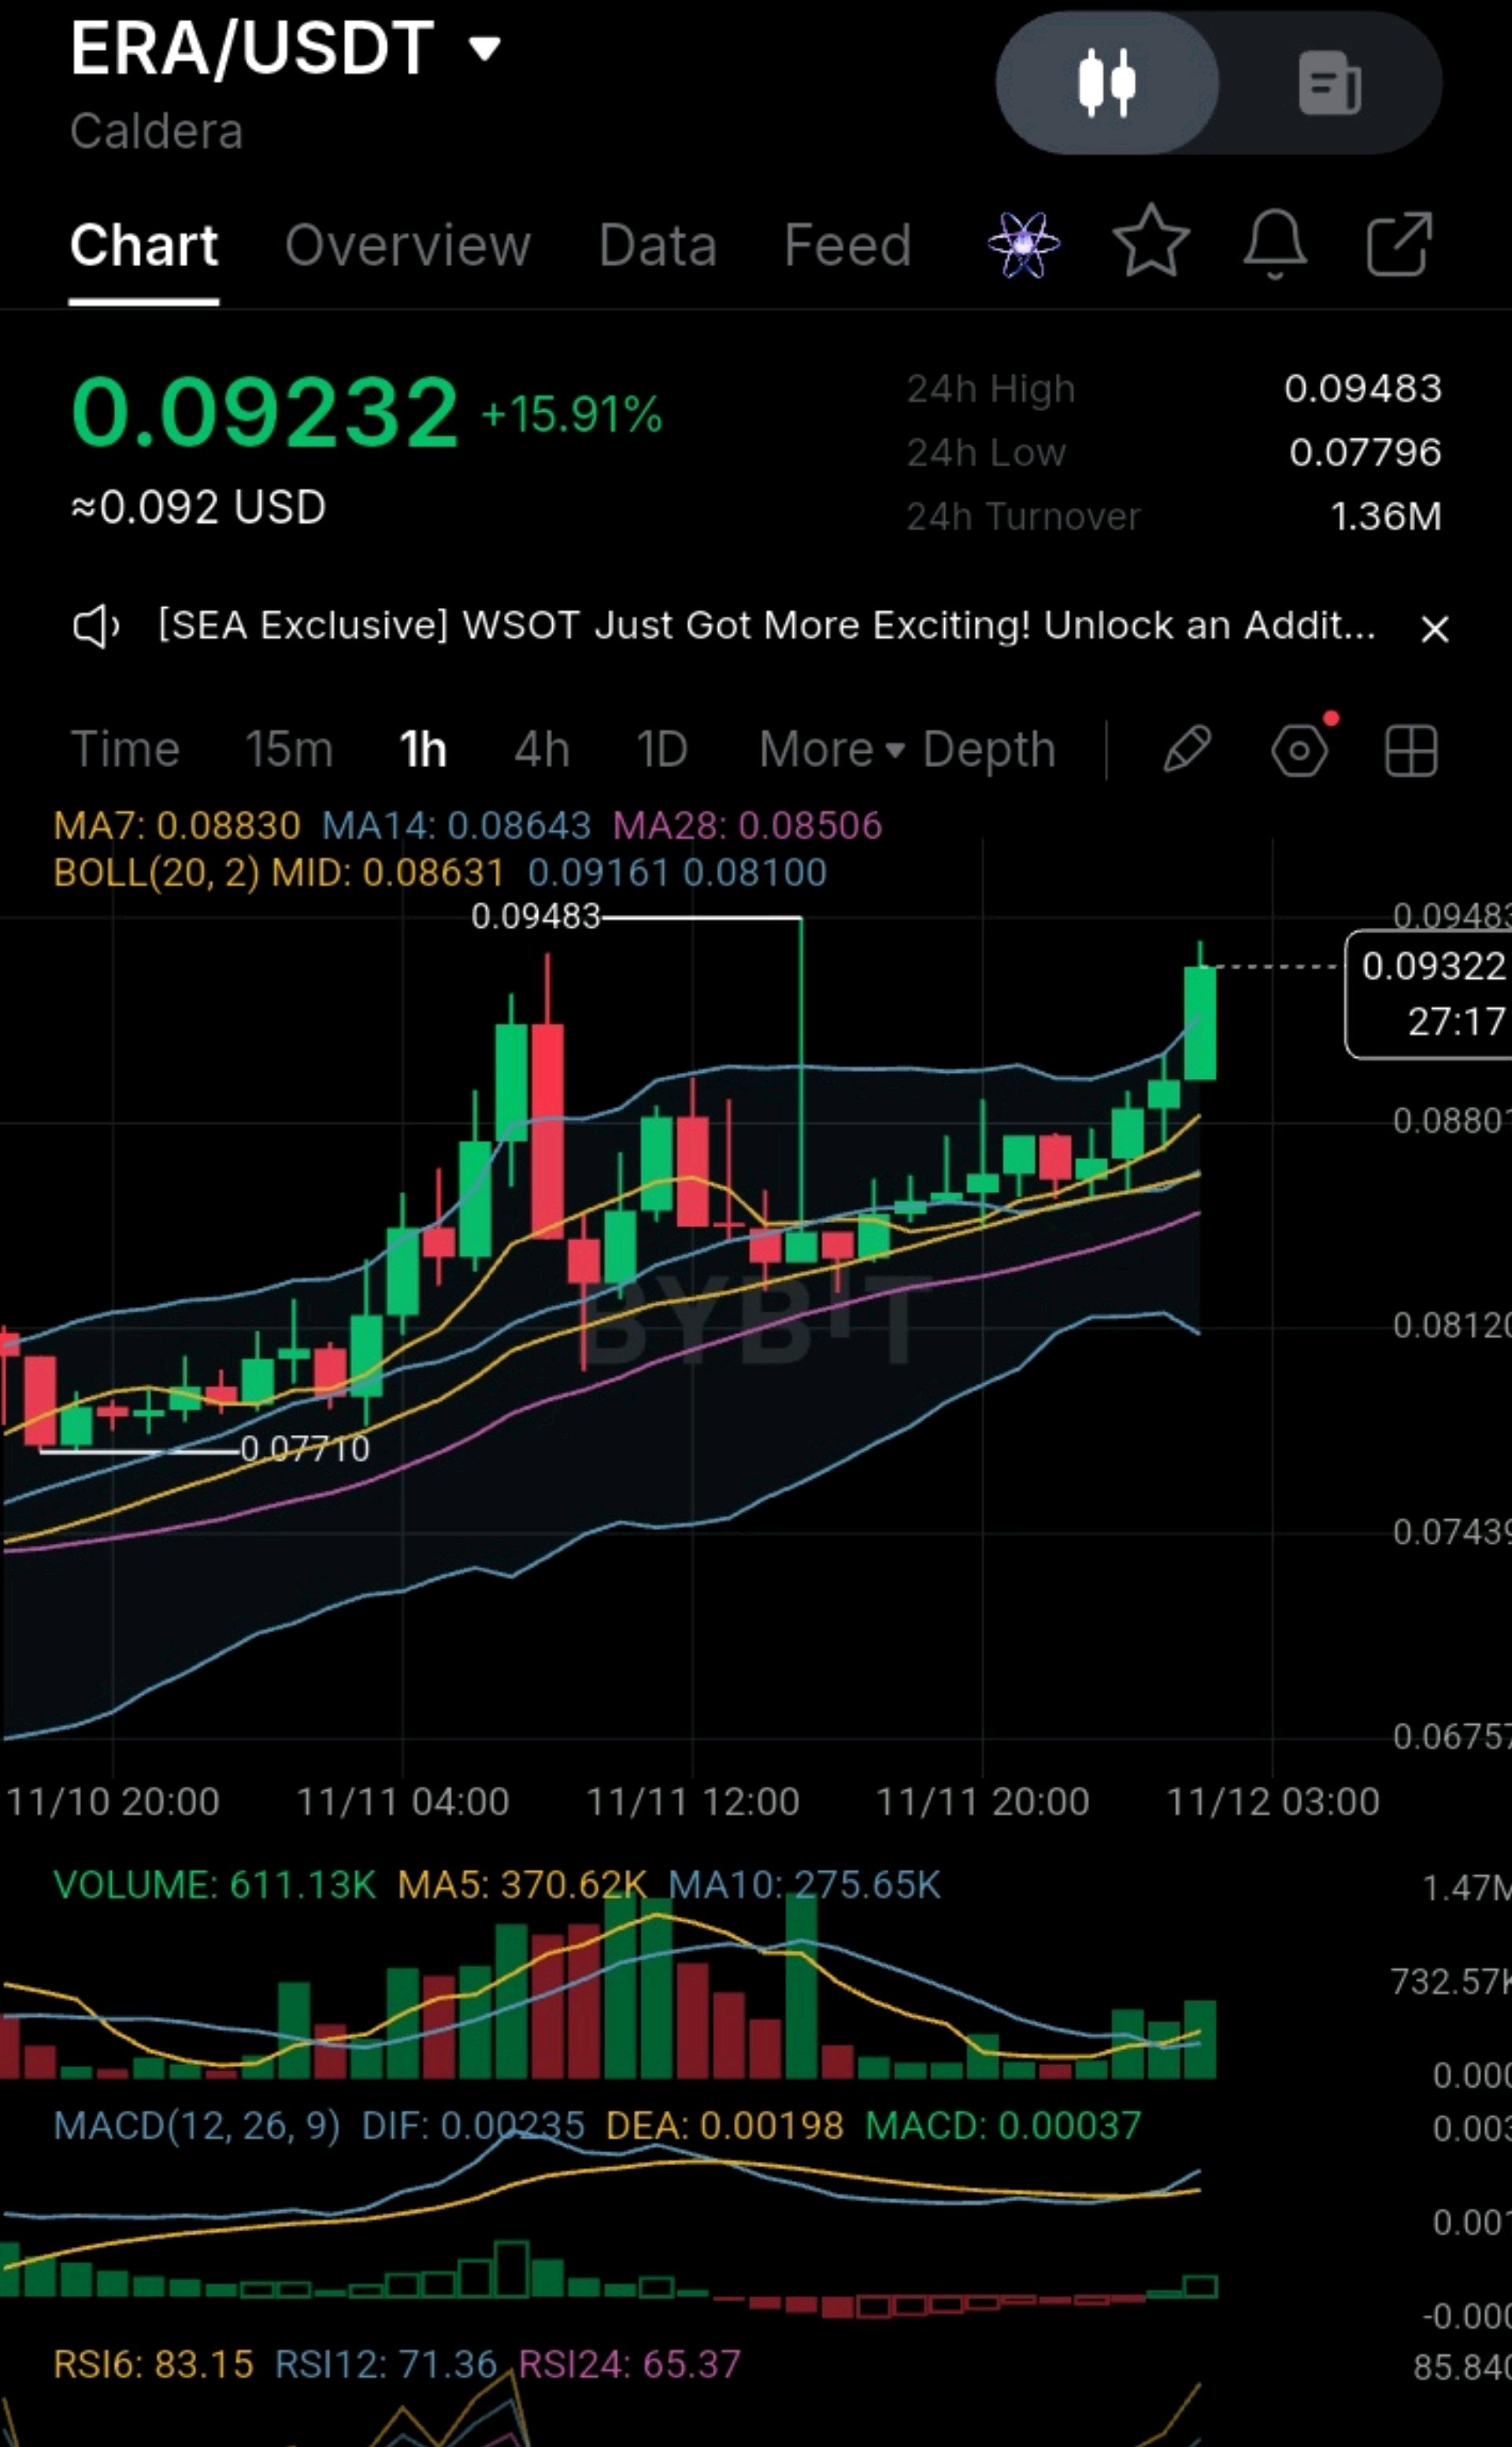
#IMPACTbyTrade #USInflationRunsHotAndRateHikeBetsRise #DeutscheBankLaunchesDigitalAssetCustody #AITechSelloffErases2Point5TrillionFromNasdaq100 #BybitAIEvolving I am watching this breakout attempt closely. A second test of a prior high rarely gives you a comfortable entry, so the current push is offering a clear structural test. Looking at this 1-hour timeframe, the chart climbed steadily from the 0.0771 low, spiked to a peak of 0.09483, pulled back and held above its moving averages, then rallied again. The price is now pushing at 0.0923-0.0932, up 15.91% on the day, and the current candle is still open with about 27 minutes left. Here is my technical reality check: The Power: The MACD has just crossed up (DIF 0.00235 vs DEA 0.00198, histogram +0.00037), and the MAs are stacked in bullish order and rising: MA7 at 0.08830, MA14 at 0.08643 and MA28 at 0.08506. The volume confirms the push, with the current bar at 611.13K against a MA5 of 370.62K and a MA10 of 275.65K. The Danger: The RSI is sitting hot, with RSI6 at 83.15 (RSI12 71.36, RSI24 65.37). While it shows strong buyer momentum, the price is above the upper Bollinger Band (0.09161) and about 5% extended from the MA7, which is why I am watching this retest of 0.09483 closely. Turnover is modest at 1.36M, so reversals can be sharp. The Foundation: The moving-average cluster (around 0.0863-0.0883) and the Bollinger midline (0.08631) have held the pullbacks like a floor, with every dip so far defended by buyers. My Trade Execution and Safety Net: I have zero interest in blindly chasing green candles. Buying at the top of the band means entering extended, with resistance right overhead and the stop far below. The planned entry is a pullback into 0.0885-0.0905, near the MA7 and the top of the recent consolidation, ideally with a bounce candle. A breakout entry only counts after an hourly close above 0.09483 on rising volume, with a smaller size. My Invalidation Point: My risk is capped beneath the MA14 and the Bollinger midline at 0.0860. If sellers manage to crack that floor with a close below it, the momentum is fading, and I am cutting the trade. No hesitation. Below that, the MA28 (0.08506) and the 0.0810 area come into play. My Upside Objective: A clean push through the 24h high at 0.09483, then 0.0990, which is an estimate near the round number and not a hard level. From a 0.0895 entry, that is about 1.5R at the first target and about 2.7R at the second. Precision and capital preservation are the only things that matter here. Who else is watching this breakout? This is technical analysis for discussion, not financial advice. $ERAUSDT

ADVICE TO BEGINNERS
#ByXIMPACT #USInflationRunsHotAndRateHikeBetsRise #WSOT2026 #AITechSelloffErases2Point5TrillionFromNasdaq100 #NovUSCPIWatch Check the next unlock dates before holding through them. On the chart, rising volume into the breakout is consistent with new buyers, but volume alone can't tell you who they are. MCRT: about 17,660 holders were reported, with roughly 5.03B tokens circulating, but at a market cap this small, concentrated wallets can matter a lot. The heavy volume at the breakout and the fade since then look more like a burst of speculation than steady accumulation. Check holder lists on BscScan, plus liquidity depth, before sizing up. Free tools for both: Arkham and Nansen for labeled wallets, the token's holder page on the block explorer, and Coinglass for open interest and funding where perps exist. 📈 TECHNICAL INTERPRETATION ERA: bullish but extended. Trend, volume and MACD agree, but RSI and the retest of 0.09483 argue for patience. Resistance is 0.09483, then about 0.0990 (an estimate). Support is 0.09161, 0.08830 (MA7), 0.08643 (MA14), 0.08631 (BB mid), then 0.08506 (MA28). MCRT: constructive consolidation with fading momentum. Price is sitting right on the MA7/MA14, which is a better location than ERA's, but MACD and volume are rolling over. Resistance is 0.00016500, 0.00017323, then 0.00017590. Support is 0.00015582, 0.00015385, 0.00014902 (BB mid), then 0.00014132 (MA28). Quick scorecard: Trend: ERA is stronger and confirmed by volume. MCRT is consolidating. Momentum: ERA has the fresh bullish MACD cross but is overheated. MCRT's has turned bearish. Liquidity: ERA wins by a wide margin. Entry location: MCRT is closer to support right now. ERA is extended. Risk of sharp reversal and manipulation: MCRT is higher. Supply overhang: ERA has scheduled unlocks. MCRT's concern is micro-cap concentration. 🧭 ADVICE TO BEGINNERS A big green day isn't a buy signal. ERA's RSI6 above 83 and a retest of a prior high are classic spots where beginners buy late. Liquidity matters. MCRT's thin market means slippage and wide spreads, so use limit orders and small size. Check the supply. Token unlocks can add selling pressure on schedule, so look up unlock dates before you buy. .Always set a stop before you enter, and don't move it once you're in a trade. Risk only 1-2% of your account per trade. Take partial profit and move your stop to breakeven. Skip leverage until you're consistent. Normal pullbacks on tokens like these can liquidate leveraged positions. Be careful with whale stories. Without wallet data, they're guesses. 🎯 MY VIEW On technicals alone, ERA is the higher-quality chart, with a trend backed by volume and a fresh MACD cross, but I wouldn't buy at the highs. I'd wait for a pullback to the 0.0885-0.0905 zone or a confirmed volume break above 0.09483. MCRT has the better entry location right now, but it is a thin micro-cap with fading momentum, so if you trade it, keep the size small and use a stop under 0.00014700. Call to action: Which one holds up better if the market dips, Drop your pick 👇 and set alerts at ERA 0.09483 / 0.0860 and MCRT 0.0001759 / 0.0001470, then tell me whether you're waiting for a pullback or a breakout. This is technical analysis for discussion, not financial advice. Small-cap tokens are highly volatile and you can lose your whole stake, so use your own risk limits and always use a stop. $ERAUSDT $MCRTUSDT
ERA vs $MCRT 🥊
#IMPACTbyTrade #USInflationRunsHotAndRateHikeBetsRise #AITechSelloffErases2Point5TrillionFromNasdaq100 #DeutscheBankLaunchesDigitalAssetCustody #AnthropicIPOTestsTheAIBoom $ERA vs $MCRT 🥊 Which setup is stronger after a big day? Both tokens are up sharply on the 1-hour chart, but they are in very different places. ERA is pressing into its 24h high with rising volume, and MCRT is coiling after a vertical spike while volume fades. ⚡ MARKET STRENGTH AND WEAKNESS $ERA (about 0.0923, +15.91%) ✅ Strength: a clean staircase of higher lows, with MA7 (0.08830), MA14 (0.08643) and MA28 (0.08506) stacked in bullish order and rising. ✅ Strength: MACD just crossed up (DIF 0.00235 vs DEA 0.00198), and volume is expanding (611.13K vs a MA5 of 370.62K), which is what you want to see on a breakout attempt. ✅ Strength: it is much more liquid, with about 1.36M in 24h turnover, roughly 11x MCRT's. ⚠️ Weakness: RSI6 is 83.15 and price is above the upper Bollinger Band (0.09161). It is also retesting the 0.09483 high for the second time, and double tests often fail without strong volume. ⚠️ Weakness: the supply schedule is heavy. Roughly 79.8% of ERA's 1 billion supply was still locked across dozens of future unlocks when that data was published, with vesting running to July 2029. $MCRT (0.00015656, +28.63%) ✅ Strength: price is above MA7 (0.00015582), MA14 (0.00015385) and MA28 (0.00014132), and the pullback was orderly, holding the averages. RSI has cooled to 60-64, so the move has reset. ⚠️ Weakness: MACD has crossed down (DIF 0.00000769 vs DEA 0.00000798), and volume is drying up (6.98M vs a MA5 of 12.16M). The big volume was all on the breakout candles. ⚠️ Weakness: it is a micro-cap. Data sites show a market cap of roughly $330K to $630K, and 24h turnover on your chart is only 120.14K. One large wallet can move the price either way. 🐋 WHALE POSITIONING (honest version) ERA: the supply picture matters more than any single wallet. The allocation was about 32% to early backers, 21% to the community treasury, roughly 15% each to the foundation and the core team, and 7% to the airdrop. Team and early-backer tokens were locked for 12 months after the July 2025 launch, then began unlocking monthly, so insider selling pressure is a real, ongoing factor. $ERAUSDT $MCRTUSDT

Metaplex Preparing
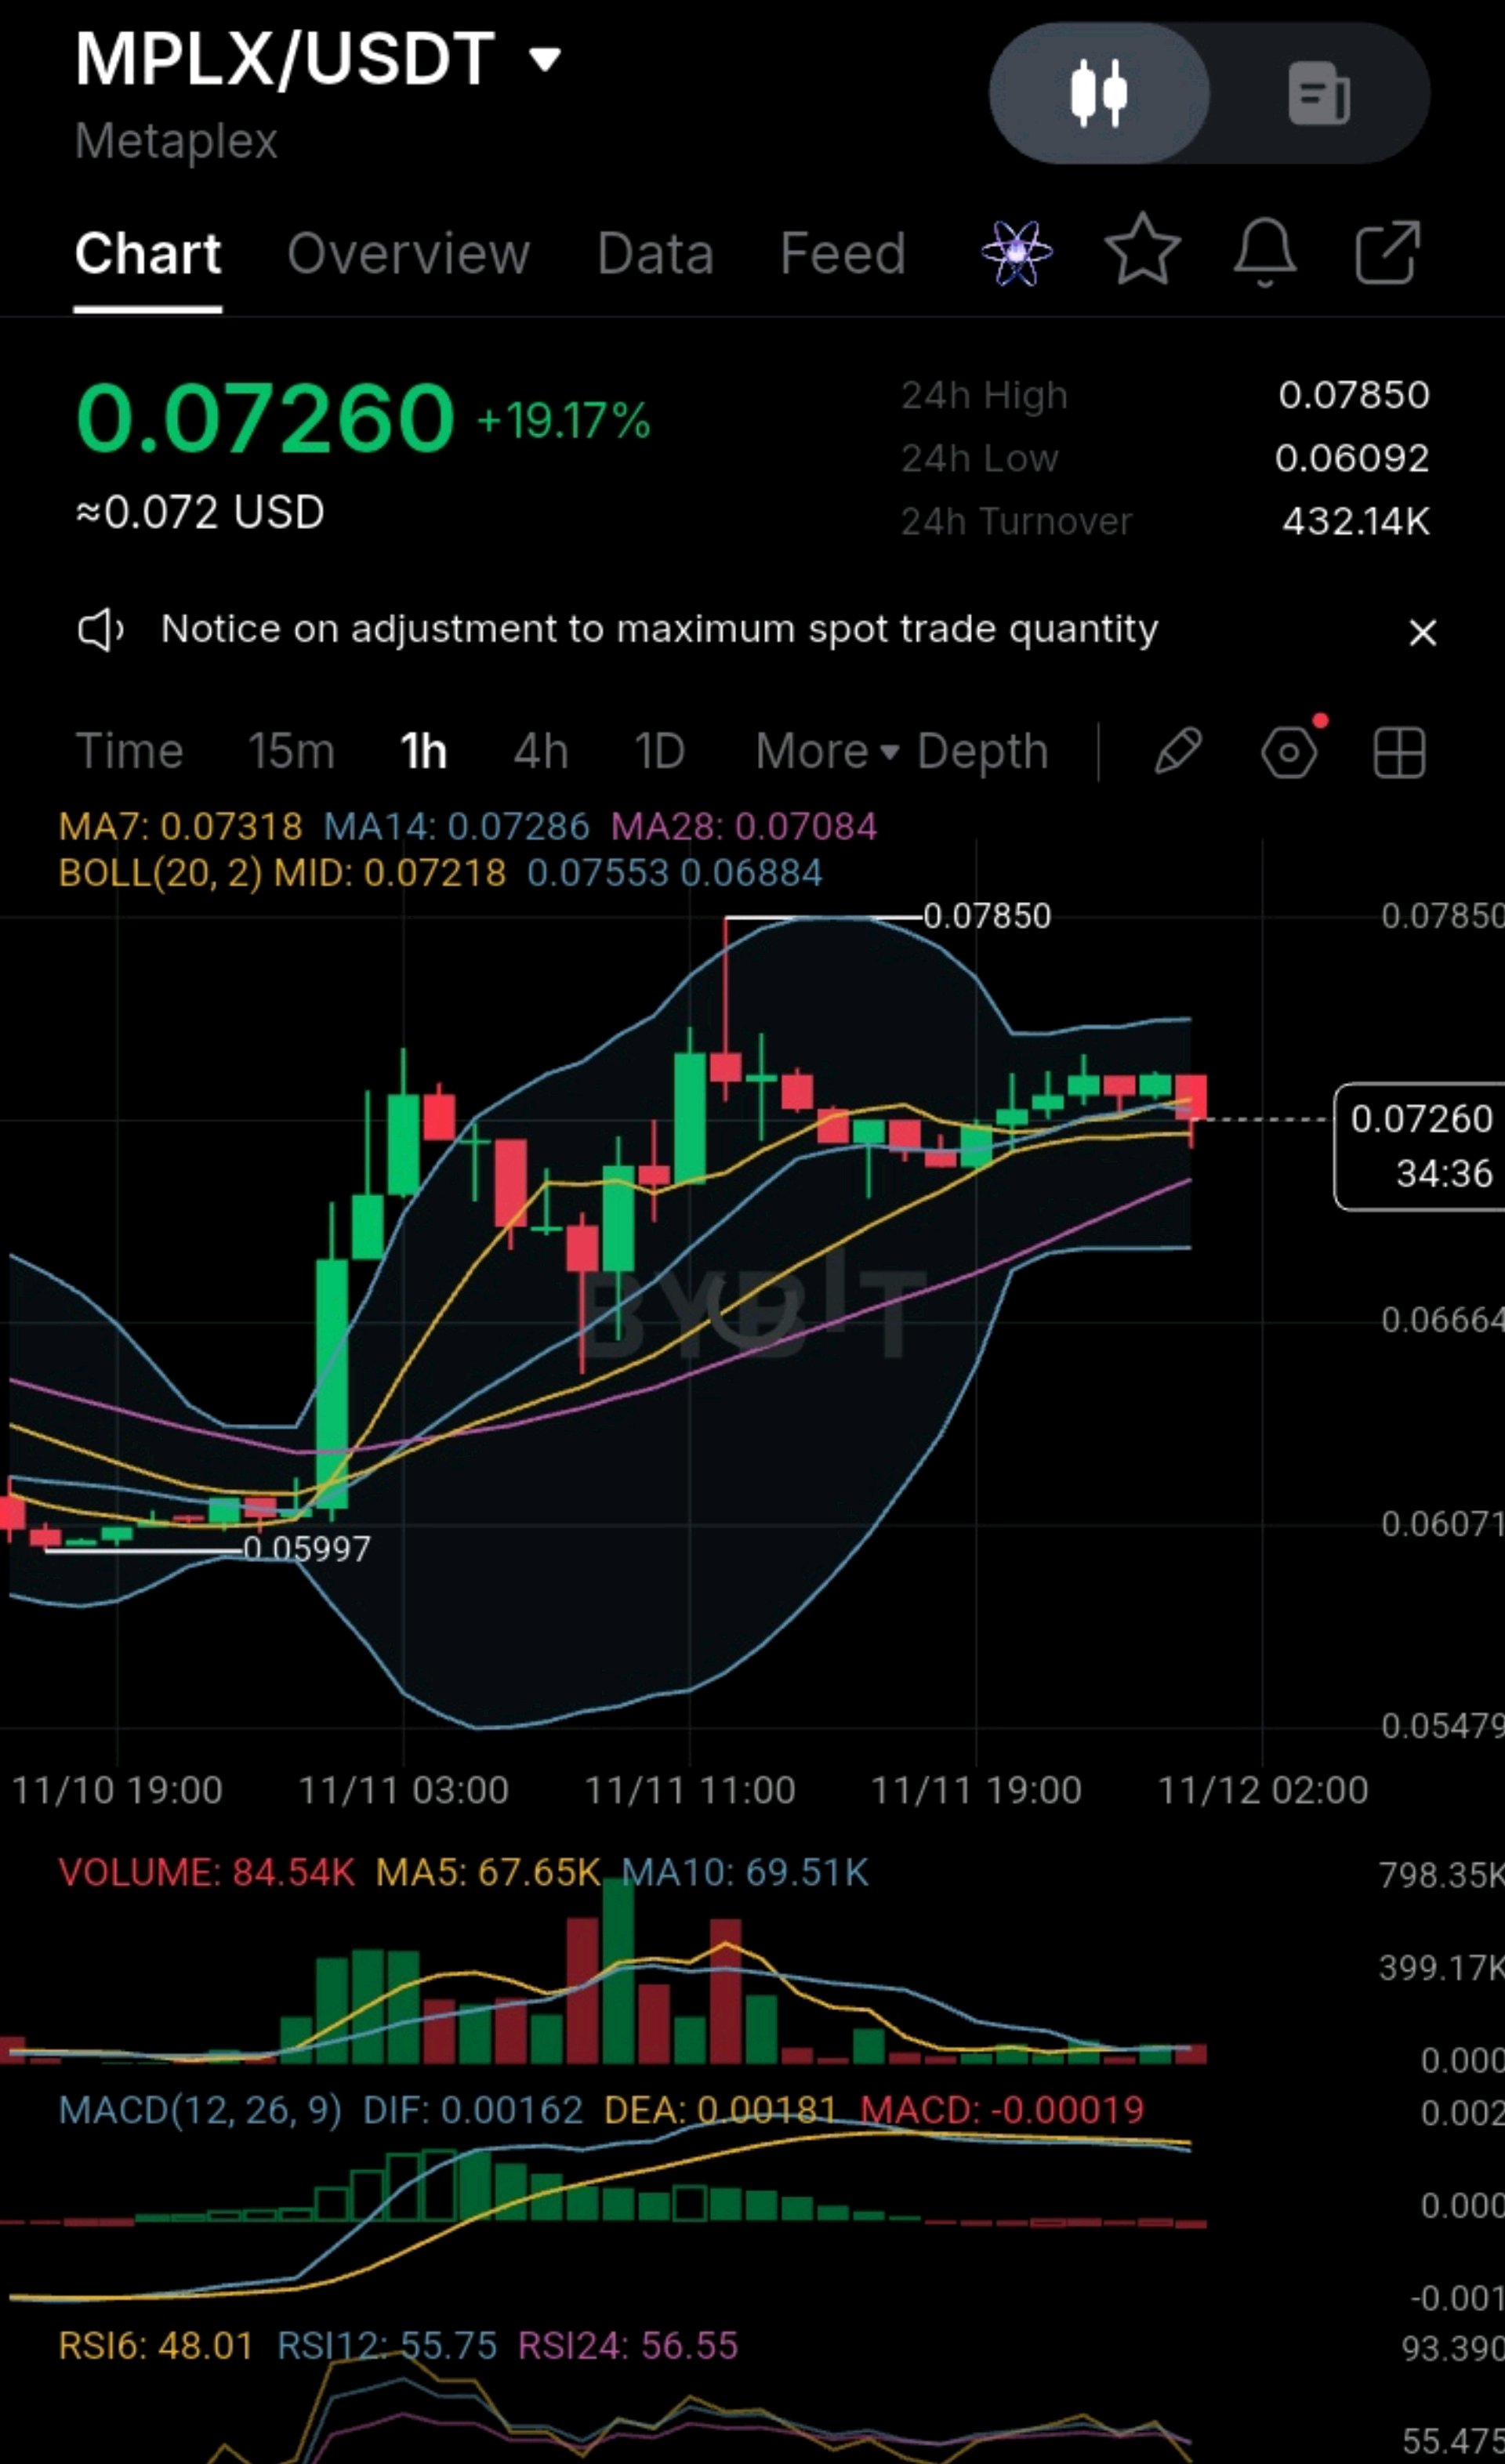
#ByXIMPACT #USInflationRunsHotAndRateHikeBetsRise #AITechSelloffErases2Point5TrillionFromNasdaq100 #DeutscheBankLaunchesDigitalAssetCustody #NovUSCPIWatch MPLX/USDT – Is Metaplex Preparing for Another Breakout or Losing Momentum? Current Price: $0.07260 24H Change: +19.17% 24H High: $0.07850 24H Low: $0.06092 24H Turnover: $432.14K 1. Market Structure MPLX has recorded a strong bullish move, climbing from approximately $0.0600 to $0.07850 before entering a consolidation phase. On the 1-hour chart, price is currently trading around $0.07260, suggesting that buyers are attempting to maintain the gains rather than allowing an immediate reversal. However, the latest candles show reduced momentum and indecision. 2. Moving Averages (MA) MA7: $0.07318 MA14: $0.07286 MA28: $0.07084 Price is currently below MA7 and MA14 but remains above MA28. This suggests short-term momentum is cooling, while the broader recovery structure remains intact. 3. RSI Analysis RSI6: 48.01 RSI12: 55.75 RSI24: 56.55 The RSI indicators show a neutral-to-mildly bullish structure. RSI6 has dropped below 50, indicating weakening immediate buying pressure. However, RSI12 and RSI24 remain above 50, suggesting the broader momentum has not completely turned bearish. 4. MACD Analysis DIF: 0.00162 DEA: 0.00181 MACD Histogram: -0.00019 The MACD is showing a slight bearish crossover, with DIF below DEA. This indicates that bullish momentum is weakening and sellers are beginning to exert some pressure. A bullish MACD recovery would strengthen the case for another upward move. 5. Volume Analysis Current Volume: 84.54K MA5 Volume: 67.65K MA10 Volume: 69.51K Volume is relatively healthy compared with its short-term averages. However, the significant volume expansion occurred during the initial price surge. The current consolidation needs stronger buying volume to support another breakout. 6. Bullish Scenario 🟢 If buyers successfully defend the $0.0710–$0.0720 region, MPLX could attempt another upward move. Key resistance levels: $0.0735 – Immediate resistance. $0.0755 – Upper Bollinger Band. $0.0785 – Previous local high. A convincing breakout above $0.0785, supported by increased volume, could open the door to further upside. 7. Bearish Scenario 🔴 If buying pressure continues to weaken, MPLX could lose its current consolidation structure. Important support levels: $0.0720 – Immediate support. $0.0708 – MA28 support. $0.0688 – Lower Bollinger Band. $0.0666 – Additional chart support. A sustained breakdown below $0.0688 would increase the risk of a deeper correction. 8. Critical Question Is MPLX consolidating before another bullish expansion, or was the move towards $0.07850 the peak of its current rally? The next important signals to watch are: Recovery above MA7 and MA14. MACD bullish crossover. RSI6 reclaiming 50. Increased buying volume during an attempt to break $0.0755. Final Observation MPLX remains up significantly over the last 24 hours, but its short-term momentum is cooling. The overall structure has not completely turned bearish, although another breakout should not be assumed without confirmation. For now, $0.0710–$0.0720 is an important area to watch. A successful defence could provide the foundation for another bullish attempt. Not financial advice. DYOR. $MPLXUSDT


MCRT ran hard
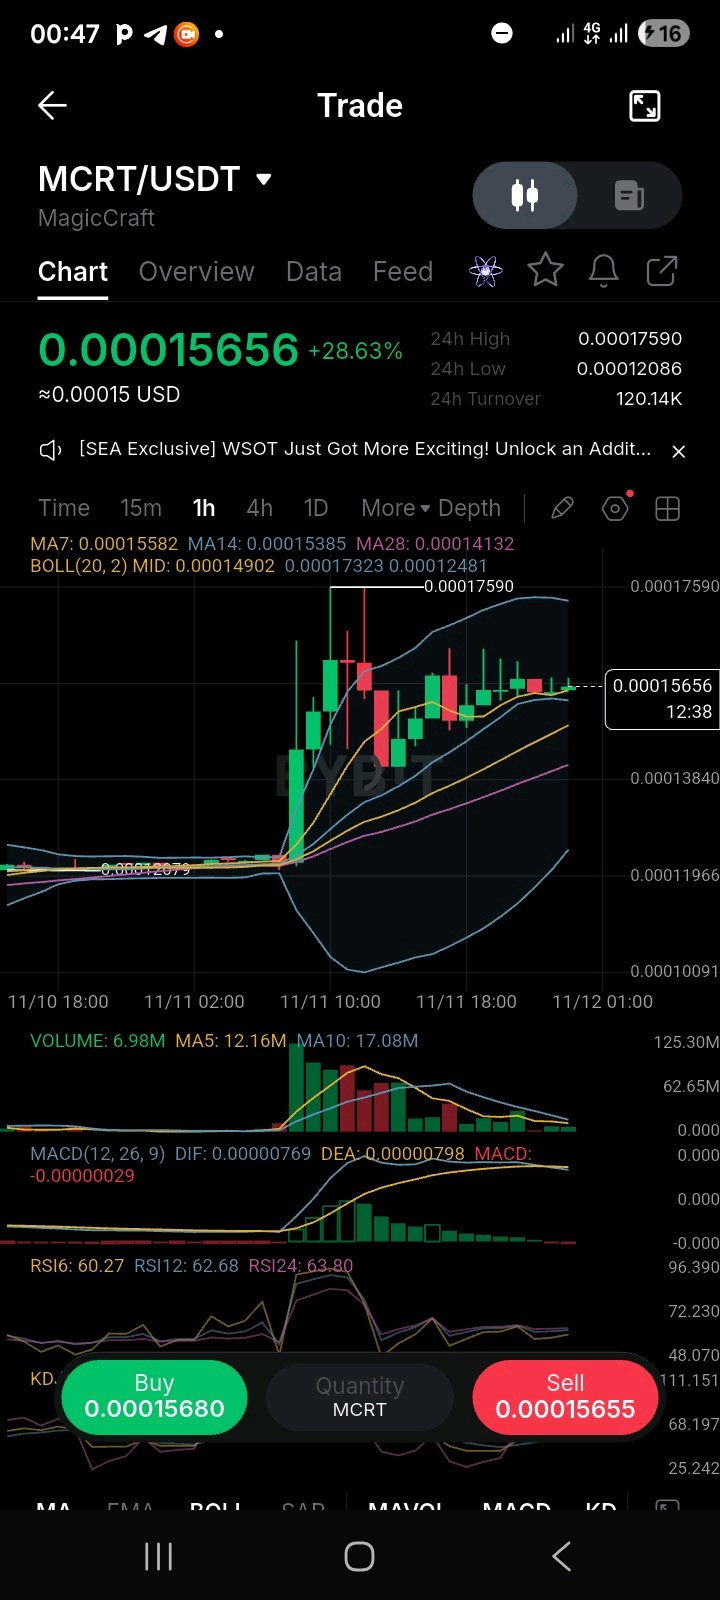
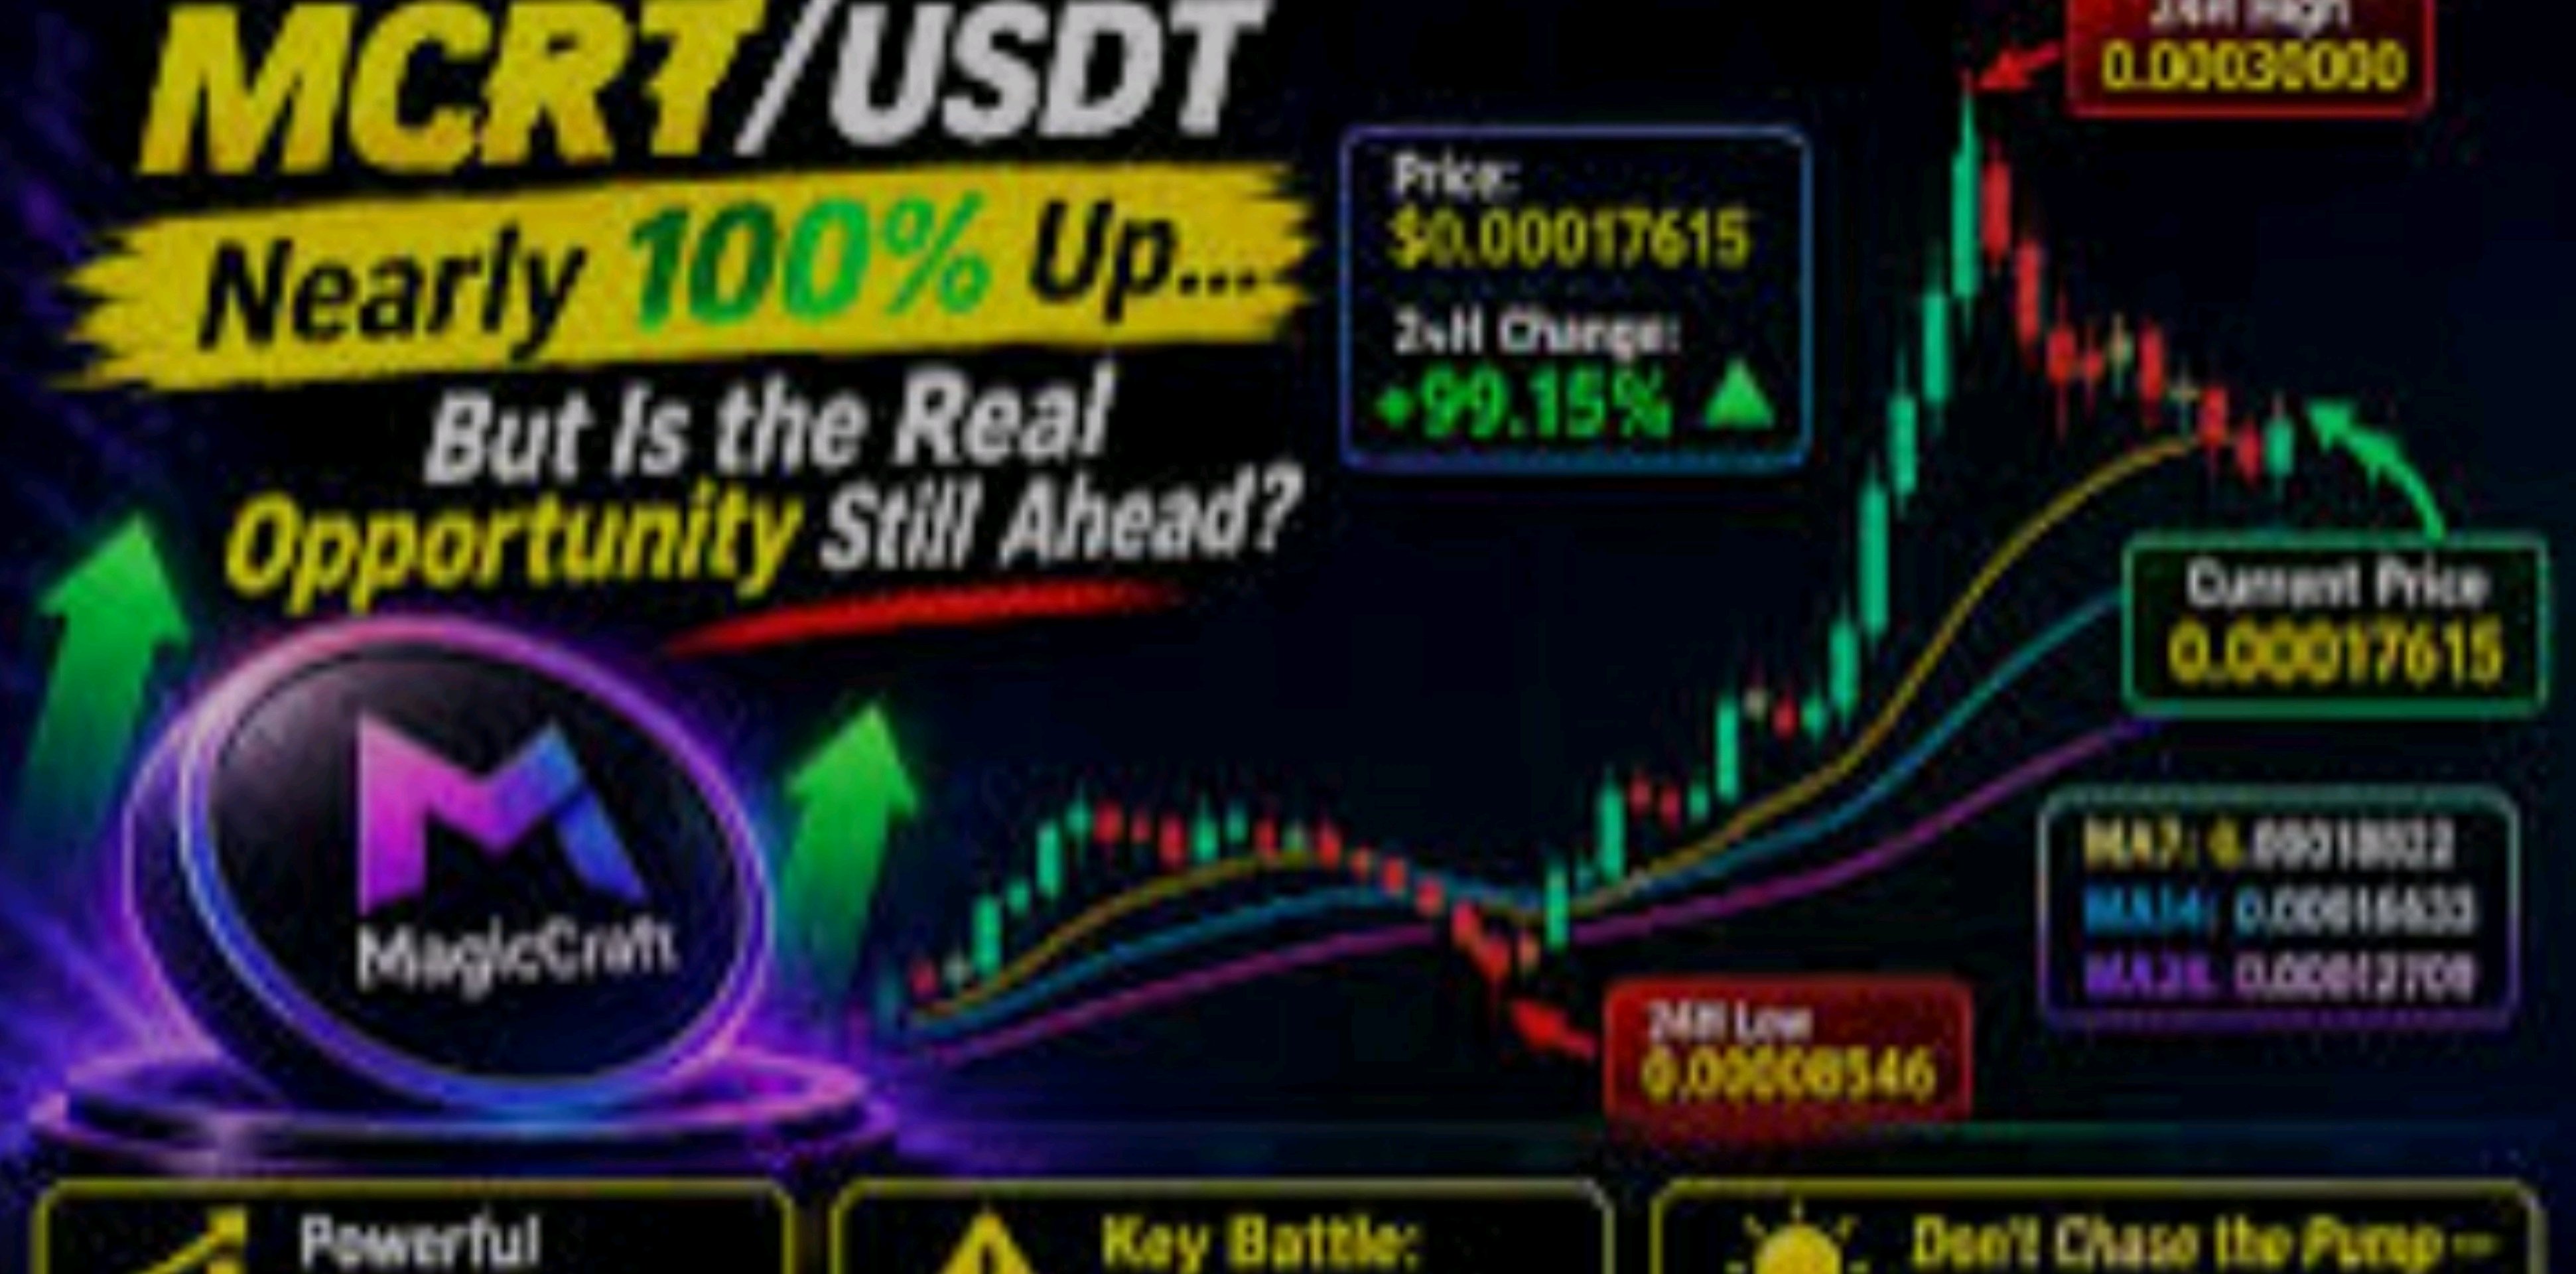
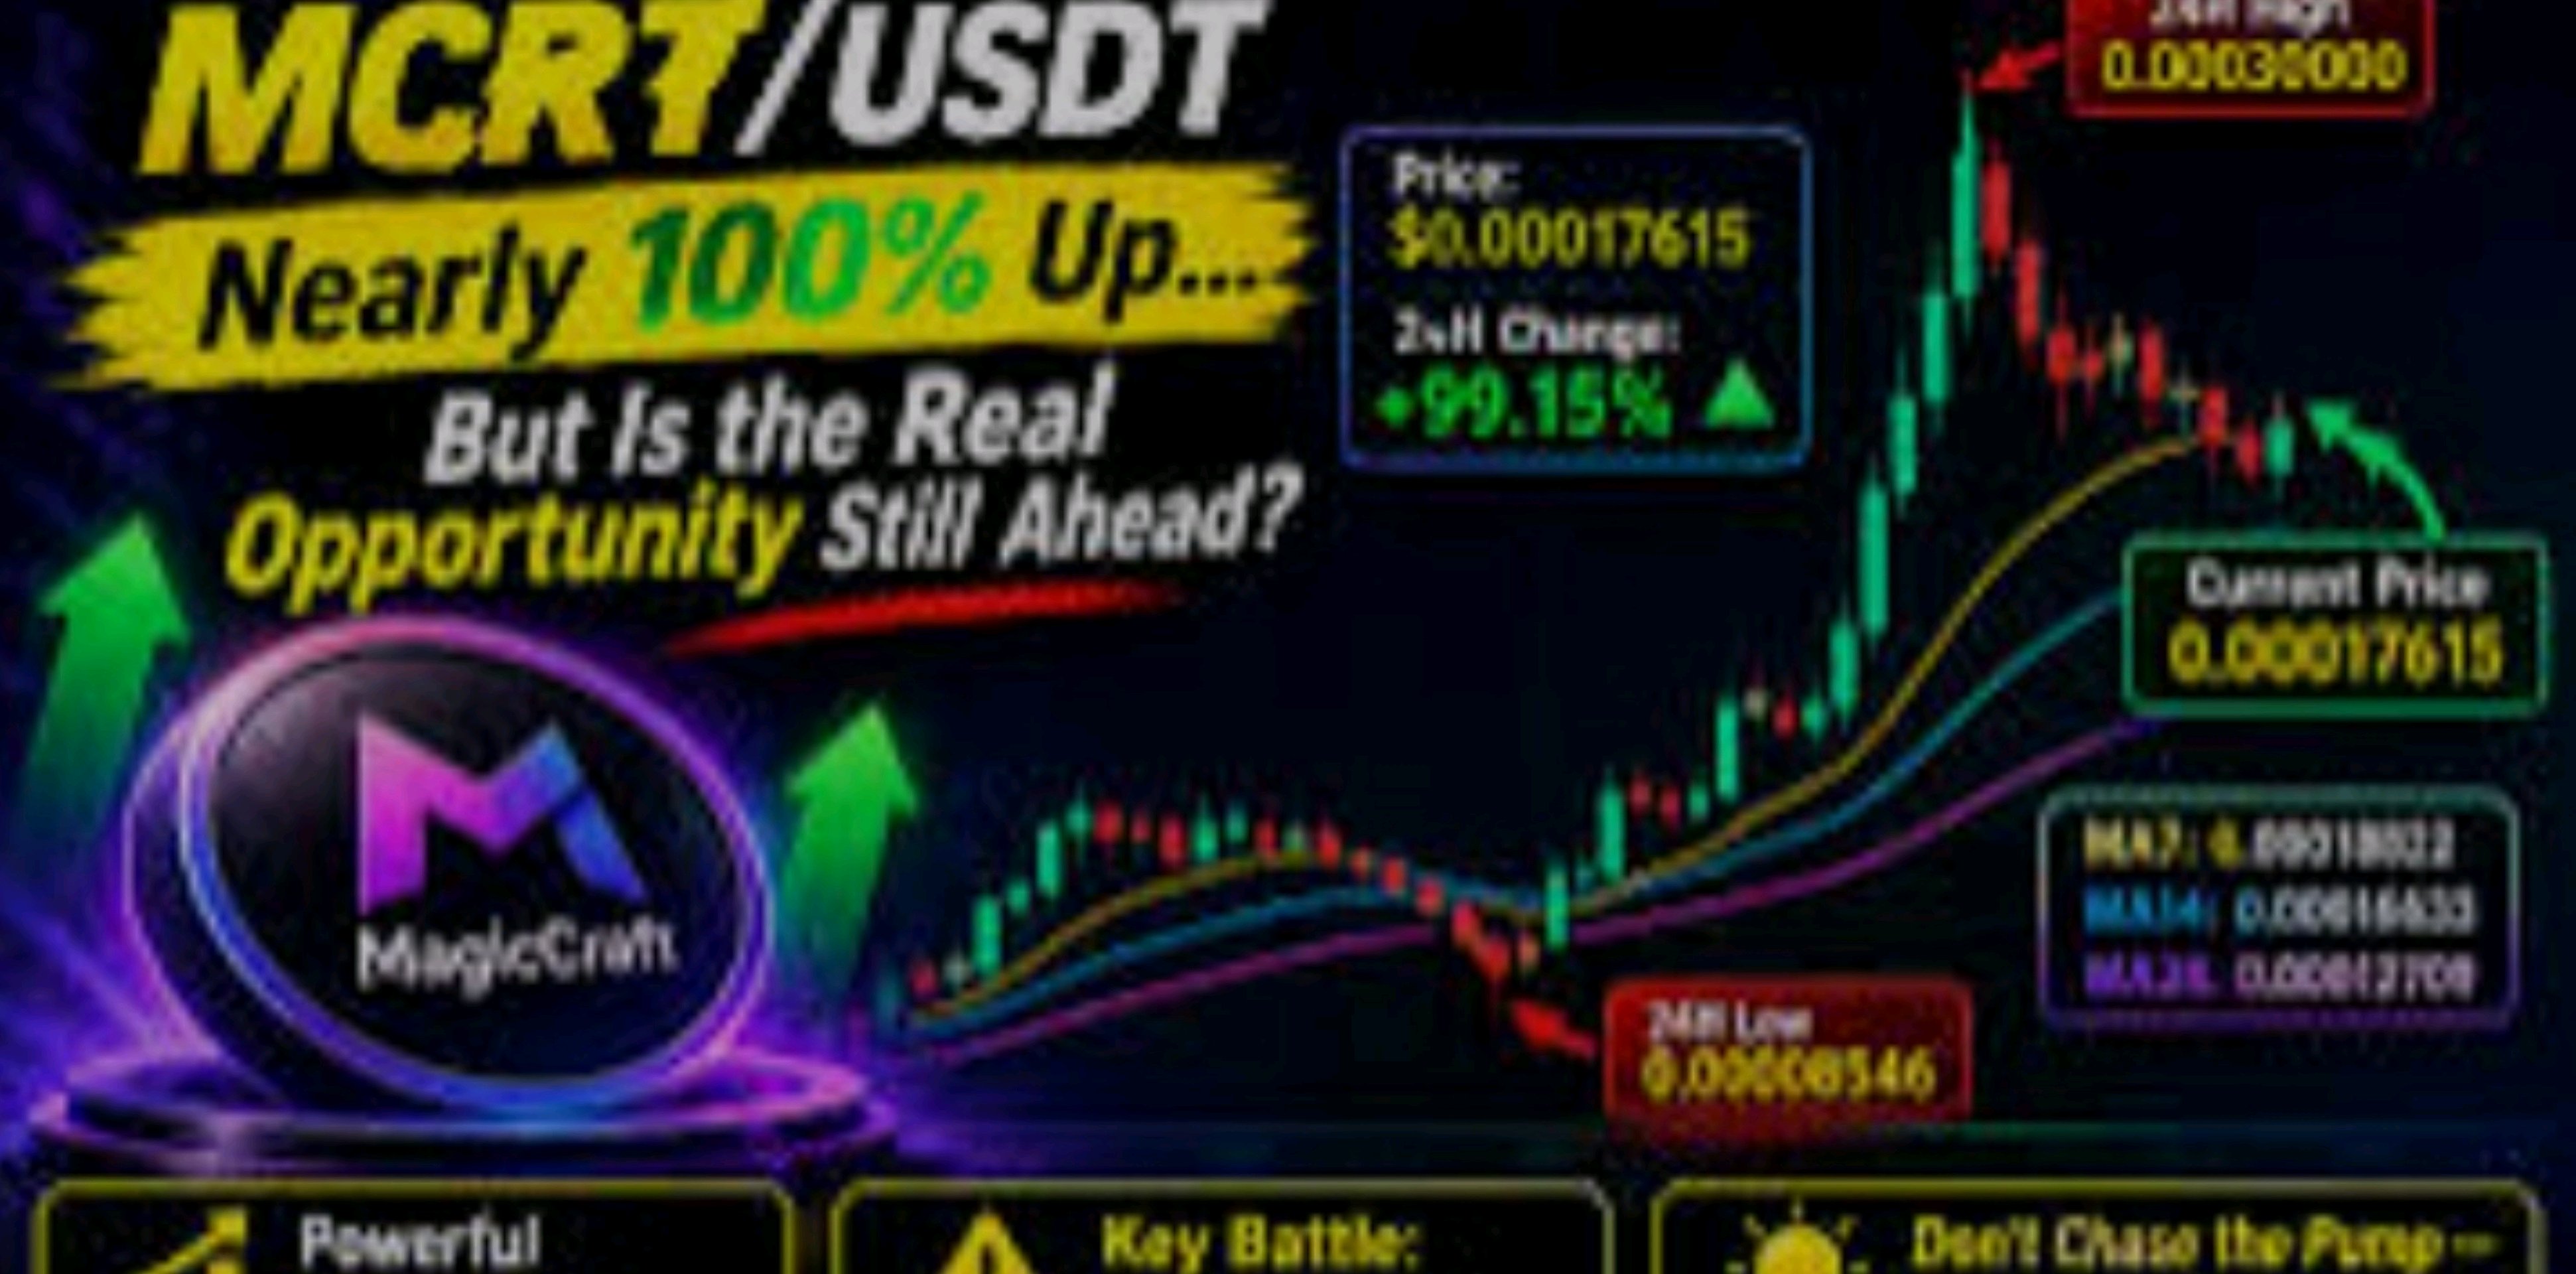
#IMPACTbyTrade #USInflationRunsHotAndRateHikeBetsRise #WSOT2026 #USPayrollsAndRateDecisionsDriveMacroWeek #OilVolatilityTracksIranPeaceTalks MCRT ran hard, cooled off, and is now coiling in a tight range under its 24h high. The next hourly closes decide whether this is a flag before a second leg or a fade. Look at this 1-hour chart. MCRT sat flat around 0.00012 for hours, then exploded on a huge volume candle to a high of 0.00017590. It was rejected, pulled back toward 0.00014, and has since consolidated in small candles right on the MA7/MA14. Price is 0.00015656, up 28.63% on the day, and the current candle is still open (about 12 minutes left), so judge it at the close. The Power: Price is above MA7 (0.00015582), MA14 (0.00015385) and MA28 (0.00014132), and above the BB midline (0.00014902). The pullback was orderly and held the moving averages, which is constructive after a vertical move. RSI has cooled from extreme levels to 60-64 (RSI6 60.27, RSI12 62.68, RSI24 63.80), so the move has reset without breaking structure. The Exhaustion Risk: MACD has crossed down: DIF (0.00000769) is below DEA (0.00000798), with a slightly negative histogram. Momentum is fading. Volume is drying up: 6.98M now against a MA5 of 12.16M and a MA10 of 17.08M. The big volume was all on the breakout candles. The 0.00017590 high was rejected with a long wick, so sellers are active at 0.00017-0.00017590. Turnover is thin (120.14K), and a +28% day on a micro-priced token can reverse fast. Key levels: Resistance: 0.00016500, then 0.00017323 (upper band), then 0.00017590 (24h high) Support: 0.00015582 (MA7), 0.00015385 (MA14), 0.00014902 (BB mid), 0.00014132 (MA28), then the 0.00012079 base Trade Plan (illustrative): Preferred entry: a dip into 0.00015200-0.00015450 (MA14 area), ideally with a bounce candle. Stop loss: 0.00014700, just under the BB midline. A closing break below invalidates the setup. Target 1: 0.00016500, about 2.0R from a 0.00015300 entry. Target 2: 0.00017323, about 3.4R. Target 3: 0.00017590 (24h high), about 3.8R. Breakout alternative: an hourly close above 0.00017590 on rising volume, with a stop under 0.00016500 and smaller size, since chasing a breakout has worse risk/reward. Position size: risk only 1-2% of your account on the stop distance. Take partial profit at Target 1 and move the stop to breakeven. If it goes wrong: below 0.00014700, expect a slide to the MA28 (0.00014132), and below that the whole move would be at risk of giving back toward the 0.00012 base. Verdict: the structure is bullish and the consolidation is healthy, but momentum and volume are fading. I'd want either a bounce off the MA14/BB-mid zone or a volume breakout above 0.00017590 before trusting it. After a +28% day, chasing here is poor risk/reward. I can't see a news catalyst in the chart, so check for listings or announcements first. Call to action: Are you buying the dip to 0.000153, waiting for a confirmed break of 0.0001759, or staying out until volume returns? Set alerts at 0.0001759 and 0.0001470 so you don't miss either move. This is technical analysis for discussion, not financial advice. $MCRTUSDT
The spike was rejected
#ByXIMPACT #USInflationRunsHotAndRateHikeBetsRise #WSOT2026 #BitcoinHitsTwoMonthLowAfterUSMidterms #AITechSelloffErases2Point5TrillionFromNasdaq100 $MCRTUSDT – 1H Overview | Long on Pullback Pair: $MCRTUSDT Looking at the hourly chart, MCRT sat flat around 0.00012 for hours, then launched on a huge volume candle to 0.00017590. The spike was rejected, price pulled back toward 0.00014, and it has been consolidating in small candles since, now trading around 0.00015656, up 28.63% on the day. The structure is constructive, but it is still a consolidation after a vertical move rather than a confirmed second leg. I'd rather let price come back to me than chase this move. Current Outlook and Key Levels Buying Zone: 0.00015200 – 0.00015450 This is the MA14 area (0.00015385) and just above the MA7 (0.00015582), where the pullback has been finding support. If price returns here and buyers step in with a visible reaction, such as a rejection wick or a strong hourly close back above 0.00015582, the zone is worth watching. A slow bleed through it with no response is not what I want to see. Resistance Zone: 0.00016500 – 0.00017590 This is the overhead supply where the spike was rejected, and the 24h high of 0.00017590 sits at the top of it, with the upper Bollinger Band (0.00017323) inside it. Sellers defended this area before, so I expect some reaction on a first test. A clean break and sustained consolidation above 0.00017590 on rising volume would suggest the consolidation is resolving upward and open the door to new highs. Trading Setup Position: Long on pullback Entry Zone: 0.00015200 – 0.00015450, only after buyer confirmation Stop-Loss: A close below 0.00014700 Invalidation: If price closes below 0.00014700 (under the BB midline at 0.00014902), the structure is breaking down and the consolidation has failed. At that point there is no reason to hold the long, and the MA28 (0.00014132) comes into focus. Take-Profits: TP1: 0.00016500 TP2: 0.00017323 TP3: 0.00017590 Why This Setup Makes Sense Buying at 0.00015656 means entering mid-range, with resistance close overhead and the stop far below. The stop would be about 6.1% away, while the first target is only about 5.4% away, so the reward-to-risk to TP1 is roughly 0.9:1 and the entry has little structural backing. Waiting for a pullback into the 0.00015200 – 0.00015450 area puts the stop just beneath a defined level (the BB midline), which keeps the risk tight and improves the reward-to-risk to about 2:1 at TP1 and up to roughly 3.8:1 at TP3. The targets follow levels the chart already shows, so each one is a place where price previously reacted. The reaction matters as much as the level. A touch of support is not a signal, but a touch followed by buyers defending it is. Momentum is also fading, with MACD crossing down (DIF 0.00000769 below DEA 0.00000798) and volume drying up (6.98M vs a MA5 of 12.16M), so patience here costs nothing, while chasing a +28% day often does. RSI has cooled to 60-64, which is healthy. Risk Management Stick to the plan. If the stop is hit, accept it and move on rather than moving it. Size the position so a loss is manageable, because a support zone can fail, this token is thin (120.14K turnover) and no setup guarantees a profit. This is a personal market observation, not financial advice. $MCRTUSDT

NVDA Slips to $177.
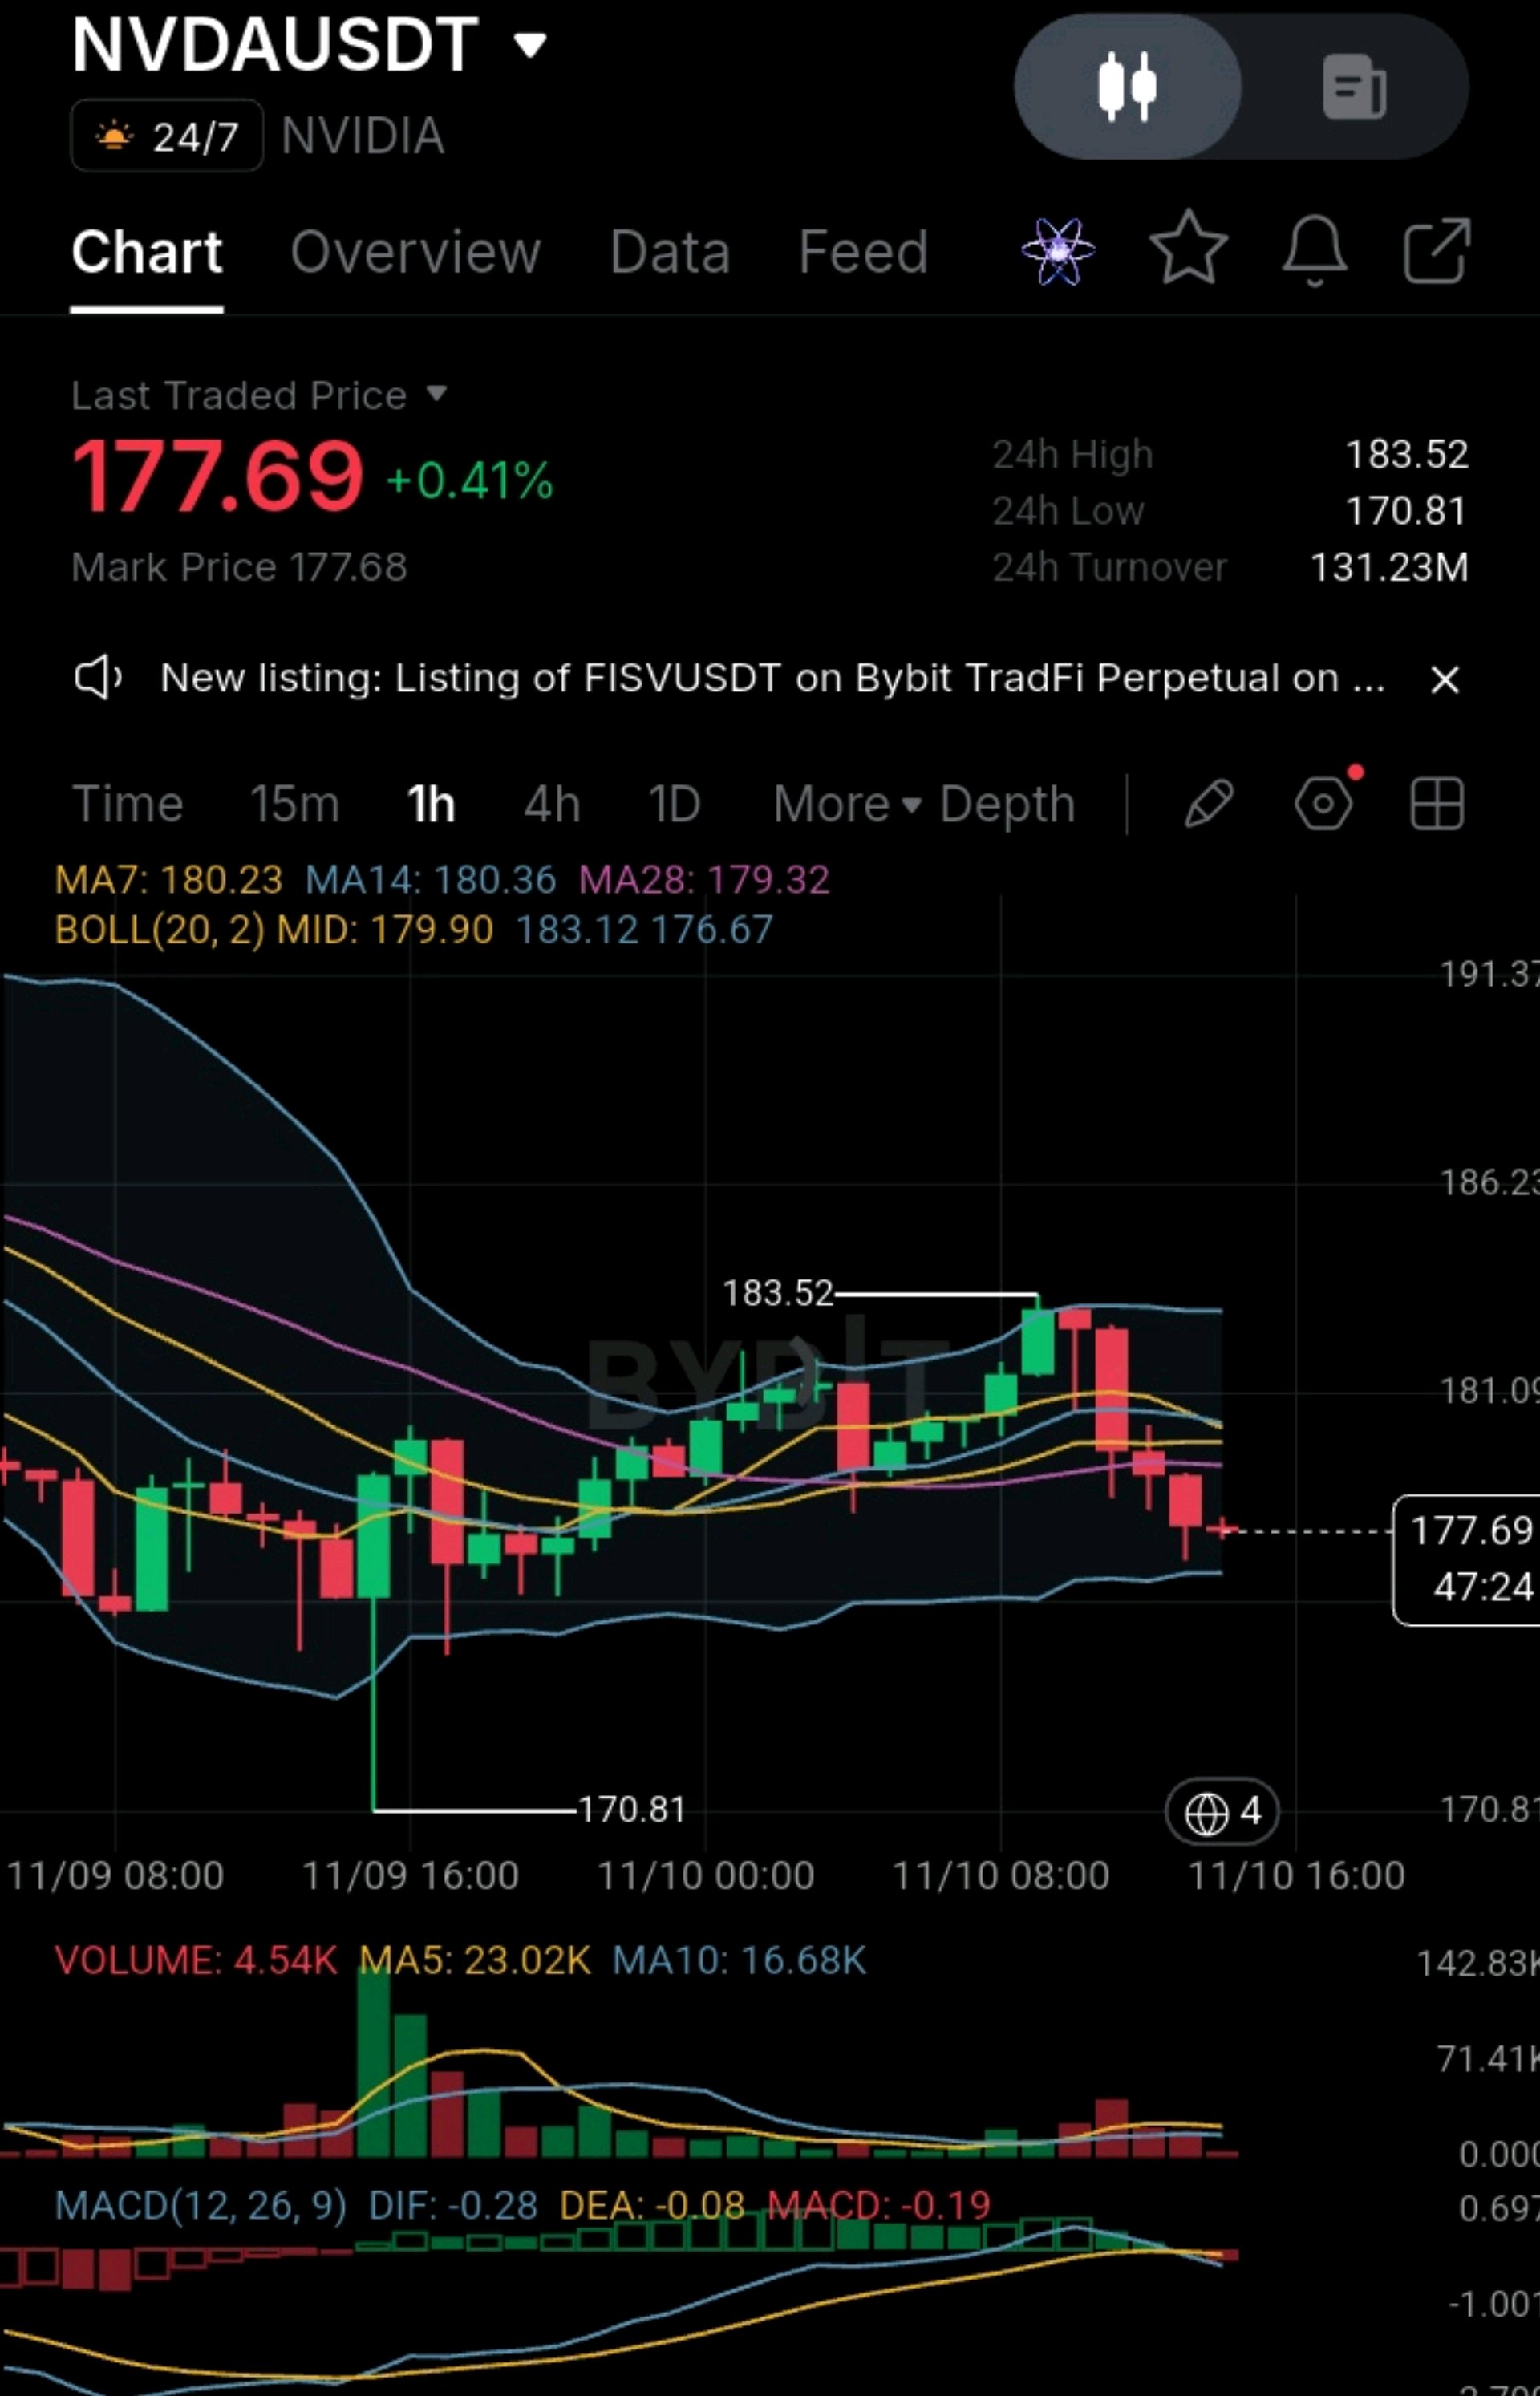
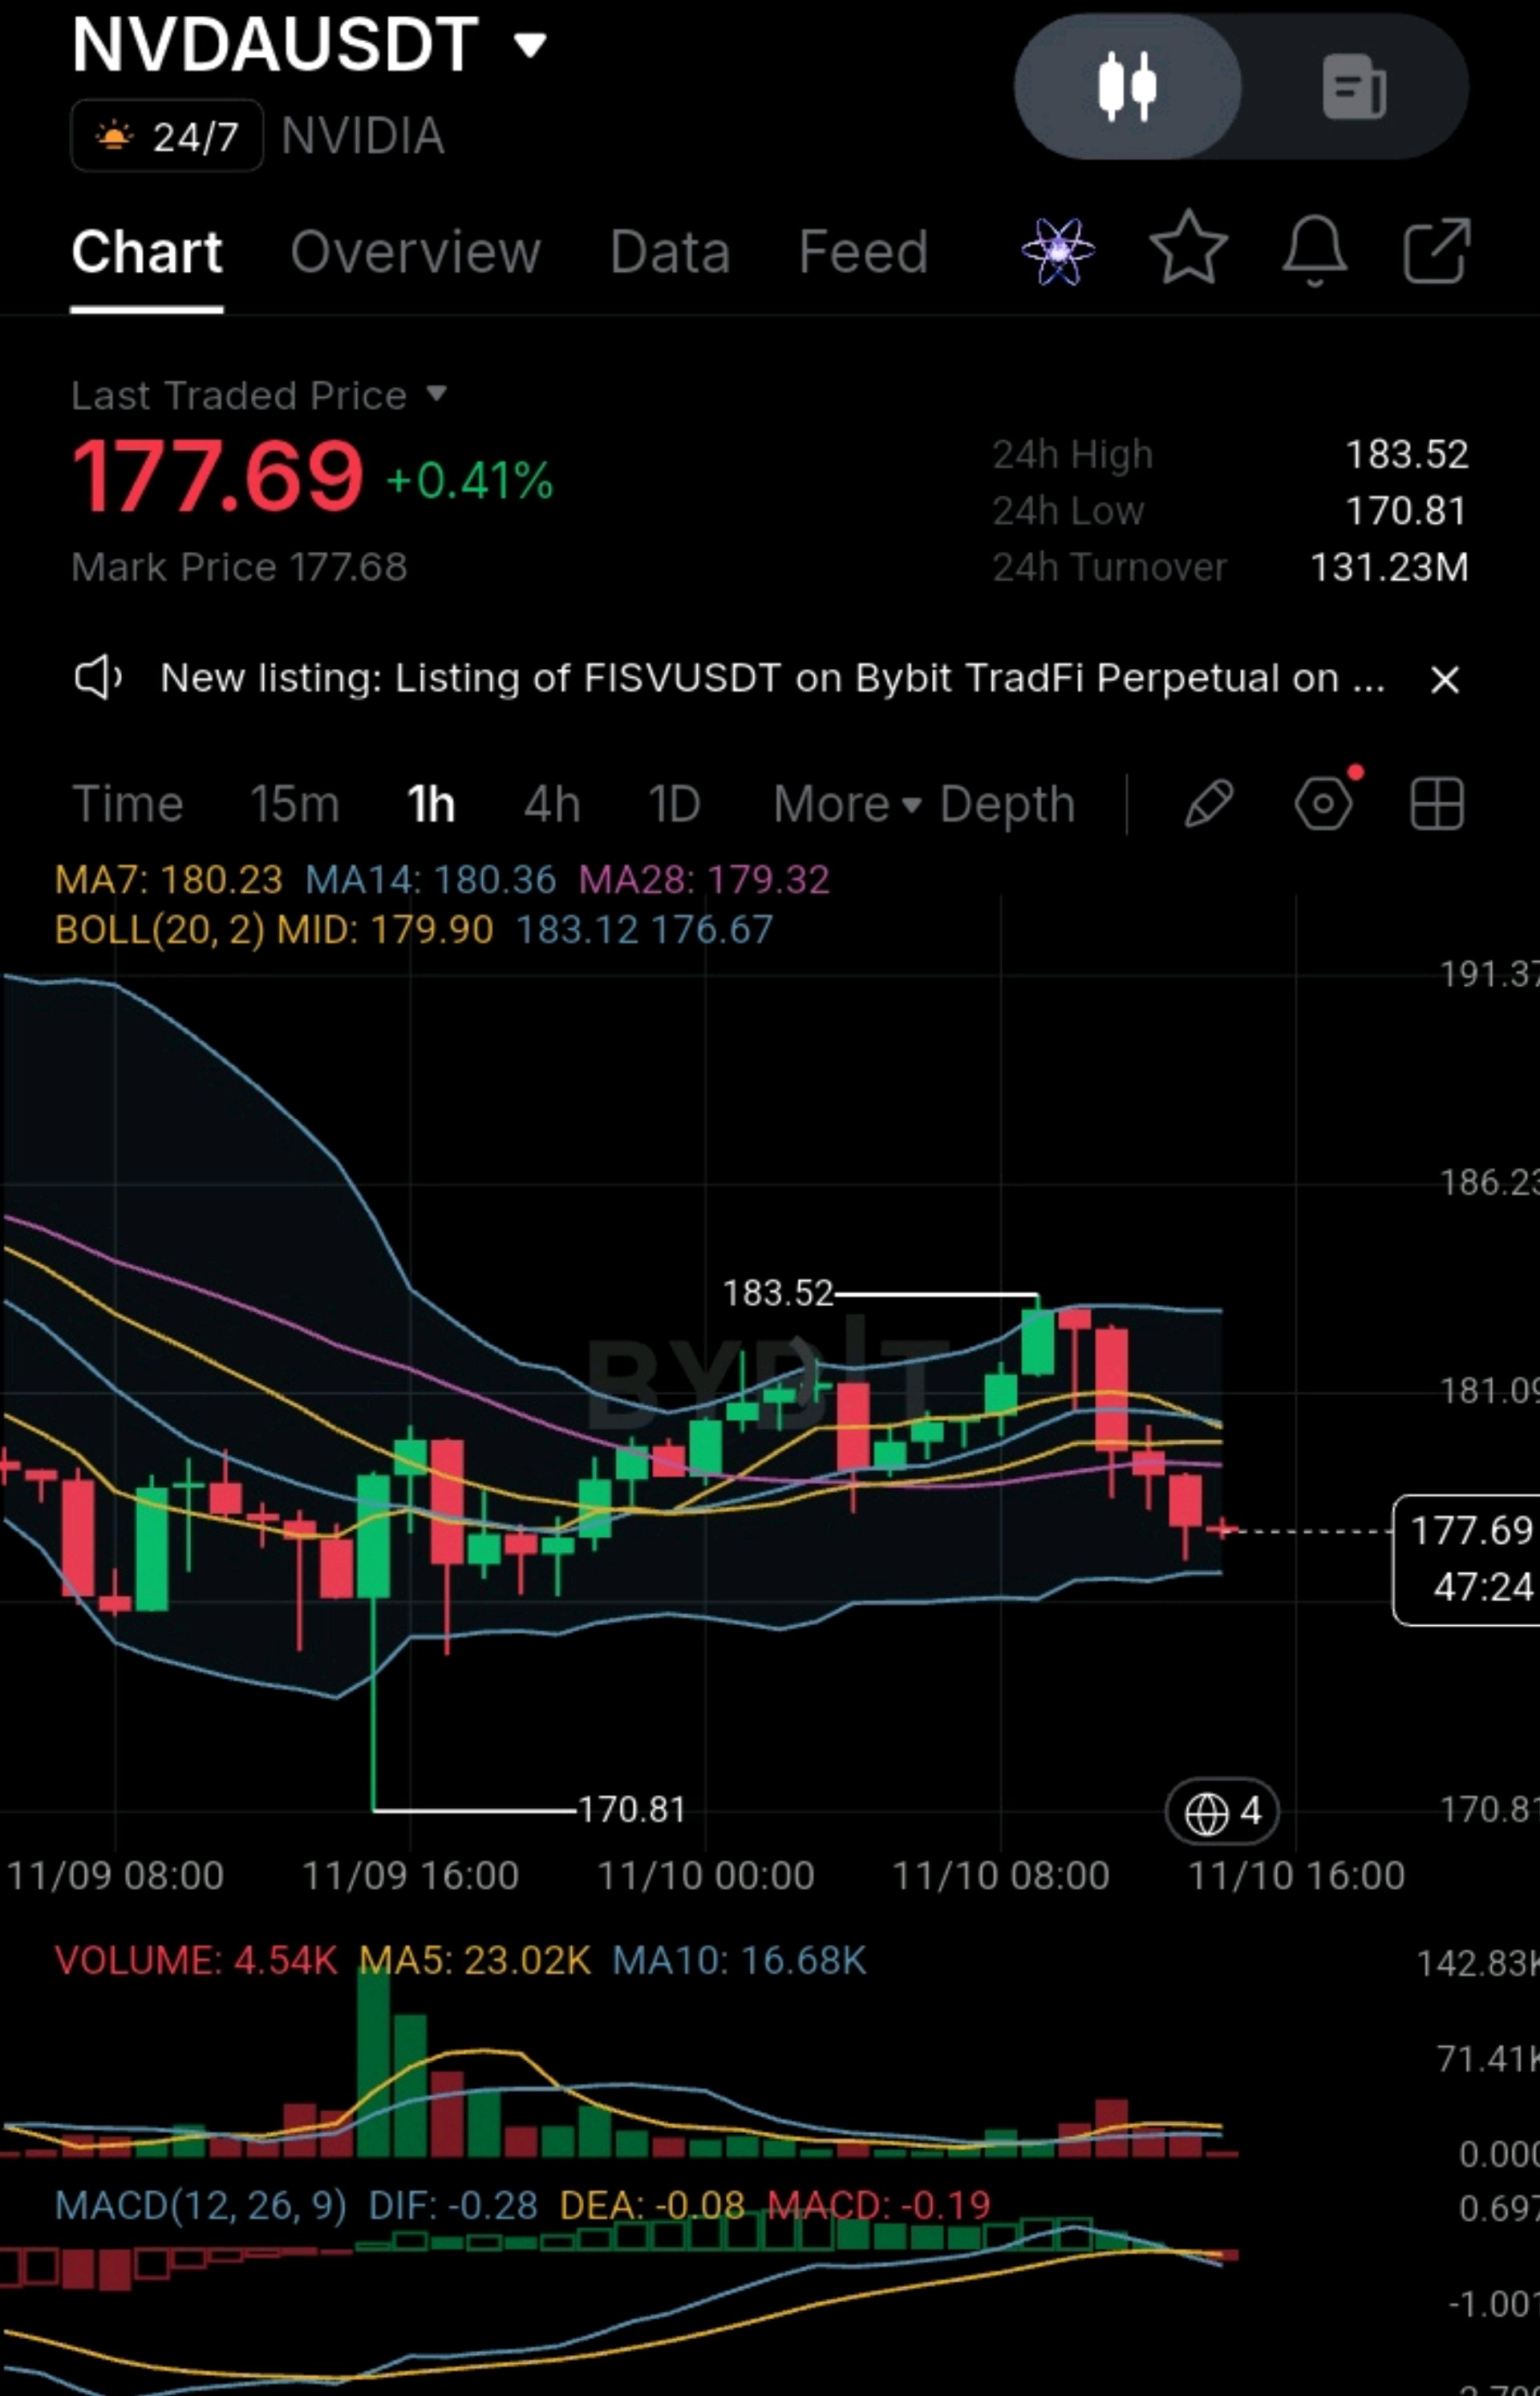
#IMPACTbyTrade #NovUSCPIWatch #USPayrollsAndRateDecisionsDriveMacroWeek #WSOT2026 #BybitAIEvolving NVDA Slips to $177.7: Can Bulls Reclaim $180? NVDAUSDT was rejected at $183.52 and has drifted lower, but the next support zone will show whether this is more than a short-term dip. On my 1H Bybit chart, NVDAUSDT is trading around $177.69, up 0.41% on the day. Price has slipped below the MA7, MA14 and MA28 cluster near $180, while the MACD has turned negative (DIF -0.28 below DEA -0.08, histogram -0.19). Sellers are showing up after the rejection at the upper Bollinger Band. But there's a catch. NVDA is now sitting just above $176.67, the lower Bollinger Band, and volume is thin (4.54K vs a MA5 of 23.02K), so neither side has much conviction. Bears may still push lower, but a bounce or consolidation here would not be surprising. The current candle is also still open, so judge it at the close. Here are the levels on my radar: $183.52: 24h high and major resistance. A solid 1H close above it would flip the bias bullish. $180.36-$179.90: MA14 and the Bollinger midline. Price needs to reclaim this zone to repair the structure. $176.67: Lower Bollinger Band and the nearest support to watch. $173.00: Next support area if $176.67 gives way (an estimate, not a hard level). $170.81: 24h low. Losing this level would weaken the recovery setup. The wider market remains sensitive to AI demand, earnings expectations (the next report is typically in late November, so check the date), China export rules and tariffs, so one green candle isn't enough to confirm a trend reversal. This is also a 24/7 perpetual tracking the stock, so it can gap when the US market opens. My approach is simple: watch how price reacts at $176.67 and $180.36 rather than assume the next move has already happened. Would you wait for a reclaim of $180.36, or are you expecting a break below $176.67? Not financial advice. DYOR. $NVDAXUSDT
CEO's private life
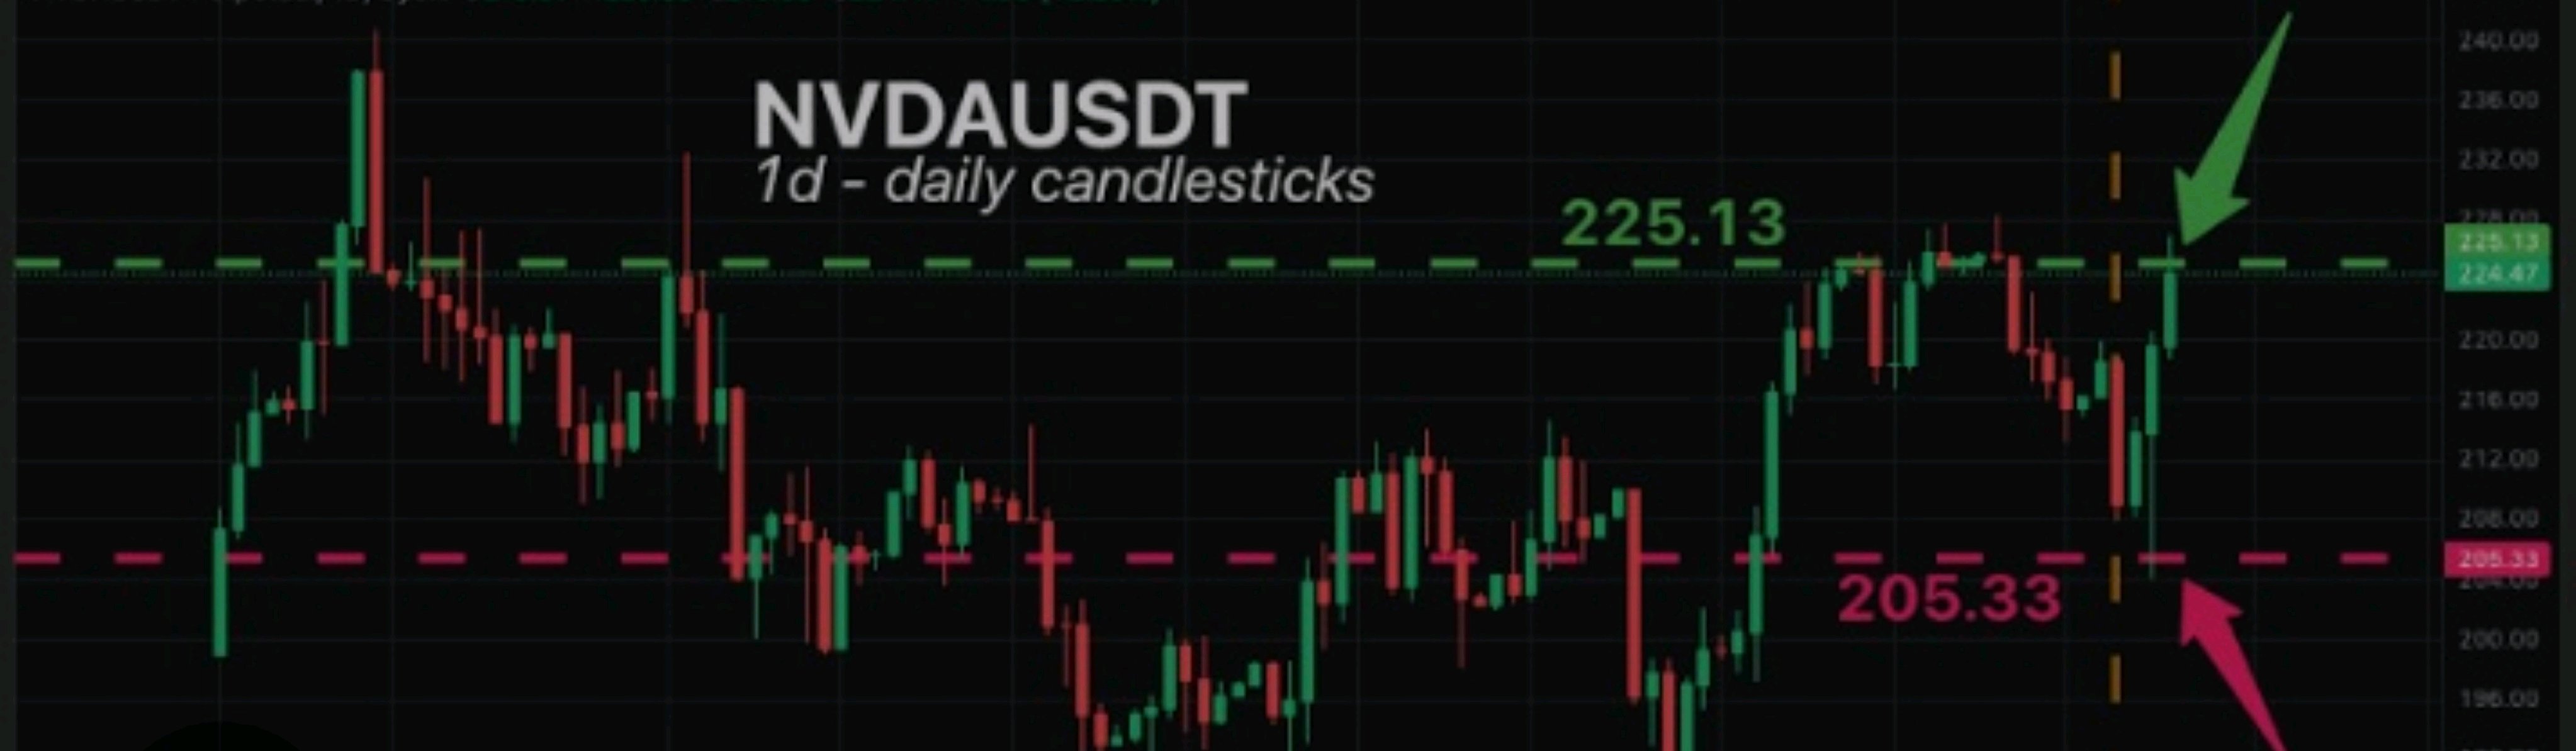
#ByXIMPACT Even then, a CEO's private life rarely moves a stock like NVDA much unless it affects leadership, governance or filings. 📊 Read Through My Current Analysis of $NVDA (NVDAUSDT) It has been quietly sliding, and the chart needs a reaction. NVDAUSDT is trading around 177.69 after being rejected at 183.52, right at the upper Bollinger Band (183.12). The 24h range is 170.81 to 183.52, and price has repeatedly interacted with the 180 region. That makes this area pretty important to me. Price is now below the MA7 (180.23), MA14 (180.36), MA28 (179.32) and the BB midline (179.90), so I'm less interested in calling every small bounce a reversal. Actually, for me, the first thing I'd want to see is the 176.67 area (lower Bollinger Band) hold properly. If buyers defend it and push NVDA back above 179.90-180.36, the chart could start building a short-term recovery. From there, 183.52 becomes the next area I'd pay attention to. But if 176.67 finally cracks and sellers manage to close below it, the market could revisit the 173 area, then the 170.81 low. Momentum and volume: MACD is negative and rolling over (DIF -0.28 below DEA -0.08, histogram -0.19). Volume is thin (4.54K vs a MA5 of 23.02K), so there's little conviction either way. The current candle is still open (about 47 minutes left), so judge it at the close. Fundamentals: I'm not factoring in any personal-life headlines about the CEO, since I couldn't find credible reporting on them. What actually moves NVDA is AI demand and data-center spending, earnings (the next report is typically in late November, so check the date), China export rules, tariffs, and the wider Nasdaq tone. This is also a 24/7 perpetual that tracks the stock, so it can gap when the US market opens. 🎯 Check my target: Recovery: 179.90 → 180.36 → 183.52 Breakdown: 176.67 → 173.00 → 170.81 Trade plan (illustrative): Sell-the-bounce: enter at 179.50-180.00 on a rejection, with a stop at 181.40 (above the MA14 and BB mid). Targets are 176.67 (about 1.9R) and 173.50 (about 3.8R). Bullish alternative: an hourly close above 180.40 on rising volume, with a stop at 178.50 and a target of 183.52 (about 1.5R). Risk only 1-2% of your account, take partial profit at the first target, and keep leverage low. I'm leaning cautiously bearish until NVDA proves otherwise. The averages are overhead and momentum is negative, and I'd rather see the chart reclaim 180.36 before changing that view. 176.67 vs 180.36 is where the next argument between buyers and sellers gets interesting This is technical analysis for discussion, not financial advice. The levels are illustrative, so size your risk and always use a stop. If you tell me whether you're long or short, I can tailor the plan to your entry and stop, Tell me in the comment. $NVDAXUSDT

$CPOOL And $NVDA
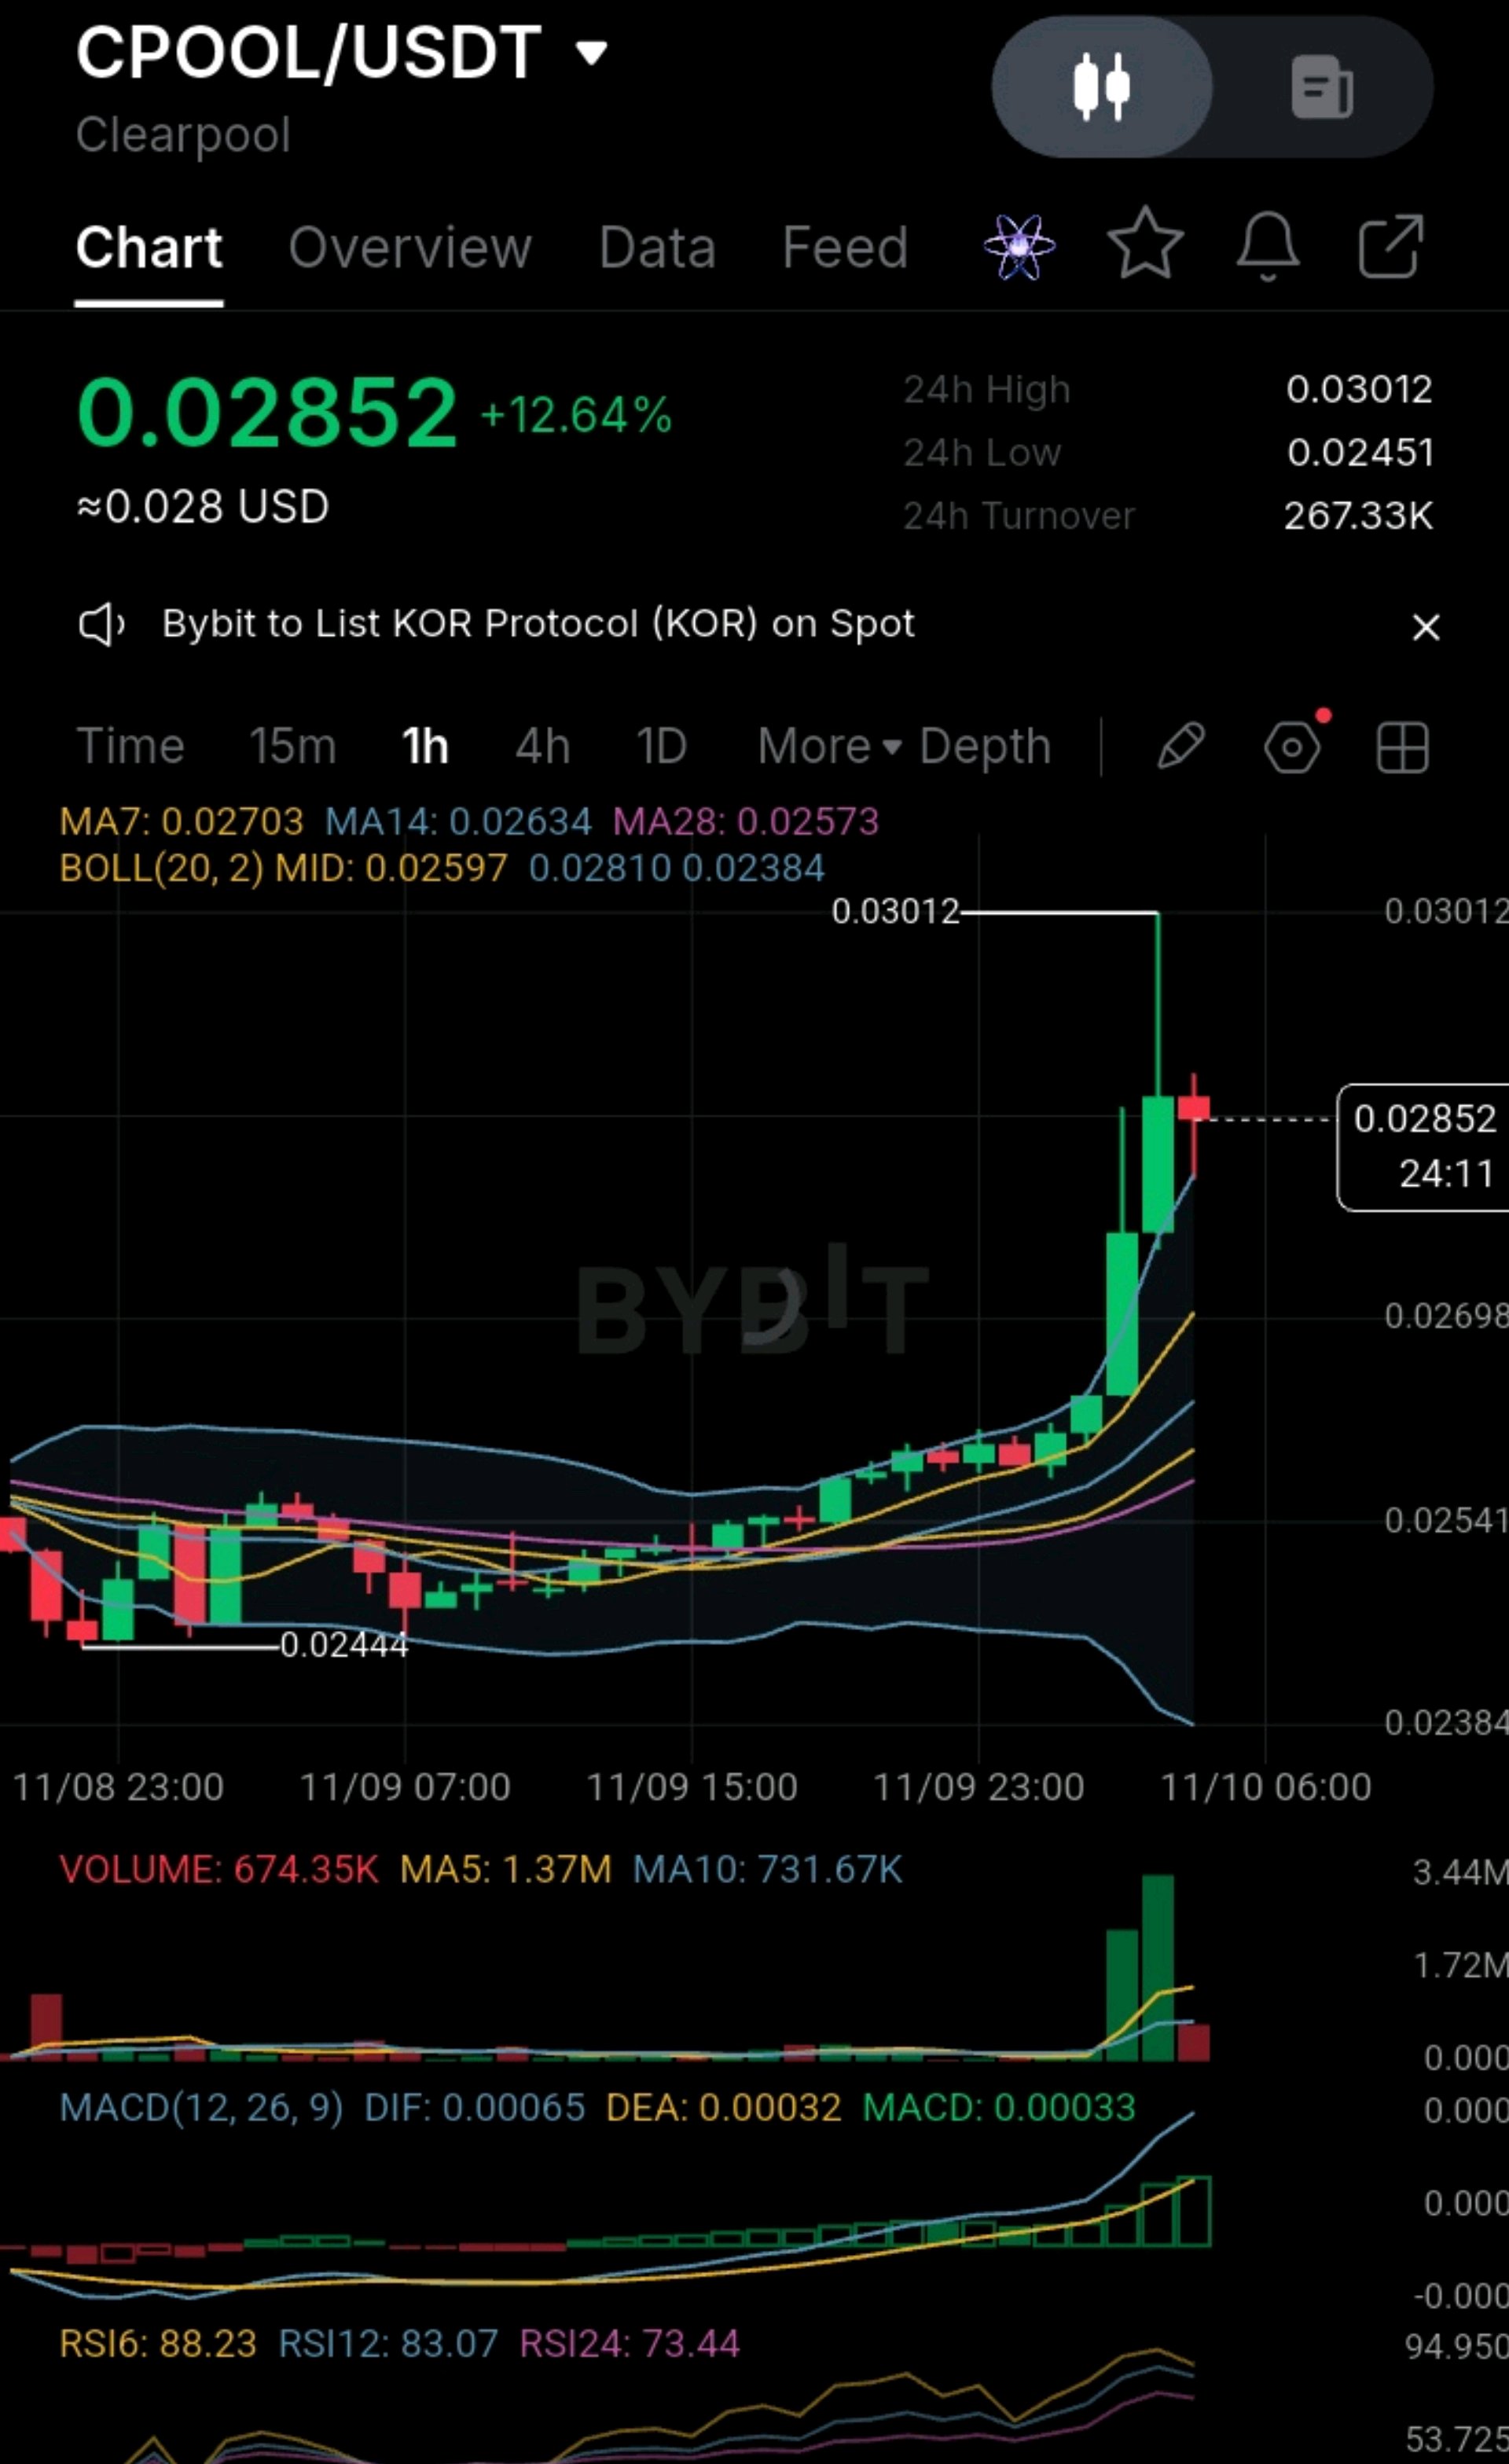
#IMPACTbyTrade #NovUSCPIWatch #USPayrollsAndRateDecisionsDriveMacroWeek #WSOTPicktoEarn10U #OilVolatilityTracksIranPeaceTalks This One Is For $CPOOL And $NVDA 😎 $CPOOL vs $NVDA 🚀📉 We can't keep pretending the small caps and the stock perps don't deserve attention whenever the market starts waking up 😂 The interesting part is how different these two feel on the 1-hour chart. One is a tiny DeFi token that just went vertical. The other is a trillion-dollar stock perp that is drifting lower. ⚡ MARKET STRENGTH AND WEAKNESS $CPOOL (0.02852, +12.64%) ✅ Strength: it broke out of a long base on two big volume candles, and MACD is positive and widening (DIF 0.00065 vs DEA 0.00032). Price is above MA7 (0.02703), MA14 (0.02634) and MA28 (0.02573). ⚠️ Weakness: it is heavily overheated. RSI6 is 88.23, RSI12 83.07 and RSI24 73.44, and price is above the upper Bollinger Band (0.02810). The 0.03012 high was rejected with a long wick, and volume is fading on the red candle (674.35K vs a MA5 of 1.37M). ⚠️ Weakness: it is very small and thin. Data sites show a market cap of roughly $28 million to $21 million, and 24h turnover on your chart is only 267.33K. $NVDA (177.69, +0.41%) ✅ Strength: it has deep liquidity, with about 131.23M in 24h turnover, roughly 490x CPOOL's. It is a mega-cap with an AI-demand story, and it trades 24/7 as a perp. ⚠️ Weakness: price sits below MA7 (180.23), MA14 (180.36), MA28 (179.32) and the BB midline (179.90). MACD is negative (DIF -0.28 below DEA -0.08, histogram -0.19), and it was rejected at 183.52, right at the upper band (183.12). Volume is dry (4.54K vs a MA5 of 23.02K). 🐋 WHALE POSITIONING CPOOL: I couldn't find reliable wallet-level data. On a token this small, one large wallet can move the price either way. The two big green volume bars at the breakout are consistent with large participants stepping in, but volume can't tell you whether they were buying or selling, and the fade since then looks like profit-taking. $NVDAXUSDT $CPOOLUSDT


BR/USDT
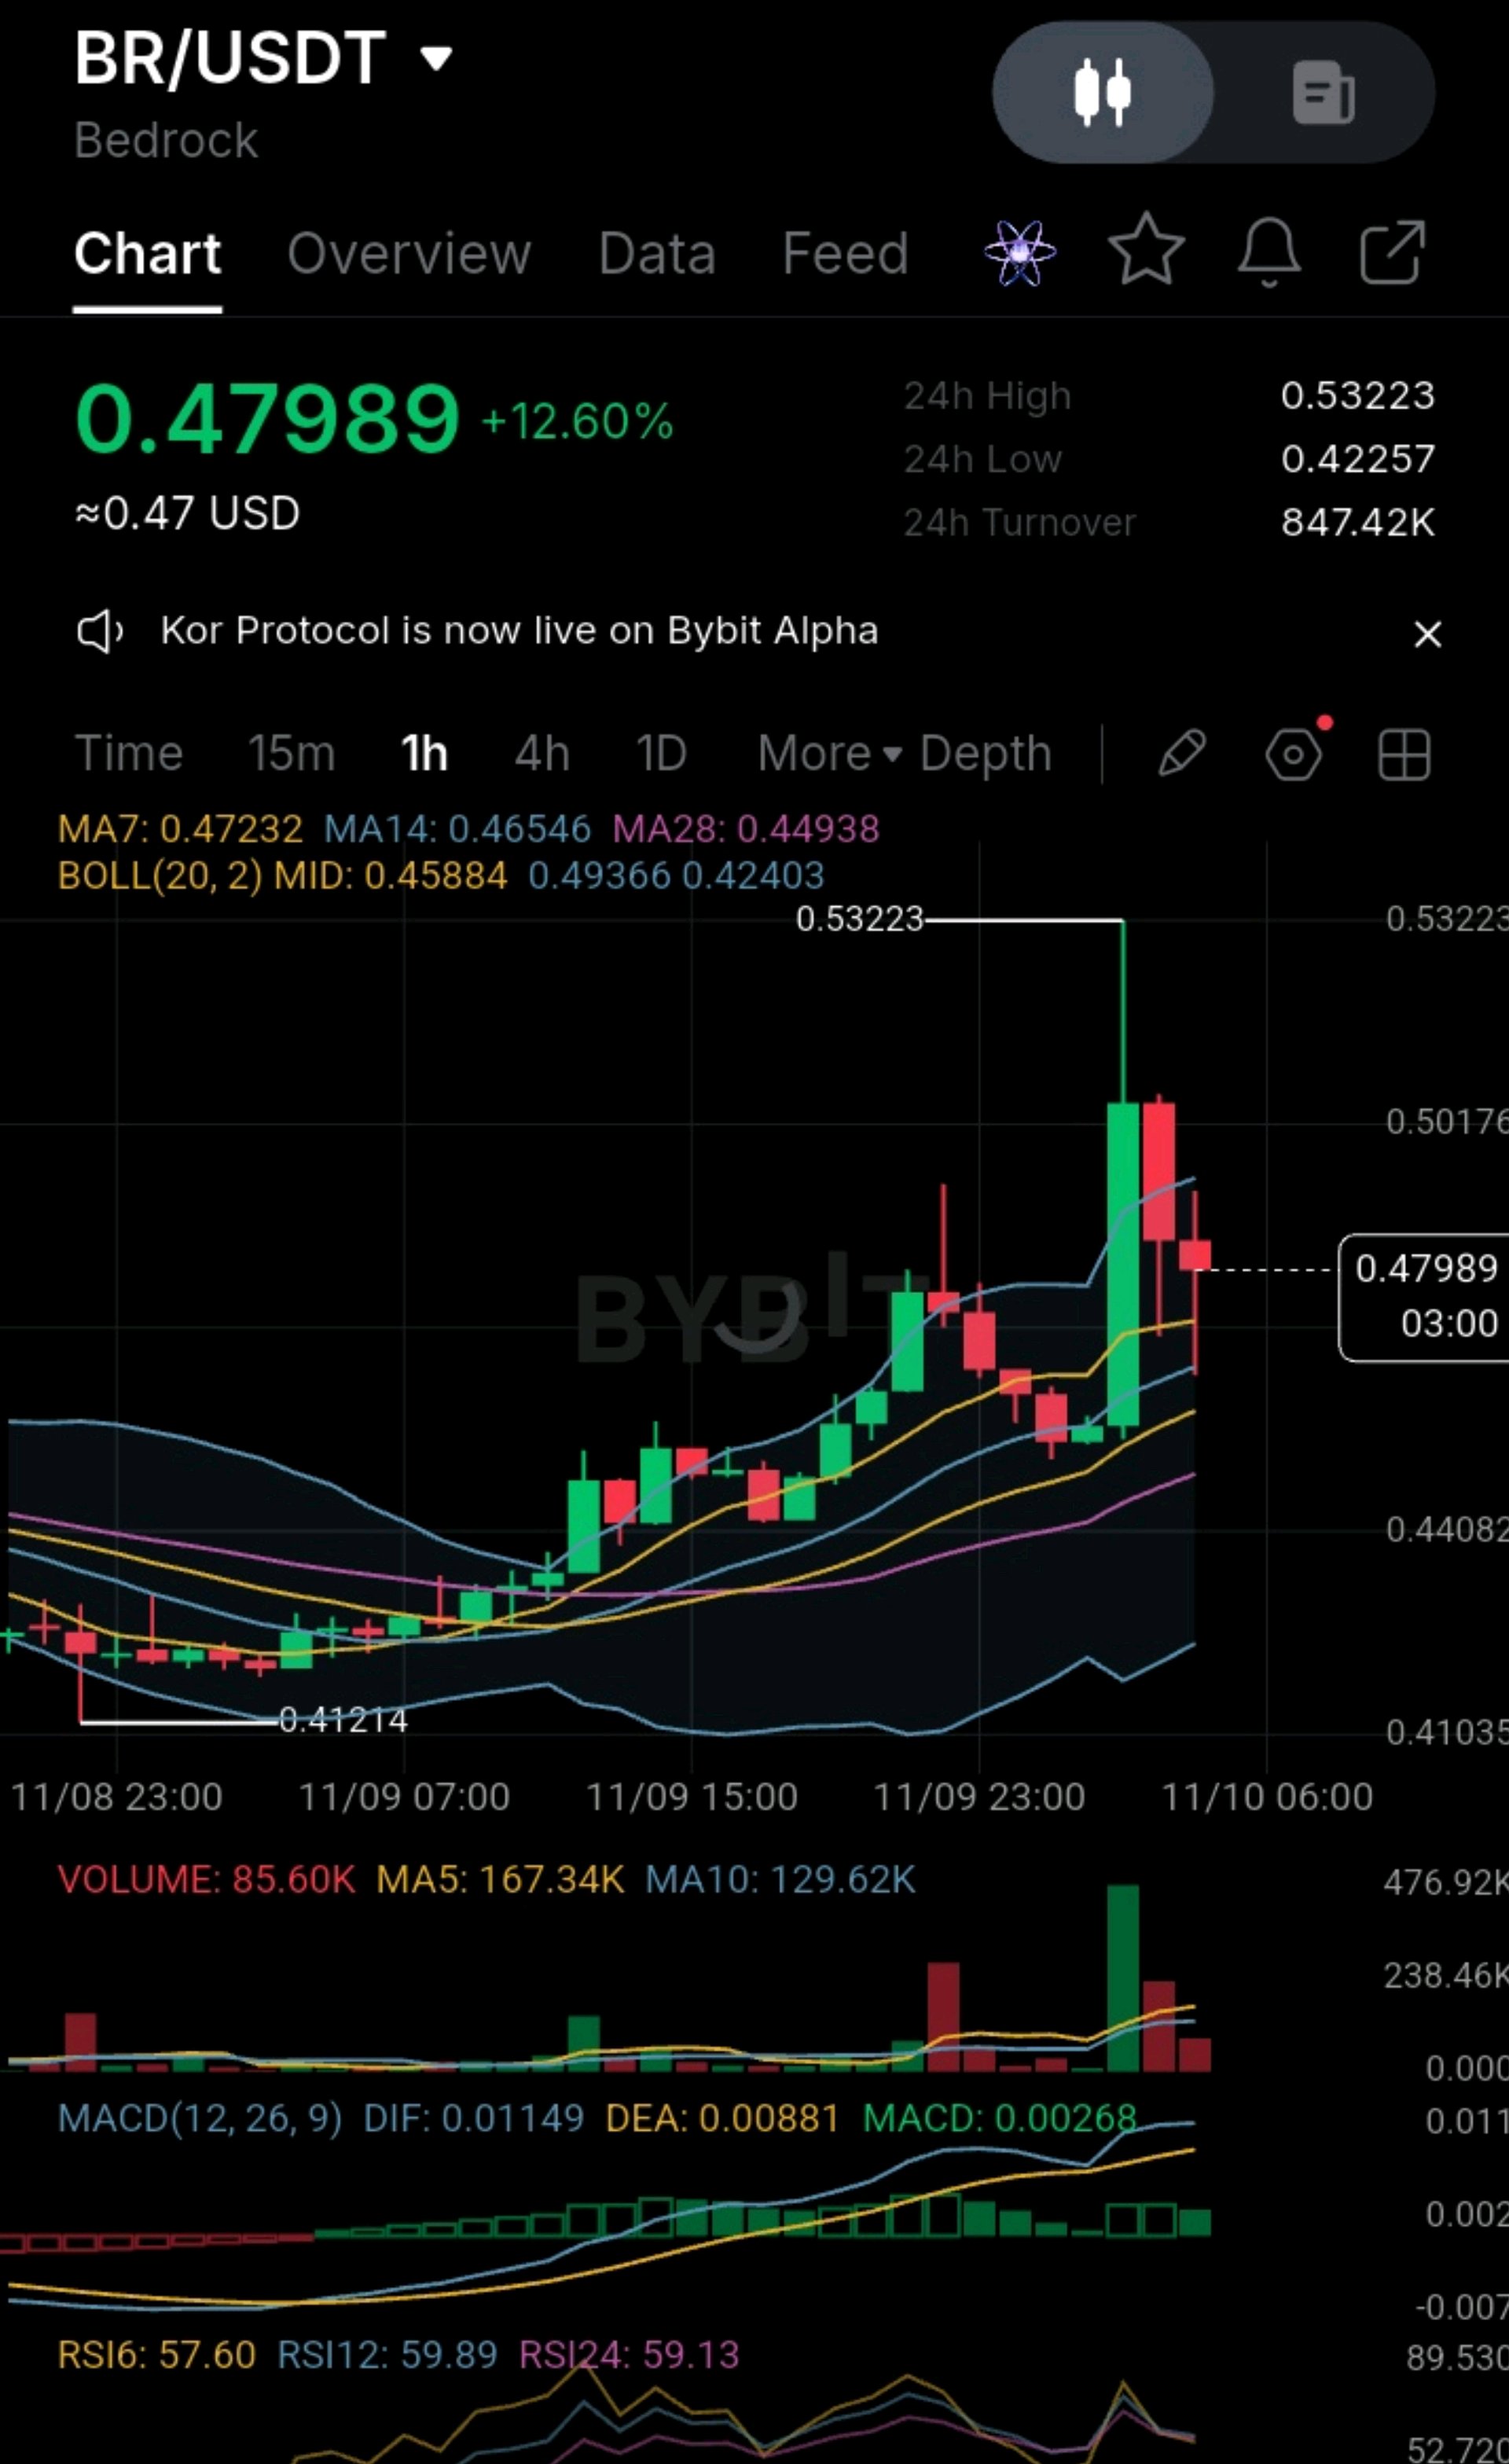
#ByXIMPACT #NovUSCPIWatch #WSOTPicktoEarn10U #USPayrollsAndRateDecisionsDriveMacroWeek #OilVolatilityTracksIranPeaceTalks This is an interesting chart. BR/USDT (Bedrock) is showing stronger bullish momentum, but there are signs of short-term profit-taking after a sharp price increase. Let's break it down. 1. Current market position Current price $0.47989 24h change +12.60% 24hhigh $0.53223 24h low $0.42257 24h turnover $847.42K Bedrock has rallied significantly from $0.41214 to $0.53223 before pulling back. That is a substantial move. 2. Technical indicators MA7, 0.47232 (Bullish) MA14, 0.46546 (Bullish) MA28, 0.44938 (Bullish) RSI6, 57.60 (Neutral-bullish) RSI12, 59.89 (Bullish) RSI24, 59.13(Bullish) MACD, +0.00268 (Bullish) What I find interesting A. Moving averages The price is above all three moving averages. Additionally: MA7 > MA14. MA14 > MA28. This is a bullish moving-average alignment. B. MACD DIF: 0.01149 DEA: 0.00881 MACD histogram: +0.00268. The MACD remains positive, suggesting the broader short-term momentum is still bullish. C. RSI RSI readings are between 57 and 60. This is encouraging because the market has not entered extreme overbought territory despite its 12.60% gain. 3. Important price levels These are the levels I would monitor. $0.53223, Major immediate resistance $0.50200, Intermediate resistance $0.49366, Upper Bollinger Band $0.47989, Current price $0.47232, First support $0.46546, Second support $0.45884, Bollinger middle line $0.44938, MA28 support 4. Something important: Volume Look at the volume during the big green candle. There was a significant increase in buying volume when Bedrock pushed towards $0.53223. However, subsequent candles show reduced volume. This could mean: Early buyers are taking profits. Buying pressure is cooling. The market is consolidating before another move. We cannot establish institutional accumulation or market-maker activity from this chart alone. 5. My trading outlook Short-term outlook: Bullish, but with pullback risk. I see two possible scenarios: Scenario A: Bullish continuation BR holds $0.472. Buyers return with stronger volume. Price breaks $0.49366. A convincing breakout could bring $0.502 and eventually $0.53223 into focus. Scenario B: Deeper correction BR loses $0.472. Price tests $0.465. Further weakness could bring $0.459 into play. I would avoid chasing the current price after its sharp rally. 6. My verdict BR has three encouraging characteristics: Bullish moving-average alignment. Positive MACD. RSI still has room before reaching overbought territory. However, declining volume after the spike means I want confirmation before considering an entry. One thing I want to investigate further There is an important distinction between buying a coin that has already pumped and identifying one that is preparing for another major move. I would investigate Bedrock's: Institutional backing and investors. Project fundamentals and utility. Tokenomics and circulating supply. Exchange listings and liquidity. Upcoming catalysts and potential price drivers. My question: Are you considering buying BR, or are you monitoring it for a potential major breakout? $BRUSDT @RoYoK
CPOOL just went vertical
#IMPACTbyTrade #NovUSCPIWatch #OilVolatilityTracksIranPeaceTalks #BybitAIEvolving #BOERateDecision CPOOL just went vertical out of a long base and is now stretched far above its averages. The next few hourly closes decide whether this is a first leg or a blow-off spike. Look at this 1-hour chart. CPOOL spent hours drifting around 0.0245-0.026, then launched through the Bollinger upper band on two big volume candles to a high of 0.03012. That candle was rejected with a long upper wick, and price is now 0.02852, up 12.64% on the day. The Power: Price is above MA7 (0.02703), MA14 (0.02634) and MA28 (0.02573), and the MAs are turning up in bullish order. MACD is positive and widening (DIF 0.00065 vs DEA 0.00032, histogram +0.00033). The breakout came on real volume, with the two big green bars standing far above the earlier flat volume. The Exhaustion Risk: RSI is overheated: RSI6 is 88.23, RSI12 83.07 and RSI24 73.44. That's deep in overbought territory on every period. Price is trading above the upper Bollinger Band (0.02810) and about 5.5% above the MA7. Moves this far from the averages usually snap back or at least consolidate. The 0.03012 high was rejected with a long wick, and the current candle is red. It has about 24 minutes left, so judge it at the close. Volume is fading on the red candle (674.35K vs a MA5 of 1.37M), so buyers are stepping back. Turnover is thin (267.33K), so spikes can reverse fast. Key levels: Resistance: 0.03012 (24h high), then roughly 0.0310 Support: 0.02810 (upper band), 0.02703 (MA7), 0.02634 (MA14), 0.02597 (BB mid), 0.02573 (MA28), then the 0.02444 base Trade Plan (illustrative): Preferred entry: a pullback into 0.0270-0.0274 (MA7 area), ideally with a bounce candle. Stop loss: 0.02580, below the BB mid and MA28. A closing break below invalidates the setup. Target 1: 0.02900, about 1.3R from a 0.02720 entry. Target 2: 0.03012 (24h high), about 2.1R. Target 3: 0.03150, an extension estimate, not a hard level, about 3R. Breakout alternative: an hourly close above 0.03012 on rising volume, with a stop under 0.02850 and smaller size, since the risk/reward is much worse when chasing. Position size: risk only 1-2% of your account on the stop distance. Take partial profit at Target 1 and move the stop to breakeven. If it goes wrong: below 0.0258, expect a slide to about 0.0250 and then the 0.02444 base, where the whole move would be given back. Verdict: the breakout is real, but with RSI6 at 88, this is a poor place to buy. I'd wait for a pullback to the MA7/MA14 zone or a clean volume breakout above 0.03012, and either way set the stop first. My Execution Strategy: I don't buy vertical candles. I let the market cool off, then take the entry with a defined stop. Call to action: Are you buying the dip to 0.0272, waiting for a confirmed break of 0.0301, or staying out until RSI cools? Drop your plan below 👇 and set alerts at 0.03012 and 0.02580 so you don't miss either move. This is technical analysis for discussion, not financial advice. $CPOOLUSDT @BitRase @RoYoK