ParvezMayar
3491Like0Shares2692Fans7675Follow
Crypto enthusiast | Exploring, sharing, and earning Let's grow together! 🤝|X @Next_GemHunter
Crypto enthusiast | Exploring, sharing, and earning Let's grow together! 🤝|X @Next_GemHunter
🚨 $BTC CRASHES TO $61K... WHAT'S NEXT?
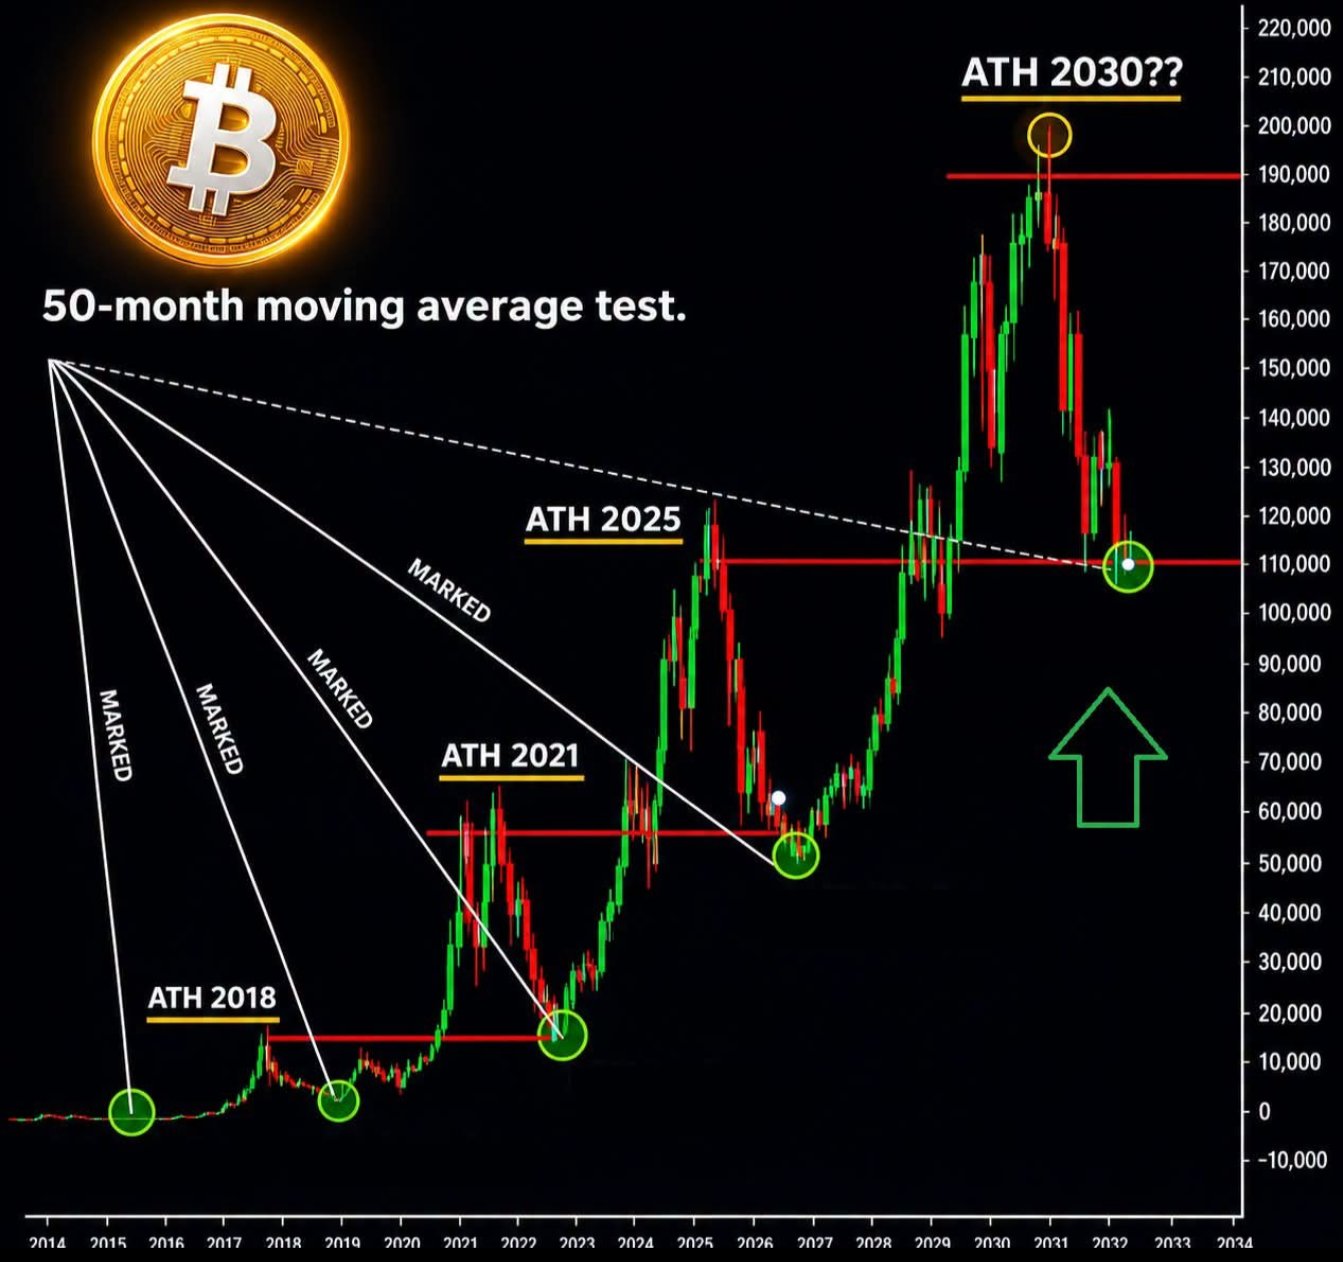
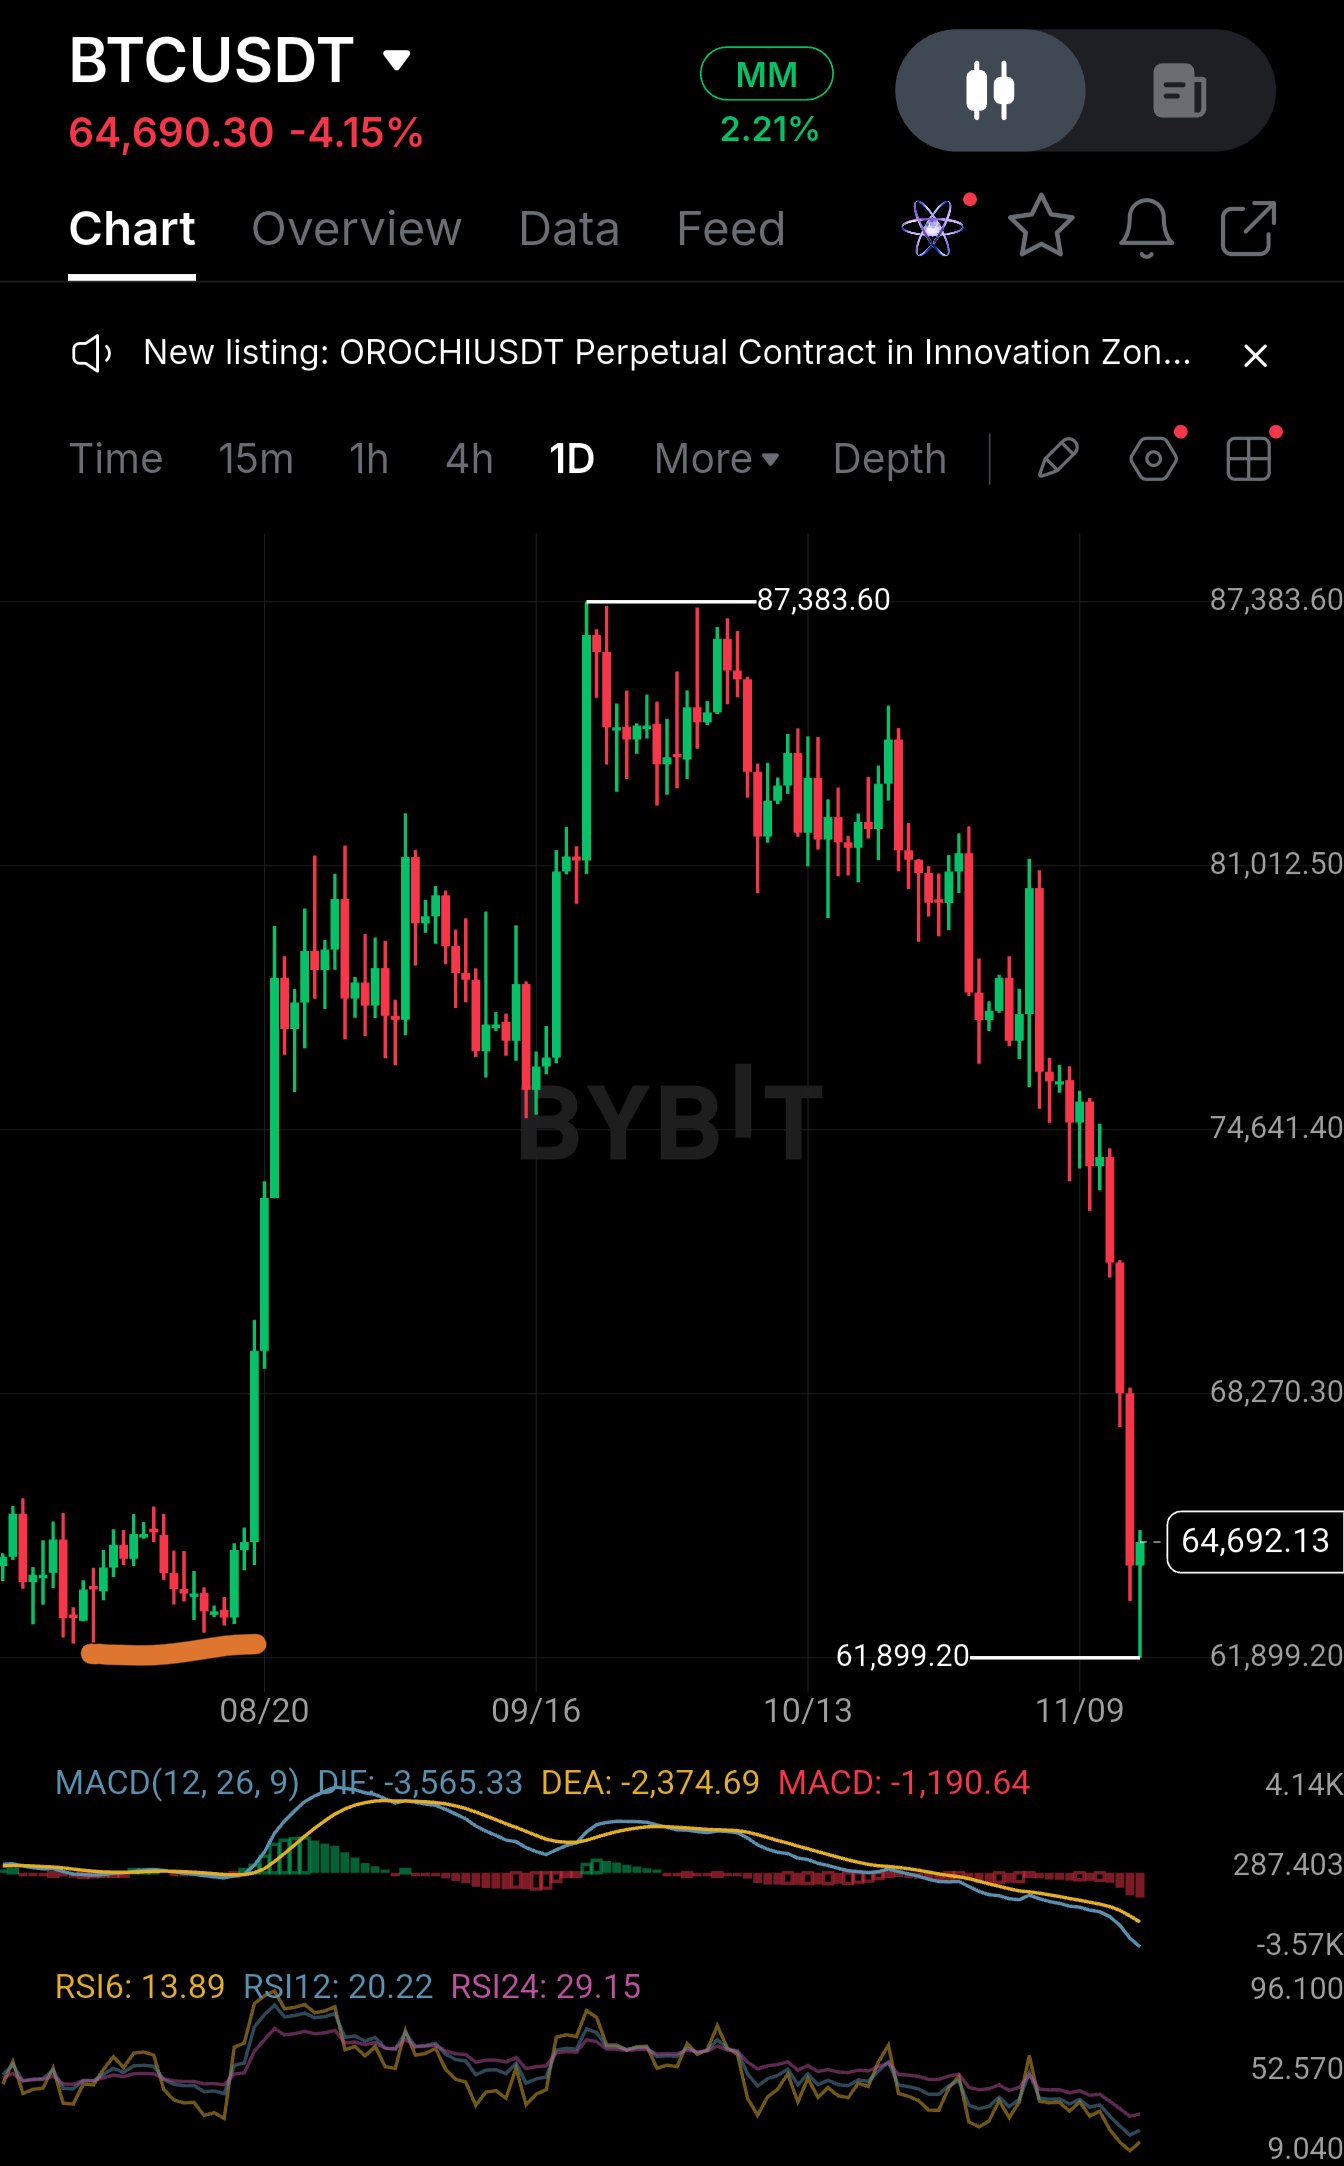
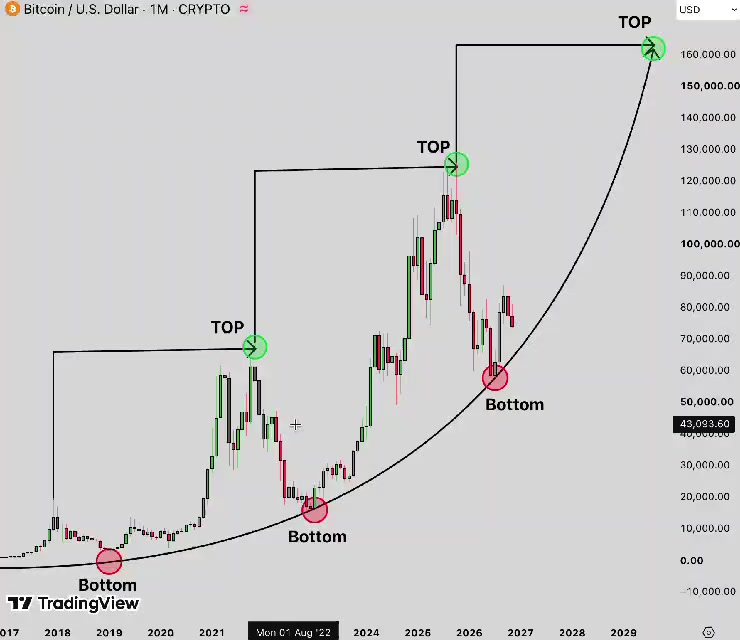
Buddies... Bitcoin just touched $61,899 before recovering toward $64,775. That's almost 51% below its $126K ATH... and honestly, this correction is starting to create some serious long-term accumulation opportunities. 👀 But before calling the bottom, look at what's happening behind this crash. 1. INSTITUTIONAL SELLING IS GETTING WORSE U.S. spot $BTCUSDT ETFs reportedly recorded approximately $2.35 BILLION in net outflows over two weeks, including around $1.07B during November 9–13. BlackRock's IBIT alone reportedly saw another $143.5M in outflows on November 13. That's substantial selling pressure from an important institutional investment channel. And when ETF demand weakens while Bitcoin is already falling... the market becomes much more vulnerable. 2. BILLIONS IN LEVERAGED POSITIONS WIPED OUT Between November 3–12, approximately $1.61 BILLION in BTC positions were liquidated. Some of the biggest days: • Nov 4: $387M • Nov 5: $301M • Nov 8: $253M • Nov 12: $250M And November 13 brought another major market-wide liquidation wave, with reports approaching $1 BILLION in 24 hours. These are different reporting periods, not figures to add together. This is why the crash has been so aggressive... BTC breaks support, leveraged LONG positions get liquidated, forced selling pushes prices lower, and the next wave of liquidations begins. 3. BUT LOOK AT BITCOIN'S HISTORICAL CYCLES... The chart i've shared highlights Bitcoin's previous major corrections and its 50-month moving average. During earlier cycles, BTC experienced brutal drawdowns before eventually recovering and reaching new highs. Could we be approaching another important long-term accumulation zone? Possibly... but the chart's future ATH projections are speculative, and historical cycles don't guarantee another recovery. 4. MY NEXT $BTCUSDC TARGETS AND ACCUMULATION PLAN BTC is still trading below its major moving averages. On the daily chart: • MA7: $70,239 • MA14: $73,492 • MA28: $76,953 • MACD histogram: -1,185 That's a strongly bearish structure, despite the bounce from $61.9K. My downside levels: 🔻 $61,900 → $60,000 → $58,000 If $58K fails, i would start watching $55K. My upside recovery targets: 🎯 $65,900 → $67,550 → $70,500 Until BTC reclaims those levels, i would treat rallies cautiously. So what am i doing? Personally, i prefer gradual SPOT accumulation rather than trying to catch the bottom with leverage. My DCA plan: • 25% around $62K–$65K • 25% around $60K–$62K • 25% around $58K–$60K • 25% reserved for deeper discounts or a confirmed reversal Guys... institutional outflows and liquidation cascades are real risks, but a 51% correction also deserves attention from long-term investors. I am bearish on the short-term structure, but increasingly interested in accumulating BTC for the next cycle. The biggest question now... Will $61.9K hold, or are we getting one final flush toward $58K? 👀 #USInflationRunsHotAndRateHikeBetsRise
🚨 Bitcoin AT $67K... IS $60K COMING NEXT?
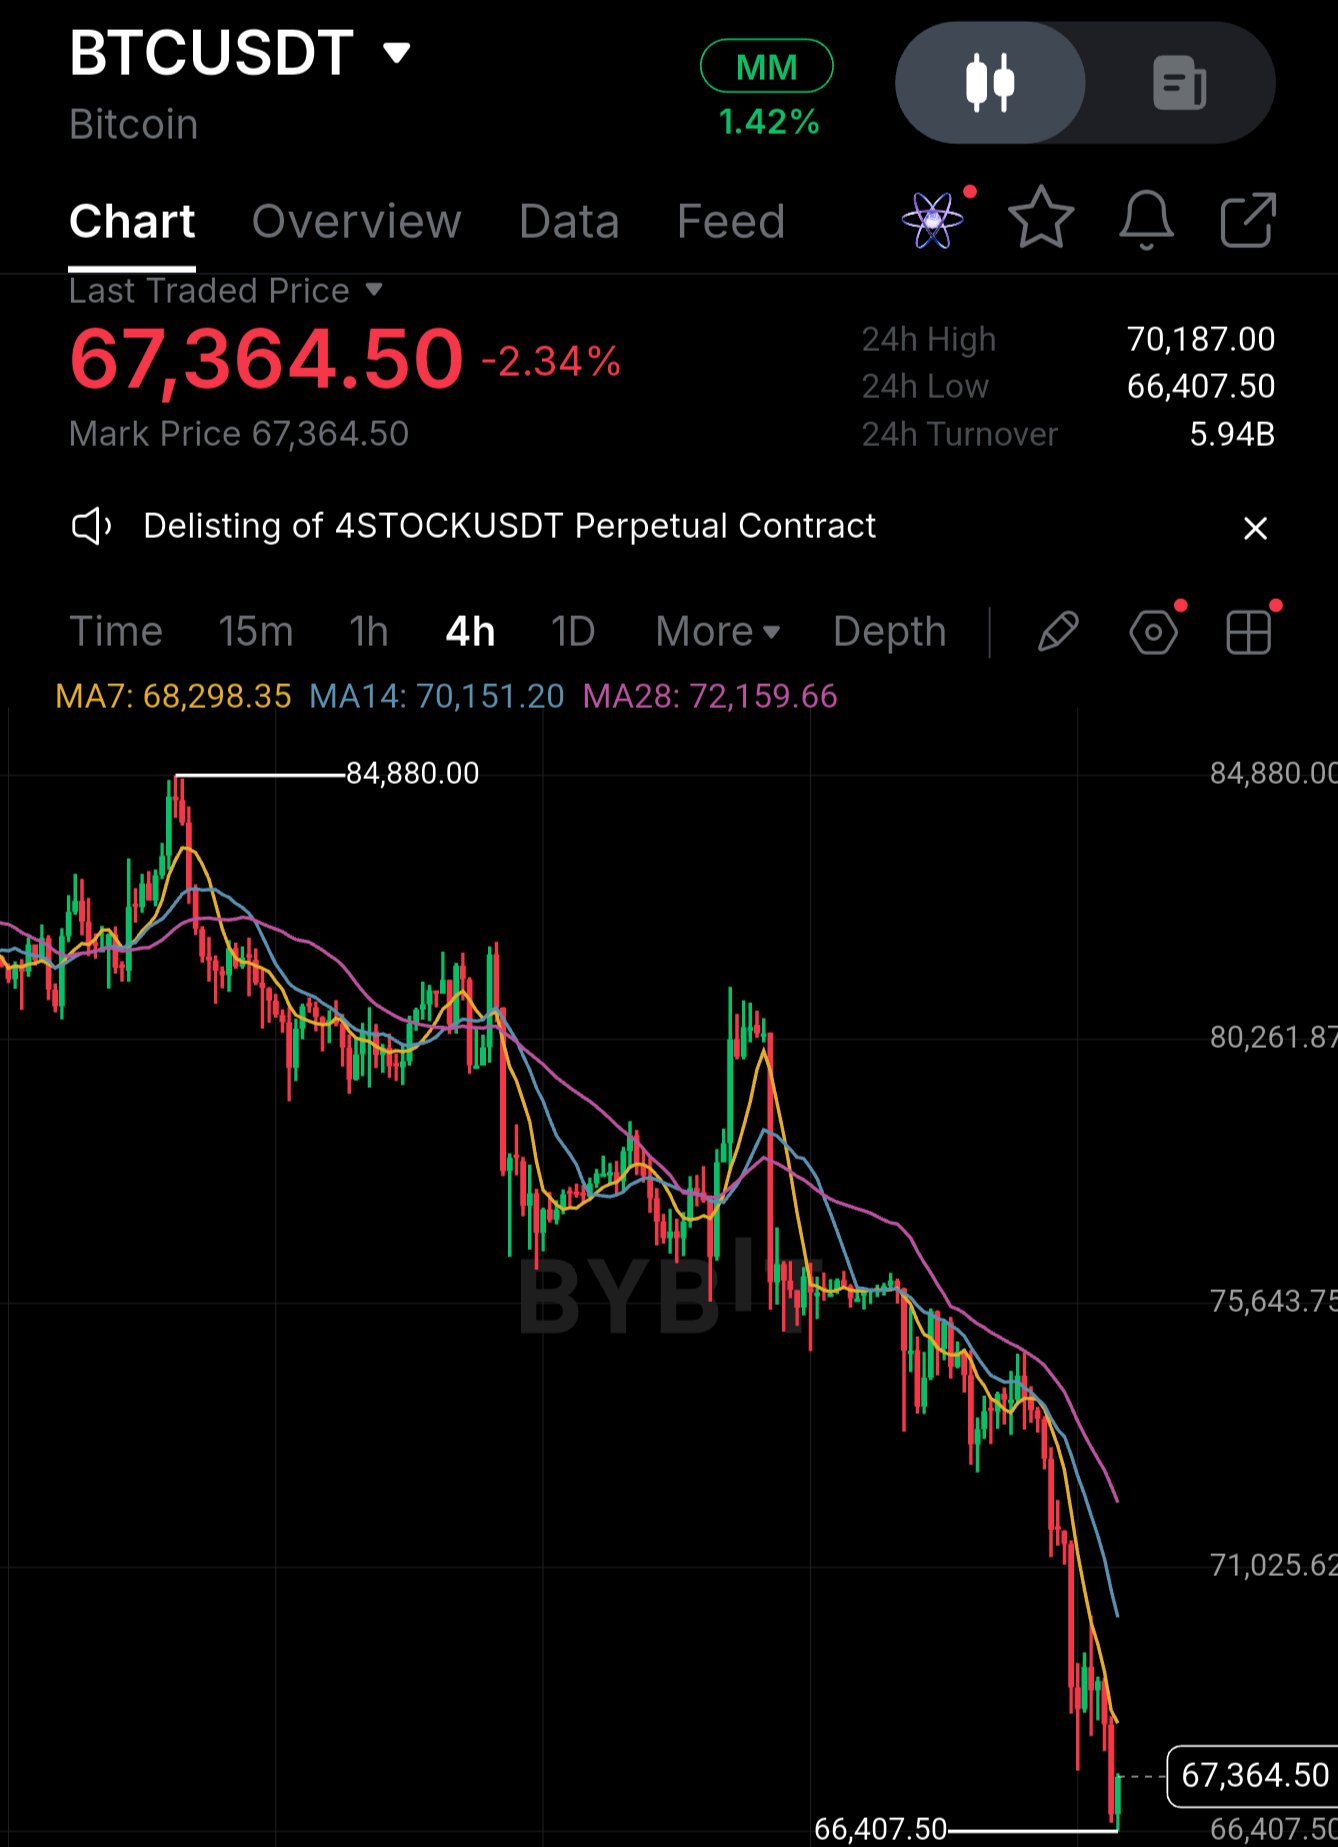
Guys... $BTCUSDT has now dropped to $67,384, and honestly this selloff is getting more aggressive than i expected. Just look at the numbers... BTC was trading around $87,383 in early October. Now it's down roughly 23% from that high, and almost 47% below its $126,198 ATH. The latest 24H low is $66,407, with approximately $5.94 BILLION in Bybit BTC futures turnover. And the bigger question is... where is all the money going? We have institutional ETF selling, leveraged traders getting wiped out, and investors becoming increasingly cautious about risk assets. But i am also wondering whether some capital is being redirected toward private AI investments and potential IPO opportunities, including companies like Anthropic. That's a hypothesis, NOT a confirmed explanation for Bitcoin's decline. Remember how traders sometimes connect major IPO anticipation with liquidity moving away from crypto? The problem is that timing alone doesn't prove money actually left Bitcoin to fund those investments. So i wouldn't blame an Anthropic IPO for this crash without evidence of those capital flows. What we can actually see is much more concerning... On the daily chart: • EMA7: $71,416 • EMA14: $73,840 • EMA28: $76,424 BTC is trading below all three. Daily RSI6 has collapsed to 12.35, RSI12 is 21.25, and MACD histogram is deeply negative around -869.60. That's extreme short-term weakness. And yes... RSI this low can produce a violent relief bounce. But it doesn't automatically mean the bottom is in. The 4H structure is still bearish too, with lower highs, lower lows and moving averages stacked above price. My downside prediction? If BTC loses $66,400 and fails to reclaim it, i would expect sellers to start testing $65,000. Below that, $62,000-$60,000 becomes a realistic deeper correction scenario. But i am NOT ignoring the upside. A reclaim of $68,400-$69,750 would be the first sign of short-term improvement. Above $70,150-$71,500, a stronger relief rally toward $72,500-$74,000 becomes possible. And with daily RSI already near 12, late shorts need to be careful. A sharp squeeze could happen before the broader downtrend changes. My accumulation strategy? Personally, i would rather build a SPOT position gradually than try to catch the exact bottom with leverage. I am watching $66K-$68K for an initial allocation, keeping capital available for $62K-$64K, and potentially $58K-$60K if the correction gets deeper. Not because those lower prices are guaranteed... but because i don't want to spend all my buying power before the market confirms stabilization. My view is still bearish short term, but increasingly interested in longer-term accumulation. The next major decision is whether buyers can defend $66.4K or whether Bitcoin begins moving toward $60K. And guys... a 47% drawdown from ATH is painful, but buying aggressively without a plan can make it much worse. I am watching for the next accumulation opportunity, not blindly calling the bottom. #BitcoinHitsTwoMonthLowAfterUSMidterms

🚨 $HYPE BELOW $70... BUYING OPPORTUNITY?
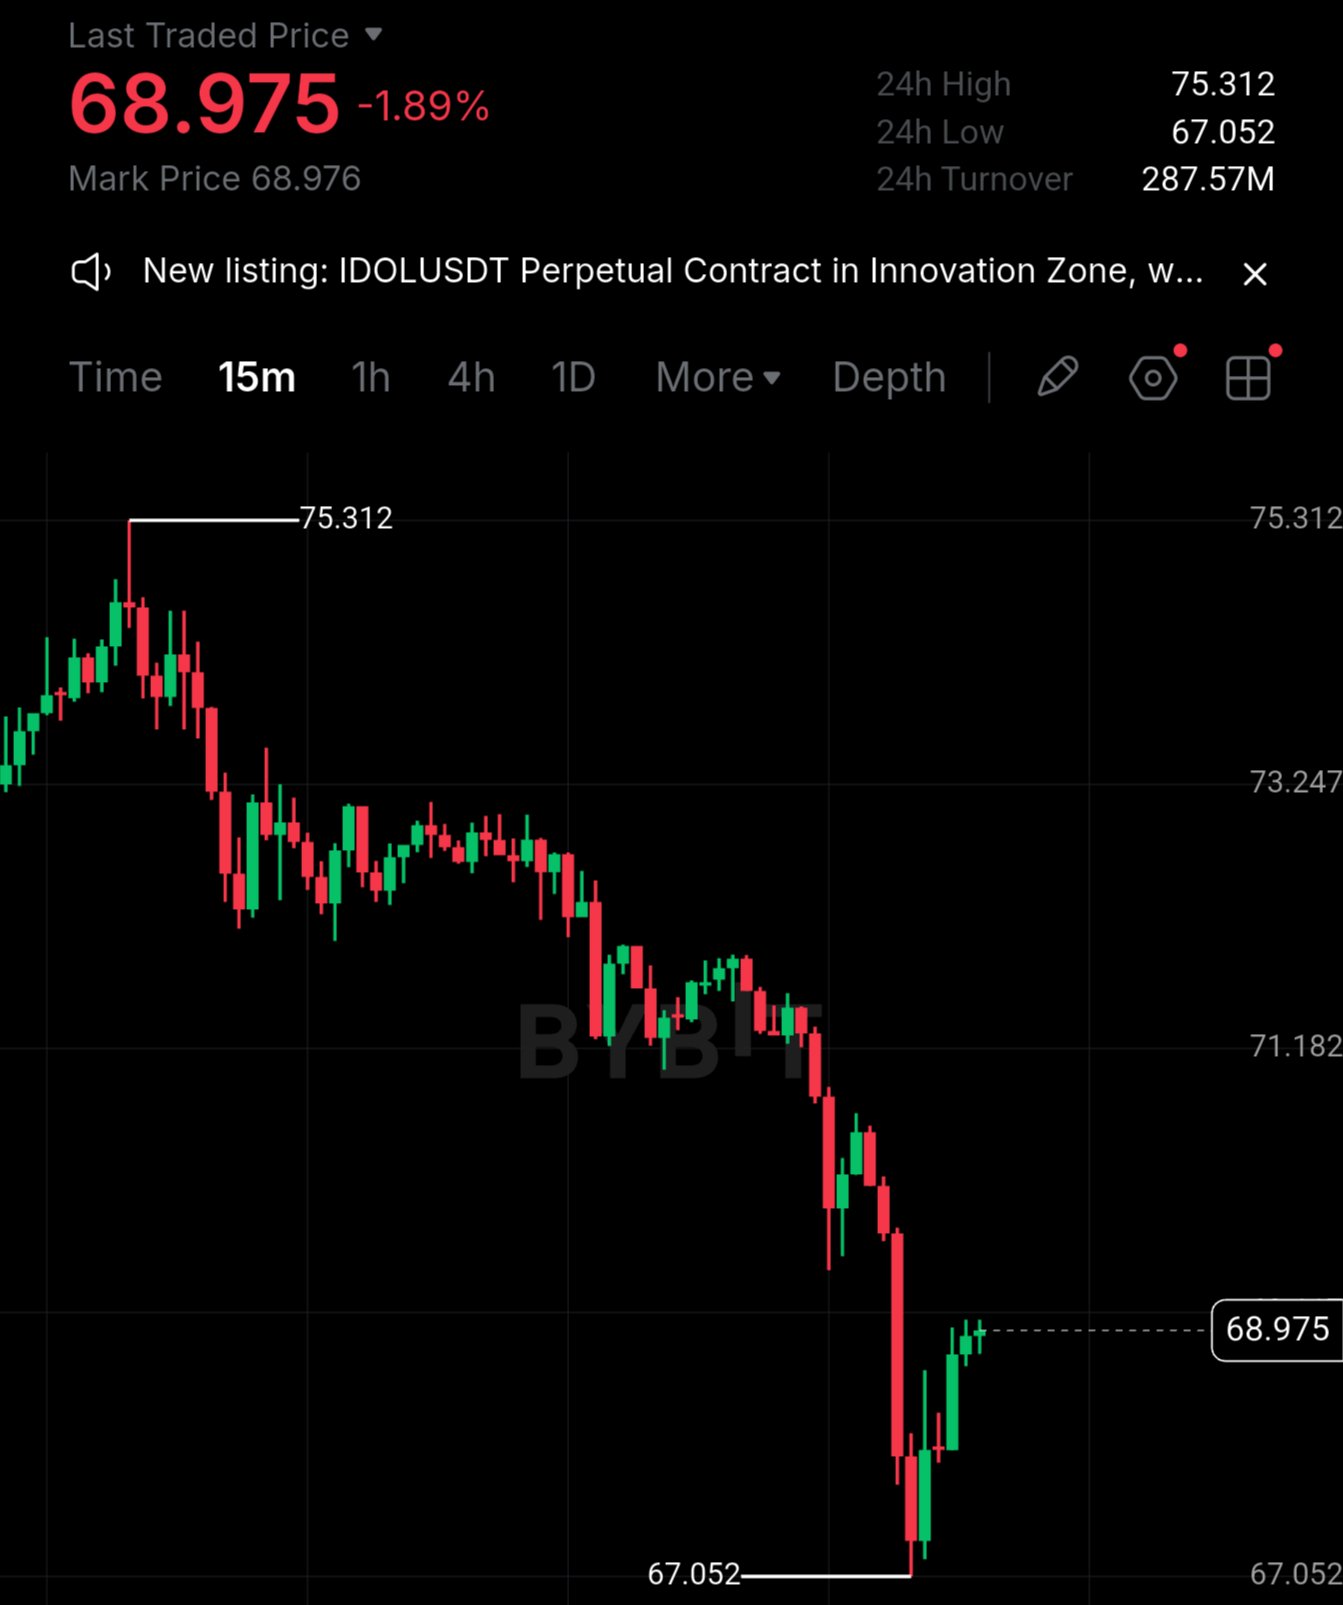
Guys... honestly, this correction in $HYPEUSDT is starting to look interesting for long-term accumulation. 👀 HYPE is trading around $68.99, after touching $67.052, and that's almost a 30% correction from its September high of $98.02. But before calling this the bottom... look at what's happening across the market. 1. BITCOIN IS DRAGGING ALTCOINS DOWN HYPE has already broken below $70K and recently dropped toward $67.5K, putting serious pressure on the broader crypto market. And HYPE hasn't escaped that selling. When Bitcoin loses major support, leveraged altcoin positions become especially vulnerable. Traders reduce exposure, margin requirements increase, and forced liquidations can accelerate the decline. So HYPE's weakness isn't happening in isolation. 2. INSTITUTIONAL DEMAND IS WEAKENING Between November 5–11, U.S. spot Bitcoin ETFs reportedly recorded approximately $1.438 BILLION in net outflows. BlackRock's IBIT also reportedly experienced heavy redemptions during that period. That's important because institutional demand has been one of the major sources of support for Bitcoin. And when that demand weakens, the effects can spread across the altcoin market. 3. LEVERAGED TRADERS ARE GETTING WIPED OUT November 13 reports cited approximately $680.81 MILLION in crypto liquidations, with around 88% coming from LONG positions. Bitcoin reportedly accounted for $325.28M, while Ethereum contributed another $106.07M. That's a serious leverage flush. But these are market-wide liquidation figures, not HYPE-specific liquidations. We would need HYPE's derivatives data to confirm how much of its decline came from forced selling. And macro pressure isn't helping either... Inflation concerns, uncertainty over Federal Reserve policy and weakness in technology stocks are making investors more cautious about risk assets. 4. NOW LOOK AT HYPE'S ACTUAL CHART On the daily timeframe: • EMA7: $72.768 • EMA14: $75.569 • EMA28: $78.394 • MACD histogram: -1.115 Price is below every one of those EMAs. The 4H chart is bearish too: • EMA7: $70.539 • EMA14: $71.318 • EMA28: $72.534 So yes... the downtrend is still intact. But after touching $67.052, buyers have started pushing HYPE back toward $69. That makes $67-$69 an interesting area to monitor for accumulation, although the bounce hasn't confirmed a reversal. 5. MY BUYING PLAN AND TARGETS Personally, i would consider gradual SPOT accumulation around $67-$69, rather than opening an aggressive leveraged LONG. For confirmation, i want to see HYPE reclaim $70.54, followed by $71.32-$72.53 on the 4H chart. If buyers manage that, my upside recovery levels become: 🎯 $75.30 → $78.40 → $82.00 → $90.00+ From $69, a recovery to $90 would represent approximately 30.4% upside. But $90 isn't my immediate target. HYPE first needs to recover the moving averages it has lost. What invalidates the idea? A sustained breakdown below $67.05 would weaken the current support thesis. Below that, i would watch $66.23, followed by the $64 region. And if $BTCUSDT continues breaking lower, i would become much more cautious about accumulating HYPE aggressively. My view? The market is under pressure from ETF outflows, leverage unwinding and macro uncertainty... but those conditions can also create attractive longer-term entry opportunities. I still believe HYPE has the potential to recover toward $90+, provided the broader market stabilizes and its technical structure starts improving. For now, $67-$69 is the area i am watching... not because the bottom is confirmed, but because the risk/reward for gradual accumulation is becoming more interesting. #USPPITestsTheHigherForLongerTrade
🚨 WHY IS $BTC DUMPING BELOW $69,000?
THE REAL REASONS BEHIND THE NOVEMBER 2026 CRYPTO CRASH Guys... $BTCUSDT has already broken below $70,000 and is now trading around $68,850, down 6.5% in 24 hours. And honestly... this is no longer looking like an ordinary correction. Multiple forces are hitting the market simultaneously: • Institutional ETF outflows • Massive leveraged liquidations • Inflation concerns • Federal Reserve rate expectations • Technology stock weakness • Declining investor risk appetite Let's look at the actual numbers... because the situation is getting more serious. 1. BITCOIN HAS LOST MORE THAN 45% FROM ITS ATH November 13, 2026: • BTC price: approximately $68,850 • 24-hour performance: -6.5% • Previous ATH: approximately $126,198 • Current drawdown: approximately -45.4% • Recent chart high: $87,383 • Decline from that high: approximately 21.2% Bitcoin is now trading significantly below its October 2025 peak, and the selling pressure is accelerating. 2. INSTITUTIONAL MONEY IS LEAVING BITCOIN ETFs U.S. spot Bitcoin ETFs reportedly recorded FIVE consecutive trading days of net outflows. November 5–11: • November 5: -$430.2M • November 6: -$411.9M • November 9: -$201.0M • November 10: -$95.0M • November 11: -$299.8M TOTAL: approximately $1.438 BILLION in net outflows. Another concerning detail... BlackRock's IBIT reportedly recorded approximately $269.7M in outflows on November 11, marking its ninth consecutive outflow session. Its cumulative outflows across those nine sessions reportedly reached approximately $2 BILLION. And guys... this matters. Spot ETFs have become an important institutional access channel for Bitcoin. When ETF redemptions persist, institutional demand is no longer providing the same buying support. 3. NEARLY $681 MILLION IN CRYPTO LIQUIDATIONS According to CoinGlass figures cited in November 13 reports: • Total crypto liquidations: $680.81M • Long liquidations: approximately 88% • Short liquidations: approximately 12% • Bitcoin liquidations: $325.28M • Ethereum liquidations: $106.07M • Traders liquidated: 112,947 • Largest single liquidation: $31.09M Bitcoin accounted for approximately $325M in liquidations, with 95.3% reportedly coming from LONG positions. This is a classic leverage unwind. Falling prices trigger margin calls, exchanges close leveraged positions, forced selling increases, and additional longs become vulnerable. And the cycle continues... The decline is being amplified by forced selling, not just ordinary spot market activity. 4. MACROECONOMIC PRESSURE IS ADDING TO THE SELLING Inflation concerns, uncertainty around future Federal Reserve rate cuts and weakness in technology stocks are making investors more cautious. Bitcoin remains sensitive to changes in liquidity and broader risk appetite. If investors expect interest rates to remain elevated for longer, speculative assets can face additional pressure. But these factors don't prove that every dollar of BTC selling is directly caused by the Fed. 5. THE TECHNICAL STRUCTURE IS STILL BEARISH Now compare all those developments with the actual Bybit chart... BTC is trading below its major daily moving averages: • EMA7: $72,902 • EMA14: $74,909 • EMA28: $77,133 The 4H chart confirms the weakness. • EMA7: $70,888 • EMA14: $72,066 • EMA28: $73,290 Price is below all three, and the market continues forming lower highs and lower lows. Bitcoin has already touched $67,468, before recovering slightly toward $68,850. That recovery alone is NOT enough to confirm a reversal. 6. IS $65,000 THE NEXT TARGET? For me, the important downside levels are: $67,468 → $66,000 → $65,000 If Bitcoin loses $67.4K with sustained selling pressure, a move toward $65K becomes increasingly plausible. But there is also a risk for late SHORT sellers. After such aggressive liquidations, even a temporary recovery can trigger a sharp short squeeze. For a meaningful bullish recovery, BTC needs to reclaim: $70,900–$71,300, followed by $72,600–$73,300. Until that happens, the broader short-term structure remains bearish. Personally, i wouldn't blindly LONG just because Bitcoin has already dropped more than 45% from its ATH. And i wouldn't chase SHORT positions after a massive red candle without waiting for a proper setup either. ETF outflows, leveraged liquidations, macro uncertainty and bearish technicals are all adding pressure at the same time. Bitcoin has already lost $70K. Now the real question is whether buyers can defend $67.4K... or whether $65,000 becomes the next major battleground. #USPayrollsAndRateDecisionsDriveMacroWeek
🚨 $BTC & $ETH... BIG DAY TOMORROW! 👀
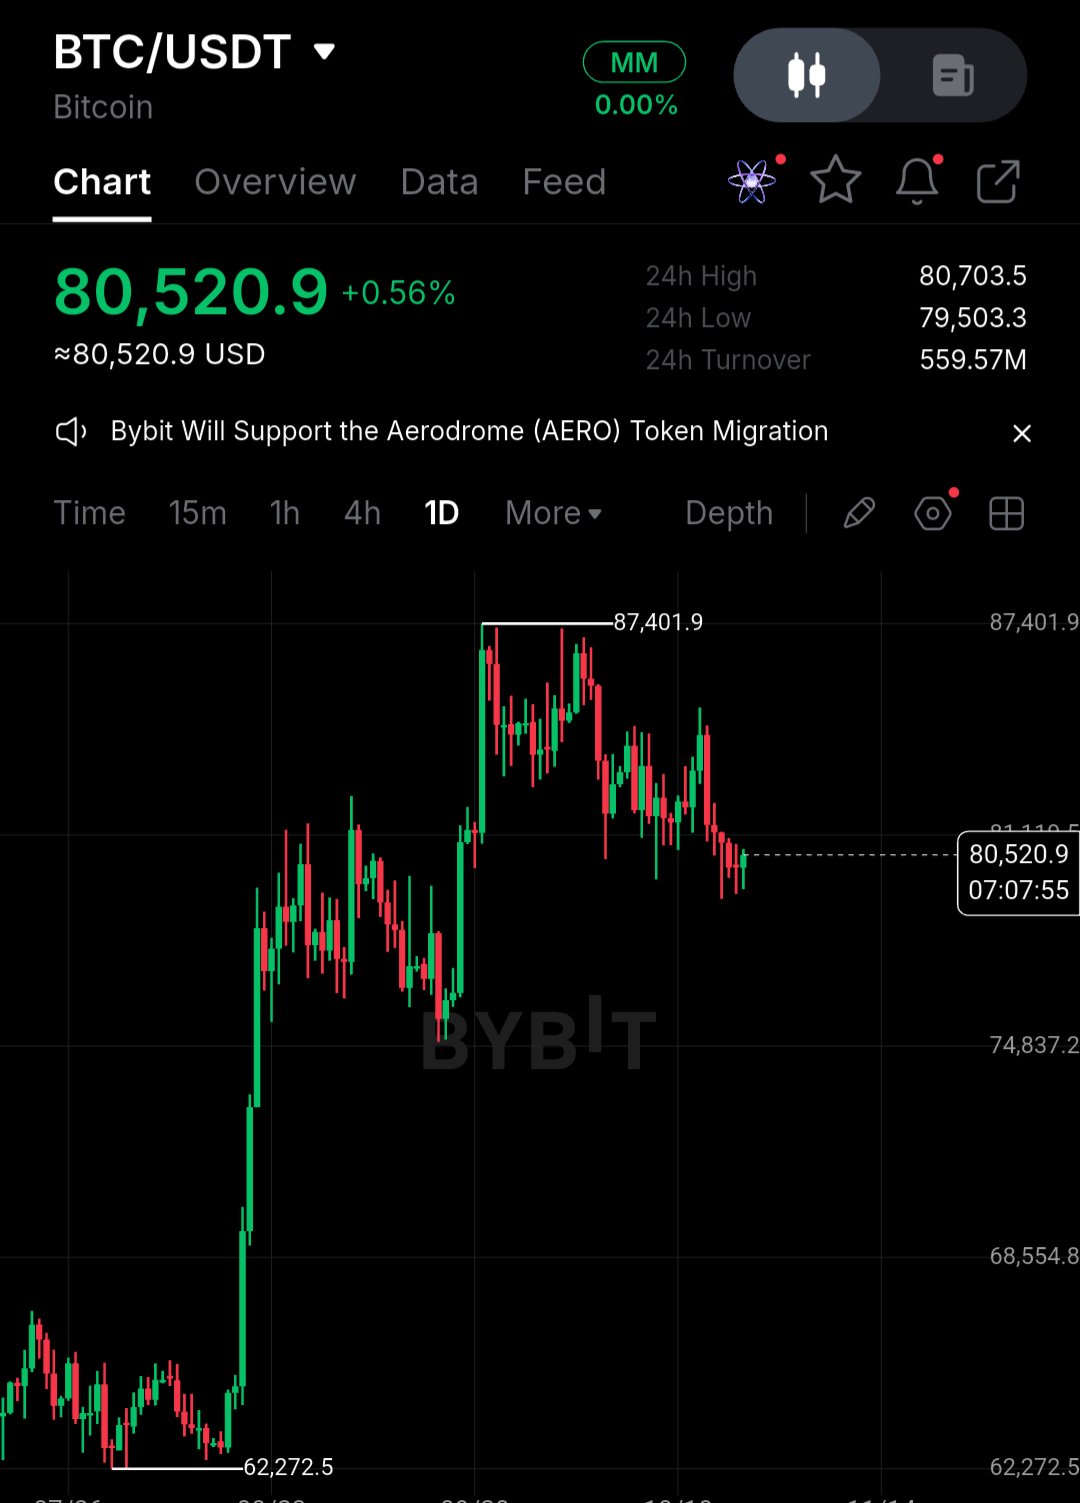
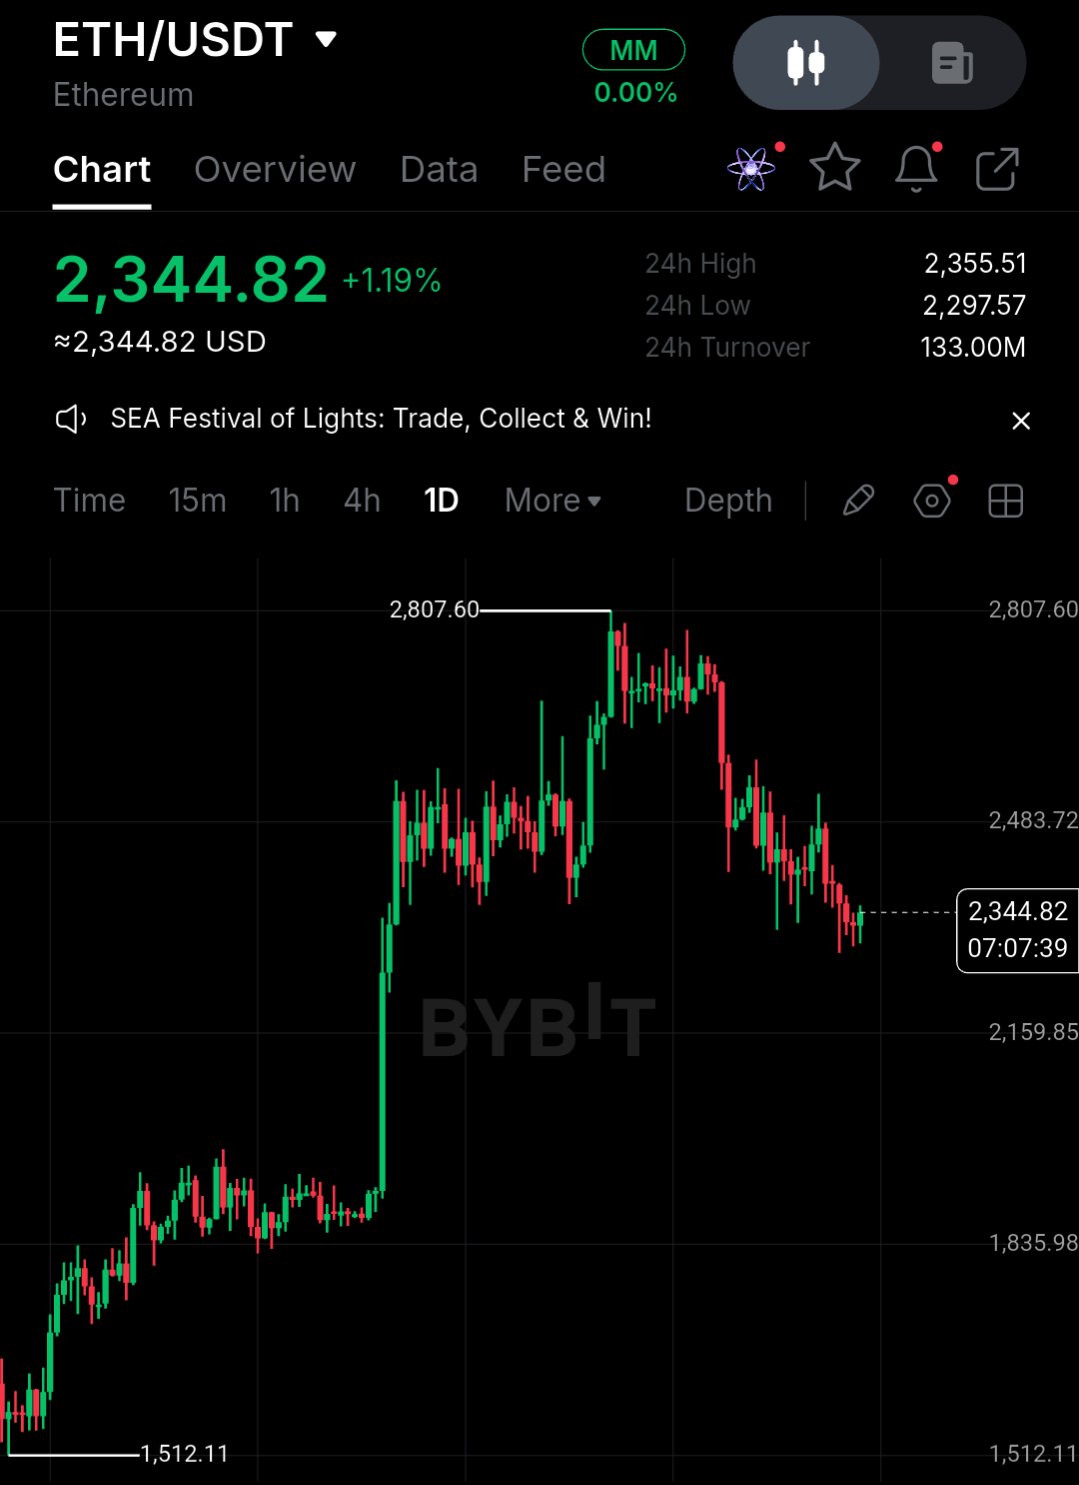
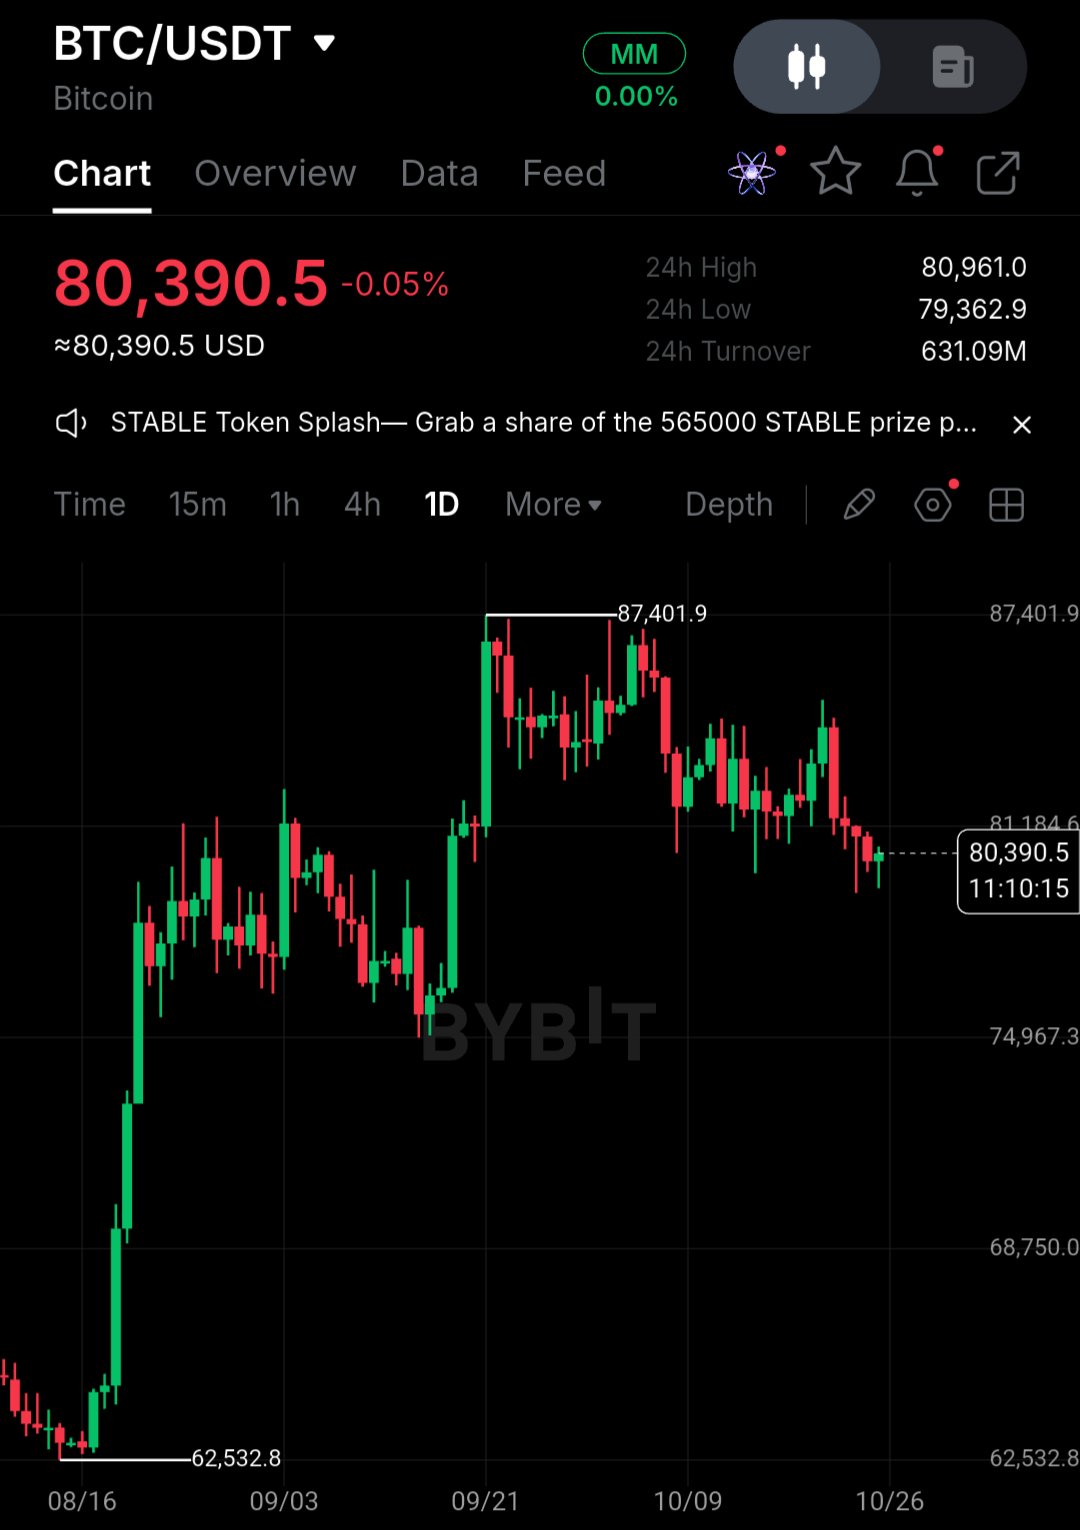
Guys... $BTCUSDT is back above $80,500 while $ETH is recovering around $2,345 💪🏻 But tomorrow, Wednesday, October 28, we have the FOMC interest rate decision! And honestly... i wouldn't trust these small green candles too much before the Fed announcement 😅 For BTC, $81K is the immediate resistance, while $79.5K remains important support. For $ETHUSDT , i am watching $2,400 for a recovery and $2,300 on the downside. Expect volatility around the announcement... especially if the Fed surprises the market. Are we getting a breakout or another liquidity sweep tomorrow? 👀 #MyByXTake
🚨 $BTC AT $80K... BIG MONEY VS LIQUIDITY!
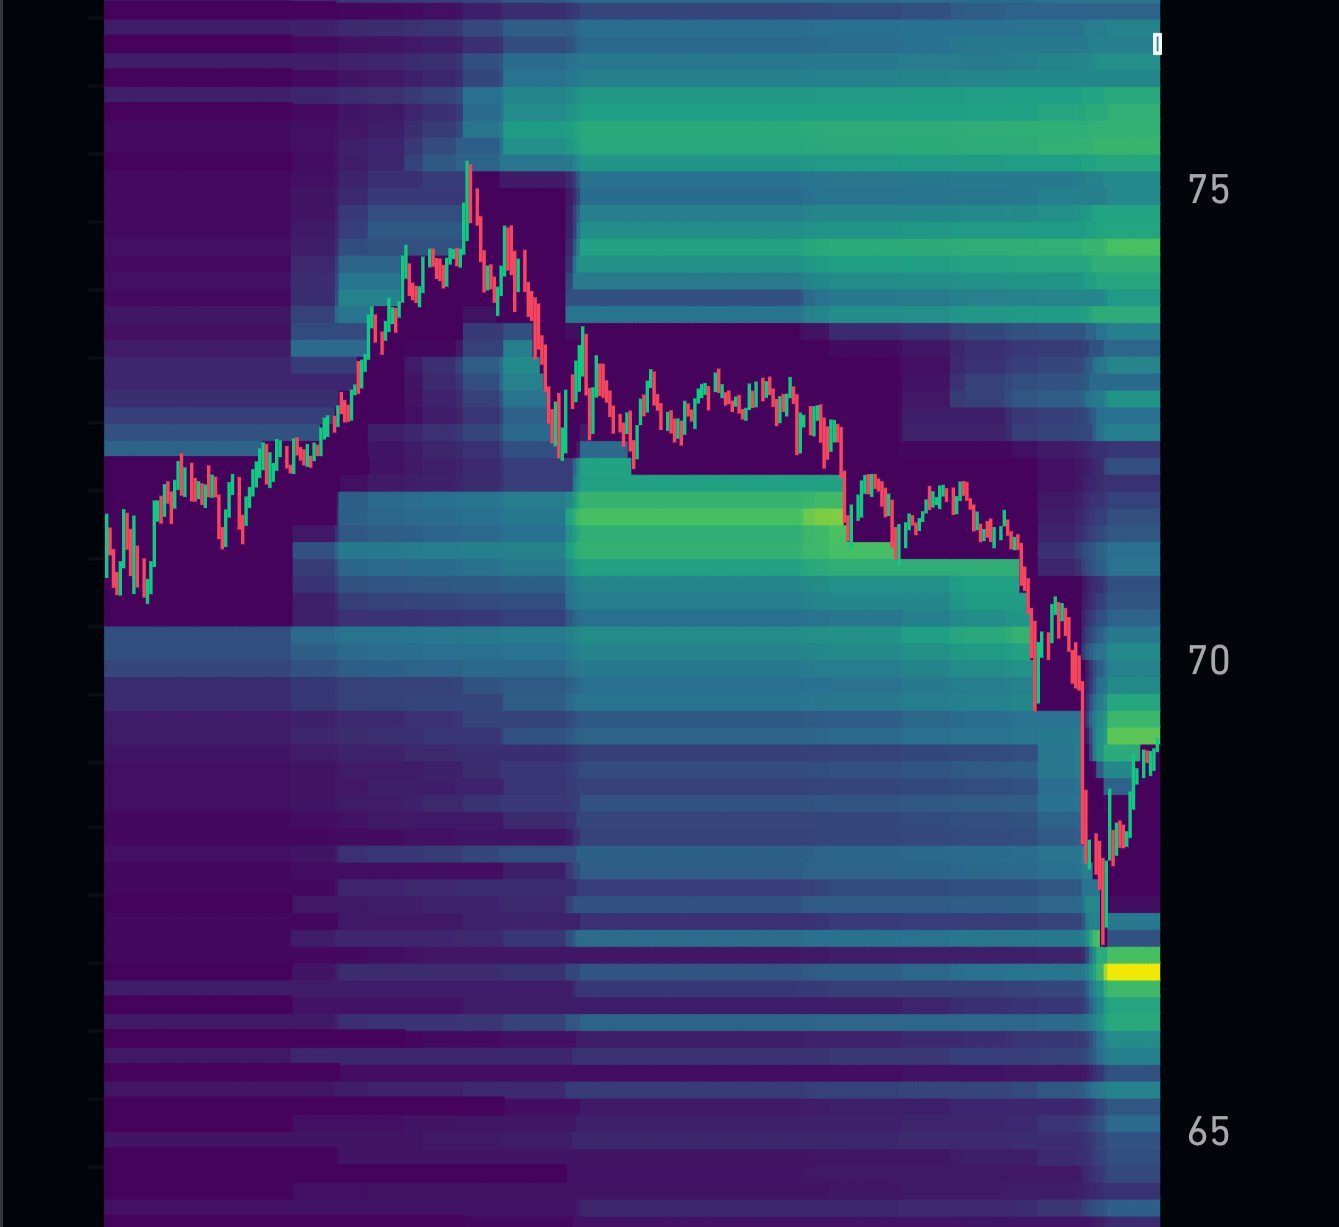
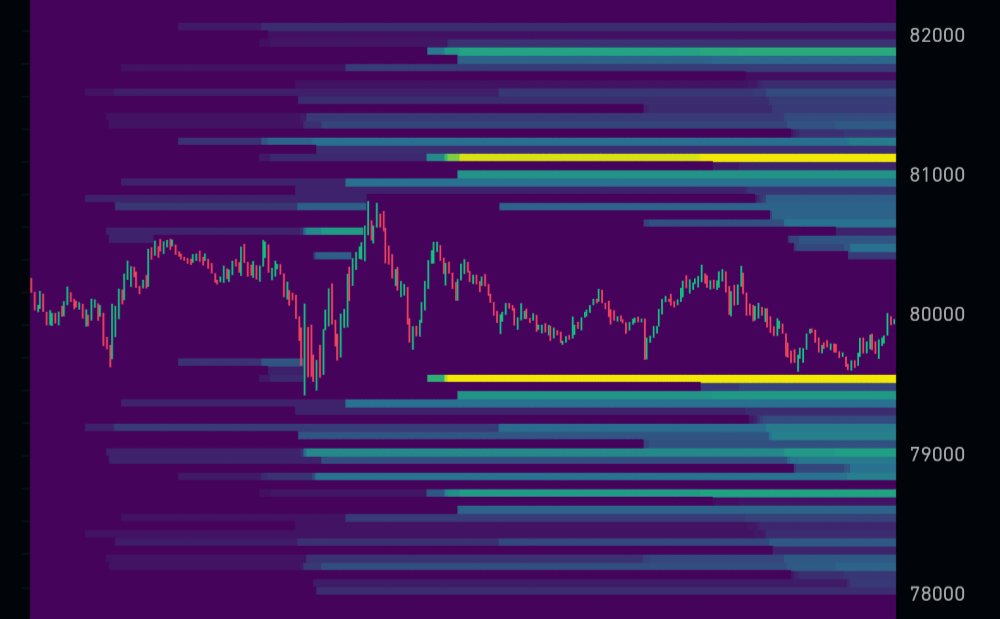
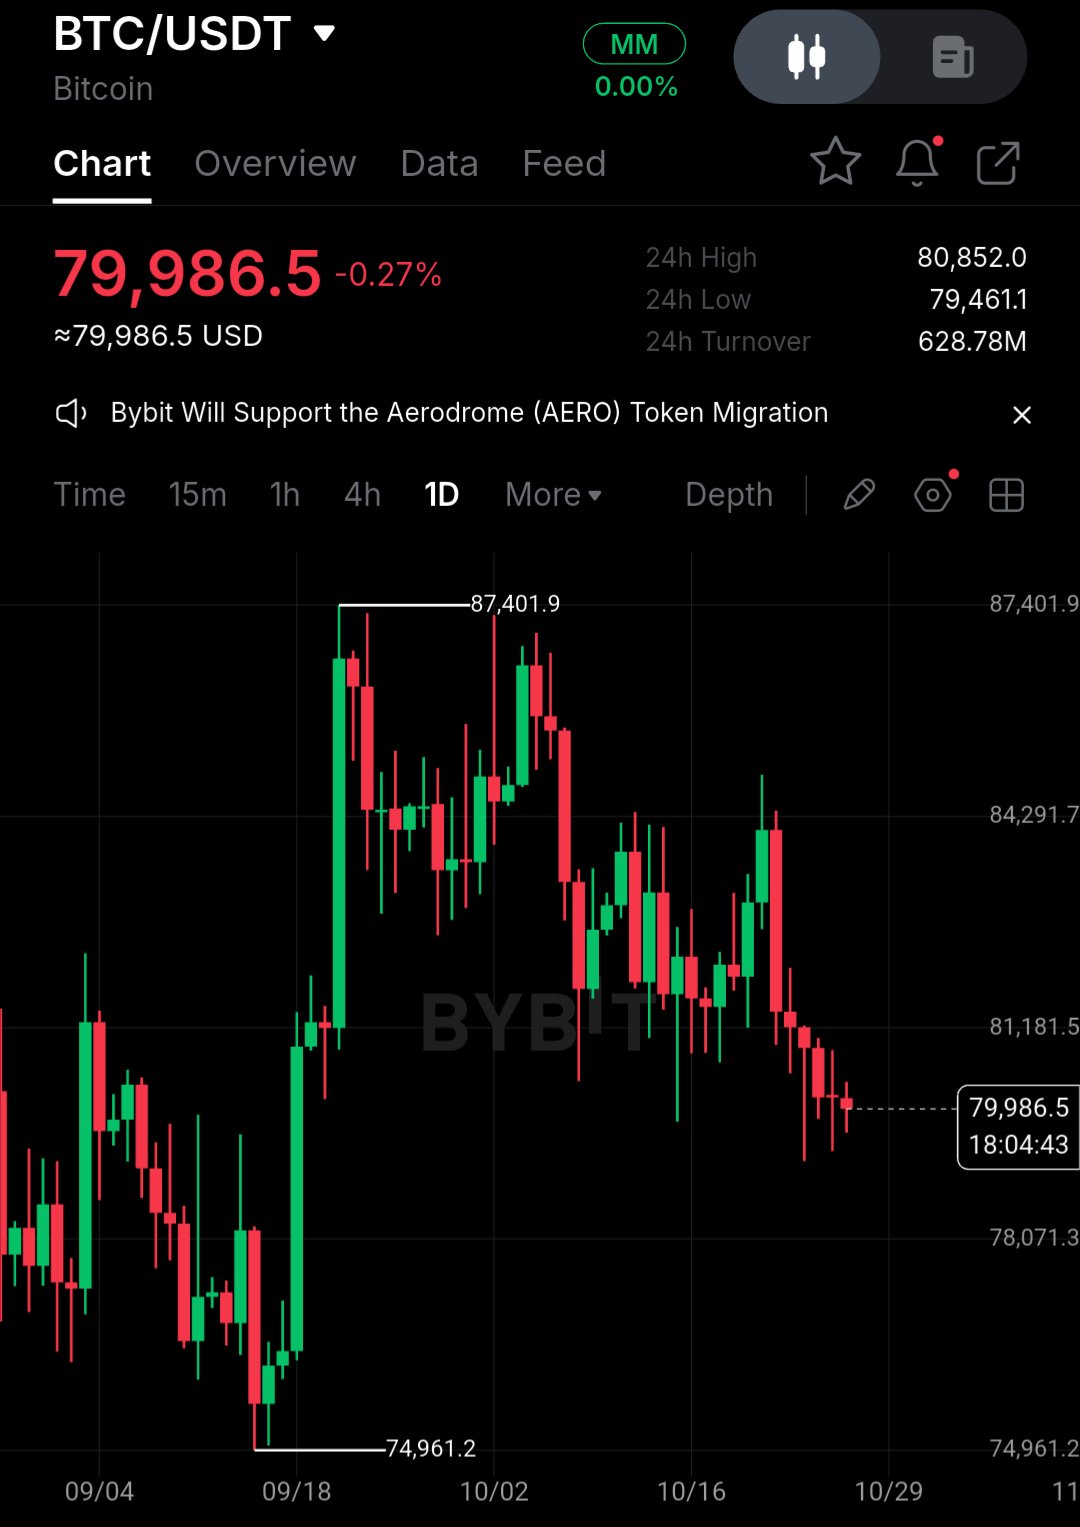
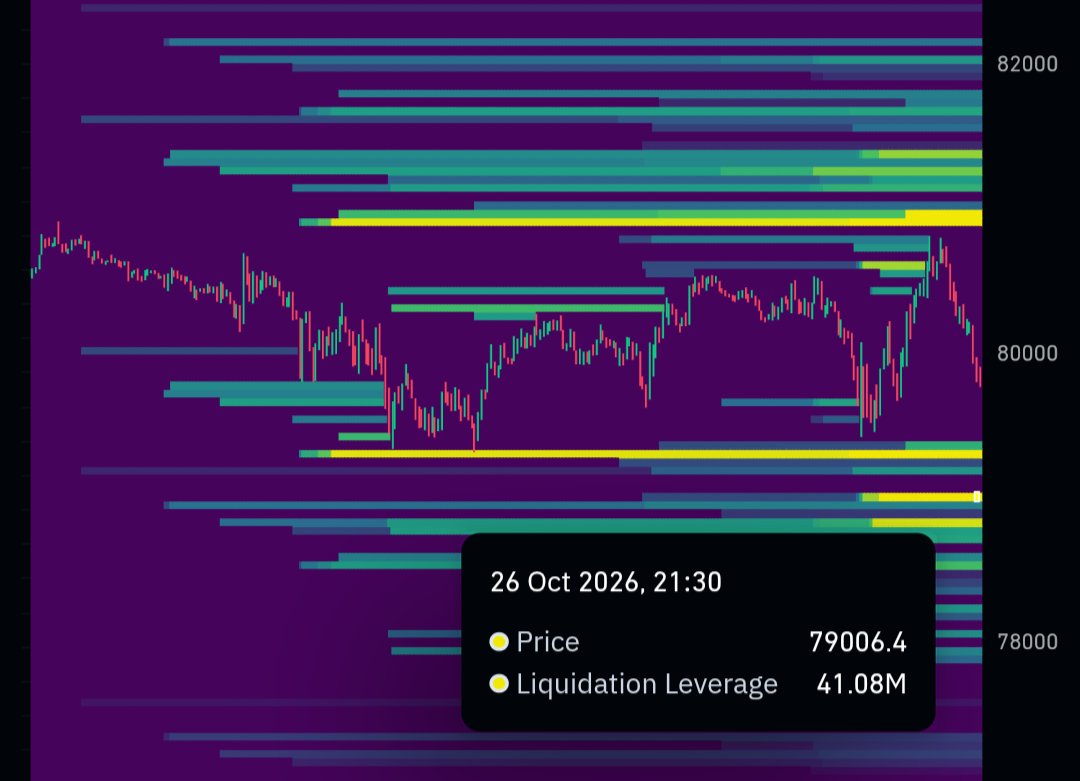
Guys... Bitcoin is still struggling around $79,986, but the interesting part is what is happening around this price. 👀 While institutional giants like BlackRock and Michael Saylor's Strategy have become major players in Bitcoin, the short-term chart is telling a very different story. $BTCUSDT has already fallen from $87,401 to $79,986, an 8.5% correction, and buyers are still struggling to reclaim $81K. Now look at the liquidation heatmap... There are TWO major liquidity areas worth watching. 🟢 Below price: $79,500-$79,600 A bright liquidity concentration is sitting just below the current market. This could attract price lower for a liquidity sweep, potentially triggering leveraged LONG liquidations before buyers attempt a recovery. 🔴 Above price: $81,000-$81,200 This is the stronger visible upper liquidity band, with another concentration near $82K. If BTC starts recovering, those upper levels could become targets for a short squeeze. But remember guys... liquidity isn't a guarantee of where price goes next. And this is where the institutional angle matters. BlackRock's spot Bitcoin ETF, IBIT, gives traditional investors direct exposure to BTC, while Strategy continues to represent a major corporate Bitcoin accumulation strategy. But institutional ownership doesn't mean institutions are buying every dip. ETF flows can turn negative, and large holders cannot prevent leveraged traders from getting liquidated. That's why i wouldn't blindly assume $80K must hold just because institutions own billions in Bitcoin. 📊 My trading outlook: If BTC sweeps $79,500, quickly reclaims $79,800-$80,000 and confirms bullish momentum, i would start looking for a LONG toward $80,850 → $81,200. But if $79,500 breaks and price accepts below it, $79,000 and $78,000 become the next areas to watch. On the upside, reclaiming $81,200 would improve the short-term structure, potentially opening the path toward $82K. Personally, i would rather wait for the liquidity sweep and confirmation than enter blindly in the middle of this range. Big institutions may be thinking in years... but leveraged traders can get wiped out in minutes. 😅 And right now, BTC is sitting between two important liquidity zones. Which one gets swept first... $79.5K or $81.2K? 👀 #IMPACTbyTrade
🚨 $DOOD EXPLODES +69%... ANOTHER SQUEEZE? 🔥
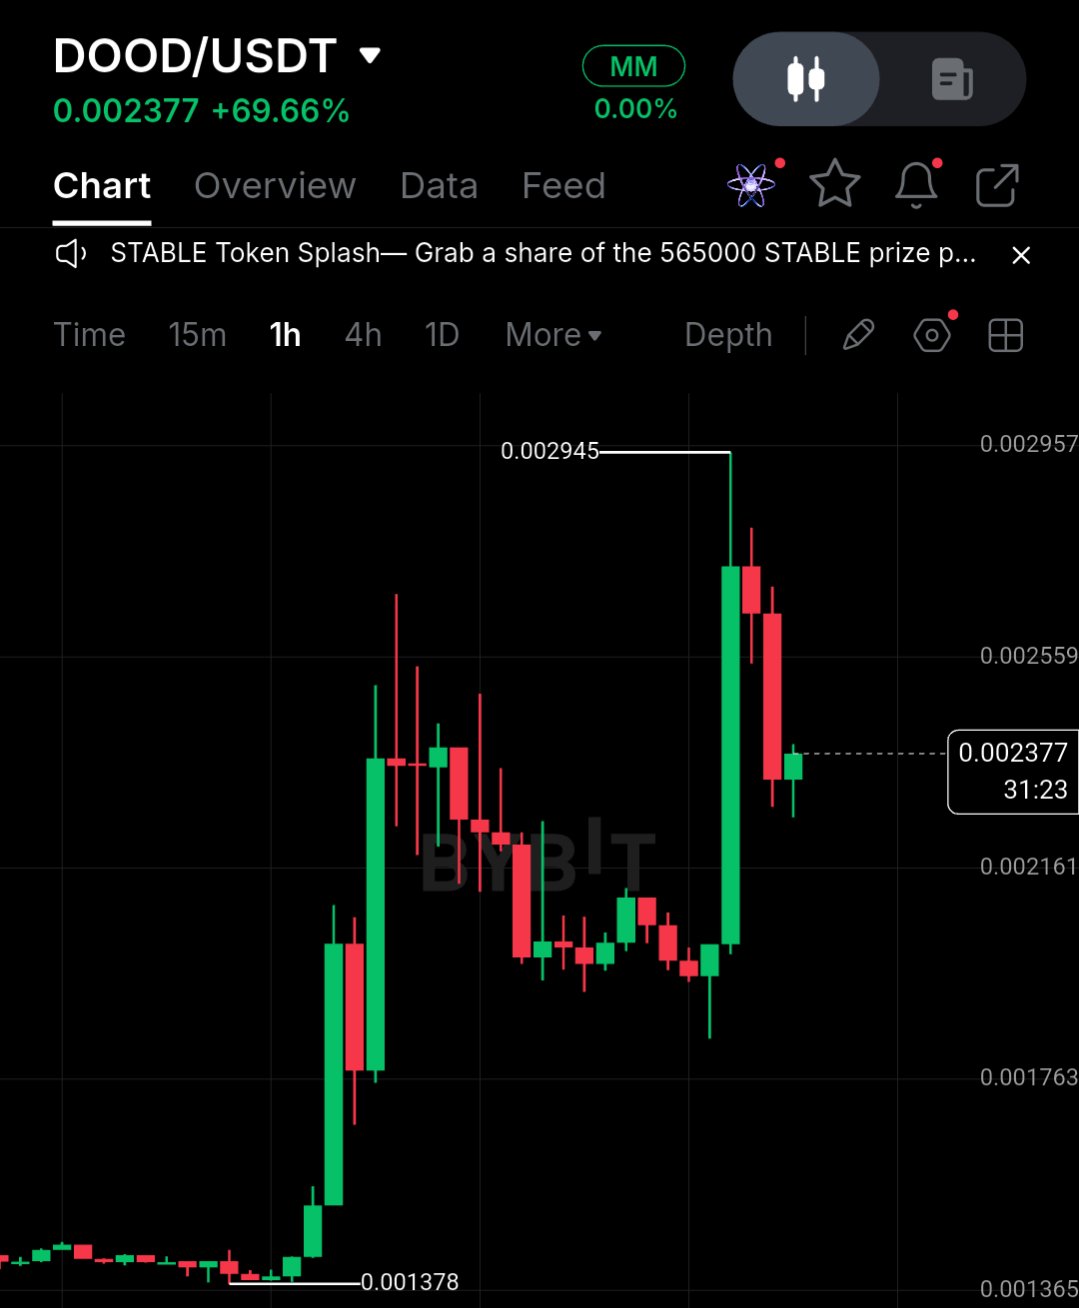
Guys... $DOODUSDT is going absolutely crazy again 😆 While $BTCUSDC is struggling around $80K, DOOD has jumped +69.52%, trading near $0.002375. But look at that daily chart carefully... DOOD recently made a massive wick all the way to $0.005255, before getting rejected HARD and dropping back toward $0.001268. That's almost a 76% collapse from the spike high. And now buyers are pushing it up again. 💪🏻 The interesting part is the moving averages... 📊 Daily technicals: EMA7: $0.001894 EMA14: $0.001792 EMA28: $0.001726 All three EMAs are stacked bullishly, and price is trading around 25% above EMA7. MACD histogram is positive at 0.000054, while RSI6 has climbed to 69.20. So momentum is definitely bullish right now... but short-term conditions are getting stretched. Now let's talk about liquidity and possible liquidations. 👀 That huge wick toward $0.005255 tells us DOOD has already experienced extreme volatility. It doesn't prove how many shorts were liquidated, but it shows just how aggressively this coin can move. If price breaks above the recent local resistance around $0.0028-$0.0030, short sellers could come under more pressure, especially if leveraged short positions are concentrated above those levels. On the downside, traders who entered LONG after today's massive pump could become vulnerable if DOOD suddenly loses $0.0022. And with these low-cap coins, a 15-20% move can happen frighteningly fast. 🎯 My trading plan: 🟢 LONG scenario: I would prefer a pullback toward $0.00205-$0.00215, followed by a confirmed bullish reaction. Targets: $0.00250 → $0.00280 → $0.00320 Invalidation: A sustained breakdown below $0.00189 would weaken this setup. 🔴 SHORT scenario: I would only consider a short if DOOD sweeps above $0.0028-$0.0030, gets rejected and confirms a bearish structure break on the lower timeframes. Potential downside targets: $0.00240 → $0.00215 → $0.00190. No blind shorts just because a coin is up 70%... these things can squeeze much higher before reversing 😂 And personally, i wouldn't chase a LONG here either. has momentum, but the better trade is waiting for a confirmed entry instead of fighting a 70% daily candle. Let's see whether buyers can actually hold this move or whether we get another brutal rejection. 👀
🚨 $BTC BELOW $80K... MORE PAIN COMING?
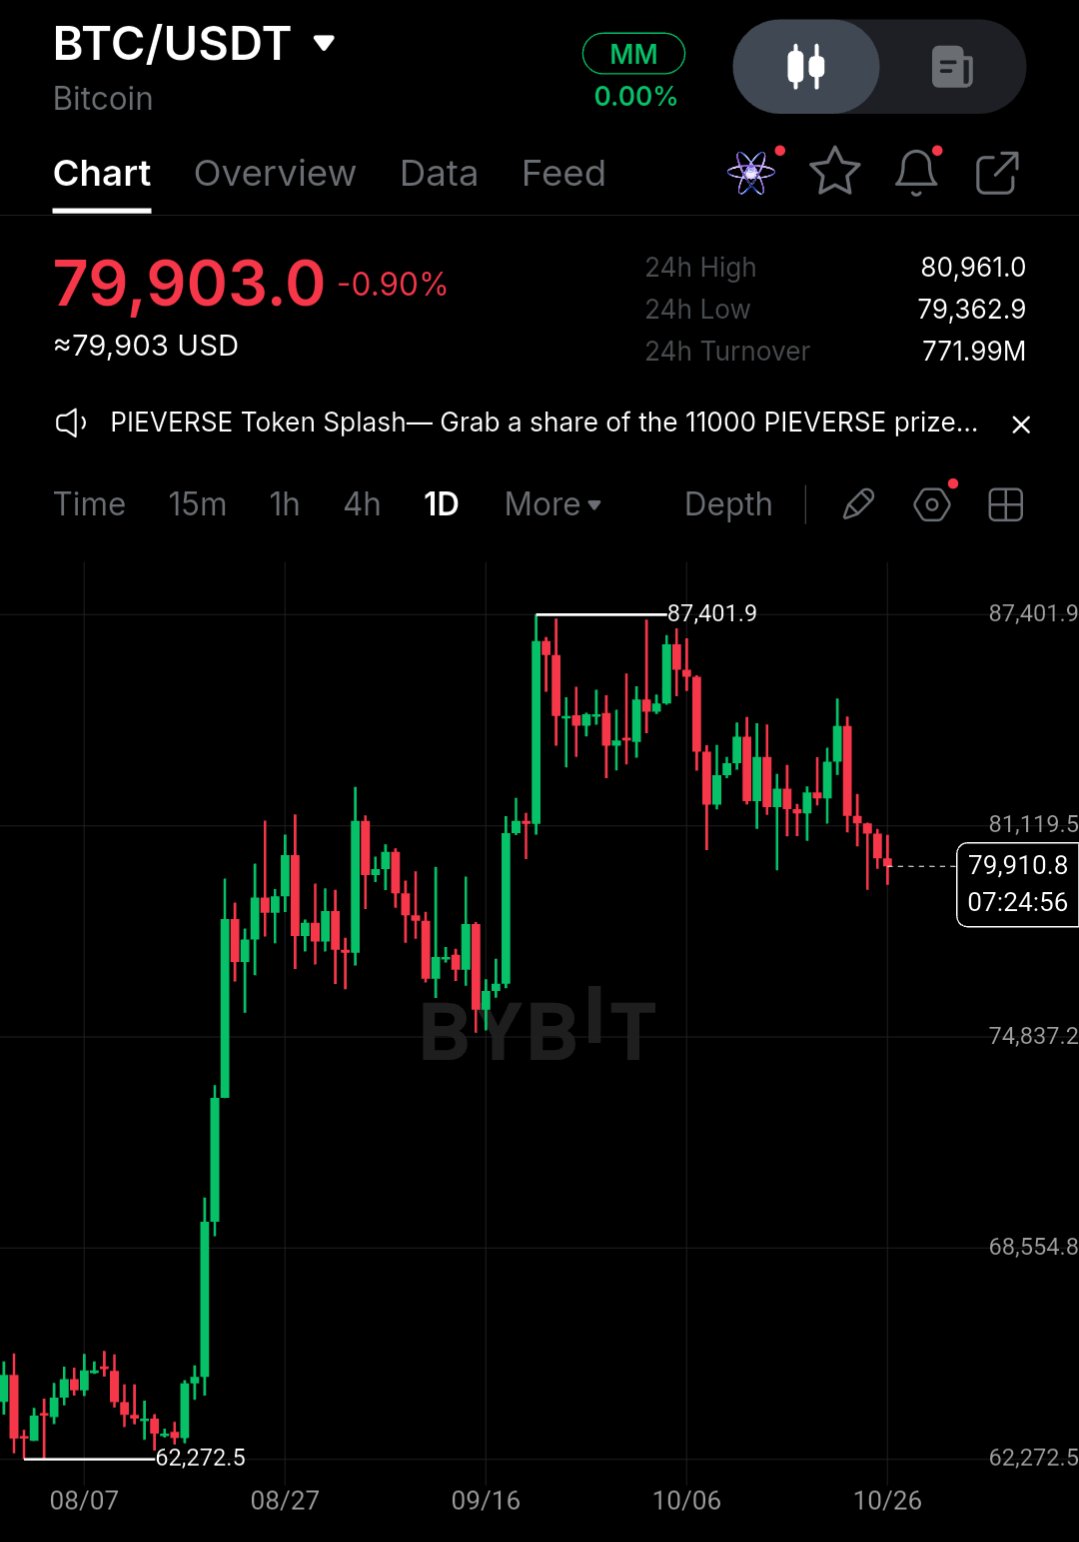
Guys... Bitcoin is losing strength again, and this time the daily chart is showing some serious warning signs. $BTCUSDT just slipped below $80,000, trading around $79,930, after touching $87,401 earlier this month. That's already an 8.5% correction from the recent high. But what concerns me more is how BTC is trading below almost every important moving average now. EMA7 is around $81,030, EMA14 near $81,661 and EMA28 around $81,927. Even MA28 is sitting much higher around $82,875. That means the entire $81K-$83K area is turning into resistance instead of support. And look at the momentum... Daily RSI6 has dropped to 29.59, showing short-term oversold conditions, while MACD remains negative around -378. So yes... a relief bounce is possible, but oversold doesn't automatically mean the bottom is in. And guys... the selling pressure isn't coming from the chart alone. On October 24, around $404 MILLION in leveraged crypto longs were reportedly liquidated within just four hours as Bitcoin briefly lost $80K. That's a serious leverage flush. Meanwhile, U.S. spot Bitcoin ETFs recorded approximately $635.6M in outflows on October 22, followed by another $137.9M on October 23. That's around $773.5M leaving in just two sessions, although the full week still reportedly finished with net inflows of roughly $300M. And liquidity is building on BOTH sides... One liquidation model estimates around $28.9M in potential long liquidations near $78,670, while approximately $41.7M in short liquidation exposure sits near $85,034. These are estimated liquidation concentrations, not guaranteed orders... but they show why BTC could make a sharp move in either direction. 📊 Now the levels that matter... For me $79K-$80K is the immediate area buyers need to defend. If $BTCUSDC loses $79K properly, the next important downside areas become: 🎯 $77K → $75K → $72K But if buyers reclaim $81K-$82K and start holding above those moving averages again, the bearish pressure could finally begin easing. And don't forget... the next Federal Reserve decision is scheduled for October 28, adding another major macro catalyst this week. Personally, i am NOT interested in blindly shorting BTC after RSI has already dropped below 30. But i am also not calling this a bullish reversal while price remains below $81K-$83K. A sweep below $79K followed by a sharp recovery is possible too... especially with leveraged positions building around nearby levels. $80K is the fight right now... and whichever side loses could give us the next major move. 👀 #ByXIMPACT
🚨 $ETH: BILLIONS BUYING... PRICE STILL FALLING!
Guys... Tom Lee is predicting Ethereum could reach $10,000 within the next 12 months, while ETH itself is struggling around $2,318 😅 And the interesting part? His company, BitMine, is reportedly STILL accumulating. The latest reported purchase is worth around $24.29 MILLION in $ETHUSDT bringing its total Ethereum holdings to approximately $14 BILLION. But look at what is happening on the other side... U.S. spot Ethereum ETFs reportedly recorded around $220.7 MILLION in net outflows over the latest five trading sessions, despite a small $4.4M inflow on Friday. And BlackRock's ETHA alone reportedly saw around $75.5M in outflows on October 22. So think about this... BitMine is accumulating millions of dollars worth of ETH, while ETF investors are pulling capital out. And the price is reflecting that uncertainty. 📊 ETH recently touched $2,807.60... now trading around $2,318. That's roughly a 17.4% correction from the recent high. And for Tom Lee's $10K prediction to become reality, Ethereum would need to rally around 331% from here. That's a HUGE move guys... not impossible, but definitely not something i would expect just because institutions are buying. For now, $2,290-$2,300 is the immediate support i am watching. Lose that and $2,200 → $2,050 could become the next downside areas. But reclaim $2,450-$2,500, and ETH could start recovering toward $2,550 and eventually challenge $2,800 again. And there is another risk people often ignore... With billions of dollars sitting in institutional and private Ethereum wallets, wallet security remains critical. One malicious signature or compromised wallet can still result in massive losses, regardless of how bullish ETH looks. Personally, i still like Ethereum for longer-term accumulation... but institutional buying doesn't automatically mean the bottom is in. BitMine is buying, ETFs are seeing outflows, and ETH is still correcting. $BTCUSDT Would you accumulate ETH around $2,300 or wait for a deeper correction? 👀 #IMPACTbyTrade #MyByXTake


🚨 BTC back to $57k ❓
What was the market sentiment on 15-16th of September ? Remember the fear and this despite pumping from 57k to 80k? Remember the fear and negative sentiment ? Do you remember, when people called for 50k back then ? Do you know everyone is now calling for $BTCUSDT 70k and lower ? #IMPACTbyTrade
🚨 ByX IMPACT IS RETURNING OCTOBER 26... I HAVE 2 SUGGESTIONS! Okay guys... Bybit has officially announced that the ByX IMPACT Leaderboard is returning on October 26 😁 And as someone who participated in the previous round, finished at Rank #46 with 211 IMPACT points and earned 80 USDT, i actually have a few suggestions that could make ByX much better for both creators and traders. 1. Separate FOLLOWING and DISCOVER feeds Right now, i think ByX needs a clearer separation between posts from creators we follow and posts from the overall community. A dedicated Following tab would help users easily find analysis from their favorite creators without losing those posts among hundreds of other updates. And the Discover tab should focus on helping new creators reach traders who haven't followed them yet. This would improve content visibility without making everything depend on the same feed. 2. Introduce trading commissions alongside IMPACT rewards This is actually my bigger suggestion... ByX IMPACT already focuses on rewarding creators whose content generates meaningful engagement and trading influence. But why not introduce a separate commission system for trades generated directly through creator posts? For example, when someone opens a futures position through a creator's trading setup, the creator could earn a small commission based on eligible trading fees. And most importantly... creators should have access to a transparent dashboard showing: • How much IMPACT each post generated. • How many eligible trades came through their content. • How much commission they earned during that week. • Their total IMPACT rewards and trading commissions separately. Because right now, seeing a weekly IMPACT score is useful... but understanding which content actually created that impact would help creators improve their research and analysis. Obviously, commissions should reward genuine trading activity, not encourage unnecessary leverage or excessive trading. I genuinely like the direction ByX is taking with IMPACT... rewarding original analysis and actual trading influence instead of just views and likes. But combining better content discovery + transparent post-level IMPACT data + a separate trading commission system could make this platform much more attractive for serious crypto creators. I will definitely be participating again on October 26 💪🏻 And i would love to see the @BybitX team consider these suggestions as the platform continues growing. What do other ByX creators think about these changes? #ByXIMPACT #ByXIMPACT

🚨 MY FIRST WEEK ON ByX... RANKED #46 AND EARNED $80! 🏆 Okay guys... my first week as a creator on Bybit ByX IMPACT turned out pretty well 😁 I finished at Rank #46 with 211 IMPACT points, earning 80 USDT from the weekly creator leaderboard 💪🏻 And honestly... what i like most isn't just the $80 reward. It's how ByX IMPACT is changing the way crypto creators get rewarded. For a long time, creator programs have been mostly about posting more, getting views and collecting likes. But ByX is taking a different approach... Content quality, original research, meaningful engagement and most importantly, whether your content actually influences trading activity. That means posting 20 random signals every day doesn't automatically make someone a better creator. A properly researched $BTC analysis, a useful $SOL market update or a $ZEC setup with actual entry levels and risk management can provide much more value than recycled hype. And look at the competition... The #1 creator, MikeInsider, finished with 399 IMPACT points, while the top three creators each earned 220 USDT. I managed to reach 211 points in my very first week, which puts me only 188 points behind the top position. Not bad for a first week... but there's still plenty of room to improve 😁 My plan is to continue sharing real market data, breaking crypto news, spot accumulation opportunities and futures setups with proper levels. Because i don't want people following my posts just to see another BUY or SELL signal... I want them to understand WHY i am buying, where the risk is and what could happen next. And if ByX continues rewarding creators based on genuine impact rather than just posting volume, i think this could become a much better platform for both creators and traders. First week: #46 | 211 IMPACT | 80 USDT Now let's see how far we can take this next week 💪🏻 Thanks to everyone who has been reading, commenting and supporting my analysis. ❤️ #ByXIMPACT $BTCUSDC $ETHUSDC


🚨 $PUMP IS WAKING UP AGAIN... +17% TODAY!
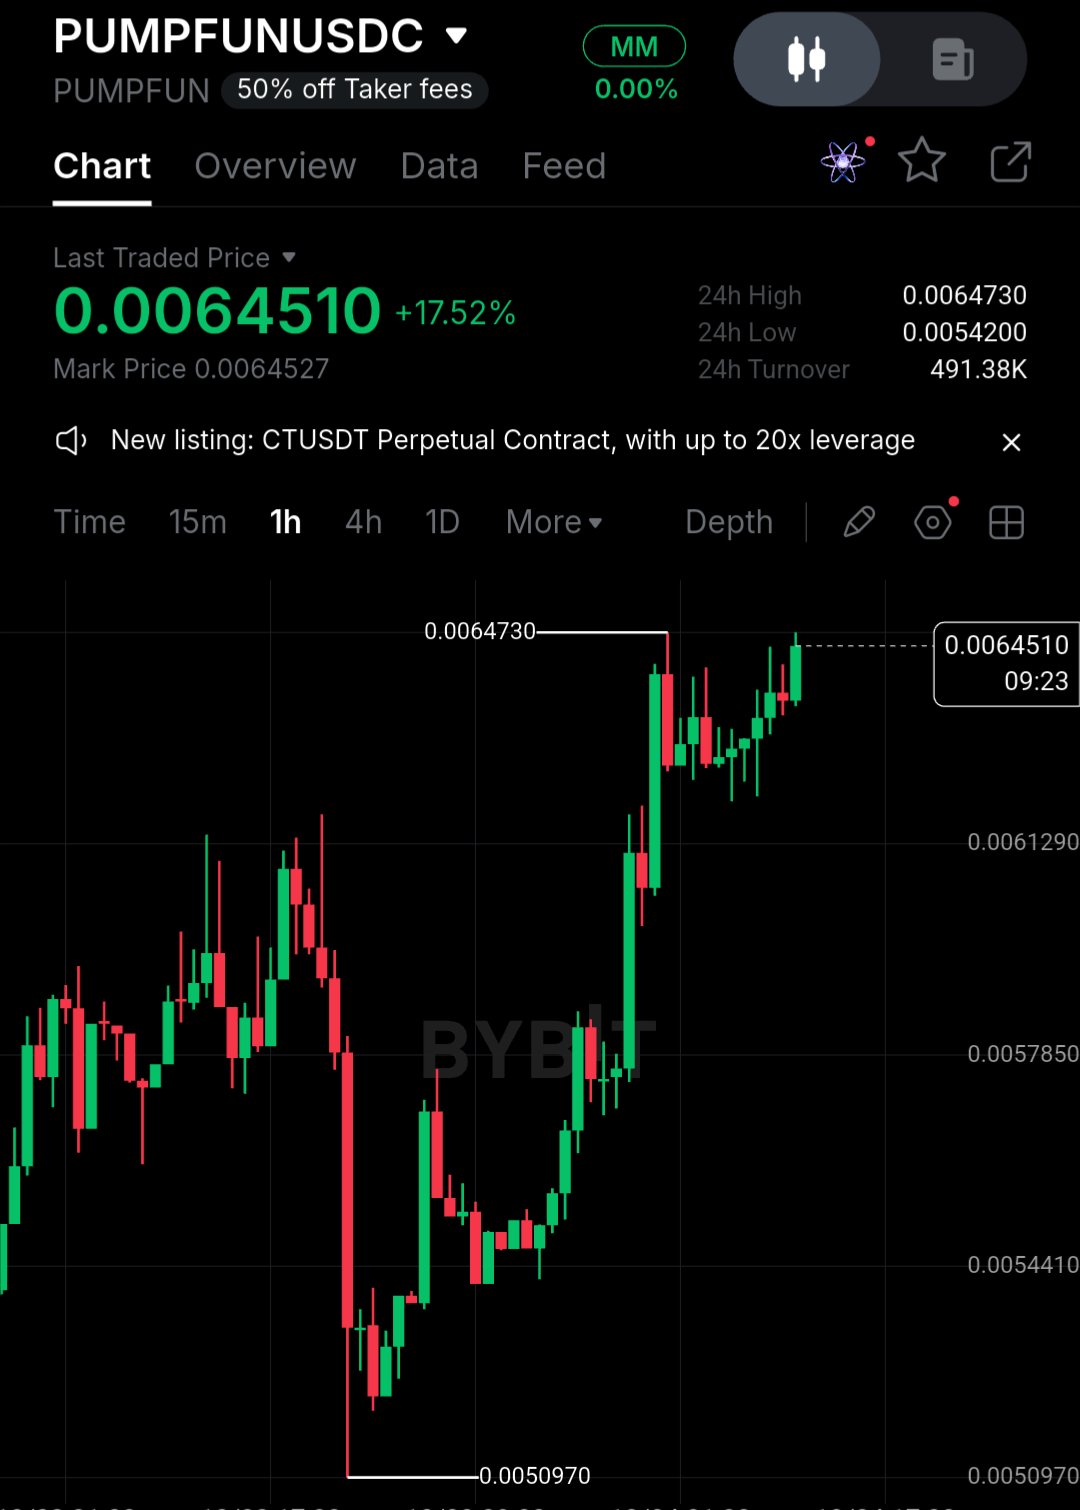
Okay... this move is actually backed by some serious numbers guys 😁 $PUMPUSDT just pushed back above $0.00645, up around 17.5% today, after trading near $0.0051 recently. But the bigger story is what Pump.fun is doing behind the price... Pump.fun is using roughly 50% of its revenue to buy and burn $PUMP. On Oct 1-3 alone, around 614 MILLION PUMP were bought and burned for roughly $3.6M. And across the last 30 days, buybacks have reached roughly $24.7 MILLION, with around $472.8M bought back historically. So this isn't just a random +17% candle. 📊 On the 1H chart, PUMP has recovered from $0.005097 → $0.006473, roughly +27%, and buyers are now pressing the same local high again. For me $0.00647-$0.00650 is the immediate fight. Break that cleanly and i would watch: 🎯 $0.0068 → $0.0072 → $0.0080 But after this fast move, chasing stupid leverage here makes no sense... a retest around $0.0061-$0.0063 would actually be healthier. $PUMPUSDC has the momentum now... and unlike many random pumps, there is an actual revenue + buyback + burn story sitting behind this one. 👀 #USNonfarmPayrolls
🚨 BITWISE JUST LAUNCHED THE FIRST SPOT $NEAR ETF!
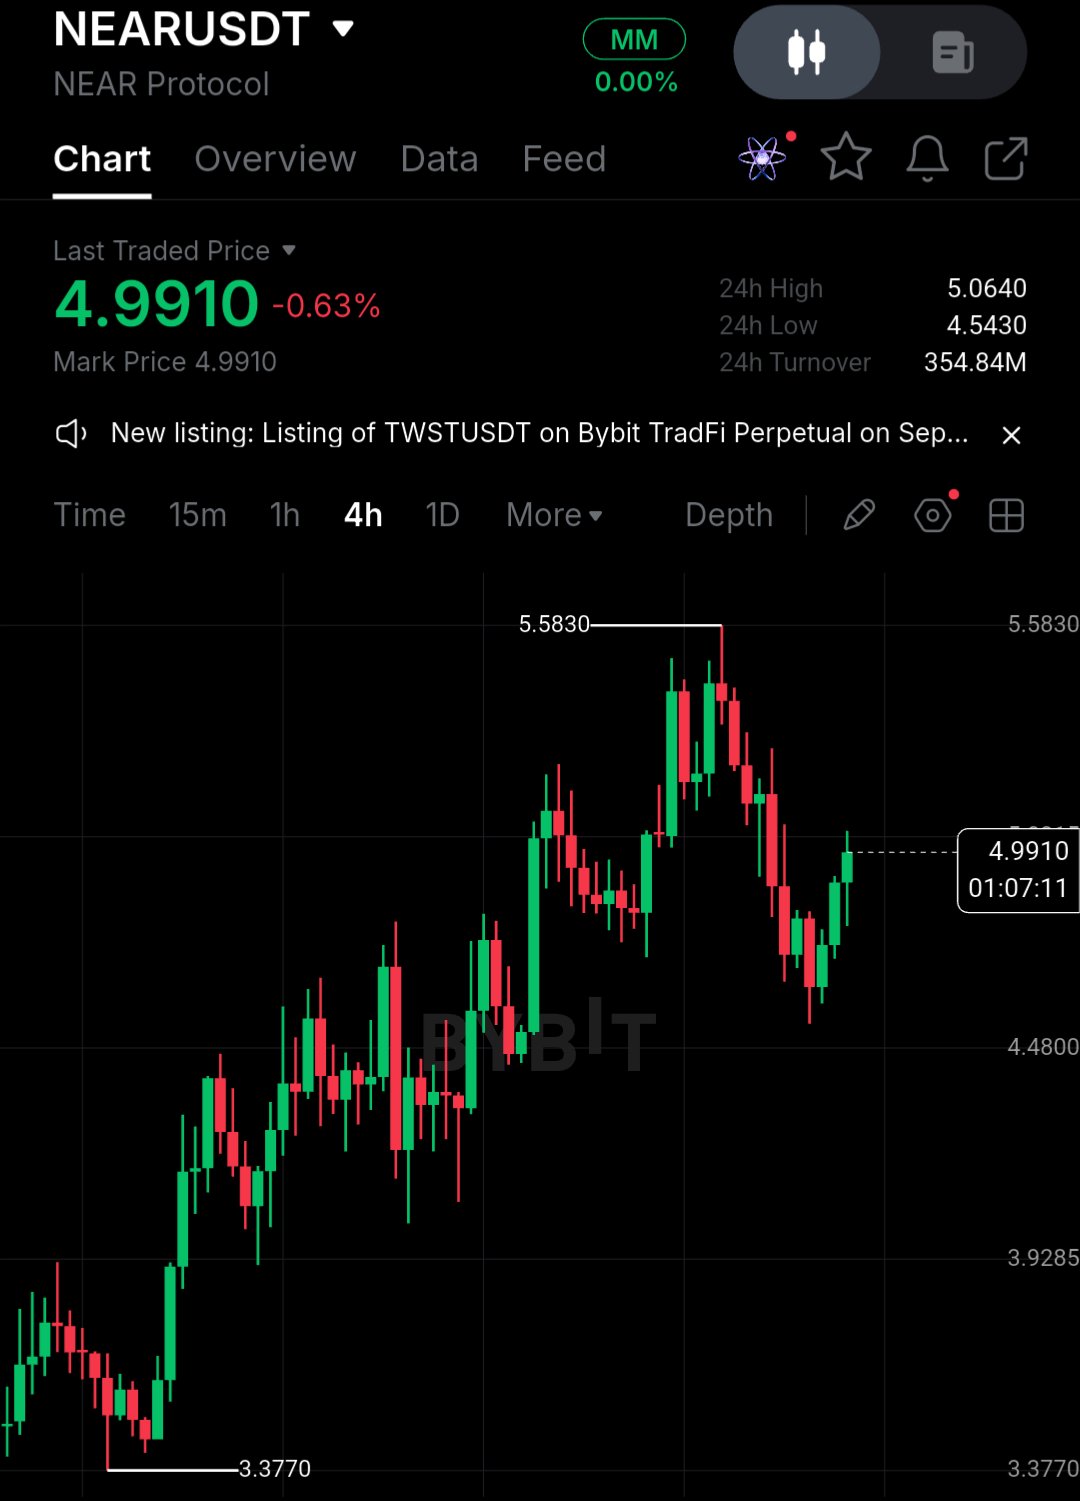
This is BIG for NEAR guys... Bitwise has officially launched the Bitwise NEAR ETF ($NRR) on NYSE Arca, giving U.S. investors direct spot exposure to $NEARUSDT through an ETF for the first time. The fund also intends to stake its NEAR holdings, with rewards reflected in the fund. And look at the timing 😁 $NEAR was around $1.53 in August... recently touched $5.58. That's roughly a +260% move from the August low. Right now NEAR is around $4.99, still above EMA7 near $4.80 and EMA14 around $4.32. After a run like this, some cooling is completely normal... but $4.50-$4.80 is the area i want to see buyers defend. Clear $5.58 again and $6+ becomes VERY interesting. $BTCUSDT ETF is no longer just a filing or rumor... $NRR is officially here. 👀 #ByXIMPACT

🚨 $SOL INSTITUTIONAL DEMAND JUST EXPLODED!
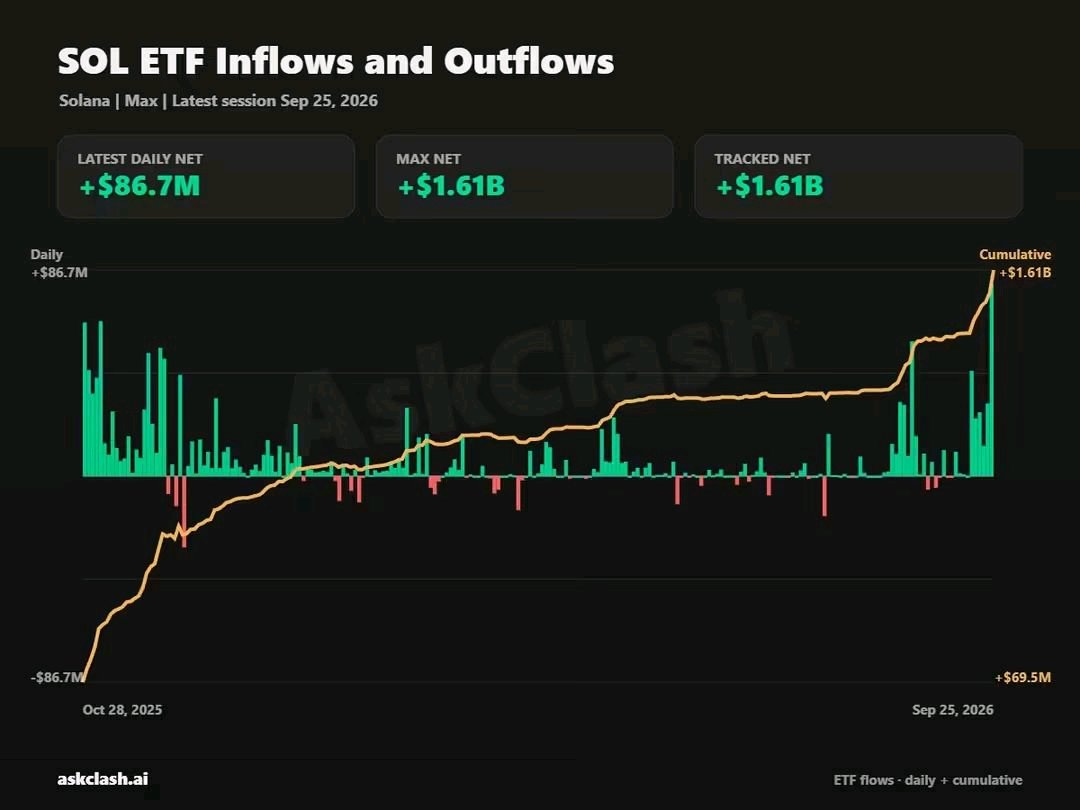
Okay... this is getting VERY interesting for Solana 😁 U.S. spot Solana ETFs pulled in around $188.2 MILLION in just one week, from Sept 21-25. And Friday alone brought roughly $86.7M... the largest single-day inflow since these products launched. But look at how close SOL came to Ethereum on that same session... $BTCUSDT ETFs: +$134.47M $ETH ETFs: +$86.95M $SOLUSDT ETFs: +$86.67M $XRP ETFs: +$22.65M SOL was basically neck-and-neck with ETH... only around $280K apart 👀 And look deeper into the weekly numbers... Bitwise's BSOL alone attracted ~$128.4M, roughly 68% of the entire SOL weekly inflow. Total cumulative net inflows into U.S. Solana ETFs have now reached around $1.6 BILLION. Now connect that with what SOL itself has been doing... Solana was around $70.60 at the end of July. Yesterday it touched $124.59. That's roughly a +76% move from that low... while institutional money is flowing into SOL through regulated ETF products at the same time. And remember what we discussed earlier... Pump.fun has reportedly been selling millions of SOL over time, yet price keeps absorbing that supply and moving higher. For me that's the bigger story. ETF demand is accelerating + selling pressure is being absorbed + price is still pushing toward new local highs. On the chart, $125 is the immediate level i want to see cleared properly. Above that... 🎯 $130 → $150 And on pullbacks, $118-$120 is still the first area i would watch before the stronger $110-$114 zone. SOL doesn't need to go straight up... after this run, corrections are completely normal. #ByPick-MakeYourPickCount But when Solana ETFs are pulling $188M in one week, almost matching ETH's daily inflows on the strongest session, while SOL itself is already up around 76% from the July low... I am definitely not ignoring what institutional money is doing here. 👀

🚨 MICHAEL SAYLOR HINTS AT ANOTHER $BTC BUY!
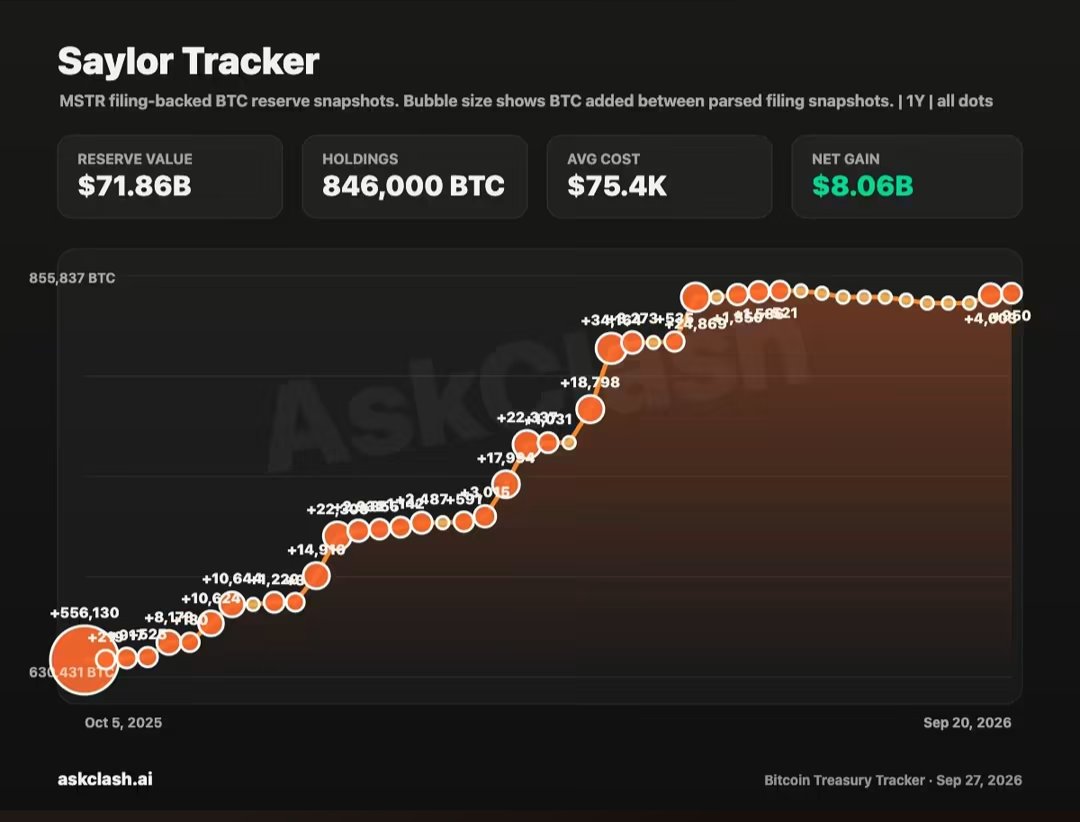
Okay... Saylor is doing it again 😁 He just posted an updated Strategy Bitcoin tracker with only three words: “Even more orange.” Those orange dots represent Strategy's Bitcoin purchases... and Saylor has repeatedly used these tracker posts around new accumulation announcements. So this is being read as another potential $BTCUSDT buy signal. And remember... Strategy literally just bought 950 BTC for $75.7 MILLION last week at an average price around $79,670. That pushed its holdings to: 🔥 846,000 BTC 💰 Around $63.8 BILLION total acquisition cost 📊 Average purchase price around $75,416 per BTC That's already more than 4% of Bitcoin's maximum 21M supply. And now Saylor is already hinting at “even more orange.” This is exactly what i was talking about earlier guys... Corporate $BTC demand is not disappearing just because Bitcoin is trading above $80K. Strategy keeps accumulating... Strive is accumulating... and BTC has now pushed back above $85K. If Strategy confirms another purchase after this hint, i will be watching the amount + average buying price VERY closely. Because if they're still aggressively adding around $80K-$85K... $ETHUSDT Retail waiting for the “perfect cheap entry” might be #ByXIMPACT waiting for something these companies clearly aren't waiting for 😁

🚨 $SOL KEEPS CLIMBING WHILE PUMP.FUN KEEPS SELLING
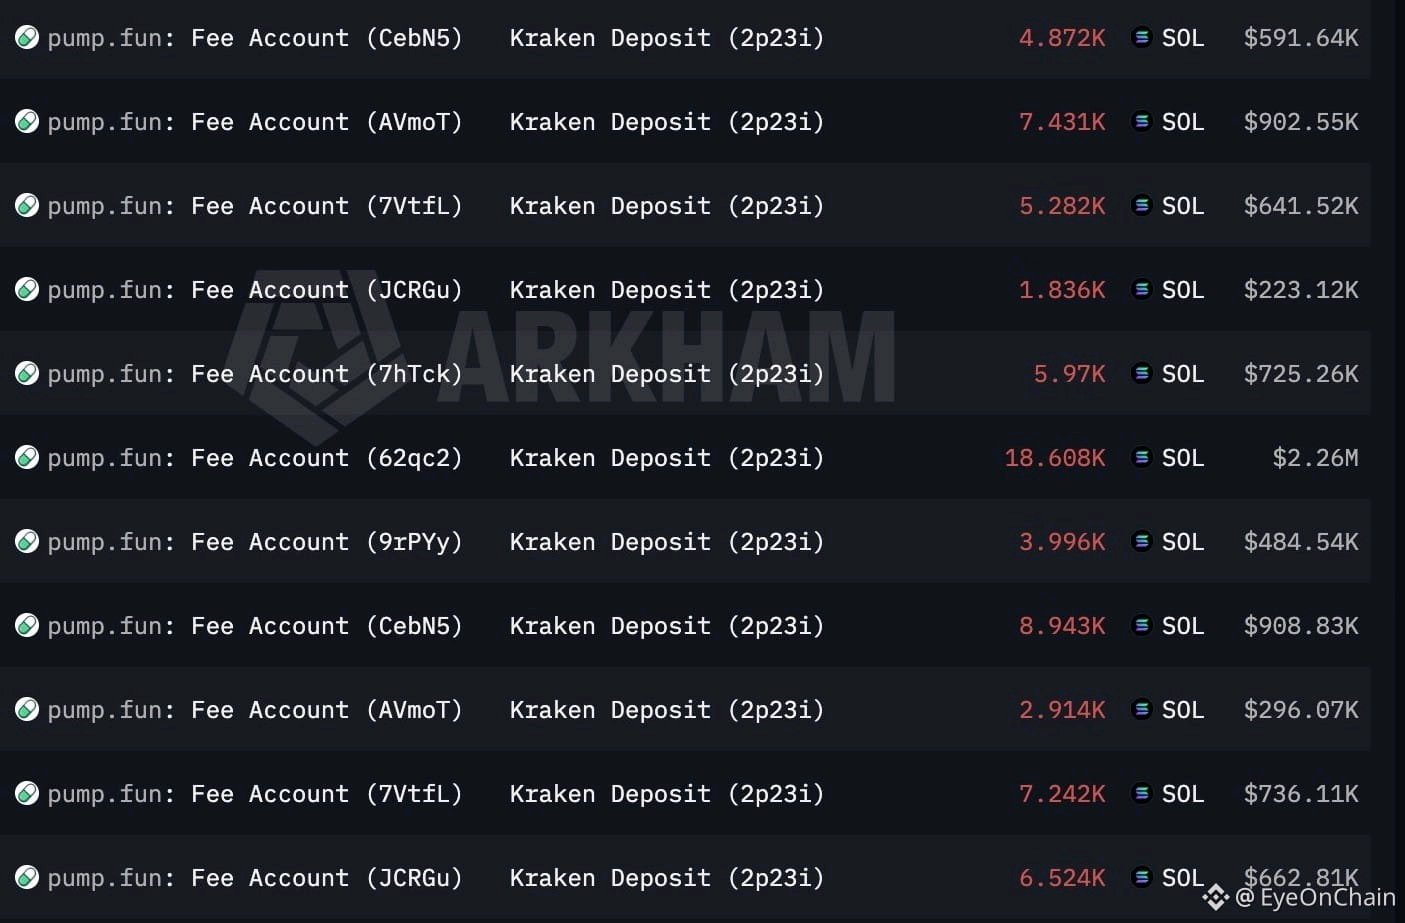
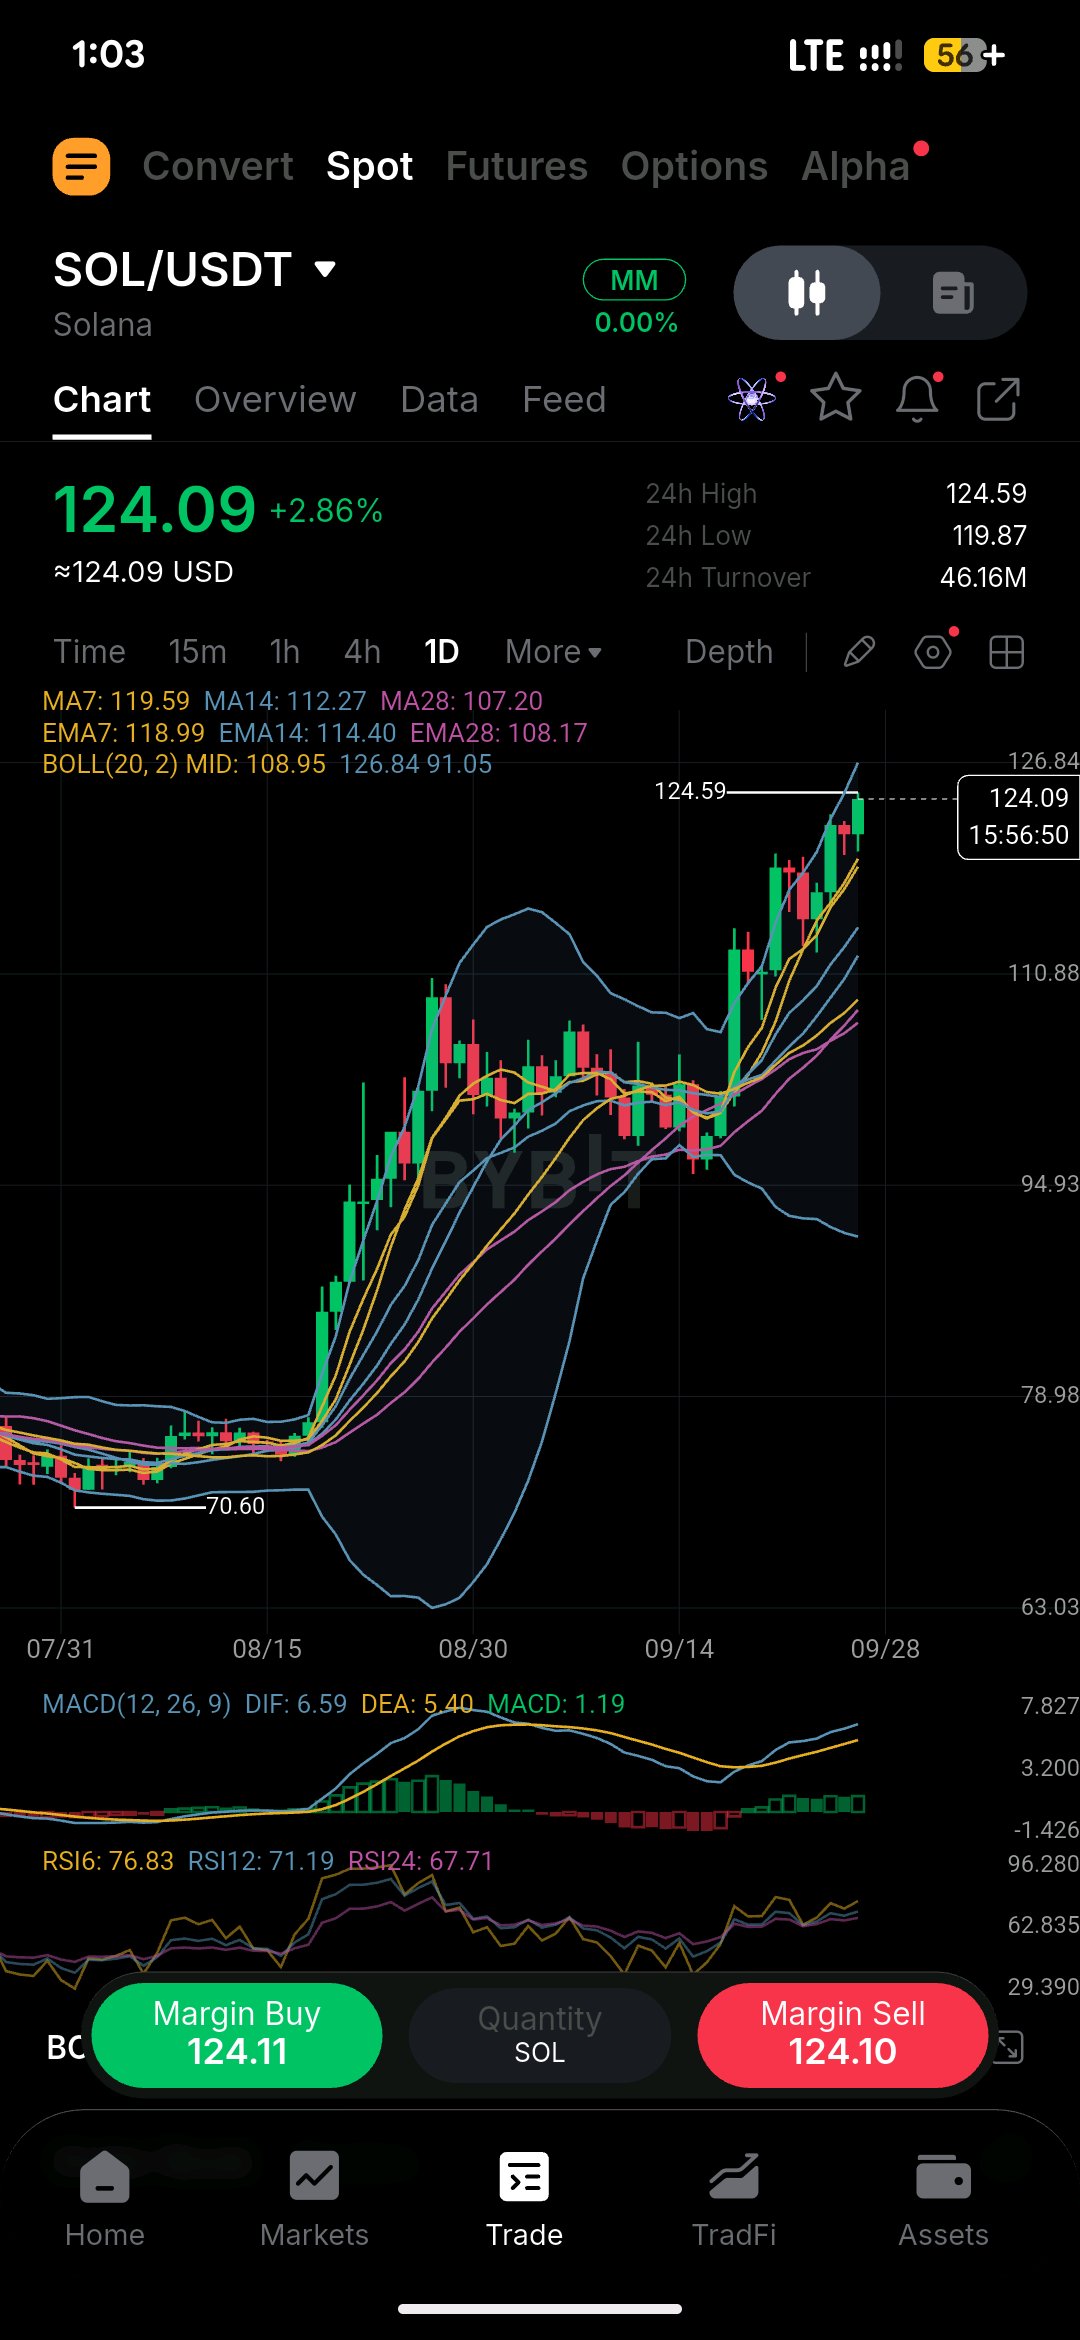
This is actually getting interesting guys... Pump.fun reportedly sold another 47,994 $SOLUSDT worth around $5.83M just a few hours ago. That brings its reported total sales to roughly 5.236 MILLION SOL worth ~$848M, at an average selling price around $162 per SOL. So basically... another chunky sell added to an already massive total. But look at what $SOL has been doing while all this supply keeps hitting the market 😁 Solana dropped as low as $70.60 in August... today it touched $124.59. That's roughly a +76% recovery from that low. And the daily chart is still pushing higher. $SOL is around $124, MA7 is near $119.6, EMA14 around $114.4 and EMA28 near $108.2. MACD is still positive and expanding... although RSI6 around 76.8 tells me the short-term move is definitely getting hot after this run. For me $118-$120 is the first important area on any pullback. Below that, $110-$114 becomes the stronger area i would watch. But if SOL clears $124.5-$125 properly... 🎯 $130 → $150 becomes very interesting for me. And honestly, the bigger story isn't one Pump.fun wallet selling. It's that Solana has absorbed millions of SOL in reported sales from Pump.fun while price has STILL recovered from $70 to $124. $BTCUSDT That's the kind of strength i care about. Pump.fun keeps selling $SOL... #PolyMarketPreIPO buyers keep absorbing it. So what happens when that selling pressure finally slows down? 👀
🚨 $BTC INSTITUTIONAL DEMAND KEEPS GROWING!
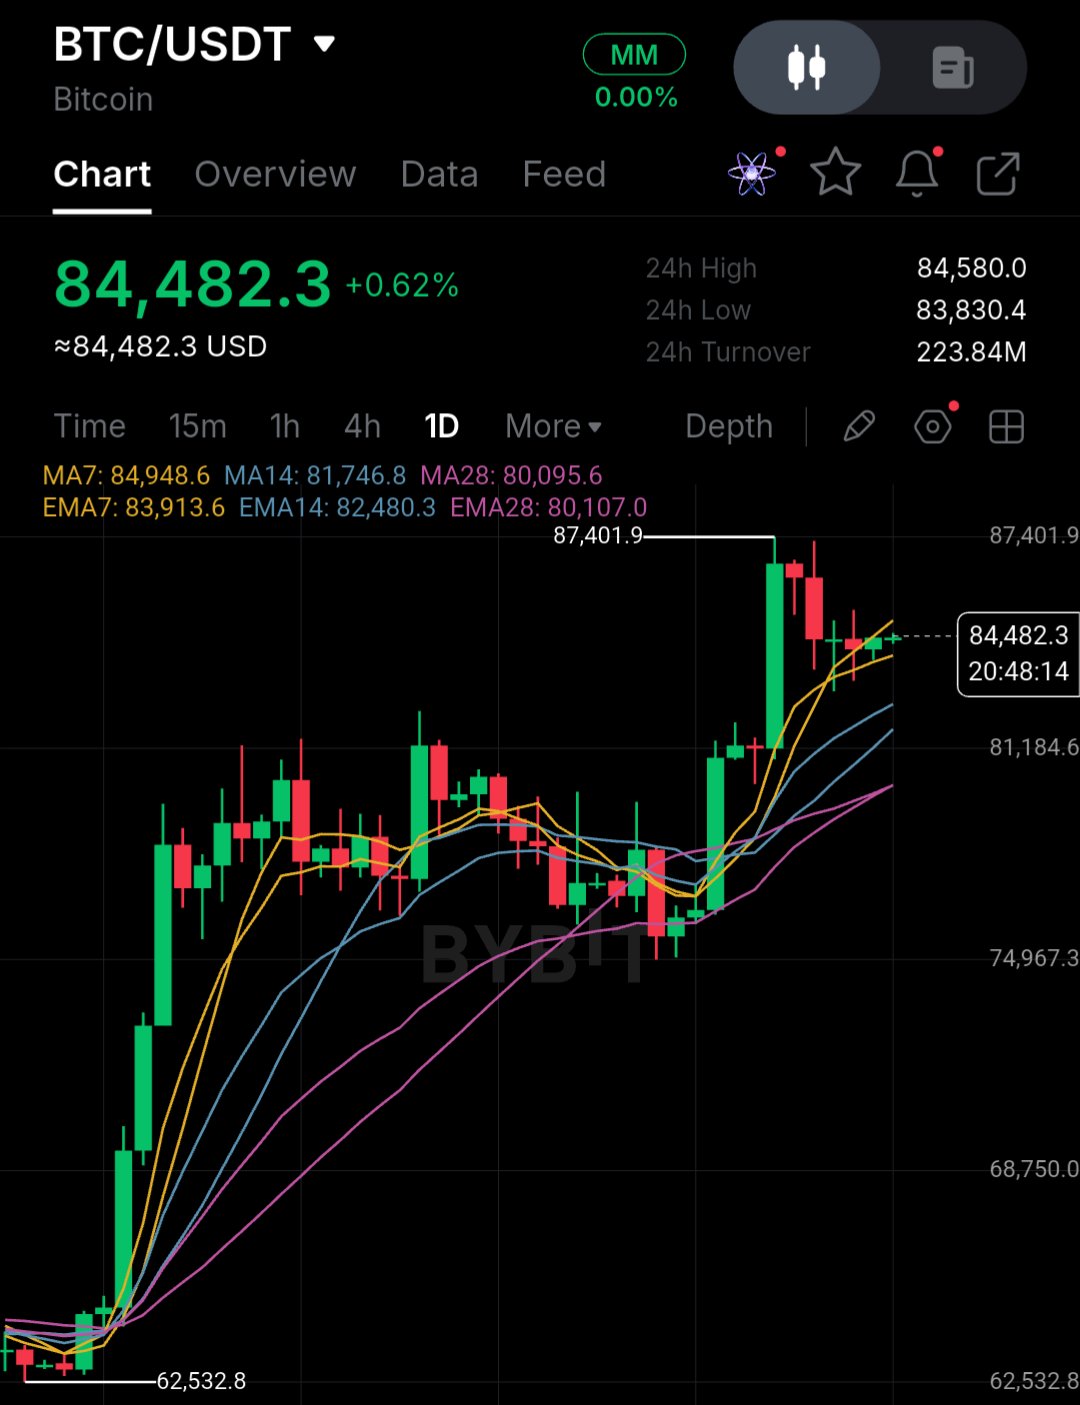
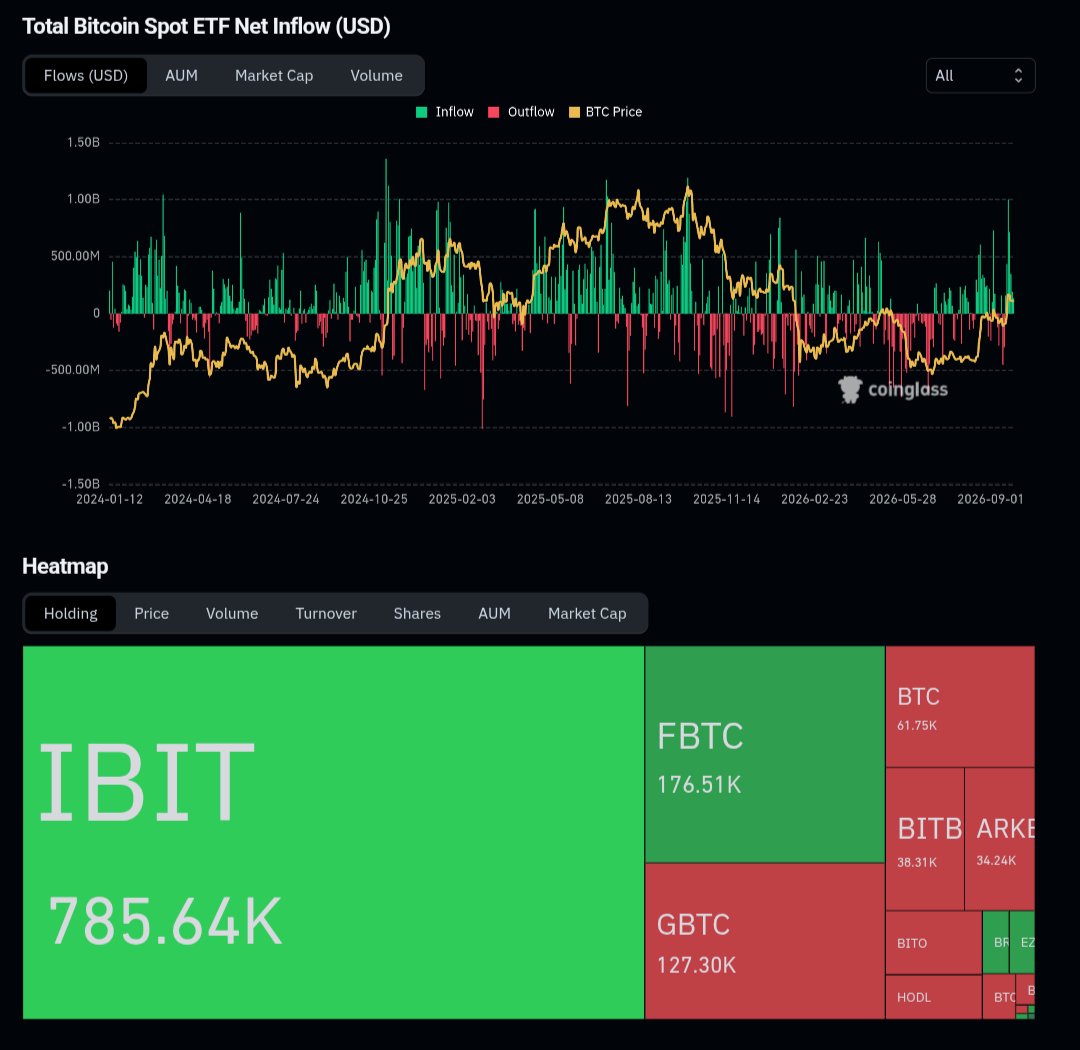
Bitcoin is trading above $84K... and major corporate buyers are STILL adding thousands of BTC around these levels. Strategy + Strive just added another 2,305 BTC worth roughly $183.4 MILLION combined. Strategy bought 950 BTC for ~$75.7M, at an average price around $79,670. That takes Strategy's total holdings to around 846,000 BTC... more than 4% of Bitcoin's entire 21M supply. And Strive was actually the bigger buyer this time... They added 1,355 BTC for ~$107.7M, at an average price around $79,475, taking total holdings to 26,355 BTC. So think about this... These companies were buying heavily around $79.5K-$79.7K... while BTC is now sitting around $84.5K. 📊 And the 1D chart is still holding pretty well. BTC is around $84,532, with EMA7 near $83.9K, EMA14 around $82.5K and EMA28 sitting near $80.1K. RSI is around 64-66 and MACD is still positive... strong momentum, but nothing stupidly overheated yet. For me $83K-$84K is the first area buyers need to keep defending. Below that, $80K-$82K becomes VERY important... interestingly, almost the same area where these latest corporate purchases were made. And above us? $BTCUSDT already touched $87.4K recently. Break $87.4K-$88K properly and i would start watching: 🎯 $90K → $95K → $100K Strategy + Strive are still accumulating thousands of Bitcoin around $80K... $ETHUSDT Meanwhile retail is still waiting for $BTC to become "cheap" again 😁

🚨 FINAL $BTC CAPITULATION IS COMING CLOSER!
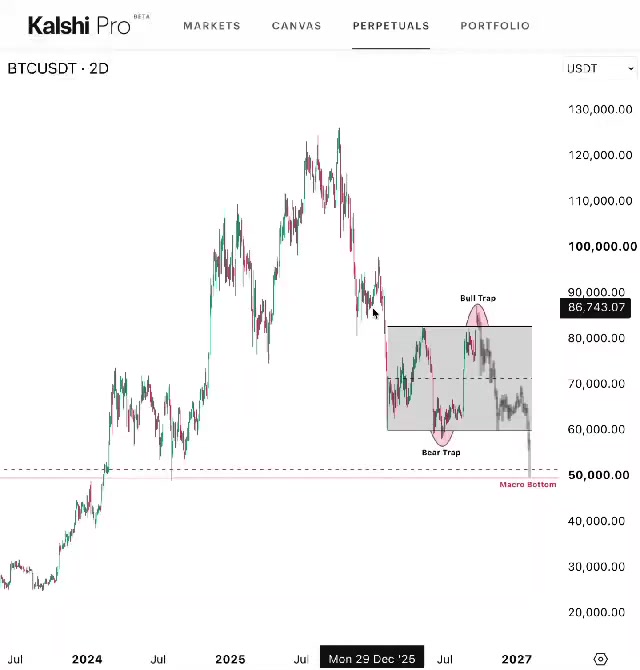
Each bear market final dump usually comes when nobody expects it... when the majority is already waiting for another pump. And recession odds hitting an all-time low around 20% on Kalshi tells us we might be exactly in that kind of place again. Everyone is getting comfortable. My $BTCUSDT plan remains: $88K → $80K → $75K → $70K → $54K macro bottom BTC is still trading inside the same huge range and we already swept liquidity on both sides. Now another push toward $85K-$88K can become the final bull trap before distribution starts. That would be the perfect setup psychologically... Everyone turns bullish again, starts calling for $100K+ and stops expecting any new lows. Meanwhile cycle timing still leaves room for one final capitulation... and we still haven't seen the real fear event that usually forms the macro bottom. Once this trap fails, i expect BTC to rotate back through the range and start accelerating if $70K breaks. That's where sentiment should finally break. And the move toward ~$54K is still where i expect the real macro bottom to form. Obviously this doesn't need to happen in one straight line... but this remains my bearish roadmap until the structure proves otherwise. $ETHUSDT
🚨 BTC JUST FLASHED 2 MAJOR BULLISH SIGNALS
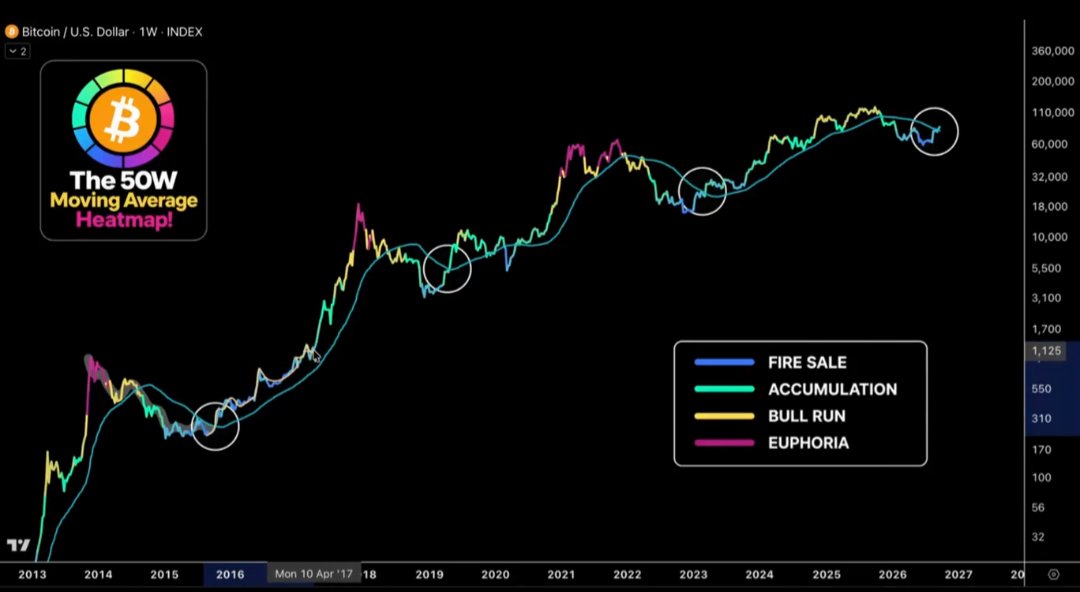
Okay... Bitcoin is back around $84.5K, but there are 2 things happening here that i wouldn't ignore. First... $BTCUSDT has reclaimed its 50-week moving average again. And look what happened around previous major 50W MA reclaims... In 2016, BTC reclaimed it before running roughly +7,800%. In 2020, another major reclaim came before roughly +1,500%. And in 2023, Bitcoin reclaimed it before eventually gaining more than +500% into the next major cycle high. Obviously i am NOT saying BTC is about to repeat those percentages 😅 But historically, getting back above this long-term level has mattered. And now there is another signal... After each of the last 3 U.S. CPI releases, gained roughly +6% within the following 8 days. 3 CPI releases... 3 positive reactions. Meanwhile the daily chart is actually pretty calm. BTC is around $84.5K after touching roughly $87.4K, still above EMA7 near $83.9K, while RSI has cooled around 64-66 instead of getting stupidly overheated. For me $83K-$84K is still the area bulls need to defend. Reclaim $87K-$88K again and suddenly $90K → $95K becomes very interesting. $ETHUSDT So we have BTC reclaiming a long-term level that mattered in previous cycles... while the last 3 CPI releases have ALL been followed by roughly +6% moves. Everyone is waiting for confirmation... #ByXIMPACT but what if $84K is already giving us one? 👀