Robin
7225Like0Shares77Fans6Follow
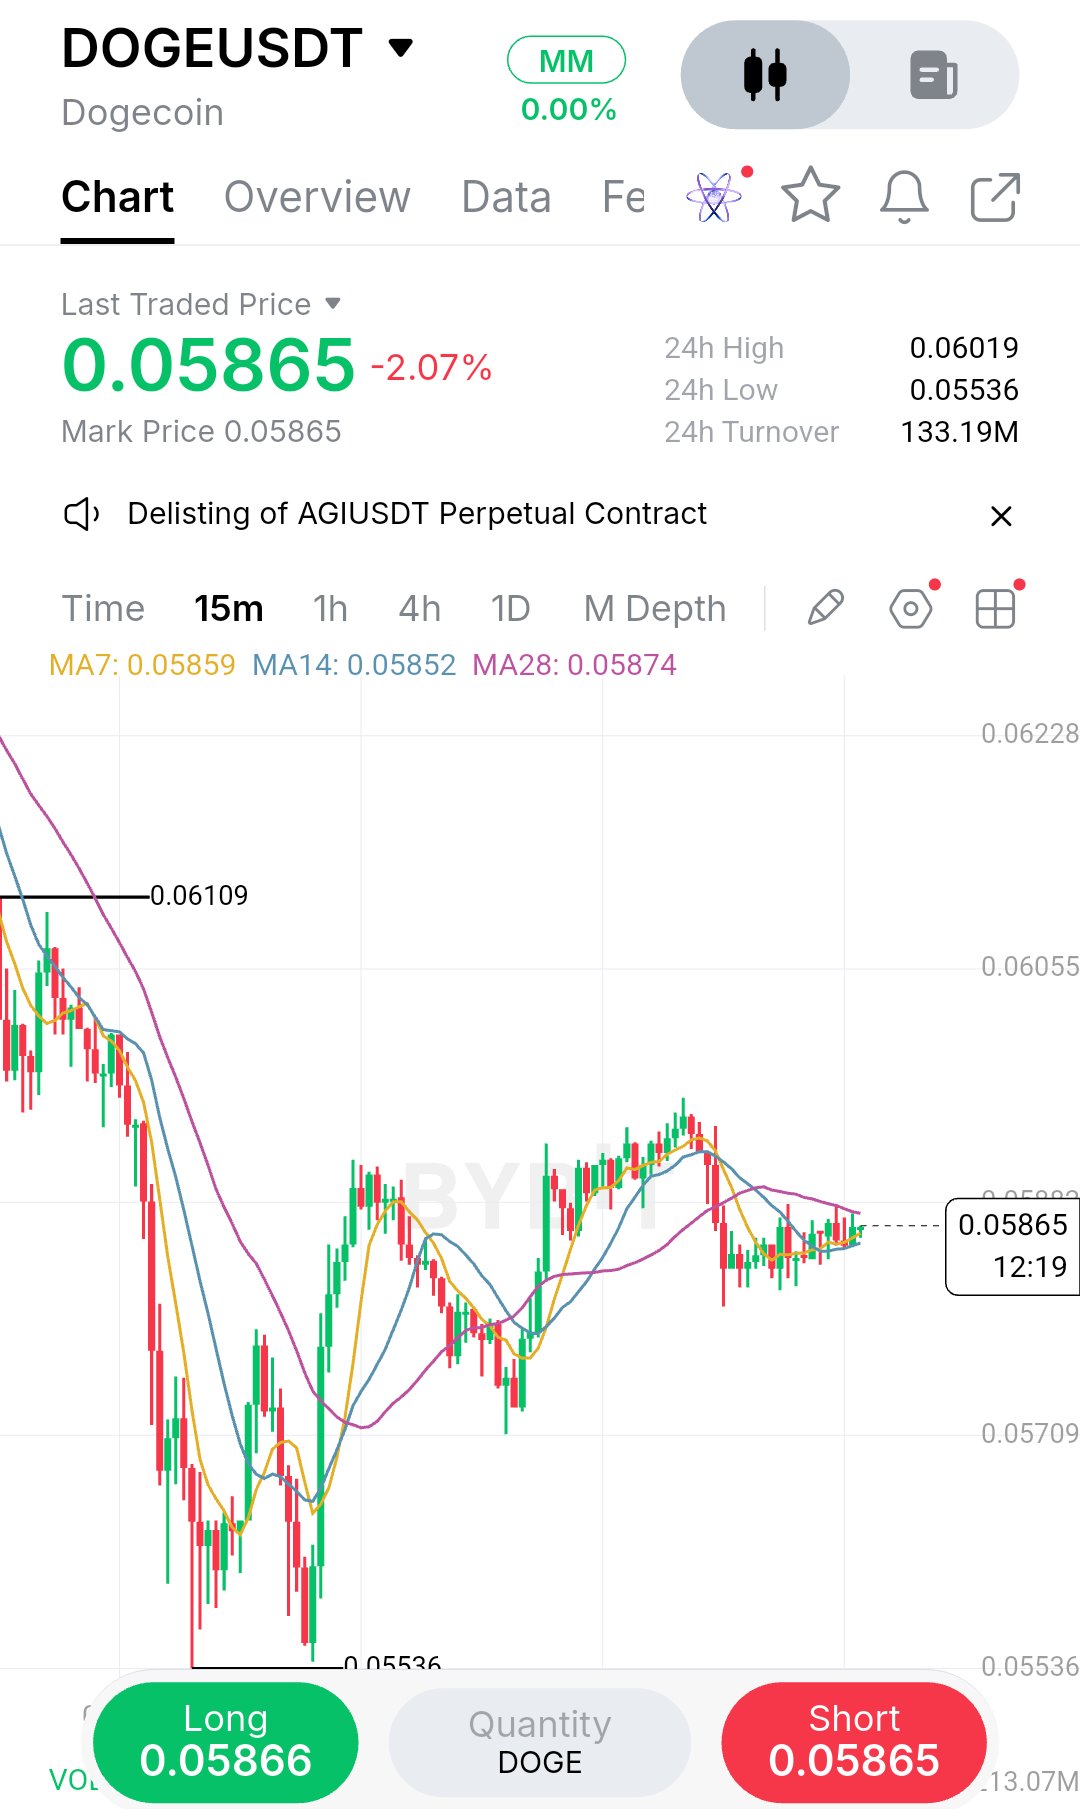
What caught my attention here is how DOGE is quietly coiling under the 28 MA after that violent flush to 0.05536. Everyone wants to catch the bottom, but this 15m chart still hasn’t proven a structural shift. I’m watching 0.05874 closely.Price is trapped between the flat 7 and 14 MAs and the 28 MA, which is acting like a ceiling. The bounce off the low was aggressive, but the lower high near 0.06109 keeps the broader downtrend intact. The market structure here is messy. We have a sharp sell-off, a V-shaped recovery, and now a tight consolidation right beneath a key moving average. That compression tells me the market is deciding its next move, and it hasn’t made up its mind yet. The 7 MA at 0.05859 and the 14 MA at 0.05852 are practically flat, meaning short-term momentum has stalled. The 28 MA at 0.05874 is the real gatekeeper. Until price reclaims that level with conviction, every rally is just a bounce inside a downtrend. Let’s look at both sides honestly. The bullish case is that the 0.05536 low held firmly, the recovery was fast, and the MAs are flattening, which often precedes a breakout. If buyers can push through 0.05880 and close above it, the trapped sellers above will be forced to cover, and that fuel could carry price toward 0.06050 and then the 0.06109 high. The bearish case is that the trend is still down, the bounce is weak relative to the drop, and the 28 MA has rejected price repeatedly. If sellers defend that level again, the low at 0.05536 becomes the obvious liquidity target. My read is neutral until we see a clean break. I’d rather wait for confirmation than guess which side wins. If price reclaims 0.05880 with a strong candle close, I’d consider a long scalp toward the previous supply zone. But if sellers defend that MA and price rolls over, the 0.05536 low becomes the next target, and I’d stand aside rather than chase a breakdown. Bias: WAIT (long on confirmation) Entry: 0.05885–0.05900 Confirmation: 15m close above 0.05900 Stop / Invalidation: 0.05780 TP1: 0.06050 TP2: 0.06100 R:R: 1.6 to 1 The biggest risk is a fakeout at the 28 MA. I’ve been burned entering before the candle closes.Now I wait for the retest. If price rejects and closes back under 0.0585, I cancel the idea and watch the low get swept. Are you waiting for the same reclaim, or fading this bounce? #ByXIMPACT #WSOT2026 $DOGEUSDT $HYPEUSDT
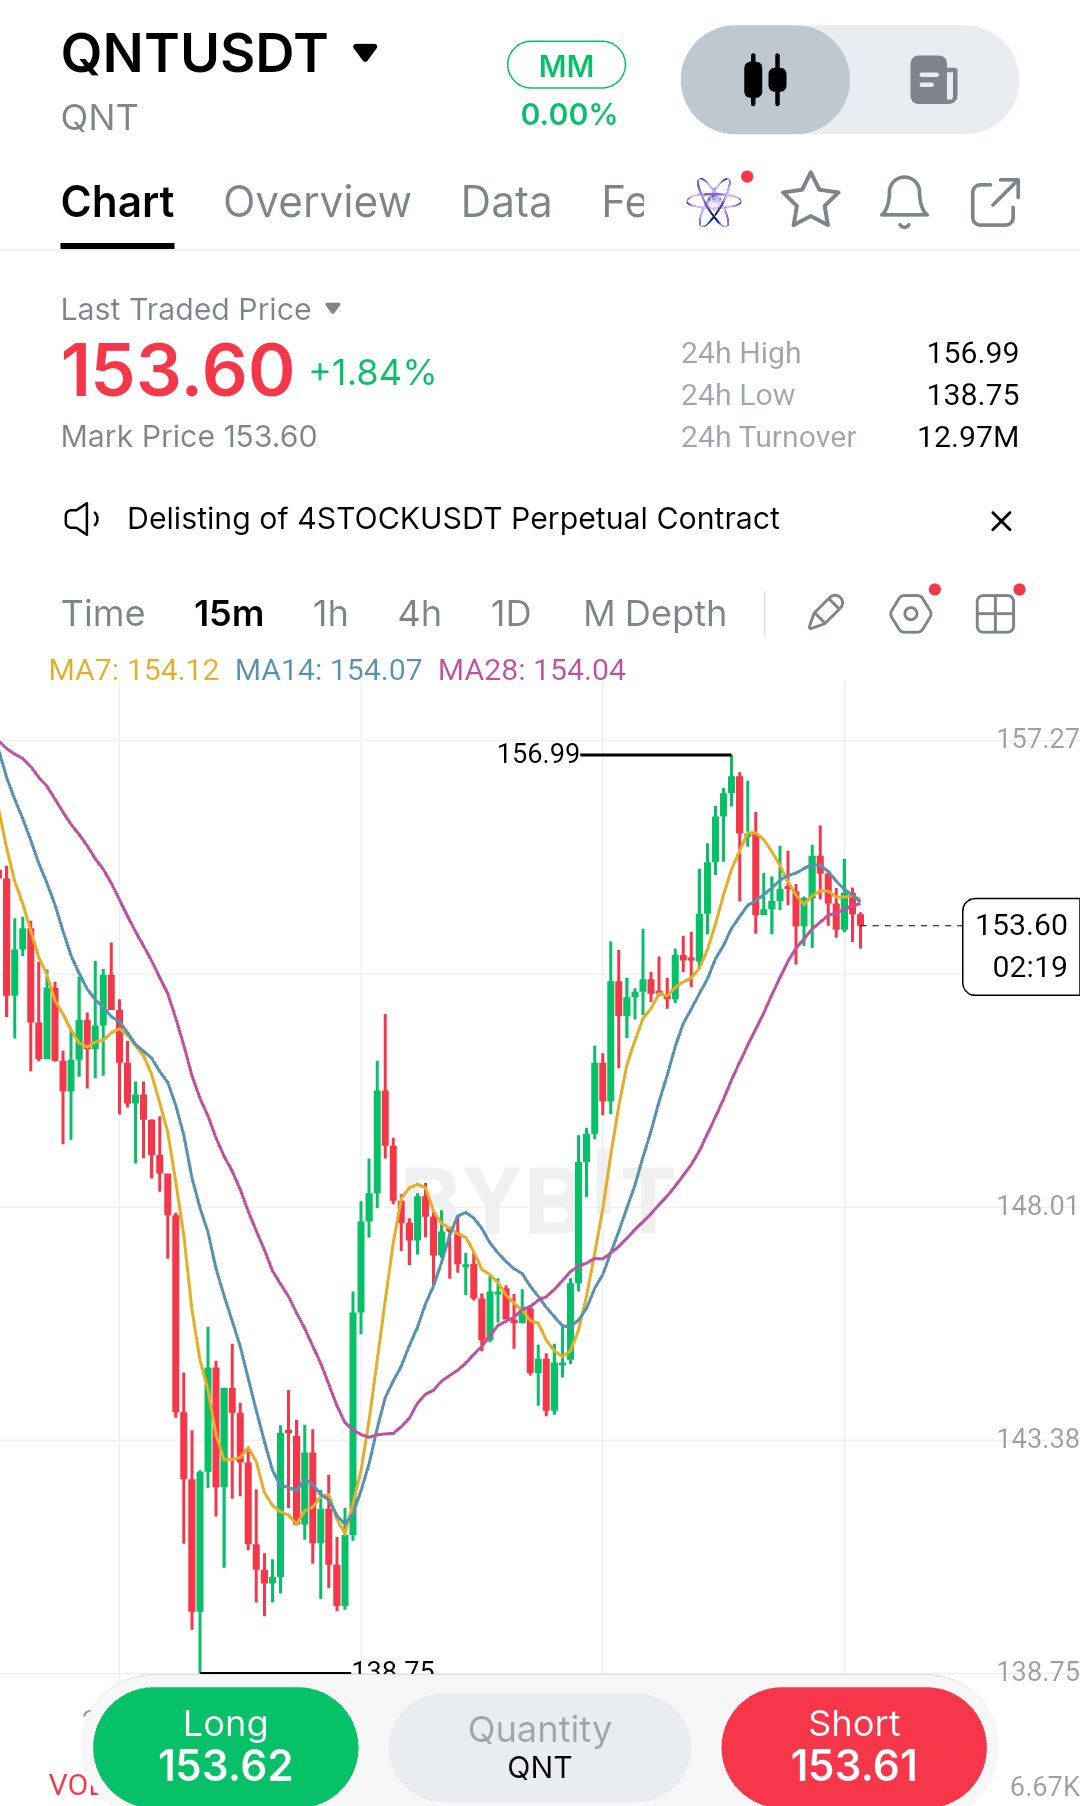
What caught my attention here isn’t the recovery from 138.75, but how the 15m chart is compressing right at the moving averages. Price is currently sitting at 153.60, tangled directly between the MA7 at 154.12, MA14 at 154.07, and MA28 at 154.04. After that massive run-up to 156.99, we are seeing a tight consolidation rather than a sharp rejection, which usually precedes a volatility expansion. My read is cautious. The broader structure is still recovering, but the immediate momentum has stalled. I’m not going to guess which way this breaks. The risk of a fakeout here is high because both buyers and sellers are fighting for control inside this tight MA cluster. I’d rather wait for price to pick a direction and close decisively outside this zone. Bias: WAIT (Breakout setup) Entry: 15m close above $155.00 or below $152.50 Stop / Invalidation: $154.50 for longs / $153.00 for shorts TP1: $156.99 (recent swing high) TP2: $148.01 (structural support) The lesson I keep in mind: trading inside compression is a gamble, not a strategy. Wait for the market to show its hand. If price just wicks out of the cluster and closes back inside, I stay flat. Are you anticipating a breakout here, or a fakeout? #ByXIMPACT #WSOT2026 $QNTUSDT $SPCXXUSDT
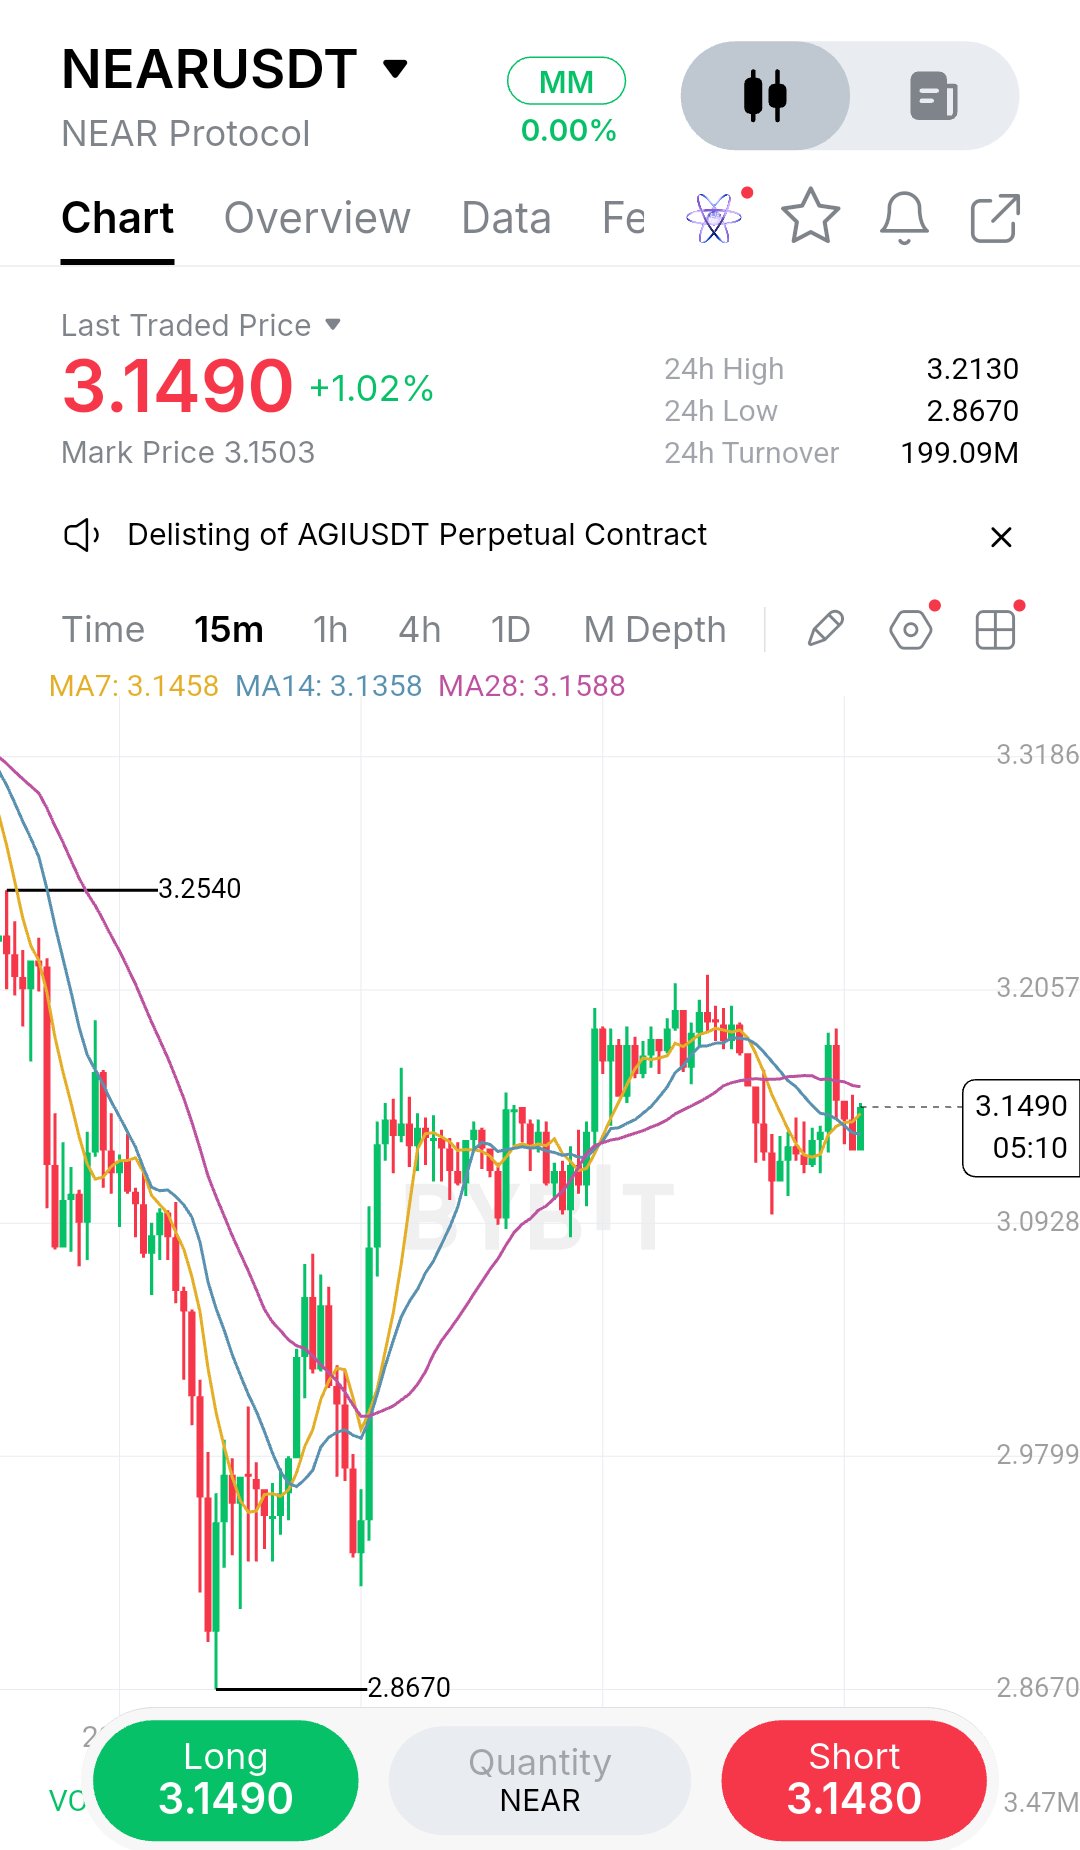
What caught my eye on this NEAR 15m chart isn't the bounce itself.It's the way price is getting squeezed right between the moving averages. After that sharp liquidity sweep down to 2.8670, we recovered and printed a decent rebound, but now we're sitting at 3.1490, grinding directly into the MA28 at 3.1588 and the MA7 at 3.1458. That tight cluster tells me the market is compressing, and compression always resolves with a decision. My read is that this is a pivotal zone. The bulls have done the hard work of reversing off the lows, but they haven't proven anything yet because they're stalled at resistance. Notice the recent swing high at 3.2057.If price rejects here, we risk forming a lower high and rolling back over. That's the trap I want to avoid. I'm not chasing this current candle; I'd rather wait for the actual breakout confirmation because entering in the middle of an MA cluster is how you get chopped up. The bullish case is straightforward: a clean 15m close above 3.16 clears the MA28 and opens the door to retest 3.2057, then the major structural resistance at 3.2540. The bearish case is that we're simply retesting broken support as resistance, and the bounce is just a relief rally in a downtrend. Until structure confirms otherwise, I lean cautious. Trade Plan: Bias: WAIT (Long on confirmation) Entry: 15m close above 3.1600 Stop / Invalidation: 3.1050 (below local consolidation) TP1: 3.2057 (recent swing high) TP2: 3.2540 (major structural resistance) R:R: 1:1.6 to TP2 The main risk here is a fakeout. If price wicks above 3.16 but closes back below the MA28, the thesis is dead and I'm flat. Patience pays better than forcing a trade in the middle of a cluster. Are you waiting for the break, or fading this resistance? #ByXIMPACT #WSOT2026 $NEARUSDT $SPCXXUSDT
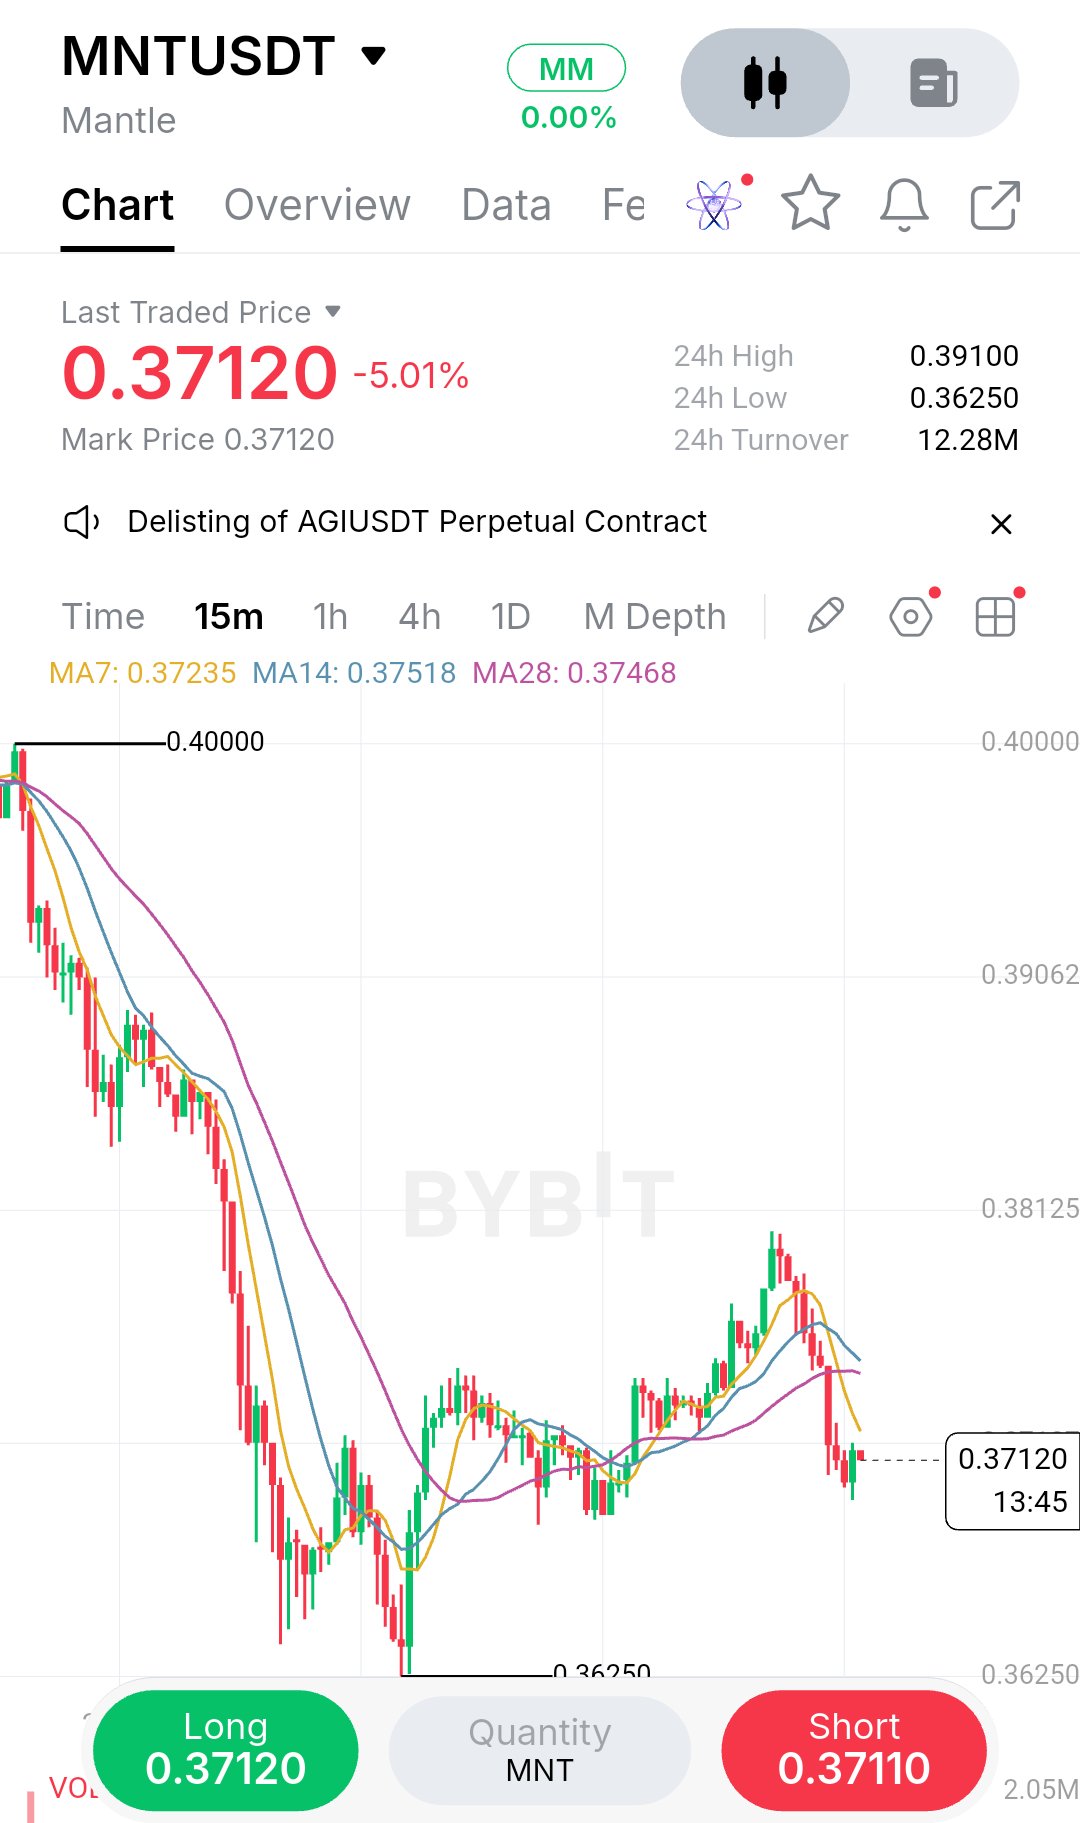
I’m watching this MNT 15m chart closely because the recent bounce attempt is failing right where it matters. Price tried to recover off the 0.3625 low, but the rally stalled and got rejected near the moving averages, and we’re now rolling over again into the low 0.3700s. That rejection tells me sellers are still in control of the short-term structure. If you look at the moving averages (MA7, MA14, MA28), they are clustered tightly between 0.3723 and 0.3746, acting as dynamic resistance. The price is currently trading below all of them, which reinforces the bearish bias on this timeframe. Here is my read. The trend remains heavy, and every green candle has been a selling opportunity rather than a real shift in momentum. The bounce off 0.3625 looks like a lower high formation in the making. I’m not going to rush in here. I’d rather see a clean break below the 0.3625 support to confirm a fresh leg down, or a strong reclaim above 0.3750 to signal the bears are losing grip. The 24h high of 0.3910 and the recent swing high near 0.3812 show where sellers previously stepped in aggressively, and until those levels are reclaimed, the path of least resistance remains down. Trade Plan: Bias: SHORT on breakdown Entry: 0.3620 (after a 15m close below support) Confirmation: Breakdown followed by a retest that fails to reclaim 0.3650 Stop Loss: 0.3710 (above the recent lower high) TP1: 0.3550 TP2: 0.3480 TP3: 0.3400 R:R: Roughly 1:2.5 to TP2 The main risk is a fakeout sweep of the lows that immediately reverses, so I need that close and retest before committing. If price reclaims 0.3750 instead, my short thesis is dead and I’ll step aside. I’ll manage the position by taking partials at TP1 and moving my stop to breakeven once the trade is in profit, ensuring I protect capital if the market turns against me. The key lesson here is patience: waiting for the confirmation candle and the retest is what separates a disciplined trade from a gamble. Are you watching for a breakdown here, or do you think the bounce has one more leg? #ByXIMPACT #WSOT2026 $MNTUSDT $SPCXXUSDT
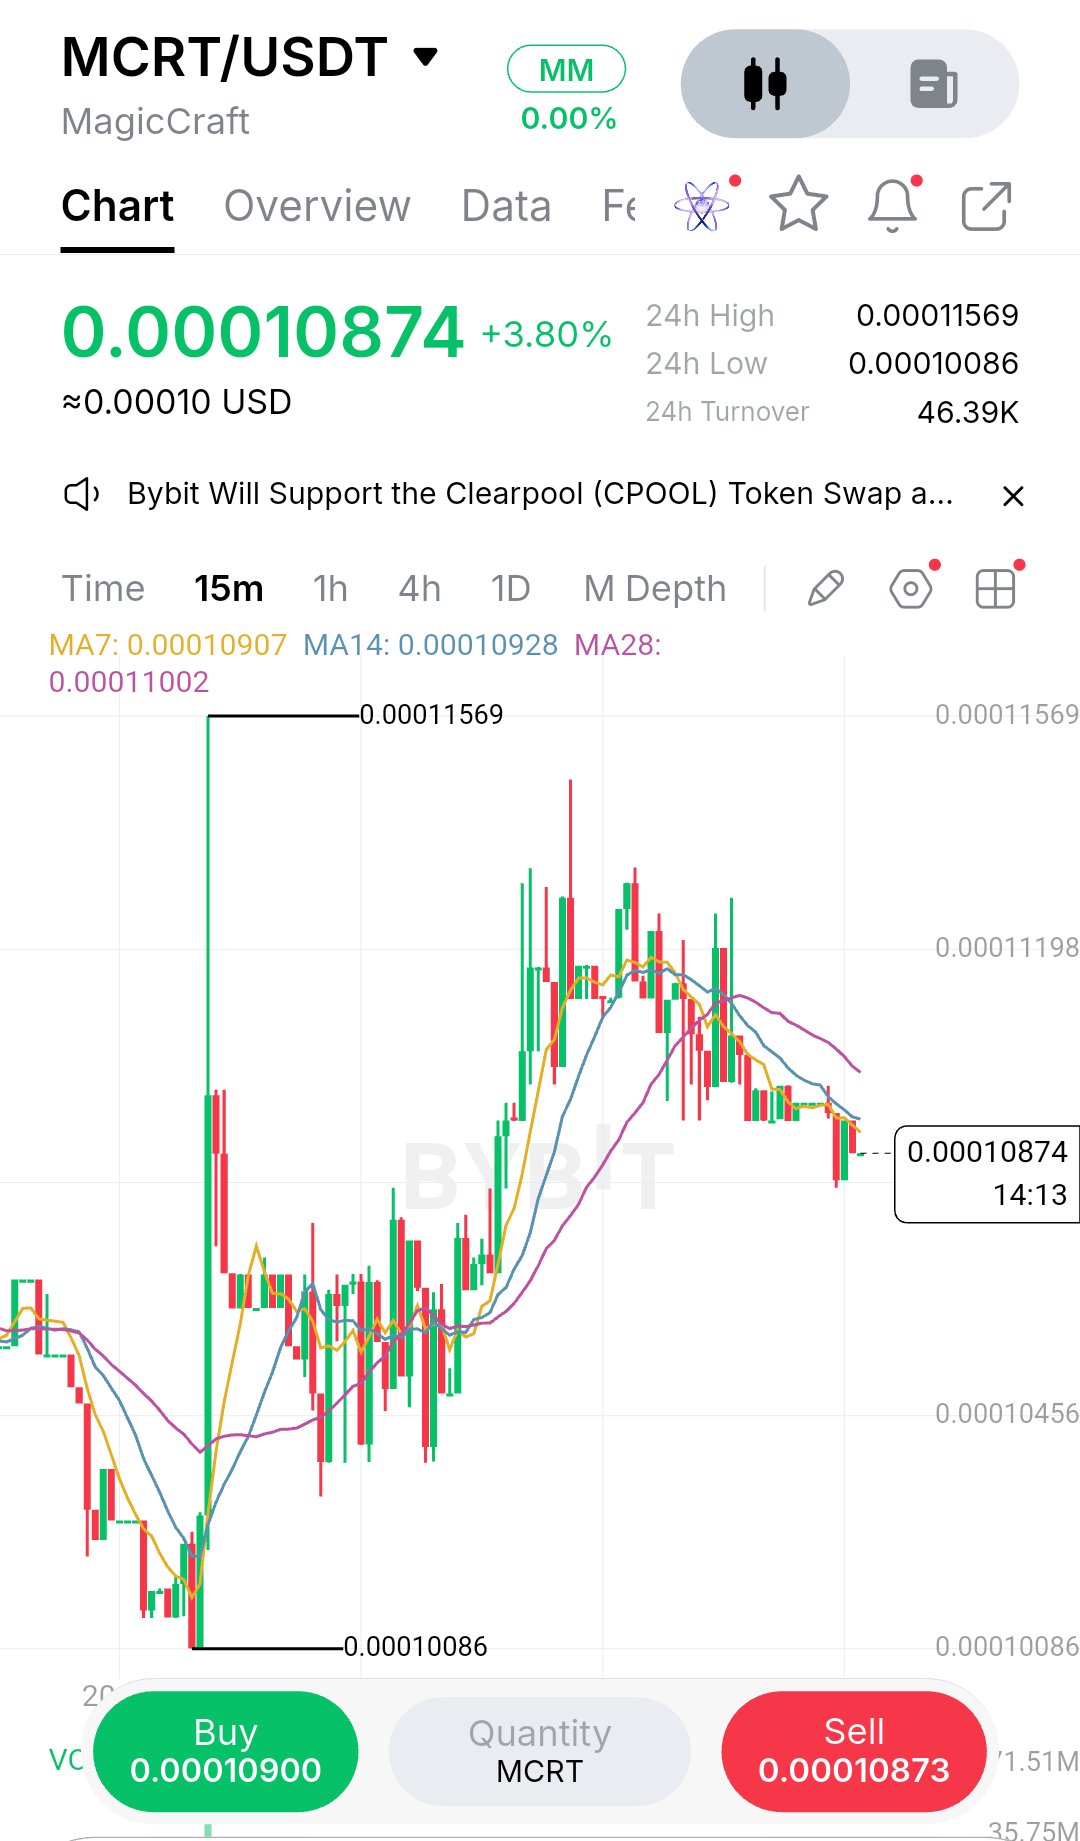
What caught my attention here is how MCRT is printing lower highs after that sharp run to 0.00011569, and now price is sitting right on a knife's edge. On the 15m chart, we’re at 0.00010874, pinned below the MA7 and MA14, which are acting as dynamic resistance. The real story is the 0.0001086 swing low .This is the line in the sand. If buyers lose this level, the market structure shifts bearish, and I’d expect a fast flush toward the 0.00010400 area. My read: I wouldn’t chase a long here because momentum is fading and sellers are controlling the short-term trend. The cleaner play is a breakdown-retest short, but only if we get confirmation. The reason I’m leaning bearish is the failure to hold the mid-range after that initial spike. The series of lower highs indicates buyers are getting exhausted, and the moving averages are curling downward, which adds pressure. Bias: SHORT Entry: 0.0001080 – 0.0001085 (on a confirmed 15m close below support) Confirmation: A 15m candle close under 0.0001086, followed by a weak retest that fails to reclaim the level. Stop/Invalidation: 0.0001105 (above the MA cluster) TP1: 0.00010450 TP2: 0.00010100 TP3: 0.00010086 (24h low) R:R: ~2.1R to TP2 The risk I’m most concerned about is a fake breakdown. If price sweeps 0.0001086 and immediately reclaims it with a strong green candle, that’s a liquidity grab, and I’d cancel the trade. I’ve learned to wait for the candle close and the retest rather than jumping in on the first break, because that’s exactly where the market loves to trap eager sellers. Patience here is key letting the structure confirm the direction before committing capital. Are you watching this support hold, or are you expecting a deeper flush? #ByXIMPACT #WSOT2026 $MCRTUSDT $SPCXXUSDT
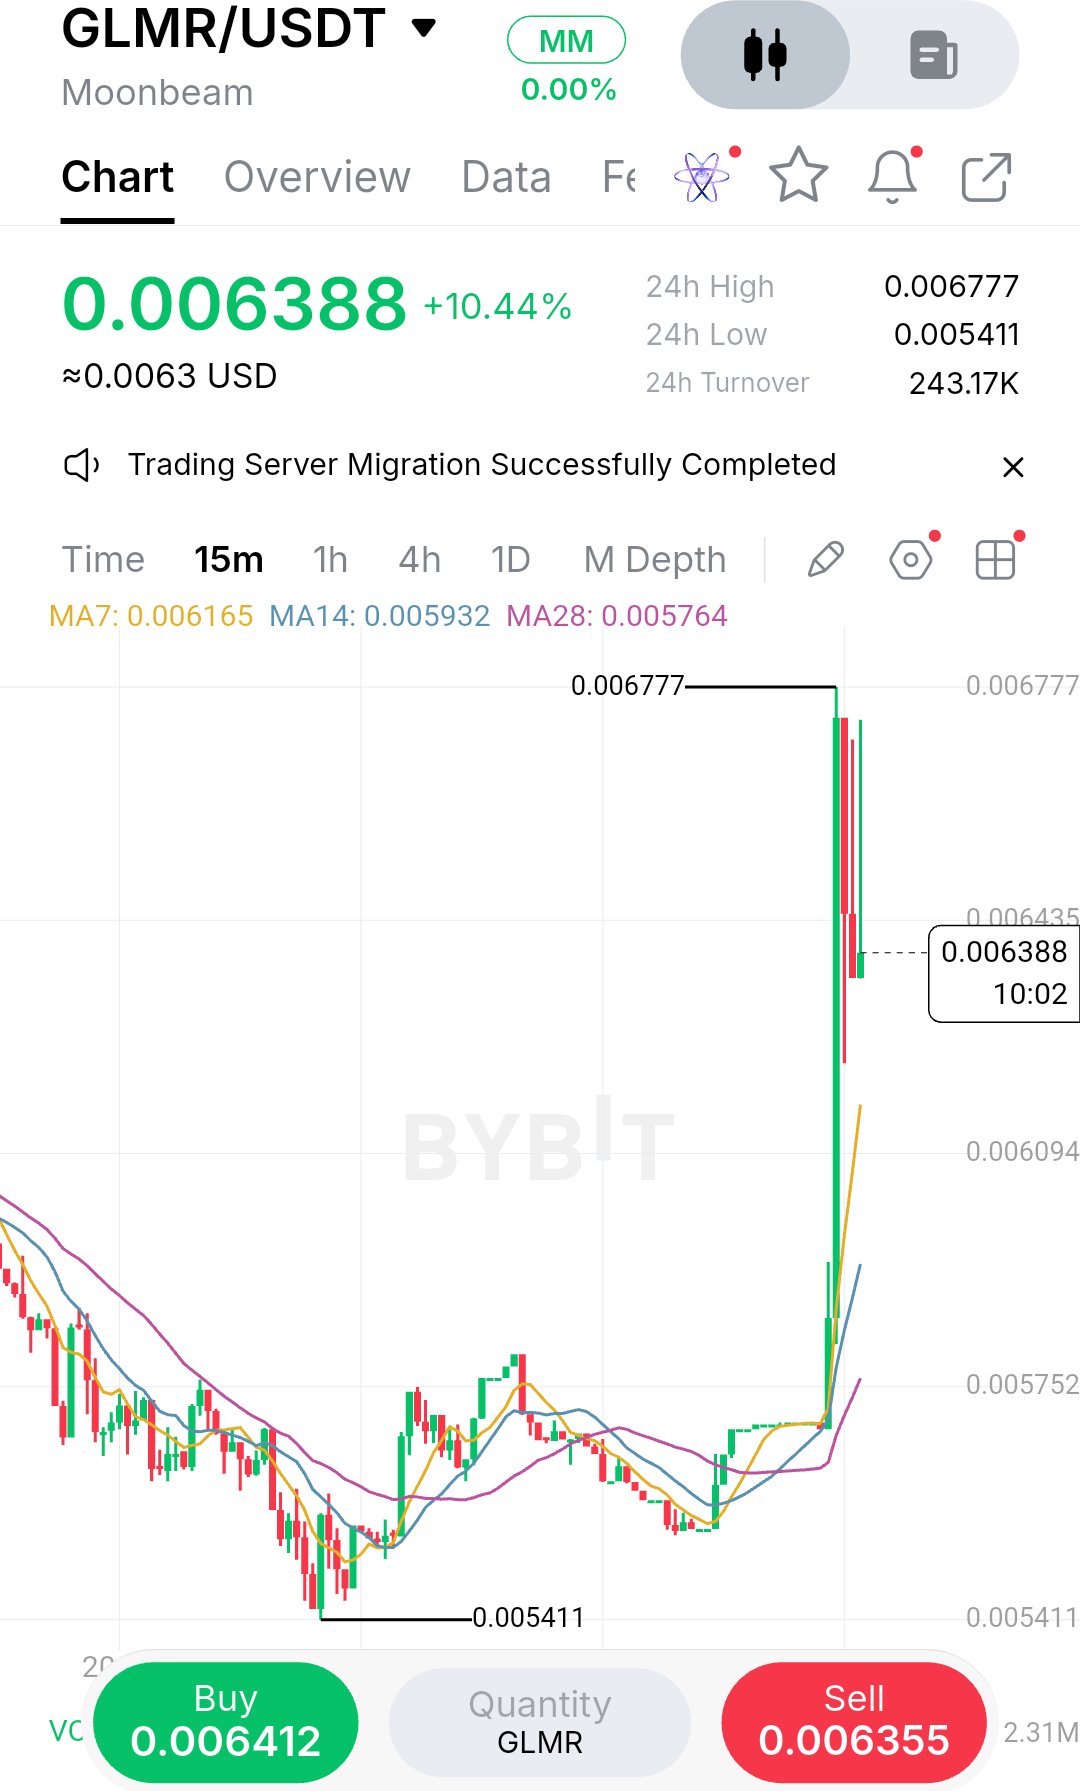
Watching a chart go vertical like this GLMR 15m pump is exactly when discipline matters most. Price ripped straight to $0.006777, but look at the rejection wick on that last candle. It immediately sold off to $0.006388. I’ve chased these parabolic spikes before, and it usually ends with me buying the exact top right before the retracement. The excitement of a sudden green candle can cloud your judgment, making you feel like you're missing out if you don't click buy immediately. But that is precisely when the risk to reward is at its absolute worst. The moving averages are completely lagging behind. The MA7 sits way down at $0.006165 while price is still hovering around $0.0063. This tells me the move is massively overextended and disconnected from its dynamic support. Chasing here is just asking to get trapped by a pullback. What catches my attention is the sheer volatility of that top wick.It shows there are plenty of sellers waiting to take profit at these highs. The structure only remains bullish if the buyers can actually hold the line above the moving averages. My read is to wait for the dust to settle. If this is a genuine breakout, price will eventually retest the $0.0061–$0.0060 area, allowing the moving averages to catch up. The part I like about this approach is that a successful retest gives us a much tighter stop loss, minimizing our risk. Patience is a trading edge, even if it feels boring. Trade Plan Bias: WAIT (Long on pullback) Entry Zone: $0.00600 – $0.00610 Confirmation: 15m bullish rejection candle off the MA cluster Stop / Invalidation: $0.00570 (below the MA28) TP1: $0.00677 (current high) TP2: $0.00720 R:R: ~1:2 to TP2 The risk is a complete rejection here that sends price straight back to the $0.0054 lows. If we lose the MA28 with momentum, the breakout failed. Do not enter before confirmation. Are you waiting for a retest, or fading this pump? #ByXIMPACT #WSOT2026 $GLMRUSDT $SPCXXUSDT
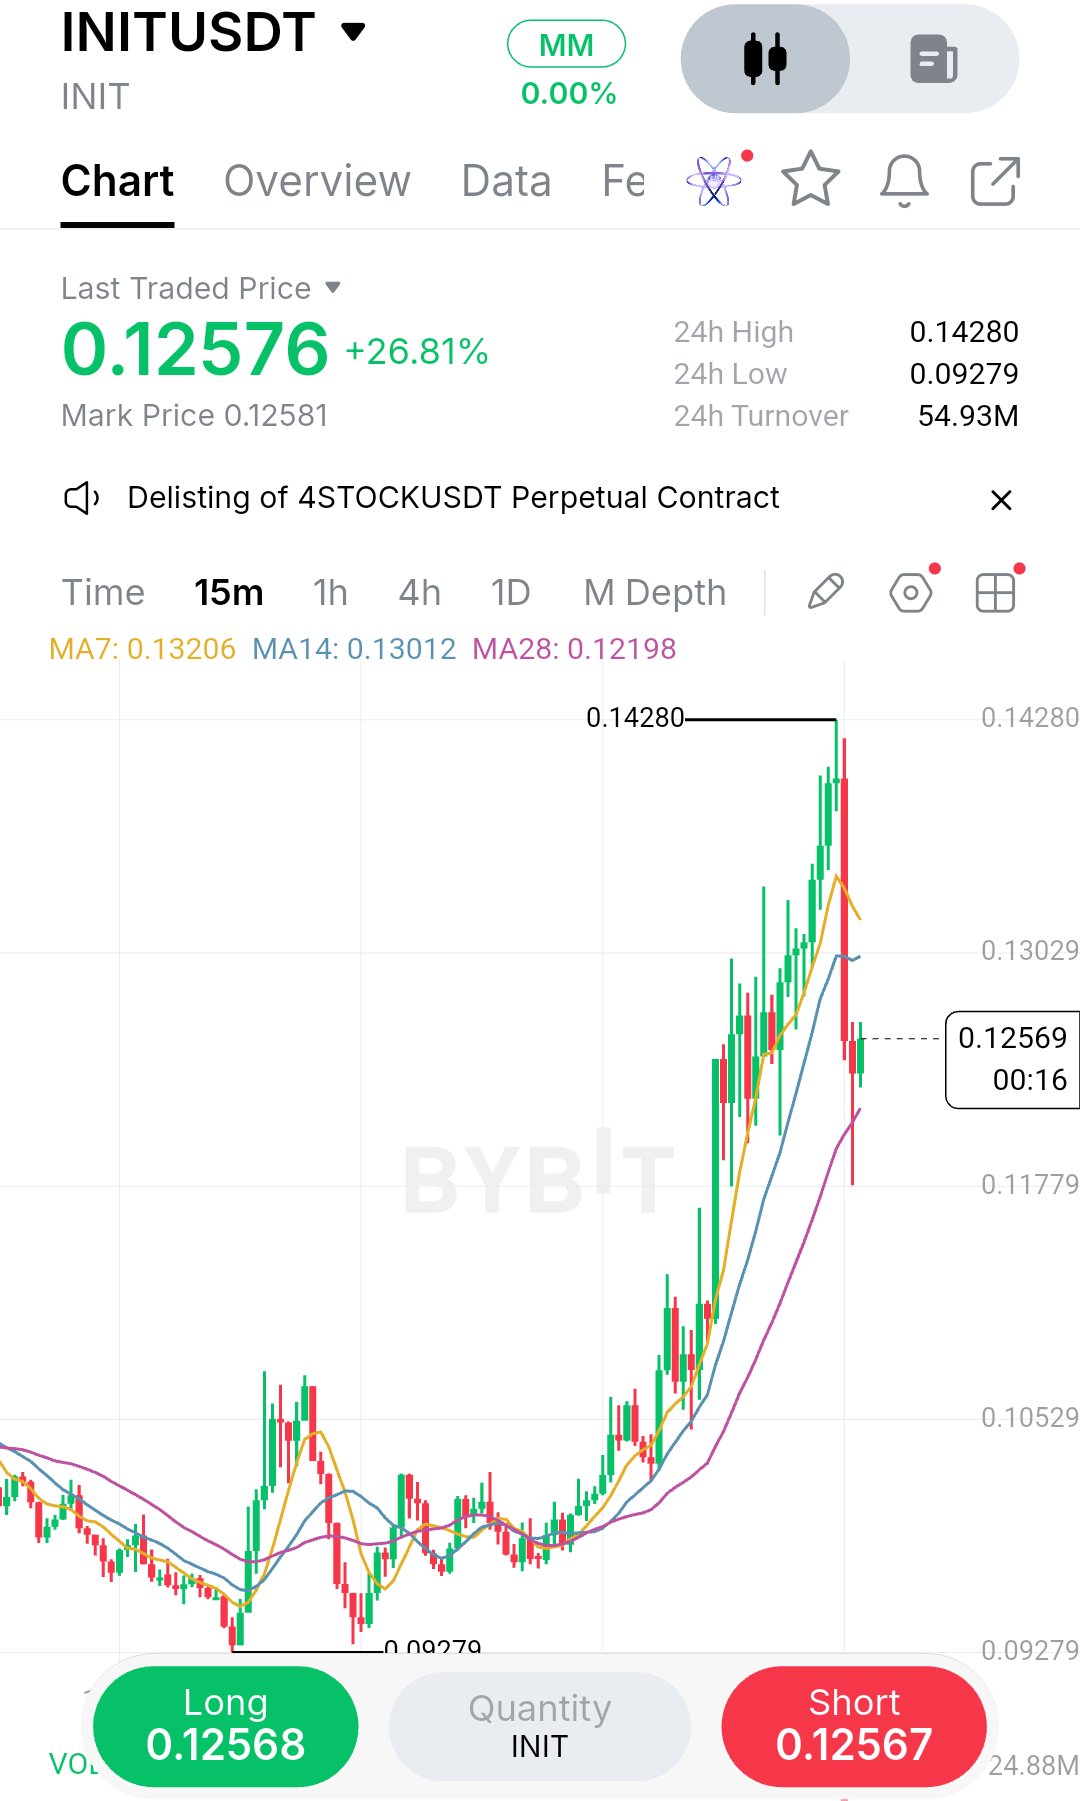
Seeing a coin rip +26% always tempts you to hit the buy button, but that massive rejection wick at the $0.14280 high tells a different story. I’ve chased tops like this before, and it rarely ends well when the structure looks this exhausted on the 15m chart. It’s easy to get caught up in the excitement of a vertical move, but that is usually when the smart money is quietly taking profits and leaving retail to hold the bag. What caught my attention is how violently price sold off from that peak, slicing straight through the MA7 ($0.13206) and MA14 ($0.13012) before finding temporary footing near $0.12576. That ugly red candle signals heavy supply and potential trapped late buyers who bought the breakout. The trend is still technically up, but this aggressive breakdown changes the near-term momentum. When a chart moves this fast and then rejects this hard, it usually needs time to digest the move, and the path of least resistance often flips lower in the short term. I wouldn’t touch a long here. Instead, I’m watching for a retest of the broken MA cluster. If price bounces back to $0.1300–$0.1320 but gets rejected, that confirms the higher-low structure is broken, and I’ll look for a short into the MA28 support. The part I like about this setup is that it offers a defined invalidation level right above the moving averages. If I’m wrong, I know exactly where to cut it. Trade Plan Bias: SHORT (on retest) Entry Zone: $0.1300 – $0.1320 Confirmation: 15m bearish rejection candle on the MA cluster Stop / Invalidation: $0.13400 (above the MA7) TP1: $0.12198 (MA28) TP2: $0.11800 R:R: ~1:2 The main risk is a sudden V-shaped recovery that reclaims $0.1320 and traps shorts. If we get a strong 15m close back above the MA7, the thesis is wrong, and I’m out. Position sizing matters here keep it tight. Personally, I’d stay patient until price comes to me.Don't force an entry at current price. Are you waiting for the retest, or trying to catch this falling knife? #ByXIMPACT #WSOT2026 $INITUSDT $AAPLXUSDT
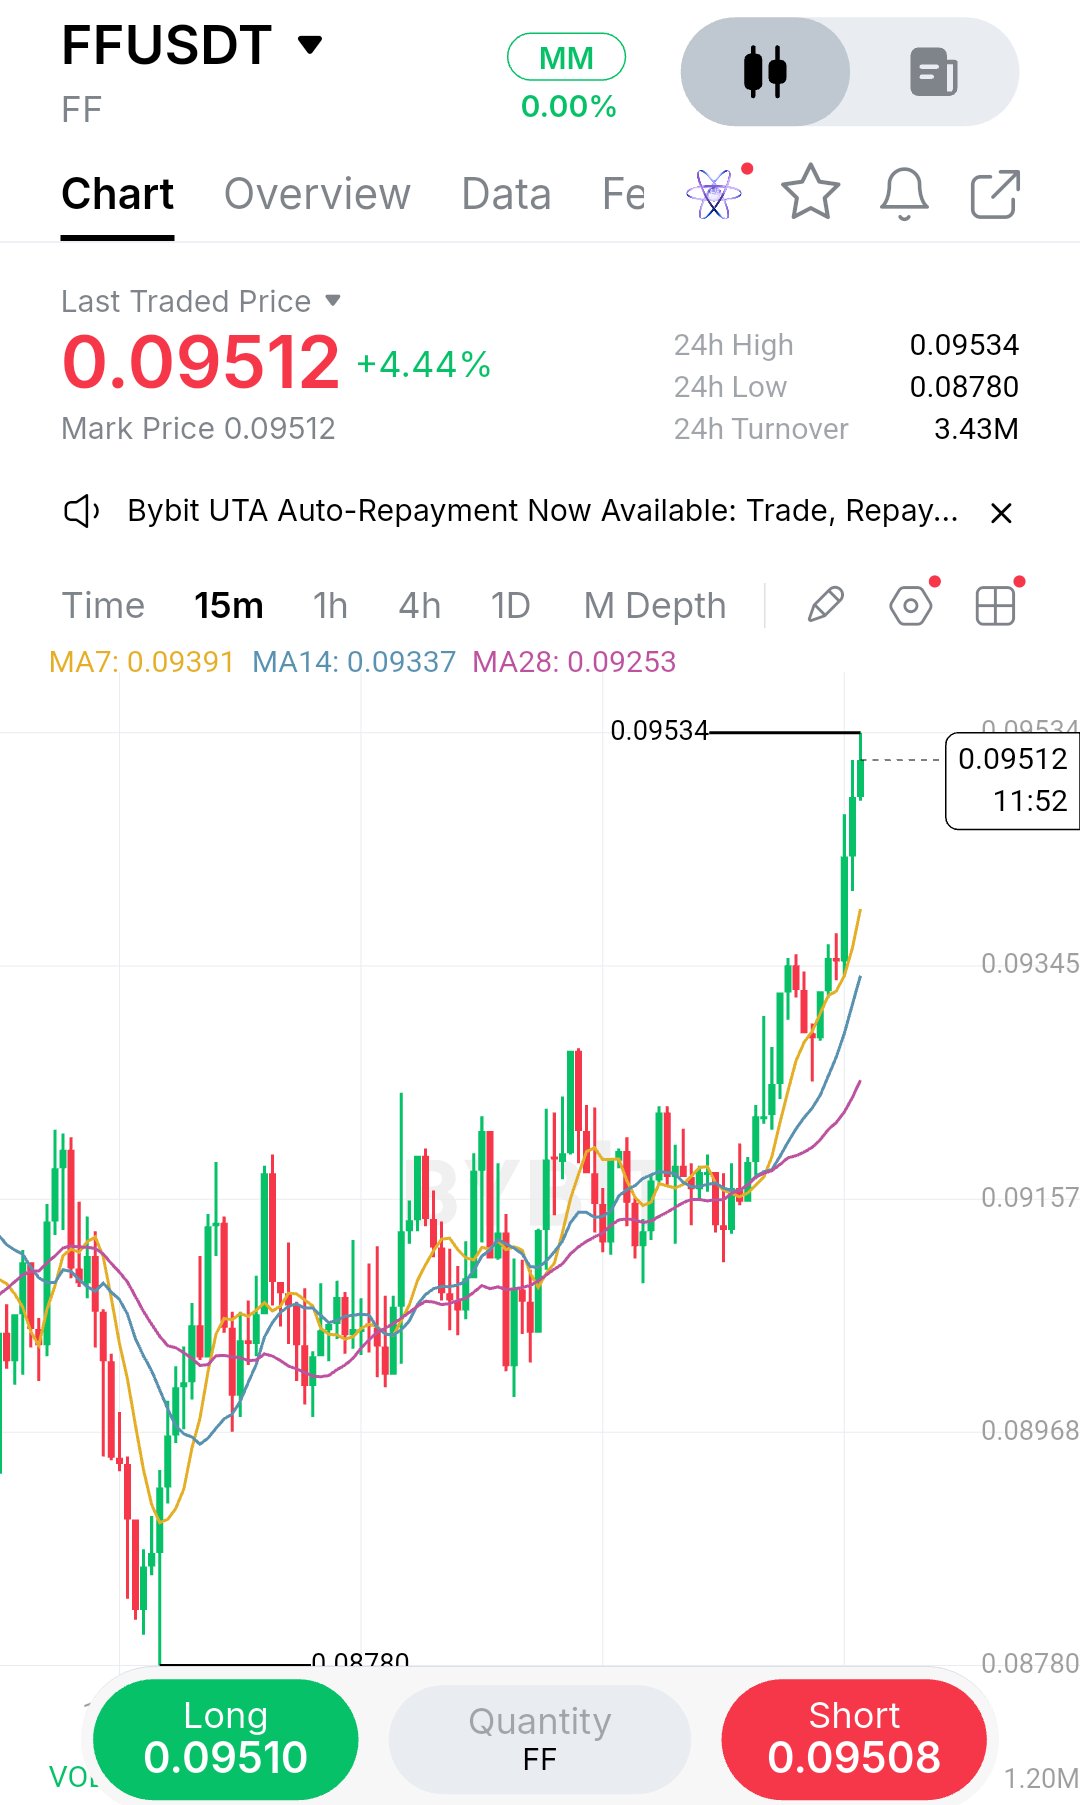
Watching a chart go parabolic always tests your patience. Seeing FF push to $0.09512 on the 15m looks like a great breakout, but the distance from the MA14 at $0.09337 tells me this move is overextended. I’ve chased these vertical runs before and usually ended up holding the bag when the inevitable pullback hit. It’s easy to get caught up in the momentum when the candles are this green, but that is exactly when risk management matters most. The local structure is definitely bullish, with clean higher lows and a stacked moving average setup (MA7 > MA14 > MA28). The trend is our friend here, but buying right at the high is poor risk management. You're essentially entering with a wide stop and hoping the momentum continues without any breathing room. I’d rather wait for price to cool off and retest the $0.0930–$0.0935 zone. If buyers defend that dynamic support, it gives us a much tighter invalidation and a clear defined risk. The part I like about this setup is that we can let the market show its hand first. If it's a real breakout, the retest will hold. If it’s a fakeout, we avoid the trap entirely. Trade Plan Bias: WAIT (Long on pullback) Entry Zone: $0.0930 – $0.0935 Confirmation: 15m bullish rejection candle (e.g., hammer) off the MA cluster Stop / Invalidation: $0.09180 (below the MA28) TP1: $0.09530 TP2: $0.09800 R:R: ~1:2 to TP2 The main risk is a breakdown below the $0.09250 MA28, which would signal a failed breakout and a deeper correction. If that breaks, I step aside. Do not force an entry if price blasts through $0.096 without a retest. Accept the missed move and protect your capital. Are you waiting for the pullback, or fading this top? #ByXIMPACT #WSOT2026 $FFUSDT $TSLAXUSDT
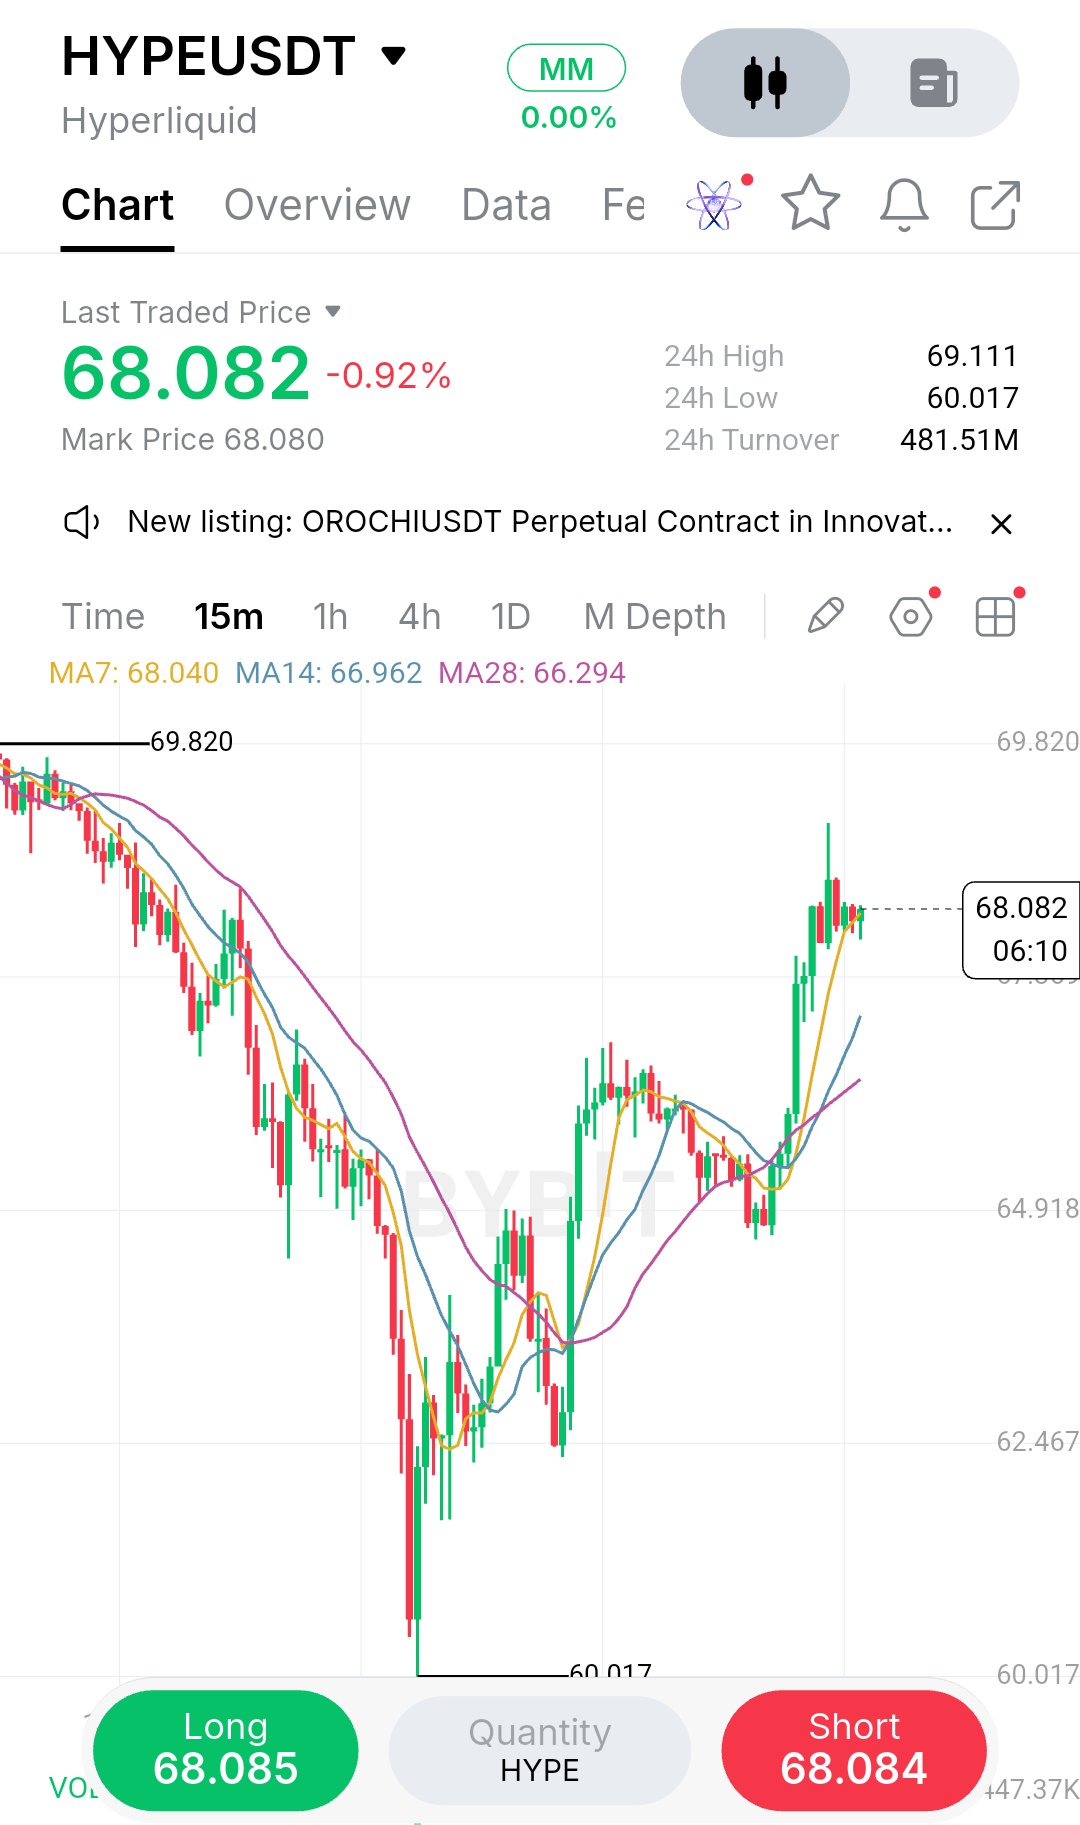
That violent wick down to $60.017 on the 15m chart was a textbook liquidity sweep, and the subsequent V-shaped recovery tells me buyers are defending this region aggressively. What catches my attention now isn't just the bounce, but how price is compressing right around $68 while the moving averages curl upward beneath us. This isn't a random spike; it looks like a deliberate shakeout to grab liquidity before a potential structural shift. My read is that the local structure has shifted bullish. We've printed a higher low off the sweep, and the MA7 ($68.04) is acting as immediate dynamic support. However, I wouldn't chase this move right into the $69.82 resistance level. That's a major supply zone from the previous breakdown, and it’s exactly where late longs could get trapped if momentum stalls. I've made the mistake of buying the top of these V-shapes before, and it usually ends with a quick stop-out. Patience pays here. I’d rather wait for a clean retest of the $66.20–$67.00 area where the MA14 ($66.96) and MA28 ($66.29) cluster to see if the buyers step back in. If we get a bullish rejection there, that's a much better risk-to-reward entry than buying the current high. Trade Plan Bias: WAIT (Long on pullback) Entry Zone: $66.20 – $67.00 Confirmation: 15m bullish rejection candle (like a hammer) off the MA cluster Stop / Invalidation: $64.80 (below the recent higher low) TP1: $69.80 (current swing high) TP2: $72.00 R:R: ~1:2.5 to TP2 The main risk is a complete rejection at $69.80 that leads to a lower high, invalidating the reversal. If price breaks and closes below $64.80, the bullish thesis is dead, and I’m stepping aside. I’d also cancel the idea if price just blasts through $70 without a pullback.I don’t chase. Are you waiting for the retest of $67, or are you shorting this bounce at resistance? #ByXIMPACT #WSOT2026 $HYPEUSDT $SPCXXUSDT
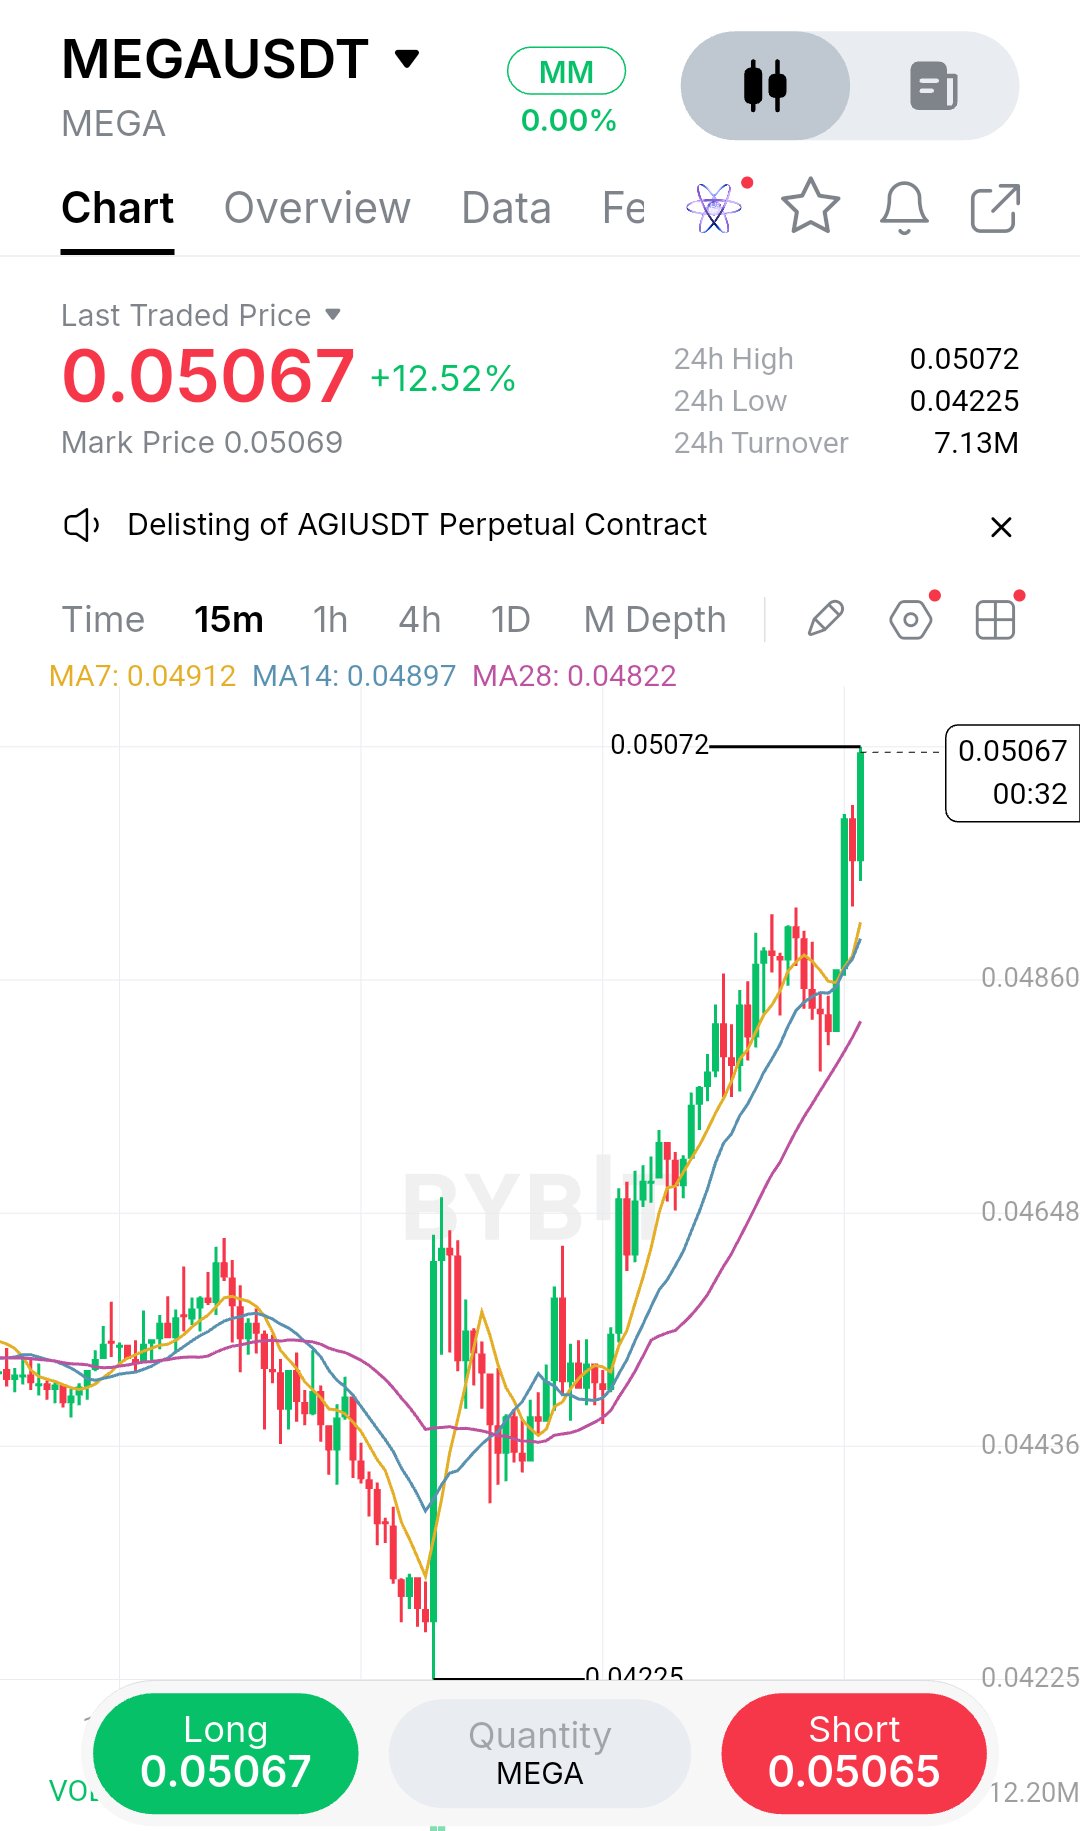
MEGA is pressing right into its 24h high at $0.05072 after a sharp vertical run on the 15m chart. What catches my eye isn’t the string of green candles.It’s that price is now testing a clear resistance level while sitting well above the moving averages. That’s exactly the kind of spot where late longs often get trapped, and it’s why I’m not hitting the buy button at current price. My read is that the structure flipped bullish off the $0.04225 low, and the higher-low sequence is intact. The 15m chart shows a clean recovery from that bottom, with price respecting the MA7 and MA14 on the way up. But buying the exact high without a retest is chasing, and chasing a +12.5% move on a lower timeframe usually means buying someone else’s exit liquidity. I’d much rather see how price reacts at this level before committing capital. If it breaks and holds, great.I’ll take the retest. If it rejects, I’ve saved myself a stop-out. The part I like about this setup is the confluence around the MA cluster. The MA7 sits at $0.04912, MA14 at $0.04897, and MA28 at $0.04822. That zone is my preferred entry area, but only if price pulls back there and shows a reaction. A clean bounce off that cluster, especially with a bullish candlestick pattern, would give me a defined risk against the MA28. The risk I’m most concerned about is a failed breakout at the high.If price wicks $0.05072 and closes back below $0.049, the long thesis weakens significantly, and I’d step aside. Trade Plan Bias: WAIT (long on confirmation) Entry Zone: $0.04900 – $0.04950 (retest of MA cluster) Confirmation: 15m close above $0.05072 followed by a hold/retest, or a clean bounce off the $0.049 MA support Stop / Invalidation: $0.04780 (below the MA28 and prior consolidation) TP1: $0.05200 TP2: $0.05400 TP3: $0.05600 R:R: ~1:2 to TP2 if entry fills near $0.04920 Position management matters here. If TP1 hits, I’d move my stop to breakeven and let the rest run toward TP2. If price stalls between $0.052 and $0.053 without momentum, I’d consider taking partials early rather than letting a winner turn into a loser. The invalidation is clear: a loss of the MA28 with momentum would tell me the bullish structure is broken, and I’d cancel the idea entirely. I’d also stay patient if price just chops sideways at the high no confirmation, no trade. Are you watching this $0.0507 level for a breakout, or expecting a pullback first? #ByXIMPACT #WSOT2026 $MEGAUSDT $SPCXXUSDT
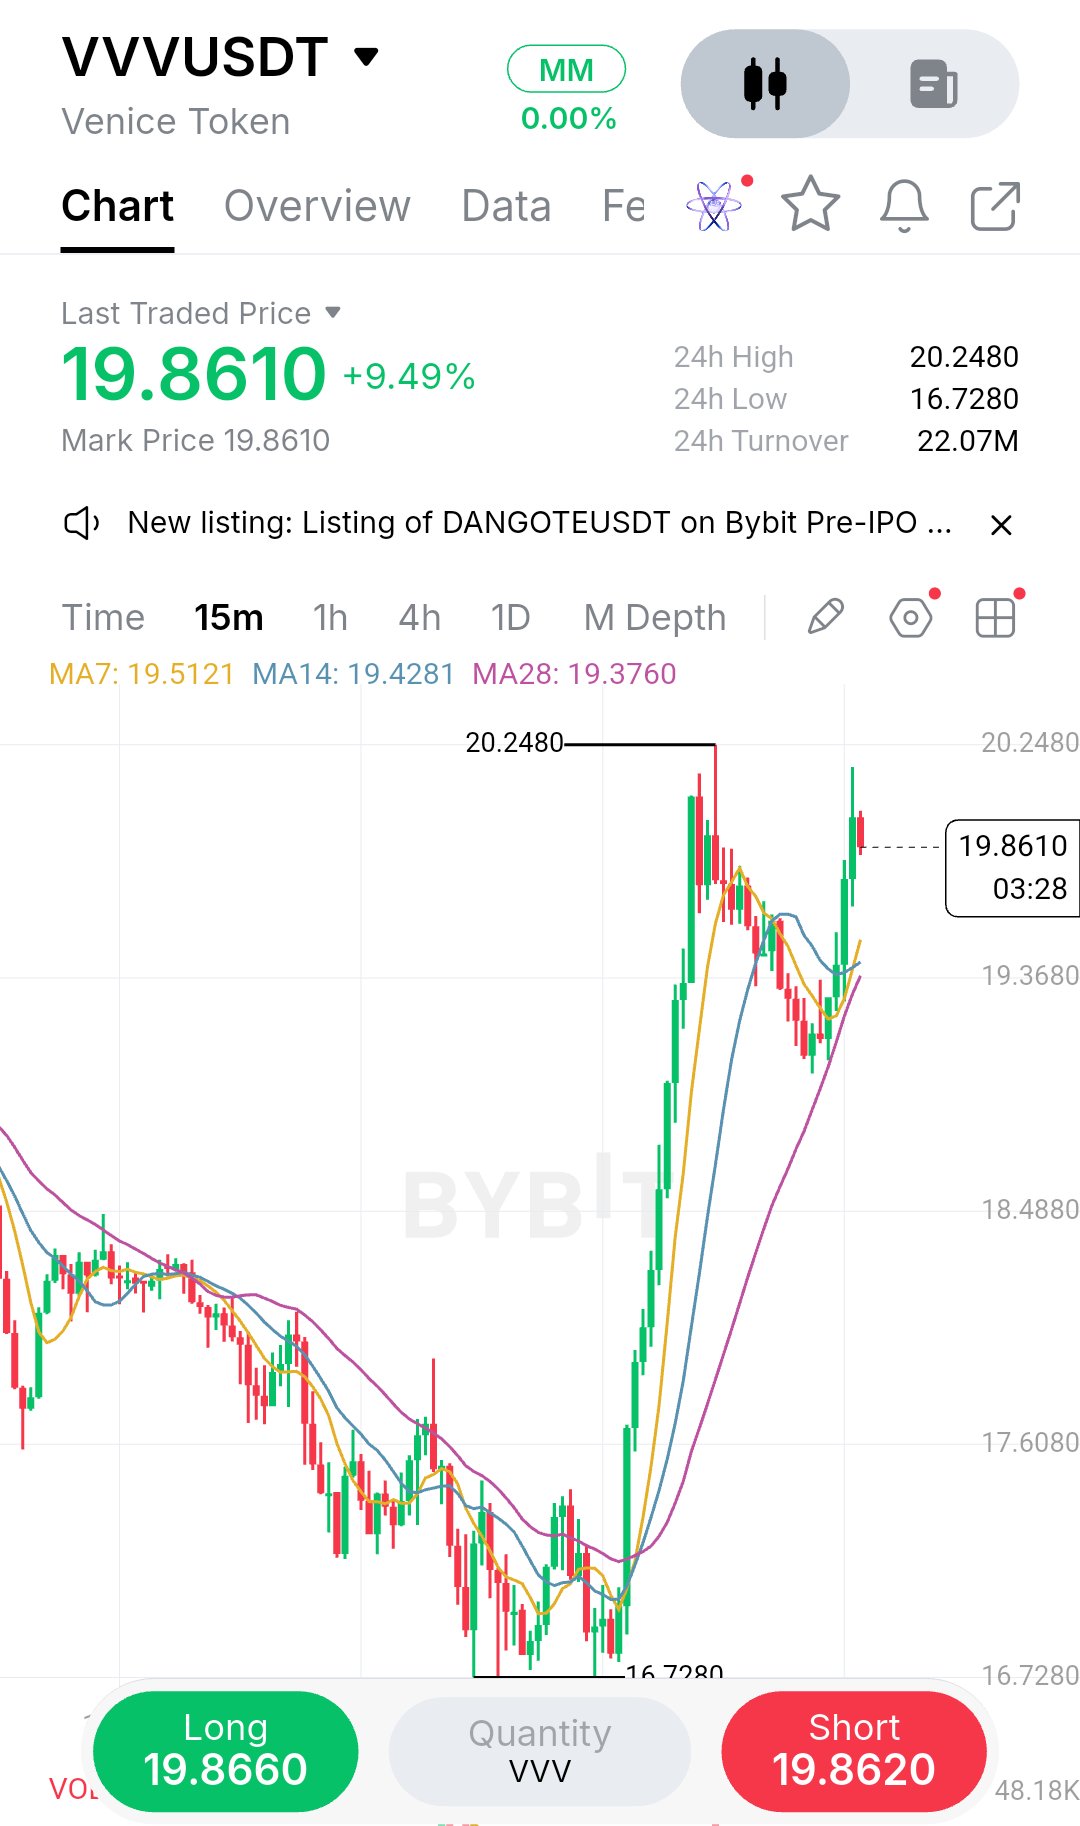
That double-top rejection at $20.24 on the 15m chart is exactly where lazy longs are going to get trapped. What caught my attention isn't just the failed breakout attempt, but how quickly the price has compressed back into the moving average cluster. After that massive impulsive run up from $16.72, the market is clearly transitioning from a trending phase into a distribution or consolidation phase. The 24h high is acting as a hard ceiling. I’m watching the $19.36–$19.42 zone closely.This is where the 14 and 28 MAs are converging. If bulls can't hold this dynamic support, the V-shaped recovery narrative dies, and we likely sweep the lower liquidity toward $18.50. Personally, I wouldn't touch this right now. The risk of getting chopped up in the middle of this range is too high. I’d rather wait for a definitive structural shift. A confirmed break and close above $20.25 opens the door for continuation, while losing the MA cluster gives the bears control for a retest of the lows. Trade Plan (WAIT / Conditional Setup) · Bias: Neutral / Wait · Long Entry: Break and retest of $20.30 · Short Entry: Breakdown and retest of $19.35 · Confirmation: 15m candle close outside the consolidation range · Stop / Invalidation: $20.10 (for longs) / $19.50 (for shorts) · TP1: $21.50 (Long) / $18.50 (Short) · TP2: $22.00 (Long) / $17.50 (Short) · R:R: Approx 1:2.5 based on the breakout levels The biggest risk here is a fake-out. Market makers love to push price just past key levels to trigger stops before reversing. If we get a wick above $20.25 that immediately gets sold off, my bullish thesis is dead, and I'd flip my bias to the downside. I’d stay flat until the range resolves. Which direction are you leaning, or are you waiting for a clean breakout too? #ByXIMPACT #WSOT2026 $VVVUSDT $SPCXXUSDT
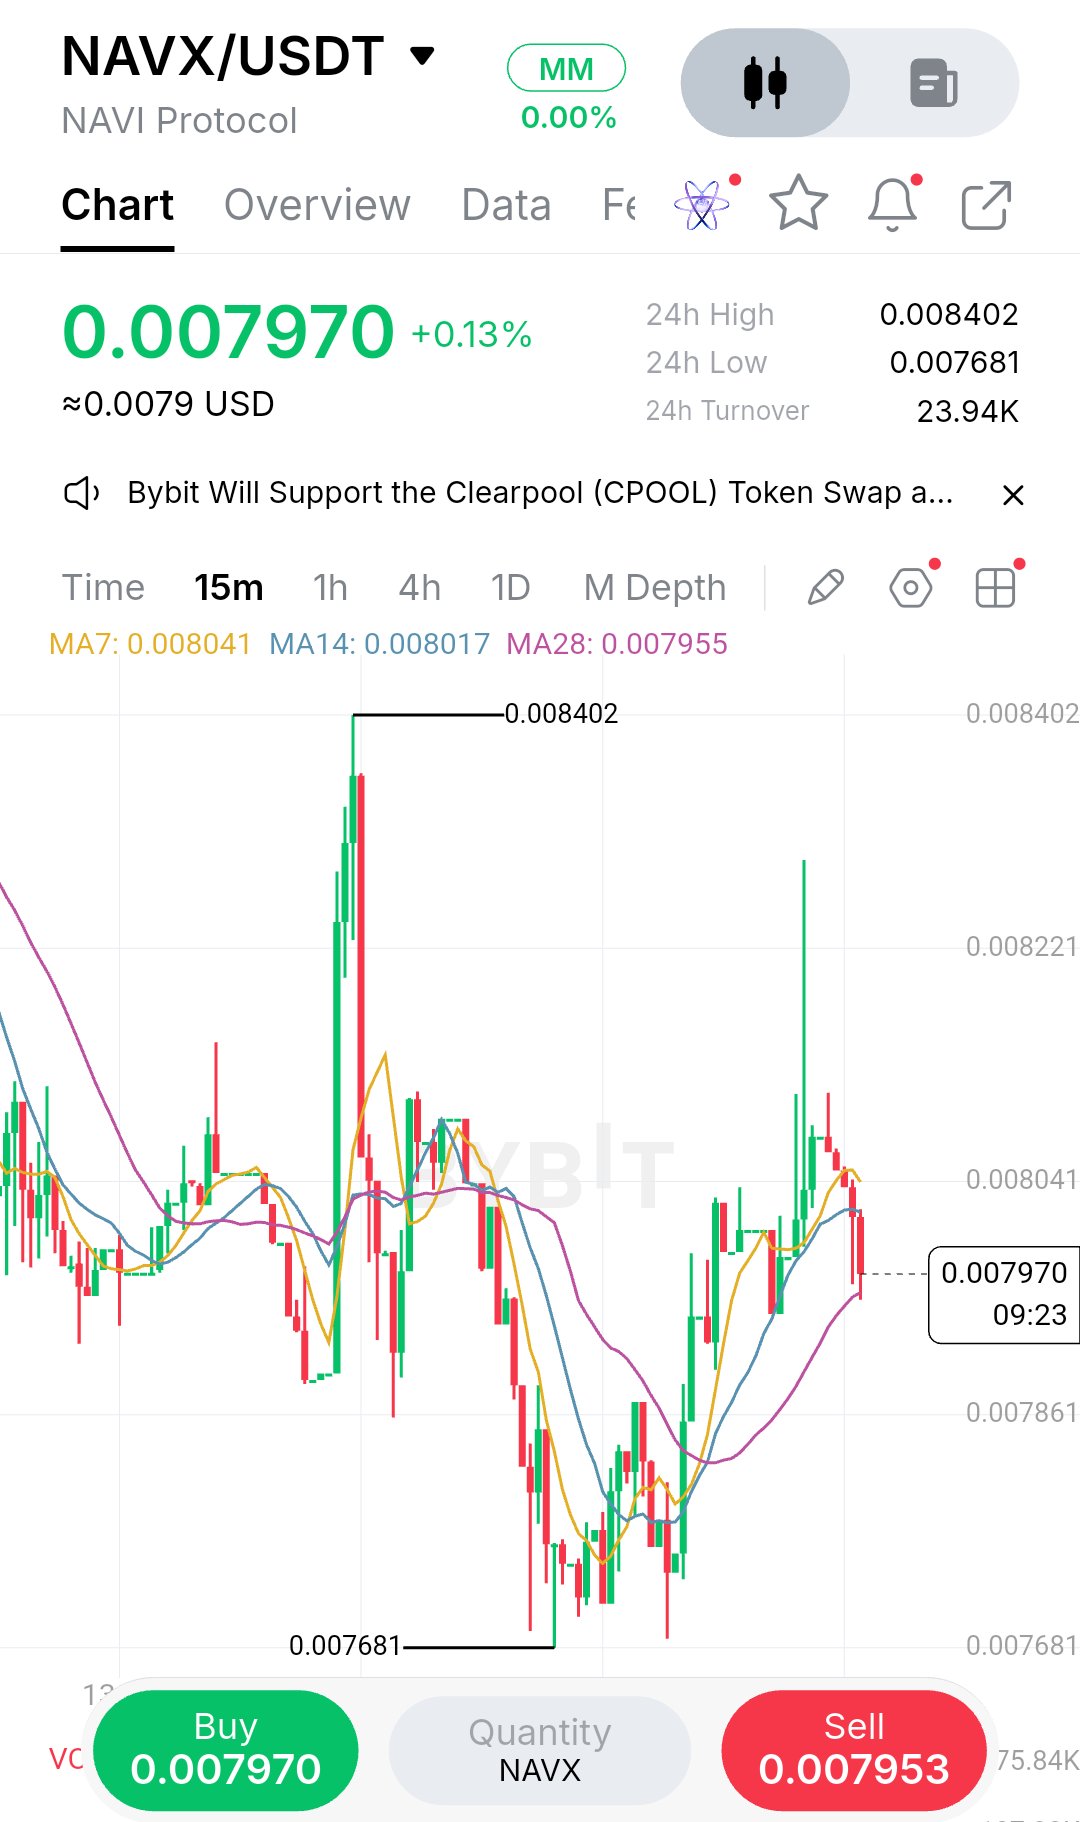
What caught my attention on this NAVX 15m chart is the violent rejection at the highs. That massive wick piercing up to 0.008402 wasn't a genuine breakout; it was a classic liquidity sweep. Price pushed up, grabbed the resting stops above the recent consolidation, and immediately got slammed back down to 0.007681. Since that flush, the structure has shifted. Instead of continuing lower, we are seeing a steady, grinding recovery. The price is currently printing a series of higher lows, and we’ve just reclaimed the 7 and 14 moving averages, which are now starting to curl upward. My read is that the market is trying to establish a local base after shaking out the late longs. However, I wouldn't chase this current green candle. The 24h turnover is relatively light at 23.94K, meaning it won't take much volume to push this around—in either direction. If you look closely at the moving averages, the MA7 (0.008041) and MA14 (0.008017) are sitting just overhead, acting as immediate dynamic resistance. We need to see price clear and hold above these levels to confirm the bullish intent. Trade Plan: · Bias: Long (on confirmation) · Entry Zone: $0.00785 – $0.00795 (Wait for a pullback/retest of the MAs) · Confirmation: A successful retest of the 0.00785 area holding as support, or a strong 15m close above 0.00805 with volume. · Stop / Invalidation: $0.00765 (Just below the recent swing low) · TP1: $0.00810 · TP2: $0.00835 · TP3: $0.00840 (Liquidity above the wick) · R:R: Approx. 1:2 to TP2 The biggest risk I’m concerned about is a fakeout higher followed by another dump, similar to what we just saw. The market structure is still fragile. If price loses the 0.00785 level and breaks back below the moving averages, the recovery thesis is dead, and I’d step aside immediately. Patience is key here. I’m keeping a close eye on how the next few candles close around this 0.0080 psychological level. Are you guys watching this base building, or do you think we are going to sweep the lows again? #ByXIMPACT #WSOT2026 $NAVXUSDT $HYPEUSDT
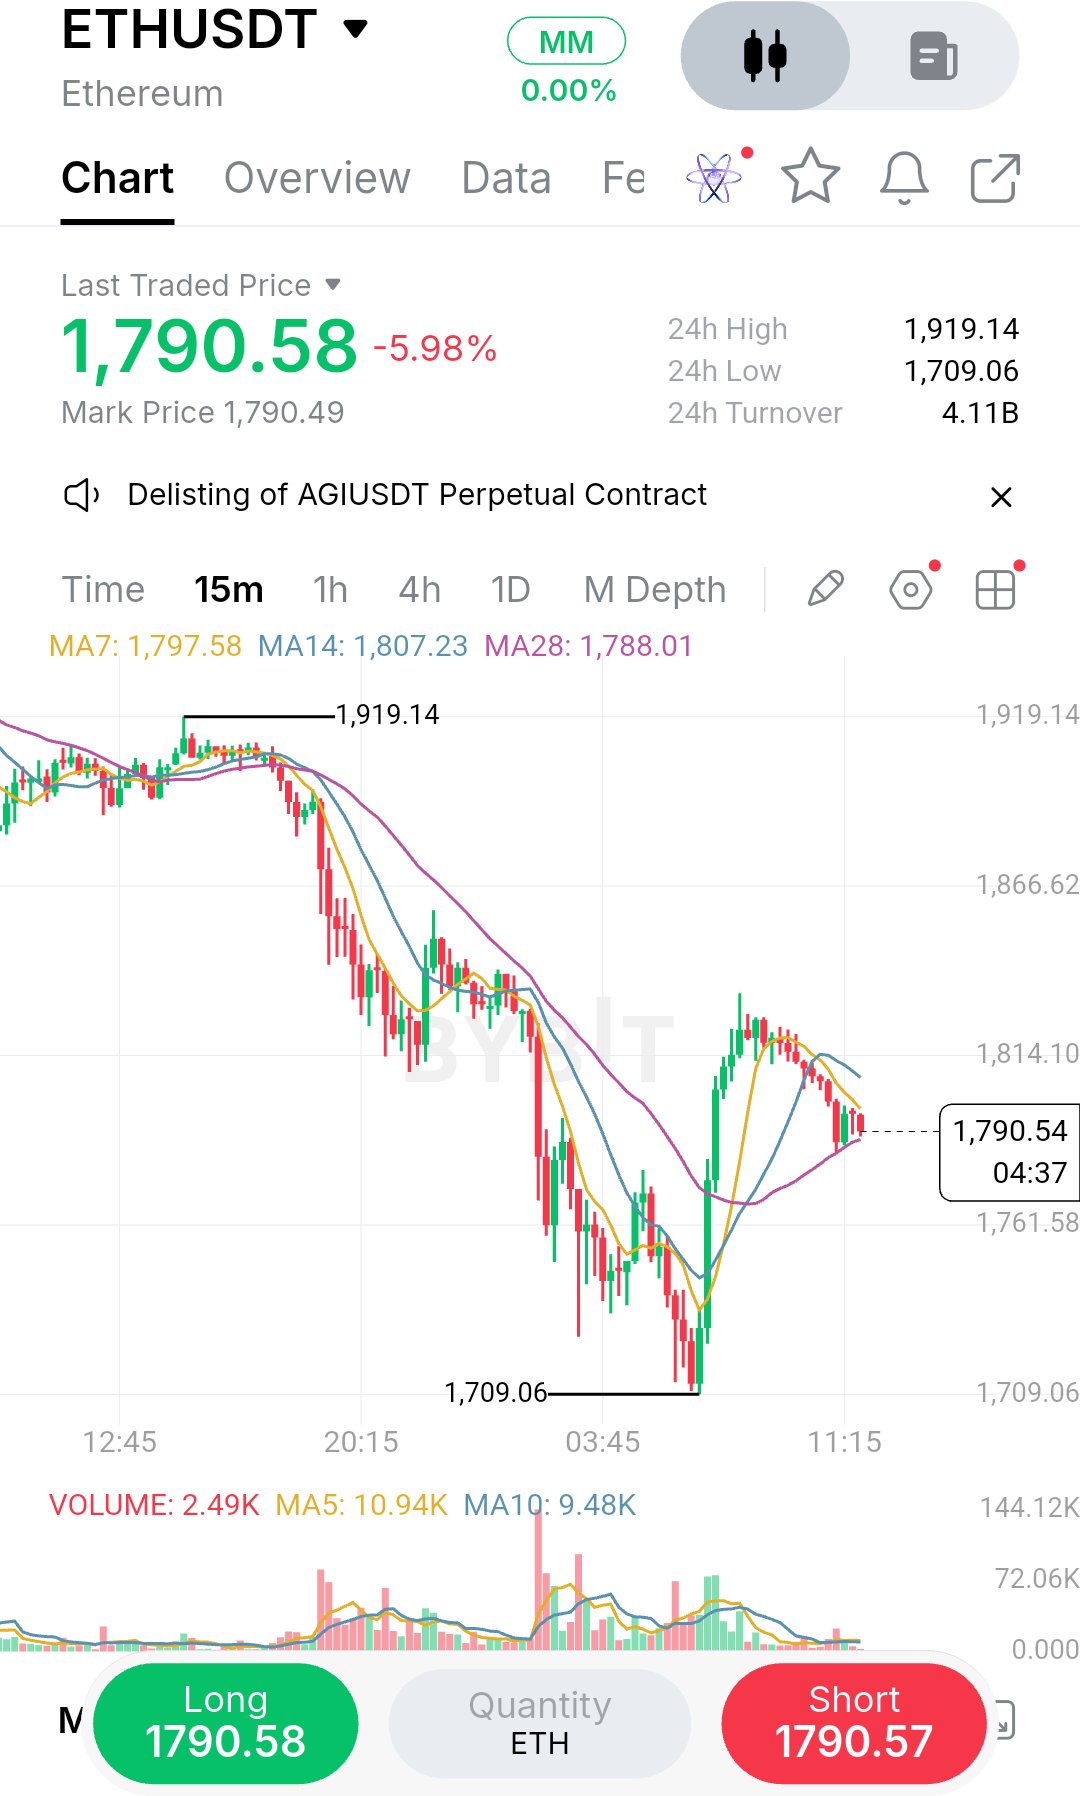
The part I’d rather not ignore here is how quickly ETH gave back its recent bounce. After sweeping liquidity down at $1,709, we saw a sharp relief rally, but price is already rolling over. Right now, at $1,790, it’s getting rejected exactly where it matters: the MA14 at $1,807 and the MA28 at $1,788. That overlap is a clear dynamic resistance zone, and the market is already showing it doesn’t want to trade above it. This looks like a classic lower high forming on the 15m chart. The broader trend is aggressively bearish, and buyers are clearly running out of steam. Every bounce is being sold into, which is the signature of a downtrend that hasn’t exhausted itself yet. The volume profile also supports this.The green candles are getting smaller, and the red candles are printing with more conviction. I’m not interested in catching this falling knife, nor am I going to short right at current support. The smart play is to wait for the retest of the moving averages to confirm the rejection. That gives us a tight stop and a clear invalidation level, which is exactly what a disciplined short needs. I’ve learned the hard way that entering mid-candle during a downtrend usually ends in a stopped-out position, so I’m letting the structure validate the entry. If price pushes back to $1,800–$1,807 and fails to close above it, that’s my signal to short with confidence. If it reclaims that zone, the thesis is wrong, and I walk away. Bias: SHORT Entry Zone: $1,800 – $1,807 (rejection at MA14) Confirmation: 15m bearish close after testing the entry zone. Stop / Invalidation: $1,821 (above the recent swing high) TP1: $1,760 TP2: $1,709 (liquidity sweep) R:R: Approx 1:2.5 to TP1 The main risk is a sudden surge through $1,821, which would invalidate the bearish structure. If that happens, I step aside and reassess. Don’t chase the short if price drops without a retest.Wait for the setup to come to you. Are you waiting to short this lower high, or buying the dip? #ByXIMPACT #WSOT2026 $ETHUSDT $BTCUSDT
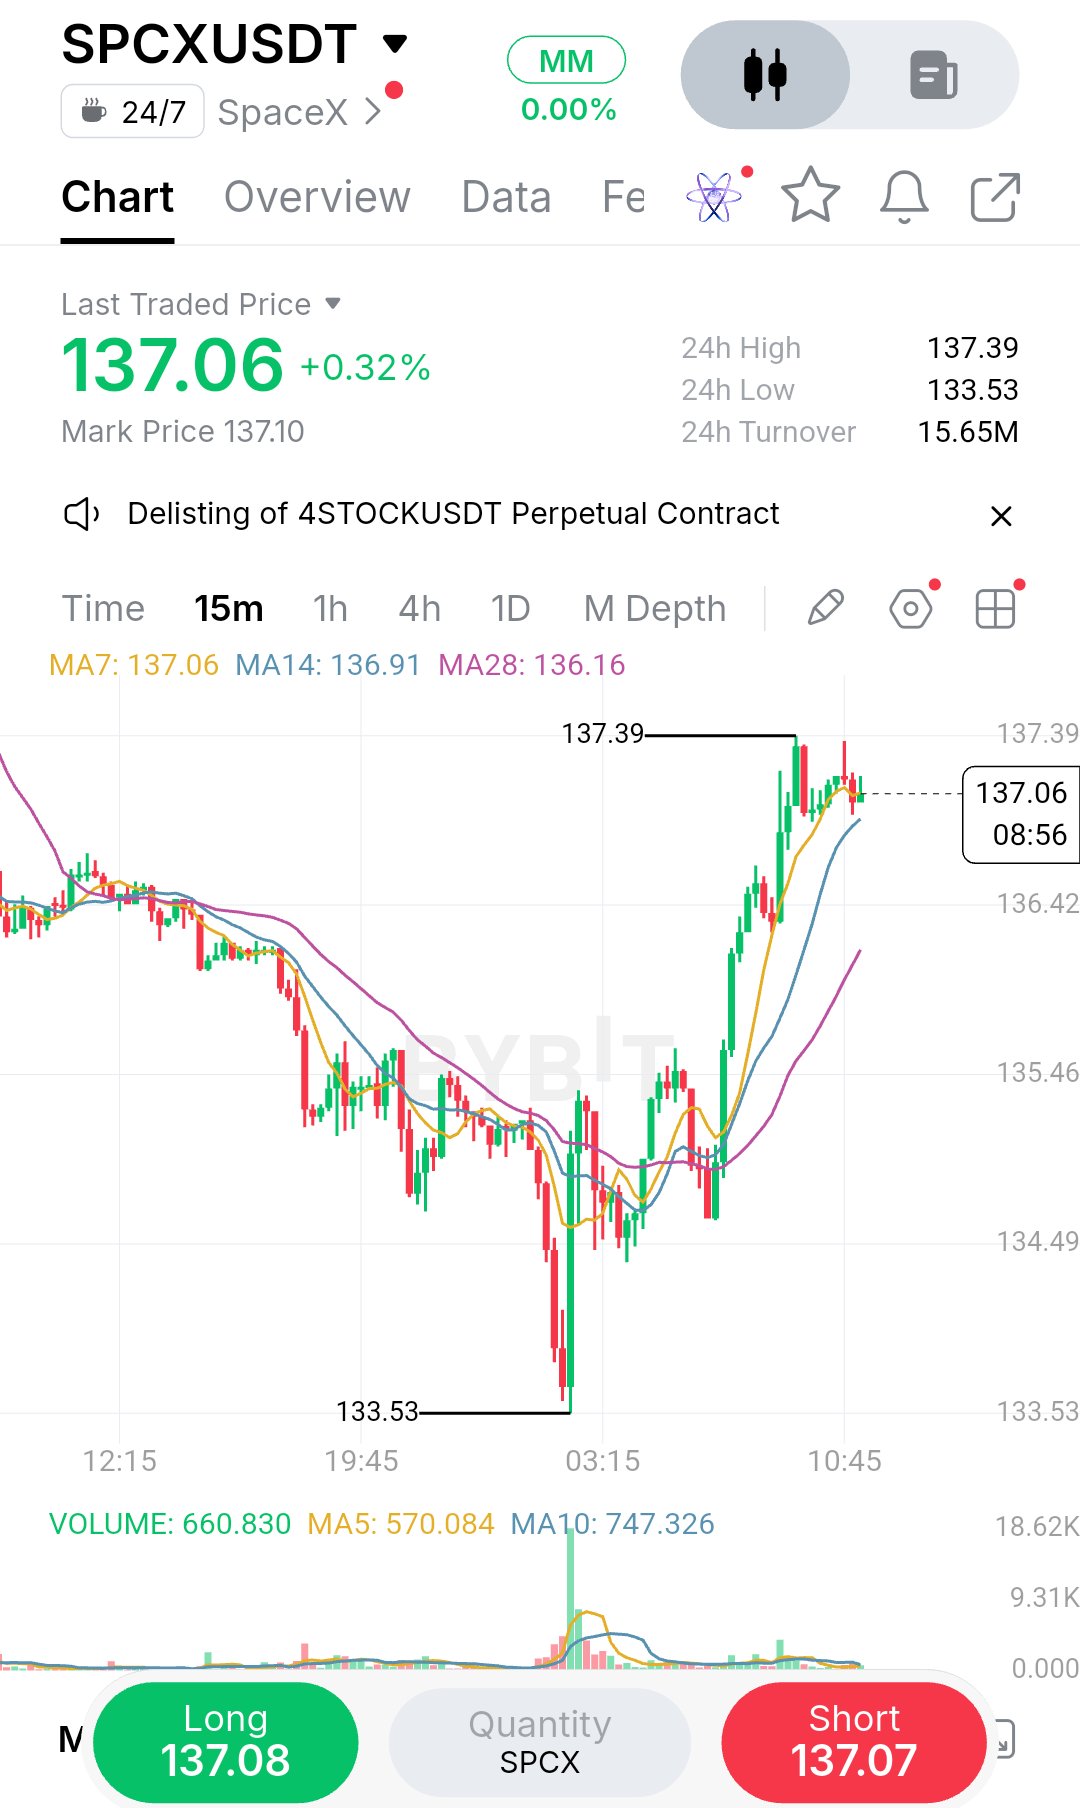
What caught my attention here is how quickly SPCX reversed after that sharp sweep down to 133.53 on the 15m chart. That spike on the volume profile looks like a classic stop hunt, and the aggressive V-shaped recovery tells me sellers likely got trapped. Now price is consolidating right at the 24h high of 137.39. It’s the kind of price action that forces you to respect the buyers, even if the broader trend hasn’t fully flipped yet. My read is that the structure has shifted bullish in the short term. Price is holding above all three moving averages (MA7, MA14, MA28), which are beginning to curl upward.A sign that short-term momentum is finally turning. However, we are testing a minor resistance zone right now. The 137.39 level is the immediate ceiling, and until it breaks, we’re essentially in a tight range. I wouldn’t chase this exact candle. I’d rather see a clean 15m close above 137.40 to confirm the breakout before taking a position. That’s the difference between anticipating and reacting. Let me walk you through the logic. The sweep to 133.53 cleared out late longs and triggered stop losses, which is often the fuel for a reversal. The subsequent green candles are strong, but the real test is whether buyers can push through 137.40 and hold it. If they do, the next leg toward 139.50 opens up. If they fail, we likely retest the 136 area. Here is my plan: Bias: LONG Entry: $137.45 (on breakout confirmation) Stop / Invalidation: $135.90 (below the recent consolidation and MA cluster) TP1: $139.50 TP2: $141.00 TP3: $144.00 R:R: Approx 1:2 to TP2 The main risk is a fakeout here. If price rejects 137.40 and rolls over, breaking below 136.50, the bullish thesis is dead. I’d cancel the trade and wait for a lower support test. The volume, while present on the sweep, hasn’t fully confirmed the breakout yet, so patience is key. I’ve learned that entering on the first touch of resistance often leads to getting stopped out on a wick. Are you waiting for the breakout or fading this resistance level? #ByXIMPACT #WSOT2026 $SPCXXUSDT $HYPEUSDT
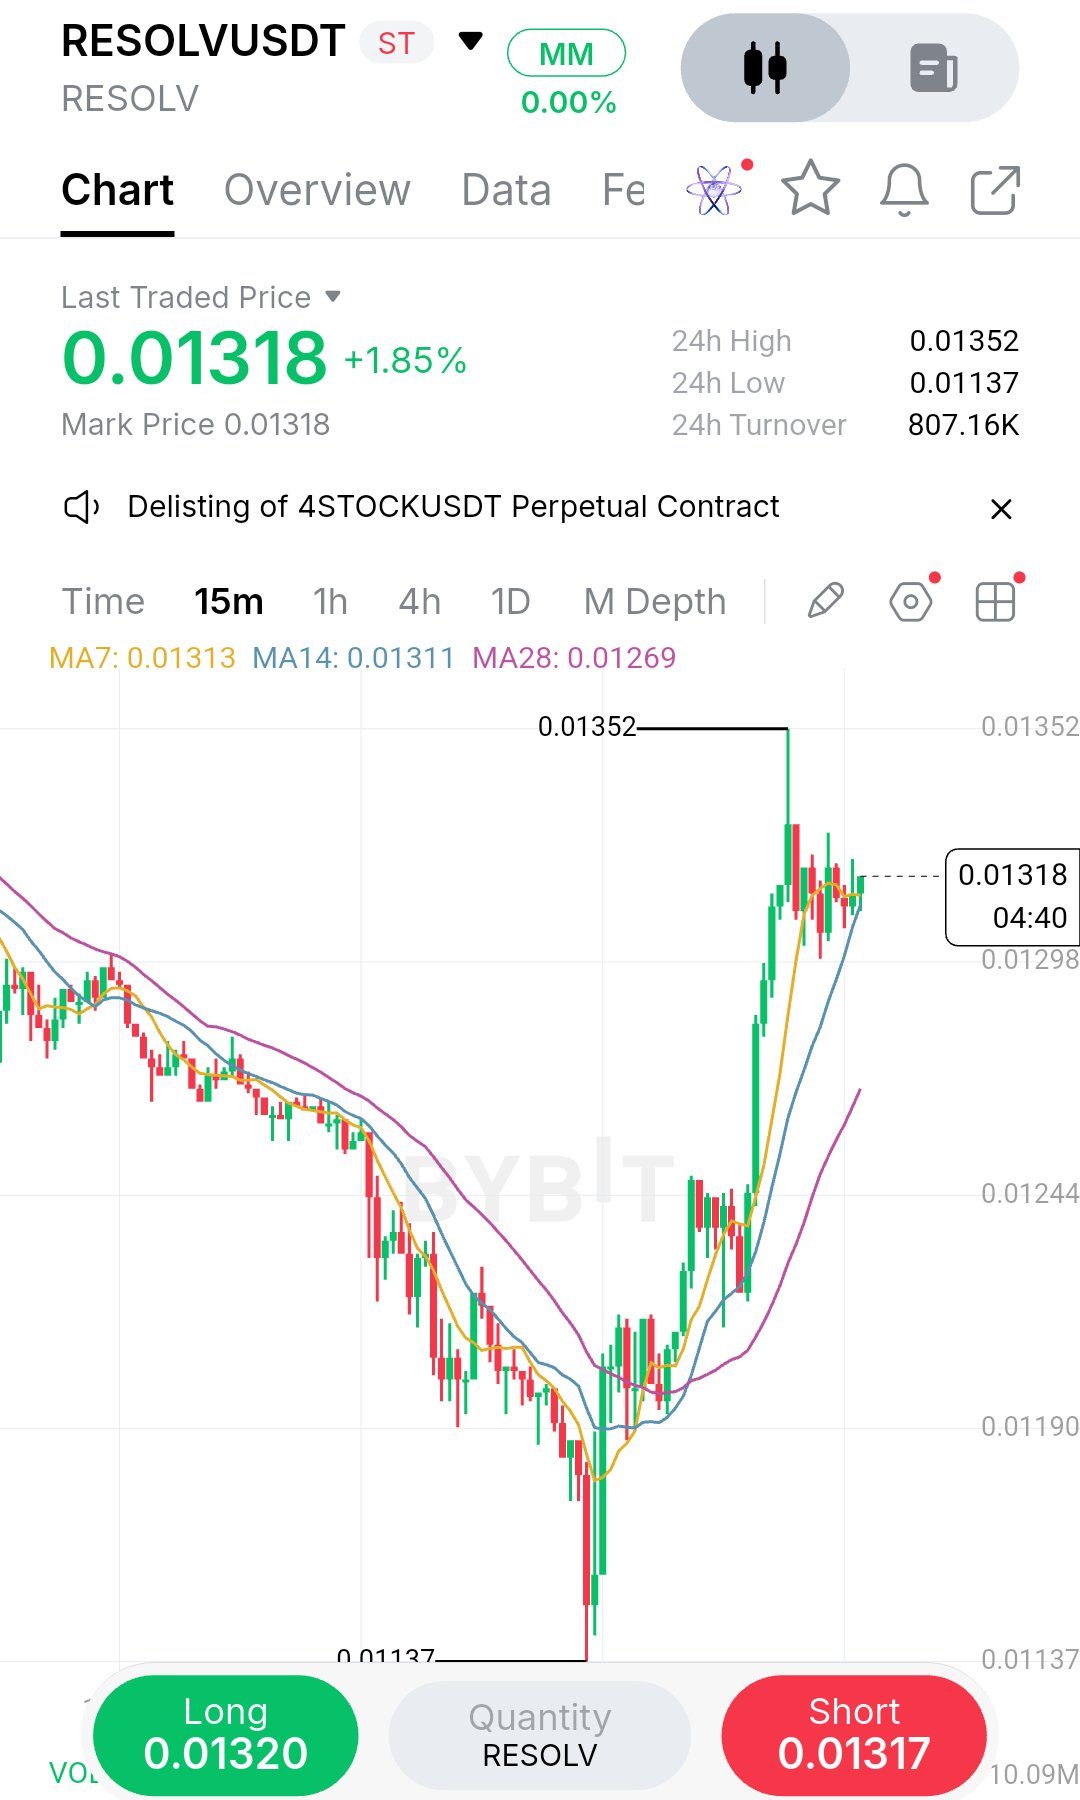
What I’ve learned about these violent V-shaped recoveries is that they often leave a trail of trapped late sellers, but they also create terrible risk-to-reward if you buy the top. Looking at RESOLVUSDT on the 15m, the bounce from the $0.01137 low was incredibly aggressive, but price is now stalling right under the $0.01352 local high. That kind of vertical move usually exhausts buyers quickly, leaving them vulnerable to a sudden pullback. My read is that the immediate momentum is bullish, but we are hitting a clear supply zone. The moving averages are curling up beneath the price, confirming the short-term shift, yet chasing here is risky. When price extends this far from the moving averages, a mean reversion is highly likely. I’d rather wait for a pullback to the $0.01260–$0.01270 area. That zone aligns perfectly with the MA28 and the previous consolidation block before the breakout. It gives a much cleaner invalidation point and significantly improves the risk profile. Trade Plan Bias: LONG Entry: $0.01260 – $0.01270 Confirmation: Bullish rejection wick or 15m close back above $0.01280 after the retest Stop / Invalidation: $0.01240 TP1: $0.01318 TP2: $0.01352 R:R: Approx 1:2.5 The biggest risk is a failed breakout leading to a double top at $0.01352. If price breaks below $0.01240, the recovery is invalidated. Don’t buy the green candle; let the price come to your level. The current price action shows exhaustion after a massive run, and buying here means your stop has to be uncomfortably wide. Patience will reward you with a better entry and a tighter stop. Are you waiting for the pullback, or playing the breakout? #ByXIMPACT #WSOT2026 $RESOLVUSDT $AAPLXUSDT
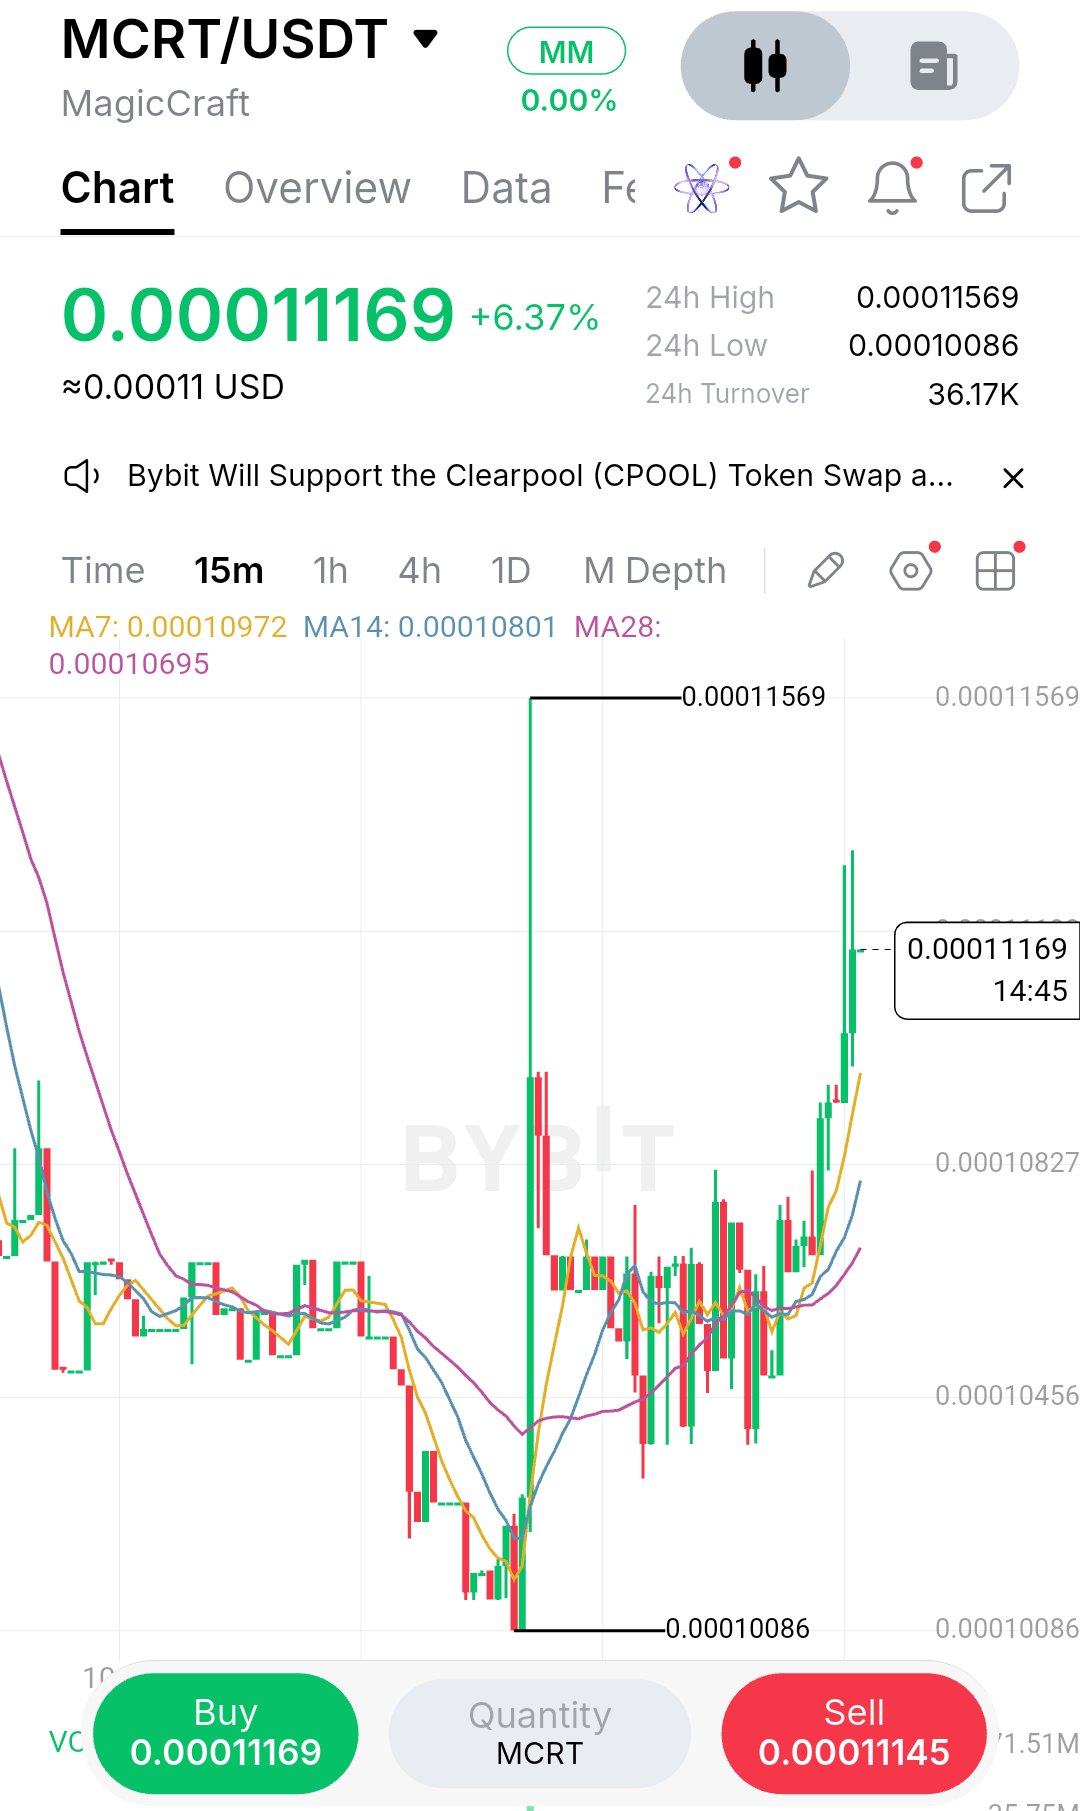
What caught my attention on this MCRT 15m chart is how aggressively price defended the $0.00010086 low. We just saw a sharp V-shaped recovery with strong green candles, pushing right back into the $0.00011569 24h high. That kind of forceful bounce usually signals that sellers have exhausted their momentum, at least temporarily. My read is that the short-term momentum has clearly flipped bullish, but I wouldn’t chase this vertical move. The 15m moving averages are curling up nicely beneath the price, confirming the shift in structure. The MA7, MA14, and MA28 are fanning out, which is a classic sign of short-term trend continuation. However, price is now running directly into local resistance. The $0.00011569 level was the 24h high, and we are seeing the first signs of hesitation right at that boundary. I’d rather wait for a pullback to the $0.00010800–$0.00011000 area, which is now acting as fresh demand. This zone aligns perfectly with the recent consolidation base before the breakout. Chasing the top of this candle is a trap. If we get a controlled retest of that demand zone, it offers a much cleaner entry with a tight stop. Trade Plan Bias: LONG Entry Zone: $0.00010800 – $0.00011000 Confirmation: Bullish rejection wick or 15m close back above $0.00011000 after the pullback Stop / Invalidation: $0.00010450 TP1: $0.00011569 TP2: $0.00012500 R:R: Approx 1:2 The biggest risk here is a failed breakout. If price gets rejected hard at the $0.00011569 high and breaks below $0.00010450, the recovery is invalidated and we likely retest the lows. Don’t enter blindly at current price; let the pullback come to you. Patience is key here, as the initial move is already extended. Are you waiting for the retest, or already positioned for the breakout? #ByXIMPACT #WSOT2026 $MCRTUSDT $AAPLXUSDT
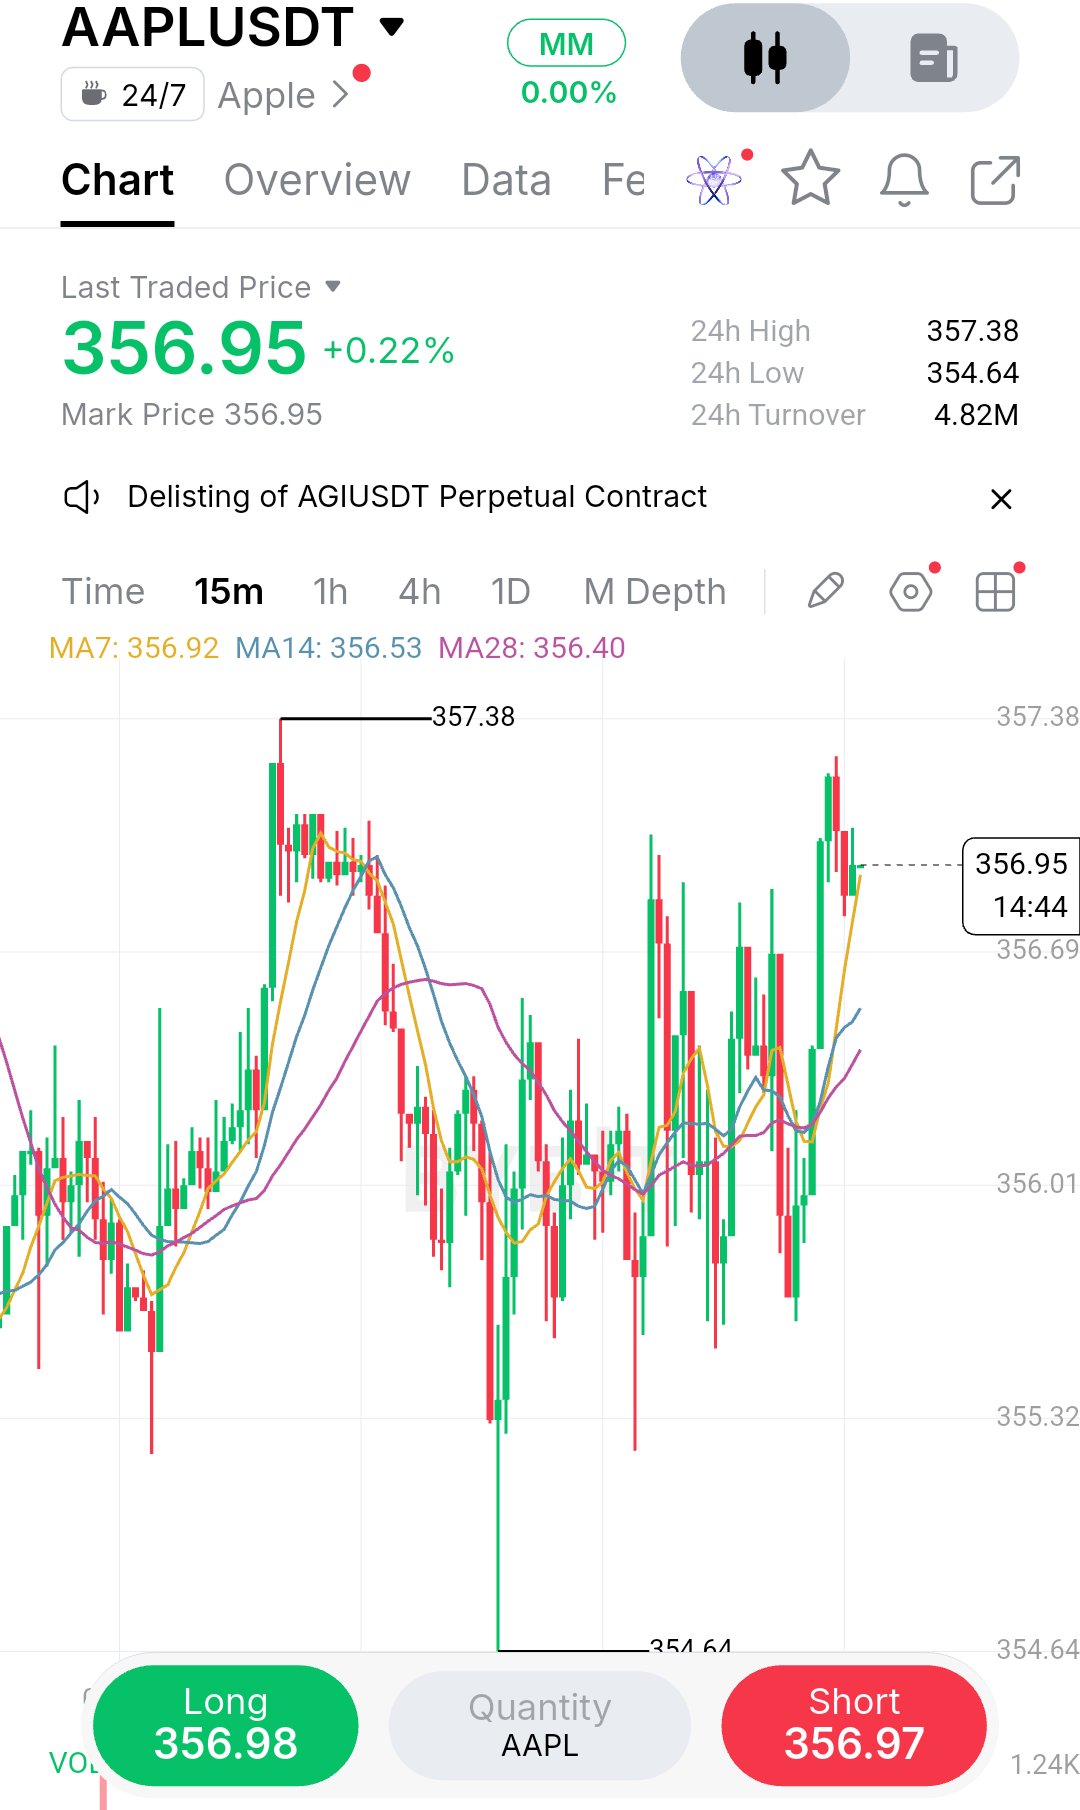
What caught my attention on this AAPLUSDT 15m chart is the sheer whipsaw price just went through. We saw a sharp drop that swept liquidity down to $354.64, and now price is aggressively fighting back toward the $357.38 local high. My read is that we are currently in a choppy, high-volatility range. The 15m structure is messy. Right now, price is trading around $356.95, riding right on top of the short-term moving averages (MA7, MA14, MA28), which are tightly clustered around $356.40–$356.90. This compression means a decision is coming, but I wouldn't chase this green candle. I’d rather wait for confirmation. If price pushes up but gets firmly rejected at the $357.38 high, I’ll look for a short back down to the recent lows. Conversely, a clean break and close above $357.38 could open a quick scalp toward higher levels. Trade Plan (Wait for confirmation): Bias: WAIT / Neutral Entry Zone: N/A (Wait for breakout or rejection) Confirmation: · Long: 15m close above $357.38. · Short: Bearish rejection candle at $357.38. Stop / Invalidation: · Long: Below $356.50 · Short: Above $357.60 TP1: $356.00 (range low) TP2: $354.64 (recent sweep low) R:R: Approx 1:2 if entering on the retest. The biggest risk here is a fakeout. The market just took out the lows, so a sudden reversal above $357.38 could trap early shorts. If price consolidates right at $357 without a clear rejection, I’m standing aside. I won’t force a trade in the middle of this chop. Anyone else watching this tight compression, or are you waiting for the 1h candle to close? #ByXIMPACT #WSOT2026 $AAPLXUSDT $HYPEUSDT
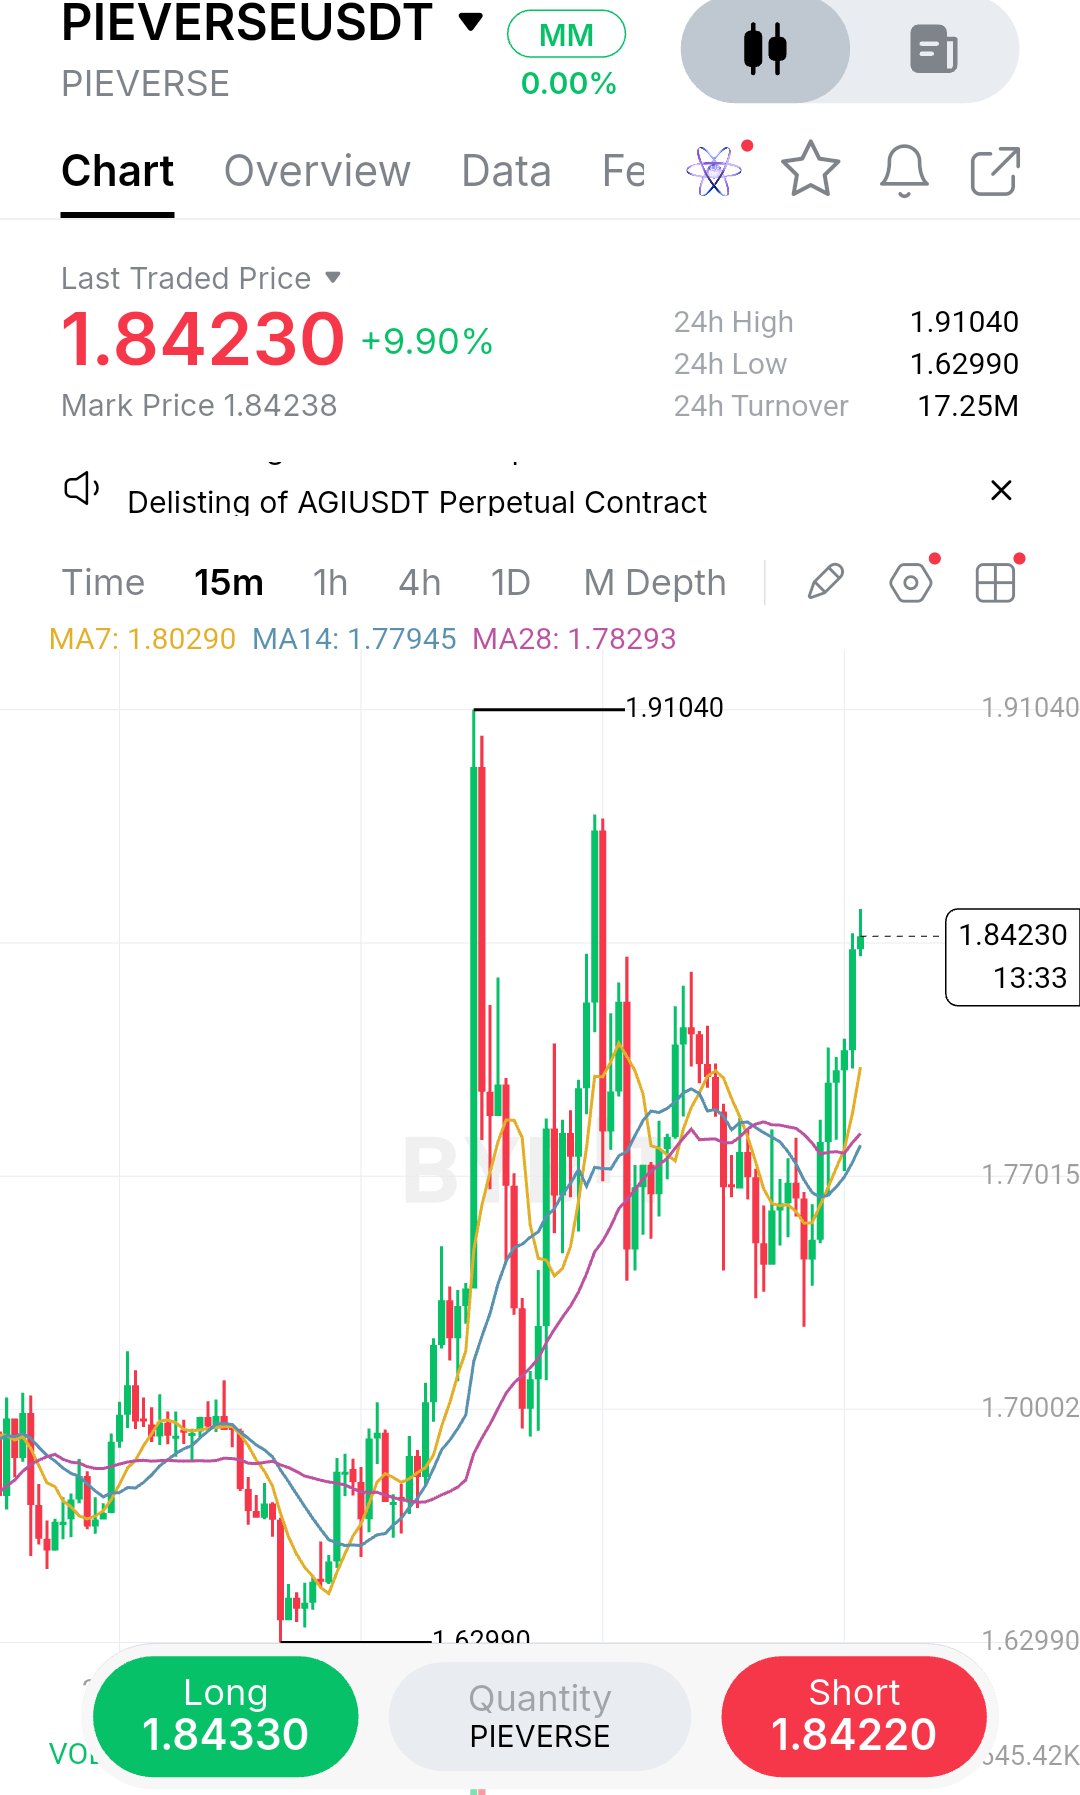
What caught my attention on this PIEVERSE/USDT 15m chart is how aggressively price swept the $1.62 low before snapping back and breaking through the moving averages. I’ve seen these deep liquidity grabs trap late sellers before a sudden reversal, and this structure looks no different. That flush down to the lows likely triggered a lot of stop-losses before the real buyers stepped in, which is a classic hallmark of a short-term bottom being formed. My read is that the immediate trend has shifted bullish. Price is printing higher lows and has just reclaimed the MA7, MA14, and MA28 around $1.78–$1.80. The $1.91 swing high is the obvious resistance that everyone is watching, but right now, I wouldn’t chase the current candle at $1.84. The risk of a minor pullback after a 9% move is simply too high, and entering right into previous resistance without a retest is a low-probability trade. Personally, I’d rather wait for a retest of the $1.80–$1.81 area. That previous resistance should now flip into support if this breakout is genuine. If we get a bearish rejection candle that immediately breaks back down there, the bullish thesis is invalid, but a strong hold and a bullish bounce is the green light. This strategy lets me enter with a tighter stop loss and a much better risk-to-reward ratio, while also confirming that buyers are still in control. Trade Plan: · Bias: LONG (on retest) · Entry Zone: $1.80 – $1.81 · Confirmation: Bullish rejection candle holding the MAs on the 15m chart. · Stop / Invalidation: $1.77 (Below the MA cluster) · TP1: $1.86 (Take partials here) · TP2: $1.91 (Recent high) · TP3: $1.95 · R:R: Approx 1:2.5 to TP2. The biggest risk is a fakeout above $1.85 followed by a sharp drop. If price loses $1.77, I’m out. Stay patient and let the retest come to you. Are you watching this $1.91 level for a breakout, or expecting a rejection? #ByXIMPACT #WSOT2026 $PIEVERSEUSDT $HYPEUSDT
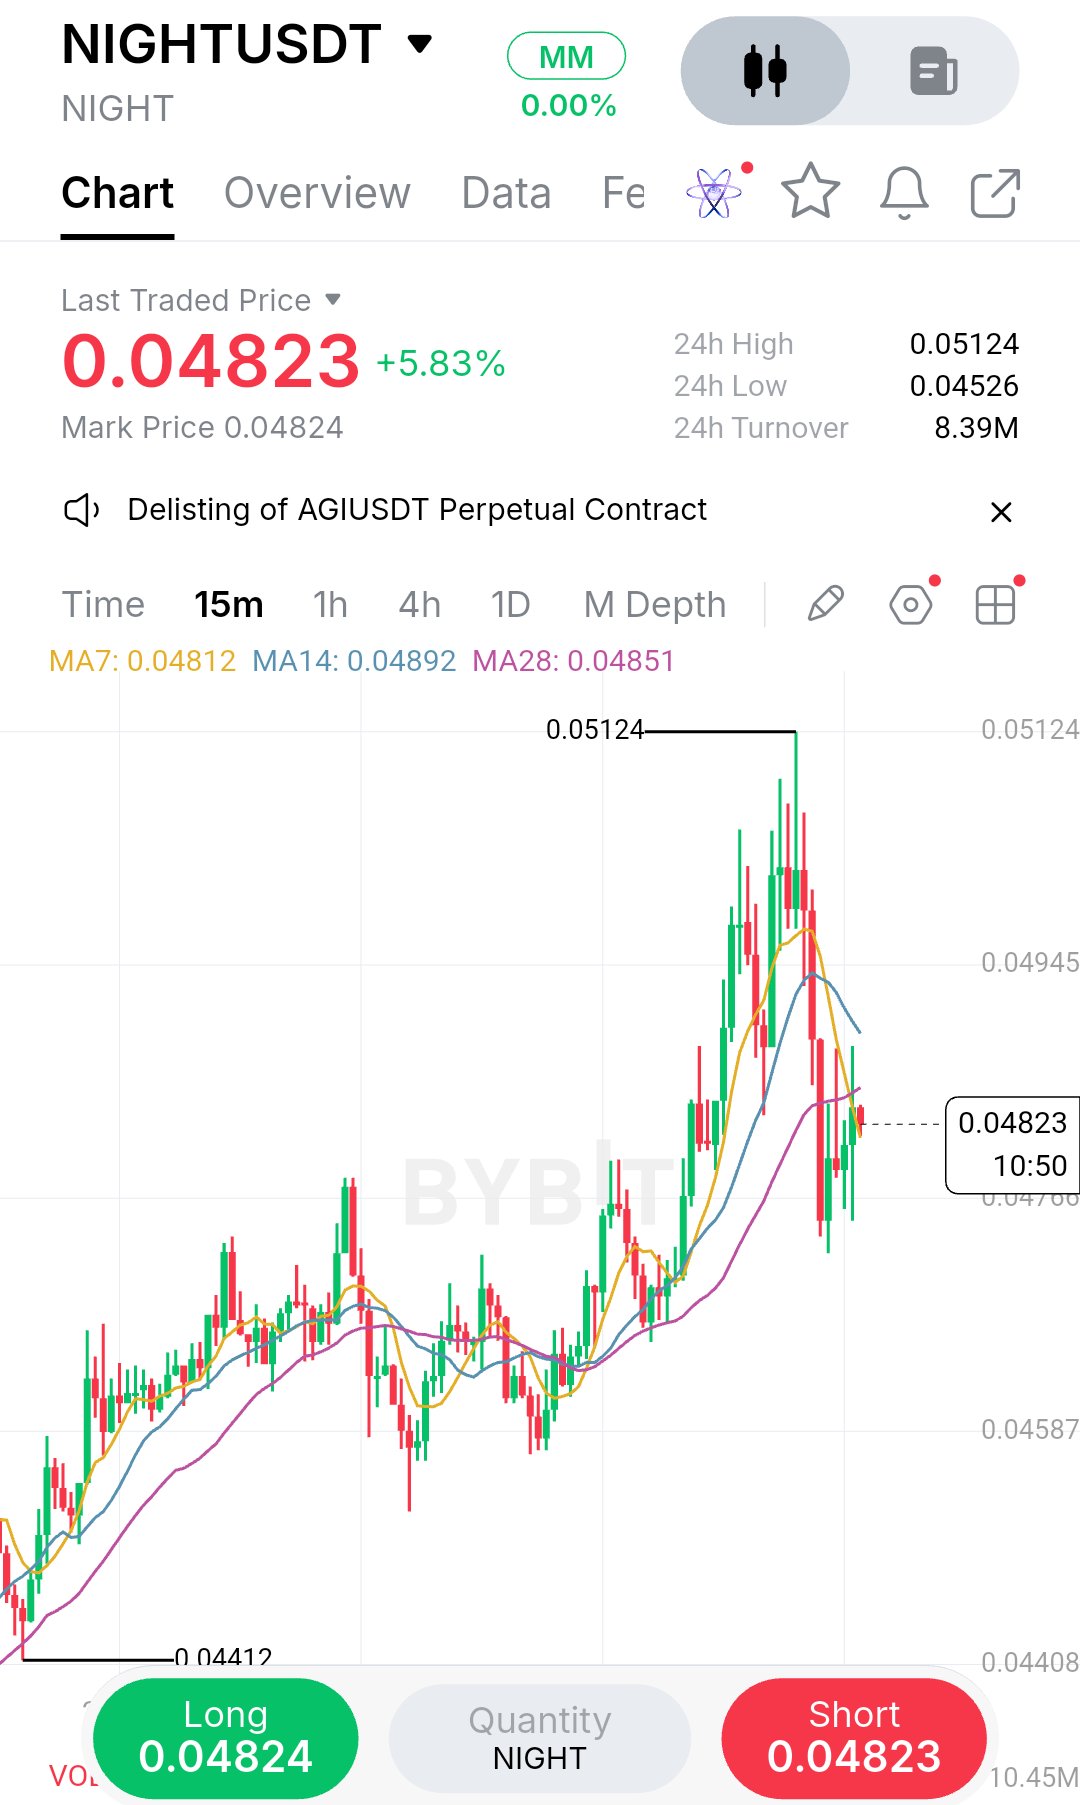
What caught my attention on this NIGHT/USDT 15m chart is how violently the recent uptrend was rejected. Price pushed all the way to $0.05124, but the pullback was sharp and heavy, wiping out the gains quickly and breaking back below the short-term moving averages. I wouldn't chase a long here. My read is that the immediate structure has shifted bearish on this timeframe. The price is currently struggling to reclaim the MA cluster around $0.04890, which is now acting as dynamic resistance. What I find most concerning is the lack of a strong bounce after that massive red sell-off. Buyers look exhausted. However, I'm not chasing the short right at $0.04823 because we are sitting near the $0.04526 support shelf. Personally, I’d rather wait for a minor pullback into the moving averages to see if they reject price. If we get a weak bounce up to $0.04850–$0.04890 with a bearish rejection candle, that’s a much safer short setup with a tighter stop. If it breaks below $0.04526 instead, I'll wait for a retest to confirm the breakdown. Trade Plan (Short Scenario): · Bias: SHORT (on confirmation) · Entry Zone: $0.04850 – $0.04890 · Confirmation: Bearish rejection candle in this zone on the 15m chart. · Stop / Invalidation: $0.04960 (Above the recent lower high and MAs) · TP1: $0.04700 · TP2: $0.04526 (Recent support) · R:R: Approx 1:2 to TP2. The biggest risk is a sudden reversal back above the $0.04945 level. If price closes a 15m candle above that, I’d cancel the short idea entirely. Stay patient and don't force it. Are you watching this MA cluster for a rejection, or do you think the dip is a buying opportunity? #ByXIMPACT #WSOT2026 $NIGHTUSDT $MNTUSDT
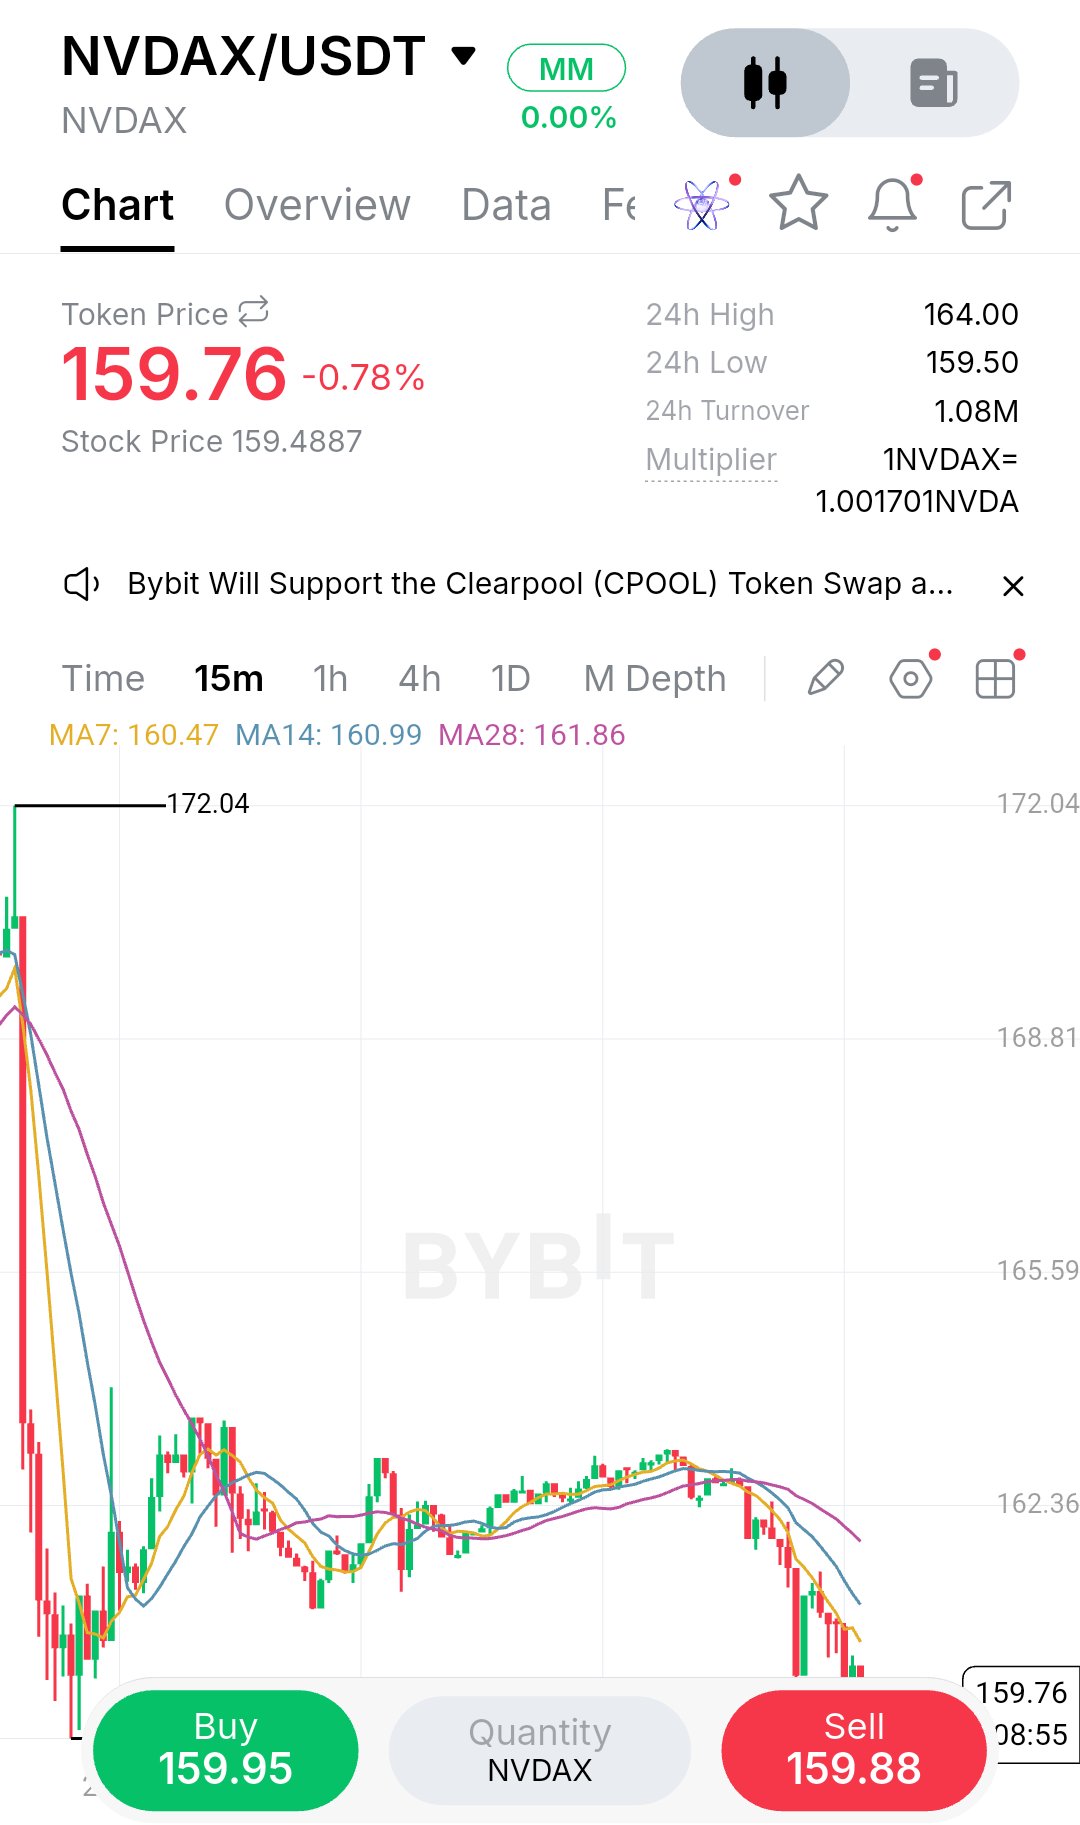
What caught my attention on this NVDAX/USDT 15m chart is the sheer weight of the rejection from the $172 region. That wasn’t just a minor pullback; it was a violent structural break. After that sharp sell-off, we saw a bounce attempt, but looking closely at the candles, it lacked conviction. It failed to print a convincing higher high and struggled to hold above the short-term moving averages. Now, price is rolling over near $159.76, hovering just above the 24h low of $159.50, and failing to reclaim the MA7 and MA14. My read is that the market regime on this intraday timeframe has shifted firmly into a bearish distribution phase. The recent consolidation around $162 has essentially broken down, and the momentum is pointing south. The $164 level is now acting as a clear ceiling, while the $172 swing high is the major invalidation for any bearish thesis. I’m watching how price reacts here because the current structure screams lower highs and lower lows. Right now, chasing the short right at $159.76 is dangerous. The price is already extended to the downside, sitting right on the $159.50 support shelf. Selling the absolute bottom of a move is a classic amateur mistake. Instead, I’d rather wait for a clean, low-risk setup that offers a favorable risk-to-reward ratio. I am looking for a minor mean-reversion pullback toward the $161–$162 region. This is where the previous support should flip into fresh resistance. If we get a weak bounce into that zone, followed by a bearish rejection candle, that’s my trigger. Let's break down the mechanics of this setup. The moving averages are fanned out bearishly, with price trading well below the MA7 ($160.47), MA14 ($160.99), and MA28 ($161.86). This tells me the immediate trend is down, but also that a retest of those MAs is highly probable before the next leg down. The 15m chart is noisy, so patience is key. Trade Plan (Short Scenario): · Bias: SHORT (on confirmation) · Entry Zone: $161.00 – $162.00 (looking for a rejection off the MAs) · Confirmation: A weak bounce and a clear bearish candlestick rejection (like a shooting star or engulfing candle) in this zone on the 15m timeframe. Do not enter blindly; wait for the candle to close. · Stop / Invalidation: $164.20 (Above the recent 15m swing high and overhead resistance). This keeps the risk tight. · TP1: $159.50 (Recent low—take partials here) · TP2: $157.00 (Next psychological support) · TP3: $155.00 · R:R: Approximately 1:2 to TP2. The biggest risk to this setup is a sudden, high-volume bounce that reclaims $162 and holds. If the broader crypto or equity market shifts bullish, NVDAX will follow. I would immediately cancel this idea if price closes a 15m candle above $164 with strong volume. If you are already short from higher up, stay patient, trail your stops, and maybe take partials at the $159.50 low. Are you guys watching this $159.50 level for a breakdown, or do you see a potential double-bottom forming that could invalidate the short bias? #ByXIMPACT #WSOT2026 $NVDAXUSDT $HYPEUSDT