WSOTPicktoEarn10U
Apoyá a tu equipo y capitán favoritos con #WSOTPick2Earn. Dales tu respaldo: ¿En qué mercados operan mejor y qué define su ADN de trading? Los posteos de alta calidad seleccionados ganarán 10 USDT cada uno. Los ganadores serán elegidos al azar entre las participaciones elegibles. Bybit se reserva el derecho de interpretación final.

Desafío de $100 a $100K | Saldo : 722.87 USDT 💲
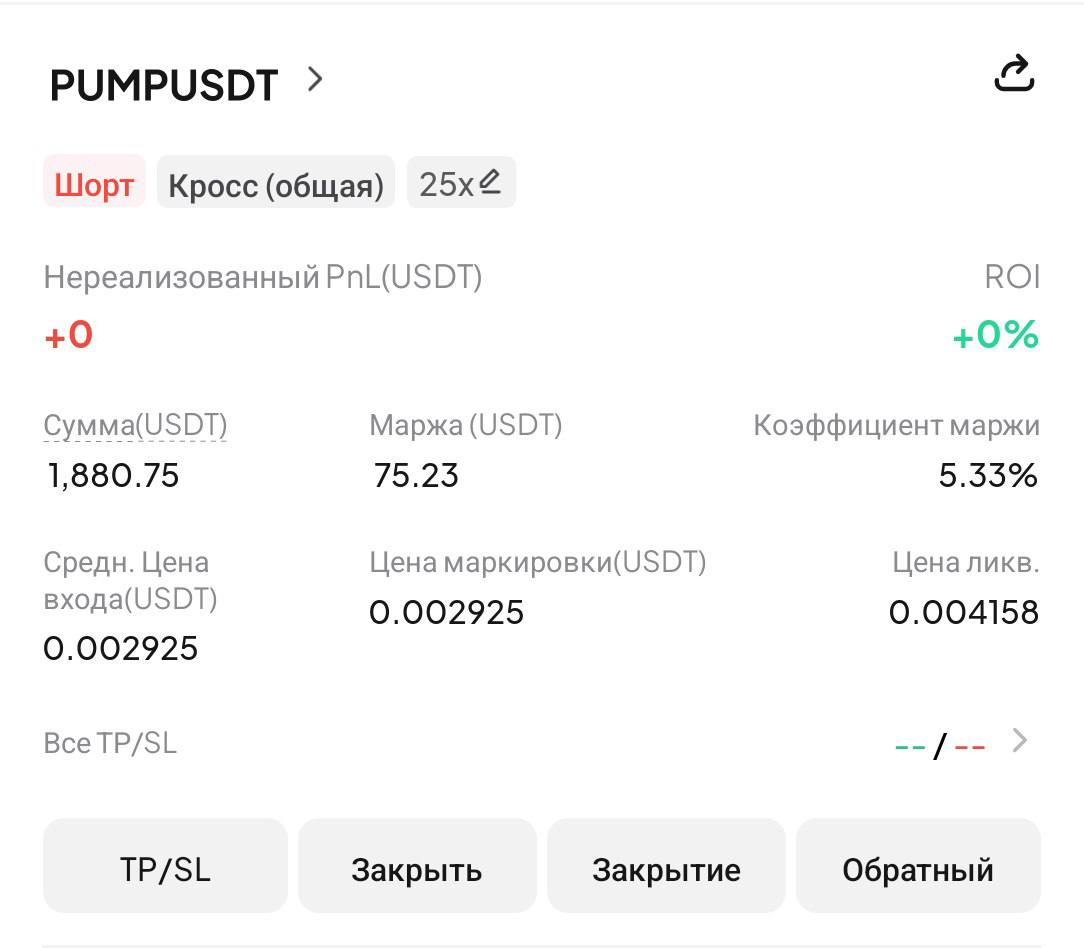
📊 $PUMPUSDT| SHORT | 25x 🟢 Precio de entrada : $0.002925 🟢 Precio objetivo : $0.002895 $0.002864 $0.002699 🔴 Stop Loss : $0.003080 💳 Margen : 75 USDT 💲 💰 Saldo de la billetera : 722.87 USDT 💲 ⚠️ Evitá entrar tarde. Cada trade se comparte temprano con la comunidad de @Kryptent. 🔥 #WSOT2026 #Seguimiento IPC EE.UU. Nov #8ºAniversarioDeBybit #BybitAIEvolving #WSOTPicktoEarn10U

🎉 ¡Se anunciaron los ganadores de #WSOTPickToEarn10USDT!
¡Felicitaciones a nuestros 10 ganadores y a sus publicaciones destacadas mostrando un gran apoyo a sus equipos: - Crypto BOSS - Rufiweb3 - RoYoK - ton***@**** - MAYA_ - CoinGru - CRIPTO PROFESIONAL - Crypto bean - wei***@**** - AlphaSaylor En ByX, buscamos contenido original, revelador y atractivo que ayude a la comunidad a tomar decisiones de trading mejor fundamentadas. La competencia principal de equipos WSOT comienza hoy! ¿Será que el equipo que apoyás llegará a la cima y se repartirá hasta 3.200.000 USDT? 👀 #WSOT2026 #WSOTPicktoEarn10U


$TSLAXUSDT ¿Tiene futuro la Tesla tokenizada? El futuro de la compañía está cada vez más vinculado a la inteligencia artificial, el transporte autónomo y la robótica. Al mismo tiempo, las acciones tokenizadas están creando una nueva forma para que los inversores accedan a acciones tradicionales a través de la infraestructura blockchain. TSLAX se sitúa directamente en la intersección de estos dos desarrollos. Pero, ¿puede esta exposición a Tesla tokenizada atraer una demanda significativa? Resumen del mercado — 11 de noviembre de 2026 Basado en la última instantánea de mercado disponible: - Precio: $384.24 - Cambio en 24H: +2.00% - Capitalización de mercado: $69.94M - Volumen en 24H: $8.67M - Máximo en 24H: $386.88 - Mínimo en 24H: $370.60 - Máximo histórico: $496.55 - Distancia del máximo histórico: -22.6% Análisis técnico TSLAX se está acercando a una importante zona de resistencia tras recuperarse de la debilidad reciente. Niveles clave a observar: - Soporte inmediato: $370–$374 - Soporte fuerte: $350–$360 - Resistencia inmediata: $386–$391 - Resistencia principal: $395–$408 Una ruptura sostenida por encima de los $391 podría fortalecer el impulso alcista hacia los $408. Sin embargo, perder los $370 podría exponer la región de soporte inferior. Desarrollo fundamental La transición estratégica de Tesla hacia el transporte autónomo y la producción del Cybercab es un desarrollo importante a tener en cuenta. Su negocio de almacenamiento de energía y sus ambiciones en IA también contribuyen a la narrativa de inversión a largo plazo. Para TSLAX, la distinción es importante: los inversores están obteniendo una exposición tokenizada al capital de Tesla en lugar de invertir en un ecosistema de criptomonedas convencional. Tokenomics y riesgo TSLAX opera a través de una estructura de capital tokenizado. Su valor está vinculado a las acciones de Tesla, mientras que los acuerdos del emisor, la custodia, el acceso a la redención, las restricciones regulatorias y la liquidez del mercado secundario siguen siendo consideraciones importantes. Mi perspectiva del mercado Escenario alcista: Mantener los $370–$374 y romper por encima de los $391 podría crear una oportunidad para probar los $395–$408. Escenario bajista: Una ruptura por debajo de los $370 podría debilitar la recuperación y poner el foco en los $350–$360. La gran pregunta es si los activos del mundo real tokenizados se convertirán en una parte significativa de los mercados financieros globales. Pregunta a la comunidad: ¿Preferirías tener acciones tradicionales de Tesla o exposición a Tesla basada en blockchain a través de TSLAX? Compartí tus pensamientos abajo. #ByXIMPACT #WSOT2026 #Bitcoin cae a su mínimo de dos meses después de las elecciones de medio término en Estados Unidos #WSOTPicktoEarn10U #BybitAIEvolving @

#ByXIMPACTHyper Marketing & Analytics (For Crypto‑Focused Projects like Hyperliquid / HYPE) Disclaimer: This is market‑education content only, not financial advice. 📌 Core Definition Hyper marketing means high‑speed, community‑first promotion tailored for fast‑moving crypto audiences — paired with analytics to track what works, who engages, and how market sentiment shifts. For projects such as Hyperliquid (HYPE), it focuses on highlighting network updates, token‑burn events, trading volume growth, and ecosystem expansion. 📊 Key Analytics Areas - On‑chain analytics: Token burn volume, wallet growth, staking activity, supply changes - Market analytics: Price trends, trading volume, liquidation levels, order‑book flow - Marketing analytics: Social reach, engagement rate, hashtag performance, new follower growth, sentiment score (positive / neutral / negative) ✅ Hyper Marketing Focus Points for HYPE 1. Share key milestones: mainnet upgrades, burn announcements, new exchange listings 2. Use short, bold posts for trading communities & WSOT squads 3. Pair every update with simple data points (e.g. “Total HYPE burned: …”) 4. Track which posts get the most views to refine future messaging 📈 Sample Good‑News Marketing Snippet “Hyperliquid keeps building momentum! Latest analytics show rising user activity + large token‑burn events reducing circulating supply. Traders & community members are watching closely as the ecosystem expands — stay tuned for next updates!” $HYPEUSDT #WSOT2026 #WSOTPicktoEarn10U #NovUSCPIWatch #BybitAIEvolving

BITCOIN
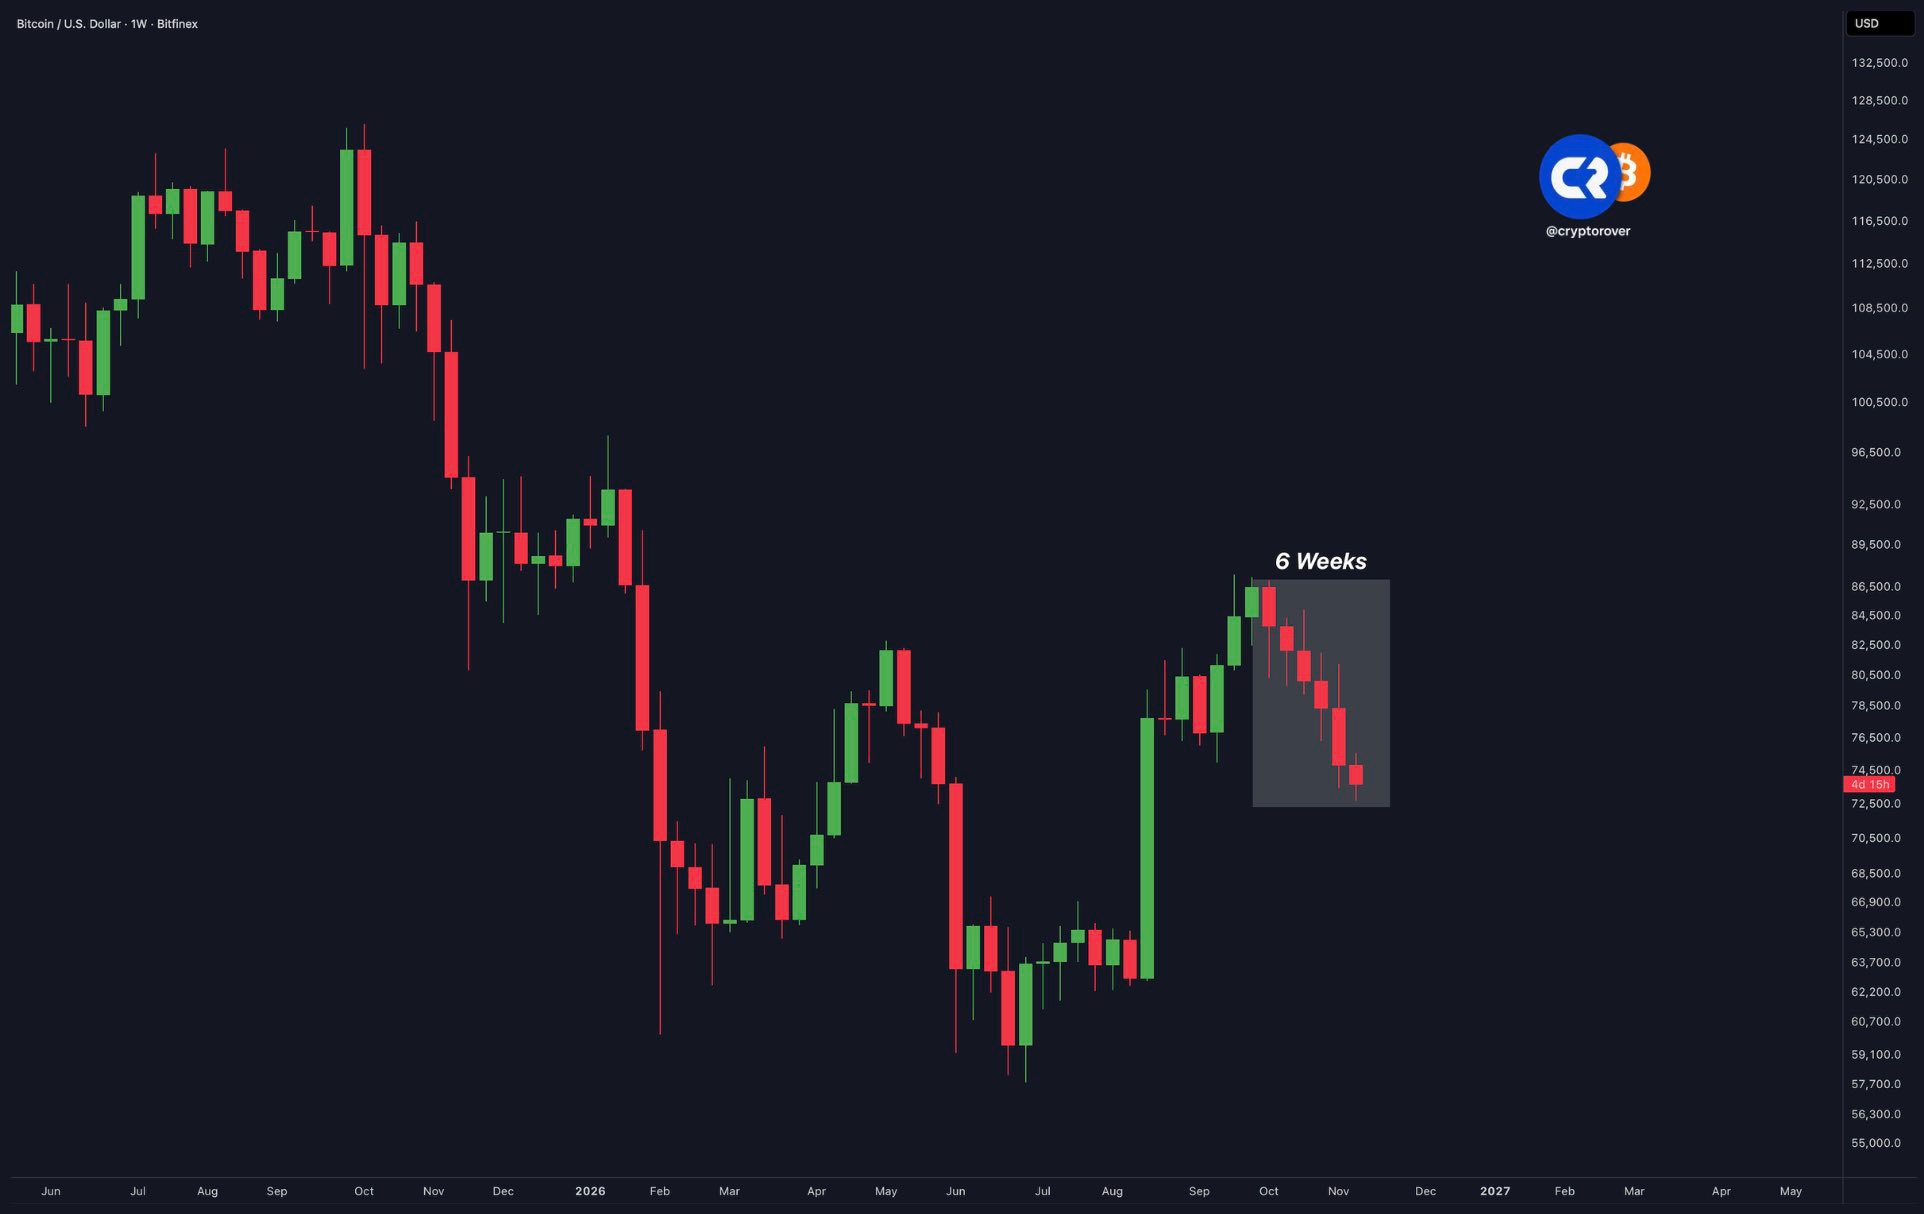
#USPayrollsAndRateDecisionsDriveMacroWeek 🔴 Bitcoin is about to close 6 RED weeks in a row. Bitcoin is experiencing one of the longest losing streaks in its history... Could this mean the longest winning streak in history is coming next? #WSOT2026 #WSOTPicktoEarn10U #OilVolatilityTracksIranPeaceTalks #NovUSCPIWatch
Trading
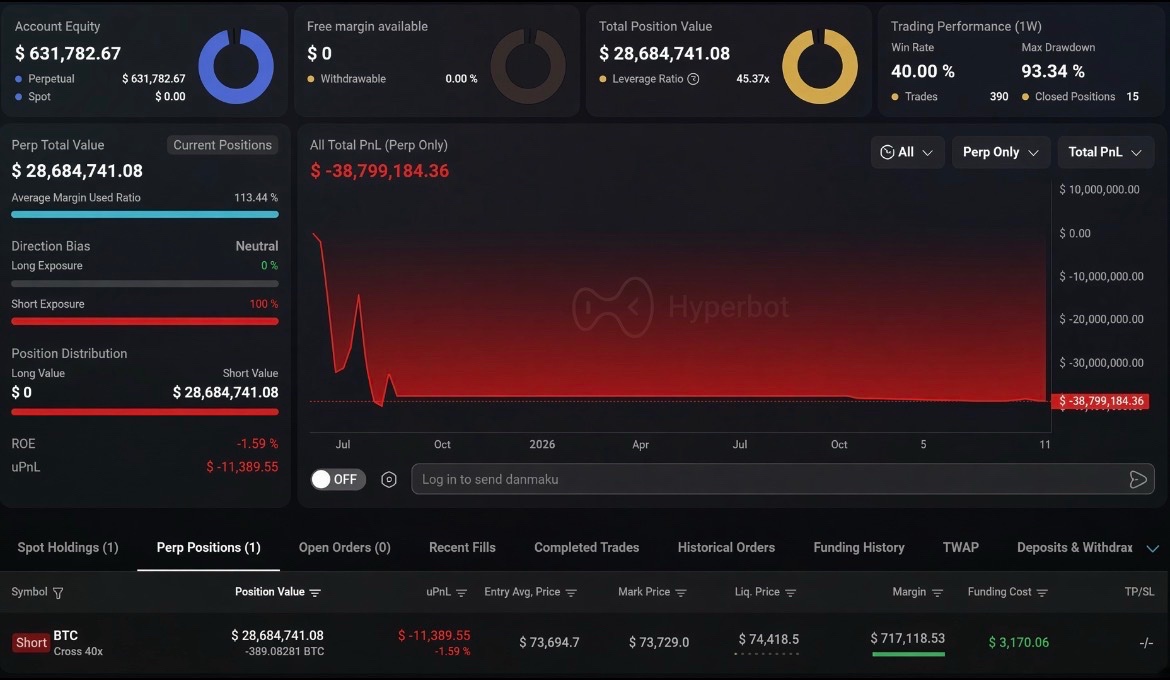
Alguien acaba de abrir un short de $BTC x40 por unos $30M. Su PnL histórico es de -$38.8M. Cuando la gente empieza a apostar a que esto sigue bajando, ya sabés que es momento de ir en long #WSOT2026 #WSOTPicktoEarn10U #Seguimiento IPC EE.UU. Nov #Las nóminas de EE. UU. y las decisiones sobre tasas de interés impulsan la semana macroeconómica #BybitAIEvolving

⚡️ AHORA: El CTO emérito de Ripple, David Schwartz 💰
Dice que vendió casi todas sus criptos por su baja tolerancia al riesgo. Sus tenencias bajaron de unos 26M $XRPUSDT , 1.500 $BTCUSDT y 40.000 ETH a aproximadamente 3M de XRP, 1 BTC y 6 ETH. #Seguimiento IPC EE.UU. Nov #WSOTPicktoEarn10U #Las nóminas de EE. UU. y las decisiones sobre tasas de interés impulsan la semana macroeconómica #La volatilidad del petróleo sigue de cerca las conversaciones de paz con Irán #BybitAIEvolving



🚨 INFORME TÁCTICO: Zona de Compresión, La Calma
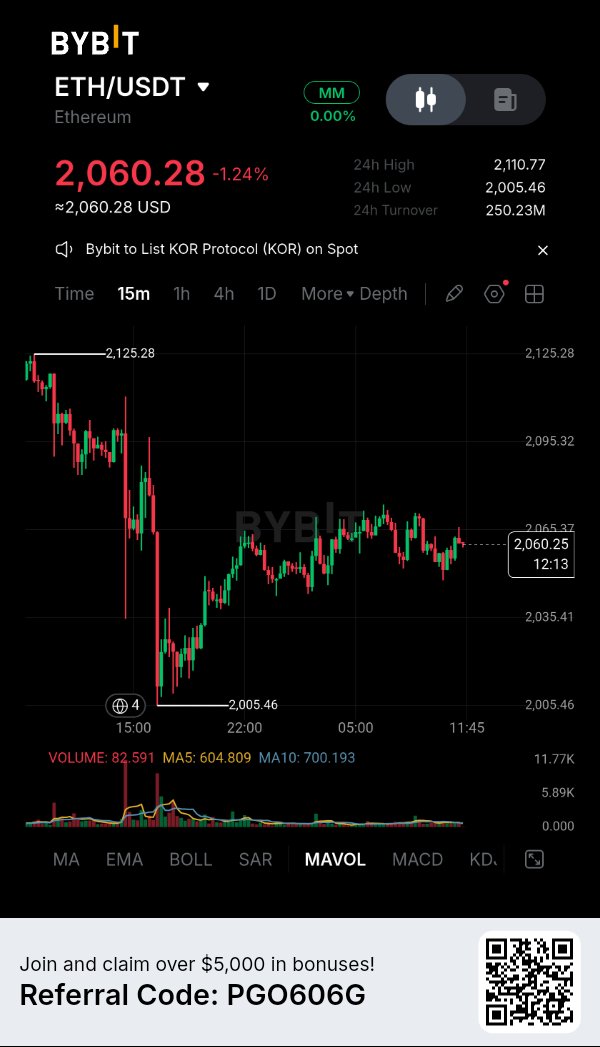
Mirá el gráfico de 15 minutos. El mercado acaba de dar un golpe fuerte. Vimos una sangría implacable desde el máximo de 2.125, que culminó en un barrido de liquidez violento directo hasta el piso de 2.005,46. Fue un típico 'shakeout' diseñado para liquidar posiciones largas sobreapalancadas y asustar a los traders minoristas para que salgan de sus posiciones. Pero mirá la reacción. Los compradores no solo defendieron el piso; absorbieron el pánico e inmediatamente empujaron el precio de vuelta hacia arriba. Actualmente estamos en 2.060,28, abajo solo un 1,24% en el día, y el precio se está moviendo lateralmente, atrapado en un rango estrecho. Esto no es debilidad; es una zona de compresión masiva. El mercado está acumulando energía para su próximo movimiento. EL ANÁLISIS TÉCNICO (Por qué importa esto): · El vacío de volumen: Mirá las barras de volumen en la parte inferior. El pico rojo masivo de la caída inicial desapareció. El volumen de venta se secó por completo. Los bajistas no tienen munición para empujar esto más abajo ahora mismo. · La estructura de mínimos ascendentes: A pesar del serrucho fuerte, el precio se niega a caer de nuevo a los mínimos de 2.005. Estamos marcando una estructura sólida de mínimos ascendentes, construyendo un piso de hormigón debajo del precio. · La compresión: Estamos comprimidos fuertemente entre el soporte de 2.035 y la resistencia de 2.065. Las medias móviles están convergiendo. Una expansión violenta en alguna dirección es inevitable. EL PLAN DE EJECUCIÓN (ESTRICTAMENTE BASADO EN REGLAS): No opero este tipo de serrucho muerto. Espero a que el mercado muestre sus cartas, y después ataco con precisión quirúrgica. 🎯 El disparador: Estoy atento a que una vela fuerte de 15 minutos cierre firmemente por encima de la resistencia local en 2.065,00. Una vez que los toros conviertan ese nivel en soporte con un aumento en el volumen de compra, se abre la trampa. 🛑 La invalidación (Riesgo): Es quirúrgico. Si el precio rechaza agresivamente acá y pierde el soporte estructural reciente en 2.035,00, la tesis alcista queda invalidada. Me salgo al instante. Sin emociones, solo price action. 💰 Los objetivos: · TP1: 2.095,00 (Resistencia local inmediata) · TP2: 2.110,00 (Retesteo del máximo de 24h) LA CONCLUSIÓN: El mercado se está enroscando como un resorte. La trampa está tendida para los bajistas. Estoy concentrado, paciente y listo para atacar en el momento exacto en que vuelva el volumen y los toros rompan el techo. ¿Estás operando este serrucho, o estás esperando el breakout por encima de 2.065? $ETHUSDT #ByXIMPACT #WSOT2026 #Seguimiento IPC EE.UU. Nov #WSOTPicktoEarn10U #Las nóminas de EE. UU. y las decisiones sobre tasas de interés impulsan la semana macroeconómica


$AVAX Subnets & Rebound Test
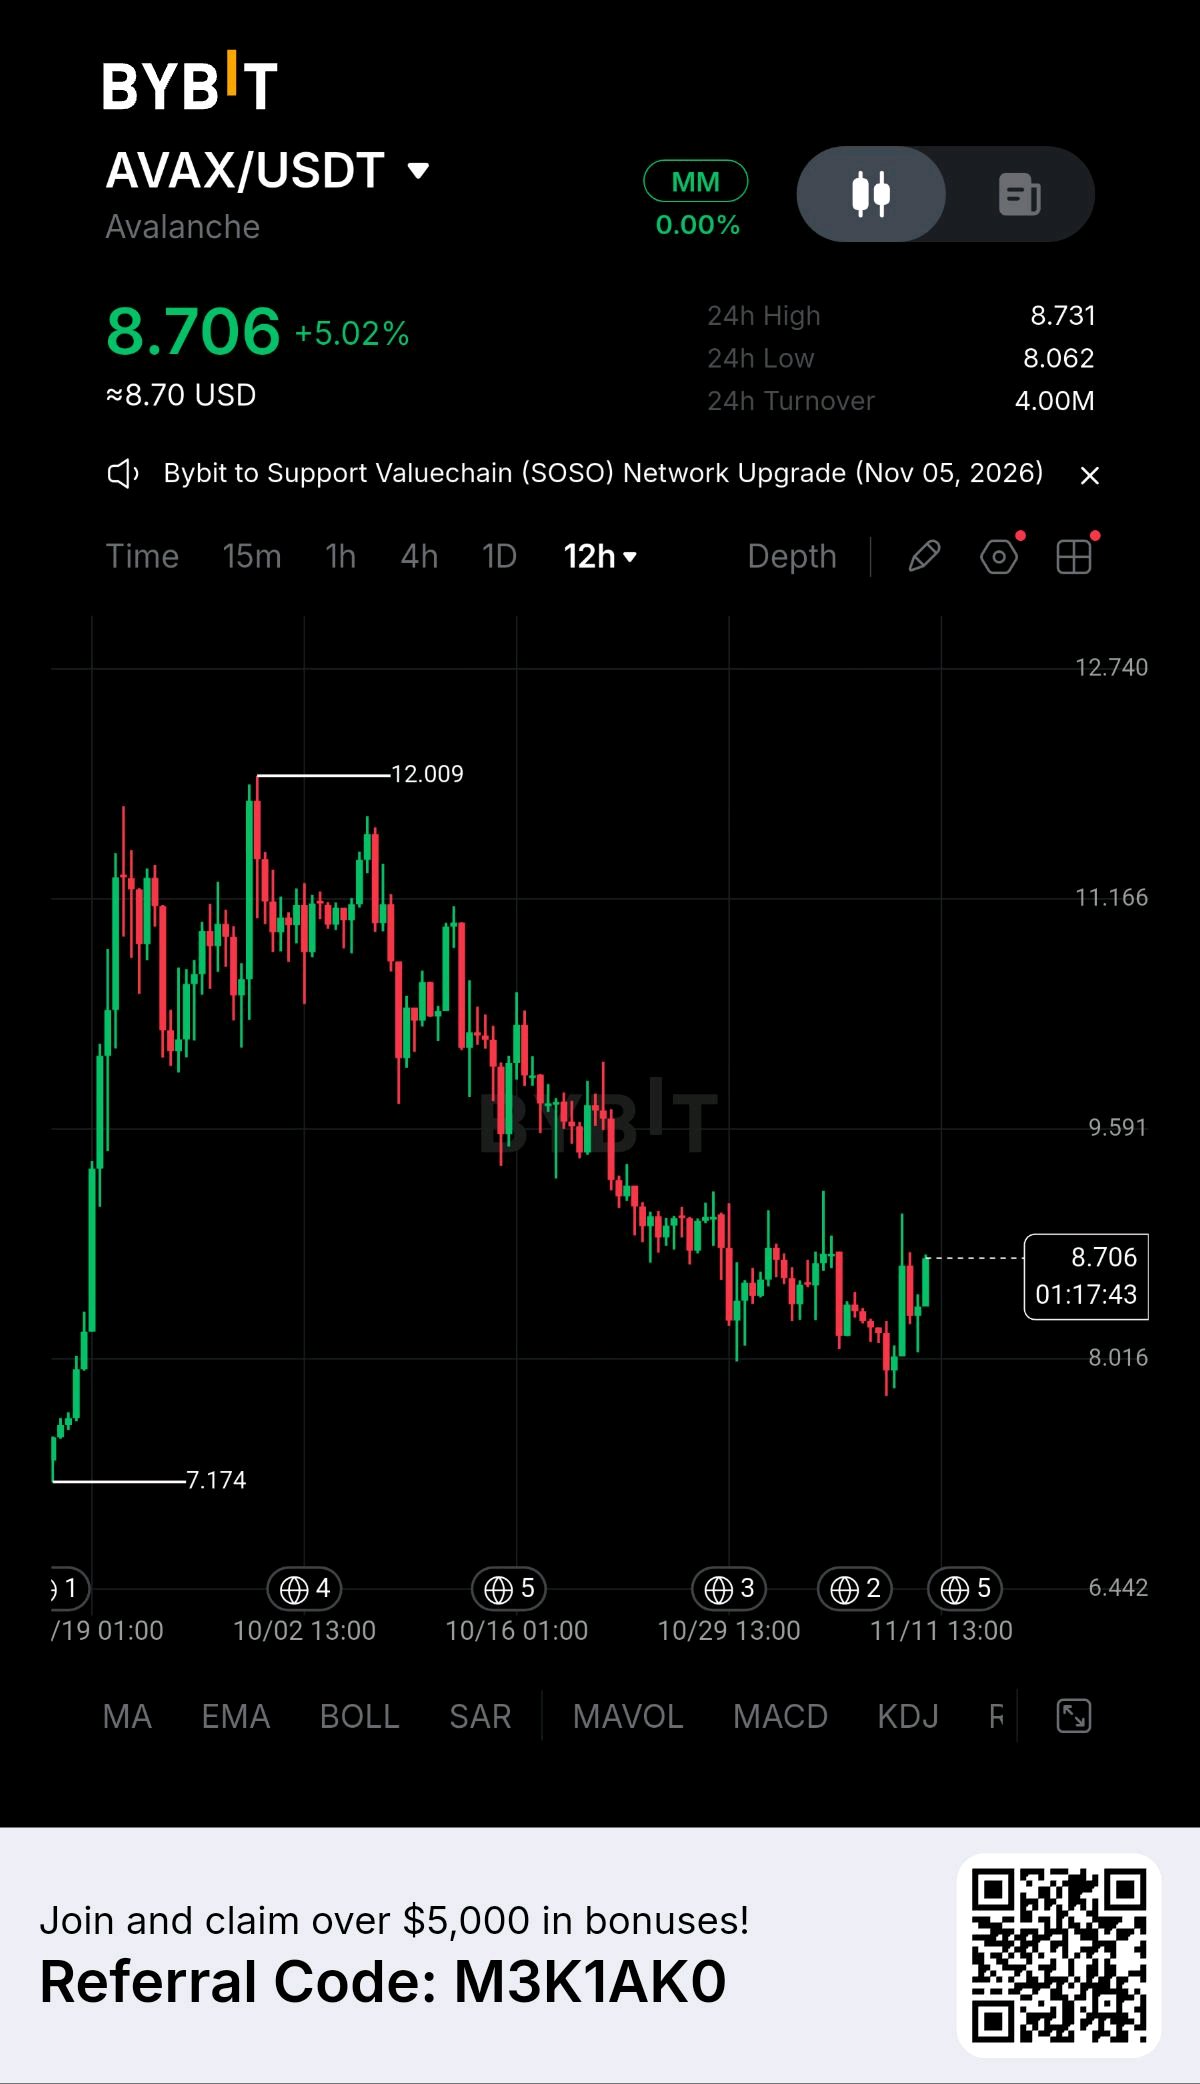
Latest News & Ecosystem Catalysts ➠ Subnet Scalability & Enterprise Adoption: Avalanche continues expanding its custom subnet architecture, driving institutional asset tokenization and high-throughput deployment across modular application chains. ➠ Network Upgrade Integration: Ecosystem validator updates and cross-chain messaging bridges improve transaction finality and user onboarding efficiency. ➠ Exchange Turnover Expansion: 24-hour trading turnover reaches $4.00M on Bybit as market volume picks up across layer-1 alternative pairs. Whale & Institutional Money Flow ➠ Order Book Bid Aggregation: Strong structural buy-side volume clusters defend the $8.016 to $8.062 demand corridor, absorbing multi-week corrective pressure. ➠ Smart Money Accumulation: On-chain metrics reveal large-wallet accumulation phases following the successful defense of multi-day swing lows near $7.174. Liquidity & Volume Dynamics ➠ Spot Price & Turnover Action: Spot $AVAX trades at $8.706 (+5.02%) on Bybit. 24-hour turnover registers at $4.00M with daily price oscillating between a low of $8.062 and a high of $8.731. ➠ Technical Rebound Momentum: Price action demonstrates an impulsive recovery leg, testing local resistance boundaries following a prolonged correction from highs near $12.009. Tokenomics & Structural Supply ➠ Deflationary Staking Model: Base fee burning mechanisms and validator bonding requirements continually reduce circulating liquid float during high network activity periods. Narrative & Market Sector ➠ Modular Subnet Infrastructure: Positions itself as a premier customizable layer-1 network tailored for institutional finance, enterprise subnet deployment, and high-performance decentralized gaming. Key Technical Setup (12H Chart) ➠ Primary Resistance Levels: $9.591 | $11.166 | $12.009 ➠ Core Support Levels: $8.016 | $7.174 | $6.442 Risk versus Reward Ratio ➠ Risk/Reward Profile: Favorable at 1:3.2 for momentum continuation swing positions initiated near the $8.05 to $8.45 retest zone, targeting an expansion toward $9.591 and $11.166. Trader’s Game Plan ➠ Support Retest Entry Strategy: Accumulate long exposure on healthy pullbacks into the $8.016–$8.400 support band, maintaining a strict stop loss below $7.100. ➠ Breakout Expansion Strategy: Trigger momentum long setups on a confirmed 12-hour candle close above local resistance at $8.731, targeting a push toward $9.591. Investor’s Angle ➠ Strategic Layer-1 Allocation: Building disciplined positioning near structural demand floors provides high asymmetric upside exposure during altcoin sector rotation phases. Not financial advice. $AVAXUSDT $LITUSDT #WSOT2026 #NovUSCPIWatch #WSOTPicktoEarn10U
📈El SPX muestra una fuerte tendencia alcista con un 71,7% de probabilidad a pesar de la volatilidad implícita extrema y una posición de GEX negativa. El sentimiento del mercado es cauto debido a los vientos en contra macroeconómicos, incluyendo las expectativas de subida de tipos de la Fed y las preocupaciones por la desdolarización. Dado que tenés pocas tenencias, principalmente en activos estables, se podría considerar una exposición cautelosa a la compra de spot del SPX para ganancias a corto plazo.💡 Recomendación: Considerá una compra spot ligera con controles de riesgo estrictos debido a la alta volatilidad y la incertidumbre macro.⚠️ Advertencia de riesgo:- La volatilidad implícita extrema indica un alto riesgo de fluctuación de precios- Las incertidumbres macroeconómicas, incluyendo la política de la Fed y la presión global de desdolarización, afectan al sentimiento del mercado- Un GEX negativo sugiere que los creadores de mercado pueden cubrirse ante caídas, aumentando el riesgo de volatilidad $SPXUSDT #ByXIMPACT #WSOT2026 #WSOTPicktoEarn10U #Seguimiento IPC EE.UU. Nov #BybitAIEvolving

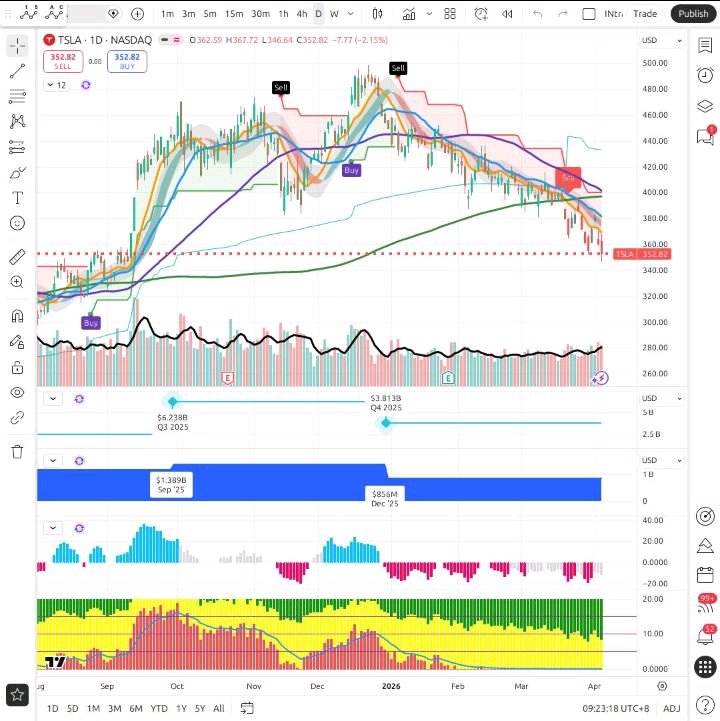
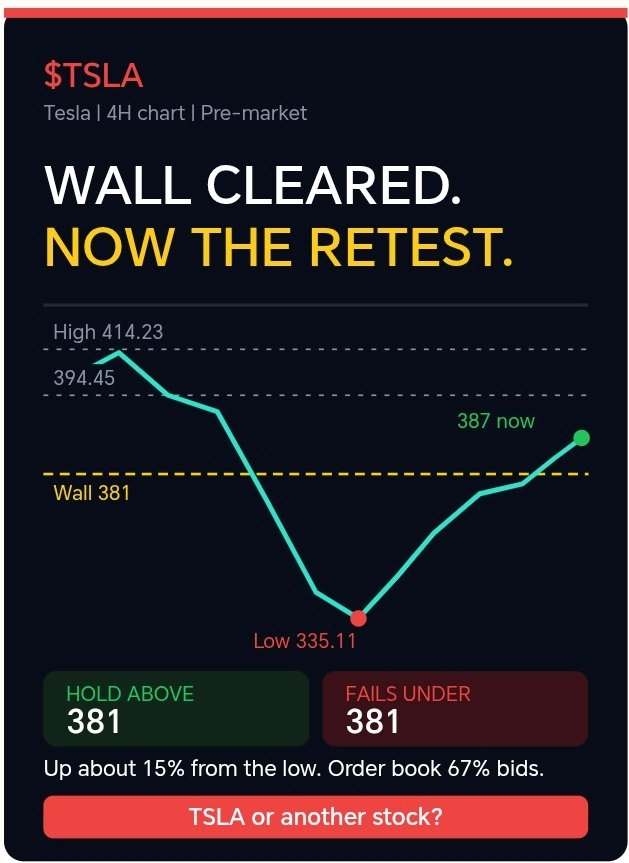
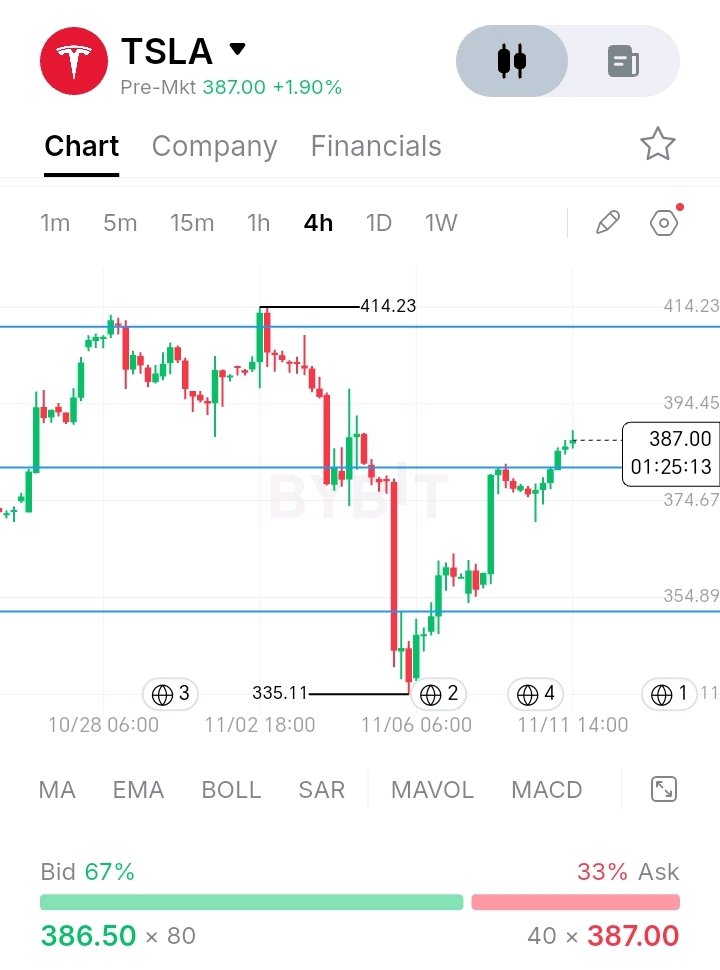
🧗 El muro fue superado en el pre-mercado. Ahora viene la parte más difícil. No quiero festejar la recuperación de $TSLA antes de que se confirme. Quiero ver cierres de 4H manteniéndose por encima de la línea de 381, porque un nivel solo se convierte en soporte después de sobrevivir a un retesteo. Esto es lo que muestra el gráfico de 4H: 🔹 La recuperación: Desde el mínimo de 335.11, $TSLA ha subido alrededor de un 15%, con mínimos más altos y velas verdes fuertes durante todo el camino. Ha recuperado cerca de dos tercios de la caída desde 414.23. 🔹 El muro: La línea de 381 detuvo el precio varias veces antes. El precio del pre-mercado está ahora por encima, y esa es la primera ruptura real de la recuperación. 🔹 Los próximos niveles: 394.45 se ubica justo arriba en el gráfico, con el máximo de 414.23 como referencia más grande. Eso está aproximadamente un 7% por encima del precio actual del pre-mercado. 🔹 El libro de órdenes: Las órdenes de compra (bids) están alrededor del 67% frente al 33% de venta (asks), una inclinación fuerte hacia el comprador. Los libros del pre-mercado son finos, así que es más una pista que una prueba. 🔹 El riesgo: Después de un rebote rápido del 15%, el precio suele retroceder para probar el nivel que acaba de superar. Ese retesteo es lo que decide si 381 ahora es soporte. 🟢 Alcista: Cierres de 4H manteniéndose por encima de 381, luego 394.45 y 414.23. Un retroceso leve a 381 que se mantenga sería una señal fuerte. 🔴 Bajista: un cierre de 4H de nuevo por debajo de 381 convierte esto en un intento fallido de recuperación, con 352 y el mínimo de 335.11 por debajo. La ruptura es el primer paso. El retesteo es la prueba real. ¿TSLA u otra acción? #TSLA #Acciones #BinanceSquare #WSOT2026 #WSOTPicktoEarn10U #Las nóminas de EE. UU. y las decisiones sobre tasas de interés impulsan la semana macroeconómica #La volatilidad del petróleo sigue de cerca las conversaciones de paz con Irán #BybitAIEvolving $TSLAXUSDT$BTCUSDT

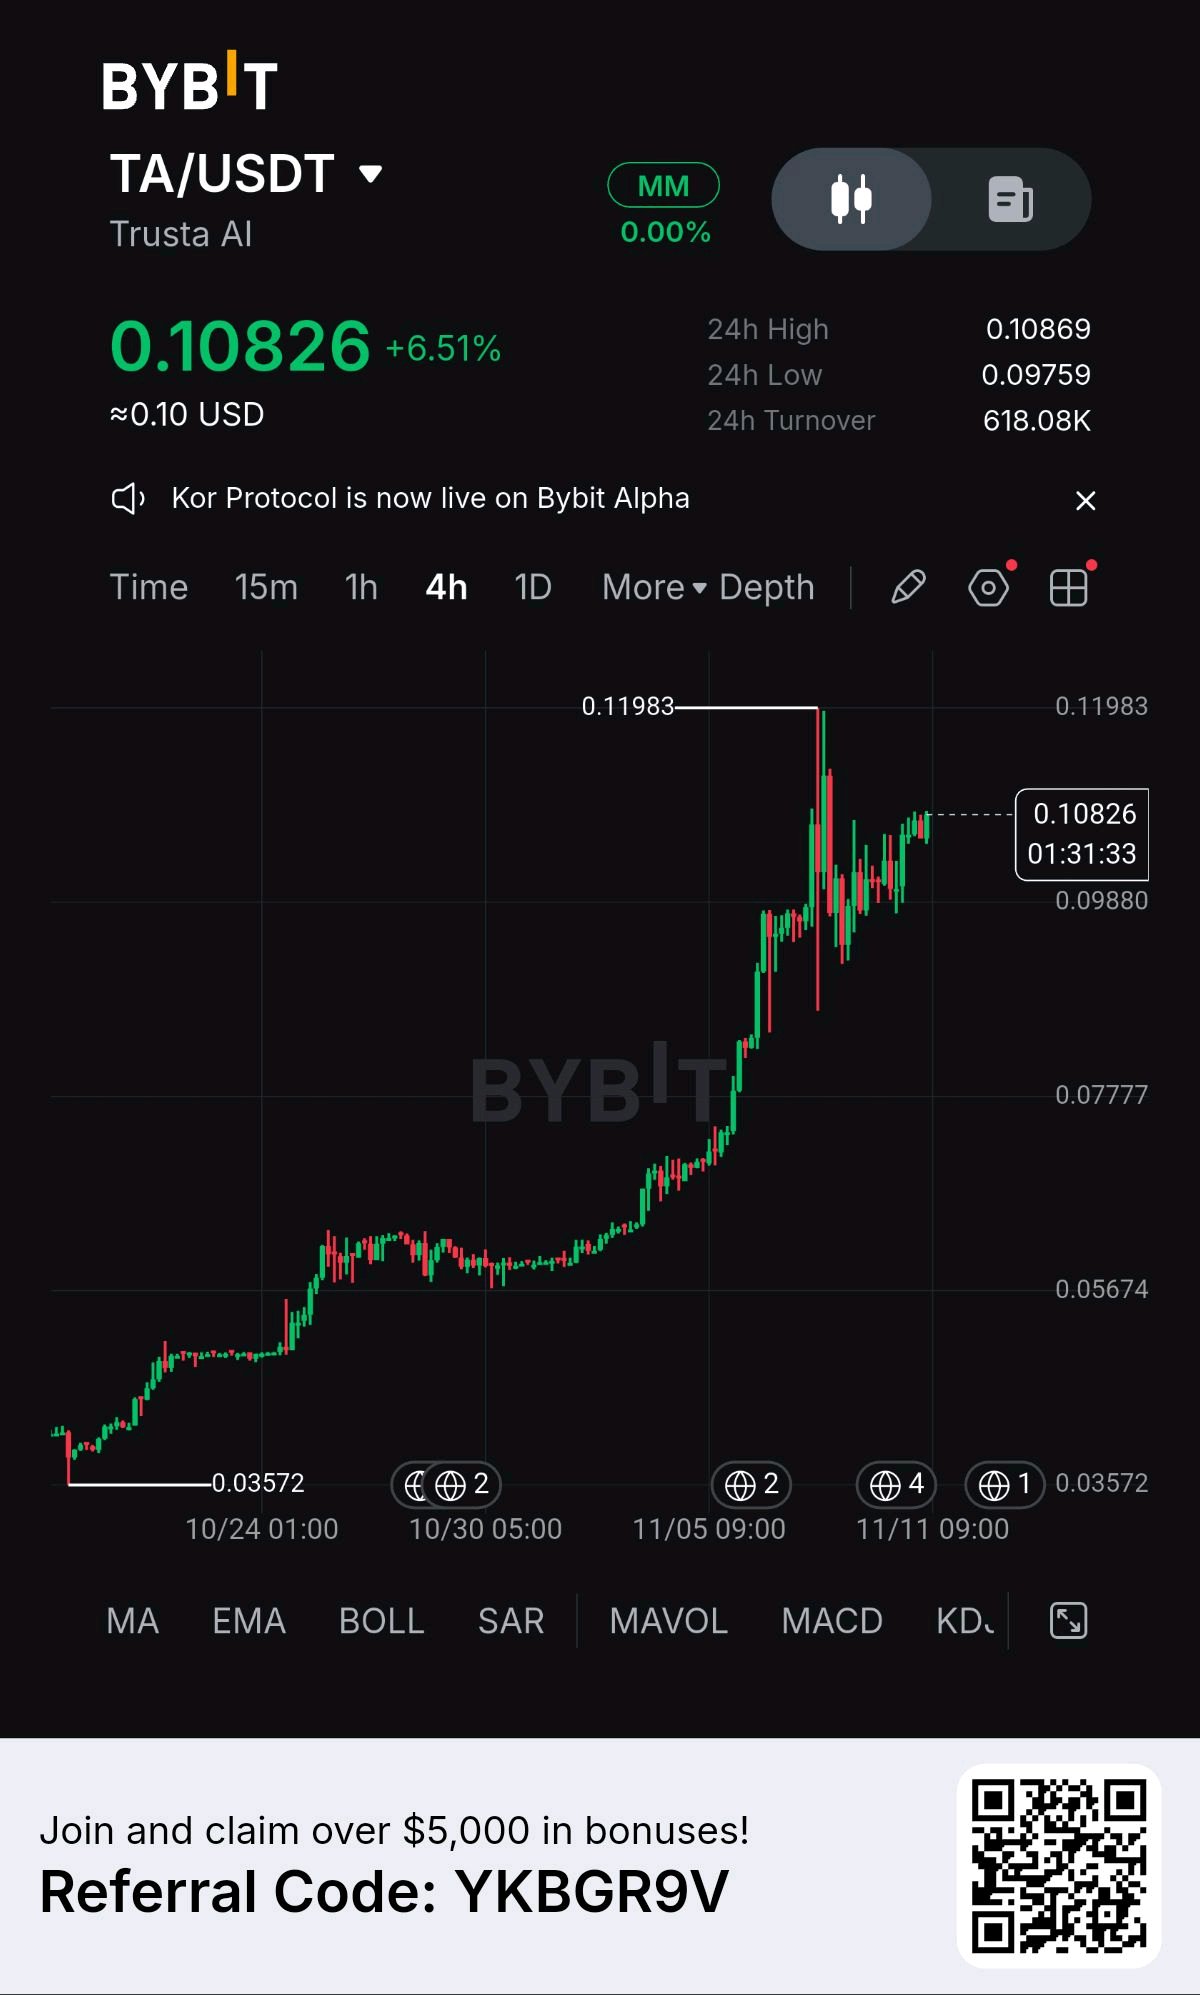
Objetivo de $0.15 reafirmado: Expansión parabólica de $TA y base de datos de IA Noticias de mercado y catalizadores macro ✔ Liquidez Spot y volumen de Bybit: Trusta AI ($TA) registró una ganancia intradía del +6.51% para operar a $0.10826 en Bybit, respaldado por un volumen de rotación de trading de 24 horas de $618.08K. ✔ Infraestructura de identidad de IA y reputación on-chain: El motor de scoring central de Trusta AI continúa expandiendo su adopción en ecosistemas Layer-1 y Layer-2, proporcionando prevención de ataques Sybil y métricas de identidad verificables para protocolos Web3. ✔ Rotación del ecosistema Bybit: El debut de Kor Protocol en Bybit Alpha ha catalizado una rotación de liquidez especulativa en protocolos de gestión de datos y agentes de IA en etapa inicial dentro del exchange. ✔ Estabilidad del rango intradía: La acción del precio estableció una base de trading firme de 4 horas entre un mínimo de sesión de $0.09759 y un máximo de $0.10869, sosteniendo su tendencia alcista estructural desde los pisos de acumulación recientes. Análisis de mercado y acción del precio El vector de tendencia parabólica: La acción del precio de $TA en 4 horas a $0.10826 muestra una poderosa expansión de tendencia macro que se origina en la base de acumulación de $0.03572. El testeo de oferta superior: Tras un pico brusco hacia el swing máximo local de $0.11983, la acción del precio se consolidó en un mínimo ascendente en $0.09880 antes de retomar su trayectoria ascendente para volver a testear la oferta de máximos locales. Momentum actual: La estructura del mercado es agresivamente alcista, con los compradores defendiendo niveles de soporte escalonados ($0.03572 → $0.05674 → $0.07777 → $0.09880) para mantener el impulso ascendente. Objetivos de liquidez: La liquidez del lado vendedor a la baja se encuentra por debajo de $0.09880. Al alza, la liquidez inmediata del lado comprador se sitúa en $0.11983, con una expansión macro secundaria apuntando a $0.13500 y $0.15000. Niveles de soporte y resistencia ✔ Soporte inmediato: $0.09880 – $0.10200 (estante de consolidación local de 4 horas y piso de demanda de mínimo ascendente) ✔ Soporte de invalidación: $0.07777 (nivel importante de quiebre estructural del swing) ✔ Primer objetivo de resistencia: $0.11983 – $0.13500 (pico local inmediato y zona de oferta de expansión) ✔ Objetivo macro de resistencia: $0.15000 – $0.18000 (zona objetivo importante de descubrimiento de precios históricos) Regla de gestión de riesgo: Un cierre de 4 horas por debajo de $0.07777 invalida la tesis de continuación parabólica inmediata y abre el riesgo hacia rangos de liquidez inferiores en $0.05674. Mantener un tamaño de posición estricto limitado al 1–2% del capital total de trading. $TAUSDT $COREUSDT #WSOT2026 #WSOTPicktoEarn10U #Seguimiento IPC EE.UU. Nov

Oportunidades en altcoins
¡Investigá antes de seguir a la multitud! El mercado de altcoins ofrece muchos proyectos innovadores, pero la popularidad por sí sola no garantiza valor a largo plazo. Prefiero analizar la tokenomics, el progreso del desarrollo, la liquidez, las asociaciones y el uso real del producto antes de evaluar cualquier proyecto. Entender los riesgos es tan importante como identificar oportunidades potenciales. ¿Qué altcoin merece más atención por su tecnología y utilidad en el mundo real? Este es mi análisis de mercado personal, no un consejo financiero. Siempre hacé tu propia investigación (DYOR). #Altcoins #CryptoResearch #Tokenomics #Blockchain #Bybit #DYOR #BybitAIEvolving #WSOT2026 #Seguimiento IPC EE.UU. Nov #WSOTPicktoEarn10U #Las nóminas de EE. UU. y las decisiones sobre tasas de interés impulsan la semana macroeconómica
Solana ($SOL)
¿Puede la expansión del ecosistema fortalecer su posición? Solana ha construido un ecosistema creciente en torno a las finanzas descentralizadas, las aplicaciones y los activos digitales. Su capacidad para atraer desarrolladores, mantener la fiabilidad de la red y aumentar la actividad real de los usuarios serán factores importantes a tener en cuenta. Creo que la adopción a largo plazo es más significativa que la emoción temporal del mercado. ¿Qué debería priorizar Solana a continuación: estabilidad de la red, crecimiento de desarrolladores o una adopción más amplia? Este es mi análisis de mercado personal, no un consejo financiero. Siempre investiga por tu cuenta (DYOR). #Solana #SOL #Blockchain #AnalisisCripto #Bybit #DYOR$SOLUSDT #WSOTPicktoEarn10U #Seguimiento IPC EE.UU. Nov #WSOT2026 #Las nóminas de EE. UU. y las decisiones sobre tasas de interés impulsan la semana macroeconómica #BybitAIEvolving

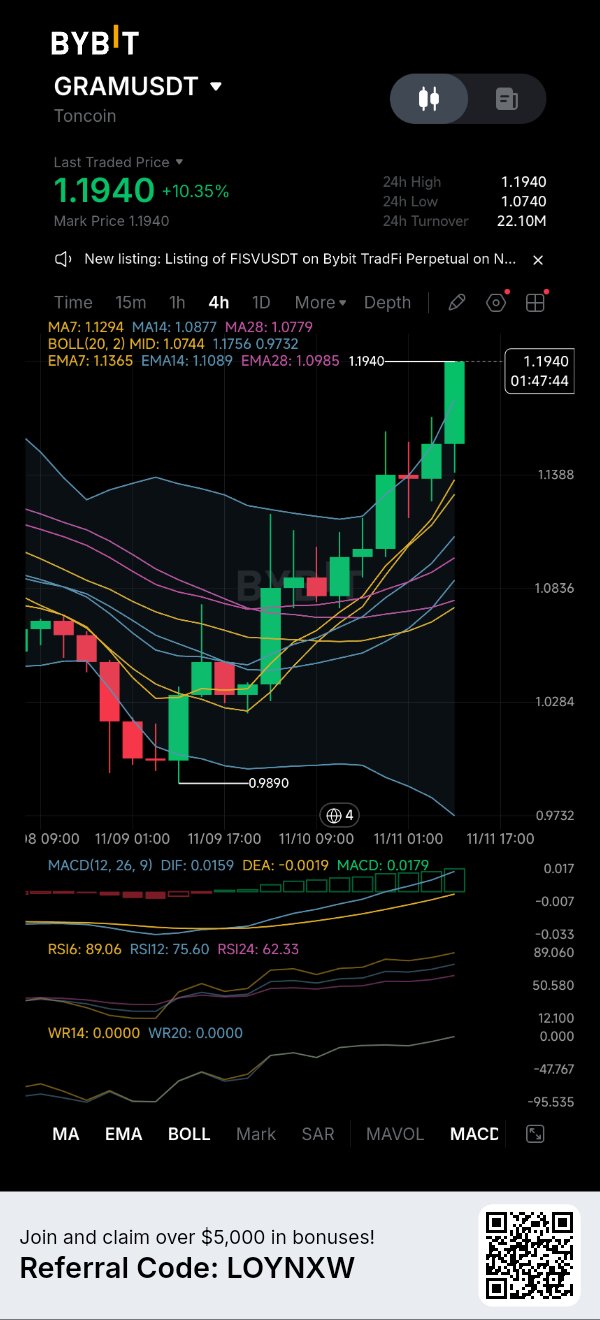
GRAM sube un 10%: ¿Podrán los toros romper los 1,20 USD?
$GRAMUSDT está mostrando un impulso impresionante tras recuperarse de su mínimo reciente de $0.9890. El precio cotiza ahora alrededor de $1.1940, con una suba del 10.35%, y velas alcistas consecutivas empujando hacia la resistencia psicológica de $1.20. La estructura de 4H se ha vuelto decididamente alcista: • El precio está por encima de la MA7 ($1.1294), MA14 ($1.0877) y MA28 ($1.0779). • El MACD es alcista, con el DIF en 0.0159 por encima del DEA en -0.0019. • El histograma MACD se ha expandido a 0.0179, lo que confirma un fortalecimiento del impulso. • El RSI6 se sitúa en 89.06, mientras que el RSI12 está en 75.60, indicando un mercado extremadamente sobrecomprado. Hay una fuerte presión de compra, pero la distancia entre el precio y las medias móviles sugiere que el rally podría necesitar un período de enfriamiento. Niveles clave a observar: - Resistencia inmediata: $1.1940 - Resistencia psicológica: $1.2000 - Primer soporte: $1.1756 - Soporte secundario: $1.1365–$1.1294 - Soporte más fuerte: $1.1089–$1.0985 Una ruptura sostenida por encima de $1.1940 podría poner el foco en $1.20. Sin embargo, un rechazo cerca de este nivel podría provocar toma de ganancias, convirtiendo a $1.1756 en el primer soporte importante a monitorear. El impulso alcista es claro, pero un RSI por encima de 89 es una advertencia contra perseguir la vela actual. Enfoque de trading: Observar consolidación, un retroceso controlado o un retesteo confirmado tras una ruptura. Revisar la liquidez, definir la invalidación y evaluar la relación riesgo-beneficio antes de considerar una posición. ¿Podrá GRAM mantener su impulso por encima de $1.20 o los compradores se tomarán un respiro primero? No es consejo financiero. DYOR (haz tu propia investigación). #WSOT2026 #Seguimiento IPC EE.UU. Nov #WSOTPicktoEarn10U #Las nóminas de EE. UU. y las decisiones sobre tasas de interés impulsan la semana macroeconómica #La volatilidad del petróleo sigue de cerca las conversaciones de paz con Irán $GRAMUSDC

BTC y ETH
Los dos pilares del mercado cripto Bitcoin y Ethereum siguen cumpliendo roles distintos pero importantes en la industria de los activos digitales. Bitcoin es conocido por su oferta limitada y su valor descentralizado, mientras que Ethereum soporta contratos inteligentes y una amplia gama de aplicaciones blockchain. Su desarrollo futuro depende de la adopción, la confianza de los inversores y el progreso tecnológico. ¿Cuál crees que tiene un mayor potencial a largo plazo: $BTC o $ETH? Este es mi análisis personal del mercado, no es asesoramiento financiero. Siempre hacé tu propia investigación (DYOR). #Bitcoin #BTC #Ethereum #ETH #CryptoMarket #Bybit #DYOR #WSOT2026 #Seguimiento IPC EE.UU. Nov #WSOTPicktoEarn10U #Las nóminas de EE. UU. y las decisiones sobre tasas de interés impulsan la semana macroeconómica #La volatilidad del petróleo sigue de cerca las conversaciones de paz con Irán $BTCUSDT $ETHUSDT

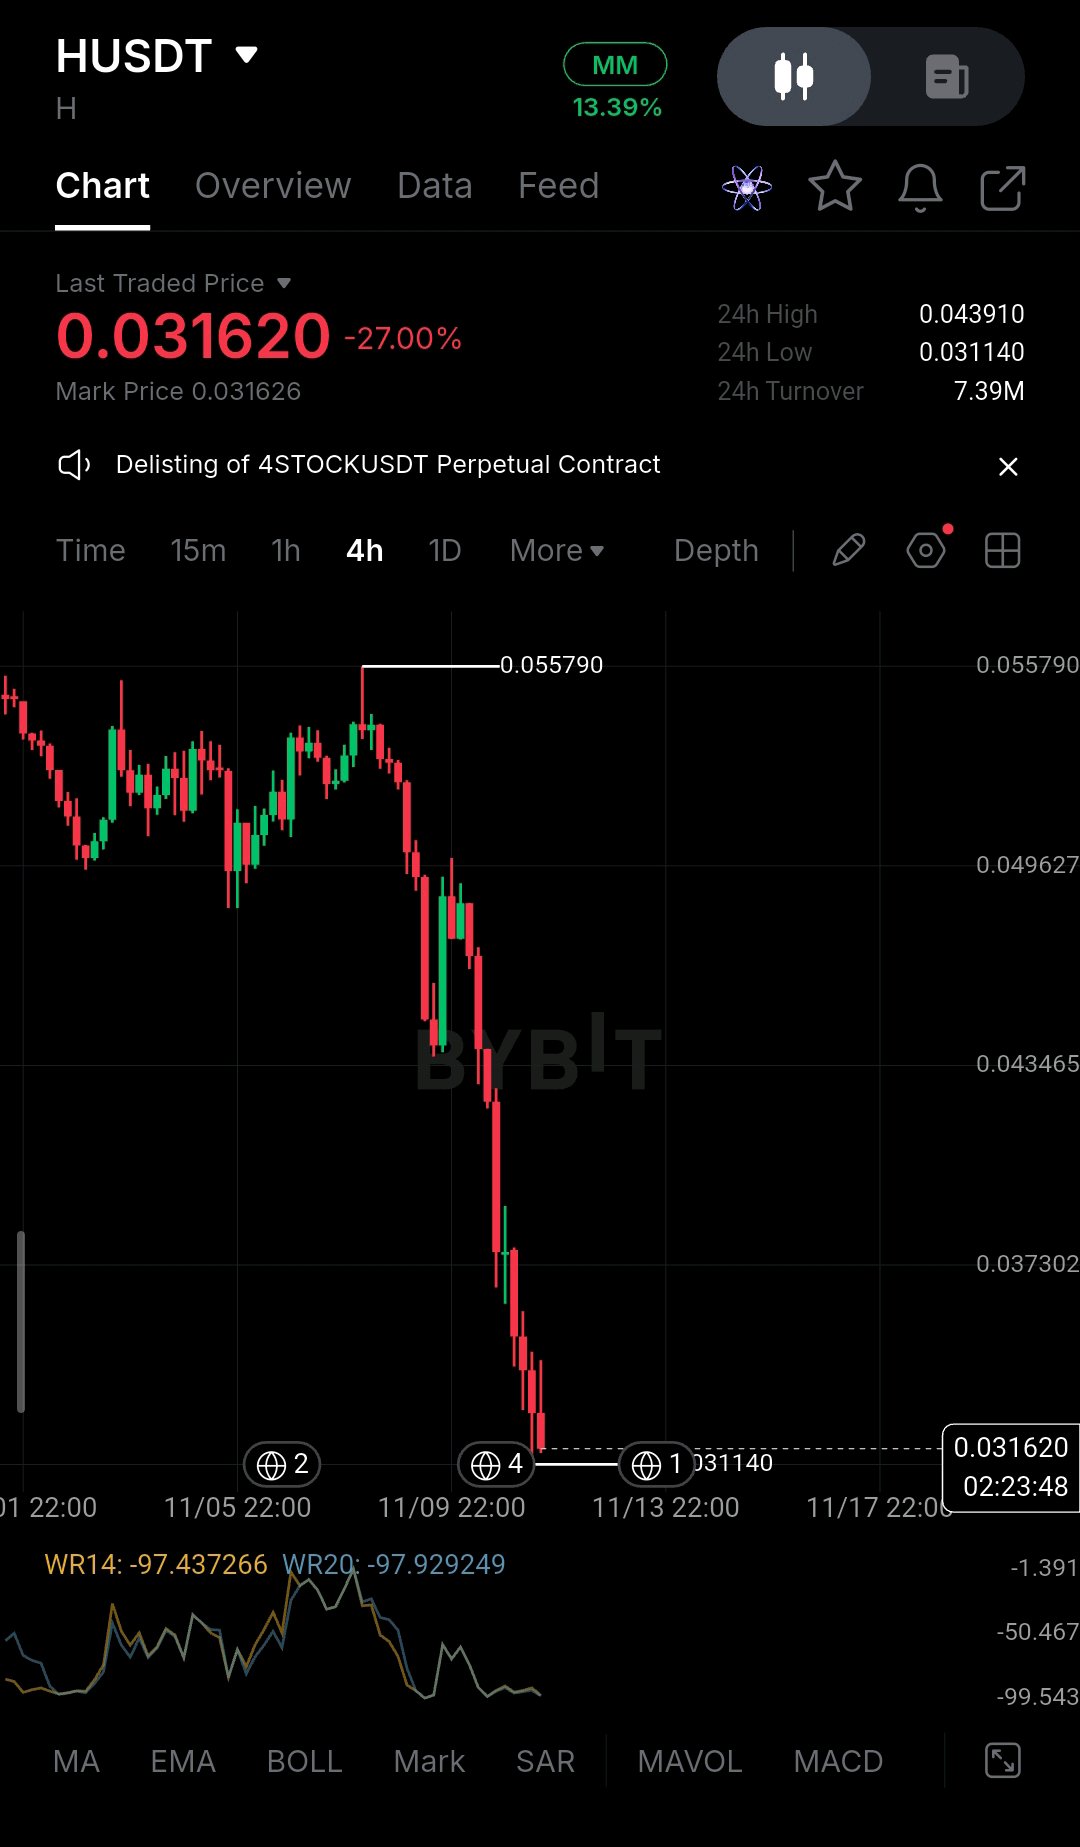
😳📉 $HUSDT Humanity Protocol is bleeding again, and the chart is heading underground ⚰️ 🩸 Market cap is down from over $1B at the peak to roughly $70-80M now (my estimate) 💥 🧨 The June $36M private-key hack never healed. It crashed the token about 90% and forced a full token migration 🔑 🔓 The next unlock is Nov 25: 266M H, about $8M at today's price. Traders are front-running the sell pressure 📉 👀 GoPlus flags the new token contract as upgradeable, so the owner can change code, including minting 🚨 Is this the bottom, or is the unlock about to push it lower? 🕳️ Which one scares you more: the unlock or the contract? 👇 ➕ Follow for more #NovUSCPIWatch #USPayrollsAndRateDecisionsDriveMacroWeek #WSOTPicktoEarn10U @BybitX @killer901 @WhaleX🐳 @DON'T JUDGE ME

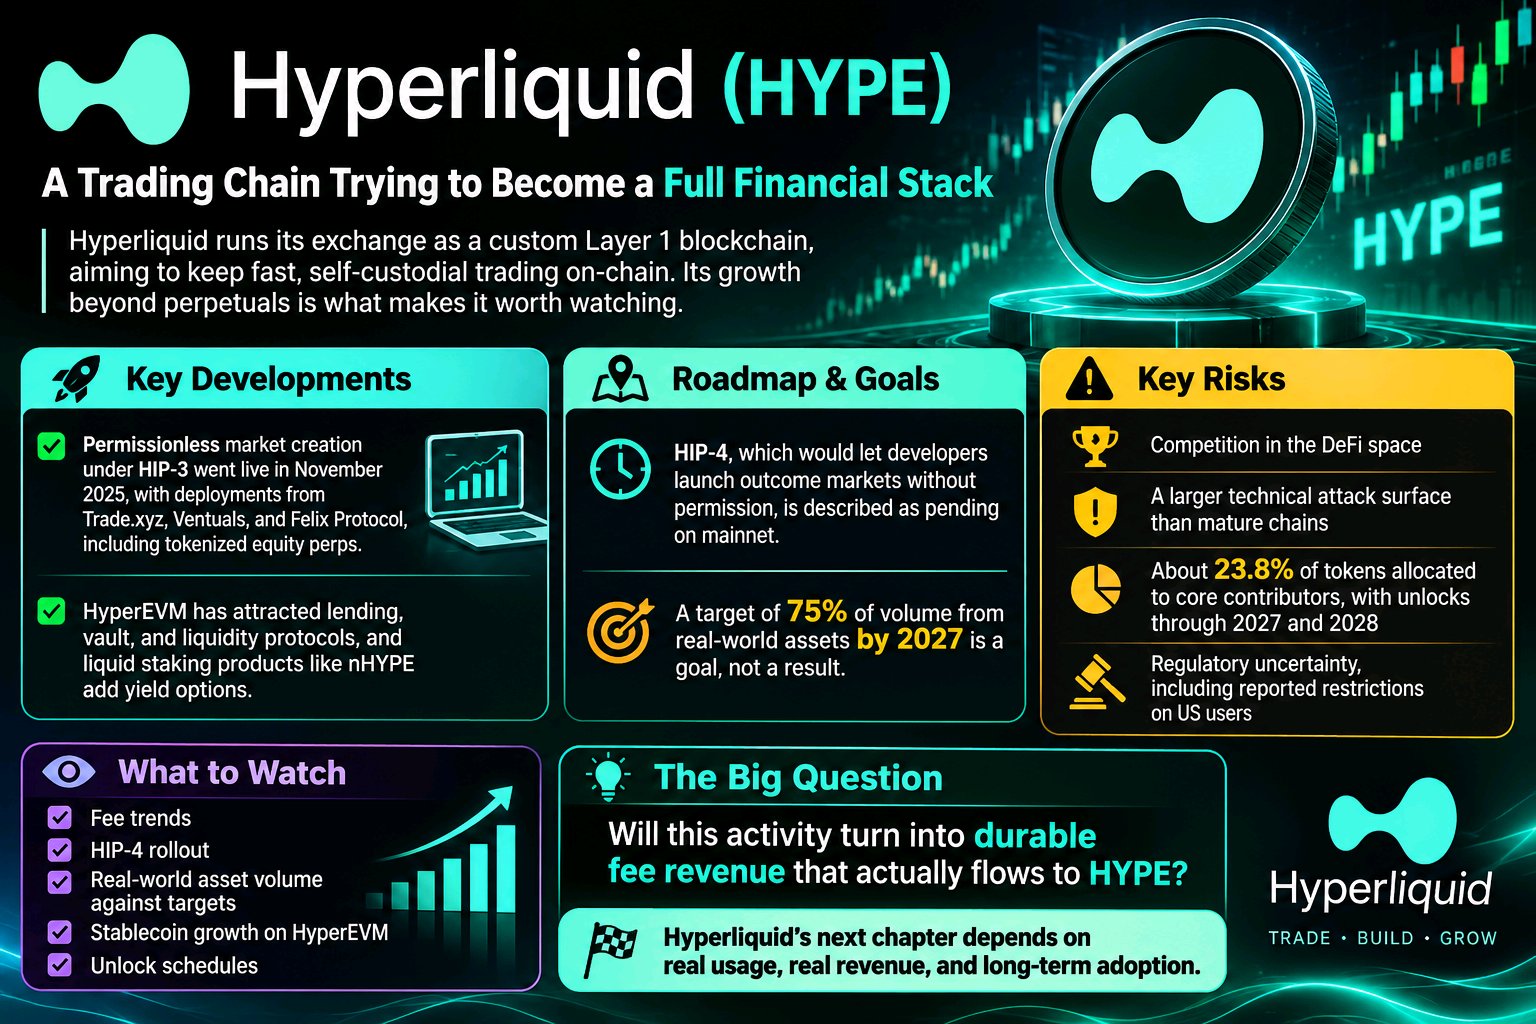
Hyperliquid (HYPE): A Trading Chain Trying to Become a Full Financial Stack Hyperliquid runs its exchange as a custom Layer 1 blockchain, aiming to keep fast, self-custodial trading on-chain. Its growth beyond perpetuals is what makes it worth watching. Permissionless market creation under HIP-3 went live in November 2025 with deployments from Trade.xyz, Ventuals, and Felix Protocol, including tokenized equity perps. HyperEVM has attracted lending, vault, and liquidity protocols, and liquid staking products like nHYPE add yield options. Some items are still forward-looking. HIP-4, which would let developers launch outcome markets without permission, is described as pending on mainnet, and a target of 75% of volume from real-world assets by 2027 is a goal, not a result. The bigger question is whether this activity turns into durable fee revenue that actually flows to HYPE. Risks include competition, a larger technical attack surface than mature chains, about 23.8% of tokens allocated to core contributors with unlocks through 2027 and 2028, and regulatory uncertainty, including reported restrictions on US users. Watch fee trends, HIP-4 rollout, real-world asset volume against targets, stablecoin growth on HyperEVM, and unlock schedules. #IMPACTbyTrade $HYPEUSDT $BTCUSDT #Oracle20BFundingPlanTestsTheAITrade #WSOT2026 #WSOTPicktoEarn10U

🚨 $AVAX IS WAKING UP — IS $9 NEXT? 👀
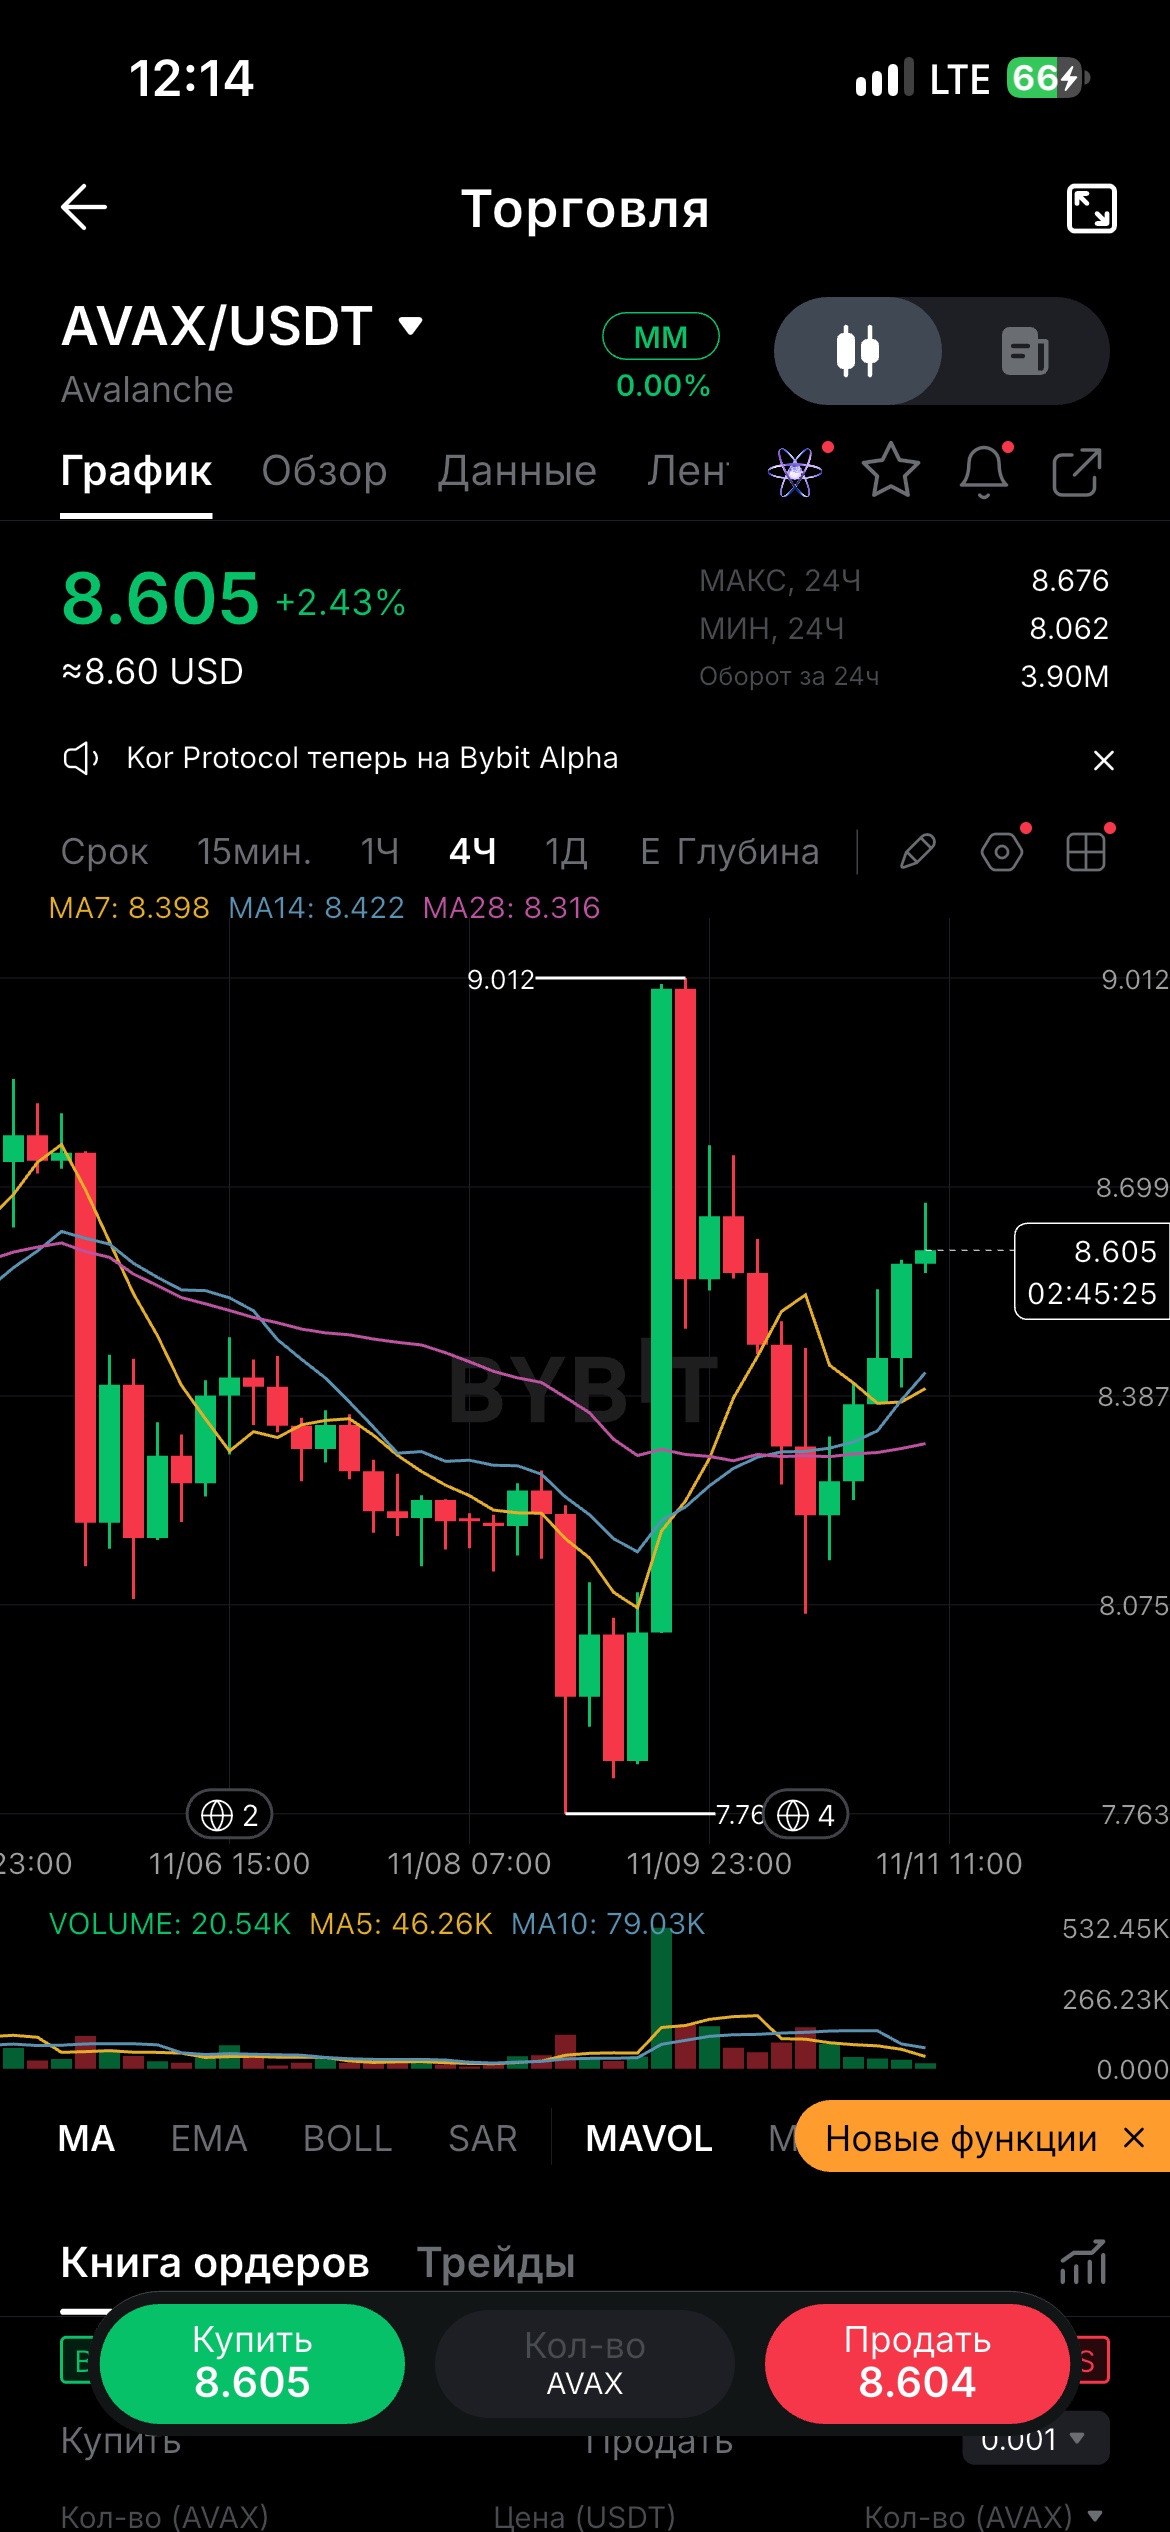
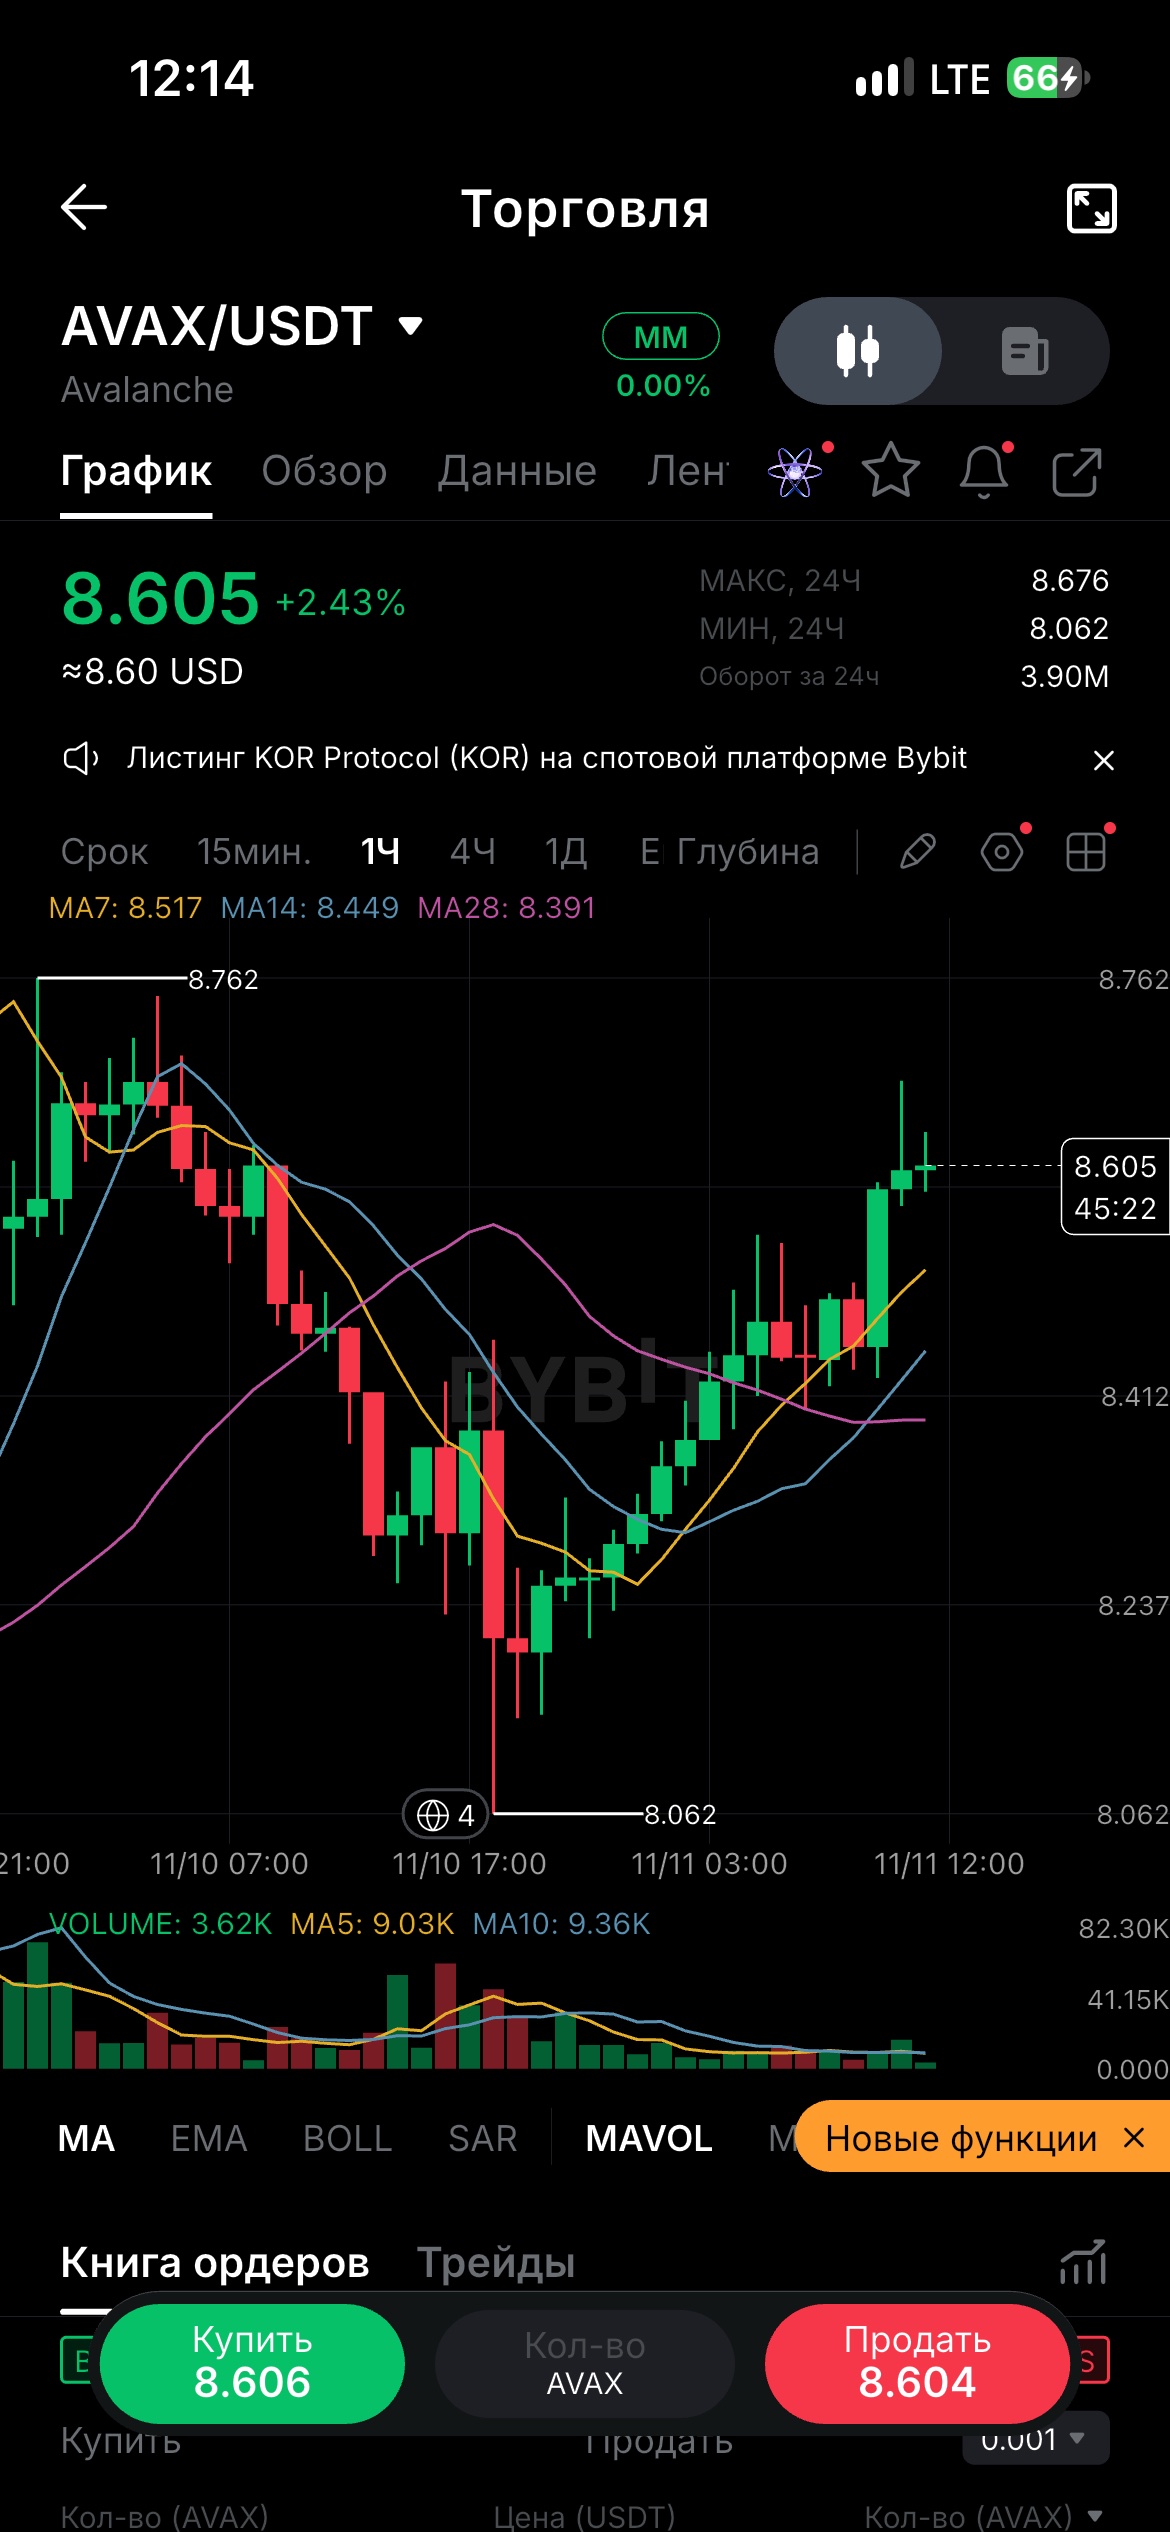
While traders are watching BTC, $AVAXUSDT is quietly building momentum. 🟢 Price: $8.60 (+2.43%) 📈 1H: Trading above MA7, MA14 & MA28 🔥 4H: Buyers pushing price higher KEY LEVELS: 🎯 $8.68 — immediate resistance 🚀 $9.00 — next bullish target 🛡️ $8.40 — important support A breakout above $8.68 could open the door to $9. But is this a real reversal or just another bull trap? 💬 to $9 or back to $8? 👇 #WSOT2026 #NovUSCPIWatch #WSOTPicktoEarn10U #USPayrollsAndRateDecisionsDriveMacroWeek #Волатильность нефти отслеживает мирные переговоры по Ирану
🟢 ETH — Good‑News Focus & Market Analysis (Nov 11 2026) Even as short‑term price action remains choppy (ETH currently ~$2,050, down ~3.8 % 24‑hr), several structural positive catalysts are building behind the recent pullback. ✅ Key Good News for Ethereum 1. Strong long‑term staking loyalty Nearly 36.4 % of circulating ETH — about 44.5 million tokens — remains locked in staking contracts, with no large‑scale unstaking rush amid volatility. This shrinking liquid supply acts as a structural floor: fewer coins available for immediate sale during dips, while yield‑seeking holders continue to accumulate for multi‑cycle positions. 2. Whale smart‑money buying at support zones On‑chain data shows large‑cap wallets have stepped in to accumulate near the $2,000‑$2,050 range — one notable group purchased over 20 000 ETH in recent sessions at average prices close to current levels. Many analysts view this weekly 0.618 Fibonacci retracement zone as a historically reliable accumulation window for medium‑term ETH cycles . 3. Upcoming Glamsterdam upgrade pipeline The highly anticipated Glamsterdam upgrade is scheduled for late‑Q4 2026, bringing parallel transaction execution and ePBS (proposer‑builder separation) — designed to boost base‑layer throughput, lower Layer‑1 congestion, and further strengthen decentralization for the fast‑growing Layer‑2 ecosystem . Layer‑2 transaction volumes have stayed resilient through market softness, keeping Ethereum’s position as the leading home for real‑world‑asset (RWA) and stablecoin settlement. 4. Broader global regulatory progress Outside the US, clearer frameworks for ETH‑linked investment products are emerging across Asia and Europe, opening new institutional access channels that could offset near‑term US spot‑ETF outflows over time . 📊 Balanced Technical & Macro Outlook Short‑term headwinds remain: hotter‑than‑expected US inflation data keeps Fed‑rate‑hike expectations elevated, pressuring risk assets, while US ETH spot ETFs have seen several days of net outflows recently. - Immediate support zone: $2,000‑$2,020 - First bullish trigger: Sustained close above $2,130‑$2,200, which would signal a shift back toward recovery momentum The positive story here is not about an instant price jump — it is about fundamentals holding firm while sentiment wavers. For longer‑term observers, the current pullback is being framed as a chance to focus on Ethereum’s expanding utility pipeline rather than short‑term volatility. $ETHUSDT $BTCUSDT #ByXIMPACT #WSOT2026 #WSOTPicktoEarn10U #BybitAIEvolving
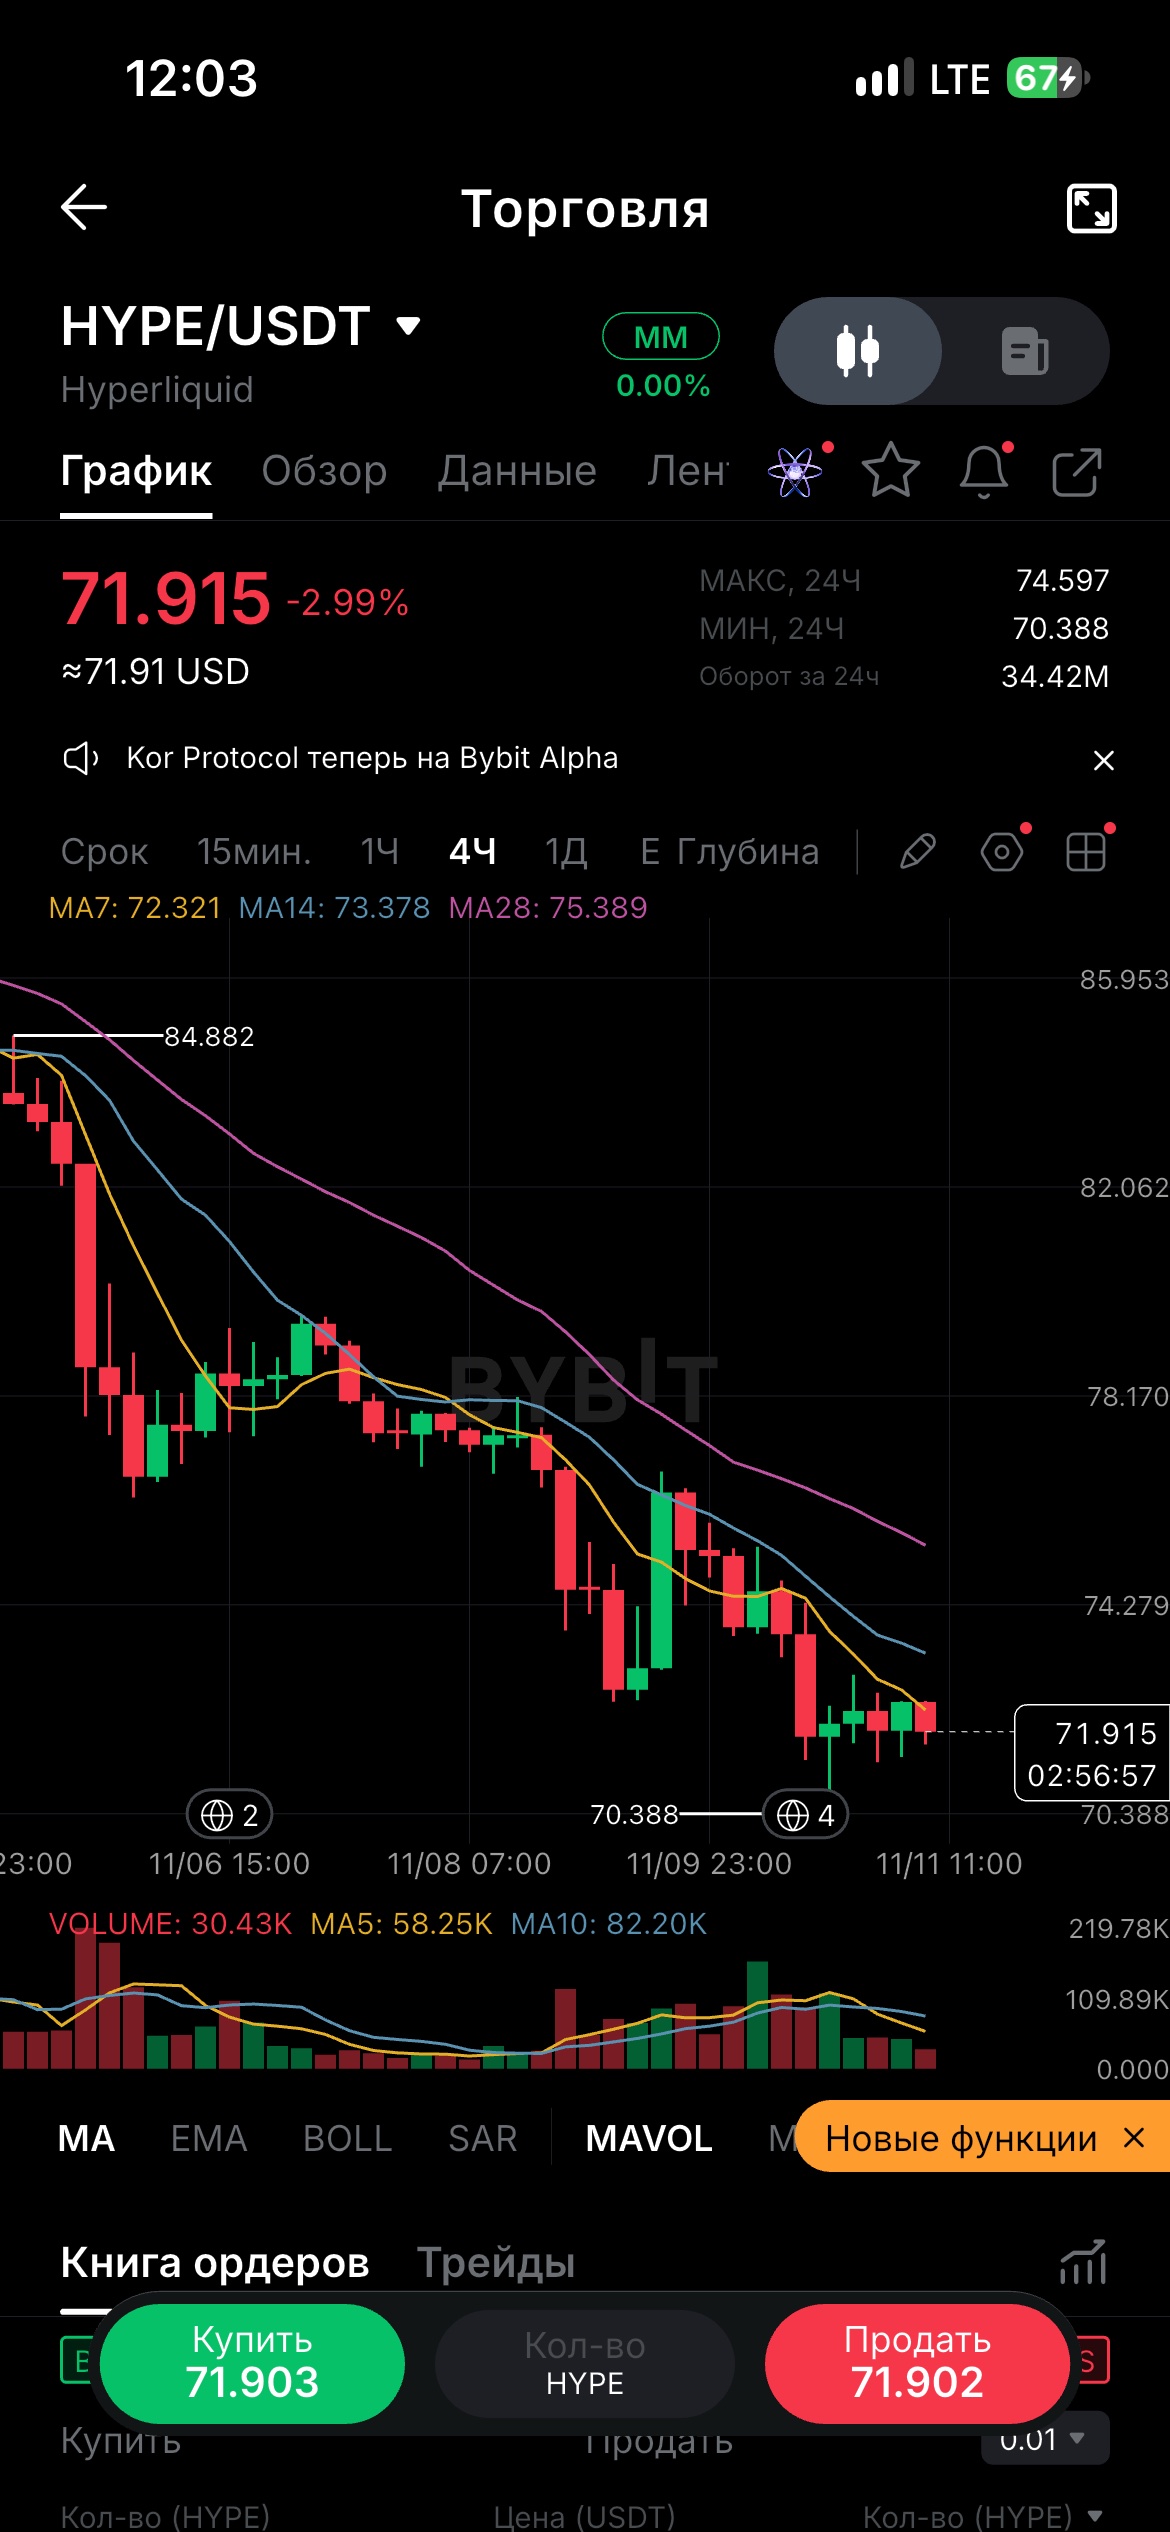
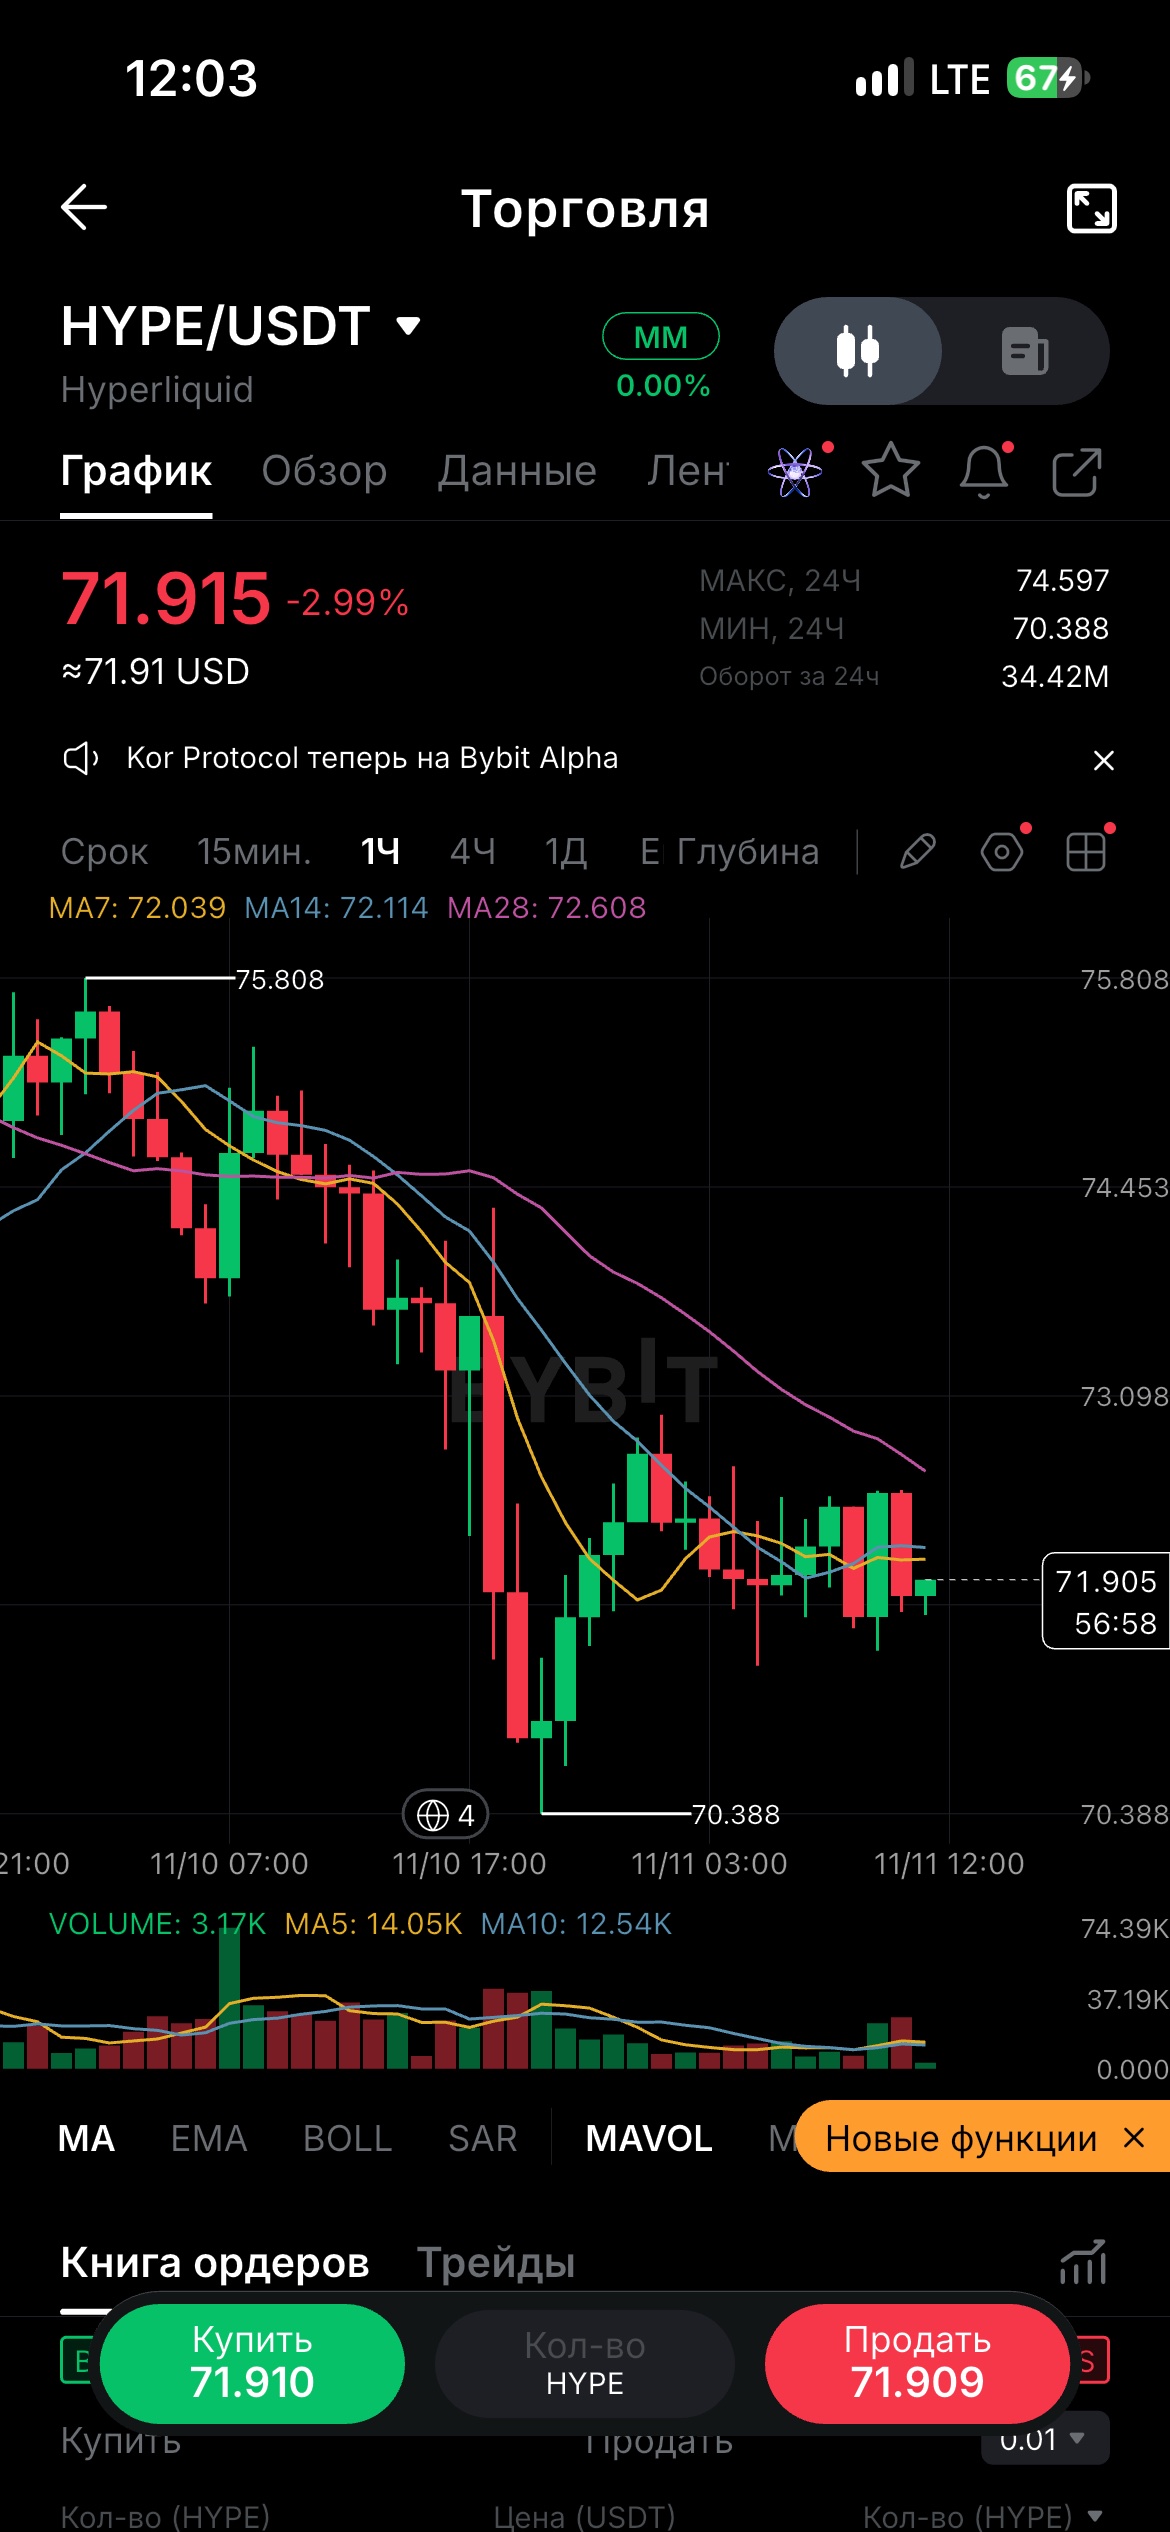
🚨 $HYPE — BULL TRAP OR THE START OF A REVERSAL?
$HYPEUSDT is trading near $71.9 after bouncing from $70.38. 📉 4H trend remains bearish. 🟢 Above $72.6 → bulls could target $73.4 🔴 Below $71.35 → $70.38 back in play 👀 Are whales accumulating or preparing another dump? What’s your next move — LONG or SHORT? 👇 #WSOT2026 #NovUSCPIWatch #WSOTPicktoEarn10U #USPayrollsAndRateDecisionsDriveMacroWeek #AnthropicIPOValuationTest
📊Current BTC snapshot Bitcoin (BTC) is trading around $73,700 (‑~2.1 % 24‑hr), after dipping to an intraday low near $72,700 overnight . Total crypto‑market liquidations hit ~$723 M in the past 24 h, with most from long‑position forced closes . Key drivers behind the pullback - Hot US inflation data: October CPI rose 0.4 % month‑over‑month (above forecasts), lifting market odds of another Fed interest‑rate hike in December — higher rates tend to weigh on non‑yielding assets like BTC . - ETF outflows: US spot Bitcoin ETFs saw net outflows for a third straight session as institutional investors reduced exposure . - Regulatory uncertainty: Post‑US‑election policy outlook + Fed‑crypto banking disputes added risk‑off sentiment . Technical levels being watched - Near‑term support zone: $72,700‑$73,000 - First resistance to reclaim: $74,500‑$75,000 - A break below main support could open a move toward $70,000, per technical analysts . Quick altcoin update - ETH: ~$2,050 (‑~3.8 % 24 h) - XRP: ~$1.05 (‑~4.2 % 24 h) Upcoming catalysts to monitor - Fed officials’ speeches & December rate‑hike signalling - Weekly US spot‑ETF flow reports - On‑chain miner‑selling & large‑wallet movement data $BTCUSDT #ByXIMPACT #WSOT2026 #WSOTPicktoEarn10U #NovUSCPIWatch
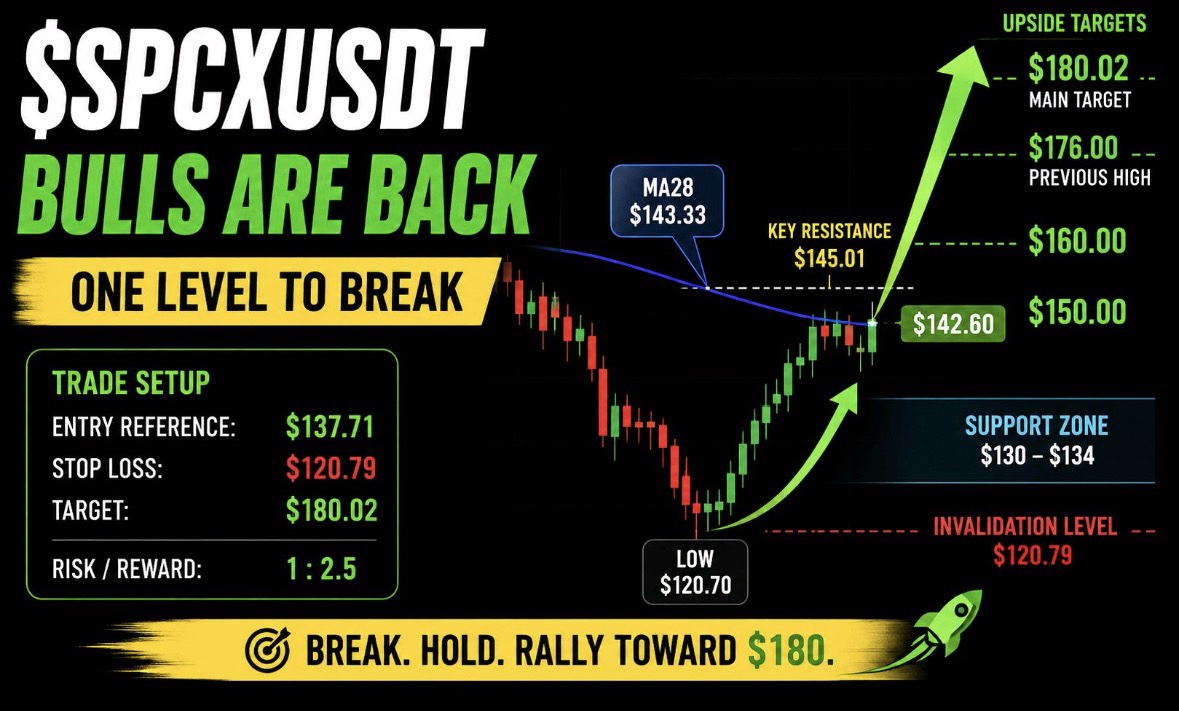
#SPCXXUSDT Bulls have recovered control, but one major hurdle remains. SPCX has staged a strong comeback from $120.70, reclaiming the lost ground and pushing back toward $142.60. Now the market is approaching a critical decision zone. spcx #WSOT2026 #NovUSCPIWatch #USPayrollsAndRateDecisionsDriveMacroWeek #WSOTPicktoEarn10U #BybitAIEvolving
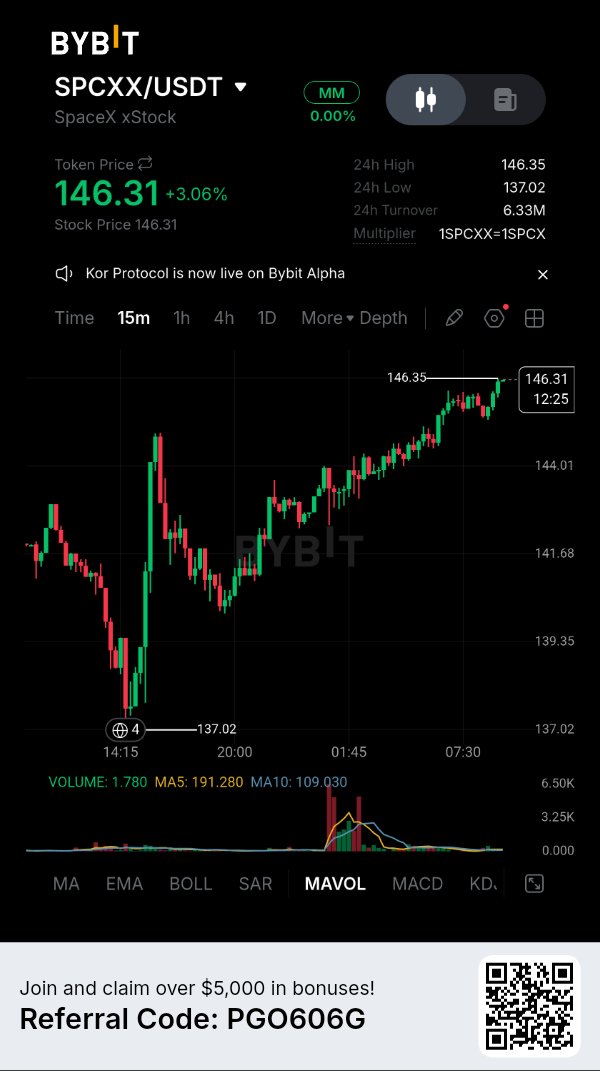
📊 Chart Overview · Asset: SPCXX paired with USDT (SpaceX xStock). · Current Price: $146.31 (Up +3.06%). · Timeframe: 15-minute (15m) chart. (Intraday view). · 24h Data: High: $146.35 | Low: $137.02 | Turnover: 6.33M. · Crucial Detail: The chart shows a "Multiplier" of 1SPCXX = 1SPCX. 📈 Technical Analysis Breakdown 1. Price Action & Recovery · The V-Shape: The chart displays a dramatic, aggressive V-shaped recovery. After a severe sell-off down to $137.02 (marked with a #4 circle), the price found immediate, strong support. · The Uptrend: From the bottom, buyers aggressively stepped in. The price formed a consistent series of higher highs and higher lows. · Current State: The price is currently pushing up against the 24-hour high of **$146.35**, resting just slightly below it at $146.31. It is consolidating in a tight range at the top of this trend. 2. Resistance & Support Levels · Immediate Resistance (Ceiling): $146.35. This is the current 24h high. A strong 15-minute close above this level is needed to confirm a breakout and continuation of the upward momentum. · Immediate Support (Floor): ~$144.01. Looking at the chart structure, this is the previous consolidation zone before the final leg up. If the price breaks down, this is the first area to watch. · Major Support: $137.02. The bottom of the recent crash. This is the critical structural floor for this 24-hour period. 3. Volume Analysis (The Story of the Move) · Look at the volume bars at the bottom. There is a massive, distinct spike in volume that occurs right at the bottom of the dip and the beginning of the recovery (around 01:45). · Interpretation: This massive green volume bar indicates heavy institutional or whale buying. This confirms that the bounce off the $137.02 level was a high-conviction buy. · The Catch: Notice the current volume on the right side. As the price climbs to new local highs, the volume is relatively flat and low. The current open candle shows a volume of 1.780 compared to the MA5 of 191.280. This is a classic bearish divergence on lower timeframes. The price is going up, but the buying volume is drying up, meaning the current uptrend lacks strong momentum to break the high. 🎯 Trading Scenarios · Bullish Scenario (Breakout): If a strong 15m candle closes solidly above $146.35, it signals the buyers have overpowered the resistance. However, for this to be reliable, you would want to see a spike in volume accompanying the breakout. · Bearish Scenario (Rejection/Pullback): The price is struggling at the 24h high with declining volume. There is a high probability of a rejection here. If the price gets pushed down, it will likely retest the $144.01 support area. If that fails, a slow bleed back down is possible. ⚠️ Important Notes for this Specific Asset · Tokenized Stock Dynamics: Because this is a tokenized version of a private asset (SpaceX), its price action may not perfectly track the traditional stock market (which is closed outside normal hours). It trades 24/7 on Bybit. · Liquidity Risk: While the turnover is decent (6.33M), the order book depth for tokenized private equity is often much thinner than standard crypto pairs. Watch out for sudden "wicks" (sharp, violent price movements) in either direction. · Notice: The banner notes "Kor Protocol is now live on Bybit Alpha." This is a general exchange announcement and not specific to this chart, but it's good to be aware of. (Disclaimer: This is a technical analysis of the provided image and does not constitute financial advice. Trading tokenized stocks carries unique risks.) $SPCXXUSDT #ByXIMPACT #WSOT2026 #NovUSCPIWatch #WSOTPicktoEarn10U #USPayrollsAndRateDecisionsDriveMacroWeek

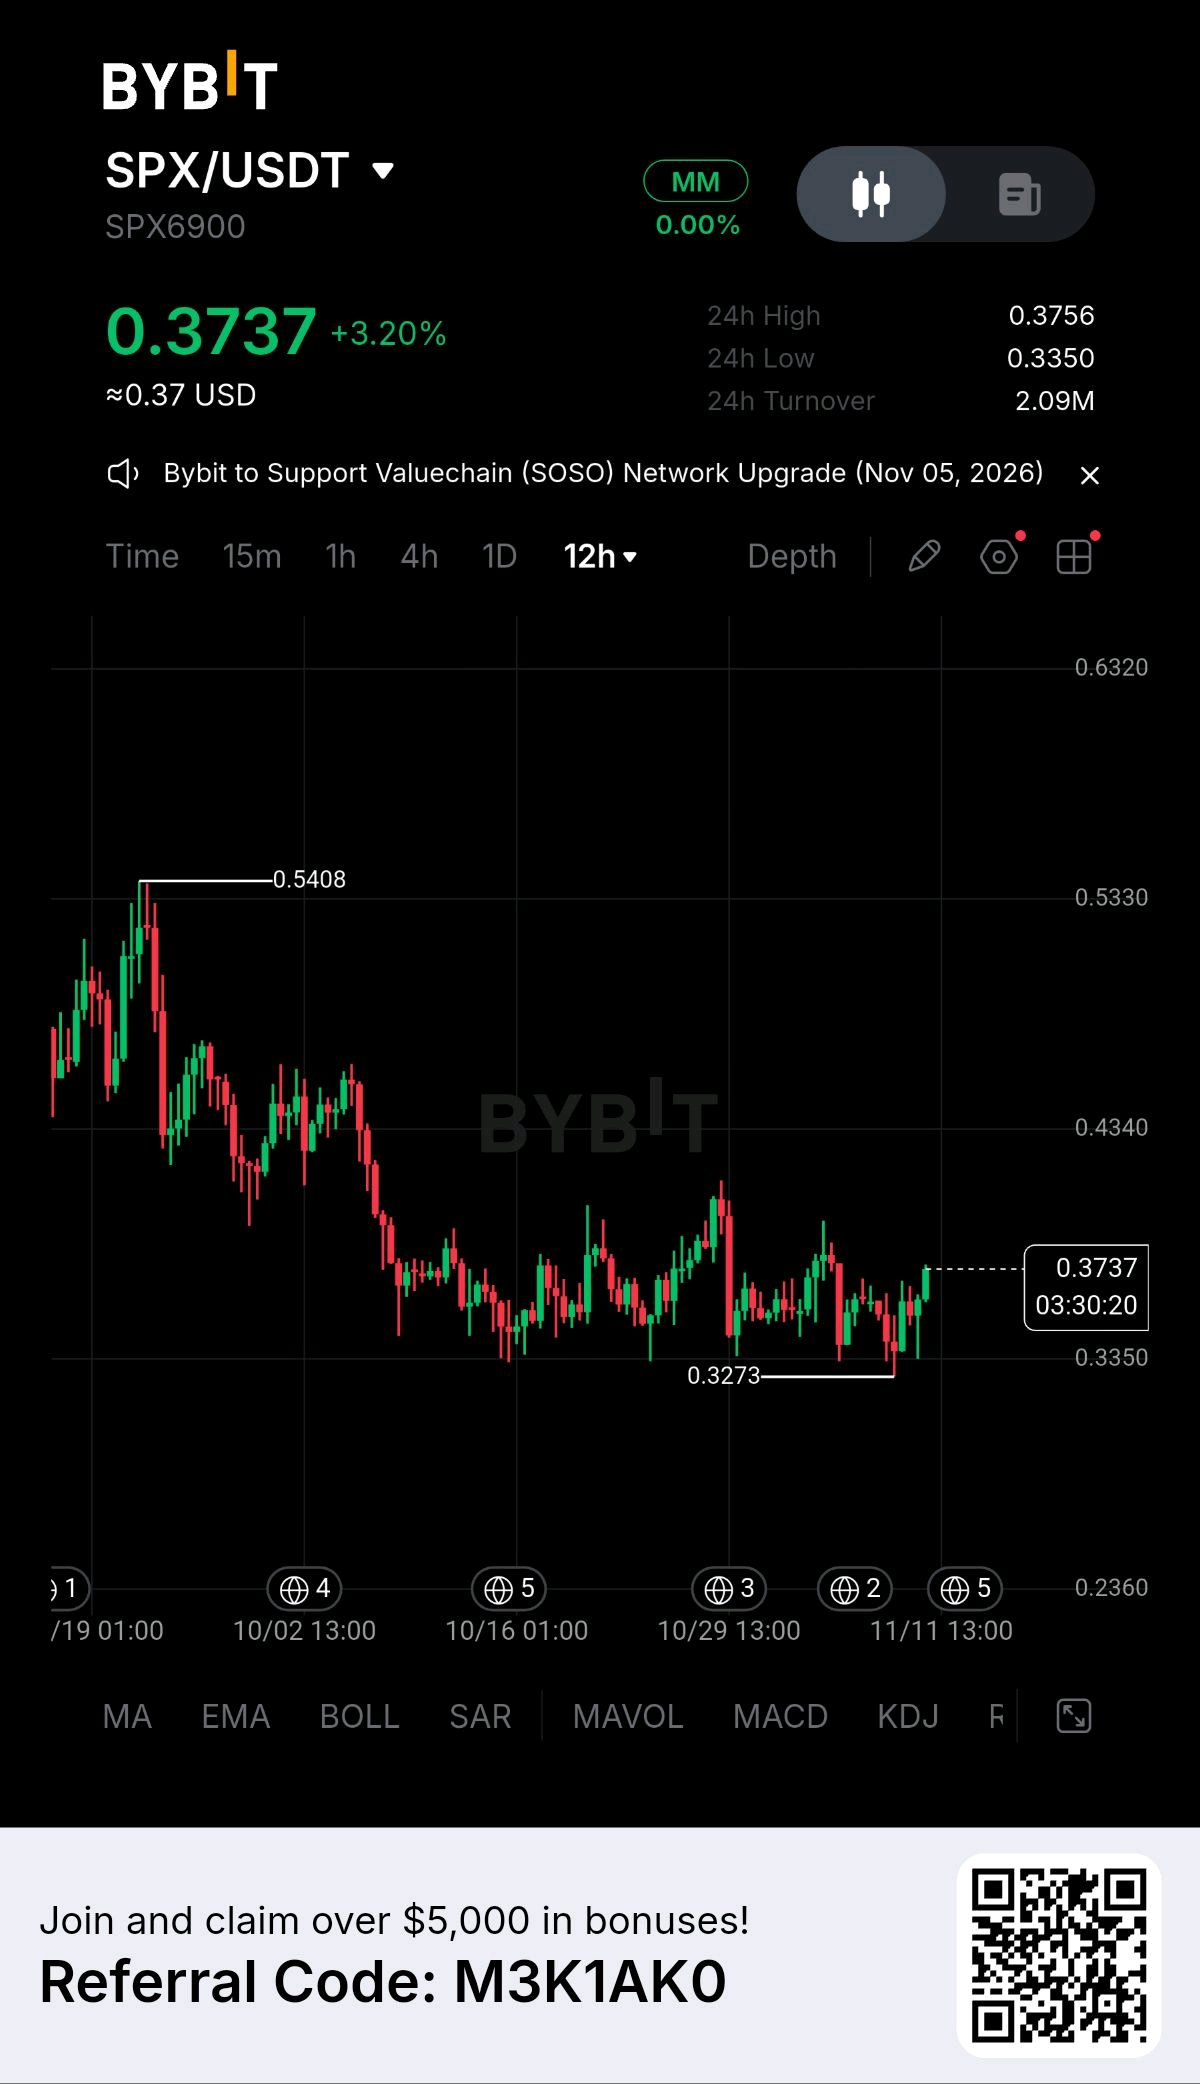
$SPX Bounces 3% Off Its Weekly Low Near $0.33
SPX6900 just posted a solid green session, climbing back above 0.37 after testing a fresh low for the stretch, though the token remains deep in a downtrend that's defined most of this year. SPX6900 is a self-described community meme asset with no roadmap, no team-led development, and no claimed intrinsic value, its own project says as much. The community, who call themselves Aeons, has built a reputation around a buy-and-hold mentality, and prominent crypto commentator Murad Mahmudov recently compared their conviction through steep drawdowns to early Bitcoin holders, though he was careful to frame it as a comparison of behavior rather than a claim the two assets will perform alike. That conviction has been tested, SPX now trades more than 80% below its July 2025 all-time high of 2.27, and 2026 has been its calmest year on record in terms of price range, with every close falling between roughly 0.25 and 0.65. Technical commentary earlier this week flagged the token sitting in a descending channel, with analysts noting price needed to hold around 0.34 and reclaim its 200-day moving average near 0.39 to show real signs of recovery, a level that today's bounce is now testing from below. The chart shows a steep decline from a high of 0.5408 down through a choppy multi-week slide to a low of 0.3273, with today's bounce bringing price back to 0.3737, up 3.20%, right around the middle of that broader range. Given the token is bouncing from a key support zone that technical watchers have specifically flagged, this looks like a cautious long rather than a wait-and-see setup, provided the level holds. An entry near the current 0.3737 with invalidation below 0.3273, the recent low, keeps risk tied to that well-defined floor. The first target sits near 0.39, the 200-day moving average and the level analysts have pointed to as the line between continued range-bound trading and a real recovery attempt, offering a modest but reasonable reward relative to the risk. China's Q3 GDP grew 4.5% year on year, beating forecasts on strong AI-related exports and tech manufacturing, a mildly supportive macro backdrop for risk assets broadly, though a pure sentiment-driven meme token like SPX is likely to keep trading far more on its own community conviction than on any macro data print. Not financial advice. $SPXUSDT $COREUSDT #WSOT2026 #WSOTPicktoEarn10U #NovUSCPIWatch


Se movieron 227.196 BTC antiguos. ¿Bajista? No necesariamente.
Checkonchain dice que unos 227.196 BTC adquiridos antes de 2019 "revivieron" en 2026, según Bitcoin.com News. $BTCUSDT Es un número grande. Así que miré más allá del titular. Primero, la cifra en dólares no cierra. La nota dice $183.6 mil millones. A unos $74.000 por BTC, 227.196 BTC están más cerca de los $16.8 mil millones (según mis cálculos). Curiosamente, el mismo artículo valora los 33.932 BTC de otro conjunto de datos en $2.49 mil millones, lo cual es consistente con ese precio. Pero la pregunta más importante es qué significa realmente "revivido". Monedas que se movieron. No necesariamente monedas que se vendieron. Btcparser rastreó 873 transferencias que totalizaron 33.932 BTC desde direcciones inactivas entre enero y octubre. Eso es aproximadamente el 15% de la cifra de Checkonchain. Mismo tema general. Diferentes definiciones de inactivo. Totales muy distintos. Aquí está la distinción que creo que más importa. Tres eventos diferentes pueden estar detrás de la frase "se movieron monedas viejas". Una transferencia de billetera: mismo dueño, nueva dirección. Podría ser un cambio de custodia, una mejora de seguridad o una planificación sucesoria. Un depósito en exchange: las monedas llegan a un lugar donde pueden venderse. Eso crea una posible presión de venta, pero no confirma una venta. Venta real: las monedas se venden o se gastan. Ahí es cuando la presión de venta directa se vuelve real. Los datos de movimiento disponibles no nos dicen qué pasó en cada caso. Entonces, ¿por qué los holders antiguos están moviendo monedas? Toma de ganancias, cambios de custodia y reposicionamiento de ballenas son todas posibilidades. No tenemos suficiente evidencia para elegir una sola explicación. Un par de detalles me llamaron la atención. Cuatro direcciones, todas creadas el 23 de enero de 2016, movieron cada una exactamente 500 BTC. Las transferencias ocurrieron el 24 de marzo, 19 de mayo, 2 de julio y 20 de octubre. Son 2.000 BTC a través de cuatro transacciones. El espaciado parece deliberado, pero cantidades idénticas y fechas de creación no prueban propiedad común o un plan compartido. Otro detalle: el 81.9% de las monedas revividas datan de 2015–2018. Las monedas de antes de 2015 representan aproximadamente el 18% (según mis cálculos). Ahora miren el momento. El período más activo de Btcparser fue el tercer trimestre (Q3), cuando Bitcoin subió aproximadamente un 43%. Que las monedas viejas se muevan durante un rally podría apuntar a la toma de ganancias en lugar de al pánico. Esa es una interpretación razonable, no una prueba. Bitcoin todavía está abajo aproximadamente un 16% este año. Y yo todavía no llamaría a esto una nueva ola. Un análisis de agosto situó la reactivación de monedas inactivas de 2026 en menos de la mitad del nivel de 2025. Diferentes definiciones hacen que valga la pena tratar esa comparación con cautela. Mi opinión: vale la pena vigilar a los BTC viejos despertando, pero el movimiento por sí solo no es una señal bajista. Estoy observando dos cosas: las entradas a exchanges desde billeteras de monedas antiguas y evidencia de gasto real. Si las monedas se mueven a una billetera fría nueva, puede ser simplemente gestión de custodia. Si llegan a los exchanges y se venden, el panorama cambia. Hasta entonces, no confundiría el movimiento de una billetera vieja con la salida de un holder antiguo. $KORUSDT #WSOT2026 #Seguimiento IPC EE.UU. Nov #WSOTPicktoEarn10U #Las nóminas de EE. UU. y las decisiones sobre tasas de interés impulsan la semana macroeconómica #La volatilidad del petróleo sigue de cerca las conversaciones de paz con Irán

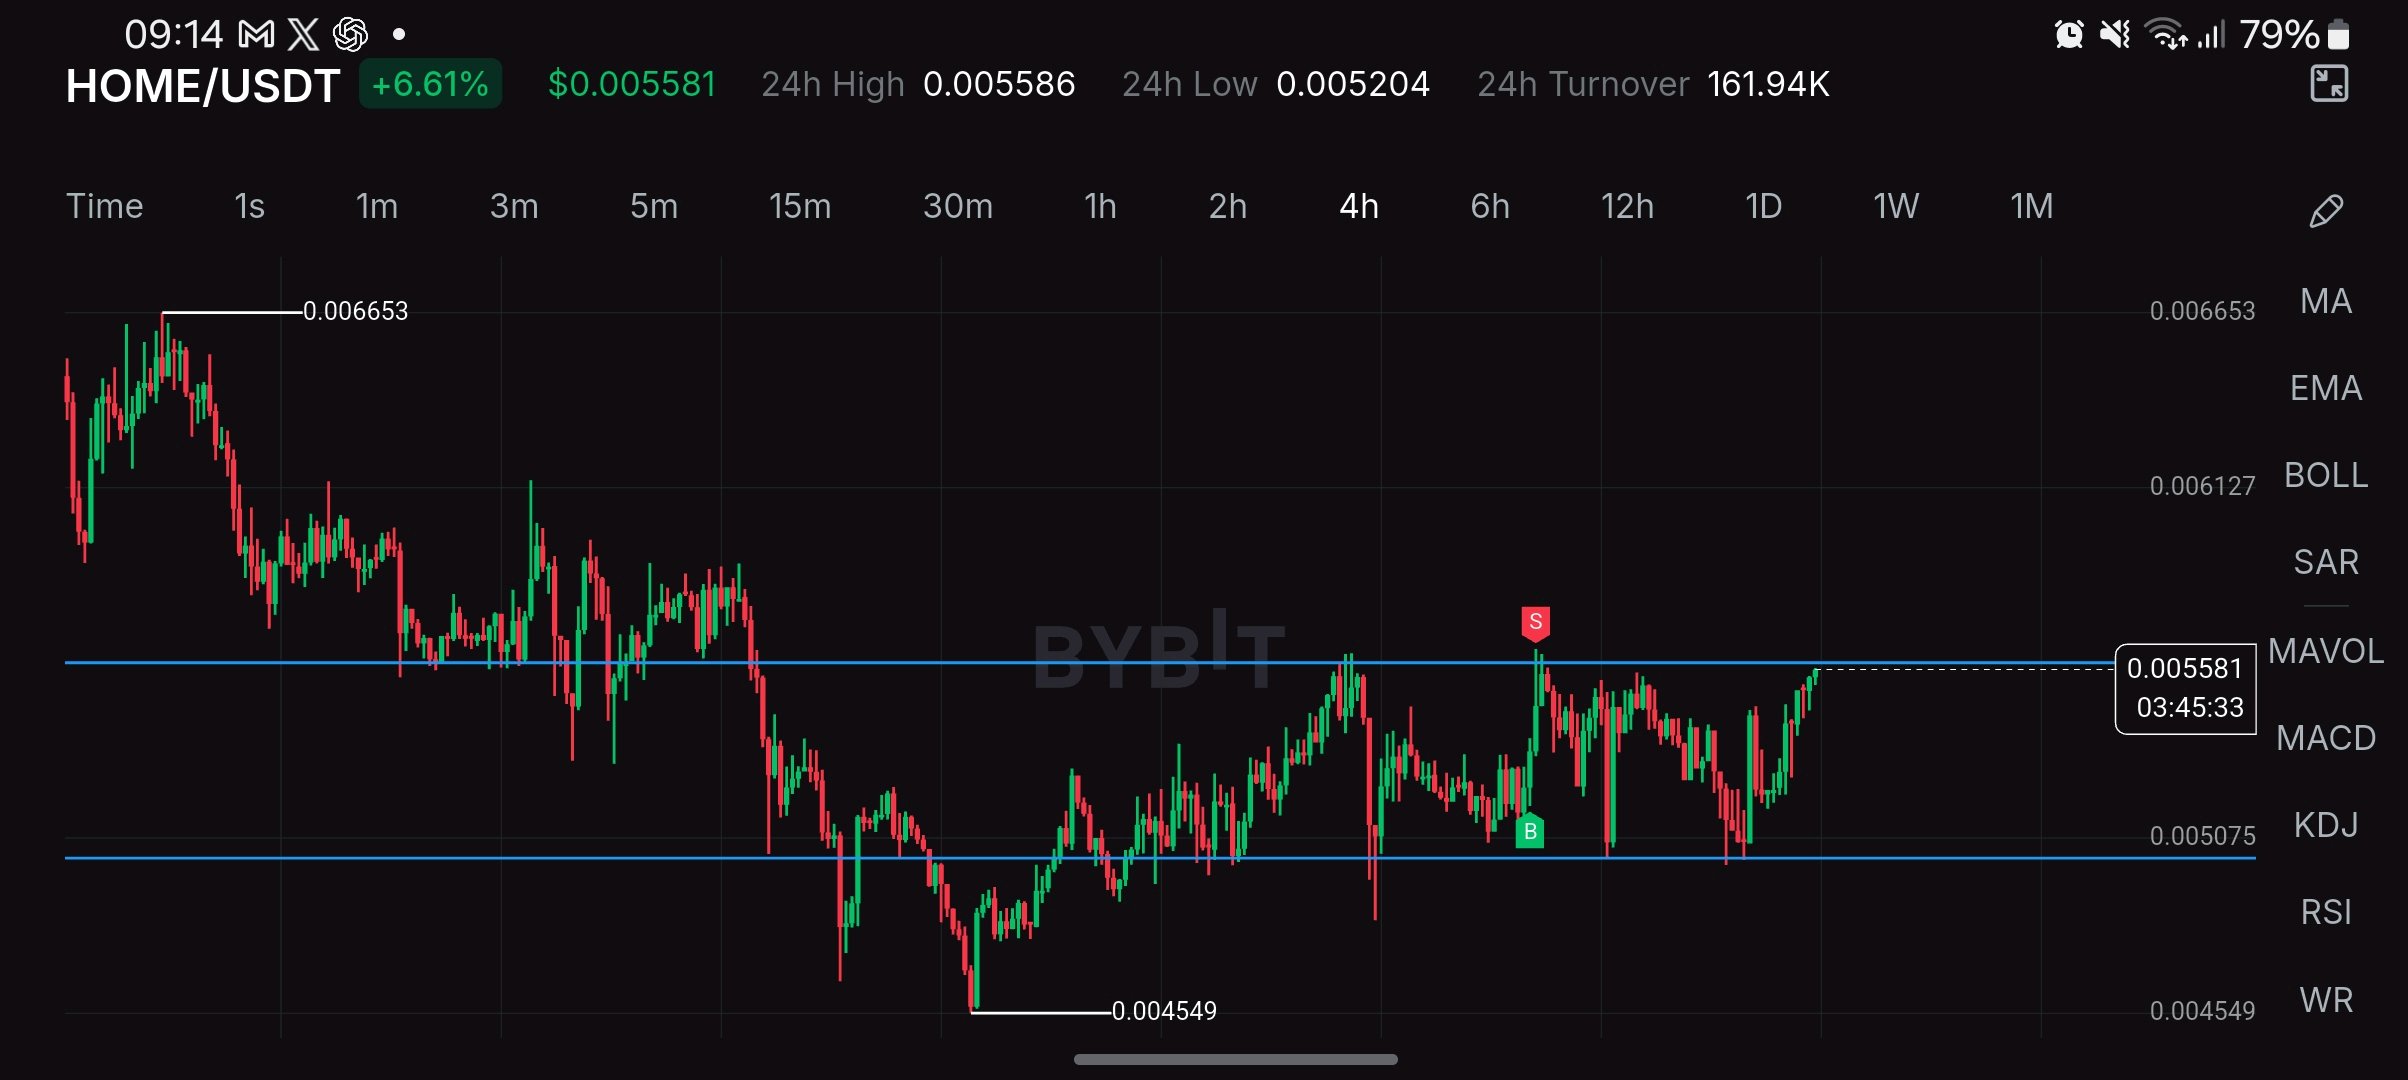
$HOME: Testing the $0.0056 Ceiling
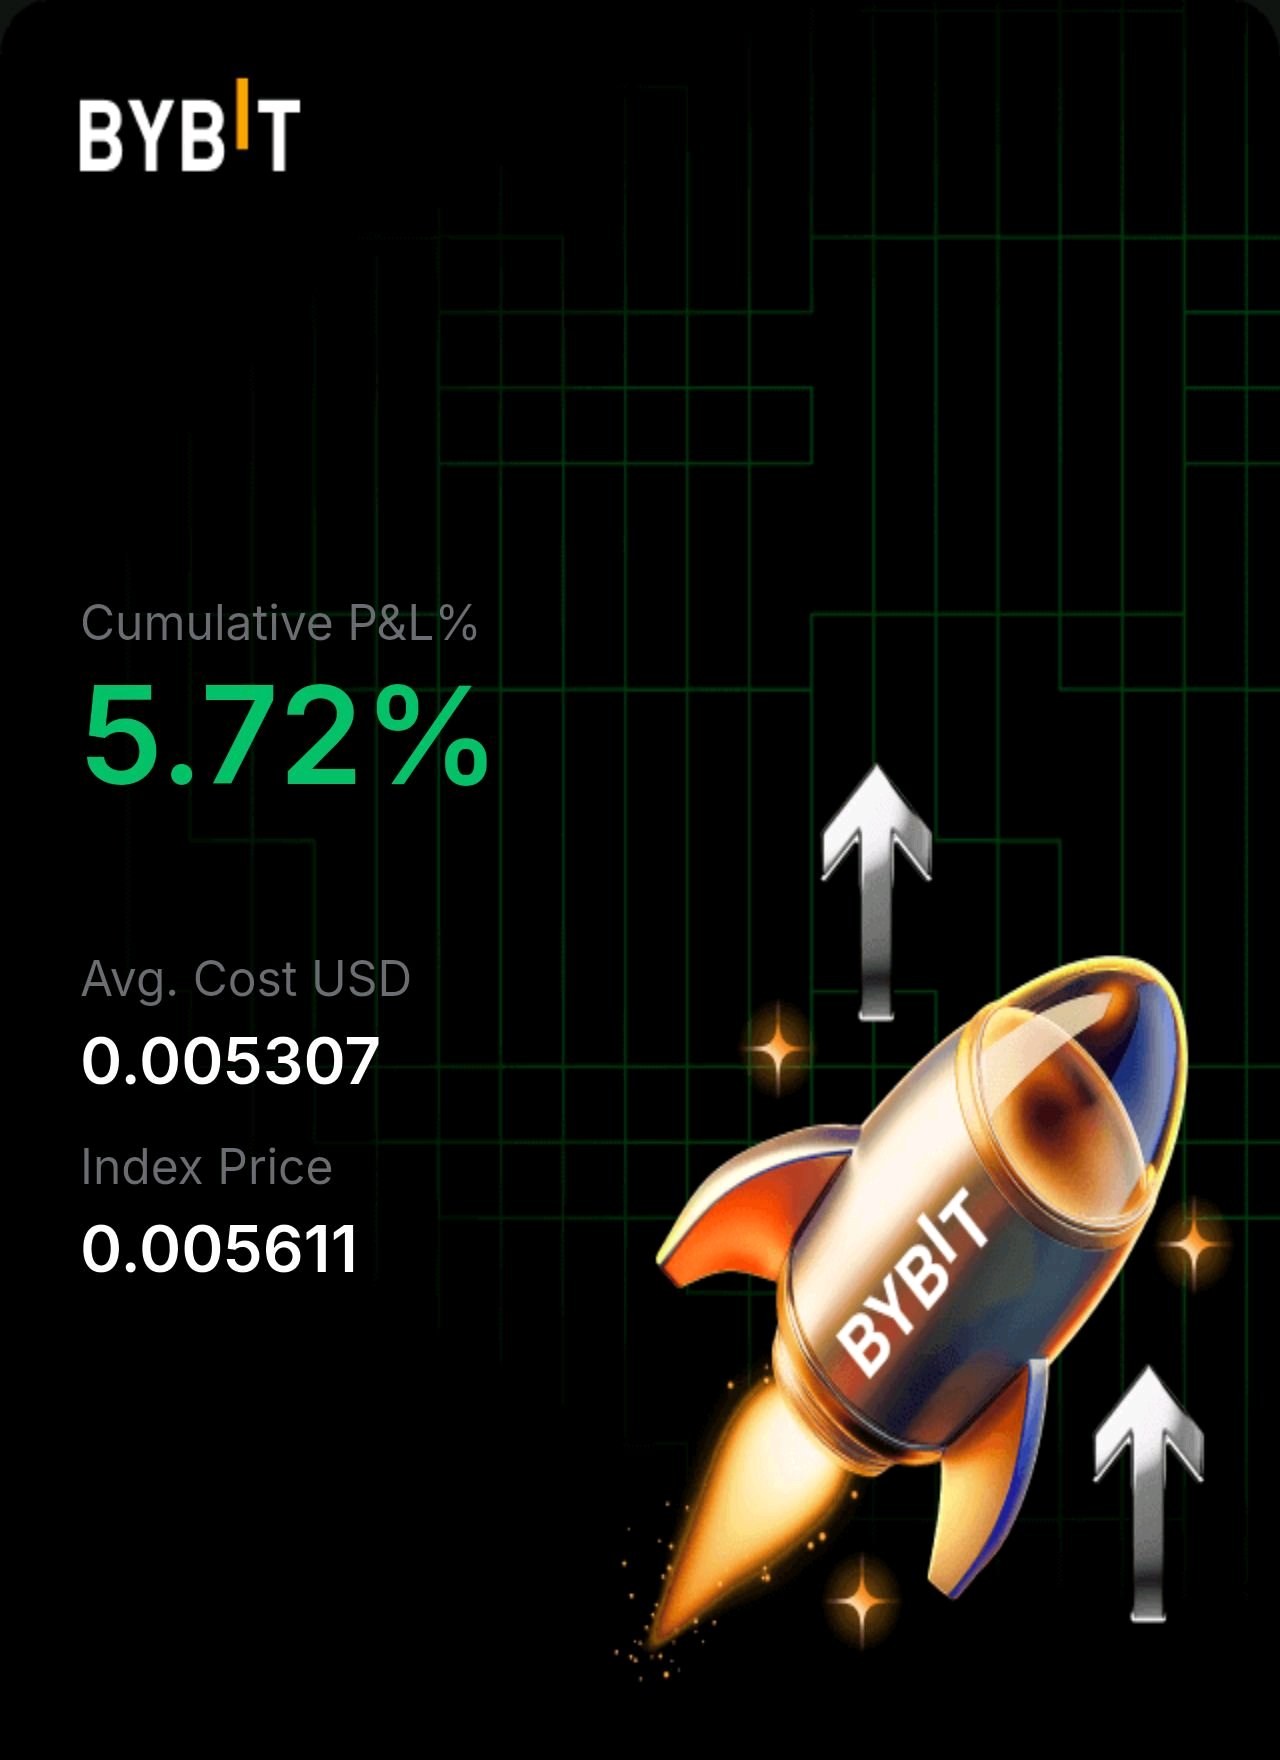
$HOME is pushing into the same ceiling that has rejected it several times in recent weeks. Today's 6.6% move is happening on low volume, so the real test is what comes next. What the 4H chart shows: Price is $0.005581, right at the upper edge of a range between about $0.0051 and $0.0056. Every push into $0.0056 has been rejected, including the sharp wick that printed a sell signal, and every dip toward $0.0051 has been bought. The 24h range is $0.005204 to $0.005586, so price is sitting exactly at the top. The bigger picture is still bearish: the structure is lower highs from $0.006653, and the yearly low is $0.004549. 24h turnover on Bybit is only about $162K, so a breakout without strong volume would be suspect. What's happening: There is no fresh project news this week. The main story is the tokenomics. Defi App uses 80% of protocol revenue for weekly on-chain buybacks, and when that was confirmed in August, $HOME jumped 13%. Upbit also listed HOME around then, which added Asian retail demand. The roadmap includes a physical debit card and prop trading in Q4 2026, which could be a catalyst if it ships. The headwind is supply: only about 4.36B of the 10B tokens are circulating, so roughly 56% is still to come from team, investor and ecosystem unlocks over the next years. That limits how far rallies can go. China and the global backdrop: China's Q3 GDP grew 4.5%, beating forecasts, and the yuan hit a 4-year high. For China, that means steadier policy and less need for emergency stimulus. For the world, stronger Asian growth supports risk appetite, and Asian retail access (like the Upbit listing) matters for a token like $HOME. The link is indirect, since China restricts crypto trading, and the beat is export-led with retail sales up only 1.1%. For $HOME, trading volume on Defi App (which drives buybacks) and Bitcoin's direction matter far more than China data. Key levels: Support: $0.0052 to $0.0051 first, then $0.004549 (the yearly low). A break below $0.0051 would reopen the move to the lows. Resistance: $0.0056 first, then $0.006127, then $0.006653 (the swing high). I want a 4H close above $0.0056 on rising volume before I treat this as a breakout. Scenarios: Bull: volume picks up, buyers close above $0.0056, and $HOME heads toward $0.006127. Base: $HOME gets rejected again and ranges between $0.0051 and $0.0056. Bear: sellers take control, $0.0051 breaks, and $HOME retests the $0.004549 low. Honest risk: thin liquidity means breakouts can fail fast, and the large locked supply is a constant overhang. Not financial advice. Does the fourth test of the ceiling finally break it? $HOMEUSDT $ICPUSDT #WSOT2026 #WSOTPicktoEarn10U #NovUSCPIWatch
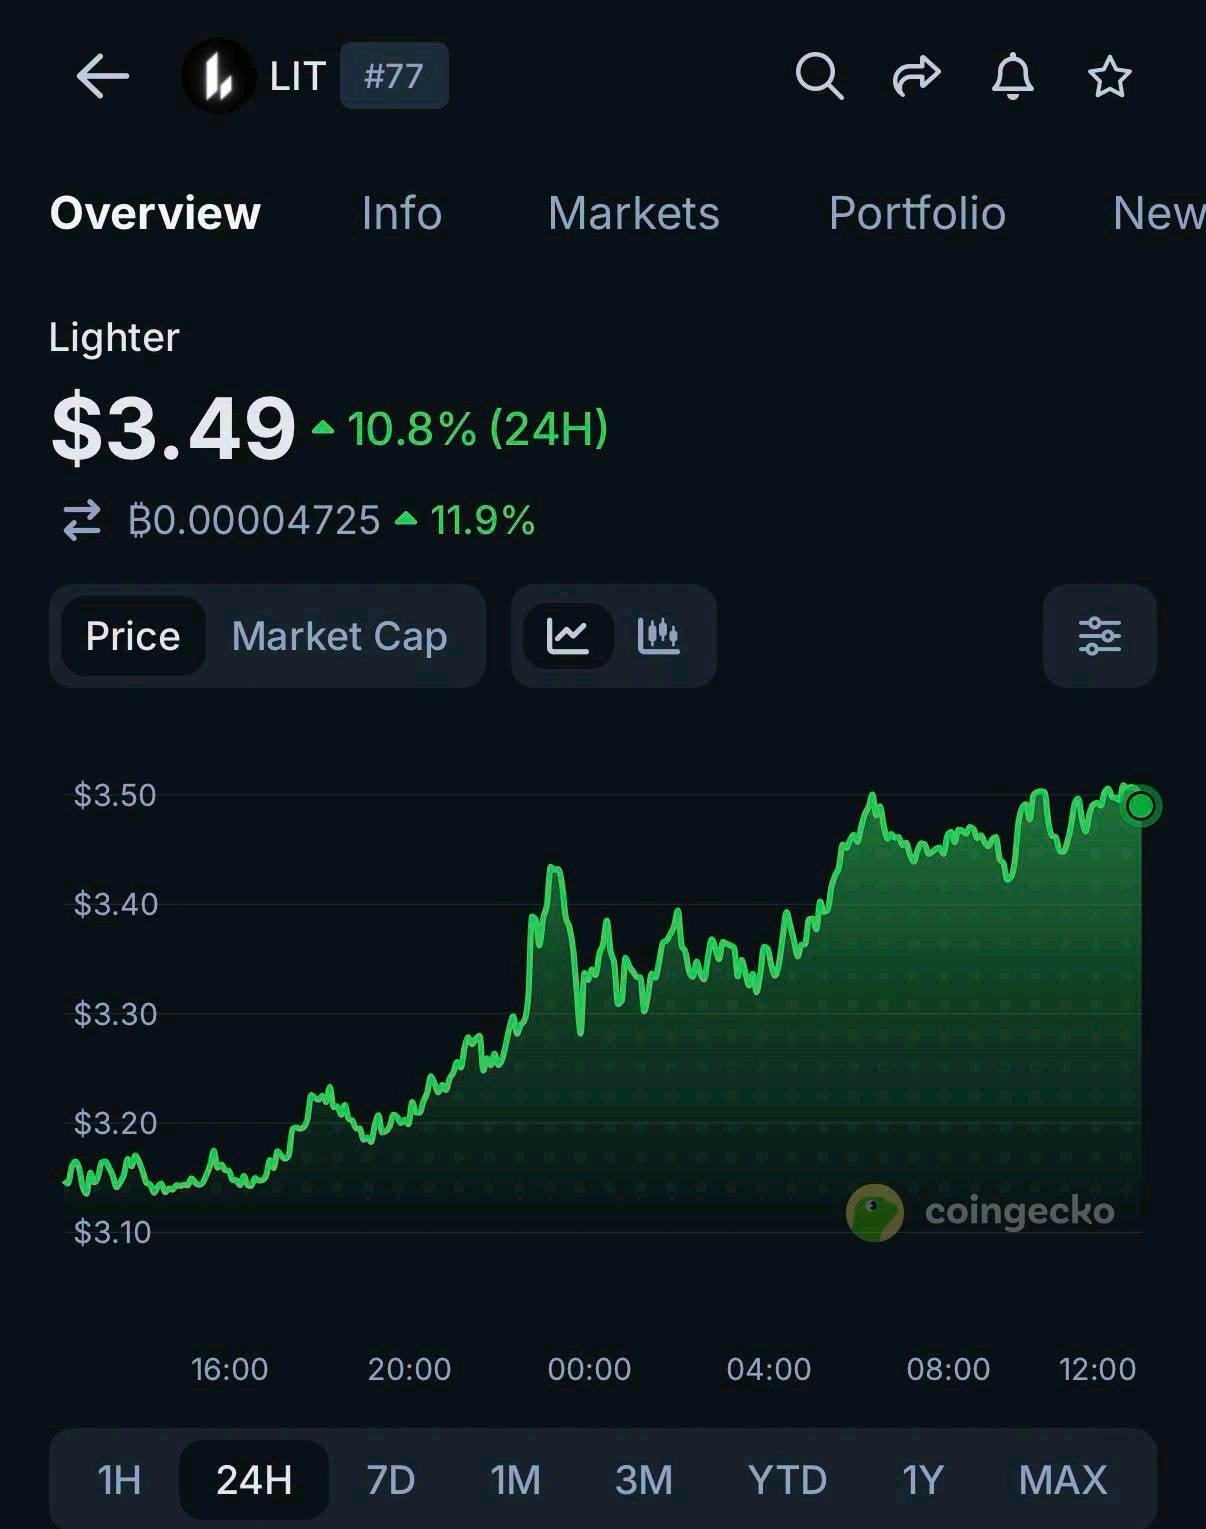
$LIT is up 10.8% 🚀
INSIGHT: $LITUSDT is up 10.8% today against a red market, two days after Swiss bank Sygnum added it for trading, custody, and lending. #NovUSCPIWatch #WSOTPicktoEarn10U #USPayrollsAndRateDecisionsDriveMacroWeek #OilVolatilityTracksIranPeaceTalks #BybitAIEvolving $MCRTUSDT
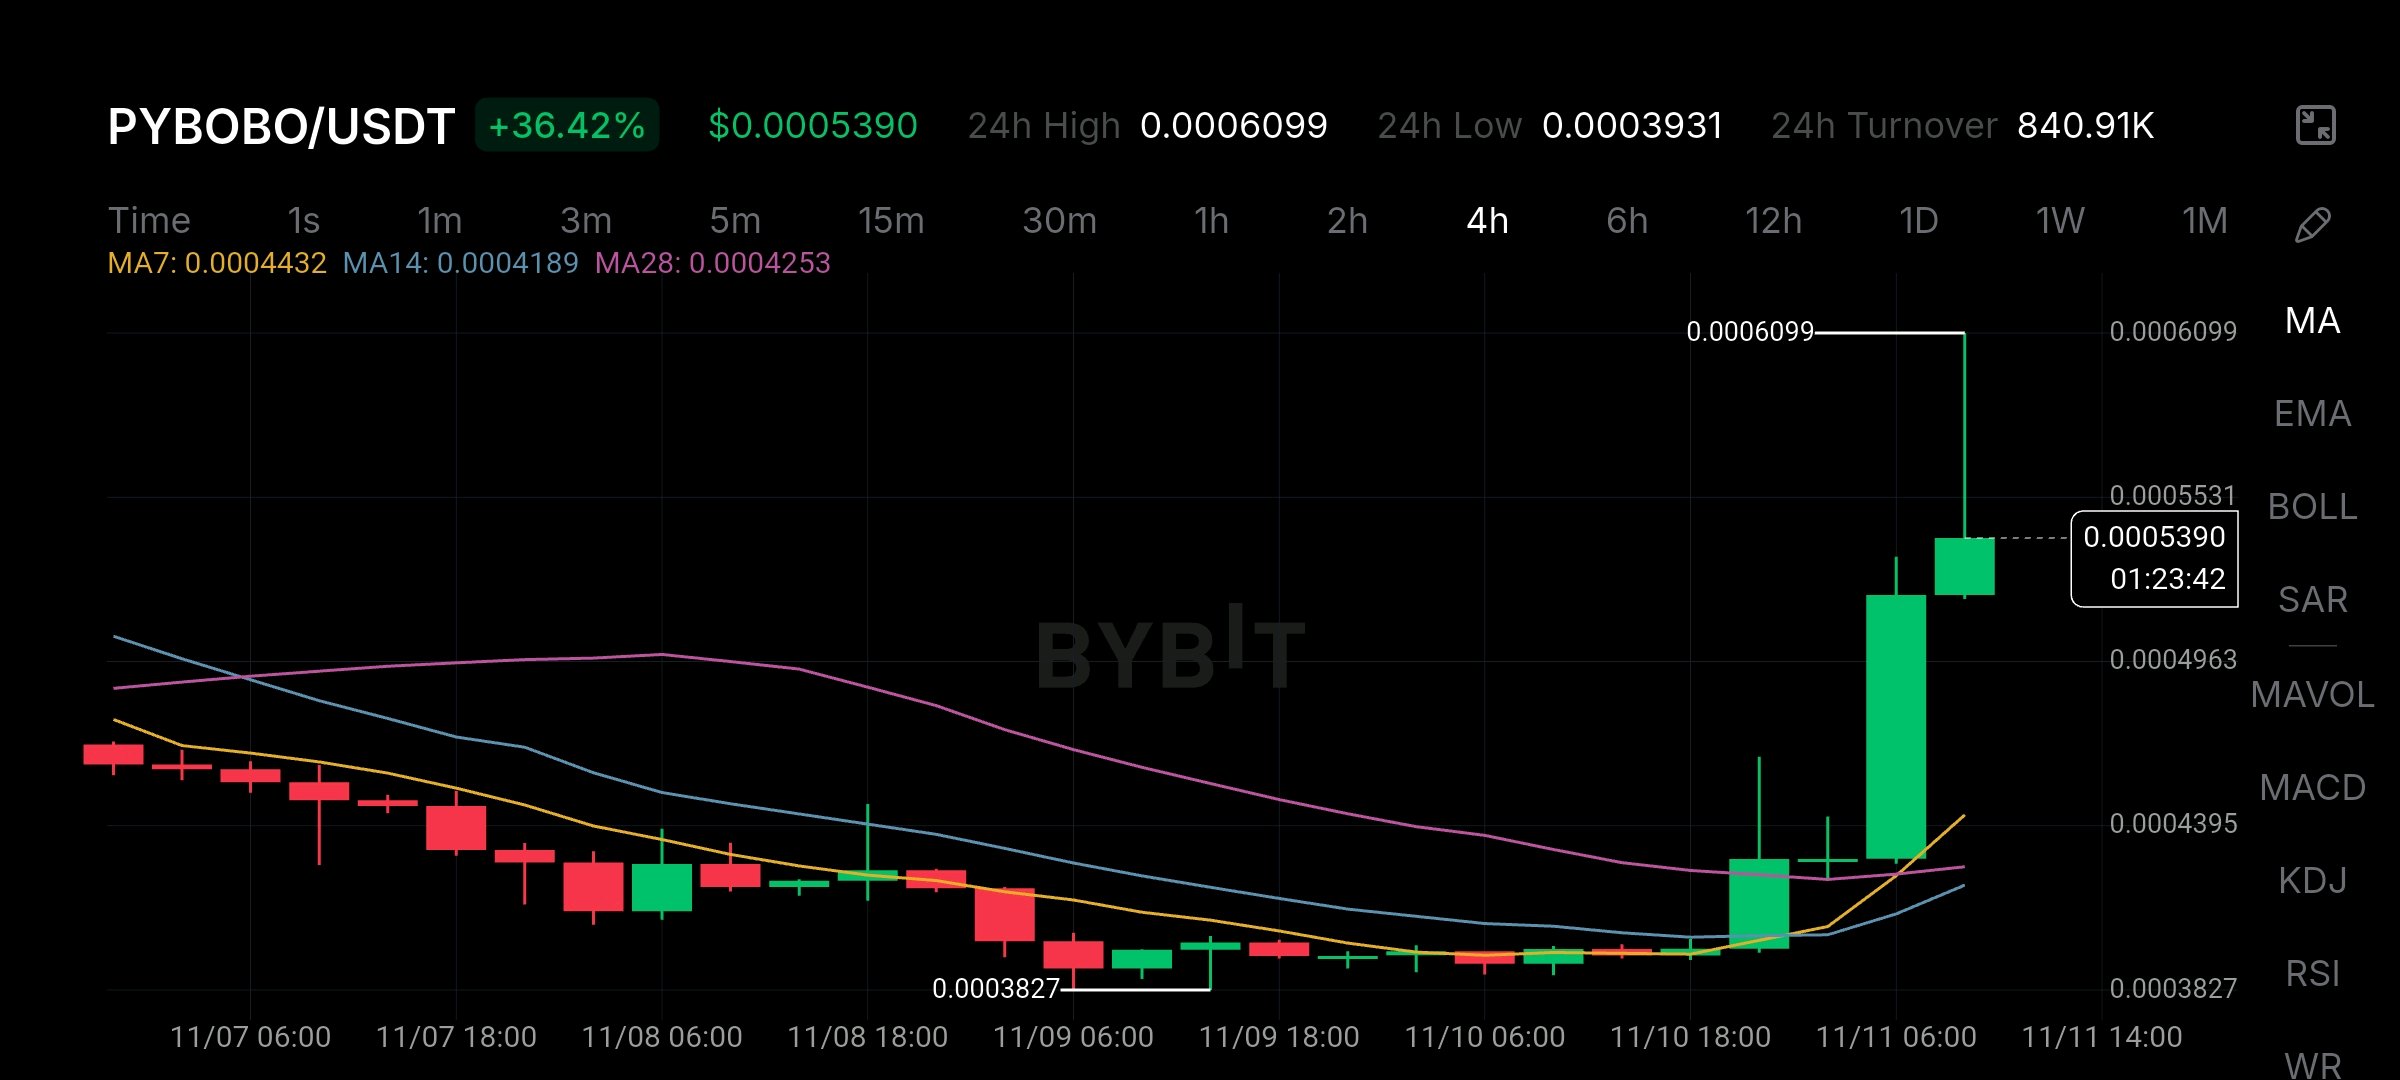
🚨 $MCRT just printed a massive green candle.
But look at the volume of $MCRTUSDT . Check this 15m chart. MCRT was flatlining in a tight base at 0.0001208, then suddenly went vertical to hit 0.0001537. It is up 23% right now, sitting at 0.0001500. But here is the massive red flag. Look at the turnover. It is only 25.40K. That is incredibly thin liquidity. Moves like this happen when the order book is empty, and they can reverse just as fast. The Levels: Resistance is the peak at 0.0001537. Support is the MA7 way down at 0.0001271. Do not FOMO into this thin pump. Wait for a pullback to the moving averages to see if it actually holds. Are you fading this spike? 👇 #NovUSCPIWatch #WSOTPicktoEarn10U #USPayrollsAndRateDecisionsDriveMacroWeek #OilVolatilityTracksIranPeaceTalks #BOERateDecision $PYBOBOUSDT
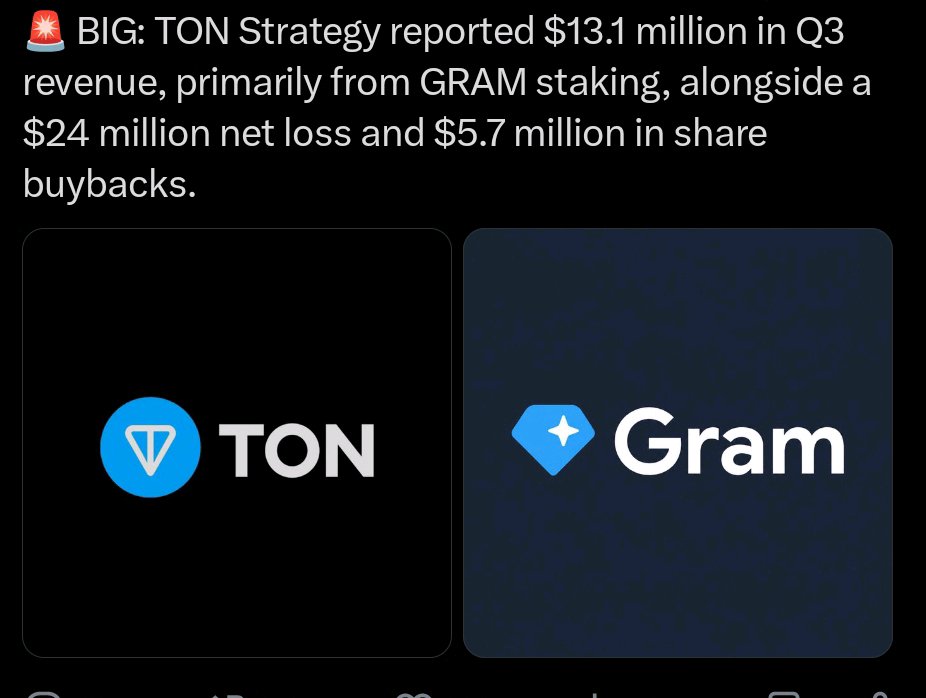
DTCC just went LIVE with Chainlink 🤯 The firm behind $4.7 QUADRILLION in securities transactions last year 💥$GRAMUSDT 🏦 Chainlink will run margin, valuations, collateral optimization and settlement inside DTCC's Collateral AppChain ⚙️ 🧠 Nasdaq research found 52% of firms expect to manage live tokenized collateral by end of 2026 📊 🐋 LINK on exchanges fell about 12% in a month as supply moved off 👀 ⚠️ DTCC's own target for full launch is Q4 2026 Is this the moment Wall Street plumbing switches on-chain? 🔌 Which part shocks you most? 👇 ➕ Follow for more #WSOTPicktoEarn10U #USPayrollsAndRateDecisionsDriveMacroWeek #NovUSCPIWatch #OilVolatilityTracksIranPeaceTalks @BybitX @kas***@**** @killer901 @DON'T JUDGE ME @BybitX @WhaleX🐳

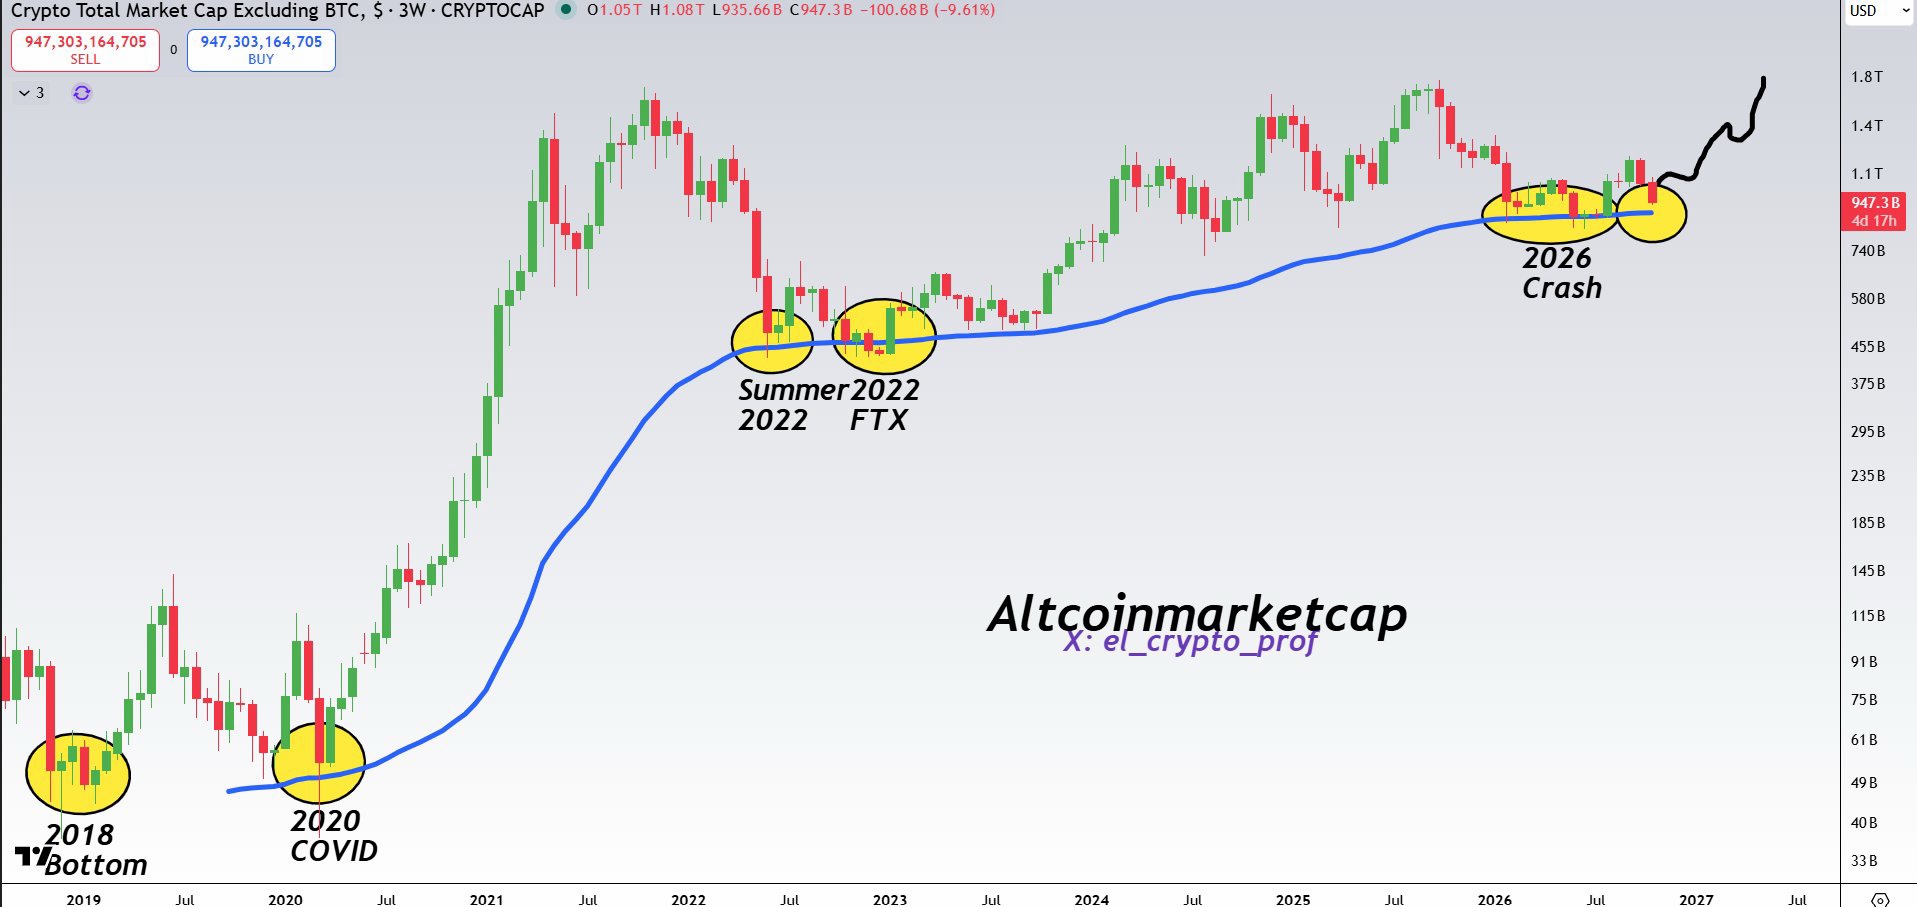
#Altcoins Did you know that the blue line marked the bottom in almost every cycle for TotalMarketCap? The bottom is very close or has already been reached. Higher, much higher. #WSOT2026 #WSOTPicktoEarn10U $INITUSDT
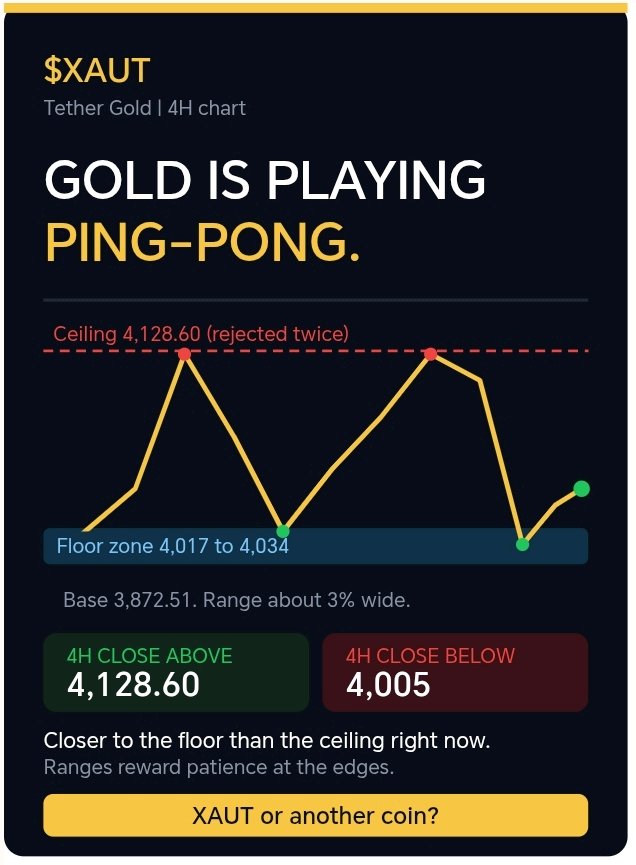
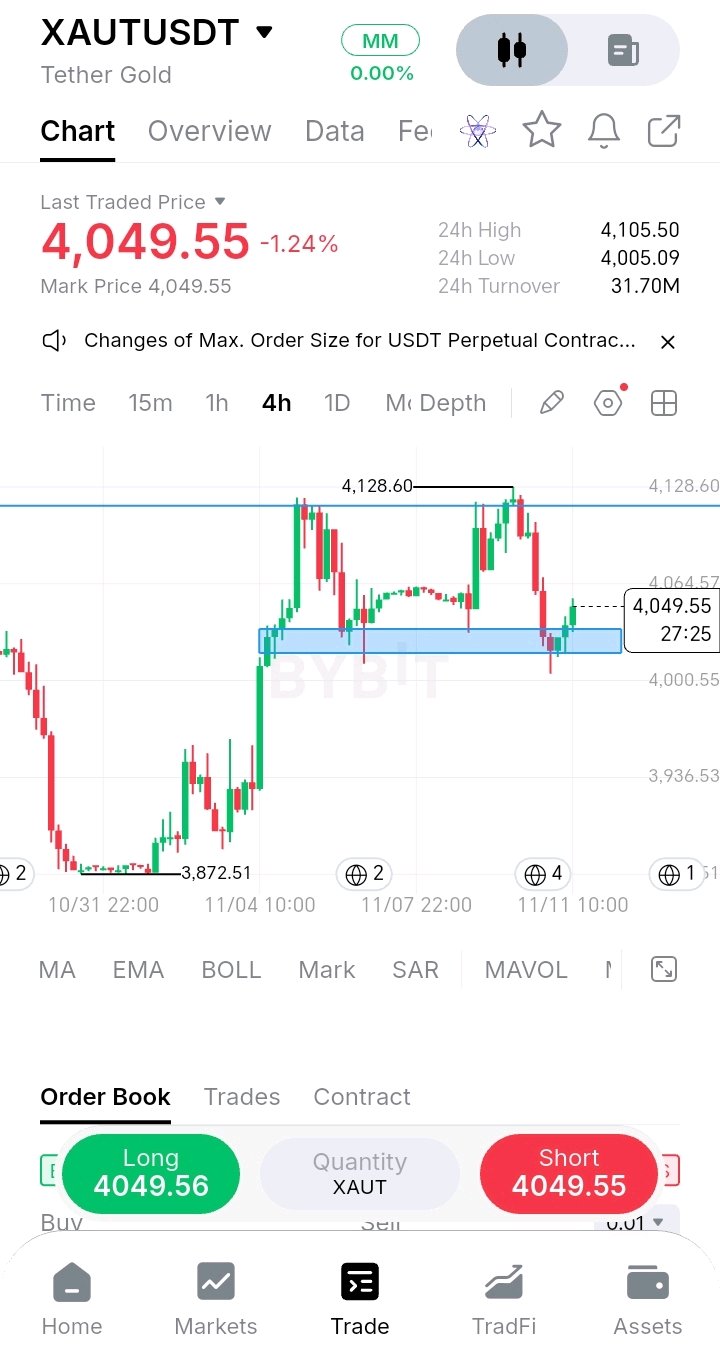
🏓 Gold is playing ping-pong, and both edges keep getting hit. I don't want to trade the middle of this $XAUT range. I want to see which edge breaks first on a 4H close: above 4,128.60 or below 4,005. Here's what the 4H chart shows: 🔹 The top edge: Gold ran from 3,872.51 up to the 4,120s and has now been rejected twice near the ceiling, with the latest high at 4,128.60. 🔹 The bottom edge: After each rejection, price dropped into the blue zone around 4,017 to 4,034, where buyers stepped in. The latest wick even dipped to 4,005.09 before recovering. 🔹 The range: Roughly 4,005 to 4,128, about 3% wide. Gold has moved back and forth inside it several times. 🔹 The bounce: Price is at 4,049.55, about 1% above the zone and 2% below the ceiling. It's closer to the bottom edge, so the risk and reward are tilted toward the floor right now. 🔹 The activity: 24H turnover is 31.70M with a 24H range of 4,005.09 to 4,105.50. Moves are fast but contained. 🟢 Bullish: a 4H close above 4,128.60 breaks the ceiling for the first time. The 4,208.90 swing high from earlier would be the next reference. 🔴 Bearish: a 4H close under 4,005 breaks the floor, and the 3,936 and 3,872 levels come into view. Ranges reward patience at the edges. The breakout is where the real move starts. Are you watching $XAUT or another coin? #XAUT #Gold #Crypto #BinanceSquare #WSOT2026 #WSOTPicktoEarn10U #USPayrollsAndRateDecisionsDriveMacroWeek #OilVolatilityTracksIranPeaceTalks #BybitAIEvolving $XAUTUSDT $BTCUSDT
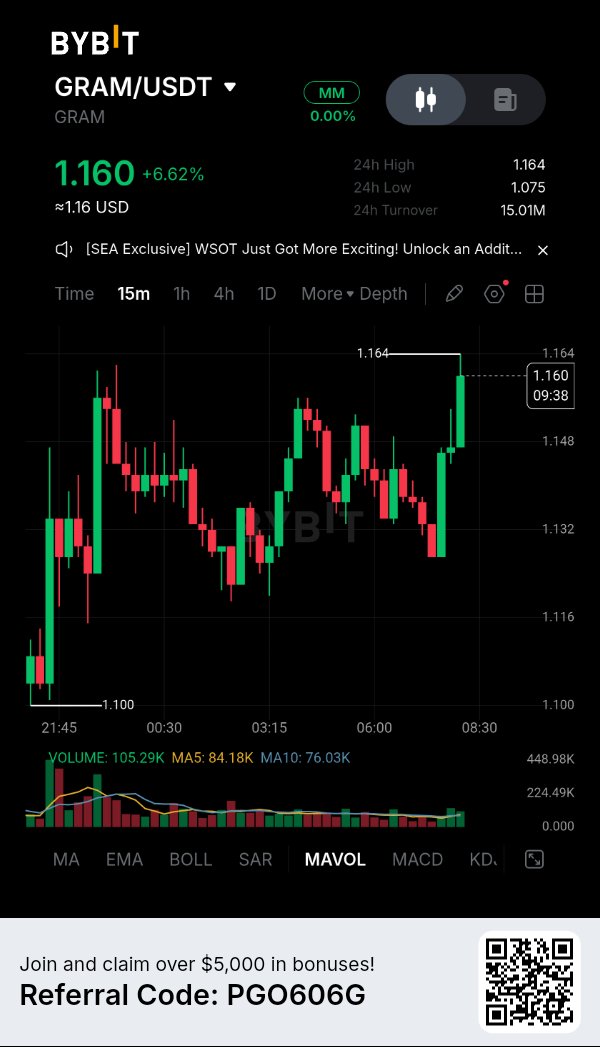
Here is a fresh, master-level breakdown of the GRAM/USDT chart on the 15-minute timeframe. This chart illustrates a highly volatile, choppy market that is slowly grinding upward. It is a great example of why patience is the most important tool in a trader's arsenal. Let's break down the mechanics. 1. The "Whipsaw" Environment Look at the chart from left to right. The price starts at the 24h Low of 1.100, rockets up to ~1.160, crashes down to ~1.125, rallies back to ~1.155, drops to ~1.130, and finally pushes to a new 24h High of 1.164. · The Master's View: Notice the long wicks on almost every candle. This is a classic "whipsaw" market. It is designed to trap retail traders. If you buy the green candles, you get stopped out by the red ones. If you short the red candles, you get squeezed by the green ones. The 24h Turnover is 15.01M—there is plenty of liquidity here, which means these erratic moves are likely driven by algorithmic trading and market makers shaking out weak hands. 2. The "Higher Low" Trend Despite the chaotic, violent swings, look at the macro structure. · First bottom: 1.100 · Second major bottom: ~1.125 · Third major bottom: ~1.130 · The Lesson: Even though the price is chopping wildly, it is printing higher lows. The underlying trend is actually mildly bullish. Buyers are slowly stepping in at higher prices, building a floor. 3. The Current Setup: The Breakout Attempt Right now, the price is sitting at 1.160, pressing right up against the 24h High of 1.164. · Look at the volume bar beneath the most recent massive green candle. It's a very healthy green spike. This tells us that real money is driving this final push. · However, notice that the price has stalled right at the resistance line. It is struggling to break through. --- The Master Trader's Game Plan for GRAM: This is a frustrating chart to trade on a 15-minute timeframe because the chop is so violent. The trend is bullish, but you are currently staring at a major resistance level. Here is how a professional handles it: · Do Not FOMO: Buying right now at 1.160 is a gamble. You are buying right into a wall of sellers at the 24h high. If it rejects here, you will be trapped. · The "Breakout Confirmation" Play: The master move is to wait. Set a buy stop order just above 1.164. If a 15-minute candle closes solidly above that level with strong volume, the resistance is broken, and you can enter a long position. · The "Buy the Dip" Play (The Safe Route): Look at the recent structure. There is a clear support zone around 1.130 - 1.148 (the area of the last pullback). If the price rejects the 1.164 high and pulls back, wait for it to hit that 1.130 zone. If it prints a strong green bounce candle there, that is a much safer entry with a defined stop-loss. · The Danger Zone: If the price violently breaks below 1.125 (the middle swing low), the higher-low structure is broken. The trend has shifted bearish, and the price will likely revisit the 1.100 floor. Summary: GRAM is in a choppy, volatile uptrend, but it is currently fighting a major resistance level at 1.164. The recent volume is promising, but do not chase the price at the top of the range. Wait for a confirmed breakout above 1.164, or a healthy pullback to the 1.130 support zone before making a move. $GRAMUSDT #ByXIMPACT #NovUSCPIWatch #WSOTPicktoEarn10U #USPayrollsAndRateDecisionsDriveMacroWeek #BybitAIEvolving


$BNB | Network growth and token performance don't always move at the same pace. BNB's market strength is closely linked to activity across its ecosystem, from DeFi liquidity to on-chain applications and transaction demand. For traders, three metrics deserve closer attention: → Changes in network activity and active addresses. → DeFi liquidity and TVL trends across BNB Chain. → BNB trading volume, demand and key market structure levels. The important distinction is whether ecosystem expansion is creating measurable demand for the native token. Fundamentals provide context, but price confirmation determines market strength. #BNB #BNBChain #CryptoAnalysis #Bybit #WSOTPicktoEarn10U

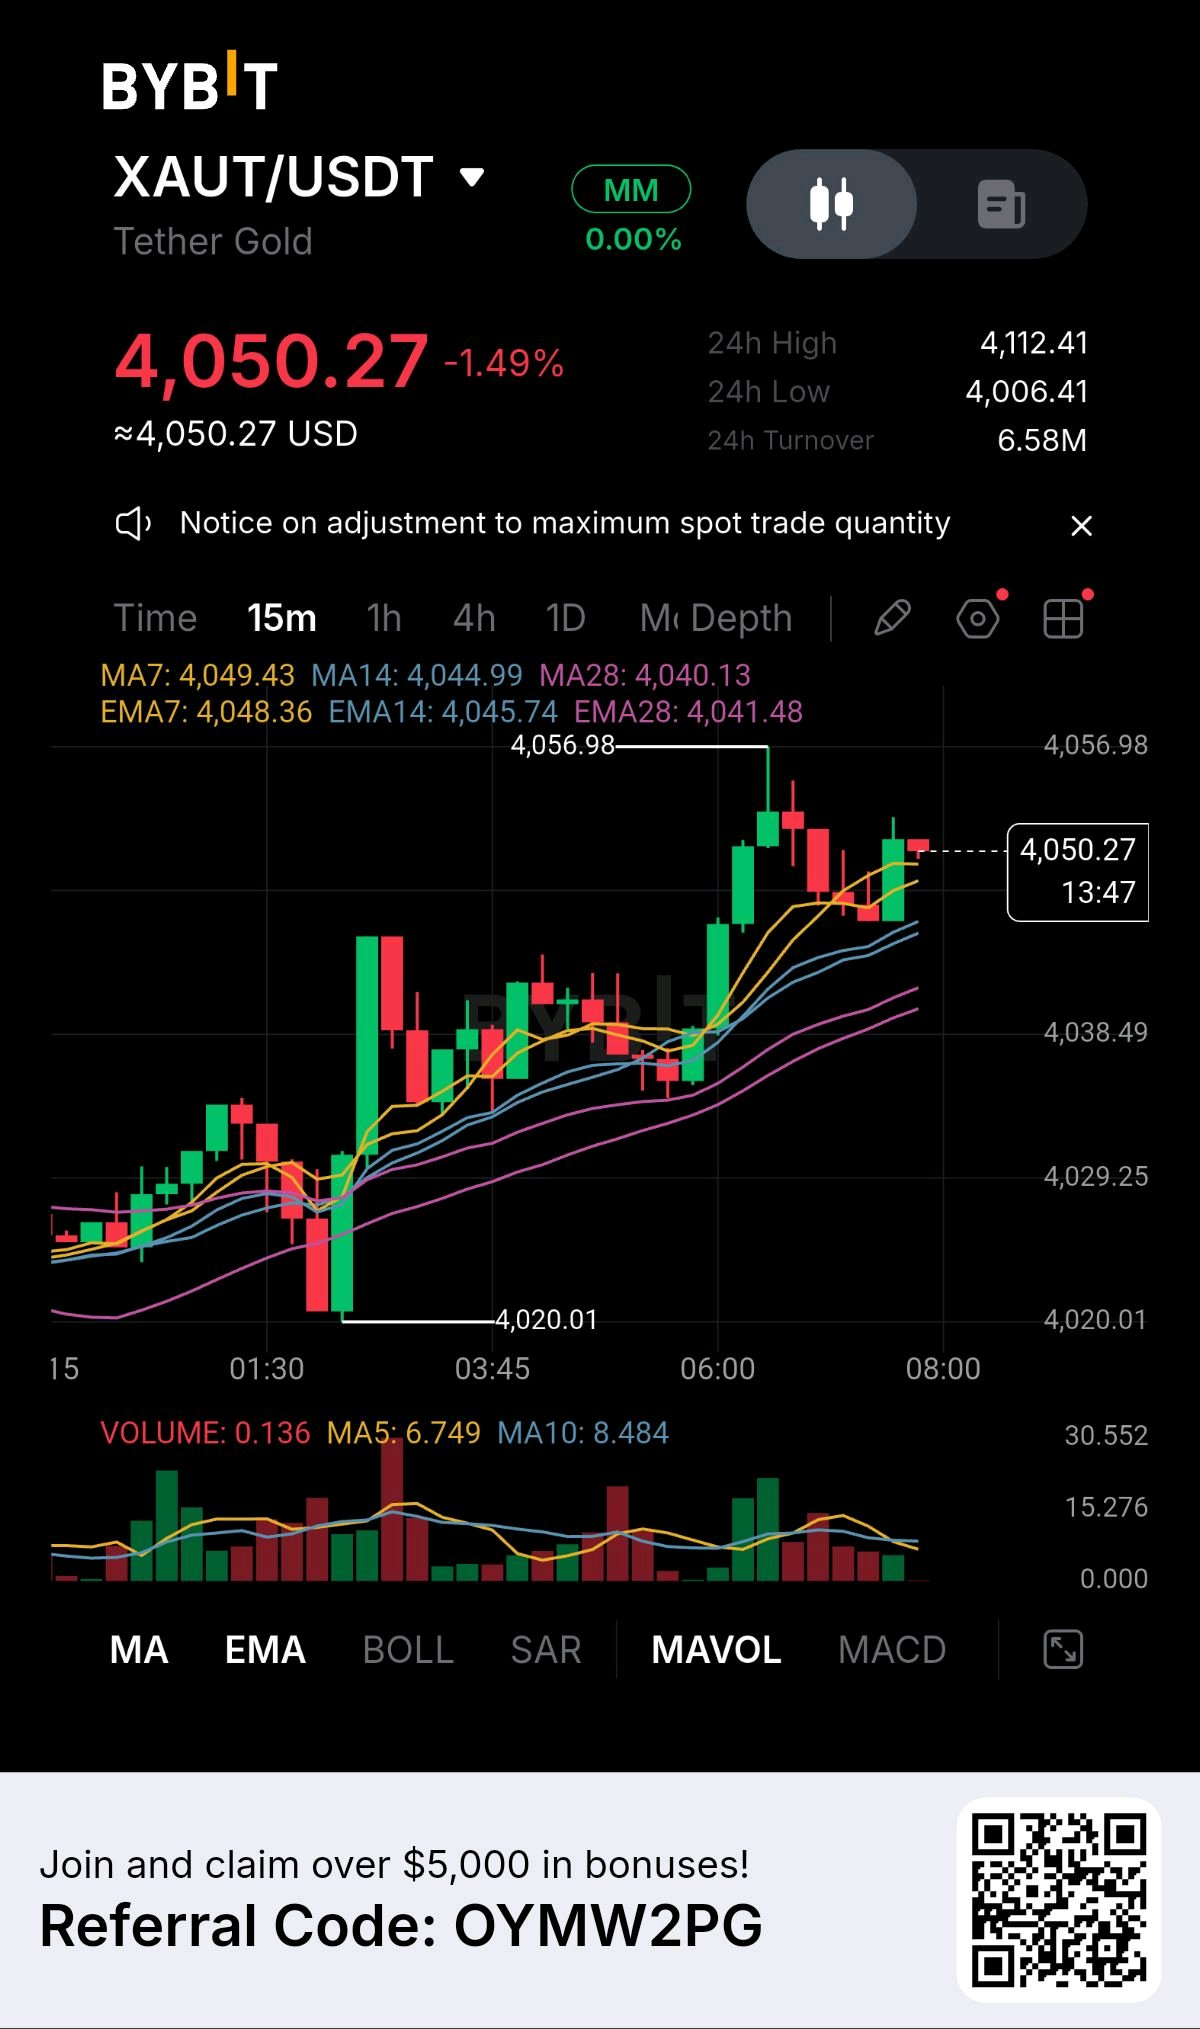
XAUT Holds Its Ground: Is Another Gold Move Loading? Gold is showing an interesting short term recovery structure despite remaining under pressure on the 24 hour chart. $XAUTUSDT is trading at $4,050.27, down 1.49% over the last 24 hours. However, the 15 minute chart reveals that buyers are still defending the recent recovery. What the chart is revealing • Price: $4,050.27 • 24H High: $4,112.41 • 24H Low: $4,006.41 • Turnover: $6.58M The technical picture The short term moving averages are aligned positively: • MA7: $4,049.43 • MA14: $4,044.99 • MA28: $4,040.13 The EMA structure tells a similar story, with price trading slightly above the major short term averages. This suggests that buyers still have some control over the immediate market structure, although momentum needs stronger confirmation. The levels that matter Resistance: $4,056.98 Support: $4,044 to $4,040 Further downside support: $4,038.49 and $4,029.25 Two possible developments A convincing breakout above $4,056.98 could strengthen bullish momentum and open the way for another upward test. However, losing the $4,040 support zone could weaken the recovery and expose lower support levels. My market perspective The important question is no longer just whether XAUT can recover. It is whether buyers can sustain the pressure long enough to turn this recovery into a stronger upward move. A breakout needs confirmation, not anticipation. What do you think comes next? Will gold break above $4,057 or return to test lower support?#ByXIMPACT #WSOT2026 #WSOTPicktoEarn10U

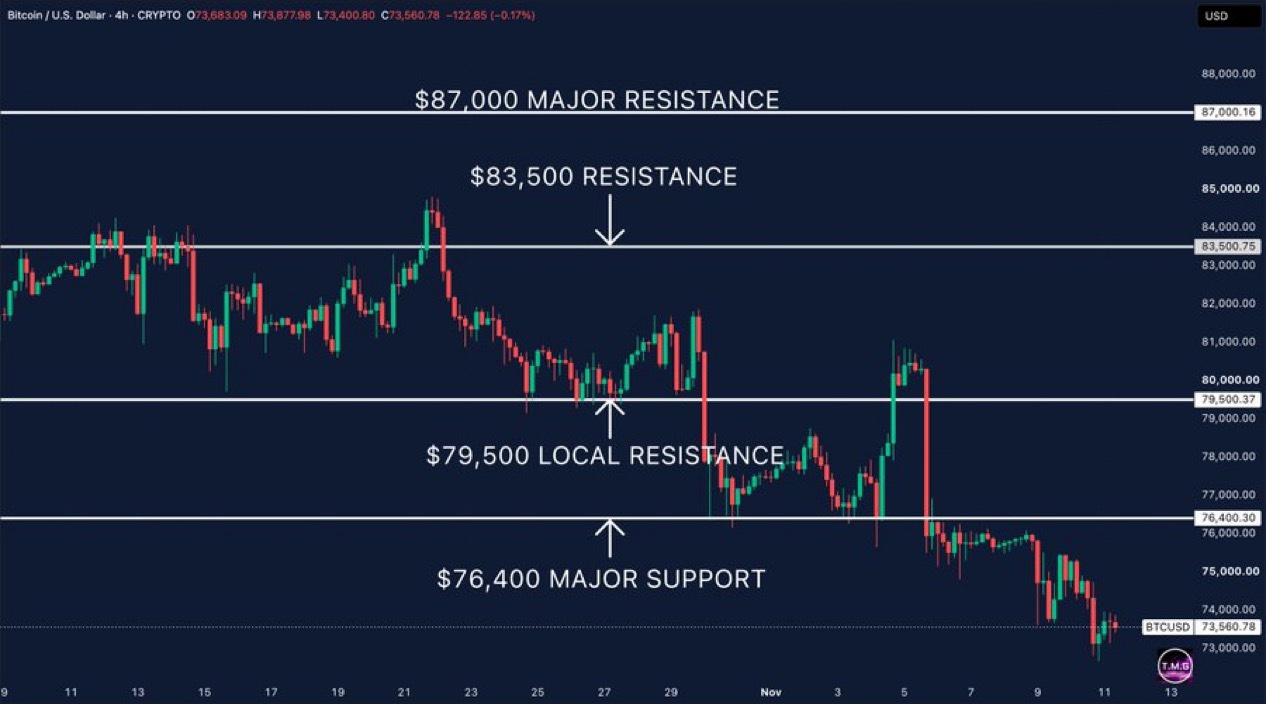
Bitcoin is struggling to find a floor. We've now lost the $76,400 support level, which had been holding the market together. BTC is trading around $73,560, with the 4H chart continuing to print lower highs and lower lows. The next thing I want to see is whether buyers can defend the recent $73K region. A reclaim of $76,400 would be the first meaningful sign of strength. Until then, the bears have the upper hand. #WSOT2026 #WSOTPicktoEarn10U
La pérdida de US$ 6.3 mil millones de BitMine: Papel, efectivo y punto de equilibrio
El 10-K de BitMine muestra una pérdida neta de unos 6.310 millones de dólares para el año fiscal terminado el 31 de agosto. El año anterior, había ganado 349 millones. Las pérdidas no realizadas en activos digitales fueron de 6.230 millones de dólares. El año previo, había registrado una ganancia de 805 millones. Según The Block, ETH cayó un 44% durante ese período. El titular suena brutal. Así que lo dividí en dos partes. Papel. La pérdida viene de marcar ETH a valor razonable. No se vendió nada con esa pérdida. Efectivo. Esa es otra historia. Las operaciones consumieron 305,1 millones de dólares. Los ingresos fueron de unos 125 millones, y el 97% vino del staking (121 millones). Los gastos generales y administrativos fueron de 376,9 millones. Ahora, el número que yo tendría en cuenta. La base de costos de ETH de BitMine fue de 19.950 millones de dólares sobre 5,9 millones de ETH. Unos 3.380 dólares por ETH. El valor razonable al 31 de agosto era de 14.560 millones, unos 2.470 dólares por ETH (según mis cálculos). Con ETH cerca de los 2.130 dólares esta semana, necesita aproximadamente un 59% más para volver al costo sobre esa base (mis cálculos). Una corrección al tweet. 5,9 millones de ETH es la cifra al 31 de agosto. Al 8 de noviembre, BitMine tenía 6.070.092 ETH, el 4,97% del suministro. Aquí viene la parte esperanzadora. El staking está aumentando. La última actualización de BitMine muestra recompensas de staking anualizadas de unos 309 millones de dólares sobre 5,2 millones de ETH en staking. Eso es un rendimiento del 2,65%. Coincide aproximadamente con los 305 millones de dólares de quema de efectivo del año pasado (mis cálculos). Pero es una tasa proyectada, no ingresos reportados. Depende del precio de ETH y del rendimiento. A 2.130 dólares, está más cerca de los 295 millones. Y los gastos generales y administrativos pueden incluir partidas que no son en efectivo. Estoy siguiendo dos cosas. Los ingresos del próximo trimestre frente a esa tasa proyectada de 309 millones. Y el efectivo de BitMine: 475 millones de dólares al 8 de noviembre, una baja respecto a los 514 millones de dos semanas antes. Si los ingresos por staking alcanzan la tasa proyectada, el modelo se autofinancia a los precios de hoy. Si ETH cae, también cae ese cálculo. #WSOT2026 #Seguimiento IPC EE.UU. Nov #WSOTPicktoEarn10U #Las nóminas de EE. UU. y las decisiones sobre tasas de interés impulsan la semana macroeconómica #La volatilidad del petróleo sigue de cerca las conversaciones de paz con Irán


if you're in your early 20s, actively participating in Web3, and you've convinced yourself that one day the next big airdrop, protocol, ecosystem or alpha call is going to change your life, I really pity you. Because there's a dangerous side to this space that a lot of young people don't talk about. You can spend three, four or even five years chasing opportunities on Crypto Twitter. Waking up to check your timeline, farming points, joining Discord communities, grinding leaderboards, hunting for whitelists, jumping from one testnet to another and convincing yourself that the next opportunity is the one that will finally pay off. And there's nothing inherently wrong with that. Web3 has created real opportunities for people who were willing to take risks, learn and put in the work. But what happens when you spend all those years chasing digital opportunities while neglecting the ones right in front of you? You could have learned a practical skill, built a business, pursued a career, gone back to school, developed meaningful relationships, travelled, met people outside your timeline or even started something of your own. Instead, you keep postponing real-life progress because you're waiting for an airdrop that may never come, a token that may never appreciate or a project that might not even remember your contribution when it's time to distribute rewards. The scary part is that the years don't announce themselves before they pass. One day, you'll look up and realise you're approaching 30. You have thousands of followers, hundreds of Discord roles, countless testnet transactions, a folder full of project bookmarks and an impressive knowledge of protocols nobody around you understands. But outside Twitter, what have you actually built or achieved ? What skills can you monetize? What tangible assets do you own? What experience can you put on your CV? What opportunities have you created for yourself beyond the possibility of another airdrop or an NFT you can flip for peanuts? I'm not saying leave Web3. I'm not saying the opportunities aren't real. Some people will genuinely change their lives through this industry. I'm saying don't make Web3 your entire life. Learn to code. Get a job. Start a business. Build something tangible. Develop skills that remain valuable even when the market turns red and the timeline goes quiet. Make friends outside Crypto Twitter. Take care of your health. Explore opportunities in the real world. You can farm points and build your future at the same time. Participate in the ecosystem, but don't become so consumed by the possibility of making it big that you forget to actually make something of yourself. Don't spend your entire 20s waiting for crypto to change your life. Make sure you're building a life that doesn't depend on it. #WSOT2026 #WSOTPicktoEarn10U #BybitAIEvolving $XLMUSDT @

WSOT 2026
WSOT 2026] Join the squad and compete for a share of up to 3.2M USDT $BTCUSDT $SOLUSDT #WSOT2026 #OilVolatilityTracksIranPeaceTalks #WSOTPicktoEarn10U