Sam Usman
4976Me gusta0Compartir en el chat444Aficionados781Seguir
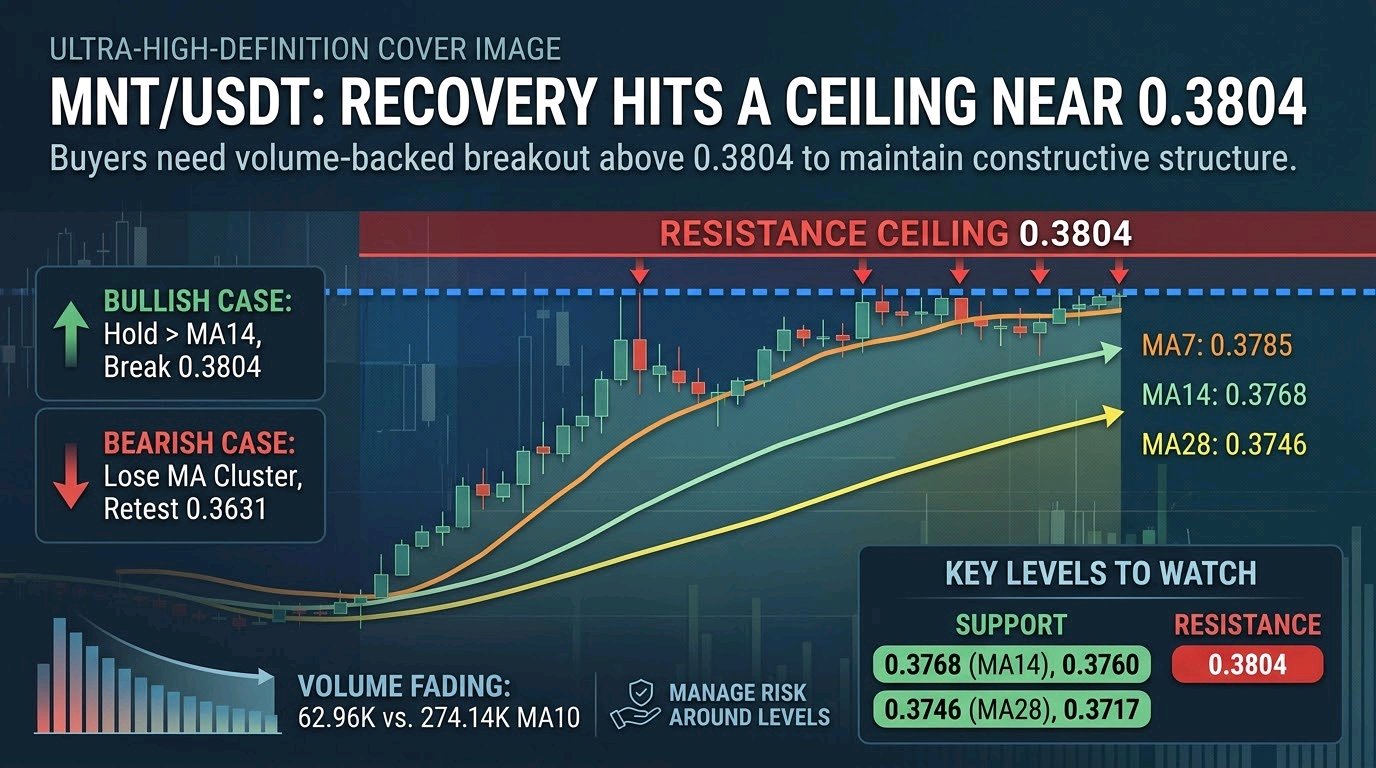
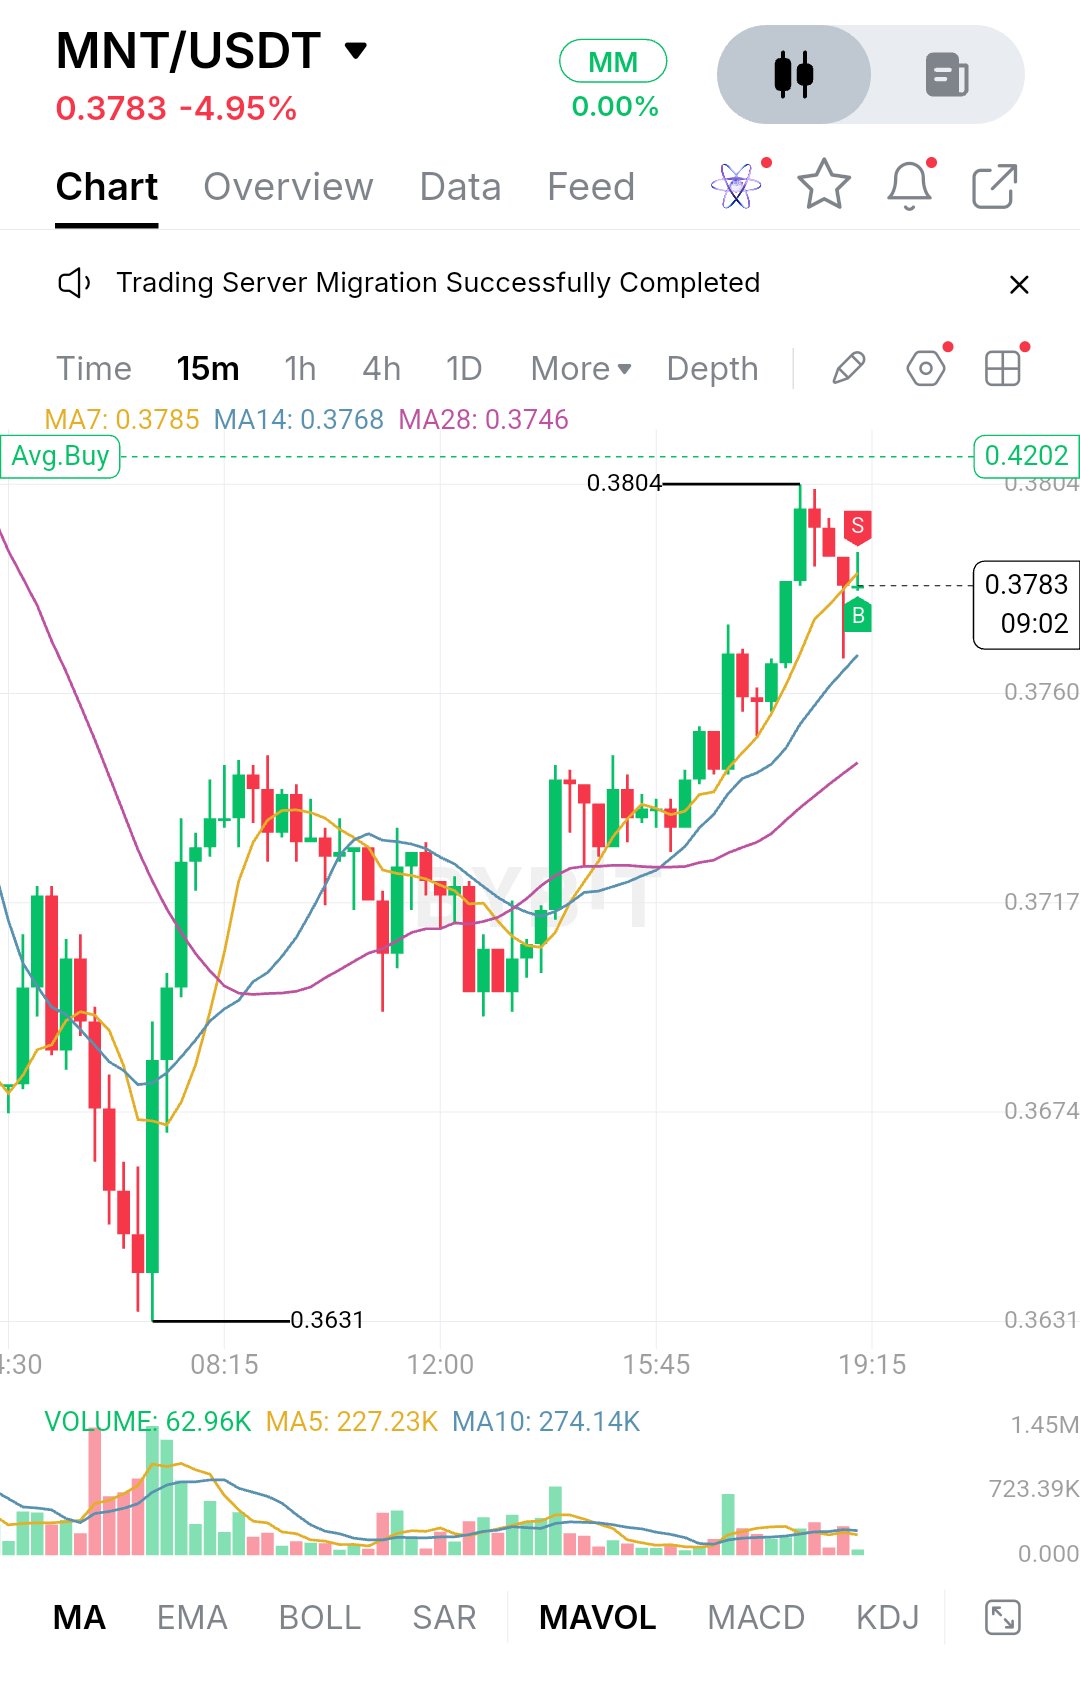
$MNTUSDT: La recuperación se topa con un techo cerca de 0.3804 MNT cotiza a 0.3783, con una baja del 4.95% en el día. Esa cifra principal oculta cómo se desarrolló la sesión. Los vendedores dominaron las primeras horas y empujaron el precio hasta 0.3631, donde una gran vela de compra absorbió la venta. Luego, los compradores reconstruyeron el movimiento paso a paso, y el precio volvió a subir a 0.3804 antes de que los vendedores aparecieran de nuevo. La recuperación fue real, pero el día sigue siendo negativo. Después del mínimo, MNT no se disparó hacia arriba. Pasó el tramo desde aproximadamente las 08:15 hasta las 12:00 moviéndose lateralmente en el área de 0.3680 a 0.3730, con velas superpuestas y mechas en ambos lados. Ese tipo de construcción de base es más lento y menos emocionante, pero generalmente resulta en una recuperación más sólida. El precio finalmente salió del rango por la tarde con una serie de velas verdes fuertes, lo que lo llevó al máximo de la sesión. Las últimas velas, sin embargo, son rojas y el empuje hacia arriba se ha estancado. Por el momento, parece un mercado que se está pausando en la resistencia en lugar de uno que haya cambiado de tendencia claramente. En cuanto a las medias móviles, la MA7 se sitúa en 0.3785, la MA14 en 0.3768 y la MA28 en 0.3746. Están apiladas en el orden correcto para una tendencia alcista a corto plazo, con la media más rápida arriba y las tres con pendiente ascendente. El precio en 0.3783 está rozando la MA7, por lo que está probando la línea de tendencia a corto plazo en este momento. Una pequeña caída hacia la MA14 sería un comportamiento normal en una tendencia saludable. Lo que me daría precaución es el volumen. La última vela muestra 62.96K frente a una MA5 de 227.23K y una MA10 de 274.14K, por lo que la participación está muy por debajo de los promedios recientes. El tramo de ruptura anterior tuvo un volumen notablemente más fuerte, y el retroceso actual es tranquilo. Eso juega a favor y en contra: no es una venta agresiva, pero también significa que los compradores aún no han vuelto a entrar con convicción. Para el soporte, la primera zona es el área de la MA14 cerca de 0.3768, seguida del nivel de 0.3760 en el eje del gráfico. El precio ha estado respetando las medias cortas durante esta subida, por lo que mantenerse aquí mantendría la estructura intacta. Por debajo de eso, la MA28 en 0.3746 es la siguiente línea a vigilar, luego los niveles de 0.3717 y 0.3674, que se alinean con el rango de consolidación que sirvió como plataforma de lanzamiento para la ruptura. El piso principal sigue siendo 0.3631. Una ruptura por debajo del grupo de medias móviles sugeriría que el repunte de la tarde fue solo un rebote, y el precio podría volver a derivar hacia el rango anterior. En cuanto al alza, la resistencia es clara: 0.3804 es el máximo de la sesión y el nivel que acaba de rechazar el precio, que es también donde se encuentra el marcador rojo S en el gráfico. Un movimiento limpio a través de él, idealmente con mejor volumen del que vemos ahora, marcaría un máximo más alto y empujaría la estructura hacia adelante. También hay una línea discontinua de Avg.Buy en 0.4202 en el gráfico. Esa es tu propia entrada promedio en lugar de un nivel de mercado, pero muestra cuánto tendría que viajar el precio para volver al punto de equilibrio, aproximadamente un 11% por encima del precio actual. No lo trataría como un objetivo realista a corto plazo. El caso alcista es simple. Los compradores deben defender la zona de 0.3768 a 0.3760, mantener el precio por encima de la MA14 ascendente y luego cerrar decisivamente por encima de 0.3804. El volumen debería expandirse en ese movimiento. Si lo hace, la siguiente área a observar está más arriba en el gráfico, donde no hay una resistencia marcada, por lo que el impulso tendría que hacer el trabajo. El rango superior hacia 0.40 es una referencia psicológica natural, pero nada en este gráfico lo confirma todavía. El caso bajista comienza con un fracaso al recuperar 0.3804 y una pérdida de las medias móviles cortas. Si el precio se desliza por debajo de la MA14 y luego de la MA28 en 0.3746, los vendedores toman el control de la estructura a corto plazo, y una nueva prueba de 0.3717 o 0.3674 se vuelve probable. Una caída por debajo de 0.3631 borraría toda la recuperación y pondría en juego el mínimo de la mañana como un nivel de ruptura en lugar de soporte. **Niveles clave de precio** - Resistencia: 0.3804 (máximo de la sesión) - Soporte inmediato: 0.3768 (MA14) y 0.3760 - Soporte secundario: 0.3746 (MA28) y 0.3717 - Soporte más profundo: 0.3674 - Soporte principal: 0.3631 (mínimo de la sesión) - Línea de tendencia a corto plazo: 0.3785 (MA7) La estructura es constructiva pero no está probada. El precio hizo una secuencia de mínimos más altos después de una fuerte venta, pero ahora se encuentra bajo un techo claro con un volumen que se desvanece. Lo que importa a continuación no es el porcentaje diario, sino cómo se comporta el precio alrededor de 0.3768 y 0.3804. Mantenerse por encima de las medias con una ruptura respaldada por volumen abriría la siguiente etapa de expansión, mientras que una pérdida del grupo de medias móviles volvería a poner al rango a cargo. Deja que el precio confirme antes de asumir cualquier dirección, y gestiona el riesgo alrededor de los niveles anteriores. Esto es análisis de gráficos, no asesoramiento financiero. #ByXIMPACT$BTCUSDT
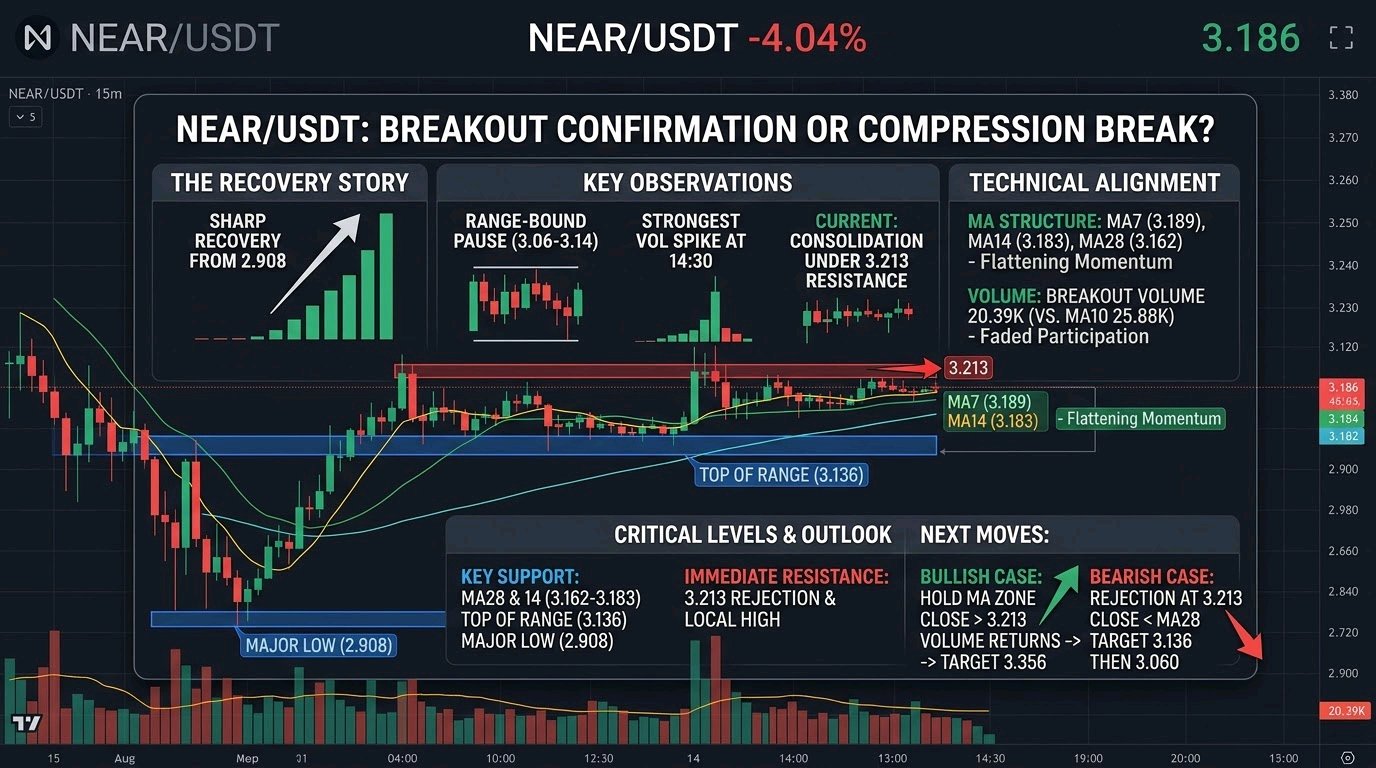
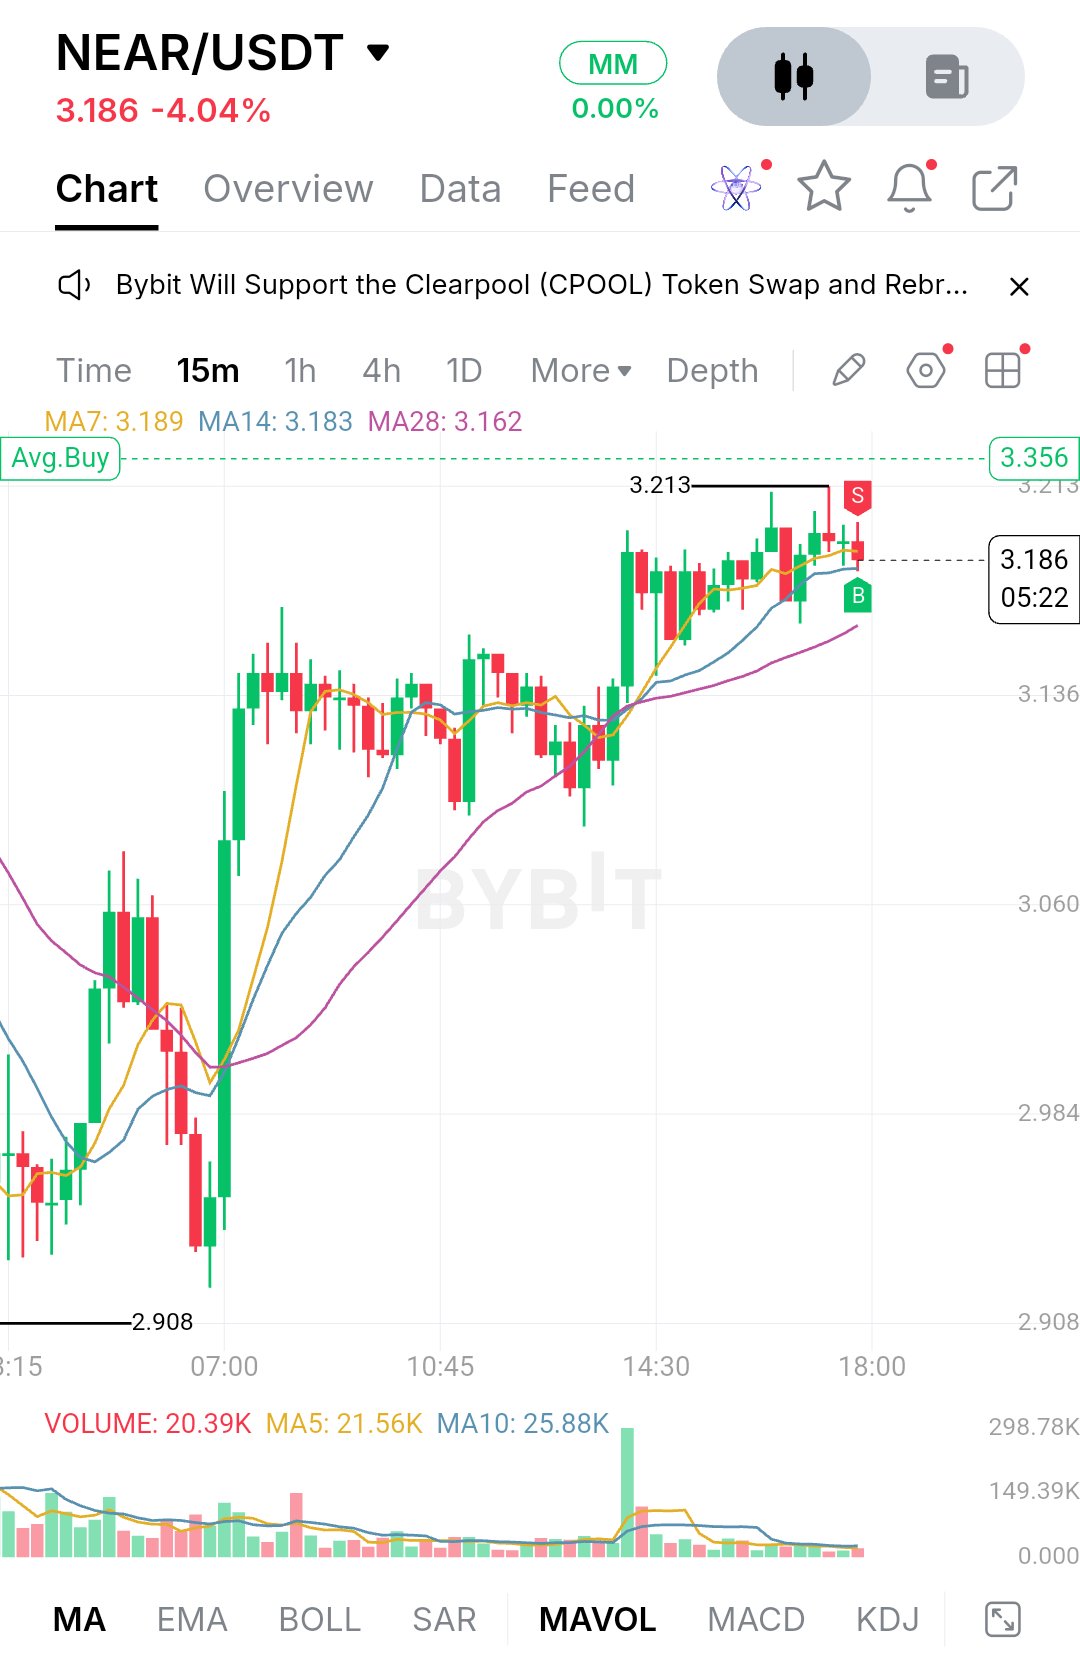
NEARUSDT está cotizando a 3.186, con una baja del 4.04% en el día. Ese número de titular esconde una historia más interesante. Los vendedores golpearon el par con fuerza al principio de la sesión y lo empujaron hasta el mínimo de 2.908, pero los compradores intervinieron agresivamente cerca de las 07:00. Una gran vela verde impulsó el precio de vuelta hacia arriba a través del rango medio. Los vendedores que causaron la caída fueron absorbidos en su mayoría y el mercado se ha estado reconstruyendo desde entonces. Después de esa recuperación brusca, el precio pasó varias horas moviéndose lateralmente entre aproximadamente 3.06 y 3.14, con velas superponiéndose y sin una dirección clara. Ese tipo de rango es típicamente donde el mercado decide si el rebote fue real. Se resolvió al alza alrededor de las 14:30, cuando una vela verde fuerte rompió el rango con el mayor pico de volumen en el gráfico. El precio luego subió hasta un máximo local de 3.213, donde se estancó. Las últimas velas son pequeñas e indecisas, con un par de mechas superiores, por lo que esto parece una consolidación bajo resistencia más que una continuación clara de la tendencia. En cuanto a las medias móviles, la MA7 se sitúa en 3.189, la MA14 en 3.183 y la MA28 en 3.162. El precio está pegado a las dos primeras, lo que te indica que el momentum se ha aplanado por ahora. Sin embargo, la estructura sigue siendo constructiva: la MA28 tiene pendiente ascendente y está por debajo del precio, y las medias más cortas están apiladas por encima. El volumen cuenta una historia similar. El pico de la ruptura fue grande, pero la participación se ha desvanecido desde entonces; la barra actual está en 20.39K y las MA5 y MA10 están cerca de 21.56K y 25.88K. Un movimiento sin un volumen fuerte que lo respalde tiende a ser más fácil de revertir. El soporte más cercano es el área de 3.162 a 3.183, donde se encuentran la MA28 y la MA14. Si los compradores lo defienden, la estructura de mínimos más altos se mantiene intacta. Por debajo de eso, el nivel de 3.136 importa porque marca la parte superior del rango anterior, y la vieja resistencia a menudo se convierte en soporte después de una ruptura. Una pérdida clara de 3.136 volvería a poner en juego la zona de 3.060, y por debajo de ella 2.984 y finalmente el mínimo de 2.908. Perder 2.908 borraría toda la recuperación. La resistencia inmediata es el máximo de 3.213. El precio ya lo rechazó una vez, y el marcador rojo cerca de esa área muestra que los vendedores están activos allí. Una ruptura decisiva por encima, idealmente con volumen en aumento, abriría el camino hacia la parte superior del gráfico, con 3.356 como el próximo nivel de referencia visible. Para el escenario alcista, los compradores necesitan mantener el área de la MA14 y MA28, cerrar velas por encima de 3.213 y hacer que el volumen vuelva. Si eso sucede, el precio tiene espacio para extenderse hacia 3.356. El escenario bajista comienza con otro rechazo en 3.213 seguido de un cierre por debajo de la MA28. Eso sugeriría que la ruptura fue solo un squeeze, con el precio probablemente rotando de vuelta a 3.136 y potencialmente 3.060. Niveles de precio clave: - Resistencia: 3.356 y 3.213 - Precio actual: 3.186 - Medias móviles: MA7 3.189, MA14 3.183, MA28 3.162 - Soporte: 3.136, 3.060, 2.984 - Mínimo importante: 2.908 El gran movimiento ya ocurrió, así que la pregunta más importante es qué viene después. El precio se está comprimiendo justo debajo de la resistencia mientras se mantiene por encima de sus medias de corto plazo, y compresiones como esta suelen terminar en expansión. Observa si la zona de 3.162 a 3.183 se mantiene y si el volumen regresa ante un empujón a través de 3.213. Si ambos se alinean, el mercado tiene un camino despejado hacia arriba. Si ninguno lo hace, la paciencia es la mejor operación. Nada de esto es seguro y debería tratarse como una lectura de la estructura más que como una predicción. Nota: tu captura de pantalla muestra el gráfico de 15 minutos y no tiene niveles de EMA200, RSI, MACD o Fibonacci. Solo usé lo que es visible, así que los dejé fuera en lugar de inventar valores. Si los agregás o enviás el gráfico de 1h, puedo incorporarlos al post. #ByXIMPACT$MNTUSDT
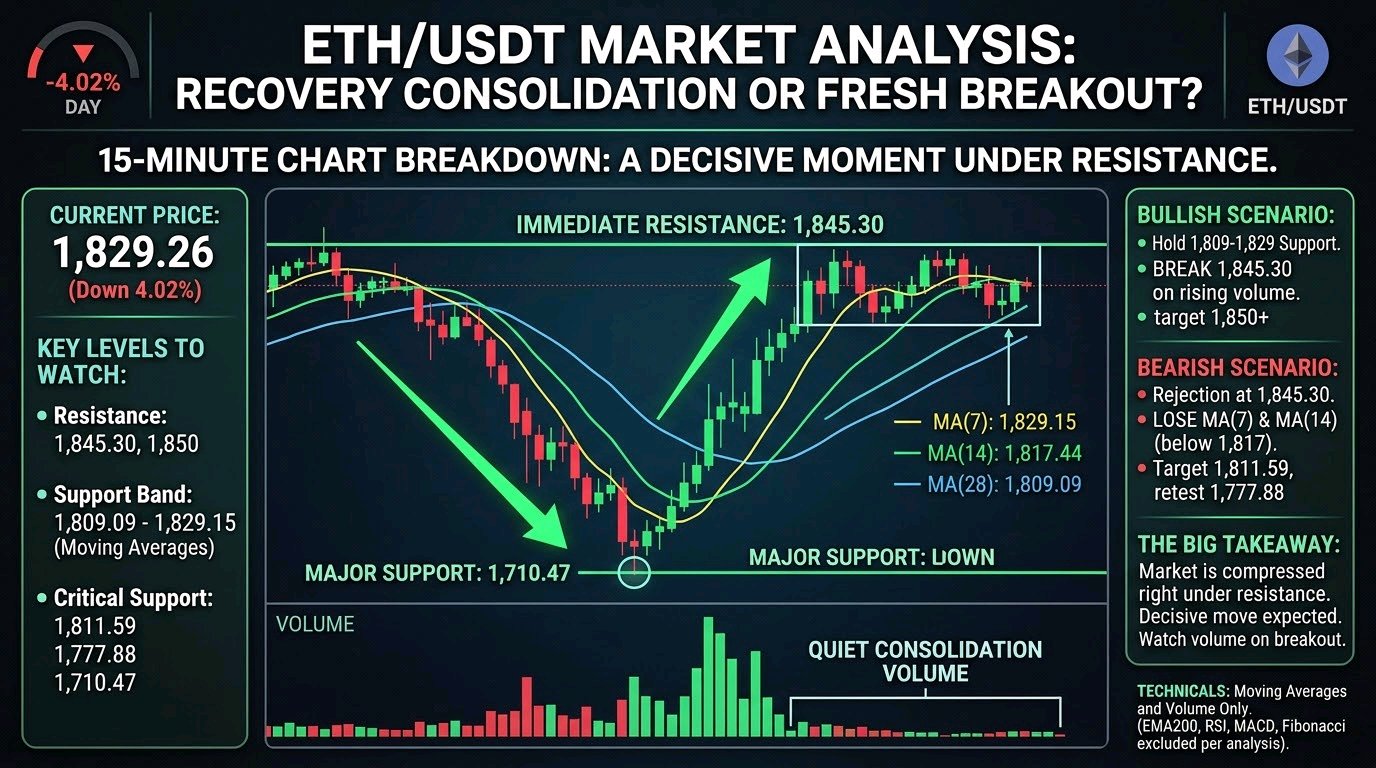
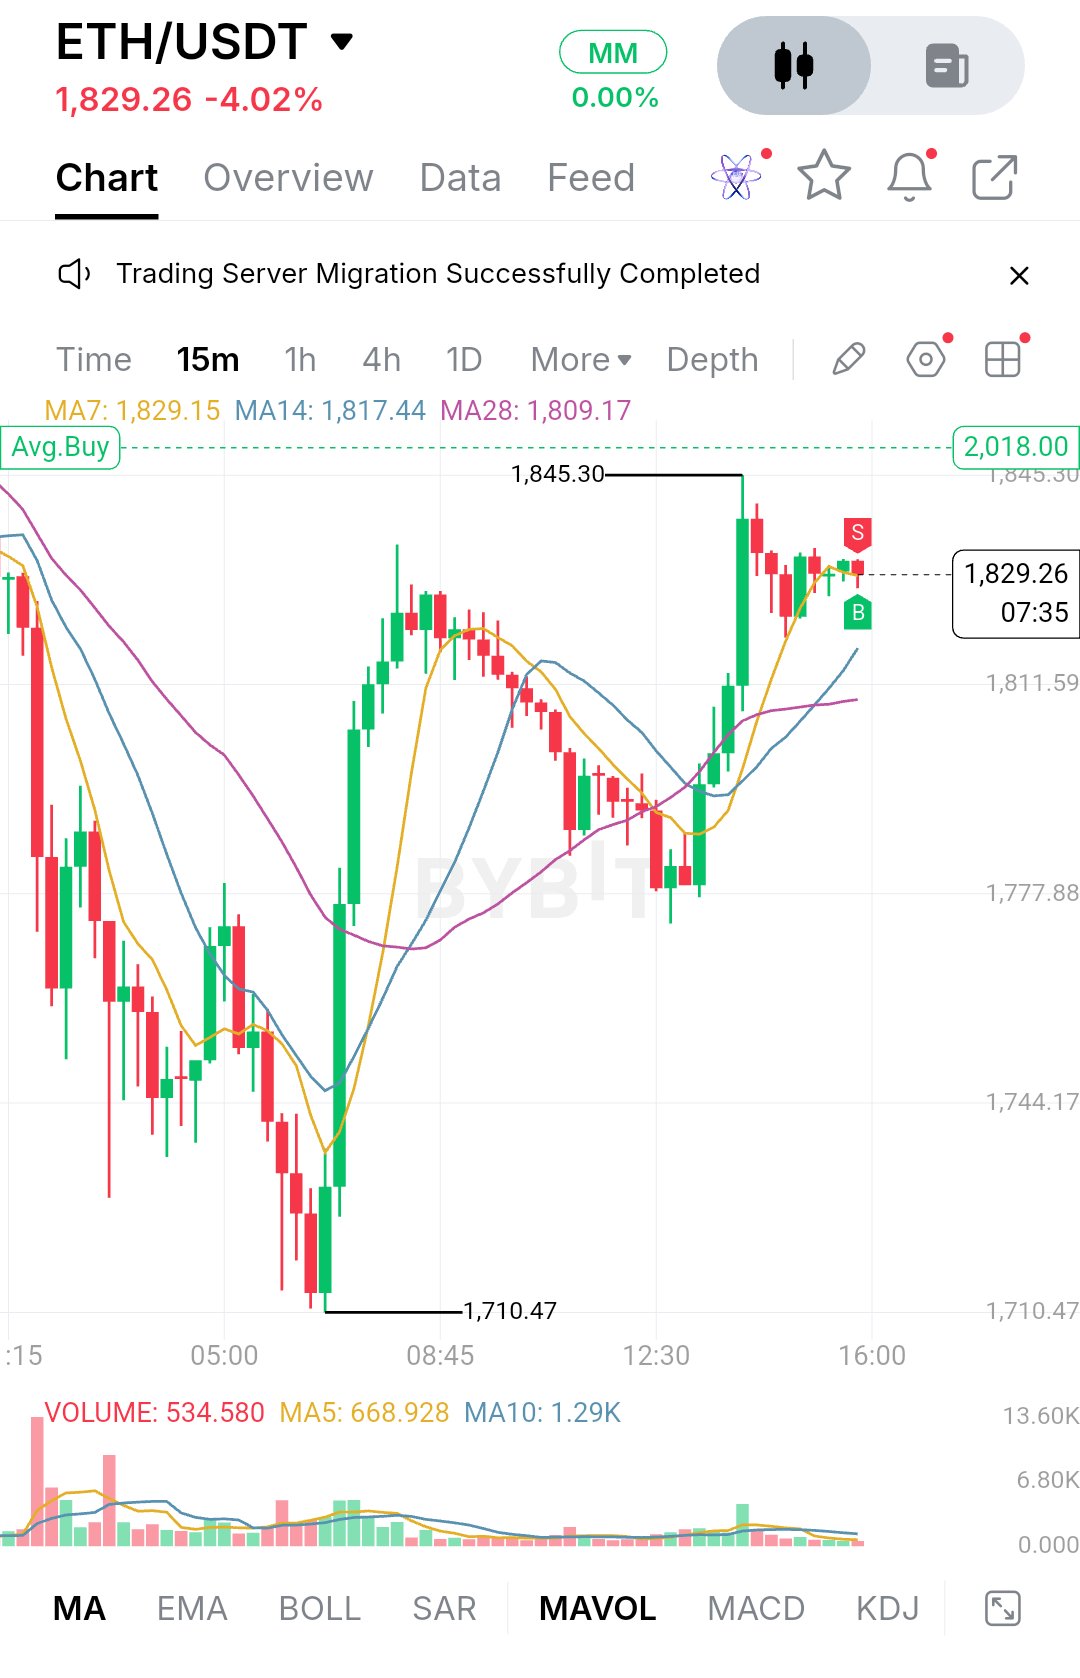
$ETHUSDT is trading at 1,829.26, down 4.02% on the day. The 15-minute chart shows the day's story clearly. Sellers pushed price hard through the early session, and the slide kept going until it bottomed at 1,710.47. That low also marks the extreme of the whole visible move. Buyers stepped in there with real force, and the long, heavy green candles that followed came with a clear pickup in volume. Price ripped back up to a swing high at 1,845.30, which recovered most of the damage in a few hours. Since that peak, the market has cooled off. The last stretch of candles is small and overlapping, with red and green bodies trading inside a tight pocket just under the high. That looks like consolidation after an impulsive recovery rather than a fresh push. Momentum hasn't flipped bearish, but it has slowed. The sellers who showed up at 1,845.30 have been enough to cap price without forcing a pullback so far. A note on the technicals: this screenshot is the 15-minute timeframe, not the 1-hour, and it only shows moving averages and volume. I can't comment on EMA200, RSI, MACD or Fibonacci levels because none of them are on the chart, and I won't make up readings. What is visible is MA7 at 1,829.15, MA14 at 1,817.44 and MA28 at 1,809.09. Price sits almost exactly on the MA7, with the MA14 and MA28 stacked below in bullish order. The MA7 has flattened out after the sharp climb, which fits the sideways chop. The slower averages are still sloping up, which keeps the short-term structure constructive as long as price holds above them. Volume tells a similar story. The surge during the recovery has faded to quiet, low bars, so the market is waiting for its next catalyst. For support, the first area to watch is the MA7 zone around 1,829, since price is sitting on it right now and losing it would be the first sign that the consolidation is breaking down. Below that sits the MA14 near 1,817, followed by the MA28 near 1,809. That 1,809 to 1,817 band is where the recovery leg was built, so it matters for structure. If buyers defend it, the higher-low pattern stays intact. A clean break below it would put the horizontal marker at 1,811.59 in play, and a failure there exposes the 1,777.88 area, where the chart shows earlier reaction. The full base of the move remains the 1,710.47 low. On the upside, the immediate ceiling is the 1,845.30 swing high. That is the level sellers defended once already, and price is pressing just beneath it. A convincing break and hold above it would confirm that the consolidation was a pause rather than a top. The round 1,850 zone sits just above it and will likely draw attention as a psychological level. Beyond that, the chart shows a dashed line at 2,018.00 labeled Avg. Buy, which looks like a position marker on this account rather than a market level, so it isn't a true technical target, though it is where price would head if a strong expansion follows. The bullish case is simple. Buyers need to hold the 1,809 to 1,829 band and then push through 1,845.30 on rising volume. A candle close above that high, followed by a retest that holds, would suggest the market is building higher lows into a continuation. That could open room toward 1,850 and then the bigger levels above, though nothing here is guaranteed. The bearish case starts with rejection at 1,845.30. If price keeps stalling under that high and then loses the MA7 and MA14, the recovery starts to look like a bounce within a larger down day. Sellers would then aim at the 1,811.59 area, and a break beneath it makes a retest of 1,777.88 realistic. The full 1,710.47 low only comes back into view if momentum shifts decisively. Key price levels: - Resistance: 1,845.30 (swing high), 1,850 (psychological), 2,018.00 (Avg. Buy marker on chart) - Current price: 1,829.26 - Moving averages: MA7 1,829.15, MA14 1,817.44, MA28 1,809.09 - Support: 1,811.59, 1,777.88, 1,744.17 - Major low: 1,710.47 Overall, ETH did the hard part by recovering from 1,710.47 to the 1,845.30 area, but the market is now compressed right under resistance, and compression like this usually resolves with a decisive move. Watch how price behaves around 1,845 and whether volume returns on a break. A hold above the moving averages with expanding volume favors upside continuation, while a slip below 1,809 would shift the tone. Let the structure show you the direction instead of anticipating it. This is not financial advice, and risk management matters more than any single read. #ByXIMPACT$SOLUSDT
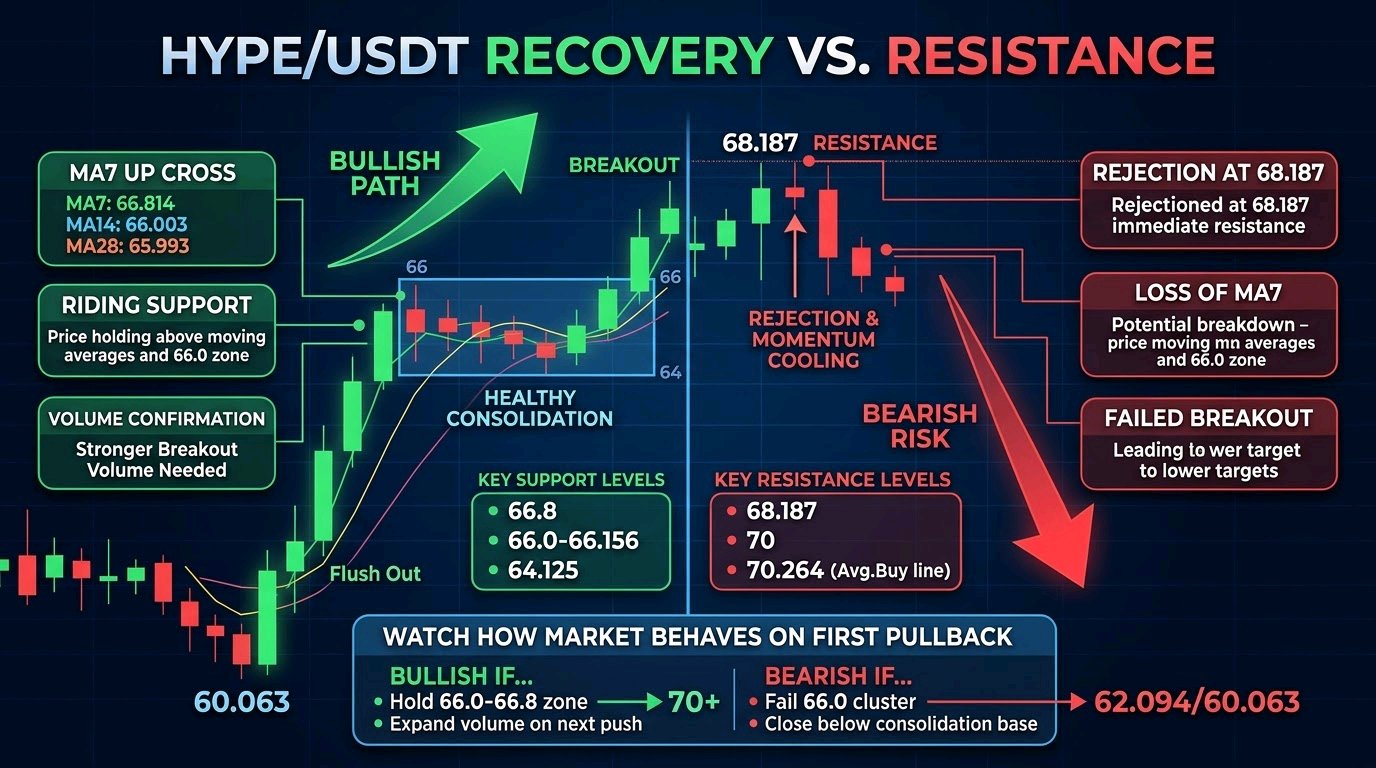
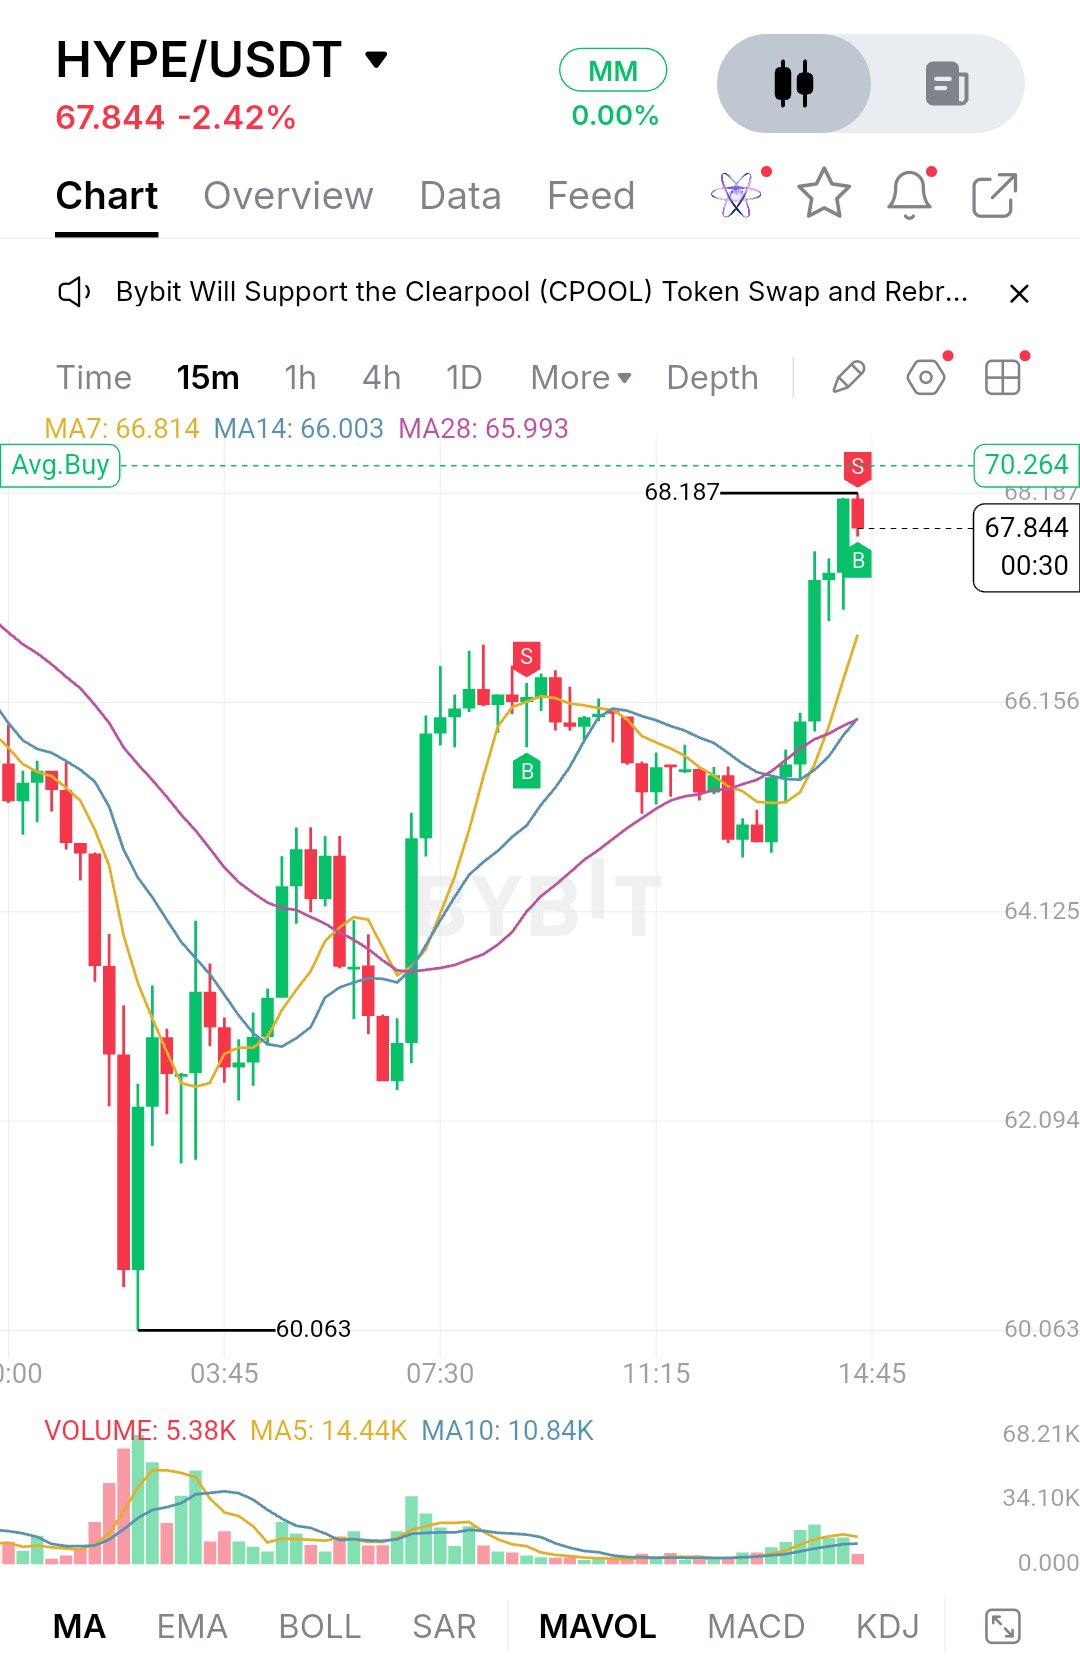
$HYPEUSDT is trading at 67.844, down 2.42% over the last 24 hours. The percentage looks mild, but the intraday action tells a more interesting story. Sellers pushed price all the way down to 60.063, where a long red candle flushed out late buyers. Buyers stepped in right there with a strong green recovery candle, and price has been climbing ever since. It has now pushed into the 68.187 area, which is where sellers showed up again. After the low, the market didn't bounce in a straight line. It rebuilt in stages. Price made a higher low, pushed up into the mid-66s, then spent several hours between roughly 64 and 66 working sideways. That range was healthy consolidation. The pullback inside it was shallow and it never retraced the whole recovery. Late in the session buyers took control again and a run of green candles broke the range to the upside, taking price to 68.187. The most recent candle is red and still open, so it's too early to call it a confirmed rejection, but momentum has cooled a little right under the highs. On the technical side, the moving averages show the shift clearly. MA7 sits at 66.814, MA14 at 66.003 and MA28 at 65.993. The three had been tangled together during the consolidation, a sign the market was indecisive. Now MA7 has turned sharply up and moved above the other two, with price riding well above all of them. That's a constructive structure for short-term traders. One caution is volume. The breakout candles printed decent participation, but the latest bar shows 5.38K against a MA5 of 14.44K and a MA10 of 10.84K. Part of that is because the candle is unfinished, but the follow-through needs to show up in volume for this move to last. For support, the first area is the MA7 near 66.8. Just below it is the more important cluster, where MA14 and MA28 sit almost on top of each other around 66.0, close to the 66.156 gridline. That zone was the top of the earlier consolidation, so if it now acts as support, it confirms the breakout was real. A close back below it would put the 64.125 area in play, which is where the range base formed. Below that, 62.094 and the 60.063 swing low are the deeper levels. Losing 60.063 would break the whole recovery structure. On the upside, immediate resistance is 68.187, the high of the move. Above it, the chart shows a dashed line at 70.264 labelled Avg.Buy, and the round 70 level sits just beneath it, so I'd expect reactions there. Sellers tend to defend psychological numbers, and breakouts through them often get tested more than once. The bullish case is simple. Buyers need to hold the 66.0 to 66.8 zone on any pullback and then push through 68.187 with real volume behind it. A clean close above that opens the way to 70, and then the 70.264 line. A pullback that finds support at the moving averages and bounces would be the healthiest way to continue. The bearish case starts with rejection at 68.187 and a loss of MA7. If price slips through the 66.0 cluster and closes below it, the breakout starts to look like a stretched move that has run out of fuel. That would likely drag price back into the 64.125 range base, and a break of that would revisit 62.094 and possibly the 60.063 low. Key price levels: Resistance: 68.187, 70 (psychological), 70.264 (Avg.Buy line) Support: 66.8 (MA7), 66.0 to 66.156 (MA14/MA28 and gridline), 64.125, 62.094, 60.063 Overall, the structure has moved from a heavy selloff to a recovery with higher lows and a range breakout, and that deserves respect. But price is now pressing against a level that already rejected it once. What I'd watch is how the market behaves on the first pullback. If buyers defend the 66 area and volume expands on the next push, the move toward 70 stays alive. If that zone fails, the rally has likely been a relief bounce inside a larger range. Let the reaction at those levels confirm the direction before committing, and keep risk defined either way. #ByXIMPACT$BTCUSDT
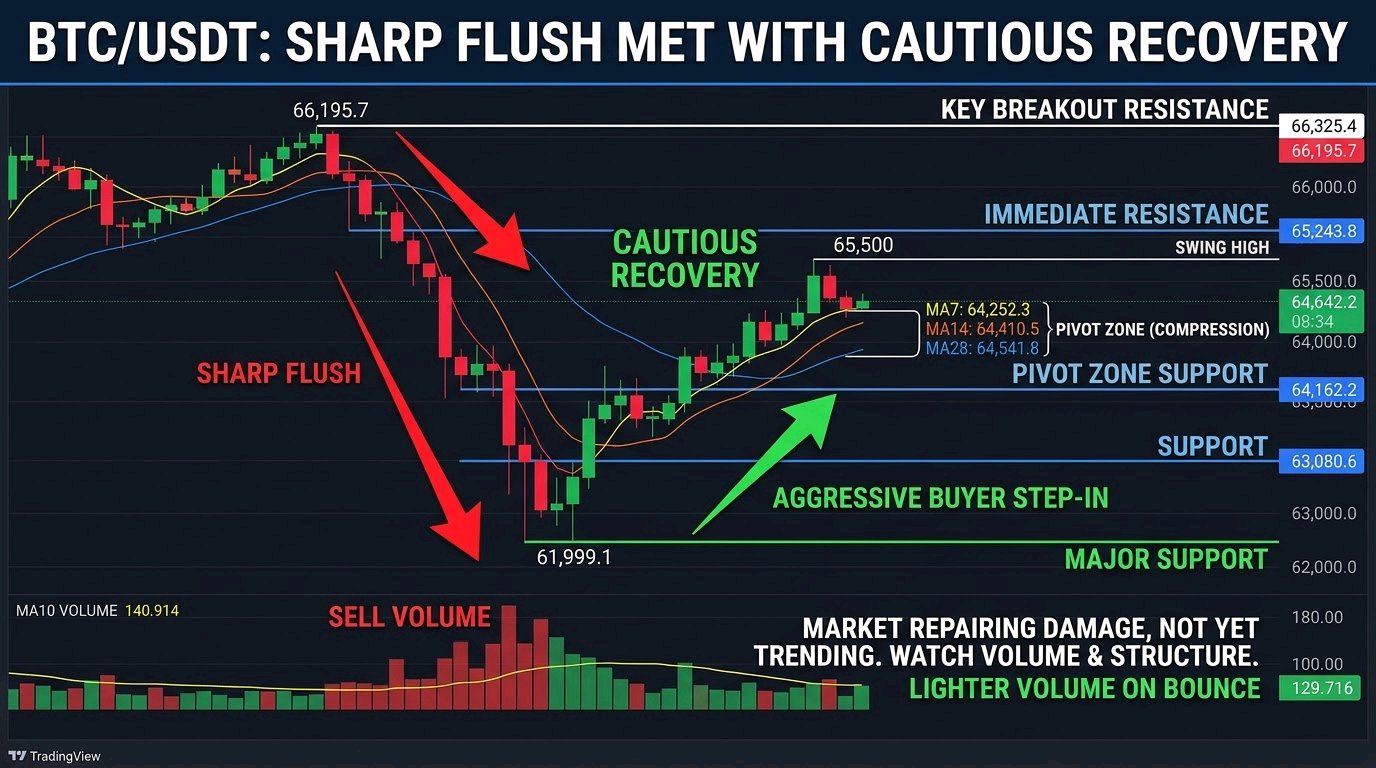
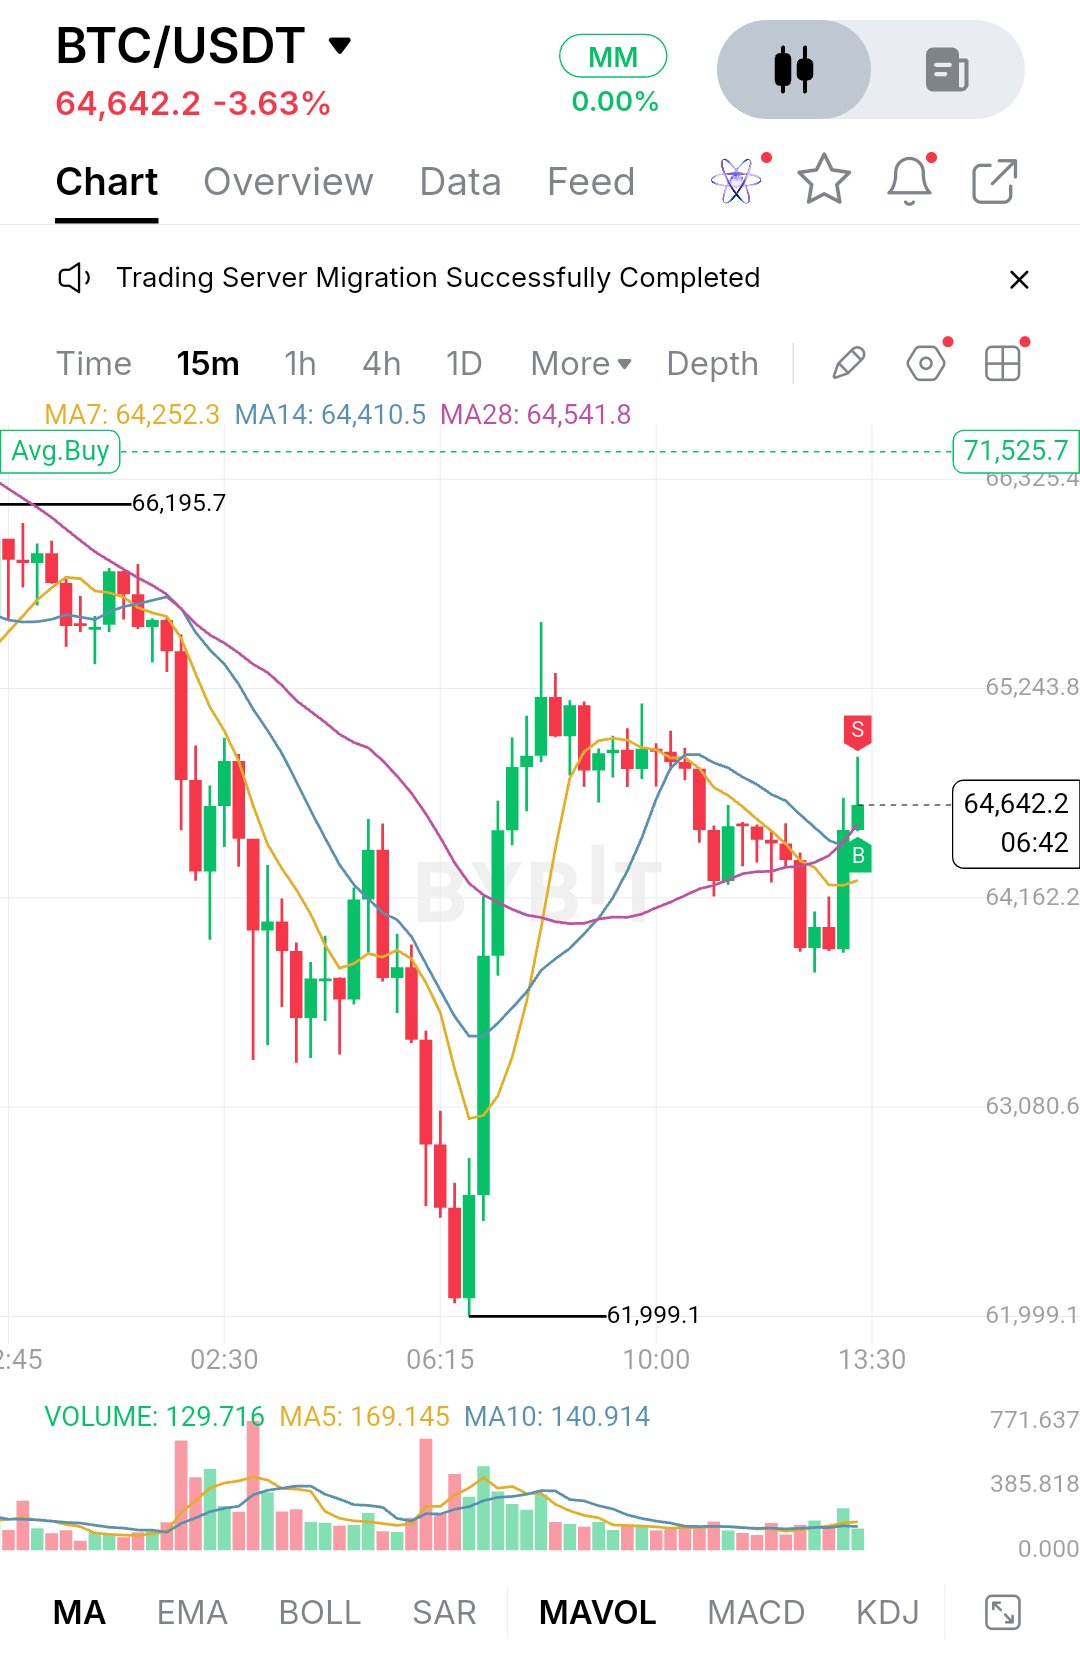
$BTCUSDT is trading at 64,642.2, down 3.63% on the day, and the chart tells a clear story of a sharp flush followed by a cautious recovery.** Earlier in the session, price was still hanging around the 66,195.7 area. Sellers took control from there and pushed Bitcoin down in a steady, heavy sequence of red candles, with the biggest volume bars of the session showing up during the drop. The move bottomed out at 61,999.1, where buyers finally stepped in aggressively and produced one of the largest green candles on the chart. That reaction told us the market was not ready to hand over that zone without a fight. After that bounce, Bitcoin moved into a recovery and then a choppy range. The rebound ran up toward the 65,500 area but stalled there, forming a lower high compared to the 66,195.7 peak. From that point price drifted sideways to lower, dipped toward the 63,900 region, and then printed a fresh green candle that lifted it back to the current level. So the structure right now is a V-shaped recovery that has not yet reclaimed the prior highs. Momentum has improved, but the market is still repairing damage rather than trending. On the technical side, the moving averages are worth a close look. Price is sitting just above all three: MA7 at 64,252.3, MA14 at 64,410.5 and MA28 at 64,541.8. They are bunched tightly together, which usually means the market is undecided and compressing before its next real move. The latest green candle pushed through that cluster, which is a constructive sign, but one candle is not confirmation. Volume is the other piece. The current reading is 129.716 against a MA5 of 169.145 and a MA10 of 140.914, so participation on the bounce is lighter than the average. Buyers are present, but they are not yet showing the conviction that was behind the selloff. That is something to keep an eye on. For support, the first area is the 64,162.2 grid level, which lines up closely with the moving average cluster. If price holds above it on pullbacks, it keeps the short-term recovery intact. Below that, 63,080.6 is the next meaningful zone, and the pullback low from the recent range formed above it. The major support is the 61,999.1 swing low. That level has already been tested once with a strong rejection, so it matters a lot. A clean break below it would shift the structure back to bearish and open the door to a deeper leg lower, since there is no visible support beneath it on this chart. On the upside, the immediate resistance sits around the recent rejection wick near 65,000, where the red "S" marker appears on the chart. Above that is the 65,243.8 level, followed by the swing high near 65,500. The key breakout level is 66,195.7, the high from before the selloff, with 66,325.4 just above it. A move through that area would take out the lower-high structure and change the tone completely. Psychologically, traders will also be watching the 65,000 and 66,000 round numbers. The bullish scenario is straightforward. Buyers need to hold price above the moving average cluster, keep 64,162.2 as support, and then push through 65,243.8 with stronger volume than we have seen on this bounce. If they get above the 65,500 swing high, the focus moves to 66,195.7 and then 66,325.4. A close above those levels would suggest the entire drop was absorbed and the market is ready to rebuild higher. The bearish scenario is a rejection from the 65,000 to 65,243.8 zone, followed by a loss of the moving averages and 64,162.2. That would confirm the bounce as a simple relief move inside a bigger downtrend, with 63,080.6 as the first target. If that gives way, a retest of 61,999.1 becomes likely, and a break below it would be the real warning sign. **Key Price Levels** - Resistance: 65,243.8 / 66,195.7 / 66,325.4 - Pivot zone: 64,162.2 to 64,541.8 (moving average cluster) - Support: 64,162.2 / 63,080.6 - Major support: 61,999.1 In the end, Bitcoin has done the hard part by defending 61,999.1, but it has not yet proven that the recovery has real strength behind it. The compression around the moving averages suggests an expansion is coming, and the direction will depend on whether price can hold above 64,162.2 and break 65,243.8 with improving volume. Watch how the market behaves around that pivot zone rather than chasing the candle. Structure and volume will tell the story, and none of this is a guarantee of where price goes next. Manage risk accordingly. #IMPACTbyTrade$ETHUSDT
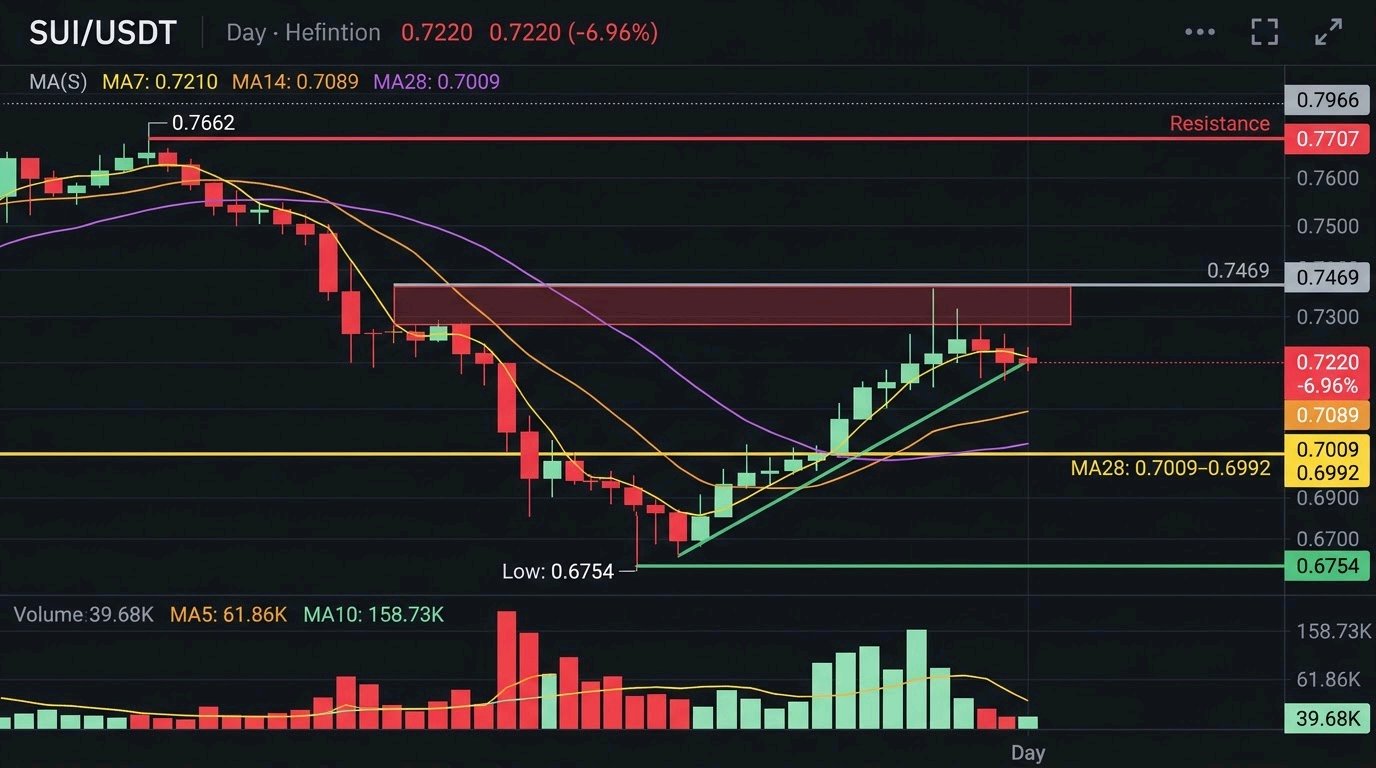
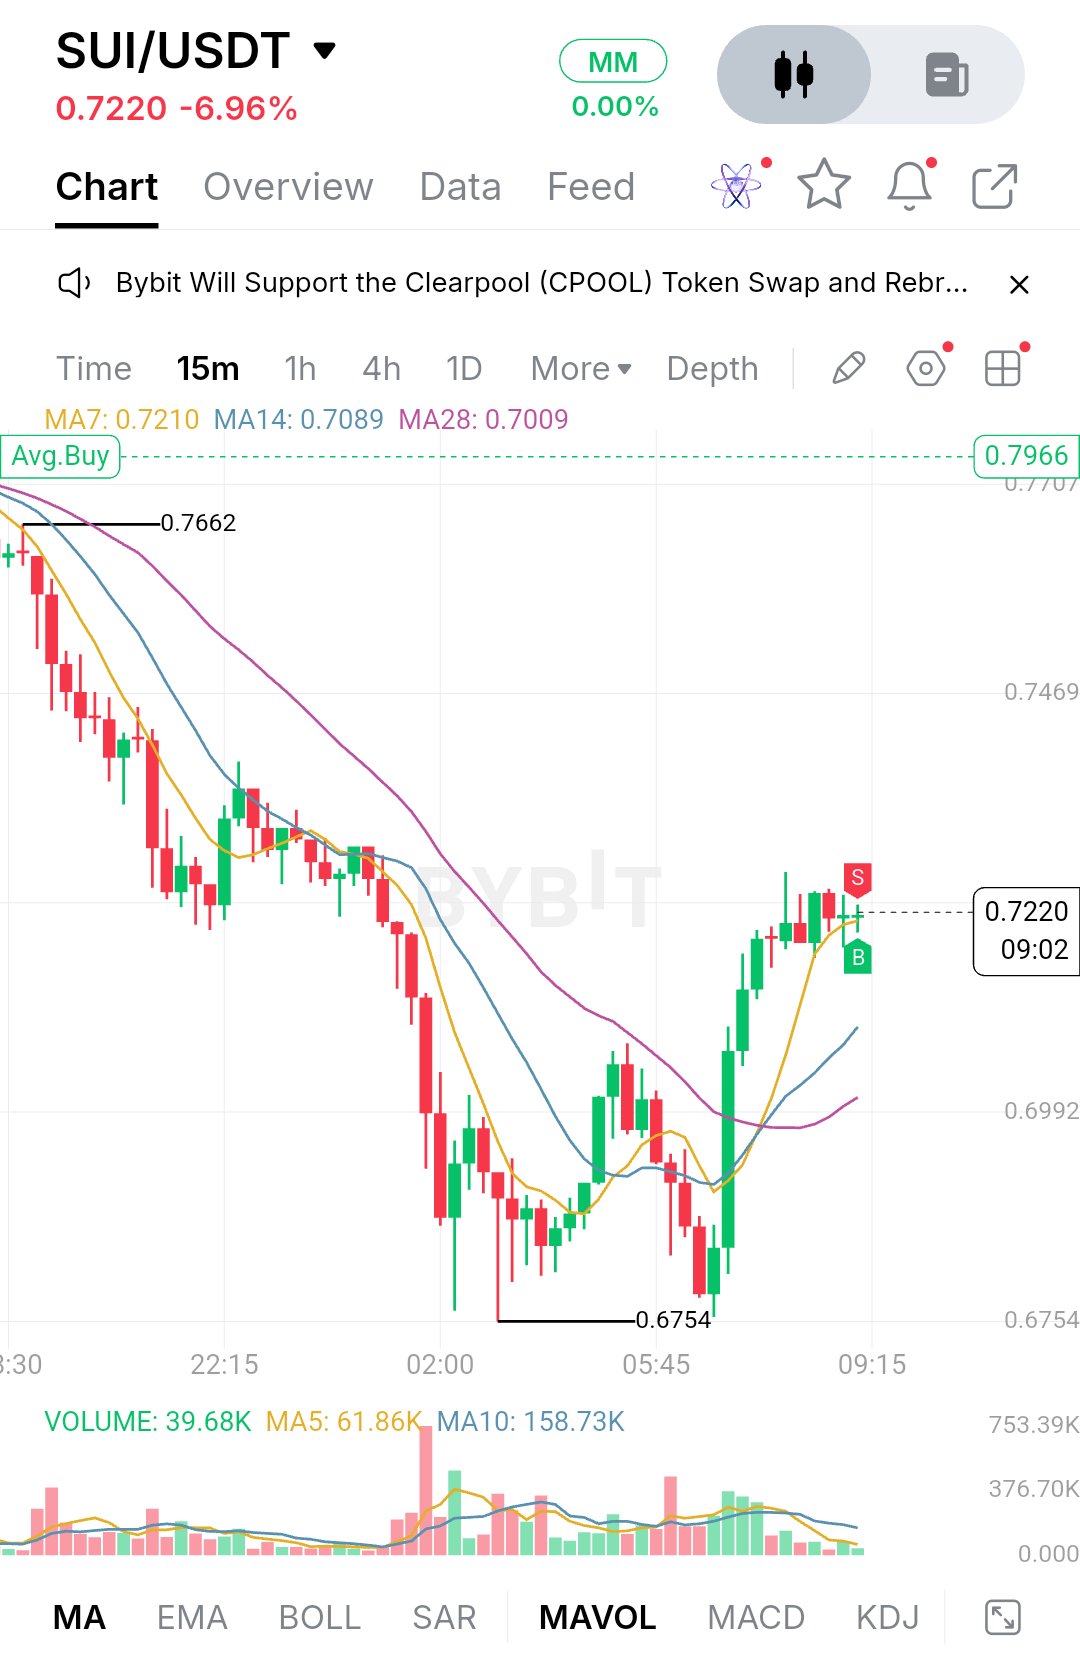
$SUIUSDT cotiza a 0.7220, con una baja del 6,96% en las últimas 24 horas. El día comenzó con los vendedores tomando el control firme cerca de 0.7662, donde el precio tocó techo y comenzó un deslizamiento constante, casi ininterrumpido. Hubo muy poca vacilación en el camino hacia abajo. Vela tras vela cerró en rojo, y cada pequeño rebote fue aprovechado para vender hasta que el precio cayó de golpe a 0.6754. Ese mínimo es donde cambió la historia. Un gran volumen ingresó cerca del fondo, y la presión vendedora dejó de producir nuevos mínimos. Los compradores intervinieron y empujaron el precio hacia arriba en una marcada recuperación en forma de V, recuperando aproximadamente 0.047 desde el mínimo en unas pocas horas. La estructura ahora parece una recuperación que todavía está tratando de probarse a sí misma. El precio ha vuelto a subir por encima de las tres medias móviles. La MA7 se sitúa en 0.7210, la MA14 en 0.7089 y la MA28 en 0.7009, y el precio está operando justo encima de la más rápida. Las medias también están cambiando: la MA7 cruzó por encima de las otras dos, y la MA14 se está curvando hacia la MA28. Esa es una señal temprana de cambio de impulso, pero las medias más largas todavía están muy por debajo de los máximos anteriores, por lo que esto es un rebote dentro de una tendencia bajista más amplia hasta que se demuestre lo contrario. El volumen da una pista útil. La venta masiva vino acompañada de grandes barras de volumen rojo, mientras que la recuperación ha sido constante pero más ligera. El volumen actual es de 39.68K, por debajo de su MA5 de 61.86K y muy por debajo de la MA10 de 158.73K. El rebote es real, pero todavía no está respaldado por el tipo de participación que suele confirmar un cambio de tendencia. Las últimas velas tienen cuerpo pequeño y son indecisas, con una mecha de rechazo cerca de la parte superior, lo que sugiere que los compradores están tomando aire, o que los vendedores están empezando a defender esta zona. A la baja, el primer soporte es el área de la MA7/MA14 alrededor de 0.7210 a 0.7089. Si el precio retrocede, este es el lugar donde los compradores deben aparecer. Por debajo de eso, la zona de 0.7009 a 0.6992 destaca, ya que se alinea con la MA28 y un nivel horizontal visible en el gráfico. Un cierre por debajo pondría en duda toda la recuperación. El soporte principal es el mínimo de 0.6754. Perderlo invalidaría el rebote y abriría la puerta a nuevos mínimos. Al alza, la resistencia más cercana está justo por encima del precio actual, alrededor de la reciente mecha de rechazo cerca de 0.73 a 0.74. Por encima de eso se encuentra 0.7469, un nivel horizontal claro en el gráfico. La zona de ruptura más grande es 0.7662, el máximo de todo este movimiento, con 0.7707 justo encima. El marcador de 0.7966 en el gráfico es la siguiente referencia por encima de eso si el impulso realmente se expande. Para el escenario alcista, los compradores deben mantenerse por encima del grupo de MA7/MA14, construir una serie de mínimos más altos y romper 0.7469 con un volumen más fuerte. Un empuje limpio a través de ese nivel pondría en juego los 0.7662. Recuperarlo sería la primera señal real de que toda la venta masiva ha sido absorbida. Para el escenario bajista, un rechazo alrededor de 0.73 a 0.7469 seguido de una pérdida de 0.7089 sugeriría que esto fue solo un rebote de alivio. Una ruptura por debajo de 0.6992 volvería a centrar la atención en 0.6754, y un cierre por debajo de ese nivel confirmaría que los vendedores siguen al mando. Niveles de precio clave: - Resistencia: 0.7300 a 0.7400 (zona de rechazo reciente) - Resistencia: 0.7469 - Resistencia principal: 0.7662 y 0.7707 - Soporte: 0.7210 (MA7) y 0.7089 (MA14) - Soporte: 0.7009 a 0.6992 (MA28 y nivel horizontal) - Soporte principal: 0.6754 (mínimo reciente) En general, SUI hizo la parte difícil al defender 0.6754 y recuperarse por encima de las medias de corto plazo. Lo que importa ahora es la reacción alrededor de 0.73 a 0.7469 y si el volumen aumenta cuando el precio llegue allí. Una pausa ajustada por encima de las medias seguida de una ruptura fuerte y de alto volumen sería la configuración más saludable. Un retesteo débil que falle en las MAs contaría una historia diferente. Observá cómo se comporta el precio en esos niveles en lugar de perseguir el rebote, y dejá que la estructura confirme el próximo movimiento. Esto no es asesoramiento financiero, así que gestioná tu riesgo en consecuencia. #IMPACTbyTrade$ETHUSDT
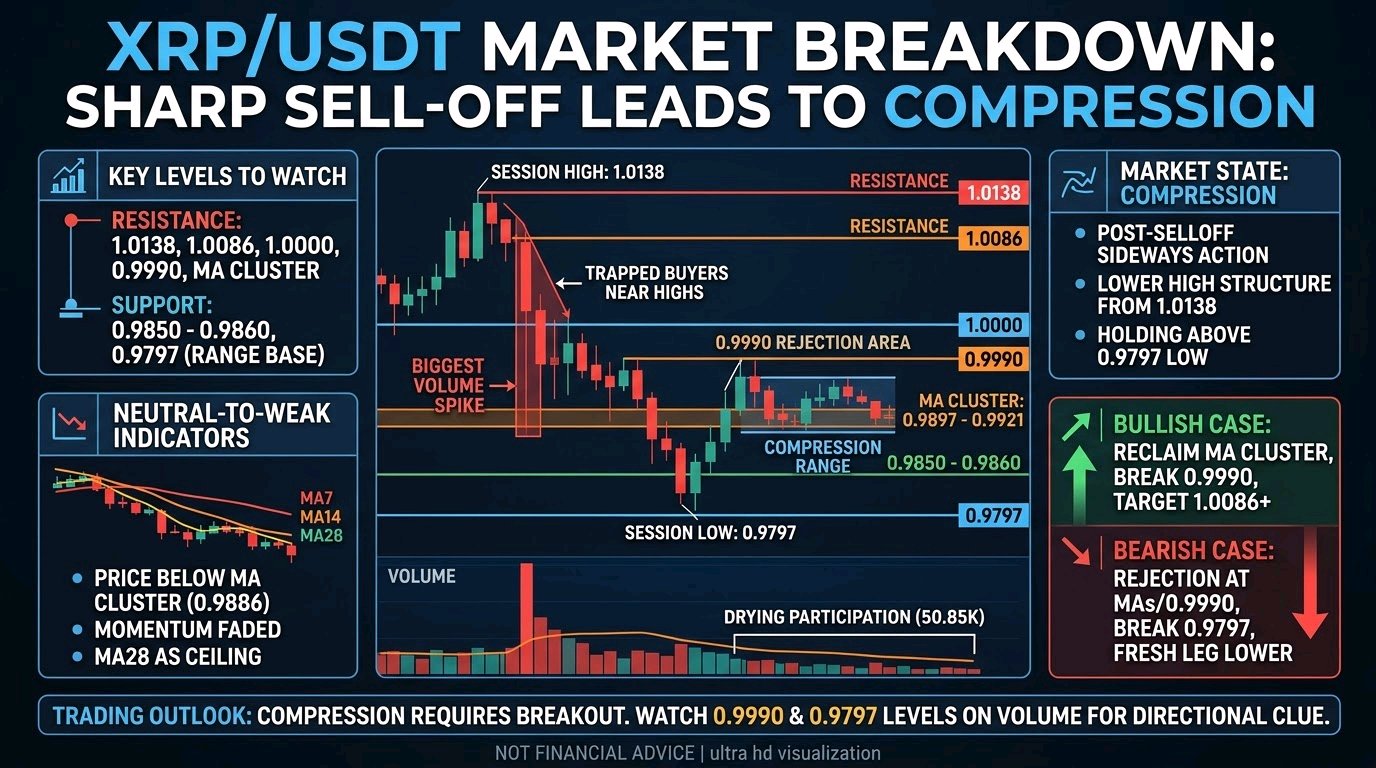
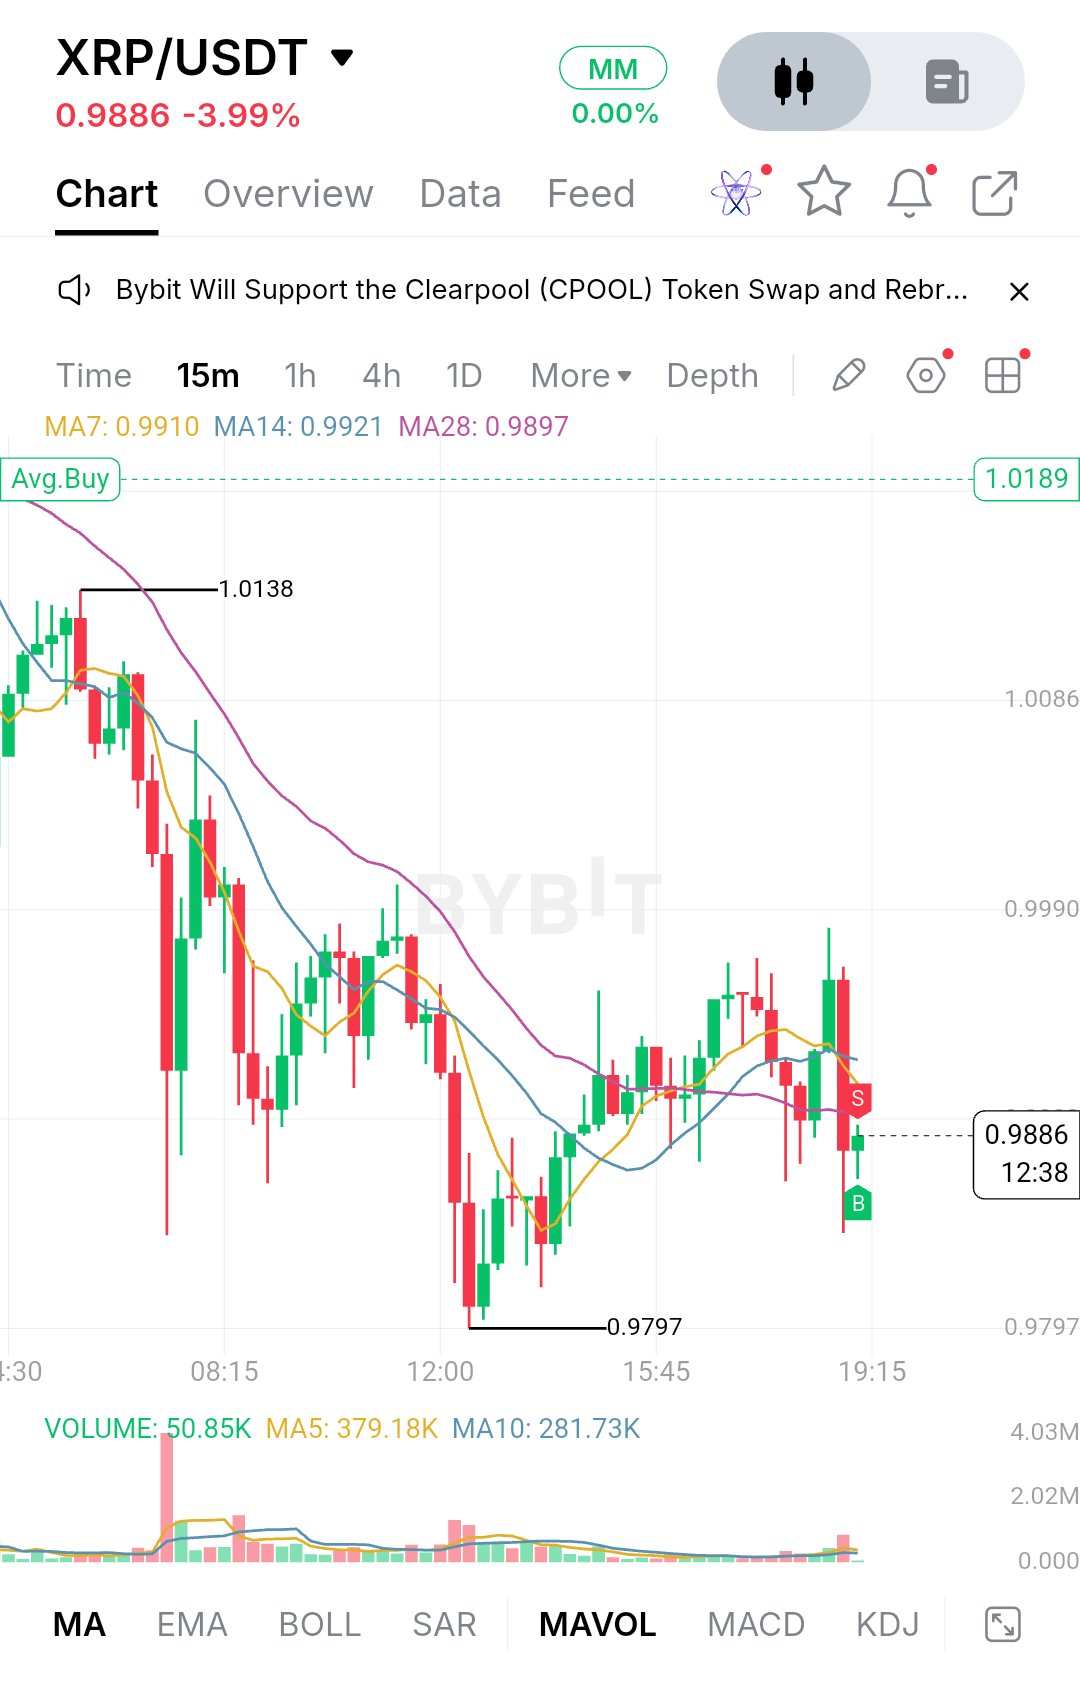
$XRPUSDT cotiza a 0,9886, con una baja del 3,99% en el día. El movimiento no fue gradual. Los compradores empujaron el precio hasta el máximo de 1,0138 al principio de la sesión, y los vendedores aparecieron justo ahí. Lo que siguió fue una secuencia de velas rojas pesadas, con la barra de volumen más grande de todo el gráfico apareciendo en medio de esa caída. Ese tipo de pico suele significar que un bando fue tomado por sorpresa, y en este caso fueron los compradores que entraron tarde cerca de los máximos. Después de la limpieza, XRP nunca recuperó realmente el terreno perdido. Rebotó hacia la zona de 0,9990, se estancó, volvió a caer y marcó un mínimo de 0,9797 alrededor del mediodía. Desde entonces, el precio se ha mantenido en un rango estrecho, con los vendedores limitando cada subida por debajo de 1,0000 y los compradores defendiendo la parte baja. La estructura es una secuencia de máximos decrecientes desde 1,0138 hasta los máximos por debajo de 1,0000 de las últimas horas, mientras que las caídas recientes se han mantenido por encima del mínimo de 0,9797. Es un mercado en compresión, no en tendencia, y el volumen lo respalda: la última lectura es de 50,85K frente a una MA5 de 379,18K y una MA10 de 281,73K, por lo que la participación se ha secado muy por debajo de los promedios recientes. En los indicadores que puedo ver, el panorama es de neutral a ligeramente débil. La MA7 se sitúa en 0,9910, la MA14 en 0,9921 y la MA28 en 0,9897, y el precio de 0,9886 cotiza justo por debajo de las tres. Están muy juntas y aplanándose, lo que indica que el impulso se ha desvanecido en ambas direcciones. La MA28 fue el techo de movimiento lento durante toda la caída, y el hecho de que los promedios más cortos hayan subido hasta encontrarse con ella muestra cuánto se ha enfriado la presión vendedora. Aun así, que el precio esté por debajo del grupo significa que los vendedores mantienen la ventaja a corto plazo hasta que se demuestre lo contrario. Como soporte, la primera zona es el área de 0,9850 a 0,9860, donde la última mecha encontró compradores. Por debajo de eso, 0,9797 es el nivel que más importa, porque es el mínimo de la sesión y la base de todo el rango. Si los compradores siguen defendiéndolo, el rango se mantiene y un rebote se vuelve más probable. Una ruptura clara por debajo, especialmente con volumen creciente, eliminaría el piso y abriría la puerta a un nuevo tramo a la baja, ya que no hay una estructura visible debajo en este gráfico. La resistencia comienza en el grupo de medias móviles alrededor de 0,9897 a 0,9921, que el precio necesita recuperar primero. Por encima de eso, 0,9990 es el nivel clave. Se alinea con los recientes máximos de rechazo y se sitúa justo por debajo de la marca psicológica de 1,0000. Si XRP supera 1,0000, la siguiente referencia es 1,0086, seguida por el máximo de la sesión de 1,0138. El marcador Avg.Buy en 1,0189 está por encima de todo eso, por lo que solo entraría en juego después de una recuperación total. El caso alcista es sencillo. Los compradores necesitan empujar el precio por encima del grupo de MA, mantenerlo ahí y luego romper 0,9990 con volumen real detrás. Un movimiento así revertiría la estructura de máximos decrecientes y haría que 1,0000 y 1,0086 sean objetivos realistas. Sin embargo, sin un aumento en el volumen, cualquier impulso al alza corre el riesgo de ser otro rechazo. El caso bajista comienza con el precio fallando en el grupo de MA o en 0,9990 y cayendo de nuevo. Eso extendería el patrón de máximos decrecientes y volvería a poner bajo presión a 0,9850. Si eso cede y se rompe 0,9797, el rango quedaría invalidado y los vendedores probablemente tomarían el control de la estructura a corto plazo. Niveles clave de precio: - Resistencia: 0,9897 a 0,9921 (grupo de MA), 0,9990, 1,0000, 1,0086, 1,0138 - Soporte: 0,9850 a 0,9860, 0,9797 - Invalidación del rango: un cierre por debajo de 0,9797 con un volumen fuerte XRP está en compresión después de una fuerte venta, y la compresión tiende a resolverse con un movimiento decisivo. En lugar de perseguir la siguiente vela, observá cómo se comporta el precio alrededor de 0,9990 al alza y 0,9797 a la baja, y prestá atención a si el volumen regresa cuando llegue allí. La ruptura, no el rebote, te dirá qué bando tiene el control. Nada de esto es una predicción, solo un mapa de dónde es probable que comience la próxima expansión. #IMPACTbyTrade$BTCUSDT
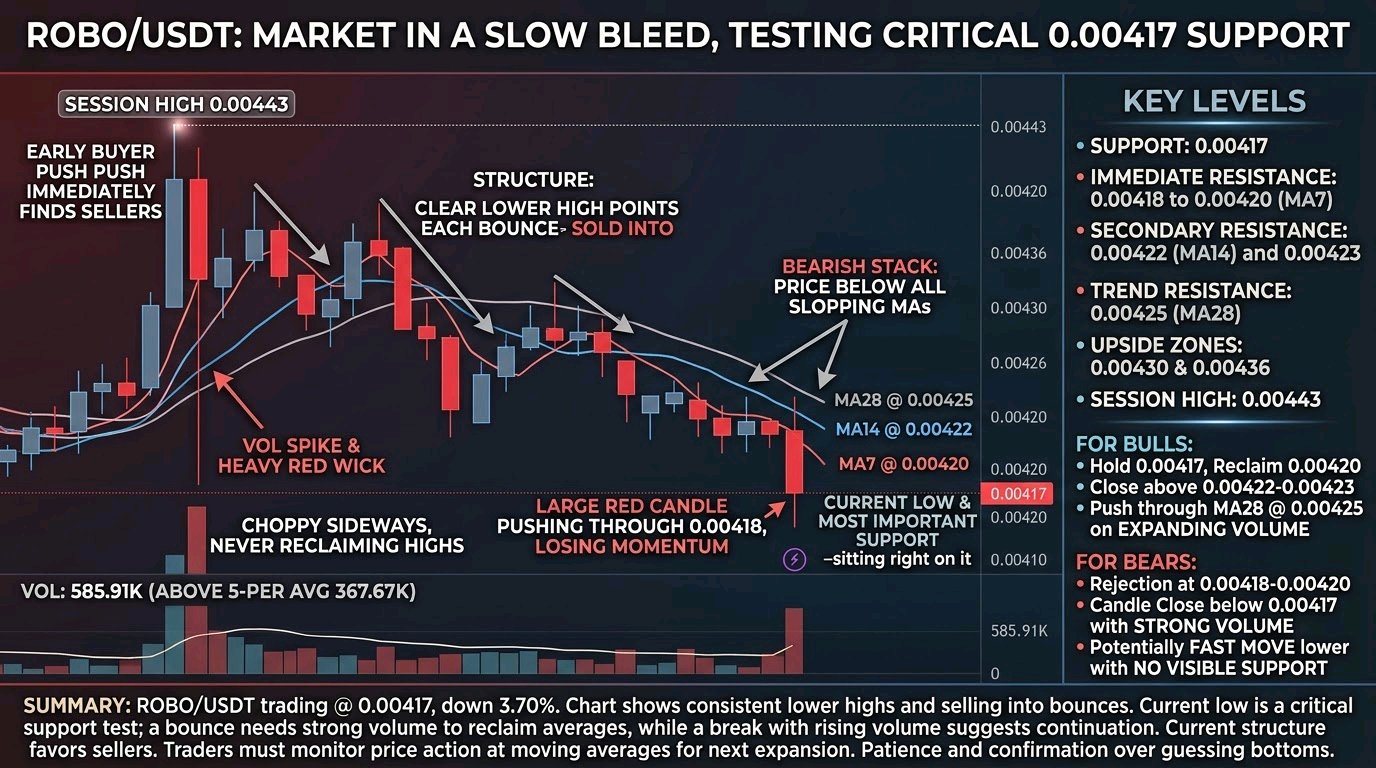
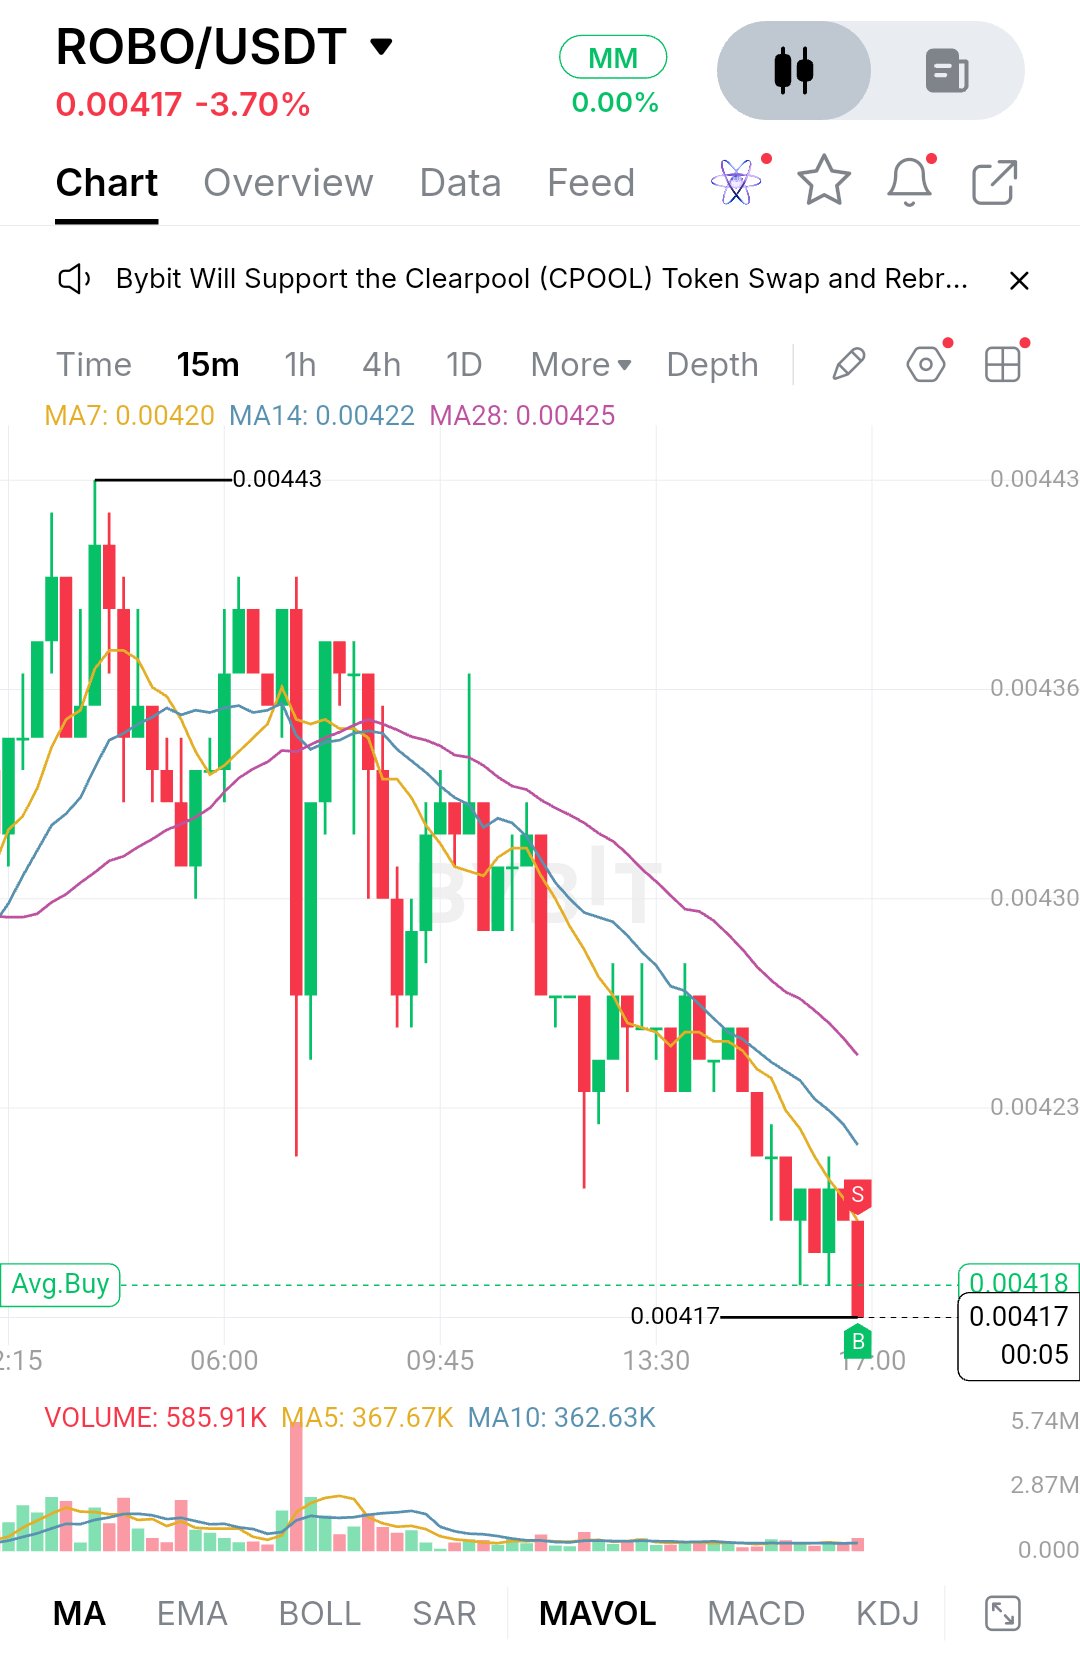
ROBOUSDT cotiza a 0.00417, con una baja del 3.70% en el día, y la sesión ha sido un desangrado lento. El precio comenzó el día cerca del máximo de 0.00443, donde los compradores empujaron hacia la resistencia y los vendedores aparecieron de inmediato. Desde entonces, el gráfico ha trazado una serie constante de máximos más bajos, y cada rebote fue aprovechado para vender en lugar de extenderse. La estructura cuenta gran parte de la historia. Después del empujón inicial a 0.00443, una vela roja pesada con una mecha larga arrastró el precio hacia abajo bruscamente, y el volumen se disparó en ese momento. El mercado recuperó parte de ese movimiento y se movió lateralmente durante un rato, pero los compradores nunca recuperaron los máximos. Desde la mitad de la sesión en adelante, el precio ha bajado en pequeñas oleadas, y la última vela es una roja grande que atraviesa directamente la consolidación reciente cerca de 0.00418. Este es un mercado que está perdiendo impulso, no uno que esté construyendo una base. Las medias móviles lo confirman. La MA7 se sitúa en 0.00420, la MA14 en 0.00422 y la MA28 en 0.00425, apiladas en orden bajista con el precio por debajo de las tres y cada línea con pendiente descendente. Las medias más rápidas han cruzado por debajo de la más lenta y están presionando el precio. El volumen muestra el mismo patrón. El gran pico anterior en la sesión se ha desvanecido hacia un trading tranquilo, y la lectura actual de 585.91K está por encima de su promedio de 5 periodos de 367.67K, por lo que la venta masiva más reciente viene con más participación que la deriva reciente. El soporte más importante es el mínimo actual en 0.00417. El precio está sentado justo ahí, y no hay otro nivel probado visible debajo, por lo que una ruptura limpia dejaría al gráfico sin una referencia obvia hasta que aparezcan los compradores. Mantenerse aquí al menos mantendría al mercado en una molienda lenta, mientras que una ruptura con volumen creciente sugeriría que la venta masiva se está extendiendo. Al alza, 0.00418 a 0.00420 es la primera resistencia, donde el rango roto y la MA7 se superponen. Por encima de eso, la MA14 en 0.00422 y el nivel 0.00423 forman un segundo obstáculo, seguido por la MA28 en 0.00425. Las zonas más grandes son 0.00430 y 0.00436, con el máximo de la sesión en 0.00443 como objetivo final. Para que los toros cambien el panorama, necesitan mantener 0.00417, recuperar 0.00420 y luego cerrar por encima de la zona de 0.00422 a 0.00423. Más allá de eso, un empujón a través de la MA28 en 0.00425 sería la primera señal de que la secuencia de máximos más bajos está terminando. El volumen debería expandirse en el camino hacia arriba, porque los rebotes recientes han sido débiles. Si los vendedores mantienen el control, un rechazo en 0.00418 a 0.00420 seguido de otra pierna hacia abajo es el camino más probable. Un cierre de vela por debajo de 0.00417 con un volumen fuerte confirmaría la ruptura, y sin soporte visible debajo, el movimiento podría ser rápido. Nada de esto está garantizado, pero la estructura actual favorece a los vendedores hasta que se demuestre lo contrario. Niveles de precio clave: - Soporte: 0.00417 - Resistencia inmediata: 0.00418 a 0.00420 (MA7 en 0.00420) - Resistencia secundaria: 0.00422 (MA14) y 0.00423 - Resistencia de tendencia: 0.00425 (MA28) - Zonas al alza: 0.00430 y 0.00436 - Máximo de la sesión: 0.00443 Al final, esta es una prueba de si 0.00417 puede aguantar. Un rebote que recupere rápidamente 0.00420 con un volumen sólido sería la primera señal constructiva, mientras que una ruptura a la baja con volumen creciente mantendría la tendencia apuntando hacia abajo. Los traders deberían observar cómo se comporta el precio alrededor de las medias móviles, porque la próxima expansión probablemente comenzará desde ahí. Hasta entonces, la paciencia y la confirmación importan más que adivinar el suelo. #IMPACTbyTrade$GRAMUSDT
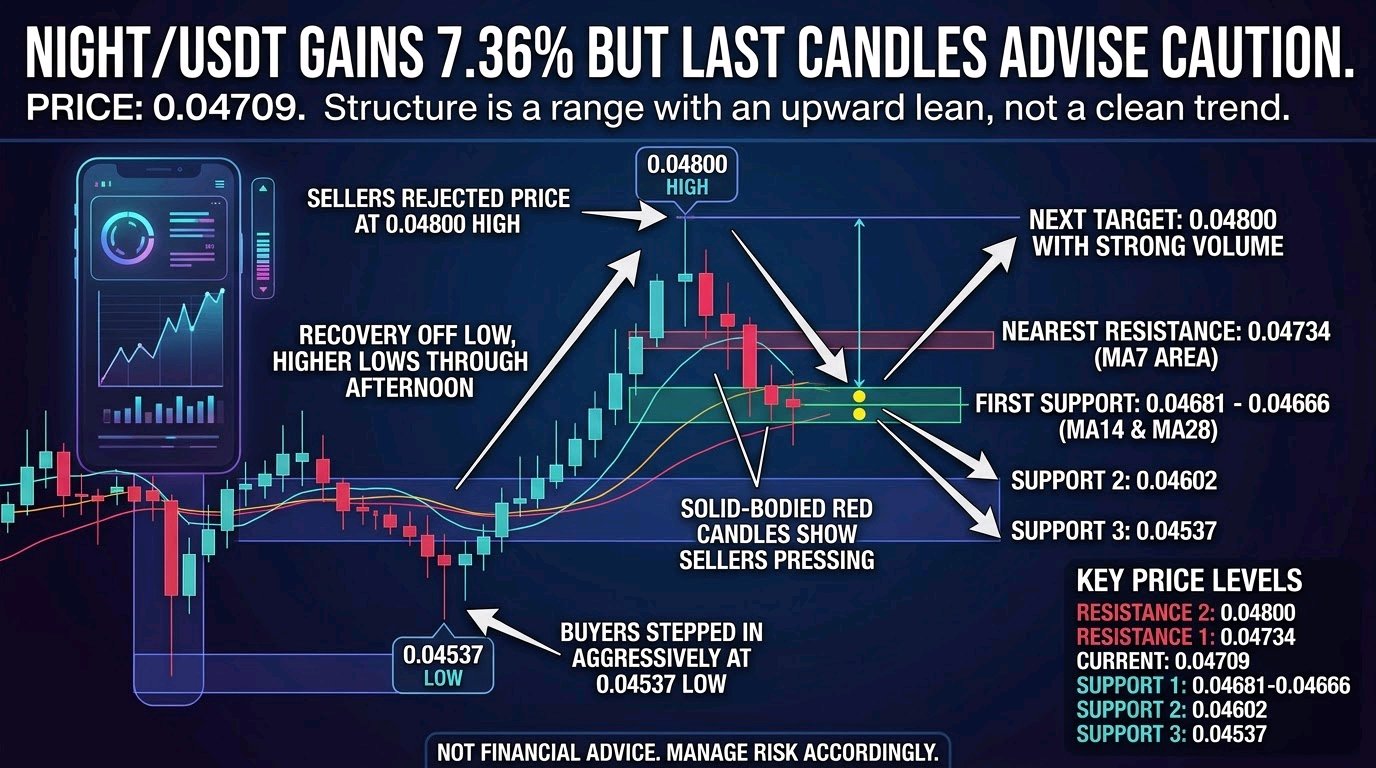
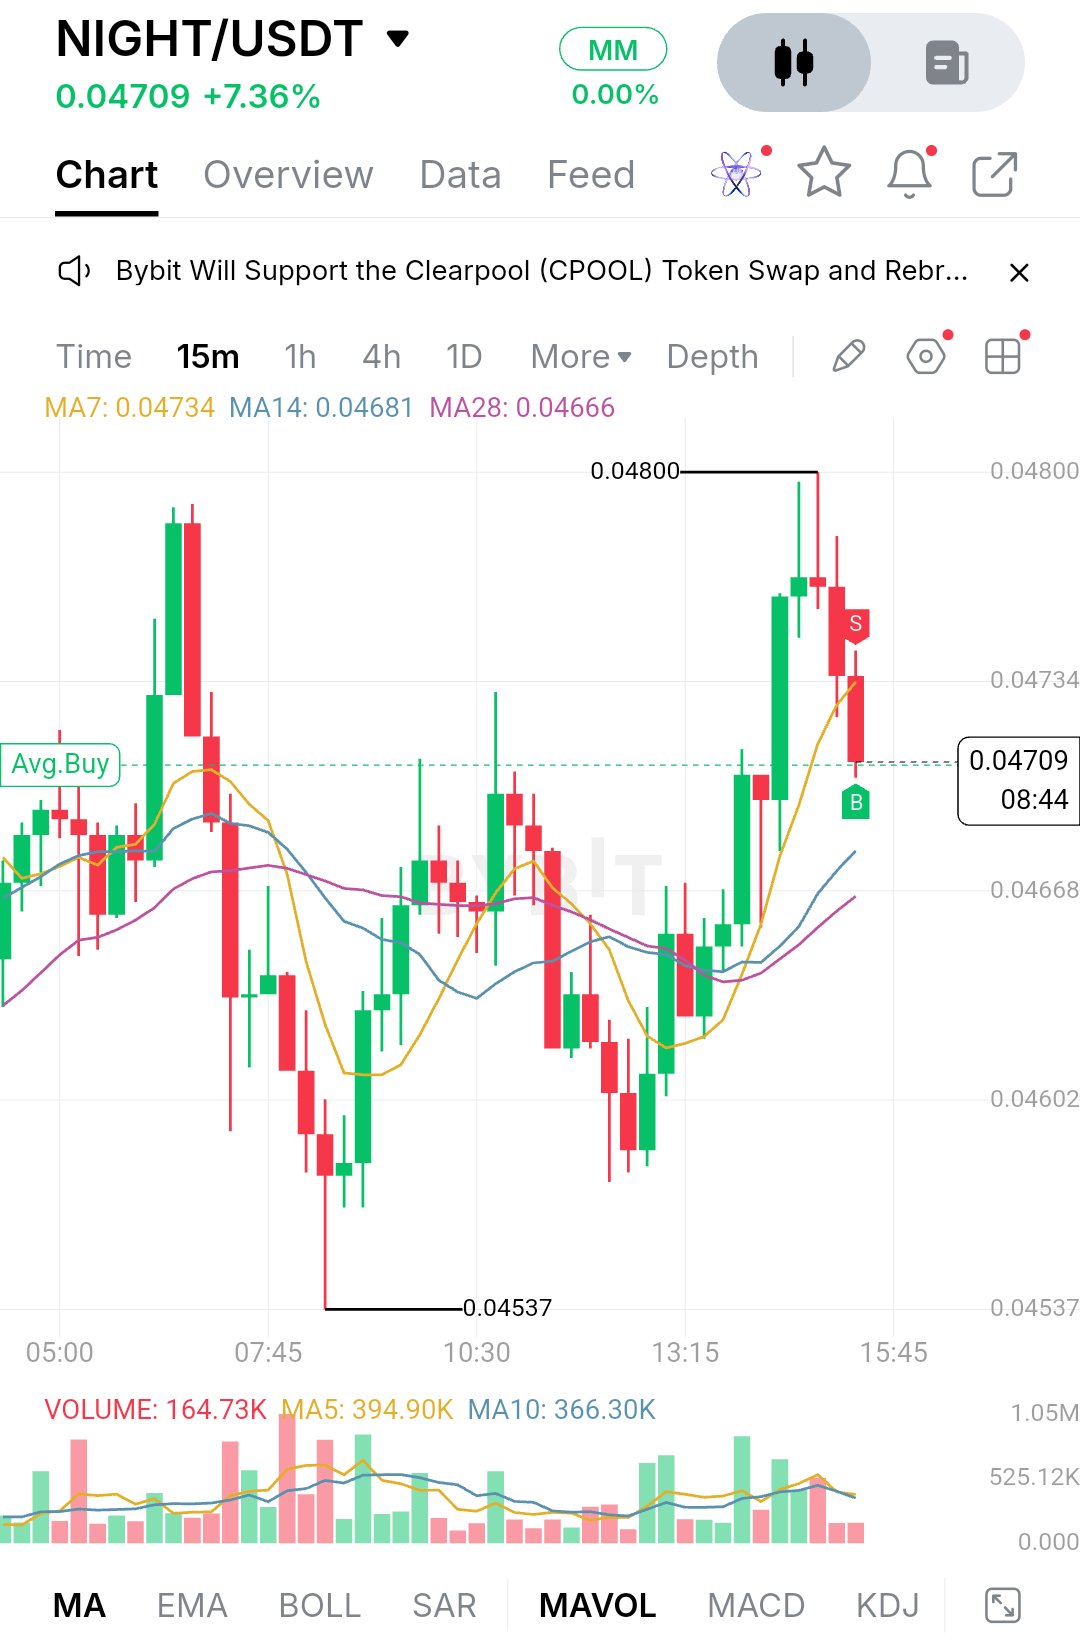
$NIGHTUSDT está cotizando a 0.04709, subiendo un 7.36% en el día, pero las últimas velas cuentan una historia más cautelosa que la cifra principal.** El precio pasó el comienzo de la sesión rebotando entre 0.0465 y 0.0472, luego cayó fuerte hasta el mínimo de 0.04537 justo antes de la zona de las 08:00. Esa vela dejó una mecha inferior larga, lo que demuestra que los compradores entraron agresivamente en ese nivel. A partir de ahí, NIGHT se recuperó lentamente durante la mitad de la sesión, y un empuje más fuerte después de las 13:00 lo llevó al máximo de 0.04800. Los vendedores respondieron de inmediato. La vela en la parte superior tiene una mecha superior larga y un cuerpo pequeño, y las velas rojas desde entonces han hecho retroceder el precio al área actual. La estructura es un rango con inclinación alcista, no una tendencia clara. La banda de 0.04537 a 0.04800 ha contenido casi todo hoy, y el mercado ya probó ambos extremos. La recuperación desde el mínimo fue constructiva, con mínimos más altos formándose durante la tarde, pero el rechazo en la parte superior muestra que el impulso se enfrió. Las últimas velas rojas también tienen cuerpo sólido, lo que sugiere que los vendedores están presionando en lugar de solo tomar ganancias. Respecto a las medias móviles, la MA7 se sitúa en 0.04734, la MA14 en 0.04681 y la MA28 en 0.04666. El precio ahora está por debajo de la MA7 rápida, aunque sigue por encima de ambas medias más lentas. Eso es una pérdida de impulso a corto plazo dentro de una recuperación más grande, no un cambio de tendencia completo. Las MAs también están apiladas en un orden alcista e inclinadas hacia arriba, con las más lentas abriéndose desde el tramo plano anterior. El volumen es el punto débil. La última barra marca 164.73K frente a una MA5 de 394.90K y una MA10 de 366.30K, por lo que el retroceso actual está ocurriendo con poca participación. Eso tiene dos caras. Un volumen de venta ligero significa que la caída aún no es agresiva, pero los intentos de rebote también han carecido de convicción. Para el soporte, la primera área a observar es de 0.04681 a 0.04666, donde se agrupan la MA14 y la MA28. Esta es la zona que probablemente decida si la tendencia alcista de la tarde sobrevive. Debajo de eso, 0.04668 en el eje de precios se alinea de cerca, lo que agrega peso. Si los compradores lo defienden con un aumento visible de volumen, la estructura de mínimos más altos se mantiene intacta. Una pérdida clara pondría en juego los 0.04602, y por debajo de eso, el piso real es el mínimo de la sesión en 0.04537. Un quiebre allí borraría toda la recuperación. Al alza, la resistencia más cercana es la MA7 cerca de 0.04734, que el precio necesita recuperar primero. Por encima de eso, 0.04800 es el nivel que importa, ya que es el máximo de la sesión y el punto donde los vendedores aparecieron con fuerza. La cifra redonda justo por encima puede actuar como un imán psicológico, pero solo un cierre por encima de 0.04800 con volumen fuerte lo convertiría en un objetivo real. El caso alcista es simple. Los compradores necesitan mantener la zona MA14/MA28, empujar de nuevo por encima de la MA7 en 0.04734, y luego desafiar los 0.04800 con un volumen muy por encima del nivel MA5 de 394.90K. Un cierre por encima de ese máximo rompería el rango y abriría espacio para la continuación. El caso bajista comienza con otro rechazo cerca de 0.04734 a 0.04800, seguido de un quiebre por debajo de 0.04666. Eso cambiaría la recuperación de la tarde a una secuencia fallida de mínimos más altos y probablemente enviaría el precio de regreso hacia 0.04602, con 0.04537 como el riesgo mayor. **Niveles clave de precio** - Resistencia 2: 0.04800 (máximo de la sesión) - Resistencia 1: 0.04734 (área de MA7) - Precio actual: 0.04709 - Soporte 1: 0.04681 a 0.04666 (MA14 y MA28) - Soporte 2: 0.04602 - Soporte 3: 0.04537 (mínimo de la sesión) NIGHT está sentado en medio de su rango después de rechazar la parte superior, por lo que el próximo movimiento depende de cómo maneje el bolsillo entre 0.04666 y 0.04734. Un mantenimiento con volumen en aumento mantiene viva la configuración de expansión de rango. Una pérdida de las MAs más lentas dice que el rebote fue solo un swing dentro del rango. De cualquier manera, observá cómo reacciona el precio en esos niveles en lugar de perseguir el 7% del día, porque la próxima expansión saldrá de esa zona. Nada de esto es asesoramiento financiero, y los niveles pueden fallar, así que gestioná el riesgo en consecuencia. #IMPACTbyTrade$LTCUSDT
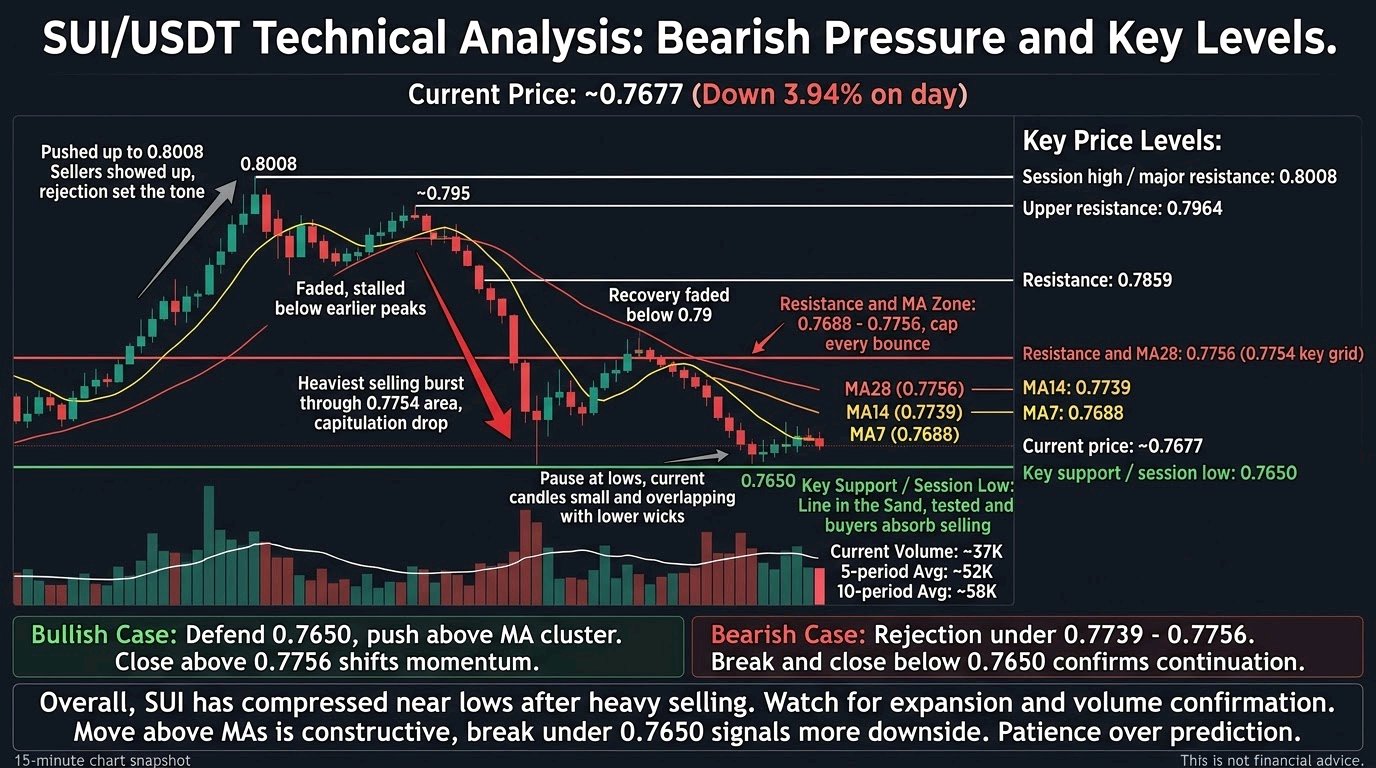
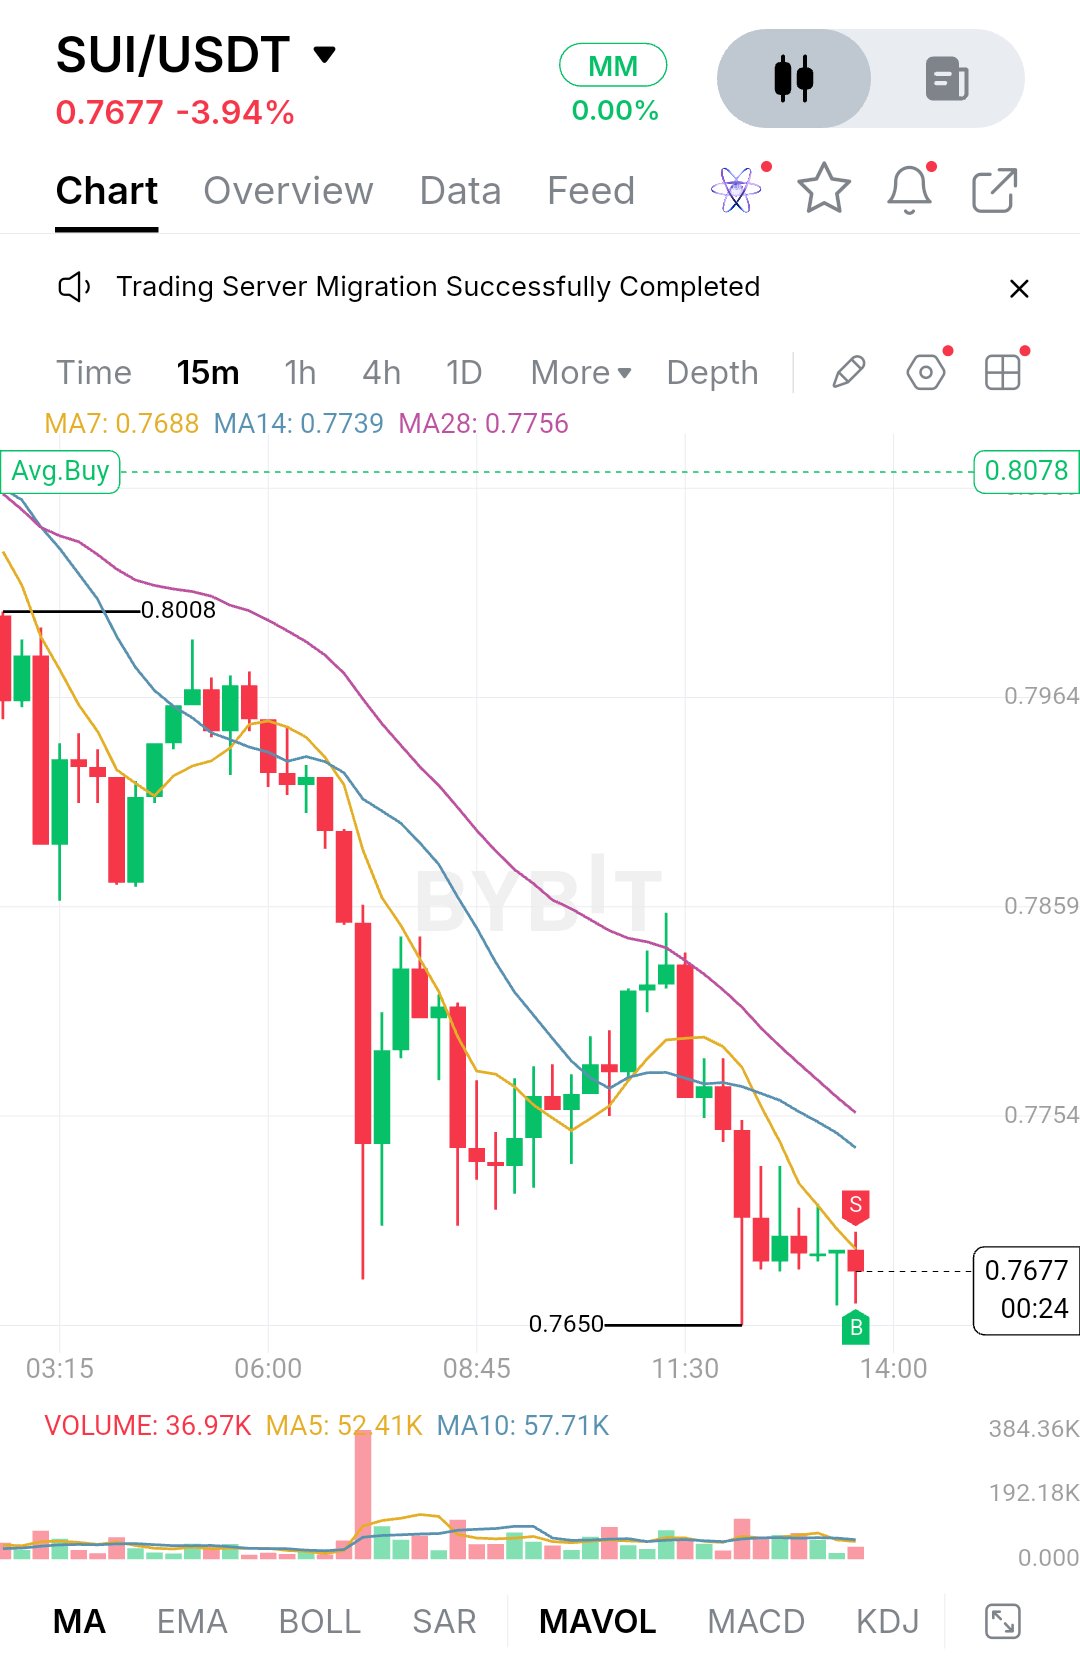
$SUIUSDT is trading around 0.7677, down 3.94% on the day, and the chart shows a market that has spent most of the session giving ground. Early on, price pushed up toward 0.8008, but sellers showed up there and the rejection set the tone. A bounce followed, but it stalled in the mid-0.79s and rolled over again. The heaviest selling came in a single burst of volume that pushed price down through the 0.7754 area in one move. Buyers stepped in afterward and rebuilt a recovery, but it faded below 0.79 and price slipped again into the session low at 0.7650. After that capitulation-style drop, the structure turned into a sequence of lower highs. The recovery into the late morning was real, but it topped out well below the earlier peaks and was sold into. The most recent candles around the lows are small and overlapping, with lower wicks showing some dip-buying, but nothing yet that looks like a decisive reversal. Right now it looks more like a pause at the lows than a base. Volume supports that reading: the current bar sits near 37K against a 5-period average of about 52K and a 10-period average of about 58K, so selling pressure has cooled, but buyers haven't shown up with conviction either. This screenshot is the 15-minute chart, and the only indicators on it are the moving averages (MA7, MA14 and MA28) and volume. There is no EMA200, RSI, MACD or Fibonacci tool visible, so I'm not going to quote values for those. What the chart does show is a clean bearish stack. MA7 sits at 0.7688, MA14 at 0.7739 and MA28 at 0.7756, all sloping down, with price at or below the fastest average. That tells me short-term momentum still belongs to sellers, and each bounce has been capped as it reached the slower averages. The market needs to reclaim and hold above them before the trend can be called improving. For support, the 0.7650 low is the line in the sand. It was tested and defended, with the lower wicks near it showing buyers willing to absorb selling there. If it holds on another retest, especially on shrinking volume, it can become the floor of a short-term range. A clean break below it would put the selling back in control, and with no obvious structure underneath on this view, price could move quickly. Failed support often leads to a fast flush, so I'd treat that level with respect. On the upside, the first hurdle is the cluster of MA7 and MA14 at 0.7688 to 0.7739, with MA28 just above at 0.7756. This zone also lines up with the 0.7754 area where the heavy sell-off began, so it should act as real overhead supply. Above it, the next reference levels are 0.7859 and 0.7964, with the session high at 0.8008 as the major ceiling. Round numbers like 0.80 tend to attract both profit-taking and fresh shorts, so I wouldn't expect it to break easily. The bullish case starts with buyers defending 0.7650 and then pushing price back above the short moving averages. A close above 0.7756, which clears all three averages, would be the first sign that momentum is shifting. From there, 0.7859 becomes the next target, then 0.7964 if volume expands on the move. Without a volume pickup, any bounce is more likely just another lower high. The bearish case is simpler. If price keeps getting rejected under 0.7739 to 0.7756 and rolls over again, sellers will likely try for another test of 0.7650. A break and close below that low would confirm continuation and invalidate the idea that this is a base. Weak bounces into falling averages are what trends usually look like before they extend. Key price levels: - Session high / major resistance: 0.8008 - Upper resistance: 0.7964 - Resistance: 0.7859 - Resistance and MA28: 0.7756 (0.7754 is the grid level where the sell-off began) - MA14: 0.7739 - MA7: 0.7688 - Current price: 0.7677 - Key support / session low: 0.7650 Overall, SUI has moved from a clear rejection at the highs to a heavy sell-off, a failed recovery and now a hesitant stall near the lows. The market is compressing, and compression usually resolves with an expansion. What I'd watch is whether the next push comes with real volume. A move above the moving average cluster would be the first constructive sign, and a break under 0.7650 would signal that the stall was only a pause before more downside. Until one of those happens, patience beats prediction. This is not financial advice, so manage your risk accordingly. #IMPACTbyTrade$BTCUSDT
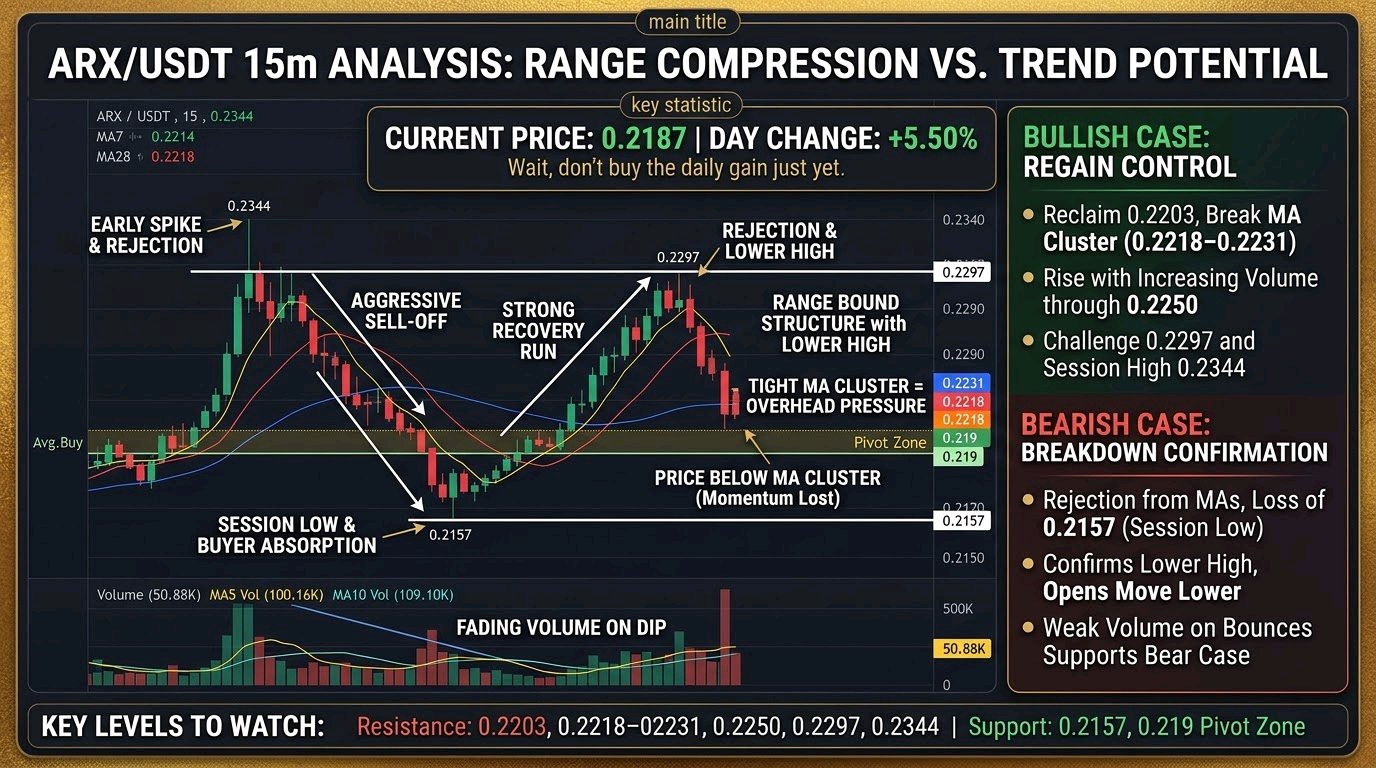
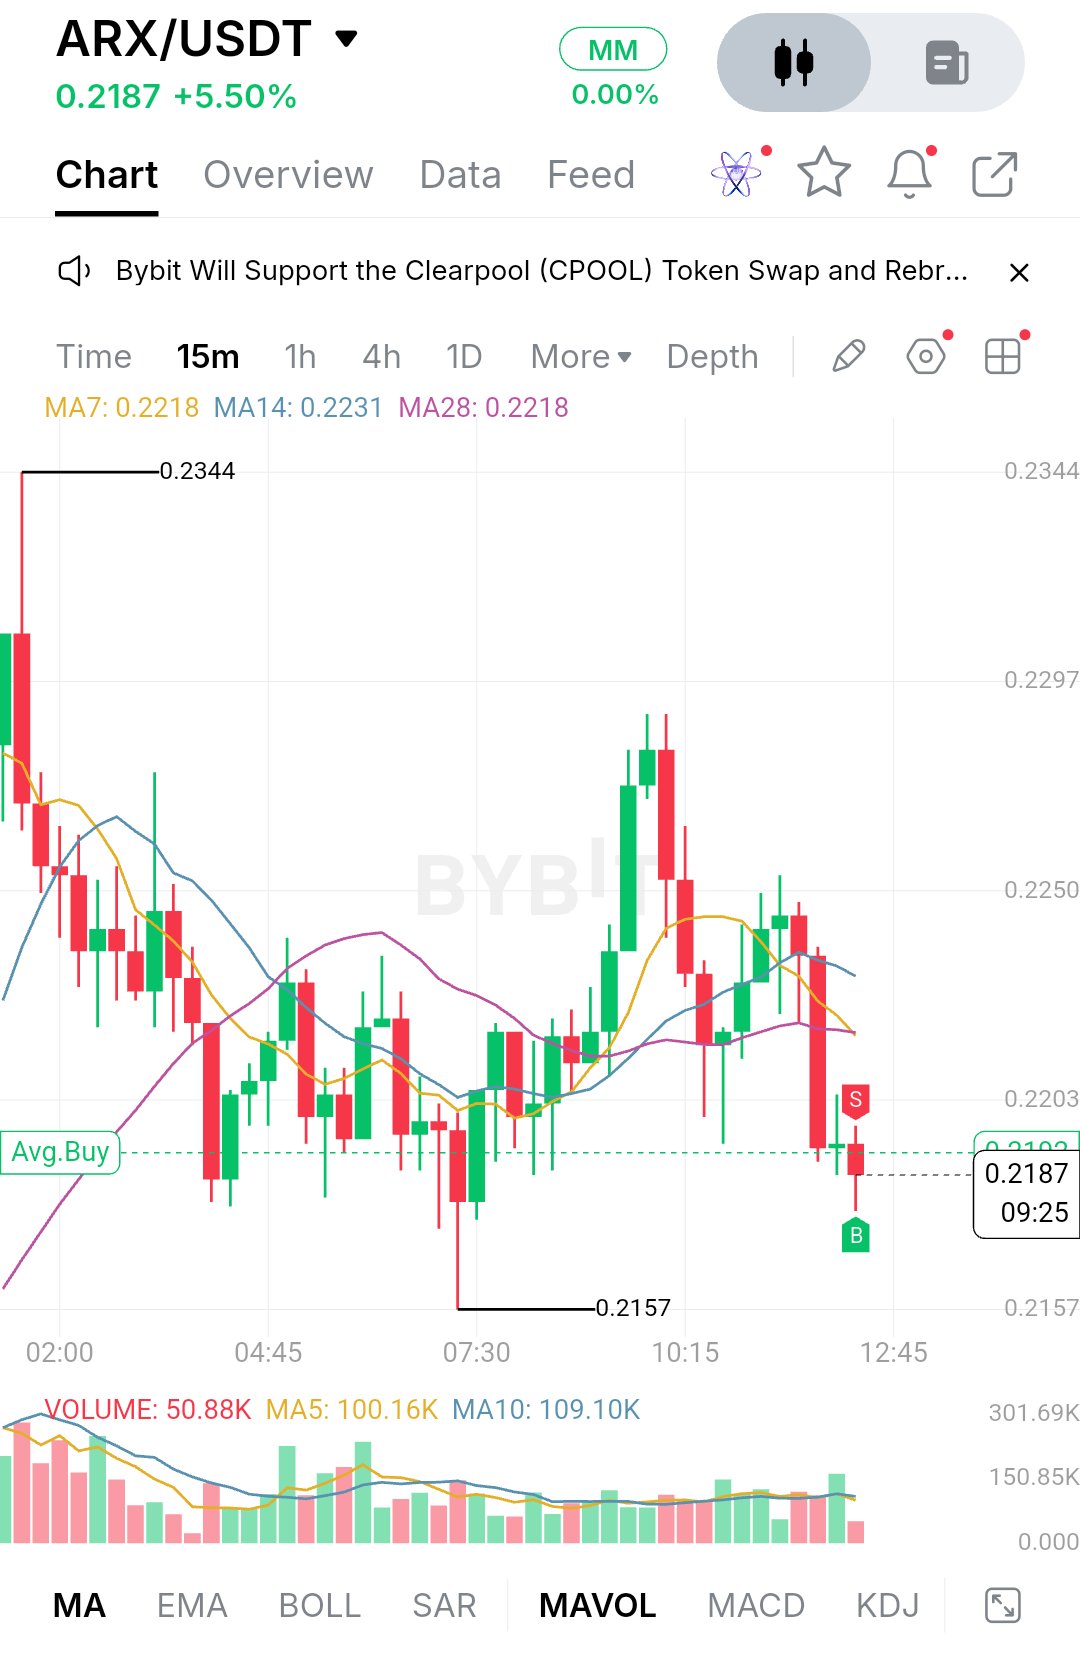
$ARXUSDT is trading at 0.2187, up 5.50% on the day, but the chart tells a more cautious story than that number suggests. Early in the visible session, price spiked to 0.2344 and was sold almost immediately. A tall red candle erased much of the move, and sellers stayed in control through the morning. That slide carried price down to 0.2157 around 07:30, where a long lower wick showed buyers stepping in and absorbing the selling. What followed was a real recovery. Price pushed back up through the mid-session and made a clean run toward the 0.2297 area around 10:15, with a few strong green candles. Sellers showed up again right there, and a large red candle took back most of that run. Since then price has drifted lower and now sits below all three moving averages, which tells me the bounce lost its momentum rather than failing outright. The structure right now is a range with a lower high. The market is bouncing between roughly 0.2157 and 0.2297, and the latest rejection came below the earlier peak. On the chart, MA7 sits at 0.2218, MA14 at 0.2231 and MA28 at 0.2218, so price is under a tight cluster that now acts as overhead pressure. The averages have also flattened and crossed each other repeatedly, which usually means the market lacks direction. Volume supports that read. The latest candle printed 50.88K against a 5-period average of 100.16K and a 10-period average of 109.10K, so the current dip is happening on fading participation, not aggressive selling. Price is also hovering around the Avg.Buy line near 0.219, which makes this a decision zone. The first support is 0.2157, the session low and the spot where buyers defended with that long wick. If it holds again, the range stays intact and a retest of the upper half becomes possible. If it breaks on strong volume, the structure turns into a lower low and the range stops being a useful reference. On the upside, the nearest resistance is 0.2203, followed by the moving average cluster between 0.2218 and 0.2231. Above that, 0.2250 is a clear horizontal level where price stalled several times, then 0.2297, the top of the recovery, and finally 0.2344, the session high. For the bulls, the first job is reclaiming 0.2203 and holding it, then closing back above the 0.2218 to 0.2231 cluster. A move through 0.2250 with rising volume would show buyers are regaining control, and 0.2297 would become the next test. A break above that would put 0.2344 back in play. For the bears, a rejection from the moving average cluster followed by a loss of 0.2157 would confirm the lower-high structure and likely open a move below the session low. Weak volume on bounces would add to that case. Key price levels: - Resistance: 0.2203, 0.2218 to 0.2231 (moving average cluster), 0.2250, 0.2297, 0.2344 - Support: 0.2157 (session low), Avg.Buy zone near 0.219 as the pivot - Volume reference: 5-period average 100.16K, 10-period average 109.10K Overall, ARX is compressed between a defended low and a rejected high, and the daily gain matters less than how price behaves at either edge. Watch whether volume returns on a move through the moving averages or on a retest of 0.2157. Whichever side breaks with real participation will likely set the direction of the next expansion. None of this is a guarantee, so keep risk defined around those levels. One note: this screenshot is the 15-minute chart, and it only shows MA7/14/28, volume with MA5/MA10, and the Avg.Buy line. EMA200, RSI, MACD and Fibonacci levels aren't visible, so I left them out instead of inventing values. If you send the 1-hour chart with those indicators on, I can add them in. #IMPACTbyTrade
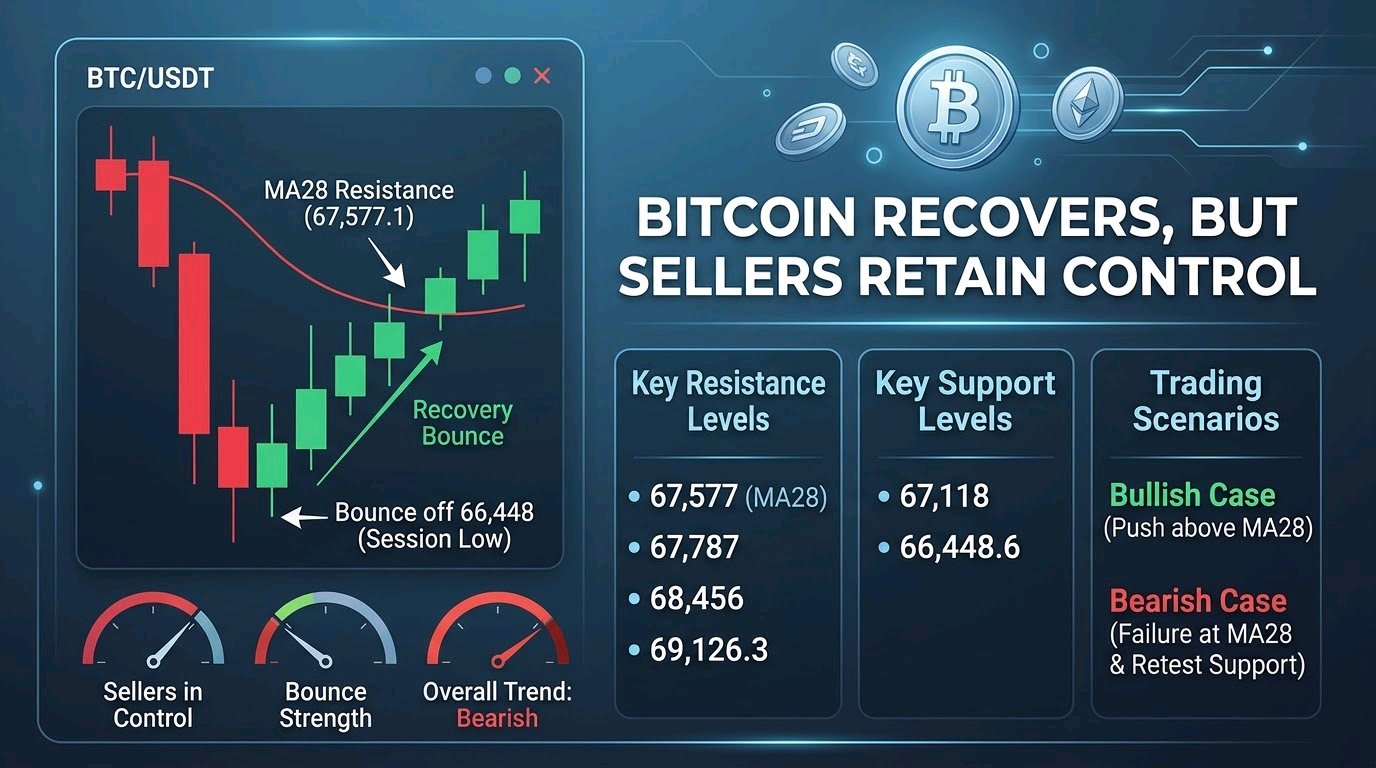
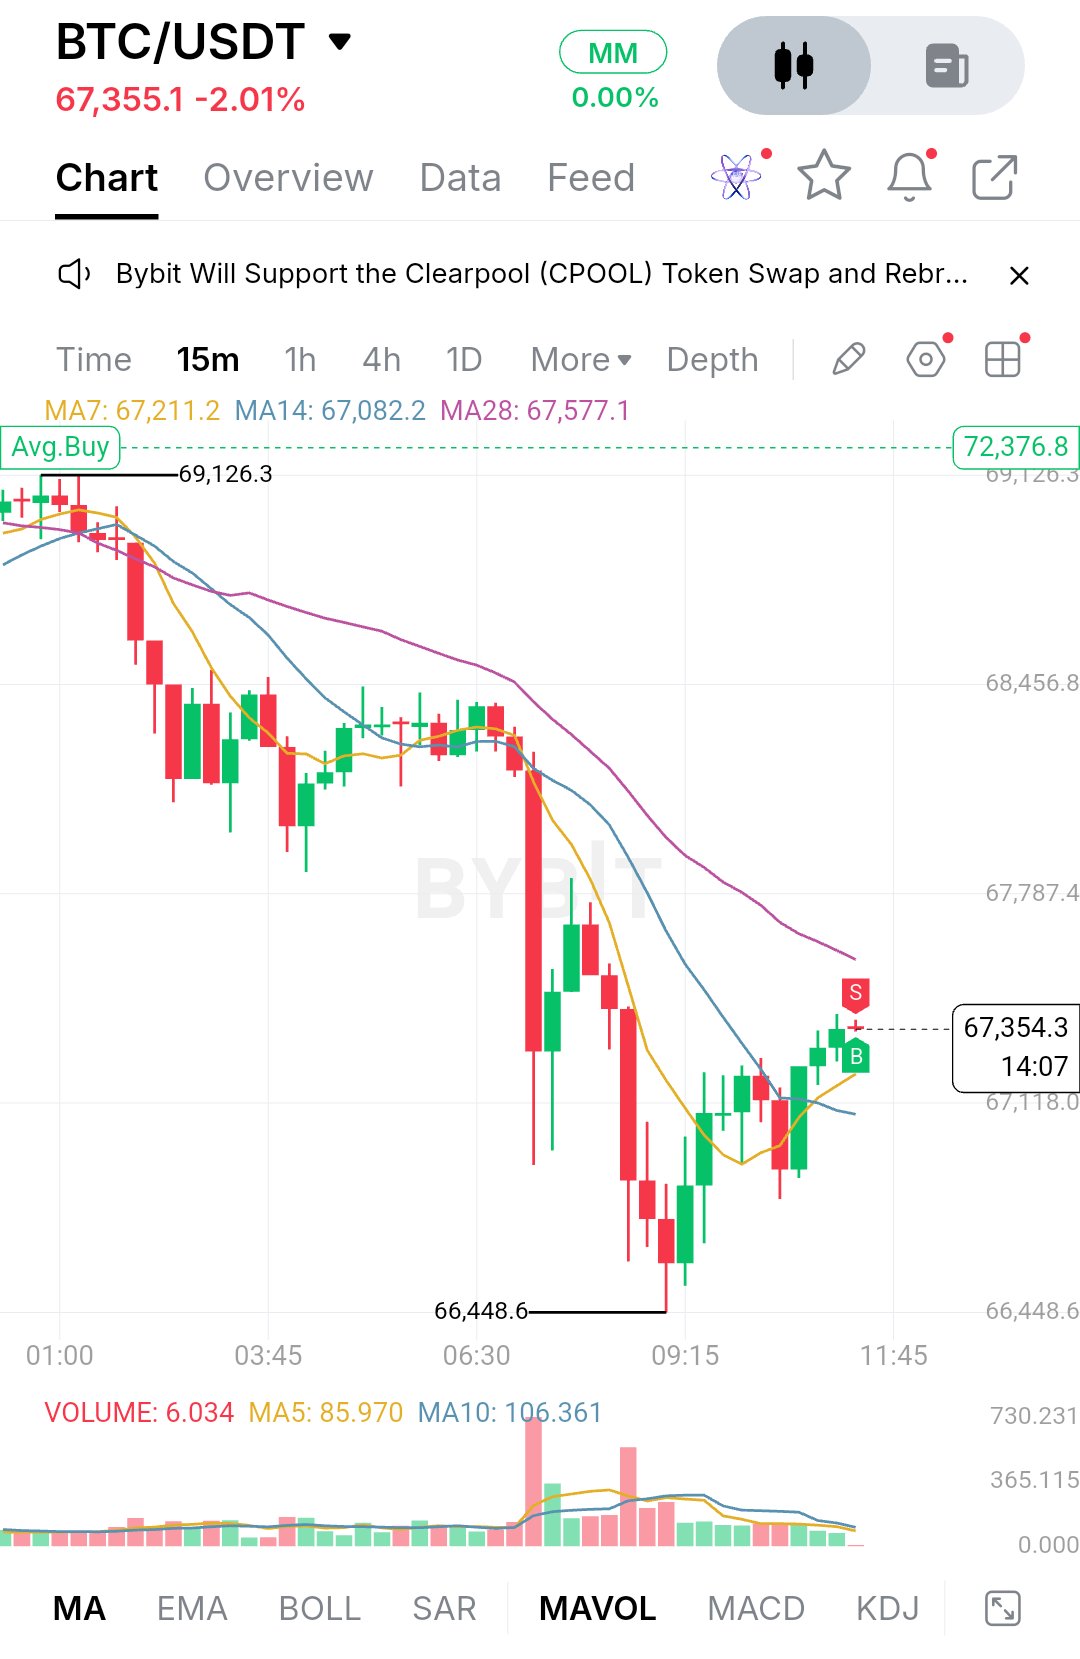
$BTCUSDT Analysis: Bitcoin Bounces Off 66,448, But Sellers Still Control the Bigger Picture** Bitcoin is trading around 67,355 and is down about 2.01% on the day. The session started with price pressing against the 69,126 area, but buyers could not hold it, and sellers took over from there. The decline came in two waves. The first was a steady grind lower through the early hours. The second was a sharp, high-volume flush that took price down to the session low at 66,448.6. That second leg was the real damage, and the volume spike on it shows how aggressively sellers were stepping in. After that low, the character of the chart changed. Price stopped making fresh lows and printed a series of higher lows with green candles, climbing back above 67,300. This looks like a recovery bounce inside a broader downtrend, not yet a confirmed reversal. Selling pressure has eased, as volume has faded noticeably since the capitulation candles, but buyers have not shown a strong follow-through push either. The chart I have is the 15-minute timeframe, not the 1-hour, so I am working with the moving averages on screen: the MA7 at 67,211.2, the MA14 at 67,082.2 and the MA28 at 67,577.1. Price has reclaimed the MA7 and MA14, and both have started to flatten out, which is the first sign that downside momentum is cooling. The MA28 is the one still sloping down above price, and it has capped every attempt to recover since the morning breakdown. Until price closes above it, the short-term trend stays bearish. I am leaving out EMA200, RSI, MACD and Fibonacci because none of them appear on this chart, and I would rather not guess at readings I cannot see. On the downside, the first support sits around 67,118, which lines up closely with the MA14 and the recent pullback zone. If buyers defend this area, the higher-low structure stays intact and the bounce has room to develop. A loss of it would put the 66,448.6 low back in play. That low matters most because it is where the heavy selling got absorbed. A clean break below it, especially on rising volume, would suggest the earlier flush was only the start of a larger move down, and it would open the door to fresh lows. On the upside, the immediate hurdle is the MA28 near 67,577, followed by the 67,787 area, where price was rejected during the decline. Above that, 68,456 is the next meaningful resistance and the zone where the market broke down before the main sell-off. The major level overhead is 69,126.3, the session high. The 68,000 round number also deserves attention as a psychological level where sellers tend to show up. For the bullish case, buyers need to hold the 67,100 to 67,200 zone, push through the MA28, and then flip 67,787 into support. If that happens with volume picking up on the green candles, a move toward 68,456 becomes realistic, and a break above that would put the session high in view. For the bearish case, a rejection at the MA28 or 67,787 followed by a close back below 67,118 would show the bounce was only a relief rally. In that scenario, sellers would likely retest 66,448.6, and a break below it would shift the structure decisively lower. Key price levels: - Resistance: 67,577 (MA28), 67,787, 68,456, 69,126.3 - Support: 67,118, 66,448.6 (session low) - Moving averages: MA7 at 67,211.2, MA14 at 67,082.2, MA28 at 67,577.1 Overall, Bitcoin is in a recovery phase after a sharp, volume-driven sell-off, and the next move depends on how price behaves around the MA28 and 67,787. A clean breakout with expanding volume would signal that buyers are regaining control. Another failure there would suggest the market is still building a base or preparing for another leg lower. Watch how price reacts at those levels rather than chasing the bounce. This is not financial advice, so manage your risk accordingly. A note on the chart itself: it shows the 15-minute timeframe, so I could not do a 1-hour analysis, and EMA200, RSI, MACD and Fibonacci are not visible. If you send a 1-hour screenshot with those indicators on, I can rework the post around them. I also left out the green "Avg.Buy 72,376.8" line, since it looks like a personal position marker rather than a market level. #IMPACTbyTrade$ETHUSDT
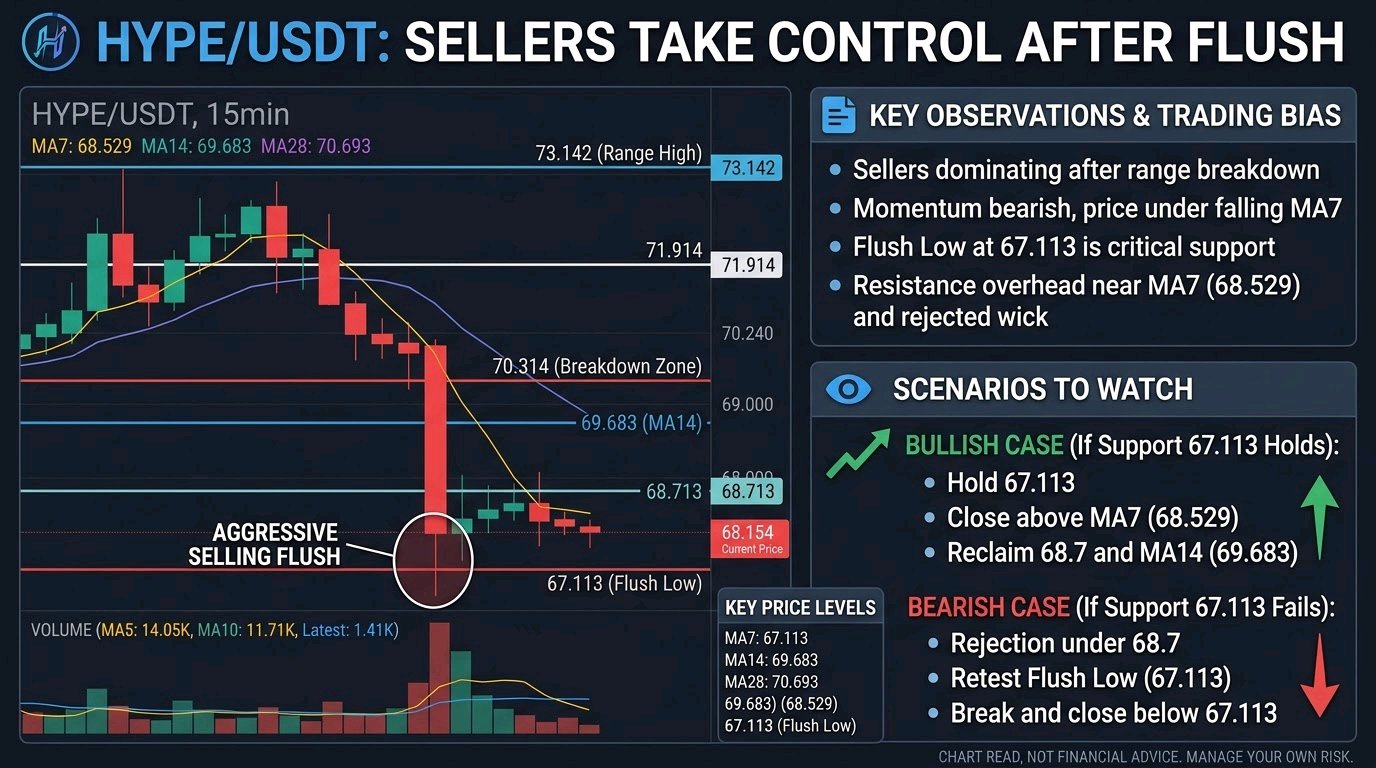
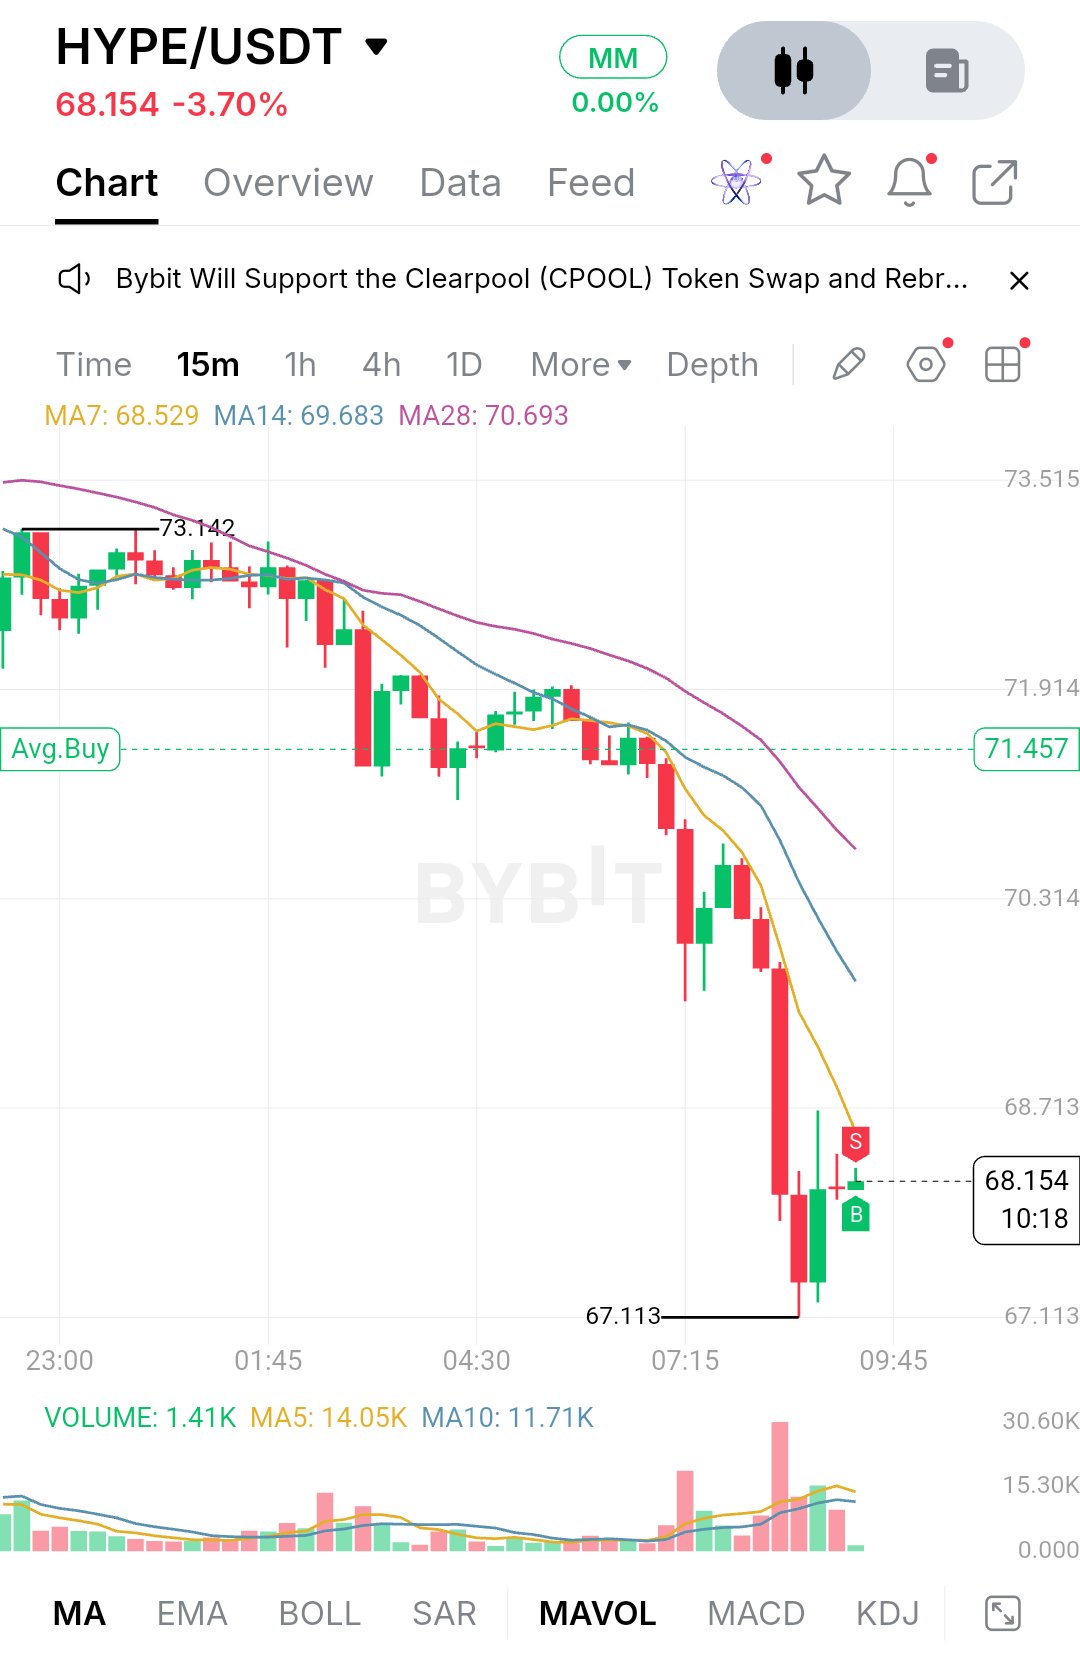
$HYPEUSDT cotiza a 68.154, con una baja del 3.70% en el día, y el gráfico cuenta una historia clara de los vendedores tomando el control.** Durante la mayor parte de la sesión anterior, el precio se mantuvo en una banda estrecha justo debajo del máximo de 73.142. Las velas eran pequeñas, las mechas iban en ambas direcciones y ninguno de los bandos se comprometió. Ese equilibrio se rompió cuando el precio cayó por debajo de la zona de 71.9. Los vendedores presionaron, el precio perdió la zona de 70.3 y el movimiento se aceleró en una fuerte barrida que terminó en 67.113. La venta más agresiva se produjo en la vela roja más grande de la caída, que también tuvo el pico de volumen más alto en el gráfico. Después de esa caída, el precio está tratando de estabilizarse. Estamos viendo un pequeño rebote desde los mínimos, una vela de mecha larga que empujó hacia la zona de 68.7 y fue vendida nuevamente, y una vela pequeña al precio actual. Eso parece vacilación, no una recuperación. Los compradores intervinieron en 67.113, pero aún no han mostrado la fuerza para recuperar nada significativo. El volumen en la última vela es de solo 1.41K, muy por debajo del volumen de la MA5 en 14.05K y la MA10 en 11.71K, por lo que el mercado está tranquilo ahora mismo después de un movimiento muy fuerte. En el gráfico de 15 minutos, las medias móviles están alineadas de forma bajista. La MA7 se sitúa en 68.529, la MA14 en 69.683 y la MA28 en 70.693, con la más corta en la parte inferior y las tres con pendiente negativa. El precio cotiza actualmente justo por debajo de la MA7, lo que me indica que el impulso a corto plazo sigue perteneciendo a los vendedores. La brecha entre la MA7 y la MA28 es amplia, lo que generalmente significa que el precio está estirado. Eso puede llevar a un rebote técnico, pero un rebote contra una media descendente no es lo mismo que un cambio de tendencia. El primer soporte es 67.113, el mínimo de la caída. Es importante porque es el único nivel donde los compradores han defendido claramente hasta ahora. Si se mantiene en una nueva prueba con velas más pequeñas y un volumen de venta decreciente, podría convertirse en la base de un rango a corto plazo. Si se rompe, no hay estructura visible debajo en este gráfico, y el precio podría moverse rápidamente porque hay poco para frenarlo. Un rebote alrededor de 67.7 a 68.0 es donde esperaría que se pongan a prueba las primeras reacciones pequeñas. La resistencia comienza justo arriba, alrededor de 68.5 a 68.7, donde se encuentran la MA7 y la mecha rechazada. Por encima de eso, 68.713 es el siguiente nivel de la grilla y la MA14 se sitúa cerca de 69.7, así que esa zona es donde una recuperación tendrá que demostrar su validez. Luego viene 70.314, el área de ruptura, seguida por la MA28 cerca de 70.7 y 71.914. El máximo de 73.142 está muy lejos y solo importaría si toda la estructura cambiara. El escenario alcista comienza con los compradores manteniendo 67.113 y luego cerrando velas por encima de la MA7 y la zona de 68.7. Un movimiento a través de la MA14 alrededor de 69.7 mostraría una mejora real, y la zona de 70.3 a 70.7 se convertiría entonces en la prueba principal. Ahí es donde se rompió el rango anterior, por lo que es probable que los vendedores lo defiendan. Cualquier movimiento al alza tiene más credibilidad si el volumen comienza a aumentar en las velas verdes en lugar de desvanecerse. El escenario bajista es más simple. Si el precio sigue siendo rechazado por debajo de 68.7 y la MA7 se convierte en un techo, los vendedores mantienen el control y se vuelve probable otra prueba de 67.113. Una ruptura limpia y un cierre por debajo de ese nivel, especialmente con un volumen en aumento, abriría la puerta a una continuación a la baja sin soporte marcado en este gráfico. **Niveles clave de precio** - Resistencia: 73.142 (máximo del rango), 71.914, 70.693 (MA28), 70.314, 69.683 (MA14), 68.713 - Precio actual: 68.154, con la MA7 en 68.529 - Soporte: 67.113 (mínimo de la caída) En este momento el mercado está en pausa después de una caída impulsiva, no en una reversión confirmada. Lo que importa ahora es si 67.113 se mantiene y si el precio puede recuperar la zona de la MA7 y 68.7 con volumen real respaldando el movimiento. Una base estrecha seguida de un cierre decisivo por encima de esa área sería la primera señal de fortaleza, mientras que una pérdida de los mínimos sugeriría que la liquidación no ha terminado. Estén atentos a cómo se comporta el precio en esta compresión, porque la próxima expansión probablemente vendrá del lado que la rompa primero. Este es un análisis gráfico, no una recomendación financiera, y cada trader debe gestionar su propio riesgo. $IMPACTbyTrade$BTCUSDT
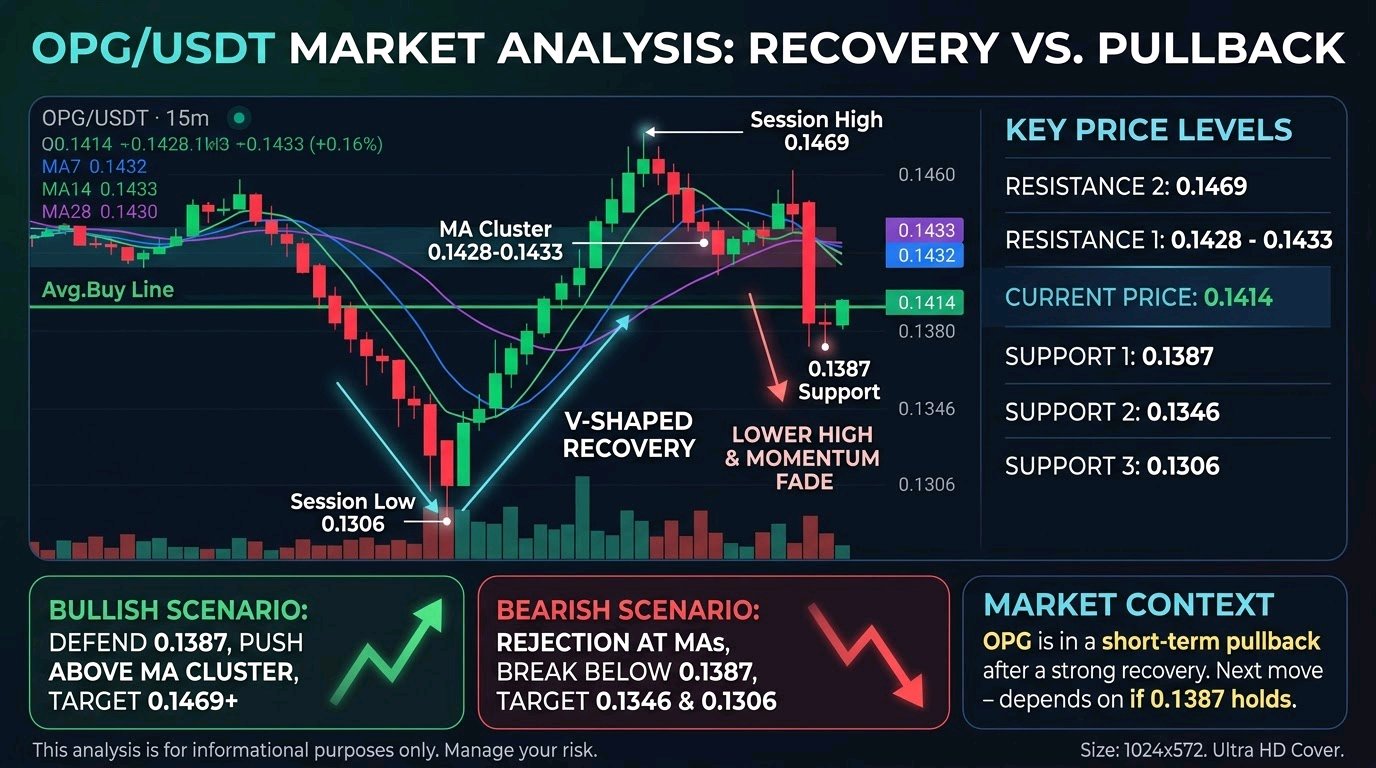
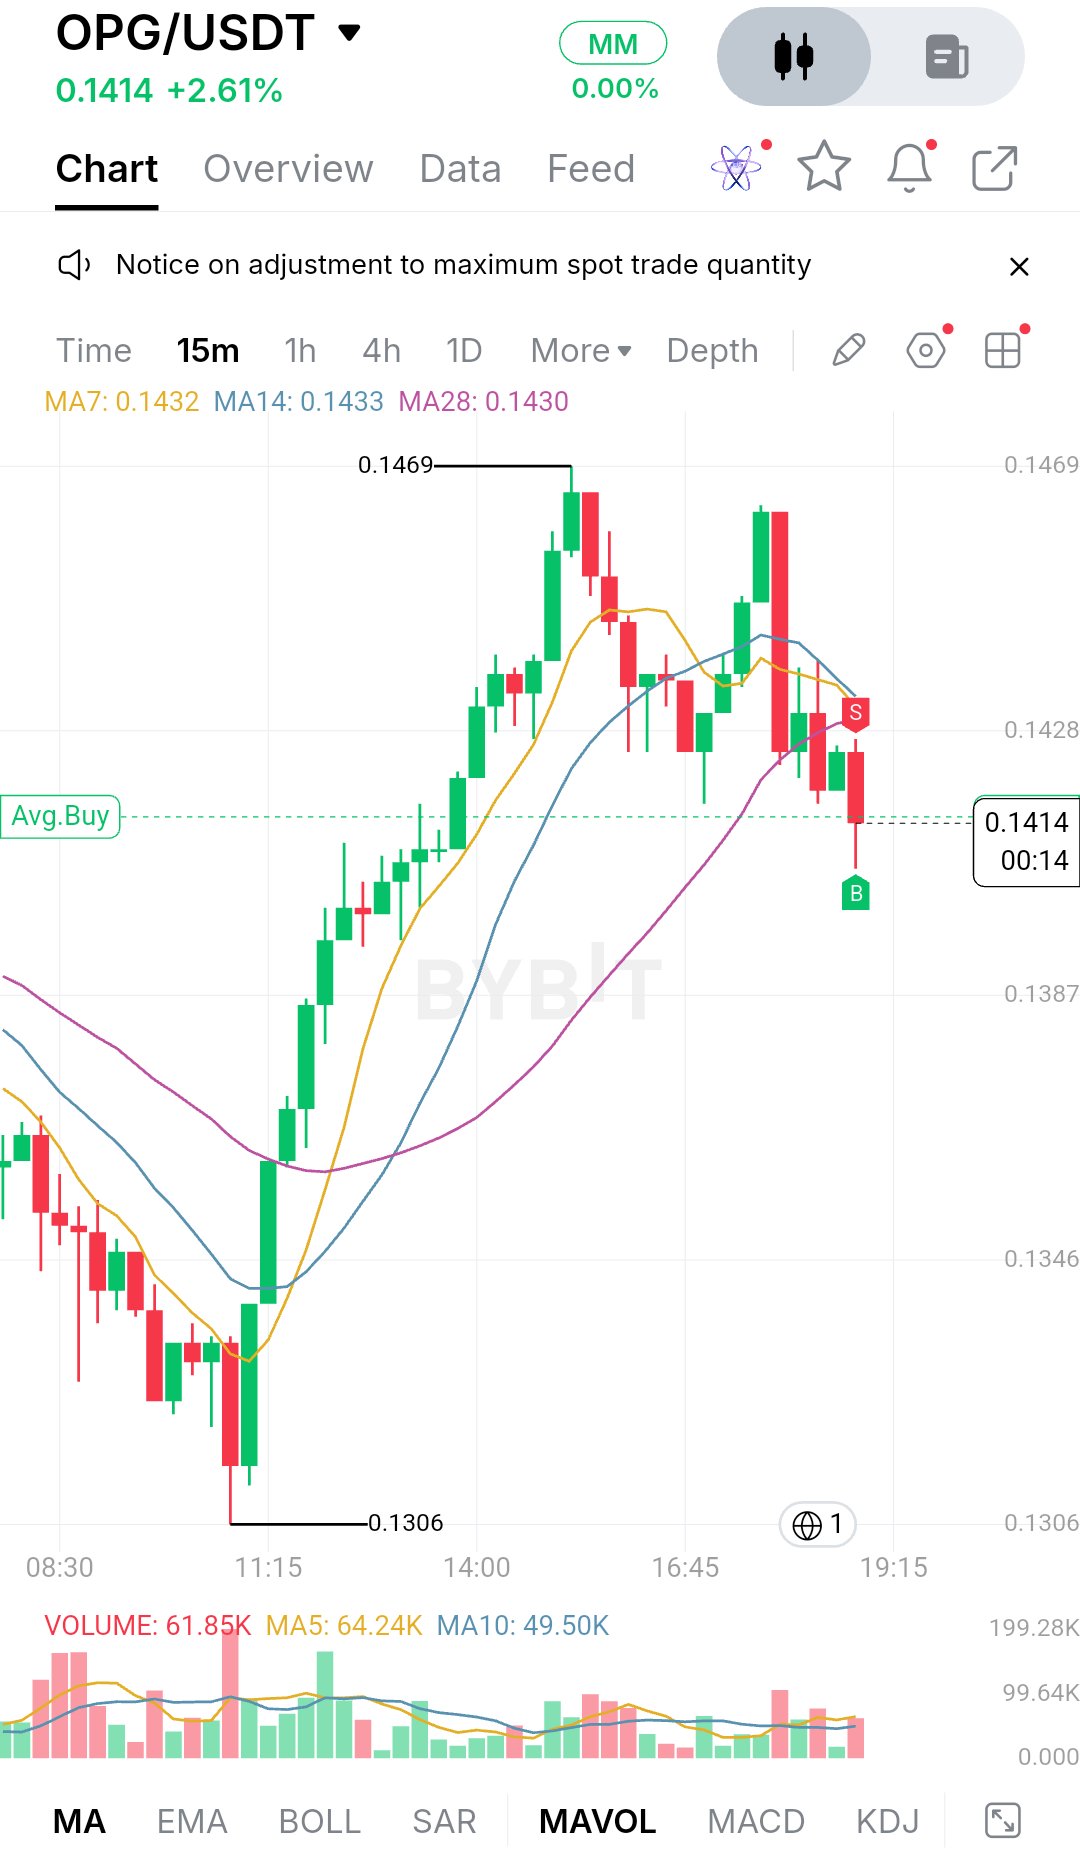
$OPGUSDT está cotizando a 0.1414, con una subida del 2.61% en el día. La sesión tuvo dos fases claras. Los vendedores empujaron el precio a la baja hasta 0.1306 cerca de las 11:15, y ahí los compradores entraron fuerte. Lo que siguió fue una racha constante de velas verdes que llevaron el precio hasta 0.1469. Un segundo empujón cerca de las 16:45 marcó un máximo similar, pero se topó con una gran vela roja que borró casi toda la subida rápidamente. Ese segundo rechazo es importante para la estructura. La primera etapa fue una recuperación en forma de V clara. El segundo intento marcó un máximo más bajo y vendió con una vela de cuerpo amplio, así que el impulso se desvaneció. El precio ahora está presionando por debajo del área de 0.1428 y se encuentra justo en la línea de Avg.Buy, que está cerca del precio actual. El mercado parece estar decidiendo si el rally fue un cambio de tendencia o solo un rebote. En el gráfico de 15 minutos, la MA7 (0.1432), la MA14 (0.1433) y la MA28 (0.1430) se han aplanado y agrupado. El precio ahora está por debajo de las tres. Cuando los promedios se comprimen así y el precio se desliza por debajo de ellos, el mercado suele haber perdido su ventaja direccional en el corto plazo. El volumen cuenta una historia similar. La última barra es de 61.85K, cerca de la MA5 en 64.24K y por encima de la MA10 en 49.50K, así que la venta no es de pánico, pero tampoco está seca. El mayor volumen se vio durante el rebote desde 0.1306 y el rechazo desde los máximos, que son los dos puntos que definieron la sesión. Para el soporte, la primera zona es 0.1387, donde llegó la mecha inferior de la última vela. Ese nivel también importa porque el mercado tuvo que pasarlo en el camino hacia arriba. Por debajo, 0.1346 es el siguiente bolsillo importante, y el mínimo de la sesión de 0.1306 es la línea sobre la que se construyó toda la recuperación. Un mantenimiento en 0.1387 sugeriría que los compradores siguen activos. Una pérdida clara abriría el camino de regreso hacia 0.1346, y una ruptura de 0.1306 borraría toda la estructura del día. Al alza, el primer obstáculo es la zona de 0.1428 a 0.1433, donde se encuentran los tres promedios móviles y donde fallaron las últimas velas. Por encima de eso, el máximo de la sesión de 0.1469 es la verdadera resistencia. El precio necesitaría reclamarlo con fuerza para confirmar un máximo más alto. El caso alcista es simple: los compradores necesitan defender 0.1387, empujar de nuevo por encima del grupo de MA cerca de 0.1430 y mantenerlo como soporte. Si eso sucede con un volumen en expansión, 0.1469 se convierte en el siguiente objetivo, y un cierre por encima de él abriría la puerta a nuevos máximos. El caso bajista comienza con un rechazo en la zona de MA. Si el precio vuelve a probar 0.1430 y falla de nuevo, eso confirmaría la estructura de máximo más bajo. Una ruptura por debajo de 0.1387 probablemente aceleraría la venta hacia 0.1346, y la falla de ese nivel pondría a 0.1306 de nuevo en juego. Niveles de precio clave: - Resistencia 2: 0.1469 (máximo de la sesión) - Resistencia 1: 0.1428 a 0.1433 (grupo de MA) - Precio actual: 0.1414 - Soporte 1: 0.1387 - Soporte 2: 0.1346 - Soporte 3: 0.1306 (mínimo de la sesión) En general, OPG está en un retroceso a corto plazo después de una fuerte recuperación, y el próximo movimiento depende de si 0.1387 se mantiene. Los traders deberían observar cómo reacciona el precio alrededor del grupo de MA y si el volumen aumenta en una ruptura en cualquier dirección. Un rango estrecho como este a menudo precede a un movimiento mayor, y qué lado se rompa primero te dirá más que la ganancia del 2.61%. Nada de esto es una predicción, y la gestión del riesgo es lo que más importa cuando el mercado está tan indeciso. #IMPACTbyTrade
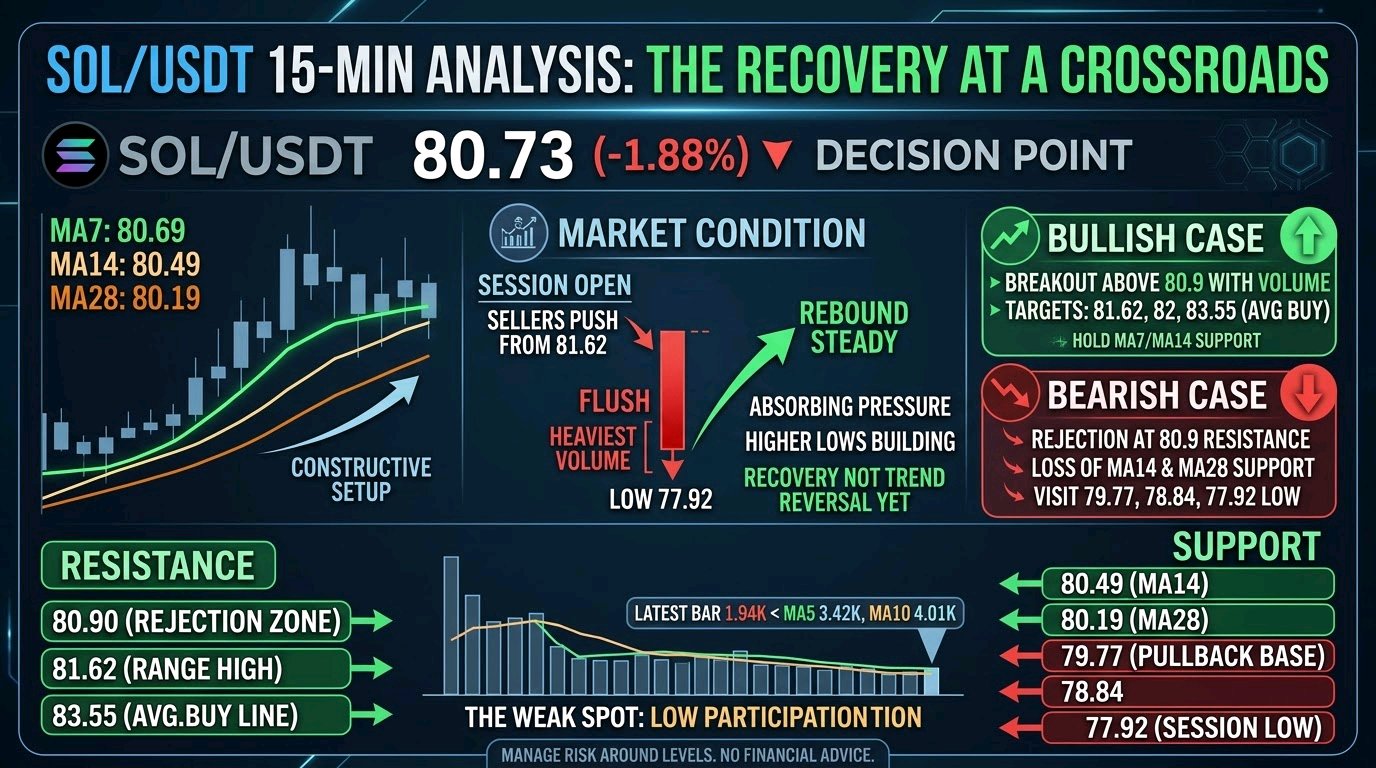
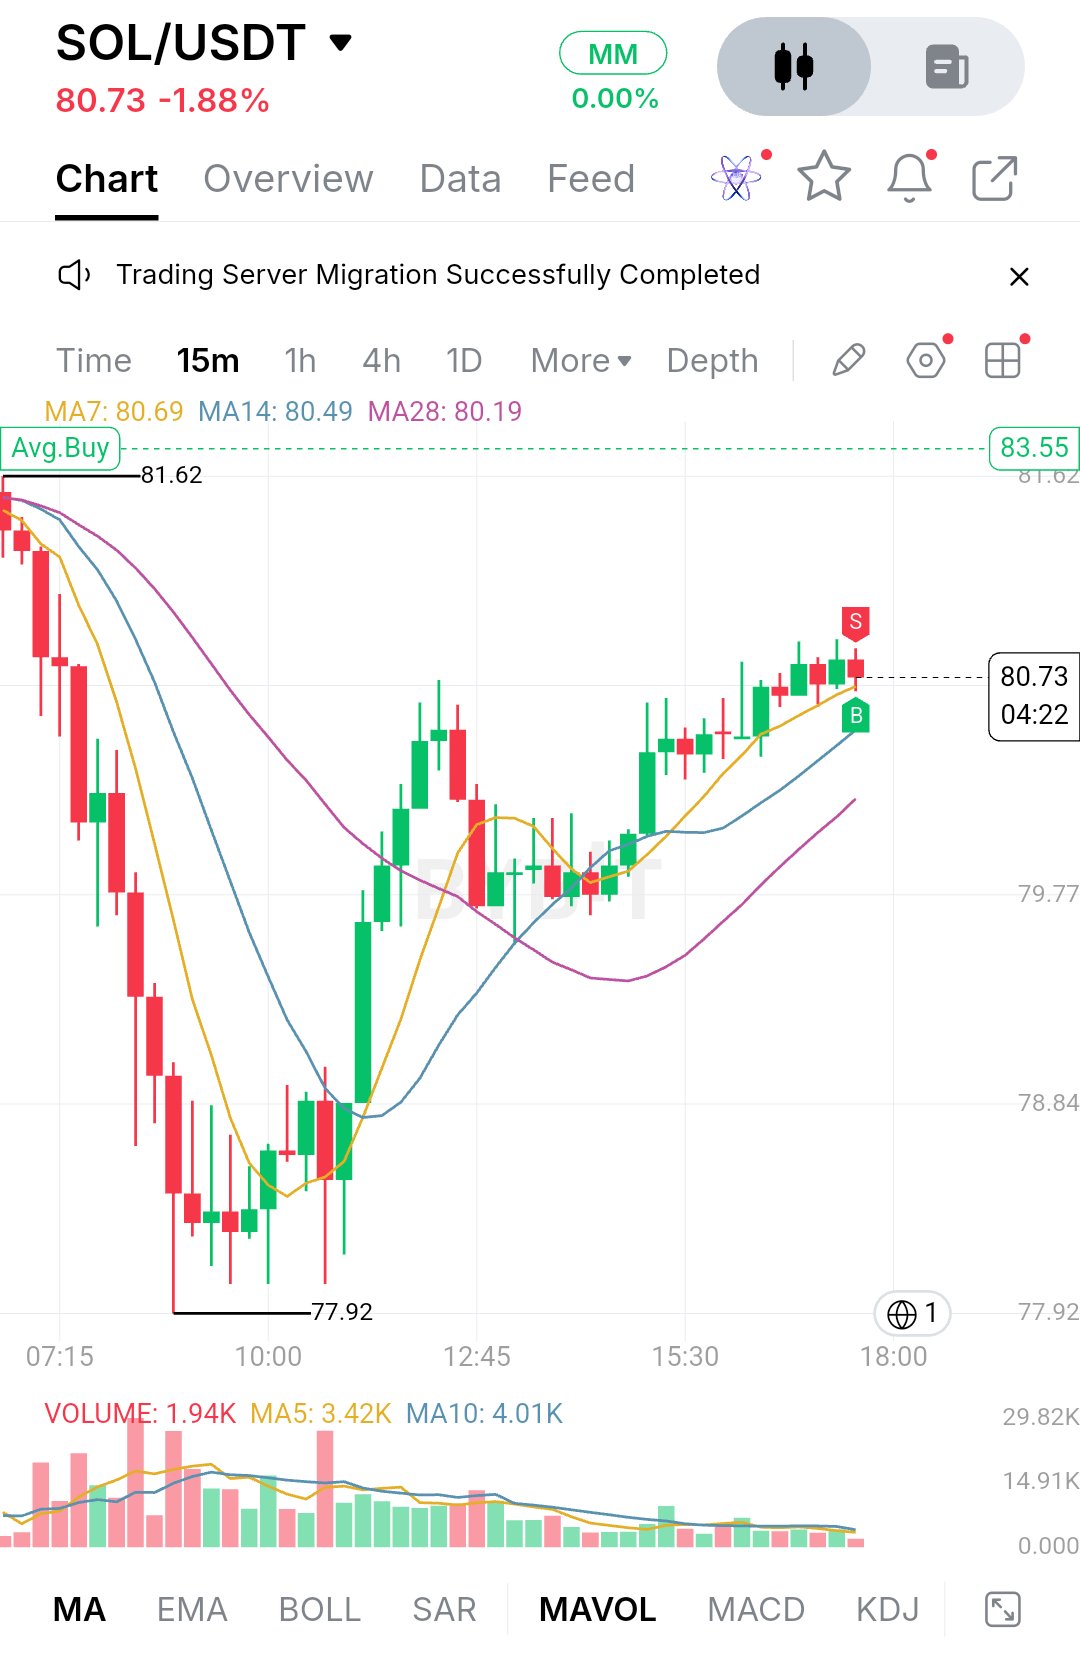
$SOLUSDT is trading at 80.73, down 1.88% on the day. The session started on the back foot, with sellers pushing price down from the 81.62 area and driving it to a low of 77.92. That drop was fast and came with the heaviest volume on the chart. Buyers stepped in at the low and started absorbing the pressure, and the rebound has been steady since. After the flush, price stopped making new lows and began building higher lows, so this looks more like a recovery than a random bounce. It isn't a clean trend reversal yet, though. The push from the lows stalled around 80.7 near the 12:45 mark, pulled back toward 79.7, and has now climbed back to the same zone. Recoveries that keep retesting the same ceiling are either loading up for a breakout or running out of fuel, and volume will decide which. This is a 15-minute chart, so I'm reading it at that resolution. The moving averages show MA7 at 80.69, MA14 at 80.49 and MA28 at 80.19. Price sits right on the MA7 and above the other two, all of which are turning upward, with MA28 curling up after a long decline. That is a constructive short-term setup. The weak spot is volume. The latest bar is 1.94K, well under the MA5 at 3.42K and the MA10 at 4.01K, so the recovery is being carried by thin participation. A move above resistance without a volume pickup would deserve some skepticism. The chart doesn't show EMA200, RSI, MACD or Fibonacci levels, so I'm leaving those out rather than guessing. Support first sits at 80.49 and 80.19, where the MA14 and MA28 are tracking. Holding those would keep the higher-low structure intact. Below that, the 79.77 area is where price based during the pullback, followed by 78.84 and the session low at 77.92. A clean break under 79.77 would put the whole recovery in question, and 77.92 would be the next major test. Immediate resistance is the 80.7 to 80.9 zone, where price has been rejected twice and where a small sell signal marker appears on the chart. Above that, 81.62 is the earlier high of the range and the first real breakout level. The chart also marks an Avg.Buy line at 83.55, which makes a reasonable longer-range target if momentum builds, with 82 as a round-number checkpoint along the way. For bulls, the job is simple: hold above the MA7 and MA14, break 80.9 on rising volume, and then reclaim 81.62. A close above that would flip the session's lower-high structure and open the way toward 82 and potentially 83.55. For bears, the signal would be another rejection at 80.7 to 80.9 followed by a loss of the MA14 and MA28. That would turn the move into a failed retest, and price would likely revisit 79.77. If that gives way too, 78.84 and the 77.92 low come back into play. Key price levels: - Resistance: 80.90, 81.62, 83.55 (Avg.Buy line) - Current price: 80.73 - Support: 80.49, 80.19, 79.77, 78.84 - Session low: 77.92 SOL is at a decision point rather than in a trend. The recovery has been orderly, but the lack of volume leaves it unproven. What matters next is whether price can push through 80.9 with real participation, or whether it stalls again and rolls back into the 80.2 to 79.8 zone. A breakout with volume would be the first real sign of expansion, and a failure would more likely mean more range-bound trading. None of this is guaranteed, so manage risk around those levels. #IMPACTbyTrade$HYPEUSDT
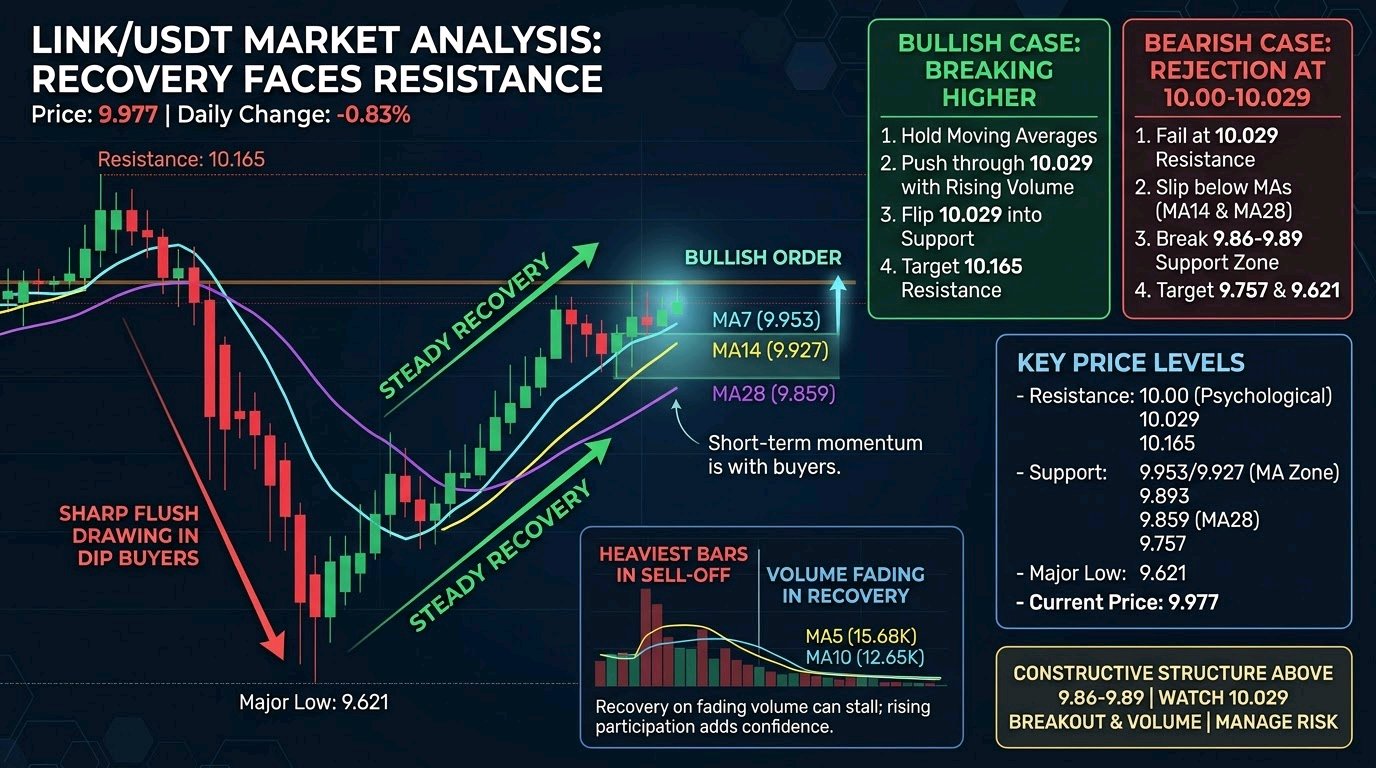
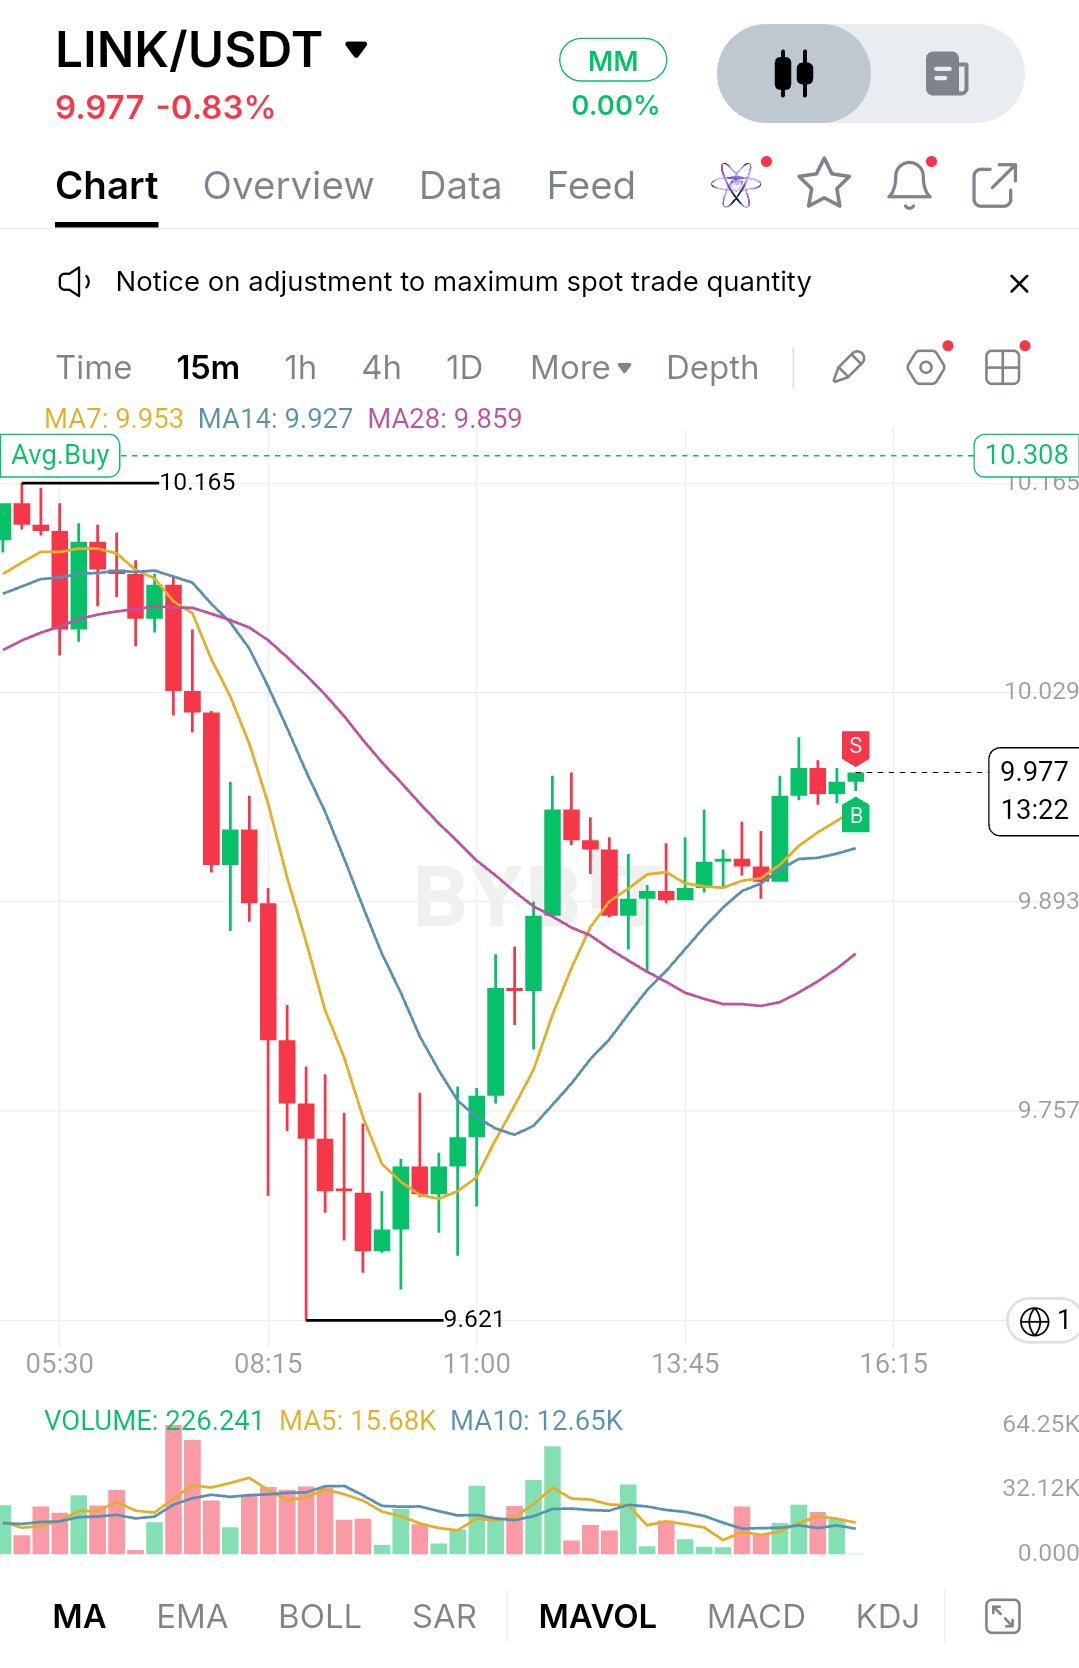
$LINKUSDT is trading around 9.977, down roughly 0.83% on the day. The move that defined the session was a sharp flush from the 10.165 area down to 9.621, where sellers pushed hard through the morning with a run of heavy red candles. That low drew in aggressive dip buyers, and the recovery since has been steady and surprisingly orderly. After the bounce, price has stopped chasing and started building. The rebound has retraced most of the drop, and the candles near the top are smaller, with a few wicks on both sides. That looks like a market digesting the recovery rather than running out of steam, but buyers haven't fully reclaimed the earlier breakdown zone either. Right now it reads as a recovery phase moving into a tight consolidation just under 10.029. On the chart, price sits above all three moving averages. MA7 is at 9.953, MA14 at 9.927 and MA28 at 9.859, stacked in a bullish order with price on top. The short averages have curled up and are tracking price closely, which shows momentum has shifted back to buyers, at least on this timeframe. The slower MA28 is still sloping gently upward after its long decline, so the broader trend hasn't fully turned. Volume tells a similar story. The heaviest bars came during the sell-off, and activity has cooled during the recovery, with the volume averages (MA5 around 15.68K, MA10 around 12.65K) drifting lower. A recovery on fading volume can stall, so a pickup in participation on the next push would add real confidence. For support, the first area is 9.953 to 9.927, where MA7 and MA14 sit just under price. Holding there keeps the short-term structure intact. Below that, 9.893 is a clear horizontal level on the chart and lines up closely with MA28 at 9.859, which makes the 9.86 to 9.89 band the most important pullback zone. If it holds on a retest, the higher-low structure stays valid. If it breaks, price likely revisits 9.757, and a loss of that level puts the 9.621 low back in play. On the upside, the nearest resistance is the psychological 10.00 mark, closely followed by the 10.029 level. Price has been pressing into this area, and the small red candle with a wick near the highs suggests sellers are active here. Above that, 10.165 is the major resistance and the high of the visible range, where the sell-off began. The bullish case is simple. Buyers need to hold the moving averages, push through 10.029 with a strong candle close and ideally rising volume, and then flip that level into support. A clean break would open the way to 10.165. A breakout above that would put price back above the entire range and weaken the case that the morning drop was anything more than a liquidity sweep. The bearish case starts with rejection at 10.00 to 10.029. If price fails there and slips below MA14 and then MA28, the recovery starts to look like a lower-high bounce inside a bigger downtrend. A break under 9.86 to 9.89 would confirm that shift, with 9.757 as the first target and 9.621 as the major downside level. **Key Price Levels** - Resistance: 10.00 (psychological), 10.029, 10.165 - Support: 9.953 / 9.927 (MA7 and MA14 zone), 9.893, 9.859 (MA28), 9.757 - Major low: 9.621 - Current price: 9.977 Overall, LINK has recovered well from the morning low, but it hasn't confirmed anything yet. The structure is constructive while price stays above the 9.86 to 9.89 zone, and the real test is whether it can clear 10.029 with conviction. Watch the volume on any breakout attempt and how price reacts to a pullback toward the moving averages. A strong close above 10.029 or a clean break below 9.86 will likely decide the next expansion. This is analysis, not a guarantee, so manage risk accordingly. $ETHUSDT#IMPACTbyTrade
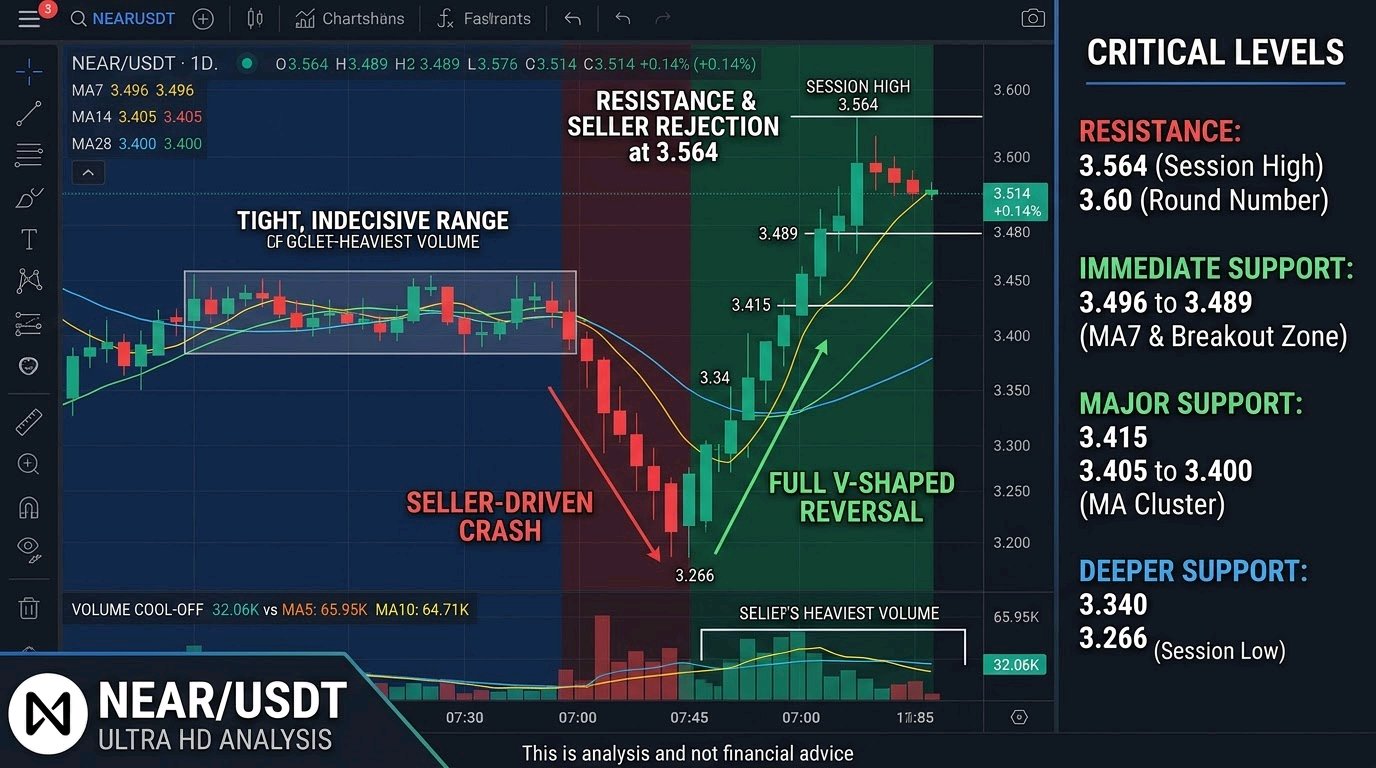
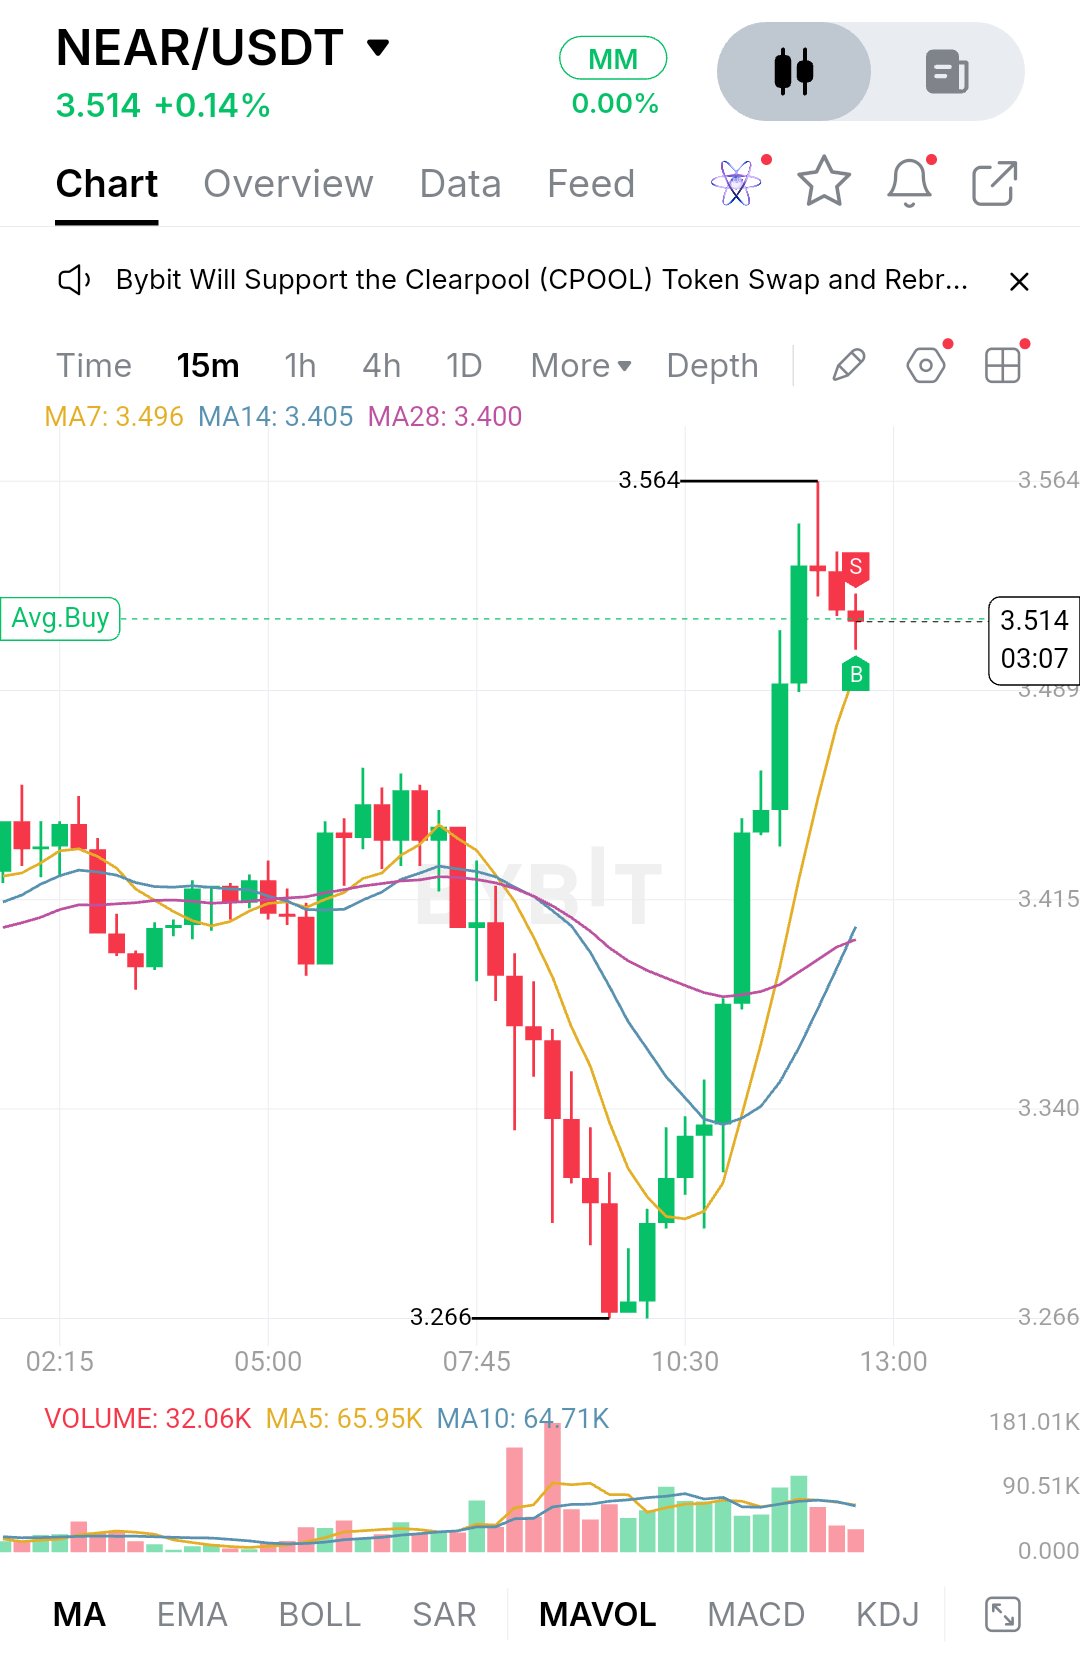
$NEARUSDT is trading at 3.514, up about 0.14% on the day. That flat number hides a pretty violent session. Price spent the morning drifting, then got hit hard by sellers, only to be bought back up with equal force. The first part of the session was a tight, indecisive range. From the early hours until roughly 07:45, candles kept overlapping around the 3.40 to 3.45 zone while the three moving averages tangled together, which is classic low-conviction behavior. Then sellers took control. A run of strong red candles pushed price down through the whole range, with the heaviest volume of the session printing on the way down. The low came in at 3.266, where the selling finally ran out of steam. What followed was the more interesting part. Buyers stepped in around that low and the recovery was fast: a string of strong green candles with rising volume carried price back through 3.34, 3.415 and 3.489, all the way to a session high of 3.564. That is a full V-shaped reversal. But the top of the move left a long upper wick at 3.564, which tells you sellers were waiting there, and the candles since have been small and mostly red as price settles back to 3.514. On the technical side, the structure has flipped from bearish to constructive. Price is now above MA7 (3.496), MA14 (3.405) and MA28 (3.400), and the short-term average has turned sharply upward. MA14 and MA28 are sitting close together just under the 3.415 area, so they now form a support cluster beneath the market. The weak spot is volume. The current bar shows 32.06K, well below the MA5 (65.95K) and MA10 (64.71K), so the push higher is cooling off. That's normal after a spike, but it means the next move needs fresh participation to be trusted. For support, the first area to watch is 3.496 to 3.489, where MA7 and the previous breakout zone overlap. If buyers defend it, the uptrend stays intact and this pullback looks like a pause. If it breaks, price likely slides toward 3.415, and below that the 3.405 to 3.400 cluster of MA14 and MA28 becomes the more important line. Losing that cluster would put the entire recovery in question and bring 3.340 and eventually the 3.266 low back into play. On the upside, resistance is clear at 3.564, the session high and the spot where sellers already showed up once. A clean break and hold above it would be the first real sign that the recovery is turning into a trend, and the round 3.60 figure is the natural next area to watch, since traders tend to react at psychological levels. The bullish case is straightforward. Buyers need to hold 3.489 to 3.496, rebuild volume, and then push through 3.564 with a decisive candle close rather than another wick. If that happens, continuation toward 3.60 becomes realistic. The bearish case starts with another rejection at 3.564, which would make it a potential double-top on this timeframe. Combined with weak volume, a break below 3.489 would suggest the move up was mostly a short squeeze and a retest of 3.415 and the moving average cluster would be likely. Key price levels: - Resistance: 3.564 (session high), then 3.60 (round number) - Immediate support: 3.496 to 3.489 (MA7 and breakout zone) - Major support: 3.415, then 3.405 to 3.400 (MA14 and MA28) - Deeper support: 3.340, then 3.266 (session low) Overall, NEAR has done the hard part by reclaiming its range and turning the short-term averages up, but it hasn't yet proven it can break the high it was just rejected from. Watch how price behaves around 3.49 and whether volume returns on the next push into 3.564. That reaction will say more about the next expansion than the small percentage change on the day. As always, this is analysis and not financial advice, so manage your risk accordingly. $BTCUSDT#IMPACTbyTrade
$SUIUSDT is trading around 0.7899, down 2.72% on the day, but the number hides a more interesting story. The session started with price pressing against the 0.8085 area, where buyers ran out of steam and sellers took control. What followed was a sharp, one-directional drop that pushed price all the way down to 0.7652, and the volume bars during that leg were the heaviest of the entire session. That was real selling, not a slow drift. The more important part is what came after. Price didn't bleed out or chop around at the lows. It found a floor near 0.7652, printed a long lower wick, and then built a run of higher lows into a strong green push. For a few hours the structure went from clean downtrend to an active recovery, and price has now retraced a good portion of the drop. On the 15-minute chart, the moving averages tell the same story. The MA7 sits at 0.7822, the MA14 at 0.7773 and the MA28 at 0.7878. During the sell-off, price stayed well below all three and the averages fanned downward, which is what a trending move looks like. Now price has climbed back above the MA7 and MA14 and is sitting right on top of the MA28. That is the first real test of the recovery. Reclaiming the faster averages is easy after a bounce, but holding above the slowest one is what separates a relief move from a genuine shift in short-term control. The MA7 is also curling up sharply, so momentum is clearly on the buyers' side for now. Volume deserves a mention too. The sell-off came with a big spike, while the bounce has been steadier, with the latest bars sitting above the volume averages (MA5 around 89.96K, MA10 around 84.23K). That suggests buyers are participating, though the recovery hasn't yet matched the intensity of the selling. For support, the nearest zone is the 0.7822 to 0.7773 region, where the MA7 and MA14 are sitting. If price pulls back, this is where buyers need to show up again. A hold here keeps the higher-low sequence alive. Below that, the 0.7760 level is the next marked area on the chart, and the real line in the sand is the 0.7652 low. A break below it would erase the entire recovery and confirm that the bounce was just a pause inside a larger downtrend. On the upside, the immediate hurdle is the MA28 near 0.7878, which price is testing right now. Above it, 0.7976 is the next clear level, and it also happens to be where the market stalled earlier in the session. Beyond that, the 0.8085 high is the major resistance, and the 0.8148 line marked on the chart sits just above it. That cluster from 0.7976 to 0.8148 is where I would expect the heaviest supply, since sellers already defended it once. The bullish case is fairly simple. Buyers need to hold price above the MA28 and keep the MA7 and MA14 as dynamic support on any dip. A clean break and hold above 0.7976 would be the signal that the sell-off is being fully absorbed, opening the door to a retest of 0.8085. If volume expands on that move instead of fading, it adds a lot of weight to the breakout. The bearish case starts with rejection at the MA28 or at 0.7976. If price stalls there and then loses the MA7 and MA14 zone, the recovery starts to look like a lower high beneath the broken structure. In that scenario, a return to 0.7760 becomes likely, and a loss of 0.7652 would open a new leg down with no nearby support to slow it. Key price levels: - Resistance: 0.7878 (MA28), 0.7976, 0.8085, 0.8148 - Support: 0.7822 (MA7), 0.7773 (MA14), 0.7760, 0.7652 - Bullish confirmation: hold above 0.7878, then a clean break of 0.7976 - Bearish confirmation: loss of 0.7773 followed by a break below 0.7652 Overall, SUI has gone from a heavy sell-off to a structured recovery, and the next move depends on how price reacts around the MA28 and 0.7976. The percentage on the day matters far less than the structure here. A sustained hold above those levels could set up the next expansion toward the highs, while a rejection would put the lows back in play. Watch how price behaves on the first pullback, because that will say more about the strength of this bounce than the candle that created it. $SOLUSDT#IMPACTbyTrade
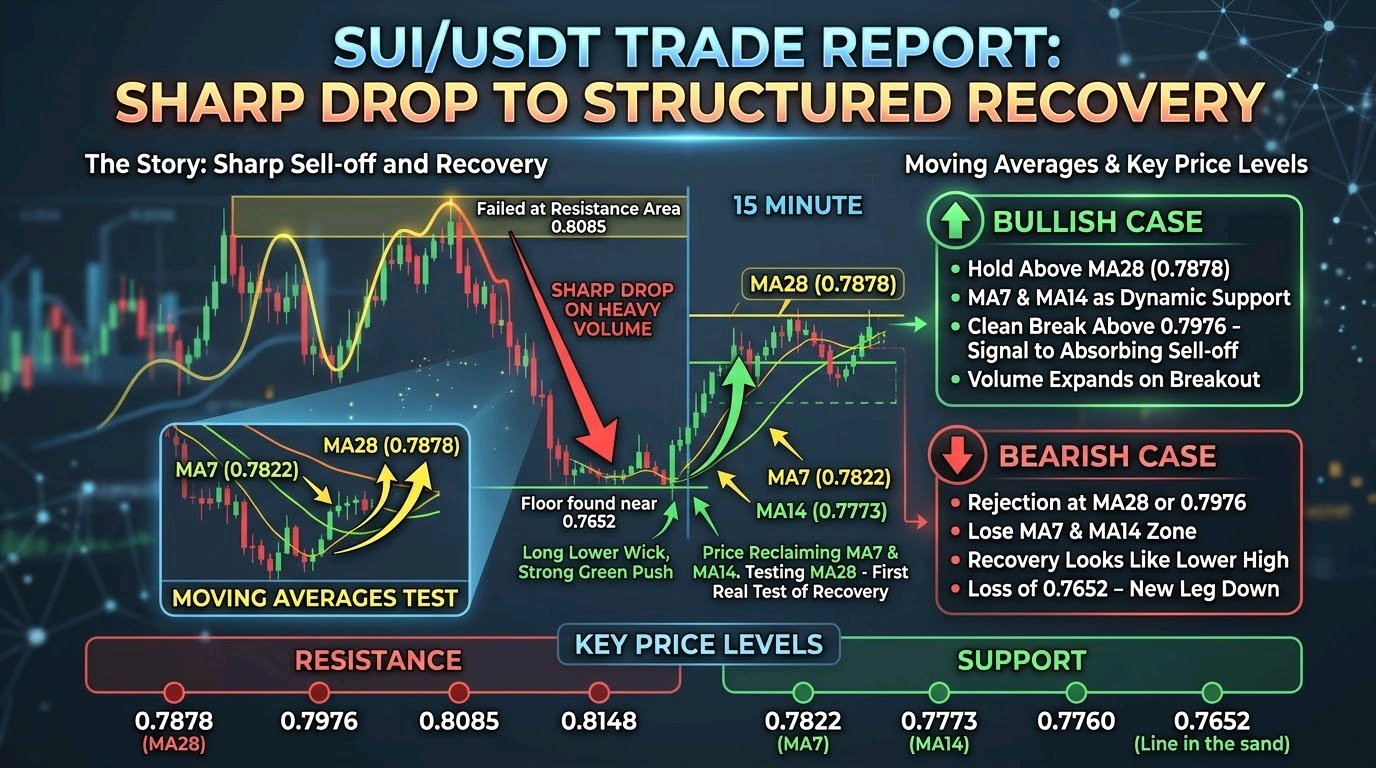
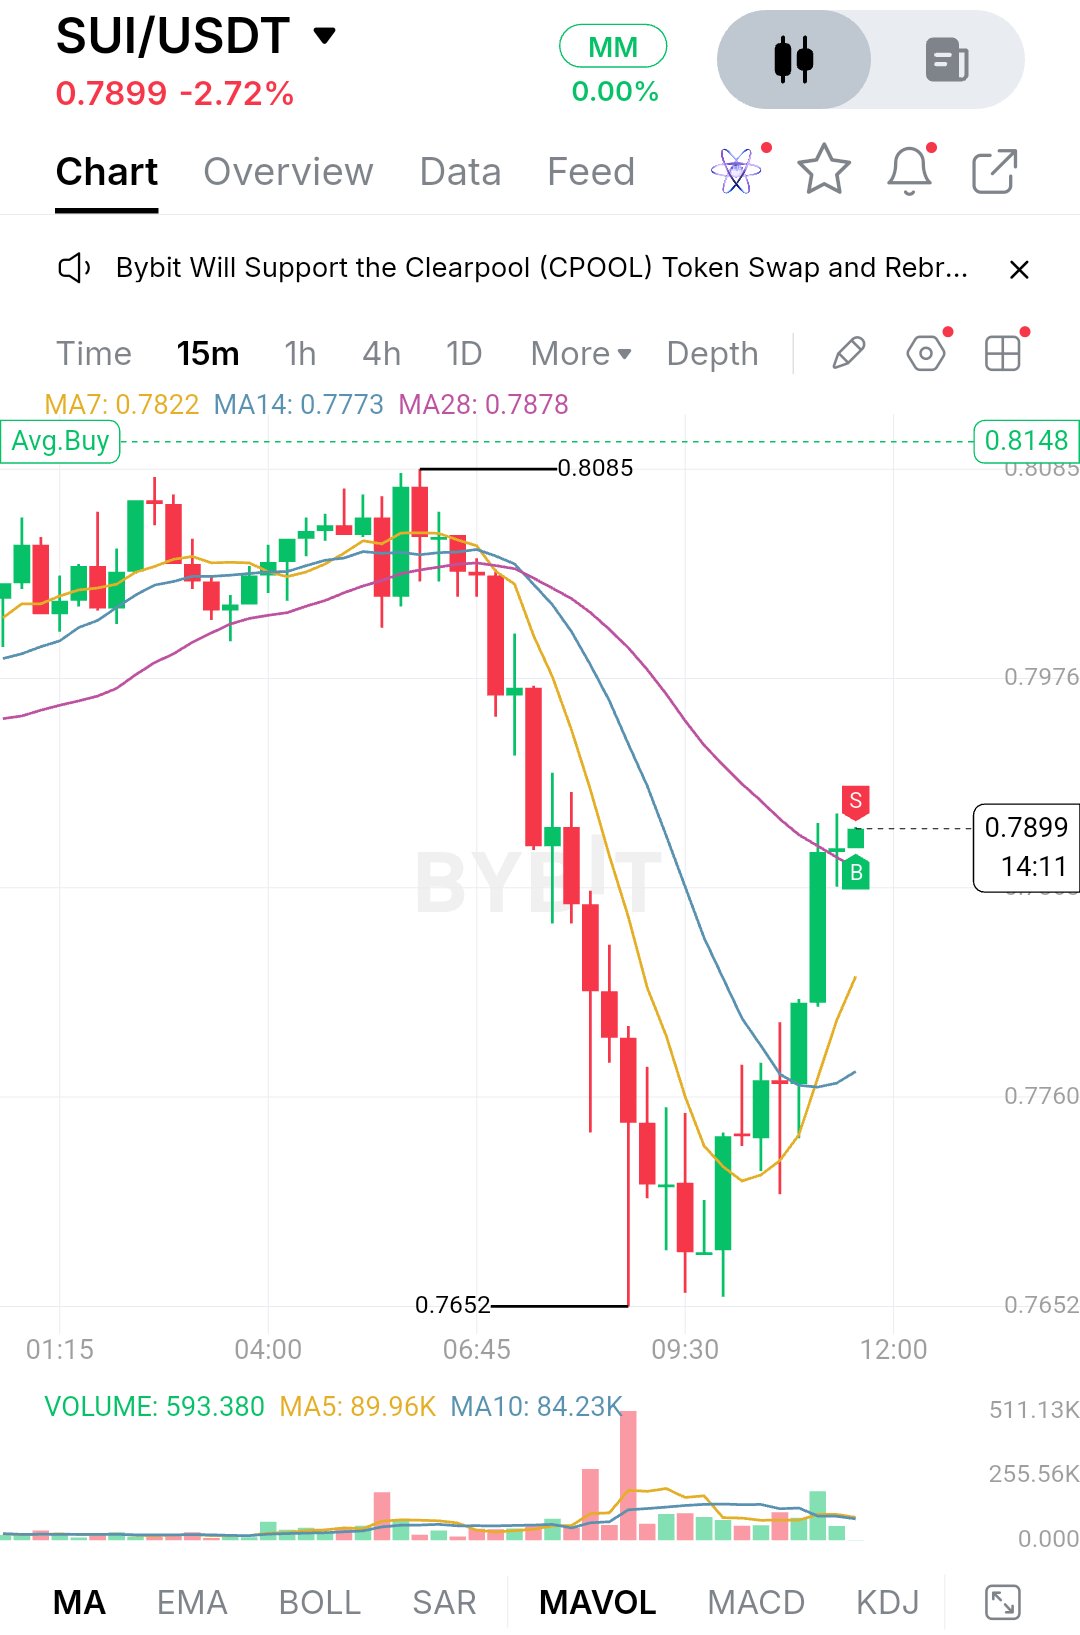
$BTCUSDT cotiza a 68.513,6, bajando un 6,89% en el día, y el gráfico deja la historia bastante clara. Temprano en la sesión, el precio estaba rondando la zona de 72.000, con el máximo marcado en 72.091,0 cerca del borde izquierdo. Los vendedores entraron ahí y realmente nunca soltaron. Lo que siguió fue un goteo constante a la baja, luego un desplome brusco a mitad de la sesión, y los compradores solo aparecieron una vez que el precio se acercó a 68.300,0. Después de ese máximo, la estructura se convirtió en una serie clara de máximos y mínimos decrecientes. La primera parte del movimiento fue lenta y controlada, con pequeñas velas derivando por debajo de las medias móviles. Luego, el ritmo cambió. Un grupo de grandes velas rojas empujó el precio desde aproximadamente 70.000 hacia la zona media de los 68.000, y el volumen se expandió fuertemente durante ese tramo. Ese tipo de pico de volumen generalmente apunta a ventas forzadas o una ola de liquidaciones (stop-outs) en lugar de una distribución tranquila. El rebote desde 68.300,0 fue una única vela verde con una larga mecha inferior, pero no se convirtió en continuación. Desde entonces, el precio ha impreso otra vela roja y se encuentra justo por encima del mínimo, por lo que parece más una pausa en el fondo que una recuperación confirmada. Una nota antes de la lectura técnica: la captura de pantalla muestra el gráfico de 15 minutos, no el de 1 hora. Solo puedo trabajar con lo que es visible aquí, por lo que no hay EMA200, RSI, MACD o herramienta de Fibonacci en esta vista, y no inventaré lecturas para ellos. Lo que sí muestra el gráfico es el conjunto de MA (MA7 en 68.696,7, MA14 en 69.221,4 y MA28 en 70.192,3) junto con el volumen y sus propias medias móviles. Las tres medias están apiladas en un orden bajista perfecto, con la más rápida en la parte inferior y la más lenta en la parte superior, y todas ellas con pendiente negativa. El precio está operando por debajo de las tres, y la brecha entre la MA28 y el precio es amplia, lo que indica lo estirado que se ha vuelto el movimiento. La MA7 es la más cercana al precio y se está aplanando un poco, pero no ha girado hacia arriba. El volumen es el otro detalle que vale la pena notar: las barras más grandes aparecieron durante la caída, y las barras más recientes se están desvaneciendo, por lo que la presión vendedora está disminuyendo aunque los compradores no hayan tomado el control. En cuanto al soporte, el nivel que más importa es 68.300,0, el mínimo de la sesión hasta ahora. Es donde se formó la única vela de rechazo real, y ya ha sido probado una vez. Si vuelve a mantenerse y el precio comienza a construir mínimos más altos, se convierte en la base para un rebote de alivio. Si se rompe limpiamente, especialmente con un aumento en el volumen, no hay estructura visible debajo de él en este gráfico, lo que dejaría al precio en espacio abierto y haría posible una extensión más profunda. Un rebote débil que no logre recuperar nada por encima también sería una advertencia, porque demostraría que la demanda en este nivel es escasa. La resistencia comienza justo arriba, en la MA7 alrededor de 68.700, de la cual el precio ha sido rechazado en las últimas velas. La siguiente capa es la MA14 cerca de 69.200, y justo por encima se encuentra el nivel horizontal de 69.260,8 en el eje del gráfico. Después de eso viene la MA28 cerca de 70.200 y el nivel de 70.221,6, una zona donde la fuerte venta se aceleró, por lo que podría actuar como oferta si el precio vuelve allí. Más arriba, el nivel de 71.182,4 y el máximo de la sesión de 72.091,0 definen el rango mayor que los vendedores defendieron anteriormente. Para el caso alcista, los compradores primero necesitan mantener 68.300,0 y recuperar la MA7, luego superar los 69.200 a 69.300, donde la MA14 y el nivel horizontal se superponen. Un cierre por encima de esa zona sería la primera señal de que la estructura vendedora se está debilitando. A partir de ahí, los 70.200 se convierten en el objetivo natural, y solo un movimiento a través de él volvería a poner en juego los 71.182,4. Idealmente, ese empuje vendría con un volumen creciente en las velas verdes, no con la escasa participación que estamos viendo ahora. El escenario bajista es más sencillo. Si el precio sigue siendo rechazado por debajo de 68.700 y la MA7 vuelve a girar hacia abajo, los vendedores mantienen el control y parece probable otra prueba de 68.300,0. Una ruptura decisiva por debajo confirmaría la continuación de la tendencia y expondría al precio a nuevos mínimos sin soporte gráfico cercano. Cualquier rebote débil hacia la zona de 69.200 a 69.300 que sea vendido también reforzaría la tendencia bajista. Niveles de precio clave: Soporte: 68.300,0 (mínimo de la sesión y punto de rechazo) Resistencia inmediata: 68.700 (área de MA7) Resistencia: 69.200 a 69.300 (MA14 y nivel horizontal) Resistencia mayor: 70.200 (MA28 y nivel 70.221,6) Rango superior: 71.182,4 y 72.091,0 (máximo de la sesión) En general, Bitcoin está en una clara tendencia bajista a corto plazo, y la gran pregunta es si el mínimo de 68.300,0 puede mantenerse mientras los vendedores pierden fuerza. La caída fue brusca, el volumen se está enfriando y las medias están muy por encima del precio, que es el tipo de configuración que a menudo conduce a una base o a un rebote, pero nada aquí confirma ninguna de las dos cosas todavía. Observá cómo se comporta el precio alrededor de 68.700 y 69.200: una recuperación con volumen sería el primer cambio real en la estructura, mientras que una pérdida de 68.300,0 abriría la puerta a la siguiente expansión a la baja. Como siempre, nada de esto es garantía, así que gestioná tu riesgo y dejá que el precio confirme el movimiento antes de entrar. $ETHUSDT#IMPACTbyTrade
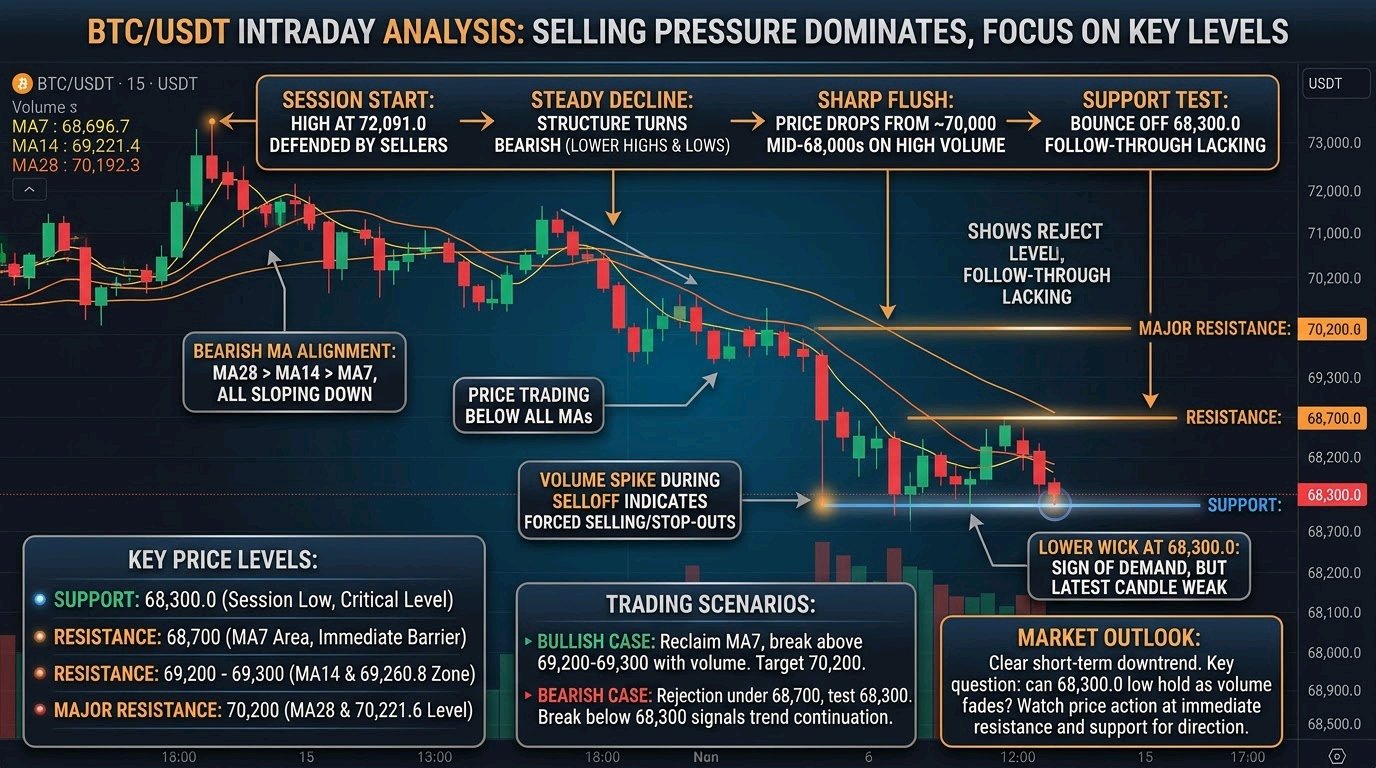
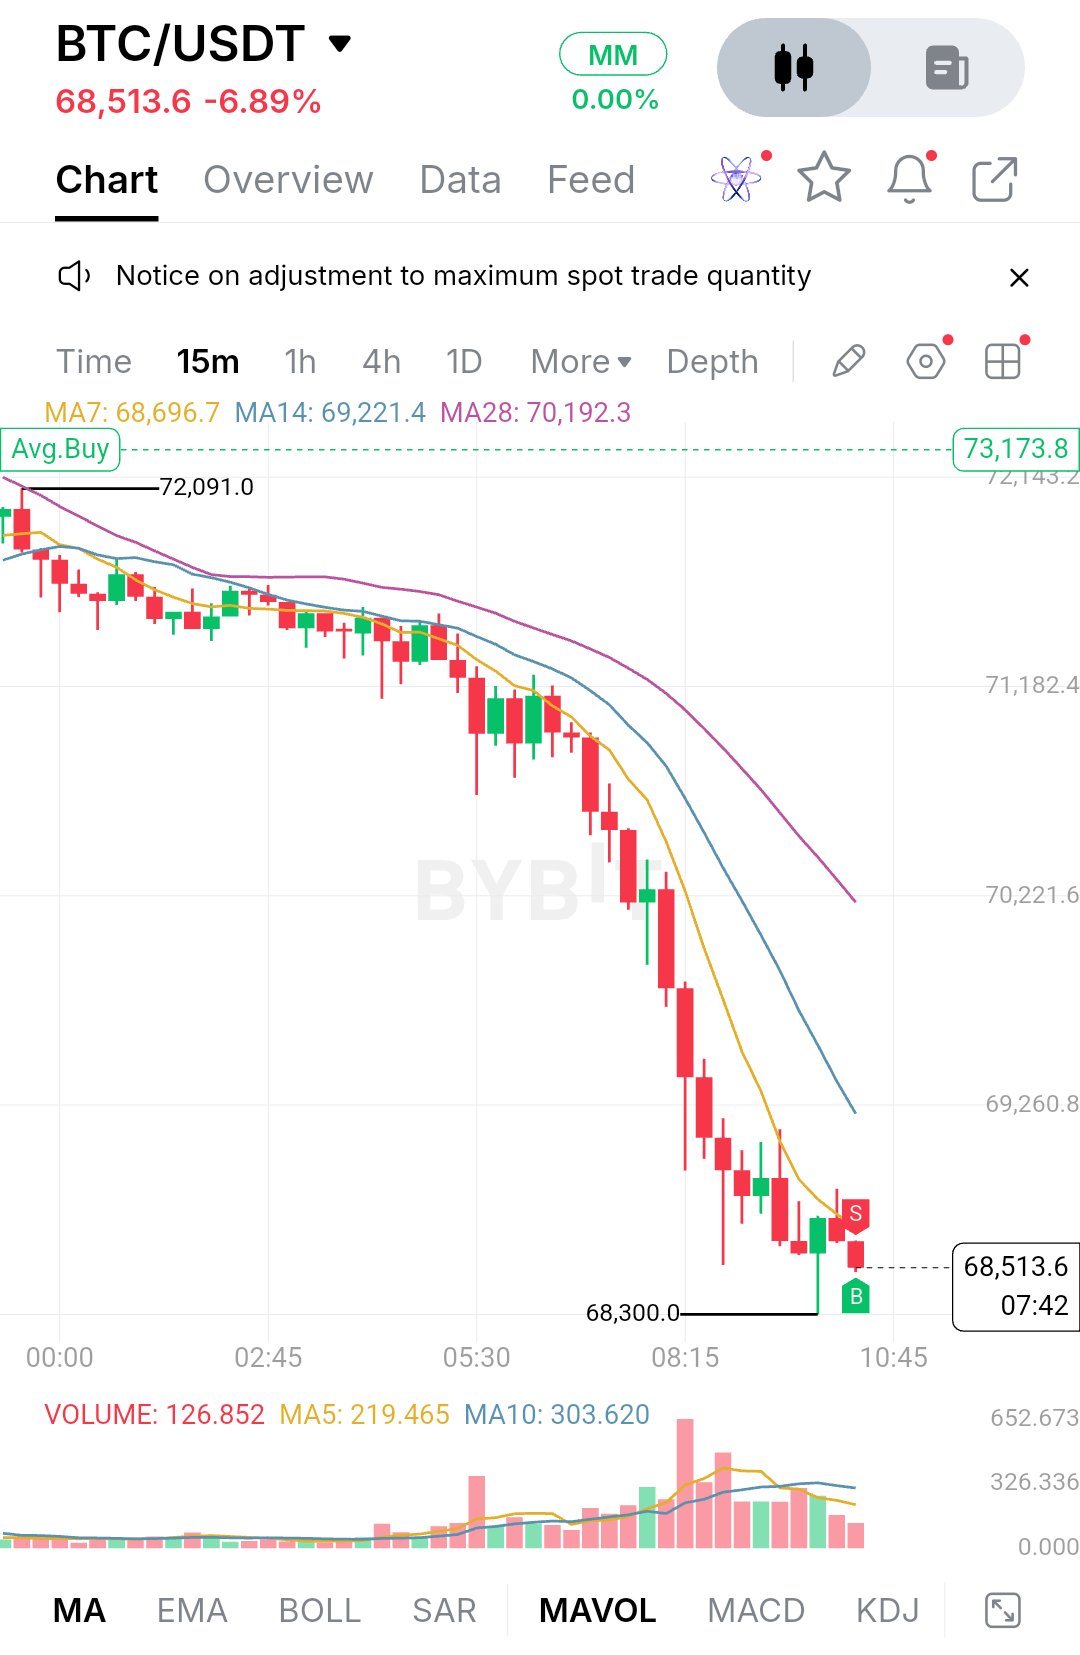
$HYPEUSDT cotiza a 70.716, bajando un 2.17% en la sesión, y la forma en que llegó aquí importa más que el número. Los compradores empujaron el precio constantemente al alza desde la zona de 22:30, construyendo una escalera limpia de mínimos más altos hasta llegar a 73.265. Ese máximo no se mantuvo. Los vendedores entraron justo en la cima, se imprimieron un par de velas indecisas y el mercado devolvió casi todo el avance en unas pocas horas. La estructura cambió de tendencia a correctiva. Después del rechazo en 73.265, el precio cayó por debajo de los tres promedios móviles y luego aceleró a la baja, con una serie de velas rojas grandes y casi sin rebotes significativos en el medio. Eso no es una sangría lenta. Parece un vaciado estilo liquidación, y el volumen lo respalda. Las barras más grandes en el panel de volumen coinciden con las ventas más pesadas, muy por encima del promedio de volumen. La última vela muestra solo 6.21K frente a una MA5 de 11.54K, por lo que la presión vendedora se está enfriando, aunque esa vela todavía se está formando y no debería sobreinterpretarse. En los indicadores, las MA cuentan la historia claramente. La MA7 se sitúa en 71.574, con la MA14 en 72.208 y la MA28 en 72.224. El promedio rápido cruzó muy por debajo de los dos más lentos, y el precio está por debajo de todos ellos. La 14 y la 28 están agrupadas y comenzando a darse vuelta, lo que convierte a la zona de 72.2 en una zona de resistencia apilada en lugar de una sola línea. La línea Avg.Buy de 72.253 se sitúa justo dentro de ella, lo cual es una referencia útil para cualquiera que haya comprado en el empuje anterior. El primer soporte es el mínimo de 70.467, donde el precio imprimió una larga mecha inferior. Esa mecha muestra que los compradores aparecieron ahí, pero un rechazo no es una base. Si 70.467 se mantiene en una nueva prueba, con velas cerrando de nuevo dentro del rango y el volumen manteniéndose moderado, podría convertirse en el piso para un rebote de alivio. Si se rompe limpiamente, no hay una estructura visible en este gráfico debajo, por lo que el precio estaría en espacio abierto. El número redondo de 70.00 es el imán psicológico obvio donde es probable que haya reacciones, pero ese es un nivel general, no algo marcado en este gráfico. Arriba, la resistencia más cercana es 71.166, seguida de 71.866. Esos son los niveles donde ocurrió la consolidación anterior durante la caída, así que esperen que los vendedores los defiendan. La barrera más importante es la zona de 72.2 a 72.565, donde convergen la MA14, la MA28 y la línea Avg.Buy. Más allá de eso, 73.265 es el máximo del swing y el nivel que tendría que romperse para cancelar todo este retroceso. Para los alcistas, el trabajo es reconstruir paso a paso. Primero necesitan mantener 70.467 y empujar de vuelta a través de 71.166 con volumen real. Reclamar 71.866 pondría el precio de nuevo cerca de la MA7 y abriría el camino hacia el grupo de 72.2. Solo un cierre por encima de ese grupo sugeriría que la caída fue un vaciado en lugar de un cambio de tendencia, poniendo a 72.565 y luego a 73.265 de nuevo sobre la mesa. Para los bajistas, la configuración más clara es un rebote débil que se estanca en 71.166 o 71.866 y se da vuelta por debajo de la MA7 que cae. Eso mostraría que la venta masiva fue solo una pausa. Un cierre por debajo de 70.467 confirmaría la continuación y expondría el área de 70.00. Sin niveles de gráfico por debajo de eso, cualquier objetivo adicional sería pura especulación, así que es mejor dejar que el precio muestre sus cartas. Niveles clave de precio: - 73.265: Máximo de swing y anulación total del retroceso - 72.565: Resistencia superior - 72.253: Línea Avg.Buy, dentro del grupo MA14/MA28 (alrededor de 72.2) - 71.866: Resistencia - 71.574: MA7, actuando como resistencia dinámica - 71.166: Primera resistencia en un rebote - 70.716: Precio actual - 70.467: Soporte clave y mínimo reciente - 70.00: Número redondo psicológico, no marcado en el gráfico En general, HYPE pasó de una expansión limpia a una corrección aguda impulsada por el volumen, y el próximo movimiento depende de cómo se comporte alrededor de 70.467. Un mantenimiento tranquilo seguido de una recuperación de 71.166 sería la primera señal de que los compradores están recuperando el control. Una ruptura a la baja diría que el mercado aún no terminó de reajustar los precios. De cualquier manera, observen la reacción en esos niveles y el volumen detrás de ellos en lugar del tamaño de las velas. Nada de esto es consejo financiero, y vale la pena esperar por confirmación antes de comprometerse. $BTCUSDT#BybitAIEvolving