Ali Explorer..
567Me gusta0Compartir en el chat8Aficionados3Seguir
just Beginning of learning 🔺
just Beginning of learning 🔺
HYPE REVERSE FROM my levels!
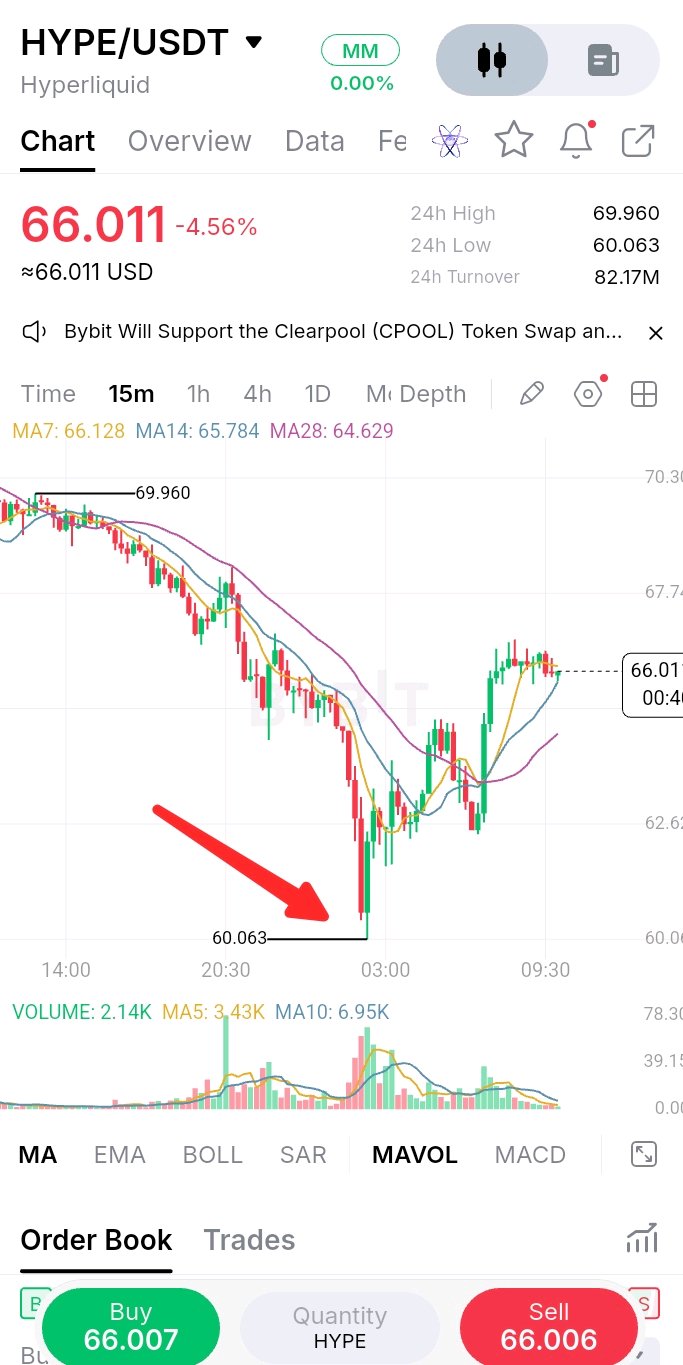
🚀 $HYPEUSDT THE BOUNCE WE WERE WATCHING! As discussed in my previous analysis, HYPE lost its $70–$71 support and moved toward the downside liquidity zone. Price swept liquidity near $60.06 and then staged a strong recovery toward $66. On the 15M chart, buyers are showing momentum, with price trading around the short-term moving averages. However, the broader downtrend is not confirmed broken yet. Key levels to watch 👀: $68–$70 resistance; $64–$65 immediate support. A sustained move above resistance could open the way toward $70–$73. For now, this looks like a recovery attempt, not a confirmed trend reversal. Watch volume and the next 4H closes before taking a position. Did HYPE finally find its bottom, or is this just a relieved... #IMPACTbyTrade
BTC bottom
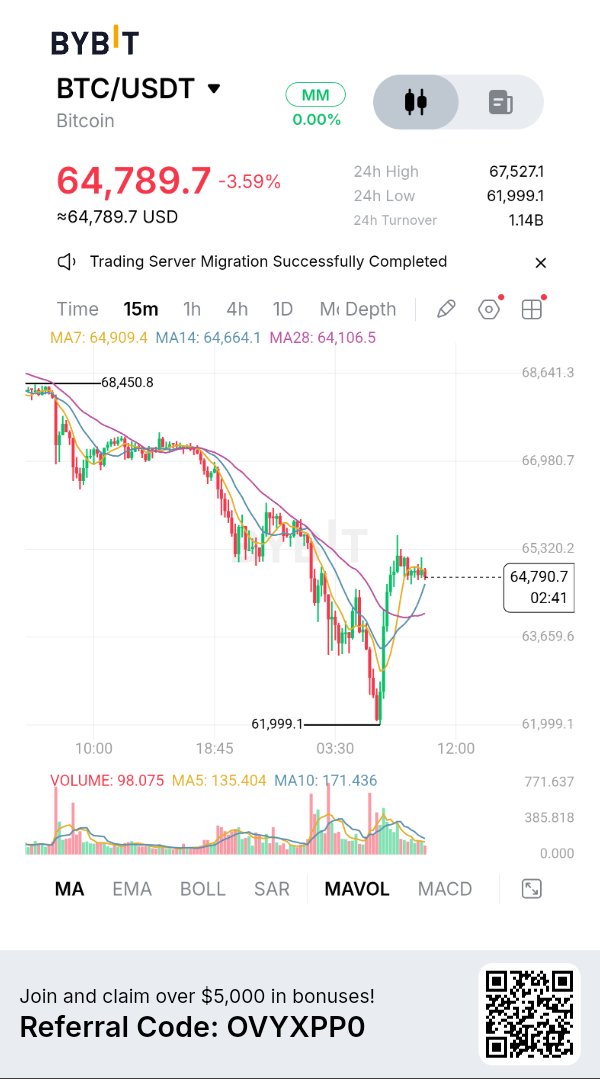
I think $BTCUSDT Bottom is near 📉 #BitcoinHitsTwoMonthLowAfterUSMidterms
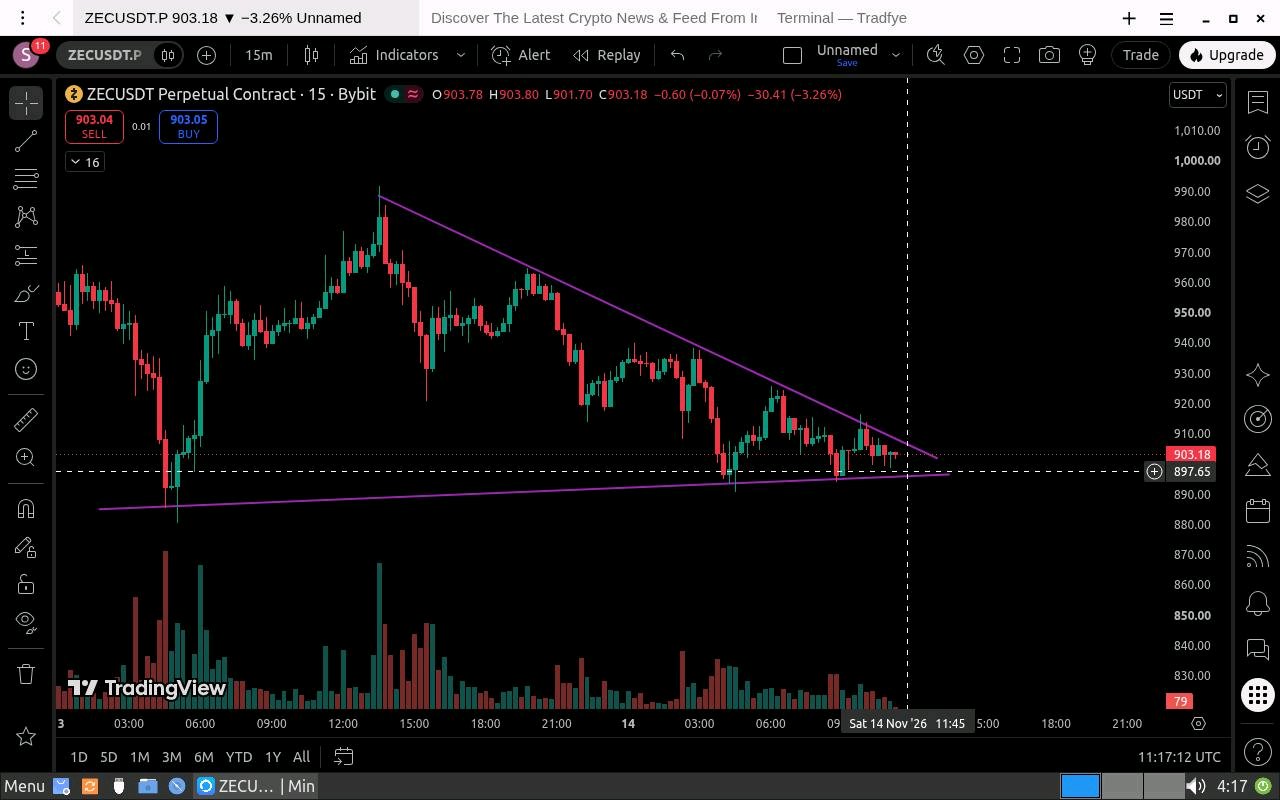
ZEC A BIG MOVE COULD BE COMING! 📊🔥
ZEC is trading around $903, squeezing inside a descending resistance structure on the 15-minute chart. Price is holding a critical support zone between $890 – $900. A breakout or breakdown could trigger the next major move. 📊 KEY LEVELS TO WATCH 👀 LONG 🎯 Target 1: $916 🎯 Target 2: $927 🚀 Final Target: $934 🛑 Stop loss: Below around $890. At $927, consider securing partial profits and moving SL to breakeven. If ZEC loses the $890–$900 support zone with a confirmed breakdown: 📉 Potential downside target: $860 🔥 THE BIG QUESTION Will ZEC break upward toward $934 or collapse toward $860? The market is approaching a critical decision zone. Don't chase the move wait for confirmation. 💡 Remember: Trade the confirmation, not the prediction. Manage your risk! What's your bias? 🐂 BULLISH or 🐻 BEARISH? #IMPACTbyTrade
Trying to Understand What Is Happening With BTC
I have been closely observing Bitcoin on the 1H timeframe, and the current market structure is showing signs of weakness. $BTCUSDT continues to form lower highs and lower lows, suggesting that sellers are still dominating the short term trend. Looking at the chart, I have mapped a possible A B C D E corrective structure. Price has recently bounced from the D wave area, but I am not considering this a confirmed bullish reversal yet. Key Technical Levels☑️ • Resistance: $69,120 • Immediate Support: $66,400–$66,500 • Next Potential Support Zone: $61,000–$63,000 if selling pressure continues. A sustained move above $69,120 could improve the short-term structure, while a breakdown below $66,400 may expose the lower support zone. Understanding the Market with Bybit AI I also used Bybit AI to understand the possible reasons behind BTC's recent decline. The analysis helped me look at the broader market picture, including: • Weakening demand and changing market sentiment. • Reduced institutional buying interest. • Derivatives positioning and the possibility of leveraged long liquidations. • Overall market uncertainty and selling pressure. According to the analysis, the current decline appears to be more related to market-wide pressure and weakening demand, potentially amplified by leverage, rather than a confirmed problem with Bitcoin itself. My Overall Market View At the moment, I am keeping an eye on the $66,400 support area and whether BTC can recover above the $69,120 resistance. If support fails, the $61,000–$63,000 zone becomes important to watch. I don't consider every bounce a reversal. I prefer to observe price confirmation, market structure and risk before making any decision. The main thing I learned from this analysis is that looking at technical structure alongside broader market conditions gives a more complete picture of what is happening. #WSOTShowYourAITradeToEarn10USDT
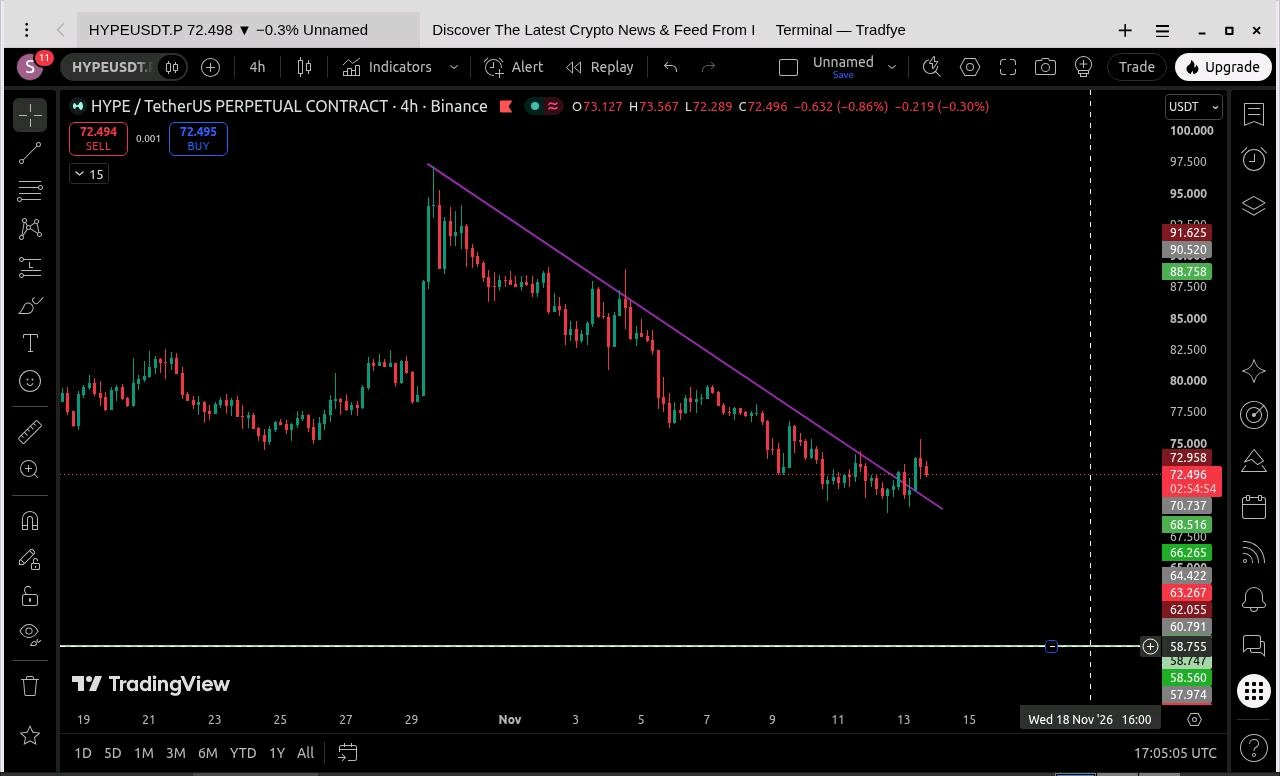
HYPE TREND LINE BREAK 😱
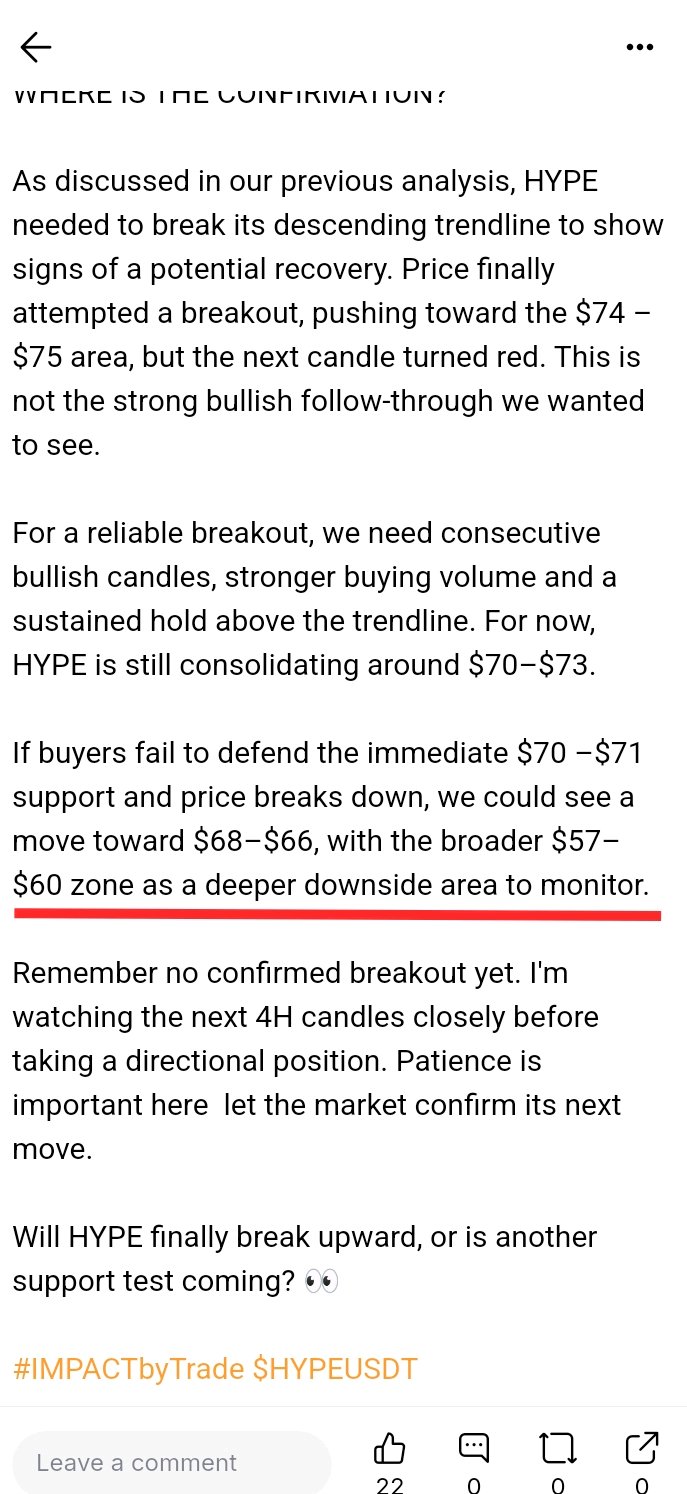
⚡ HYPE UPDATE TRENDLINE BREAKOUT BUT WHERE IS THE CONFIRMATION? As discussed in our previous analysis, HYPE needed to break its descending trendline to show signs of a potential recovery. Price finally attempted a breakout, pushing toward the $74 – $75 area, but the next candle turned red. This is not the strong bullish follow-through we wanted to see. For a reliable breakout, we need consecutive bullish candles, stronger buying volume and a sustained hold above the trendline. For now, HYPE is still consolidating around $70–$73. If buyers fail to defend the immediate $70 –$71 support and price breaks down, we could see a move toward $68–$66, with the broader $57– $60 zone as a deeper downside area to monitor. Remember no confirmed breakout yet. I'm watching the next 4H candles closely before taking a directional position. Patience is important here let the market confirm its next move. Will HYPE finally break upward, or is another support test coming? 👀 #IMPACTbyTrade $HYPEUSDT
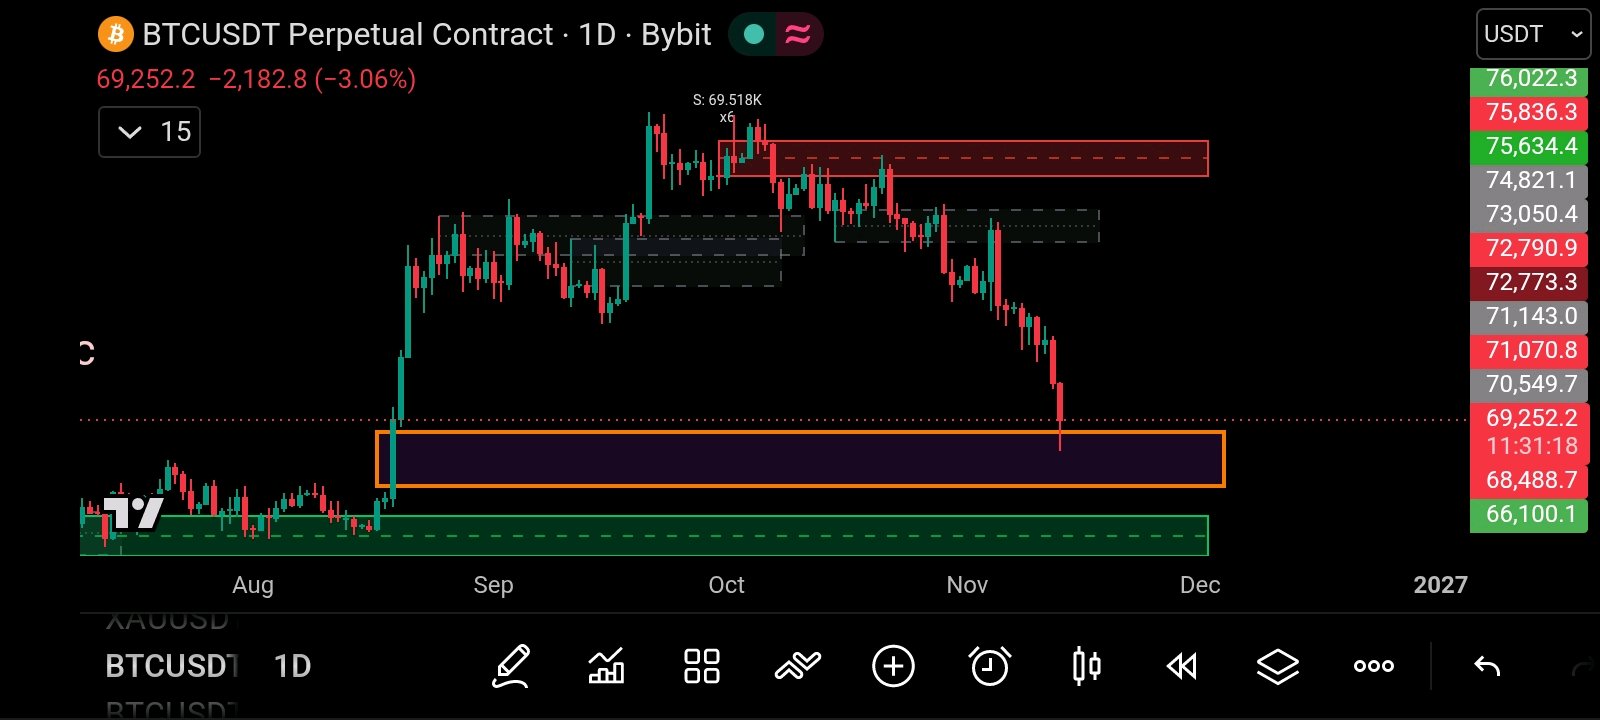
BITCOIN PROBÓ EL FVG DIARIO
Bitcoin ha retrocedido oficialmente y testeó la zona de demanda del Fair Value Gap (FVG) diario principal alrededor de los $65K – $69K 🌐. Tras el intenso flash crash que liquidó más de $750M en posiciones en largo, la acción del precio está mostrando ahora señales tempranas de absorción de compradores en estos niveles más bajos 📉. Con BTC estabilizándose actualmente alrededor de los $69.174, esta zona está actuando como el punto de inflexión definitivo. Así es como estamos operando la configuración 🧠. La Configuración: Planeando una posición EN LARGO condicional desde la defensa del FVG 🟢. Objetivo al alza: $72.000+, donde convergen una liquidez significativa por encima y la estructura previa 🎯 Stop Loss estricto: Colocado claramente por debajo del mínimo del reciente flash crash, alrededor de los $67.000 🛡️ ⚡ Regla de Ejecución: Nunca operes con esperanza ciega. Necesitamos ver una reacción alcista fuerte y verificada y una estructura de confirmación clara en 1h/4h antes de apretar el gatillo. Si esta zona de demanda no se sostiene, respetamos nuestros límites de riesgo inmediatamente y nos hacemos a un lado 📉. La gestión de riesgo siempre va primero. ¡Observemos el flujo de órdenes de cerca y veamos si BTC puede usar este FVG diario como plataforma de lanzamiento para la recuperación! 🚀 ¿Qué dice tu análisis? ¿Se va a los $72K, o vamos a testear niveles más bajos? ¡Deja tu opinión abajo! 👇 $BTCUSDT #WSOT Mostrá tu operación con IA para ganar 10 USDT
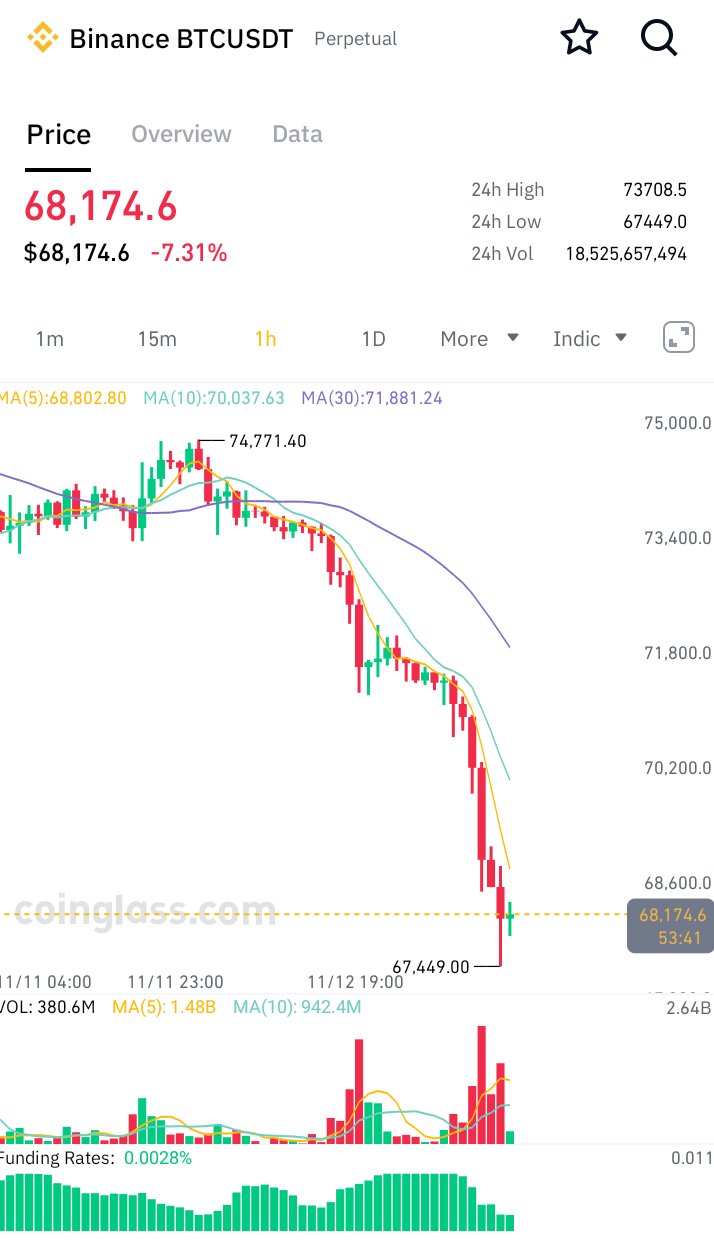
BITCOIN Drop below 68,000 is This end!
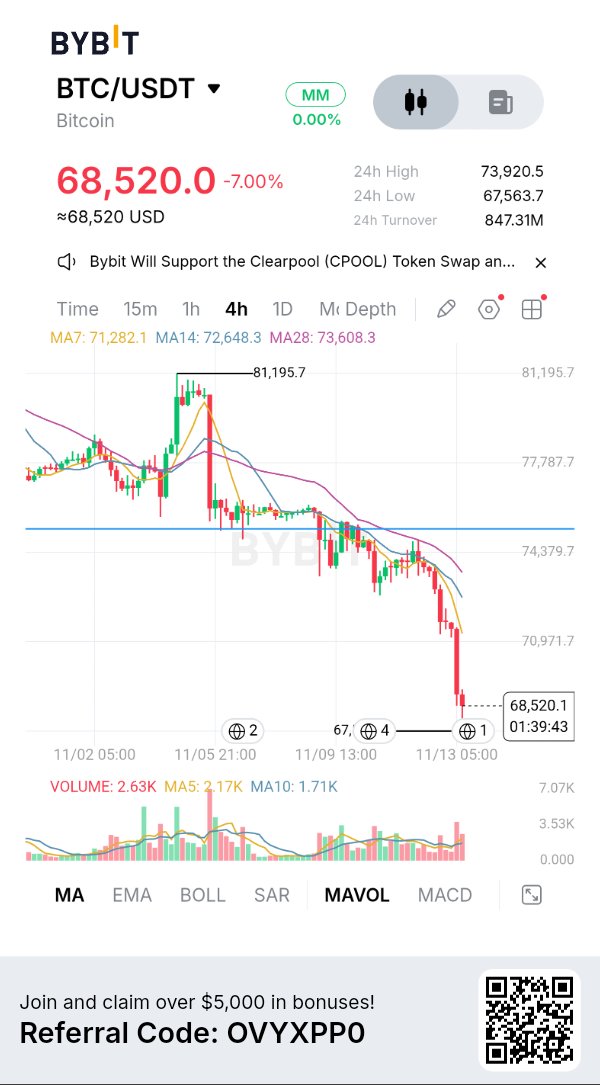
Bitcoin has fallen below $69,000 for the first time in nearly two months, triggering one of the larger leverage resets of recent weeks. After trading near $81,000 last week, $BTCUSDT slid under the $69,000 level on November 13. The move forced roughly $1.4 billion in liquidations across crypto derivatives markets, with long positions accounting for the vast majority of the damage. More than 170,000 traders were liquidated in the cascade. Bitcoin linked liquidations alone totaled around $740 million, while Ethereum saw roughly $250 million wiped out. The broader crypto market followed lower, with total market capitalization dropping about 5–6% to roughly $2.3 trillion. Analysts are framing the sell off primarily as a deleveraging event rather than a fundamental breakdown. Dense clusters of leveraged longs sat just below $70,000. Once that level broke, automatic liquidations accelerated the decline. Macro factors added pressure: recent spot Bitcoin ETF outflows, a stronger U.S. dollar, weakness in tech stocks, and hotter inflation data that raised expectations for tighter financial conditions. Altcoins mirrored the move. Ethereum $ETHUSDT dropped toward the $1,900–$1,925 range, XRP hovered near $1, and names like SOL and DOGE posted losses of 5–9%. The key signals to watch from here are leverage metrics open interest and funding rates, spot ETF flows, and whether Bitcoin can stabilize in the high $60,000s. If forced selling slows and outflows calm, the market could shift into more orderly trading. Renewed heavy leverage, however, would leave it vulnerable to further volatility. In short, this was a sharp leverage flush against a risk off backdrop painful for overextended longs, but not yet a clear structural break in the broader Bitcoin thesis. #ByXIMPACT

Bitcoin just lost the $69K level
$BTCUSDT dropped below $69,000 for the first time in nearly two months, falling from around $81K last week. The move triggered roughly $1.4 billion in liquidations, with the vast majority coming from long positions. Over 170,000 traders got wiped out in the cascade. This looks more like a leverage flush than a fundamental breakdown. Crowded longs below $70K got hit hard, while ETF outflows, a stronger dollar, and broader risk-off sentiment in tech added pressure. Altcoins followed $ETHUSDT slid toward $1,900 – 1,925, XRP hovered near $1. Key things to watch now: - Whether leverage continues to reset - Spot ETF flows - If BTC can hold the high $60Ks Classic leverage reset against a risk off backdrop. #WSOT2026 #BitcoinHitsTwoMonthLowAfterUSMidterms #USInflationRunsHotAndRateHikeBetsRise

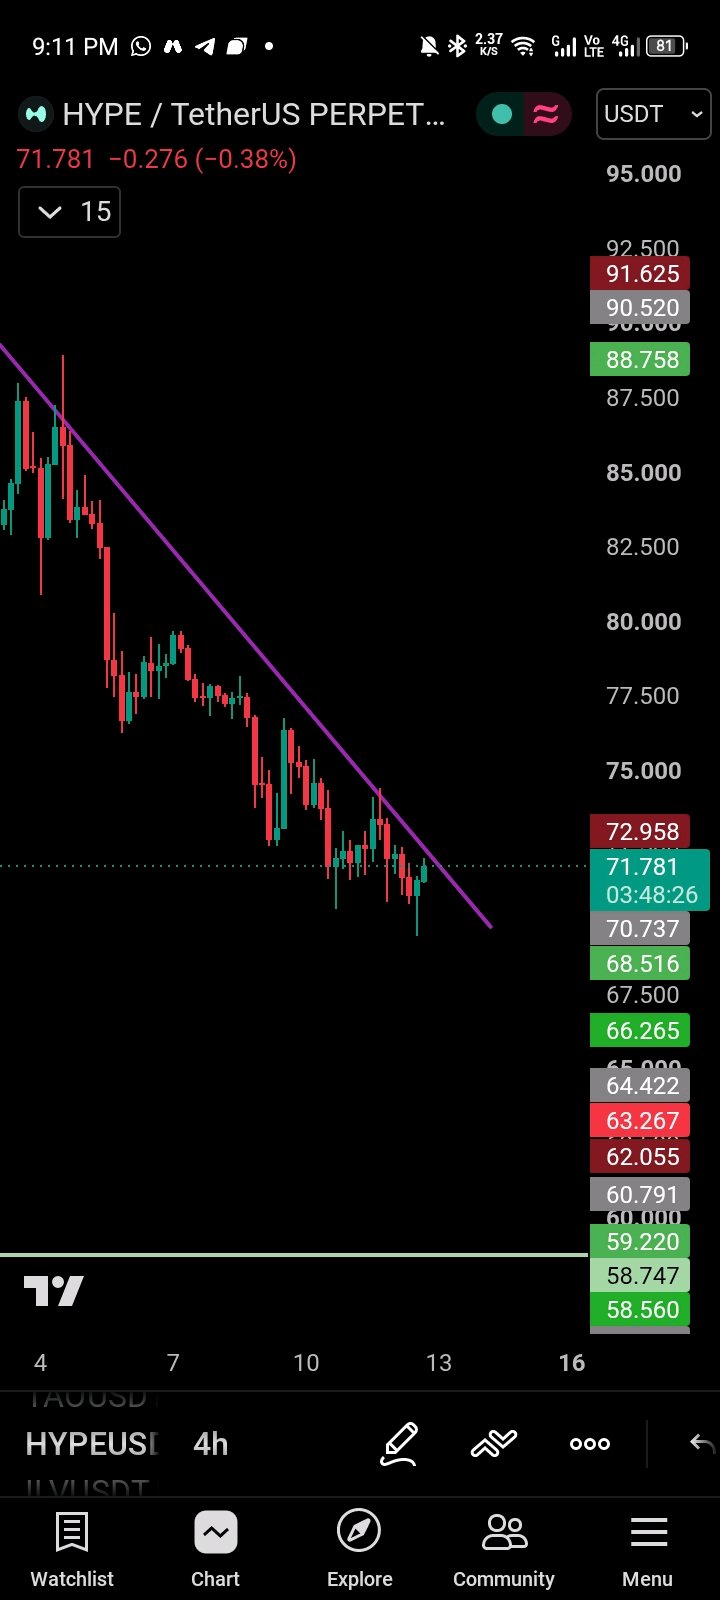
$HYPEUSDT ¡ESTÁN APARECIENDO LOS COMPRADORES! Tal como esperábamos de nuestro análisis anterior, HYPE barrió la liquidez por debajo de la zona de soporte de $70, que ahora muestra señales de actuar como una zona de demanda. Los compradores están intentando empujar el precio hacia arriba, pero la tendencia general sigue siendo bajista, con los vendedores todavía en control. El nivel clave a vigilar es la línea de tendencia descendente: una ruptura confirmada con buen volumen podría activar una recuperación, mientras que otro rechazo podría traer más caídas. Este es un momento crítico, así que cada pequeño movimiento importa. Vamos a ver: ¿ruptura al alza o desplome? 👀 #HYPEUSDT #IMPACTbyTrade
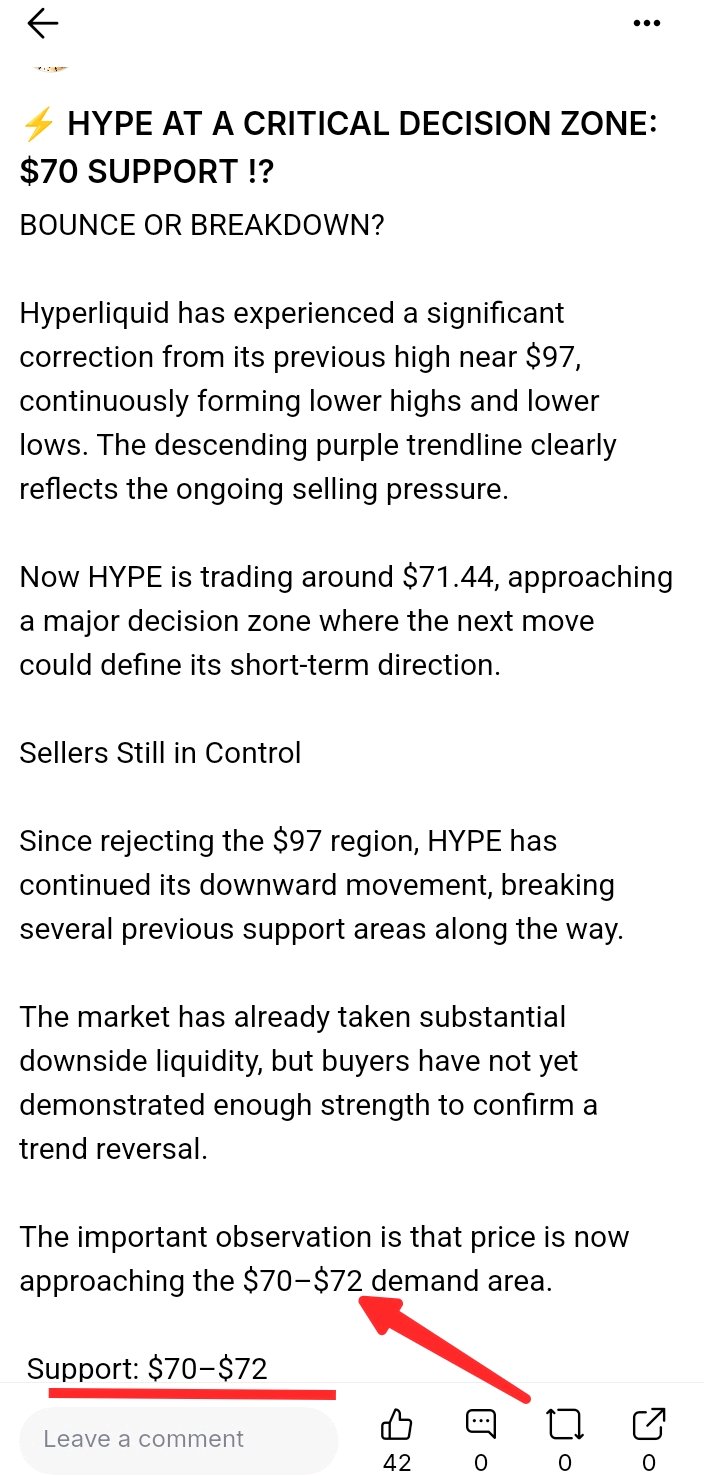
⚡ HYPE EN UNA ZONA DE DECISIÓN CRÍTICA: ¿¡SOPORTE EN $70!?
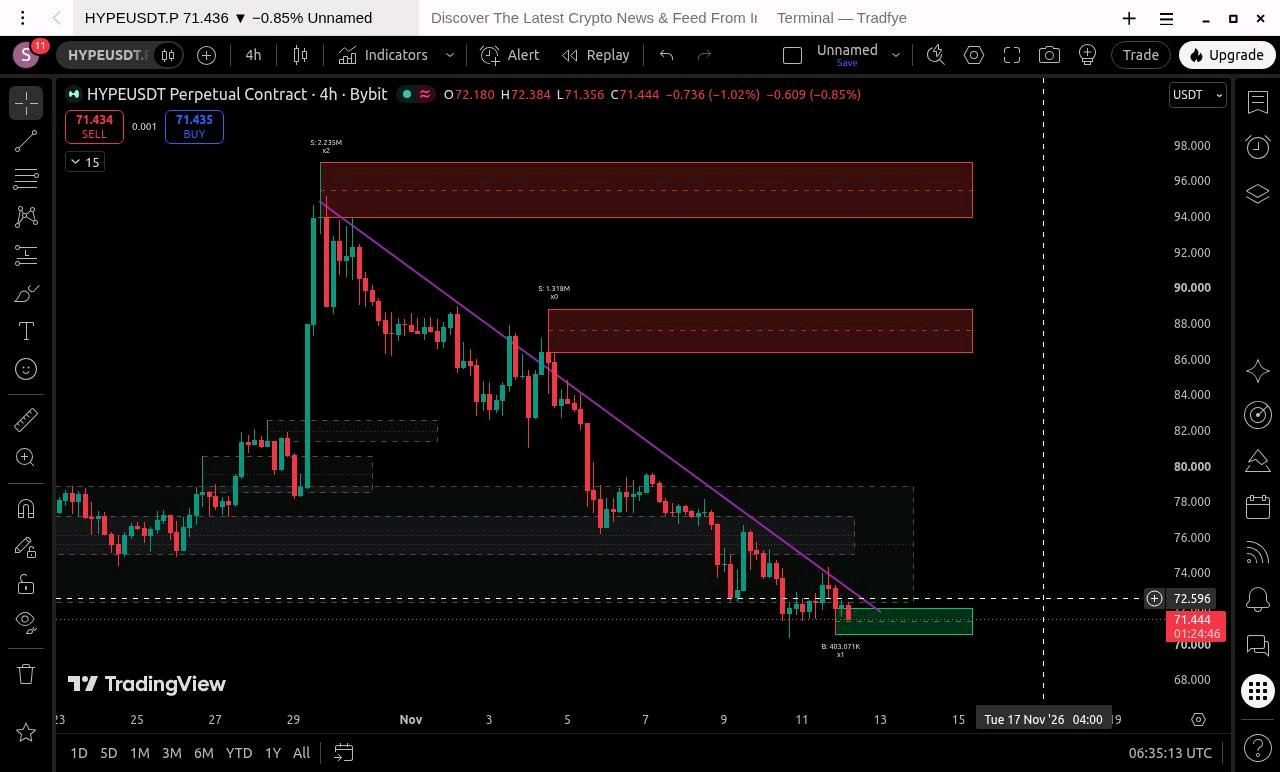
¿REBOTE O QUIEBRE? Hyperliquid ha experimentado una corrección significativa desde su máximo anterior cerca de los $97, formando continuamente máximos y mínimos decrecientes. La línea de tendencia descendente púrpura refleja claramente la presión vendedora en curso. Ahora HYPE cotiza alrededor de los $71.44, acercándose a una zona de decisión importante donde el próximo movimiento podría definir su dirección a corto plazo. Los vendedores siguen al mando Desde el rechazo en la región de los $97, HYPE ha continuado con su movimiento a la baja, rompiendo varias áreas de soporte previas en el camino. El mercado ya ha tomado una cantidad sustancial de liquidez bajista, pero los compradores todavía no han demostrado suficiente fuerza para confirmar un cambio de tendencia. La observación importante es que el precio se está acercando ahora a la zona de demanda de $70–$72. Soporte: $70–$72 Esta es la zona inmediata que estoy mirando. El precio está consolidando cerca de este soporte mientras la línea de tendencia descendente se aproxima a la misma área. Dos escenarios son posibles: Escenario alcista: Si los compradores defienden los $70–$72 y el precio rompe por encima de la línea de tendencia descendente con volumen fuerte, podríamos ver una recuperación hacia los $75 – $76, seguido de un posible movimiento hacia los $78. Escenario bajista: Pero si los vendedores siguen al mando y HYPE rompe decisivamente por debajo de los $70, la próxima área potencial de caída podría estar alrededor de los $66, donde vale la pena monitorear un FVG en la temporalidad diaria. Por ahora, los niveles de confirmación inmediata son: - $70–$72: Soporte principal y zona de demanda. - $72.60: Nivel de recuperación inmediata (reclaim). - $75–$76: Primera resistencia de recuperación. - $78–$79: Siguiente área de liquidez superior/resistencia. - $86–$89: Zona de resistencia más alta. - $94–$97: Oferta principal superior. Un cierre en 4H por encima de la línea de tendencia descendente, apoyado por un mayor volumen de compra, fortalecería el escenario de recuperación. Por otro lado, un rechazo repetido de la línea de tendencia seguido de un quiebre por debajo de los $70 favorecería una mayor caída. Perspectiva fundamental❓ Hay también un desarrollo interesante en el lado fundamental: Upbit anunció el trading de HYPE contra KRW, BTC y USDT el 10 de noviembre, expandiendo su acceso al mercado en Corea del Sur. Este es un desarrollo positivo para la accesibilidad y la liquidez potencial, pero aún no ha revertido la estructura bajista del precio. Un listado por sí solo no garantiza presión compradora. HYPE ha caído significativamente desde su máximo de $97 y ahora se acerca a una zona de soporte mayor alrededor de los $70–$72. En mi opinión, este es el próximo punto de decisión importante del mercado. Si los compradores finalmente rompen la línea de tendencia descendente con volumen fuerte, una recuperación hacia los $78 se vuelve posible. Pero si el soporte de los $70 falla, podríamos ver otra extensión bajista hacia el área de FVG diaria de $66. Por ahora, estoy mirando dos cosas muy de cerca👀: el soporte de los $70 y el quiebre de la línea de tendencia descendente. Veamos qué bando toma el control. #ByXIMPACT $HYPEUSDT
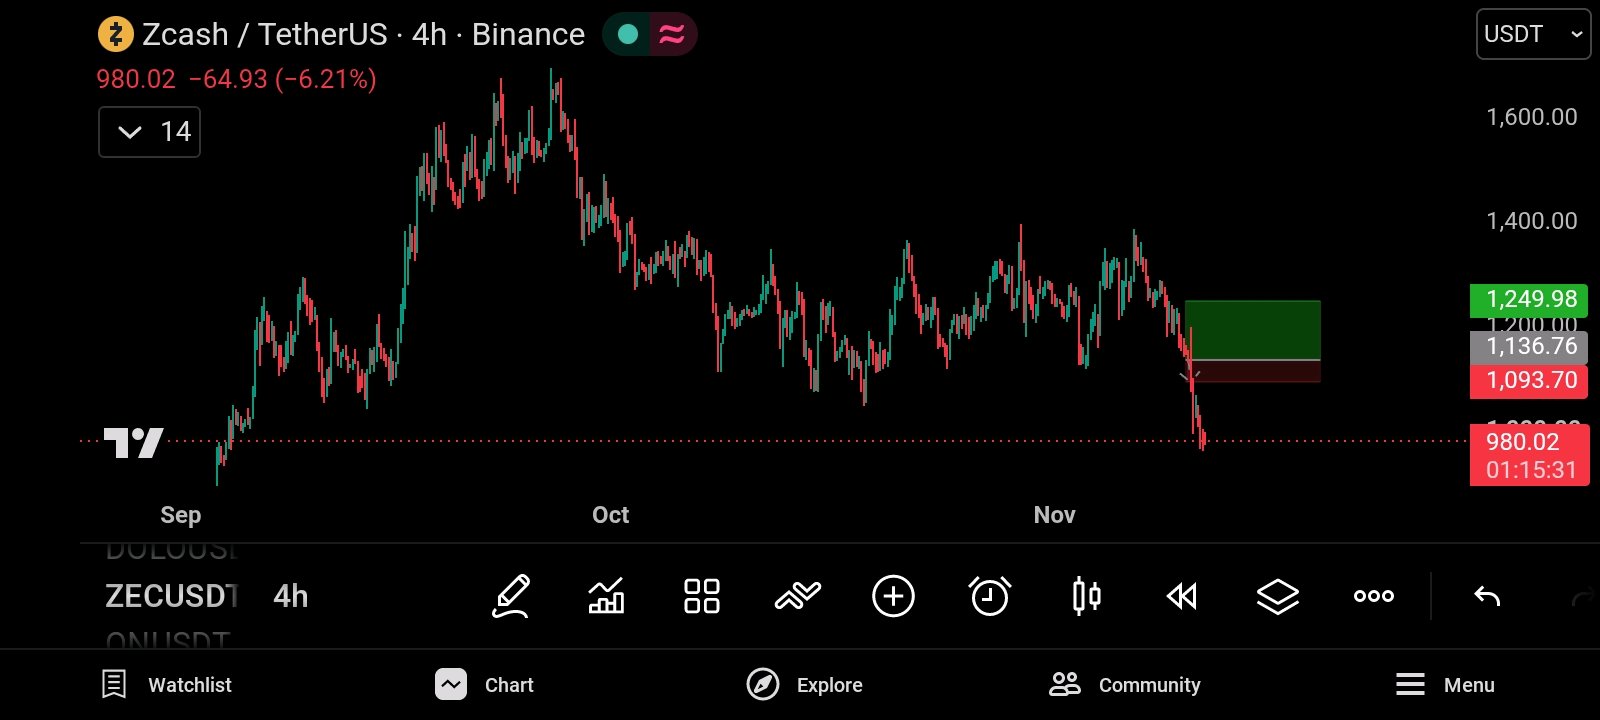
SE CONFIRMÓ LA RUPTURA DEL SOPORTE DE ZEC 👌 LOS OSOS TOMAN EL CONTROL
¿Se acuerdan de mi análisis anterior? Señalé la posibilidad de que ZEC perdiera su soporte importante tras haber sido testeado varias veces. Ese escenario finalmente se dio. ZEC rebotó brevemente desde la zona de los $1.136 hacia los $1.198, pero los compradores no pudieron mantener el impulso. Los vendedores volvieron agresivamente, rompieron la estructura de soporte y empujaron el precio hacia los $980. ¿Entonces qué cambió? La zona de soporte anterior no aguantó y el intento de recuperación fue rechazado. Esto sugiere que los compradores están perdiendo el control y que el mercado podría estar entrando en otra fase bajista. Mi perspectiva bajista actual es: - $980: Área de referencia actual en el gráfico. - $910: Primer objetivo en corto. - $800: Zona bajista más amplia a vigilar. Una recuperación sostenida por encima de la región de soporte rota debilitaría este escenario bajista. ¿Zcash está realmente débil? Curiosamente, los desarrollos fundamentales de Zcash no son del todo bajistas. Actualización de red NU7: Zcash activó su importante actualización NU7 el 6 de noviembre, reduciendo los intervalos de bloque objetivo de 75 a 25 segundos. También introdujo un Mecanismo de Sostenibilidad de Red que destina el 60% de las comisiones de transacción a una reserva. Estas son mejoras de infraestructura significativas a largo plazo. Crecimiento del ecosistema de privacidad: CoinDesk Research informó que el pool blindado Ironwood de Zcash ganó aproximadamente 122.000 ZEC en octubre, mientras que el suministro blindado total aumentó alrededor de 27.000 ZEC hasta aproximadamente 4,97 millones de ZEC. Interés institucional: Según se informa, la cantidad de acciones del ETF de Zcash de Grayscale creció un 54,2% entre su cotización en agosto y el 30 de octubre, lo que indica una creciente exposición institucional. Sin embargo, también hay preocupaciones. Alrededor de 12.224 ZEC permanecieron en el pool retirado Sprout tras la activación de NU7, y la actividad promedio de transacciones blindadas en octubre fue de aproximadamente 4.450 transacciones por día, un 36% menos que en septiembre. Lo interesante es que Zcash tiene un progreso de desarrollo significativo a largo plazo, pero su estructura de precios se ha debilitado considerablemente 📉. Esto sugiere que los fundamentos positivos actualmente no están proporcionando suficiente presión de compra inmediata para superar la actividad de venta. Mi perspectiva a corto plazo sigue siendo cautelosa a bajista, a menos que el precio recupere la región de soporte rota. Mi plan de trading 🔸 Objetivo en corto: $910 Área bajista más amplia: $800 Stop loss: $1.120 Vigilaré si los vendedores mantienen el control y si el precio continúa formando máximos decrecientes. La gestión de riesgos es fundamental. Si se entra alrededor de los $980, el stop en $1.120 representa aproximadamente $140 de riesgo frente a un movimiento de $70 hacia el objetivo de $910. Eso es solo alrededor de 0,5:1 de recompensa-riesgo, por lo que la entrada, el objetivo o el tamaño de la posición merecen una reevaluación cuidadosa. ByXIMPACT
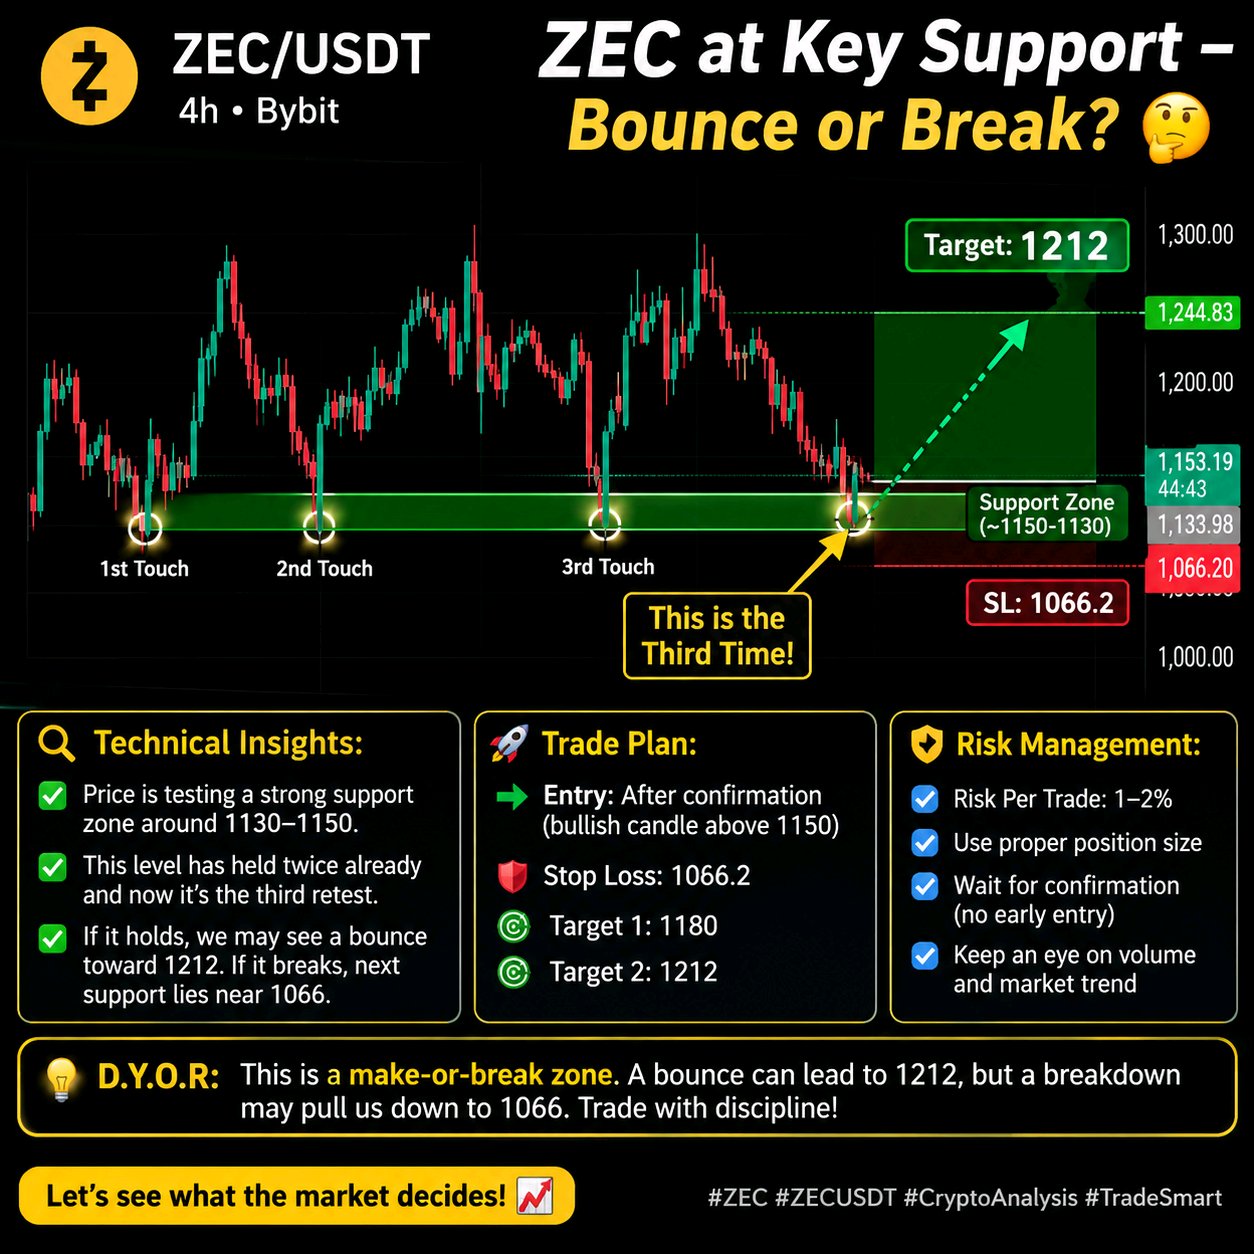
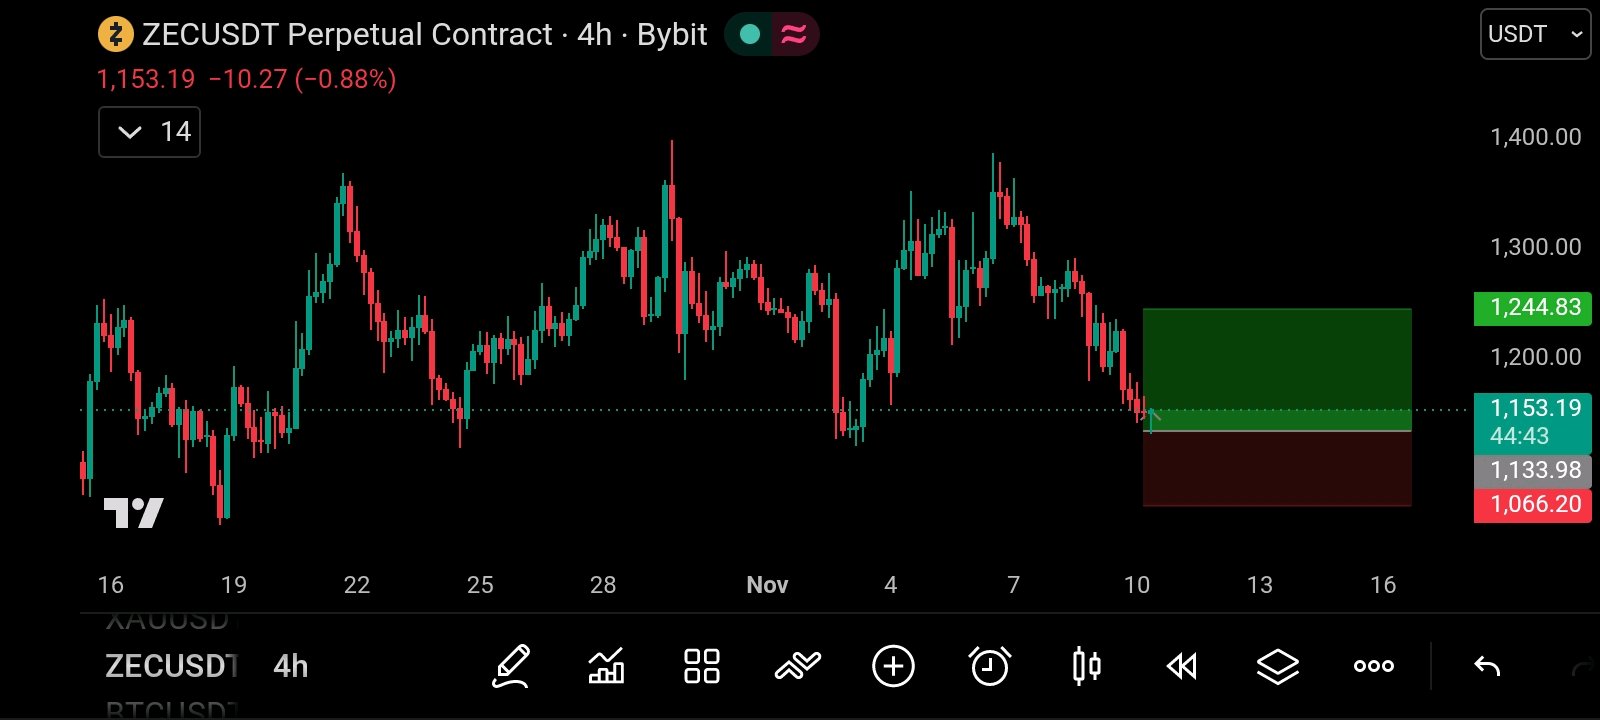
⚡ ZEC THIRD TEST OF SUPPORT BOUNCE OR BREAK?
ZEC is currently trading around $1,153, testing the important $1,134 – $1,153 support zone for the third time on the 4H chart. If buyers defend this area and we get a strong bullish confirmation, I'm interested in a potential LONG, targeting $1,212. My planned stop loss is $1,066.20. However, if support breaks decisively, the bullish setup is invalidated and further downside is possible. I'll wait for confirmation before entering no blind trades. Position sizing and risk management are essential, especially at a third support retest. Will ZEC bounce from here or finally break support? Let's see what the market decides! 👀 DYOR. Manage your risk and never trade blindly. #ByXIMPACT
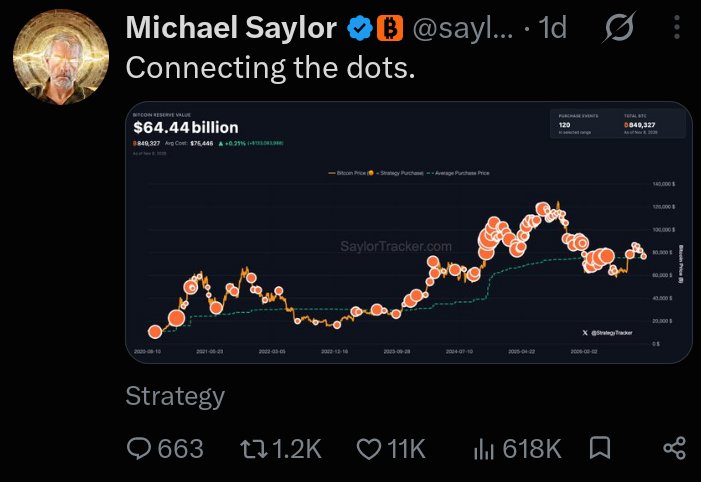
Michael Saylor dropped another Bitcoin tease!
"Connecting the dots" The Strategy chairman's latest X post has sparked speculation about another potential $BTCUSDT purchase. But there's a bigger story behind it. 🧵👇 🟠 Strategy reportedly holds 849,327 BTC, worth approximately $62.98 billion. 📉 Bitcoin falling below Strategy's average purchase price of $75,451 has pushed its holdings into roughly $1 billion in unrealized losses. Just a month ago, Strategy was reportedly sitting on nearly $10 billion in unrealized profits. A dramatic market reversal! 🐻 Bitcoin's Q4 2026 weakness is drawing comparisons with previous bearish cycles in 2014, 2018 and 2022. 📊 Analysts are also warning about weakening momentum, with BTC approaching its fifth consecutive weekly red candle. 💰 Despite the pressure, Strategy reportedly maintains $4.9 billion in USD reserves and recently acquired $208 million worth of STRC. 👀 Now everyone's watching Michael Saylor. Does "Connecting the dots" hint at another Bitcoin purchase? Or is it simply another message about his long term BTC conviction? One thing is clear that Strategy's Bitcoin strategy is facing another major market test. #IMPACTbyTrade #MidtermsMarketWatch
Bybit Expands European Presence With Web Summit
Bybit is strengthening its position in Europe's digital financial sector through its partnership with Web Summit 2026 in Lisbon, following key regulatory approvals in Austria. 🗝️ Taking place from November 9 –1 2, Web Summit 2026 will provide Bybit with an opportunity to showcase its European strategy, financial technology innovations and growing focus on artificial intelligence. A major milestone in the company's expansion is the regulatory progress achieved by its European operations. In May 2025, Bybit EU GmbH received authorization as a Crypto-Asset Service Provider (CASP) under the European Union's MiCA framework. More recently, in August 2026, Bybit Payments GmbH secured an Electronic Money Institution (EMI) license from Austria's Financial Market Authority. These approvals establish a foundation for Bybit to expand its regulated crypto, electronic money and payment services across the European Economic Area. During Web Summit, Bybit executives will participate in discussions about cryptocurrency regulation, AI-powered financial infrastructure and the future of digital finance. The company will also host a masterclass focused on autonomous trading agents. Beyond cryptocurrency trading, Bybit is exploring opportunities in payments, U.S. equities, ETFs and investment services. With more than 80 million users worldwide, Bybit is positioning itself as a broader digital financial platform, combining cryptocurrency services, traditional financial products and emerging AI technologies. Bybit's European expansion highlights the growing convergence between cryptocurrency$BTCUSDT , traditional finance and artificial intelligence, as exchanges compete to become comprehensive financial service providers. #BybitAIEvolving
BNB Chain Dominates Daily Activity
🔥$BNBUSDT Chain just hit 4.86 million active addresses in the last 24 hours ranking #1 among all public blockchains. For comparison: • Solana → ~1.97M • Ethereum → ~535K • Base → ~312K That’s roughly 2.5x Solana and 9x Ethereum in daily active addresses.$SOLUSDT Strong on chain activity continues even as BNB price sits near $684. #NovUSCPIWatch #BybitAIEvolving #WSOT2026

BTC next year !?
Guys what is your analysis about $BTCUSDT for next year 🙃 ? Are we heading towards another massive bull run, or should we expect a major correction? 🤔📈 Would love to hear your thoughts and predictions! 🚀
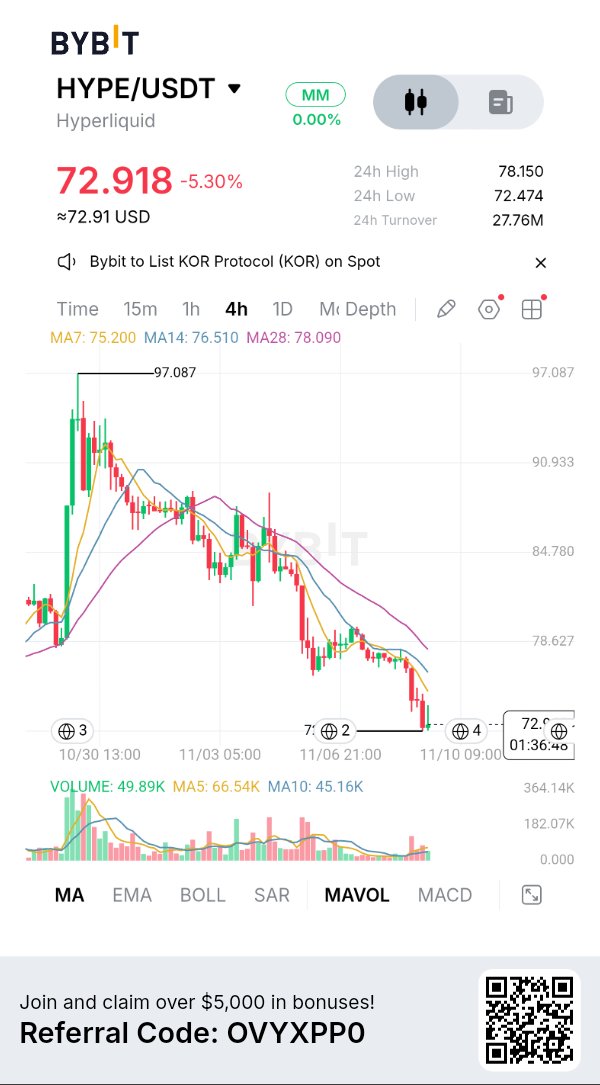
HYPE has pulled back significantly from its $97 peak and is working to build a base at $72.00 – $75.00 🌐⚡. While ecosystem fundamentals like the Elysium L2 launch are strong, price action demands patience 📊. The key level to watch is $75.20 — reclaiming it is the first true signal of recovery 💎📈. Keep your position sizing disciplined and let the market confirm the reversal! What’s your take? Are you buying the $72 support or waiting for a $75.20 reclaim? Drop your thoughts below! 👇$HYPEUSDT #IMPACTbyTrade
🚀 SOLANA: RECOVERY INCOMING?
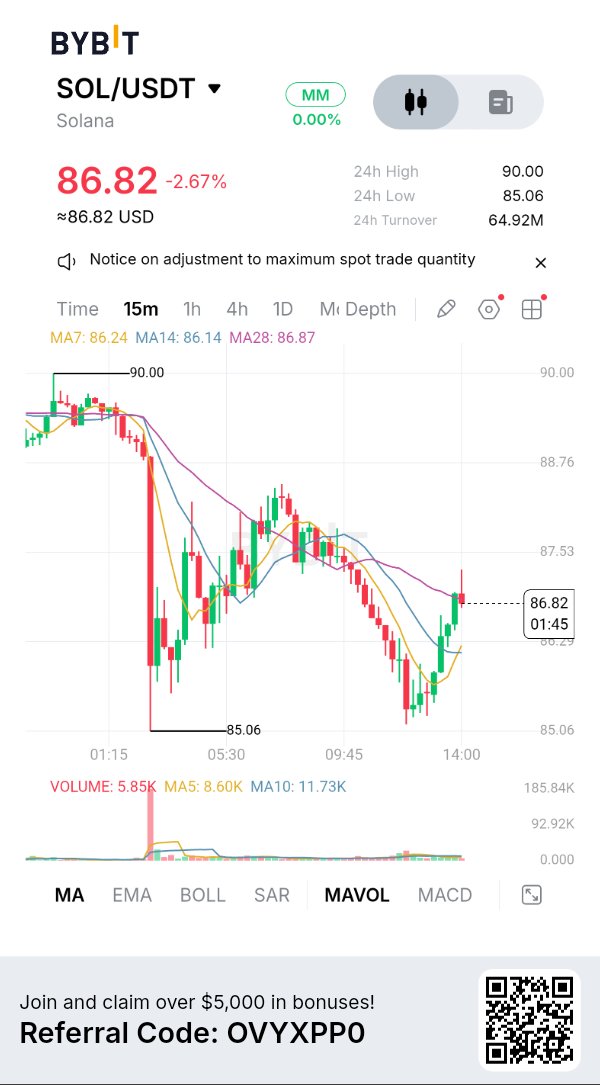
$SOLUSDT dropped sharply from the $96 resistance zone toward $85, but buyers are now showing some strength on the 15-minute chart. If SOL reclaims $88.25 with confirmation, we could see a recovery toward $90 and potentially $92. A long setup may develop, but the 4H trend remains bearish, so patience and proper risk management are essential. Can SOL make a comeback? 👀📈 #SOLUSDT #NovUSCPIWatch #WSOT2026
🚨 SE MOVIMIENTOS 344 MILLONES DE DÓLARES EN BITCOIN
Una transferencia masiva de Bitcoin ha puesto a Trump Media en el centro de atención del mercado. Según se informa, las billeteras etiquetadas como “Colateral de Notas Convertibles 2028” movieron 4.259 BTC, con un valor aproximado de 344 millones de dólares, a una dirección de Crypto.com en dos transacciones. Eso es casi el 30% de las tenencias de Bitcoin reportadas por Trump Media. Pero una transferencia no significa automáticamente una venta. Movimientos similares en mayo y agosto, según se informó, no llevaron a una liquidación en el mercado, lo que sugiere que detrás del último movimiento podría haber una reestructuración de custodia o una gestión de colaterales.$BTCUSDT La mayor preocupación es el 30 de noviembre. De acuerdo con los documentos de valores presentados, los tenedores de notas podrían tener el derecho de exigir hasta 1.000 millones de dólares en reembolsos en efectivo. Con reservas de efectivo reportadas anteriormente de alrededor de 425 millones de dólares, los inversores están observando de cerca cualquier señal de venta de activos o nuevos acuerdos de colateral. La pregunta clave: ¿Es esto simplemente una gestión institucional del balance general, o podría Bitcoin convertirse en una fuente de liquidez para las próximas obligaciones corporativas? Por ahora, la transferencia está confirmada por el movimiento on-chain reportado, pero no se ha establecido una venta real de Bitcoin. No confundan la actividad de las billeteras con presión de venta en el mercado. 📊 #WSOT2026 #Seguimiento IPC EE.UU. Nov #Las nóminas de EE. UU. y las decisiones sobre tasas de interés impulsan la semana macroeconómica

Bitcoin en punto de decisión
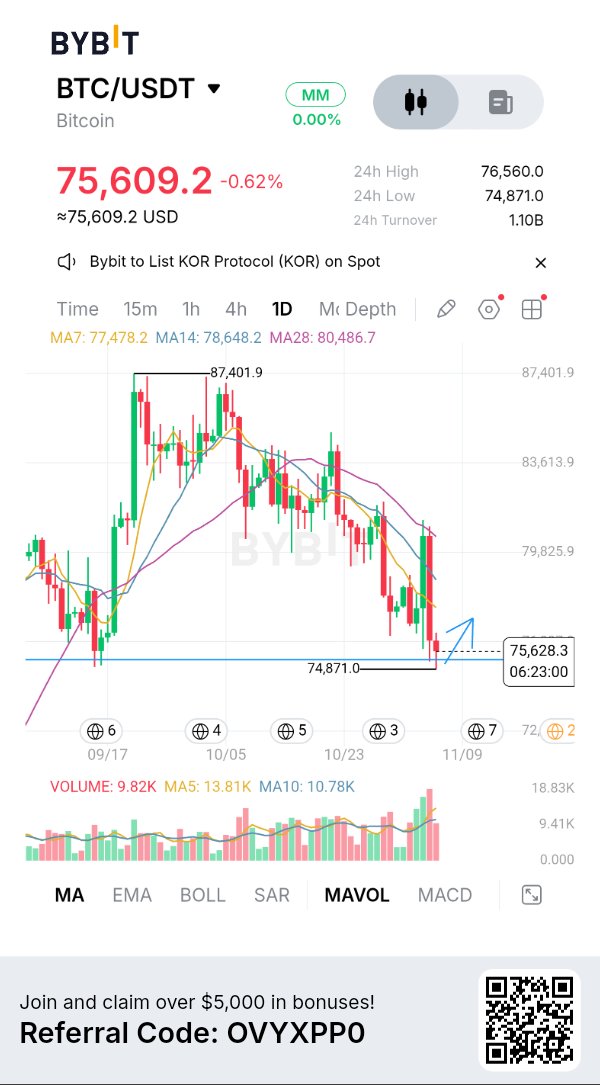
$75K SOPORTE — ¿LOS TOROS DEFENDERÁN EL PISO? 🚀 Bitcoin está presionando actualmente la zona crítica de soporte de $75.000 tras un retroceso continuo desde los máximos locales cerca de $87.400 🌐. El gráfico diario resalta un barrido de liquidez hasta los $74.871, poniendo al mercado en una coyuntura decisiva de todo o nada 📈. Este es un nivel clave donde los compradores necesitan aparecer para evitar una corrección macro más profunda. ¿Podrá $BTCUSDT estabilizarse aquí y lanzar una recuperación hacia los $78.000–$80.000, o necesitamos más liquidez a la baja antes de un verdadero rebote? Analicémoslo 🧠. 1. La prueba de soporte de $75K: Observaciones clave 🔍 La acción del precio en el marco temporal diario muestra una clara presión vendedora que arrastra a BTC por debajo de sus medias móviles (MA7: $77.478, MA14: $78.648, MA28: $80.486) 📉. Barrido de liquidez: BTC bajó hasta $74.871 antes de absorber la presión vendedora inmediata, dejando una pequeña mecha en la vela diaria 🟢. Perfil de volumen: El volumen diario muestra ventas persistentes, pero está empezando a contraerse cerca del piso de soporte, lo que indica un posible agotamiento de los vendedores 🛡️. 2. Los objetivos de recuperación: Lo que los toros necesitan reclamar 🧱 Si los compradores defienden este piso de soporte diario, el objetivo principal será recuperar las medias móviles superiores 📊. Resistencia inmediata: $77.400 – $78.600 (Confluencia de MA7 y MA14) 🛑 Objetivo principal de ruptura: Línea de defensa MA28 en $80.400 🚀 Objetivo alcista extendido: $83.600 – $87.400 Reclamación del máximo del swing macro 🎯 El escenario alcista: Un cierre de vela diario fuerte por encima de $76.500 confirma un interés de compra agresivo, abriendo las puertas para un rápido rally de alivio hacia los $78.000–$80.000 ⚡. El escenario de precaución: Si BTC no logra mantener el mínimo de $74.800 y pierde el soporte diario, el mercado corre el riesgo de extender su retroceso hacia zonas de demanda más bajas antes de establecer un suelo permanente 📉. 🎯 Niveles clave a vigilar 👀 Resistencia actual: $77.478 línea MA7 🛑 Zona de ruptura mayor: $78.600 – $80.486 (Confluencia de MA14 y MA28) 🟢 El piso de soporte crítico está en $74.871 – $75.000 Mínimo local y demanda diaria 🛡️ Objetivo alcista macro: $78.000 – $80.000 (Objetivos de rally de alivio)$XRPUSDT 🎯 por ahora Bitcoin está poniendo a prueba a los compradores en la zona de soporte de $75.000 🌐⚡. Aunque un rebote hacia los $78.000–$80.000 sigue siendo un escenario sólido de alta probabilidad, todavía necesitamos volumen de compra real y una fuerte reacción de cierre diario para confirmar la reversión 💎📈. No se apuren con operaciones no confirmadas esperen la confirmación estructural, respeten sus stop losses y operen con disciplina. ¿Cuál es tu plan? ¿Estamos manteniendo los $75K para una reversión a $80K, o primero vamos a romper más abajo? ¡Dejen sus opiniones abajo! 👇 #IMPACTbyTrade #WSOT2026 #Seguimiento IPC EE.UU. Nov