
KnoxCrypto
5224Me gusta0Compartir en el chat102Aficionados58Seguir
Spot Trader & Comunty Builder
Spot Trader & Comunty Builder
$ZILUSDT ¡ENTREGA LOS TRES OBJETIVOS LOGRADOS CON ÉXITO! ¡Otro movimiento fuerte de Zilliqa ($ZIL)! El precio siguió la dirección esperada, con TP1, TP2 y TP3 alcanzados exitosamente. ZILUSDT Perpetuo Precio actual: $0.001179 Cambio en 24H: -14.99% Los tres objetivos se han completado, marcando otra oportunidad de trading exitosa. Felicitaciones a todos los que siguieron el análisis y aprovecharon este movimiento. Se vienen más oportunidades en el mercado. ¡Manténganse enfocados, gestionen el riesgo y sigan mirando los gráficos! #WSOT2026

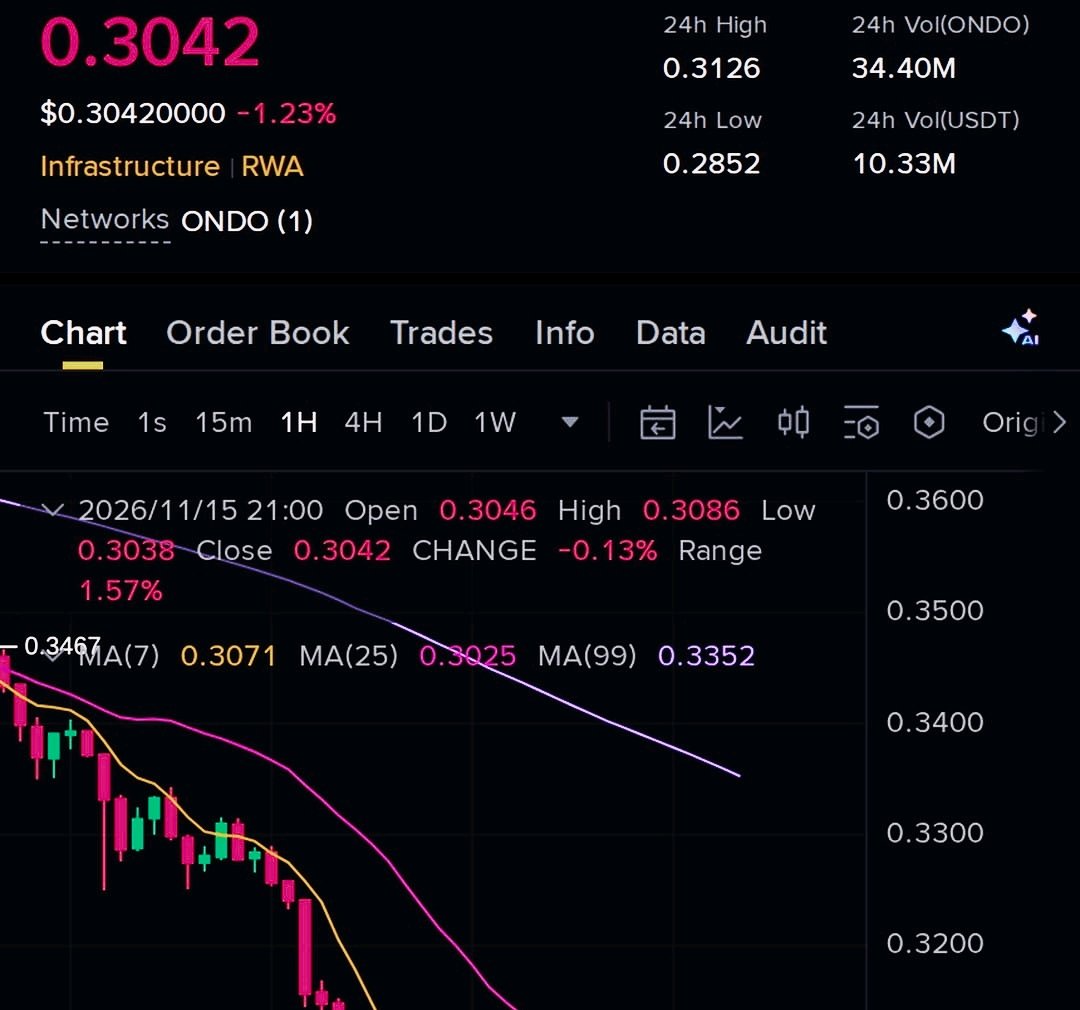
$ONDOUSDT FACES ANOTHER REJECTION SELLERS REMAIN IN CONTROL ONDO bounced toward a key resistance zone, but buyers failed to maintain upward momentum. Sellers quickly stepped in, suggesting that bearish pressure is still present and the recovery may be losing strength. The rejection around $0.3041–$0.3055 is an important area to watch. If price continues to struggle below this zone, further downside could develop. Key figures $0.3041–$0.3055 — Resistance and rejection zone $0.3122 — Level that would invalidate the bearish outlook $0.2941 — First downside support $0.2850 — Secondary support $0.2743 — Deeper downside level Bearish outlook: Continued rejection below resistance could keep sellers in control, with $0.2941 as the first important downside area. A breakdown could expose $0.2850 and potentially $0.2743. Bullish outlook: If ONDO reclaims resistance and establishes acceptance above $0.3055, bearish momentum could weaken. A move above $0.3122 would further challenge the current bearish structure. For now, ONDO remains under pressure, and the next reaction around resistance will be important. #WSOT2026

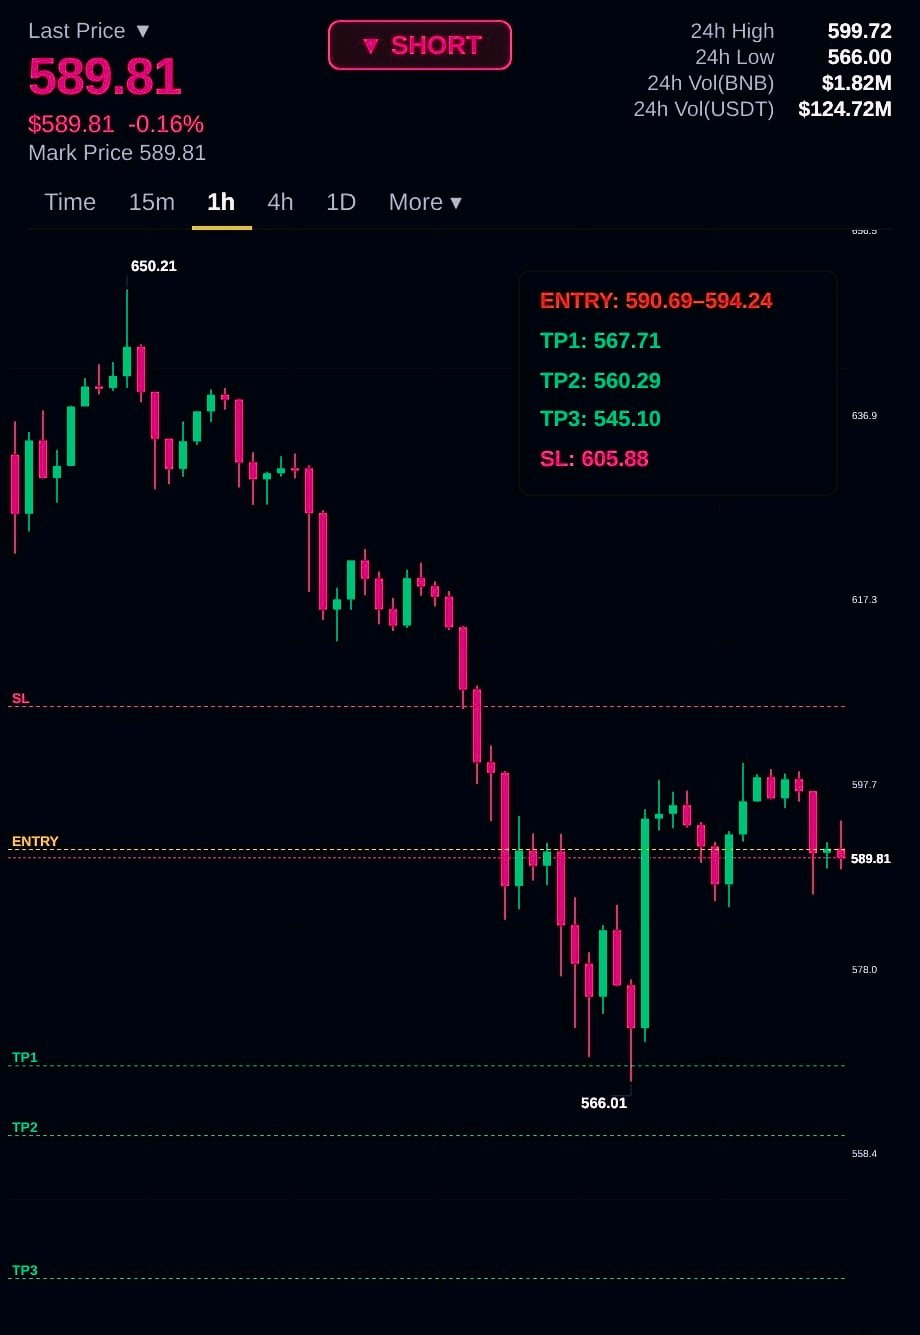
$BNBUSDT LOS BAJISTAS SIGUEN AL MANDO, LA PRESIÓN VENDEDORA PERSISTE BNB muestra señales de debilidad, con el RSI actualmente alrededor de 43, lo que indica que el impulso bajista sigue siendo más fuerte que la presión compradora. El precio está luchando por recuperar fuerza alcista, manteniendo la perspectiva a corto plazo inclinada hacia la baja. Cifras clave $590,69–$594,24 — Zona de entrada $605,88 — Nivel de stop-loss $567,71 — Primer objetivo a la baja $560,29 — Segundo objetivo a la baja $545,10 — Objetivo extendido a la baja Perspectiva del mercado Mientras BNB se mantenga por debajo de la zona de los $594,24, los vendedores podrían seguir dominando. Un rechazo desde esta área podría aumentar la posibilidad de un mayor movimiento a la baja. Sin embargo, una recuperación sostenida por encima de los $594,24 debilitaría la estructura bajista, mientras que un movimiento por encima de los $605,88 invalidaría esta perspectiva bajista a corto plazo. RSI: 43 — El impulso favorece actualmente a los vendedores, pero es importante esperar una mayor confirmación. Mantengan la disciplina y gestionen el riesgo con cuidado. #WSOT2026
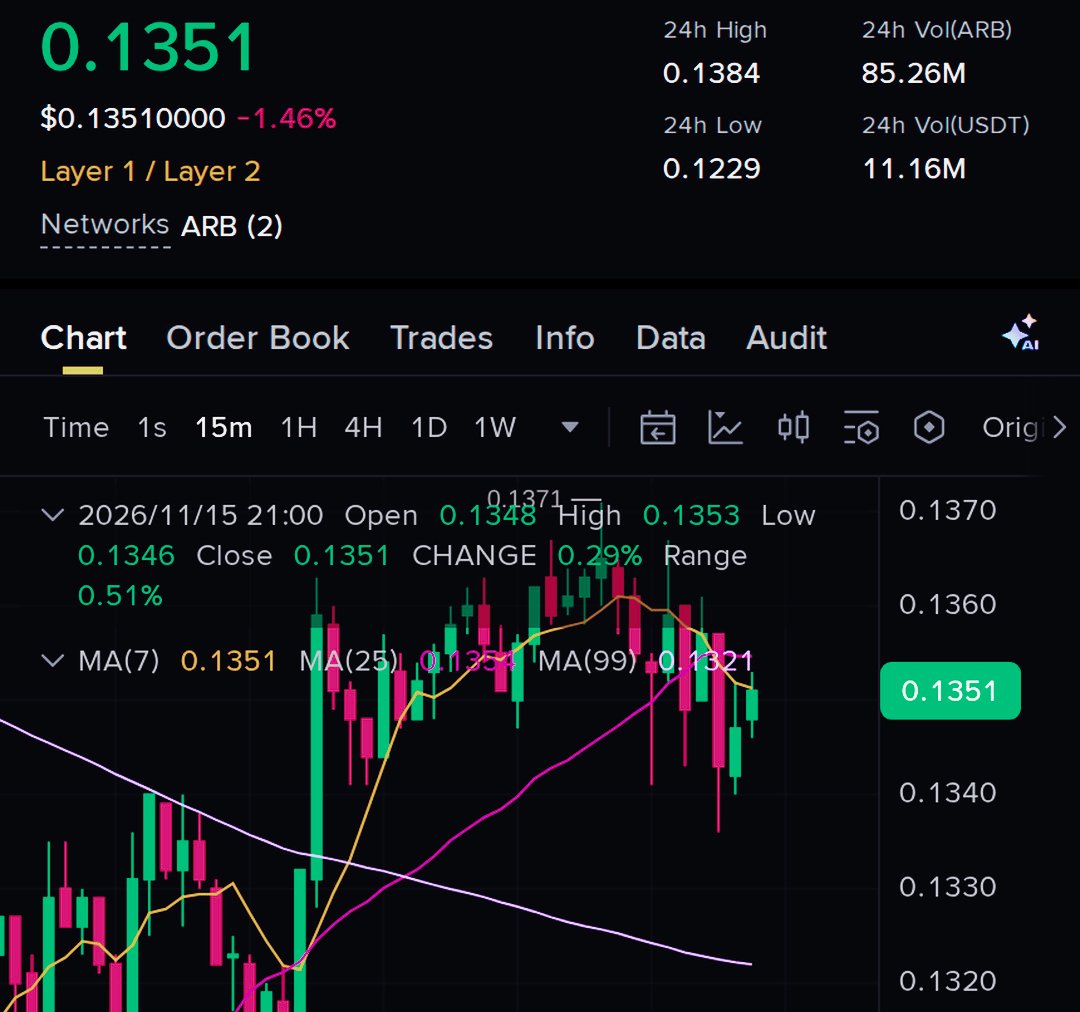
$ARBUSDT MUESTRA RESILIENCIA; LOS COMPRADORES INTENTAN RECUPERAR EL CONTROL. Arbitrum (ARB) está mostrando señales alentadoras de fortaleza después de haber logrado aguantar su reciente caída mejor de lo esperado. A pesar de la incertidumbre general en el mercado, los compradores están defendiendo la zona de precio actual, lo que sugiere que la presión vendedora podría estar perdiendo impulso gradualmente. La reacción en torno a los $0.1348–$0.1352 es particularmente importante. La estabilidad del precio en esta zona podría ayudar a establecer una estructura de recuperación a corto plazo, especialmente si los compradores siguen entrando y evitan otro derrumbe. Sin embargo, ARB todavía necesita un mayor volumen de compra para confirmar que este rebote tiene suficiente fuerza para desarrollarse en un movimiento alcista sostenido. Cifras clave $0.1348–$0.1352 — Zona de demanda importante donde los compradores están intentando defender el precio. $0.1382 — Primer nivel de resistencia y punto de control de recuperación inicial. $0.1406 — Siguiente zona al alza si continúa el impulso alcista. $0.1449 — Objetivo de resistencia más alto en una recuperación extendida. $0.1328 — Soporte crítico y nivel de invalidación para la estructura alcista actual. Escenario alcista Si ARB continúa manteniéndose por encima de la región de $0.1348, los compradores podrían empujar gradualmente el precio hacia los $0.1382. Un movimiento exitoso por encima de este nivel mejoraría la estructura a corto plazo y potencialmente abriría espacio para una mayor recuperación hacia los $0.1406. Si la presión compradora se fortalece y el volumen respalda la ruptura, la región de $0.1449 podría convertirse en la próxima zona importante a vigilar. Escenario bajista La recuperación sigue siendo vulnerable si los compradores no logran defender la zona de demanda actual. Un movimiento sostenido por debajo de $0.1348 indicaría un debilitamiento de la demanda y podría traer presión vendedora adicional. Perder el soporte de $0.1328 invalidaría la perspectiva alcista actual y sugeriría que los vendedores han recuperado el control de la tendencia a corto plazo. Perspectiva del mercado ARB está mostrando una mejor resiliencia en torno a sus mínimos recientes, lo cual es un desarrollo alentador para los compradores. Sin embargo, mantener el soporte es solo el primer paso. La verdadera confirmación vendrá de una recuperación sostenida por encima de los $0.1382, seguida de una mayor aceptación en torno a los $0.1406. Por ahora, la clave es si los compradores pueden convertir esta acción defensiva del precio en un impulso alcista genuino. #WSOT2026

$UNIUSDT ENFRENTA OTRO RECHAZO Y VUELVE LA PRESIÓN DE VENTA. Uniswap (UNI) está luchando por mantener su recuperación a medida que los vendedores vuelven a aparecer cerca de una zona de resistencia importante. El rebote reciente ha llevado el precio de vuelta a un área donde la presión bajista se está haciendo visible, lo que sugiere que a los compradores todavía les cuesta establecer el control. El rechazo alrededor de los $5.12–$5.148 merece atención. Si UNI sigue sin poder mantenerse por encima de esta región, la recuperación podría perder impulso y abrir la puerta a otro movimiento a la baja. Sin embargo, la confirmación de la acción del precio sigue siendo importante antes de esperar una corrección más profunda. Cifras clave $5.12–$5.148 — Resistencia inmediata y zona de rechazo. $4.972 — Primer nivel a la baja para observar. $4.849 — Soporte secundario si los vendedores mantienen el control. $4.679 — Área a la baja más profunda en caso de debilidad prolongada. $5.241 — Nivel de invalidación para el escenario bajista. Escenario bajista Si UNI se mantiene por debajo de la zona de resistencia, los vendedores podrían seguir controlando la estructura a corto plazo. Una ruptura por debajo de los $4.972 podría aumentar la presión a la baja hacia los $4.849. Una mayor debilidad en el mercado cripto en general podría exponer la región de los $4.679. Escenario alcista Por otro lado, una fuerte recuperación por encima de los $5.148 podría desafiar la perspectiva bajista. Si los compradores logran recuperar la resistencia y mantenerse por encima de ella, la presión de venta podría debilitarse gradualmente. Un movimiento hacia los $5.241 sería una señal importante de que la estructura bajista actual está perdiendo fuerza. Perspectiva del mercado UNI está mostrando dudas tras su último intento de recuperación, con la resistencia continuando atrayendo vendedores. El próximo movimiento dependerá de si los compradores pueden recuperar el área de los $5.14 o si los vendedores logran empujar el precio hacia un soporte más bajo. Mantente enfocado en la confirmación y gestiona el riesgo con cuidado en lugar de reaccionar a cada movimiento a corto plazo. #WSOT2026

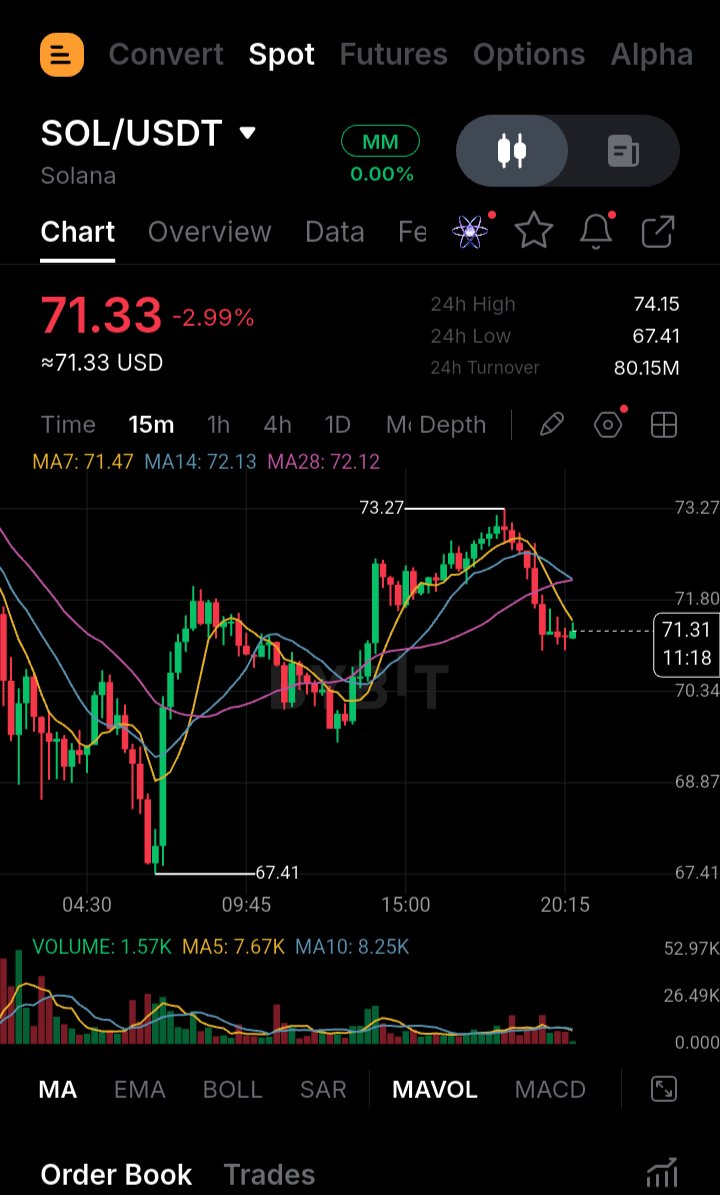
$SOLUSDT ENFRENTA PRESIÓN DE VENTA Y HAY QUE ESTAR ATENTOS A UNA CORRECCIÓN MÁS PROFUNDA Solana está mostrando señales de debilidad después de que le costara mantener el impulso alcista cerca de una zona de resistencia clave. Los compradores intentaron empujar el precio al alza, pero la presión de venta se está haciendo notar, lo que sugiere que la recuperación podría estar perdiendo fuerza. La estructura actual favorece una perspectiva bajista cautelosa, especialmente si SOL sigue enfrentando rechazo alrededor de la zona de los 71,30. Si no logra recuperar esta área, los vendedores podrían tener otra oportunidad para empujar el precio hacia niveles de soporte más bajos. Cifras clave 71,14 $ – 71,30 $ — Zona importante de resistencia y entrada. 69,09 $ — Primer nivel a la baja para monitorear. 67,30 $ — Soporte secundario si aumenta la presión de venta. 65,52 $ — Nivel bajista más profundo en caso de una corrección extendida. 73,39 $ — Nivel de invalidación para la estructura bajista. Escenario bajista Si SOL no logra romper por encima de la zona de resistencia y sigue formando máximos más bajos, los vendedores podrían recuperar el control. Un movimiento sostenido por debajo de los 69,09 $ fortalecería el impulso bajista y potencialmente expondría la región de los 67,30 $. Si continúa la debilidad en todo el mercado, el área de los 65,52 $ también podría entrar en foco. Escenario alcista Sin embargo, si los compradores logran recuperar los 71,30 $ y establecerse por encima de la resistencia, la perspectiva bajista podría debilitarse. Una recuperación hacia los 73,39 $ invalidaría la estructura bajista actual y sugeriría que los compradores están retomando el control. Perspectiva del mercado SOL sigue bajo presión cerca de la resistencia, pero es importante confirmar antes de asumir otra caída importante. Observá la reacción alrededor de los 71,14 $ – 71,30 $ y cómo se comporta el precio cerca del primer soporte. Apalancamiento mencionado: 24x. La gestión de riesgos sigue siendo esencial en condiciones de mercado volátiles. #WSOT2026

SE LIQUIDARON POSICIONES EN CRIPTO POR U$S 2.050 MILLONES MIENTRAS LOS TRADERS EN LARGO ENFRENTAN UNA PRESIÓN MASIVA El mercado cripto experimentó una gran ola de liquidaciones en las últimas 24 horas, afectando a 329.339 traders. Los traders en largo absorbieron la mayor parte del daño, representando aproximadamente U$S 1.922 millones (93%) del total de las liquidaciones. La liquidación individual más grande fue una posición de ETH de U$S 16,17 millones en Binance. Mientras tanto, ETH está cotizando alrededor de los U$S 1.831,38, con una baja del 3,21%. ¿Será que esta venta masiva está limpiando el exceso de apalancamiento antes de un posible repunte del mercado, o podría haber más caídas por delante? El próximo movimiento podría revelar si los compradores están listos para volver a entrar o si los vendedores siguen teniendo el control.ETHUSDT NEARUSDT WSOT2026

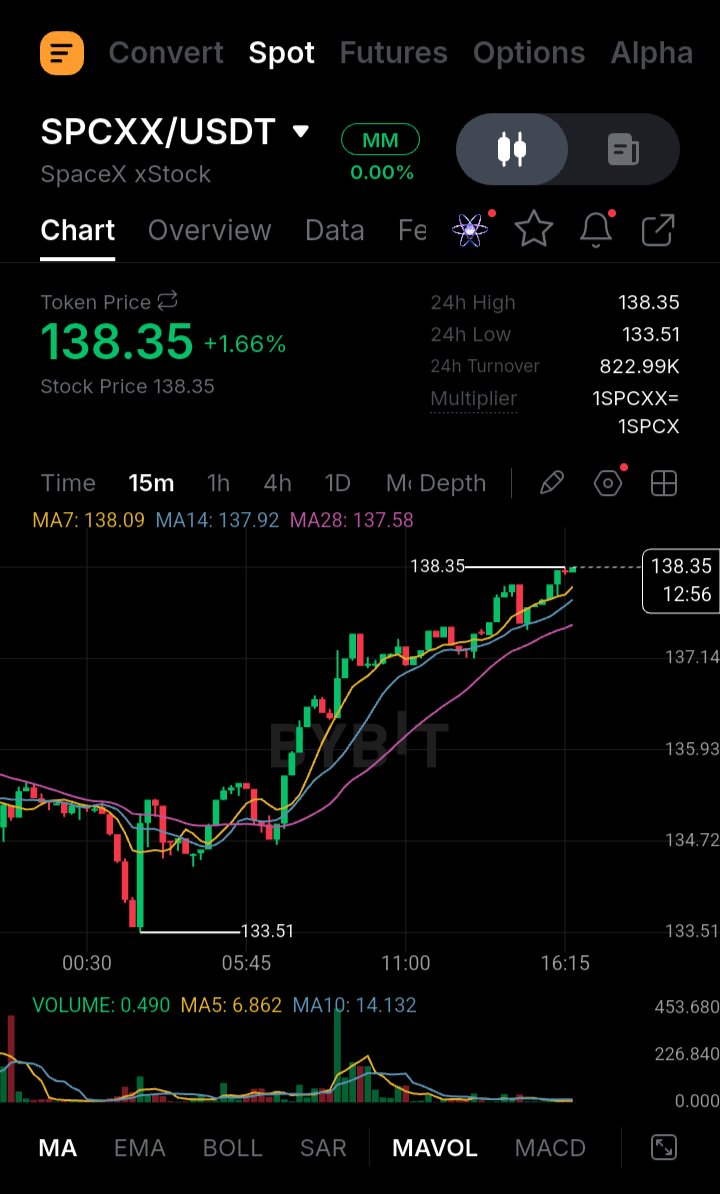
$SPCXXUSDT RECOVERY MOMENTUM BUILDING CAN BUYERS PUSH TOWARD $148.50? SPCX is showing encouraging signs of recovery after buyers stepped in around the $133.00 support region and prevented further downside. Price has climbed from $133.55 to $138.33, indicating that buying interest is gradually returning after the recent correction. The latest rebound suggests that sellers are losing some control, but bulls still need to overcome nearby resistance before a stronger upward move can develop. The $139.40 level is particularly important because a decisive breakout above this area could attract additional buying pressure and strengthen the recovery structure. Key figures $138.33 — Current price area $133.00–$133.55 — Major support zone $139.40 — Immediate resistance and breakout level $142.70 — Next upside objective $148.50 — Extended recovery level Bullish Scenario If SPCX continues holding above $133.00, buyers may have an opportunity to extend the current recovery. A sustained move above $139.40 would be an important confirmation of improving momentum and could open the way toward $142.70. If bullish pressure remains strong beyond that level, the next area to watch would be $148.50. Reaching this zone would indicate a more substantial recovery rather than just a temporary bounce. Bearish Scenario On the downside, failure to break above $139.40 could lead to another period of consolidation or a short-term pullback. Losing the $133.00 support zone would weaken the recovery structure and suggest that sellers are regaining control. Market Outlook SPCX is showing early signs of renewed buying interest, but confirmation is still needed. The reaction around $139.40 will be important in determining whether this recovery can develop into a stronger rally. Can SPCX bulls secure a breakout above $139.40 and push toward $142.70, or will sellers interrupt the recovery? #WSOT2026

$ADAUSDT SHOWS RECOVERY STRENGTH AFTER RECLAIMING $0.1539 BUYERS TRY TO REGAIN CONTROL Cardano is showing renewed buying interest after recovering from the $0.1430 support area and pushing back above the important $0.1539 level. This recovery suggests that buyers are attempting to regain control after the recent downside pressure. The latest price movement is encouraging, but the bigger question is whether ADA can maintain its position above the reclaimed level and attract enough buying volume to extend the recovery. The $0.1539 area is now an important level to monitor. If buyers successfully defend it during upcoming pullbacks, it could gradually become a stronger support zone rather than acting as previous resistance. However, a brief move above resistance is not enough to confirm a sustained trend reversal. Consistent buying activity and stronger volume will be important. Key figures $0.1430 — Previous support and recent recovery base $0.1539 — Important reclaimed price level $0.1539–$0.1548 — Current breakout and retest area $0.1580 — First major upside resistance $0.1600 — Psychological resistance and important market level $0.1630 — Higher resistance and potential recovery objective $0.1500 — Important downside level to monitor Bullish market scenario: If ADA continues holding above $0.1539, buyers could maintain the recovery structure and attempt another move toward $0.1580. A convincing breakout above this resistance, supported by stronger volume, would improve the short-term outlook and potentially open the way toward $0.1600. If buying pressure remains consistent beyond $0.1600, the next important area to watch would be $0.1630. A successful move above these resistance levels could indicate that market sentiment is gradually shifting in favor of buyers. Bearish market scenario: On the other hand, failure to maintain $0.1539 could weaken the current recovery. If sellers push ADA back below this level and buyers fail to reclaim it, the market may experience another pullback. A move toward $0.1500 would become important to monitor, as losing this area could increase downside pressure and bring the previous $0.1430 support zone back into focus. Overall market structure: ADA is showing early signs of recovery, but the market still needs stronger confirmation before calling this a sustained bullish reversal. The most important factor now is whether buyers can turn $0.1539 into reliable support. Trading volume, Bitcoin's overall direction, and ADA's reaction around nearby resistance levels will help determine whether this recovery has enough strength to continue or whether sellers will regain control. For now, $0.1539 remains the level that deserves the closest attention. #WSOT2026

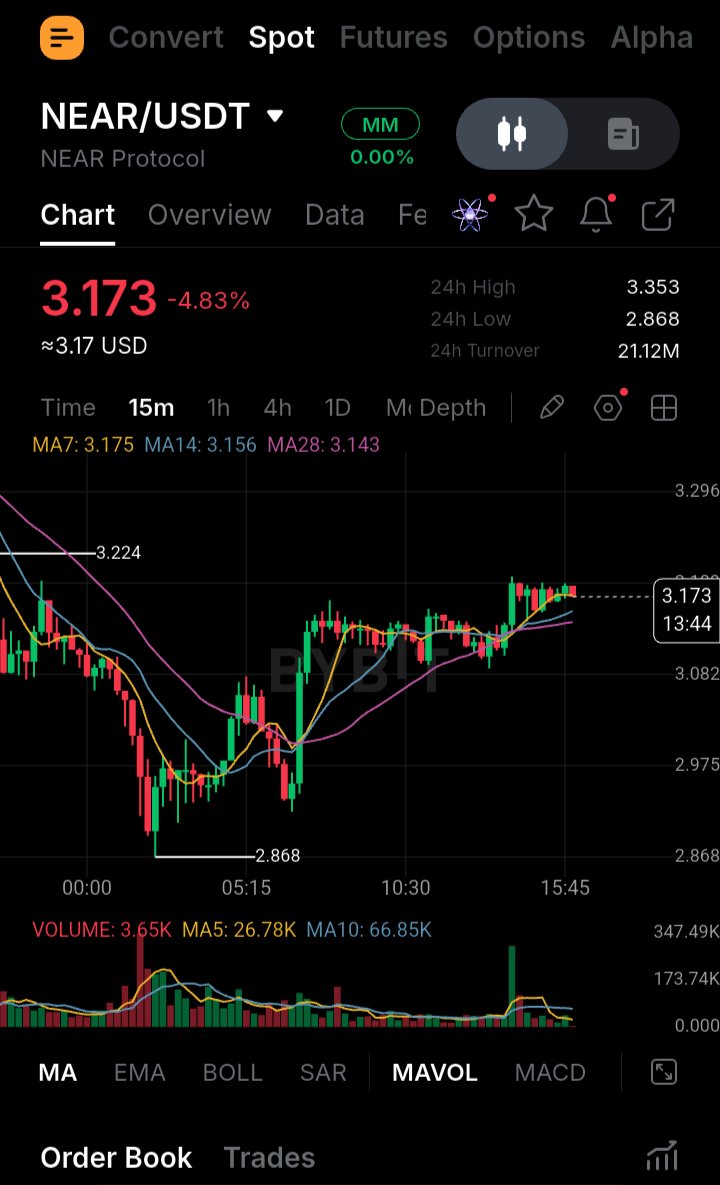
$NEARUSDT MOMENTUM ALCISTA: LOS COMPRADORES DEFIENDEN EL SOPORTE EN $3.087 MIENTRAS LA RECUPERACIÓN CONTINÚA NEAR muestra señales de un renovado interés comprador tras rebotar desde la zona de soporte de $3.0870. El precio está cotizando actualmente alrededor de los $3.183, lo que indica que los compradores están intentando mantener el control y extender la recuperación. La zona clave a vigilar es $3.130–$3.087. Mientras los compradores continúen defendiendo esta zona, la estructura alcista se mantiene intacta. Un quiebre fuerte por encima de los $3.198, respaldado por un volumen de trading creciente, podría proporcionar más impulso para un movimiento al alza. Cifras clave $3.183 — Precio de mercado actual $3.130–$3.087 — Zona principal de soporte y demanda $3.198 — Resistencia de quiebre importante $3.220 — Primer objetivo alcista $3.300 — Resistencia secundaria $3.400 — Objetivo alcista principal $3.050 — Nivel de invalidación bajista crítico Escenario alcista: Si NEAR se mantiene por encima de la zona de soporte y logra romper los $3.198 con un volumen fuerte, los compradores podrían empujar el precio hacia los $3.220. Un impulso continuado podría abrir el camino hacia los $3.300, convirtiéndose los $3.400 en el siguiente gran objetivo alcista. Escenario bajista: Sin embargo, perder el soporte de $3.087 podría debilitar la recuperación y hacer que los vendedores retomen el control. Un movimiento más profundo por debajo de los $3.050 invalidaría la configuración alcista actual y sugeriría un mayor riesgo a la baja. Perspectiva del mercado: NEAR está mostrando señales de recuperación alentadoras, pero la confirmación sigue siendo importante. Observa el nivel de quiebre de $3.198, la fuerza del soporte, el volumen de trading y la dirección de Bitcoin antes de sacar conclusiones. El próximo movimiento dependerá de si los compradores pueden convertir esta recuperación en una continuación alcista sostenida. #WSOT2026
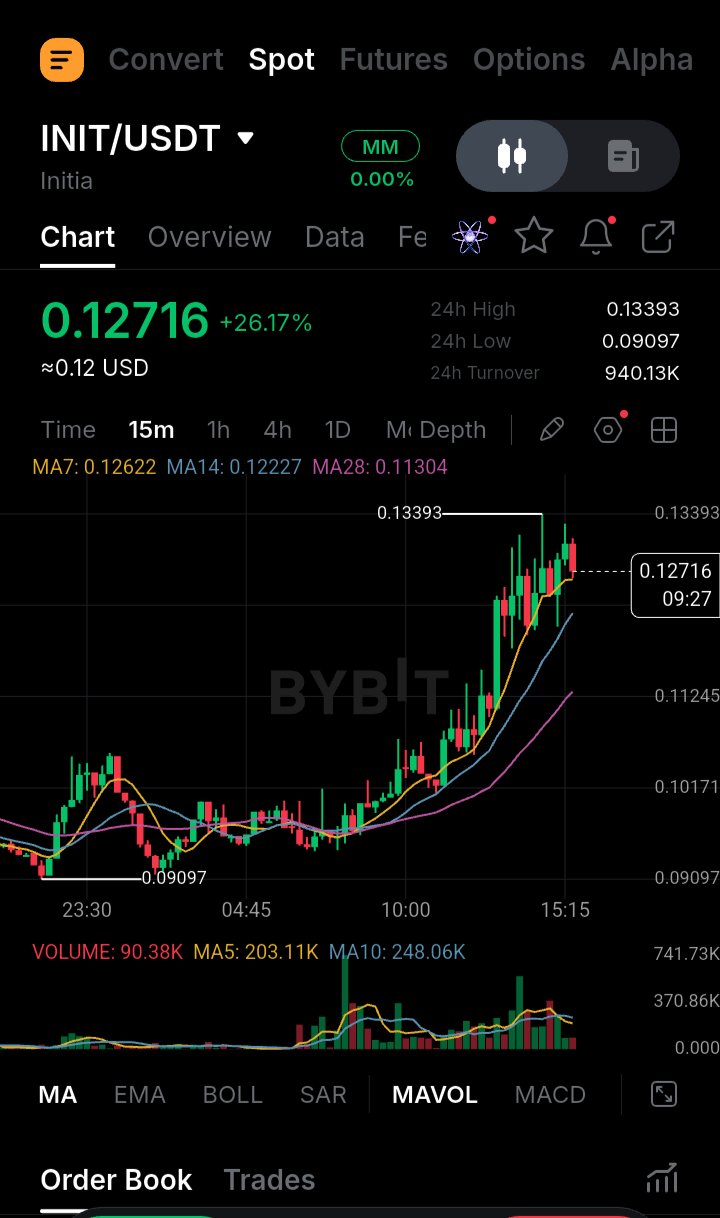
$INITUSDT SHOWS STRENGTH AFTER 32% RALLY CAN BUYERS PUSH TOWARD $0.15? INIT is showing encouraging bullish momentum following its recent 32% surge. Buyers are attempting to maintain control, with the $0.1320 area becoming an important level to watch. As long as price stays above this zone, the recovery structure remains constructive. A move above $0.1397 could attract additional buying interest and create room for a continuation toward $0.1450 and potentially $0.1520. Key figures $0.1320–$0.1340 — Important support and price-holding zone. $0.1397 — Key resistance and bullish breakout level. $0.1450 — Next upside area. $0.1520 — Higher resistance target. Bullish Scenario: Holding above $0.1320 and breaking through $0.1397 could strengthen upward momentum and support a move toward $0.1450–$0.1520. Bearish Scenario: Losing $0.1320 could weaken the recovery structure, while a drop below $0.1270 would put the bullish outlook under further pressure. Market Outlook remains worth watching, but confirmation above resistance is important before assuming the rally has more room to run. #WSOT2026

Tom Lee sees the crypto crash as temporary, believing current market pressures won't derail the bigger supercycle. Is he right, or is more downside coming? $NVDA


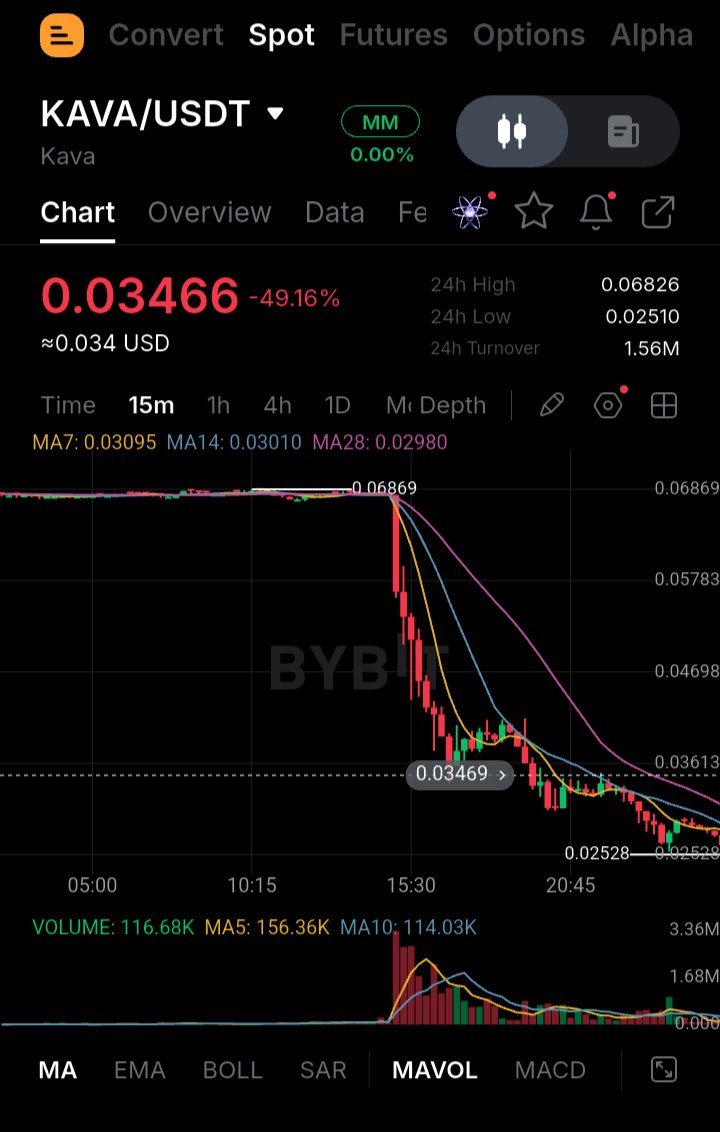
$KAVAUSDT SHOWING EARLY RECOVERY SIGNS $0.043 BACK IN FOCUS? has experienced a significant decline of more than 52%, but recent price action suggests that buyers are starting to defend the $0.025 support area. The rebound toward $0.03234 indicates that selling pressure may be easing, although a confirmed trend reversal is still needed. Key figures $0.03234 — Current price area $0.02500 — Major support zone to watch $0.03700 — First important resistance $0.04300 — Next upside level if recovery continues Bullish scenario: If KAVA continues holding above $0.025, buyers could gradually regain control. A sustained move above $0.03234 would strengthen the recovery outlook, with $0.037 and eventually $0.043 becoming important resistance areas. Bearish scenario: Despite the recent bounce, the broader market structure remains weak. If buyers fail to maintain momentum and KAVA loses the $0.025 support, renewed selling pressure could push the price toward lower levels. For now, the $0.025 zone remains the most important level to monitor. The next move will depend on whether buyers can turn this relief bounce into a stronger recovery. Is $KAVA preparing for a genuine comeback, or are we simply seeing a temporary relief rally?

Tom Lee ve la reciente venta masiva de criptomonedas como un contratiempo temporal, no como el fin del ciclo alcista. Tom Lee cree que la última presión en los mercados cripto está siendo impulsada por varios factores externos, más que por un colapso en las perspectivas del mercado a largo plazo. Señala las llamadas de margen relacionadas con Nvidia, los inversores reduciendo su exposición antes de la anticipada salida a bolsa (IPO) de Anthropic, la liberación de fondos previamente congelados relacionados con hackeos, la creciente preocupación por la disrupción de la IA y el mayor escrutinio de EE. UU. sobre las exportaciones de chips. A pesar de estos desafíos, Lee sigue confiando en que el superciclo cripto más amplio sigue intacto. En su opinión, la debilidad actual es parte de una fase temporal, y estas presiones del mercado podrían desvanecerse con el tiempo. Pero, ¿vos qué pensás? ¿Es simplemente una corrección a corto plazo antes del próximo gran rally cripto, o el mercado podría enfrentar más caídas antes de recuperarse? #WSOT2026 $NAVXUSDT $ETHUSDT


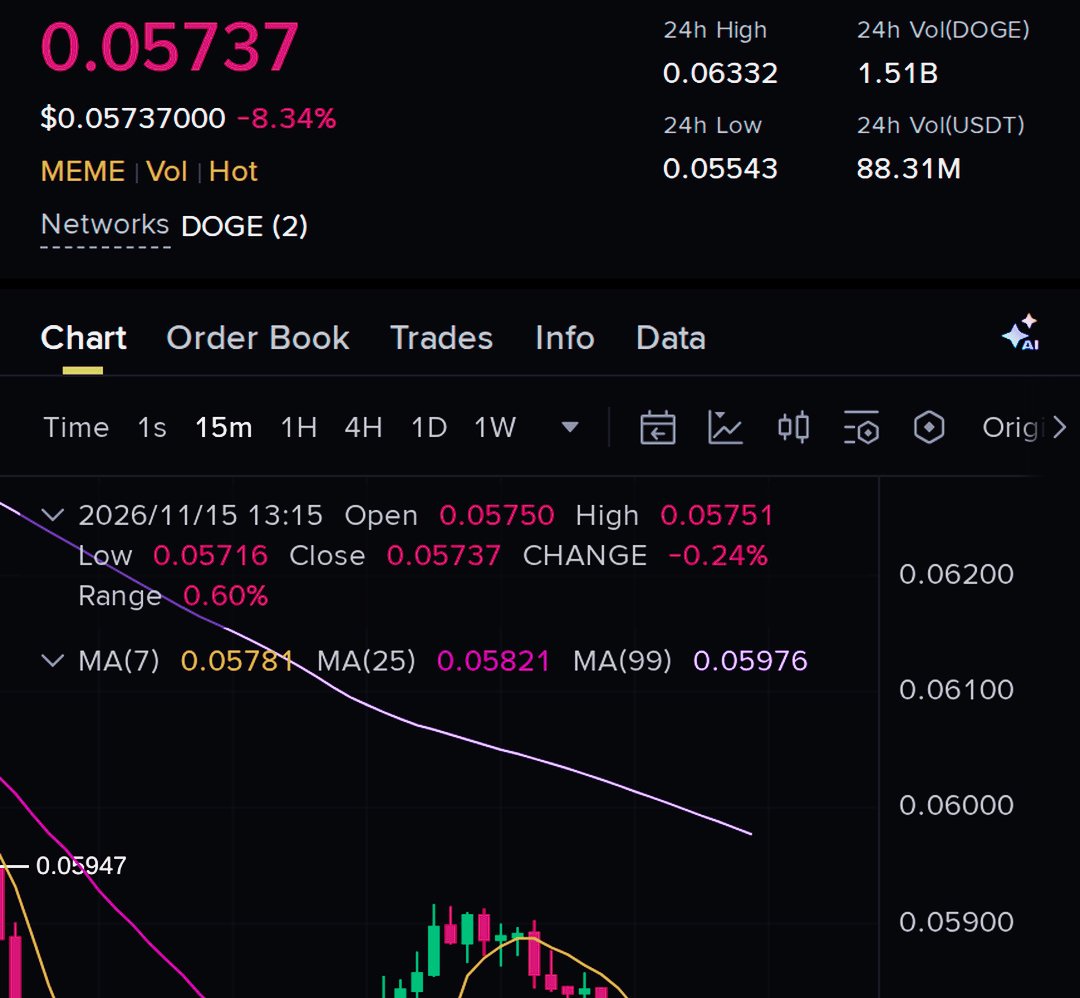
$DOGEUSDT BEARISH MOMENTUM REMAINS IN FOCUS Dogecoin is still struggling to regain its previous support area, suggesting that buyers have not yet shown enough strength to reverse the current short-term weakness. Every unsuccessful recovery attempt keeps selling pressure relevant, while the inability to establish a stronger position above the previous support zone gives sellers an advantage. The important factor here is how DOGE reacts around its current price region. If buyers continue failing to defend this area, another downward move could develop. However, a sudden recovery and strong buying volume could challenge the bearish structure. Key figures Entry Zone: 0.05735–0.05747 — Area being monitored for potential bearish continuation. TP1: 0.05569 — First downside reference. TP2: 0.05425 — Next important downside level. TP3: 0.05282 — Deeper downside target if selling pressure accelerates. Stop Loss: 0.05867 — Level that would invalidate this setup. Leverage: 40x — High-risk leveraged position. Bearish Scenario If DOGE continues trading below its recovery zone and sellers maintain control, the price could gradually move toward 0.05569. A decisive break below this level may expose the next support around 0.05425. If broader market weakness continues, 0.05282 could become another important area to watch. Bullish Scenario On the other hand, if DOGE manages to reclaim its lost support and sustain buying pressure, the bearish outlook could start weakening. A move toward 0.05867 would invalidate the current setup and indicate that buyers are regaining control. Market Outlook For now, the short side remains the focus because DOGE has not demonstrated a convincing recovery. However, 40x leverage carries significant liquidation risk, so position sizing and risk management are especially important. #WSOT2026

Bitcoin Whales Are Accumulating While Smaller Players Reduce Exposure$BTCUSDT $DOGEUSDT Despite Bitcoin's sharp 24% correction, large holders appear to be taking a different approach. Data from CryptoQuant shows that wallets holding more than 1,000 BTC added approximately 47,000 BTC during the market downturn. On the other side, mid-sized investors have been reducing their holdings, while overall Bitcoin demand has weakened to its lowest point since April 2025. This creates an interesting market dynamic: major holders are increasing their exposure while broader demand remains under pressure. The key question now is whether whale accumulation can eventually outweigh selling pressure and support Bitcoin's next recovery phase. #WSOT2026

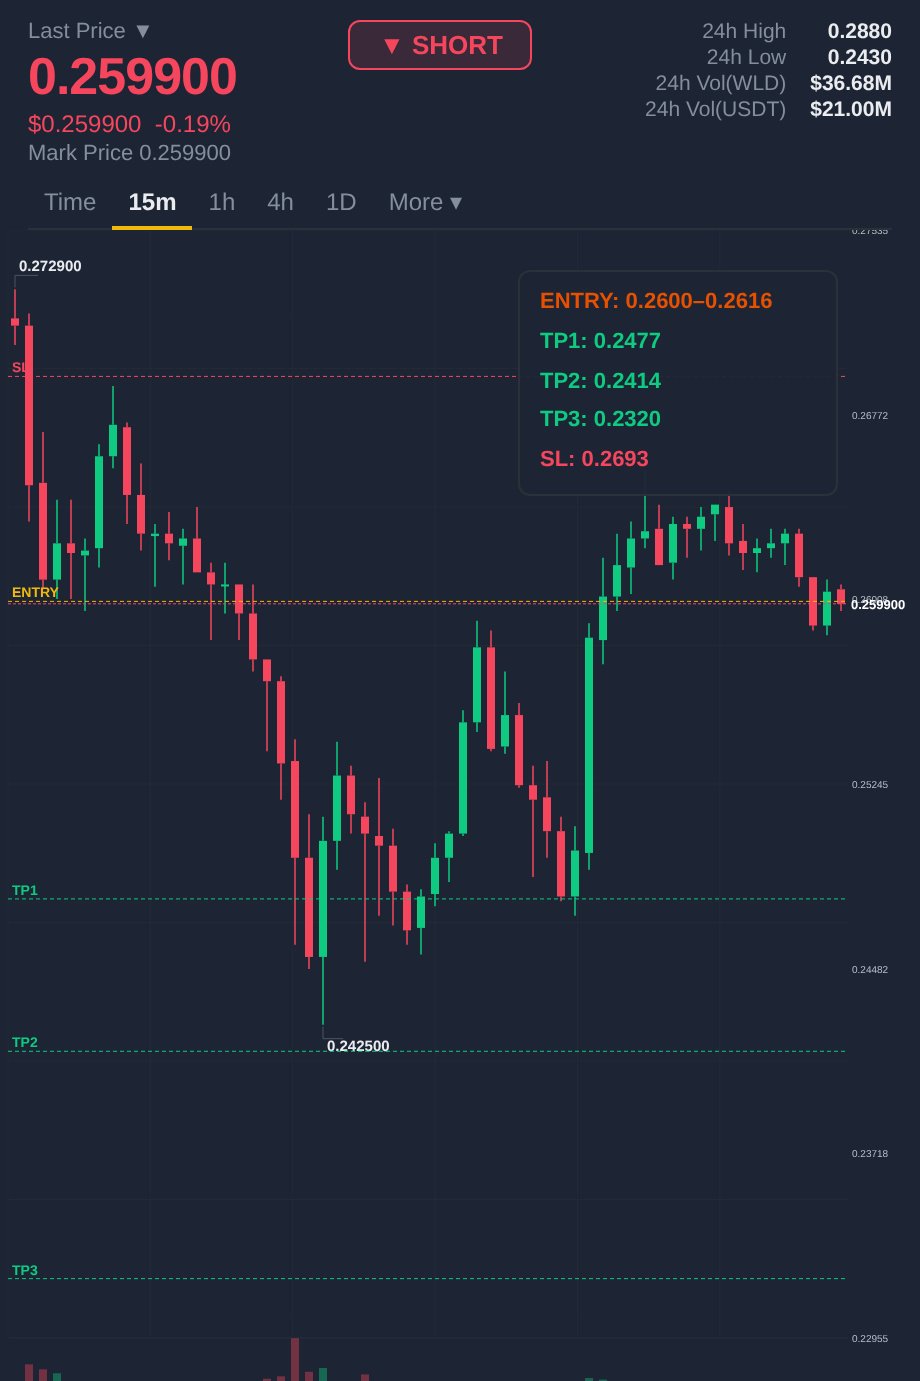
$WLDUSDT is showing signs of a potential bearish reversal after facing rejection near resistance. Momentum needs close attention, especially as RSI has cooled down to 42. Negative funding at -0.044% also highlights unusual positioning in the derivatives market. If sellers maintain pressure, WLD could revisit lower support zones. Key figures $0.2600–$0.2616 — Resistance and rejection zone $0.2693 — Important invalidation level $0.2477 — First downside support $0.2414 — Secondary support $0.2320 — Major downside level Market outlook A sustained rejection below resistance could strengthen bearish momentum and increase the possibility of further downside. However, a move above $0.2693 would weaken the bearish outlook. Watch price action and volume for confirmation before drawing conclusions. #WSOT2026

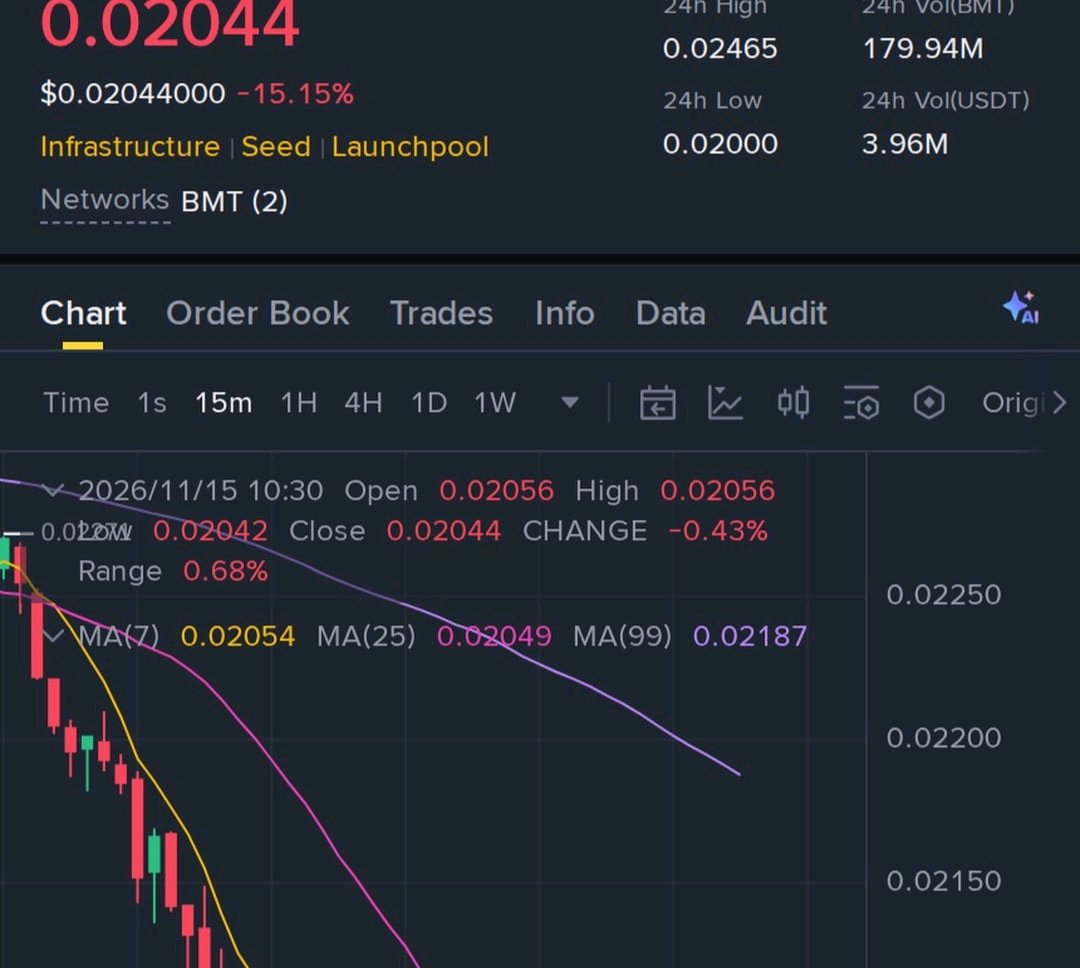
$BMTUSDT is showing potential signs of a bullish recovery, and buyers could step in if the price manages to hold its nearby support zone. After recent price movements, a successful bounce could open the door for another upward move. Keeping this long setup on watch with approximately 46x leverage. Entry Zone: 0.02038–0.02045 Key figures - 0.01980 — First upside target - 0.01929 — Second upside target - 0.01878 — Third upside target - 0.02088 — Risk level A strong bounce from the current area could support a recovery, but confirmation from buying volume is important before expecting further upside. #WSOT2026
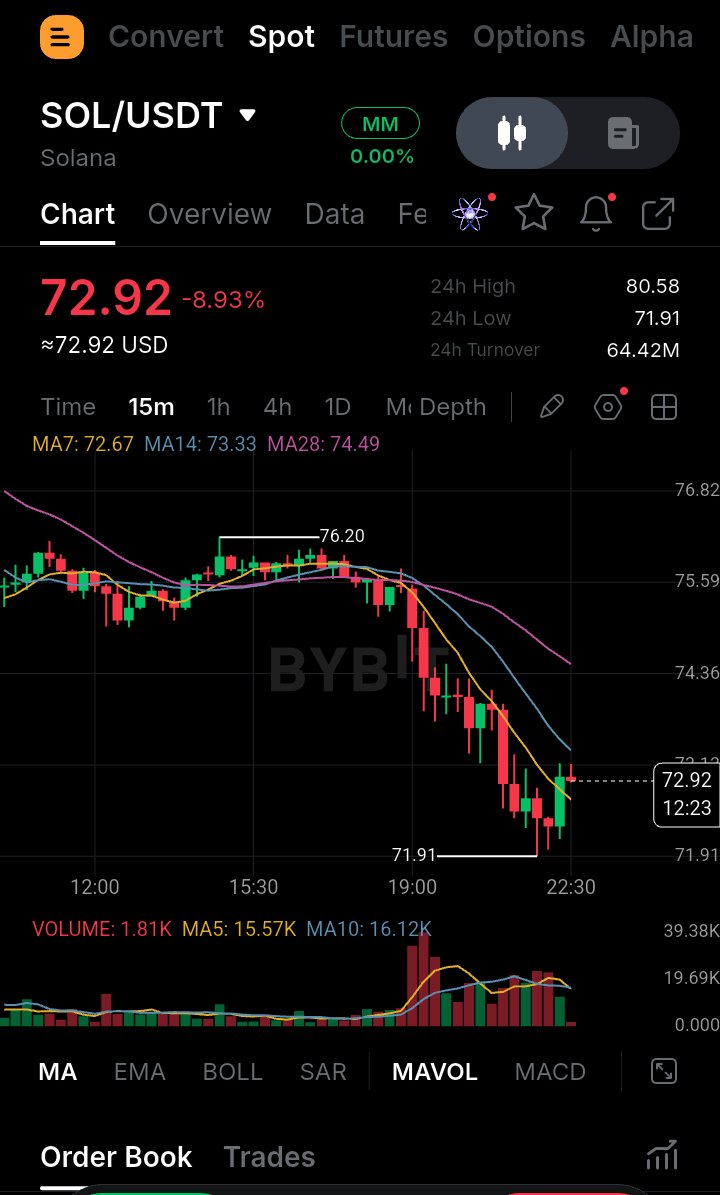
$SOLUSDT Análisis de mercado: Los osos están poniendo a prueba el soporte inferior Solana sigue mostrando una presión bajista a medida que los vendedores intentan empujar el precio por debajo de su estructura de soporte reciente. Con SOL operando cerca de los $72,96, el mercado sigue siendo vulnerable a nuevas caídas si los compradores no logran defender la región actual. Cifras clave $76,50 — Área de resistencia superior $73,50 — Zona de precio importante a corto plazo $72,96 — Precio de referencia actual $71,80 — Primer soporte a la baja $70,00 — Nivel de soporte psicológico $68,50 — Siguiente soporte potencial $66,00 — Área de caída más profunda Escenario bajista Si SOL no logra recuperar la región de $73,50–$76,50, la presión vendedora podría seguir siendo dominante. Un movimiento sostenido por debajo de los $71,80 podría exponer las zonas de soporte de $70,00 y $68,50, mientras que una debilidad continuada podría poner en foco los $66,00. Escenario alcista Por otro lado, una recuperación fuerte por encima de los $76,50 podría debilitar la estructura bajista. Un movimiento hacia los $80,50 sería una señal importante de que los compradores están recuperando el control. Por ahora, SOL sigue bajo presión vendedora, y los traders deberían observar cómo reacciona el precio cerca del soporte cercano antes de sacar conclusiones. $WSOT2026

$HYPEUSDT muestra potencial alcista mientras los compradores defienden soportes clave HYPE está llamando la atención a medida que los compradores intentan defender la zona de soporte actual en la temporalidad de 1H. El RSI está cerca de 30, lo que indica condiciones de sobreventa y la posibilidad de una recuperación a corto plazo. La tasa de financiación (funding) está actualmente en +0,002%, mientras que la acción del precio sugiere que los compradores están entrando alrededor de la región de $65,80–$66,20. Sin embargo, será importante ver una presión compradora sostenida para confirmar un movimiento alcista más fuerte. Cifras clave - $65,80–$66,20 — Zona importante de soporte y reacción - $63,81 — Nivel crítico a la baja - $68,16 — Primera resistencia alcista - $68,50 — Próxima área de resistencia - $69,80 — Objetivo de recuperación más alto - RSI: 30 — Territorio de sobreventa - Tasa de financiación: +0,002% Escenario alcista Si HYPE continúa manteniendo el soporte y aumenta el volumen de compra, podría desarrollarse una recuperación hacia los $68,16 y $68,50. Un movimiento sostenido por encima de estos niveles podría abrir el camino hacia los $69,80. Escenario bajista Si los compradores no logran defender la zona actual, la presión vendedora podría empujar el precio a la baja. Una ruptura por debajo de los $63,81 debilitaría las perspectivas de recuperación alcista. HYPE se encuentra en un área técnica importante, y la próxima reacción de los compradores podría determinar su dirección a corto plazo. #WSOT2026