NEUTRAL
6632Me gusta0Compartir en el chat169Aficionados70Seguir
crypto trader/ meme coin
crypto trader/ meme coin
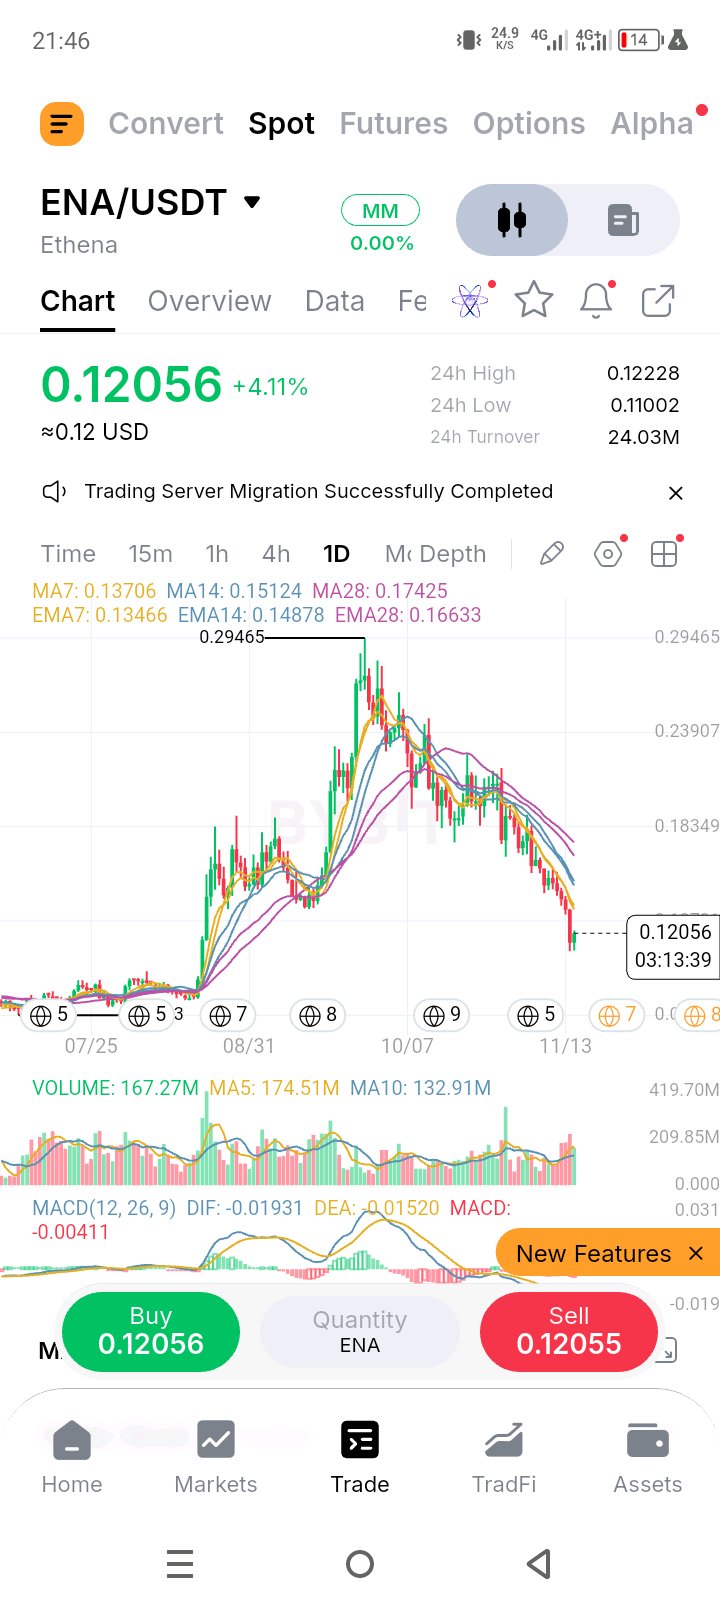
$ENAUSDT está en 0,12056 (+4,11%), aproximadamente un 59,1% por debajo del máximo de 0,29465, un 1,4% por debajo del máximo de 24h de 0,12228 y un 9,6% por encima del mínimo de 24h de 0,11002. El rango de 24h es un cuadro del 11,1% y a la vela diaria le quedan unas tres horas. El precio cayó bruscamente hasta 0,11002 y está rebotando, pero sigue cotizando en los niveles más bajos desde la ruptura de agosto, con la antigua base aproximadamente en 0,08-0,09 (estimado) por debajo. Todas las medias están por encima y cayendo, apiladas de rápida a lenta: 10,5-12,0% por debajo de las 7 (EMA7 0,13466, MA7 0,13706), 19,0-20,3% por debajo de las 14 (EMA14 0,14878, MA14 0,15124) y 27,5-30,8% por debajo de las 28 (EMA28 0,16633, MA28 0,17425). Un día de +4,11% solo cierra una pequeña parte de esa brecha, así que esto es un rebote dentro de una tendencia bajista hasta que se recuperen las de 7. El volumen es fuerte en ambos lados de este movimiento. La barra de hoy es de 167,27M con unas tres horas restantes, un 25,9% por encima de la MA10 (132,91M) y solo un 4,1% por debajo de la MA5 (174,51M), y el volumen de negocio de 24h de 24,03M USDT equivale aproximadamente a 199,3M ENA, alrededor de un 14% por encima de la MA5 y un 50% por encima de la MA10. La MA5 se sitúa un 31,3% por encima de la MA10. Se negoció un volumen real en 0,11002, que es como se ve una caída brusca, y merece la pena respetar un rebote con ese tipo de volumen. El MACD sigue siendo negativo y apunta hacia abajo: el DIF (-0,01931) está por debajo de la DEA (-0,01520), un histograma de -0,00411, con ambas líneas por debajo de cero, por lo que el impulso aún no ha cambiado. Niveles a vigilar: Soporte: 0,11002 (mínimo de 24h), luego nada marcado hasta la base de julio-agosto, aproximadamente 0,08-0,09 (estimado), y alrededor de 0,0723 (línea de cuadrícula, estimado). Resistencia: 0,12228 (máximo de 24h), alrededor de 0,12791 (línea de cuadrícula, estimado), 0,13466 (EMA7), 0,13706 (MA7), 0,14878 (EMA14), 0,15124 (MA14), 0,16633 (EMA28), 0,17425 (MA28), 0,18349 (línea de cuadrícula), 0,23907 (línea de cuadrícula), luego 0,29465 (el máximo). Plan, según los cierres diarios: Posición larga con soporte bajo (contra tendencia): un retroceso hacia 0,1100-0,1170 que se mantenga en el cierre diario por encima de 0,11002. Entrada 0,1140, stop por debajo de 0,1075, que es 0,0065 de riesgo. 0,12791 es aproximadamente 2,1R, 0,13466 aproximadamente 3,2R y 0,14878 aproximadamente 5,4R. Posición larga tras recuperación: un cierre diario por encima de 0,13706 con un volumen superior a la MA5 de 174,51M, seguido de un nuevo test de 0,1345-0,1375 que se mantenga. Entrada 0,1395, stop por debajo de 0,1330, que es 0,0065 de riesgo. 0,15124 es aproximadamente 1,8R, así que recortaría ahí, luego 0,17425 es aproximadamente 5,3R y 0,18349 aproximadamente 6,8R. Desglose (corto o salida): un cierre diario por debajo de 0,11002 con un volumen superior a la MA5 de 174,51M, seguido de un nuevo test fallido de 0,1100-0,1180. Entrada 0,1125, stop por encima de 0,1195, que es 0,0070 de riesgo. Aproximadamente 0,09 es alrededor de 3,2R y aproximadamente 0,0723 es alrededor de 5,7R, aunque ambos son estimados, así que iría ajustando el trailing después del primero. Invalidación: la posición larga de soporte bajo falla por debajo de 0,1075. La lectura bajista se suaviza con un cierre diario por encima de 0,15124 (MA14), y la tendencia bajista se ha revertido por encima de 0,17425 (MA28). Nota de riesgo: un rebote de este tamaño dentro de una tendencia bajista puede desvanecerse tan rápido como apareció, y a la vela todavía le quedan tres horas para terminar. Los stops importan más que los objetivos. Órdenes limitadas, tamaño pequeño. Esa es mi lectura del gráfico, no es un consejo.$ENAUSDT #ByXIMPACT
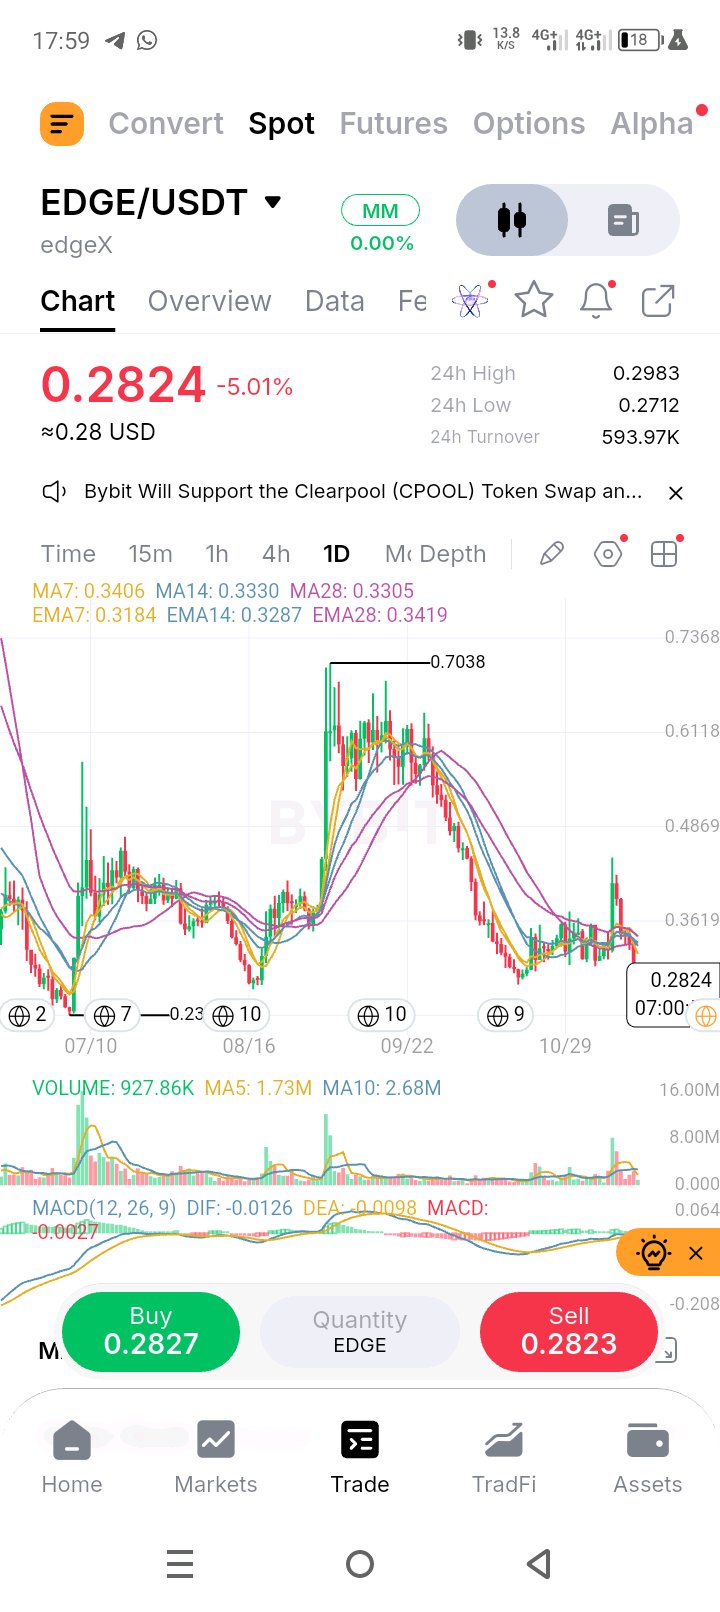
$EDGEUSDT is at 0.2824 (-5.01%), about 59.9% under the 0.7038 high, 5.3% under the 24h high of 0.2983 and 4.1% above the 24h low of 0.2712. The 24h range is a 10.0% box, and the daily candle has about seven hours left. Price has given back the whole September spike and is back near the bottom of the October-November range, roughly 0.27-0.36 by my read (approximate), with the July low of about 0.237 (approximate) still 19.2% below. Price is under every average, and they are tangled in a 0.318-0.342 pack, not stacked: 11.3% under the EMA7 (0.3184), 14.1% under the EMA14 (0.3287), 14.6% under the MA28 (0.3305), 15.2% under the MA14 (0.3330), 17.1% under the MA7 (0.3406) and 17.4% under the EMA28 (0.3419). A tangle like that is a drifting range, and a reclaim has to clear all of it. Volume is light on this drop. The 24h turnover of 593.97K USDT works out to roughly 2.10M EDGE, 22% above the MA5 (1.73M) but 22% under the MA10 (2.68M), and today’s bar is 927.86K with about seven hours left. The MA5 sits 35.4% under the MA10, because the November spike is still inside the MA10 window, so activity has faded since. A -5.01% day without a volume surge is a drift, not a capitulation. MACD is negative but shallow: DIF (-0.0126) is under DEA (-0.0098), a histogram of -0.0027, with both lines just below zero. Levels to watch: Support: 0.2712 (24h low, which lines up with the October low, approximate), then about 0.237 (the July low, approximate). Nothing is marked below it. Resistance: 0.2983 (24h high), 0.3184 (EMA7), 0.3287 (EMA14), 0.3305 (MA28), 0.3330 (MA14), 0.3406 (MA7), 0.3419 (EMA28), 0.3619 (grid line), roughly 0.44 (the November spike high, approximate), 0.4869 (grid line), 0.6118 (grid line), then 0.7038 (the high). Plan, on daily closes: Low-hold long (counter-trend): a dip into 0.2700-0.2790 that holds on the daily close above 0.2712. Entry 0.2750, stop under 0.2600, which is 0.0150 of risk. 0.3184 is about 2.9R, 0.3419 about 4.5R and 0.3619 about 5.8R. Reclaim long: a daily close above 0.3419 on volume above the 1.73M MA5, then a retest of 0.3330-0.3420 that holds. Entry 0.3480, stop under 0.3280, which is 0.0200 of risk. 0.3619 is only about 0.7R, so I’d trim a small piece there, then roughly 0.44 (approximate) is about 4.6R and 0.4869 about 6.9R. Breakdown (short or exit): a daily close under 0.2712 on volume above the 1.73M MA5, then a failed retest of 0.2710-0.2800. Entry 0.2740, stop above 0.2830, which is 0.0090 of risk. 0.2369 is about 4.1R, though it is approximate, and with nothing marked below it I’d trail the rest. Invalidation: the low-hold long fails under 0.2600. The bearish read softens on a daily close above 0.3330 (MA14), and the downtrend has turned above 0.3419 (EMA28). Risk note: 24h turnover is only 593.97K USDT, so this is a thin book and wicks can run through levels. Stops matter more than targets. Limit orders, small size. That’s my read of the chart, not advice.$EDGEUSDT #ByXIMPACT
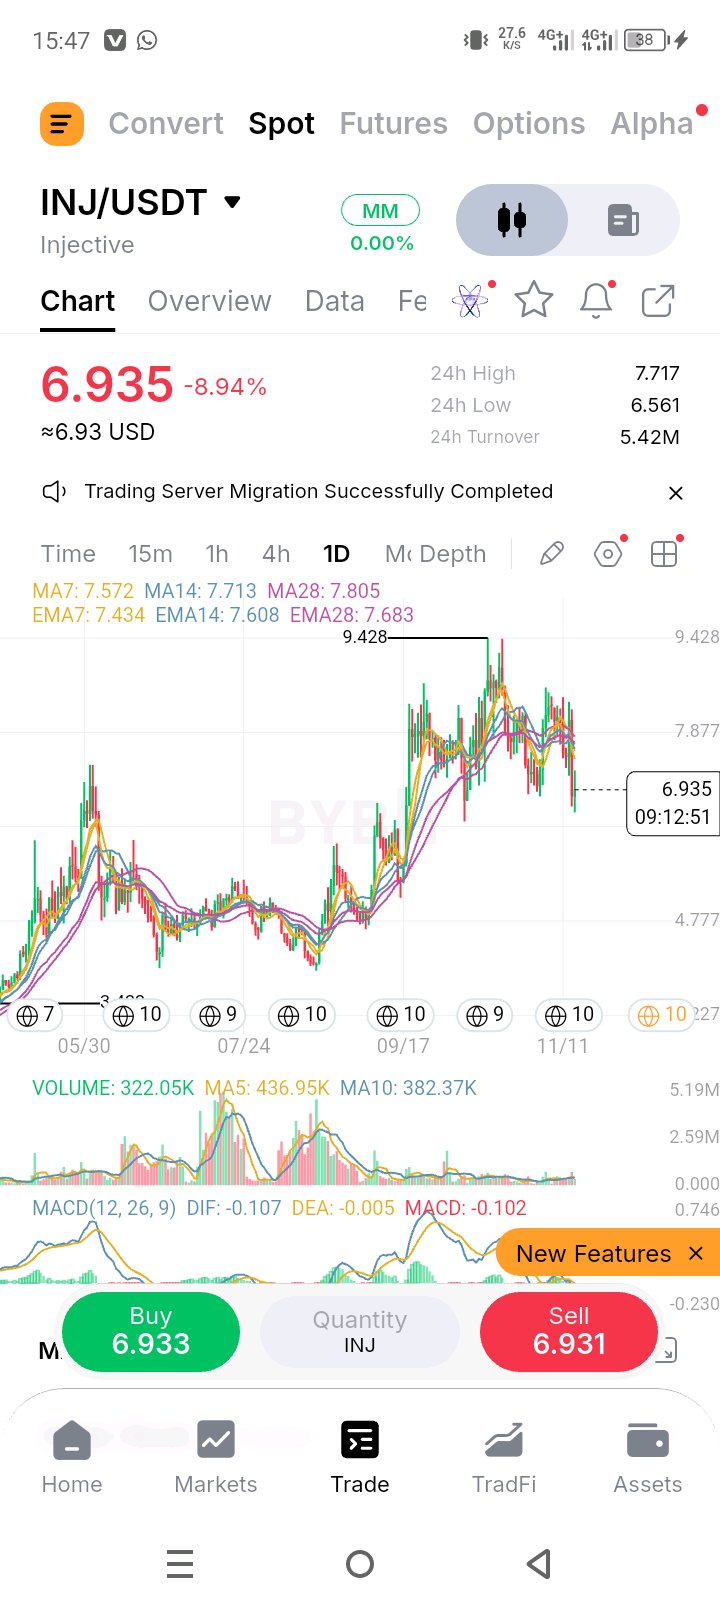
$INJUSDT está en 6,935 (-8,94%), cerca de un 26,4% por debajo del máximo de 9,428, un 10,1% por debajo del máximo de 24h de 7,717 y un 5,7% por encima del mínimo de 24h de 6,561. El rango de 24h es un bloque del 17,6%, y a la vela diaria le quedan unas nueve horas. El precio está rompiendo el suelo del rango de octubre-noviembre, aproximadamente 6,9-7,0 según mi lectura (estimado), después de semanas de movimiento lateral. Todas las medias están por encima y agrupadas en una banda estrecha de 7,43-7,81, apiladas de rápidas a lentas: 6,7-8,4% por debajo de las de 7 periodos (EMA7 7,434, MA7 7,572), 8,8-10,1% por debajo de las de 14 (EMA14 7,608, MA14 7,713) y 9,7-11,1% por debajo de las de 28 (EMA28 7,683, MA28 7,805). Esa compresión es el aspecto que tiene un rango desde dentro, y el precio acaba de caer fuera de la parte inferior, por lo que toda la banda actúa ahora como una zona de resistencia. El volumen es fuerte en la caída. El volumen de negociación de 24h de 5,42M USDT equivale a unos 781,5K INJ, aproximadamente 1,8 veces la MA5 (436,95K) y 2,0 veces la MA10 (382,37K), mientras que la barra de hoy es de 322,05K con unas nueve horas restantes, por lo que todavía se está formando. La MA5 se sitúa un 14,3% por encima de la MA10, así que la participación ha estado aumentando con la caída. Eso es venta por convicción, no un hueco de liquidez. El MACD es negativo y está deslizándose: el DIF (-0,107) ha caído muy por debajo de la DEA (-0,005), un histograma de -0,102, con ambas líneas por debajo de cero. Niveles a vigilar: Soporte: 6,561 (mínimo de 24h), aproximadamente 6,4-6,5 (el mínimo de principios de octubre, estimado), cerca de 6,327 (línea de cuadrícula, estimado), luego 4,777 (línea de cuadrícula). No hay nada marcado entre los dos últimos. Resistencia: 7,434 (EMA7), 7,572 (MA7), 7,608 (EMA14), 7,683 (EMA28), 7,713 (MA14), 7,717 (máximo de 24h), 7,805 (MA28), 7,877 (línea de cuadrícula), cerca de 8,5 (la parte superior del rango de octubre-noviembre, estimado), luego 9,428 (el máximo). Plan, basado en cierres diarios: Largo de soporte bajo (contratendencia): una caída hasta 6,35-6,56 que se mantenga en el cierre diario por encima de 6,327. Entrada en 6,50, stop por debajo de 6,20, lo que supone un riesgo de 0,30. 7,434 está a unos 3,1R, 7,683 a unos 3,9R y 7,877 a unos 4,6R. Largo de recuperación: un cierre diario por encima de 7,805 con un volumen superior a la MA5 de 436,95K, seguido de un retesteo de 7,70-7,82 que se mantenga. Entrada en 7,95, stop por debajo de 7,62, lo que supone un riesgo de 0,33. Aproximadamente 8,5 está a unos 1,7R (estimado), así que recortaría ahí, luego 9,428 está a unos 4,5R. Desplome (corto o salida): un cierre diario por debajo de 6,327 con un volumen superior a la MA5 de 436,95K, seguido de un retesteo fallido de 6,33-6,60. Entrada en 6,45, stop por encima de 6,65, lo que supone un riesgo de 0,20. No hay nada marcado entre 6,33 y 4,777, por lo que la operación consiste en seguir la tendencia hacia la línea de cuadrícula de 4,777, cerca de 8,4R. Invalidación: el largo de soporte bajo falla por debajo de 6,20. La lectura bajista se suaviza con un cierre diario por encima de 7,572 (MA7), y la tendencia bajista se revierte por encima de 7,805 (MA28). Nota de riesgo: -8,94% en un día saca al precio de un rango que había mantenido durante semanas, y sin nada marcado entre 6,33 y 4,777, un suelo fallido puede caer rápido. Los stops importan más que los objetivos. Órdenes limitadas, tamaño pequeño. Esa es mi lectura del gráfico, no un consejo. $INJUSDT #ByXIMPACT
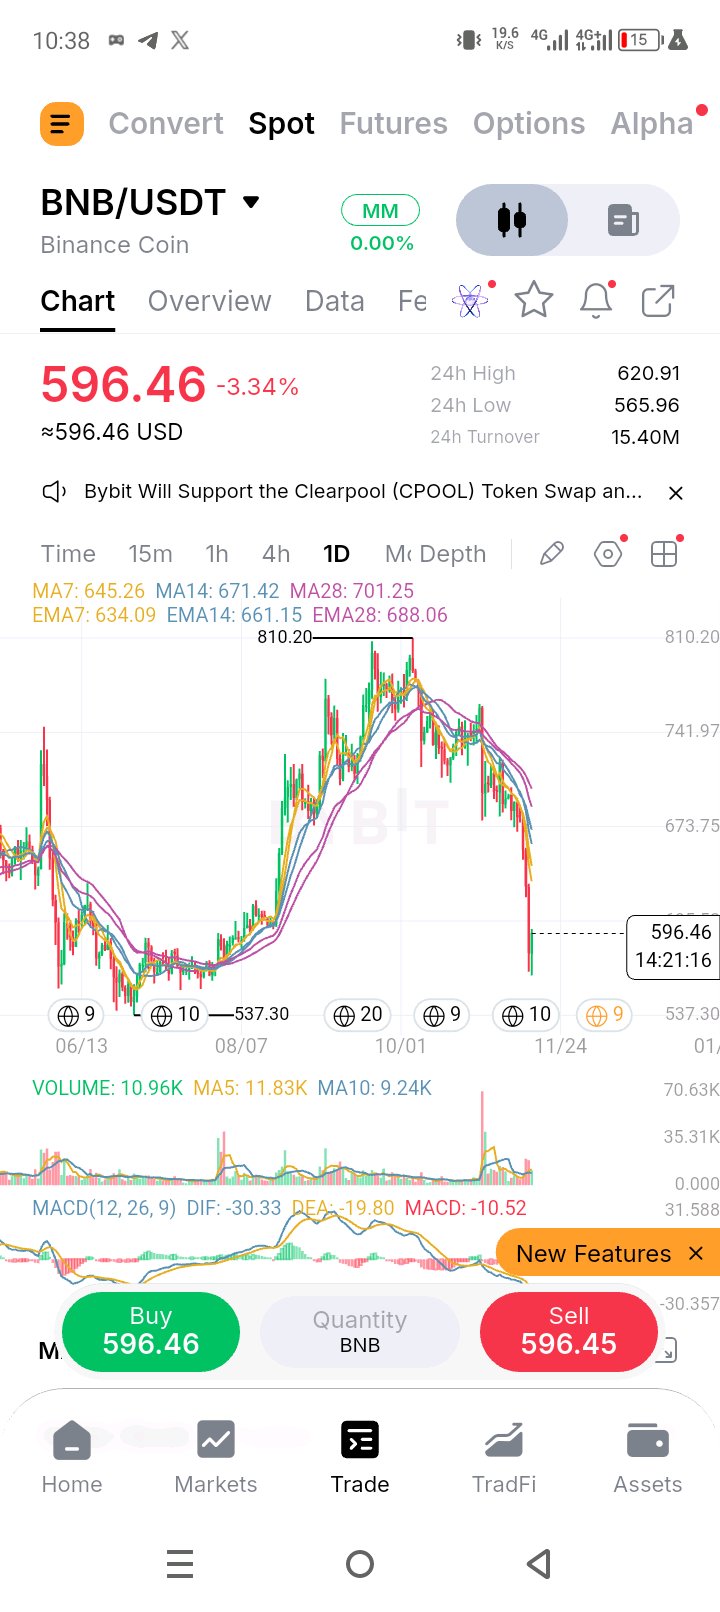
$BNBUSDT is at 596.46 (-3.34%), about 26.4% under the 810.20 high, 3.9% under the 24h high of 620.91 and 5.4% above the 24h low of 565.96. The 24h range is a 9.7% box, and the daily candle has about fourteen hours left. Price has given back most of the rally and is back at the top of the July-August base, roughly 565-595 by my read (approximate), with the 537.30 low still 11.0% below. Every average is overhead and falling, stacked fast under slow: 5.9-7.6% under the 7s (EMA7 634.09, MA7 645.26), 9.8-11.2% under the 14s (EMA14 661.15, MA14 671.42) and 13.3-14.9% under the 28s (EMA28 688.06, MA28 701.25). The 7s have rolled over hard, so the first test is the 634-645 pocket, not the 28s. Volume told the story on the way down. The 24h turnover of 15.40M USDT works out to roughly 25.8K BNB, about 2.2x the MA5 (11.83K), and today’s bar is 10.96K with about fourteen hours left, already 18.6% above the MA10 (9.24K). The MA5 sits 28.0% above the MA10, so participation has been building into the flush. That is heavy selling that tagged the base lows at 565.96 and bounced. MACD is negative and pointing down hard: DIF (-30.33) is under DEA (-19.80), a histogram of -10.52, with both lines below zero. Levels to watch: Support: 565.96 (24h low), roughly 565-580 (the July-August base lows, approximate), 537.30 (the low marked on the chart). Nothing is marked below it. Resistance: about 605.52 (grid line, approximate), 620.91 (24h high), 634.09 (EMA7), 645.26 (MA7), 661.15 (EMA14), 671.42 (MA14), 673.75 (grid line), 688.06 (EMA28), 701.25 (MA28), 741.97 (grid line), then 810.20 (the high). Plan, on daily closes: Low-hold long (counter-trend): a dip into 565-585 that holds on the daily close above 565.96. Entry 575, stop under 555, which is 20 of risk. 634.09 is about 3.0R, 661.15 about 4.3R and 688.06 about 5.7R. Reclaim long: a daily close above 645.26 on volume above the 11.83K MA5, then a retest of 632-646 that holds. Entry 652, stop under 625, which is 27 of risk. 671.42 is only about 0.7R, so I’d trim a small piece there, then 701.25 is about 1.8R and 741.97 about 3.3R. Breakdown (short or exit): a daily close under 565.96 on volume above the 11.83K MA5, then a failed retest of 566-590. Entry 572, stop above 590, which is 18 of risk. 537.30 is about 1.9R, and with nothing marked below it I’d trail the rest. Invalidation: the low-hold long fails under 555. The bearish read softens on a daily close above 671.42 (MA14), and the downtrend has turned above 701.25 (MA28). Risk note: price is sitting on the top edge of an old base after a vertical drop, so it can snap back or break through quickly. Stops matter more than targets. Limit orders, small size. That’s my read of the chart, not advice.$BNBUSDT #ByXIMPACT
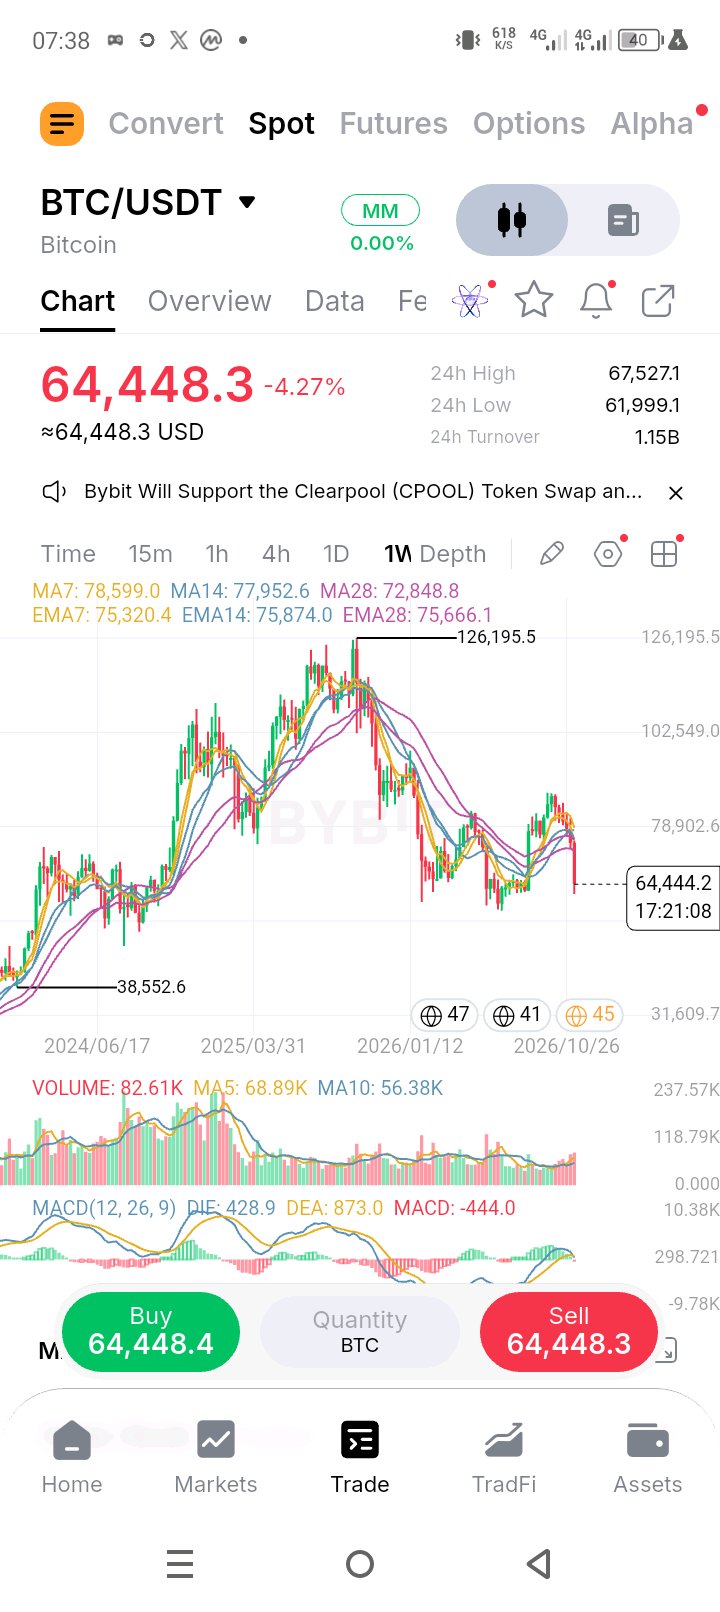
$BTCUSDT on the weekly is at 64,448.3 (-4.27% on the day), about 48.9% under the 126,195.5 high and 67.2% above the 38,552.6 low marked on the chart. The 24h range is 61,999.1 to 67,527.1, an 8.9% box, and the weekly candle has about seventeen hours left. Price has rejected from the recent swing high, roughly 86-87k (approximate), and is giving back most of that bounce. Price is under every average. The three EMAs are braided into a tight 75.3-75.9k band (EMA7 75,320.4, EMA28 75,666.1, EMA14 75,874.0), 14.4-15.1% overhead, which says the weekly trend had already gone flat before this drop. The MAs are more spread out: MA28 72,848.8 is 11.5% overhead, MA14 77,952.6 is 17.3% and MA7 78,599.0 is 18.0%. Volume is rising into the drop. The weekly bar is 82.61K BTC with about seventeen hours still to run, already 19.9% above the MA5 (68.89K) and 46.5% above the MA10 (56.38K), and the MA5 sits 22.2% above the MA10. The 24h turnover of 1.15B USDT works out to roughly 17.8K BTC, above the weekly bar’s average daily pace of about 13.2K. This is not a quiet slide. Weekly MACD has rolled over: DIF (428.9) is under DEA (873.0), a histogram of -444.0. Both lines are still above zero, so the bigger structure has not flipped, but momentum is turning down. Levels to watch: Support: 61,999.1 (24h low), roughly 58-60k (the two prior weekly swing lows, approximate), 55,256.1 (grid line, approximate), 38,552.6 (the low marked on the chart). Resistance: 67,527.1 (24h high), 72,848.8 (MA28), 75,320.4 (EMA7), 75,666.1 (EMA28), 75,874.0 (EMA14), 77,952.6 (MA14), 78,599.0 (MA7), 78,902.6 (grid line), roughly 86-87k (the recent swing high, approximate), 102,549.0 (grid line), then 126,195.5 (the high). Plan, on weekly closes: Low-hold long (counter-trend): a dip into 58,000-60,500 that holds on the weekly close. Entry 60,000, stop under 56,500, which is 3,500 of risk. 67,527.1 is about 2.2R, 72,848.8 about 3.7R and 75,666.1 about 4.5R. Reclaim long: a weekly close above 75,874.0 on volume above the 68.89K MA5, then a retest of 75,000-76,000 that holds. Entry 76,500, stop under 73,500, which is 3,000 of risk. 78,902.6 is only about 0.8R, so I’d trim there, then roughly 86,500 (approximate) is about 3.3R and 102,549.0 about 8.7R. Breakdown (short or exit): a weekly close under 58,000 on volume above the 68.89K MA5, then a failed retest of 58,000-60,500. Entry 59,000, stop above 61,500, which is 2,500 of risk. 55,256.1 is about 1.5R and 38,552.6 about 8.2R, so I’d trail after the first. Invalidation: the low-hold long fails under 56,500. The bearish read softens on a weekly close above 77,952.6 (MA14), and the downtrend has turned above 78,902.6, which also clears the MA7. Risk note: this is a weekly read with the candle still open, so the close can change the picture, and stops on this timeframe are wide, so size accordingly. Limit orders, small size. That’s my read of the chart, not advice.$BTCUSDT #ByXIMPACT
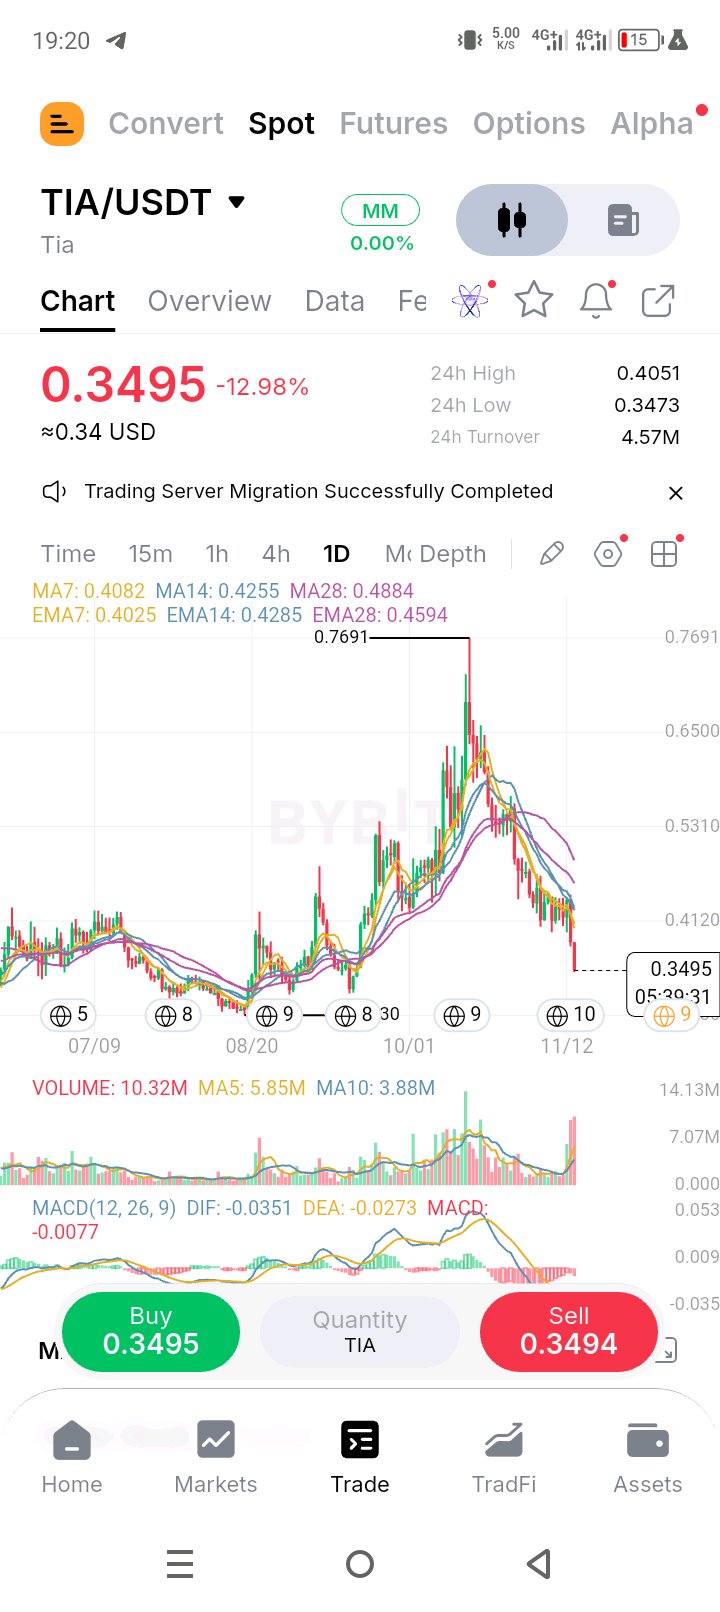
$TIAUSDT está en 0,3495 (-12,98%), cerca de un 54,6% por debajo del máximo de 0,7691, un 13,7% por debajo del máximo de 24 horas de 0,4051 y apenas un 0,6% por encima del mínimo de 24 horas de 0,3473. El rango de 24 horas es una horquilla del 16,6% y a la vela diaria le quedan unas cinco horas y media. El precio ha revertido toda la subida y vuelve a estar cerca del mínimo de septiembre, aproximadamente en 0,32 según mi lectura (estimado), con el mínimo de agosto de 0,2930 todavía un 19,3% por debajo. Todas las medias están por encima y cayendo, apiladas de rápida a lenta: 13,2-14,4% por debajo de las de 7 (EMA7 0,4025, MA7 0,4082), 17,9-18,4% por debajo de las de 14 (MA14 0,4255, EMA14 0,4285) y 23,9-28,4% por debajo de las de 28 (EMA28 0,4594, MA28 0,4884). Una vela de -12,98% ha abierto una brecha amplia respecto a toda la pila, por lo que cualquier recuperación debe ganarse paso a paso. El volumen es fuerte en esta caída. La barra de hoy es de 10,32M con unas cinco horas y media todavía por delante, ya un 76,4% por encima de la MA5 (5,85M) y 2,7 veces la MA10 (3,88M), y la MA5 se sitúa un 50,8% por encima de la MA10, por lo que la participación ha ido aumentando durante la caída. El volumen de negociación de 24 horas de 4,57M USDT equivale aproximadamente a 13,1M TIA. Se trata de ventas con gran convicción, del tipo que o se agotan o siguen su curso. El MACD es negativo y sigue apuntando hacia abajo: el DIF (-0,0351) está por debajo de la DEA (-0,0273), con un histograma de -0,0077, y ambas líneas por debajo de cero. Niveles a vigilar: Soporte: 0,3473 (mínimo de 24h), aproximadamente 0,32 (el mínimo de septiembre, estimado), 0,2930 (el mínimo de agosto, el precio más bajo en este gráfico). No hay nada marcado por debajo. Resistencia: 0,4025 (EMA7), 0,4051 (máximo de 24h), 0,4082 (MA7), 0,4120 (línea de cuadrícula), 0,4255 (MA14), 0,4285 (EMA14), 0,4594 (EMA28), 0,4884 (MA28), 0,5310 (línea de cuadrícula), 0,6500 (línea de cuadrícula), y luego 0,7691 (el máximo). Plan, al cierre diario: Compra en soporte bajo (contratendencia): un descenso a 0,3400-0,3480 que se mantenga al cierre diario por encima de 0,3473. Entrada 0,3480, stop por debajo de 0,3300, lo que supone 0,0180 de riesgo. 0,4025 es alrededor de 3,0R, 0,4285 alrededor de 4,5R y 0,4594 alrededor de 6,2R. Compra tras recuperación: un cierre diario por encima de 0,4082 con un volumen superior a la MA5 de 5,85M, seguido de un nuevo test de 0,4025-0,4085 que aguante. Entrada 0,4150, stop por debajo de 0,3990, lo que supone 0,0160 de riesgo. 0,4285 es solo alrededor de 0,8R, así que reduciría posiciones ahí, luego 0,4884 es alrededor de 4,6R y 0,5310 alrededor de 7,3R. Desplome (corto o salida): un cierre diario por debajo de 0,3473 con volumen por encima de la MA5 de 5,85M, seguido de un retest fallido de 0,3475-0,3600. Entrada 0,3520, stop por encima de 0,3640, lo que supone 0,0120 de riesgo. 0,3200 es alrededor de 2,7R y 0,2930 alrededor de 4,9R, aunque la zona de 0,32 es aproximada, así que iría ajustando el stop tras el primer objetivo. Invalidación: la compra en soporte bajo falla por debajo de 0,3300. La lectura bajista se suaviza con un cierre diario por encima de 0,4255 (MA14), y la tendencia bajista se revierte por encima de 0,4884 (MA28). Nota de riesgo: un día de -12,98% con la vela aún abierta puede cambiar de forma antes del cierre, y una purga con gran volumen a menudo rebota con fuerza antes de reanudarse. Los stops importan más que los objetivos. Órdenes limitadas, tamaño pequeño. Esa es mi lectura del gráfico, no es un consejo$TIAUSDT #ByXIMPACT
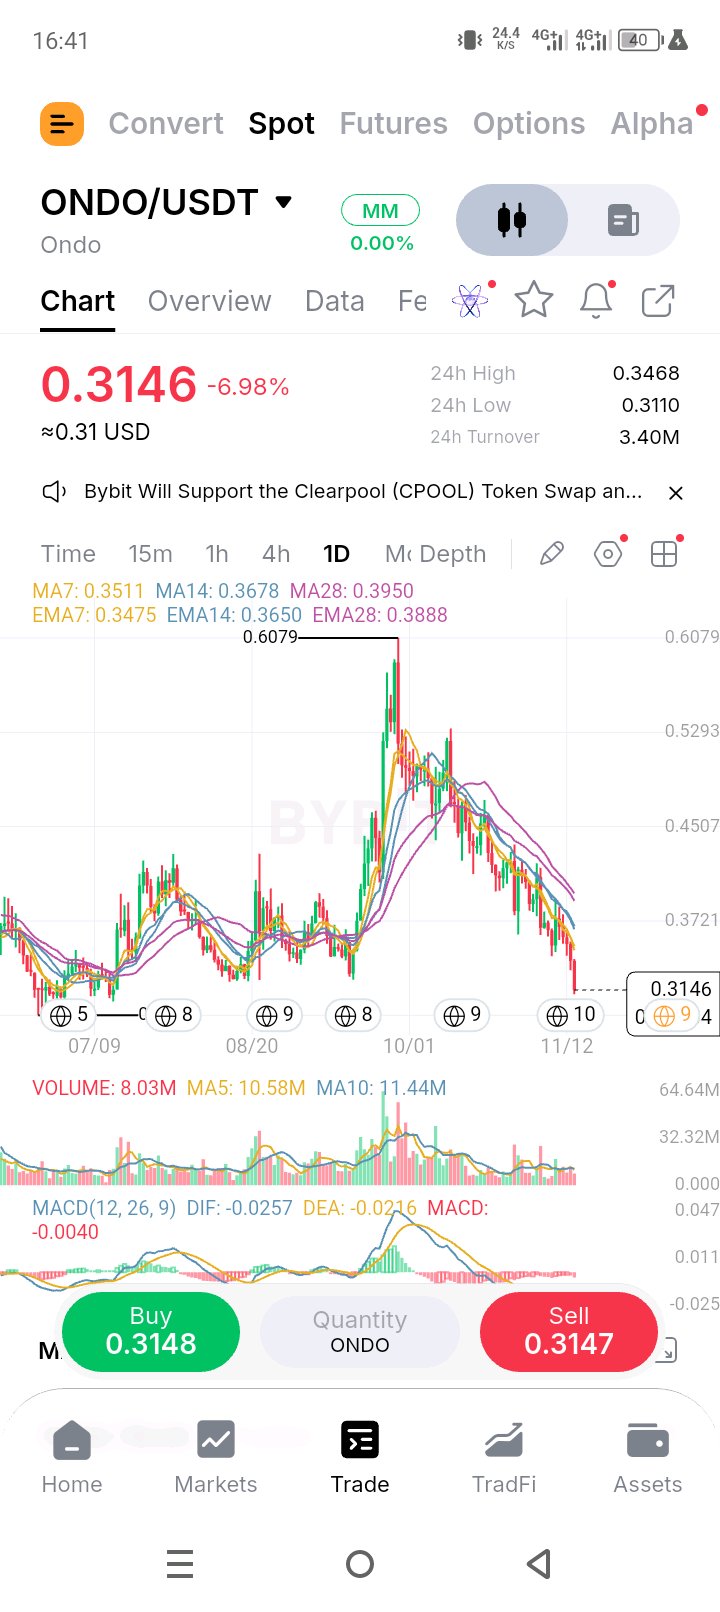
$ONDOUSDT está en 0,3146 (-6,98%), cerca de un 48,2% por debajo del máximo de 0,6079, un 9,3% por debajo del máximo de 24h de 0,3468 y un 1,2% por encima del mínimo de 24h de 0,3110. El rango de 24h es un intervalo del 11,5% y a la vela diaria le quedan unas ocho horas. El precio ha roto por debajo de los mínimos de agosto y septiembre, aproximadamente 0,32-0,33 según mi lectura (aproximada), y está operando cerca de los precios más bajos desde julio. Todas las medias están por encima y cayendo, apiladas de rápida a lenta: 9,5-10,4% por debajo de las de 7 periodos (EMA7 0,3475, MA7 0,3511), 13,8-14,5% por debajo de las de 14 periodos (EMA14 0,3650, MA14 0,3678) y 19,1-20,4% por debajo de las de 28 periodos (EMA28 0,3888, MA28 0,3950). Un día de -6,98% aleja aún más el precio de todas ellas, por lo que un rebote tiene un largo camino por recorrer antes de alcanzar la pila. El volumen es solo medio en esta caída. El volumen de negociación de 24h de 3,40M USDT equivale a unos 10,8M ONDO, cerca de un 2% por encima de la MA5 (10,58M) y un 5,5% por debajo de la MA10 (11,44M), y la barra de hoy es de 8,03M con unas ocho horas restantes, así que sigue aumentando. La MA5 se sitúa un 7,5% por debajo de la MA10. Es una tendencia bajista lenta sin un pico de capitulación todavía, lo que significa que el lavado puede no haber terminado. El MACD es negativo y sigue apuntando hacia abajo: DIF (-0,0257) está por debajo de DEA (-0,0216), con un histograma de -0,0040, y ambas líneas por debajo de cero. Niveles a vigilar: Soporte: 0,3110 (mínimo de 24h), aproximadamente 0,294 (el mínimo de julio, aproximado). No hay nada marcado por debajo en este gráfico. Resistencia: aproximadamente 0,32-0,33 (los mínimos rotos de agosto-septiembre, aproximado), 0,3468 (máximo de 24h), 0,3475 (EMA7), 0,3511 (MA7), 0,3650 (EMA14), 0,3678 (MA14), 0,3721 (línea de cuadrícula), 0,3888 (EMA28), 0,3950 (MA28), 0,4507 (línea de cuadrícula), 0,5293 (línea de cuadrícula), luego 0,6079 (el máximo). Plan, en cierres diarios: Largo con soporte bajo (contratendencia): una caída hasta 0,3050-0,3130 que se mantenga en el cierre diario por encima de 0,3110. Entrada 0,3120, stop por debajo de 0,3280, que es un riesgo de 0,0140. 0,3475 es cerca de 2,5R, 0,3650 cerca de 3,8R y 0,3888 cerca de 5,5R. Largo por recuperación: un cierre diario por encima de 0,3511 con un volumen superior a la MA10 de 11,44M, seguido de un retest de 0,3470-0,3515 que aguante. Entrada 0,3560, stop por debajo de 0,3430, que es un riesgo de 0,0130. 0,3721 es solo de aproximadamente 1,2R, así que reduciría posiciones ahí, luego 0,3950 es cerca de 3,0R y 0,4507 cerca de 7,3R. Desplome (corto o salida): un cierre diario por debajo de 0,3110 con un volumen superior a la MA5 de 10,58M, seguido de un retest fallido de 0,3110-0,3220. Entrada 0,3150, stop por encima de 0,3260, que es un riesgo de 0,0110. 0,2940 es cerca de 1,9R, aunque es aproximado, y sin nada marcado por debajo, dejaría correr el resto. Invalidación: el largo con soporte bajo falla por debajo de 0,2980. La lectura bajista se suaviza en un cierre diario por encima de 0,3678 (MA14), y la tendencia bajista se ha revertido por encima de 0,3950 (MA28). Nota de riesgo: el precio acaba de perder su base y ha caído casi un 7% en el día, por lo que los rebotes pueden ser bruscos y breves. Los stops importan más que los objetivos. Órdenes limitadas, tamaño pequeño. Esa es mi lectura del gráfico, no es un consejo.$ONDOUSDT #ByXIMPACT
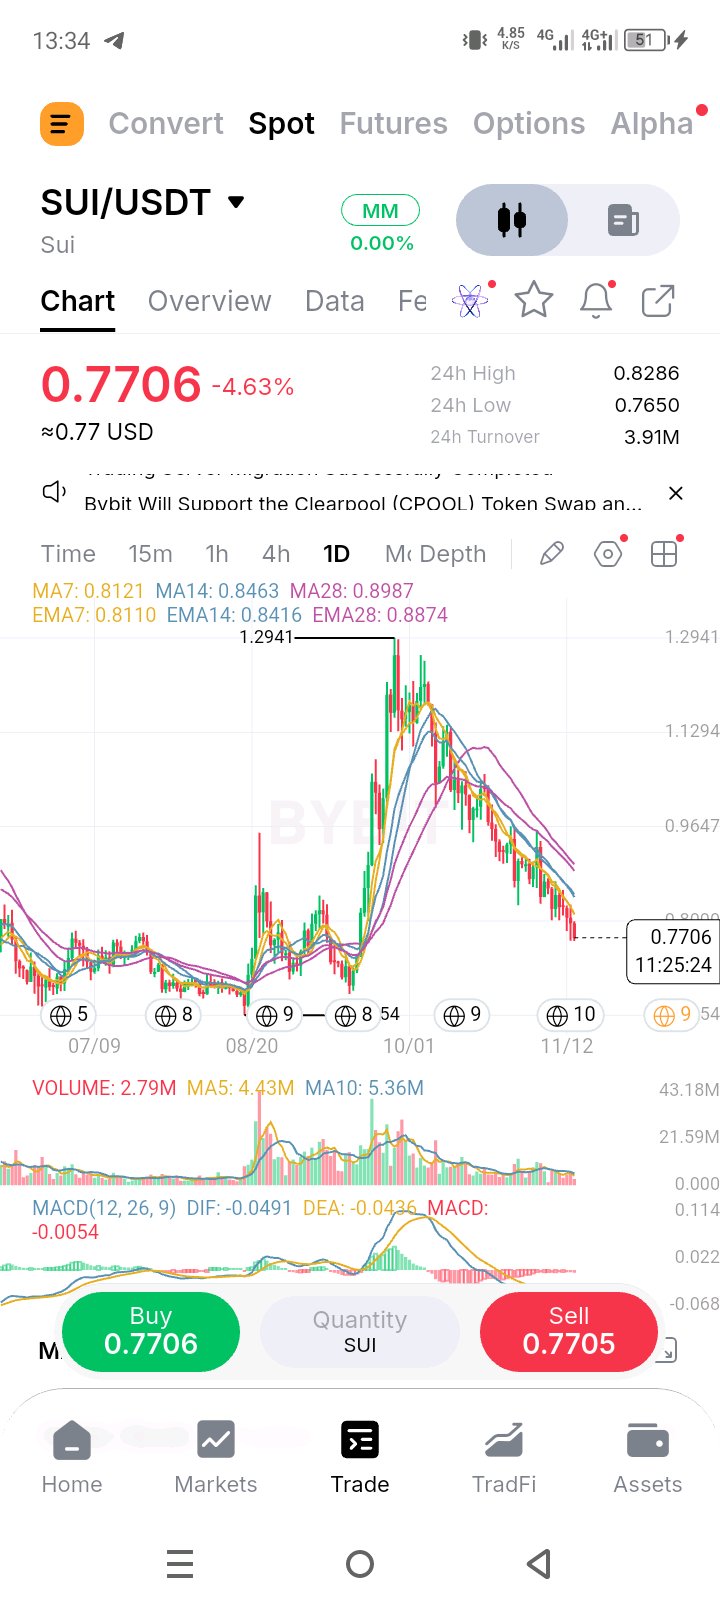
$SUIUSDT is at 0.7706 (-4.63%), about 40.5% under the 1.2941 high, 7.0% under the 24h high of 0.8286 and 0.7% above the 24h low of 0.7650. The 24h range is an 8.3% box, and the daily candle has about eleven and a half hours left. Price has given back the whole rally and is back inside the August-September base (approximate), with the August low of 0.6354 still 21.3% below. Every average is overhead and falling, stacked fast under slow: 5.0-5.1% under the 7s (EMA7 0.8110, MA7 0.8121), 8.4-8.9% under the 14s (EMA14 0.8416, MA14 0.8463) and 13.2-14.3% under the 28s (EMA28 0.8874, MA28 0.8987). The 0.8000 grid line sits just under the fast pair, so the first resistance is a zone, not a line. Volume has been fading into the decline: the MA5 (4.43M) sits 17.3% under the MA10 (5.36M). Today’s bar is 2.79M with over eleven hours left, so it is early, and the 24h turnover of 3.91M USDT works out to roughly 5.1M SUI, about 15% above the MA5 but still under the MA10. This is steady selling, not a panic. MACD is negative and still pointing down: DIF (-0.0491) is under DEA (-0.0436), a histogram of -0.0054, with both lines below zero. Levels to watch: Support: 0.7650 (24h low), roughly 0.65-0.67 (the September low, approximate), 0.6354 (the August low, the lowest price on this chart). Nothing is marked below it. Resistance: 0.8000 (grid line), 0.8110 (EMA7), 0.8121 (MA7), 0.8286 (24h high), 0.8416 (EMA14), 0.8463 (MA14), 0.8874 (EMA28), 0.8987 (MA28), 0.9647 (grid line), 1.1294 (grid line), then 1.2941 (the high). Plan, on daily closes: Low-hold long (counter-trend): a dip into 0.7550-0.7700 that holds on the daily close above 0.7650. Entry 0.7650, stop under 0.7350, which is 0.0300 of risk. 0.8110 is about 1.5R, 0.8416 about 2.6R and 0.8874 about 4.1R. Reclaim long: a daily close above 0.8121 on volume above the 5.36M MA10, then a retest of 0.8000-0.8125 that holds. Entry 0.8180, stop under 0.7950, which is 0.0230 of risk. 0.8463 is about 1.2R, so I’d trim there, then 0.8987 is about 3.5R and 0.9647 about 6.4R. Breakdown (short or exit): a daily close under 0.7650 on volume above the 4.43M MA5, then a failed retest of 0.7650-0.7800. Entry 0.7720, stop above 0.7850, which is 0.0130 of risk. 0.6700 is about 7.8R and 0.6354 about 10.5R, though the 0.67 area is approximate, so I’d trail after the first. Invalidation: the low-hold long fails under 0.7350. The bearish read softens on a daily close above 0.8463 (MA14), and the downtrend has turned above 0.8987 (MA28). Risk note: the 24h low is the only nearby floor, so a close under 0.7650 can slide a long way before the next marked support. Stops matter more than targets. Limit orders, small size. That’s my read of the chart, not advice.$SUIUSDT #ByXIMPACT
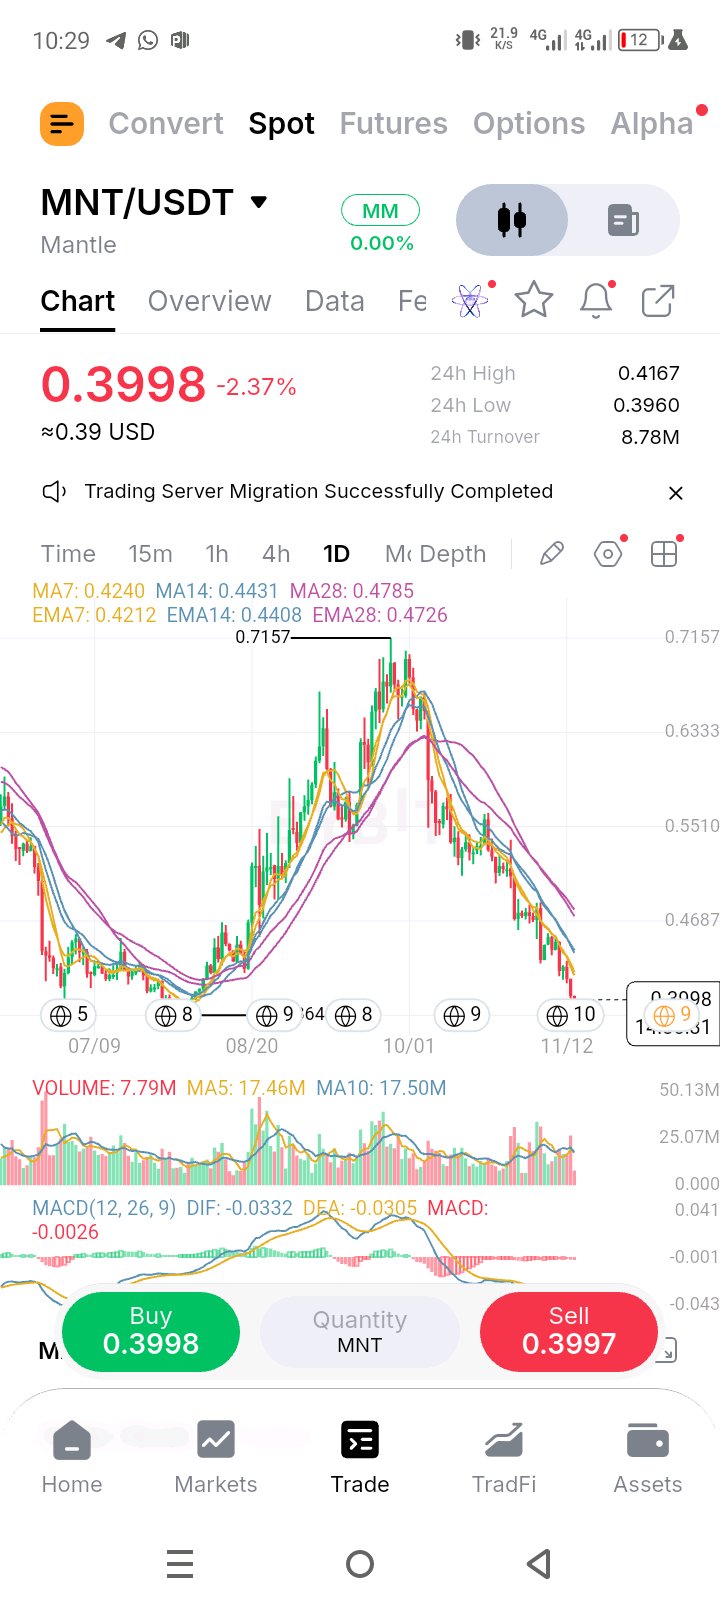
$MNTUSDT is at 0.3998 (-2.37%), about 44.1% under the 0.7157 high, 4.1% under the 24h high of 0.4167 and 1.0% above the 24h low of 0.3960. The 24h range is a 5.2% box, and the daily candle has about fourteen hours left. Price has given back the whole rally and is now 3.5% above the August low of 0.3864, the lowest price on this chart. Every average is overhead and sloping down, stacked fast under slow: 5.1-5.7% under the 7s (EMA7 0.4212, MA7 0.4240), 9.3-9.8% under the 14s (EMA14 0.4408, MA14 0.4431) and 15.4-16.4% under the 28s (EMA28 0.4726, MA28 0.4785). The gap to the 28s is wide, so any bounce has a lot of overhead to chew through. Volume is picking up into the floor. Today’s bar is 7.79M with about fourteen hours left, too early to judge, but the 24h turnover of 8.78M USDT works out to roughly 22.0M MNT, about 26% above both the MA5 (17.46M) and the MA10 (17.50M). Those two are level, so the extra activity is new, and it is arriving right as price nears the August low. MACD is negative and still pointing down: DIF (-0.0332) is under DEA (-0.0305), a histogram of -0.0026, with both lines below zero. Levels to watch: Support: 0.3960 (24h low), 0.3864 (the August low). Nothing is marked below it on this chart. Resistance: 0.4167 (24h high), 0.4212 (EMA7), 0.4240 (MA7), 0.4408 (EMA14), 0.4431 (MA14), 0.4687 (grid line), 0.4726 (EMA28), 0.4785 (MA28), 0.5510 (grid line), 0.6333 (grid line), then 0.7157 (the high). Plan, on daily closes: Low-hold long (counter-trend): a dip into 0.3864-0.3960 that holds on the daily close above 0.3864. Entry 0.3900, stop under 0.3780, which is 0.0120 of risk. 0.4212 is about 2.6R, 0.4431 about 4.4R and 0.4726 about 6.9R. Reclaim long: a daily close above 0.4240 on volume above the 17.50M MA10, then a retest of 0.4190-0.4245 that holds. Entry 0.4290, stop under 0.4150, which is 0.0140 of risk. 0.4431 is only about 1.0R, so I’d trim there, then 0.4785 is about 3.5R and 0.5510 about 8.7R. Breakdown (short or exit): a daily close under 0.3864 on volume above the 17.50M MA10, then a failed retest of 0.3860-0.3960. Entry 0.3880, stop above 0.4000, which is 0.0120 of risk. The August low is the bottom of this chart, so there is nothing below to aim at and the trade is a trail. Invalidation: the low-hold long fails under 0.3780. The bearish read softens on a daily close above 0.4431 (MA14), and the downtrend has turned above 0.4785 (MA28). Risk note: the August low is the floor of this chart, so a break leaves no marked support to lean on and can run fast. Size small, use limit orders and respect the stop. That’s my read of the chart, not advice.#ByXIMPACT$MNTUSDT
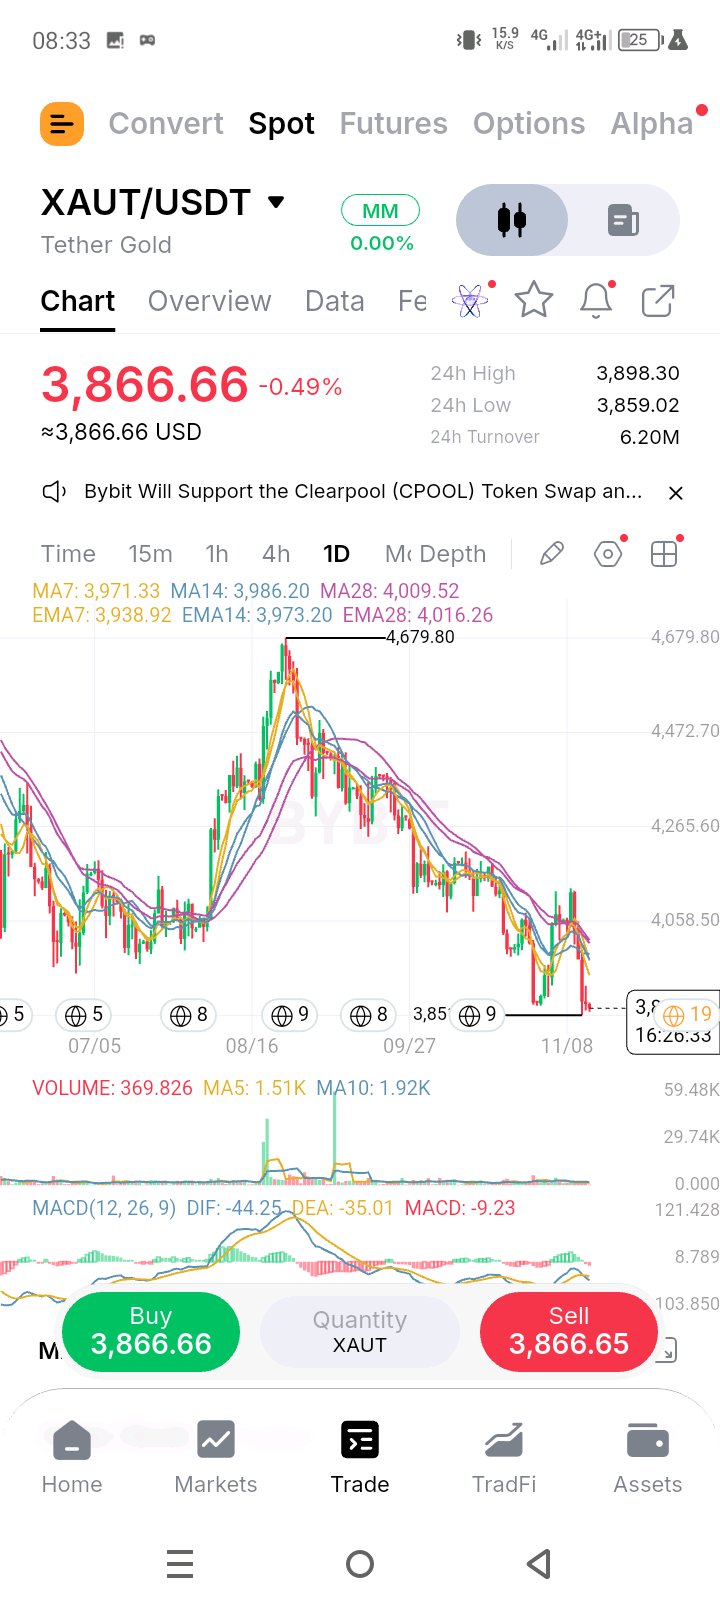
$XAUTUSDT is at 3,866.66 (-0.49%), about 17.4% under the 4,679.80 high, 0.2% above the 24h low of 3,859.02 and 0.4% above the 3,851.40 low marked on the chart. The 24h range is a tight 1.0% box, and the daily candle still has over sixteen hours left. Price is pinned to the bottom of the chart, under every average. All the averages are overhead, bunched into a 3,939-4,016 band: 1.8% under the EMA7 (3,938.92), 2.6% under the MA7 (3,971.33), 2.7-3.0% under the 14s (EMA14 3,973.20, MA14 3,986.20) and 3.6-3.7% under the 28s (MA28 4,009.52, EMA28 4,016.26). The 4,000 round number sits inside that band, so a reclaim has to clear the whole stack, not one line. Volume is dry. The MA5 (1.51K) sits 21.4% under the MA10 (1.92K), so activity has been fading, and today’s bar is only 369.83 with over sixteen hours left, which is too early to judge. The 24h turnover of 6.20M USDT works out to roughly 1.6K XAUT, about 6% above the MA5. Nobody is rushing to sell this low, but nobody is stepping in either. MACD is negative and pointing down: DIF (-44.25) is under DEA (-35.01), a histogram of -9.23, with both lines below zero. Levels to watch: Support: 3,859.02 (24h low), 3,851.40 (the marked low). Nothing is marked below it on this chart. Resistance: 3,898.30 (24h high), 3,938.92 (EMA7), 3,971.33 (MA7), 3,973.20 (EMA14), 3,986.20 (MA14), 4,009.52 (MA28), 4,016.26 (EMA28), 4,058.50 (grid line), 4,265.60 (grid line), 4,472.70 (grid line), then 4,679.80 (the high). Plan, on daily closes: Low-hold long (counter-trend): a dip into 3,850-3,870 that holds on the daily close above 3,851.40. Entry 3,860, stop under 3,830, which is 30 of risk. 3,938.92 is about 2.6R, 3,973.20 about 3.8R and 4,016.26 about 5.2R. Reclaim long: a daily close above 4,016.26 on volume above the 1.51K MA5, then a retest of 3,990-4,020 that holds. Entry 4,030, stop under 3,980, which is 50 of risk. 4,058.50 is only about 0.6R, so I’d trim a small piece there, then 4,265.60 is about 4.7R and 4,472.70 about 8.9R. Breakdown (short or exit): a daily close under 3,851.40 on volume above the 1.51K MA5, then a failed retest of 3,850-3,880. Entry 3,855, stop above 3,885, which is 30 of risk. There is no level below to measure a target against, so the trade is a trail. Invalidation: the low-hold long fails under 3,830. The bearish read softens on a daily close above 3,986.20 (MA14), and the downtrend has turned above 4,016.26 (EMA28). Risk note: the day has barely started and the range is only 1.0%, and a quiet tape can break either way on one headline. XAUT tracks gold, so gold’s own moves can override this chart. Limit orders, small size. That’s my read of the chart, not advice$XAUTUSDT #ByXIMPACT
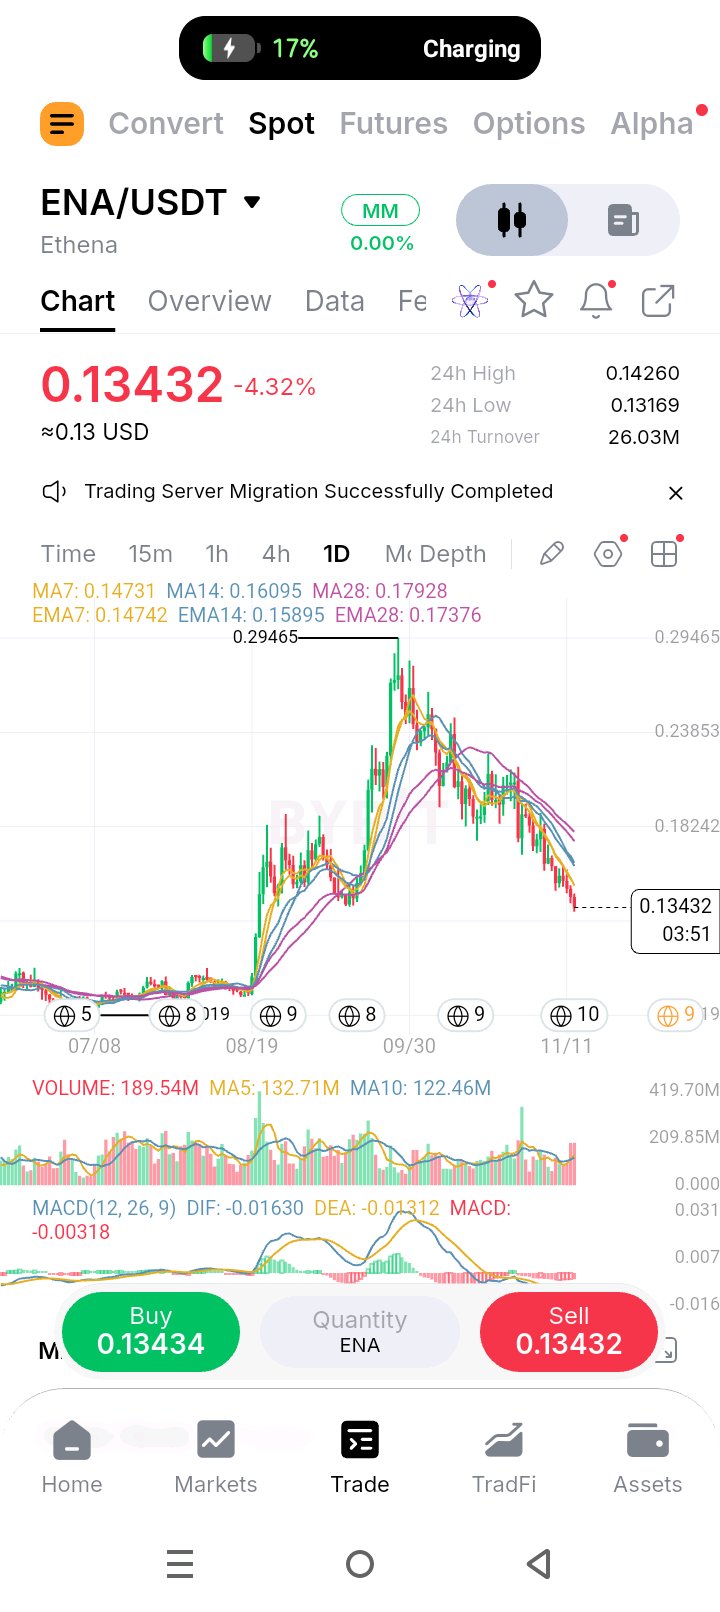
$ENAUSDT está en 0,13432 (-4,32%), aproximadamente un 54,4% por debajo del máximo de 0,29465, un 5,8% por debajo del máximo de 24h de 0,14260 y un 2,0% por encima del mínimo de 24h de 0,13169. El rango de 24h es una caja del 8,3%, y a la vela diaria le quedan menos de cuatro minutos. El precio ha cedido todo el segundo tramo y está justo alrededor del mínimo del retroceso de septiembre, aproximadamente 0,135-0,140 según mi lectura (aproximado). Todas las medias están por encima y cayendo, apiladas de rápida a lenta: 8,8-8,9% por debajo de las de 7 periodos (EMA7 0,14742, MA7 0,14731), 15,5-16,5% por debajo de las de 14 (EMA14 0,15895, MA14 0,16095) y 22,7-25,1% por debajo de las de 28 (EMA28 0,17376, MA28 0,17928). El precio tiene que recuperar las de 7 antes de que el resto de la pila entre siquiera en juego. El volumen es fuerte en la bajada. La barra de hoy es de 189,54M con la vela casi terminada, un 42,8% por encima de la MA5 (132,71M) y un 54,8% por encima de la MA10 (122,46M), y la MA5 se sitúa un 8,4% por encima de la MA10, por lo que la participación ha estado aumentando hacia el mínimo. El volumen de negociación de 24h de 26,03M USDT equivale aproximadamente a 193,8M ENA, justo en línea con la barra. Eso es venta real, no una sangría silenciosa. El MACD es negativo y apunta hacia abajo: DIF (-0,01630) está por debajo de DEA (-0,01312), un histograma de -0,00318, con ambas líneas por debajo de cero. Niveles a vigilar: Soporte: 0,13169 (mínimo de 24h), unos 0,1263 (línea de cuadrícula, aproximado), luego nada marcado hasta la base de agosto, aproximadamente 0,08-0,09 (aproximado), y unos 0,0702 (línea de cuadrícula, aproximado). Resistencia: 0,14260 (máximo de 24h), 0,14731 (MA7), 0,14742 (EMA7), 0,15895 (EMA14), 0,16095 (MA14), 0,17376 (EMA28), 0,17928 (MA28), 0,18242 (línea de cuadrícula), 0,23853 (línea de cuadrícula), luego 0,29465 (el máximo). Plan, en cierres diarios: Largo de mantenimiento en mínimos (contra tendencia): una caída hacia 0,1270-0,1320 que se mantenga en el cierre diario por encima de 0,13169. Entrada 0,1300, stop por debajo de 0,1230, lo que supone 0,0070 de riesgo. 0,14742 es aproximadamente 2,5R, 0,15895 aproximadamente 4,1R y 0,17376 aproximadamente 6,3R. Largo de recuperación: un cierre diario por encima de 0,14742 con volumen por encima de la MA5 de 132,71M, seguido de un retesteo de 0,1465-0,1480 que aguante. Entrada 0,1490, stop por debajo de 0,1445, lo que es 0,0045 de riesgo. 0,15895 es aproximadamente 2,2R, así que reduciría ahí, luego 0,17376 es aproximadamente 5,5R y 0,18242 aproximadamente 7,4R. Ruptura (corto o salida): un cierre diario por debajo de 0,13169 con volumen por encima de la MA5 de 132,71M, seguido de un retesteo fallido de 0,1315-0,1350. Entrada 0,1325, stop por encima de 0,1360, lo que es 0,0035 de riesgo. 0,1263 es aproximadamente 1,8R, y al no haber nada marcado por debajo hasta la base de agosto, seguiría el resto. Invalidación: el largo de mantenimiento en mínimos falla por debajo de 0,1230. La lectura bajista se suaviza en un cierre diario por encima de 0,16095 (MA14), y la tendencia bajista ha girado por encima de 0,17928 (MA28). Nota de riesgo: la vela está a punto de cerrar, por lo que todo aquí puede cambiar al cierre, y con tanto aire por debajo de 0,1263, una ruptura a la baja puede extenderse. Los stops importan más que los objetivos. Órdenes límite, tamaño pequeño. Esa es mi lectura del gráfico, no es un consejo.#ByXIMPACT$ENAUSDT
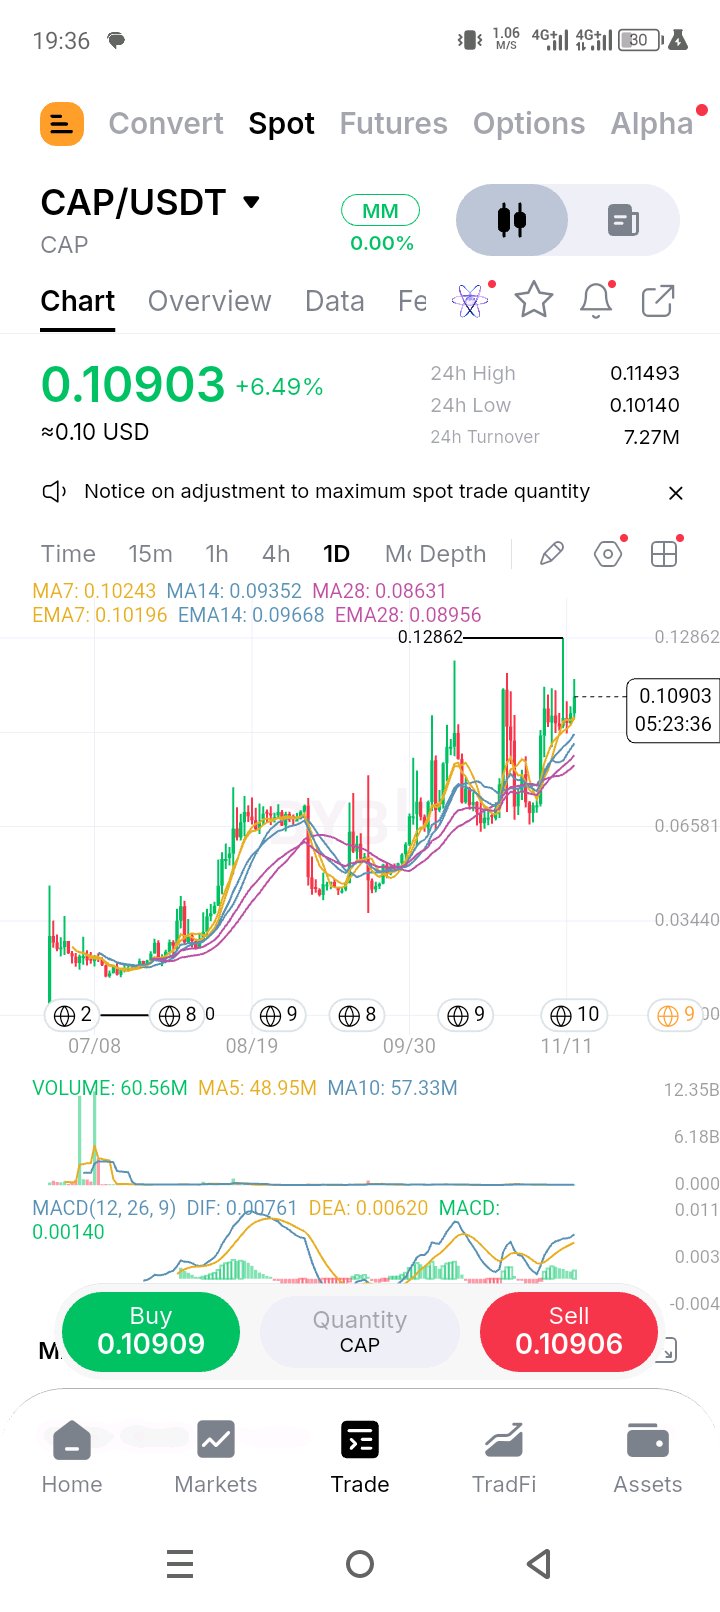
$CAPUSDT está en 0.10903 (+6.49%), un 15.2% por debajo del máximo de 0.12862, un 5.1% por debajo del máximo de 24h de 0.11493 y un 7.5% por encima del mínimo de 24h de 0.10140. El rango de 24h es un rango del 13.3%, y a la vela diaria le quedan poco más de cinco horas. El precio está por encima de todas las medias y presionando de nuevo hacia el máximo. Todas las medias están por debajo del precio y curvándose hacia arriba, apiladas de rápida a lenta: 6.4-6.9% por encima de las de 7 (EMA7 0.10196, MA7 0.10243), 12.8-16.6% por encima de las de 14 (EMA14 0.09668, MA14 0.09352) y 21.7-26.3% por encima de las de 28 (EMA28 0.08956, MA28 0.08631). Es una tendencia alcista clara, pero la brecha con las de 28 indica que está extendido. El volumen se está expandiendo con el impulso. La barra de hoy es de 60.56M con algo más de cinco horas restantes, ya un 23.7% por encima de la MA5 (48.95M) y un 5.6% por encima de la MA10 (57.33M), y el volumen de negocio de 24h de 7.27M USDT equivale aproximadamente a 66.7M CAP, cerca de un 36% por encima de la MA5. La MA5 todavía está un 14.6% por debajo de la MA10, por lo que se trata de un repunte reciente, no una acumulación larga. Los compradores están pagando más. El MACD es positivo: DIF (0.00761) está por encima de DEA (0.00620), con un histograma de +0.00140, y ambas líneas por encima de cero y girando hacia arriba. Niveles a vigilar: Soporte: 0.10243 (MA7), 0.10196 (EMA7), 0.10140 (mínimo 24h), 0.09722 (línea de grid, aproximado), 0.09668 (EMA14), 0.09352 (MA14), 0.08956 (EMA28), 0.08631 (MA28), luego 0.06581 (línea de grid). Resistencia: 0.11493 (máximo 24h), luego 0.12862 (el máximo). No hay nada marcado por encima en este gráfico. Plan, en cierres diarios: Pullback largo (continuación de tendencia): una caída hacia 0.1020-0.1050 que se mantenga en el cierre diario por encima de las de 7. Entrada 0.1040, stop por debajo de 0.0965, lo que supone 0.0075 de riesgo. 0.11493 es aproximadamente 1.5R y 0.12862 aproximadamente 3.3R, después no hay nada marcado por encima, así que seguiría la tendencia. Breakout largo: un cierre diario por encima de 0.11493 con un volumen por encima de la MA10 de 57.33M, seguido de un retest de 0.1130-0.1150 que se mantenga. Entrada 0.1160, stop por debajo de 0.1105, lo que supone 0.0055 de riesgo. 0.12862 es aproximadamente 2.3R, y como no hay nada marcado por encima, seguiría el resto. Breakdown (salida o corto): un cierre diario por debajo de 0.10140 con un volumen por encima de la MA5 de 48.95M, seguido de un retest fallido de 0.1015-0.1045. Entrada 0.1030, stop por encima de 0.1060, lo que supone 0.0030 de riesgo. 0.09722 es aproximadamente 1.9R, 0.09352 aproximadamente 3.2R y 0.08956 aproximadamente 4.5R. Invalidación: el pullback largo falla por debajo de 0.0965. La lectura alcista se debilita con un cierre diario por debajo de 0.09352 (MA14), y la tendencia alcista se ha invertido por debajo de 0.08631 (MA28). Nota de riesgo: el precio está extendido, 16.6% por encima de la MA14 y 26.3% por encima de la MA28, y los movimientos extendidos pueden corregir rápido. Prefiero esperar al retroceso que perseguir el precio. Órdenes limitadas, tamaño pequeño. Esa es mi lectura del gráfico, no es un consejo.$CAPUSDT #ByXIMPACT
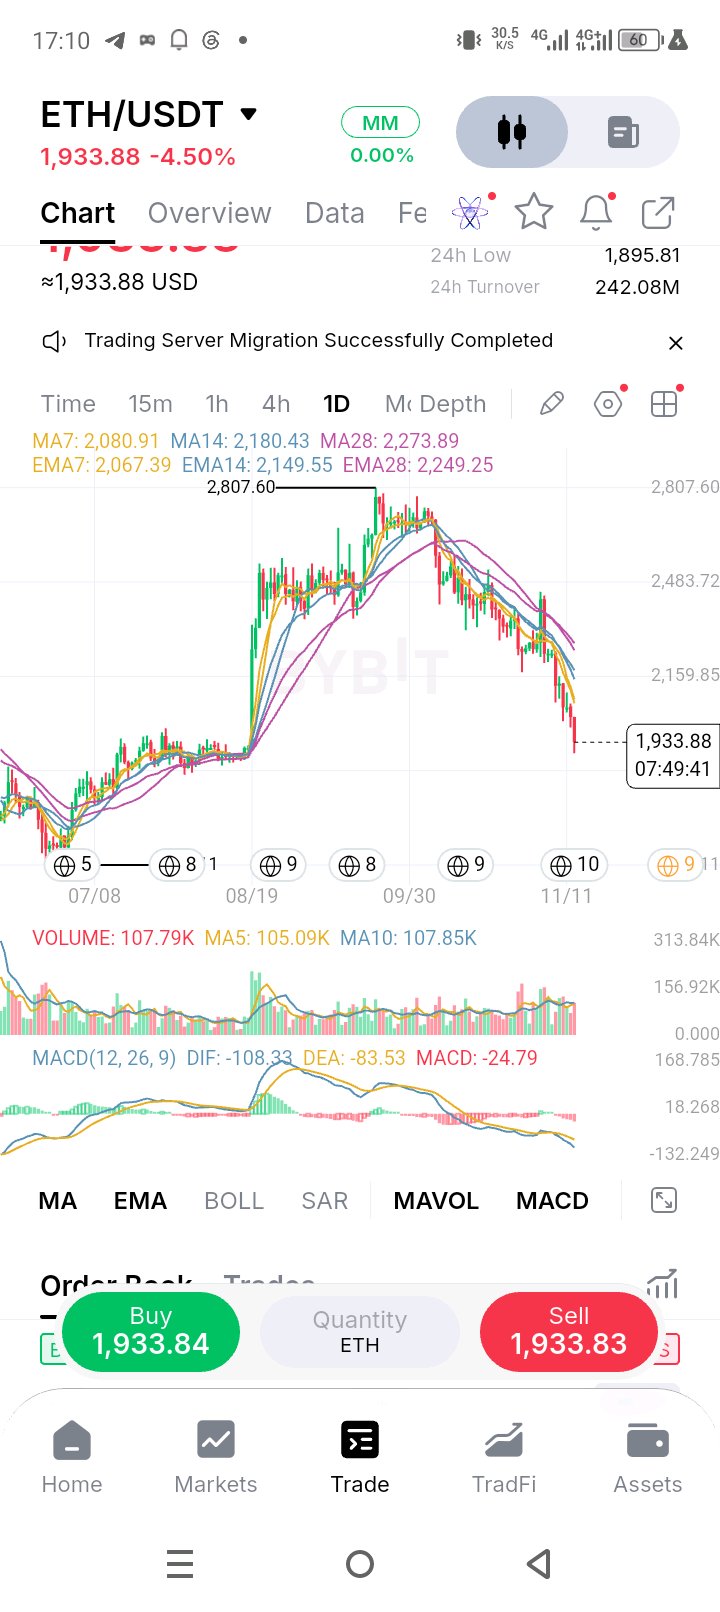
$ETHUSDT está en 1.933,88 (-4,50%), aproximadamente un 31,1% por debajo del máximo de 2.807,60 y un 2,0% por encima del mínimo de 24 horas de 1.895,81. A la vela diaria le quedan poco menos de ocho horas. El precio ha devuelto toda la subida y se encuentra dentro de la base de agosto, que según mi lectura estuvo aproximadamente en el rango 1.850-1.950 (aproximado), el soporte desde el que se lanzó la ruptura. Todas las medias están por encima y cayendo, apiladas de rápida a lenta: 6,5% por debajo de la EMA7 (2.067,39), 7,1% por debajo de la MA7 (2.080,91), 10,0-11,3% por debajo de las 14 (EMA14 2.149,55, MA14 2.180,43) y 14,0-15,0% por debajo de las 28 (EMA28 2.249,25, MA28 2.273,89). Un día de -4,50% con esa pila por encima indica que los vendedores siguen teniendo el control. El volumen es sólido en el camino hacia abajo. La barra de hoy está en 107,79K con casi ocho horas por delante, al nivel de la MA10 (107,85K) y un 2,6% por encima de la MA5 (105,09K), y el volumen de 24 horas de 242,08M USDT equivale a unos 125K ETH, aproximadamente un 19% por encima de la MA5. La participación está aumentando en la caída, lo que hace que esto sea una venta masiva real, no algo infundado. El MACD es negativo y sigue apuntando hacia abajo: el DIF (-108,33) está por debajo de la DEA (-83,53), con un histograma de -24,79, y ambas líneas por debajo de cero. Niveles a observar: Soporte: 1.895,81 (mínimo de 24h), alrededor de 1.836 (línea de cuadrícula, aproximado), alrededor de 1.512 (línea de cuadrícula, cerca del mínimo de julio, aproximado). Resistencia: 2.067,39 (EMA7), 2.080,91 (MA7), 2.149,55 (EMA14), 2.159,85 (línea de cuadrícula), 2.180,43 (MA14), 2.249,25 (EMA28), 2.273,89 (MA28), 2.483,72 (línea de cuadrícula), luego 2.807,60 (el máximo). Plan, según cierres diarios: Largo de mantenimiento en mínimos (contra tendencia): una caída a 1.880-1.920 que se mantiene en el cierre diario por encima de 1.895,81. Entrada en 1.905, stop por debajo de 1.865, lo que supone 40 de riesgo. 2.067,39 está a unos 4,1R, 2.149,55 a unos 6,1R y 2.249,25 a unos 8,6R. Largo de recuperación: un cierre diario por encima de 2.080,91 con volumen superior a la MA5 de 105,09K, seguido de un retest de 2.060-2.085 que se mantenga. Entrada en 2.090, stop por debajo de 2.040, lo que supone 50 de riesgo. 2.149,55 está solo a unos 1,2R, así que recortaría una pequeña parte allí, luego 2.273,89 está a unos 3,7R y 2.483,72 a unos 7,9R. Desglose (corto o salida): un cierre diario por debajo de 1.895,81 con volumen superior a la MA5 de 105,09K, seguido de un retest fallido de 1.895-1.935. Entrada en 1.910, stop por encima de 1.950, lo que supone 40 de riesgo. 1.836 está a unos 1,9R y 1.512 a unos 10R, aunque ambos son aproximados, así que seguiría la tendencia después del primero. Invalidación: el largo de mantenimiento en mínimos falla por debajo de 1.865. La lectura bajista se suaviza con un cierre diario por encima de 2.180,43 (MA14), y la tendencia bajista se revierte por encima de 2.273,89 (MA28). Nota de riesgo: el precio está sentado sobre la base antigua después de una caída rápida, así que me importa más dónde me equivoco que dónde acierto. Órdenes limitadas, tamaño pequeño. Esa es mi lectura del gráfico, no es un consejo.$ETHUSDT #IMPACTbyTrade
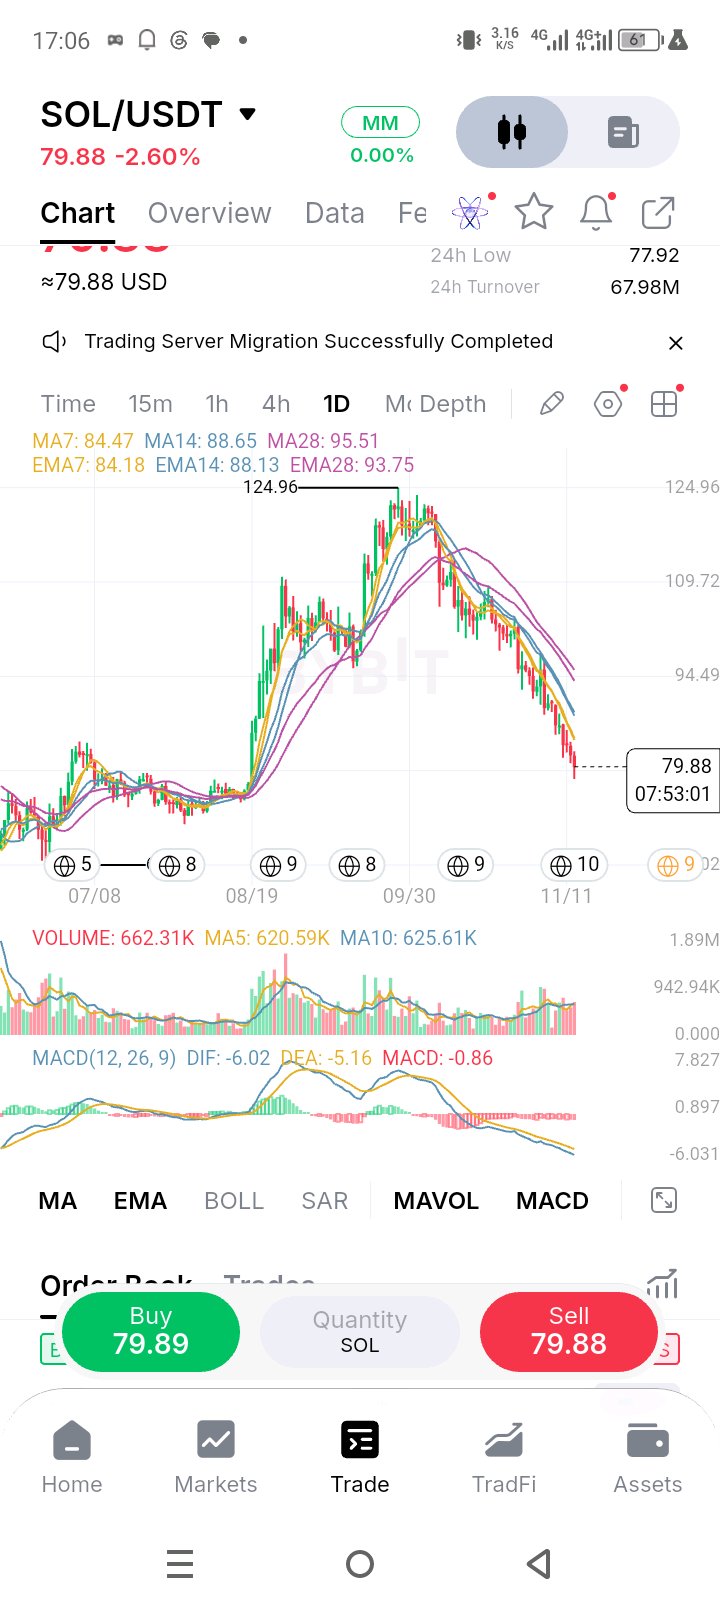
$SOLUSDT está en 79,88 (-2,60%), aproximadamente un 36,1% por debajo del máximo de 124,96 y un 2,5% por encima del mínimo de 24 horas de 77,92. A la vela diaria le quedan poco menos de ocho horas. El precio ha revertido toda la subida y se encuentra justo por encima del soporte desde el que se lanzó la ruptura de agosto, aproximadamente entre 74 y 77 según mi análisis (aproximado). Todas las medias están por encima y cayendo, apiladas de rápida a lenta: 5,1% por debajo de la EMA7 (84,18), 5,4% por debajo de la MA7 (84,47), entre un 9,4% y un 9,9% por debajo de las de 14 (EMA14 88,13, MA14 88,65) y entre un 14,8% y un 16,4% por debajo de las de 28 (EMA28 93,75, MA28 95,51). Es una tendencia bajista ordenada, no un desplome de un solo día. El volumen se mantiene en el camino hacia abajo. La barra de hoy está en 662,31K con casi ocho horas todavía por delante, ya un 6,7% por encima de la MA5 (620,59K) y un 5,9% por encima de la MA10 (625,61K), y el volumen de negocio de 24 horas de 67,98M USDT equivale aproximadamente a 851K SOL, cerca de un 37% por encima de la MA5. Con la MA5 y la MA10 estables, la participación extra es la de hoy, y está llegando en el mínimo. Eso es vender con cierta convicción. El MACD es negativo y sigue apuntando hacia abajo: el DIF (-6,02) está por debajo de la DEA (-5,16), con un histograma de -0,86, y ambas líneas están por debajo de cero y en la lectura más baja de este gráfico. Niveles a vigilar: Soporte: 79,26 (línea de cuadrícula, justo debajo del precio), 77,92 (mínimo de 24h), aproximadamente 74-77 (el soporte de la ruptura de agosto, aproximado), 64,02 (línea de cuadrícula, cerca del mínimo de julio, aproximado). Resistencia: 84,18 (EMA7), 84,47 (MA7), 88,13 (EMA14), 88,65 (MA14), 93,75 (EMA28), 94,49 (línea de cuadrícula), 95,51 (MA28), 109,72 (línea de cuadrícula), luego 124,96 (el máximo). Plan, al cierre diario: Compra en soporte bajo (contratendencia): una caída hasta 77,00-79,30 que se mantenga al cierre diario. Entrada en 78,50, stop por debajo de 75,00, lo que supone un riesgo de 3,50. 84,18 es aproximadamente 1,6R, 88,13 aproximadamente 2,8R y 93,75 aproximadamente 4,4R. Compra por recuperación: un cierre diario por encima de 84,47 con volumen superior a la MA5 de 620,59K, seguido de un nuevo testeo de 83,50-84,50 que se mantenga. Entrada en 85,00, stop por debajo de 82,50, lo que supone un riesgo de 2,50. 88,65 es aproximadamente 1,5R, así que recortaría ahí, luego 95,51 es aproximadamente 4,2R y 109,72 aproximadamente 9,9R. Desglose (venta en corto o salida): un cierre diario por debajo de 77,92 con volumen superior a la MA5 de 620,59K, seguido de un retesteo fallido de 77,90-79,30. Entrada en 78,00, stop por encima de 80,00, lo que supone un riesgo de 2,00. 75,00 es aproximadamente 1,5R y 64,02 aproximadamente 7,0R, aunque ambos son aproximados, así que iría ajustando el trailing stop después del primero. Invalidación: la compra en soporte bajo falla por debajo de 75,00. La lectura bajista se suaviza con un cierre diario por encima de 88,65 (MA14), y la tendencia bajista se revierte por encima de 95,51 (MA28). Nota de riesgo: el precio está de vuelta en un soporte mientras la tendencia sigue siendo bajista, así que los stops importan más que los objetivos. Usa órdenes limitadas y mantén el tamaño de la posición pequeño. Esa es mi lectura del gráfico, no es un consejo. $SOLUSDT#IMPACTbyTrade$SOLUSDT
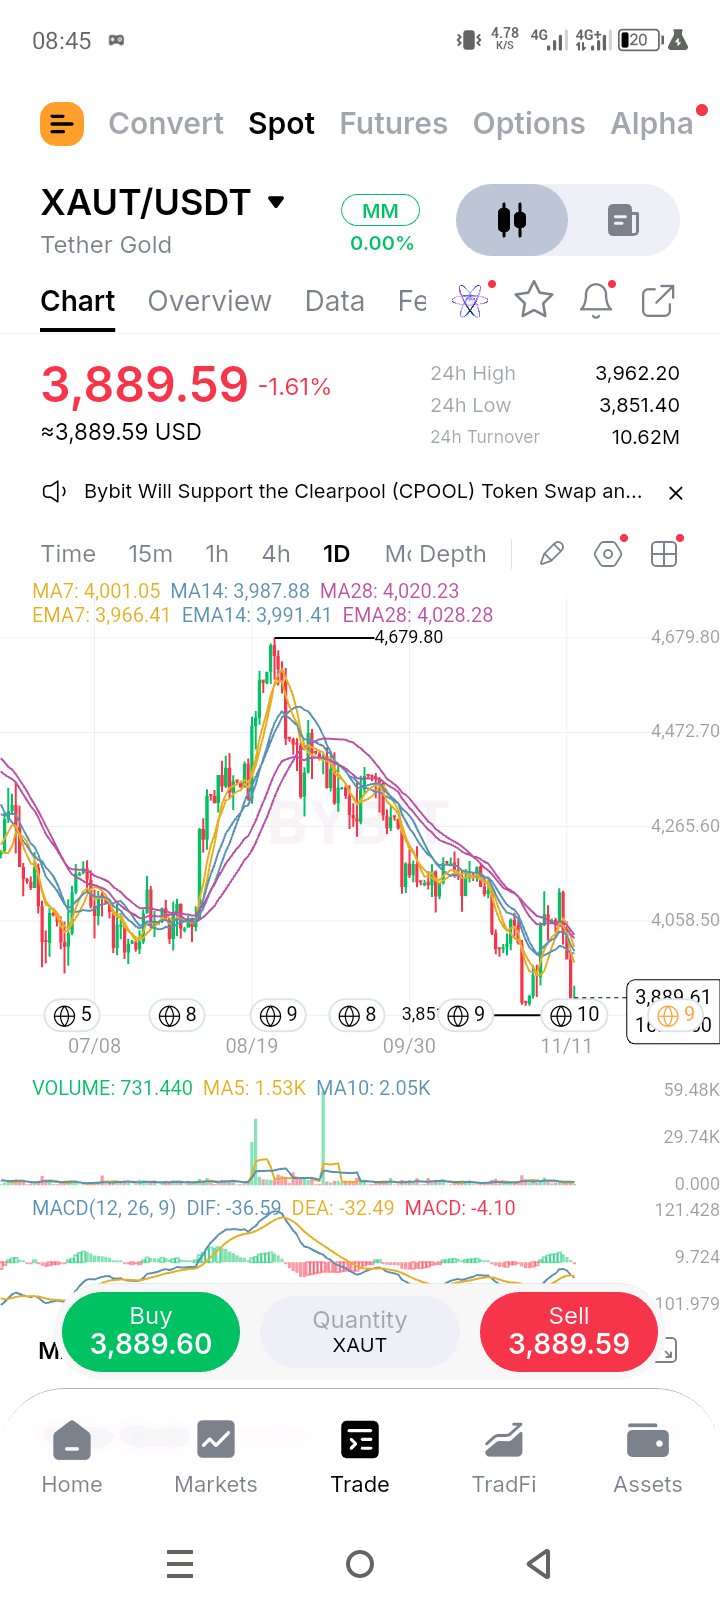
$XAUTUSDT is at 3,889.59 (-1.61%), about 16.9% under the 4,679.80 high and 1.0% above today’s low of 3,851.40. The 24h range is 3,851.40 to 3,962.20, a 2.9% box. Price has given back the whole rally and is trading near the lowest prices on this chart, with the daily candle still open. Every average is overhead and sloping down, packed into a tight 3,966-4,028 band: 1.9% under the EMA7 (3,966.41), 2.8% under the MA7 (4,001.05), 2.5-2.6% under the 14s (MA14 3,987.88, EMA14 3,991.41) and 3.3-3.4% under the 28s (MA28 4,020.23, EMA28 4,028.28). The 4,000 round number sits inside that cluster, so it stacks as one resistance zone, not separate levels. Volume is waking up late. Today’s bar is only 731.44 with the candle still open, well under the MA5 (1.53K) and MA10 (2.05K), and the MA5 sits 25% under the MA10, so the last few days were quiet. But the 24h turnover of 10.62M USDT works out to roughly 2.7K XAUT, above both averages, so most of that pace came before today’s candle opened. Selling is picking up into the low, and today’s bar needs the close to confirm it. MACD is negative: DIF (-36.59) is under DEA (-32.49), a histogram of -4.10, with both lines below zero. The histogram is shallow, so momentum leans down without accelerating. Levels to watch: Support: 3,851.40 (24h low). Nothing is marked below it on this chart. Resistance: 3,962.20 (24h high), 3,966.41 (EMA7), 3,987.88 (MA14), 3,991.41 (EMA14), 4,001.05 (MA7), 4,020.23 (MA28), 4,028.28 (EMA28), 4,058.50 (grid line), 4,265.60 (grid line), 4,472.70 (grid line), then 4,679.80 (the high). Plan, on daily closes: Low-hold long (counter-trend): a dip into 3,850-3,880 that holds on the daily close. Entry 3,870, stop under 3,830, which is 40 of risk. 3,966.41 is about 2.4R, 3,991.41 about 3.0R and 4,028.28 about 4.0R. Reclaim long: a daily close above 4,028.28 on volume above the 1.53K MA5, then a retest of 4,000-4,030 that holds. Entry 4,040, stop under 3,990, which is 50 of risk. 4,058.50 is only about 0.4R, so I’d trim a small piece there, then 4,265.60 is about 4.5R and 4,472.70 about 8.7R. Breakdown (short or exit): a daily close under 3,851.40 on volume above the 1.53K MA5, then a failed retest of 3,850-3,890. Entry 3,865, stop above 3,905, which is 40 of risk. There’s nothing marked below on this chart to measure a target against, so I’d trail instead. Invalidation: the low-hold long fails under 3,830. The bearish read softens on a daily close above 3,991.41 (EMA14), and the downtrend has turned above 4,028.28 (EMA28). Risk note: price is near the lows of the chart and nothing is marked beneath it, so stops matter more than targets. XAUT tracks gold, so a move in gold itself can override these levels. Use limit orders and keep size small. That’s my read of the chart, not advice.$XAUTUSDT #ByXIMPACT
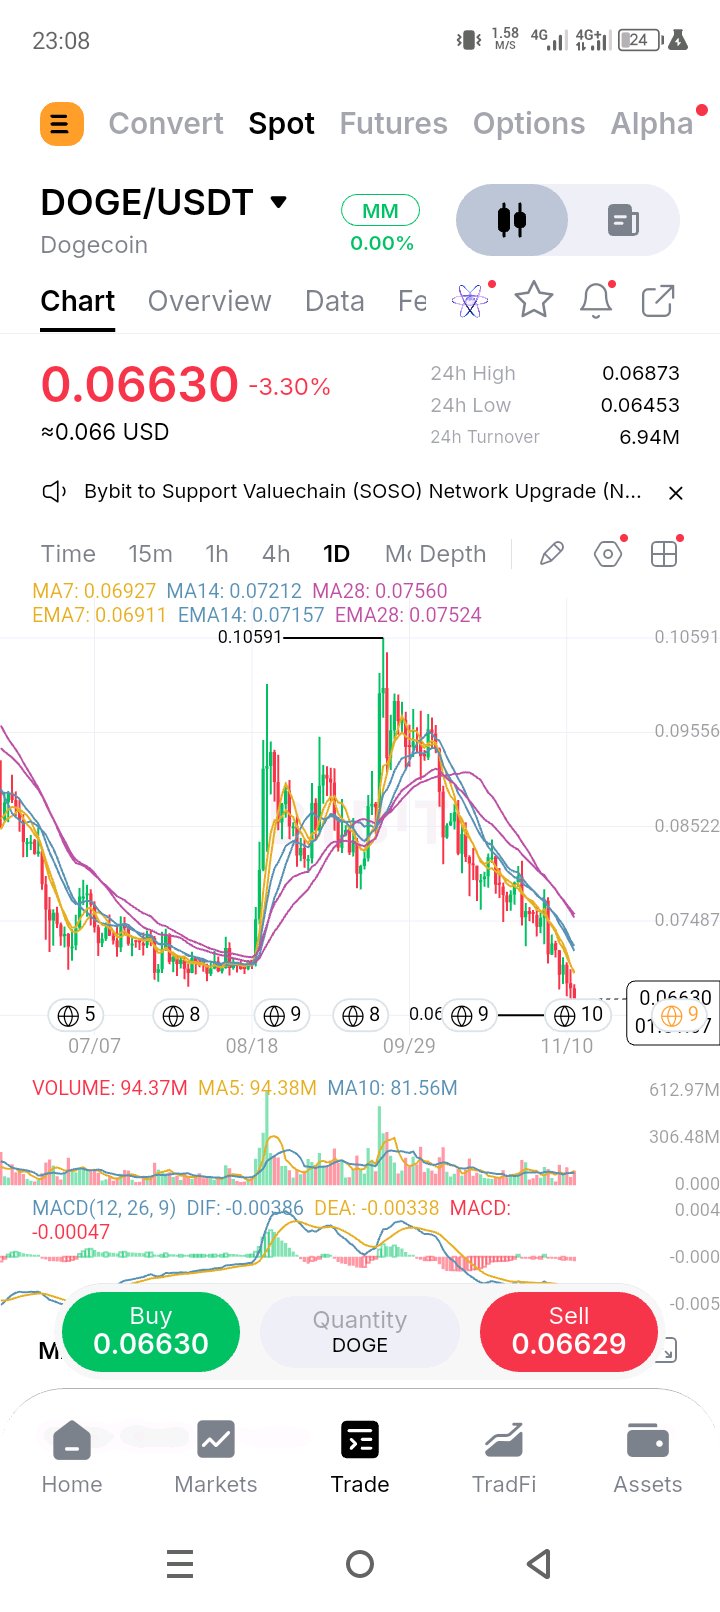
$DOGEUSDT se sitúa en 0.06630 (-3.30%), alrededor de un 37% por debajo del máximo de finales de septiembre de 0.10591 y un 2.7% por encima del mínimo de hoy de 0.06453, que coincide con la línea de cuadrícula de 0.0645. El rango de 24 horas es de 0.06453 a 0.06873, un rango del 6.5%. El precio ha roto por debajo de toda la base de agosto, que según mi lectura se situaba alrededor de 0.070-0.072, por lo que cotiza cerca de los precios más bajos en este gráfico, y a la vela le quedan menos de dos horas. Todas las medias están por encima y cayendo: 4.1-4.3% por debajo de la EMA7 (0.06911) y la MA7 (0.06927), 7.4-8.1% por debajo de la EMA14 (0.07157) y la MA14 (0.07212), y 11.9-12.3% por debajo de la EMA28 (0.07524) y la MA28 (0.07560). La antigua base de agosto alrededor de 0.070-0.072 actúa ahora como resistencia, que se apila justo encima del par rápido y las medias de 14. El volumen se mantiene en el camino hacia abajo. La barra de hoy es de 94.37M con menos de dos horas por delante, nivelada con la MA5 (94.38M) y un 16% por encima de la MA10 (81.56M), y el volumen de negocio de 24h de 6.94M USDT equivale aproximadamente a 105M de DOGE. La MA5 está un 16% por encima de la MA10, así que la participación ha ido aumentando hacia el mínimo. Eso es venta con convicción, no una deriva. El MACD es de neutral a negativo: el DIF (-0.00386) está justo por debajo de la DEA (-0.00338), un histograma de -0.00047, con ambas líneas por debajo de cero. Niveles a vigilar: Soporte: 0.06453 (mínimo de 24h y línea de cuadrícula). No hay nada marcado por debajo en este gráfico. Resistencia: 0.06873 (máximo de 24h), 0.06911 (EMA7), 0.06927 (MA7), aproximadamente 0.070-0.072 (la antigua base de agosto, aproximado), 0.07157 (EMA14), 0.07212 (MA14), 0.07487 (línea de cuadrícula), 0.07524 (EMA28), 0.07560 (MA28), 0.08522 (línea de cuadrícula), luego 0.10591 (el máximo). Plan, en cierres diarios: Largo de soporte bajo (Low-hold long): una caída hacia 0.0640-0.0660 que se mantenga en el cierre diario. Entrada 0.0655, stop por debajo de 0.0625, lo cual es 0.0030 de riesgo. 0.06911 es aproximadamente 1.2R, 0.07157 aproximadamente 2.0R y 0.07524 aproximadamente 3.2R. Recuperación (Reclaim long): un cierre diario por encima de 0.06927 con un volumen superior a la MA5 de 94.38M, seguido de un retesteo de 0.0687-0.0693 que se mantenga. Entrada 0.0700, stop por debajo de 0.0675, lo cual es 0.0025 de riesgo. La MA14 en 0.07212 es solo alrededor de 0.8R, así que reduciría ahí, luego 0.07524 es alrededor de 2.1R y 0.08522 alrededor de 6.1R. Desglose (corto o salida): un cierre diario por debajo de 0.06453 con un volumen superior a la MA5 de 94.38M, seguido de un retesteo fallido de 0.0645-0.0675. Entrada 0.0660, stop por encima de 0.0690, lo cual es 0.0030 de riesgo. No hay nada marcado por debajo en este gráfico para medir un objetivo, así que preferiría seguir el precio (trailing). Invalidación: el largo de soporte bajo falla por debajo de 0.0625. La lectura bajista se suaviza con un cierre diario por encima de 0.07212 (MA14), y la tendencia bajista se ha revertido por encima de 0.07560 (MA28). Nota de riesgo: con el precio cerca de los mínimos del gráfico y sin niveles por debajo, los stops importan más que los objetivos. Usa órdenes limitadas y mantén un tamaño pequeño. Esa es mi lectura del gráfico, no es un consejo.$DOGEUSDT #IMPACTbyTrade
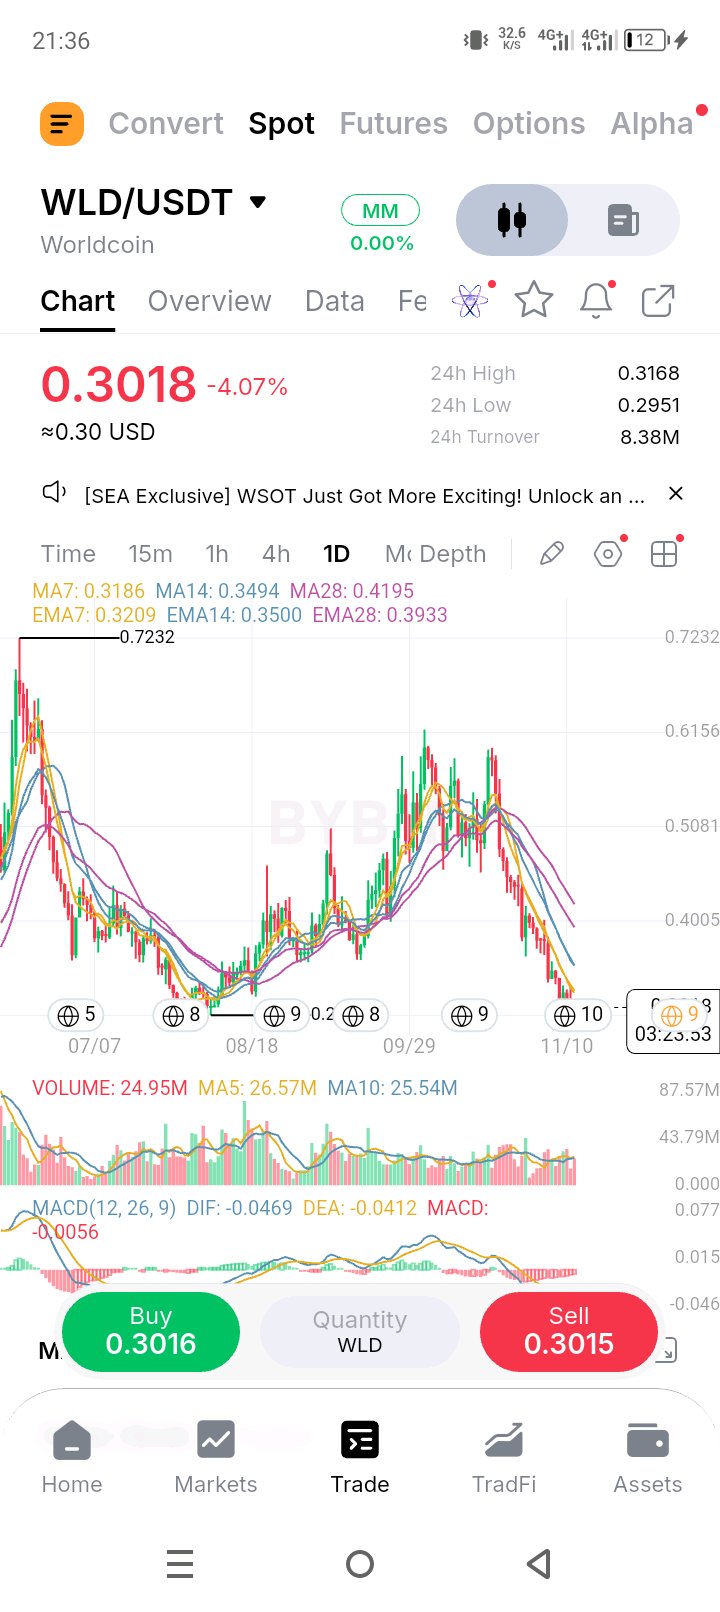
$WLDUSDT está en 0,3018 (-4,07%), aproximadamente un 51% por debajo del máximo de principios de octubre (más o menos 0,615 según mi lectura del eje) y un 2,9% por encima de la línea de la cuadrícula de 0,2930, que coincide con el mínimo de agosto. El mínimo de hoy de 0,2951 se detuvo a menos de un 0,7% de ese nivel, y el rango de 24 horas es de 0,2951 a 0,3168, una oscilación del 7,4%. A la vela le quedan unas tres horas y media, así que el cierre está prácticamente definido. Todas las medias están por encima y cayendo: 5,3% por debajo de la MA7 (0,3186), 5,9% por debajo de la EMA7 (0,3209), 13,6-13,8% por debajo de las 14 (0,3494 y 0,3500), 23,3% por debajo de la EMA28 (0,3933) y 28,1% por debajo de la MA28 (0,4195). El primer nodo está en 0,3168-0,3209, donde el máximo de 24 horas, la MA7 y la EMA7 se sitúan a menos de un 1,3% de diferencia entre sí. Más allá, el antiguo suelo de septiembre, más o menos 0,36-0,38 según mi lectura, se sitúa justo por encima de las 14. El volumen es constante, no se acelera. La barra de hoy es de 24,95M con tres horas y media restantes, ya al 94% de la MA5 (26,57M) y al 98% de la MA10 (25,54M), y el volumen de negocio de 24 horas de 8,38M USDT equivale a unos 27,8M de WLD. El MACD es la parte alentadora: el DIF (-0,0469) está por debajo de la DEA (-0,0412), pero el histograma se ha reducido a -0,0056 y, según mi lectura, el DIF se ha mantenido prácticamente plano mientras el precio bajaba ligeramente. Es una divergencia positiva leve, no una señal por sí sola. Niveles a vigilar: Soporte: 0,2951 (mínimo de 24h), luego 0,2930 (línea de la cuadrícula, parcialmente oculta detrás de la etiqueta de precio, así que calculada a partir del espaciado del eje, y más o menos donde se sitúa el mínimo de agosto). No hay nada marcado por debajo en este gráfico. Resistencia: 0,3168 (máximo de 24h), 0,3186 (MA7), 0,3209 (EMA7), aproximadamente 0,36-0,38 (el antiguo suelo de septiembre, aproximado), 0,3494 (MA14), 0,3500 (EMA14), 0,3933 (EMA28), 0,4005 (línea de la cuadrícula), 0,4195 (MA28), 0,5081 (línea de la cuadrícula), luego 0,6156 (línea de la cuadrícula). Plan, en cierres diarios: Largo en el mínimo de agosto: mantenimiento de 0,2930-0,3000 al cierre diario. Entrada 0,2970, stop por debajo de 0,2820, lo que supone 0,0150 de riesgo. 0,3209 es aproximadamente 1,6R, 0,3500 aproximadamente 3,5R y 0,3933 aproximadamente 6,4R. Largo de recuperación: un cierre diario por encima de 0,3209 con un volumen superior a la MA5 de 26,57M, seguido de un retest de 0,3168-0,3209 que se mantenga. Entrada 0,3250, stop por debajo de 0,3110, lo que supone 0,0140 de riesgo. 0,3500 es aproximadamente 1,8R, 0,3933 aproximadamente 4,9R y 0,4195 aproximadamente 6,8R. Desglose (corto o salida): un cierre diario por debajo de 0,2930 con un volumen superior a la MA5 de 26,57M, seguido de un retest fallido de 0,2930-0,3010. Entrada 0,2970, stop por encima de 0,3050, lo que supone 0,0080 de riesgo. No hay nada marcado por debajo en este gráfico para medir un objetivo, así que utilizaría un trailing stop. Invalidación: el largo en el mínimo de agosto falla por debajo de 0,2820. La lectura bajista se suaviza en un cierre diario por encima de 0,3500 (EMA14), y la tendencia bajista se revierte por encima de 0,4195 (MA28). Nota de riesgo: esta es la segunda prueba del mismo soporte en pocos días, y no hay nada probado por debajo en este gráfico, por lo que los stops son importantes. Utilice órdenes limitadas y mantenga un tamaño pequeño. Esa es mi lectura del gráfico, no es un consejo #ByXIMPACT$WLDUSDT
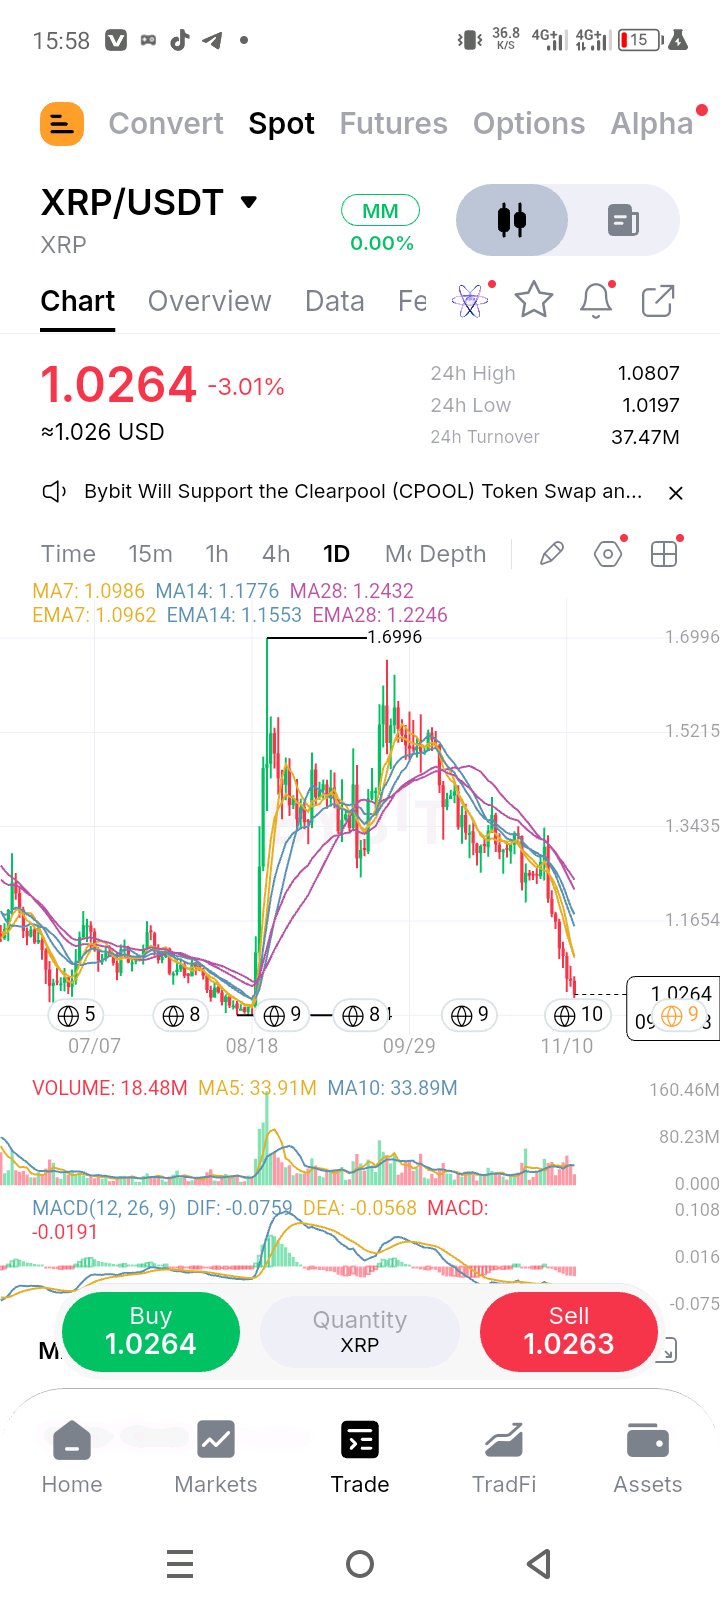
$XRPUSDT está en 1,0264 (-3,01%), un masivo 39,6% por debajo del pico de 1,6996 de mediados de septiembre, y actualmente se sitúa solo un 0,6% por encima del mínimo de 24h de 1,0197. El reciente impulso hacia el grupo de medias móviles fracasó dramáticamente, lo que resultó en una caída pronunciada y en cascada. El precio se está desplomando actualmente por debajo de un soporte estructural importante. El rango de 24h es de 1,0197 a 1,0807, aproximadamente un 6,0%, y a la vela diaria le quedan aproximadamente 8 horas. Las seis medias están apiladas fuertemente por encima del precio actual, confirmando una violenta tendencia macro bajista. El precio está un 6,5% por debajo de la MA7 a corto plazo (1,0986) y un 11,5% por debajo de la EMA7 (1,0962). Las medias a medio y largo plazo actúan como techos pesados: MA14 (1,1776), EMA14 (1,1553) y EMA28 (1,2246). La MA28 se sitúa un masivo 19,3% por encima del precio actual. Así que cada media móvil en el gráfico actúa como resistencia superior, y el mínimo de 24h (1,0197) es el único suelo inmediato. El volumen muestra signos de agotamiento en la venta. El volumen de la vela actual es de 18,48M, lo que está aproximadamente un 45% por debajo tanto de la MA5 (33,91M) como de la MA10 (33,89M). El precio está cayendo con fuerza con un volumen en descenso. Eso significa que los vendedores agresivos podrían estar quedándose sin fuerza, pero no hay absolutamente ninguna compra agresiva entrando para intentar cazar el cuchillo. Un volumen bajo durante un desplome puede provocar mechas bruscas y erráticas. El MACD es profundamente negativo y se expande a la baja. El DIF (-0,0759) está por debajo de la DEA (-0,0568), y el histograma está en -0,0191. Ambas líneas están muy por debajo de la línea cero, y el histograma rojo en expansión confirma que el impulso bajista todavía se está acelerando. Todavía no hay señal de divergencia alcista o cruce de fondo. Niveles a vigilar: Soporte: 1,0197 (mínimo de 24h), luego el suelo estructural más profundo alrededor de 1,0000 (nivel psicológico) y el mínimo anterior del gráfico cerca de 0,9000. Resistencia: 1,0807 (máximo de 24h), 1,0962 (EMA7), 1,0986 (MA7), 1,1553 (EMA14), 1,1776 (MA14), luego 1,2246 (MA28). Plan, al cierre diario: Largo en suelo (alto riesgo): una caída a 1,0000-1,0197 que se mantenga al cierre diario. Entrada 1,015, stop por debajo de 0,990, que es 25 de riesgo. 1,0962 es cerca de 3,2R, y 1,1553 es cerca de 5,6R. Largo por recuperación: un cierre diario por encima de 1,0986 (MA7) con volumen superior a la MA5 de 33,91M, seguido de un retest de 1,080-1,098 que se mantenga. Entrada 1,100, stop por debajo de 1,050, que es 50 de riesgo. 1,1776 es cerca de 1,5R y 1,2246 es cerca de 2,5R. Desplome (corto): un cierre diario por debajo de 1,0197 con expansión de volumen, seguido de un retest fallido de 1,020-1,050. Entrada 1,010, stop por encima de 1,050, que es 40 de riesgo. El suelo estructural de 0,900 es cerca de 2,7R. Invalidación: el largo en suelo falla en un cierre de nuevo por debajo de 0,990, y la idea de recuperación es errónea en un cierre de nuevo por debajo de 1,050. Un cierre diario por debajo de 1,0000 termina con el escenario de rebote inmediato y abre una profunda tendencia bajista macro. Nota de riesgo: XRP está en una caída libre pronunciada y sin confirmar, sin soporte de medias móviles a la vista. El MACD se acelera a la baja y, aunque el volumen cae, no hay señal de reversión alcista. Cazar este cuchillo que cae es altamente peligroso. Usa órdenes limitadas y mantén el tamaño muy pequeño. Esa es mi lectura del gráfico, no un consejo.$XRPUSDT #ByXIMPACT
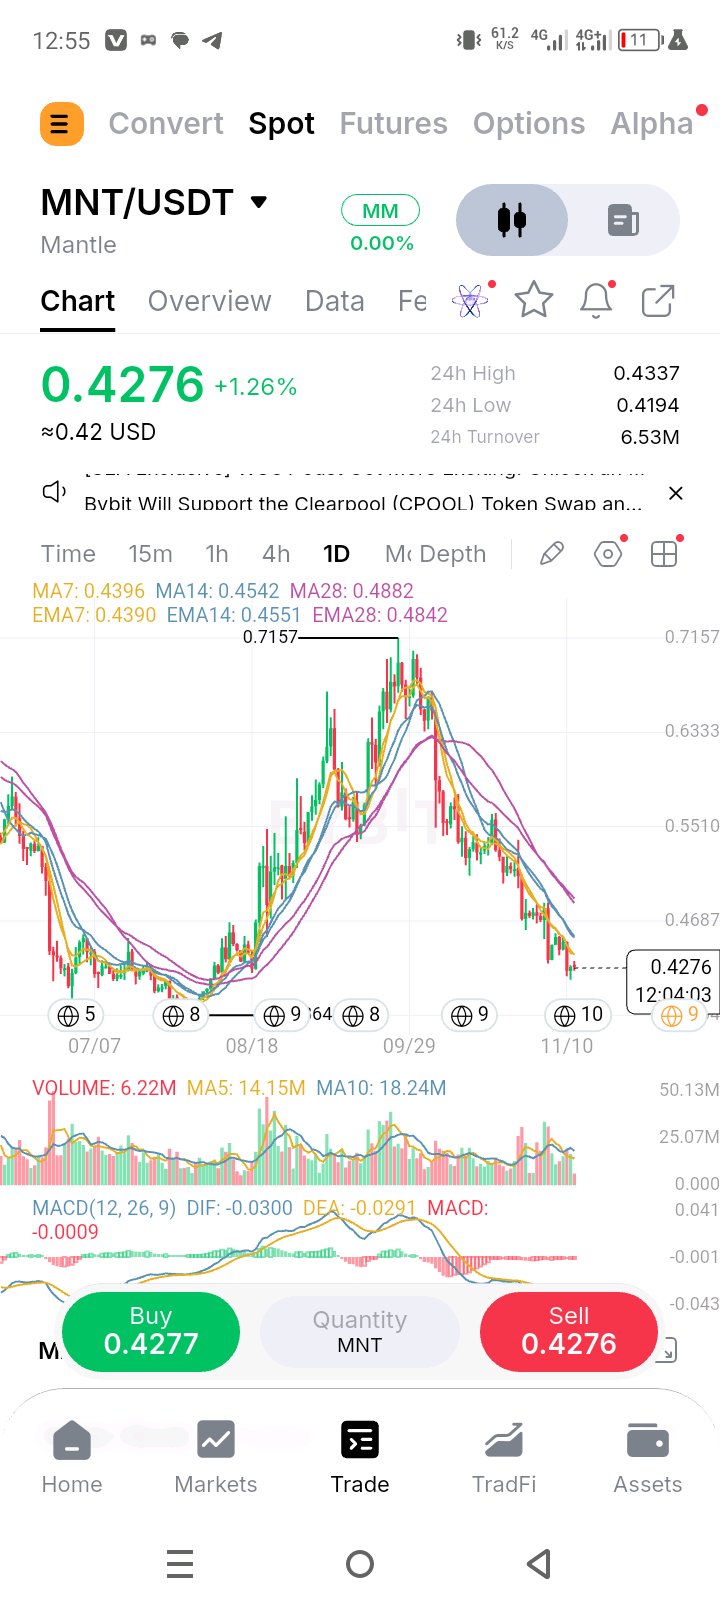
$MNTUSDT is at 0.4276 (+1.26%), about 40% under the late-September high of 0.7157 and only 2.0% above today’s low of 0.4194. It has now slid into the area where the July and August lows sit, roughly 0.40-0.41 by my read of the axis, with the chart low at the 0.3864 grid line. The 24h range is 0.4194 to 0.4337, a 3.4% box, and the candle has about 12 hours left. Every average is overhead and falling: 2.6-2.7% under the EMA7 (0.4390) and MA7 (0.4396), 5.9-6.0% under the MA14 (0.4542) and EMA14 (0.4551), and 11.7-12.4% under the EMA28 (0.4842) and MA28 (0.4882). The 0.4687 grid line sits between the 14s and the 28s, so a bounce has three layers to get through, the first only 2.6% away. Volume is fading with the price. The 24h turnover of 6.53M USDT works out to roughly 15.3M MNT, about 8% above the MA5 (14.15M) but 16% under the MA10 (18.24M), and today’s bar is 6.22M with 12 hours to go. The MA5 is about 78% of the MA10. The slide hasn’t been accelerating on volume. MACD has flattened out: DIF (-0.0300) is only 0.0009 under DEA (-0.0291), with both lines below zero, so downside momentum has stopped growing, though it hasn’t turned. Levels to watch: Support: 0.4194 (24h low), roughly 0.40-0.41 (the July-August lows, approximate), then 0.3864 (grid line, the chart low). Resistance: 0.4337 (24h high), 0.4390 (EMA7), 0.4396 (MA7), 0.4542 (MA14), 0.4551 (EMA14), 0.4687 (grid line), 0.4842 (EMA28), 0.4882 (MA28), 0.5510 (grid line), 0.6333 (grid line), then 0.7157 (the high). Plan, on daily closes: Floor long: a dip into 0.4000-0.4200 that holds on the daily close. Entry 0.4150, stop under 0.3950, which is 0.0200 of risk. 0.4396 is about 1.2R, 0.4551 about 2.0R and 0.4882 about 3.7R. A sweep of the lows toward 0.3864 is possible, so I’d wait for a reaction candle. Reclaim long: a daily close above 0.4396 on volume above the 14.15M MA5, then a retest of 0.4337-0.4396 that holds. Entry 0.4430, stop under 0.4300, which is 0.0130 of risk. The 14s at 0.4551 are only about 0.9R, so I’d trim there, then 0.4687 is about 2.0R and 0.4882 about 3.5R. Breakdown (short or exit): a daily close under 0.4194 on volume above the 14.15M MA5, then a failed retest of 0.4194-0.4300. Entry 0.4250, stop above 0.4350, which is 0.0100 of risk. The 0.3864 chart low is about 3.9R, and under it there’s nothing on this chart to measure against. Invalidation: the floor long fails under 0.3950. The bearish read softens on a daily close above 0.4551 (EMA14), and the downtrend has turned above 0.4882 (MA28). Risk note: a support zone that gets tested again and again can be swept before it holds, so I’d wait for a reaction candle and keep size small. Use limit orders. That’s my read of the chart, not advice.$MNTUSDT #IMPACTbyTrade
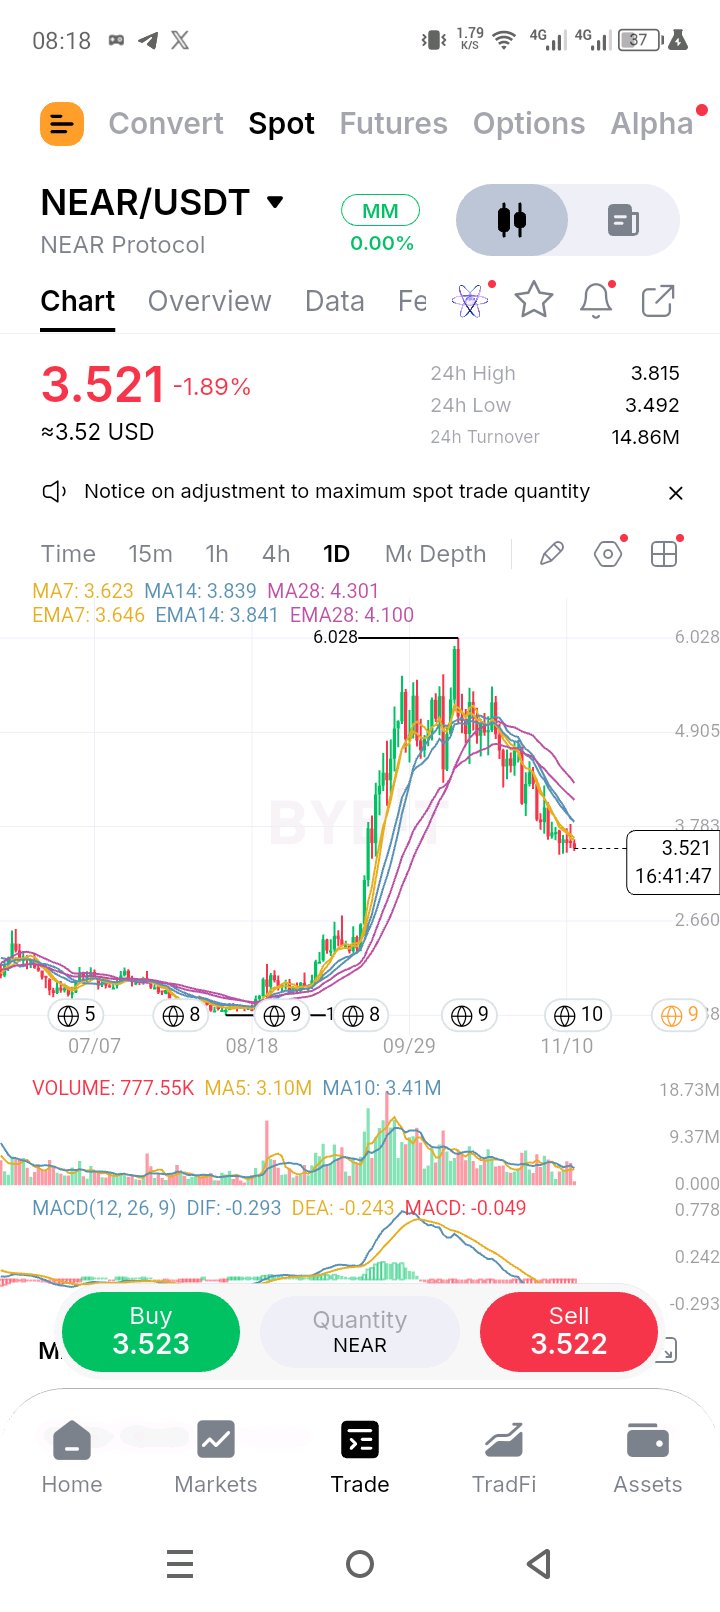
$NEARUSDT is at 3.521 (-1.89%), about 42% under the mid-October high of 6.028 and just 0.8% above today’s low of 3.492, which sits right on the recent low near 3.48 (read off the axis, so approximate). The 24h range is 3.492 to 3.815, a 9% swing: price pushed above the 3.783 grid line, was rejected, and has given back almost all of that push. The candle has about 16 hours left. Every average is overhead and falling: 2.8% under the MA7 (3.623), 3.4% under the EMA7 (3.646), 8.3% under the MA14 (3.839) and EMA14 (3.841), 14.1% under the EMA28 (4.100) and 18.1% under the MA28 (4.301). The 3.783 grid line, the 24h high and the 14s all sit between 3.78 and 3.84, a 1.5% node, and that’s the wall a bounce has to clear. Volume is moderate. The 24h turnover of 14.86M USDT works out to roughly 4.2M NEAR, about 36% above the MA5 (3.10M) and 24% above the MA10 (3.41M), though today’s own bar is only 777.55K about seven hours in. The selling hasn’t needed a spike. MACD is flat and negative: DIF (-0.293) is under DEA (-0.243), a histogram of -0.049, with both lines below zero. Levels to watch: Support: 3.492 (24h low), roughly 3.48 (the recent low, approximate), then the 2.660 grid line, roughly 2.2 (the base top, approximate) and the 1.537 grid line. Nothing is marked between 3.48 and 2.66. Resistance: 3.623 (MA7), 3.646 (EMA7), 3.783 (grid line), 3.815 (24h high), 3.839 (MA14), 3.841 (EMA14), 4.100 (EMA28), 4.301 (MA28), 4.905 (grid line), then 6.028 (the high). Plan, on daily closes: Low-hold long: a dip into 3.44-3.50 that holds on the daily close. Entry 3.480, stop under 3.360, which is 0.120 of risk. 3.646 is about 1.4R, 3.841 about 3.0R and 4.100 about 5.2R. Reclaim long: a daily close above 3.841 on volume above the 3.10M MA5, then a retest of 3.78-3.84 that holds. Entry 3.880, stop under 3.720, which is 0.160 of risk. 4.100 is about 1.4R, 4.301 about 2.6R and 4.905 about 6.4R. Breakdown (short or exit): a daily close under 3.470 on volume above the 3.10M MA5, then a failed retest of 3.47-3.60. Entry 3.540, stop above 3.650, which is 0.110 of risk. The 2.660 grid line is about 8.0R, but there’s nothing marked in between, so treat that target as rough. Invalidation: the low-hold long fails under 3.360. The bearish read softens on a daily close above 3.841, and the downtrend has turned above 4.301 (MA28). Risk note: a low that keeps getting retested with nothing marked beneath it tends to give way eventually, so I’d wait for the daily close and keep size small. Use limit orders. That’s my read of the chart, not advice #IMPACTbyTrade$NEARUSDT