MuzammilWeb3
7793Me gusta0Compartir en el chat97Aficionados21Seguir
🚀 Crypto Signals for Byx Traders | Trade Smart, Profit Smart 💰
🚀 Crypto Signals for Byx Traders | Trade Smart, Profit Smart 💰
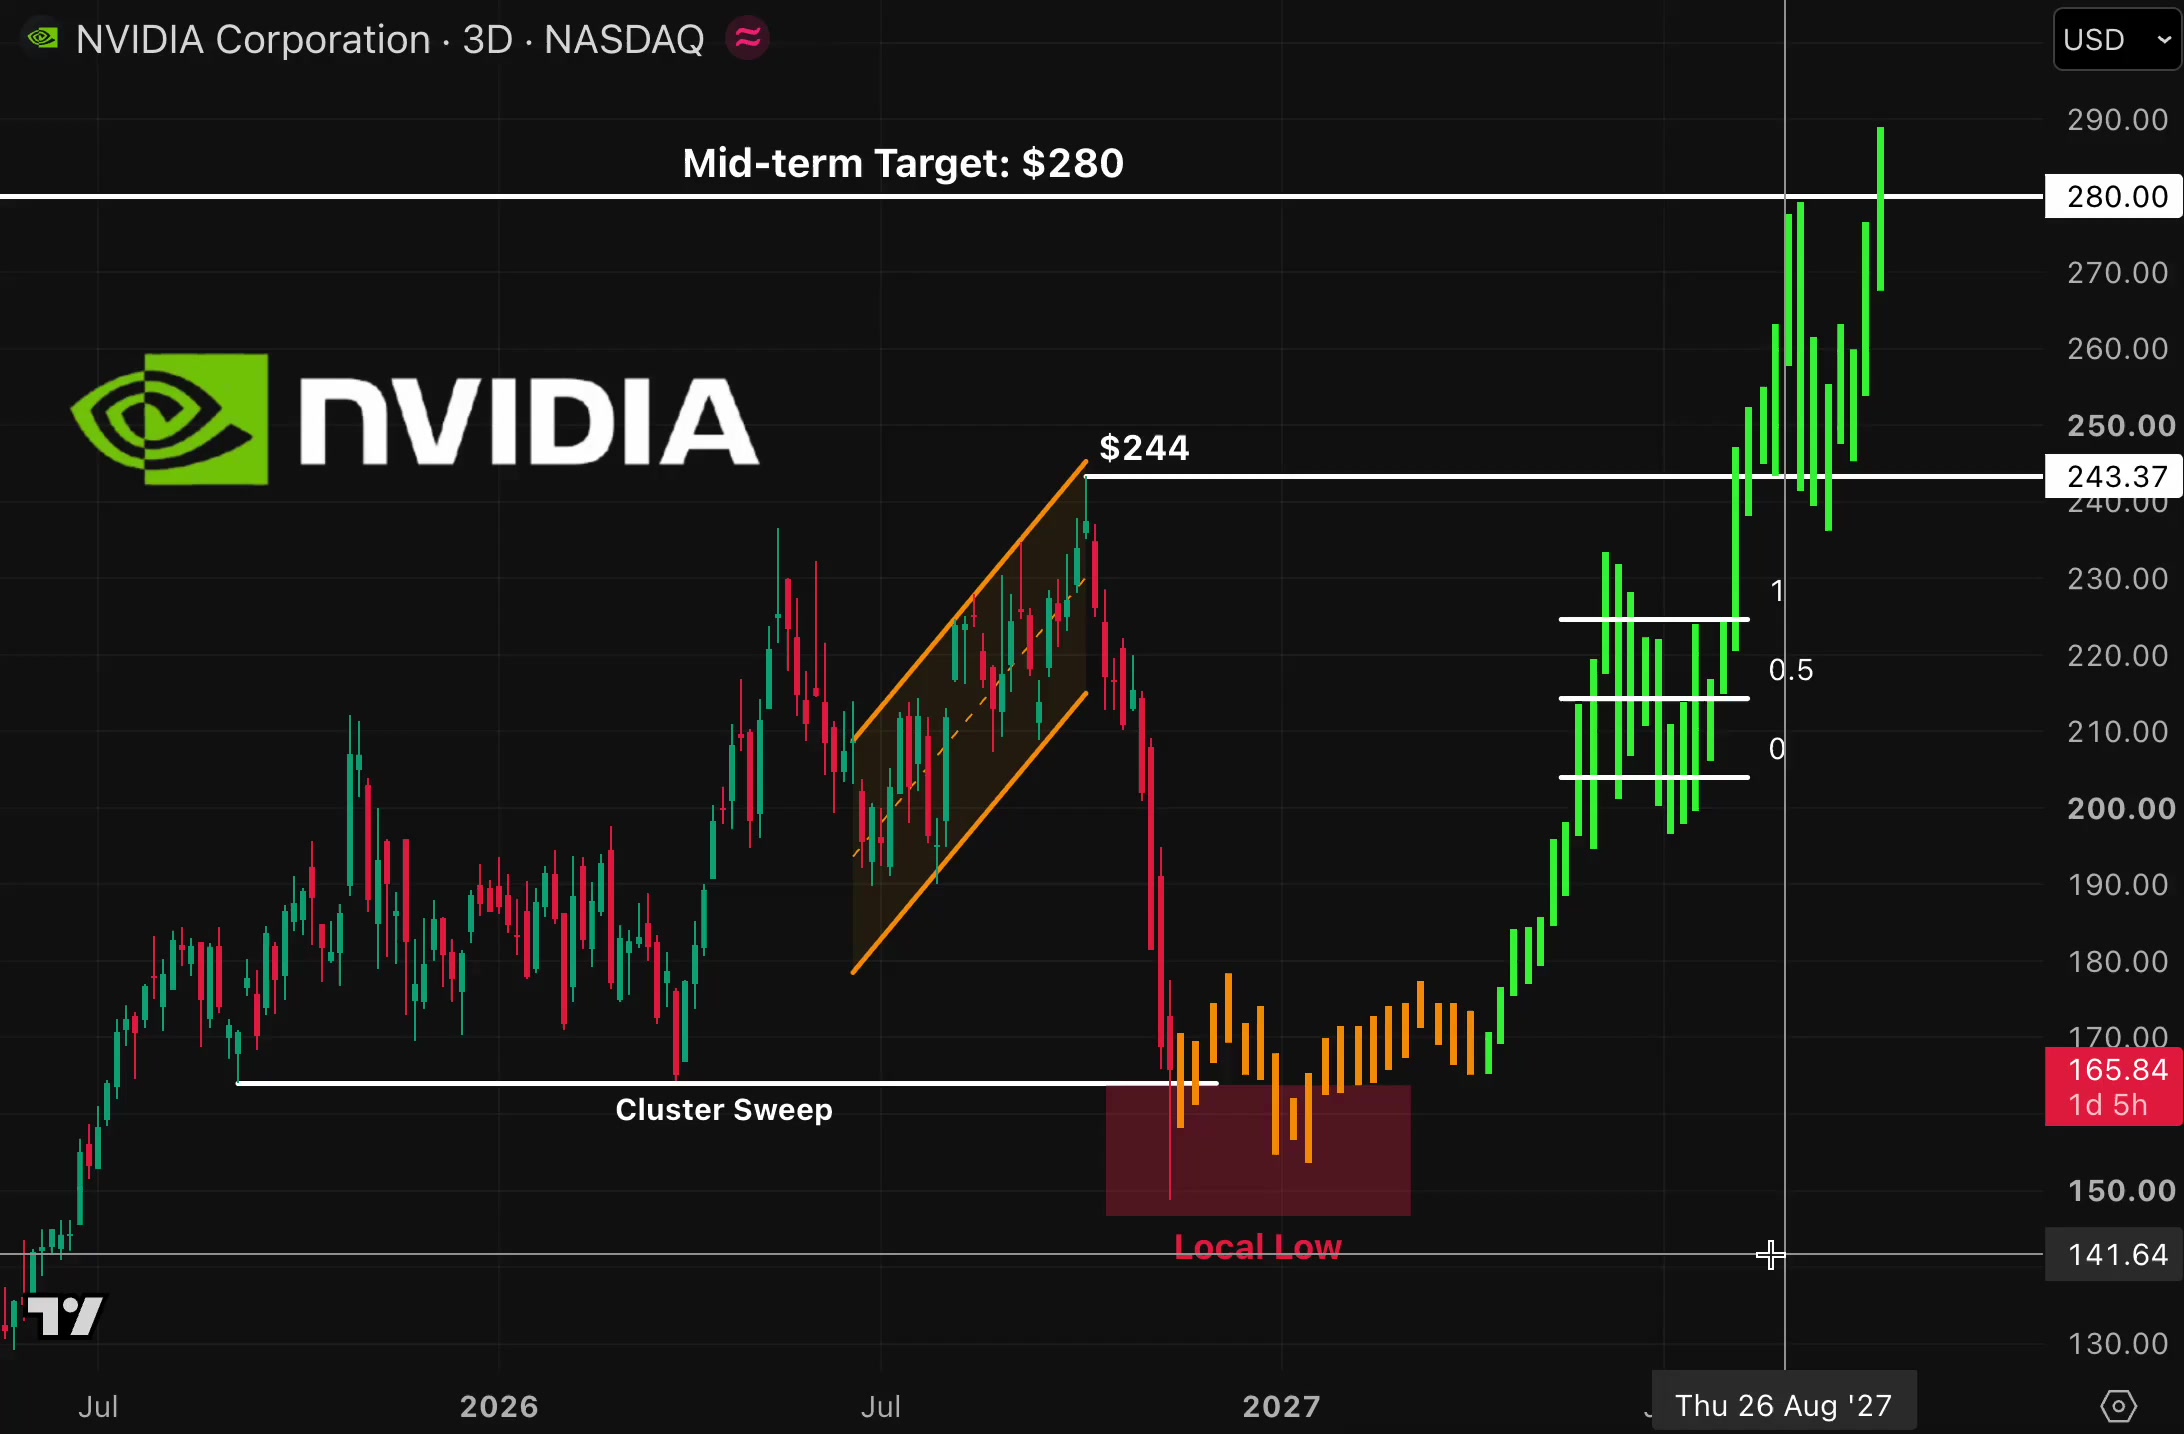
NVDA has gone from a hard slide to a quiet base, and a quiet base is the kind of chart where I'd rather buy a small dip than chase the high. The chart attached is only background on the bigger picture. The trade below stands on today's Bybit 1h and 15m charts alone. $NVDAXUSDT is at 161.55 (+1.12%), inside a 24h range of 156.15 to 161.74 That puts it 97% of the way up the range, 3.5% above the low and 0.1% under the high. Turnover is 54.23M. The levels I'm watching: Up: 161.74 (24h high) -> 163.99 (chart gridline, an area) -> 171.84 (1h chart high) Down: 160.89 (1h MA7) -> 160.80 (1h MA14) -> 160.70 (15m MA14) -> 160.35 (1h MA28) On the 1h, price is over MA7 (160.89), MA14 (160.80) and MA28 (160.35), by 0.4%, 0.5% and 0.7% The three have flattened and bunched after the slide from 171.84, so I read 160.35 to 160.90 as one support zone, and price is only now stepping away from it. On the 15m, price is over MA7 (160.85), MA14 (160.70) and MA28 (160.84), by 0.4%, 0.5% and 0.4% All three are tightly stacked and turning up, and the last candles are a clean run of green into the 24h high. I don't want to buy the top of that run, I want it to come back to the stack. I'm watching volume. The 15m bar is 2.79K against MA5 2.66K and MA10 2.38K with 06:42 left, so the push is above both averages but still forming. The 1h bar is 12.87K against 8.80K and 8.64K with 06:37 left, also above both. Participation is picking up on the way up, which is what I want from a base, but it is still small next to the flush earlier in the week. The trade, buying the dip into the stack: - Entry: 160.60 to 161.00 (limit, needs a 0.3% to 0.6% dip) - Stop: below 159.90 - Target 1: 162.30 (~1.7R from 160.80) - Target 2: 163.60 (~3.1R) Invalid if the 15m closes below 159.90, because that loses the 1h MA28 and the whole stack together. My thinking is to stay small, since this is a TradFi perp with thin liquidity and price is already at the 24h high. Limit orders, small size, and no dip, no trade. #IMPACTbyTrade
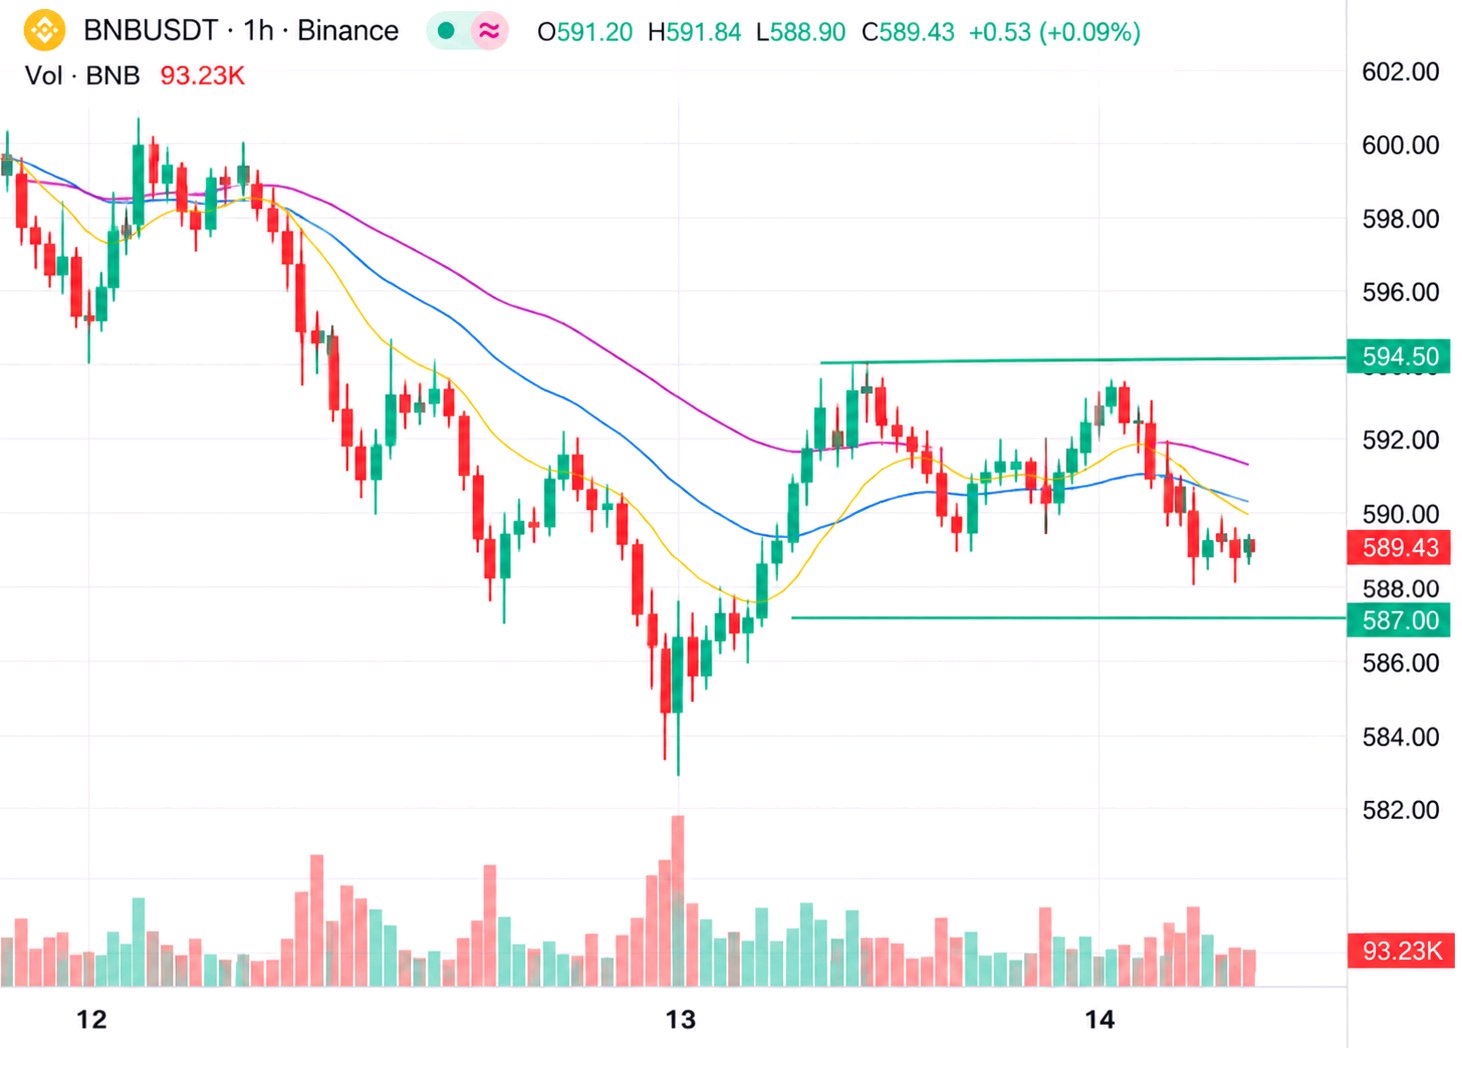
BNB ha borrado todas sus ganancias de la tarde en un par de velas y ahora se encuentra justo sobre la línea horaria que acaba de perder. Prefiero vender en el primer rebote hacia arriba que en la caída en sí. $BNBUSDT está en 589,43 (+0,09%), dentro de un rango de 24 horas de 565,52 a 599,47. Eso lo sitúa al 70% del rango, un 4,2% por encima del mínimo y un 1,7% por debajo del máximo. El volumen de negociación es de 57,15M. Lo que estoy marcando: Arriba: 592,55 (MA14 de 15m) -> 592,97 (MA14 de 1h) -> 593,76 (MA7 de 1h) -> 594,83 (MA28 de 15m) -> 599,47 (máximo de 24h) Abajo: 589,89 (MA28 de 1h) -> 585,70 (mínimo reciente, según mi interpretación) -> 582,49 (línea de cuadrícula del gráfico, una zona) En el gráfico de 1h, el precio está por debajo de la MA7 (593,76), la MA14 (592,97) y la MA28 (589,89), un 0,7%, 0,6% y 0,1% respectivamente. Las tres se han aplanado y agrupado tras la larga caída desde 658, y el precio acaba de deslizarse por debajo de todas ellas, por lo que interpreto de 592,5 a 594,8 como un solo techo, no como cuatro líneas. En el gráfico de 15m, el precio está nivelado con la MA7 (589,47) y por debajo de la MA14 (592,55) y la MA28 (594,83), un 0,5% y un 0,9% respectivamente. Ambas están inclinadas hacia abajo, y las últimas velas son pequeñas y rojas, sin un verdadero impulso al alza. Estoy vigilando el volumen. La barra de 15m es de 92.630 frente a la MA5 de 217.778 y la MA10 de 434.612 con 02:19 restantes, así que todavía se está formando y no la juzgaré. La barra de 1h es de 93.230 frente a 1,16K y 2,19K con 47:13 restantes, apenas abierta. Las barras más grandes aparecieron en el rebote de la mañana, y las últimas horas han sido muy tranquilas, por lo que estoy esperando la subida y no persiguiendo la caída. La operación, vendiendo en el retesteo de las medias de 1h: - Entrada: 592,50 a 594,50 (límite, necesita un rebote del 0,5% al 0,9%) - Stop: por encima de 596,50 - Objetivo 1: 587,00 (~2,2R desde 593,50) - Objetivo 2: 583,00 (~3,5R) Inválida si los 15m cierran por encima de 596,50. Eso recuperaría todo el grupo horario y la MA28 de 15m juntos, y me retiraría. Mi idea es mantener un tamaño pequeño, ya que el día está plano y el rango es estrecho. Órdenes límite, tamaño modesto, y si no hay subida, no hay operación. #IMPACTbyTrade

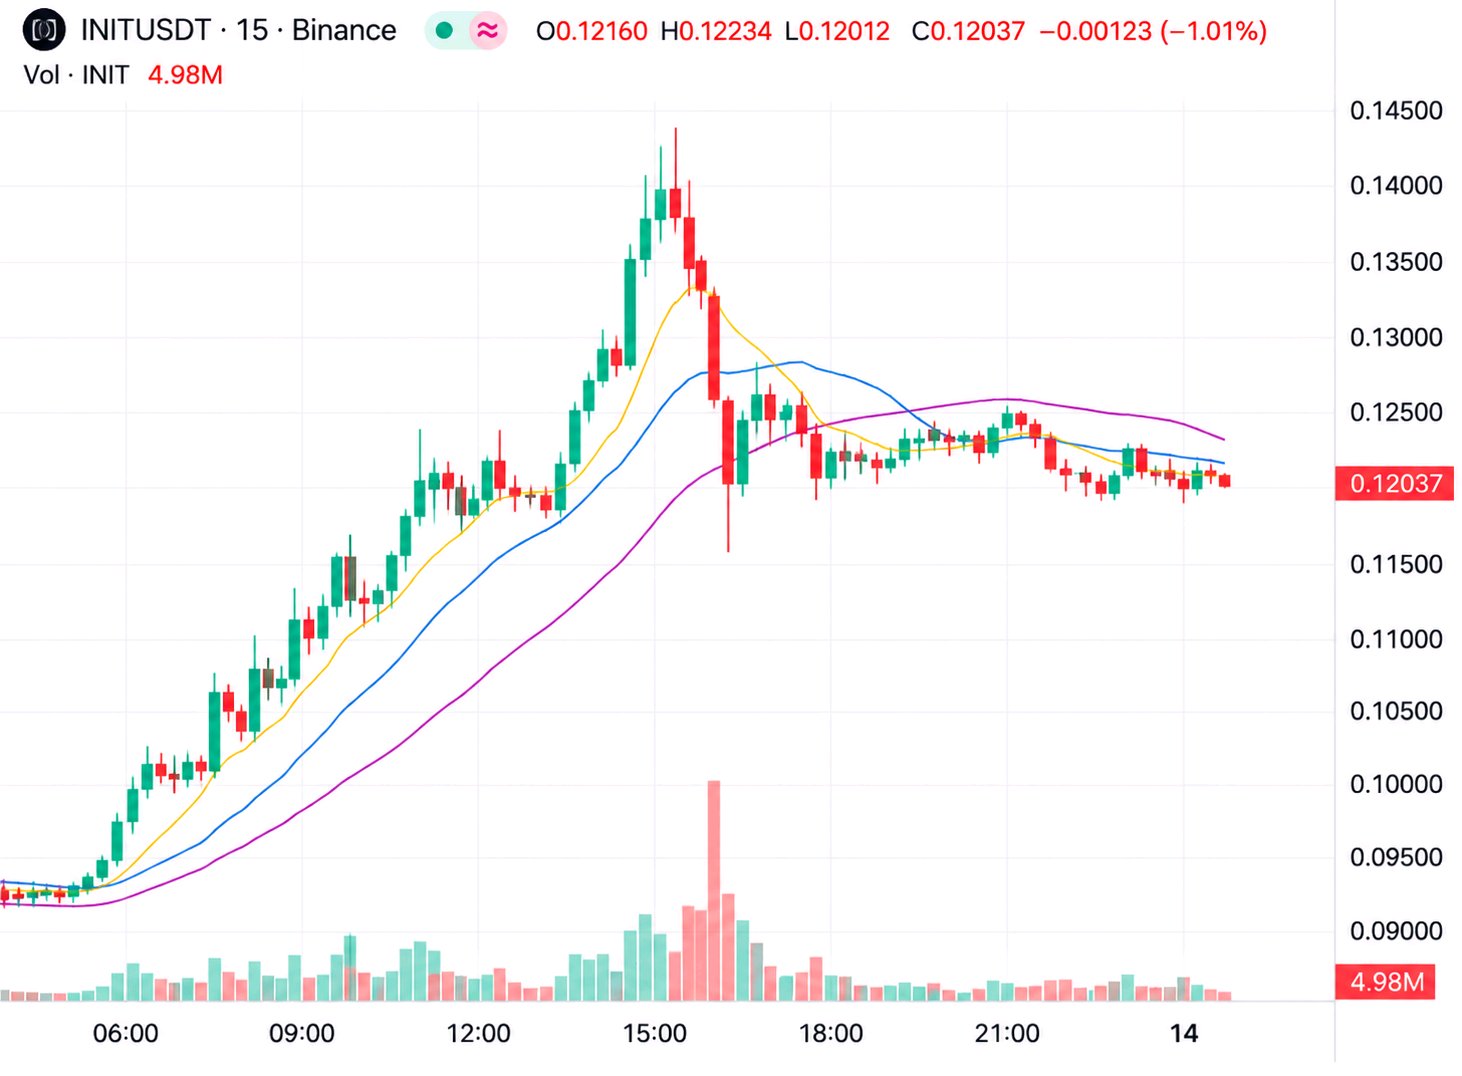
INIT sigue subiendo un 23% en el día, pero la barra de volumen más alta de toda la subida es la roja que salió desde arriba, y el precio ya ha caído por debajo de sus medias rápidas. No voy a comprar esa caída. Quiero ver si el rebote puede siquiera volver a alcanzarlas. $INITUSDT está a 0,12037 (+23,19%), dentro de un rango de 24h de 0,09279 a 0,14280. Eso lo sitúa al 55% de su rango, un 29,7% por encima del mínimo y un 15,7% por debajo del máximo. El volumen de negociación es de 57,63M. El mapa que estoy usando: Arriba: 0,12415 (MA7 de 15m) -> 0,12443 (MA28 de 15m) -> 0,12517 (MA7 de 1h) -> 0,1265 (parte superior del pequeño soporte después del desplome, una zona) -> 0,12928 (MA14 de 15m) -> 0,14280 (máximo de 24h) Abajo: 0,1178 (mínimo de la mecha tras la purga) -> 0,11353 (MA14 de 1h) -> 0,10626 (MA28 de 1h) -> 0,09279 (mínimo de 24h) En el gráfico de 1h, el precio está un 4,0% por debajo de la MA7 (0,12517) pero sigue por encima de la MA14 (0,11353) y la MA28 (0,10626), un 5,7% y un 11,7% respectivamente. Ambas siguen subiendo desde abajo por la racha, así que el marco temporal superior aún no se ha roto. Por eso solo quiero el retesteo, no perseguir la bajada. En el gráfico de 15m, la MA7 (0,12415), la MA28 (0,12443) y la MA14 (0,12928) están todas por encima del precio, un 3,1%, 3,4% y 7,4% respectivamente. Las líneas rápidas se han girado y las últimas velas son pequeñas y se amontonan unas sobre otras por debajo de 0,1242, lo que parece una pausa después de una pérdida, no compradores tomando el control. También vigilo el volumen. La barra de las 17:00 es la más alta del gráfico, alrededor de 24M según leo en el eje. La barra de 15m ahora es de 4,98M frente a la MA5 de 6,33M y la MA10 de 10,14M, con 02:36 restantes, así que casi está terminada. La barra de 1h es de 17,04M frente a 40,15M y 34,82M con 17:33 restantes, una hora tranquila. La purga fue fuerte y todo lo que ha ocurrido desde entonces ha sido mucho más flojo. La operación, vender el retesteo de las medias: - Entrada: 0,1242 a 0,1252 (límite, necesita un empuje del 3,1% al 4,0% y que se estanque ahí) - Stop: por encima de 0,1295 - Objetivo 1: 0,1150 (~2,0R desde 0,12466) - Objetivo 2: 0,1075 (~3,5R) Inválido si la vela de 15m cierra por encima de 0,1295. Eso pondría el precio por encima de la MA14 de 15m y el máximo del soporte juntos, y me retiraría. El stop está a un 3,9% de la mitad de la zona y esta moneda acaba de moverse un 23% en un día, así que mantengo la posición pequeña. Solo órdenes límite, y si no vuelve a subir, lo dejo pasar. #IMPACTbyTrade

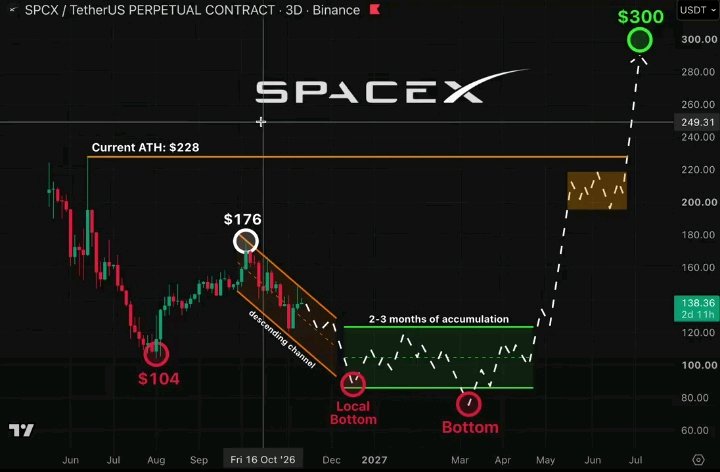
SPCX ha subido casi un 4% desde el mínimo de la noche a la mañana y ahora se sitúa justo por debajo del máximo, y no me lo creo. Si entro, será en un retroceso hacia las medias en las que se ha estado apoyando. $SPCXXUSDT está en 138,56 (+1,88%), dentro de un rango de 24h de 133,53 a 138,62. Eso lo sitúa al 99% del recorrido de su rango, un 3,8% por encima del mínimo y un 0,04% por debajo del máximo, con un volumen de 17,54M. No es una profundidad significativa para un movimiento de este tamaño, así que estoy siendo cauteloso. El mapa que estoy usando: Alcista: 138,62 (máximo de 24h) -> 139,80 (una zona donde se estancó antes de la caída, no es un nivel limpio) -> 143,15 (máximo del gráfico de 1h) Bajista: 138,35 (MA7 de 15m) -> 138,12 (MA14 de 15m) -> 137,84 (MA7 de 1h) -> 137,72 (MA28 de 15m) -> 137,00 (MA14 de 1h) -> 133,53 (mínimo de 24h) En la temporalidad de 1h, el precio está por encima de la MA7 (137,84), MA14 (137,00) y MA28 (136,16), un 0,5%, 1,1% y 1,7% respectivamente. Las tres están subiendo y la brecha entre ellas sigue ensanchándose, por lo que este rebote tiene una estructura sólida detrás. También ha recuperado alrededor de la mitad (52%) del swing desde 143,15 hasta 133,53, lo cual es un punto natural para una pausa. En la temporalidad de 15m, el precio está por encima de la MA7 (138,35), MA14 (138,12) y MA28 (137,72), un 0,2%, 0,3% y 0,6% respectivamente. El conjunto de medias va subiendo en orden y las velas están siguiendo la línea rápida. Es una tendencia saludable, pero también significa que aquí nada está barato en este momento. El volumen es la parte de la que estoy menos seguro. La barra de 15m está en 553,87 frente a la MA5 de 588,72 y la MA10 de 888,39 con 07:57 restantes, así que todavía se está formando y no voy a juzgarla. La barra de 1h está en 1,66K frente a 4,06K y 3,91K con 37:53 restantes, al principio de la vela. Las barras más pesadas se dieron en el camino hacia abajo y en el primer rebote desde el mínimo, y la subida posterior ha sido silenciosa en comparación. El precio está subiendo sin mucho apoyo, así que quiero un retroceso, no una ruptura. La operativa, comprando un retroceso hacia el conjunto de medias: - Entrada: 137,72 a 138,12 (límite, necesita un retroceso del 0,3% al 0,6% primero) - Stop: por debajo de 137,40 - Objetivo 1: 138,55 (~1,2R desde 137,92) - Objetivo 2: 139,80 (~3,6R) La tesis queda invalidada si la vela de 15m cierra por debajo de 137,40. Eso situaría al precio por debajo de la MA28 de 15m y del último mínimo creciente (alrededor de 137,5) a la vez, y me retiraría. Esto es un perpetuo de TradFi, por lo que la liquidez puede ser menor que en los principales criptoactivos y las ejecuciones pueden sufrir deslizamiento. Mantendré el tamaño de la posición pequeño y usaré solo órdenes limitadas. Si nunca retrocede, no perseguiré el máximo. #IMPACTbyTrade

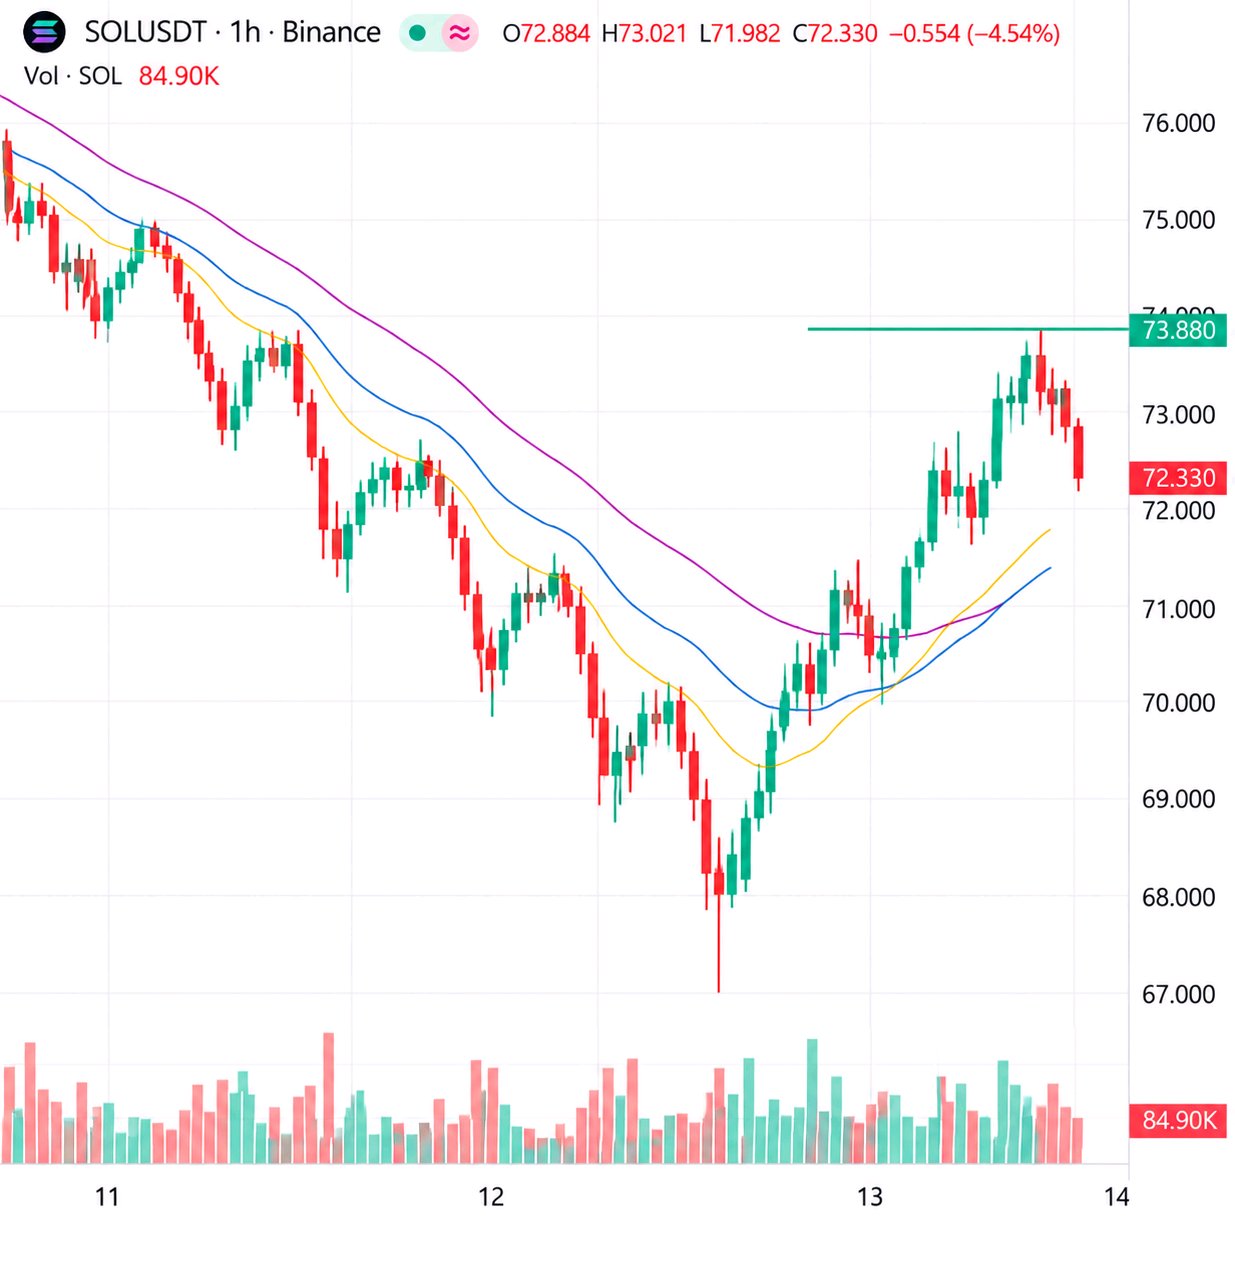
SOL has climbed 7% off the low and walked right up to the one hourly line that has turned it back all week. Before I trust the bounce, I want to see what happens when it touches. $SOLUSDT is at 72.330 (-4.54%), inside a 24h range of 67.320 to 76.020. That puts it 58% of the way up the range, 7.4% above the low and 4.9% under the high. Turnover is 930.11M. The map I'm using: Up: 72.540 (15m chart high) -> 73.880 (chart gridline, an area) -> 76.020 (24h high) Down: 72.034 (15m MA7) -> 71.615 (15m MA14) -> 71.083 (15m MA28) -> 67.320 (24h low) On the 1h, price is over MA7 (71.177) and MA14 (70.583), by 1.6% and 2.5%, but only 0.3% over MA28 (72.132), and that line is still sloping down from the 82 area. Price is sitting on a falling average that has not been tested yet, so I read 72.1 to 72.7 as the first real wall. On the 15m, price is over MA7 (72.034), MA14 (71.615) and MA28 (71.083), by 0.4%, 1.0% and 1.8% The stack is rising, but the last candles are small and overlapping right under 72.540, which looks like hesitation, not momentum. I'm watching volume. The 15m bar is 52.82K against MA5 40.79K and MA10 86.20K with 04:07 left, still forming, so I won't judge it. The 1h bar is 84.90K against 299.35K and 345.31K with 34:03 left, early in the candle. The tall bars on this chart are the red ones on the drop, and the recovery has been far lighter than that. The trade, selling the rejection at the 1h MA28: - Entry: 72.45 to 72.70 (limit, needs a 0.2% to 0.5% lift) - Stop: above 73.00 - Target 1: 71.65 (~2.2R from 72.575) - Target 2: 71.10 (~3.5R) Invalid if the 15m closes above 73.00. That would put price over the 1h MA28 and the 72.54 high together, and I'd step aside. My thinking is to keep it small, since the bounce is real and could still extend. Limit orders, modest size, and no lift, no trade. #IMPACTbyTrade

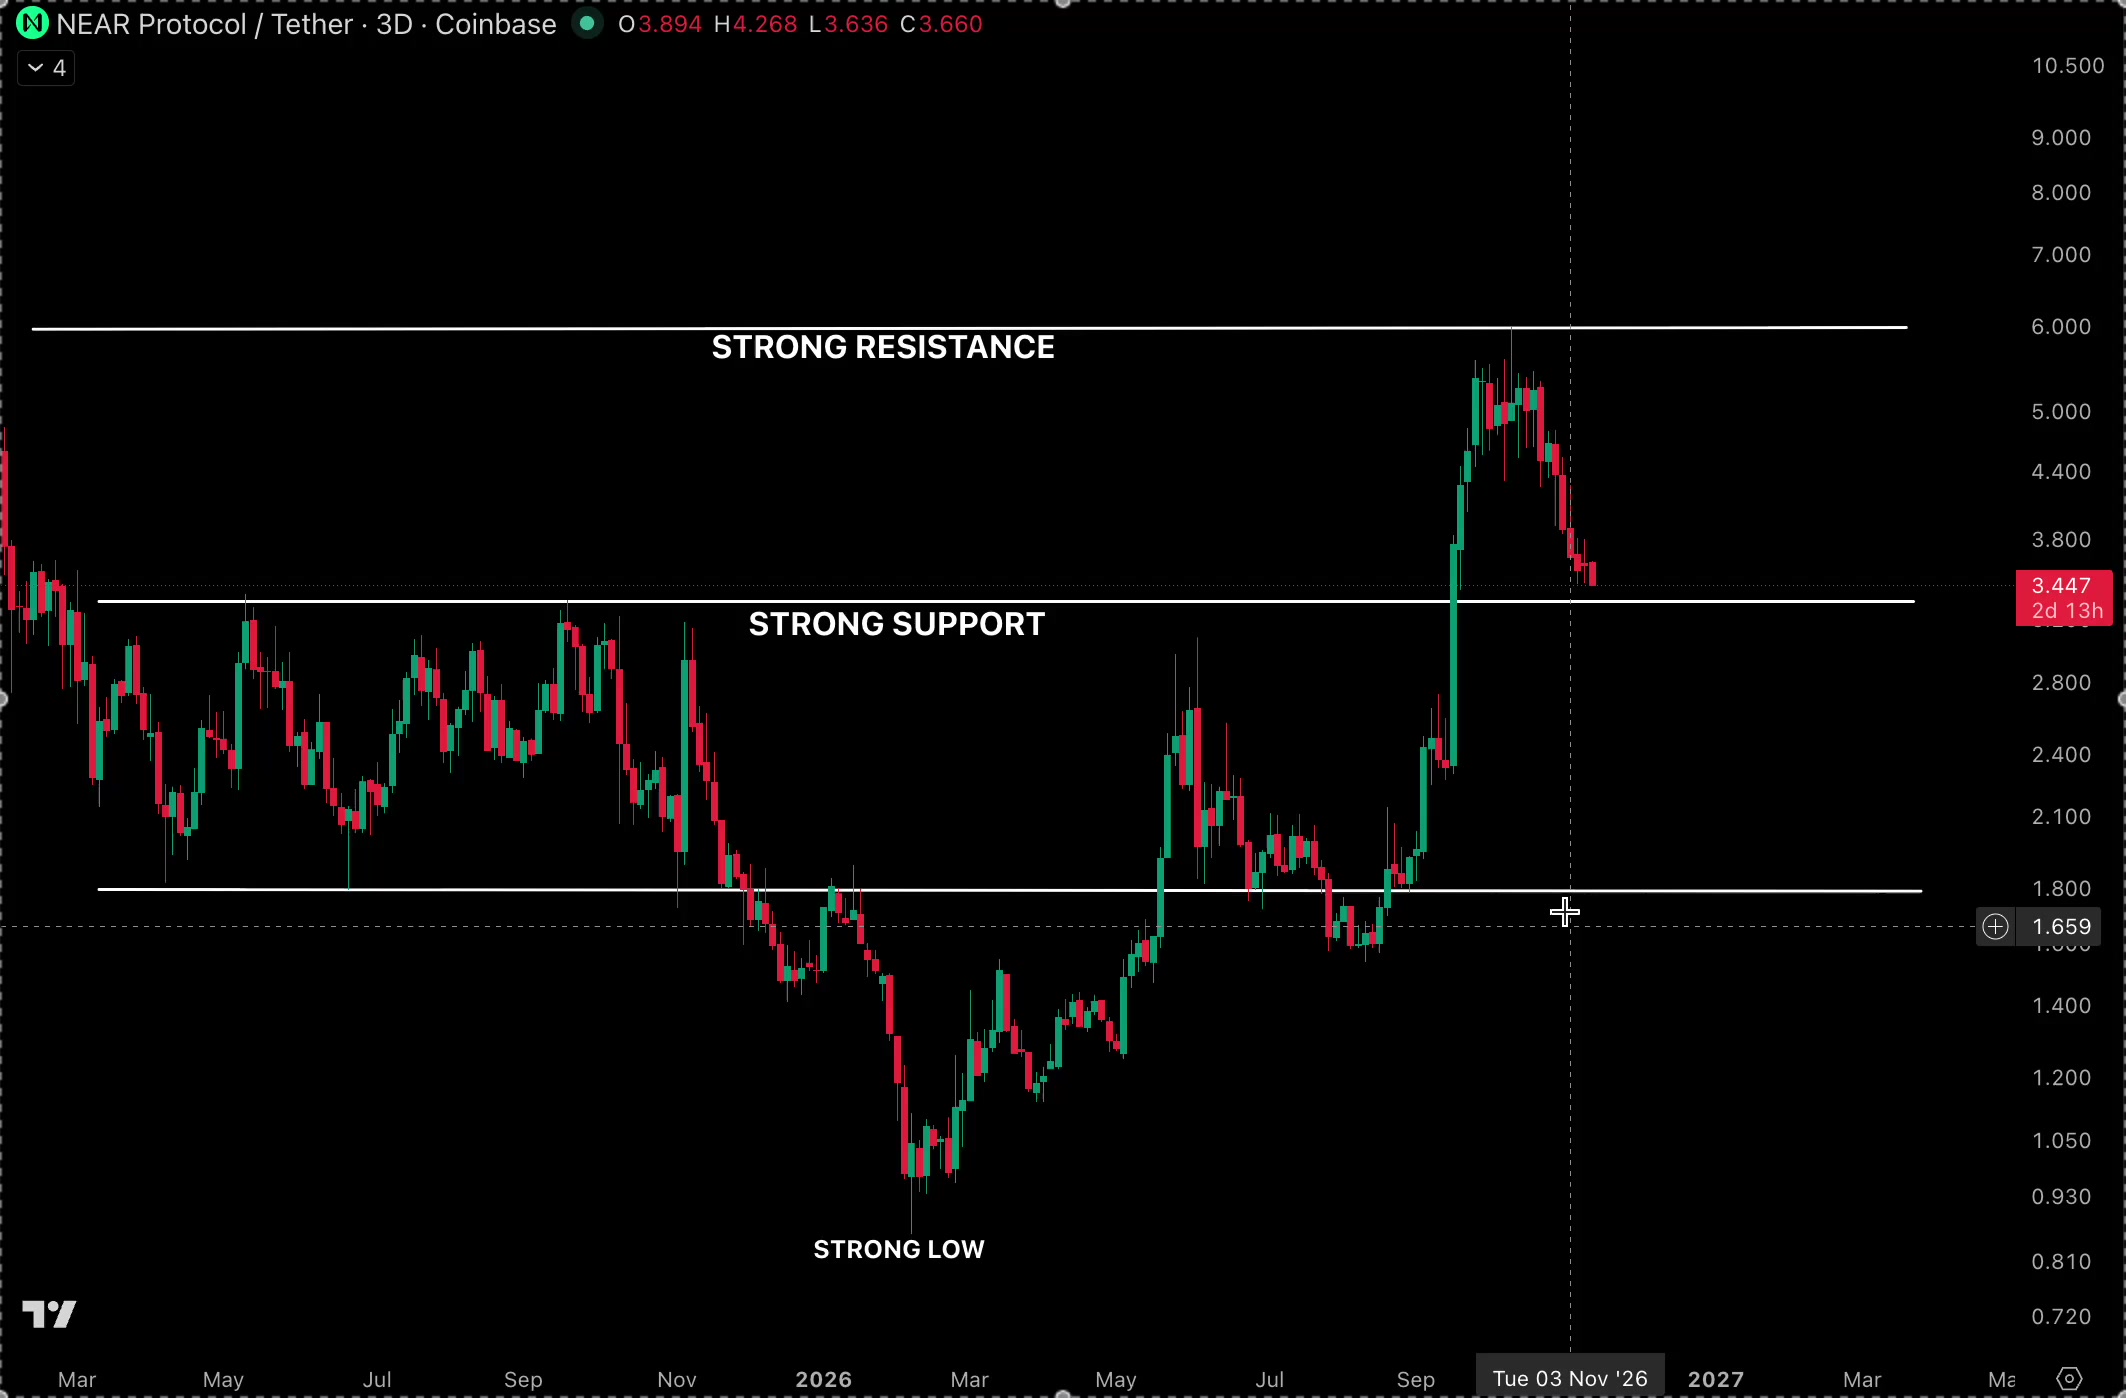
I'm done trying to catch NEAR on the way down. What I like now is that it finally closed above the line that kept pushing it back $NEARUSDT is at 3.1740 (-4.51%), inside a 24h range of 2.8670 to 3.3510. That puts it 63% of the way up the range, 10.7% above the low and 5.3% under the high. Turnover is 218.58M What I'm marking: Up: 3.1970 (15m chart high) -> 3.2394 (chart gridline, an area) -> 3.3510 (24h high) Down: 3.1687 (15m MA7) -> 3.1510 (1h MA28) -> 3.1435 (15m MA14) -> 3.1362 (1h MA7) On the 1h, price is over MA7 (3.1362), MA14 (3.0801) and MA28 (3.1510), by 1.2%, 3.0% and 0.7% MA28 was the line capping every bounce, and price has now closed above it, so I want to see that line act as a floor. On the 15m, price is over MA7 (3.1687), MA14 (3.1435) and MA28 (3.1366), by 0.2%, 1.0% and 1.2% The three are stacked in order and rising, and the candles since noon have been small and overlapping, which reads as a pause, not a fade. I'm watching volume. The 15m bar is 281.99K against MA5 594.75K and MA10 692.69K with 07:05 left, still forming. The 1h bar is 902.84K against 2.15M and 2.25M with 37:01 left, also unfinished. Participation is light on this pause, so I'm keeping the plan patient. The trade, buying the dip into the 1h MA28: - Entry: 3.1400 to 3.1650 (limit, needs a 0.3% to 1.1% dip) - Stop: below 3.1100 - Target 1: 3.2250 (~1.7R from 3.1525) - Target 2: 3.2700 (~2.8R) Invalid if the 15m closes below 3.1100, because that loses the 1h MA28 and the 15m stack together. My thinking is to stay small, since the day is still down 4.5%. Limit orders, modest size, and no dip, no trade. #IMPACTbyTrade
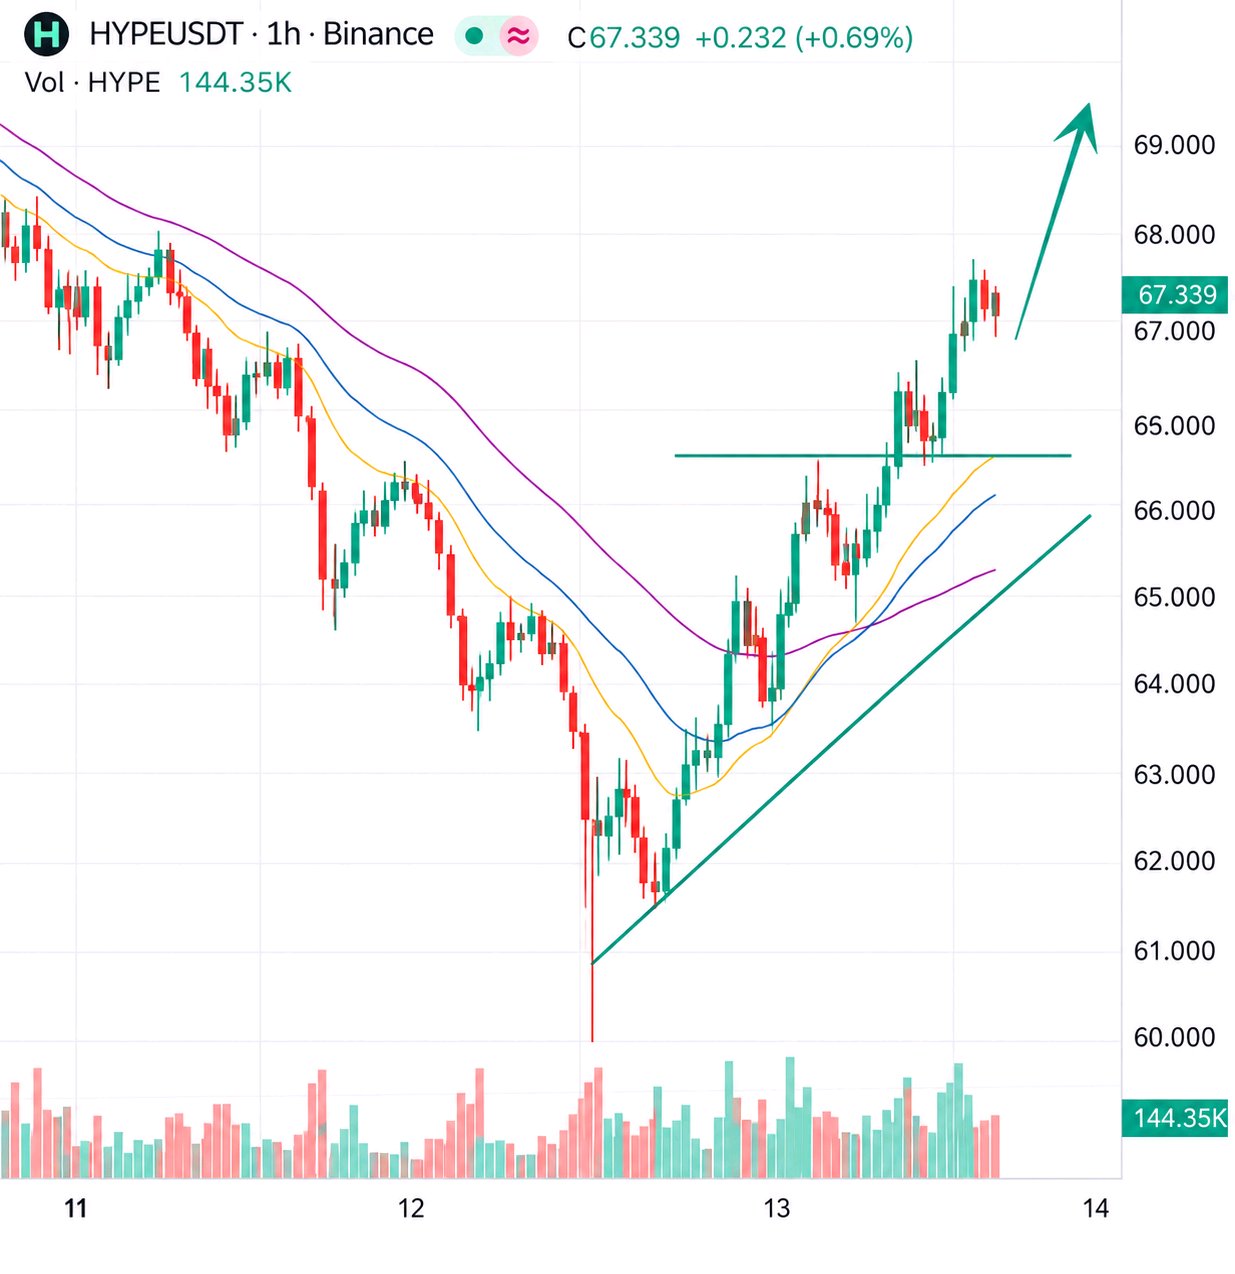
HYPE no solo ha rebotado, ha vuelto a subir por encima de la media horaria que lo estaba limitando, y lo que haga el precio con esa línea a continuación es toda la operación para mí. $HYPEUSDT está en 67,339 (-2,07%), dentro de un rango de 24 horas de 60,017 a 69,678. Eso lo sitúa en el 76% del rango, un 12,2% por encima del mínimo y un 3,4% por debajo del máximo. El volumen de negociación es de 462,22 M. Donde pongo el ojo: Al alza: 67,593 (máximo gráfico de 15 m) -> 69,678 (máximo de 24 h) A la baja: 66,250 (MA28 de 1 h) -> 65,879 (MA7 de 15 m) -> 65,590 (MA14 de 15 m) -> 60,017 (mínimo de 24 h) En la temporalidad de 1 h, el precio está por encima de la MA7 (65,883), MA14 (64,698) y MA28 (66,250), un 2,2%, 3,9% y 1,6% respectivamente. El precio acaba de cerrar de nuevo por encima de la MA28 tras una larga caída, así que interpreto que 66,25 es la línea que debe mantenerse como soporte, y el par rápido que se sitúa debajo añade un colchón. En la temporalidad de 15 m, el precio está por encima de la MA7 (65,879), MA14 (65,590) y MA28 (65,814) un 2,2%, 2,6% y 2,3% respectivamente. Las tres han girado al alza y están estrechamente apiladas, y la última vela es una larga verde que se ha alejado directamente de ellas. No quiero comprar después de una vela así, quiero que vuelva atrás. Estoy vigilando el volumen. La barra de 15 m es de 20,92 K frente a la MA5 de 54,31 K y la MA10 de 36,79 K con 07:39 restantes, todavía formándose. La barra de 1 h es de 144,35 K frente a la MA5 de 107,01 K y la MA10 de 191,47 K con 37:37 restantes, ya por encima de la MA5 antes de que la vela esté completada a la mitad. Ese es el tipo de participación que quiero ver tras una recuperación. La operación, comprar el retest de la MA28 de 1 h: - Entrada: 66,10 a 66,55 (límite, necesita una caída del 1,2% al 1,8%) - Stop: por debajo de 65,55 - Objetivo 1: 67,55 (~1,6R desde 66,33) - Objetivo 2: 68,40 (~2,7R) Inválido si la vela de 15 m cierra por debajo de 65,55. Eso volvería a situar el precio por debajo de la MA28 de 1 h y del conjunto de 15 m, y lo dejaría estar. Mi plan es mantener una posición pequeña, ya que el rebote ya es del 12% desde el mínimo. Órdenes límite, tamaño pequeño, y si no hay caída, no hay operación. #IMPACTbyTrade

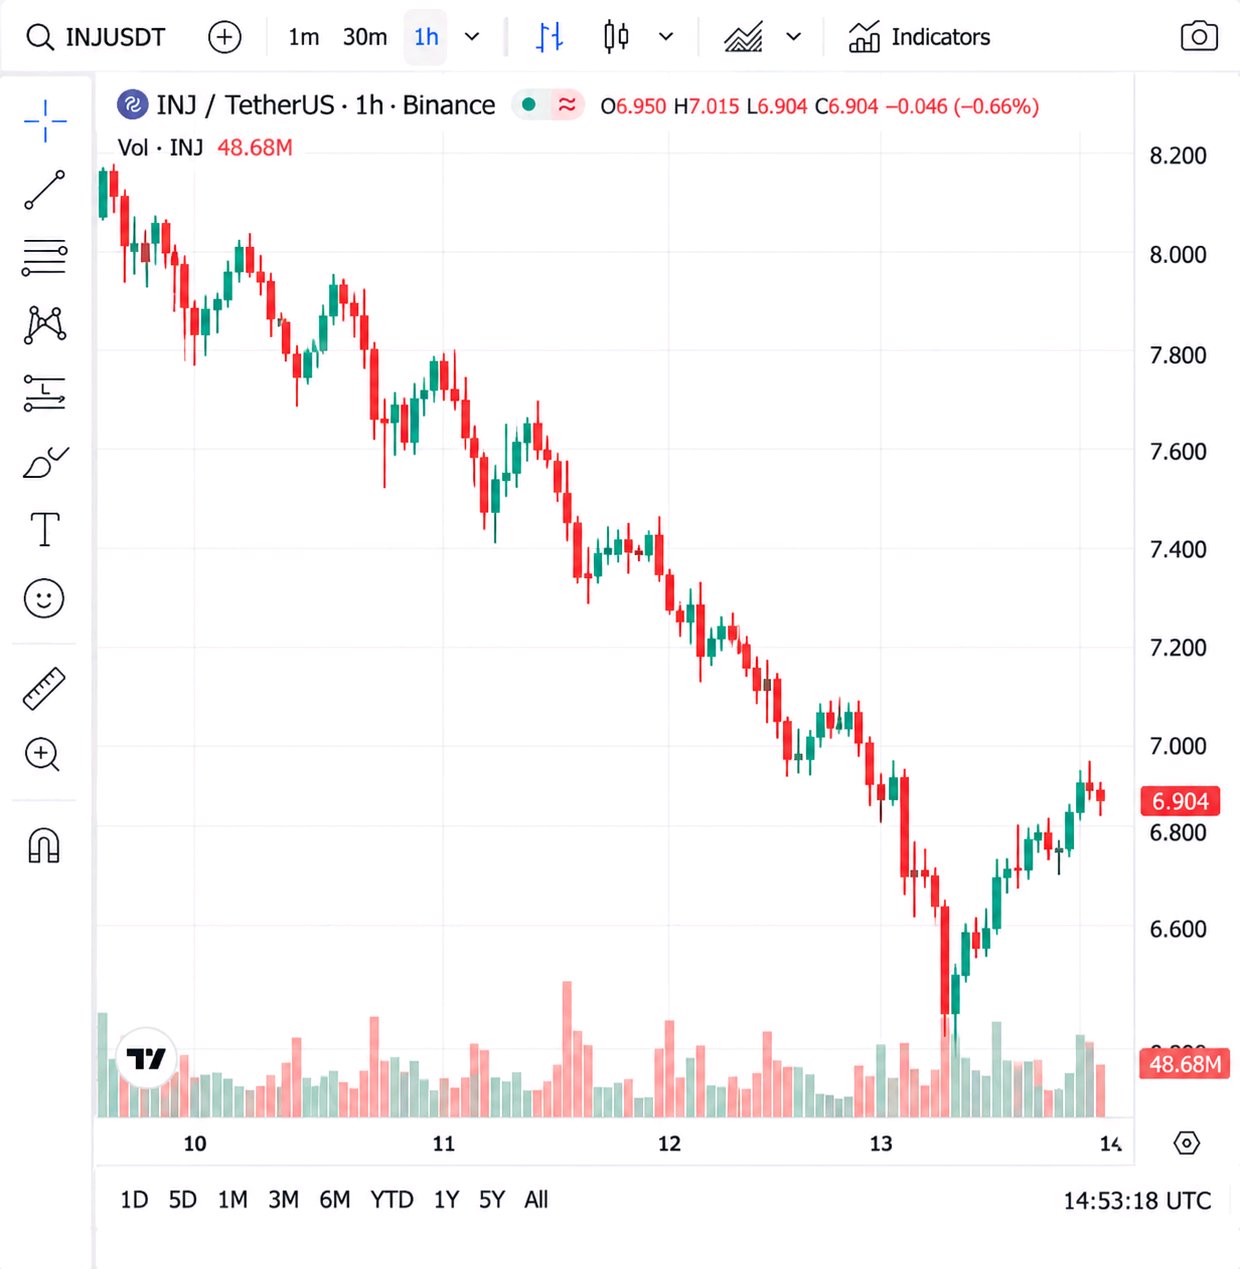
INJ's bounce only got back about 38% of the 24h range before it started losing its averages, and I don't trust it. $INJUSDT is -13.76% at 6.9040, 5.3% above the 6.5540 low, with the 8.0540 high 16.7% overhead. That puts it about 23% of the way up the 24h range, on 48.68M of turnover. The low printed around 6:45 AM, the bounce topped near 7.12 around 10:15, and since then it has been sliding out of a 6.95 to 7.10 shelf until it now sits under all three 15m averages. Volume says the bounce was thin. The 15m candle shows 15.33K against 19.24K (MA5) and 25.22K (MA10), about 0.8x and 0.6x, with the bar nearly closed. The 1h bar shows 15.36K against 107.30K and 173.81K, but that hour only just opened, so I'm not reading anything into that one. The heavy volume came on the way down, and the bounce never got close to it. The averages: 1h MA14 6.9041 (0.0%, price is sitting right on it) 15m MA28 6.9370 (+0.5%) 1h MA7 6.9551 (+0.7%) 15m MA7 6.9767 (+1.1%) 15m MA14 7.0040 (+1.5%) 1h MA28 7.3284 (+6.1%) Four of those six land inside 6.937 to 7.004, a 1% band, and that band is the zone I care about. Up: 6.937 / 6.955 / 6.977 / 7.004 -> 7.12 (bounce high) -> 7.328 (1h MA28) -> 8.054 (24h high) Down: 6.904 (1h MA14, where it sits now) -> 6.554 (24h low) What I'd do is sell a retest, nothing else: Entry 6.937 to 7.004, after price climbs back into it and stalls. That takes a 0.5% to 1.5% bounce first. Stop above 7.13, over the 7.12 bounce high. Target 1: 6.60, just above the 6.554 low (about 2.3R) Target 2: 6.45 if the low gives way (about 3.3R). No level is visible under 6.554, so that one is a measured move. If the 1h candle closes under 6.9041 and keeps sliding without ever retesting, I'm not chasing it. If a 15m candle closes above 7.13, the bounce was real and I step aside. R is counted from the middle of the zone (6.9705) with a stop about 2.3% away. That is a wide stop, so I'd size smaller than usual. A -13% day makes everybody a dip buyer. I'd rather wait and see who is still holding at 7.00 #IMPACTbyTrade

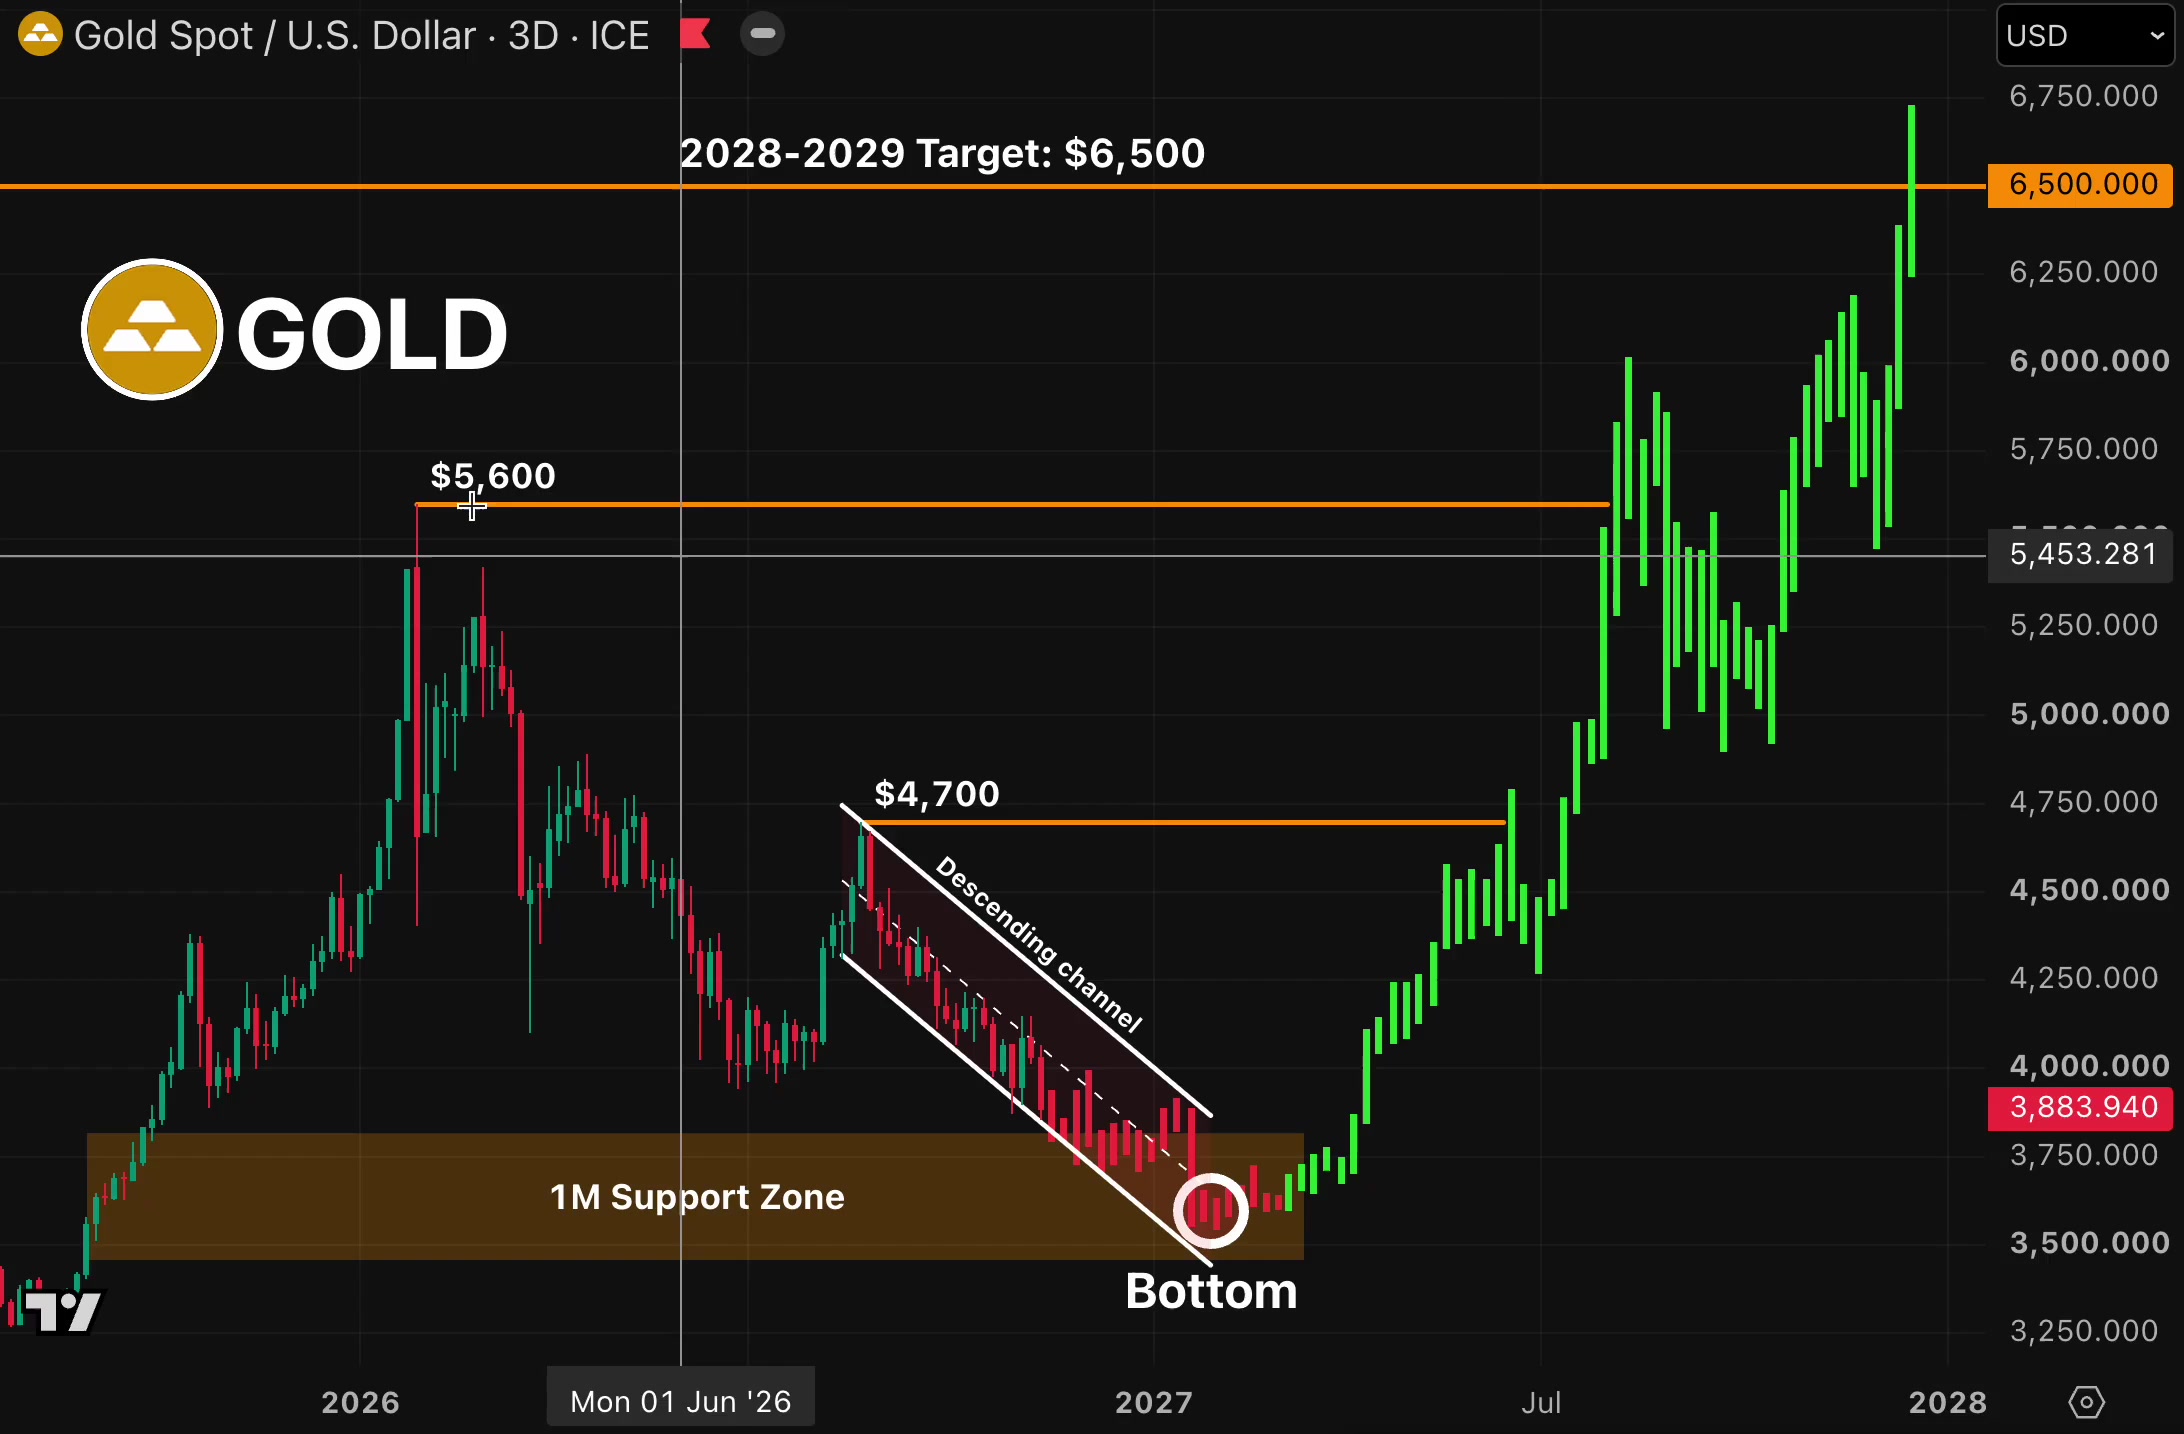
El oro se sitúa por encima de todas las medias que veo, y cuando el precio no tiene una tendencia clara, prefiero elegir un punto de entrada antes que adivinar una dirección. $XAUTUSDT está en 3.835,26 (-1,27%), dentro de un rango de 24 horas de 3.777,66 a 3.888,21. Eso lo sitúa al 52% del rango, un 1,5% por encima del mínimo y un 1,4% por debajo del máximo. El volumen de negociación es de 139,29 M. Lo que estoy marcando: Al alza: 3.853,10 (MA28 de 1h) -> 3.857,55 (línea de cuadrícula del gráfico, una zona) -> 3.881,30 (máximo del gráfico de 15m) A la baja: 3.829,59 (MA14 de 1h) -> 3.800 (mi estimación) -> 3.777,66 (mínimo de 24h) En el gráfico de 1h, el precio está al nivel de la MA7 (3.835,61), un 0,1% por encima de la MA14 (3.829,59) y un 0,5% por debajo de la MA28 (3.853,10). La MA28 es la que sigue descendiendo desde la zona de 3.957, por lo que la primera prueba por encima del precio es una línea descendente. En el de 15m, la MA7 (3.834,07), la MA14 (3.837,19) y la MA28 (3.833,70) están todas dentro del 0,1% del precio. No hay tendencia, así que no operaré en medio, prefiero esperar al impulso hacia la línea horaria. Estoy vigilando el volumen. La vela de 15m es de 35,812 frente a la MA5 de 78,281 y la MA10 de 99,338 con 06:34 restantes, y la vela de 1h es de 35,812 frente a 492,822 y 1,17K con 51:30 restantes, así que ambas velas están empezando y no las juzgaré aún. Las velas más altas en ambos paneles son las rojas del desplome a 3.777,66, y la recuperación desde entonces ha sido tranquila. La operación, vender en la repesca de la MA28 de 1h: - Entrada: 3.848 a 3.858 (límite, necesita un impulso del 0,3% al 0,6%) - Stop: por encima de 3.870 - Objetivo 1: 3.826 (~1,6R desde 3.853) - Objetivo 2: 3.800 (~3,1R) Anulada si el gráfico de 15m cierra por encima de 3.870. Mi razonamiento es que un cierre por encima de la MA28 de 1h significaría que el desplome está siendo absorbido, y me mantendría al margen. Órdenes límite, tamaño pequeño porque el oro puede tener gaps, y si no hay impulso, no hay operación. #IMPACTbyTrade
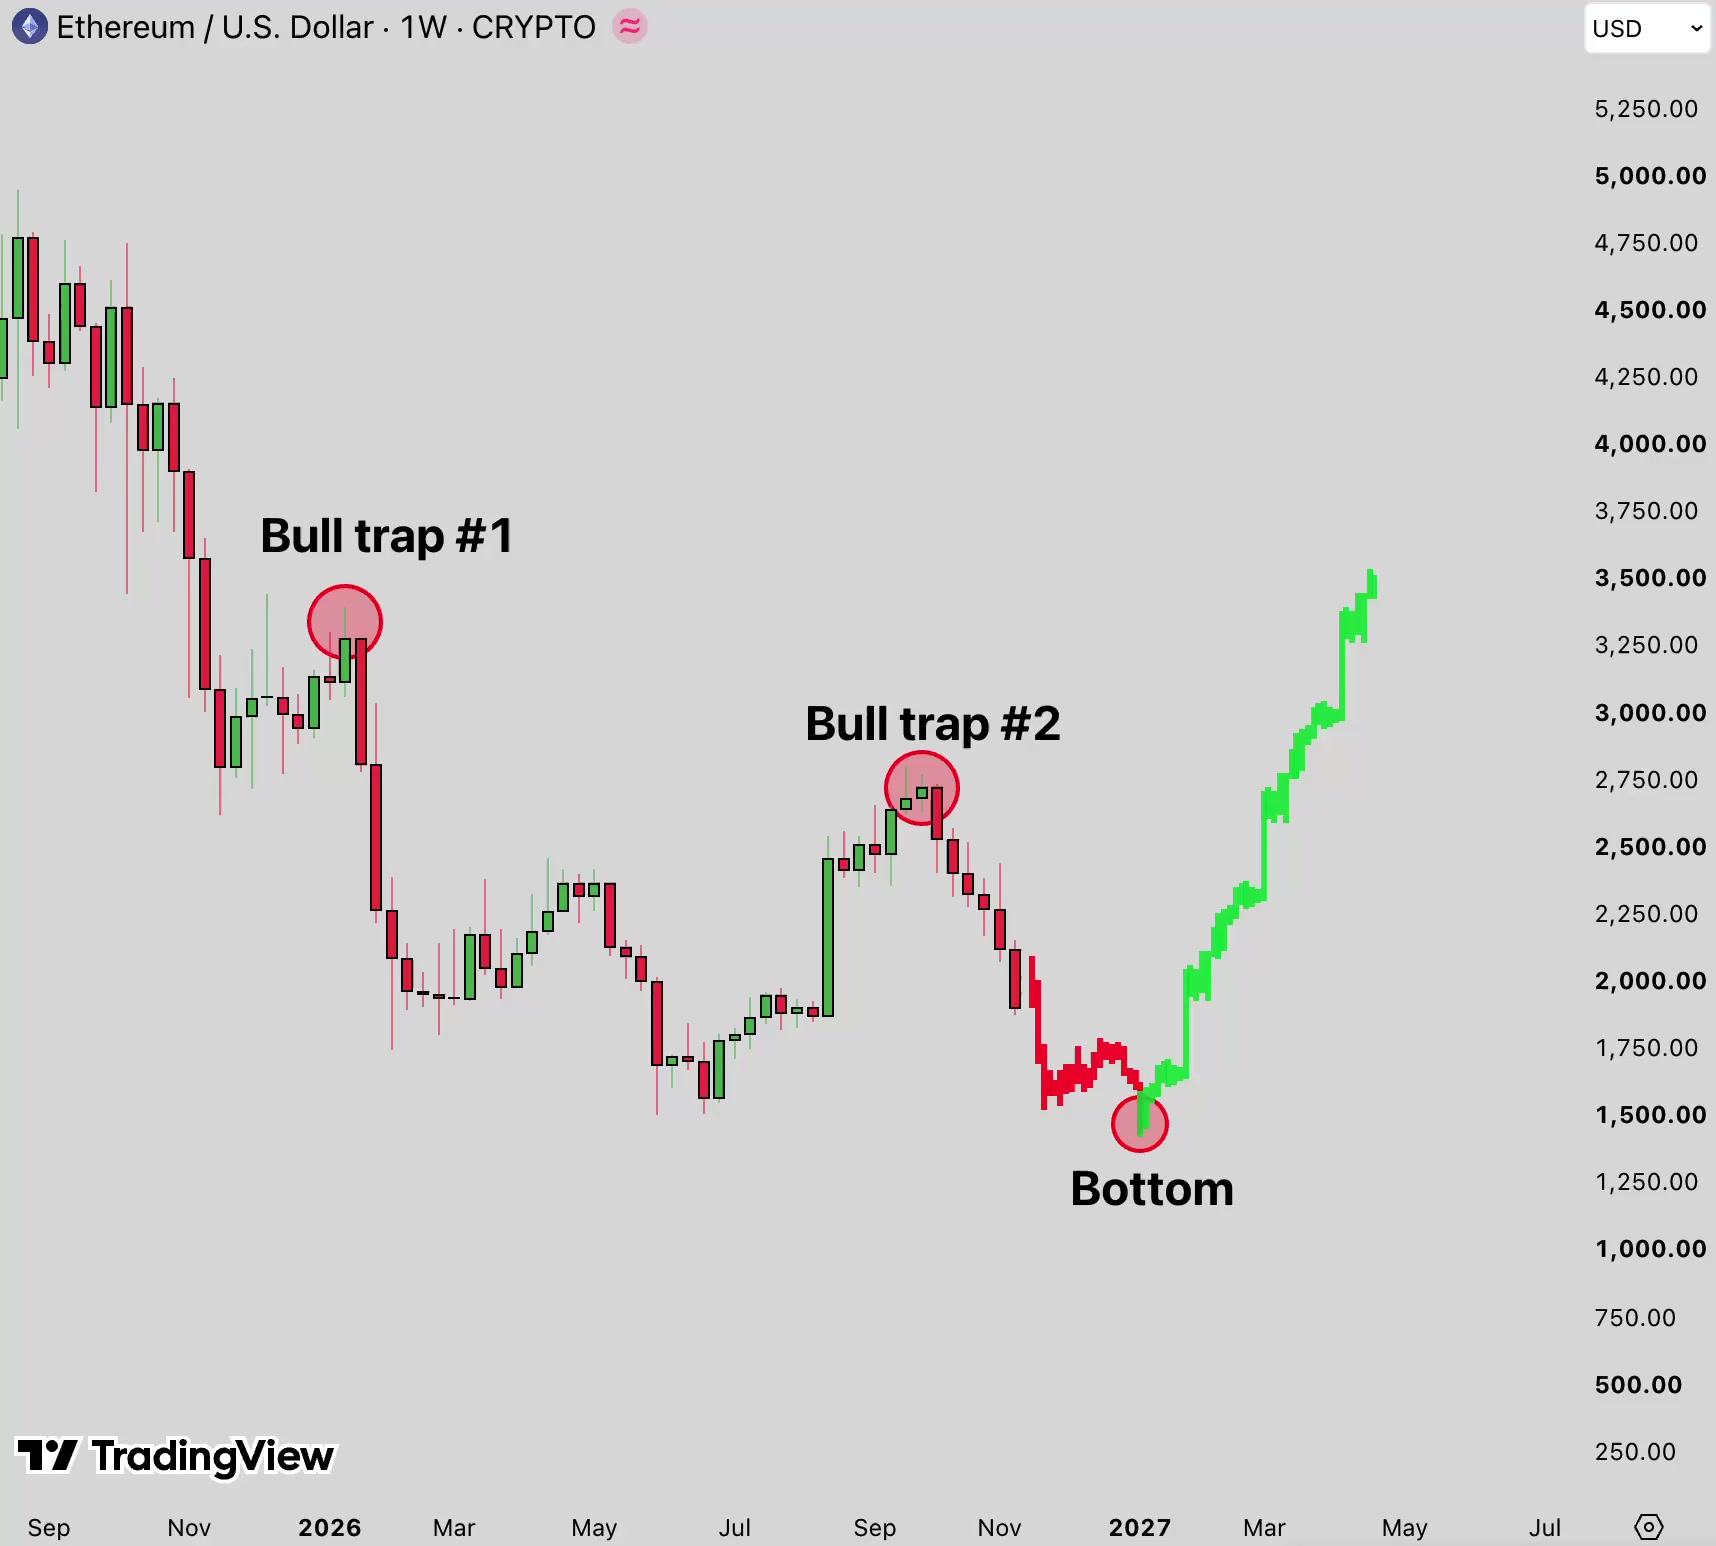
Everyone has a bottom call for ETH right now. I don't need one, I just need a dip I can define, and the hourly chart is giving me one. The video attached shows the bigger picture of ETH's bull traps and where the last flush ended. That's the backdrop. The trade below is built only on today's hourly and 15m charts. $ETHUSDT is at 1,808.04 (-4.72%), inside a 24h range of 1,709.06 to 1,919.14. That puts it 47% of the way up the range, 5.8% above the low and 5.8% under the high. Turnover is 4.08B. The levels I'm watching: Up: 1,816.60 (15m MA7) -> 1,832 (bounce high, my read) -> 1,843.98 (1h MA28) Down: 1,794.39 (1h MA14) -> 1,784.34 (1h MA7) -> 1,777.00 (15m MA28) -> 1,709.06 (24h low) On the 1h, price is over MA7 (1,784.34) and MA14 (1,794.39), by 1.3% and 0.8%, and 2.0% under MA28 (1,843.98). The fast pair has bunched together right under price after the bounce, so I read 1,784 to 1,794 as one support zone. MA28 is still falling, which is why I'm only treating this as a bounce. On the 15m, price is 0.5% under MA7 (1,816.60), 0.1% over MA14 (1,806.53) and 1.7% over MA28 (1,777.00). The last candles are small red ones drifting back toward the averages, which is the kind of dip I'm willing to buy. I'm watching volume. The 15m bar is 2.84K against MA5 6.35K and MA10 12.88K with 12:19 left, still forming. The 1h bar is 2.86K against 97.32K and 124.78K with 57:15 left, just opened. The bounce came on a big green bar and the pullback so far is quiet, so I'm not seeing sellers rush back in. The trade, buying the dip into the 1h pair: - Entry: 1,786 to 1,798 (limit, needs a 0.6% to 1.2% dip) - Stop: below 1,770 - Target 1: 1,830 (~1.7R from 1,792) - Target 2: 1,844 (~2.4R) Invalid if the 15m closes below 1,770, because that loses the 15m MA28 and the 1h MA7 together and the bounce is over. My thinking is to stay small, since the bigger trend is still down. Limit orders, small size, and no dip, no trade. #IMPACTbyTrade
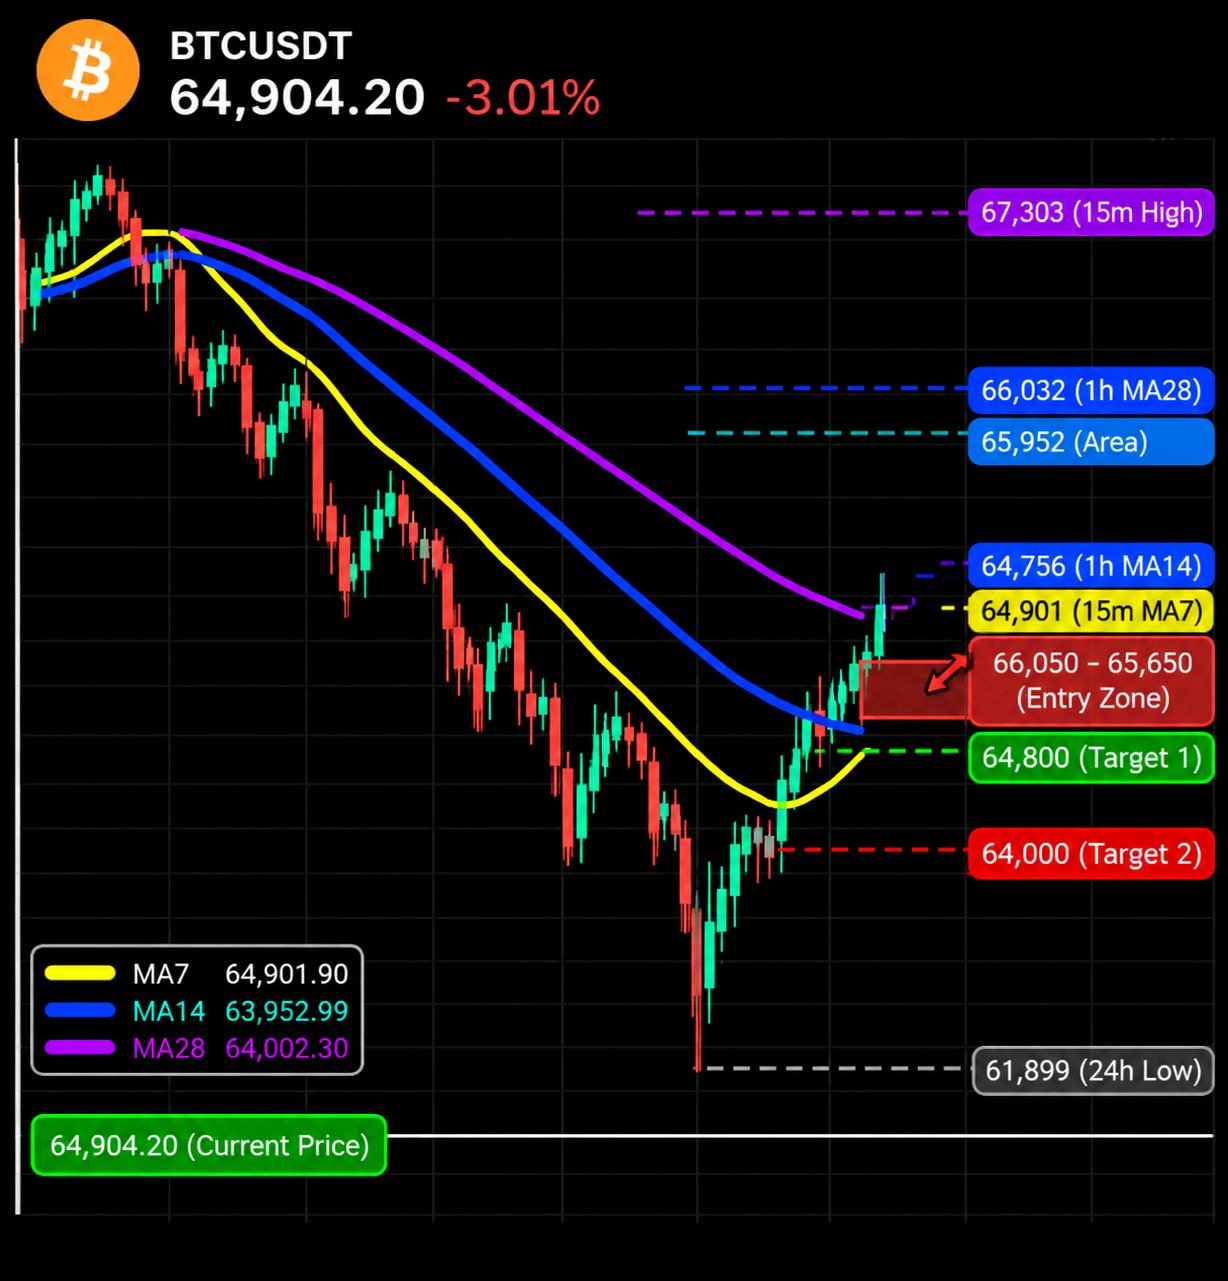
A 5% bounce inside a falling market is either the start of something or a trap, and the hourly averages above price are going to tell me which. $BTCUSDT is at 64,904.20 (-3.01%), inside a 24h range of 61,899.20 to 67,496.00 That puts it 54% of the way up the range, 4.9% above the low and 3.8% under the high Turnover is 9.93B The map I'm using: Up: 65,952 (chart gridline, an area) -> 66,032 (1h MA28) -> 67,303 (15m chart high) Down: 64,757 (1h MA14) -> 64,002 (15m MA28) -> 61,899 (24h low) On the 1h, price has climbed back over MA7 (63,975.22) and MA14 (64,756.66), by 1.4% and 0.2%, but it is still 1.7% under MA28 (66,032.35), and that line has been sloping down for days with no flat stretch. The bounce is a single long green candle, so I treat MA28 as the first real test, not the finish line. On the 15m, price is right on MA7 (64,901.90) and 1.5% and 1.4% over MA14 (63,952.99) and MA28 (64,002.30) The ladder has turned up under price and that is a fair bounce, but the last few candles are small and overlapping, which looks like a pause to me, not a second leg. I'm watching volume. The 15m bar is 530.289 against MA5 1.79K and MA10 3.18K, and the 1h bar is 7.29K against 11.14K and 9.59K, both with about 11 minutes left, so neither is final. The tallest bars on the 1h panel are the red ones from the drop, and I would want a real surge to believe this bounce has more room. The trade, selling the retest of the 1h MA28: - Entry: 65,650 to 66,050 (limit, needs a 1.1% to 1.8% bounce) - Stop: above 66,450 - Target 1: 64,800 (~1.8R from 65,850) - Target 2: 64,000 (~3.1R) Invalid if the 15m closes above 66,450. My thinking is that a close over the 1h MA28 would turn the whole slide into a base, and I'd stand aside. Limit orders, modest size, and no retest, no trade. If price never gets back to 65,650, I simply watch. #IMPACTbyTrade

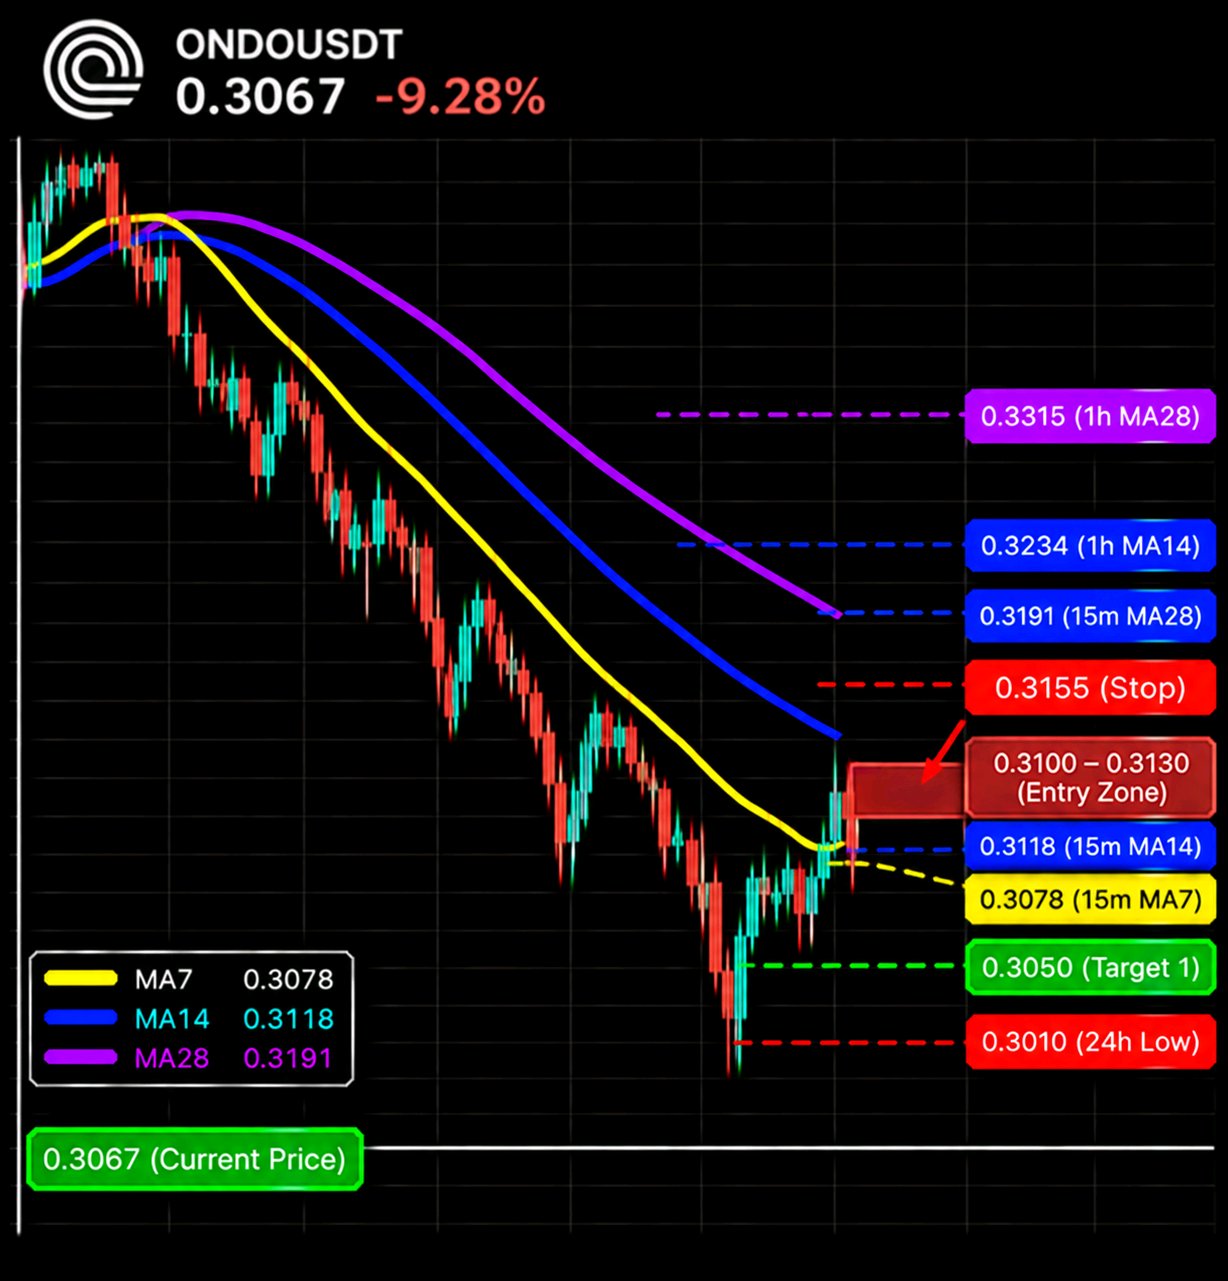
ONDO is down almost a tenth on the day and the chart still doesn't look finished to me. Every average above price is falling, and that's the part I trust more than the percentage $ONDOUSDT is at 0.3067 (-9.28%), inside a 24h range of 0.3038 to 0.3465. That puts it 7% of the way up the range, 1.0% above the low and 11.5% under the high. Turnover is 30.40M My levels: Up: 0.3078 (15m MA7) -> 0.3118 (15m MA14) -> 0.3173 (1h MA7) -> 0.3191 (15m MA28) Down: 0.3038 (24h low) -> 0.3010 (my estimate) On the 1h, price is under MA7 (0.3173), MA14 (0.3234) and MA28 (0.3315), by 3.5%, 5.4% and 8.1%. They are fanned out in order and every one is sloping down, and the last few 1h candles fell through them with barely a pause On the 15m, price is under MA7 (0.3078), MA14 (0.3118) and MA28 (0.3191), by 0.4%, 1.7% and 4.0%. After the flush there is a small base of candles at the low, but none of them has closed back over the fast average, so I'm waiting for the bounce to come to the MA14, not selling the floor I'm watching volume. The 15m bar is 234.05K against MA5 1.62M and MA10 2.19M with 11:16 left, still forming, so I'm not judging it. The 1h bar is 1.10M against 8.40M and 5.04M with 41:12 left, just opened. The tallest bars on both charts are the red ones on the drop, and the base since has been light The trade, sell the bounce into the 15m MA14: - Entry: 0.3100 to 0.3130 (limit, needs a 1.1% to 2.1% bounce) - Stop: above 0.3155 - Target 1: 0.3050 (~1.6R from 0.3115) - Target 2: 0.3010 (~2.6R) Invalid if the 15m closes above 0.3155. My thinking is that a reclaim of the 1h MA7 area would mean the flush is being bought, and I'd stay out Limit orders, small size after a move this fast, and no bounce, no trade. I would rather miss it than short the low. #IMPACTbyTrade

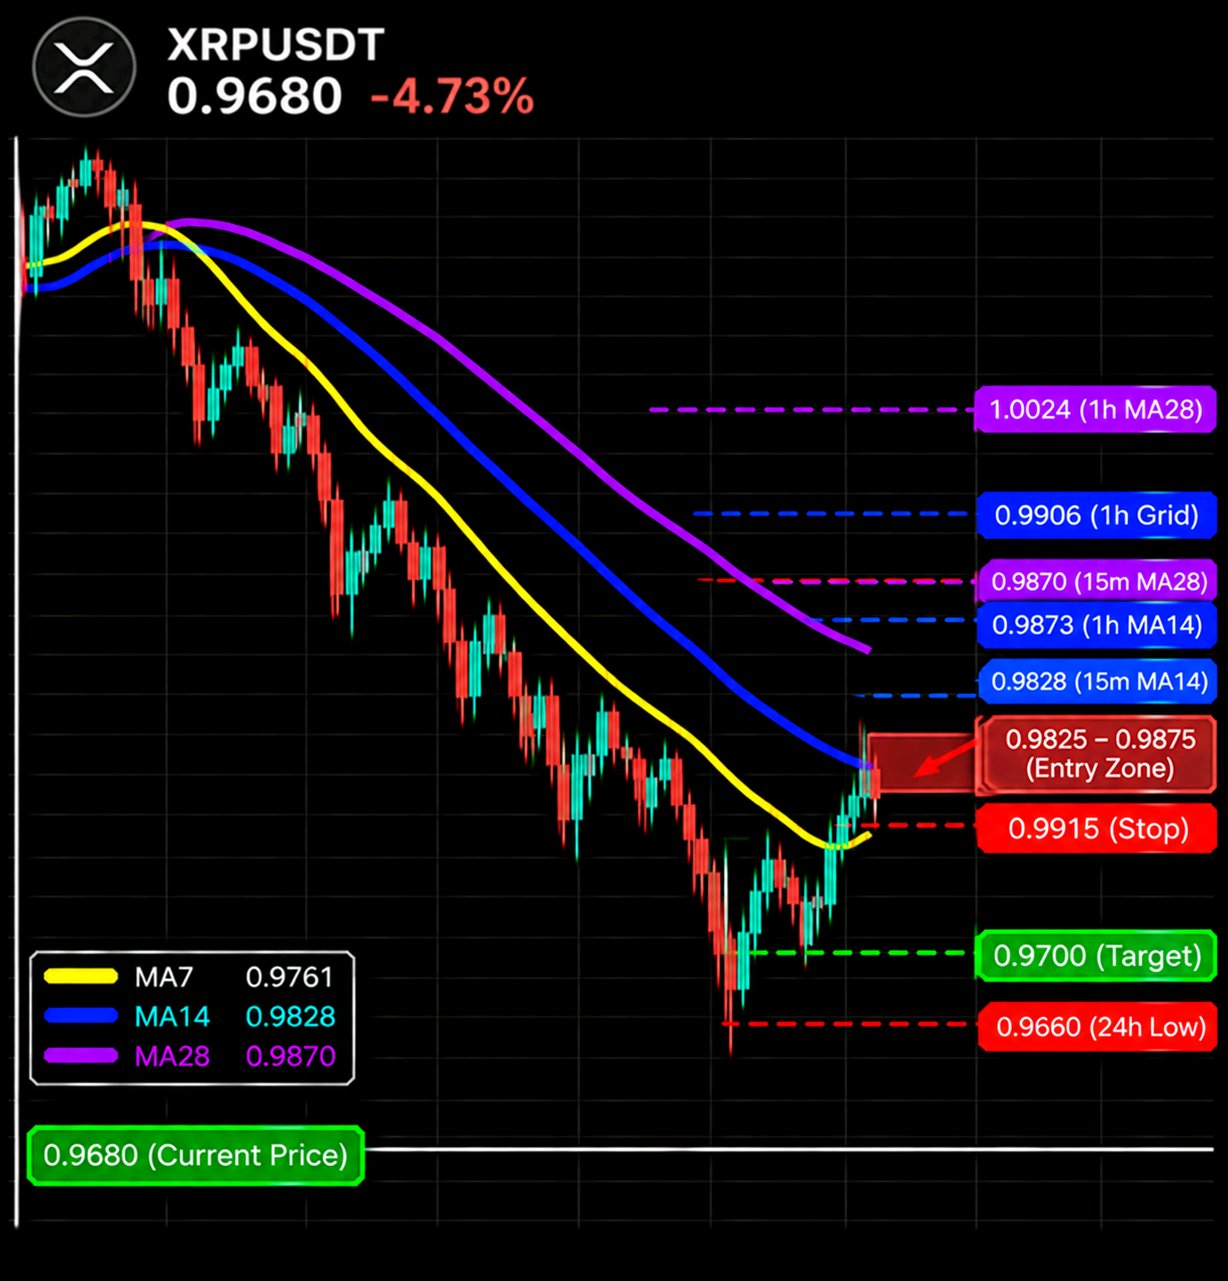
Cinco monedas en mi pantalla han bajado entre un 5% y un 10%, y XRP está un 0,2% por encima de su mínimo. No voy a vender tan bajo. Estoy esperando a que vuelva a subir al soporte que acaba de romper. $XRPUSDT está en 0,9680 (-4,73%), dentro de un rango de 24h de 0,9660 a 1,0294. Eso lo sitúa un 3% por encima de su mínimo del rango y un 6,0% por debajo del máximo, con un volumen de 364,39M. En gráfico de 1h ha caído un 9,3%, desde 1,0645 hasta 0,9660, y el de 15m muestra cómo aguantó un soporte alrededor de 0,979 a 0,992 durante horas antes de ceder. La zona que usaría es de 0,9825 a 0,9875: Arriba: 0,9761 (MA7 15m) -> 0,9828 (MA14 15m) -> 0,9847 (MA7 1h) -> 0,9870-0,9873 (MA28 15m / MA14 1h) -> 0,9906 (línea de cuadrícula 1h) -> 1,0024 (MA28 1h) Abajo: 0,9660 (mínimo 24h) En gráfico de 1h, la MA7 (0,9847), la MA14 (0,9873) y la MA28 (1,0024) están en orden bajista y todas apuntando hacia abajo, con el precio un 1,6%, 1,9% y 3,4% por debajo de ellas. En gráfico de 15m, la MA7 (0,9761), la MA14 (0,9828) y la MA28 (0,9870) caen de la misma forma, con el precio un 0,8%, 1,5% y 1,9% por debajo. Cuatro medias están apiladas en medio punto porcentual justo donde solía estar el antiguo soporte. El volumen dice que la caída no fue casualidad. La vela de 1h en el movimiento hasta 0,9660 es una de las más grandes del gráfico. La vela actual de 15m muestra 2,05M con unos seis minutos restantes, frente a 9,61M y 8,54M, así que aún no doy por sentado ese mínimo, y la vela de 1h acaba de abrir, así que ignoro sus 2,06M. Mi plan, vender el rebote hacia el antiguo soporte: - Entrada: 0,9825 a 0,9875 - Stop: por encima de 0,9915 - Objetivo: 0,9700 (~2,3R desde el punto medio de 0,9850) No tengo segundo objetivo, porque no veo ningún nivel por debajo del mínimo de 24h. Necesita un rebote del 1,5% al 2,0% para llegar a la zona, y solo me interesa si el precio se estanca ahí. Mi tesis se invalida si una vela de 15m cierra por encima de 0,9915, de nuevo por encima del soporte y de todas las medias. Tal como lo veo: si el rebote se estanca bajo esa pila, el mínimo de 0,9660 volverá a ponerse a prueba antes de que pase nada más. En un día como hoy, un stop de alrededor del 0,6% puede ser barrido por una sola vela. Mantendría un tamaño modesto y usaría órdenes limitadas. Si el precio nunca rebota hacia la zona, simplemente no opero. Prefiero vender un soporte que ya se rompió que un mínimo que todavía se está formando. #IMPACTbyTrade

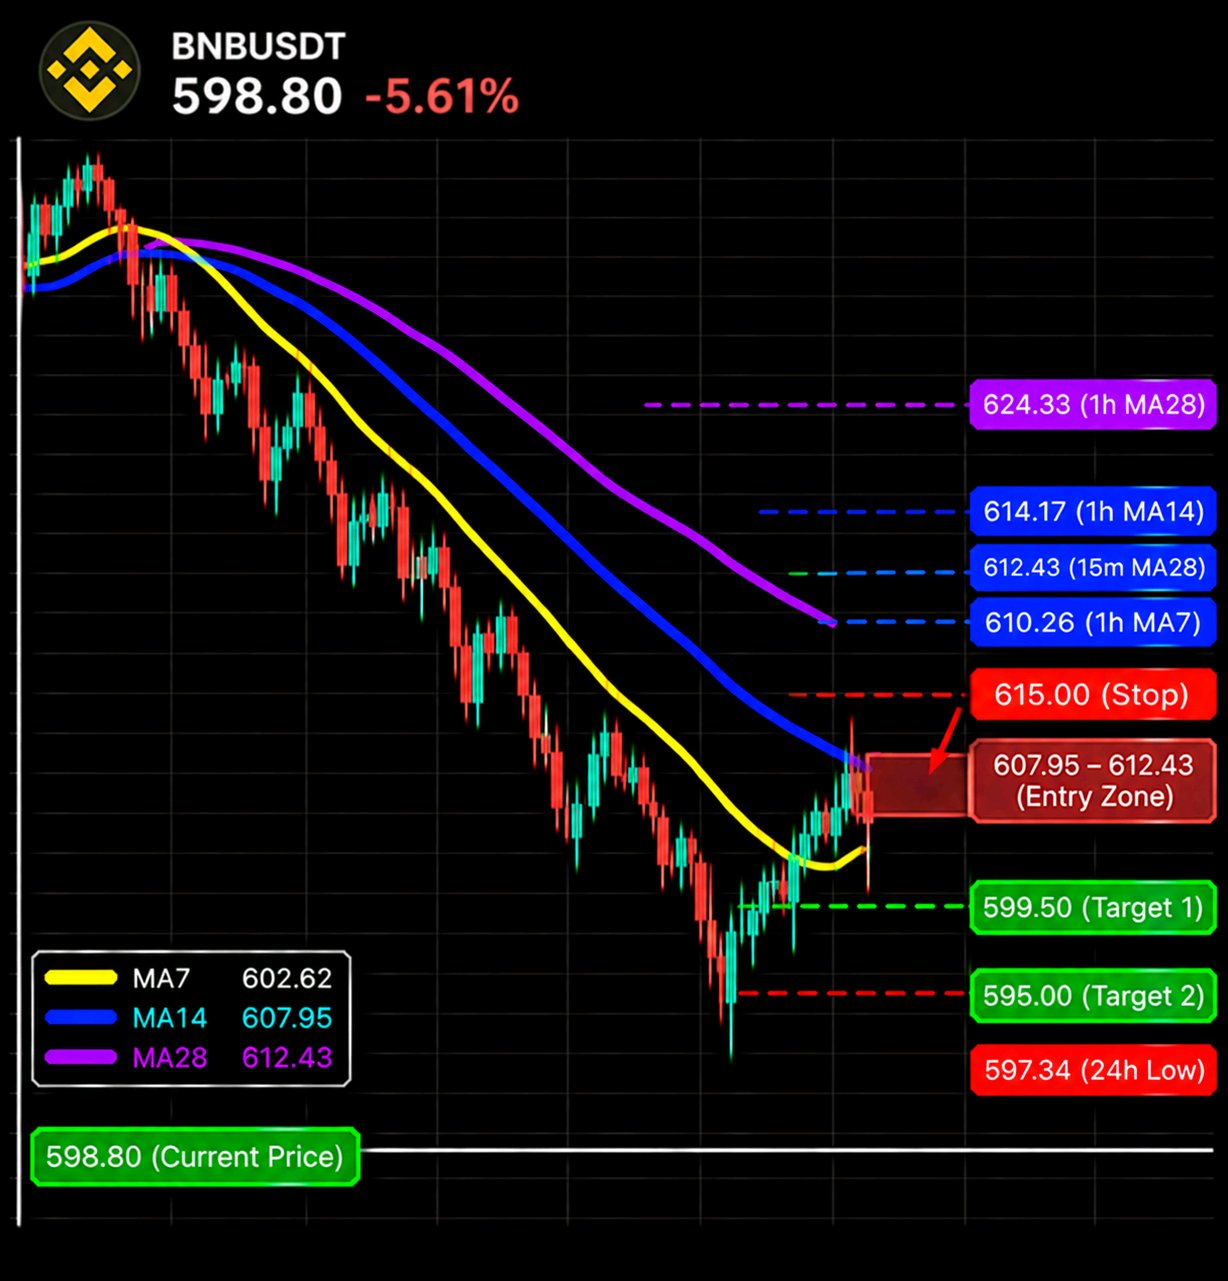
BNB lleva desangrándose en línea recta desde las 18:00 aproximadamente, y la única entrada que tomaría es aquella en la que finalmente experimente un rebote y recupere terreno. $BNBUSDT está en -5,61% a 598,80, un 0,24% por encima del mínimo de 597,34 y un 6,7% por debajo del máximo de 638,95, aproximadamente al 3,5% del rango de 24 horas, con un volumen de negociación de 31,09 M. Cayó atravesando la zona de 615 a 621 en la que se había mantenido y luego imprimió vela roja tras vela roja sin apenas rebote en medio. Lo que estoy observando es que la presión vendedora se ha calmado. La última vela de 15m muestra 428 frente a 1,57K (MA5) y 1,33K (MA10), aproximadamente 0,3x de cada una, después de una racha de barras de varias veces ese tamaño. La barra de 1h muestra 431 frente a 3,06K y 2,30K, pero esa hora acaba de abrir. La calma en el mínimo puede significar que un rebote está cerca. No significa que los vendedores hayan terminado, así que quiero que el rebote venga a mí. Las medias (todas por encima del precio): MA7 15m 602,62 (+0,6%) MA14 15m 607,95 (+1,5%) MA7 1h 610,26 (+1,9%) MA28 15m 612,43 (+2,3%) MA14 1h 614,17 (+2,6%) MA28 1h 624,33 (+4,3%) La MA7 de 15m en 602,62 es solo la línea rápida y está demasiado cerca del mínimo para que yo venda. La zona que me interesa es donde se acumulan la MA14 de 15m, la MA7 de 1h y la MA28 de 15m, de 607,95 a 612,43. Al alza: 602,62 -> 607,95 / 610,26 / 612,43 -> 614,17 -> 624,33 -> 638,95 (máximo de 24h) A la baja: 597,34 (mínimo de 24h), nada visible por debajo de eso Mi operación, solo si aparece el rebote: Entrada de 607,95 a 612,43, después de que el precio llegue y se estanque (una o dos velas que no puedan cerrar por encima de 612,43). Eso significa un rebote previo del 1,5% al 2,3%. Stop por encima de 615,00, sobre la MA14 de 1h en 614,17 Objetivo 1: 599,50, justo por encima del mínimo de 597,34 (aprox. 2,2R) Objetivo 2: 595,00 si se rompe el mínimo (aprox. 3,2R). No hay nada mapeado por debajo de 597,34, así que ese es un movimiento calculado. Si se desliza por debajo de 597,34 sin rebotar, la dejo pasar. Si una vela de 15m cierra por encima de 615,00, los vendedores perdieron el control del rebote y la idea queda invalidada. R se cuenta desde la mitad de la zona (610,19) con un stop a aproximadamente un 0,8% de distancia. Mantén el tamaño lo suficientemente pequeño como para que el stop no duela. No es asesoramiento financiero. Sinceramente, la parte más difícil de esto es no hacer nada mientras se mantiene en el mínimo. #IMPACTbyTrade

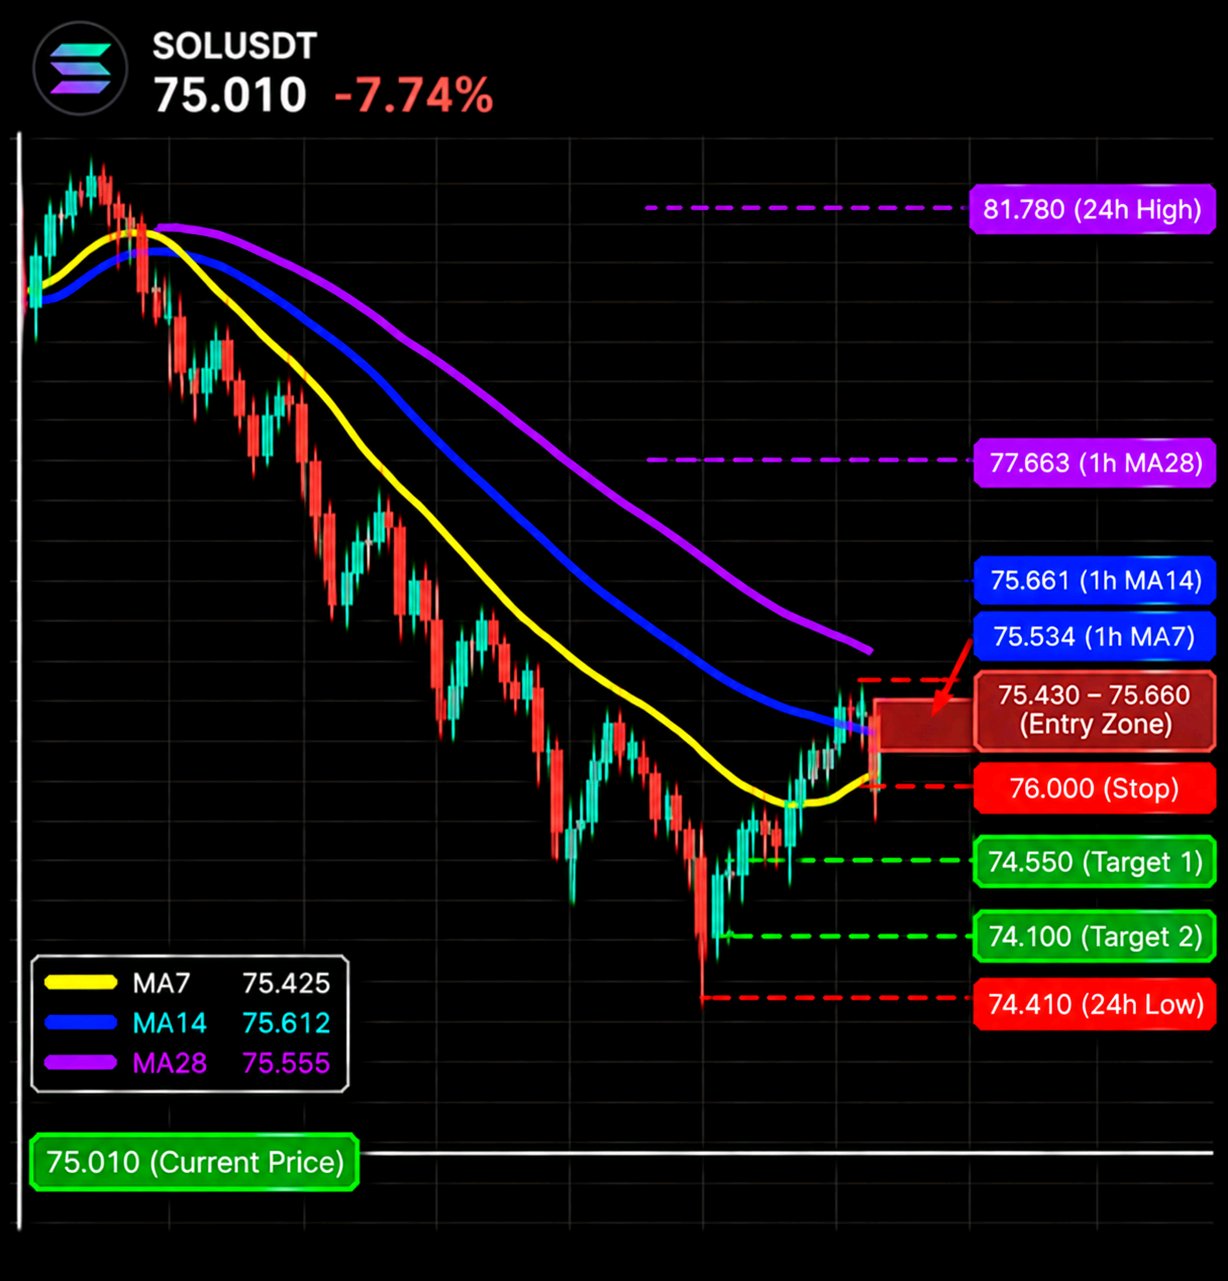
SOL pasó seis horas sin ir a ninguna parte, luego una vela rompió el soporte. No voy a perseguir eso. Quiero ver primero si el rebote falla. $SOLUSDT está a -7.74% en 75.010, un 0.8% por encima del mínimo de 74.41 y un 9.0% por debajo del máximo de 81.78, solo alrededor de un 8% por encima del rango de 24h. El rango en el que se mantenía oscilaba aproximadamente entre 75.0 y 75.9 (de 12:15 a 18:45). El volumen de negociación es de 608.92M, más de diez veces cualquier otra cosa que haya mirado hoy, así que estos niveles no son poco sólidos. El volumen es lo importante aquí. La vela de 15m registra 258.82K frente a 103.61K (MA5) y 71.92K (MA10), aproximadamente 2.5x y 3.6x. La vela de 1h muestra 258.96K, casi el mismo número, por lo que la hora acaba de abrir y una sola vela ha hecho todo eso. Eso ya es 1.4x la MA5 de 1h (182.41K) y 1.3x la MA10 (193.16K). Ambas velas todavía se están formando, así que el cierre tiene que respaldarlo. Las medias (todas por encima del precio): MA7 15m 75.425 (+0.6%) MA28 15m 75.555 (+0.7%) MA14 15m 75.612 (+0.8%) MA7 1h 75.534 (+0.7%) MA14 1h 75.661 (+0.9%) MA28 1h 77.663 (+3.5%) Las tres líneas de 15m se sitúan dentro de una banda del 0.25% y las MA7 y MA14 de 1h caen justo en ella, así que estoy vigilando un solo grupo (75.43 a 75.66), no seis líneas separadas. Arriba: 75.43 / 75.56 / 75.61 -> 75.66 -> 77.66 (MA28 1h) -> 81.78 (máximo 24h) Abajo: 74.41 (mínimo 24h), nada mapeado por debajo Plan: vender solo en el retesteo. Entrada entre 75.43 y 75.66, y solo una vez que el precio llegue allí y se detenga. Eso requiere primero un rebote del 0.6% al 0.9%. Stop por encima de 76.00, sobre la parte superior de ese rango y la MA14 de 1h. Objetivo 1: 74.55, justo por encima del mínimo de 74.41 (aprox. 2.2R) Objetivo 2: 74.10 si se rompe el mínimo (aprox. 3.2R) No hay ningún nivel visible por debajo de 74.41, así que ese es un movimiento medido. Si sangra por debajo de 74.41 y sigue bajando sin volver a testear nunca, no voy a perseguirlo. Si una vela de 15m cierra de nuevo por encima de 76.00, el rango se mantiene y estoy equivocado. R se cuenta desde la mitad de la zona (75.545) con un stop a 0.6% de distancia. Stop pequeño, así que posición pequeña también. No es consejo financiero. ¿Alguien más está vigilando el nivel de 75.43 a 75.66 para esta? #IMPACTbyTrade

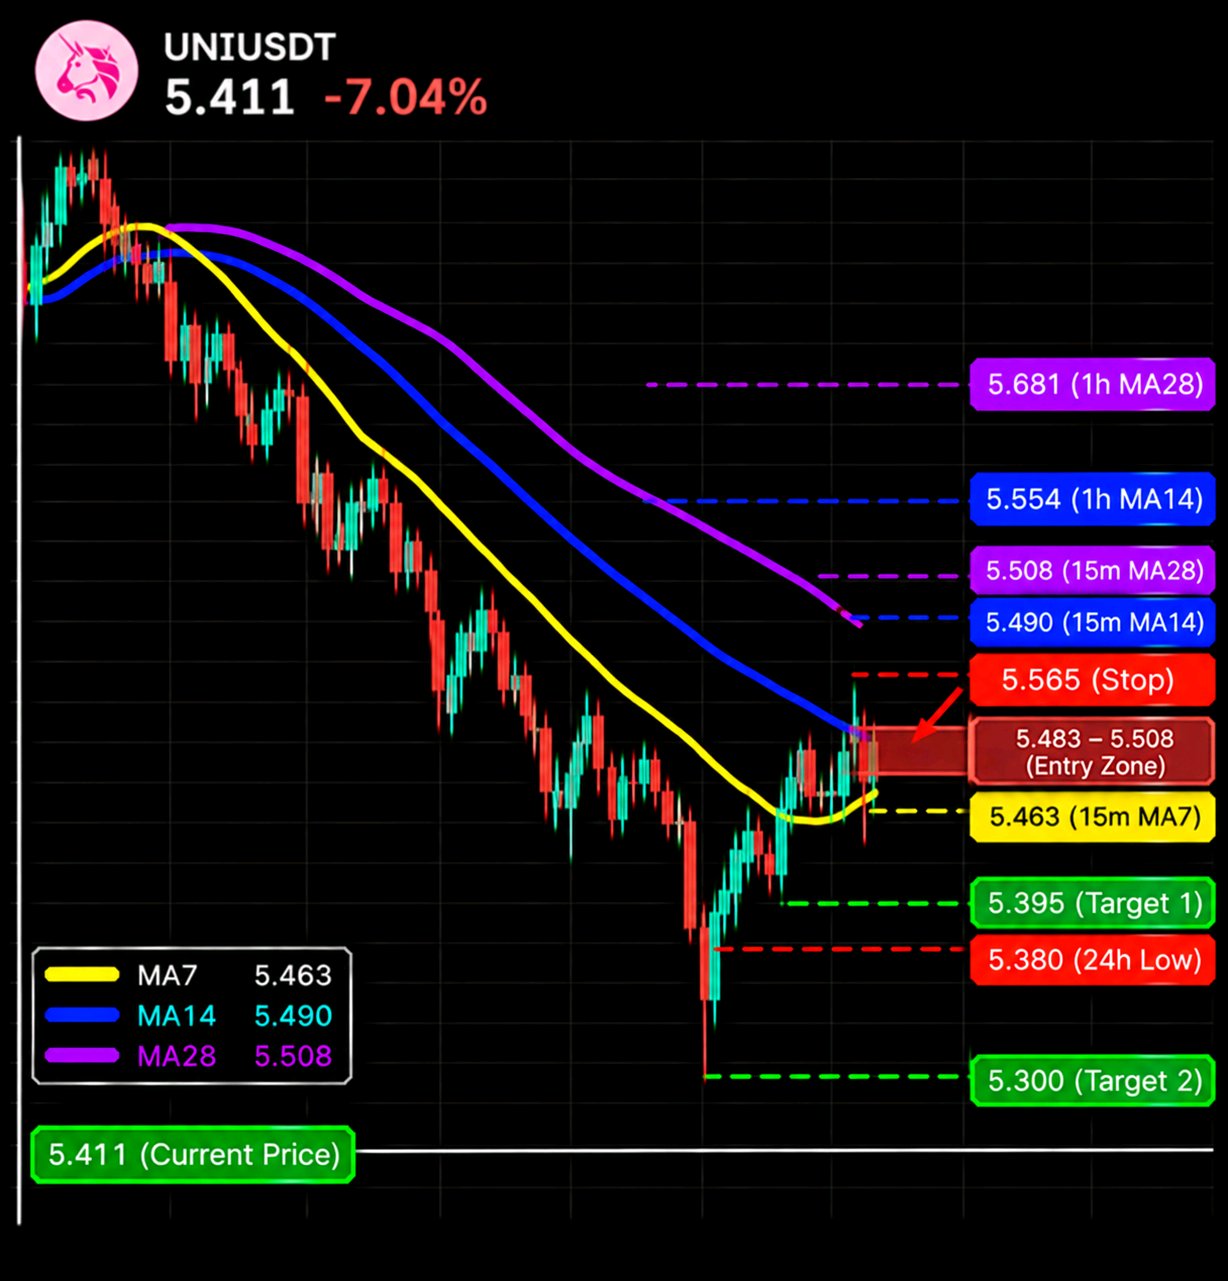
Todo lo que tengo en mi lista está sangrando, pero UNI es lo único que querría vender, y solo después de que rebote. $UNIUSDT está en 5.411 (-7.04%), solo un 0.6% por encima del mínimo de 5.380 y aproximadamente un 5% por encima de un rango de 24h que llega hasta 6.022 (11.3% de margen). El volumen de negociación es de 34.73M, así que hay dinero real detrás de este movimiento. Lectura de volumen: la vela actual de 15m muestra 210.25K frente a 79.67K (MA5) y 56.41K (MA10), aproximadamente 2.6x y 3.7x. La barra de 1h muestra 210.41K, casi la misma cifra, lo que me dice que la hora apenas ha empezado y casi todo ha entrado en una sola vela. Ya supera la MA10 de 1h (191.43K). Ambas velas siguen abiertas, así que lo trato como una venta fuerte que el cierre aún tiene que confirmar. Las medias (todas por encima del precio): MA7 15m 5.463 (+1.0%) MA14 15m 5.490 (+1.5%) MA28 15m 5.508 (+1.8%) MA7 1h 5.483 (+1.3%) MA14 1h 5.554 (+2.6%) MA28 1h 5.681 (+5.0%) Media rápida bajo la lenta en ambos marcos temporales y precio por debajo de las seis. Al alza: 5.463 / 5.490 / 5.508 -> 5.554 -> 5.681 -> 6.022 (máximo de 24h) A la baja: 5.380 (mínimo de 24h), nada visible por debajo. Mi plan (vender solo el rebote): Entrada de 5.483 a 5.508 (MA7 de 1h más la MA14 / MA28 de 15m). Eso requiere primero un rebote del 1.3% al 1.8%, y quiero ver que el precio llegue a la zona y se estanque allí, no tocarla y ponerse corto a ciegas. Stop por encima de 5.565 (recuperar la MA14 de 1h en 5.554 significa que esto ya no es un rebote débil). Objetivo 1: 5.395, justo por encima del mínimo de 5.380 (alrededor de 1.4R) Objetivo 2: 5.300 si el mínimo cede (alrededor de 2.8R) No hay ningún nivel visible por debajo de 5.380, así que ese es un movimiento medido, no mapeado. Si se desliza por debajo de 5.380 sin rebotar, no lo persigo. Lo dejo pasar y espero al próximo retesteo. La R se calcula desde la mitad de la zona (5.4955) con un stop a aproximadamente un 1.3% de distancia, así que el stop-out se mantiene pequeño. Ajústalo de esa manera. Esto no es consejo financiero. ¿Prefieres esperar al rebote o aprovechar el mínimo? Sé cuál de los dos me ha hecho más daño. #IMPACTbyTrade

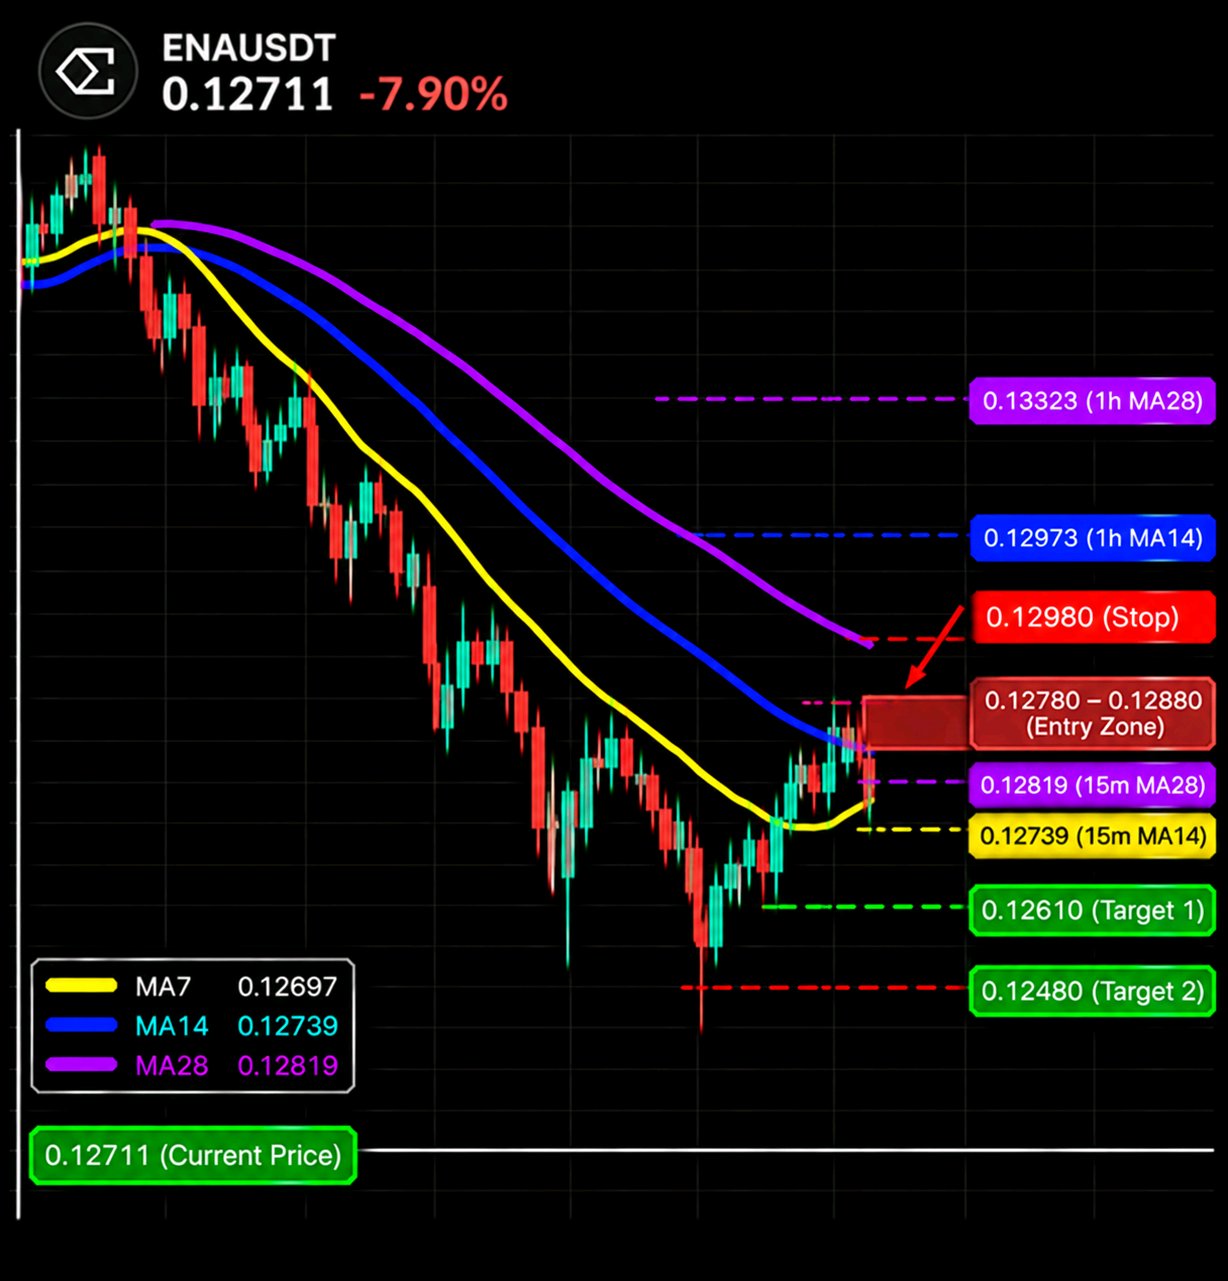
ENA me sigue recordando que una moneda puede bajar un 8% y aun así no parecer barata, porque todos los promedios horarios están por encima y ninguno se está aplanando. $ENAUSDT está en 0,12711 (-7,90%), dentro de un rango de 24h de 0,12598 a 0,14258. Eso lo sitúa un 7% por encima del rango, un 0,9% por encima del mínimo y un 10,9% por debajo del máximo. El volumen de negociación es de 75,54M. Lo que estoy marcando: Arriba: 0,12739 (MA14 de 15m) -> 0,12772 (MA7 de 1h) -> 0,12819 (MA28 de 15m) -> 0,12973 (MA14 de 1h) Abajo: 0,12598 (mínimo de 24h) -> 0,12480 (mi estimación) En la gráfica de 1h, el precio está por debajo de la MA7 (0,12772), MA14 (0,12973) y MA28 (0,13323), un 0,5%, 2,0% y 4,6% respectivamente. Están apiladas en orden, bien abiertas y las tres siguen inclinándose hacia abajo, así que no hay ningún tramo donde los compradores hayan tomado el control. En la de 15m, el precio está un 0,1% por encima de la MA7 (0,12697), pero un 0,2% por debajo de la MA14 (0,12739) y un 0,9% por debajo de la MA28 (0,12819). Las velas se han estado moviendo lateralmente alrededor de las líneas rápidas, así que no quiero entrar en corto en medio de eso, quiero que me paguen por esperar al rebote. Estoy vigilando el volumen. La vela de 15m es de 396,20K frente a la MA5 de 2,95M y la MA10 de 3,52M con 12:39 restantes, y la vela de 1h es de 405,97K frente a 10,72M y 20,37M con 57:37 restantes. Ambas velas apenas han comenzado, así que no las juzgaré todavía, pero las barras altas en ambos gráficos aparecieron en las caídas, no en los pequeños rebotes posteriores. Mi pensamiento: el primer punto donde un rebote puede atascarse es la MA7 de 1h y la MA28 de 15m, ambas dentro de un 0,4% entre sí, y por encima de ellas, la MA14 de 1h es la línea que me indicaría que el rebote es real. La operación, vender el rebote: - Entrada: 0,12780 a 0,12880 (límite, necesita un rebote del 0,5% al 1,3%) - Stop: por encima de 0,12980 - Objetivo 1: 0,12610 (~1,5R desde 0,12830) - Objetivo 2: 0,12480 (~2,3R) Me equivoco si la vela de 15m cierra por encima de 0,12980, porque entonces el precio habrá recuperado la MA14 de 1h y me retiraría. Tamaño pequeño, solo órdenes limitadas. Si nunca llega a 0,12780, no hay operación. #IMPACTbyTrade

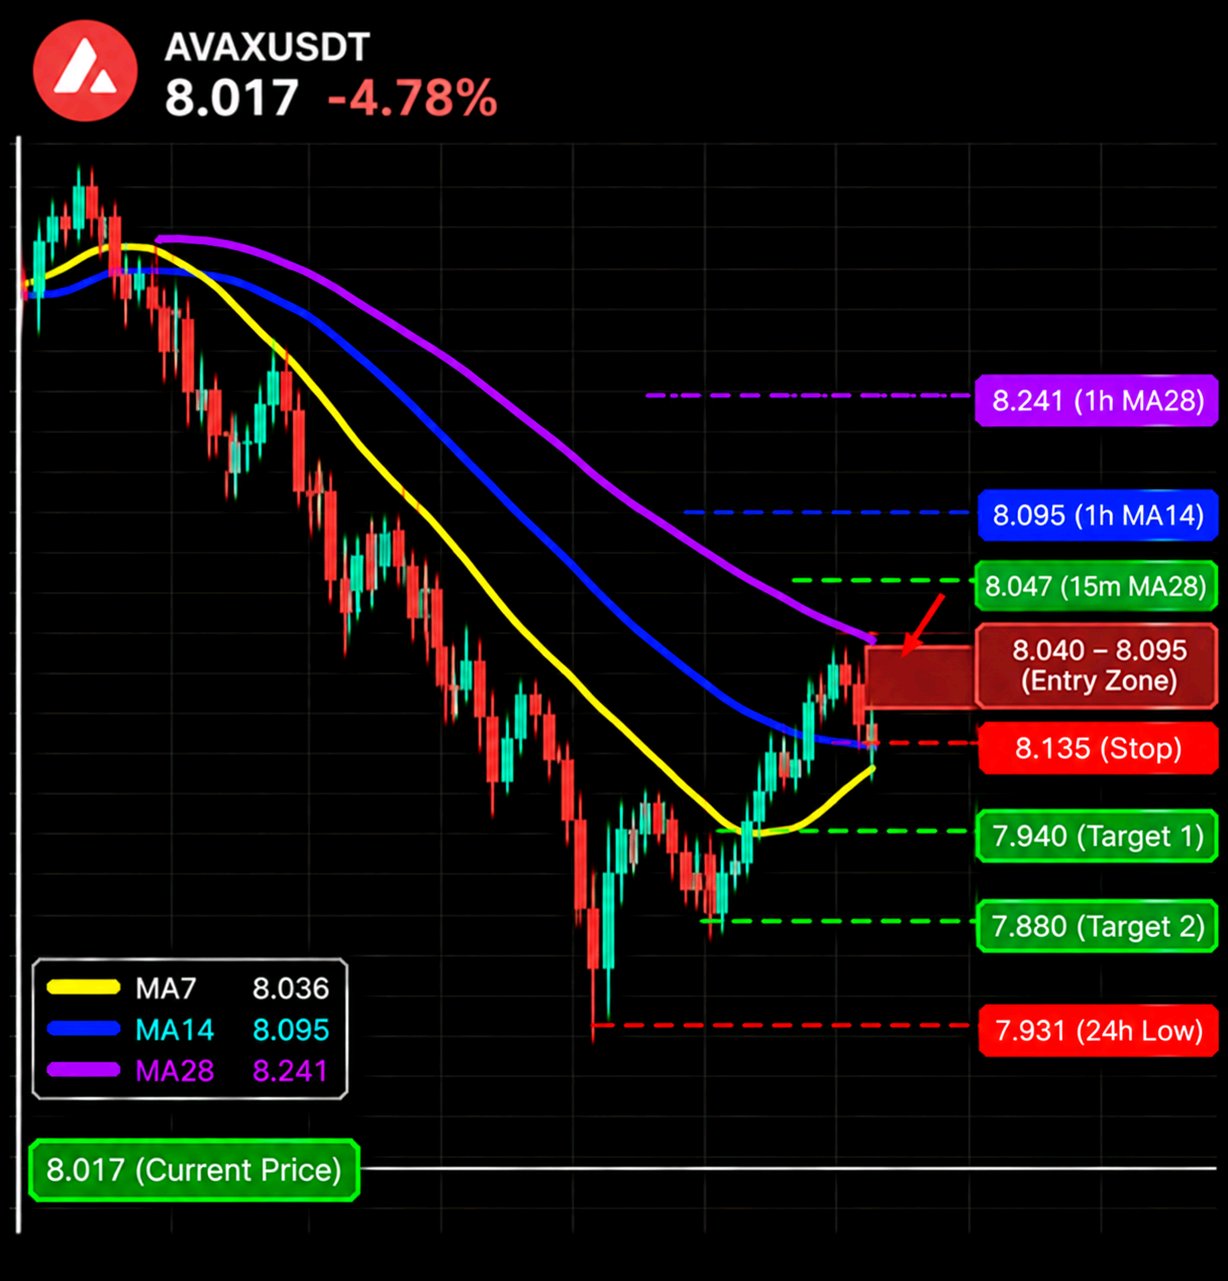
AVAX has been giving back the same ground all afternoon, and the hourly chart shows exactly where each bounce has been running out of air. $AVAXUSDT is at 8.017 (-4.78%), inside a 24h range of 7.931 to 8.629. That puts it 12% of the way up the range, 1.1% above the low and 7.1% under the high. Turnover is 29.73M Here is the map I'm using: Up: 8.036 (1h MA7) -> 8.047 (15m MA28) -> 8.095 (1h MA14) -> 8.241 (1h MA28) Down: 7.931 (24h low) -> 7.880 (my estimate) On the 1h, price is under MA7 (8.036), MA14 (8.095) and MA28 (8.241), by 0.2%, 1.0% and 2.7% The three are fanned out and pointing down, and every bounce since the 8.45 area has topped out at the fast line, so I read 8.04 to 8.10 as the area where the next one has to prove itself. On the 4h, price is also under MA7 (8.208), MA14 (8.279) and MA28 (8.378), by 2.3%, 3.2% and 4.3%, so the bigger picture is leaning the same way. On the 15m, price is level with MA14 (8.018) and 0.1% over MA7 (8.012), but 0.4% under MA28 (8.047). The last candle is a small green one that has only just reached the fast lines, so I'm not selling this exact price, I'm waiting for a little more. Volume is light. The 1h bar shows 15.23K against MA5 119.19K and MA10 141.10K with 44:26 left, so it is still early in the candle and I won't judge it. The 15m bar was 12.48K against 18.32K and 20.09K when I looked. The tall bars on this chart came on the drops and this bounce has none, so I lean toward selling into it. My plan, selling the bounce into the 1h averages: - Entry: 8.040 to 8.095 (limit, needs a 0.3% to 1.0% bounce) - Stop: above 8.135 - Target 1: 7.940 (~1.9R from 8.068) - Target 2: 7.880 (~2.8R) I'm wrong if the 15m closes above 8.135, because then price has taken back the 1h MA14 and I'd step aside. Small size, limit orders only. If it never reaches 8.040, there is no trade, and I'm fine with that. #IMPACTbyTrade

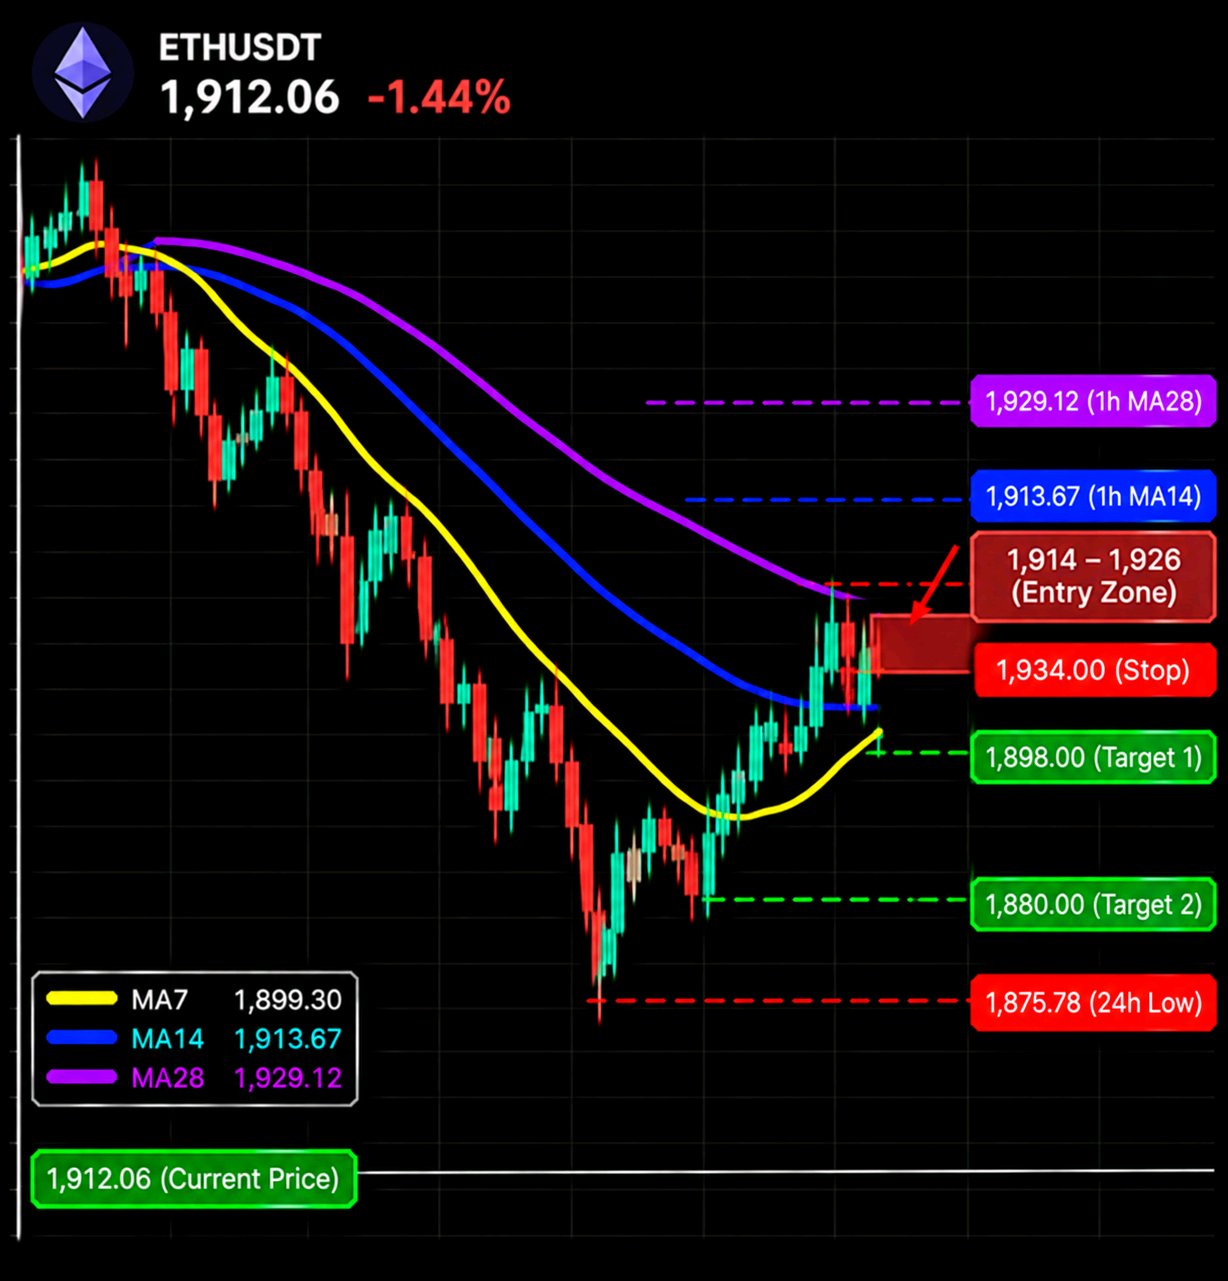
ETH has spent the last few hours climbing off 1,875, and the climb is walking straight into the hourly averages, which is the one place I'd expect it to get tired. $ETHUSDT is at 1,912.06 (-1.44%), inside a 24h range of 1,875.78 to 1,988.67. That puts it 32% of the way up the range, 1.9% above the low and 3.9% under the high Turnover is 2.39B. The ceiling I'm marking: Up: 1,913.67 (1h MA14) -> 1,929.12 (1h MA28) -> 1,952.21 (15m chart high) Down: 1,903.73 (15m MA7) -> 1,899.67 (15m MA28) -> 1,875.78 (24h low) On the 1h, price is 0.7% over MA7 (1,899.30), but 0.1% under MA14 (1,913.67) and 0.9% under MA28 (1,929.12). MA14 and MA28 are both still sloping down from the 2,053 area, so price has just reached the first of two falling lines, and I'm treating 1,914 to 1,929 as one zone. On the 15m, price is over MA7 (1,903.73), MA14 (1,901.56) and MA28 (1,899.67) by 0.4%, 0.6% and 0.7% The averages have turned flat and the last candle is a long green one with a wick above it, so buyers have shown up, but they have not yet been tested at the hourly line. Volume is the honest part. The 15m bar shows 17.98K against MA5 8.26K and MA10 7.79K with 00:52 left, so it is above both averages and still forming, which means this bounce has real buying behind it. The 1h bar is 38.38K against 33.07K and 52.08K with 00:39 left, above the MA5 but below the MA10. That is why I'm waiting for the zone and not shorting here. My plan, selling into the hourly averages: - Entry: 1,914 to 1,926 (limit, needs a 0.1% to 0.7% rise) - Stop: above 1,934 - Target 1: 1,898 (~1.6R from 1,920) - Target 2: 1,880 (~2.9R) I'm wrong if the 15m closes above 1,934, because that puts price over the 1h MA28 and the bounce becomes a reversal, so I'd leave it. Limit orders, small size, and if the climb never reaches 1,914 I simply don't have a trade. #IMPACTbyTrade

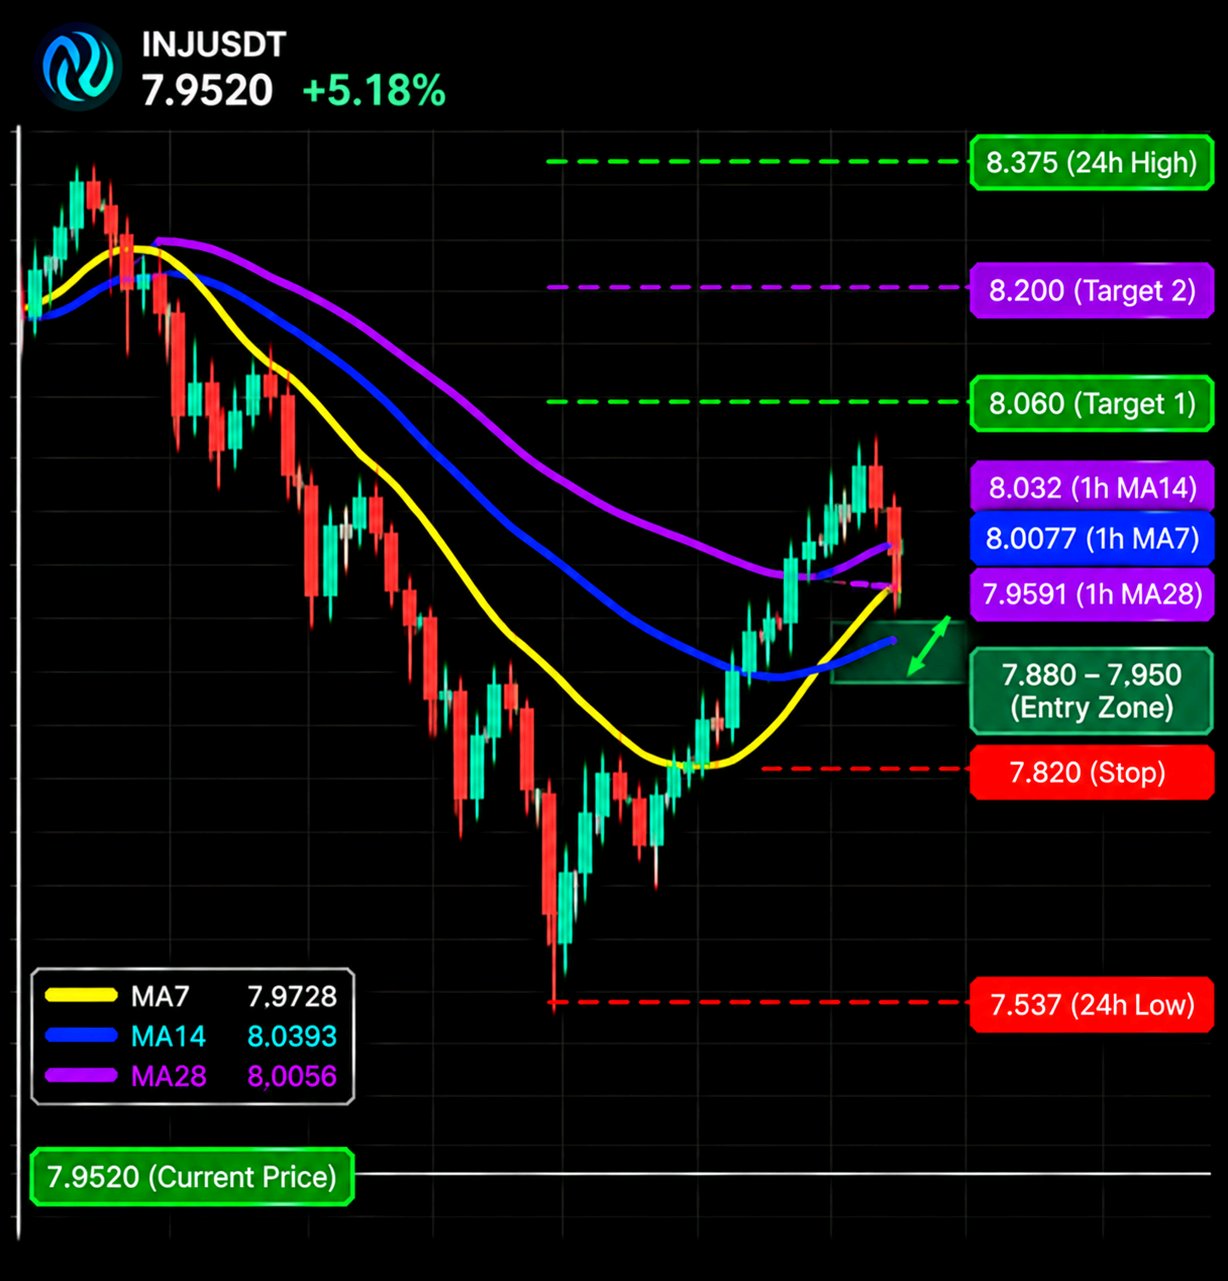
Every chart on my screen is bleeding to a fresh low except INJ, which is still 5% green and pulling back onto its rising 1h average. That contrast is what caught my eye $INJUSDT is at 7.9520 (+5.18%), inside a 24h range of 7.5370 to 8.3750. That puts it 50% of the way up the range, 5.5% above the low and 5.1% under the high. Turnover is 44.54M The shelf I'm watching: Up: 7.973 (15m MA7) -> 8.006 (15m MA28) -> 8.032 (1h MA14) -> 8.375 (24h high) Down: 7.959 (1h MA28) -> 7.859 (15m low) -> 7.537 (24h low) On the 1h, price is 0.7% under MA7 (8.0077) and 1.0% under MA14 (8.0318), and sitting right on MA28 (7.9591), 0.1% under it. MA28 is the one still climbing steeply from the 7.45 area, so that line is the whole trade for me: if it holds, this is a pullback, and if it doesn't, it's a top. On the 15m, price is under MA7 (7.9728), MA14 (8.0393) and MA28 (8.0056), by 0.3%, 1.1% and 0.7% The fast lines have rolled over after the spike to 8.3360, so I'm not buying the current price, I want a small flush into the shelf first. Volume is quiet. The 15m bar shows 1.60K against MA5 26.87K and MA10 36.98K with 13:24 left, so it is still forming and I won't judge it. The 1h shows 2.24K against 172.61K and 177.13K with 58:21 left, barely opened. The push up came on much bigger bars than this pullback, which is what I'd want from a dip I'm willing to buy. My plan, buying the pullback into the shelf: - Entry: 7.880 to 7.950 (limit, needs up to a 0.9% dip) - Stop: below 7.820 - Target 1: 8.060 (~1.5R from 7.915) - Target 2: 8.200 (~3.0R) I'm out if the 15m closes below 7.820. That means the 1h MA28 and the 15m low both gave way, and the pullback has turned into a reversal. Limit orders, small size, and if 7.95 never trades I simply have no position. #IMPACTbyTrade