RISK AND RICHES
24511Me gusta18Compartir en el chat405Aficionados264Seguir
Without risk a man is nothing
Without risk a man is nothing
The moment I opened Bybit and saw SPCXX climbing back toward $140, my first instinct was to get excited. After watching this chart fall from the $147.56 region toward $133.51, seeing buyers step back in felt like a possible turning point. But experience has taught me to separate excitement from evidence. Here's what caught my attention: $SPCXXUSDT is trading at $139.35, up 2.85%. On the 1H chart, price has reclaimed all three moving averages: MA7 at $139.31, MA14 at $138.98, and MA28 at $137.74. MACD is also positive, suggesting improving short-term momentum. However, I am not calling this a confirmed trend reversal yet. The $140.53 resistance is the immediate test. A convincing break with stronger volume could open the door toward higher levels. Rejection could send price back toward $138 or even $137. My approach? Watch confirmation, manage risk, and avoid chasing green candles. I've survived enough cycles to know that a recovery is not the same thing as a reversal. #ByXIMPACT $DOGEUSDT


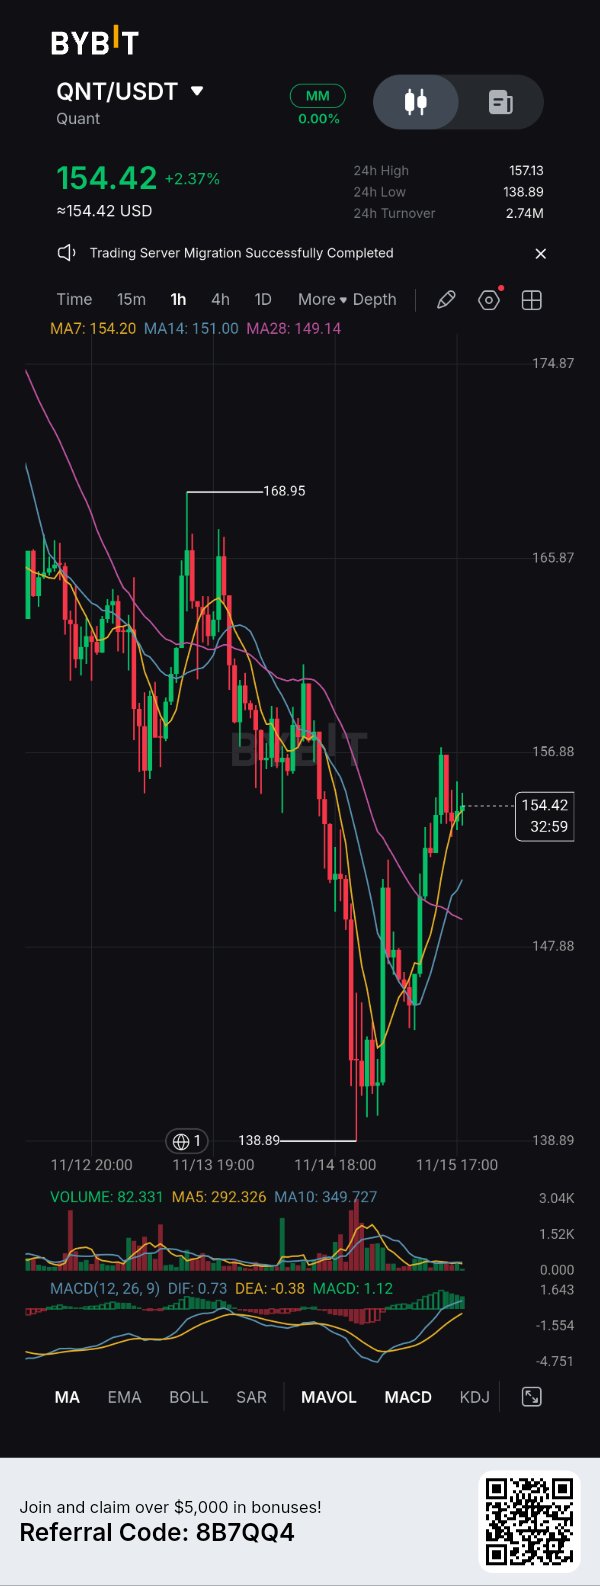
$QNTUSDT caught my attention after its sharp drop to $138.89. The rebound to $154.42 is significant, but I'm more interested in whether buyers can sustain the move. Here's what I'm watching: 1. TREND: Price has climbed above MA7 ($154.20), MA14 ($151.00), and MA28 ($149.14). Short-term momentum is improving. 2. RESISTANCE: The $156.88 area is the immediate obstacle. Breaking it convincingly could attract fresh buyers. 3. MOMENTUM: MACD is positive at 1.12, but volume has declined considerably. That's something I won't ignore. 4. RISK: Losing the $149–$151 support zone would make me question the recovery. My approach is simple: I won't chase QNT at $154.42. I'll wait for either a confirmed breakout above $156.88 or a controlled pullback that holds support. A recovery deserves attention, not blind trust. Trade the confirmation, not the excitement. #ByXIMPACT #WSOT2026 #WSOTShowYourAITradeToEarn10USDT
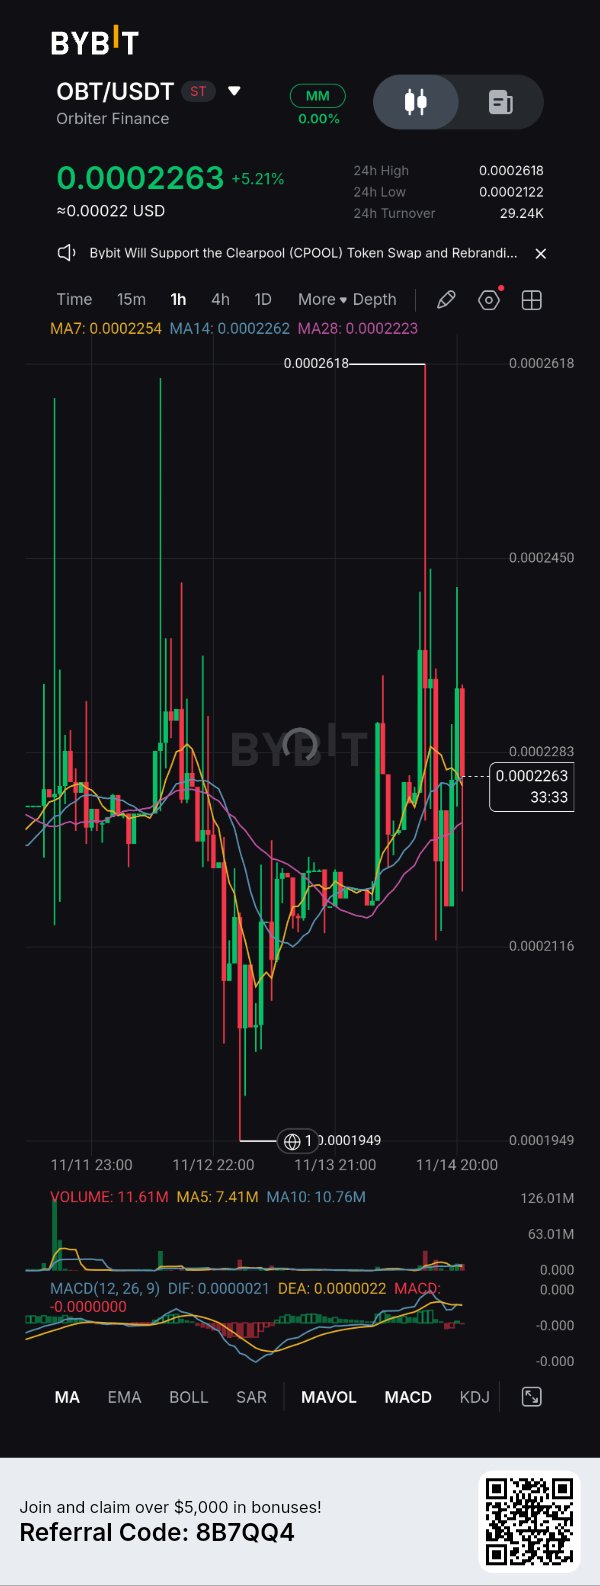
Aprendí una de las lecciones más caras de las criptomonedas durante la caída del mercado de 2022: tener razón sobre un token no significa nada si tu gestión de riesgos es incorrecta. Ver cómo desaparecían las ganancias y las posiciones se hundían me enseñó algo que nunca olvidé. Nunca dejes que la convicción se convierta en una excusa para ignorar el gráfico. Es exactamente así como estoy abordando $OBTUSDT hoy. En 0,0002263 $, OBT está mostrando señales de recuperación, pero no confundo un rebote del 5,21 % con una ruptura confirmada. Esto es lo que estoy observando en el gráfico de 1H: - Soporte inmediato: 0,0002223 $–0,0002254 $. - Nivel crítico a la baja: 0,0002122 $. - Resistencia principal: 0,0002283 $, seguido de 0,0002450 $. - Zona clave de invalidación: 0,0001949 $. Mi estrategia es sencilla: esperar la confirmación, ajustar el tamaño de las posiciones de forma responsable y definir mi salida antes de entrar. Si los compradores recuperan la resistencia con un volumen convincente, consideraré la continuación alcista. Si el soporte falla, no lucharé contra el mercado. He aprendido que proteger el capital también es una victoria en el trading. El mercado te bajará los humos, pero una buena gestión de riesgos te mantiene en el juego. #ByXIMPACT #WSOT2026
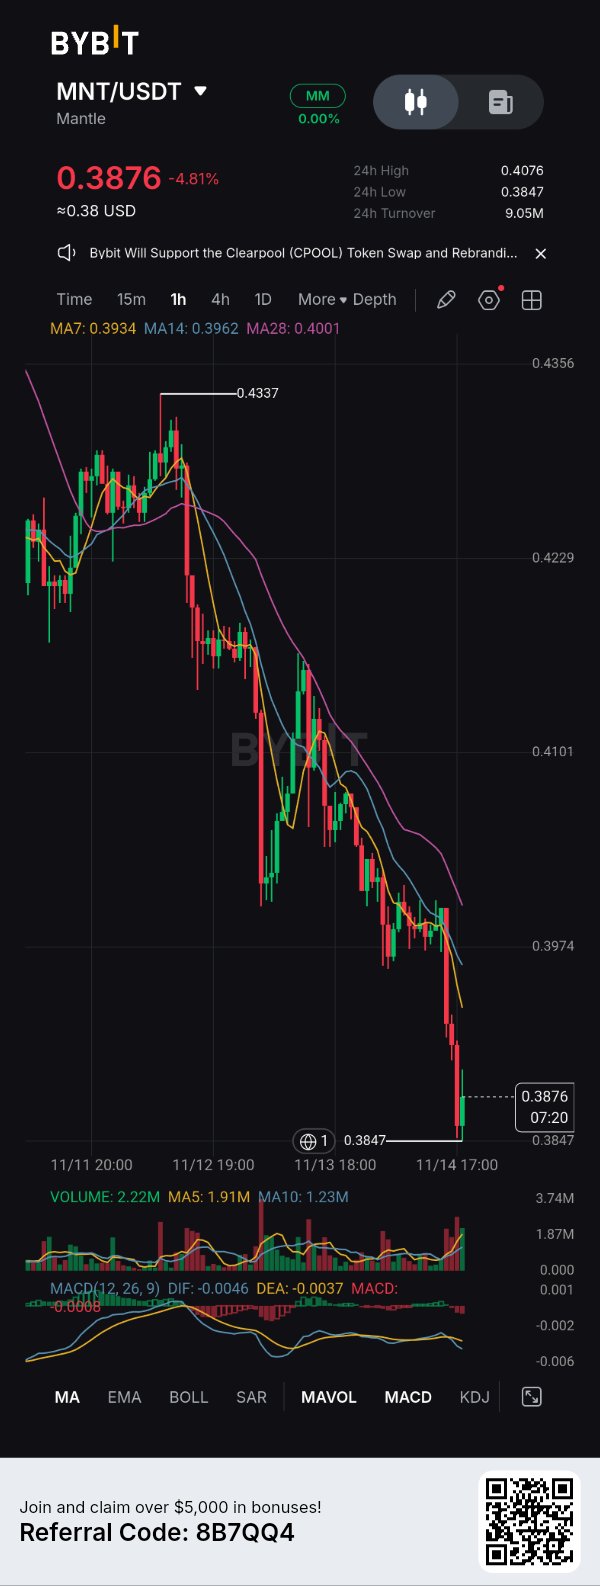
Everyone is either a maxi or a hater when it comes to $MNTUSDT . Both are wrong. I don't think Mantle deserves blind confidence, but I also don't think one ugly price movement tells the entire story. Here's where I stand. The bulls have a point: MNT is showing signs of buying interest around $0.3847, with volume reaching 2.22M. That suggests traders are still reacting to this support zone. But the bears aren't imagining things either. MNT currently trades at $0.3876, down 4.81%. More importantly, price sits below all three moving averages: MA7 ($0.3934), MA14 ($0.3962), and MA28 ($0.4001). MACD remains negative, confirming bearish momentum. My thesis? The short-term trend is bearish, but $0.3847 is the level I'm watching. A breakdown could invite further downside. A sustained recovery above $0.4001 would make me reconsider. I'm watching confirmation, not narratives. #ByXIMPACT$MNTUSDC
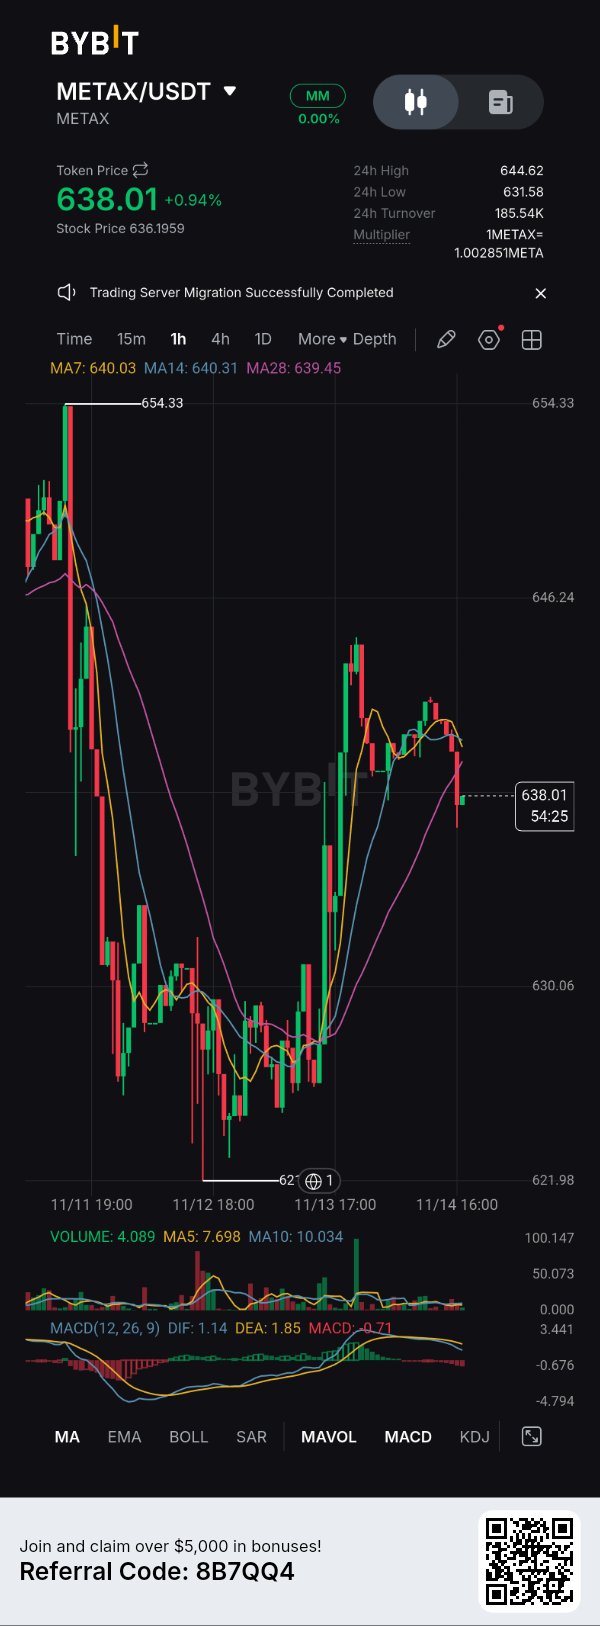
$METAXUSDT Cuando analicé METAX por primera vez, mi tesis era que la recuperación desde su zona de consolidación más baja podría convertirse en un movimiento alcista más fuerte. Esa parte se cumplió. Lo que subestimé fue lo agresivamente que los vendedores defenderían los precios más altos. El gráfico de 1H nos ofrece ahora un panorama interesante. METAX se recuperó desde aproximadamente 621,98 $, subió hacia los 654,33 $ y actualmente cotiza alrededor de los 638,01 $. Es una recuperación significativa, pero el reciente rechazo muestra que los compradores no han asegurado el control por completo. Veo otro detalle importante: las medias móviles de 7, 14 y 28 periodos están agrupadas alrededor de los 639–640 $, mientras que el MACD se ha vuelto negativo, lo que sugiere que el impulso a corto plazo se está enfriando. Hay cierta satisfacción al ver cómo se materializa la tesis de recuperación, pero también humildad al reconocer que el timing y la resistencia importan tanto como la dirección. Mi enfoque actual: no voy a añadir más posiciones a 638 $. Esperaré a que recupere los 644,62 $ de forma convincente antes de considerar aumentar mi exposición. Una ruptura por debajo de 631,58 $ me obligaría a reevaluar la configuración alcista. El mercado premia el pensamiento actualizado, no las predicciones obstinadas. #ByXIMPACT #WSOT2026 $NVDAXUSDT
BR/USDT: Me equivoqué por completo con esta.
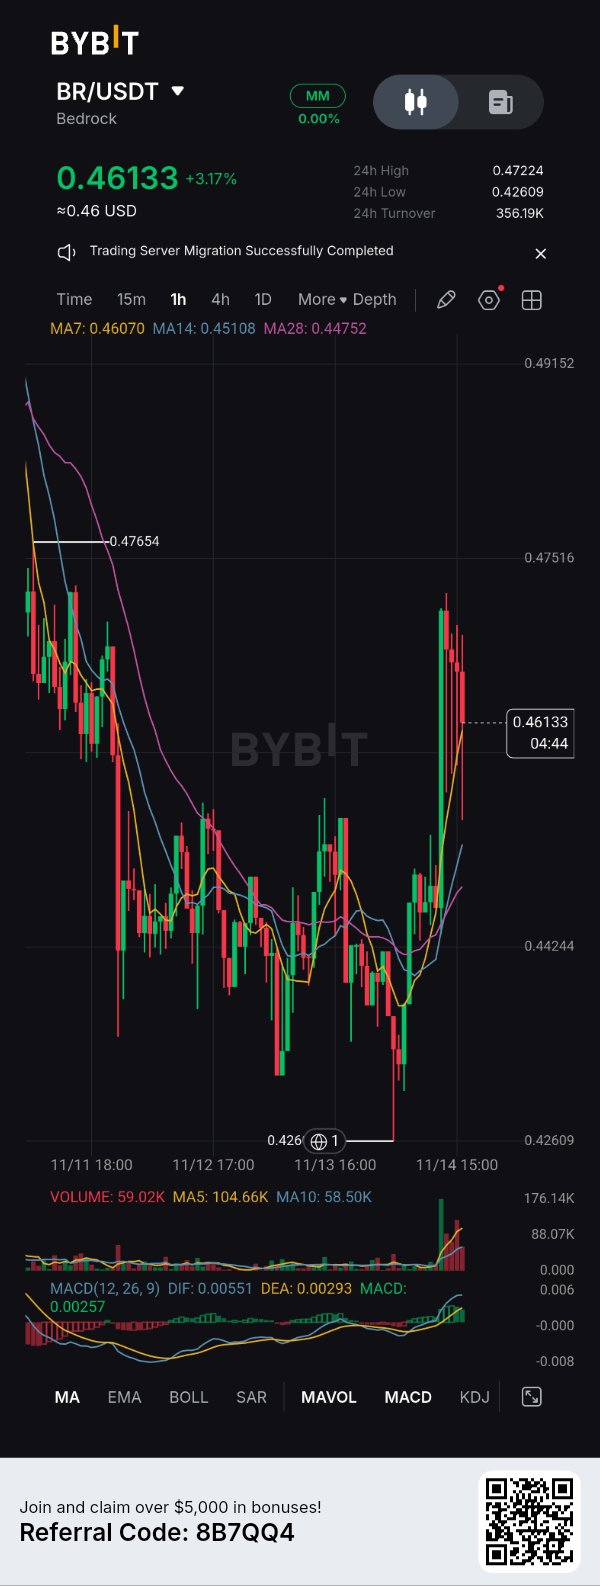
Antes solía descartar $BRUSDT como otro token impulsado por el hype. Cada vez que veía que ganaba atención, mi primer instinto era buscar razones para ponerme en corto. Pensaba que la emoción acabaría desvaneciéndose. Entonces, el gráfico me obligó a reconsiderar. En la temporalidad de 1H, BR rompió su consolidación prolongada alrededor de 0,4424$ y subió hasta 0,47224$. Lo que me llamó la atención no fue solo el movimiento del precio; fue la repentina expansión en el volumen de trading acompañando la ruptura. El MACD también se volvió alcista, con el DIF cruzando por encima de la DEA. Sinceramente, ver ese movimiento inicial sin una posición fue frustrante. Había pasado demasiado tiempo defendiendo mi opinión original en lugar de responder a lo que el mercado me estaba mostrando realmente. Mi sesgo ha cambiado. Ahora estoy atento a una posible continuación hacia 0,4765$, siempre y cuando los compradores defiendan la estructura de ruptura. Mi tesis alcista pierde validez si BR pierde los 0,4424$ en un cierre confirmado de 1H. He aprendido algo importante: el mercado no premia las opiniones obstinadas. Premia a los traders que saben cuándo actualizarlas. A veces, el mayor error en el trading no es entrar tarde. Es negarse a admitir que te equivocaste. #IMPACTbyTrade #WSOT2026 #WSOTMuestraTuOperaciónConIAParaGanar10USDT $BERAUSDT

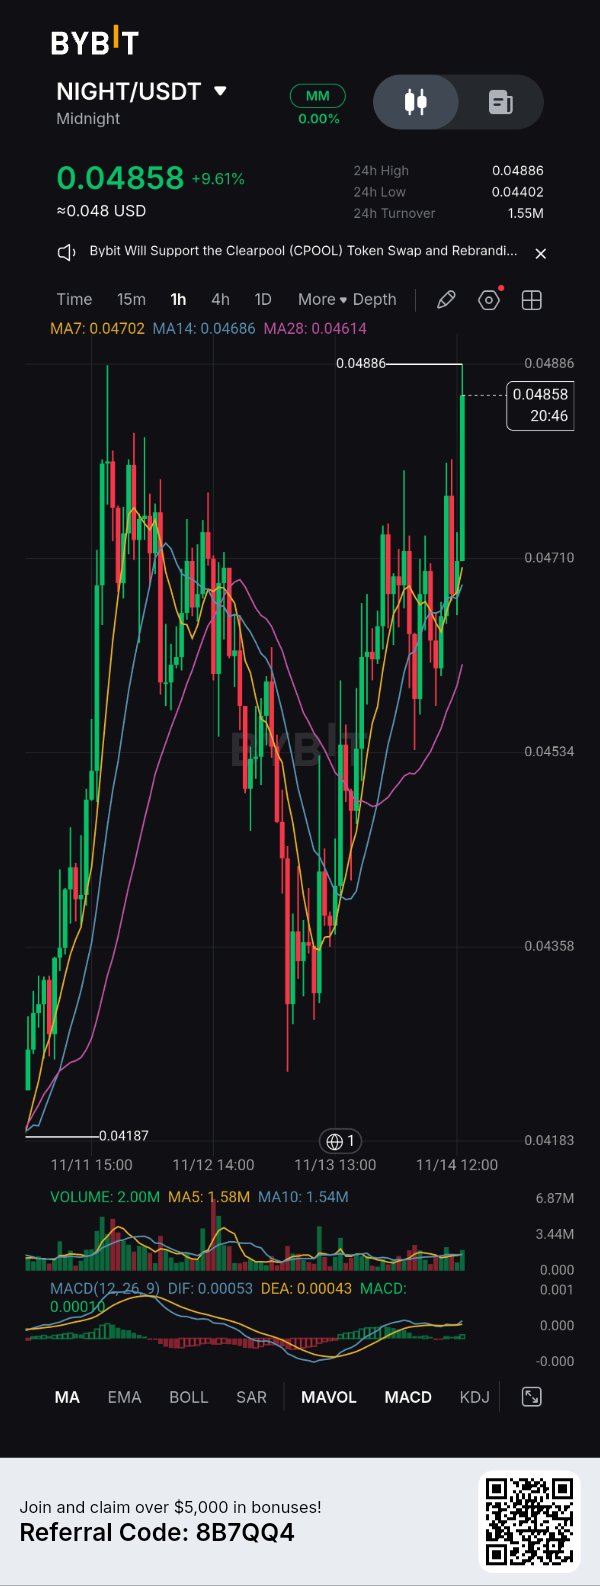
$NIGHTUSDT - No suelo hacer shill, pero he estado usando Clearpool tranquilamente y su rebranding a NIGHT en Bybit acaba de llegar a mi radar. Si pudiera explicarle este swap de tokens a mi yo principiante de 2021, le diría que es como si tu restaurante favorito cambiara de nombre pero mantuviera a los mismos chefs. Mi yo del pasado habría vendido por pánico con la noticia y habría cometido el error de pensar que un cambio de ticker significaba empezar de cero. Honestamente, siento un poco de frustración por haberme perdido el suelo en 0,04187, pero pura emoción viendo este breakout. Mi escenario base para los próximos días es una prueba de nuevos máximos locales. El gráfico de 15m muestra a NIGHT con una subida del +9,61% en 0,04858, rompiendo la resistencia de 0,04886 con volumen confirmando el movimiento (2,00M frente a la MA5 de 1,58M). ¿Mi advertencia sincera? Las migraciones de tokens pueden causar confusión temporal de liquidez. Mi tesis queda invalidada si perdemos el soporte de la MA7 en 0,04702. Conclusión: No dejes que la ansiedad por migraciones pasadas te ciegue ante un fuerte momentum. (NFA, ¡haz siempre tu propia investigación!) $ByXIMPACT
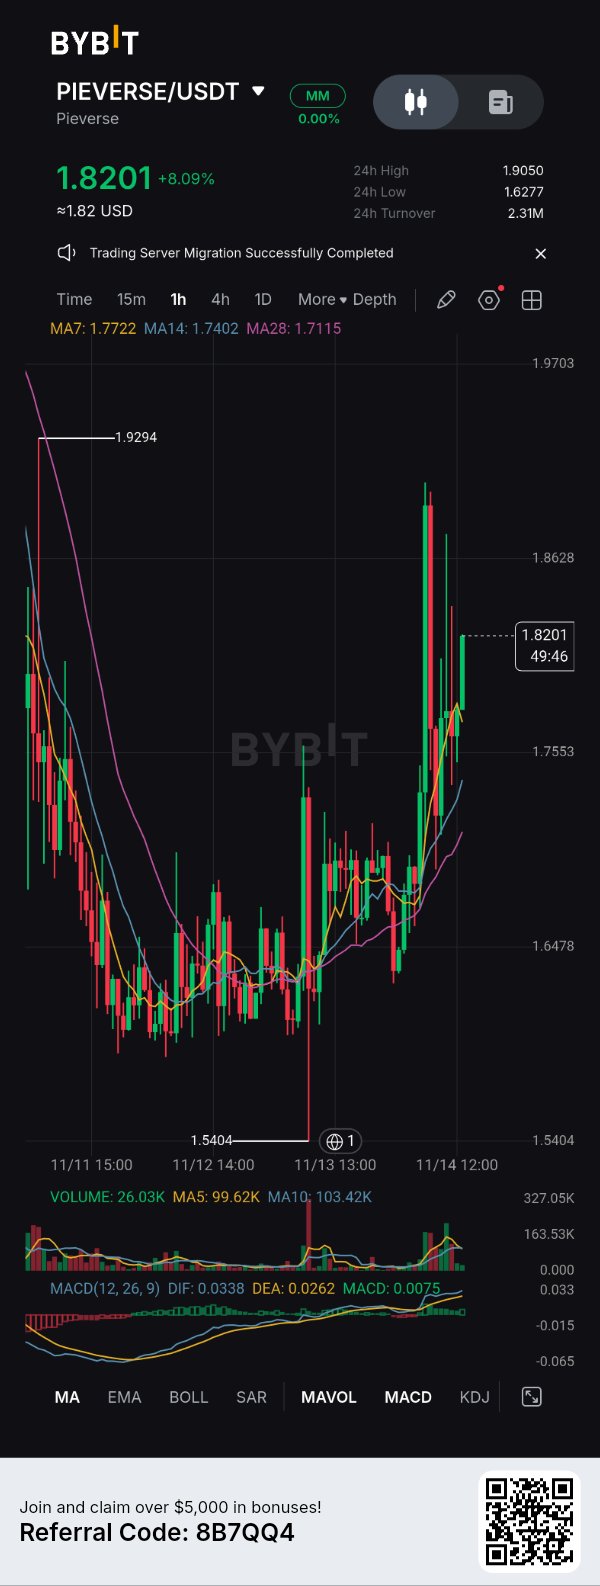
$PIEVERSEUSDT -I didn't get into crypto just to chase green candles or celebrate every time a token pumps. I'm here because I believe in financial opportunity, understanding emerging technology, and learning how markets actually work. But I have three values I refuse to compromise: 1. Discipline Over Emotions. I won't let FOMO push me into trades. A missed opportunity is better than a poorly planned entry. 2. Knowledge Over Hype. I want to understand what I'm buying, why the market is moving, where liquidity sits, and what could invalidate my thesis. 3. Patience Over Quick Profits. Not every candle deserves a position. Sometimes the smartest trade is waiting for confirmation. MY BIGGEST BOUNDARY? I refuse to gamble with money simply because everyone on social media is shouting that a token will go to the moon. No blind entries. No revenge trading. No pretending every prediction will be right. Why am I here? Because I want to build something meaningful through knowledge, consistency, and better financial decisions. I know the journey won't always be profitable, but every experience should make me a better market participant. PIEVERSE moving +8% is interesting, but one green candle doesn't define a good trader. My goal isn't to catch every pump. It's to develop the discipline to recognize quality opportunities and survive long enough to take advantage of them. I don't trade for excitement. I trade with a plan. The market doesn't owe me profits. I owe myself discipline. #CryptoTrading #TradingPsychology #Bybit #CryptoMindset #IMPACTbyTrade #WSOT2026 #WSOTShowYourAITradeToEarn10USDT
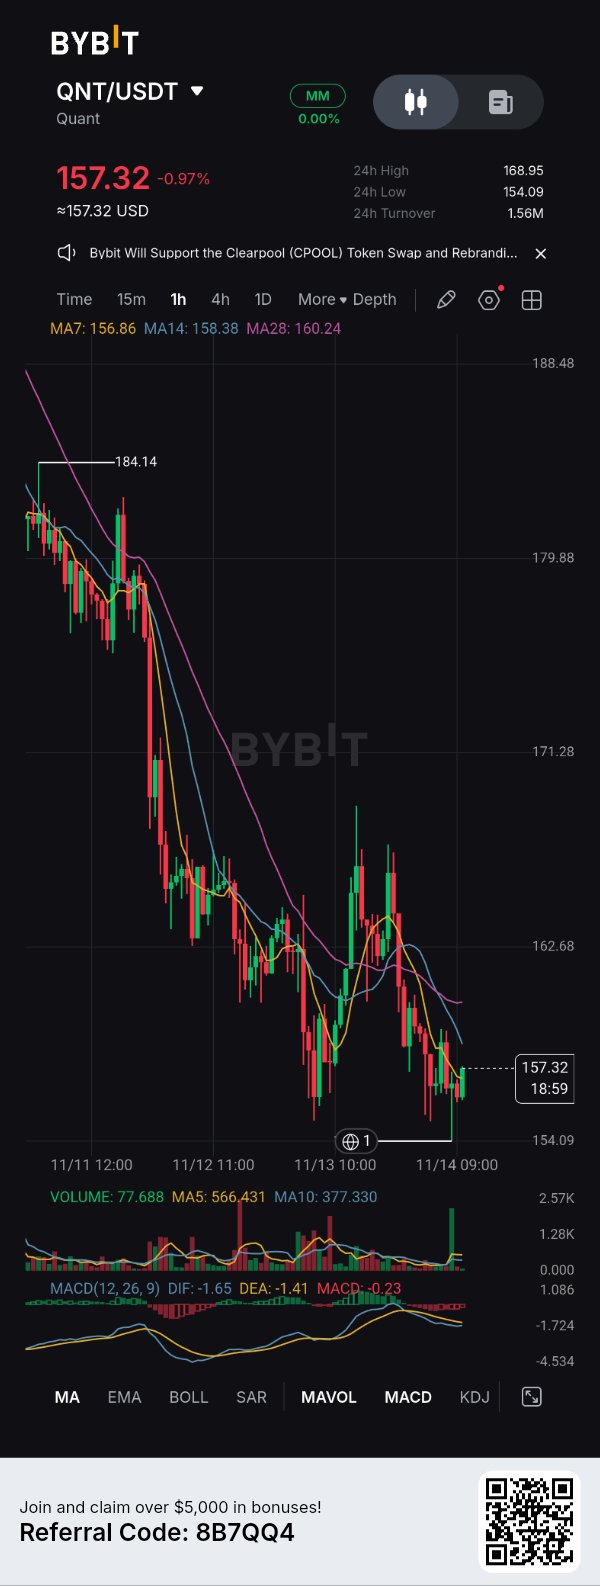
$QNTUSDT — A Conversation I Wish I Had With My Past Self. 🧠 Me in 2024: Why are you hesitating? QNT is already at $157.32. It has dropped significantly. This is obviously the perfect opportunity to buy the dip. The bounce is coming! Me now: That's exactly how I used to lose money. A falling price doesn't automatically mean a buying opportunity. Me in 2024: But look! It bounced from $154.09. Surely that's confirmation? Me now: Not yet. Look at the 1H chart. Price is still below MA14 ($158.38) and MA28 ($160.24). The broader structure remains bearish, and MACD is still negative. Me in 2024: So you're not buying? Me now: I'm watching. $154.09 is the immediate support I'm monitoring. If buyers defend it and price reclaims $158.38–$160.24 with convincing momentum, I'll reconsider a long position. If support breaks, I'll watch for further downside rather than trying to catch a falling knife. Me in 2024: You've become too cautious. Me now: No. I've become more disciplined. I no longer trade because I want the market to move in my direction. I trade when the market gives me evidence. THE ONE RULE I FOLLOW NOW: Never confuse a price drop with a trading opportunity. Let confirmation come before commitment. Sometimes the most profitable trade is the one you have the discipline not to take. #QNT #QNTUSDT #CryptoTrading #TradingPsychology #Bybit #ByXIMPACT

SUI: El momento en el que dejé de ir contra la tendencia. 📉
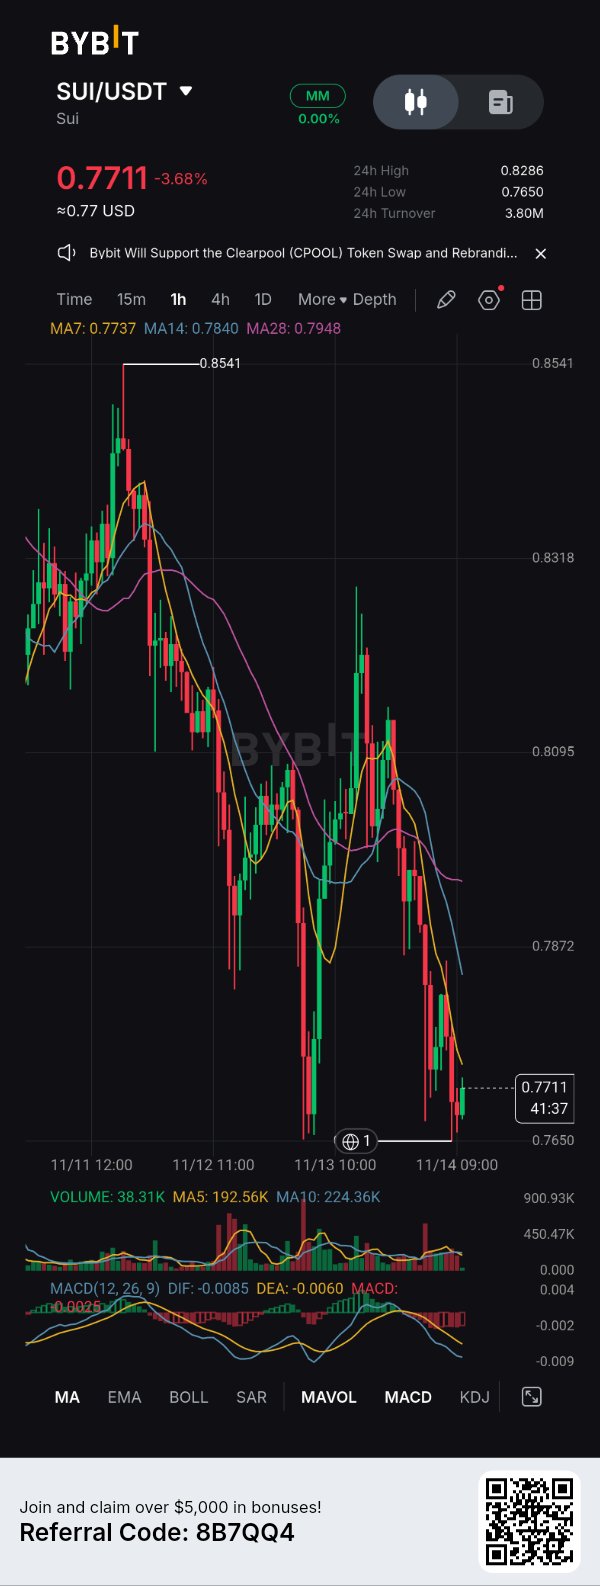
Antes solía pensar que siempre que una moneda caía significativamente, la mejor oportunidad era comprar la caída antes de que el resto notara la reversión. $SUIUSDT me recordó hace poco por qué ese pensamiento puede salir caro. Al mirar el gráfico de 1H, noté algo importante. El precio cotizaba alrededor de 0,7711 $, un 3,68 % abajo, tras haber caído desde la zona de 0,85 $. Pero lo que llamó mi atención no fue solo el descenso. Fue la estructura. Las medias móviles de 7, 14 y 28 estaban todas posicionadas por encima del precio, lo que mostraba que los vendedores seguían teniendo el control. El MACD también estaba en territorio negativo. ¿Mi punto de inflexión? Ver cómo SUI se acercaba al área de soporte de 0,7650 $ sin ver pruebas convincentes de una reversión alcista. Sentí la tentación de anticipar un rebote, pero me recordé que barato no significa automáticamente infravalorado. Así es como estoy abordando SUI ahora: - Soporte: 0,7650 $ - Resistencia inmediata: 0,7737 $ – 0,7840 $ - Resistencia más fuerte: 0,7948 $ - Confirmación alcista: Recuperar la resistencia con un fuerte volumen de compra. - Continuación bajista: Perder los 0,7650 $ de forma convincente. He cambiado una cosa sobre cómo opero: ya no entro simplemente porque un precio parece atractivo. Espero a que el mercado me dé una razón. Mi mayor lección: proteger el capital también es una victoria en el trading. A veces, la operación más inteligente es aquella por la que esperas pacientemente. ¿Cuál es tu enfoque con SUI ahora mismo? ¿Comprar en la caída o esperar confirmación? #ByXIMPACT #WSOT2026 #WSOTMuestraTuOperaciónConIAParaGanar10USDT #Las pruebas de salida de Jensen Huang del liderazgo en IA de Nvidia
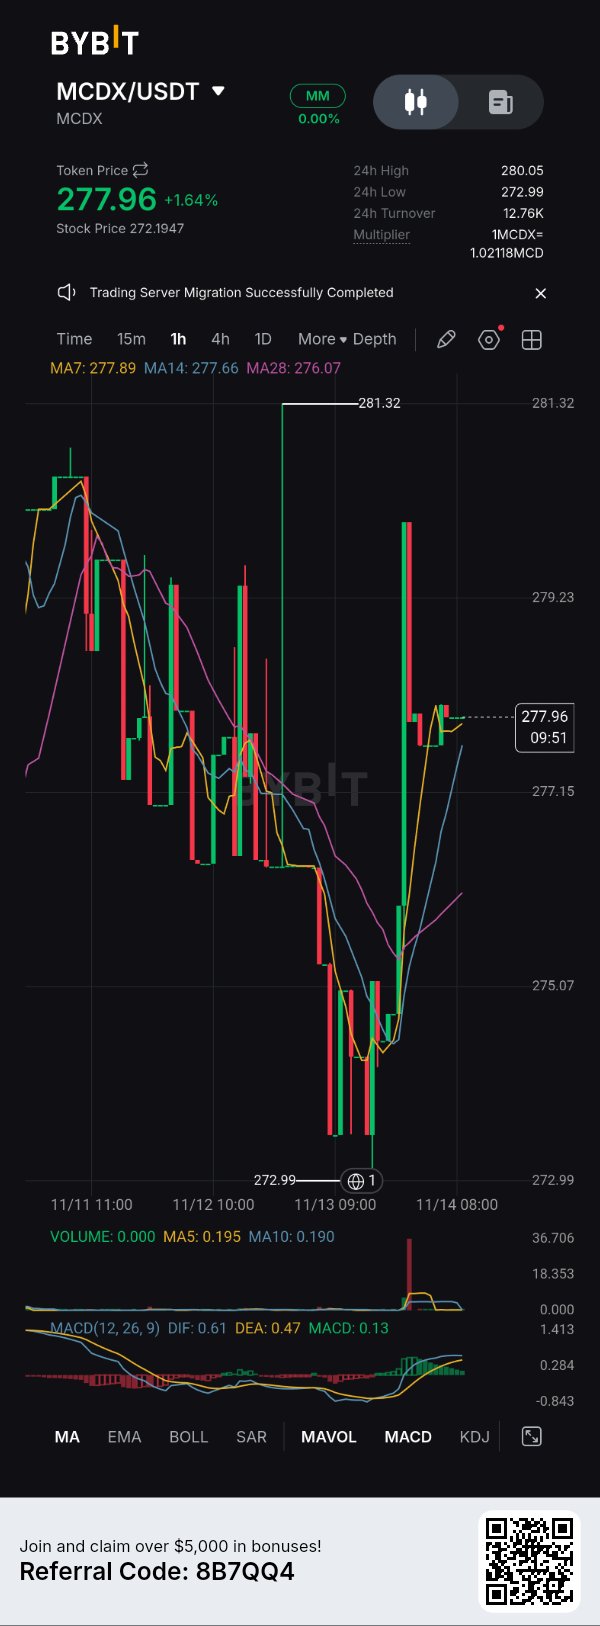
I used to believe that whenever a token printed a massive green candle after a heavy decline, it was confirmation that a bullish reversal had started. But watching $MCDXUSDT on the 1H chart reminded me why that assumption can be dangerous. Here's what I observed: 1. A sharp recovery isn't automatically a trend reversal. MCDX dropped towards $273 before recovering to $277.96. That's a strong bounce, but it doesn't automatically erase the previous selling pressure. 2. Volume needs context. A sudden volume spike can indicate aggressive buying, but traders still need to establish whether buyers can sustain that momentum. 3. Indicators need confirmation. The MACD has moved into positive territory, while the moving averages are beginning to recover. Encouraging signs, but not a guaranteed bullish continuation. The misconception: A big green candle tells you the market has reversed. The reality: It tells you that buying pressure has increased. Whether that pressure can sustain a new trend is a different question. My practical takeaway? I no longer chase a green candle simply because it looks impressive. I wait for confirmation, watch how price reacts around resistance, and pay attention to volume. Remember: A bounce is an opportunity to investigate, not an invitation to enter blindly. What's more dangerous in trading: missing a rally or entering a fake reversal? #ByXIMPACT $METAXUSDT #WSOT2026 #WSOTShowYourAITradeToEarn10USDT #JensenHuangExitTestsNvidiasAILeadership
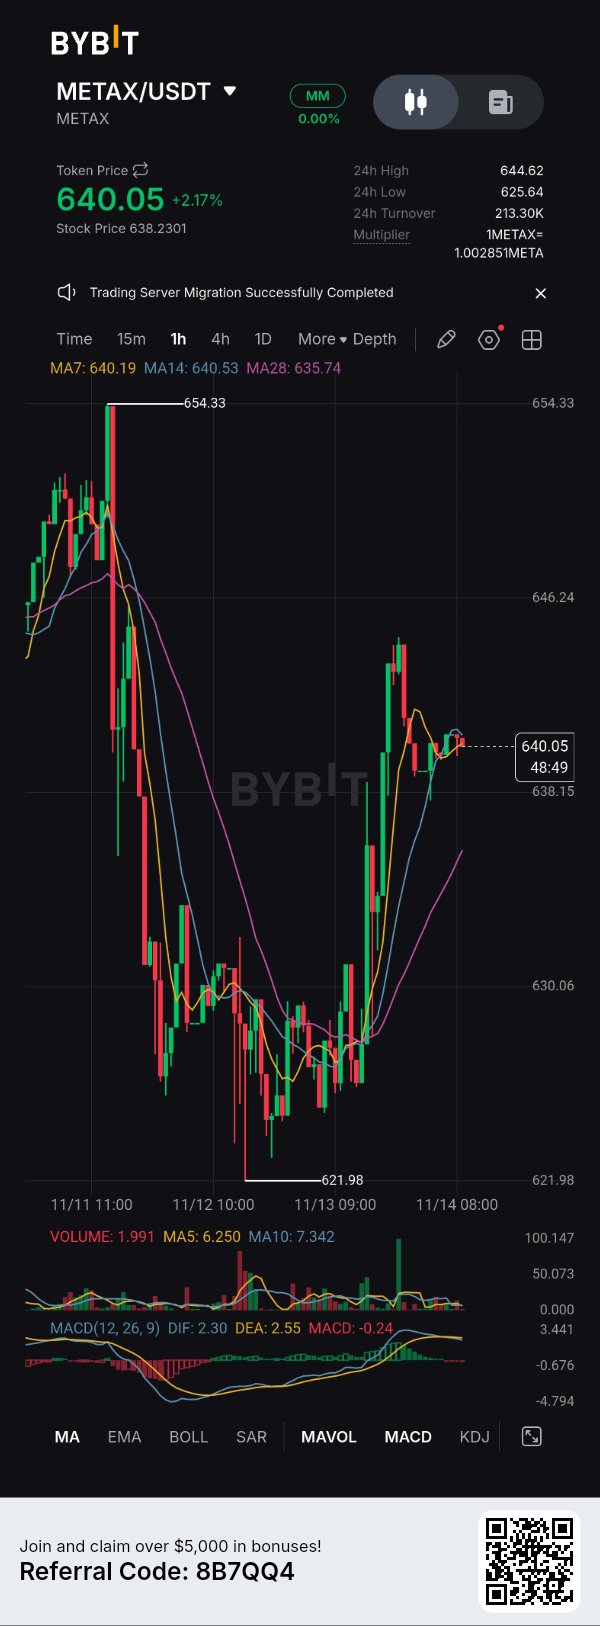
Everyone on Crypto is looking at this $METAXUSDT 15m chart and screaming the same thing: "The consensus is that the massive V-shaped bounce from 621.98 back to 640 proves the bulls are fully back in control. The dip was just a liquidity sweep, and we are heading back to 654!" I’m here to tell you that view is only half true. Yes, the bounce was aggressive. But my view is that this is a classic lower-high setup designed to trap retail longs before another leg down. We are looking at a textbook bull trap, not a trend reversal. Here are 3 reasons why I’m fading this rally: 1. The MA Pinch: Look at the moving averages. The MA7 (640.19), MA14 (640.53), and MA28 (635.74) are completely bunched up right at current price. This isn't bullish momentum; this is extreme indecision and heavy dynamic resistance. Price is struggling to break cleanly above the MA14. 2. MACD is Lethargic: Despite the massive price spike, the MACD (12, 26, 9) is completely flat. We have a bearish DIF (2.30) and DEA (2.55) with the histogram remaining in the red. The momentum is diverging negatively from the price action. 3. Market Structure: The local top was 654.33. The recent bottom was 621.98. The current bounce to 640 leaves us in the middle of a massive chop zone. The "V-shape" is just shorts taking profit; there is no real structural break of the downtrend yet. The Strongest Counterpoint: To play devil's advocate, the buying volume on the way up from 621 wasn't weak. The volume bars at the bottom show some aggressive green spikes, suggesting real spot buying interest defending the 620 level. If that volume continues to compound, it could overwhelm the moving averages. What would change my mind? I will flip fully bullish and eat my words if we get a confirmed 15m candle close above the 646.24 resistance zone, accompanied by a bullish MACD crossover and rising volume. Until then, I'm scalping shorts into these local pumps. Trade safe. Don't get chopped up in the middle. #IMPACTbyTrade

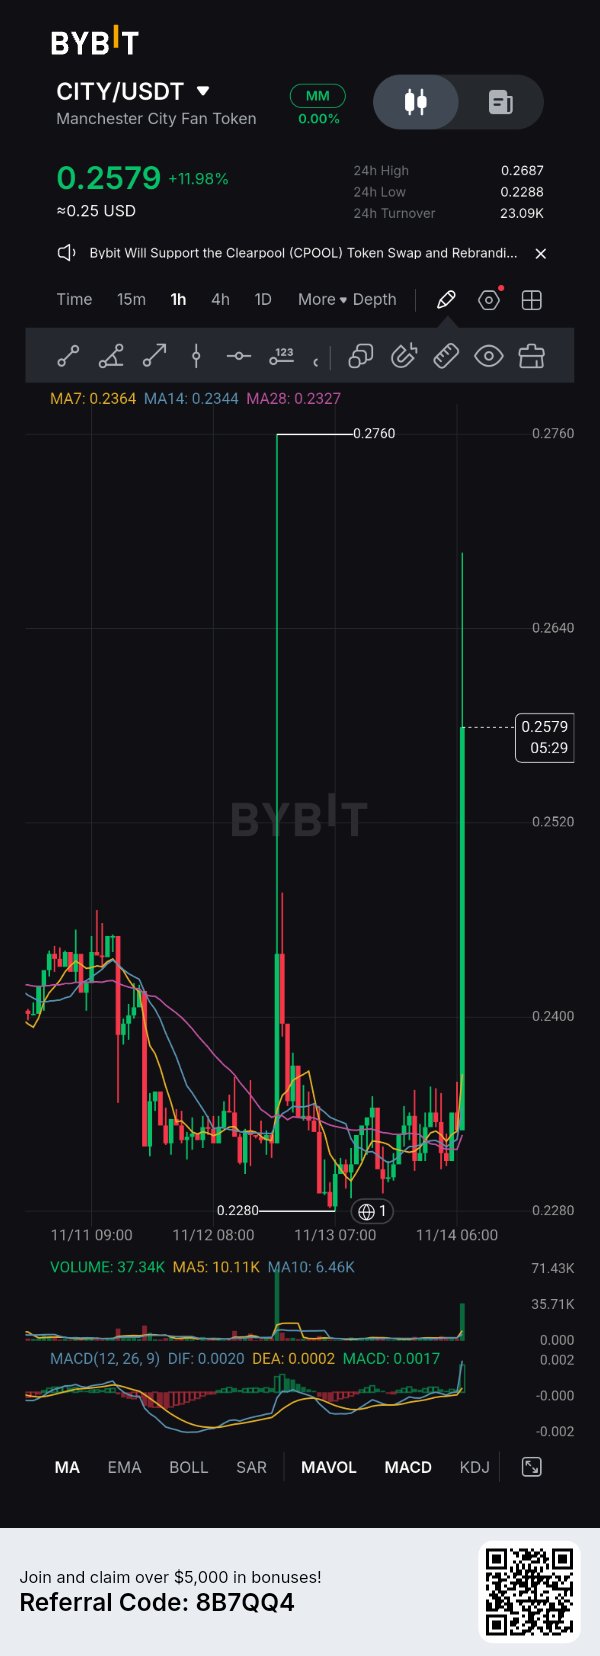
I've been paying closer attention to $CITYUSDT , and today's market activity gave me something interesting to work with. Here's what I'm seeing from the builder's perspective. 1. What I Shipped I completed another round of market observation around CITY/USDT, focusing on price behaviour, momentum, and trading activity. The numbers caught my attention: - Current price: $0.2579 - 24-hour gain: +11.98% - 24-hour high: $0.2687 - 24-hour low: $0.2288 That's a significant move after a period of relatively tight consolidation. 2. What Broke My biggest challenge was separating genuine momentum from short-lived excitement. CITY printed a massive bullish candle, but the upper wick approaching $0.2760 shows that buyers haven't had a completely smooth ride. A breakout is interesting. Sustaining it is the real challenge. 3. What I Learned One lesson stood out: volume matters. The displayed candle volume reached 37.34K, compared with a 5-period average of 10.11K. That's a substantial increase in activity. However, increased activity doesn't automatically guarantee continuation. I want to see whether buyers can defend the breakout rather than immediately surrendering the move. 4. What's Next? My next step is to monitor the $0.2520–$0.2400 region. If CITY holds above this area and builds acceptance, I'll be watching for another attempt towards $0.2687 and potentially $0.2760. If momentum fades, I'll reassess rather than force a bullish narrative. My biggest takeaway: Building conviction requires more than celebrating green candles. It means documenting what works, admitting what doesn't, and staying curious when the market challenges your assumptions. I'm still learning, still observing, and still building. The goal isn't to predict every move. It's to understand the market better with every move. What's your biggest concern with CITY right now: sustaining this breakout or overcoming the $0.2687 resistance? Market observations, not financial advice. #ByXIMPACT #WSOT2026 #WSOTShowYourAITradeToEarn10USDT #JensenHuangExitTestsNvidiasAILeadership #USPPITestsTheHigherForLongerTrade $GOOGLXUSDT
I Stopped Fighting the Downtrend. Here's Why. 📉
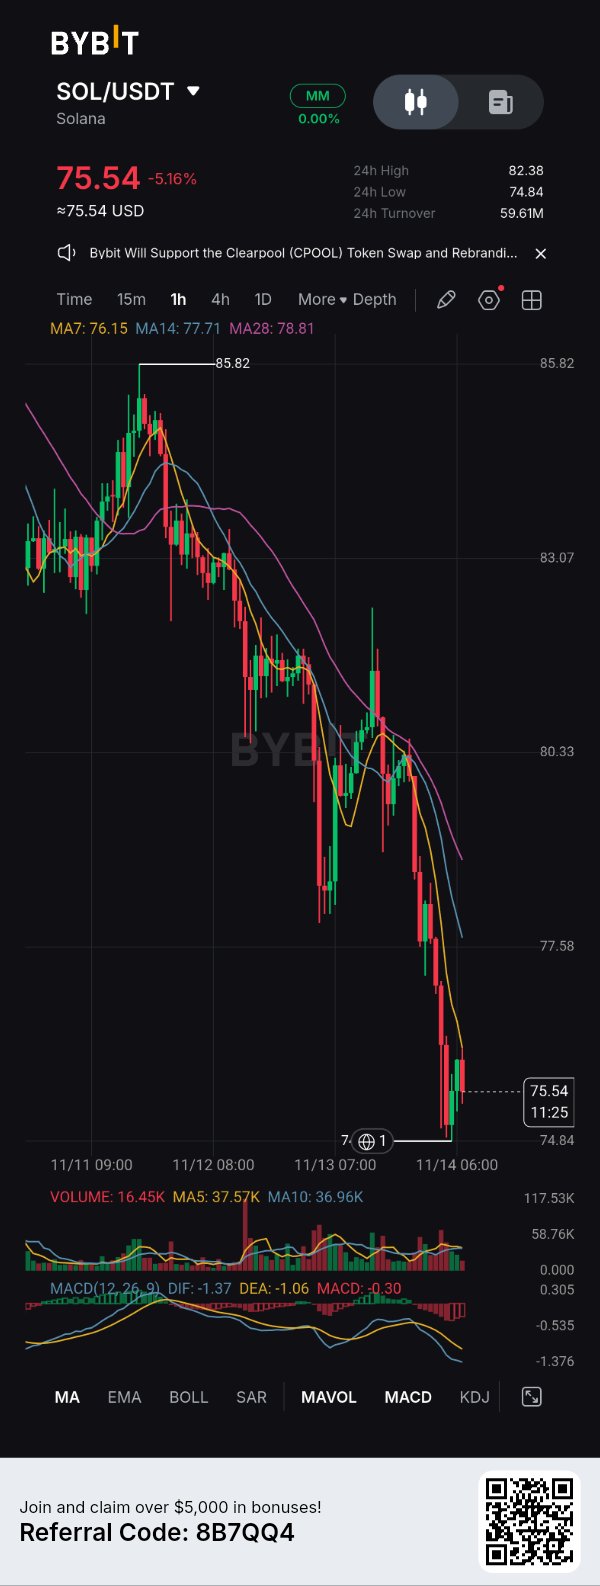
I was watching $SOLUSDT closely, and one thing became increasingly difficult to ignore: the sellers were controlling the market. My bearish thesis wasn't based on one red candle. It was built around the bigger picture. SOL was trading at $75.54, down 5.16%, after falling from the $85.82 region. The 1H structure continued printing lower highs and lower lows. 1. My Market Thesis Three things caught my attention: - Price was trading below MA7 ($76.15), MA14 ($77.71), and MA28 ($78.81). - MACD remained negative, confirming bearish momentum. - The $77.58 region had become an important resistance area after the breakdown. For me, there was no convincing reason to fight the sellers yet. 2. My Entry and Exit Logic My preferred approach was to wait for a relief bounce into resistance before considering a short position. - Potential entry zone: $76.15–$77.58. - First downside target: $74.84. - Extended target: Below $74.84, if selling pressure continued. - Invalidation: A convincing recovery above $78.81. These were planned levels, not confirmed executed fills. 3. How I Felt During the Setup Honestly, watching SOL drop this aggressively creates a temptation to chase the move. But I reminded myself that missing an entry is better than entering emotionally at the bottom of an extended move. 4. What I'd Repeat I'd repeat my patience, my focus on market structure, and my decision to wait for price to approach resistance instead of blindly chasing red candles. 5. The Risk I Underestimated A sudden relief rally. After such an aggressive decline, short sellers can become crowded. A sharp recovery could squeeze late sellers before the bearish trend resumes. My takeaway: The market doesn't reward impatience. Sometimes the best trading decision is waiting for price to come to your level rather than chasing where it has already been. What's more important to you when trading a breakdown: momentum confirmation or a retest of resistance? This is my personal trading journal, not financial advice. #ByXIMPACT $SOLUSDC

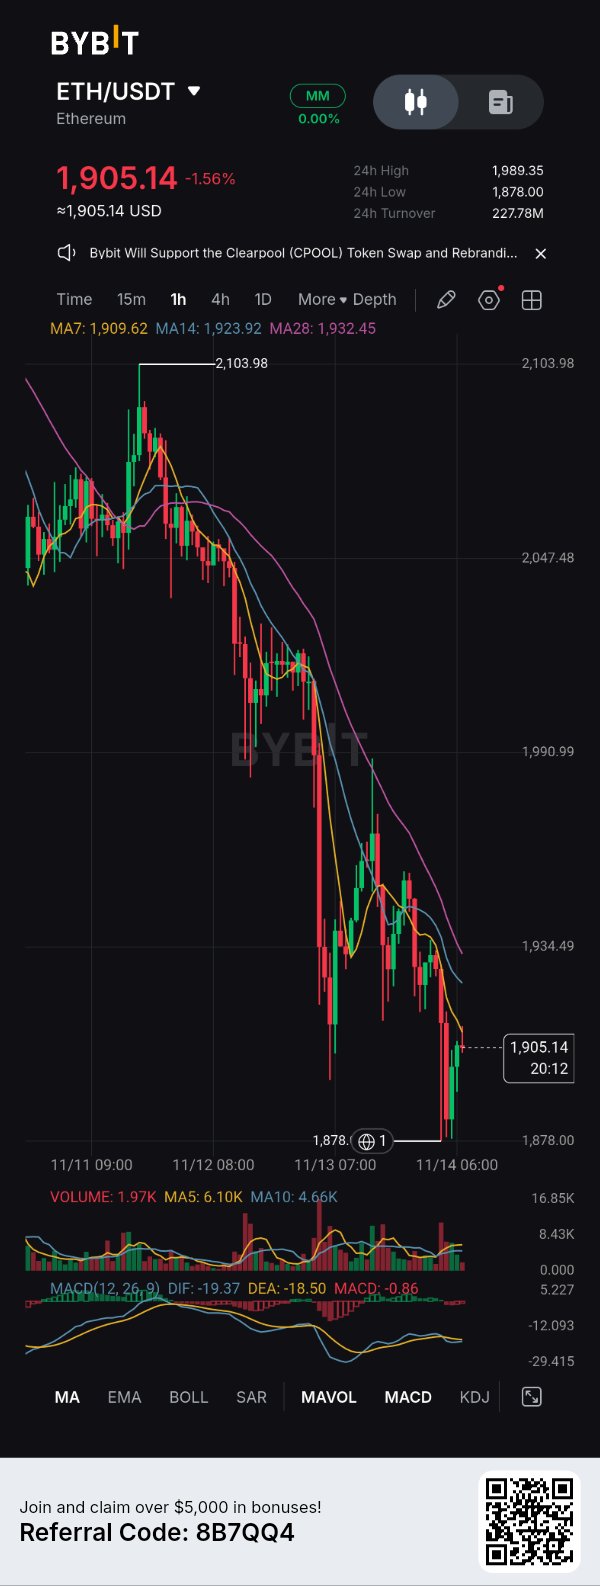
I initially thought $ETHUSDT had enough strength to defend the $1,930 region and attempt another recovery. I expected buyers to step in and turn the pullback into a continuation move. But the market had a different plan. Looking at the current ETH/USDT structure, a few things changed my mind: 1. The trend is still bearish: ETH is trading around $1,905, below MA7 ($1,909), MA14 ($1,923) and MA28 ($1,932). That's not the recovery structure I was expecting. 2. Sellers remain in control: The chart continues printing lower highs and lower lows. Previous recovery attempts have struggled to produce meaningful upside momentum. 3. $1,878 is the level I'm watching: This is the recent swing low. A decisive breakdown could expose ETH to another leg down. 4. MACD isn't convincing yet: Momentum remains negative, so I'm not rushing to call this a bullish reversal. I'll be watching two scenarios: - Bullish: ETH reclaims $1,923–$1,934 and establishes support above that zone. - Bearish: ETH loses $1,878, opening the possibility of further downside. Honestly, there's a certain frustration in watching a setup you believed in fail. But I'd rather admit I'm wrong than defend a bias the market has already invalidated. My biggest lesson: Never become emotionally attached to a direction. Let price action prove your analysis, and when the evidence changes, change your position. The market doesn't reward stubbornness. It rewards discipline. What's your current ETH bias: recovery or another breakdown? 👇 #ByXIMPACT
$BTCUSDT Loses $67,000, Over $1.3 Billion in Longs Liquidated, Yet Short-Term Holders Are Still "Holding the Line" According to Bybit market data, BTC is currently at 67,241.5 USDT, down 1.47% in 24 hours, with an intraday low of 66,448.6. Measured from the peak of 74,822.9, this pullback has already exceeded 11%. 📉 News Drivers: A Four-Fold Pressure Stack This decline is not driven by a single factor. Over the past 24 hours, roughly $1.3 billion** in crypto long positions were forcibly liquidated, triggering a cascade of selling. At the same time, institutional capital is retreating — BlackRock's IBIT saw over **$2 billion in net outflows across nine consecutive sessions through Wednesday, and on November 13 alone, IBIT bled $143.5 million** while Fidelity's FBTC saw **$41.9 million leave. On the macro front, hotter-than-expected CPI has reinforced expectations of another Fed rate hike, while Nvidia's post-CEO-resignation stock plunge has dampened risk appetite across tech and crypto alike. 📊 Technical Picture: Key Support Is Being Tested On the chart, BTC has broken below the multi-month 73,000–75,000 support zone and is now battling around 67,000. According to 21Shares strategist Matt Mena, a sustained drop below $69,000** opens the door to a test of **$65,000 support. To the upside, reclaiming $70,000** would be the first step toward recovery, but **$74,000 is the level needed for a sustained rebound. Momentum indicators show oversold conditions, but the MACD death cross remains in place, keeping selling pressure intact. 🔍 A Notable Detail Despite the sharp sell-off, the 1.48 million BTC held by short-term holders in the 73,000–86,000 range saw a net decrease of only 34,000 coins — roughly 2.3% — indicating most did not panic-sell. Absorption was concentrated mainly at $68,000, where about 42,200 BTC were added. If 65,000–66,000 holds, this stubbornly held supply could become the base for a subsequent bounce; conversely, a decisive break below 65,000 could force these "diamond hands" to capitulate, triggering another wave of cascading liquidations. ⚡ Key Levels to Watch Two things to watch next: whether ETF flows can turn positive again, and the battle for 65,000. Until institutional buying clearly returns, treat any bounce as a repair rally rather than a trend reversal. ⚠️ The above is personal market observation, not investment advice. Leverage cuts both ways — position management should always take priority over directional calls. #ByXIMPACT $BTCUSDC

$LTCUSDT is Recovering, BUT I'M NOT READY TO BUY THIS RECOVERY. HERE'S WHY. I've learned something important about trading: not every green candle deserves my money. LTC has recovered from the $47.71 region and is currently trading around $48.80. That's encouraging, but when I look at the 1H chart, I see a market that hasn't fully convinced me that buyers are back in control. And I'm not going to pretend otherwise. 🔍 WHAT I'M SEEING ON THE CHART LTC/USDT — 1H Current price: $48.80 24H change: +1.08% 24H high: $50.11 24H low: $47.87 My moving-average readings: - MA7: $49.03 - MA14: $49.27 - MA28: $49.12 Here's my concern: Price is trading below all three moving averages. That means the recovery is approaching a resistance cluster where sellers could become active again. I want buyers to reclaim this zone before I consider a serious bullish position. ⚠️ WHY I'M NOT CONVINCED YET My MACD readings are: - DIF: -0.15 - DEA: -0.08 - Histogram: -0.07 Momentum is still negative. Volume is also relatively quiet: - Current volume: 1.26K - MA5: 2.01K - MA10: 1.99K For me, this is not enough evidence to chase the recovery. I want stronger participation, not just another temporary bounce. 🎯 HERE'S HOW I'M PLANNING MY TRADE I'm watching two possible opportunities. 🔴 MY FIRST PLAN: SHORT THE REJECTION If LTC climbs toward $49.03–$49.27 and gets rejected, I'll consider a short position. $LTCUSDC Potential EP: $49.05–$49.25 SL: $49.75 TP1: $48.30 TP2: $47.87 I want to see an actual bearish reaction before entering. 🟢 MY SECOND PLAN: BUY THE CONFIRMED RECOVERY I'm not ruling out the bulls. If LTC reclaims $49.27 and successfully retests that level with stronger volume, I'll reconsider my bearish outlook. Potential EP: $49.30–$49.40 SL: $48.85 TP1: $49.72 TP2: $50.11 If neither setup confirms, I'm staying out. 🧠 WHAT WOULD MAKE ME CHANGE MY MIND? A strong 1H close above the moving-average cluster, followed by a successful retest, would make me more interested in buying. But if sellers defend that zone again, I'll respect the weakness. I don't need to predict every move. I just need to recognize a good opportunity when the market presents one. MY FINAL POSITION I'm cautiously bearish until LTC proves otherwise. The $49.03–$49.27 region is my decision zone. I would rather wait for confirmation than become another trader buying the top of a temporary recovery. 🔥 LET ME ASK YOU SOMETHING: If you were trading LTC right now, would you SHORT the moving-average rejection or BUY only after a confirmed reclaim of $49.27? #LTC #LTCUSDT #Litecoin #Bybit #CryptoTrading #TradingStrategy#ByXIMPACT #WSOT2026 #WSOTShowYourAITradeToEarn10USDT #JensenHuangExitTestsNvidiasAILeadership

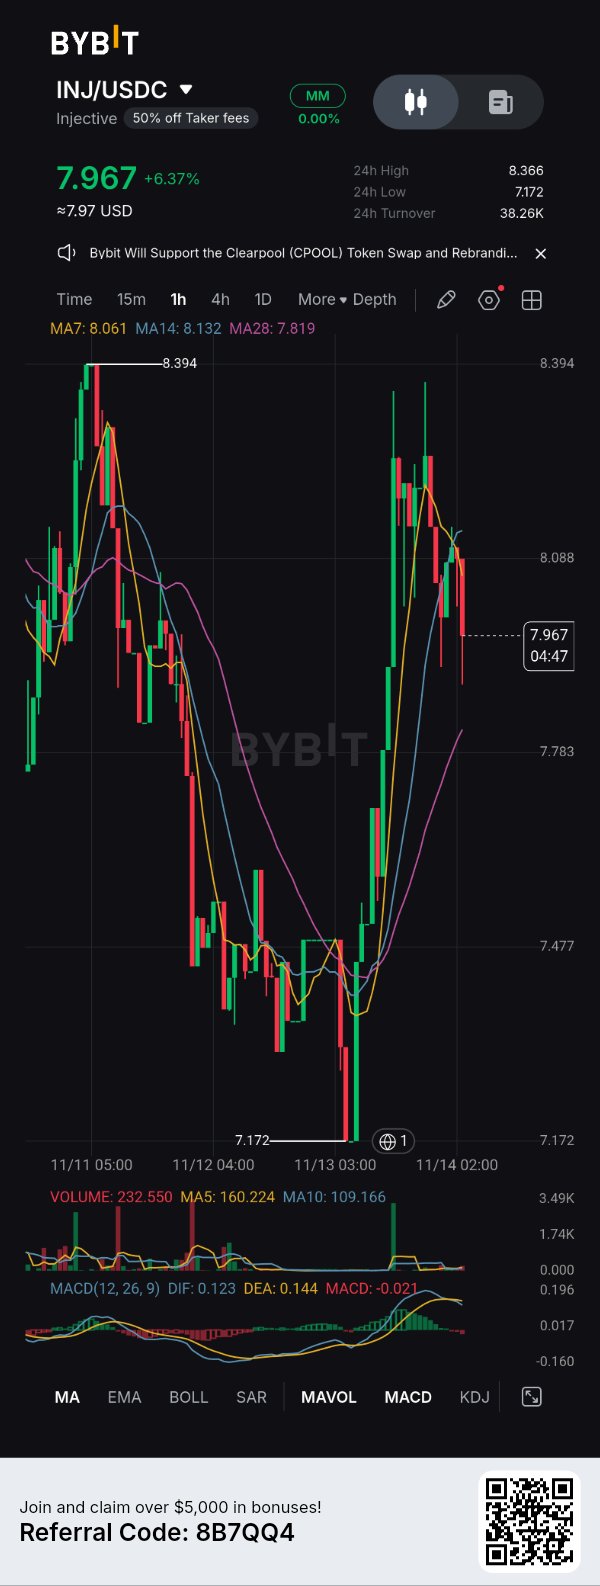
Si compraste $INJUSDT justo en el suelo, en 7,172, enhorabuena. Si estás mirando el gráfico ahora mismo y pensando en comprar esas velas verdes, tú eres la liquidez. INJ acaba de imprimir una violenta recuperación en forma de V, disparándose desde los 7,172 directos hasta los 8,10. Pero mira bien el gráfico de 1H: la música se ha acabado. Aquí tienes por qué el impulso inmediato se está desvaneciendo: 🔻 El rechazo: El precio se estrelló contra la zona de 8,10–8,13 (la MA14) y fue rechazado inmediatamente, formando un máximo más bajo en relación con el swing high de 8,394. 🔻 El giro del MACD: La línea MACD se ha cruzado a la baja y el histograma está imprimiendo barras rojas. La presión compradora agresiva se está agotando. 🔻 Ruptura de MA: El precio está cotizando actualmente por debajo de la MA 7 y la MA 14, derivando a la baja para probar un soporte más profundo. Esto no significa necesariamente que el mercado alcista haya muerto. Pero sí significa que el dinero fácil en posiciones largas ya se ha hecho en este tramo. Ahora, toca esperar a que el mercado muestre sus cartas. Los dos escenarios (elige tu bando) 🟢 El retest alcista (el mínimo más alto): Si esto es un cambio de tendencia real, los compradores intervendrán en la zona de 7,81–7,85 (la MA28). Si vemos una vela de rechazo alcista en 1H ahí, ofrece una entrada en largo con una relación riesgo-beneficio fantástica para volver a empujar hacia los 8,10. 🔴 El desglose bajista (el rebote del gato muerto): Si el soporte de 7,75 se desmorona, significa que el rebote en V fue solo una captación de liquidez para atrapar a los que entraron tarde en largo. Una ruptura aquí apunta a la zona de consolidación anterior, en 7,47. Conclusión No hagas FOMO en un gráfico de 1H que ya está perdiendo impulso. Deja que el precio llegue a un nivel estructural. Espera al retest de la MA28 o a la ruptura para confirmar tu entrada. ¿Vas a comprar esta caída esperando un mínimo más alto, o vas a esperar a que rompa por debajo de 7,75 para ir en corto? 👇. #ByXIMPACT
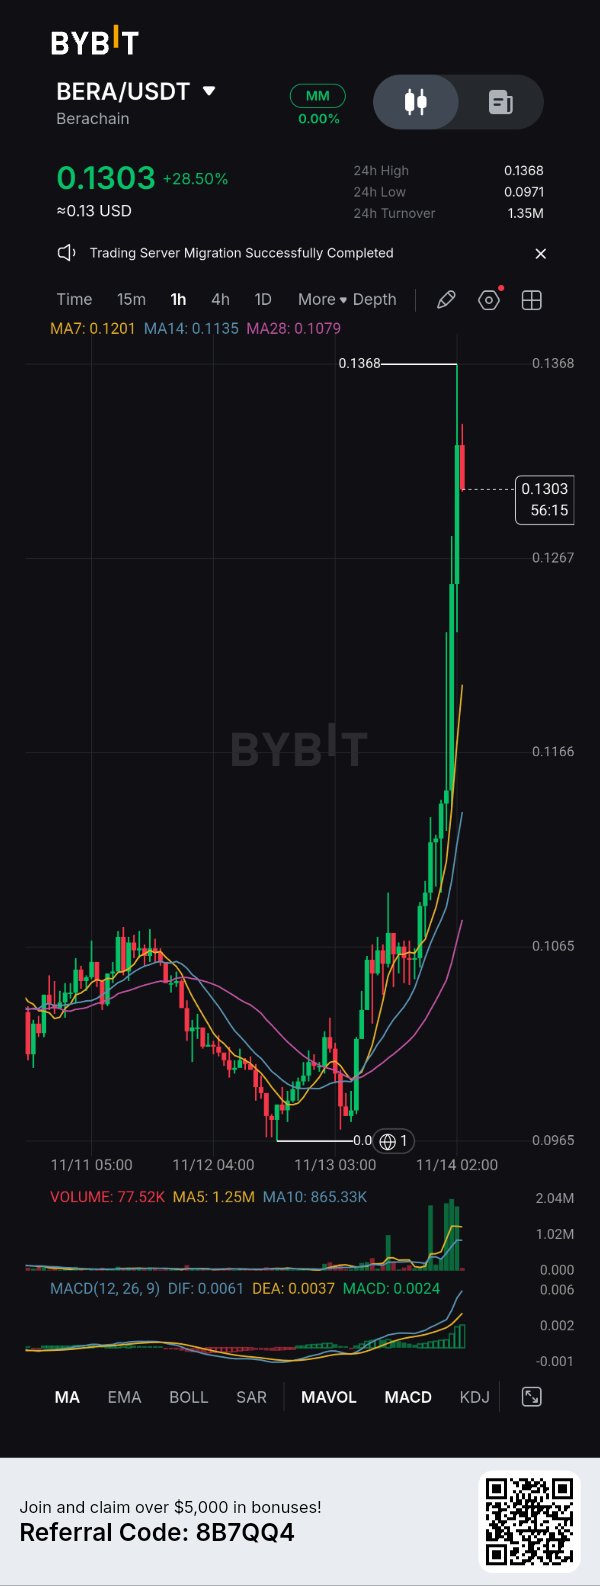
Some traders will see this$BERAUSDT chart and immediately look for a BUY button. I'm looking at the $0.1368 level. Why? Because BERA has made a powerful move from the $0.0971 region, but price is now approaching the high of the entire 24-hour session. This is where momentum traders need to distinguish between a genuine continuation and a late-entry trap. ⚡ WHAT THE CHART IS TELLING US BERA/USDT — 1H chart Current price: $0.1303 24H change: +28.50% 24H high: $0.1368 24H low: $0.0971 24H turnover: $1.35M Moving averages: - MA7: $0.1201 - MA14: $0.1135 - MA28: $0.1079 All three moving averages are positioned below price, with a bullish alignment. This confirms that the short-term structure has changed significantly. But there's a warning: price has moved considerably above its moving averages. A pullback would not necessarily mean the rally is over. 📊 THE MOMENTUM CHECK MACD: - DIF: 0.0061 - DEA: 0.0037 - Histogram: +0.0024 Momentum remains bullish, with DIF above DEA and a positive histogram. However, look at the volume readings: - Current volume: 77.52K - MA5 volume: 1.25M - MA10 volume: 865.33K The displayed current volume is considerably lower than both volume averages. This could reflect cooling participation after the explosive candles. I want to see fresh buying activity before trusting another immediate upward extension. 🎯 THE LEVELS THAT MATTER Resistance: - $0.1368 — 24H high - Above this level, watch for a confirmed breakout and new resistance formation. Support: - $0.1267 — First important chart area - $0.1201 — MA7 - $0.1166 — Additional chart support - $0.1135 — MA14 🔥 TWO SETUPS I'M WATCHING 🟢 SETUP 1: THE PULLBACK TRADE I would rather let BERA come to support than chase it at $0.1303. Potential EP: $0.1205–$0.1267, depending on the support reaction. SL: $0.1160 TP1: $0.1368 TP2: Only after a confirmed breakout, establish the next target from fresh price structure. Confirmation: A bullish reaction around the entry zone, preferably supported by renewed volume. 🔵 SETUP 2: THE BREAKOUT TRADE If buyers push through $0.1368 with strong volume and price successfully retests that level: EP: Above $0.1368 after confirmation. SL: Below the confirmed retest low. TP: Determine from the next resistance formed after the breakout. I won't invent a target where the chart provides none. INVALIDATION: A sustained breakdown below $0.1166 would significantly weaken this immediate bullish continuation thesis. ⚠️ THE MISTAKE I WANT TRADERS TO AVOID Don't confuse a strong token with a good entry. BERA has already delivered a substantial move. Buying simply because the candles are green can expose late entrants to a sharp correction. Sometimes waiting for a retest offers a better opportunity than chasing momentum. 🧠 MY VERDICT Bullish structure. Elevated entry risk. I'm interested in BERA, but I want buyers to prove that the $0.1368 resistance can be broken and defended. Until then, the pullback is the setup I'm watching. 🔥 BERA TRADERS, WHAT'S YOUR PLAN? Are you buying a controlled pullback toward $0.1267, or waiting for a confirmed breakout above $0.1368? #BERA #BERAUSDT #Berachain #Bybit #CryptoTrading #TechnicalAnalysis #ByXIMPACT #WSOT2026 #WSOTShowYourAITradeToEarn10USDT #JensenHuangExitTestsNvidiasAILeadership #USPPITestsTheHigherForLongerTrade
$HYPEUSDT — LOS COMPRADORES HAN HECHO SU MOVIMIENTO. AHORA EL MERCADO ESTÁ PONIENDO A PRUEBA SU FUERZA. 👀 He estado observando HYPE, y algo destaca: el rechazo alrededor de los 75,30 $. El precio intentó un movimiento alcista fuerte, pero los vendedores intervinieron de forma agresiva. Ahora HYPE cotiza en torno a los 72,429 $, y me interesa más lo que ocurra a continuación que la subida inicial. Así es como estoy leyendo el gráfico. 🔎 TRES COSAS A LAS QUE ESTOY PRESTANDO ATENCIÓN 1. El rechazo no fue insignificante. HYPE subió hacia los 75,308 $ antes de experimentar un retroceso brusco. Eso me indica que la zona de 75 $ es un área de resistencia importante. Los compradores necesitan demostrar que pueden absorber la presión vendedora antes de que me sienta seguro ante otra ruptura. 2. El impulso se está enfriando. Fíjate en las medias móviles: - MA7: 73,264 $ - MA14: 72,712 $ - MA28: 72,220 $ El precio ha caído por debajo de la MA7 y la MA14, pero se mantiene por encima de la MA28. Para mí, esto es una señal de advertencia a corto plazo. La estructura de recuperación no ha desaparecido por completo, pero los compradores han perdido algo de impulso inmediato. 3. El MACD me da otra razón para ser paciente. DIF: 0,316 DEA: 0,324 MACD: -0,008 El histograma ligeramente negativo sugiere que el impulso alcista se ha debilitado. Quiero ver si esto se convierte en una corrección más profunda o simplemente en un periodo de enfriamiento temporal. 📍 LOS NIVELES QUE ESTOY VIGILANDO En lugar de predecir una dirección, me estoy preparando para dos posibilidades. 🟢 ESCENARIO ALCISTA Si HYPE recupera los 72,70 $–73,30 $ y establece un soporte por encima de esa zona, empezaré a vigilar: - 73,86 $ - 74,50 $ - 75,30 $ Una ruptura convincente por encima de los 75,30 $ sería especialmente interesante. 🔴 ESCENARIO BAJISTA Si los vendedores empujan el precio por debajo de los 72,20 $, vigilaré el área de soporte de los 70,97 $. Una ruptura por debajo de esa zona podría exponer el mínimo anterior alrededor de los 69,53 $. 🎯 MI ENFOQUE DE TRADING No me interesa comprar simplemente porque HYPE muestre un porcentaje verde en 24 horas. Mi preferencia es esperar a la confirmación. - Posible entrada en largo: 72,80 $–73,30 $, tras una recuperación y retesteo confirmados. - TP1: 73,86 $ - TP2: 74,50 $ - TP3: 75,30 $ - Invalidación: Movimiento sostenido por debajo de los 72,20 $. Estos son niveles de planificación condicionales, no una señal de trading activa. El setup necesita confirmación, y el primer objetivo ofrece un potencial alcista limitado en relación con el nivel de invalidación propuesto, así que reevaluaría la relación riesgo-beneficio antes de entrar. 🧠 MI CONCLUSIÓN Soy cautelosamente neutral respecto a HYPE a corto plazo. El rechazo en los 75,30 $ merece atención, pero no lo interpretaré automáticamente como el comienzo de una caída importante. Lo que quiero ver es sencillo: ¿pueden los compradores recuperar el grupo de medias móviles, o forzarán los vendedores otra prueba del soporte inferior? La próxima reacción importa más que la subida anterior. 👇 QUIERO ESCUCHAR A OTROS TRADERS: Si estuvieras vigilando HYPE ahora mismo, ¿qué nivel determinaría tu próximo movimiento: 73,30 $ o 70,97 $? Y lo que es más importante, ¿qué te haría cambiar tu sesgo? #HYPE #Hyperliquid #CryptoTrading #ByX ByXIMPACT