Ali Explorer..
567Me gusta0Compartir en el chat8Aficionados3Seguir
just Beginning of learning 🔺
just Beginning of learning 🔺
HYPE REVERSE FROM my levels!
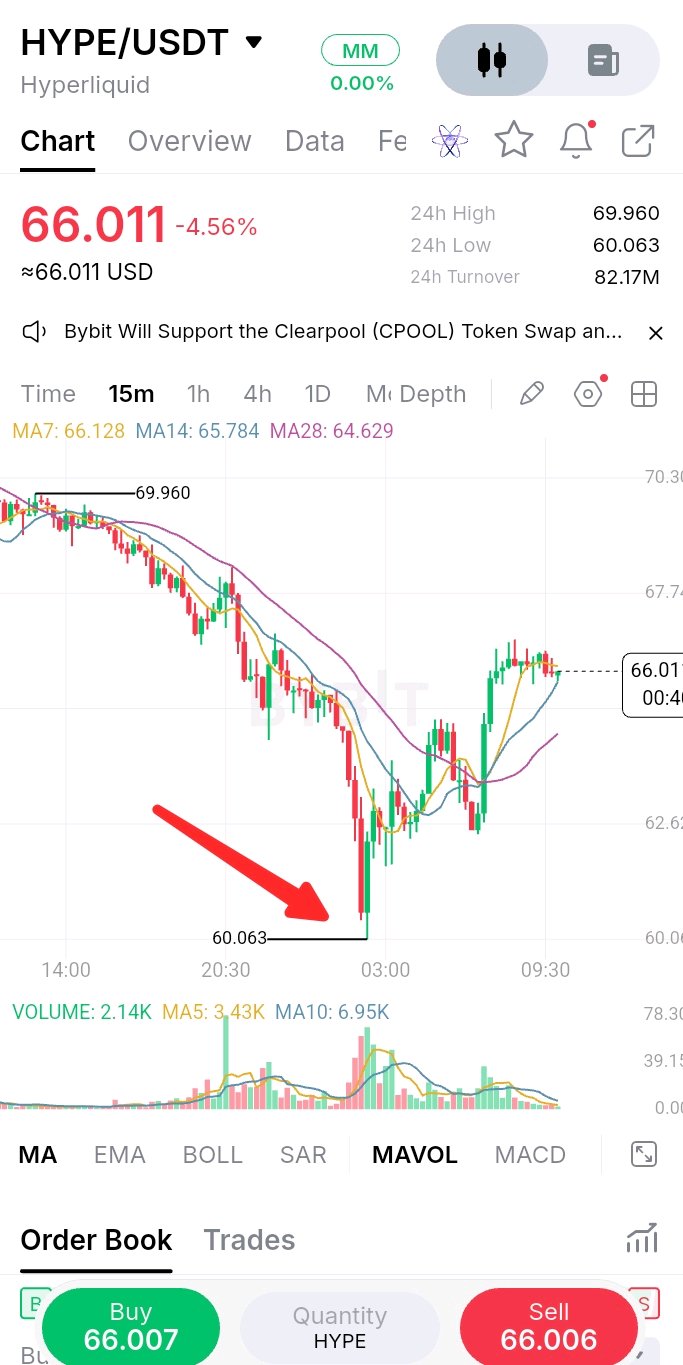
🚀 $HYPEUSDT THE BOUNCE WE WERE WATCHING! As discussed in my previous analysis, HYPE lost its $70–$71 support and moved toward the downside liquidity zone. Price swept liquidity near $60.06 and then staged a strong recovery toward $66. On the 15M chart, buyers are showing momentum, with price trading around the short-term moving averages. However, the broader downtrend is not confirmed broken yet. Key levels to watch 👀: $68–$70 resistance; $64–$65 immediate support. A sustained move above resistance could open the way toward $70–$73. For now, this looks like a recovery attempt, not a confirmed trend reversal. Watch volume and the next 4H closes before taking a position. Did HYPE finally find its bottom, or is this just a relieved... #IMPACTbyTrade
BTC bottom
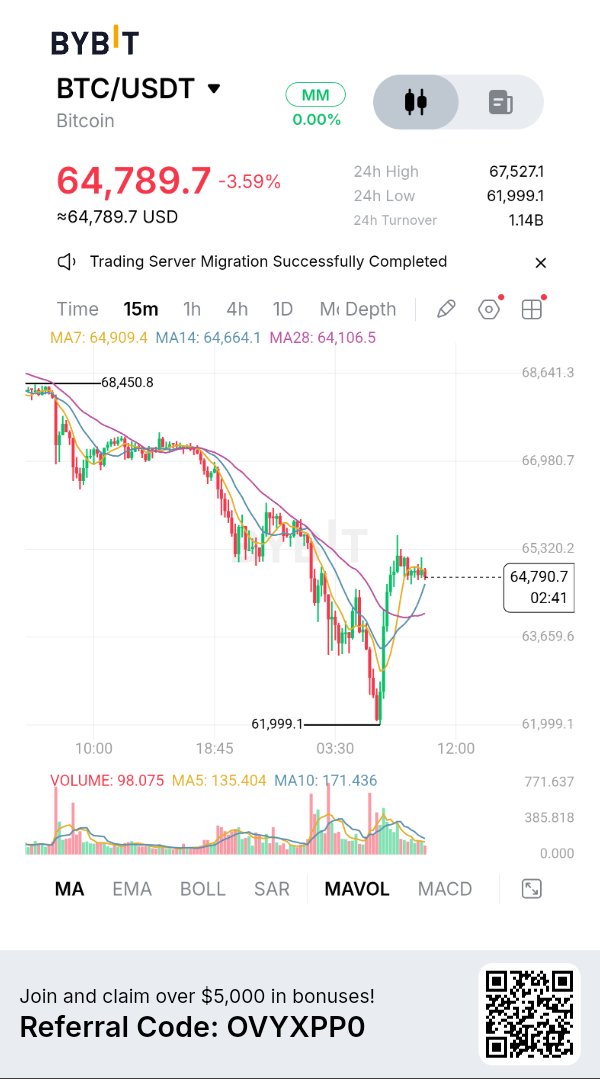
I think $BTCUSDT Bottom is near 📉 #BitcoinHitsTwoMonthLowAfterUSMidterms
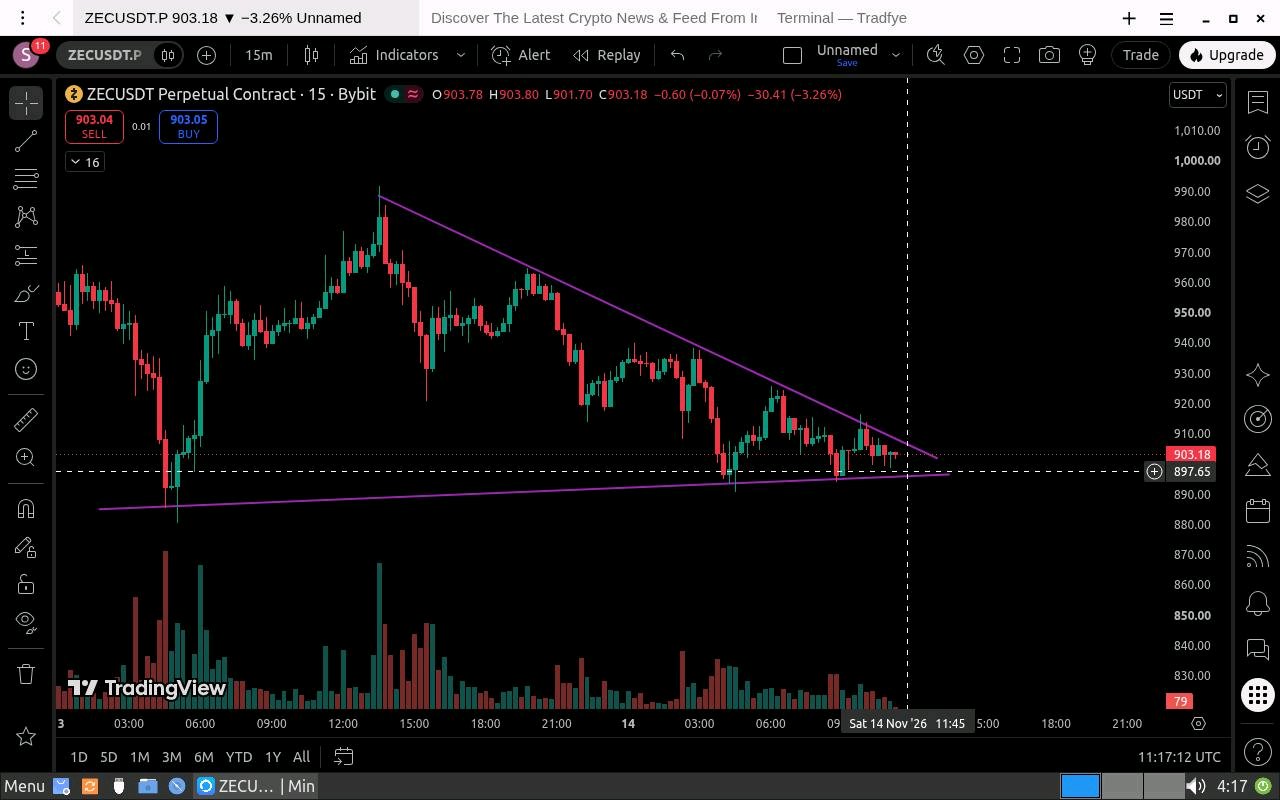
¡ZEC PODRÍA TENER UN GRAN MOVIMIENTO! 📊🔥
ZEC cotiza alrededor de los 903 $, comprimiéndose dentro de una estructura de resistencia descendente en el gráfico de 15 minutos. El precio se mantiene en una zona de soporte crítica entre los 890 $ y los 900 $. Una ruptura al alza o a la baja podría desencadenar el próximo gran movimiento. 📊 NIVELES CLAVE A VIGILAR 👀 LARGO 🎯 Objetivo 1: 916 $ 🎯 Objetivo 2: 927 $ 🚀 Objetivo final: 934 $ 🛑 Stop loss: Por debajo de unos 890 $. En los 927 $, considera asegurar ganancias parciales y mover el SL al punto de entrada (breakeven). Si ZEC pierde la zona de soporte de 890 $ – 900 $ con una ruptura confirmada a la baja: 📉 Posible objetivo bajista: 860 $ 🔥 LA GRAN PREGUNTA ¿Romperá ZEC al alza hacia los 934 $ o colapsará hacia los 860 $? El mercado se acerca a una zona de decisión crítica. No persigas el movimiento, espera a que haya confirmación. 💡 Recuerda: Opera según la confirmación, no según la predicción. ¡Gestiona tu riesgo! ¿Cuál es tu sesgo? 🐂 ¿ALCISTA o 🐻 BAJISTA? #IMPACTbyTrade
Trying to Understand What Is Happening With BTC
I have been closely observing Bitcoin on the 1H timeframe, and the current market structure is showing signs of weakness. $BTCUSDT continues to form lower highs and lower lows, suggesting that sellers are still dominating the short term trend. Looking at the chart, I have mapped a possible A B C D E corrective structure. Price has recently bounced from the D wave area, but I am not considering this a confirmed bullish reversal yet. Key Technical Levels☑️ • Resistance: $69,120 • Immediate Support: $66,400–$66,500 • Next Potential Support Zone: $61,000–$63,000 if selling pressure continues. A sustained move above $69,120 could improve the short-term structure, while a breakdown below $66,400 may expose the lower support zone. Understanding the Market with Bybit AI I also used Bybit AI to understand the possible reasons behind BTC's recent decline. The analysis helped me look at the broader market picture, including: • Weakening demand and changing market sentiment. • Reduced institutional buying interest. • Derivatives positioning and the possibility of leveraged long liquidations. • Overall market uncertainty and selling pressure. According to the analysis, the current decline appears to be more related to market-wide pressure and weakening demand, potentially amplified by leverage, rather than a confirmed problem with Bitcoin itself. My Overall Market View At the moment, I am keeping an eye on the $66,400 support area and whether BTC can recover above the $69,120 resistance. If support fails, the $61,000–$63,000 zone becomes important to watch. I don't consider every bounce a reversal. I prefer to observe price confirmation, market structure and risk before making any decision. The main thing I learned from this analysis is that looking at technical structure alongside broader market conditions gives a more complete picture of what is happening. #WSOTShowYourAITradeToEarn10USDT
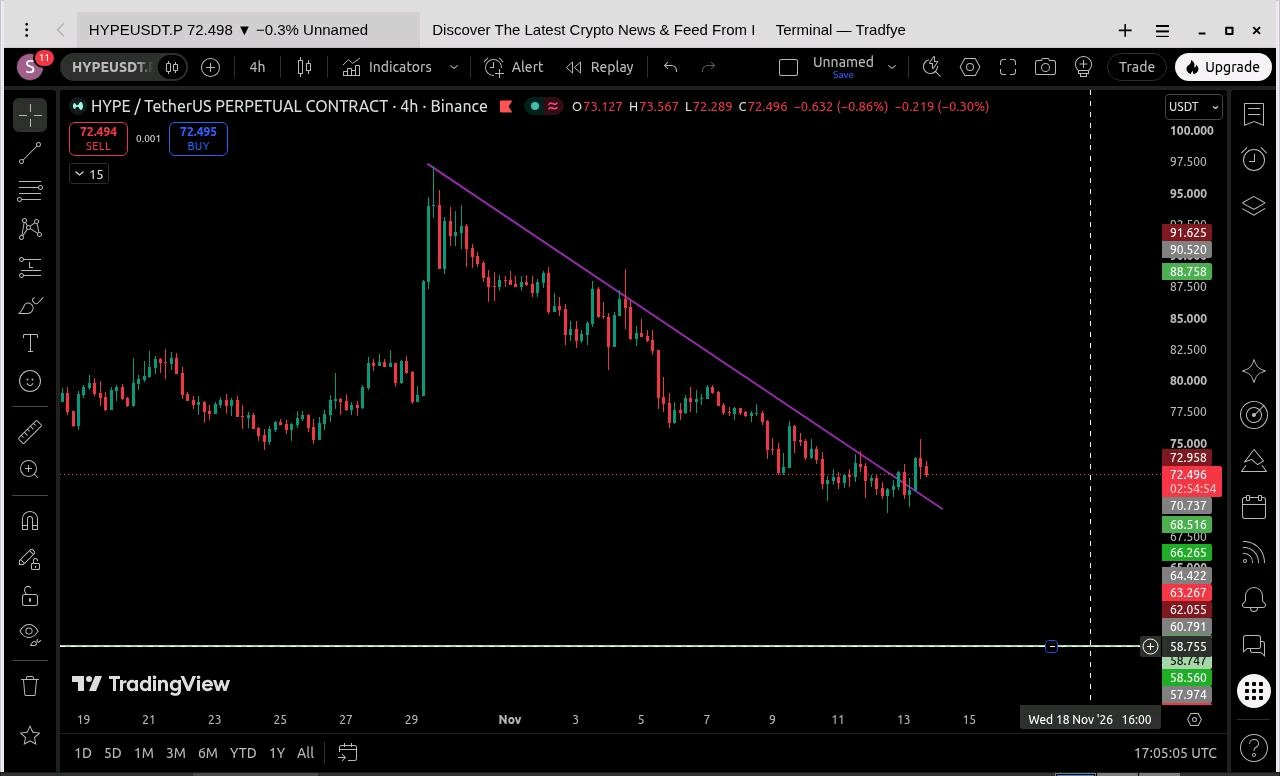
HYPE TREND LINE BREAK 😱
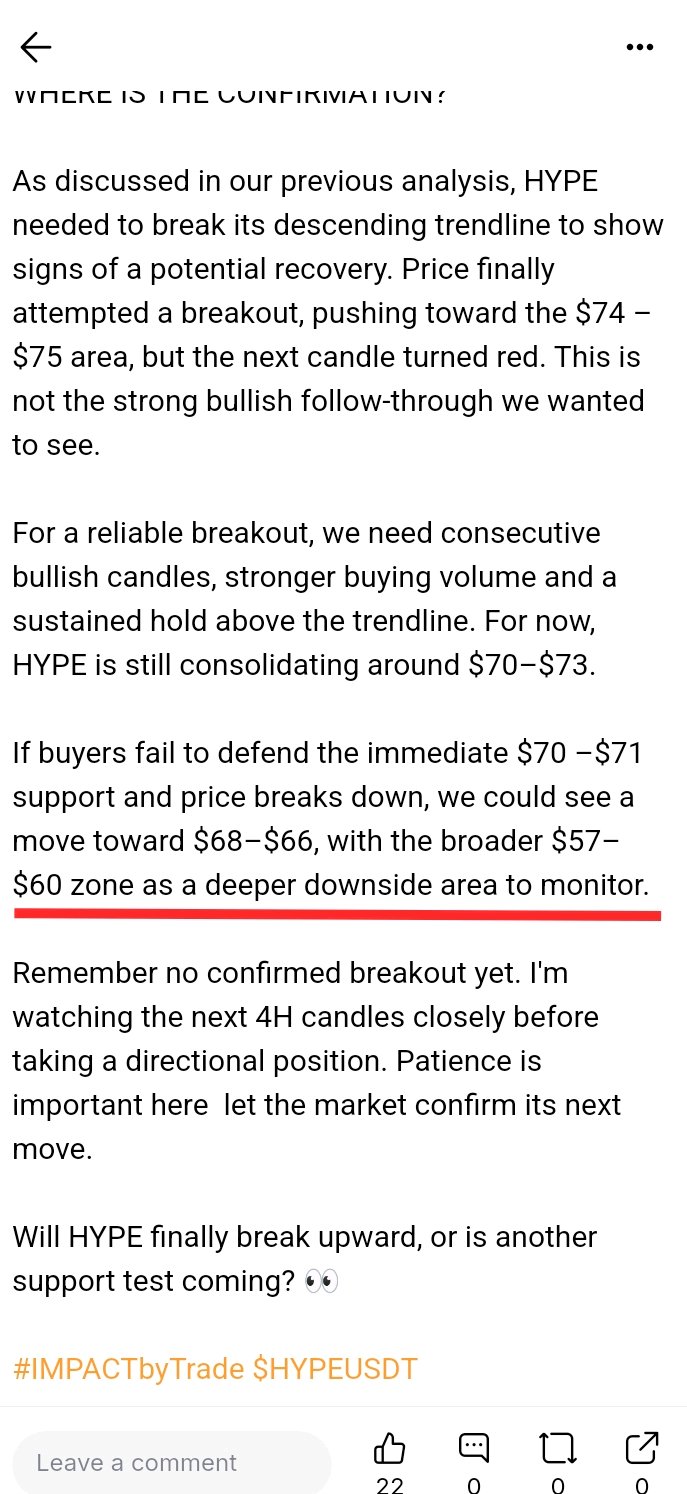
⚡ HYPE UPDATE TRENDLINE BREAKOUT BUT WHERE IS THE CONFIRMATION? As discussed in our previous analysis, HYPE needed to break its descending trendline to show signs of a potential recovery. Price finally attempted a breakout, pushing toward the $74 – $75 area, but the next candle turned red. This is not the strong bullish follow-through we wanted to see. For a reliable breakout, we need consecutive bullish candles, stronger buying volume and a sustained hold above the trendline. For now, HYPE is still consolidating around $70–$73. If buyers fail to defend the immediate $70 –$71 support and price breaks down, we could see a move toward $68–$66, with the broader $57– $60 zone as a deeper downside area to monitor. Remember no confirmed breakout yet. I'm watching the next 4H candles closely before taking a directional position. Patience is important here let the market confirm its next move. Will HYPE finally break upward, or is another support test coming? 👀 #IMPACTbyTrade $HYPEUSDT
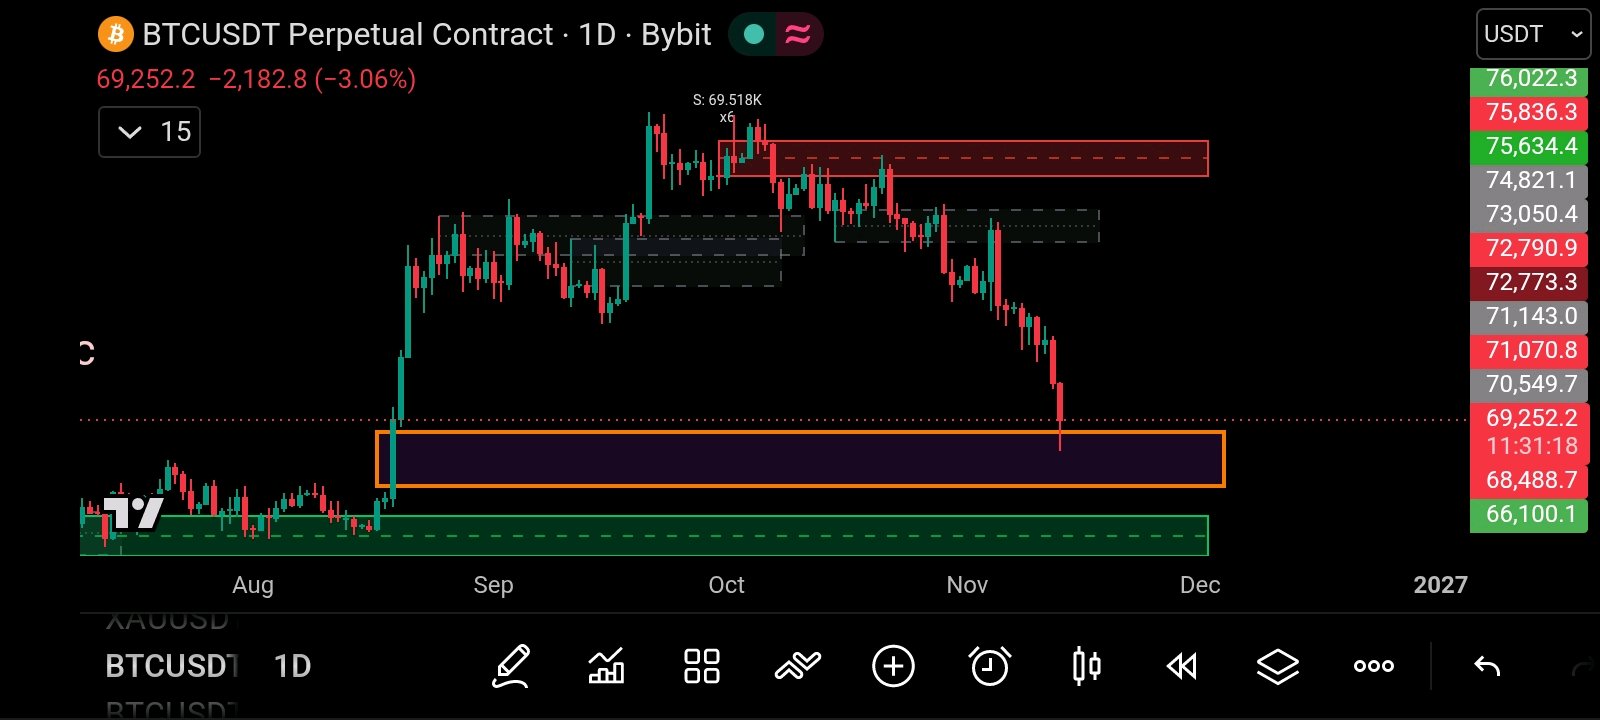
BITCOIN HA PUESTO A PRUEBA EL FVG DIARIO
Bitcoin ha retrocedido oficialmente y ha testeado la importante zona de demanda de Fair Value Gap (FVG) diaria alrededor de los 65.000$ – 69.000$ 🌐. Tras el intenso flash crash que liquidó más de 750 millones de dólares en posiciones largas, la acción del precio muestra ahora las primeras señales de absorción de compradores en estos niveles más bajos 📉. Con BTC estabilizándose actualmente en torno a los 69.174$, esta zona está actuando como el punto de inflexión definitivo. Así es como estamos planteando la estrategia 🧠. La estrategia: Planeamos una posición LONG condicional basada en la defensa del FVG 🟢. Objetivo alcista: 72.000$+ donde convergen la liquidez significativa por encima del precio y la estructura anterior 🎯 Stop Loss estricto: Situado claramente por debajo del reciente mínimo del flash crash, alrededor de los 67.000$ 🛡️ ⚡ Regla de ejecución: Nunca operes basándote en la esperanza ciega. Necesitamos ver una reacción alcista fuerte y verificada, y una estructura de confirmación clara en 1h/4h antes de apretar el gatillo. Si esta zona de demanda no aguanta, respetamos nuestros límites de riesgo inmediatamente y nos apartamos 📉. La gestión del riesgo siempre es lo primero. ¡Estemos muy atentos al flujo de órdenes y veamos si BTC puede usar este FVG diario como plataforma de lanzamiento para la recuperación! 🚀 ¿Qué dice tu análisis? ¿Vamos hacia los 72.000$ o vamos a testear niveles más bajos? ¡Deja tu opinión abajo! 👇 $BTCUSDT #WSOTMuestraTuOperaciónConIAParaGanar10USDT
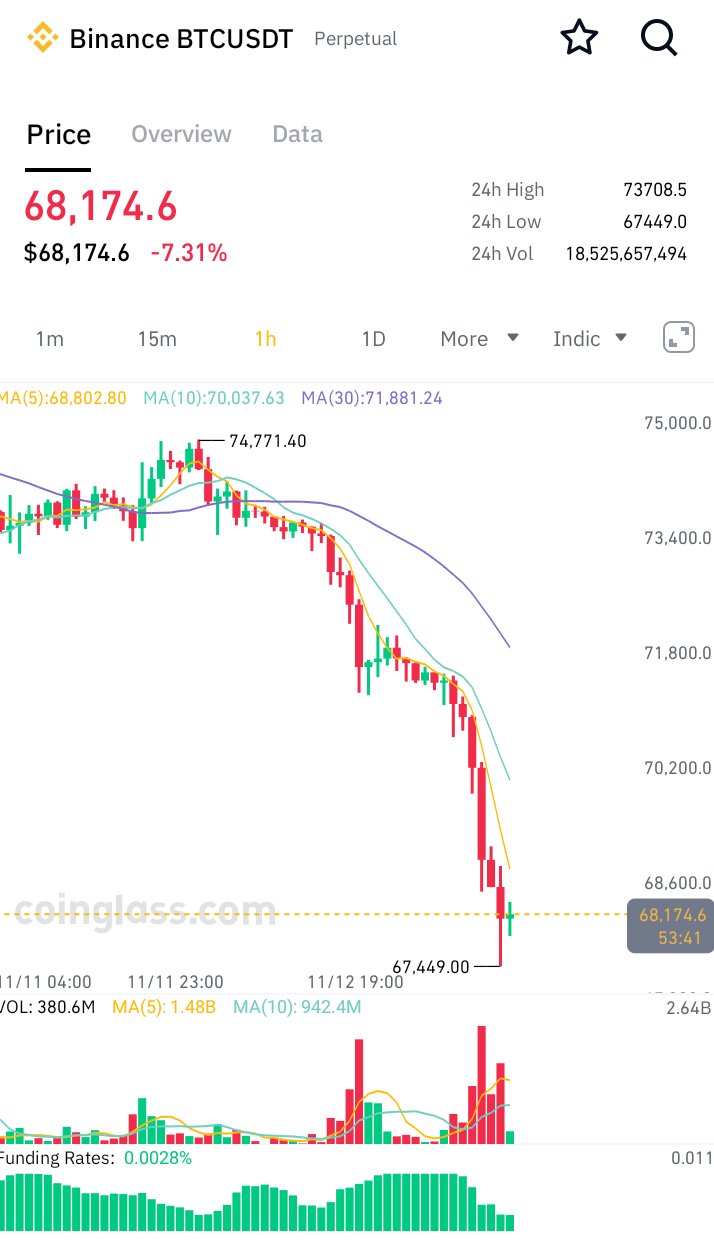
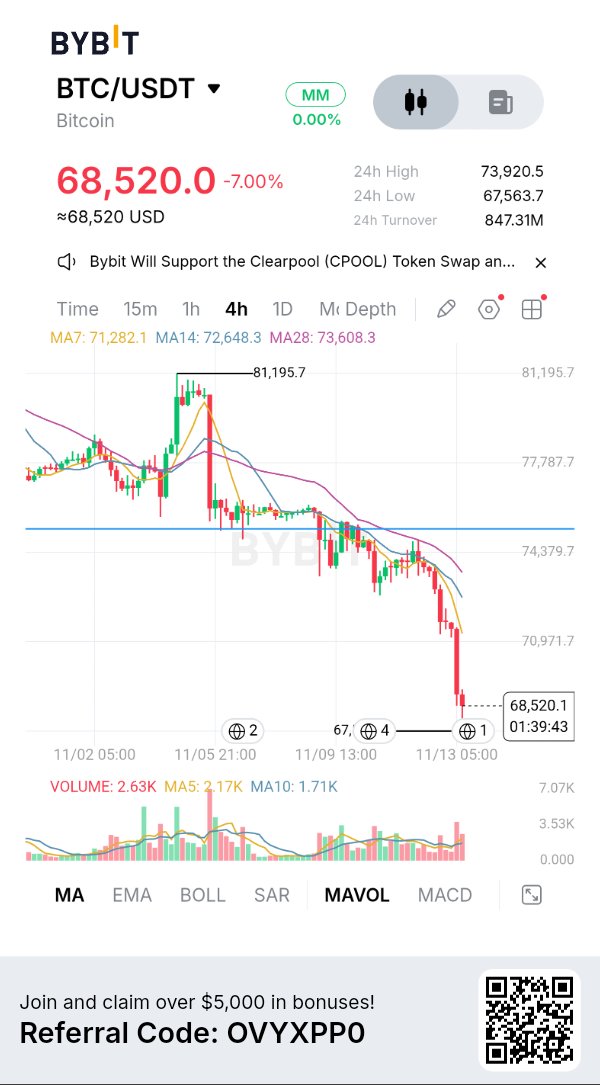
BITCOIN Drop below 68,000 is This end!
Bitcoin has fallen below $69,000 for the first time in nearly two months, triggering one of the larger leverage resets of recent weeks. After trading near $81,000 last week, $BTCUSDT slid under the $69,000 level on November 13. The move forced roughly $1.4 billion in liquidations across crypto derivatives markets, with long positions accounting for the vast majority of the damage. More than 170,000 traders were liquidated in the cascade. Bitcoin linked liquidations alone totaled around $740 million, while Ethereum saw roughly $250 million wiped out. The broader crypto market followed lower, with total market capitalization dropping about 5–6% to roughly $2.3 trillion. Analysts are framing the sell off primarily as a deleveraging event rather than a fundamental breakdown. Dense clusters of leveraged longs sat just below $70,000. Once that level broke, automatic liquidations accelerated the decline. Macro factors added pressure: recent spot Bitcoin ETF outflows, a stronger U.S. dollar, weakness in tech stocks, and hotter inflation data that raised expectations for tighter financial conditions. Altcoins mirrored the move. Ethereum $ETHUSDT dropped toward the $1,900–$1,925 range, XRP hovered near $1, and names like SOL and DOGE posted losses of 5–9%. The key signals to watch from here are leverage metrics open interest and funding rates, spot ETF flows, and whether Bitcoin can stabilize in the high $60,000s. If forced selling slows and outflows calm, the market could shift into more orderly trading. Renewed heavy leverage, however, would leave it vulnerable to further volatility. In short, this was a sharp leverage flush against a risk off backdrop painful for overextended longs, but not yet a clear structural break in the broader Bitcoin thesis. #ByXIMPACT

Bitcoin acaba de perder el nivel de los 69.000 $
$BTCUSDT ha caído por debajo de los 69.000 $ por primera vez en casi dos meses, bajando desde los 81.000 $ aproximadamente de la semana pasada. El movimiento provocó aproximadamente 1.400 millones de dólares en liquidaciones, con la gran mayoría proveniente de posiciones largas. Más de 170.000 traders fueron eliminados en la cascada. Esto parece más un ajuste de apalancamiento que un colapso fundamental. Las posiciones largas masivas por debajo de los 70.000 $ recibieron un duro golpe, mientras que las salidas de los ETF, un dólar más fuerte y una mayor aversión al riesgo en el sector tecnológico añadieron presión. Las altcoins siguieron la tendencia: $ETHUSDT se deslizó hacia los 1.900 - 1.925 $, XRP rondó los 1 $. Aspectos clave a vigilar ahora: - Si el apalancamiento continúa ajustándose - Los flujos de los ETF al contado - Si BTC puede mantenerse en la parte alta de los 60.000 $ El clásico ajuste de apalancamiento en un contexto de aversión al riesgo. #WSOT2026 #Bitcoin alcanza su mínimo de dos meses tras las elecciones de mitad de mandato en Estados Unidos #LaInflaciónDeEEUUSeDisparaYAumentanLasApuestasSobreSubidasDeTipos

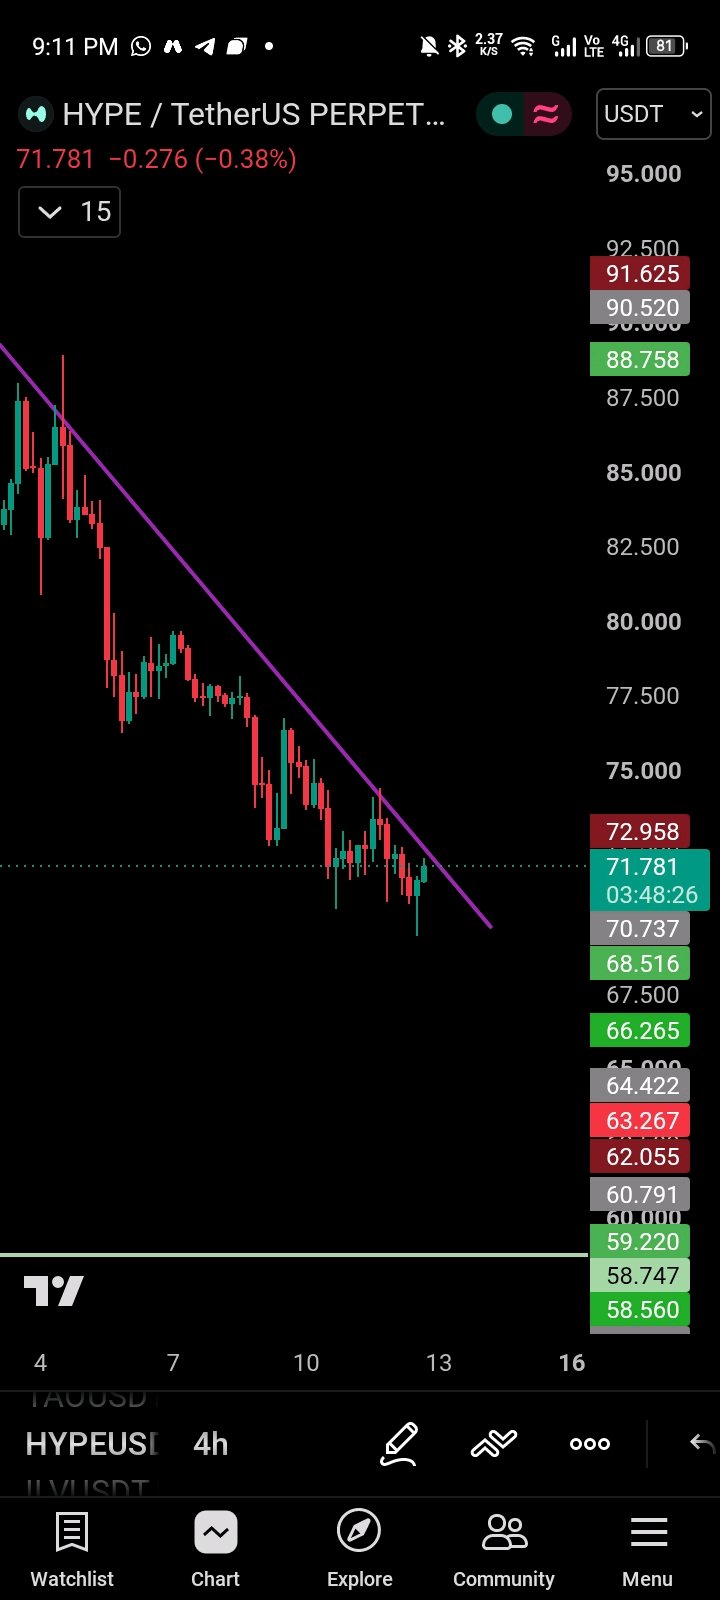
$HYPEUSDT ¡APARECEN LOS COMPRADORES! Tal y como esperábamos tras nuestro análisis previo, HYPE ha barrido la liquidez por debajo de la zona de soporte de 70 $, que ahora muestra señales de actuar como zona de demanda. Los compradores están intentando empujar el precio al alza, pero la tendencia general sigue siendo bajista, con los vendedores aún al mando. El nivel clave a vigilar es la línea de tendencia descendente: una ruptura confirmada con un volumen fuerte podría desencadenar una recuperación, mientras que otro rechazo podría traer más caídas. Este es un momento crítico, así que cada pequeño movimiento importa. Veamos: ¿ruptura al alza o desplome? 👀 #HYPEUSDT #IMPACTbyTrade
⚡ HYPE AT A CRITICAL DECISION ZONE: $70 SUPPORT !?
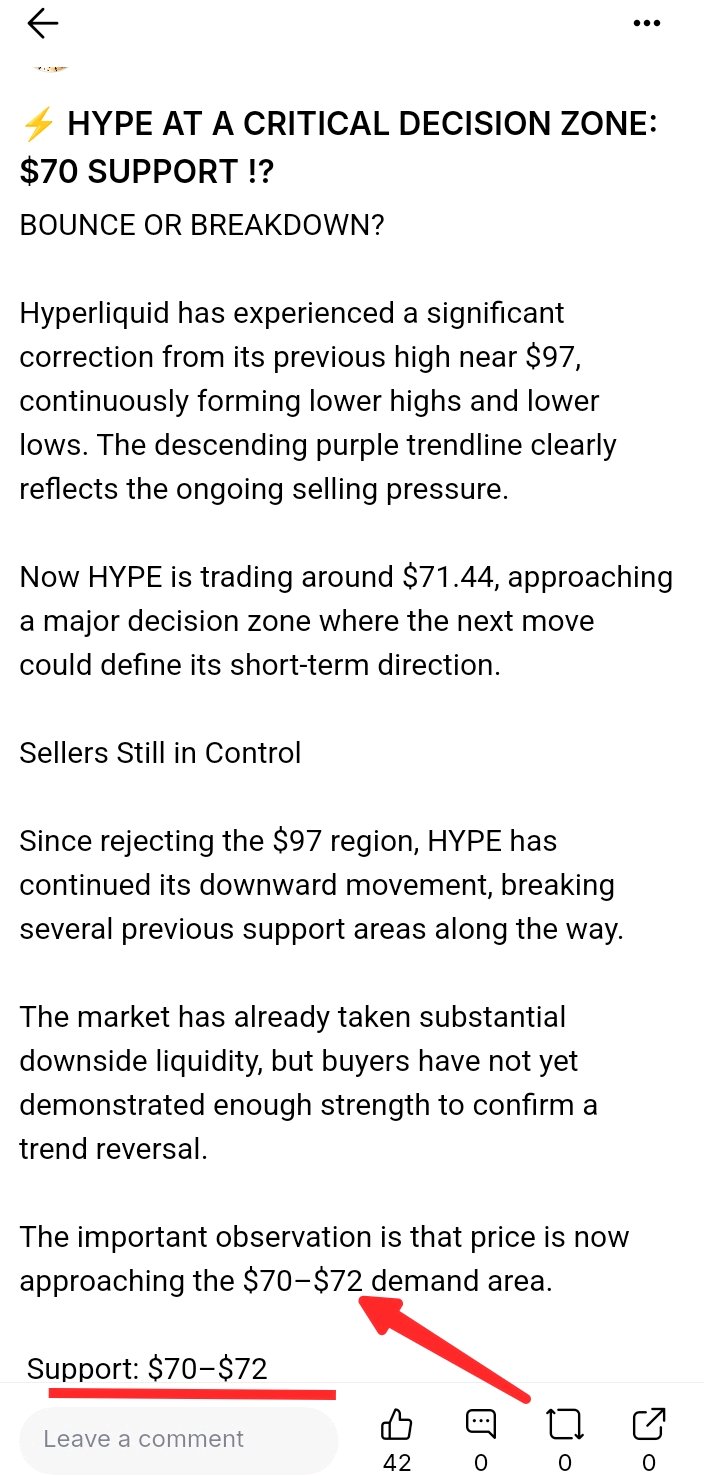
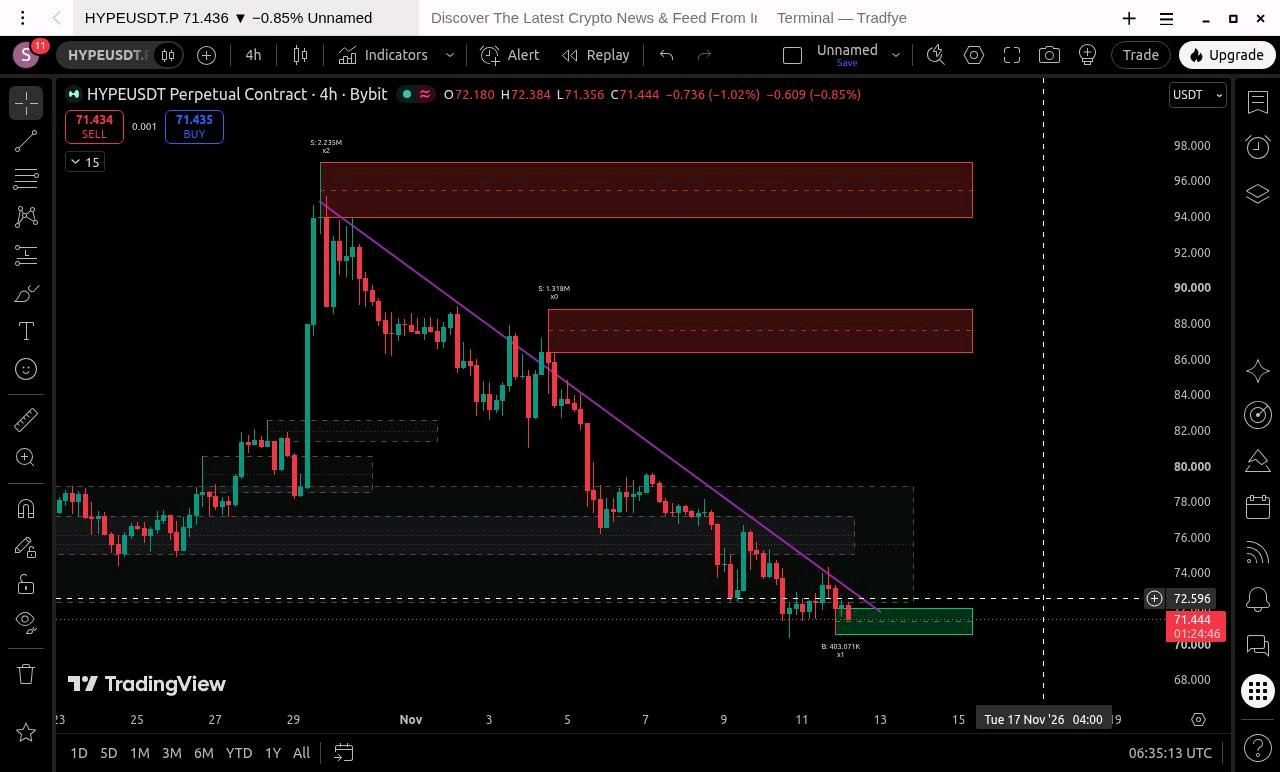
BOUNCE OR BREAKDOWN? Hyperliquid has experienced a significant correction from its previous high near $97, continuously forming lower highs and lower lows. The descending purple trendline clearly reflects the ongoing selling pressure. Now HYPE is trading around $71.44, approaching a major decision zone where the next move could define its short-term direction. Sellers Still in Control Since rejecting the $97 region, HYPE has continued its downward movement, breaking several previous support areas along the way. The market has already taken substantial downside liquidity, but buyers have not yet demonstrated enough strength to confirm a trend reversal. The important observation is that price is now approaching the $70–$72 demand area. Support: $70–$72 This is the immediate zone I'm watching. Price is consolidating near this support while the descending trendline is approaching the same area. Two scenarios are possible: Bullish scenario If buyers defend $70–$72 and price breaks above the descending trendline with strong volume, we could see a recovery toward $75 – $76, followed by a possible move toward $78. Bearish scenario But If sellers remain in control and HYPE decisively breaks below $70, the next potential downside area could be around $66, where a daily-timeframe FVG is worth monitoring. For now, the immediate confirmation levels are: - $70–$72: Major support and demand zone. - $72.60: Immediate reclaim level. - $75–$76: First recovery resistance. - $78–$79: Next upside liquidity/resistance area. - $86–$89: Higher resistance zone. - $94–$97: Major overhead supply. A 4H close above the descending trendline, supported by increased buying volume, would strengthen the recovery scenario. On the other hand, repeated rejection from the trendline followed by a breakdown below $70 would favour further downside. Fundamental Perspective❓ There is also an interesting development on the fundamental side: Upbit announced HYPE trading against KRW, BTC and USDT on November 10, expanding its market access in South Korea. This is a positive development for accessibility and potential liquidity, but it has not yet reversed the bearish price structure. A listing alone does not guarantee buying pressure. HYPE has fallen significantly from its $97 high and is now approaching a major support zone around $70–$72. In my view, this is the market's next important decision point. If buyers finally break the descending trendline with strong volume, a recovery toward $78 becomes possible. But if the $70 support fails, we could see another downside extension toward the $66 daily FVG area. For now, I'm watching two things very closely👀: the $70 support and the descending trendline breakout. Let's see which side takes control. #ByXIMPACT $HYPEUSDT
RUPTURA DE SOPORTE DE ZEC CONFIRMADA 👌 LOS OSOS TOMAN EL CONTROL
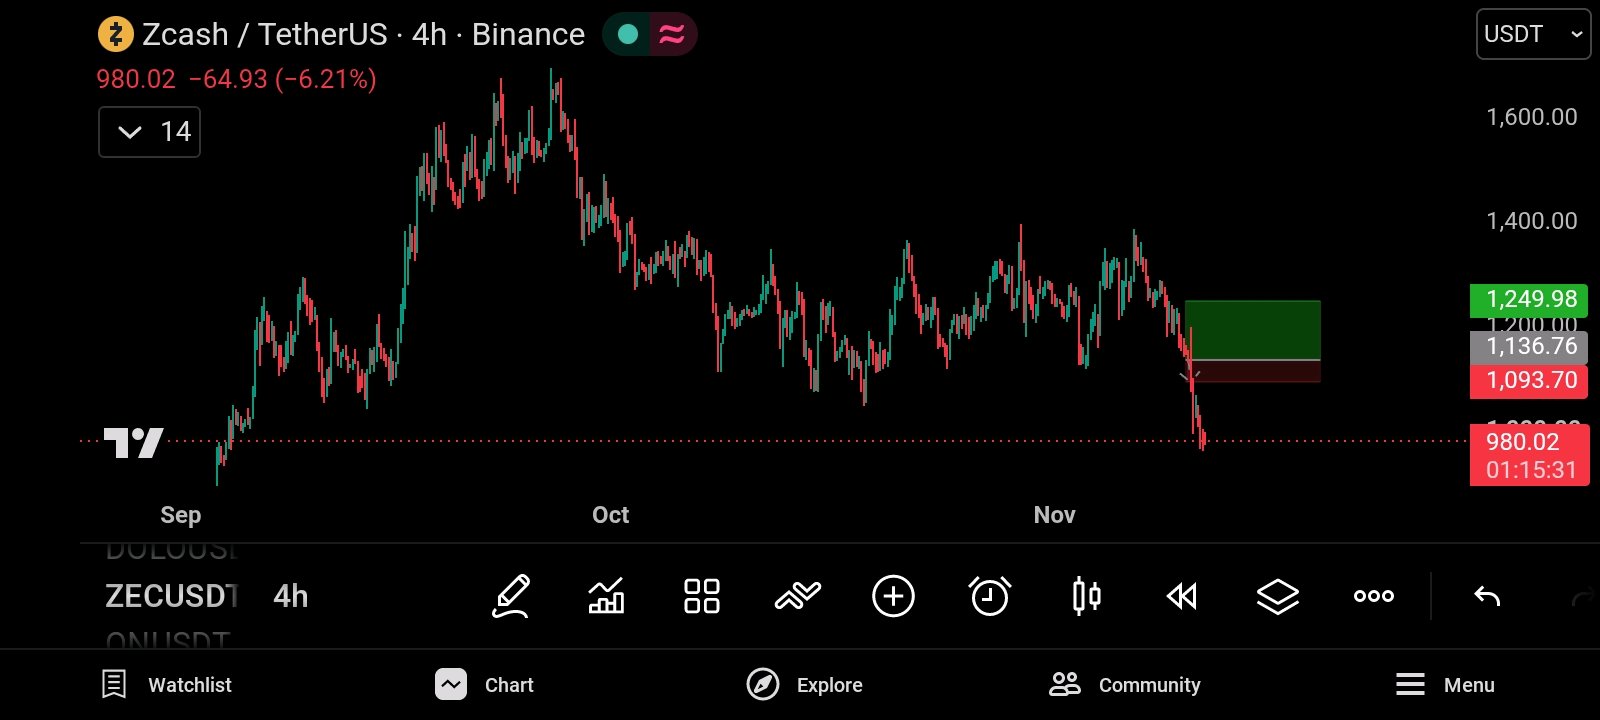
¿Recuerdas mi análisis anterior? Señalé la posibilidad de que ZEC pudiera perder su soporte importante tras varias pruebas. Ese escenario ya se ha materializado. ZEC rebotó brevemente desde la zona de 1.136 $ hacia los 1.198 $, pero los compradores no lograron mantener el impulso. Los vendedores regresaron de forma agresiva, rompieron la estructura de soporte y empujaron el precio hacia los 980 $. Entonces, ¿qué ha cambiado? La zona de soporte anterior no logró mantenerse y el intento de recuperación fue rechazado. Esto sugiere que los compradores están perdiendo el control y que el mercado podría estar entrando en una nueva fase bajista. Mi perspectiva actual a la baja es: - 980 $: Área de referencia actual en el gráfico. - 910 $: Primer objetivo para posiciones cortas. - 800 $: Zona bajista más amplia a vigilar. Una recuperación sostenida por encima de la zona de soporte rota debilitaría este escenario bajista. ¿Es Zcash realmente débil? Curiosamente, los desarrollos fundamentales de Zcash no son del todo bajistas. Actualización de red NU7: Zcash activó su importante actualización NU7 el 6 de noviembre, reduciendo los intervalos de bloque objetivo de 75 a 25 segundos. También introdujo un Mecanismo de Sostenibilidad de Red que destina el 60 % de las comisiones de transacción a una reserva. Estas son mejoras de infraestructura significativas a largo plazo. Crecimiento del ecosistema de privacidad: CoinDesk Research informó que el pool blindado Ironwood de Zcash ganó aproximadamente 122.000 ZEC en octubre, mientras que la oferta blindada total aumentó en unos 27.000 ZEC hasta alcanzar aproximadamente 4,97 millones de ZEC. Interés institucional: Según se informa, el número de acciones del ETF de Zcash de Grayscale creció un 54,2 % entre su salida a bolsa en agosto y el 30 de octubre, lo que indica una creciente exposición institucional. Sin embargo, también hay motivos de preocupación. Alrededor de 12.224 ZEC permanecieron en el pool retirado Sprout tras la activación de NU7, y la actividad media de transacciones blindadas en octubre fue de aproximadamente 4.450 transacciones por día, un descenso de alrededor del 36 % respecto a septiembre. Lo interesante es que Zcash tiene un progreso de desarrollo significativo a largo plazo, pero su estructura de precios se ha debilitado considerablemente 📉. Esto sugiere que los fundamentos positivos no están proporcionando actualmente suficiente presión compradora inmediata para superar la actividad vendedora. Mi perspectiva a corto plazo sigue siendo de cautela a bajista, a menos que el precio recupere la zona de soporte rota. Mi plan de trading 🔸 Objetivo corto: 910 $ Área bajista más amplia: 800 $ Stop loss: 1.120 $ Observaré si los vendedores mantienen el control y si el precio continúa formando máximos decrecientes. La gestión del riesgo es esencial. Si entramos cerca de los 980 $, el stop en 1.120 $ representa un riesgo de aproximadamente 140 $ frente a un movimiento de 70 $ hasta el objetivo de 910 $. Eso es solo una relación riesgo-beneficio de alrededor de 0,5:1, por lo que la entrada, el objetivo o el tamaño de la posición merecen una reevaluación cuidadosa. ByXIMPACT
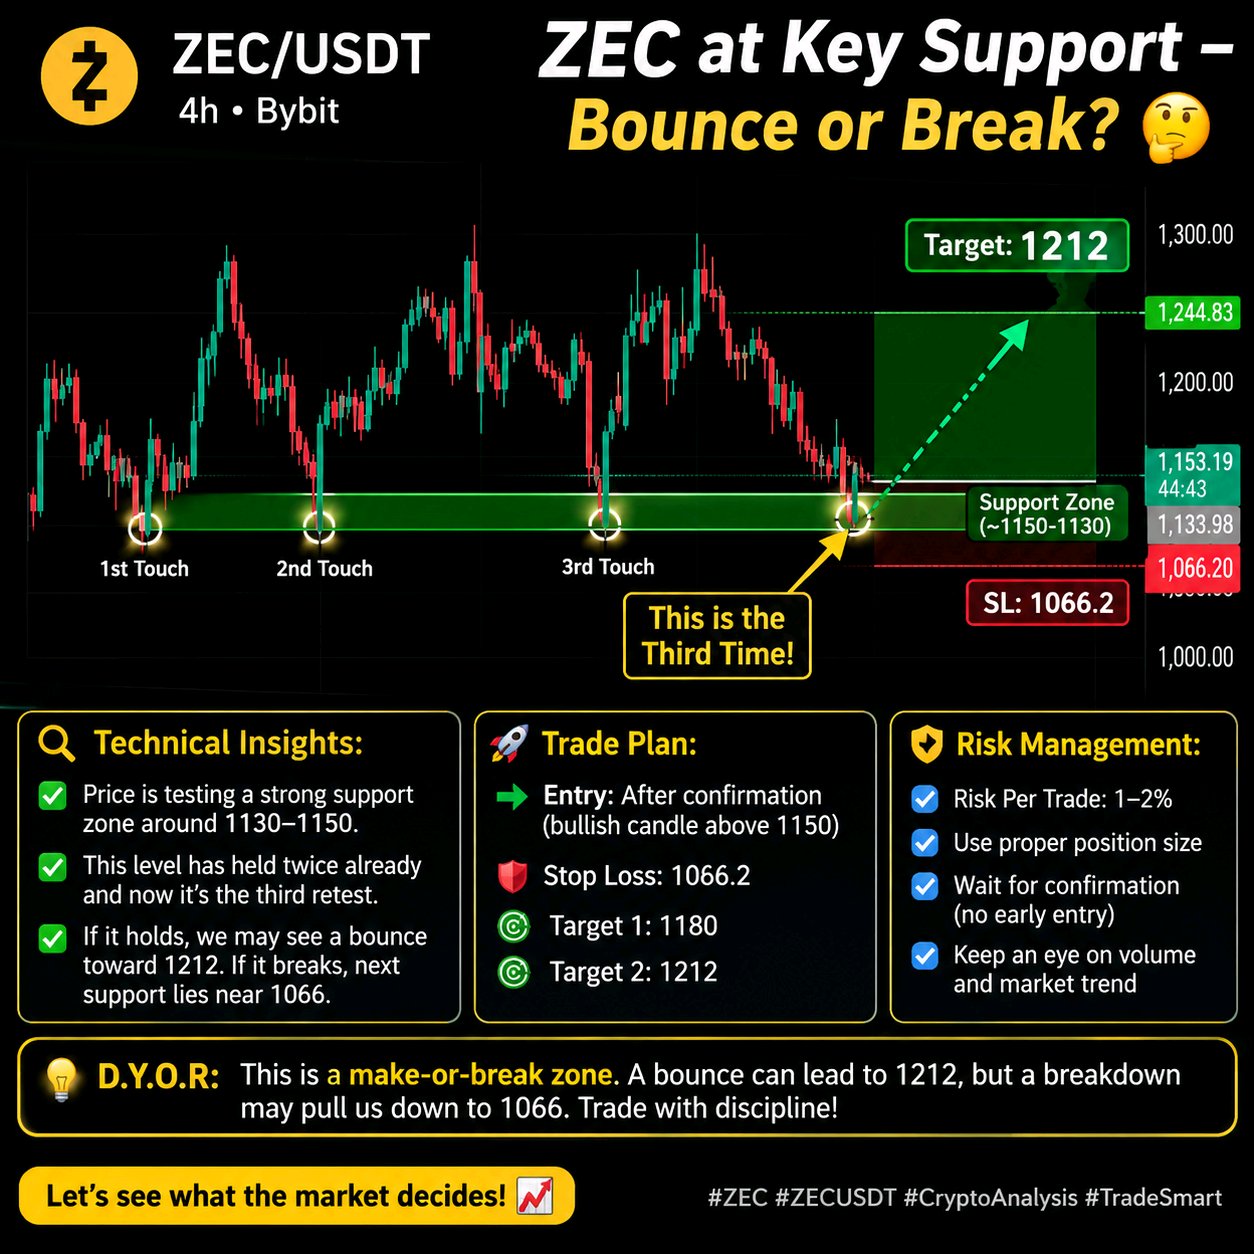
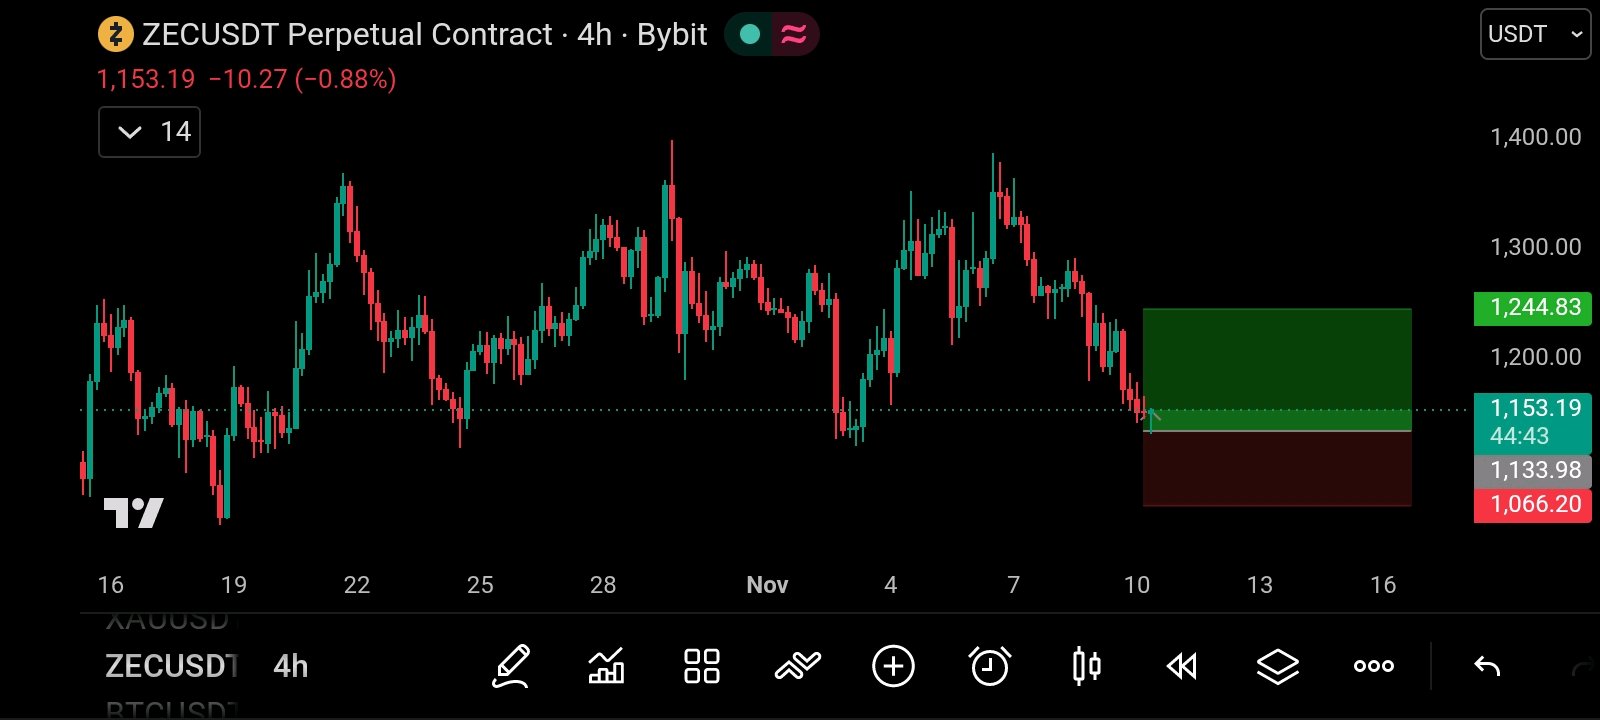
⚡ ZEC THIRD TEST OF SUPPORT BOUNCE OR BREAK?
ZEC is currently trading around $1,153, testing the important $1,134 – $1,153 support zone for the third time on the 4H chart. If buyers defend this area and we get a strong bullish confirmation, I'm interested in a potential LONG, targeting $1,212. My planned stop loss is $1,066.20. However, if support breaks decisively, the bullish setup is invalidated and further downside is possible. I'll wait for confirmation before entering no blind trades. Position sizing and risk management are essential, especially at a third support retest. Will ZEC bounce from here or finally break support? Let's see what the market decides! 👀 DYOR. Manage your risk and never trade blindly. #ByXIMPACT
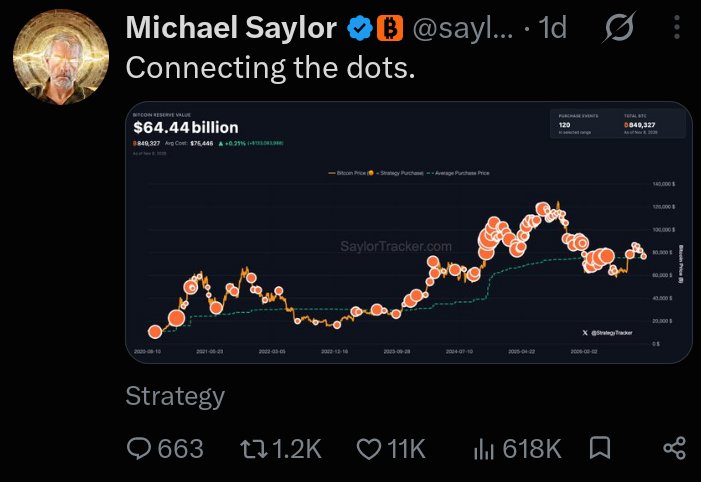
Michael Saylor dropped another Bitcoin tease!
"Connecting the dots" The Strategy chairman's latest X post has sparked speculation about another potential $BTCUSDT purchase. But there's a bigger story behind it. 🧵👇 🟠 Strategy reportedly holds 849,327 BTC, worth approximately $62.98 billion. 📉 Bitcoin falling below Strategy's average purchase price of $75,451 has pushed its holdings into roughly $1 billion in unrealized losses. Just a month ago, Strategy was reportedly sitting on nearly $10 billion in unrealized profits. A dramatic market reversal! 🐻 Bitcoin's Q4 2026 weakness is drawing comparisons with previous bearish cycles in 2014, 2018 and 2022. 📊 Analysts are also warning about weakening momentum, with BTC approaching its fifth consecutive weekly red candle. 💰 Despite the pressure, Strategy reportedly maintains $4.9 billion in USD reserves and recently acquired $208 million worth of STRC. 👀 Now everyone's watching Michael Saylor. Does "Connecting the dots" hint at another Bitcoin purchase? Or is it simply another message about his long term BTC conviction? One thing is clear that Strategy's Bitcoin strategy is facing another major market test. #IMPACTbyTrade #MidtermsMarketWatch
Bybit Expands European Presence With Web Summit
Bybit is strengthening its position in Europe's digital financial sector through its partnership with Web Summit 2026 in Lisbon, following key regulatory approvals in Austria. 🗝️ Taking place from November 9 –1 2, Web Summit 2026 will provide Bybit with an opportunity to showcase its European strategy, financial technology innovations and growing focus on artificial intelligence. A major milestone in the company's expansion is the regulatory progress achieved by its European operations. In May 2025, Bybit EU GmbH received authorization as a Crypto-Asset Service Provider (CASP) under the European Union's MiCA framework. More recently, in August 2026, Bybit Payments GmbH secured an Electronic Money Institution (EMI) license from Austria's Financial Market Authority. These approvals establish a foundation for Bybit to expand its regulated crypto, electronic money and payment services across the European Economic Area. During Web Summit, Bybit executives will participate in discussions about cryptocurrency regulation, AI-powered financial infrastructure and the future of digital finance. The company will also host a masterclass focused on autonomous trading agents. Beyond cryptocurrency trading, Bybit is exploring opportunities in payments, U.S. equities, ETFs and investment services. With more than 80 million users worldwide, Bybit is positioning itself as a broader digital financial platform, combining cryptocurrency services, traditional financial products and emerging AI technologies. Bybit's European expansion highlights the growing convergence between cryptocurrency$BTCUSDT , traditional finance and artificial intelligence, as exchanges compete to become comprehensive financial service providers. #BybitAIEvolving
BNB Chain Dominates Daily Activity
🔥$BNBUSDT Chain just hit 4.86 million active addresses in the last 24 hours ranking #1 among all public blockchains. For comparison: • Solana → ~1.97M • Ethereum → ~535K • Base → ~312K That’s roughly 2.5x Solana and 9x Ethereum in daily active addresses.$SOLUSDT Strong on chain activity continues even as BNB price sits near $684. #NovUSCPIWatch #BybitAIEvolving #WSOT2026

¿BTC el año que viene!?
Chicos, ¿cuál es vuestro análisis sobre $BTCUSDT para el próximo año 🙃? ¿Vamos camino a otro gran mercado alcista o deberíamos esperar una corrección importante? 🤔📈 ¡Me encantaría conocer vuestras opiniones y predicciones! 🚀
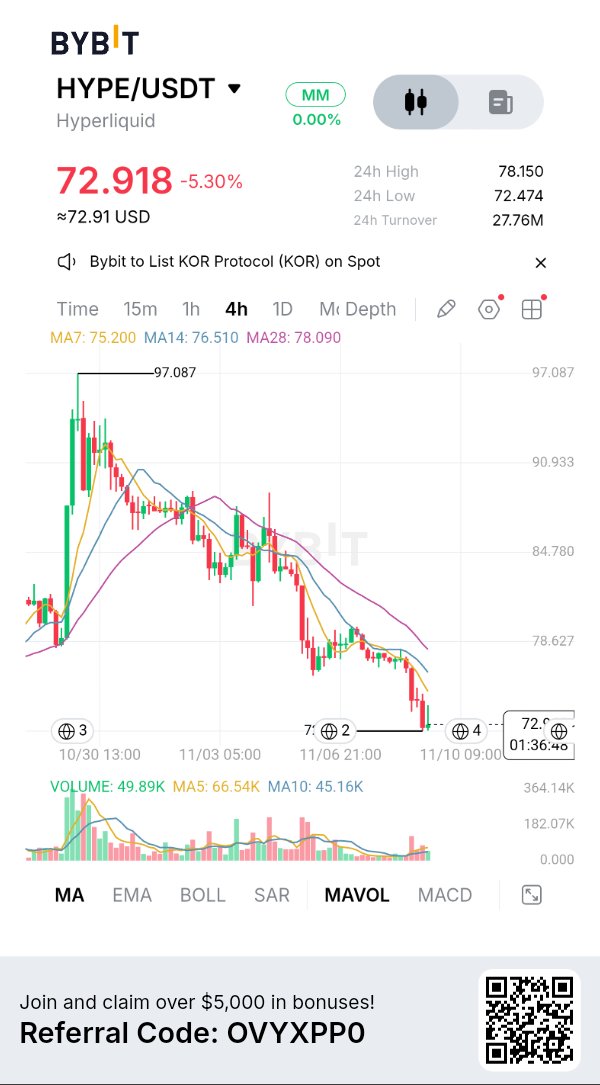
HYPE has pulled back significantly from its $97 peak and is working to build a base at $72.00 – $75.00 🌐⚡. While ecosystem fundamentals like the Elysium L2 launch are strong, price action demands patience 📊. The key level to watch is $75.20 — reclaiming it is the first true signal of recovery 💎📈. Keep your position sizing disciplined and let the market confirm the reversal! What’s your take? Are you buying the $72 support or waiting for a $75.20 reclaim? Drop your thoughts below! 👇$HYPEUSDT #IMPACTbyTrade
🚀 SOLANA: RECOVERY INCOMING?
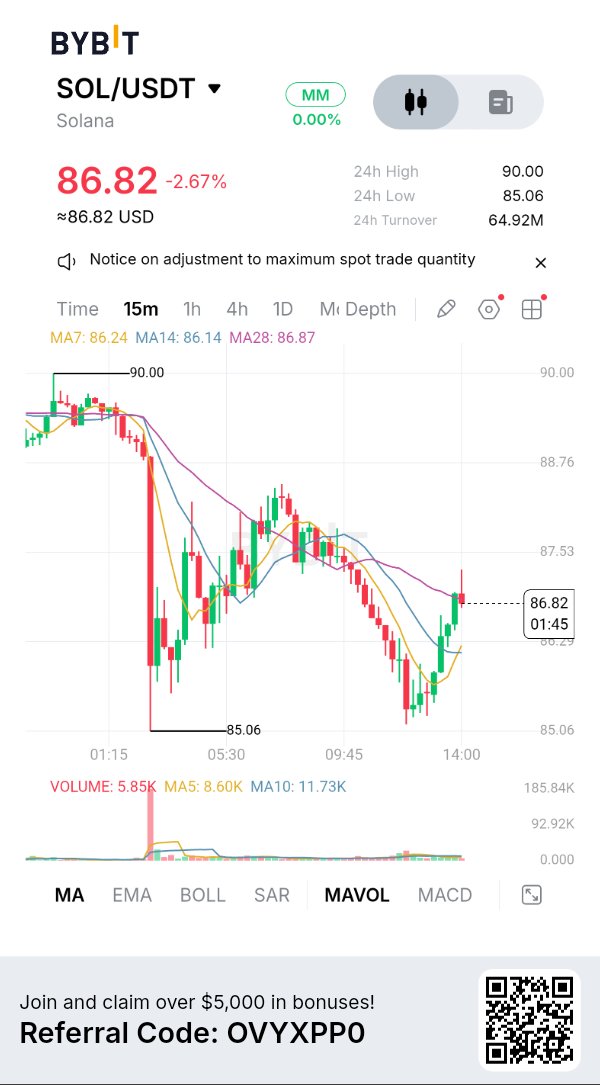
$SOLUSDT dropped sharply from the $96 resistance zone toward $85, but buyers are now showing some strength on the 15-minute chart. If SOL reclaims $88.25 with confirmation, we could see a recovery toward $90 and potentially $92. A long setup may develop, but the 4H trend remains bearish, so patience and proper risk management are essential. Can SOL make a comeback? 👀📈 #SOLUSDT #NovUSCPIWatch #WSOT2026
🚨 344 MILLONES DE DÓLARES EN BITCOIN SE HAN MOVIDO
Una transferencia masiva de Bitcoin ha puesto a Trump Media en el punto de mira del mercado. Carteras etiquetadas como “2028 Convertible Notes Collateral” supuestamente movieron 4.259 BTC, con un valor aproximado de 344 millones de dólares, a una dirección de Crypto.com en dos transacciones. Eso es casi el 30% de las tenencias de Bitcoin reportadas por Trump Media. Pero una transferencia no significa automáticamente una venta. Movimientos similares en mayo y agosto supuestamente no llevaron a una liquidación de mercado, lo que sugiere que una reestructuración de custodia o una gestión de colateral podría estar detrás del último movimiento.$BTCUSDT La mayor preocupación es el 30 de noviembre. Según los informes de valores presentados, los tenedores de bonos podrían tener derecho a exigir hasta 1.000 millones de dólares en reembolsos en efectivo. Con reservas de efectivo reportadas anteriormente de alrededor de 425 millones de dólares, los inversores están observando de cerca cualquier señal de ventas de activos o acuerdos de colateral adicionales. La pregunta clave: ¿Es esto simplemente una gestión institucional del balance, o podría el Bitcoin convertirse en una fuente de liquidez para las próximas obligaciones corporativas? Por ahora, la transferencia está confirmada por el movimiento on-chain reportado, pero no se ha establecido una venta real de Bitcoin. No confundas la actividad de las carteras con la presión vendedora del mercado. 📊 #WSOT2026 #NovObservatorioIPC-EEUU #Las nóminas de EE. UU. y las decisiones sobre tipos de interés marcan una semana macroeconómica

Bitcoin en punto de decisión
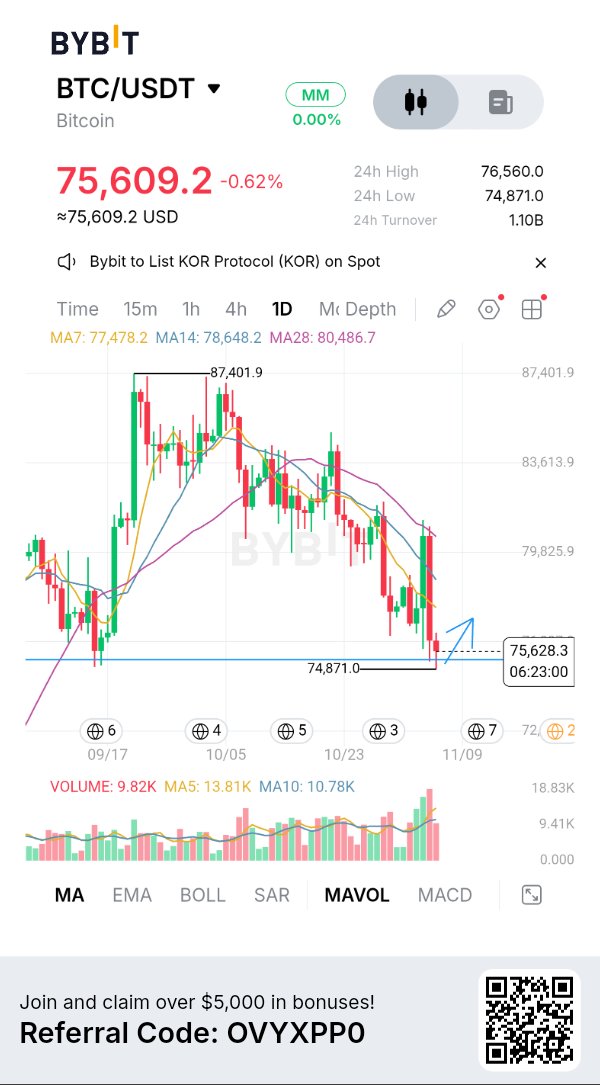
SOPORTE EN 75K — ¿DEFENDERÁN LOS TOROS EL SUELO? 🚀 Bitcoin está presionando actualmente la zona de soporte crítica de 75.000 $ tras un retroceso continuo desde máximos locales cerca de los 87.400 $ 🌐. El gráfico diario destaca un barrido de liquidez hasta los 74.871 $, situando al mercado en un punto decisivo de todo o nada 📈. Este es un nivel clave donde los compradores necesitan intervenir para evitar una corrección macro más profunda. ¿Puede $BTCUSDT estabilizarse aquí e iniciar una recuperación hacia los 78.000 $–80.000 $, o necesitamos más liquidez a la baja antes de un verdadero rebote? Analicémoslo 🧠. 1. La prueba de soporte de 75K: Observaciones clave 🔍 La acción del precio en el marco temporal de 1 día muestra una clara presión vendedora que arrastra a BTC por debajo de sus medias móviles (MA7: 77.478 $, MA14: 78.648 $, MA28: 80.486 $) 📉. Barrido de liquidez: BTC barrió a la baja hasta los 74.871 $ antes de absorber la presión vendedora inmediata, dejando una pequeña mecha en la vela diaria 🟢. Perfil de volumen: El volumen diario muestra una venta persistente, pero el volumen está empezando a contraerse cerca del suelo de soporte, lo que indica un posible agotamiento de los vendedores 🛡️. 2. Objetivos de recuperación: Lo que los toros necesitan reclamar 🧱 Si los compradores defienden este suelo de soporte diario, el objetivo principal será recuperar las medias móviles superiores 📊. Resistencia inmediata: 77.400 $ – 78.600 $ (Confluencia de MA7 y MA14) 🛑 Objetivo principal de ruptura: 80.400 $ línea de defensa MA28 🚀 Objetivo alcista extendido: 83.600 $ – 87.400 $ recuperación del máximo de oscilación macro 🎯 El escenario alcista: Un cierre de vela diaria fuerte por encima de 76.500 $ confirma un interés comprador agresivo, abriendo las puertas a un rápido rally de alivio hacia los 78.000 $–80.000 $ ⚡. El escenario de precaución: Si BTC no logra mantener el mínimo de 74.800 $ y pierde el soporte diario, el mercado corre el riesgo de extender su retroceso hacia zonas de demanda más bajas antes de establecer un fondo permanente 📉. 🎯 Niveles clave a vigilar 👀 Resistencia actual: 77.478 $ línea MA7 🛑 Zona principal de ruptura: 78.600 $ – 80.486 $ (confluencia de MA14 y MA28) 🟢 Suelo de soporte crítico es 74.871 $ – 75.000 $ mínimo local y demanda diaria 🛡️ Objetivo alcista macro: 78.000 $ – 80.000 $ (objetivos de rally de alivio)$XRPUSDT 🎯 por ahora Bitcoin está poniendo a prueba a los compradores en la zona de soporte de 75.000 $ 🌐⚡. Aunque un rebote hacia los 78.000 $–80.000 $ sigue siendo un escenario sólido de alta probabilidad, todavía necesitamos volumen de compra real y una reacción fuerte al cierre diario para confirmar la reversión 💎📈. No te apresures a realizar operaciones no confirmadas, espera la confirmación estructural, respeta tus stop loss y opera con disciplina. ¿Cuál es tu plan? ¿Vamos a mantener los 75K para una reversión a 80K, o romperemos a la baja primero? ¡Deja tus pensamientos abajo! 👇 #IMPACTbyTrade #WSOT2026 #NovObservatorioIPC-EEUU