ZENBIOA
6540Me gusta0Compartir en el chat238Aficionados95Seguir
Crypto trader | Charts, setups, & market psychology in one place..
Crypto trader | Charts, setups, & market psychology in one place..
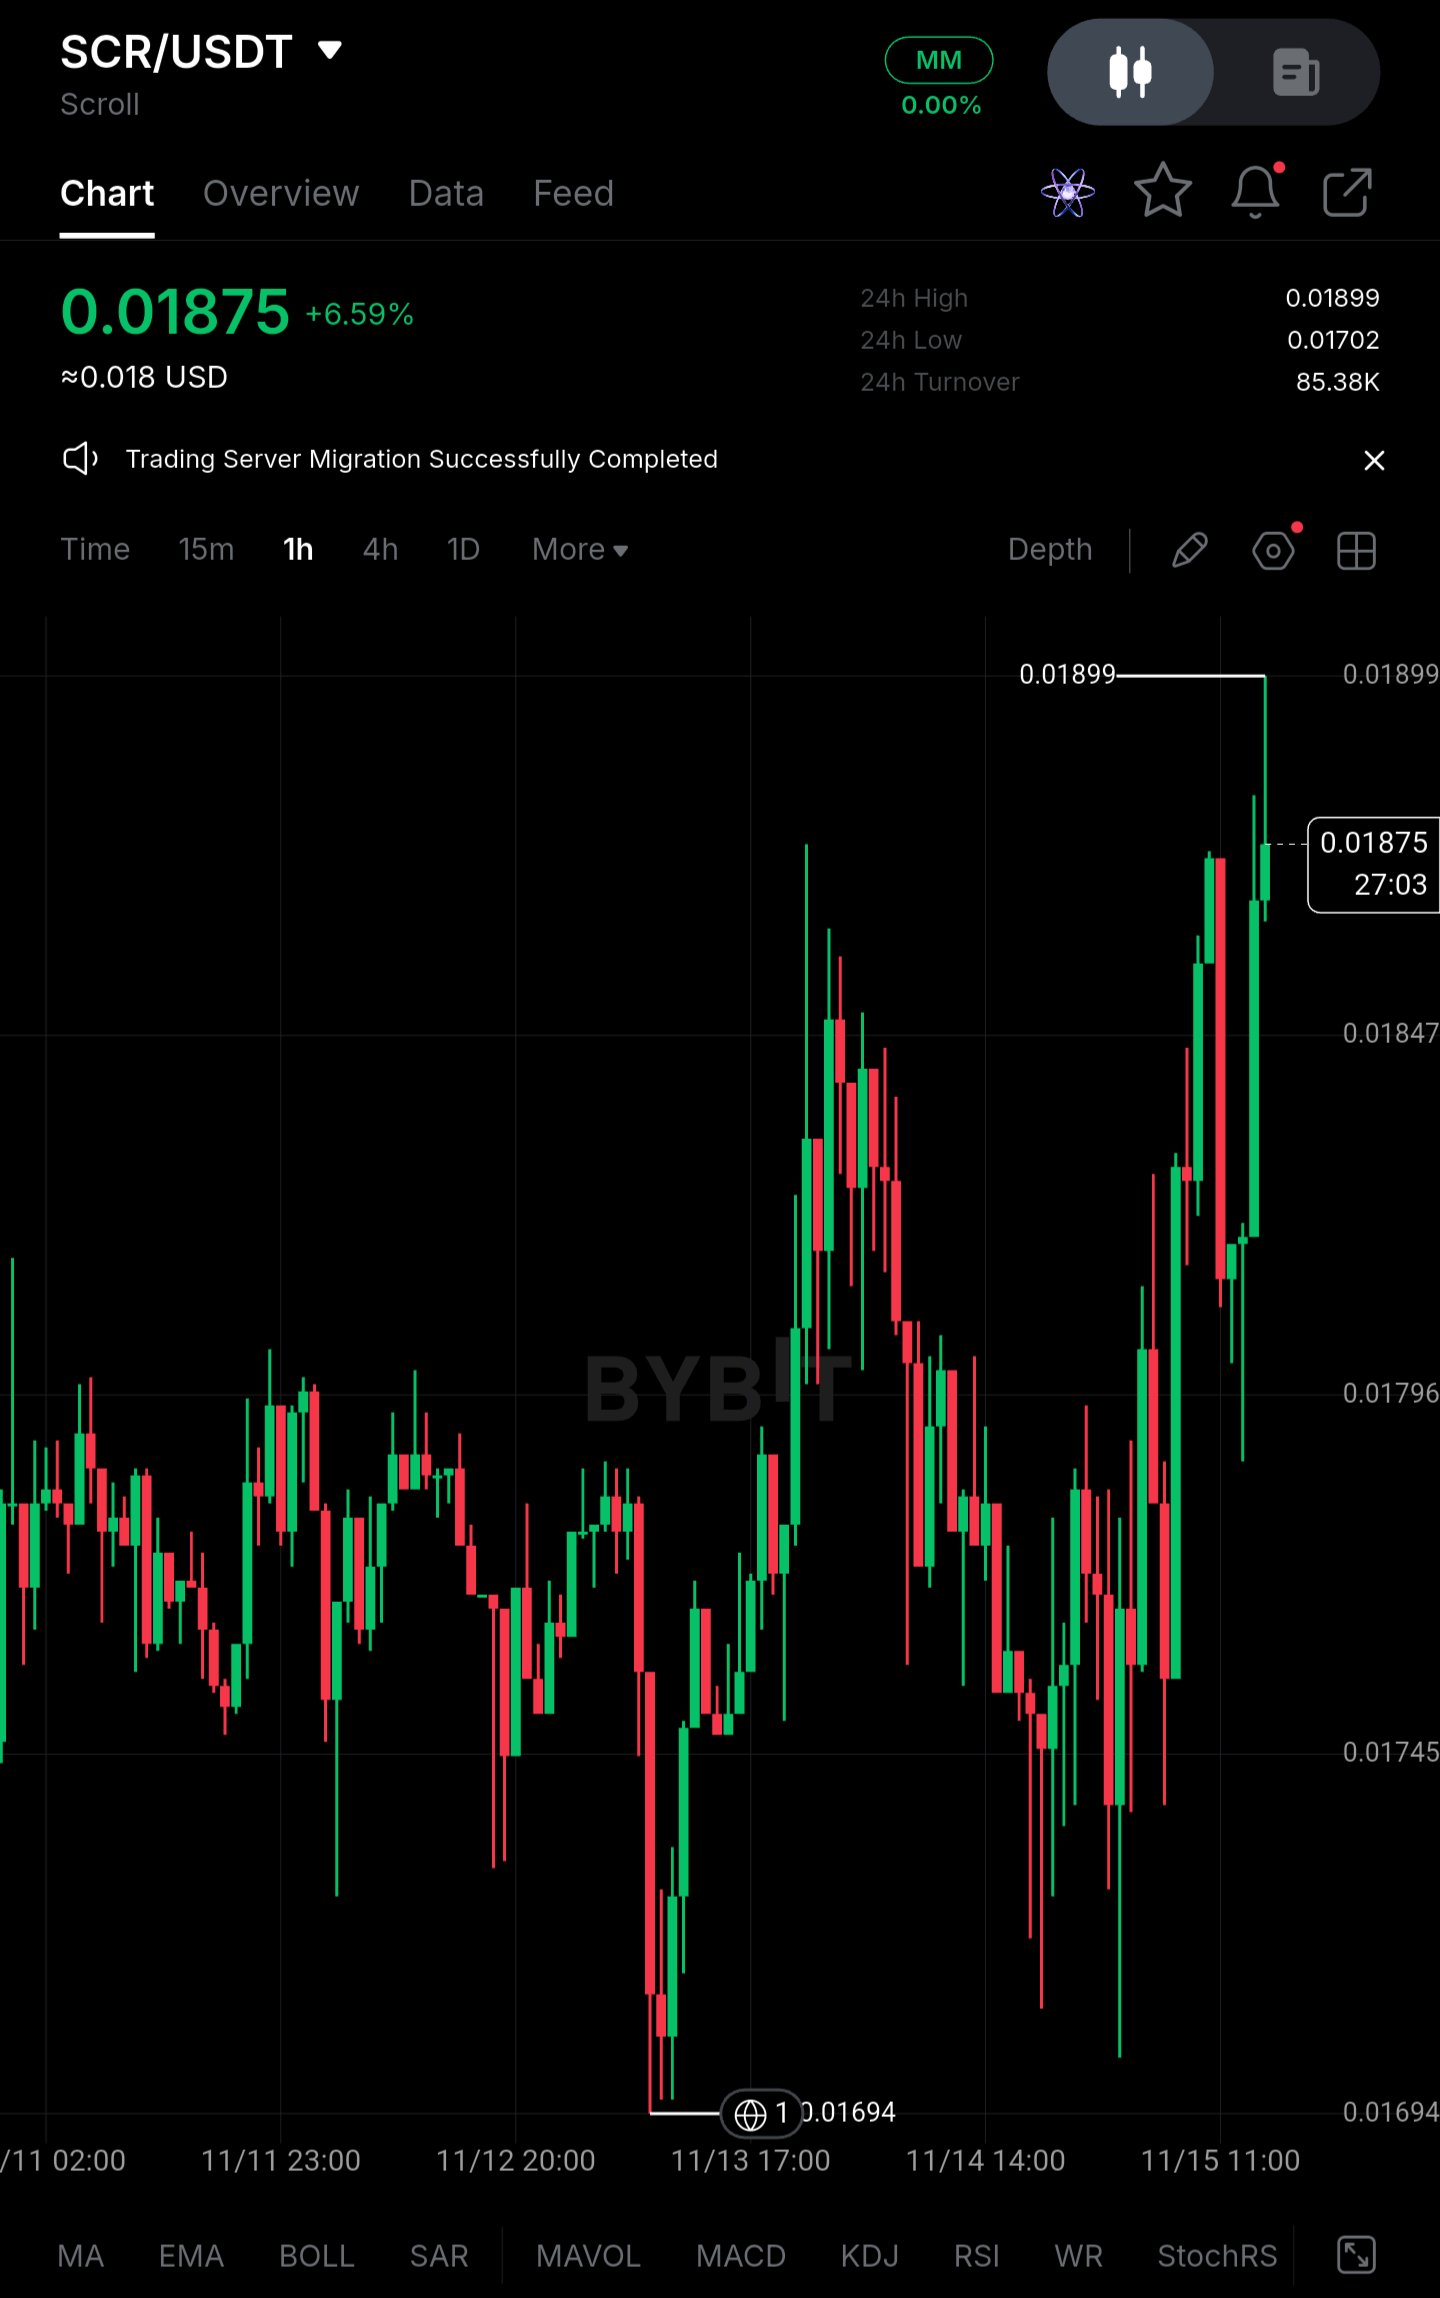
$SCRUSDT | Scroll holds near $0.0188 after a $0.01694 low, but this is not a recovery yet** Scroll (SCR) is trading around $0.01875 on the 1h chart, roughly 10% above the $0.01694 low printed on 11/13. I am not treating the current bounce as a recovery. The larger concern is the combination of institutional-scale selling pressure and a derivatives market that still leans heavily long. Whether spot demand can absorb supply, or another liquidity sweep is still ahead, remains unresolved. **Price Action** SCR is up 6.59% over the last 24 hours, within a 24h range of $0.01702 to $0.01899. The rebound off $0.01694 was sharp, but the structure since then is a series of higher lows with repeated rejection near $0.01899. The latest push into that level left a long upper wick, which signals supply at the highs. Immediate resistance sits at $0.01899, with $0.01847 as the first intraday level to defend. First support is $0.01796, followed by the $0.01745 to $0.01694 demand zone. A clean hourly close above $0.01899 would shift short-term structure, but it would not by itself reverse the broader trend, which remains under pressure. **Institutional / Large Capital Picture** SCR is a small-cap Layer 2 token, so there is no ETF channel to track. Large-wallet distribution, unlock-related supply and exchange inflows are the relevant signals. Demand has been inconsistent: the 11/12 to 11/13 sell-off printed heavy red candles with little immediate absorption, and the rebound was driven by thin, fast moves rather than steady accumulation. 24h turnover of roughly 85.38K is modest, which means a few large orders can move price in either direction. The move to $0.01694 had the character of a liquidity-driven flush rather than organic selling alone. **Liquidity & Range Conditions** Price has compressed into a relatively narrow band between $0.0180 and $0.0190 after the decline. A narrow range after a sharp drop is not evidence of accumulation. Without a clear rise in spot volume, it more often reflects pause and positioning before the next directional move. Stronger spot participation is still required to validate any bullish read. **Derivatives Positioning** Exact figures are not visible on the chart, so these are estimates based on price behavior and typical positioning for this asset: - Open interest: elevated relative to spot turnover, likely in the low-to-mid single-digit millions USD - Funding rate: positive, around +0.01% per 8h, meaning longs are paying shorts - Long/short ratio: roughly 60% of accounts long Positive funding combined with a long-tilted ratio creates vulnerability. If $0.01796 breaks, stop clusters and leveraged longs would likely unwind quickly, extending the move toward the prior low. **Key Figures** - Current price: ~$0.01875 - Immediate resistance: $0.01899 - Intermediate level: $0.01847 - Support zone: $0.01796 to $0.01745 - Recent low: $0.01694 - 24h turnover: ~85.38K - Funding: positive (~+0.01%, estimated) - Long share: ~60% (estimated) **Confirmation Levels** - Bullish: a sustained hourly close above $0.01899 with rising spot volume opens a move toward $0.0195 to $0.0200. - Bearish: a break below $0.01796 exposes $0.01745, and a loss of that level reopens a retest of $0.01694 with a risk of a lower low and fresh long liquidations. **Closing** SCR has stabilized, but stabilization is not the same as recovery. Selling pressure from larger holders and crowded long positioning are still competing with the rebound attempt. The decisive signal is whether spot buyers return while leverage stays controlled, or whether another support breakdown triggers a new wave of long liquidations. #ByXIMPACT
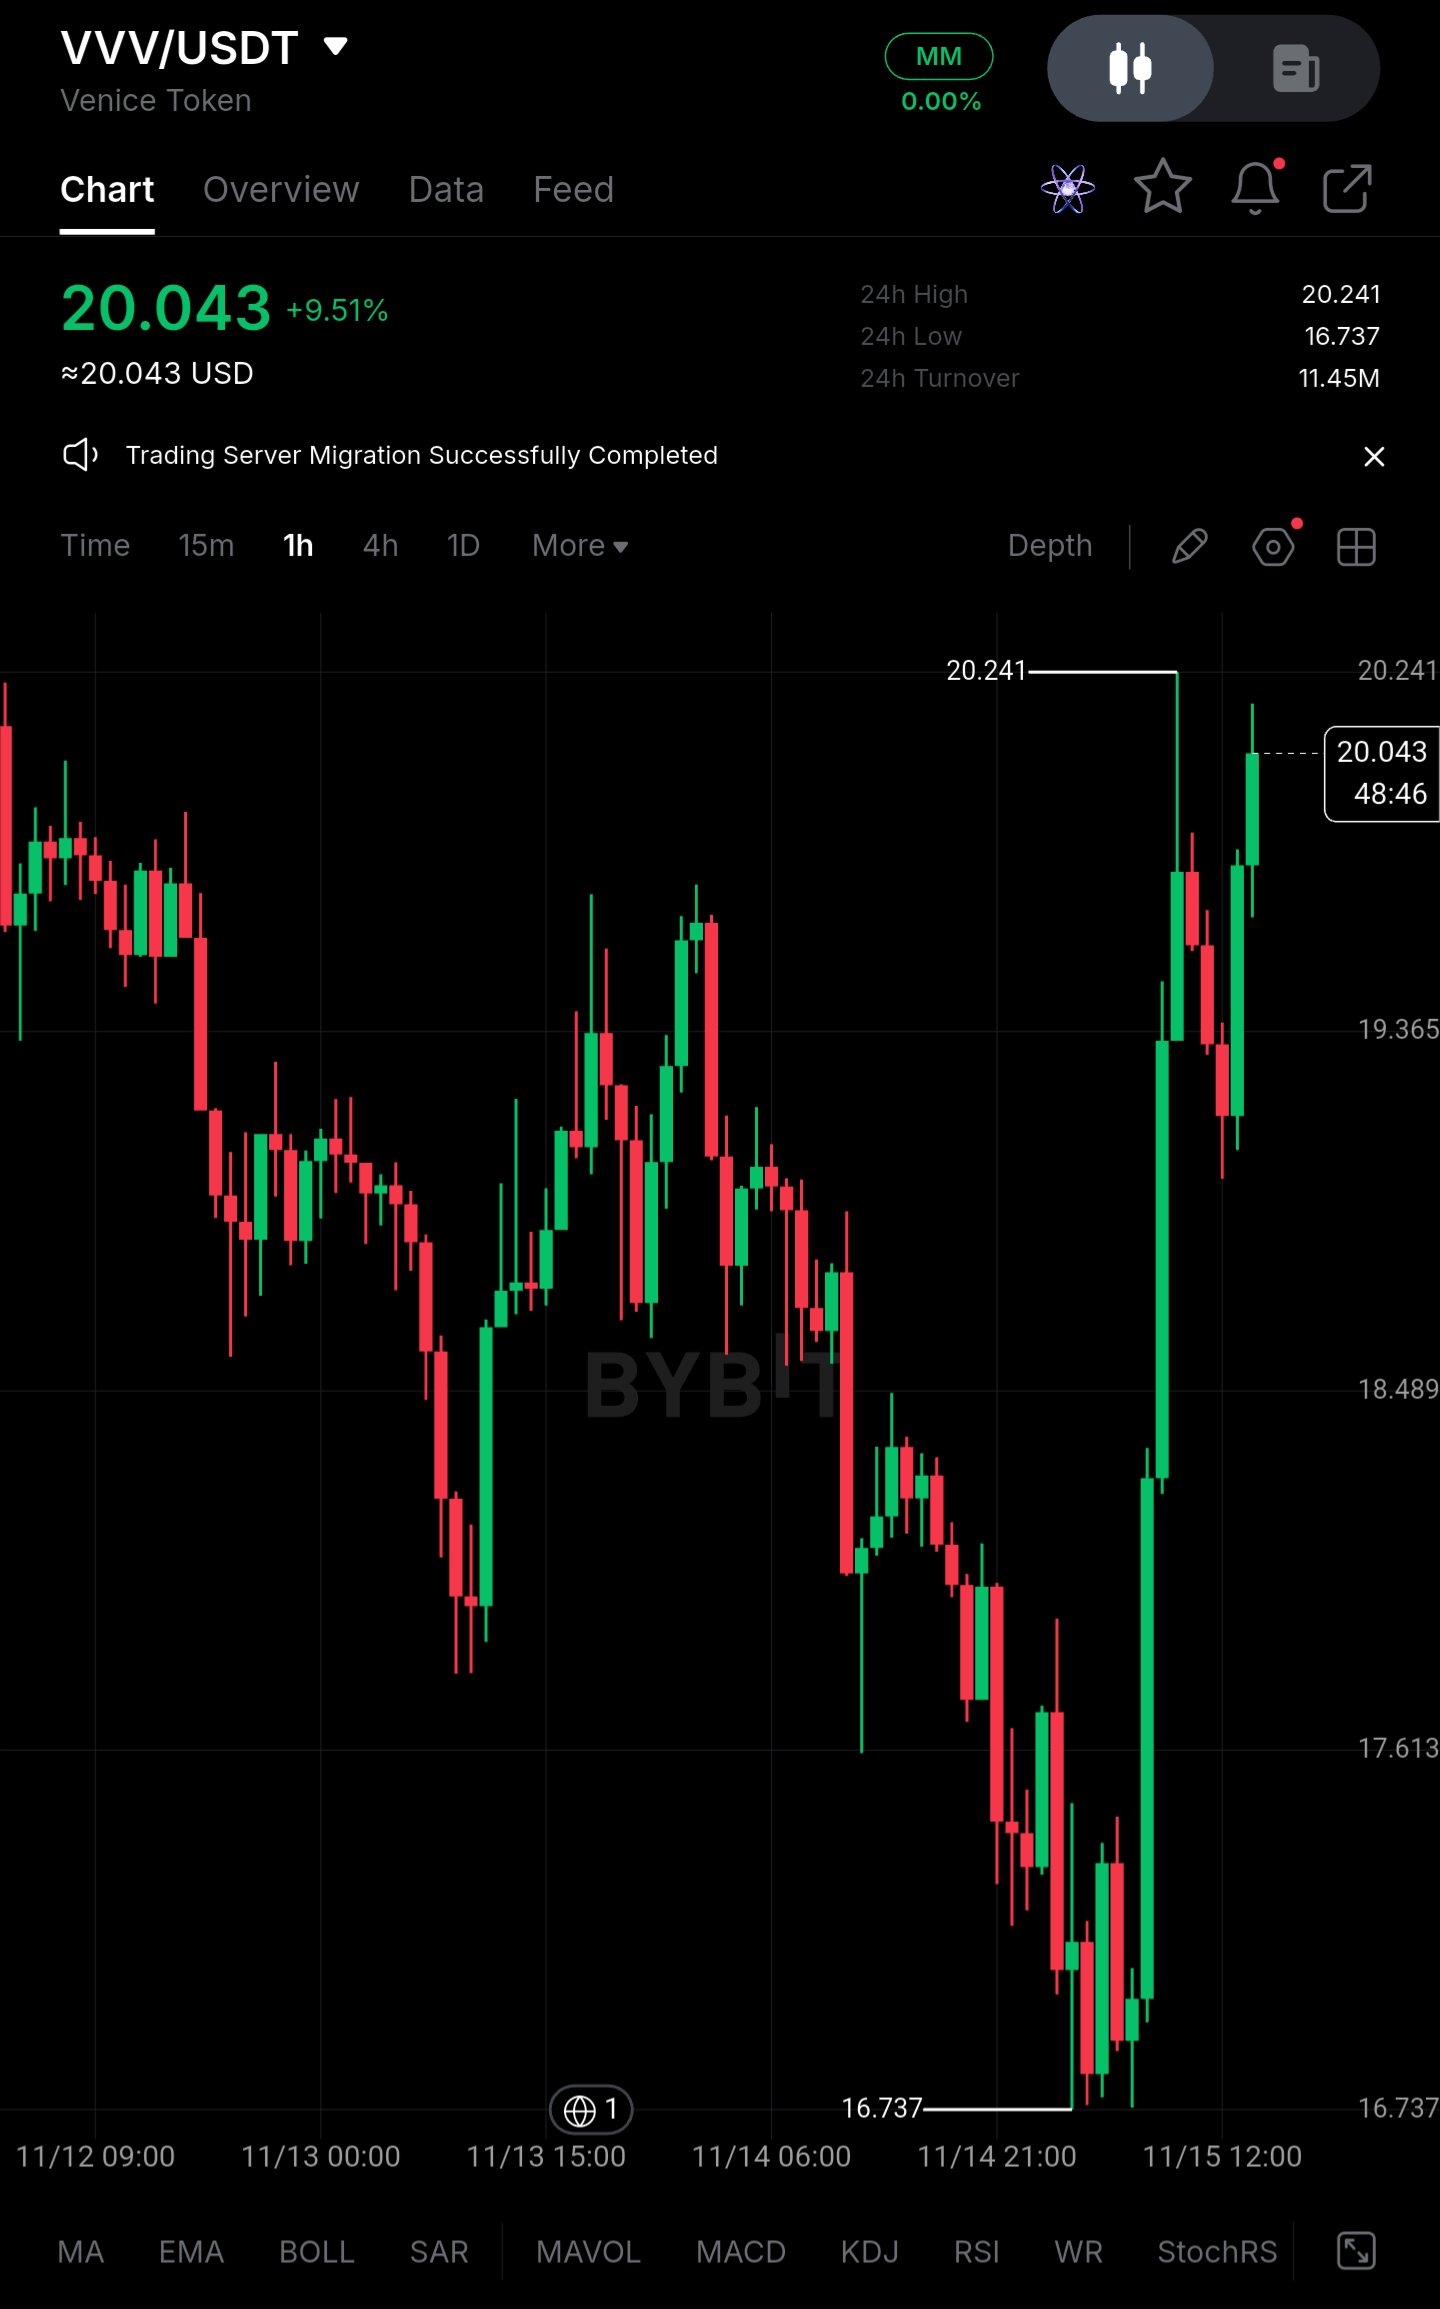
$VVVUSDT – Higher Timeframe Overview | Long on Pullback** Pair: $VVVUSDT (1H chart, Bybit) Looking at the 1H chart, VVV spent most of the last few days drifting lower and chopping around, with a clear sequence of lower highs from 11/13 into 11/14. Price bottomed at 16.737, then reversed with one of the strongest candles on the chart and pushed all the way to 20.241. It's now trading around 20.04, up roughly 9.5% on the day. I didn't catch the bounce from the lows, so I'd rather wait for a proper pullback than chase this. **Current Outlook and Key Levels** **Buying Zone: 18.489 – 19.365** This is the area where the vertical rally started to accelerate, so it's the first place I'd expect buyers to defend if price cools off. It's also a sensible retracement area for a move this extended. I'm looking for the pullback to slow down, wicks to get absorbed, and a 1H candle to close back up from the zone. A touch alone isn't enough. **Resistance Zone: 20.04 – 20.241** The 24h high at 20.241 is the obvious overhead level, and price is already pressing into it. Sellers who bought the way down may use this as a chance to exit. A clean break and sustained consolidation above 20.241 would suggest the rally is more than a one-off squeeze and that the structure is shifting higher. **Trading Setup** **Position:** Long on pullback **Entry Zone:** 18.489 – 19.365 (only after a buyer reaction, not as a blind limit) **Stop-Loss:** Below 17.613 **Invalidation:** A 1H close below 17.613 would mean the pullback is no longer a healthy retracement. It would put price back into the lower part of the previous range, and the reversal would be suspect. **Take-Profits:** - TP1: 20.241 (24h high) - TP2: No verified level above 20.241 yet. If price breaks and holds above it, I'd trail the stop and reassess instead of forcing a target. **Why This Setup Makes Sense** Buying near 20.0 means entering right under the local high after an impulsive move, with a stop that would have to sit far away. Even a small retracement would hurt the risk-to-reward. A pullback into 18.489 – 19.365 gives a more structured entry, with the stop below 17.613 and the first target at the recent high, which is a much better ratio. The reaction matters as much as the level. If buyers step in and hold, the zone is doing its job. If price slices through without a bounce, the setup isn't there and I stay out. Patience costs very little here, while chasing after a +9.5% day often means buying someone else's exit. **Risk Management** Stick to the plan. Don't move or remove the stop-loss, and size the position so a stop-out is an acceptable loss. A bullish reversal can still fail, and no setup guarantees a profit. This is not financial advice. #ByXIMPACT
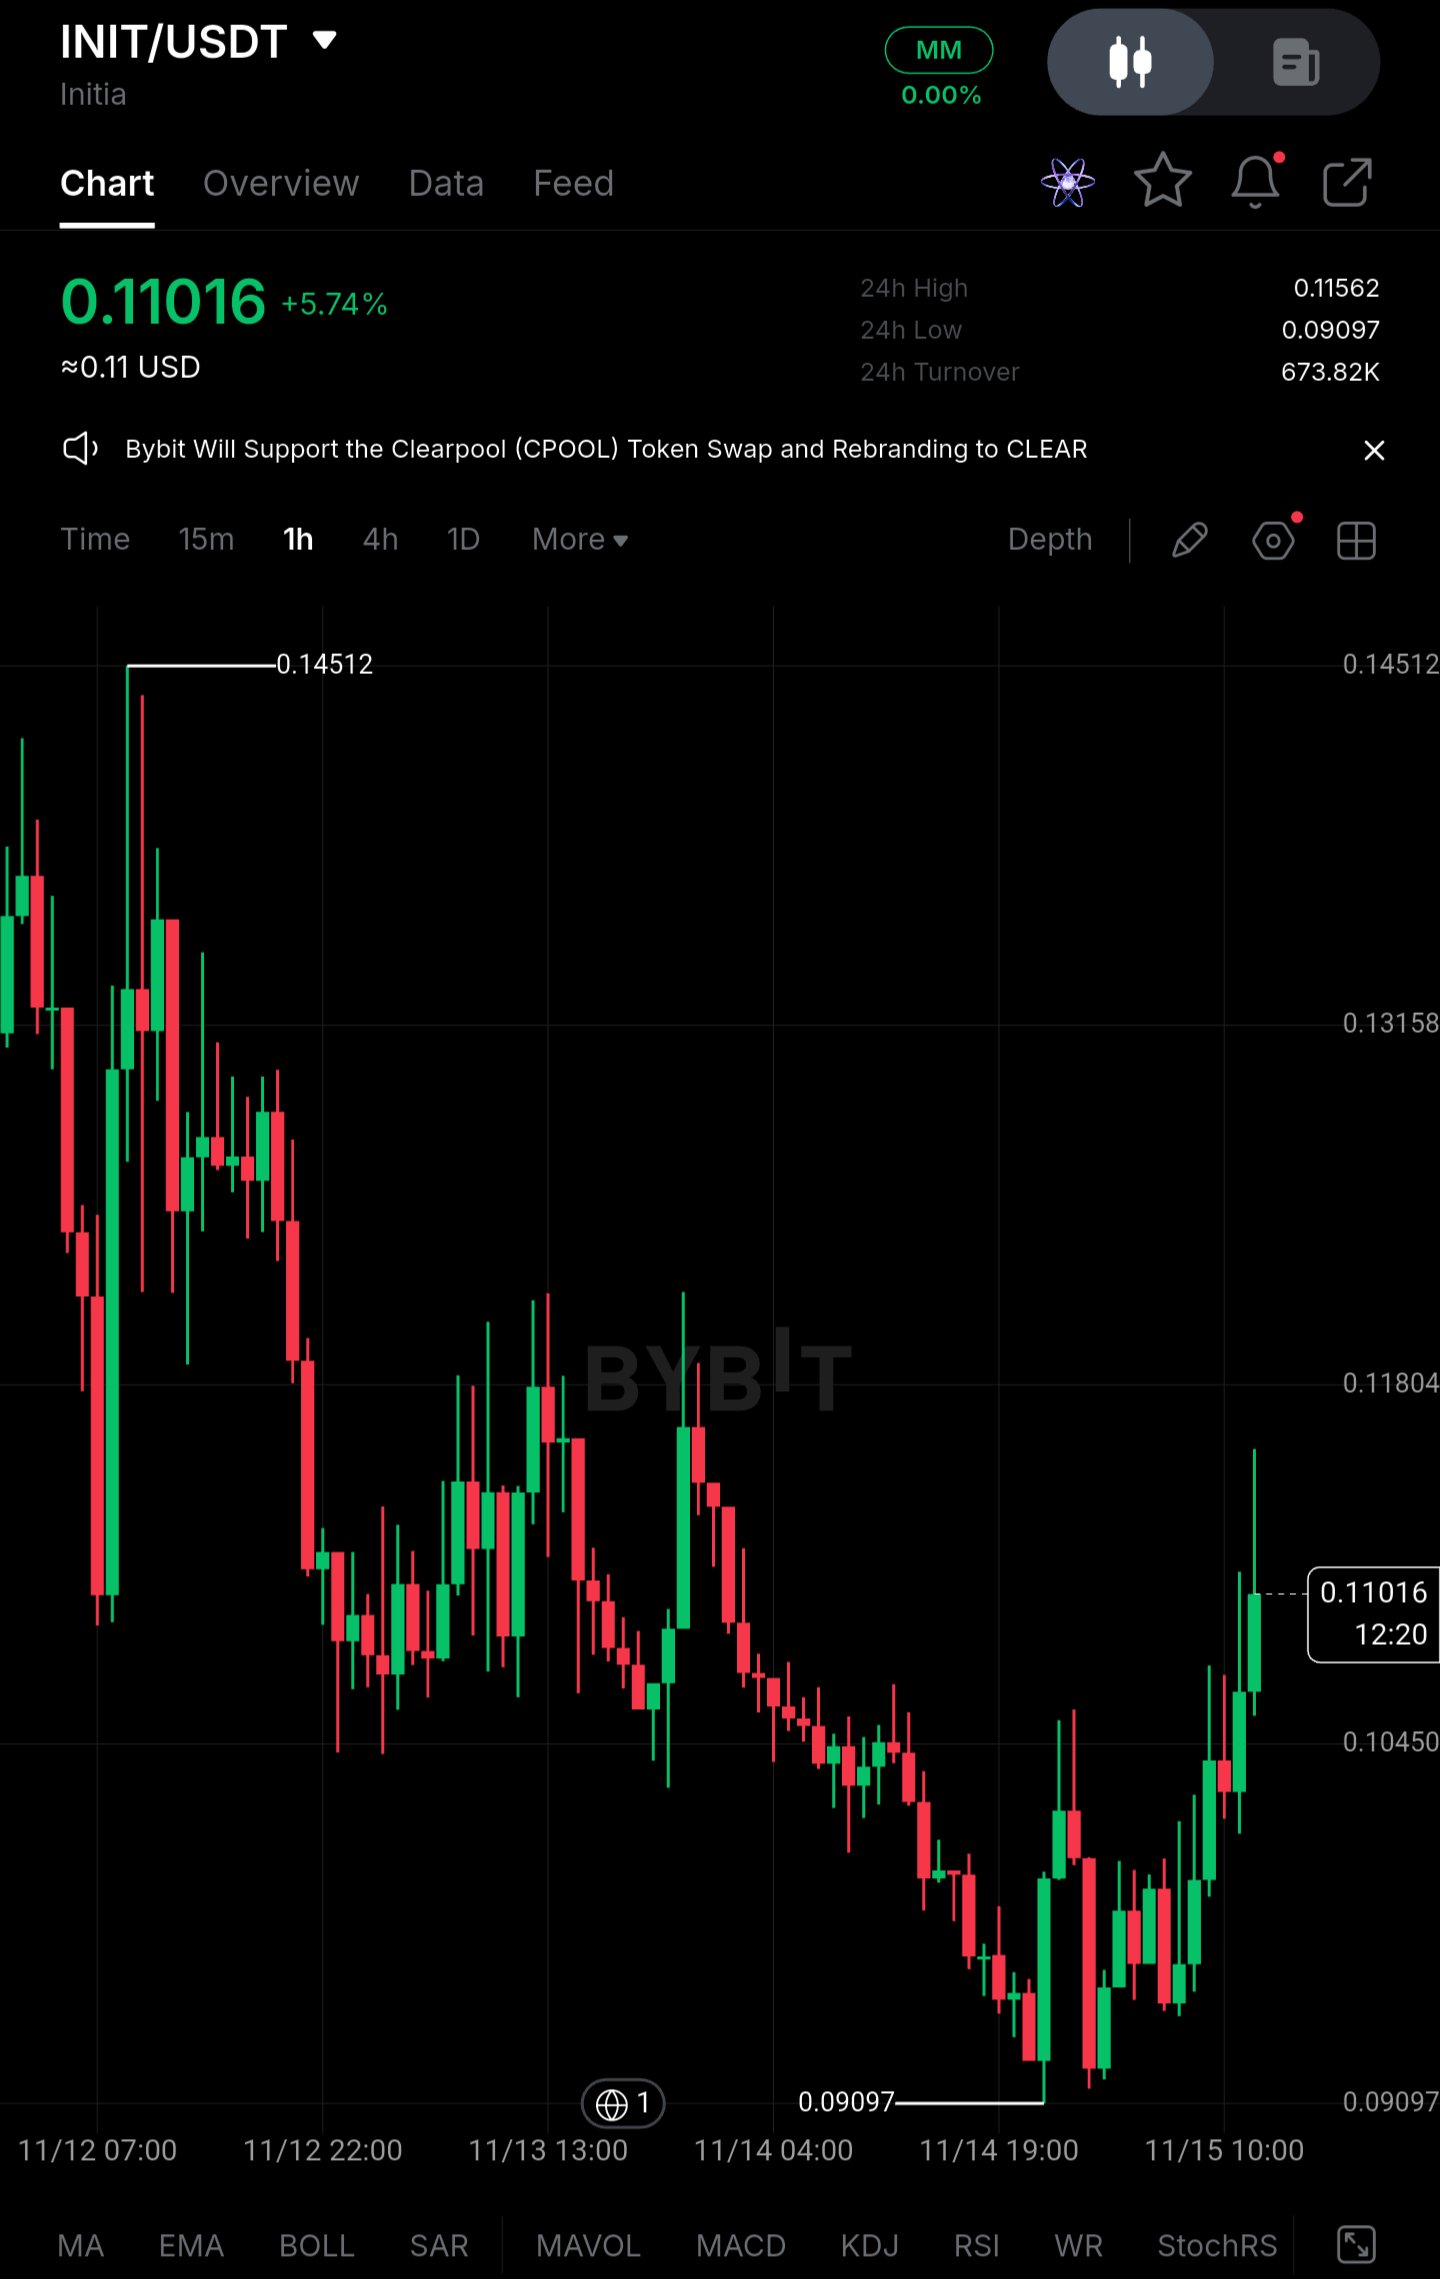
$INITUSDT – Higher Timeframe Overview | Long on Pullback** Pair: $INITUSDT INIT has spent the last few sessions in a steady downtrend, sliding from the 0.14512 high to a low of 0.09097. I didn't have any interest in catching that fall. Price has since bounced sharply, now around 0.11016 (+5.74% on the day), with the last few 1h candles pushing up and a long wick printing near the top of the move. One strong green run after a long decline doesn't tell me the trend has changed. It tells me buyers showed up at the lows, and now I want to see whether they defend higher prices. **Current Outlook and Key Levels** **Buying Zone: around 0.10450** This level sits roughly midway between the 0.09097 low and the bounce high, and it's where price consolidated before the recent push. A pullback into this area would be a retest of the breakout base. I'd want to see the selling slow down, lower wicks form, and buyers close candles back above the level. If price just slices through it on heavy red candles, there's nothing to buy. **Resistance Zone: 0.11562 – 0.11804** 0.11562 is the 24h high, and 0.11804 is the next level above it, where earlier price action found sellers on the way down. Sellers have a reason to respond here. A clean break and sustained consolidation above 0.11804, with candles holding above it instead of wicking back under, would suggest the downtrend is losing control and open the way toward the higher levels on the chart. **Trading Setup** **Position:** Long on pullback **Entry Zone:** around 0.10450 (only on buyer confirmation, not by default) **Stop-Loss:** below 0.09097 **Invalidation:** A break below the 0.09097 low means the bounce has failed and the downtrend is resuming. At that point the setup no longer has structure behind it. **Take-Profits:** - TP1: 0.11804 - TP2: 0.13158 - TP3: 0.14512 **Why This Setup Makes Sense** After a bounce this sharp, buying near 0.11 puts you right under the 24h high, with resistance close overhead and a long way to the stop. That's a poor risk profile, and it's how people end up buying the top of a relief move. Waiting for a retest of 0.10450 gives a more defined entry. If buyers defend it, the structure of higher lows starts to build. If they don't, you've lost nothing and the plan stays unchanged. The targets follow the levels visible on the chart. TP1 is the first real resistance, TP2 and TP3 are the next levels on the way back toward the previous high. The stop below 0.09097 is wide, which keeps the trade honest about what would actually invalidate it, but it also means TP1 only offers roughly 1:1 from the entry. The setup gets better with TP2 and TP3, so partial profits at TP1 make sense. **Risk Management** Stick to the plan and don't move the stop because price feels like it will turn. Because the stop is wide, position size should be smaller than usual. A recovery bounce can fail just as easily as it can continue, and no setup guarantees a profit. *Levels are taken from the 1h Bybit chart and are not financial advice.* #ByXIMPACT
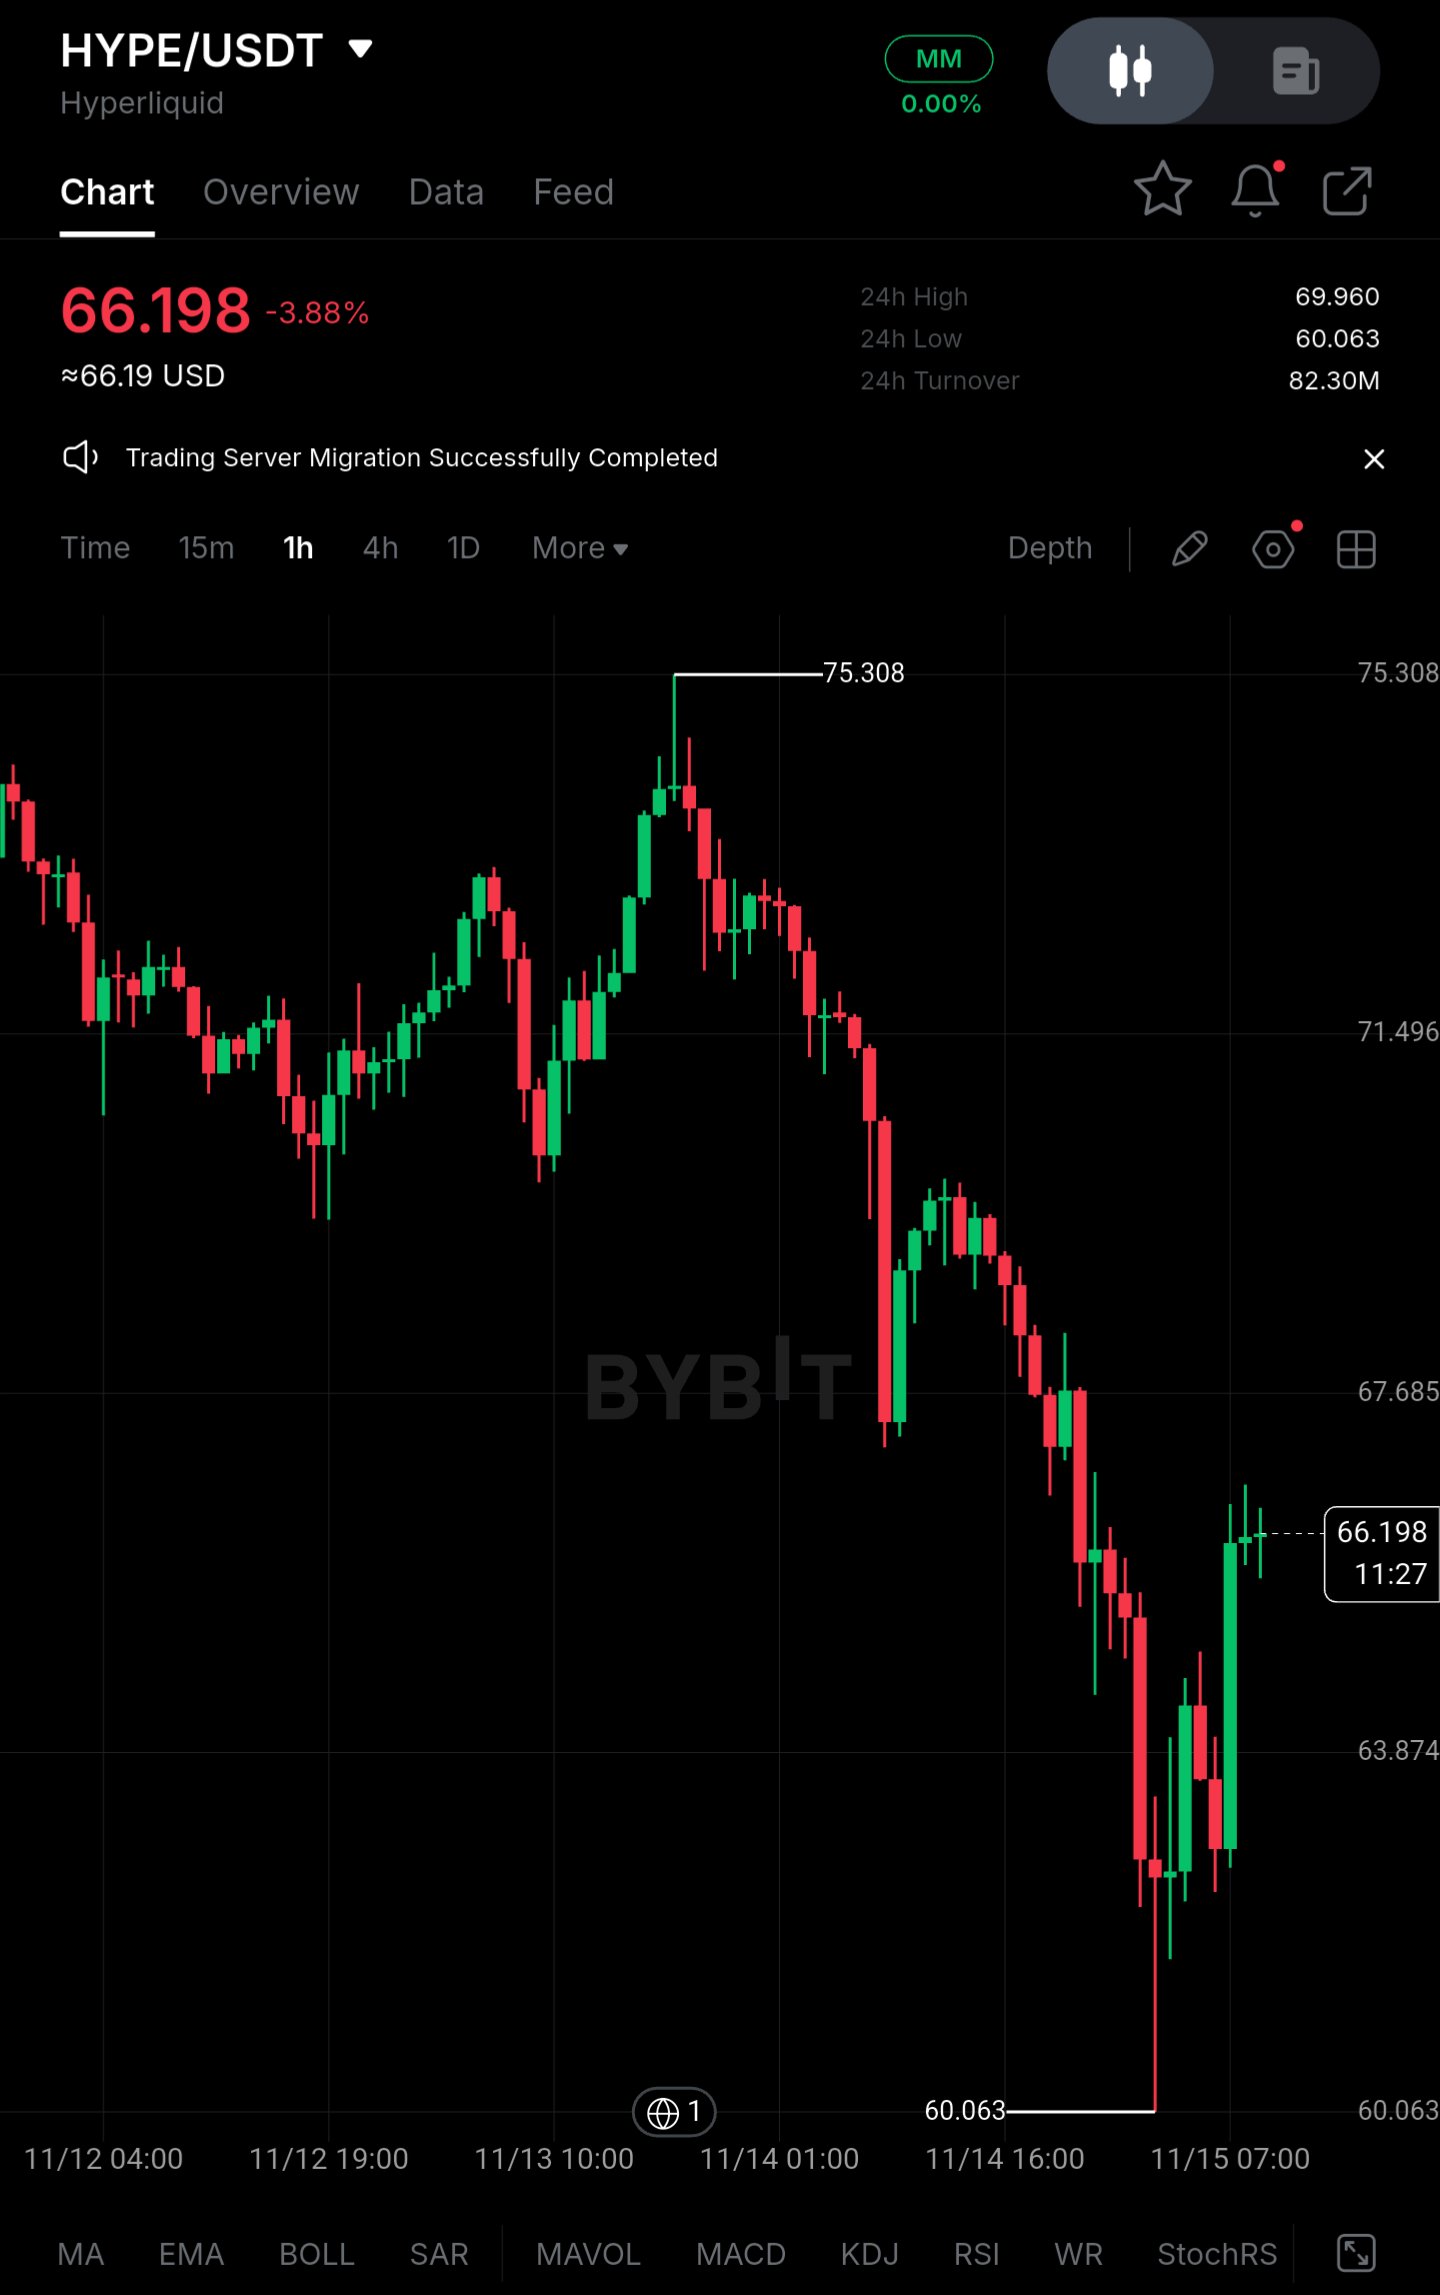
$HYPEUSDT se mantiene cerca de los 66 $ tras un barrido hasta los 60,06 $, pero todavía no lo considero una recuperación** HYPE/USDT cotiza alrededor de los 66,20 $ (-3,88 % en el día) tras alcanzar los 60,06 $ con una mecha, su nivel más bajo en el periodo. La estructura horaria muestra un rebote dentro de una tendencia bajista, no un cambio de tendencia. La preocupación más importante es la distribución de las grandes carteras combinada con un posicionamiento en derivados que sigue inclinado hacia posiciones largas. **Acción del precio** - Precio actual: ~66,20 $, alrededor de un 10 % por encima del mínimo de 60,06 $ y un 12 % por debajo del máximo de 75,31 $. - Descenso: alrededor de un -20 % desde el máximo al mínimo en aproximadamente tres sesiones, con una capitalización de mercado de unos 22 000 millones de dólares en los niveles actuales (aproximadamente). - Resistencia inmediata: 67,70 $–69,96 $. El máximo de 24 horas en 69,96 $ es la primera prueba real. - Primer soporte: 63,87 $, seguido del barrido mínimo en 60,06 $. - El rebote ha producido una fuerte vela verde horaria desde el mínimo, seguida de velas de cuerpo pequeño. Eso es un alivio, no una reversión confirmada. La secuencia de máximos decrecientes desde los 75,31 $ permanece intacta. **Panorama del gran capital** - A HYPE le faltan los datos de flujo de ETF que tienen BTC y ETH, por lo que la lectura proviene de los flujos de los exchanges y el comportamiento de las grandes carteras. Las velas impulsivas de venta, seguidas de una larga mecha inferior, son coherentes con ventas forzadas sumadas a compras oportunistas en la caída. - La demanda parece inconsistente. Las velas verdes en el rebote no están acompañadas de un volumen de seguimiento sostenido. El volumen de negocio de 24 horas de unos 82,3 millones de dólares es modesto en relación con el tamaño de la caída. - El aviso del exchange sobre la migración del servidor de trading es un recordatorio de que los eventos de infraestructura y liquidez pueden amplificar los movimientos en cualquier dirección. **Condiciones de liquidez y rango** - El precio se ha comprimido en un rango estrecho justo por debajo de los 67 $ tras la fuerte caída. Un rango estrecho después de una caída no es prueba de acumulación. Con mayor frecuencia refleja una pausa de los vendedores mientras la liquidez se reconstruye. - Se requiere una mayor participación en el mercado spot antes de que este rango pueda interpretarse de forma constructiva. **Posicionamiento en derivados** - Interés abierto: elevado en relación con el volumen spot, estimado en el extremo superior de su rango reciente (aproximadamente; verificar en un panel de derivados). - Financiación: estimada ligeramente positiva, lo que significa que las posiciones largas siguen pagando a las cortas. - Largo/corto: aproximadamente el 55–60 % de las cuentas están en largo (estimación). - Este posicionamiento es la vulnerabilidad. Si los 63,87 $ fallan, las posiciones largas abarrotadas que sobrevivieron al primer barrido se convierten en combustible para un segundo tramo a la baja. **Cifras clave** - Precio actual: ~66,20 $ - Resistencia inmediata: 67,70 $–69,96 $ - Soporte: 63,87 $ - Mínimo reciente: 60,06 $ - Rango de 24 h: 60,06 $–69,96 $ - Volumen de 24 h: ~82,3 millones $ - OI / financiación: elevado / ligeramente positivo (estimado) - Cuota de posiciones largas: ~55–60 % (estimado) **Niveles de confirmación** - **Alcista:** Un cierre horario y mantenerse por encima de los 69,96 $ sería la primera señal de fortaleza. Abriría el camino a los 71,50 $, con los 75,31 $ como objetivo mayor. - **Bajista:** Un cierre por debajo de los 63,87 $ expone una nueva prueba de los 60,06 $. Una ruptura por debajo de eso abre un bolsillo de liquidez más profundo y probablemente desencadene una nueva ronda de liquidaciones de posiciones largas. **Cierre** El mercado está estable por ahora, pero la estabilidad no es demanda. Las ventas de grandes carteras y el posicionamiento abarrotado en largo compiten con el intento de recuperación. La señal decisiva es si los compradores en el mercado spot regresan mientras el apalancamiento permanece controlado, o si otra ruptura del soporte desencadena nuevas liquidaciones de posiciones largas. Hasta que ocurra lo primero, los repuntes hacia la resistencia merecen escepticismo. *No es asesoramiento financiero. Las cifras de derivados son estimaciones, no datos en tiempo real.* $ByXIMPACT
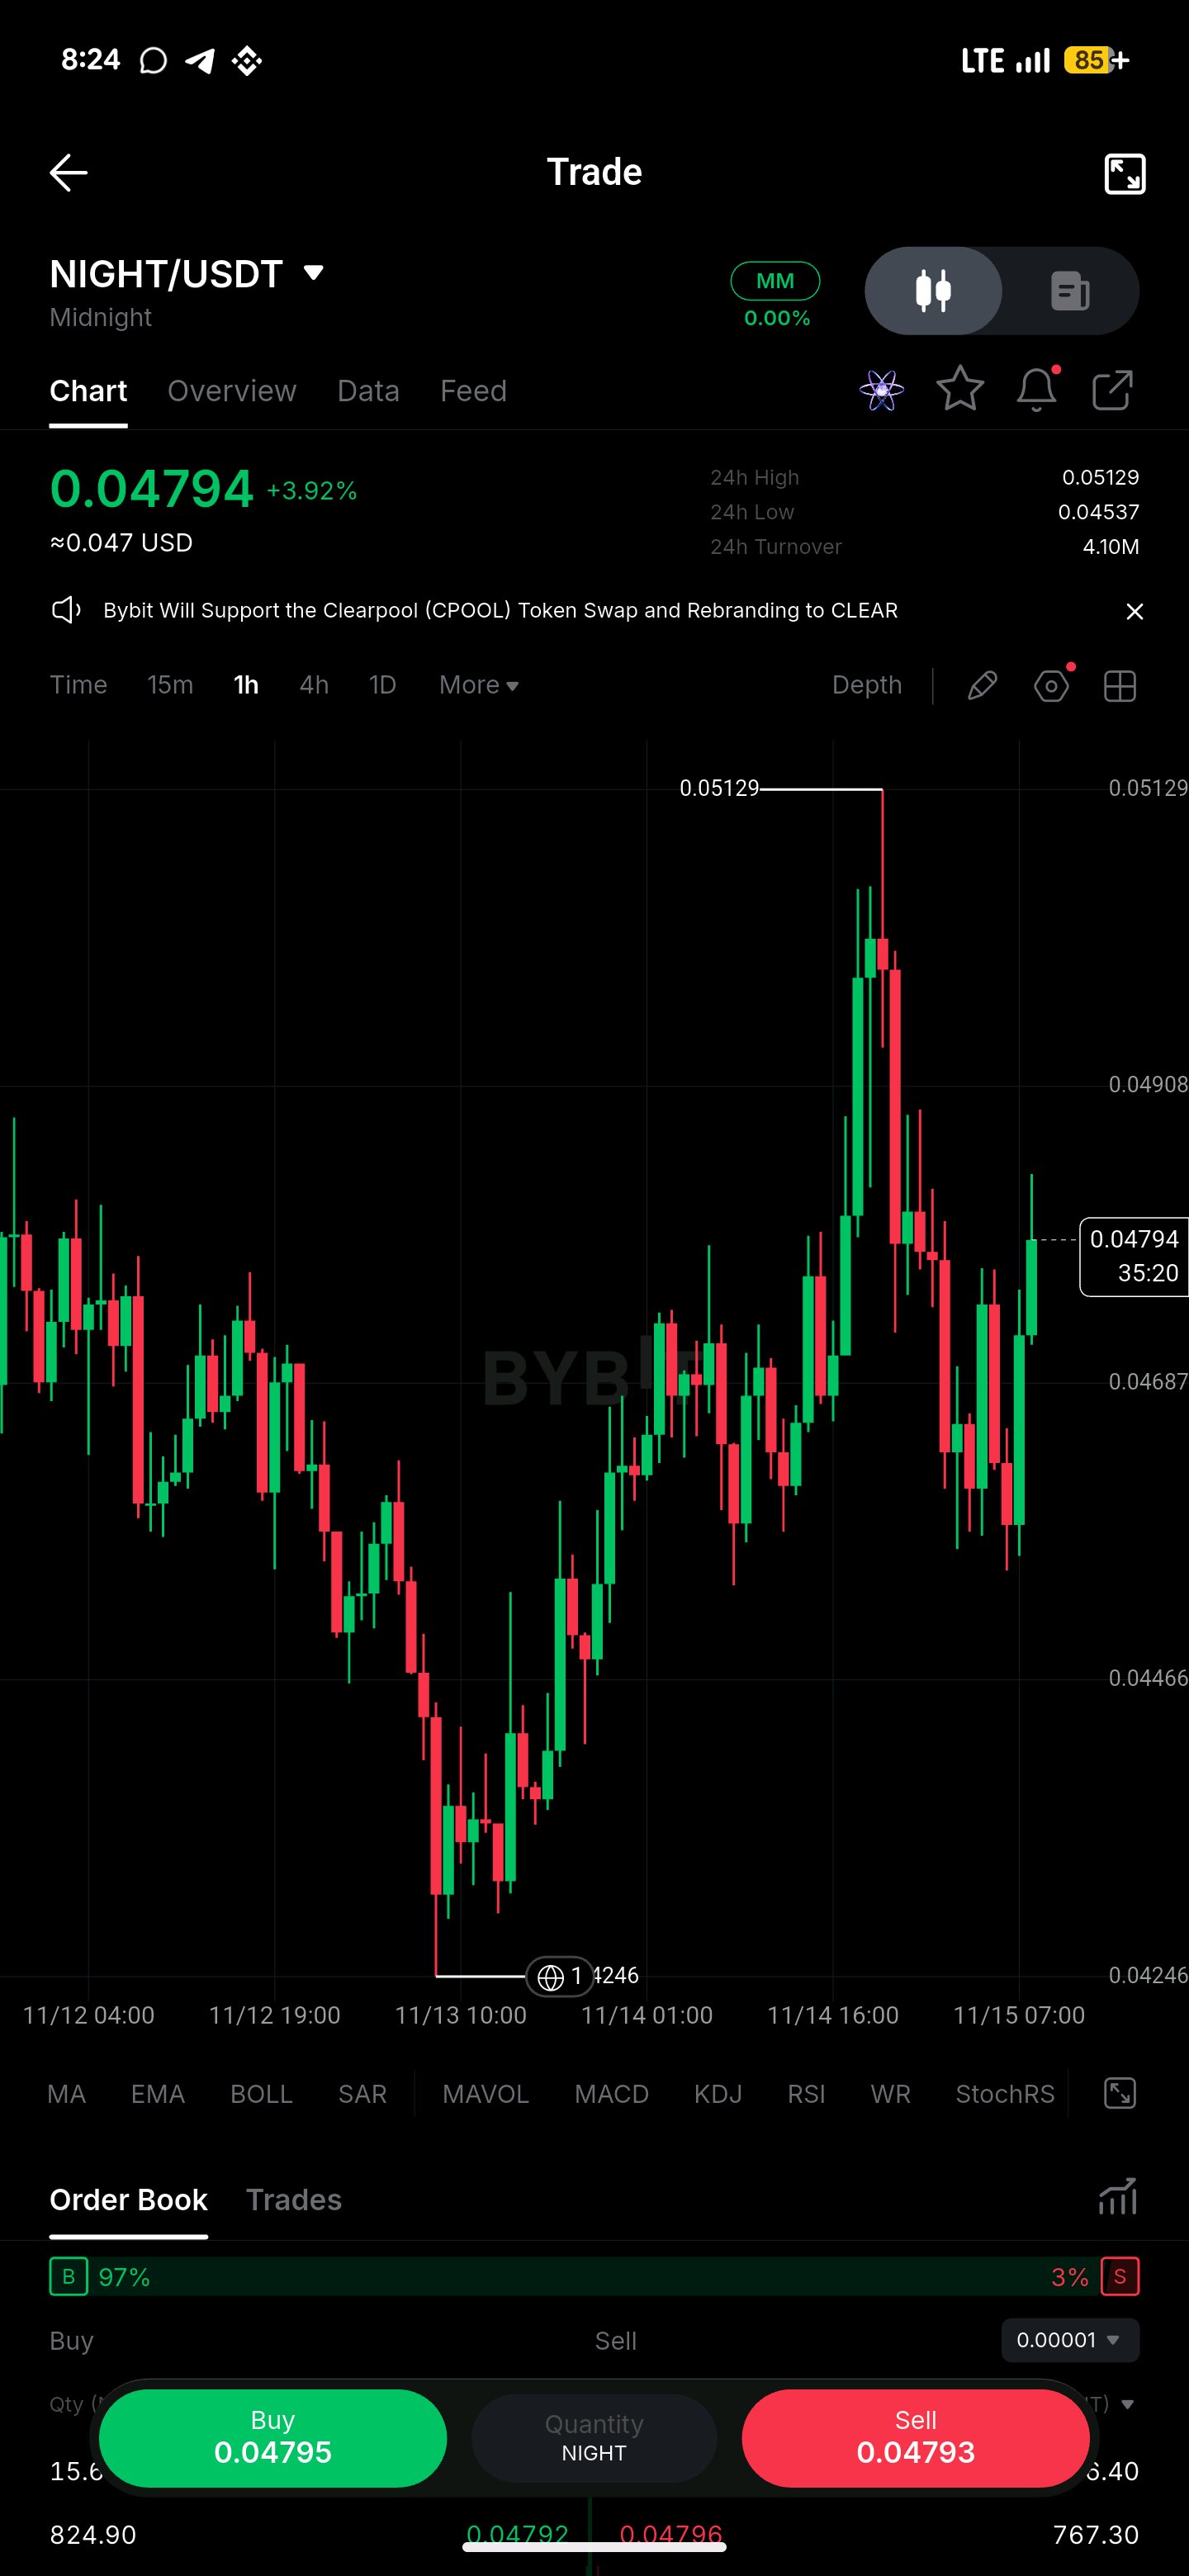
$NIGHTUSDT – Resumen de marco temporal superior | Posición larga en retroceso** Par: $NIGHTUSDT (gráfico de 1H) **Observación del mercado** NIGHT se ha mostrado volátil durante las últimas sesiones. Cayó hasta el mínimo de 0.04246 el 13 de noviembre, rebotó, y luego subió a 0.05129 el 14 de noviembre antes de que entraran los vendedores. Ese rechazo fue rápido y el precio devolvió la mayor parte del movimiento antes de que volvieran a aparecer los compradores. Ahora cotiza alrededor de 0.04794, recuperándose, pero todavía por debajo de los máximos. No obtuve una entrada clara en el empuje hacia 0.05129, y no me interesa perseguir un rebote después de un rechazo así. Prefiero dejar que el precio venga a mí. **Perspectiva actual y niveles clave** *Zona de compra: 0.04537 – 0.04687* Esta área contiene el mínimo reciente de 24h en 0.04537 y el nivel de 0.04687 por el que el precio ha operado repetidamente. Es donde los compradores defendieron el último retroceso. Quisiera ver una reacción clara aquí antes de tratarla como una entrada real: un rechazo con mecha, un cierre fuerte en 1H por encima de la zona, o una desaceleración visible en la venta. *Zona de resistencia: 0.04908 – 0.05129* El máximo de 0.05129 es el techo obvio, y 0.04908 es la primera área donde se estancó el último rally. Los vendedores ya han aparecido en este rango una vez. Una ruptura y consolidación sostenida por encima de 0.05129 significaría que el mercado ha aceptado precios más altos. Una mecha rápida por encima que no se mantenga no lo haría. **Configuración de trading** **Posición:** Largo en retroceso **Zona de entrada:** 0.04537 – 0.04687 (zona potencial, no es una entrada confirmada hasta que los compradores reaccionen) **Stop-Loss:** Por debajo de 0.04466 **Invalidación:** Un cierre de 1H por debajo de 0.04466 significa que la zona de retroceso ha fallado y la estructura está volviendo hacia el mínimo de 0.04246. En ese punto, la idea de largo se descarta. **Tomas de beneficios:** - TP1: 0.04908 - TP2: 0.05129 - TP3: No definido. No hay un nivel verificado por encima de 0.05129 en este gráfico, así que reevaluaría si el precio rompe y se mantiene allí. **Por qué esta configuración tiene sentido** El último rally hacia 0.05129 fue impulsivo y fue rechazado casi de inmediato. Entrar cerca de los máximos significaría comprar justo donde los vendedores ya han actuado, con un stop lejano y poco margen. Un retroceso a 0.04537–0.04687 ofrece un stop más ajustado por debajo de 0.04466, y objetivos en niveles que el mercado ya ha respetado. La zona solo importa si los compradores la defienden. Si el precio atraviesa sin reacción, no hay razón para estar en largo. Esperar la confirmación significa un riesgo más pequeño y limpio en lugar de una entrada emocional. El TP1 en 0.04908 es la primera prueba realista de si la recuperación tiene fuerza, y el TP2 vuelve a probar el máximo. **Gestión de riesgos** Cíñete al plan. No muevas ni ignores el stop-loss, y ajusta el tamaño de la posición para que un stop-out sea una pérdida aceptable. Una estructura alcista puede fallar, y ninguna configuración garantiza ganancias. Esto no es asesoramiento financiero. *Nota: La entrada, el stop y los objetivos se derivan de los niveles visibles en el gráfico. Ajústalos si tienes tus propios niveles.* $ByXIMPACT
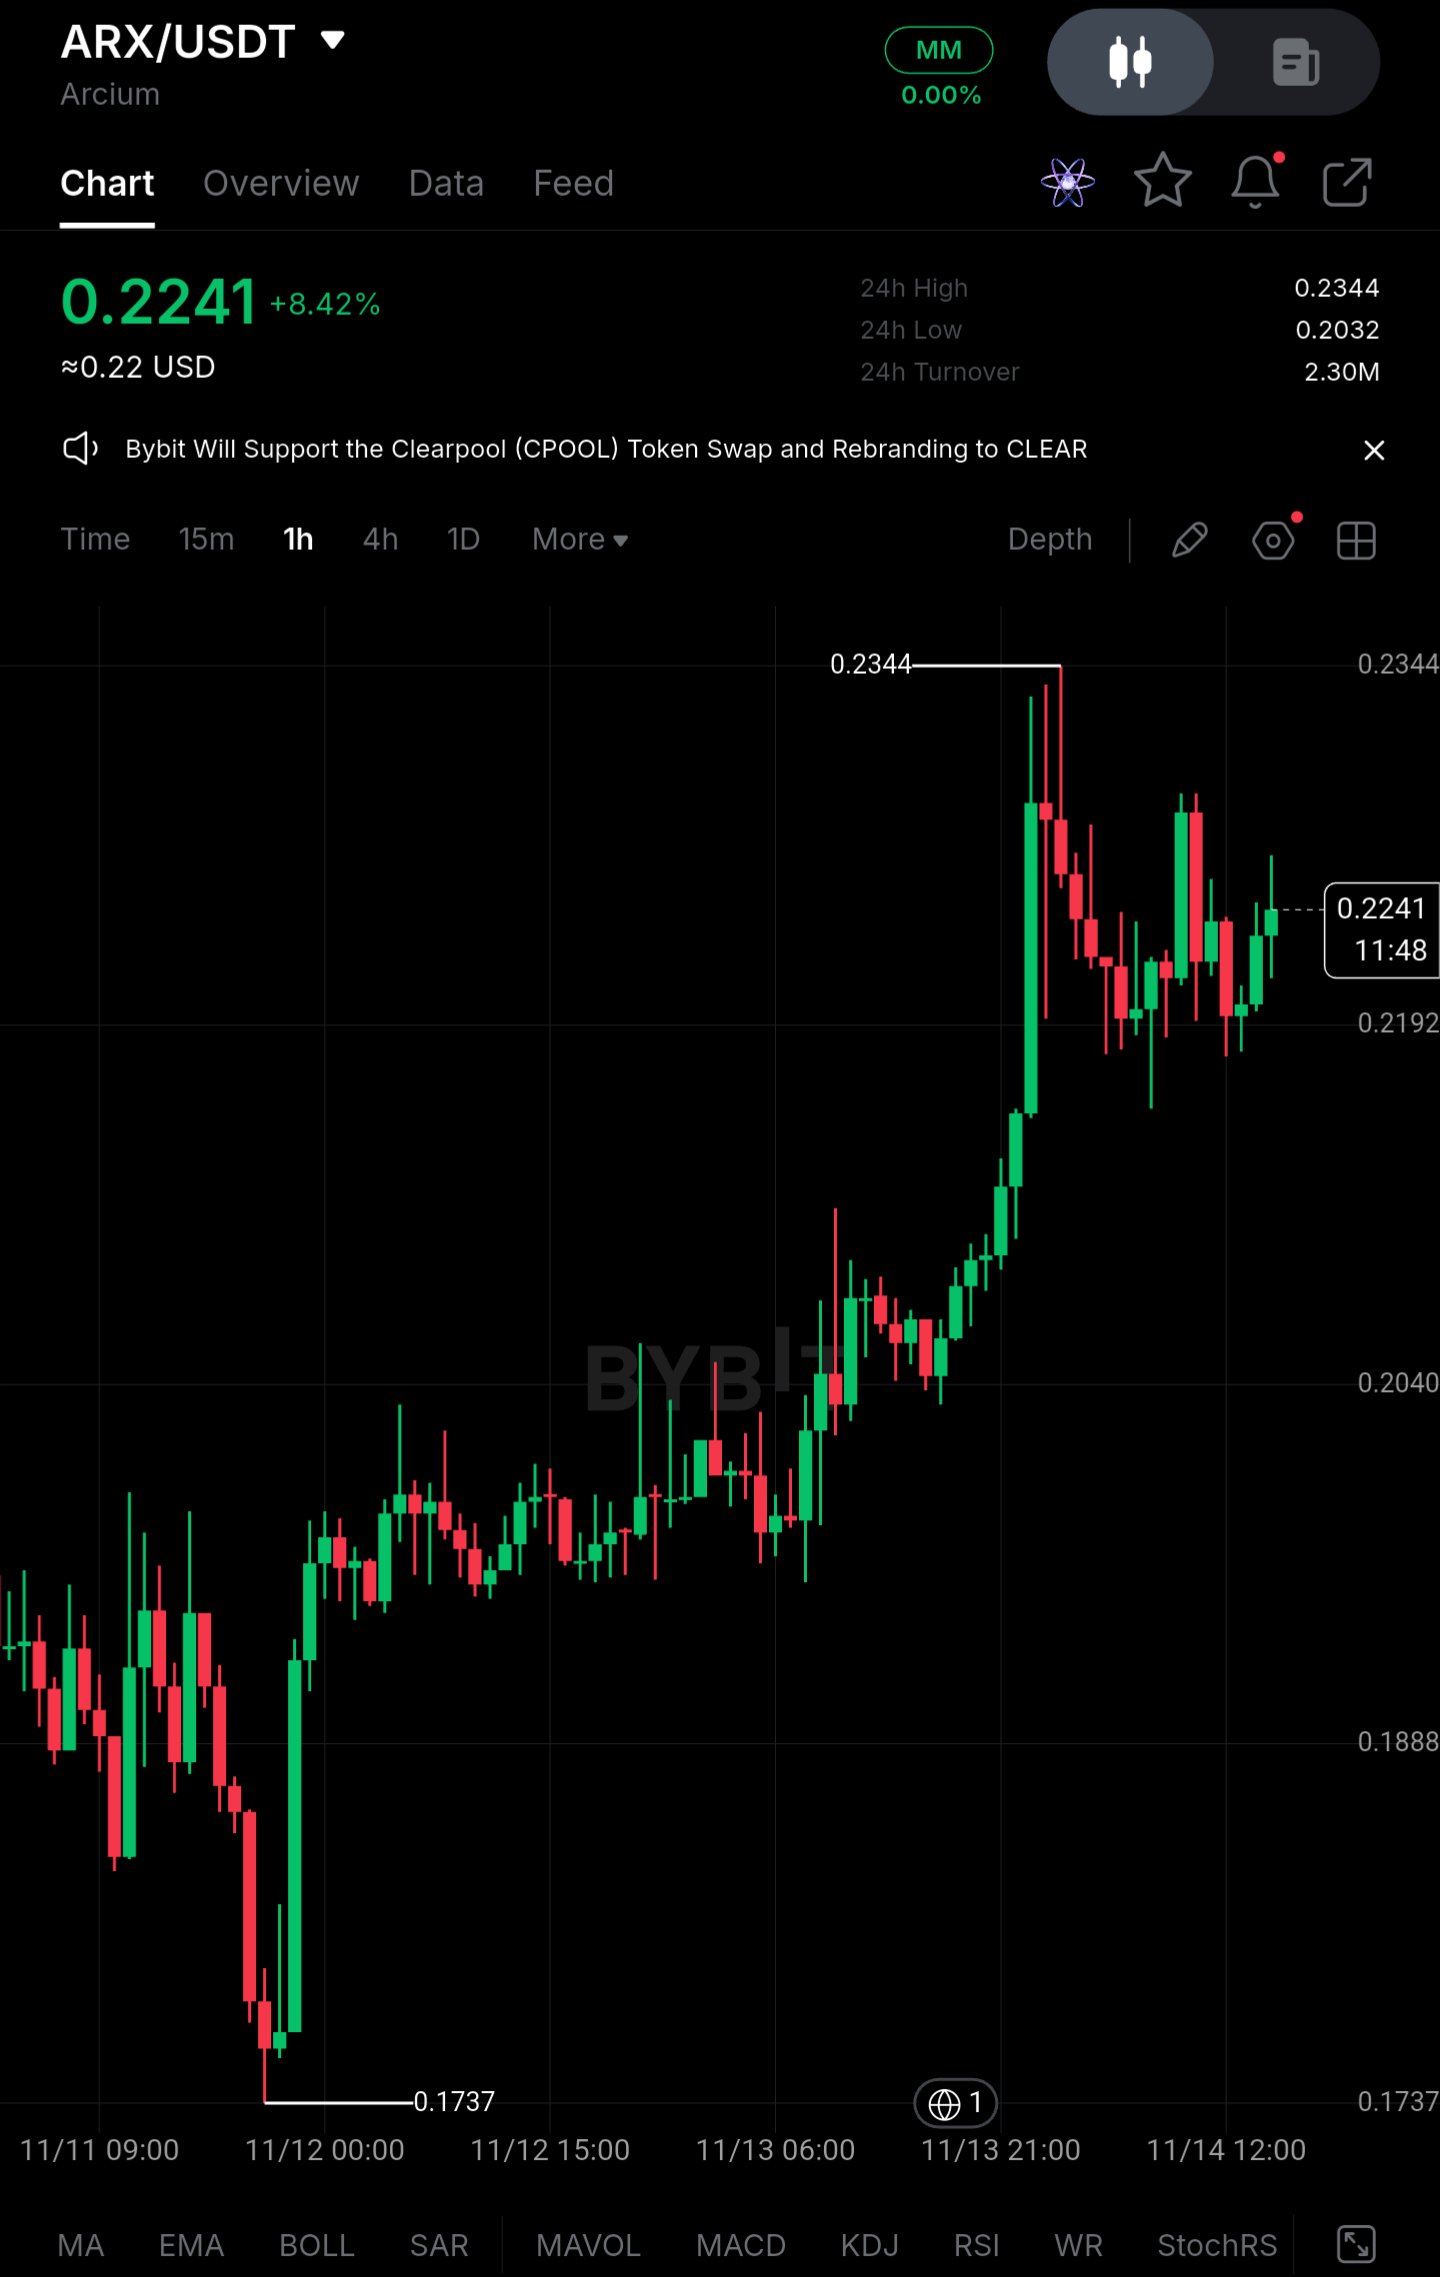
$ARXUSDT : Pullback From 0.2344 Is Not a Confirmed Trend Reversal** ARX is trading near 0.2241 after a sharp 1H rally off the 0.1737 low, and I am not treating the current pause below the high as a durable recovery. The advance was fast and thinly traded, and the key question is whether spot demand can absorb profit-taking while derivatives positioning stays long-tilted. **Price Action** - Current price: 0.2241 (+8.42% on 24h, about $0.22) - Recent low: 0.1737, which has since been followed by a roughly 35% expansion to the 0.2344 high - Pullback from the high: about 4.4%, with price holding in a 0.2190–0.2280 band - Immediate resistance: 0.2344, with a minor supply pocket near 0.2280 - First support: 0.2192, then the 0.2040 / 0.2032 zone (24h low) A reclaim and hold above 0.2344 would shift the structure toward continuation. Until then, the move reads as a vertical impulse followed by distribution-style consolidation, with lower highs forming inside the range. **Large Capital Picture** There are no ETF flows to reference, so the read comes from price behavior. The impulse candle around 11/13 21:00 expanded in a single hour, which is more consistent with concentrated large-wallet buying or a short squeeze than with broad accumulation. The follow-through since has been inconsistent: long upper wicks near 0.2344 and repeated rejections show supply is still being sold into strength. Large holders may be using the liquidity to reduce exposure. **Liquidity & Range Conditions** 24h turnover is about 2.30M, which is thin for a move of this size. Price is now compressing in a narrow range after the spike. A narrow range after a vertical move is not evidence of accumulation, and it more often precedes expansion in either direction. Without stronger spot participation, thin liquidity amplifies downside in the event of a break. **Derivatives Positioning** These figures are estimates based on typical behavior after a move like this, not verified readings. - Open interest: likely elevated relative to spot turnover after the rally - Funding: likely positive, meaning longs are paying shorts - Long share of accounts: likely above 55% If support gives way, this positioning creates vulnerability. Late longs entered near the highs and have little cushion above 0.2192, so a break could trigger a cascade of liquidations toward the 0.2040 area. **Key Figures** - Current price: 0.2241 - 24h high / low: 0.2344 / 0.2032 - Immediate resistance: 0.2344 - First support: 0.2192 - Secondary support: 0.2040–0.2032 - Major swing low: 0.1737 - 24h turnover: about 2.30M - Funding / long share (est.): positive / above 55% **Confirmation Levels** - **Bullish:** A sustained 1H close above 0.2344 with rising spot volume opens 0.2450–0.2500 and invalidates the distribution reading. - **Bearish:** A 1H close below 0.2192 exposes 0.2040–0.2032, and a failure there reopens 0.1888 and the 0.1737 low. **Closing** The current stabilization is real but unconfirmed. Large-capital selling into strength and crowded long positioning are competing with the recovery attempt. The decisive signal is whether spot buyers return and defend 0.2192 while leverage stays controlled, or whether a breakdown below that level triggers fresh long liquidations. #ByXIMPACT
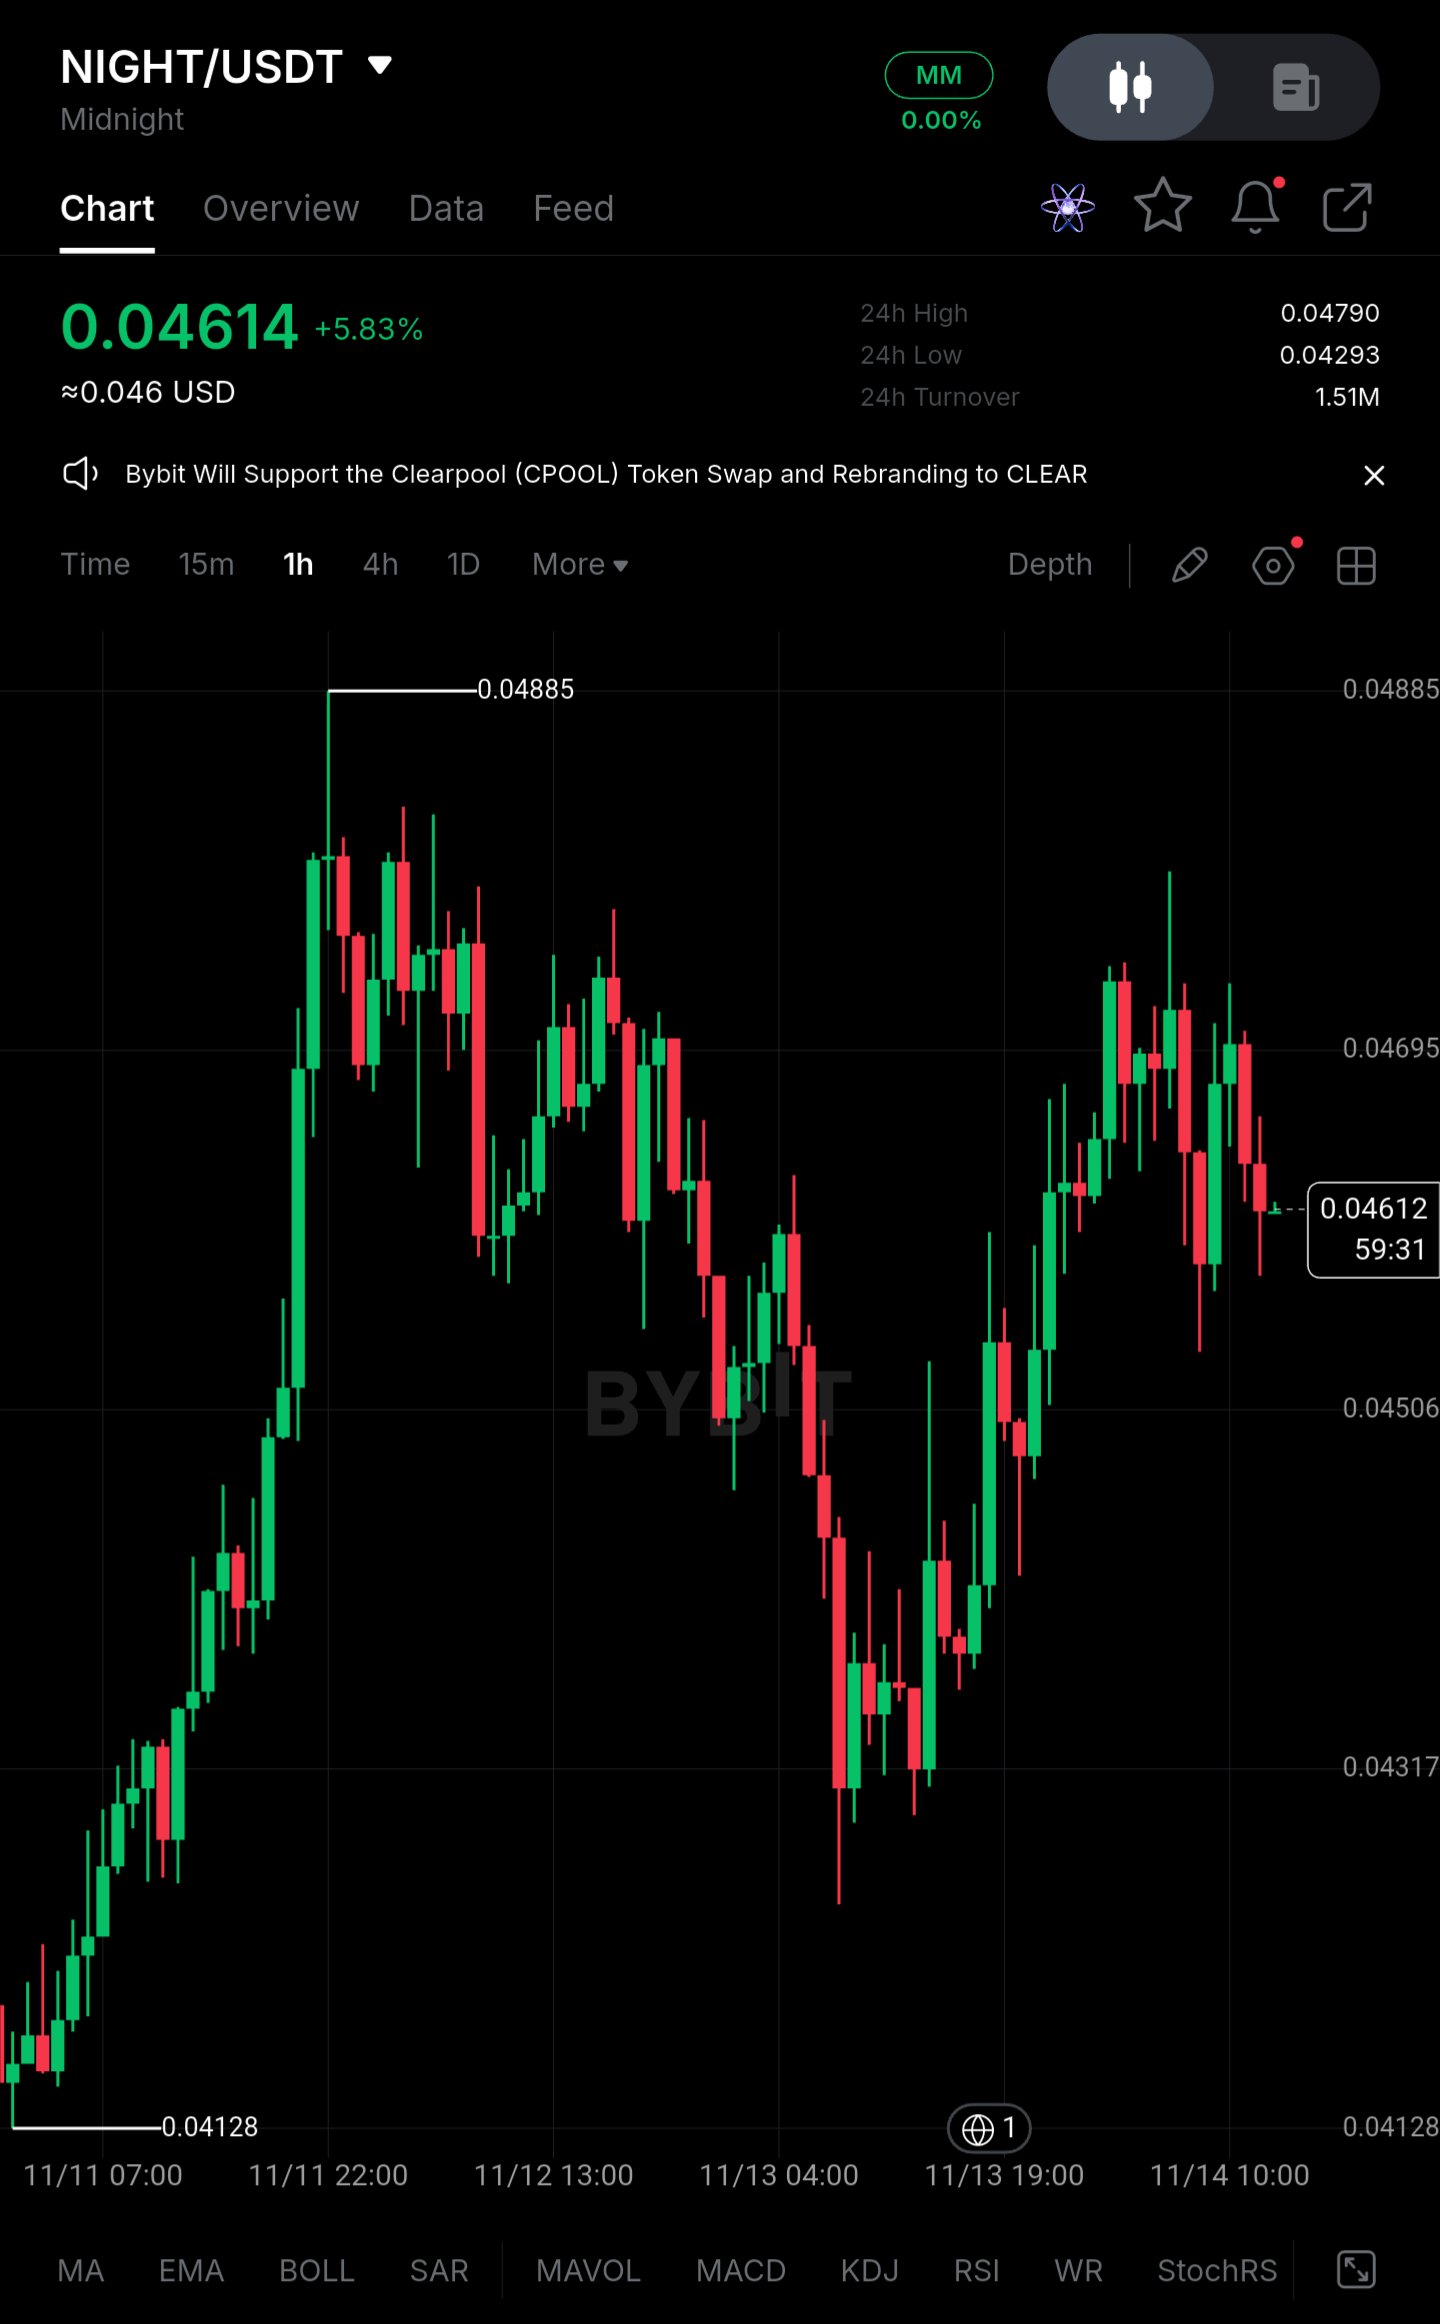
$NIGHTUSDT Range-Bound Below 0.04885, Not a Recovery Yet** NIGHT is trading near 0.04614, roughly 5.5% above the 0.04293 24h low and about 5.6% below the 0.04885 swing high. I'm not treating this stabilization as a recovery. The sharp advance from 0.04128 has stalled, and the last two rebounds peaked below the prior high. **Price Action** - Current price: 0.04614 (+5.83% on the day) - Recent low on chart: 0.04128 - Swing high: 0.04885 - 24h range: 0.04293 – 0.04790 - Immediate resistance: 0.04695, then 0.04790 (24h high) - First support: 0.04506, then 0.04317 Reclaiming 0.04790 and holding it would be the first sign buyers are regaining control of the range. Until then, the structure is a failed push toward highs followed by a pullback, which keeps the broader picture under pressure. **Institutional / Large Capital Picture** The chart carries no data on large-wallet movements, exchange flows or token unlocks, so I'm not going to infer any. What price does show is inconsistent demand. The advance from 0.04128 to 0.04885 was strong, but the retracement to roughly 0.04317 retraced a large part of it, and the second rebound failed to make a higher high. That pattern is consistent with sellers using strength to distribute rather than with sustained accumulation. **Liquidity & Range Conditions** Price has been rotating between roughly 0.04317 and 0.04885 for over two days. A range after a failed breakout is not evidence of accumulation. With 24h turnover at 1.51M, participation looks thin for a move of this size, and thin books make both directions prone to sharp wicks. Stronger spot participation is still needed. **Derivatives Positioning** Open interest, funding rate and the long/short ratio are not visible on this chart, so I'm not quoting figures. These are the numbers to check before acting. After a +5.83% daily move, positive funding and long-heavy positioning would be a vulnerability: a loss of 0.04506 could trigger forced long liquidations toward 0.04317 rather than an orderly retest. **Key Figures** - Current price: 0.04614 - Immediate resistance: 0.04695 - Upper resistance: 0.04790 (24h high), 0.04885 (swing high) - Support: 0.04506, then 0.04317 - Recent low: 0.04128 (chart low), 0.04293 (24h low) - OI / funding / long %: not verified from the chart **Confirmation Levels** - **Bullish:** A hold above 0.04790 would open 0.04885. A move through 0.04695 alone is not enough, since it still sits inside the range. - **Bearish:** A sustained close below 0.04506 exposes 0.04317, and a break of that level would put the 0.04128 low back in play. **Closing** The stability here is temporary until proven otherwise. A rejection from the highs and the possibility of crowded long positioning are working against the recovery attempt. The deciding signal is whether spot buyers return with leverage under control, or whether a break below 0.04506 triggers fresh long liquidations. #ByXIMPACT
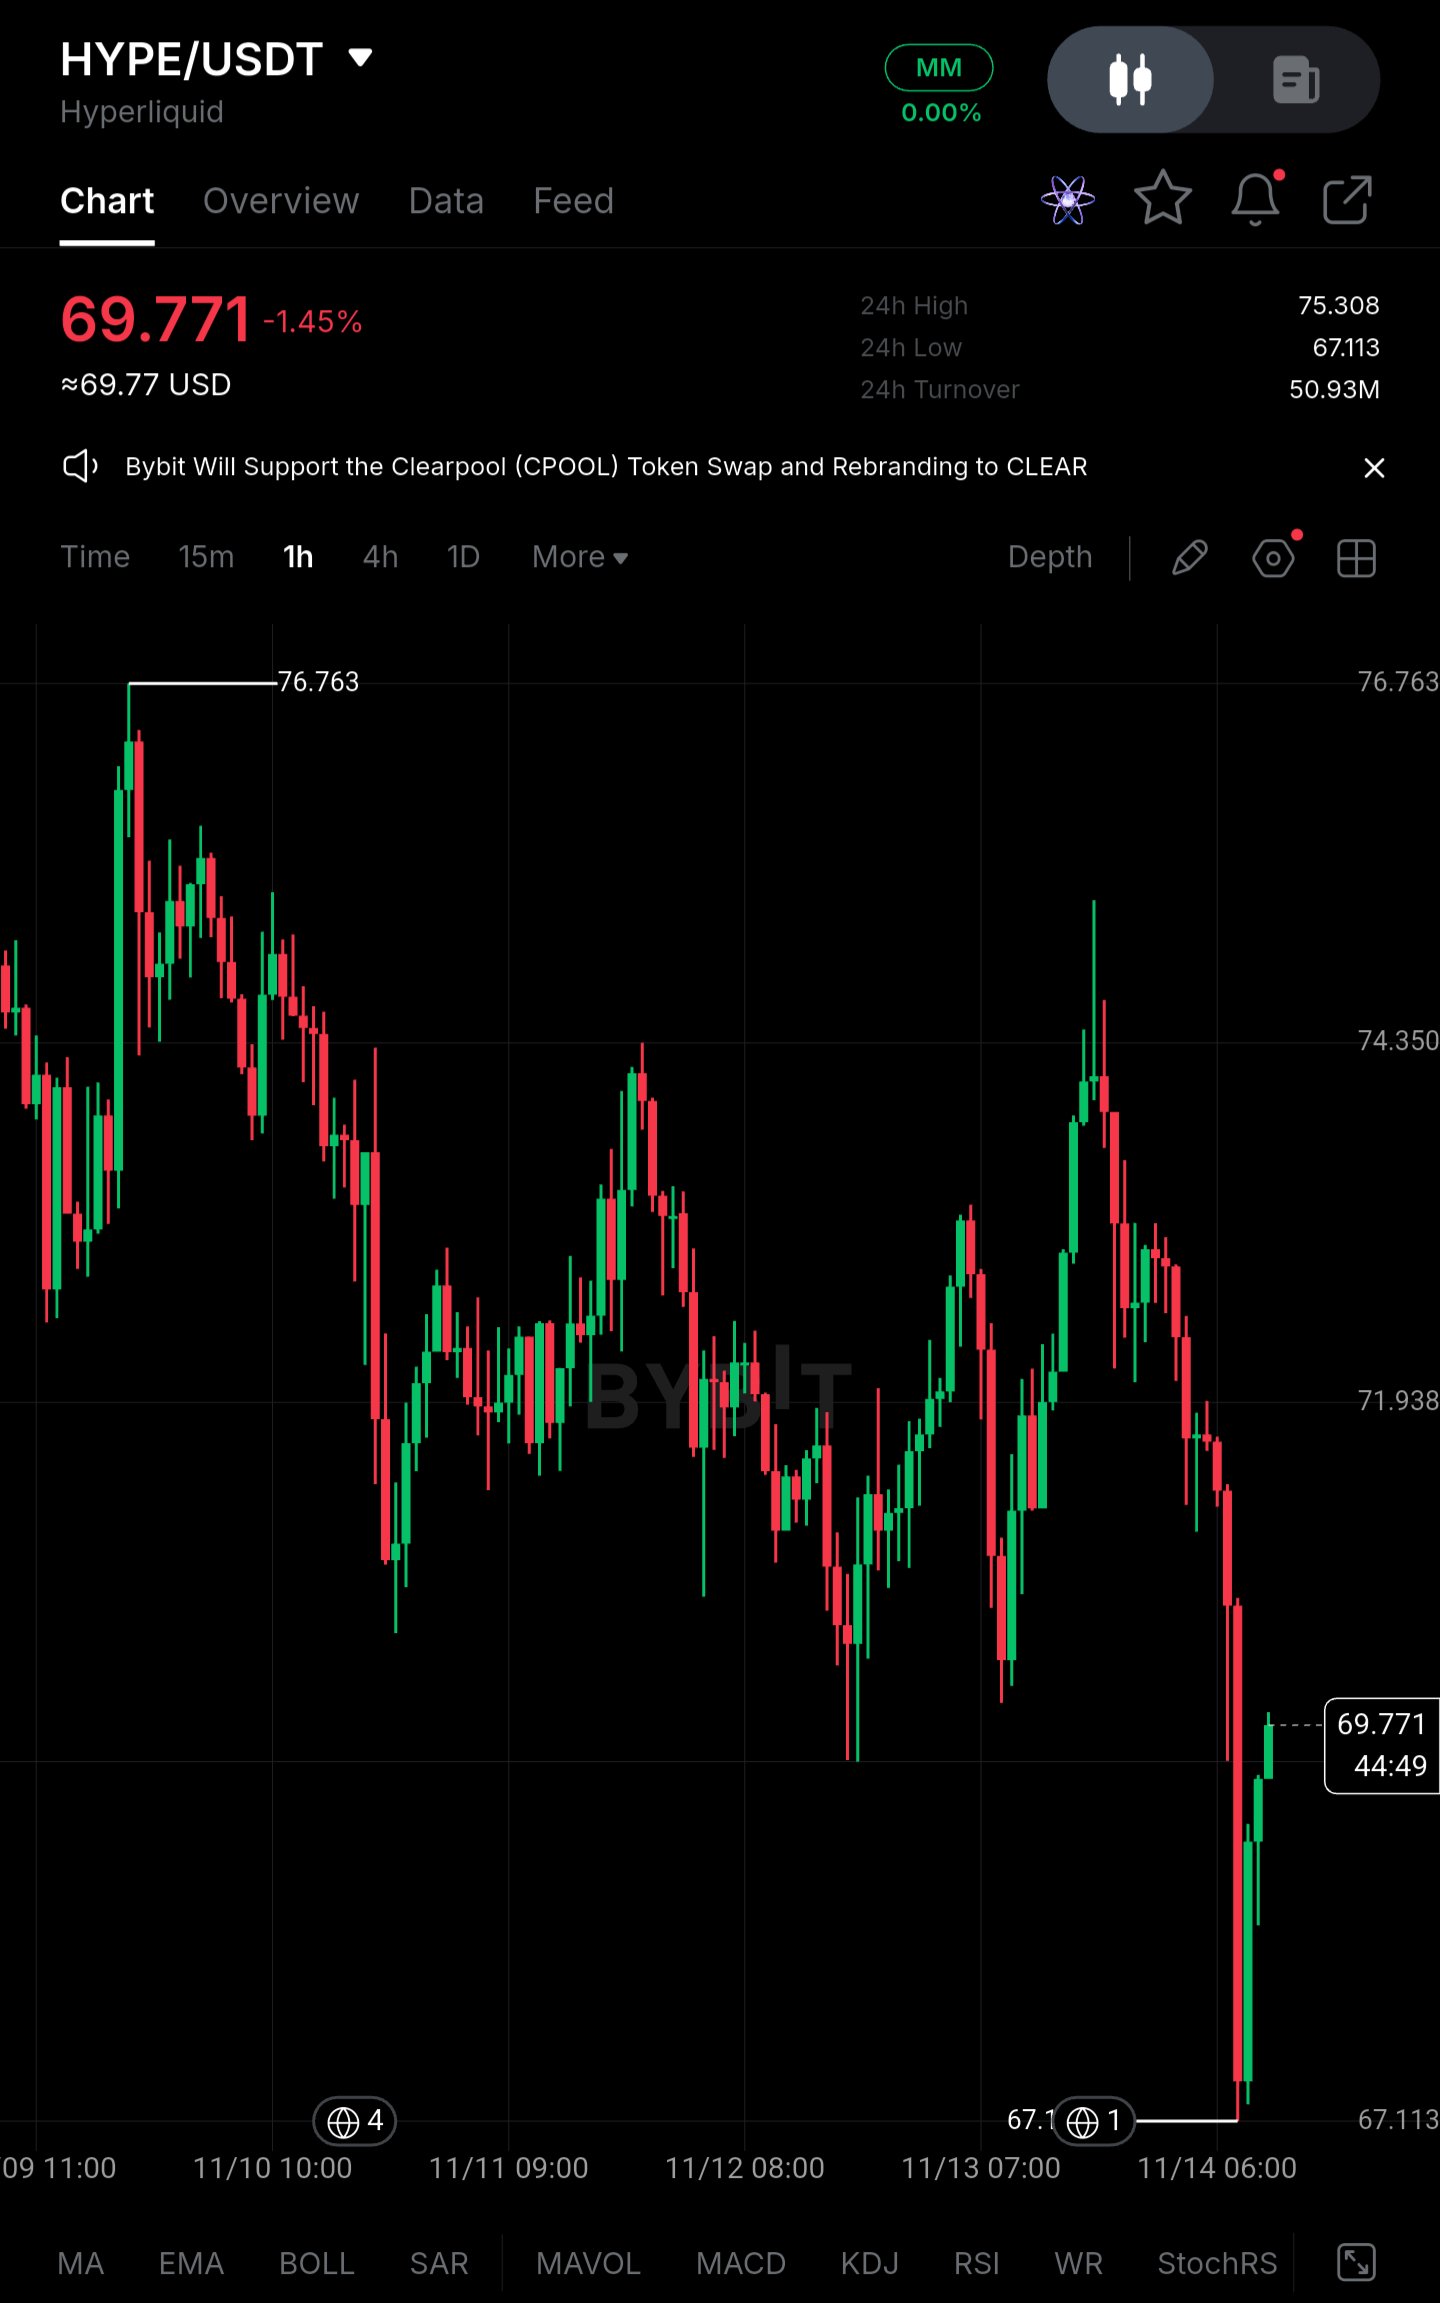
$HYPEUSDT – Visión general de temporalidad superior | Largo en retroceso (condicional)** Par: $HYPEUSDT HYPE ha pasado los últimos días en un rango lateral con sesgo bajista. Los máximos han ido descendiendo desde 76.763, y el último tramo cayó bruscamente hasta 67.113 antes de que un rebote llevara el precio de vuelta a alrededor de 69.771. No conseguí una entrada limpia en los giros anteriores, y no me interesa perseguir un rebote tras una caída repentina. **Perspectiva actual y niveles clave** **Zona de compra: 67.113 – 69.000 (condicional)** El mínimo de 67.113 es el punto más bajo en este gráfico, y la mecha brusca hacia abajo junto con la recuperación sugiere que los compradores entraron ahí. Trataría una nueva prueba de esta área como algo a vigilar, pero solo si el precio muestra una reacción, como una mecha de rechazo o un mínimo más alto formándose por encima de 67.113. El borde superior de 69.000 es mi propia referencia para el retroceso, no un nivel marcado por el gráfico, así que ajústalo a tu propia lectura. **Zona de resistencia: 71.938 – 74.350** Ambos niveles fueron probados repetidamente durante el rango, y cada empuje hacia ellos ha sido vendido. Una ruptura limpia y una consolidación sostenida por encima de 71.938 sería la primera señal de que la secuencia de máximos decrecientes está terminando. La aceptación por encima de 74.350 pondría el máximo del swing de 76.763 de nuevo en juego. **Configuración de trading** **Posición:** Largo en retroceso, solo después de una reacción confirmada. **Zona de entrada:** 67.113 – 69.000, con confirmación de comprador. No es una orden límite a ciegas. **Stop-Loss:** Por debajo de 67.113. No asigno un número exacto porque el gráfico no marca un nivel verificado por debajo del mínimo. **Invalidación:** Un cierre sostenido por debajo de 67.113 significa que el mínimo de la caída no logró mantenerse. El rebote habría sido entonces una pausa más que una reversión, y la configuración ya no aplica. **Take-Profits (Tomas de beneficios):** - TP1: 71.938 - TP2: 74.350 - TP3: 76.763 (máximo previo del swing, solo si 74.350 se rompe y se mantiene) **Por qué tiene sentido esta configuración** El último movimiento fue una caída brusca y rápida seguida de un rebote veloz. Comprar el rebote cerca de 69.771 sitúa el stop muy lejos con el primer objetivo a poca distancia, por lo que la relación riesgo-beneficio es pobre. Una nueva prueba del mínimo ofrece un stop más ajustado y comprueba si los compradores lo defienden por segunda vez. Un primer toque a un mínimo tras una caída a menudo se vuelve a visitar, y la reacción en esa revisita te dice más que la mecha inicial. Los objetivos siguen niveles que ya han actuado como resistencia, por lo que son lugares razonables para tomar beneficios mientras la estructura siga formando máximos decrecientes. Si el precio rompe 67.113 sin reacción, no hay operación, y esperar no cuesta nada. **Gestión de riesgos** Respeta el plan y no muevas ni elimines el stop. Ajusta el tamaño de la posición para que un stop-out sea una pérdida que puedas aceptar. Un rebote puede fallar, y ninguna configuración garantiza un beneficio. *Nota: los niveles provienen solo del gráfico de 1H. Un chequeo en 4H o diario ayudaría a confirmar la estructura más amplia.* $ByXIMPACT
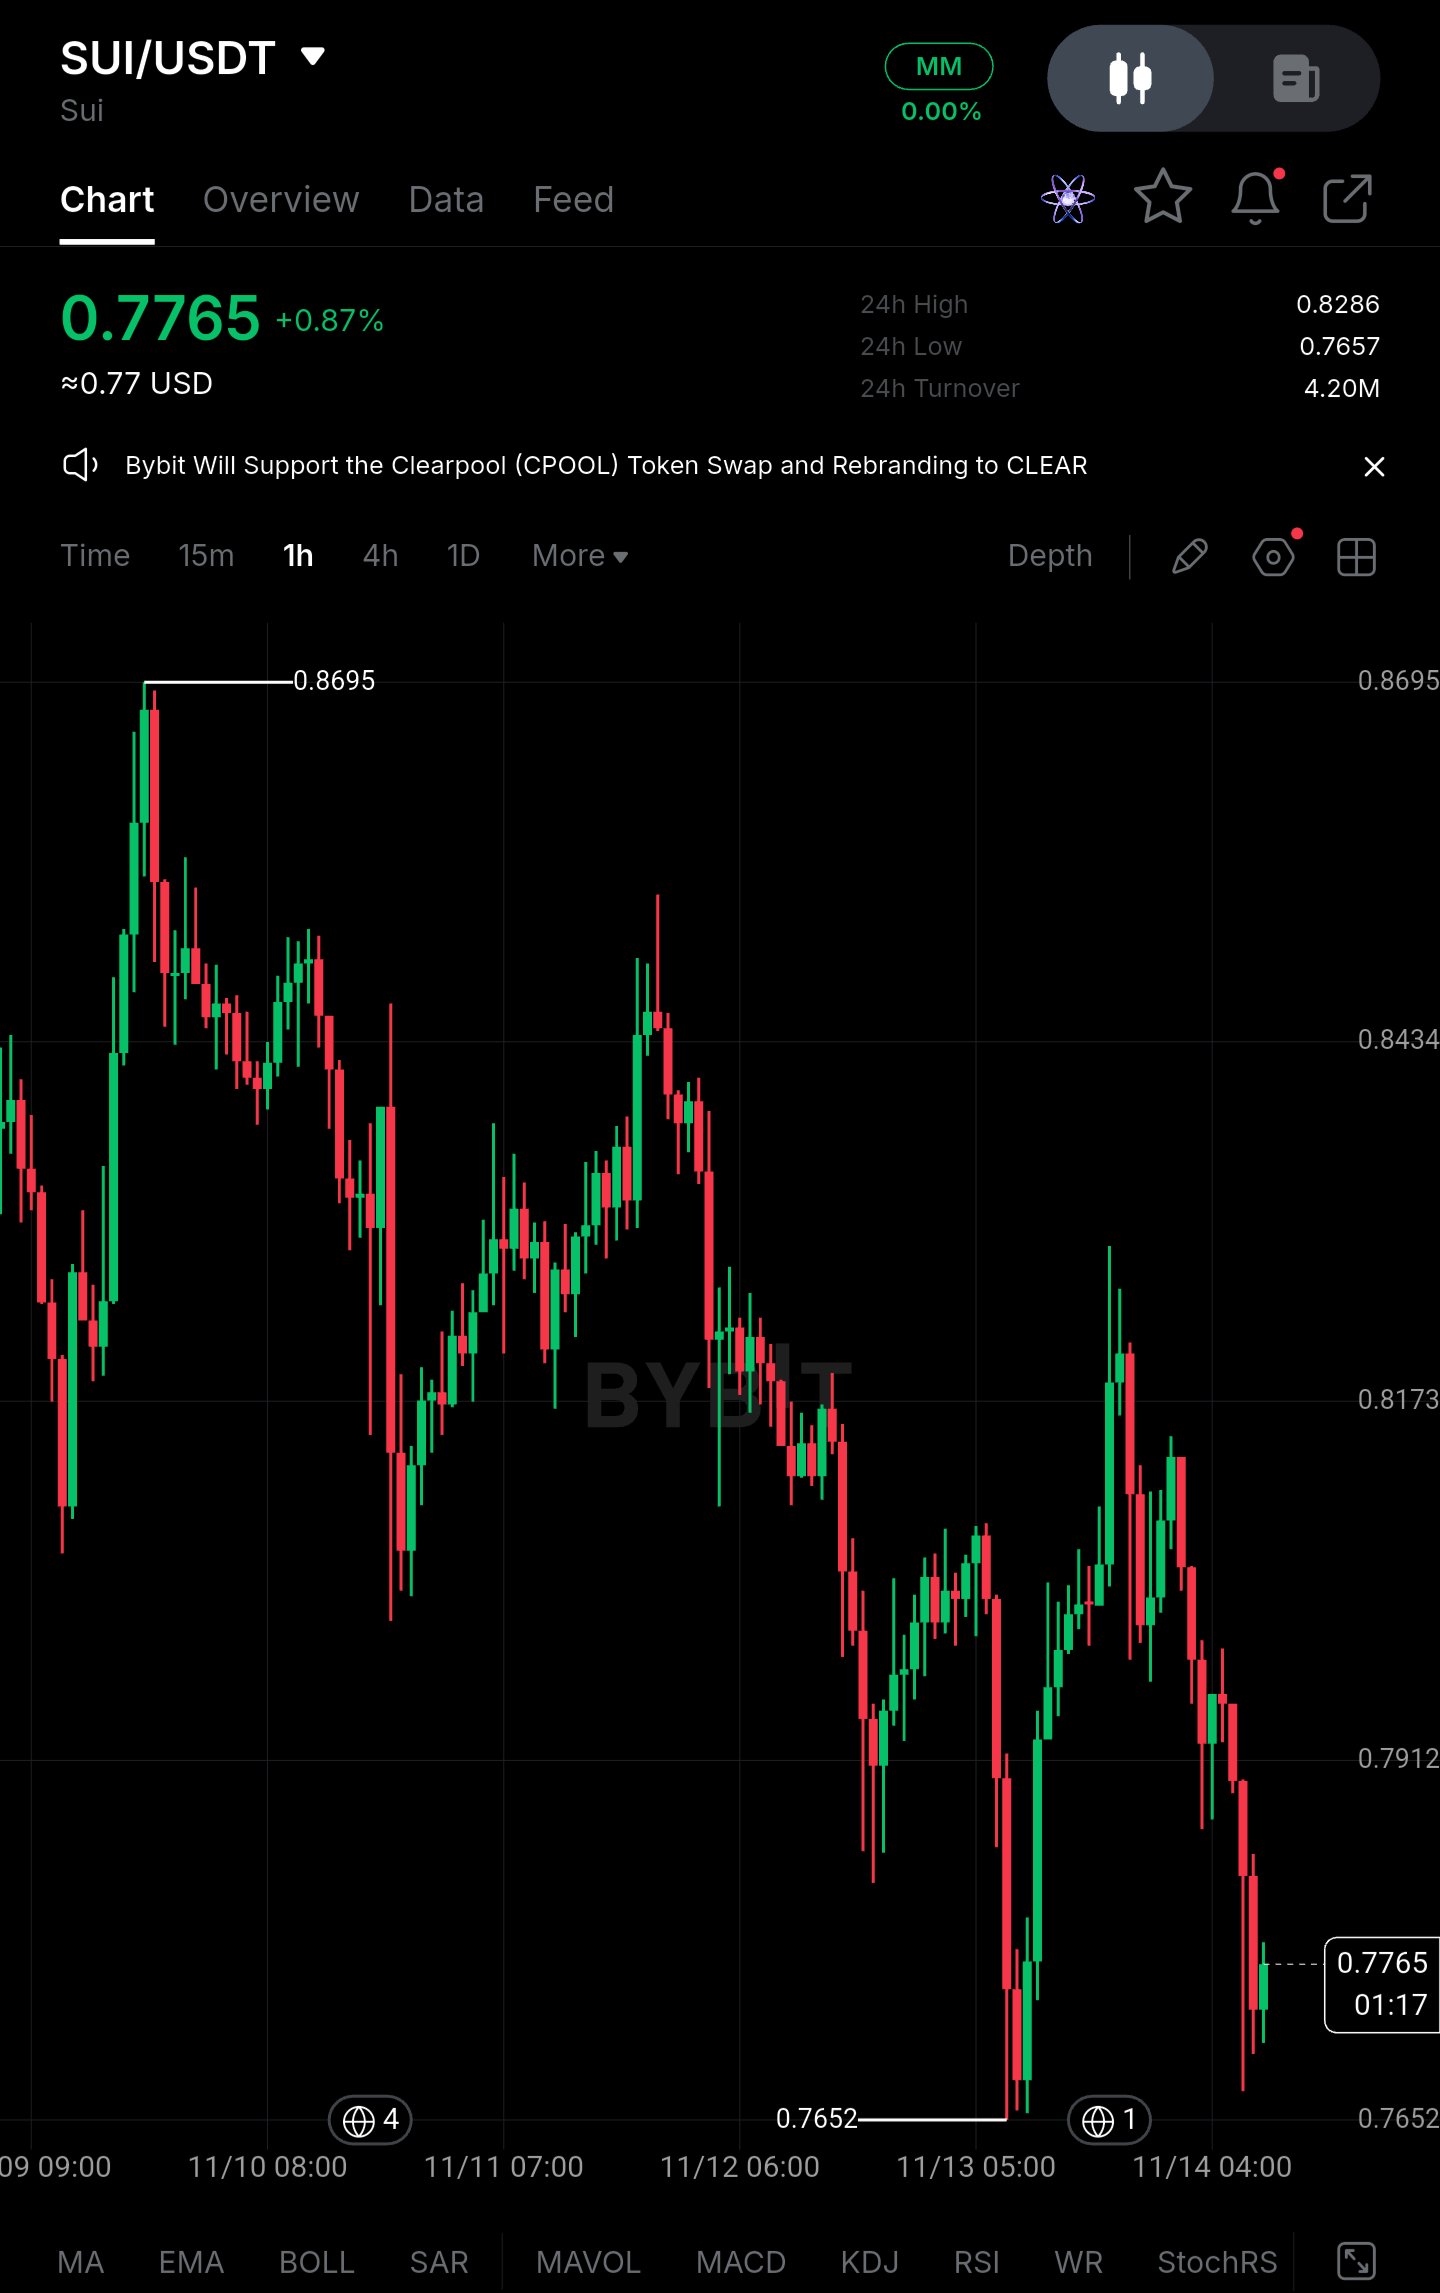
$SUIUSDT Holding Above 0.7652, but This Is Not a Recovery Yet** SUI is trading near 0.7765, just above the 0.7652 low set on the 1H chart. I'm not treating this stabilization as a recovery. The structure is still a sequence of lower highs, and so far the bounces have been sold into. **Price Action** - Current price: 0.7765 (+0.87% on the day) - Recent low: 0.7652 - Prior swing high: 0.8695, so price is roughly 10.7% below that peak - 24h range: 0.7657 – 0.8286 - Immediate resistance: 0.7912, then 0.8173 - First support: 0.7652–0.7657, which price has already tested Reclaiming 0.8173 would be the first sign the lower-high sequence is breaking. Until then, the broader trend is still under pressure. **Institutional / Large Capital Picture** The chart doesn't show ETF flows, large-wallet movements or exchange outflows, and I'm not going to infer them from price. What the chart does show is selling that arrives in waves. Each rebound from 0.7652 has faded below the previous high, which is consistent with supply absorbing demand rather than demand taking control. **Liquidity & Range Conditions** The recent range is tight relative to the decline. A pause after a sharp drop is not evidence of accumulation. Turnover of 4.20M over 24h does not show the kind of sustained spot participation that would turn this range into a base. **Derivatives Positioning** Open interest, funding rate and the long/short ratio are not visible on this chart, so I'm not quoting figures. This is the section to check before acting. If funding is positive and positioning is long-tilted after this decline, that is a vulnerability. A break of 0.7652 would then risk forced long liquidations rather than an orderly retest. **Key Figures** - Current price: 0.7765 - Immediate resistance: 0.7912 - Next resistance: 0.8173, with 0.8434 above it - Support: 0.7652–0.7657 - Recent swing high: 0.8695 - OI / funding / long %: not verified from the chart **Confirmation Levels** - **Bullish:** A hold above 0.8173 would open 0.8434. A move through 0.7912 alone is not enough, because it still sits inside the downtrend. - **Bearish:** A sustained close below 0.7652 invalidates the stabilization. No verified support is mapped below that level on this chart, so a breakdown would be exposed to a fast move. **Closing** The stability here is temporary until proven otherwise. The lower-high structure and the possibility of crowded long positioning are working against the recovery attempt. The deciding signal is whether spot buyers return with leverage under control, or whether a break below 0.7652 triggers fresh long liquidations. #ByXIMPACT
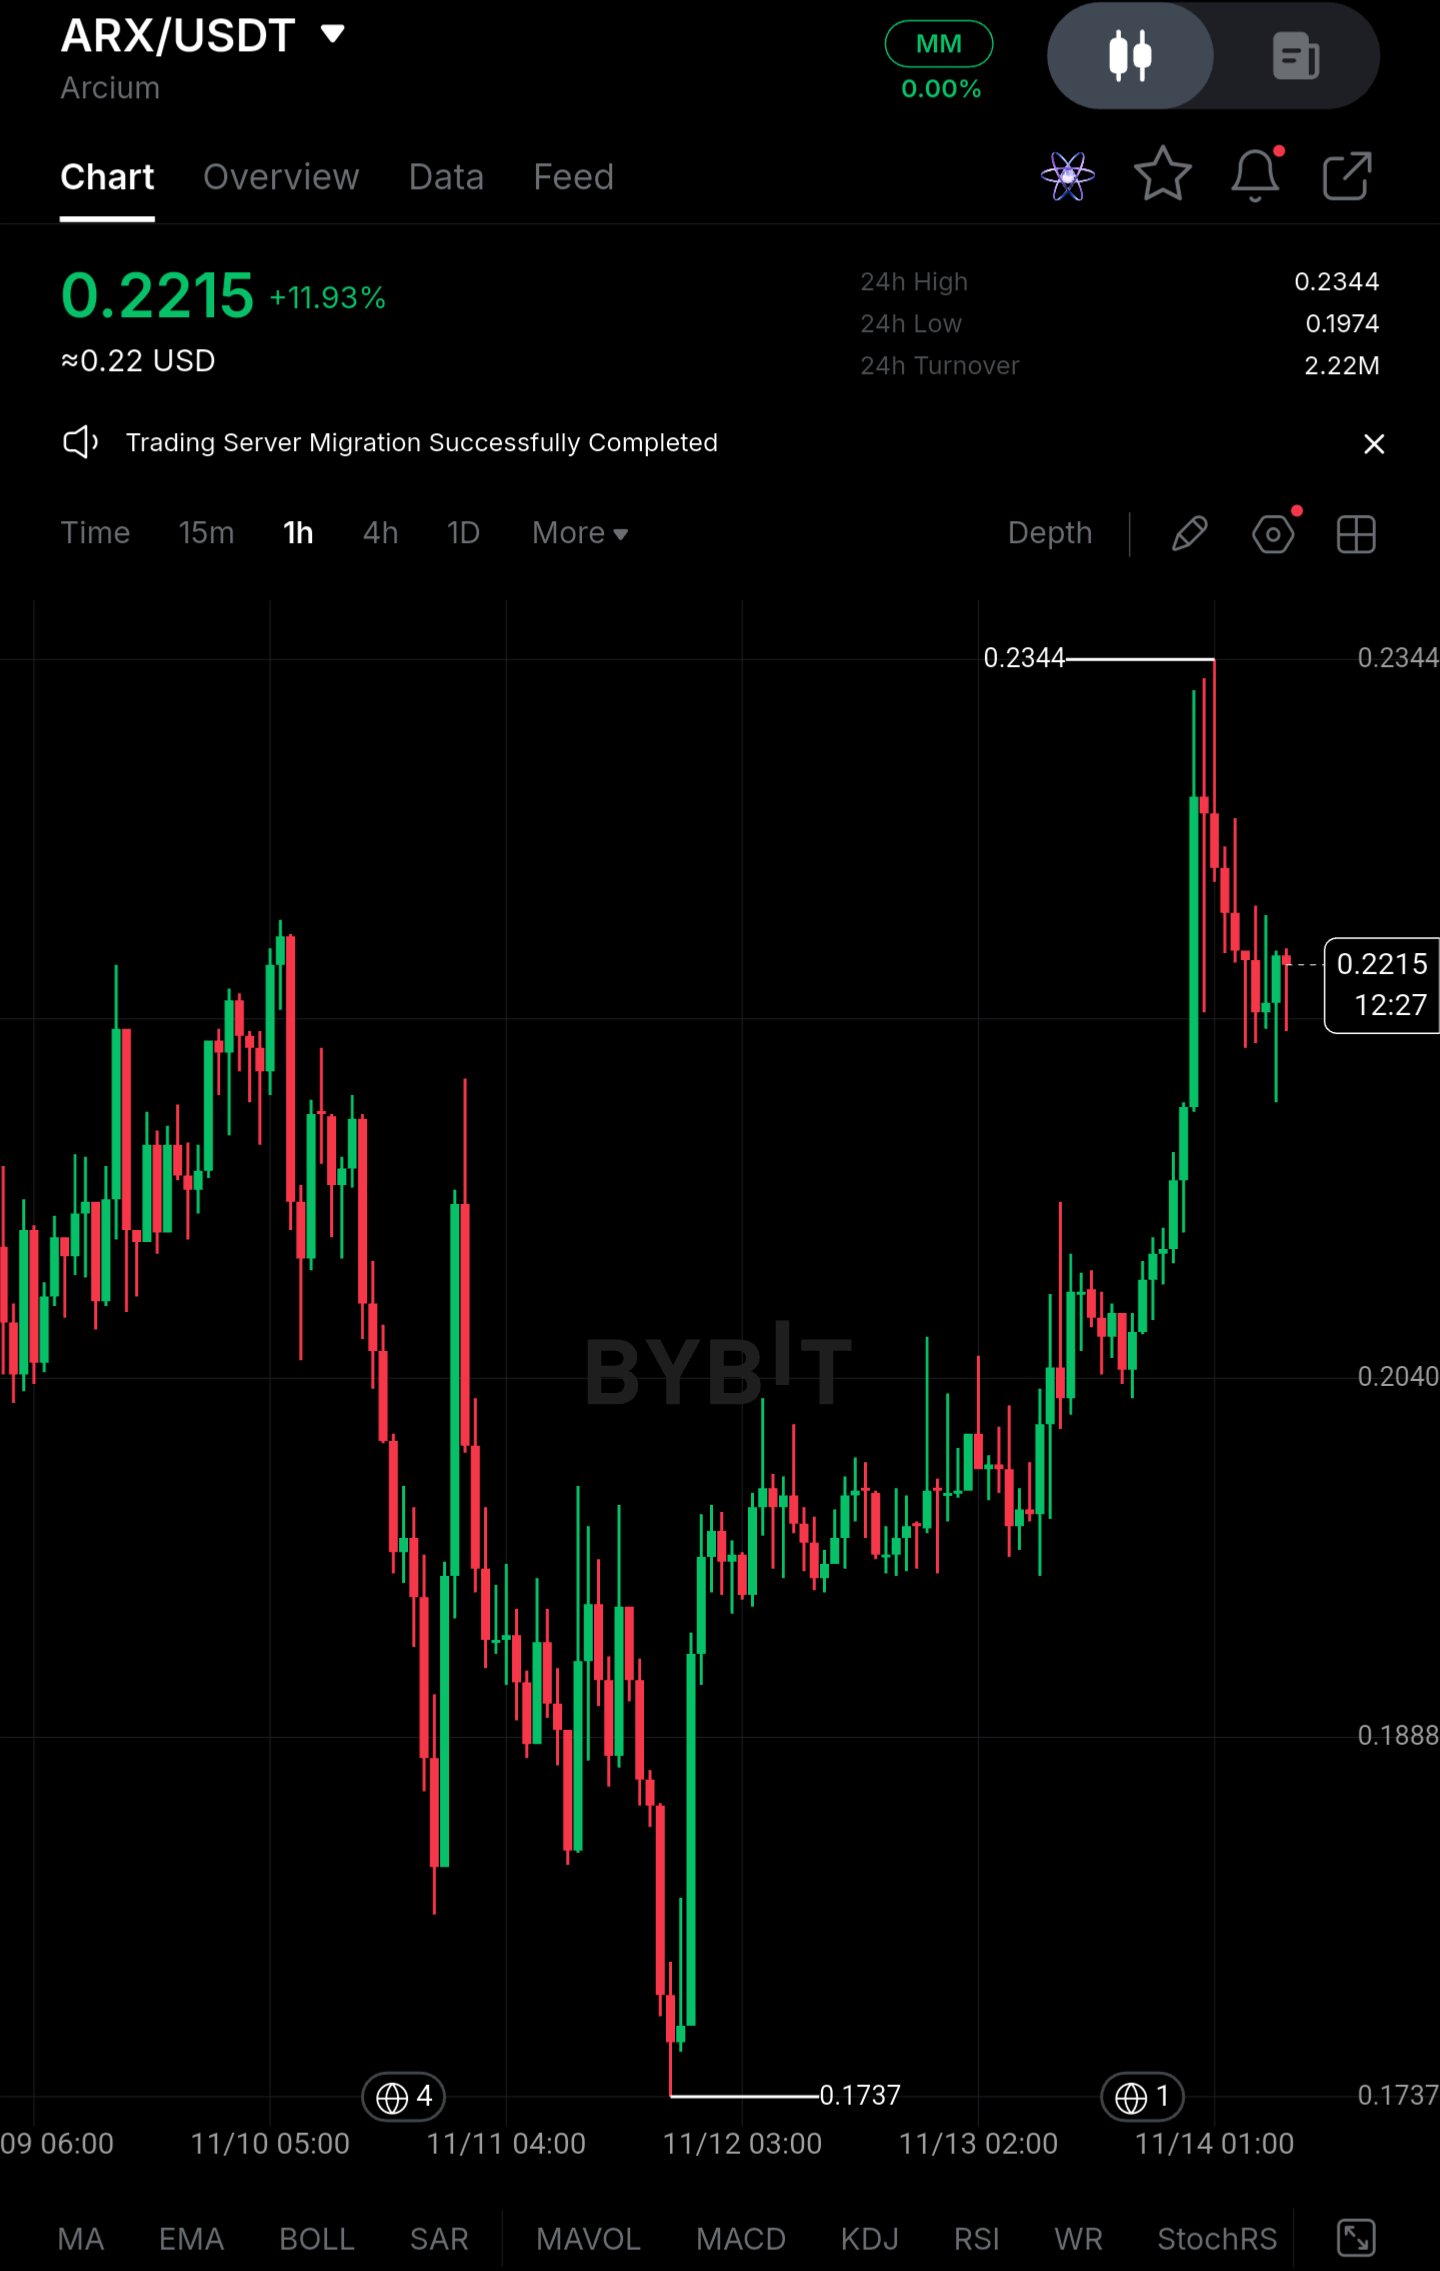
$ARXUSDT (Arcium) – Higher Timeframe Overview | Long on Pullback** Pair: $ARXUSDT ARX has been recovering steadily after bottoming near 0.1737 on 11/12. Price spent some time building a base, then pushed hard to a high of 0.2344 before cooling off. It's now trading around 0.2215, up roughly 12% on the day. I didn't get in near the lows, and I'm not interested in chasing a candle that has already moved this far. **Current Outlook and Key Levels** **Buying Zone: 0.1974 – 0.2040** This is where price consolidated before the breakout, and 0.1974 is the 24h low. If the market pulls back, this is the first area where previous resistance could act as support. I'd want to see buyers defend it with a reaction, such as a wick rejection or a higher low forming, before treating it as a real entry. **Resistance Zone: 0.2344** This is the recent high, where the impulse stalled and sellers stepped in. A clean break and sustained hold above it would suggest the recovery is turning into a larger higher-low structure. A quick spike above with no follow-through would not. **Trading Setup** **Position:** Long on pullback **Entry Zone:** 0.1974 – 0.2040, only after buyers show a reaction **Stop-Loss:** Below 0.1974. I'm not assigning a specific number because the chart doesn't give me a verified level under it. **Invalidation:** A sustained close below 0.1974 means the pre-breakout base has failed. It would also put price back inside the old range, and the bullish structure would no longer apply. **Take-Profits:** - TP1: 0.2344 (retest of the recent high) - TP2 and TP3: I'm leaving these open. Above 0.2344 there are no verified levels on this chart, so I'd reassess if price breaks and holds there. **Why This Setup Makes Sense** After an impulsive move like this, entering near 0.22 puts the stop a long way down and leaves little room before the 0.2344 high. Waiting for a pullback into 0.1974–0.2040 gives a much tighter stop. It also puts the entry at a level the market has already shown interest in. The buyer reaction matters, because a zone alone doesn't guarantee a bounce. If price slices through it without reacting, the setup is off and there's no trade. If it holds, TP1 at the recent high gives a defined and realistic first objective. Patience and confirmation beat paying up for momentum. **Risk Management** Respect the plan and don't move or ignore the stop. Size the position so a stop-out is a loss you can accept. A bullish structure can fail, and no setup guarantees a profit. *Note: the levels above come from the 1H chart provided. A true higher-timeframe view (4H or daily) would help confirm them.* #ByXIMPACT
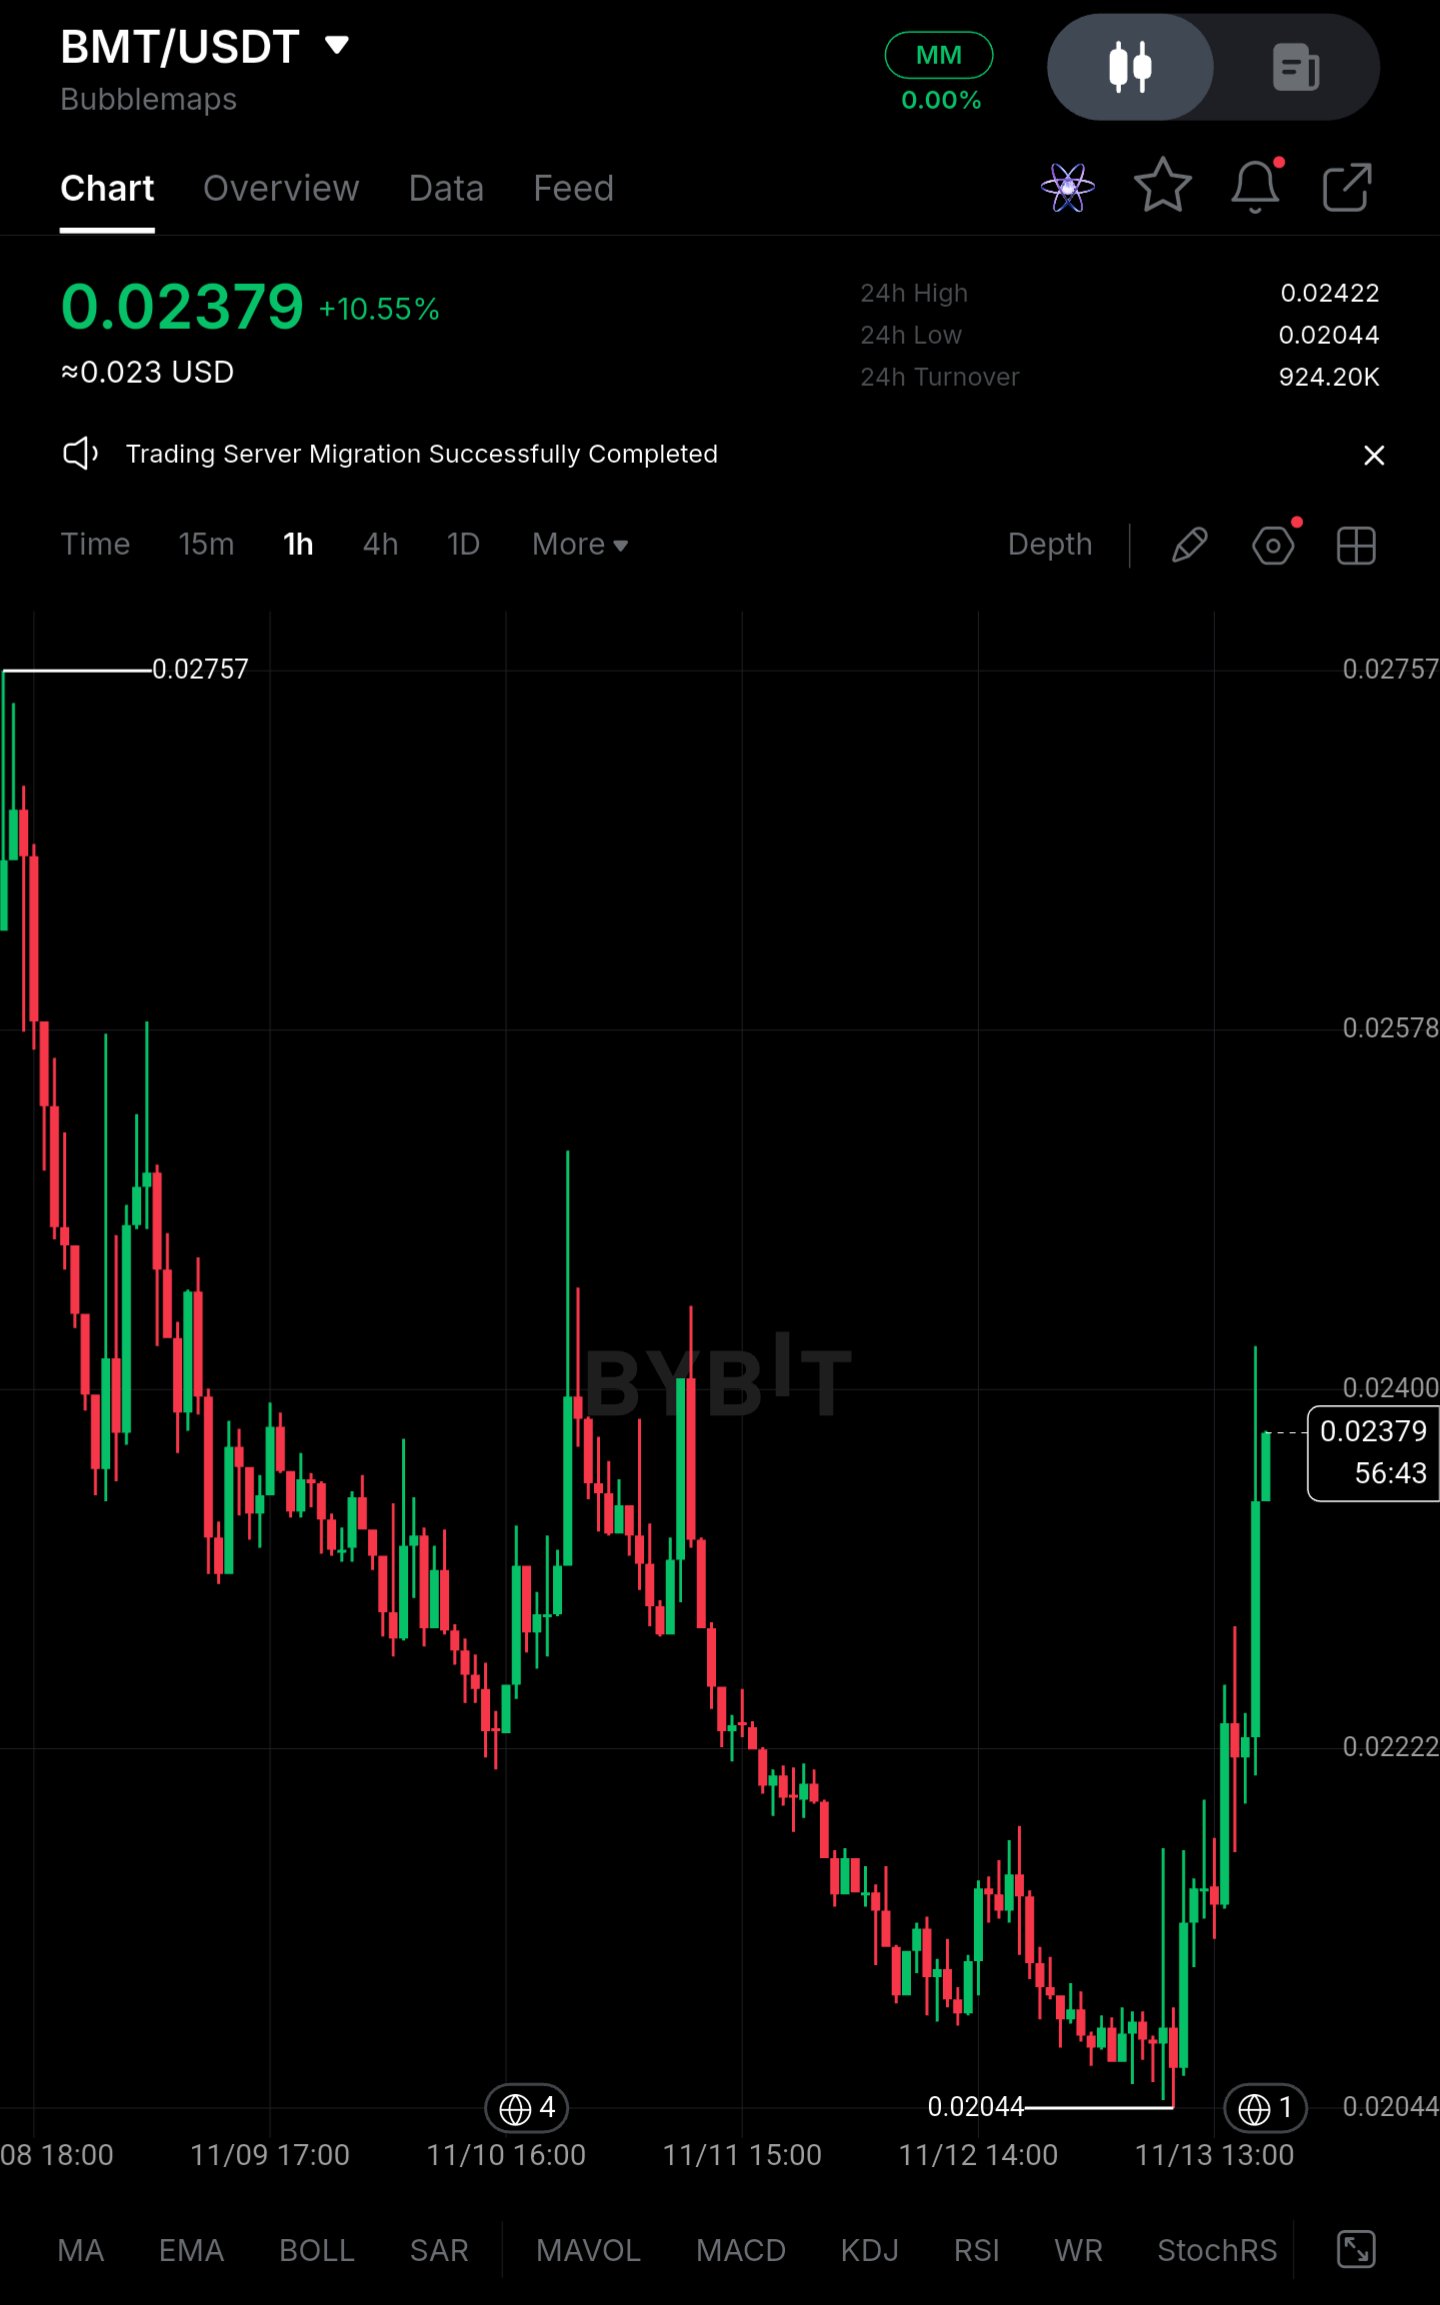
$BMTUSDT – Visión general de temporalidad superior | Largo en retroceso** Par: $BMTUSDT (Bubblemaps, Bybit) BMT se ha pasado la mayor parte de la semana pasada desangrándose a la baja. El precio salió del área de 0,02757 y fue descendiendo de forma bastante ordenada, con breves rebotes, hasta encontrar un suelo en 0,02044. No intenté capturar ese movimiento bajista, y el rebote reciente ha sido demasiado rápido para que pueda perseguirlo. El precio está ahora alrededor de 0,02379 (+10,55% en el día), empujando hacia la zona de 0,02400 tras una fuerte carrera vertical desde los mínimos. Es una respuesta sólida, pero se trata de una secuencia de velas de expansión tras una larga tendencia bajista, y prefiero ver cómo se comporta el precio en un retroceso antes que entrar comprando. *Nota: esta lectura se basa en el gráfico de 1H proporcionado, así que trátalo como una estructura a corto plazo en lugar de una tendencia confirmada de temporalidad superior.* **Perspectiva actual y niveles clave** **Zona de compra: 0,02222 – 0,02250** 0,02222 es un nivel visible en el gráfico, y se sitúa en medio del reciente rebote, donde el precio se movió rápidamente a través de él. Un retroceso a esta área sería una prueba de si esa ruptura fue real. Querría ver a los compradores entrar con un rechazo de mecha o un cierre firme en 1H por encima de la zona. Si el precio la atraviesa con fuertes ventas, no hay nada que comprar. **Zona de resistencia: 0,02422 – 0,02578** 0,02422 es el máximo de 24h, y 0,02578 es el siguiente nivel marcado arriba, donde el precio fue rechazado durante el descenso anterior. Los vendedores bien podrían aparecer aquí, ya que es donde los largos atrapados de la tendencia bajista buscarían salir. Un cierre en 1H por encima de 0,02578 que se mantenga en un retesteo sugeriría que la tendencia bajista se está rompiendo y que 0,02757 vuelve a estar en juego. Hasta entonces, es oferta por encima. **Configuración de trading** **Posición:** Largo en retroceso **Zona de entrada:** 0,02222 – 0,02250, solo después de una reacción visible de los compradores. Esta es una zona de entrada potencial, no una entrada confirmada. **Stop-Loss:** Por debajo de 0,02200 **Invalidación:** Un cierre en 1H por debajo de 0,02200 colocaría al precio de nuevo dentro del rango anterior y sugeriría que el rebote fue un *short squeeze* en lugar de un cambio de tendencia. En ese punto, me apartaría y reevaluaría. **Take-Profits:** - TP1: 0,02422 - TP2: 0,02578 - TP3: 0,02757 **Por qué tiene sentido esta configuración** Tras un descenso tan persistente, un rebote del 10% suele ser la primera señal de un cambio, no la prueba del mismo. Comprar en 0,02379 significa entrar justo por debajo del máximo de 24h y de 0,02400, con resistencia cercana por encima y un stop que tendría que estar muy abajo. Eso es un mal riesgo para el espacio disponible. A un retroceso a 0,02222 le corresponde un nivel definido con un stop cercano, y los objetivos se sitúan en niveles que el gráfico ya ha marcado. Lo que importa es la reacción: si los compradores defienden la zona, sugiere que el movimiento tiene demanda detrás. Si no lo hacen, el stop es pequeño y la idea es claramente errónea. Prefiero perderme parte de una continuación que comprar un pico y esperar. El nivel de stop en 0,02200 es mi propia colocación justo debajo de la zona, así que ajústalo a tu propia tolerancia al riesgo. **Gestión del riesgo** Respeta el plan y no muevas ni ignores el stop. Dimensiona la posición de manera que un *stop-out* sea una pérdida que puedas aceptar, especialmente en una moneda que acaba de moverse tan rápido. Una recuperación tras una tendencia bajista puede fallar rápidamente, y ninguna configuración garantiza un beneficio. $ByXIMPACT
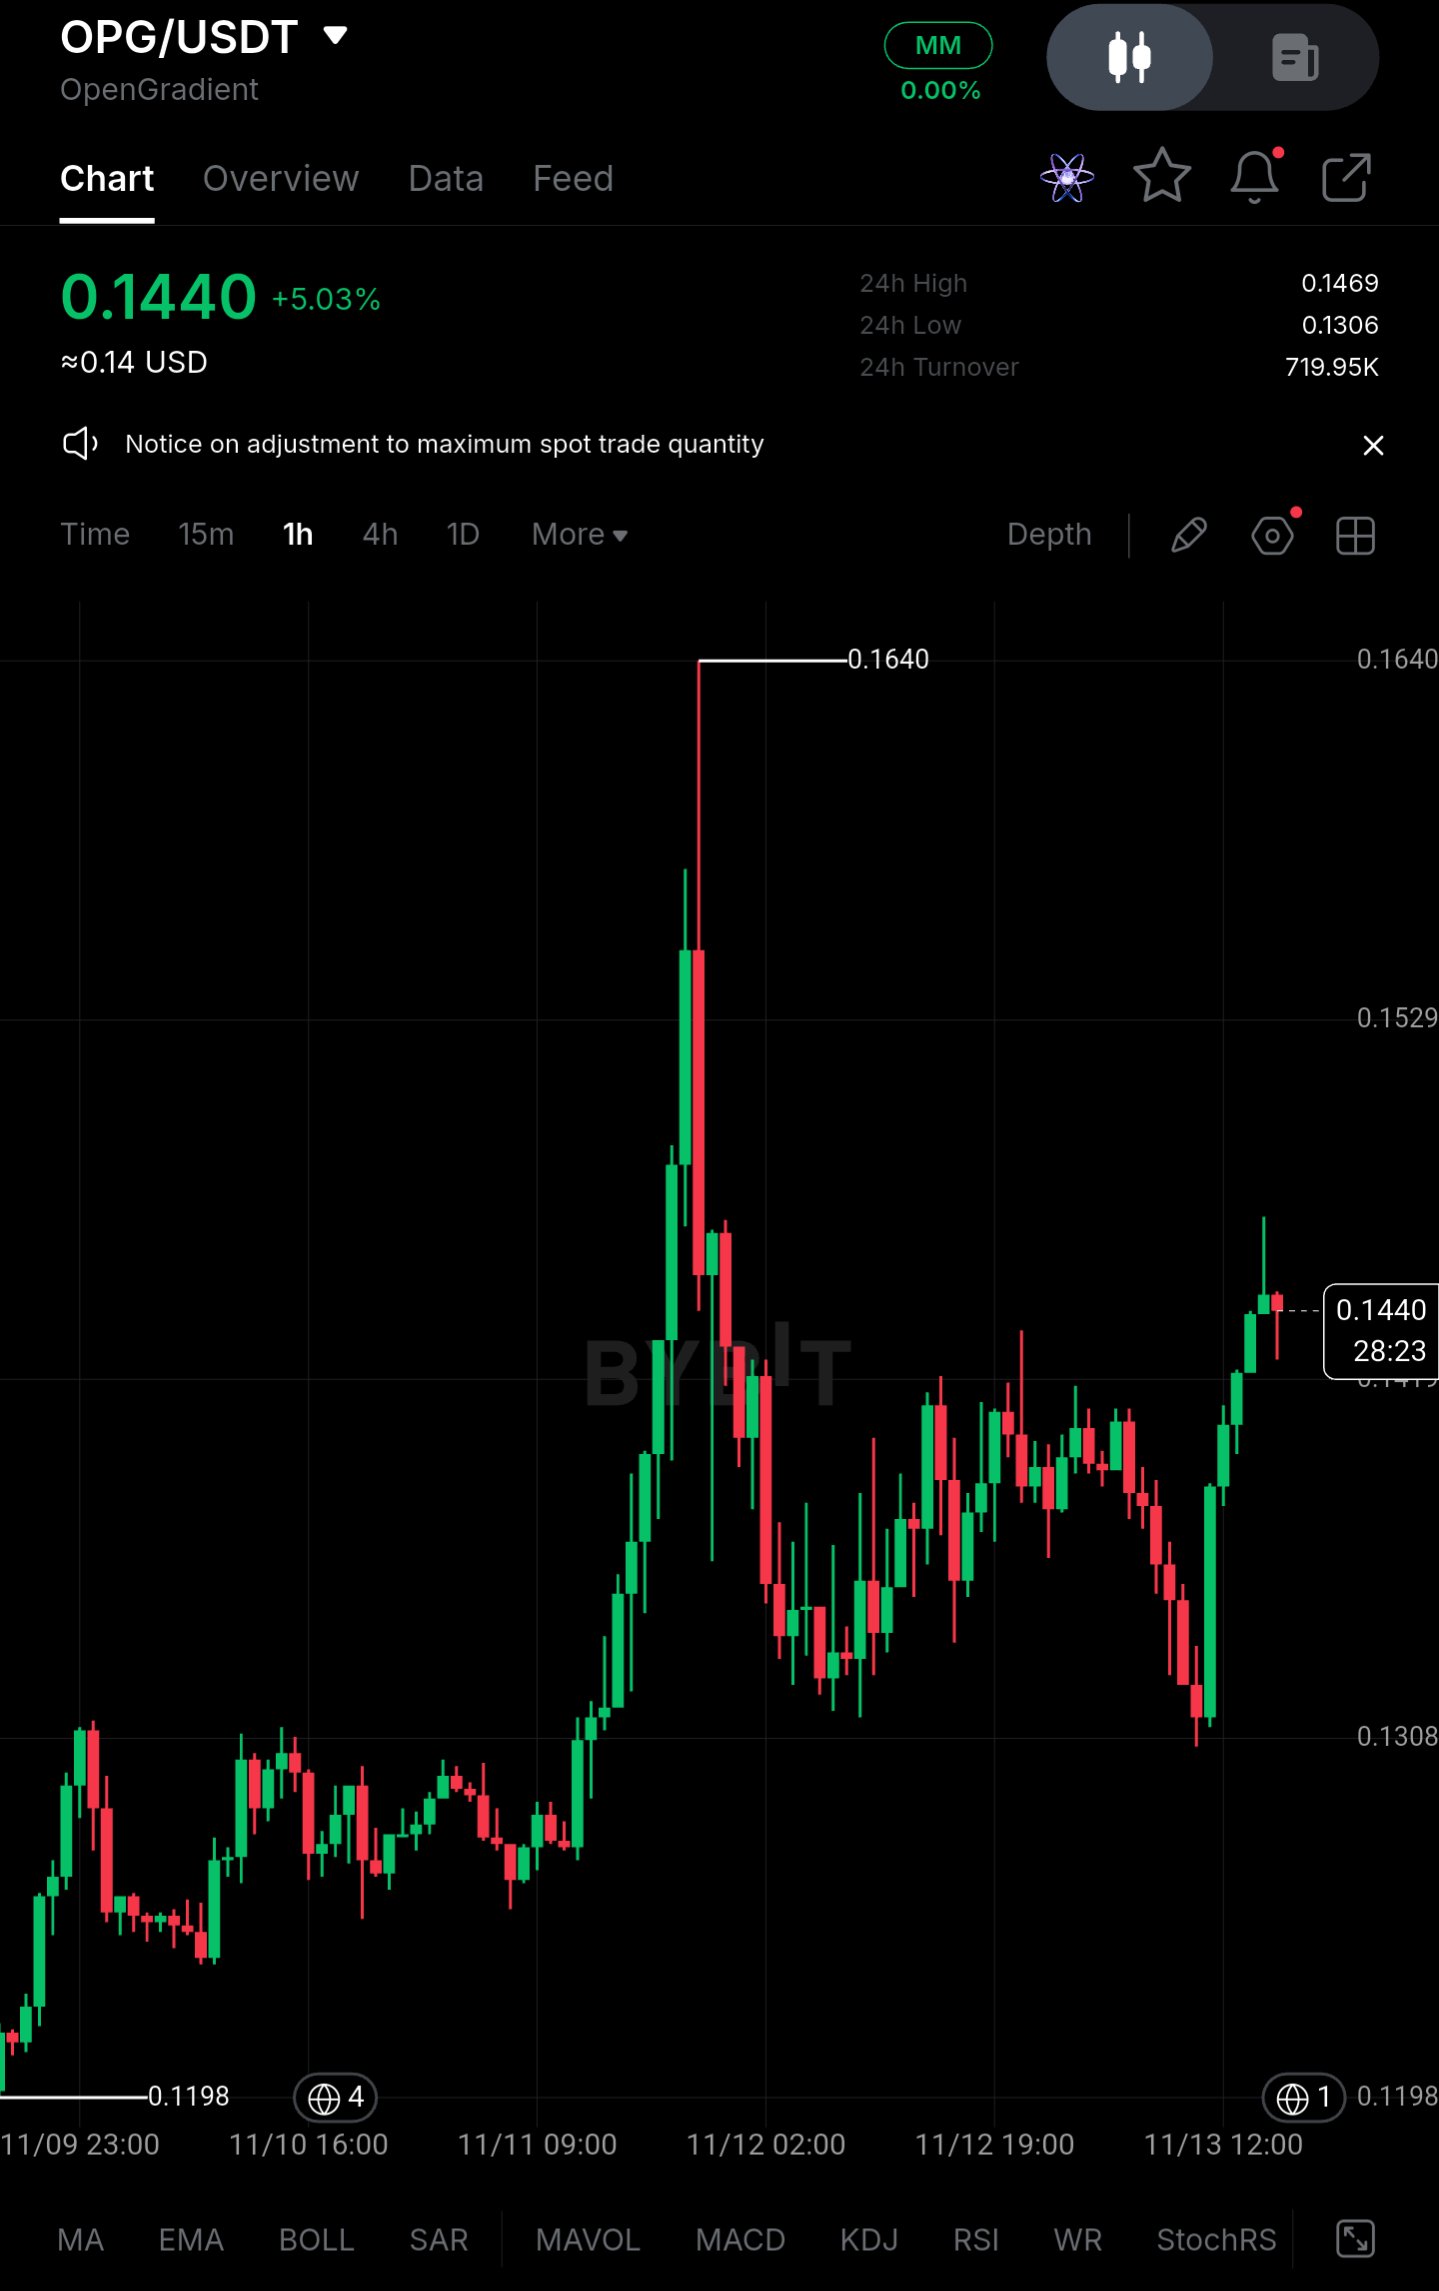
$OPGUSDT – Visión general de temporalidad superior | Largo en retroceso Par: $OPGUSDT (OpenGradient, Bybit) He estado observando OPG desde el empuje desde el mínimo de 0.1198 el 09/11. No conseguí una entrada limpia en esa primera etapa, y perseguirlo cerca del máximo habría sido una mala gestión del riesgo. El movimiento llegó hasta 0.1640, donde se formó una mecha larga de rechazo, y desde entonces el precio ha estado operando de forma lateral a bajista. El precio se sitúa ahora en torno a 0.1440 (+5.03% en el día) tras rebotar desde la zona de 0.1306. Es una recuperación decente, pero sigue estando dentro de un rango. Prefiero esperar a que el precio venga a mí antes que comprar en este rebote. *Nota: este análisis se basa en el gráfico de 1H proporcionado, así que trátalo como una estructura a corto plazo y no como una tendencia confirmada de mayor temporalidad.* **Perspectiva actual y niveles clave** **Zona de compra: 0.1306 – 0.1308** Este es el mínimo de 24h y la base del rango reciente, donde se absorbieron las ventas y el precio giró bruscamente al alza. Si se vuelve a probar, me gustaría ver una mecha de rechazo o un cierre fuerte en 1H por encima de la zona. Un goteo lento a través de ella sin reacción no es una configuración válida. **Zona de resistencia: 0.1469 – 0.1529** 0.1469 es el máximo de 24h, y 0.1529 es el siguiente nivel donde el precio se estancó durante el descenso anterior. Los vendedores podrían responder aquí, ya que es donde el reciente rebote podría quedarse sin fuerza. Un cierre en 1H por encima de 0.1529 que se mantenga en un retesteo sugeriría que el mercado está intentando volver a visitar el máximo de 0.1640. Hasta entonces, esto es solo oferta por encima. **Configuración de trading** **Posición:** Largo en retroceso **Zona de entrada:** 0.1306 – 0.1308, solo tras una reacción visible de los compradores. Esta es una zona de entrada potencial, no una entrada confirmada. **Stop-Loss:** Por debajo de 0.1306 **Invalidación:** Un cierre en 1H por debajo de 0.1306 significa que el suelo del rango ha fallado y que el rebote fue probablemente solo un movimiento de alivio. Me apartaría y reevaluaría en lugar de esperar una recuperación. **Take-Profits:** - TP1: 0.1469 - TP2: 0.1529 - TP3: 0.1640 **Por qué tiene sentido esta configuración** Tras un pico brusco y un rechazo como el de 0.1640, el precio a menudo necesita tiempo para construir una base. La recuperación desde 0.1306 es alentadora, pero comprar en 0.1440 significa entrar a mitad de rango con poco margen hasta el máximo de 0.1469 y un stop muy por debajo. Es una mala operación, incluso si la dirección es correcta. Esperar un retesteo de 0.1306–0.1308 coloca el stop justo por debajo de un mínimo claramente definido, y los objetivos se sitúan en niveles que el gráfico ya ha marcado. La reacción importa más que el nivel en sí. Si los compradores lo defienden de nuevo, la operación está justificada. Si no lo hacen, el stop es pequeño y la tesis queda claramente invalidada. La paciencia puede significar perderse el movimiento por completo, y prefiero eso antes que forzar una entrada. **Gestión de riesgo** Cíñete al plan y no muevas ni ignores el stop. Dimensiona la posición de manera que una salida por stop sea una pérdida que puedas aceptar. Una estructura de rango puede romperse tan fácilmente como rebotar, y ninguna configuración garantiza ganancias. $ByXIMPACT
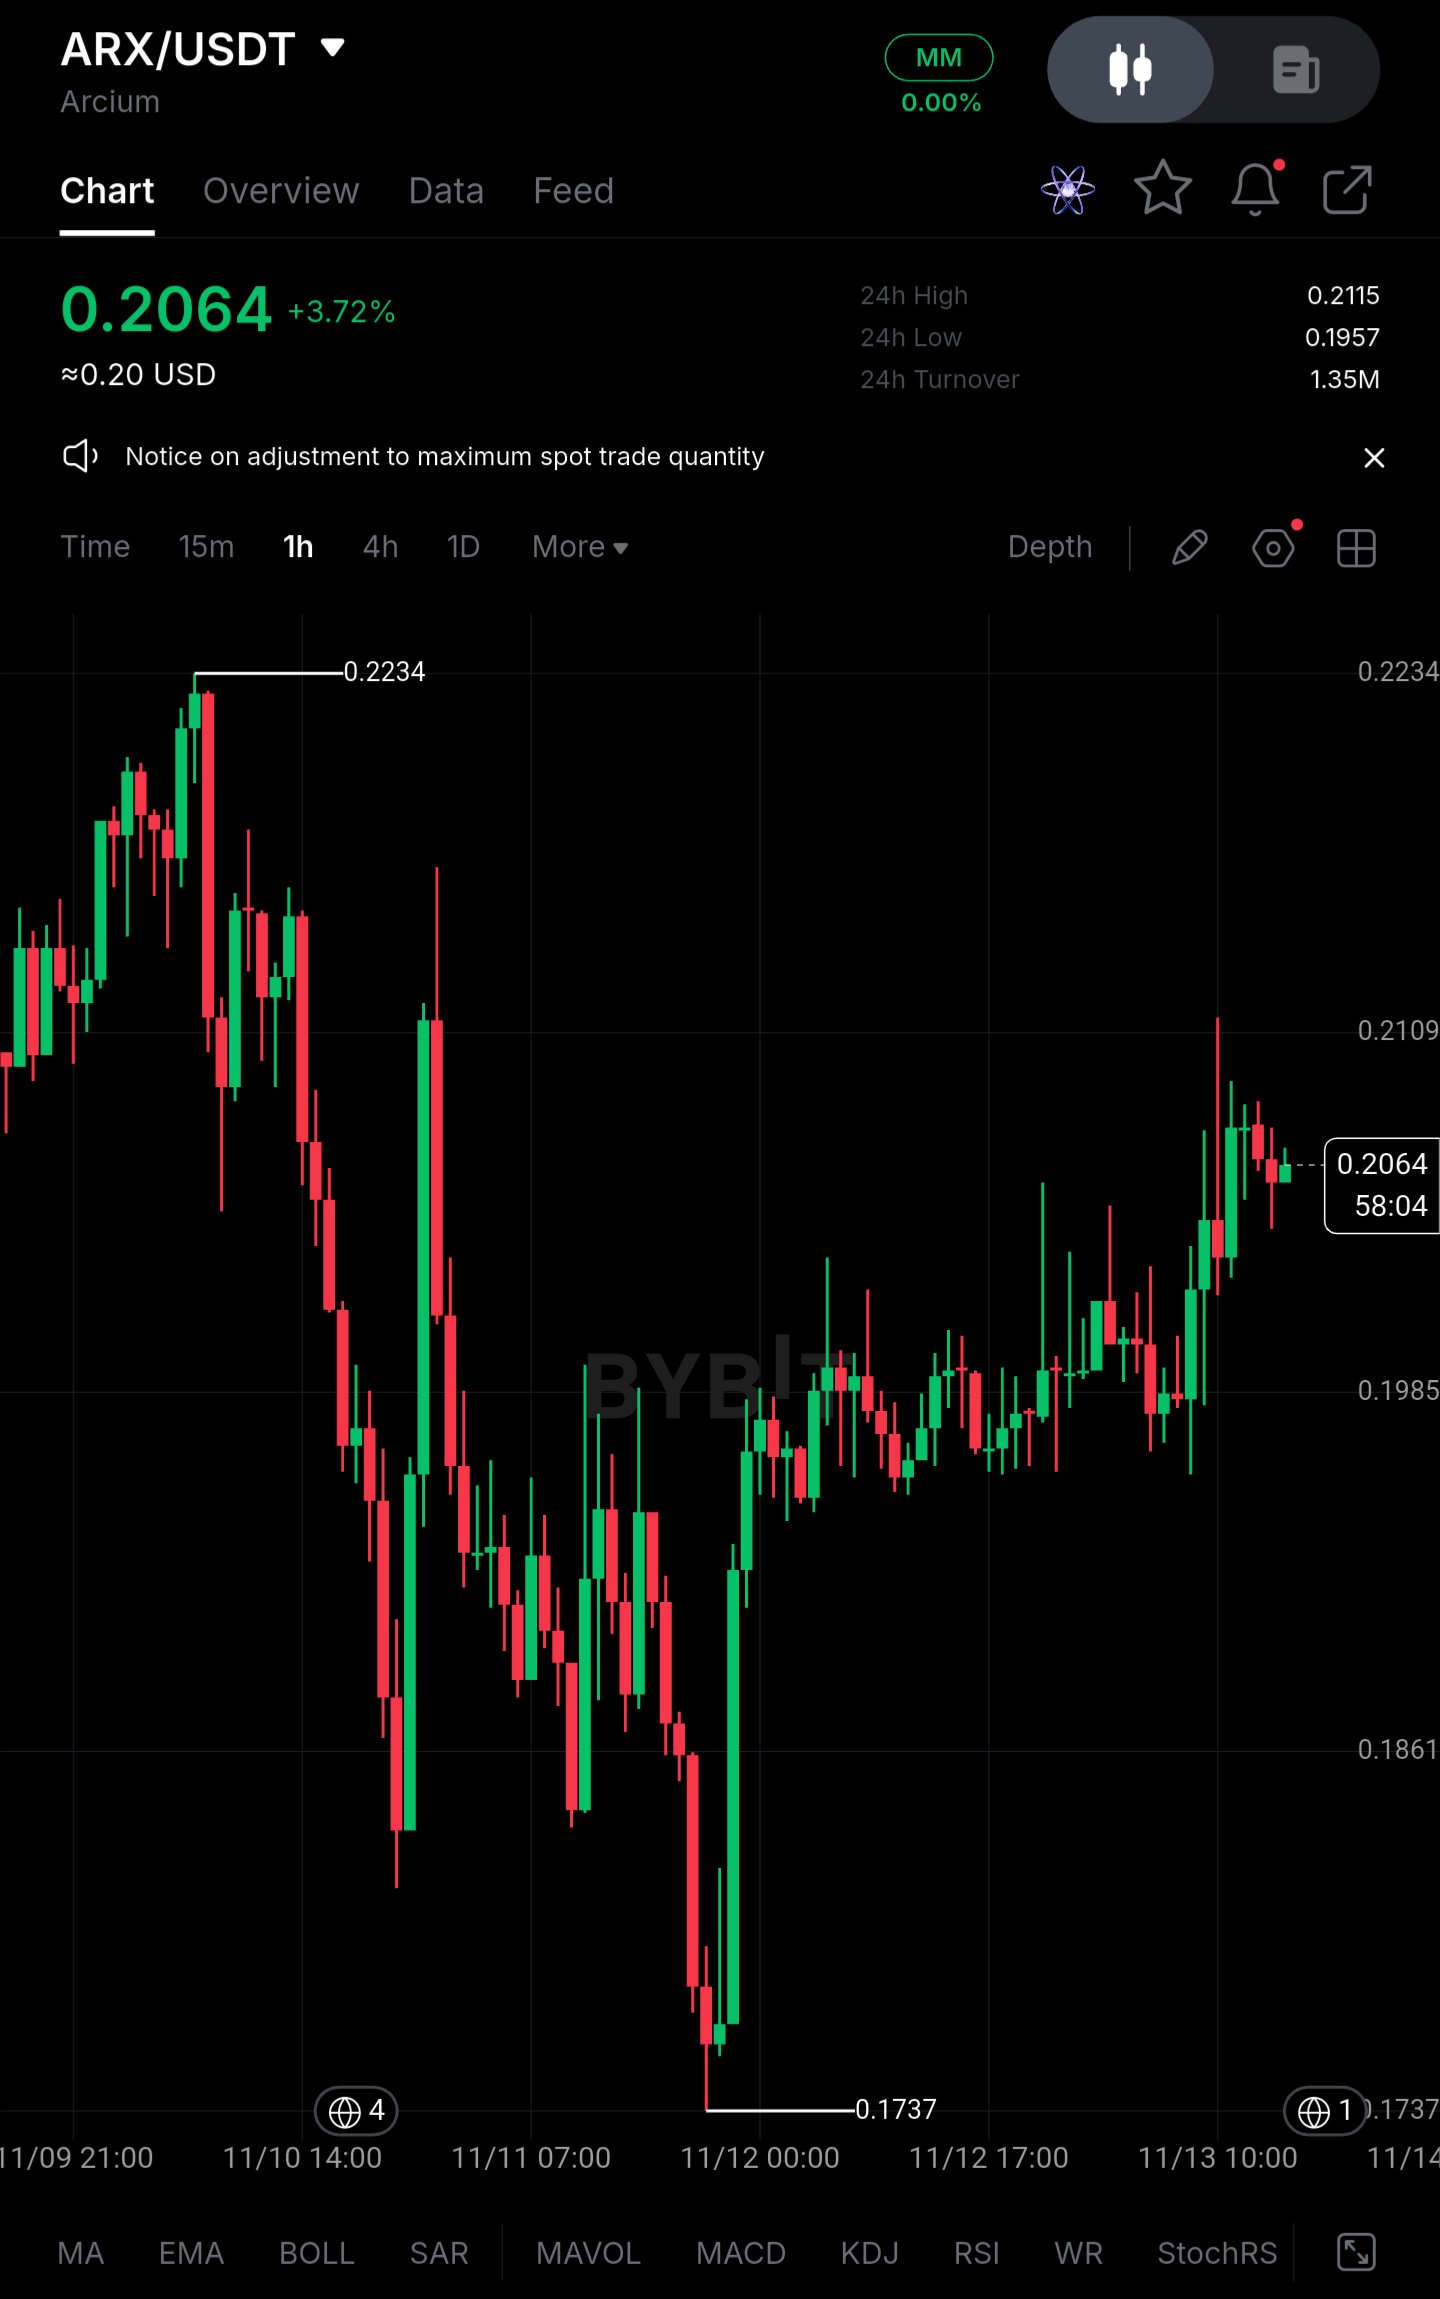
$ARXUSDT : Holding Near $0.206, But This Is Not a Recovery Yet** ARX/USDT is trading near $0.2064 after a sharp drawdown that carried price to $0.1737 on the 1H chart. The current stabilization is not being treated as a recovery. Large-capital selling pressure and a heavily long-tilted derivatives book remain the larger concern, and the bounce has not yet shown the spot demand needed to absorb it. **Price Action** ARX is at $0.2064, up 3.72% on the day, after rebounding roughly 18.8% from the $0.1737 low. That low was set on 11/12 after a steep, near-uninterrupted decline from the $0.2234 swing high, a drop of about 22%. The 24h range is narrow, $0.1957 to $0.2115, on turnover of only 1.35M. - Immediate resistance: $0.2109–$0.2115, which is the 24h high and where the latest wick was rejected - First support: $0.1985–$0.1957, where price based before the latest push higher - A reclaim of $0.2109 would improve short-term structure, but the broader trend remains under pressure, with a lower high still in place against $0.2234. **Large Capital Picture** ARX has no ETF channel, so the read comes from large-wallet and exchange-flow behavior. The V-shaped rebound from $0.1737 was driven by a single large impulse candle, not sustained bidding. The follow-through since is uneven, with alternating green and red candles and several upper wicks near $0.21. That points to inconsistent demand, with larger holders more willing to sell into strength than to accumulate. The sharp 11/11–11/12 flush also has the character of a forced-liquidation event, not orderly distribution. **Liquidity and Range Conditions** Price has compressed into a tight band after the decline. A narrow range following a sharp drop is not evidence of accumulation. Turnover of 1.35M is thin, and a move that is not backed by volume is easily reversed. Stronger spot participation is still needed before this range can be read as a base. **Derivatives Positioning** Exact figures are not visible on the chart, so these are estimates based on price behavior and typical positioning after such a rebound: - Open interest: elevated relative to spot turnover, consistent with leverage rebuilding during the bounce - Funding rate: positive, meaning longs are paying shorts - Long accounts: roughly 60–65% of positioning Positioning has rebuilt on the long side during a low-volume bounce. That creates vulnerability. If $0.1957 fails, stacked long stops and liquidations could accelerate a move back toward the recent low. **Key Figures** - Current price: ~$0.2064 - Immediate resistance: $0.2109–$0.2115 - Support zone: $0.1985–$0.1957 - Recent low: $0.1737 - Swing high: $0.2234 - 24h turnover: 1.35M - Estimated funding: positive - Estimated long share: ~60–65% **Confirmation Levels** - **Bullish:** A sustained hourly close above $0.2115 on rising spot volume would open $0.2234. Even then, the move would only be a recovery attempt, not a trend reversal. - **Bearish:** A close below $0.1957 would expose $0.1861, with $0.1737 as the next liquidity pool, where another sweep becomes likely. **Closing** The current stability is real but temporary. Large-holder selling and crowded long positioning are competing with the recovery attempt, and neither side has shown a decisive edge. The signal that matters is whether spot buyers return while leverage stays controlled, or whether another support breakdown triggers fresh long liquidations. *Not financial advice. Estimated derivatives figures should be verified against live exchange data.* #ByXIMPACT
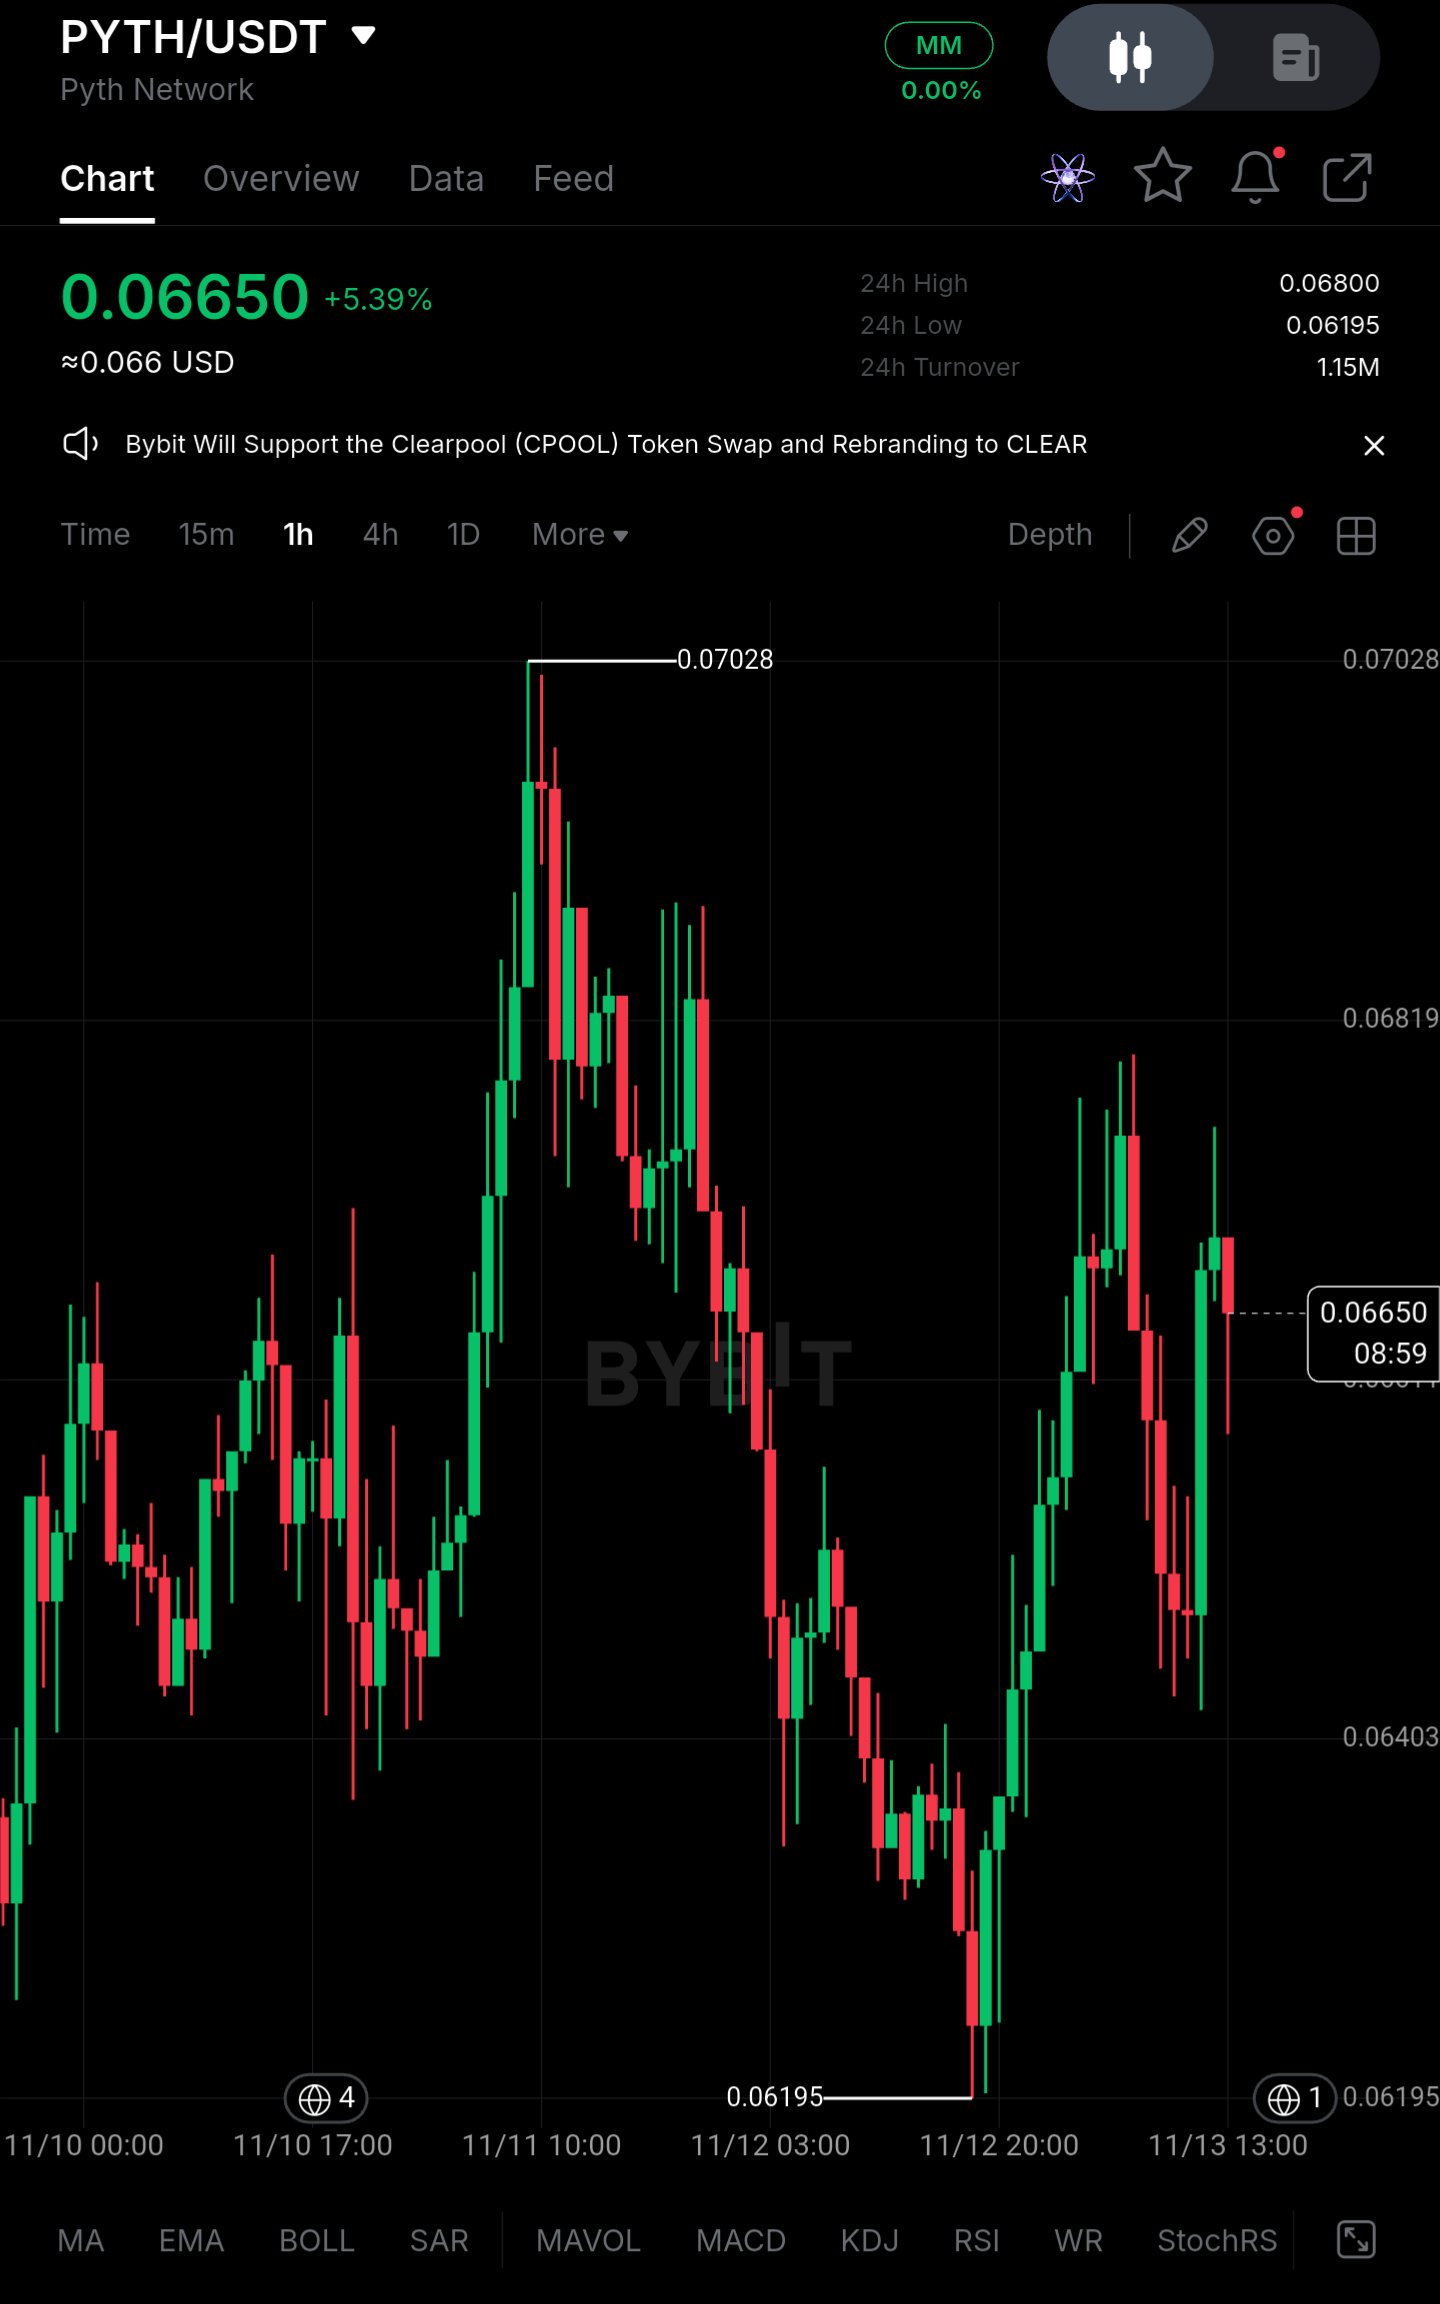
$PYTHUSDT – Visión general de temporalidad superior | Largo en retroceso** Par: $PYTHUSDT **Observación del mercado** PYTH subió hasta 0.07028 a principios de semana, luego devolvió la mayor parte de las ganancias en un descenso constante hacia 0.06195. Desde ese mínimo, el precio se ha recuperado en dos tramos y ahora se sitúa alrededor de 0.06650, subiendo un 5% en el día. La recuperación parece decente, pero no ha superado los máximos anteriores, así que, por ahora, lo trato como un rebote dentro de un rango mayor. Me perdí el primer impulso hacia 0.07028, y perseguirlo después de los hechos nunca me pareció correcto. El retroceso ha sido más interesante que la ruptura. **Perspectiva actual y niveles clave** **Zona de compra: 0.06195 – 0.06403** El mínimo de 0.06195 es la base de la reciente venta, y 0.06403 es el siguiente nivel por encima de él en el que reaccionó el mercado. Juntos forman el área donde los compradores intervinieron tras la caída. Si el precio retrocede hasta aquí, querría ver una mecha de rechazo clara o un cierre horario fuerte por encima de 0.06403 antes de tratarlo como una entrada real. **Zona de resistencia: 0.06800 – 0.06819** El máximo de 24h se sitúa en 0.06800, y 0.06819 es el nivel justo por encima. El precio fue rechazado desde esta zona en el último impulso, por lo que los vendedores ya han aparecido aquí una vez. Una ruptura horaria y una consolidación sostenida por encima abrirían el camino hacia 0.07028 y sugerirían que la recuperación es más que un simple rebote. **Estrategia de trading** **Posición:** Largo en retroceso **Zona de entrada:** 0.06195 – 0.06403, solo después de una reacción compradora visible **Stop-Loss:** Por debajo de 0.06195 (cierre horario) **Invalidación:** Un cierre sostenido por debajo de 0.06195 significa que el mínimo reciente ha fallado. Ese mínimo es la base de toda la recuperación, por lo que perderlo volvería a poner en control la secuencia de mínimos decrecientes y la idea ya no se sostiene. **Tomas de ganancias (TPs):** - TP1: 0.06800 - TP2: 0.06819 - TP3: 0.07028 **Por qué esta estrategia tiene sentido** En 0.06650, el precio ya está cerca de la resistencia en 0.06800, por lo que entrar en largo aquí ofrece muy poco espacio antes de que los vendedores aparezcan de nuevo. Esperar un retroceso hacia el área de 0.06195 – 0.06403 da una mejor estructura: el stop se coloca justo por debajo de un mínimo que el mercado ya ha defendido, y el potencial alcista hacia el primer objetivo es mucho mayor en relación con el riesgo. Los TP1 y TP2 están muy juntos porque la banda 0.06800 – 0.06819 es una zona de resistencia, así que esperaría cierta reacción allí y consideraría reducir el riesgo. El TP3 en 0.07028 es el máximo anterior, y alcanzarlo probablemente requeriría una ruptura limpia de esa banda. Si el precio nunca regresa a la zona de compra, no hay operación, y eso está bien. Perderse un movimiento cuesta menos que forzar una entrada en medio de un rango. **Gestión de riesgos** Respeta el stop y ajusta el tamaño de la posición de modo que una pérdida por debajo de 0.06195 sea aceptable. Una recuperación puede fallar, y ninguna estrategia garantiza un resultado rentable. *Nota: la zona de entrada, el stop y los objetivos no se proporcionaron, así que los construí a partir de los niveles en tu gráfico de 1h (0.06195, 0.06403, 0.06800, 0.06819, 0.07028). Ajústalos si tienes tus propios niveles, y dado que el gráfico es de 1h, quizás quieras cambiar "Temporalidad superior" en el título.* $ByXIMPACT
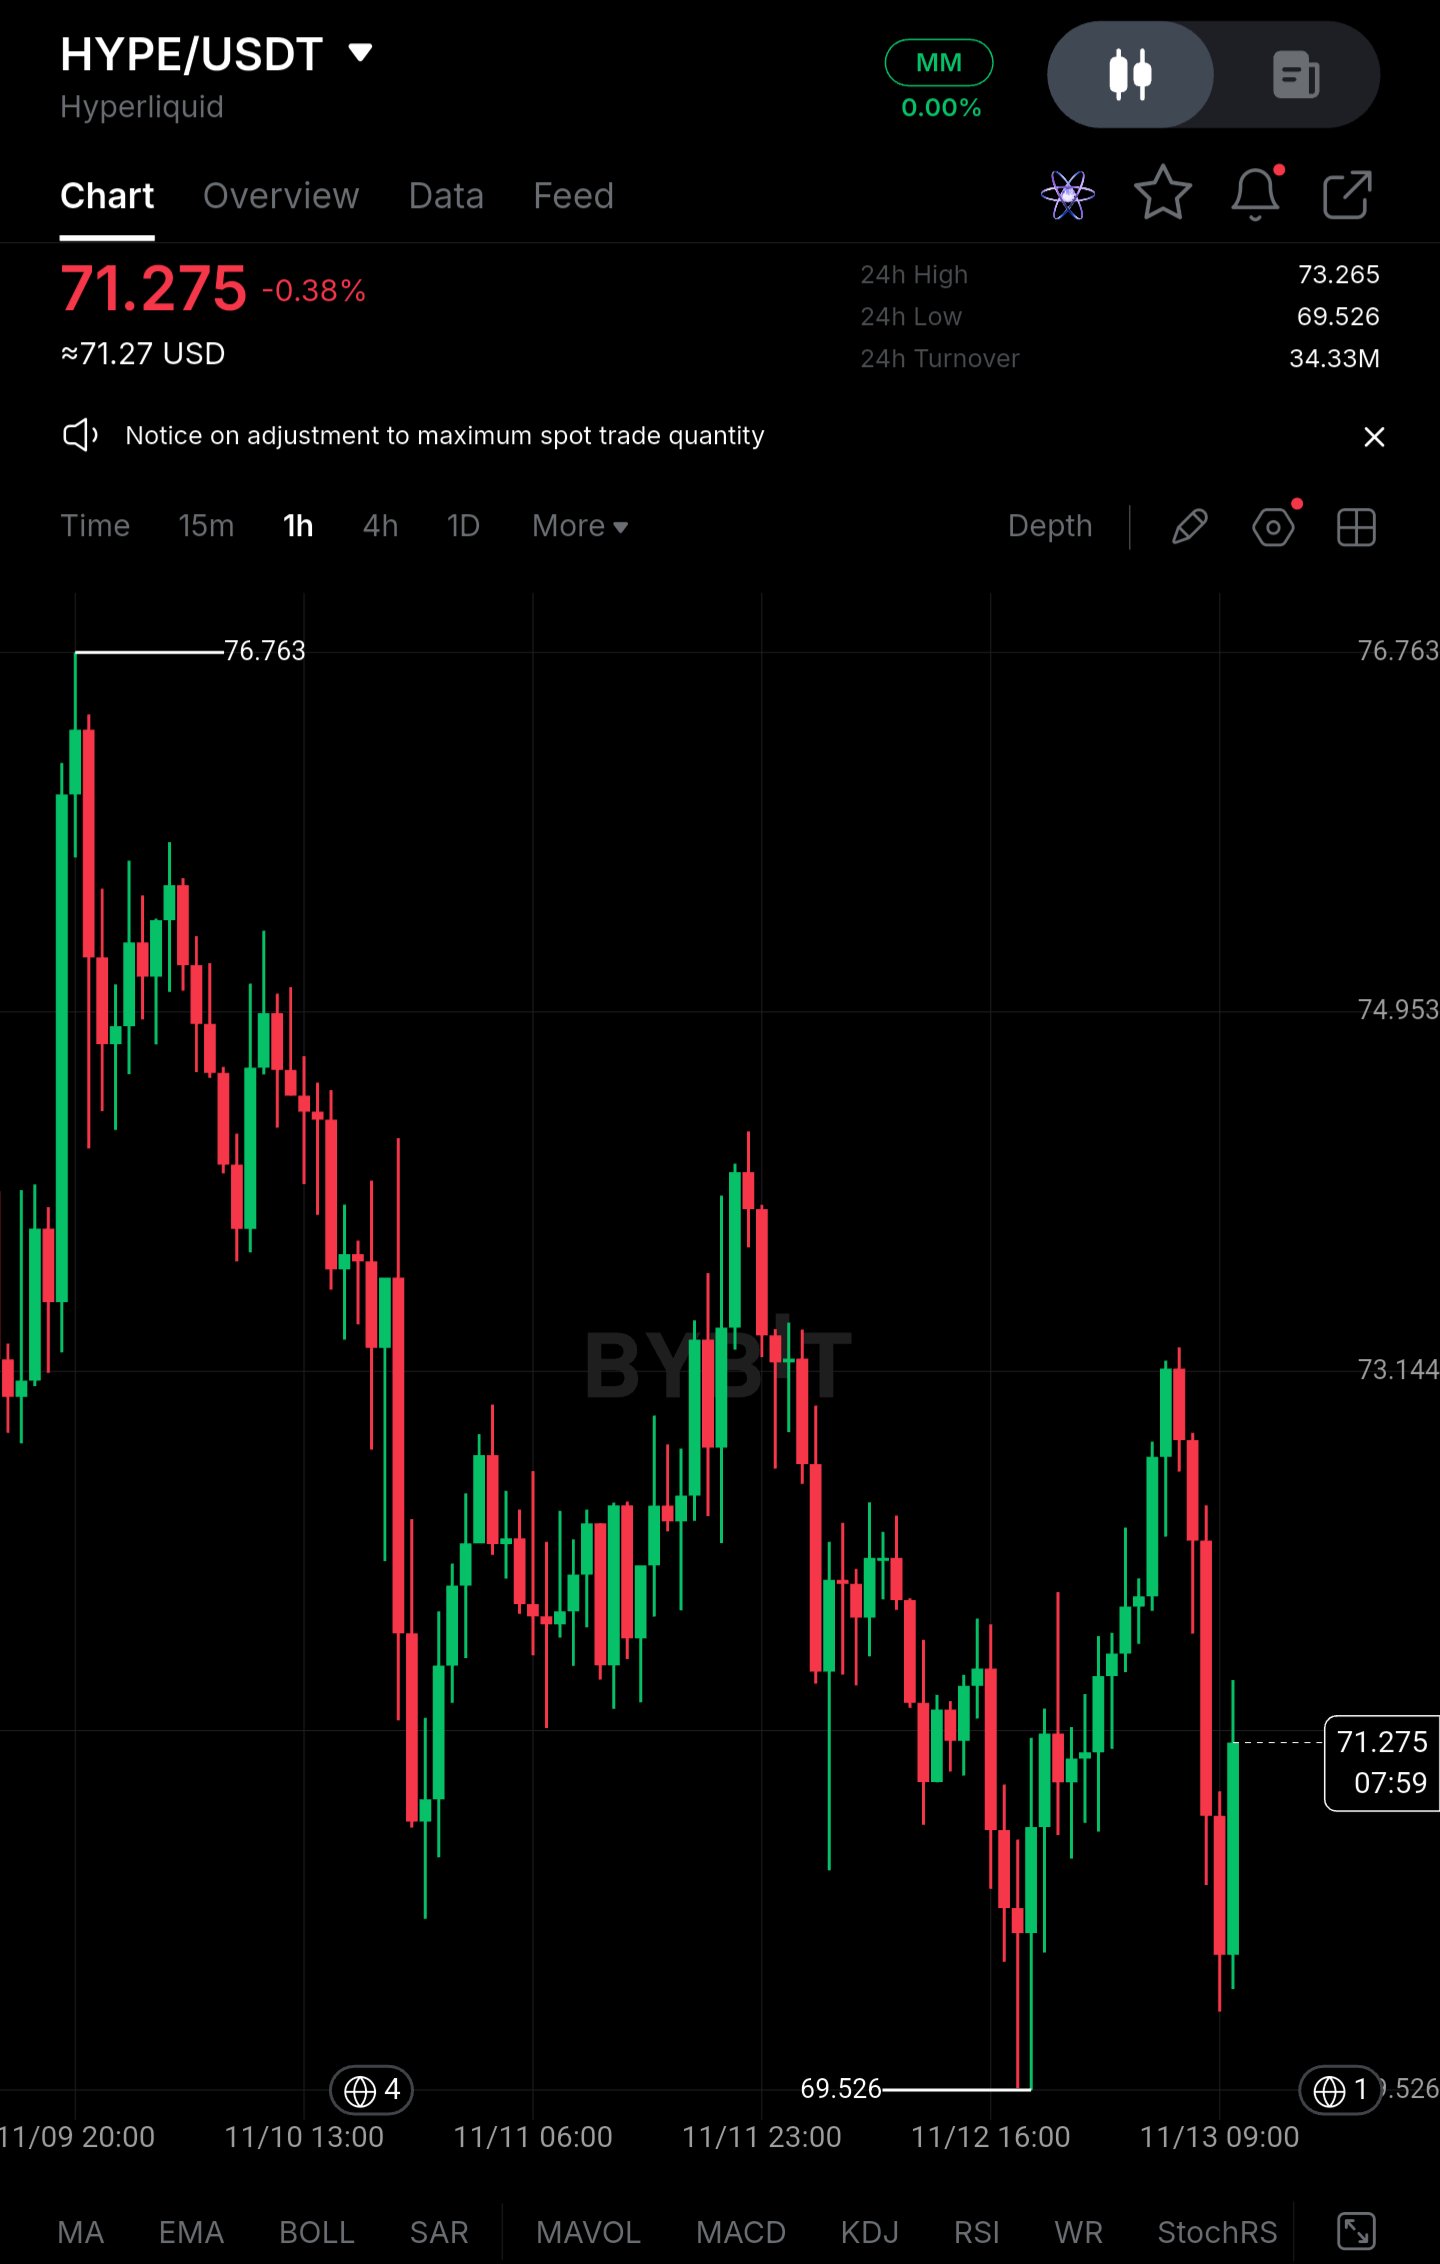
$HYPEUSDT – Visión general de temporalidad superior | Largo en retroceso** Par: $HYPEUSDT **Observación del mercado** HYPE ha estado inestable en el gráfico de 1h desde el impulso hacia 76,763 a principios de la semana. Ese pico se desvaneció en una serie de máximos más bajos y el precio ha estado rotando dentro de un rango desde entonces. Ahora está alrededor de 71,275, aproximadamente en la mitad de ese rango, que no es un punto desde el cual quiera entrar. No aproveché el movimiento alcista hasta 76,763, y estoy bien con eso. La estructura ahora es más útil de lo que fue la ruptura. **Perspectiva actual y niveles clave** **Zona de compra: alrededor de 69,5 – 70,0** El mínimo de 24h en 69,526 es el suelo que los compradores han defendido hasta ahora. El precio tocó esa zona y se recuperó, lo que muestra demanda allí. Querría otra reacción en esta zona, como una mecha de rechazo marcada o un cierre fuerte en verde en la temporalidad de una hora, antes de tratarlo como una entrada real. **Zona de resistencia: 73,14 – 73,27** Esta área contiene el máximo de 24h (73,265) y el nivel de 73,144, y el precio ya ha sido rechazado desde allí una vez. Una ruptura horaria y una consolidación sostenida por encima de ella volverían a poner en juego los niveles de 74,953 y el máximo anterior en 76,763, sugiriendo que la secuencia de máximos más bajos está terminando. **Configuración de trading** **Posición:** Largo en retroceso **Zona de entrada:** ~69,5 – 70,0, solo después de una reacción visible de los compradores **Stop-Loss:** Por debajo de 69,526 (cierre horario) **Invalidación:** Un cierre sostenido por debajo de 69,526 significa que el suelo del rango ha fallado. Los compradores lo defendieron, así que perderlo desplazaría la estructura hacia una continuación bajista y la idea ya no se mantendría. **Take-Profits (Toma de ganancias):** - TP1: 73,144 - TP2: 74,953 - TP3: 76,763 **Por qué tiene sentido esta configuración** En 71,275, el mercado se sitúa entre el soporte y la resistencia sin una ventaja clara. Comprar aquí sitúa el stop demasiado lejos, en el suelo del rango, y deja poco margen antes de la resistencia en 73,1. Esperar a un retroceso hasta 69,5 proporciona un stop mucho más ajustado, ya que la invalidación se sitúa justo por debajo de un nivel que el mercado ya ha respetado. Los objetivos siguen la estructura. El TP1 es la primera resistencia donde el precio ya se estancó, y el TP2 y TP3 son los siguientes niveles en el camino de vuelta hacia el máximo de 76,763. Si el precio nunca llega a la zona de compra, no hay operación, y prefiero perdérmela que forzar una entrada en medio del rango. **Gestión de riesgos** Respeta el stop y dimensiona la posición de modo que una pérdida en 69,526 sea aceptable. Un suelo de rango puede fallar y ninguna configuración garantiza un resultado rentable. *Nota: la zona de entrada, el stop y los objetivos no fueron proporcionados, así que los construí a partir de los niveles en tu gráfico de 1h (69,526, 73,144, 73,265, 74,953, 76,763). Ajústalos si tienes tus propios niveles, y dado que el gráfico es de 1h, es posible que quieras cambiar "Temporalidad superior" en el título.* $ByXIMPACT
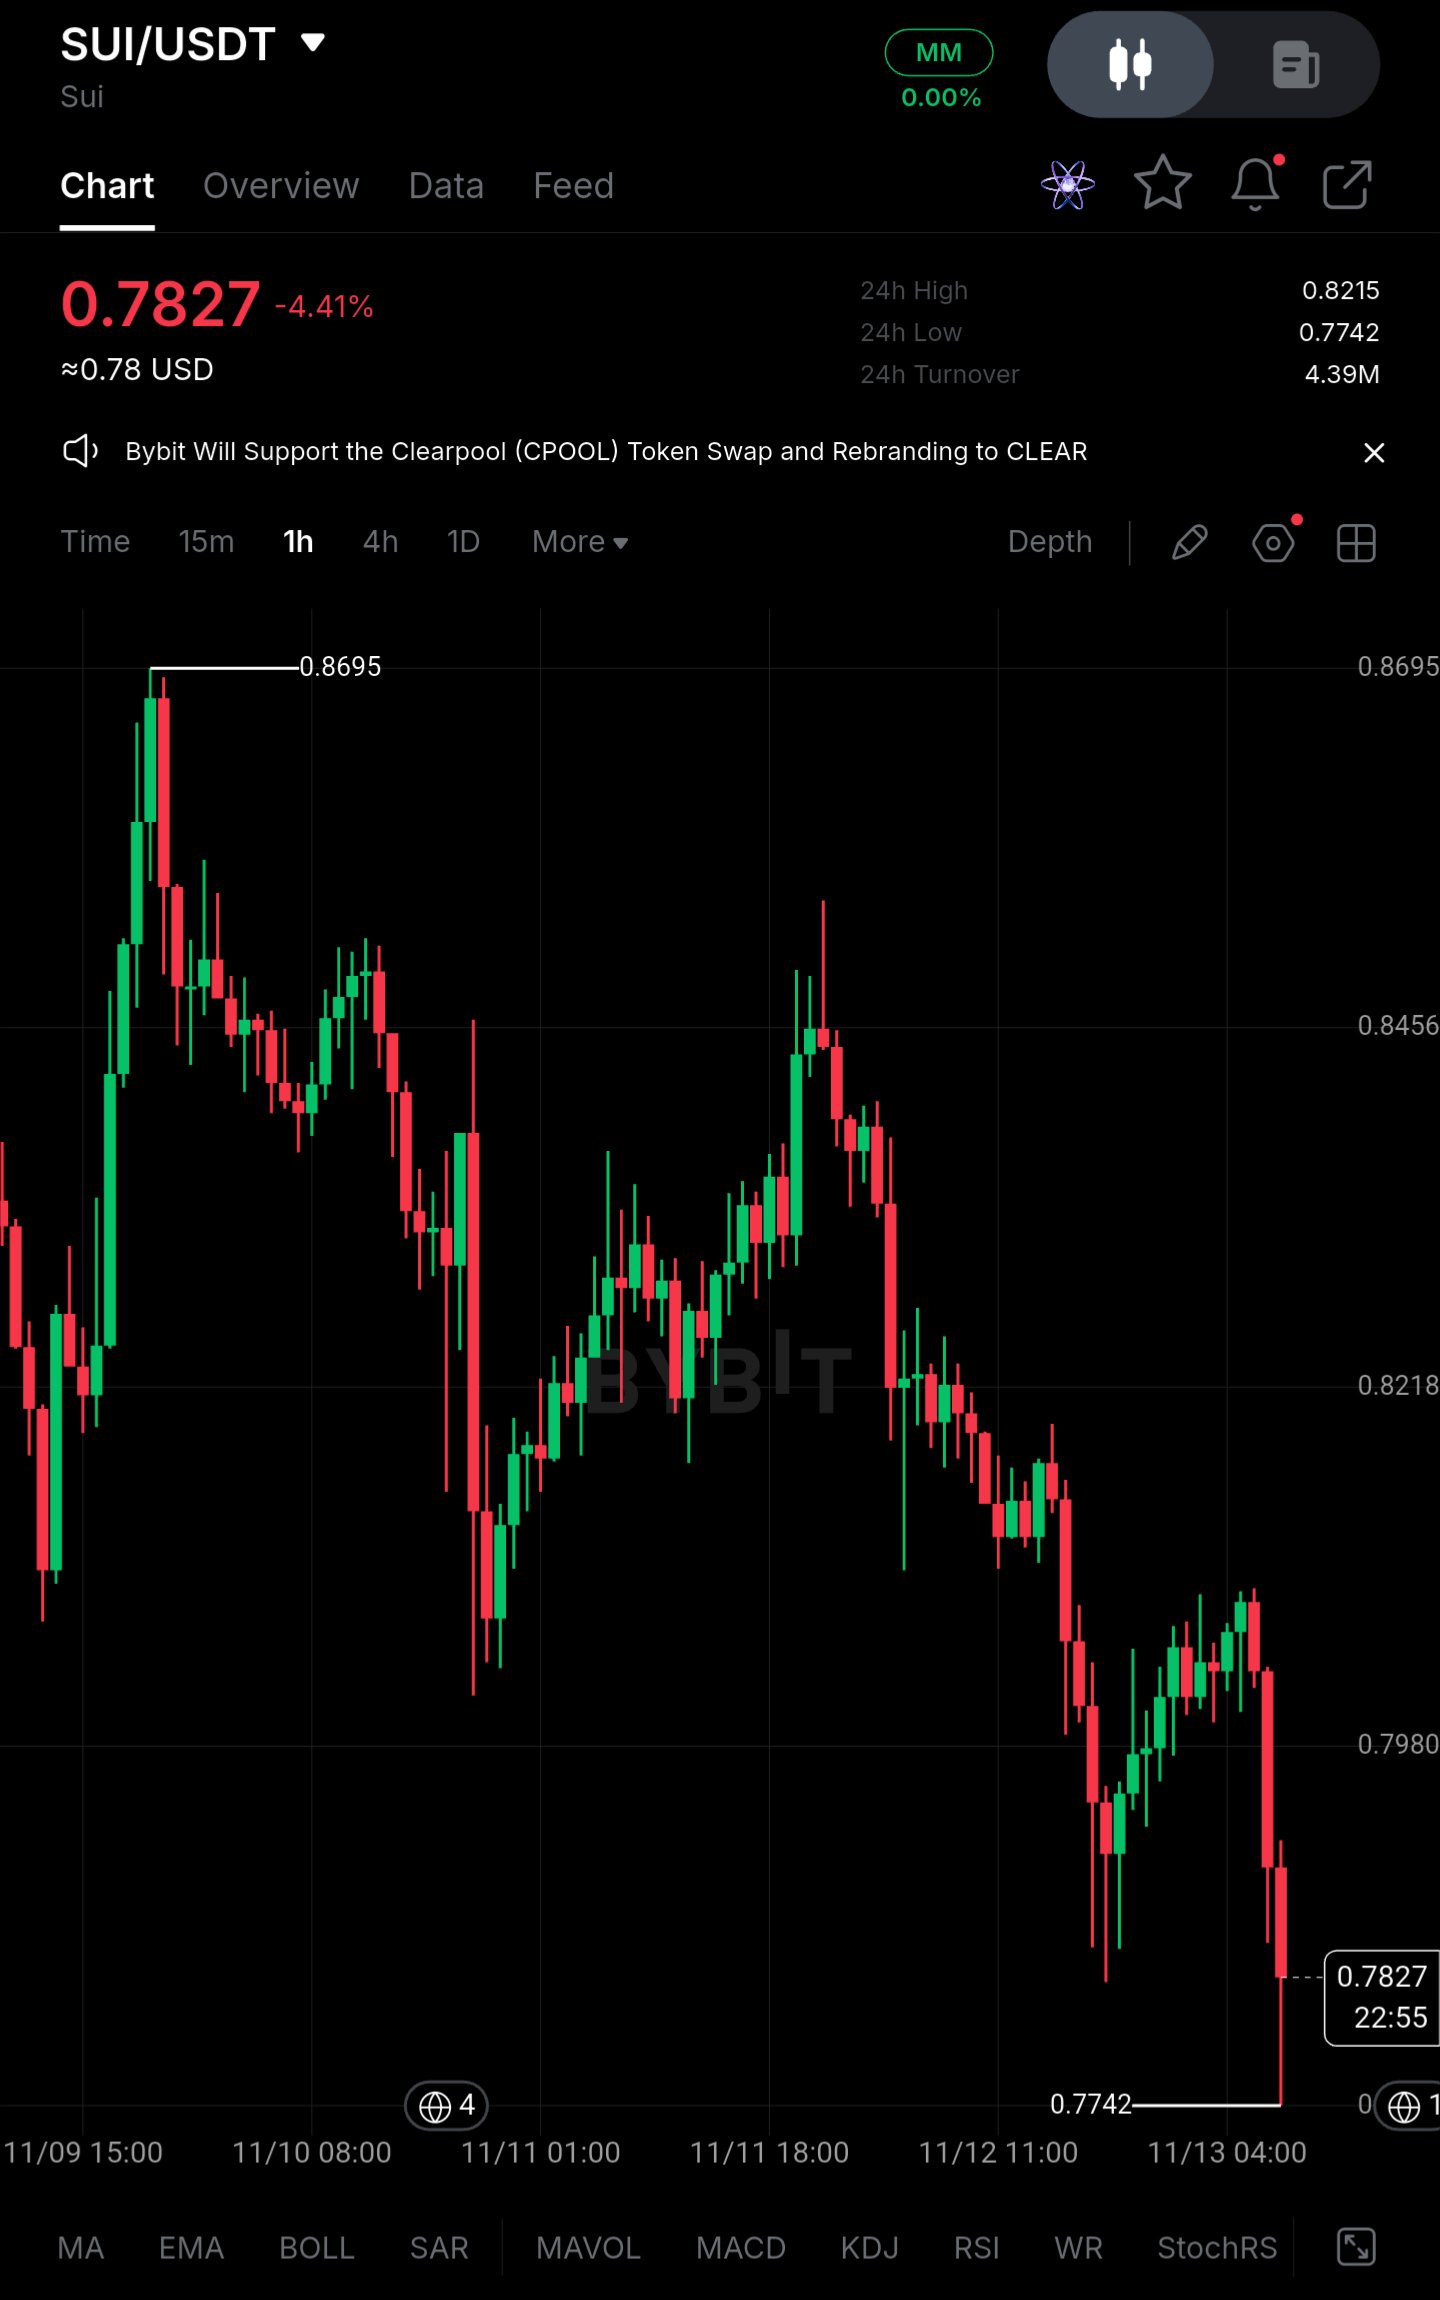
$SUIUSDT Se mantiene cerca de 0,78 $ tras un fuerte descenso, pero esto aún no es una recuperación** SUI cotiza alrededor de 0,7827 $ tras marcar un nuevo mínimo en 0,7742 $, con una caída aproximada del 4,4% en el día. No considero que la pausa actual sea una recuperación. La mayor preocupación es la persistente presión de venta de las grandes carteras, combinada con un posicionamiento en derivados que sigue inclinado hacia posiciones largas. **Acción del precio** - SUI se sitúa en 0,7827 $, aproximadamente un 10% por debajo del máximo local de 0,8695 $ registrado a principios de semana. - El rango de 24 horas va de 0,7742 $ a 0,8215 $, y las últimas velas horarias cerraron cerca de los mínimos. - La resistencia inmediata se sitúa en 0,7980 $, seguida de 0,8215 $-0,8218 $, donde comenzó el desplome al final de la sesión. - El primer soporte es el mínimo de 0,7742 $. Recuperar los 0,8218 $ mejoraría la estructura a corto plazo, pero la tendencia general de máximos decrecientes desde 0,8695 $ sigue intacta. **Panorama del gran capital** La demanda ha sido inconsistente. Cada repunte de esta semana se encontró con una fuerte oferta, y el desplome desde los 0,84 $ fue rápido y unidireccional. Ese patrón indica que los grandes tenedores y los fondos a corto plazo están aprovechando la fortaleza para reducir su exposición en lugar de acumular. Un volumen de spot de unos 4,39 millones en 24 horas no es suficiente para demostrar que los compradores están absorbiendo esta oferta. **Liquidez y condiciones del rango** El precio se está comprimiendo justo por encima del mínimo tras un tramo bajista impulsivo. Un rango estrecho tras una caída no es prueba de acumulación. Suele significar que los vendedores se están tomando un respiro, no que los compradores hayan tomado el control. Sigue faltando una participación real en el mercado spot, con un volumen creciente en los movimientos al alza y retrocesos leves. **Posicionamiento en derivados** Basándose en el comportamiento actual del gráfico, el posicionamiento sigue pareciendo inclinado hacia las posiciones largas: - El interés abierto se ha mantenido elevado a pesar del descenso, lo que sugiere que las posiciones largas apalancadas no se han eliminado por completo. - Se estima que la financiación es ligeramente positiva, lo que significa que los operadores en largo siguen pagando a los operadores en corto por mantener sus posiciones. - Se estima que entre el 55% y el 60% de las posiciones son largas. Esto es una vulnerabilidad. Si se rompen los 0,7742 $, las liquidaciones forzosas de posiciones largas podrían acelerar el movimiento mucho más allá de lo que produciría la venta en el mercado spot por sí sola. **Cifras clave (los valores de los derivados son estimaciones aproximadas)** - Precio actual: 0,7827 $ - Resistencia inmediata: 0,7980 $, después 0,8215 $-0,8218 $ - Soporte: 0,7742 $ - Máximo reciente: 0,8695 $ - Interés abierto: elevado, sin desapalancamiento significativo - Financiación: ligeramente positiva - Porcentaje de posiciones largas: ~55–60% **Niveles de confirmación** - **Alcista:** un cierre horario por encima de 0,8218 $ con un volumen spot creciente abriría el camino hacia los 0,8456 $ y comenzaría a reparar la estructura de máximos decrecientes. - **Bajista:** un cierre horario claro por debajo de 0,7742 $ dejaría expuesta la zona de 0,75 $, con 0,72 $ como siguiente objetivo si las liquidaciones de posiciones largas se producen en cascada. **Conclusión** La estabilidad cerca de 0,78 $ es real, pero es temporal hasta que se demuestre lo contrario. La venta por parte de grandes tenedores y el posicionamiento excesivo en posiciones largas juegan en contra de este intento de recuperación. La señal decisiva es si los compradores de spot regresan mientras el apalancamiento se mantiene controlado, o si otra ruptura del soporte desencadena nuevas liquidaciones de posiciones largas. #ByXIMPACT
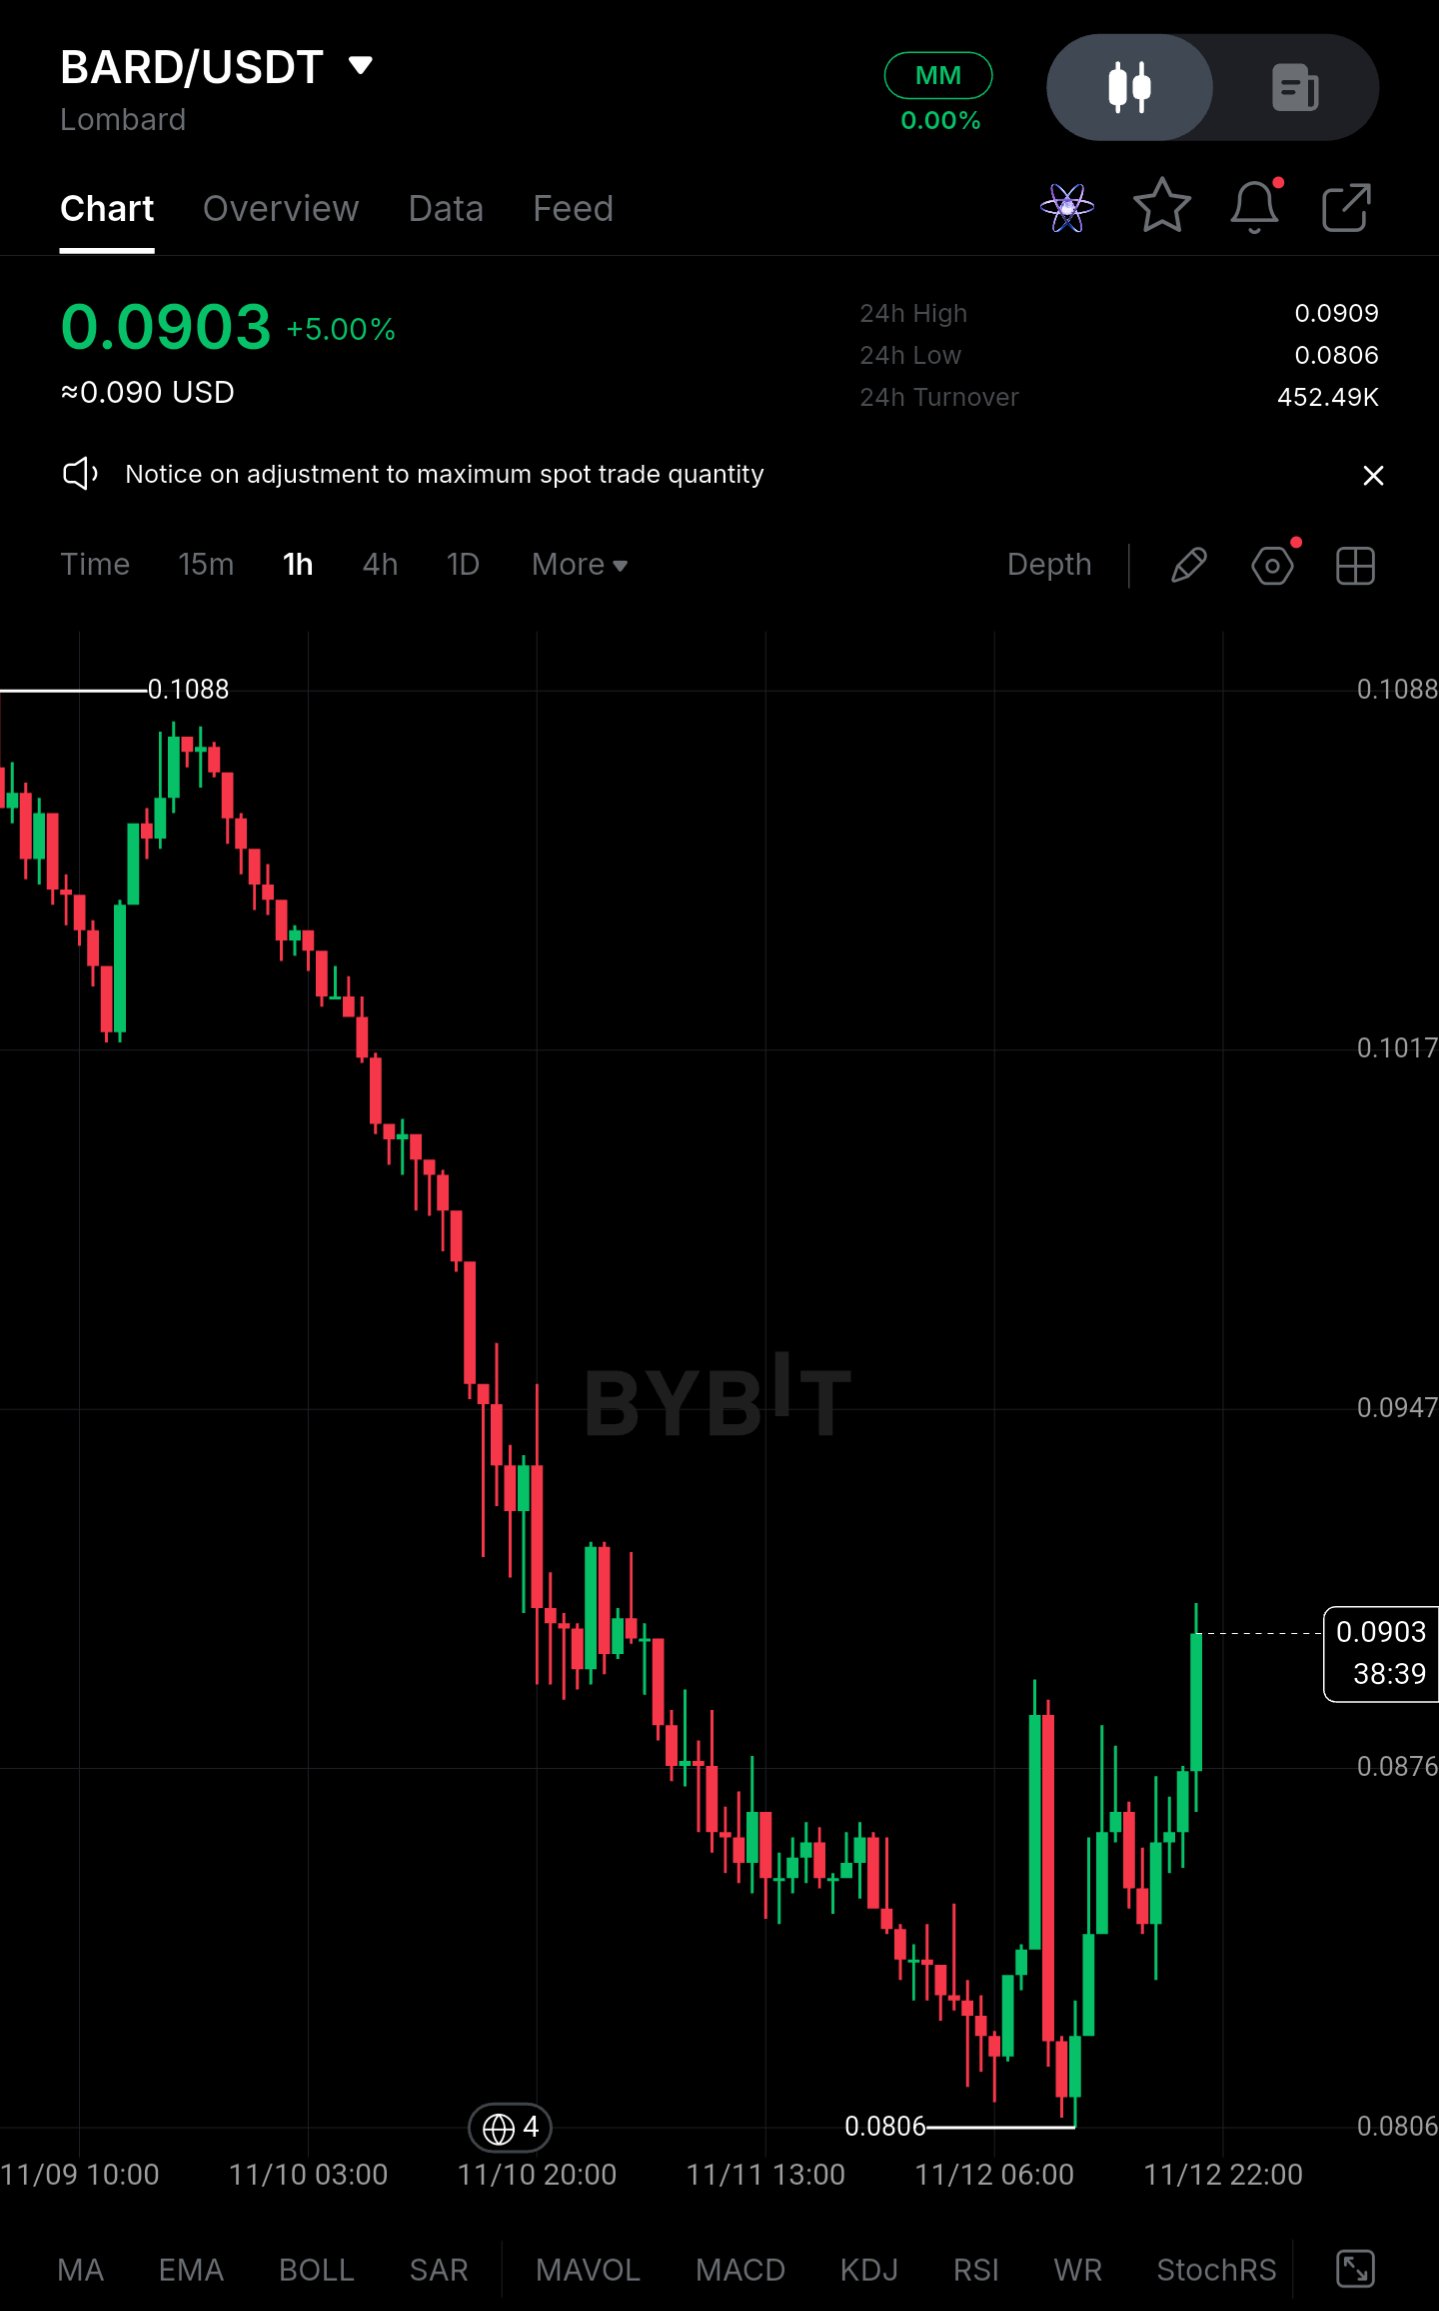
$BARDUSDT Análisis de mercado: Rebote bajo presión, no una recuperación** BARD cotiza cerca de 0,0903 tras una fuerte caída desde el máximo de 0,1088 hasta un mínimo reciente de 0,0806. No considero la estabilización actual como una recuperación. La mayor preocupación es la persistente venta por parte de grandes tenedores combinada con un posicionamiento en derivados que se ha mantenido con sesgo alcista durante la caída. **Acción del precio** - Precio actual: 0,0903, con una subida de aproximadamente el 5% en el día - Mínimo reciente: 0,0806, aproximadamente un 26% por debajo del máximo de 0,1088 - Rebote desde el mínimo: alrededor del 12% - Rango de 24h: 0,0806 a 0,0909, por lo que el precio está presionando la parte superior de su rango diario - Resistencia inmediata: 0,0909, seguida de 0,0947 - Primer soporte: 0,0876 Recuperar los 0,0947 sería la primera señal de un cambio en la estructura, pero la tendencia general sigue siendo de máximos y mínimos decrecientes, por lo que el movimiento se interpreta como un rebote de alivio dentro de una tendencia bajista. **Panorama del gran capital** Para un activo DeFi de capitalización media como BARD, las señales relevantes son la distribución de las grandes carteras y las entradas en exchanges, más que los flujos de ETF. El descenso desde 0,1088 fue constante, con velas rojas consecutivas y pocas pausas significativas, lo cual es más consistente con una oferta sostenida que con un evento de liquidación puntual. El volumen del rebote ha sido desigual, y el volumen de negocios de 24h de unos 452K es escaso para hablar de una recuperación. La demanda es inconsistente: los compradores aparecen cerca de 0,0806 pero se desvanecen rápidamente ante la resistencia. **Liquidez y condiciones de rango** El precio se ha mantenido en una banda contenida desde el mínimo, aproximadamente entre 0,0806 y 0,0909. Un rango estrecho tras una fuerte caída no es prueba de acumulación. Puede reflejar perfectamente a vendedores haciendo una pausa antes de otro tramo. Se necesita una mayor participación al contado (spot) para demostrar lo contrario, y la falta de seguimiento por encima de 0,0909 sugiere que aún no ha llegado. **Posicionamiento en derivados** *Las cifras a continuación son estimaciones inferidas del comportamiento del precio y el posicionamiento típico para este activo, no datos en tiempo real. Verifique con los datos actuales del exchange antes de actuar.* - Interés abierto: modestamente elevado en relación con el volumen de negociación al contado - Tasa de financiación (funding rate): positiva (alrededor de +0,01%), por lo que los largos están pagando a los cortos - Cuentas en largo: aproximadamente 55-60% de las posiciones El rebote no ha forzado la salida del apalancamiento. Una tasa de financiación positiva y un libro con sesgo alcista significan que muchos participantes están posicionados para una recuperación antes de que la demanda al contado lo confirme. Si el soporte se rompe, ese posicionamiento se convierte en una vulnerabilidad y podría acelerar una nueva ronda de liquidaciones de posiciones largas. **Cifras clave** - Área de precio actual: 0,0903 - Resistencia inmediata: 0,0909 a 0,0947 - Resistencia superior: 0,1017 - Primer soporte: 0,0876 - Soporte principal / mínimo reciente: 0,0806 - Volumen de negocio 24h: ~452K - Financiación: positiva (est.) - Porcentaje de posiciones largas: ~55-60% (est.) **Niveles de confirmación** - **Alcista:** Un cierre horario sostenido por encima de 0,0947 con un volumen al contado creciente abriría un movimiento hacia 0,1017. Sin volumen, un empuje por encima de este nivel es sospechoso. - **Bajista:** Un cierre horario por debajo de 0,0876 expone a un retesteo de 0,0806. Una ruptura por debajo de ese mínimo confirmaría la continuación de la tendencia y probablemente desencadenaría liquidaciones de posiciones largas. **Cierre** La estabilidad actual es real pero temporal. La venta por parte de grandes tenedores y el posicionamiento alcista abarrotado compiten con el intento de recuperación. La señal decisiva es si los compradores al contado regresan mientras el apalancamiento se mantiene controlado, o si otra ruptura del soporte desencadena nuevas liquidaciones de posiciones largas. Hasta que la demanda al contado demuestre que puede absorber la oferta, se recomienda mantener la cautela. *No es un consejo financiero.* #ByXIMPACT
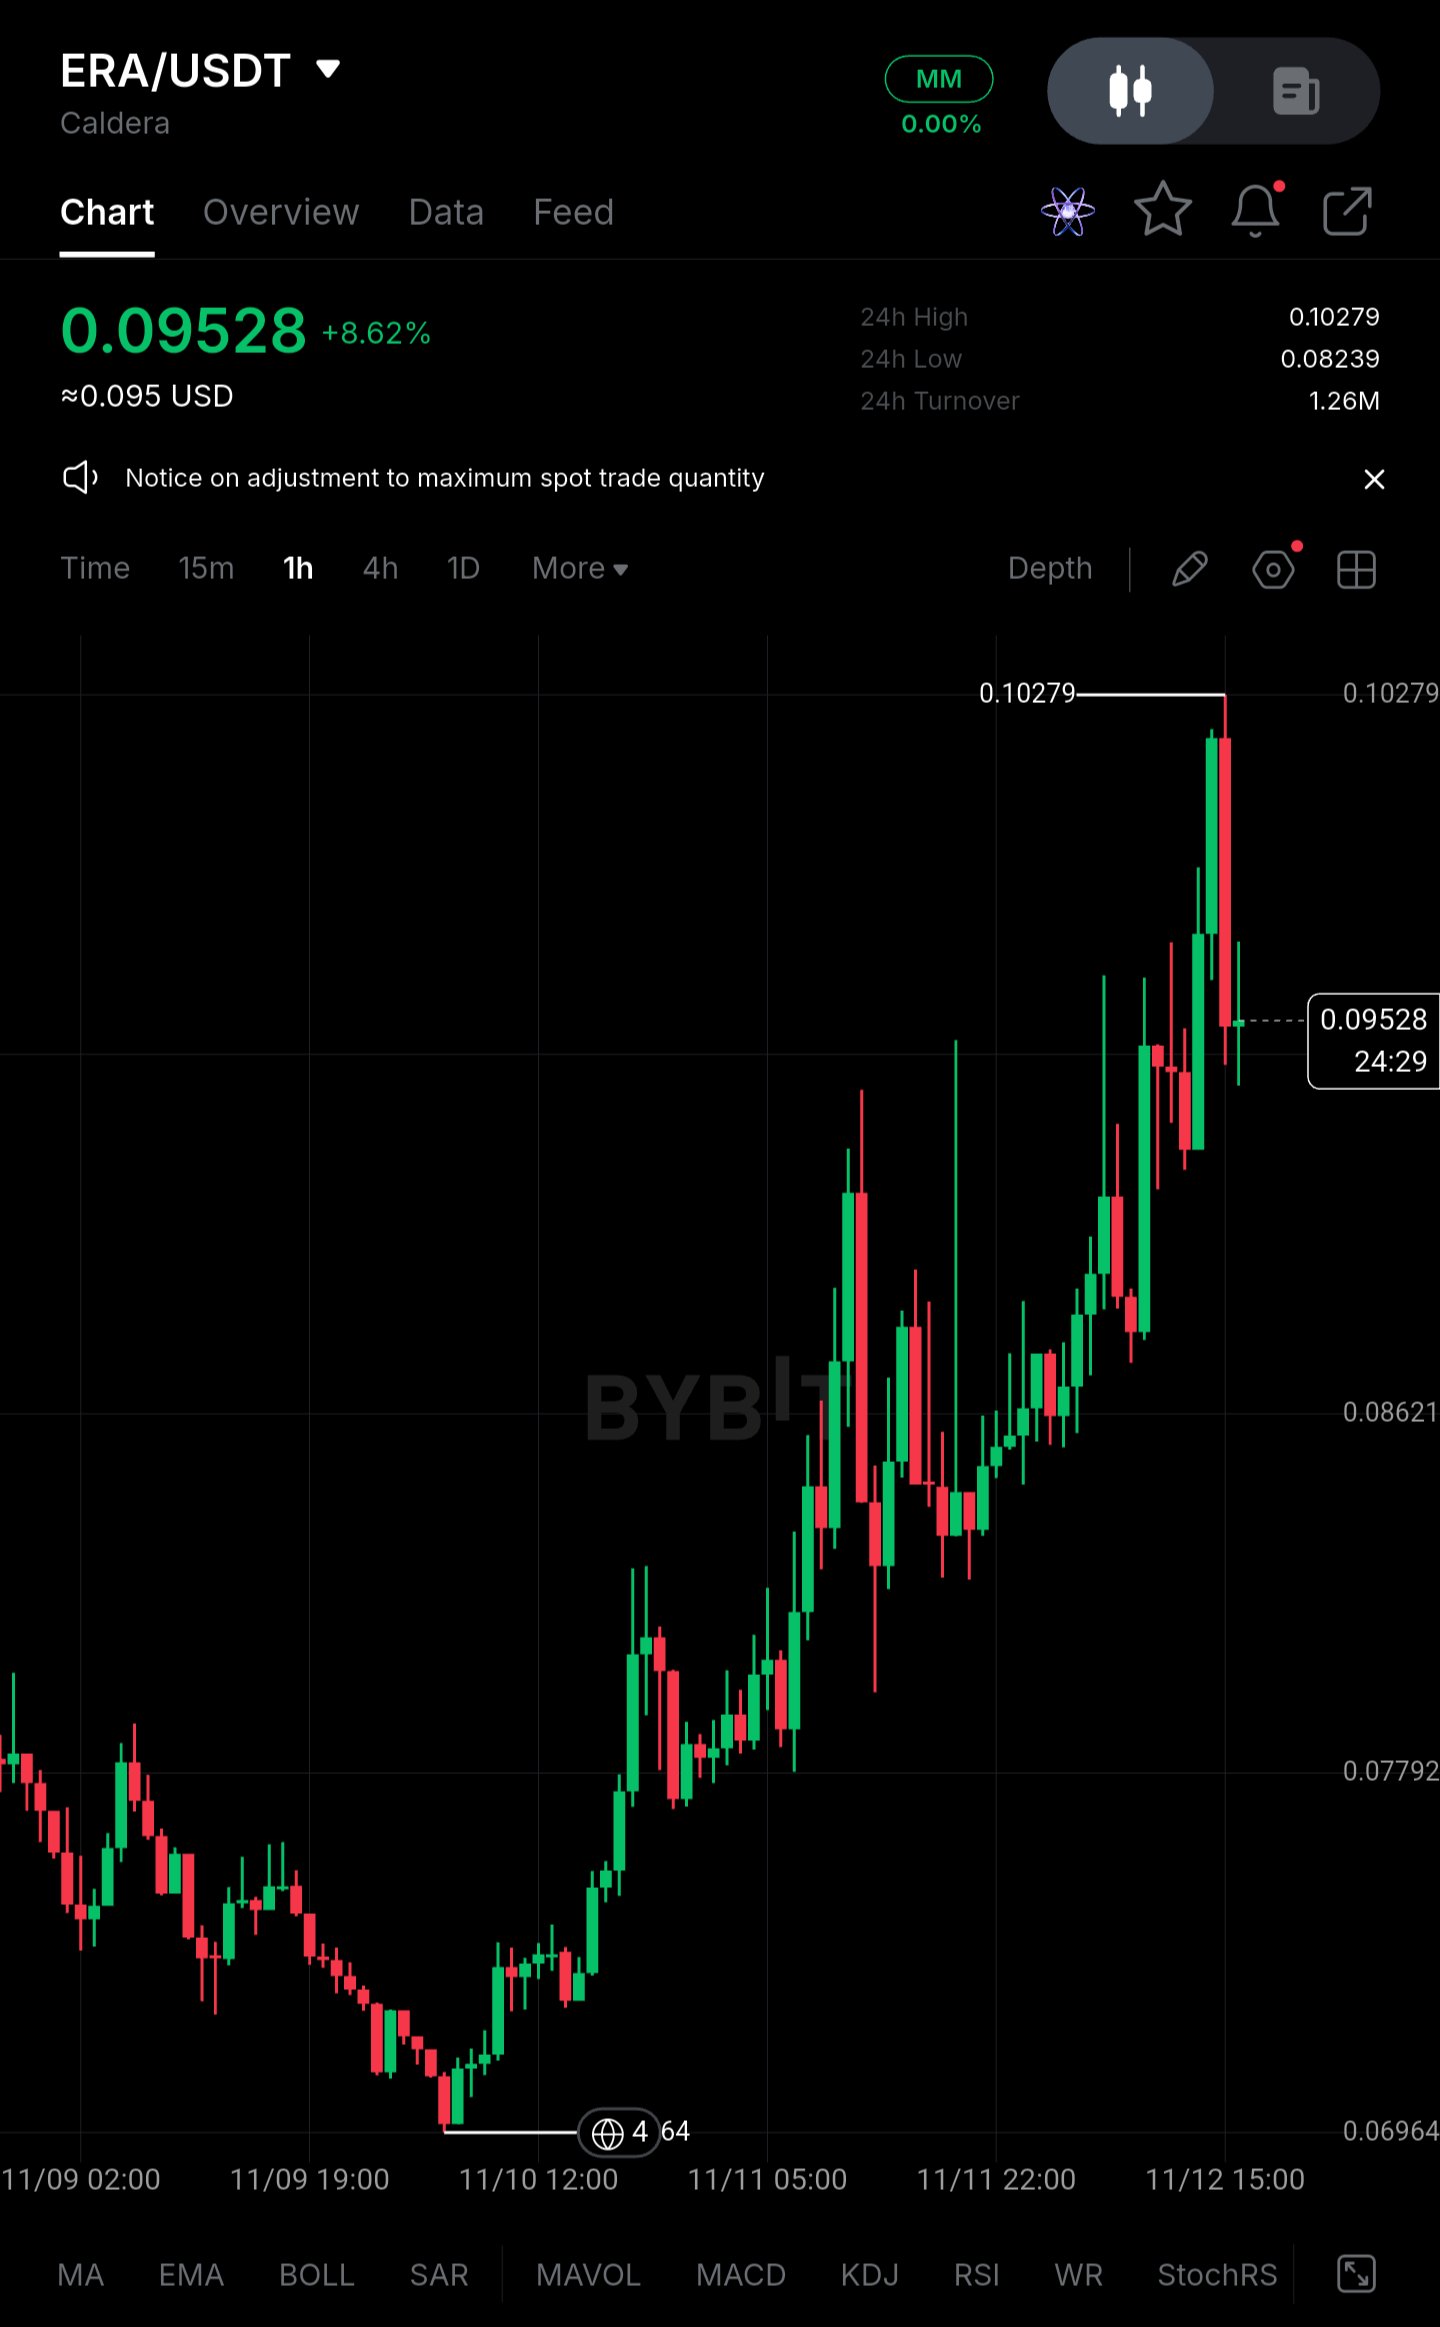
$ERAUSDT – Higher Timeframe Overview | Long on Pullback** Pair: $ERAUSDT (1H chart, Bybit) After a steady slide into the 0.0696 area, ERA has turned around and climbed almost without pausing. Price is now around 0.0953, up roughly 8.6% on the day, after tagging 0.10279. That high was rejected quickly, with a long upper wick and a red candle right under it. I didn't catch the bottom, so I'm not interested in chasing the top of this move either. **Current Outlook and Key Levels** **Buying Zone: 0.0824 – 0.0862** The 24h low sits at 0.0824, and 0.0862 is where the chart shows an earlier reaction level. Together they form a pullback area where the previous leg up was built. I'd want to see price slow down here, hold the zone, and print a higher low with buyers stepping back in. A single touch isn't enough. **Resistance Zone: around 0.1028** This is the 24h high, where the most recent push was rejected hard. Sellers are likely to defend it again. A clean break and sustained consolidation above it would show the trend can continue and turn the level into support. A quick wick above that gets sold straight back is not a breakout. **Trading Setup** **Position:** Long on pullback **Entry Zone:** 0.0824 – 0.0862, only after a visible buyer reaction **Stop-Loss:** Below 0.0824 (a close under the 24h low) **Invalidation:** If price loses 0.0824 and holds below it, the higher-low structure is broken and the bounce from 0.0696 looks more like a relief move. Below that, the next visible reference is 0.0779. **Take-Profits:** - TP1: 0.0953 (the current price area, for partial profits) - TP2: 0.1028 (24h high, the main resistance) - TP3: Not defined. There is no marked structure above the high, so I'd reassess after a confirmed breakout. **Why This Setup Makes Sense** ERA has moved from about 0.0696 to 0.1028 in a short stretch, and the last candles show sellers reacting near the top. Buying there means entering late, with a tight upside to the high and a distant invalidation. A pullback into 0.0824–0.0862 gives a much better structure. The stop can sit just below the 24h low, and the first two targets sit at levels the chart already shows. If buyers don't defend the zone, I simply don't enter. A zone is only a place to watch, and the entry needs confirmation. **Risk Management** Respect the stop and don't move it once you're in. Size the position so a loss at the stop is acceptable. A bullish structure can fail, and no setup guarantees a profit. This is a trade plan, not financial advice. #ByXIMPACT
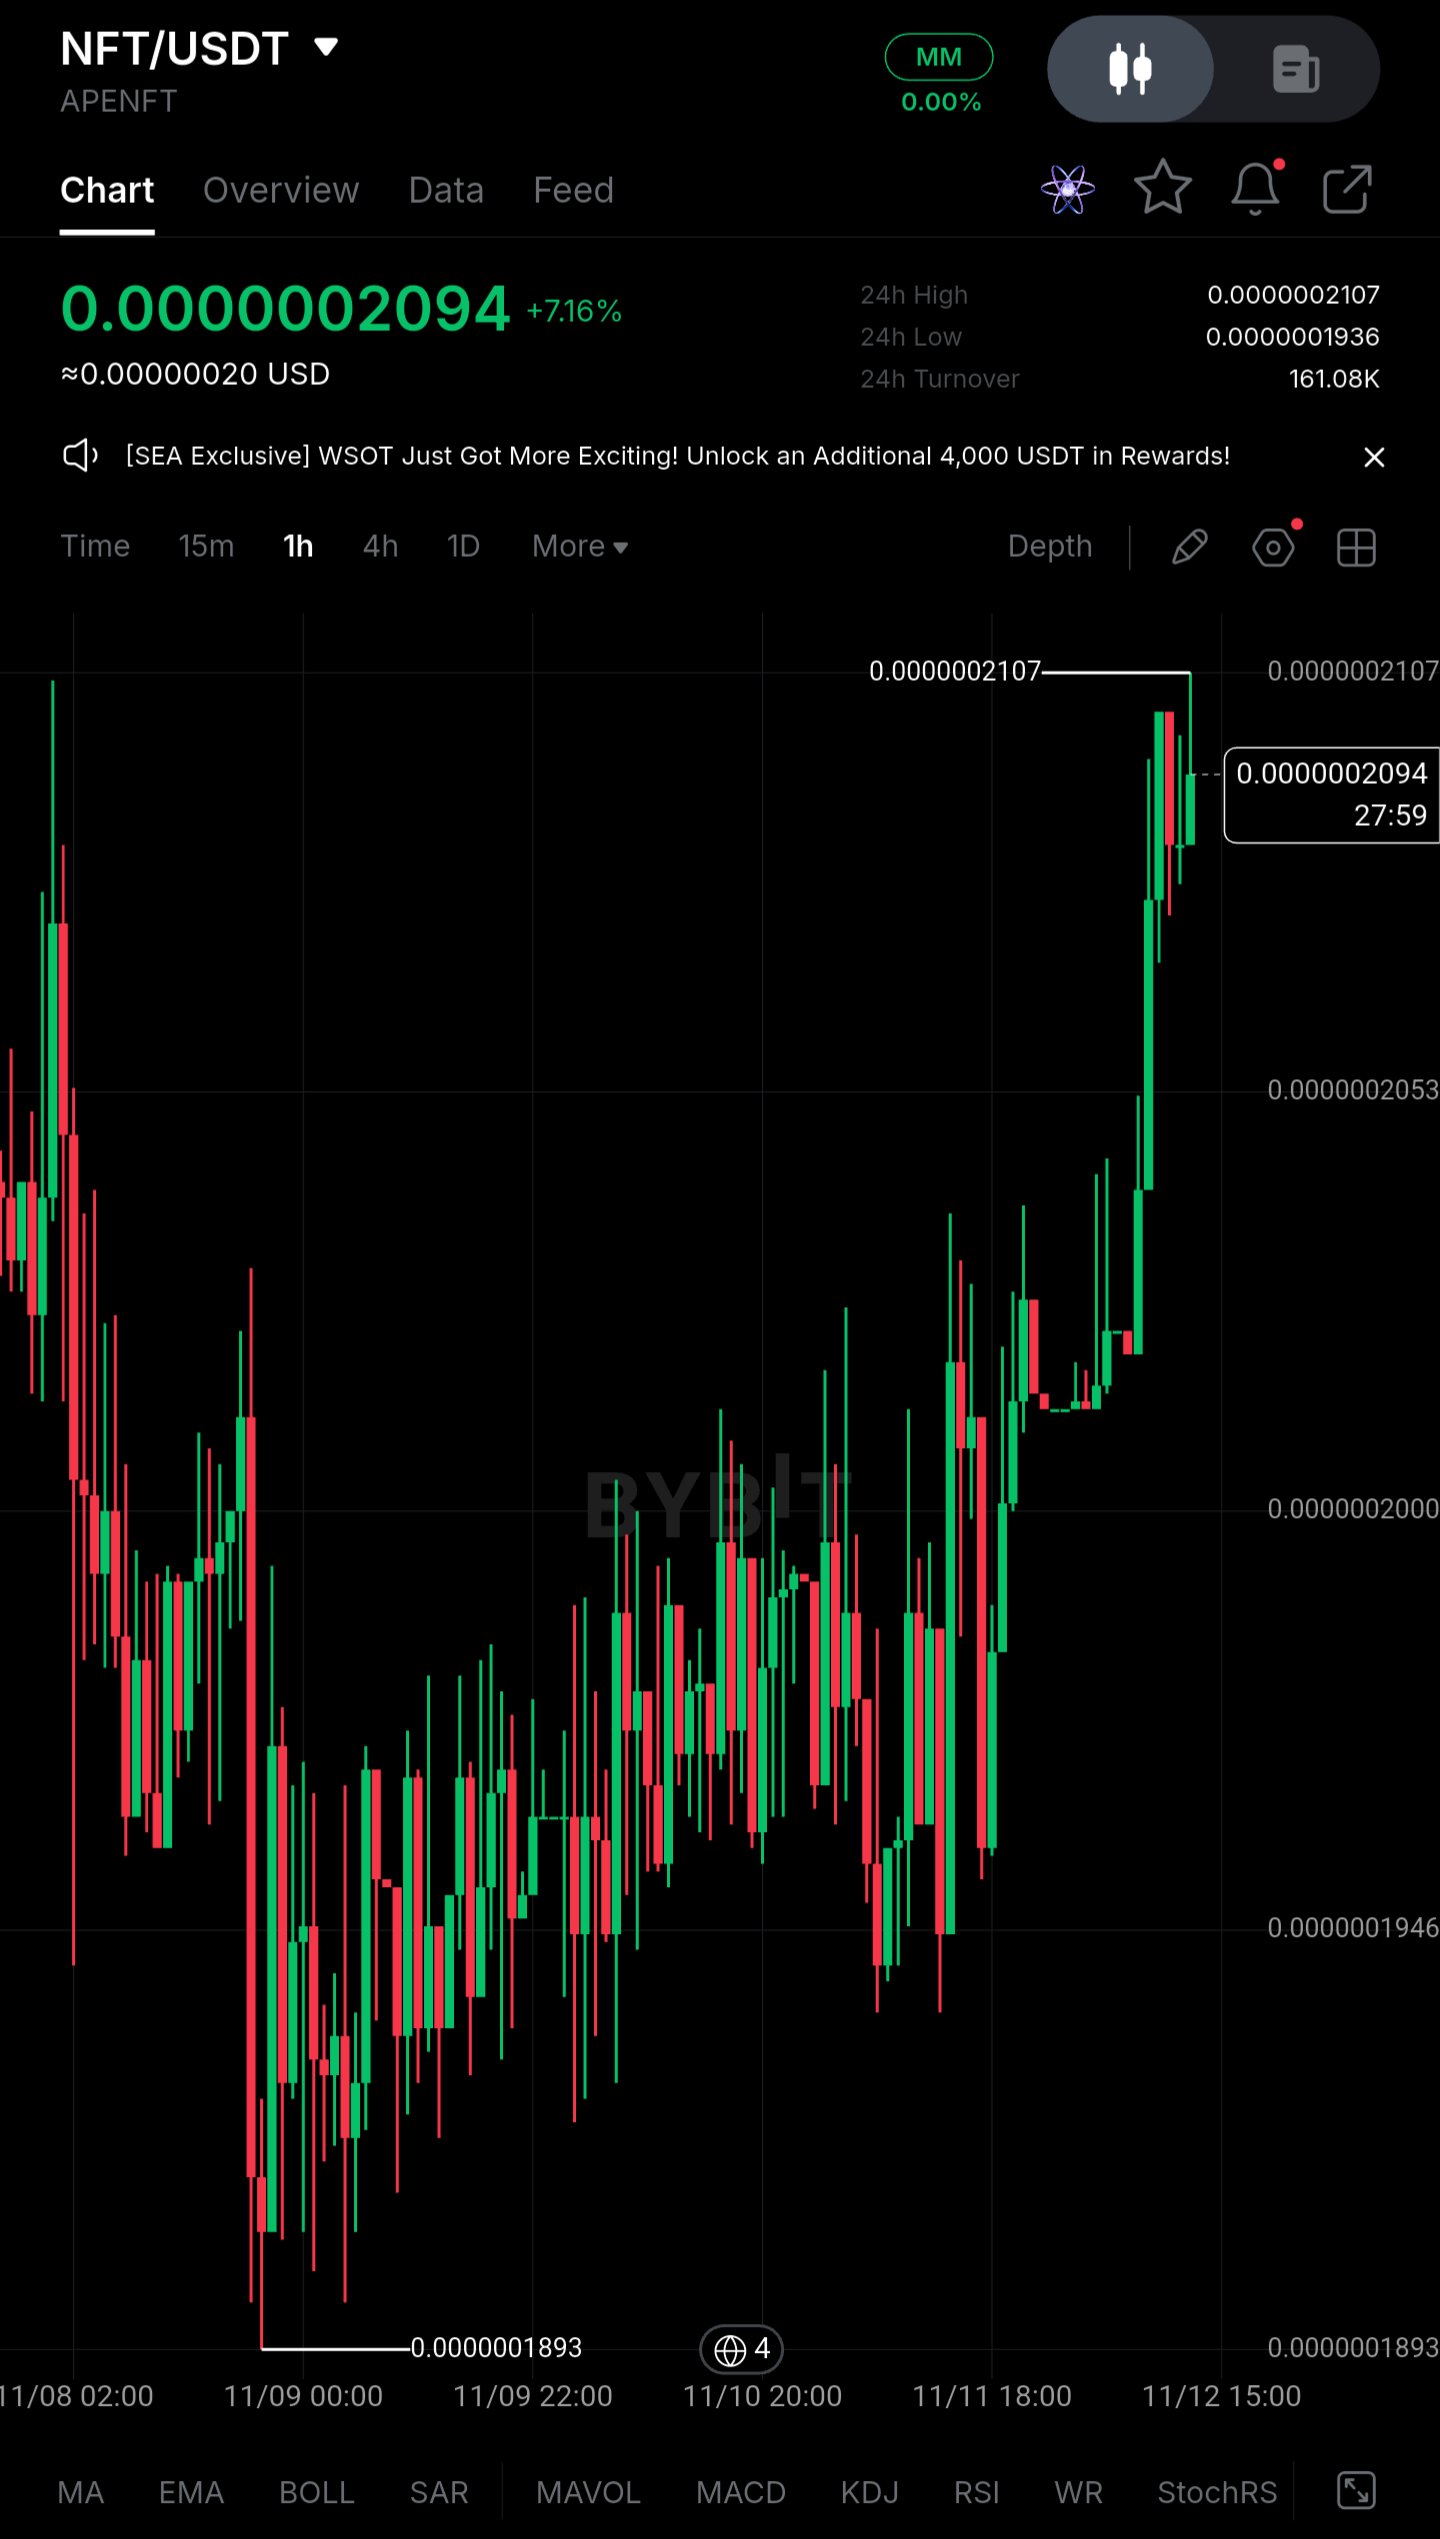
$NFTUSDT – Higher Timeframe Overview | Long on Pullback** Pair: $NFTUSDT (APENFT) NFT has been working its way higher on the 1h chart after printing a low at 0.0000001893 on 9 November. The days after that were choppy, with overlapping candles and long wicks both ways, but the lows kept getting a little higher. Today price finally pushed out of that range, and it now sits at 0.0000002094, up about 7% on the day. I didn't get involved during the base-building phase, and I'd rather wait than chase this move. **Current Outlook and Key Levels** *Buying Zone: 0.0000002000 – 0.0000002053* This area was the upper part of the recent range, where price stalled and moved sideways just before the breakout candle. Old resistance that has been broken often gets retested as support. I'd want to see buyers defend it with a visible reaction, such as a rejection wick or a strong hourly close back up. A slow bleed through the zone with no response would not count as a confirmation. *Resistance Zone: 0.0000002107* This is the 24h high, and price is only about 0.6% below it. The last candles show small bodies and upper wicks, so sellers are active. A clean break and a few hourly closes above it would suggest the range has turned into a higher base. That would be the first real sign of structural strength, though not a guarantee of continuation. **Trading Setup** - **Position:** Long on pullback - **Entry Zone:** 0.0000002000 – 0.0000002053 (only after buyer confirmation) - **Stop-Loss:** 0.0000001946 - **Invalidation:** A sustained hourly close below 0.0000001946 means price has fallen back into the old range. The breakout would then look like a failed push, and the idea is off. - **TP1:** 0.0000002107 (24h high) - **TP2:** A move beyond 0.0000002107 would mean price is trading above all levels visible on this chart. I have no verified level there, so I'd trail the stop on structure instead of setting a fixed target. TP1 alone doesn't pay well against this stop. Most of the reward would have to come from a continuation above the high, so I'd take partial profit at TP1 and manage the rest with a trailing stop. **Why This Setup Makes Sense** Buying right under 0.0000002107 after a vertical move leaves little room above and a lot of room below. If the move fades, price can drop back to the 0.0000002000 area quickly. Waiting for the pullback puts the entry closer to a level that has already been tested, and it gives me a clear point where the idea is wrong. The stop below 0.0000001946 sits under the recent higher lows, so it only triggers if the structure actually breaks. The wide stop also means a smaller position size. If price never pulls back and simply breaks higher, I'm fine missing it. Turnover is only about 161K over 24 hours, so this is a thin market, and the extra patience costs very little. **Risk Management** Stick to the plan and don't move the stop once you're in. Size the position so a stop-out is an acceptable loss, especially in a market this thin. A bullish structure can fail, and no setup guarantees a profit. *Not financial advice.* #ByXIMPACT
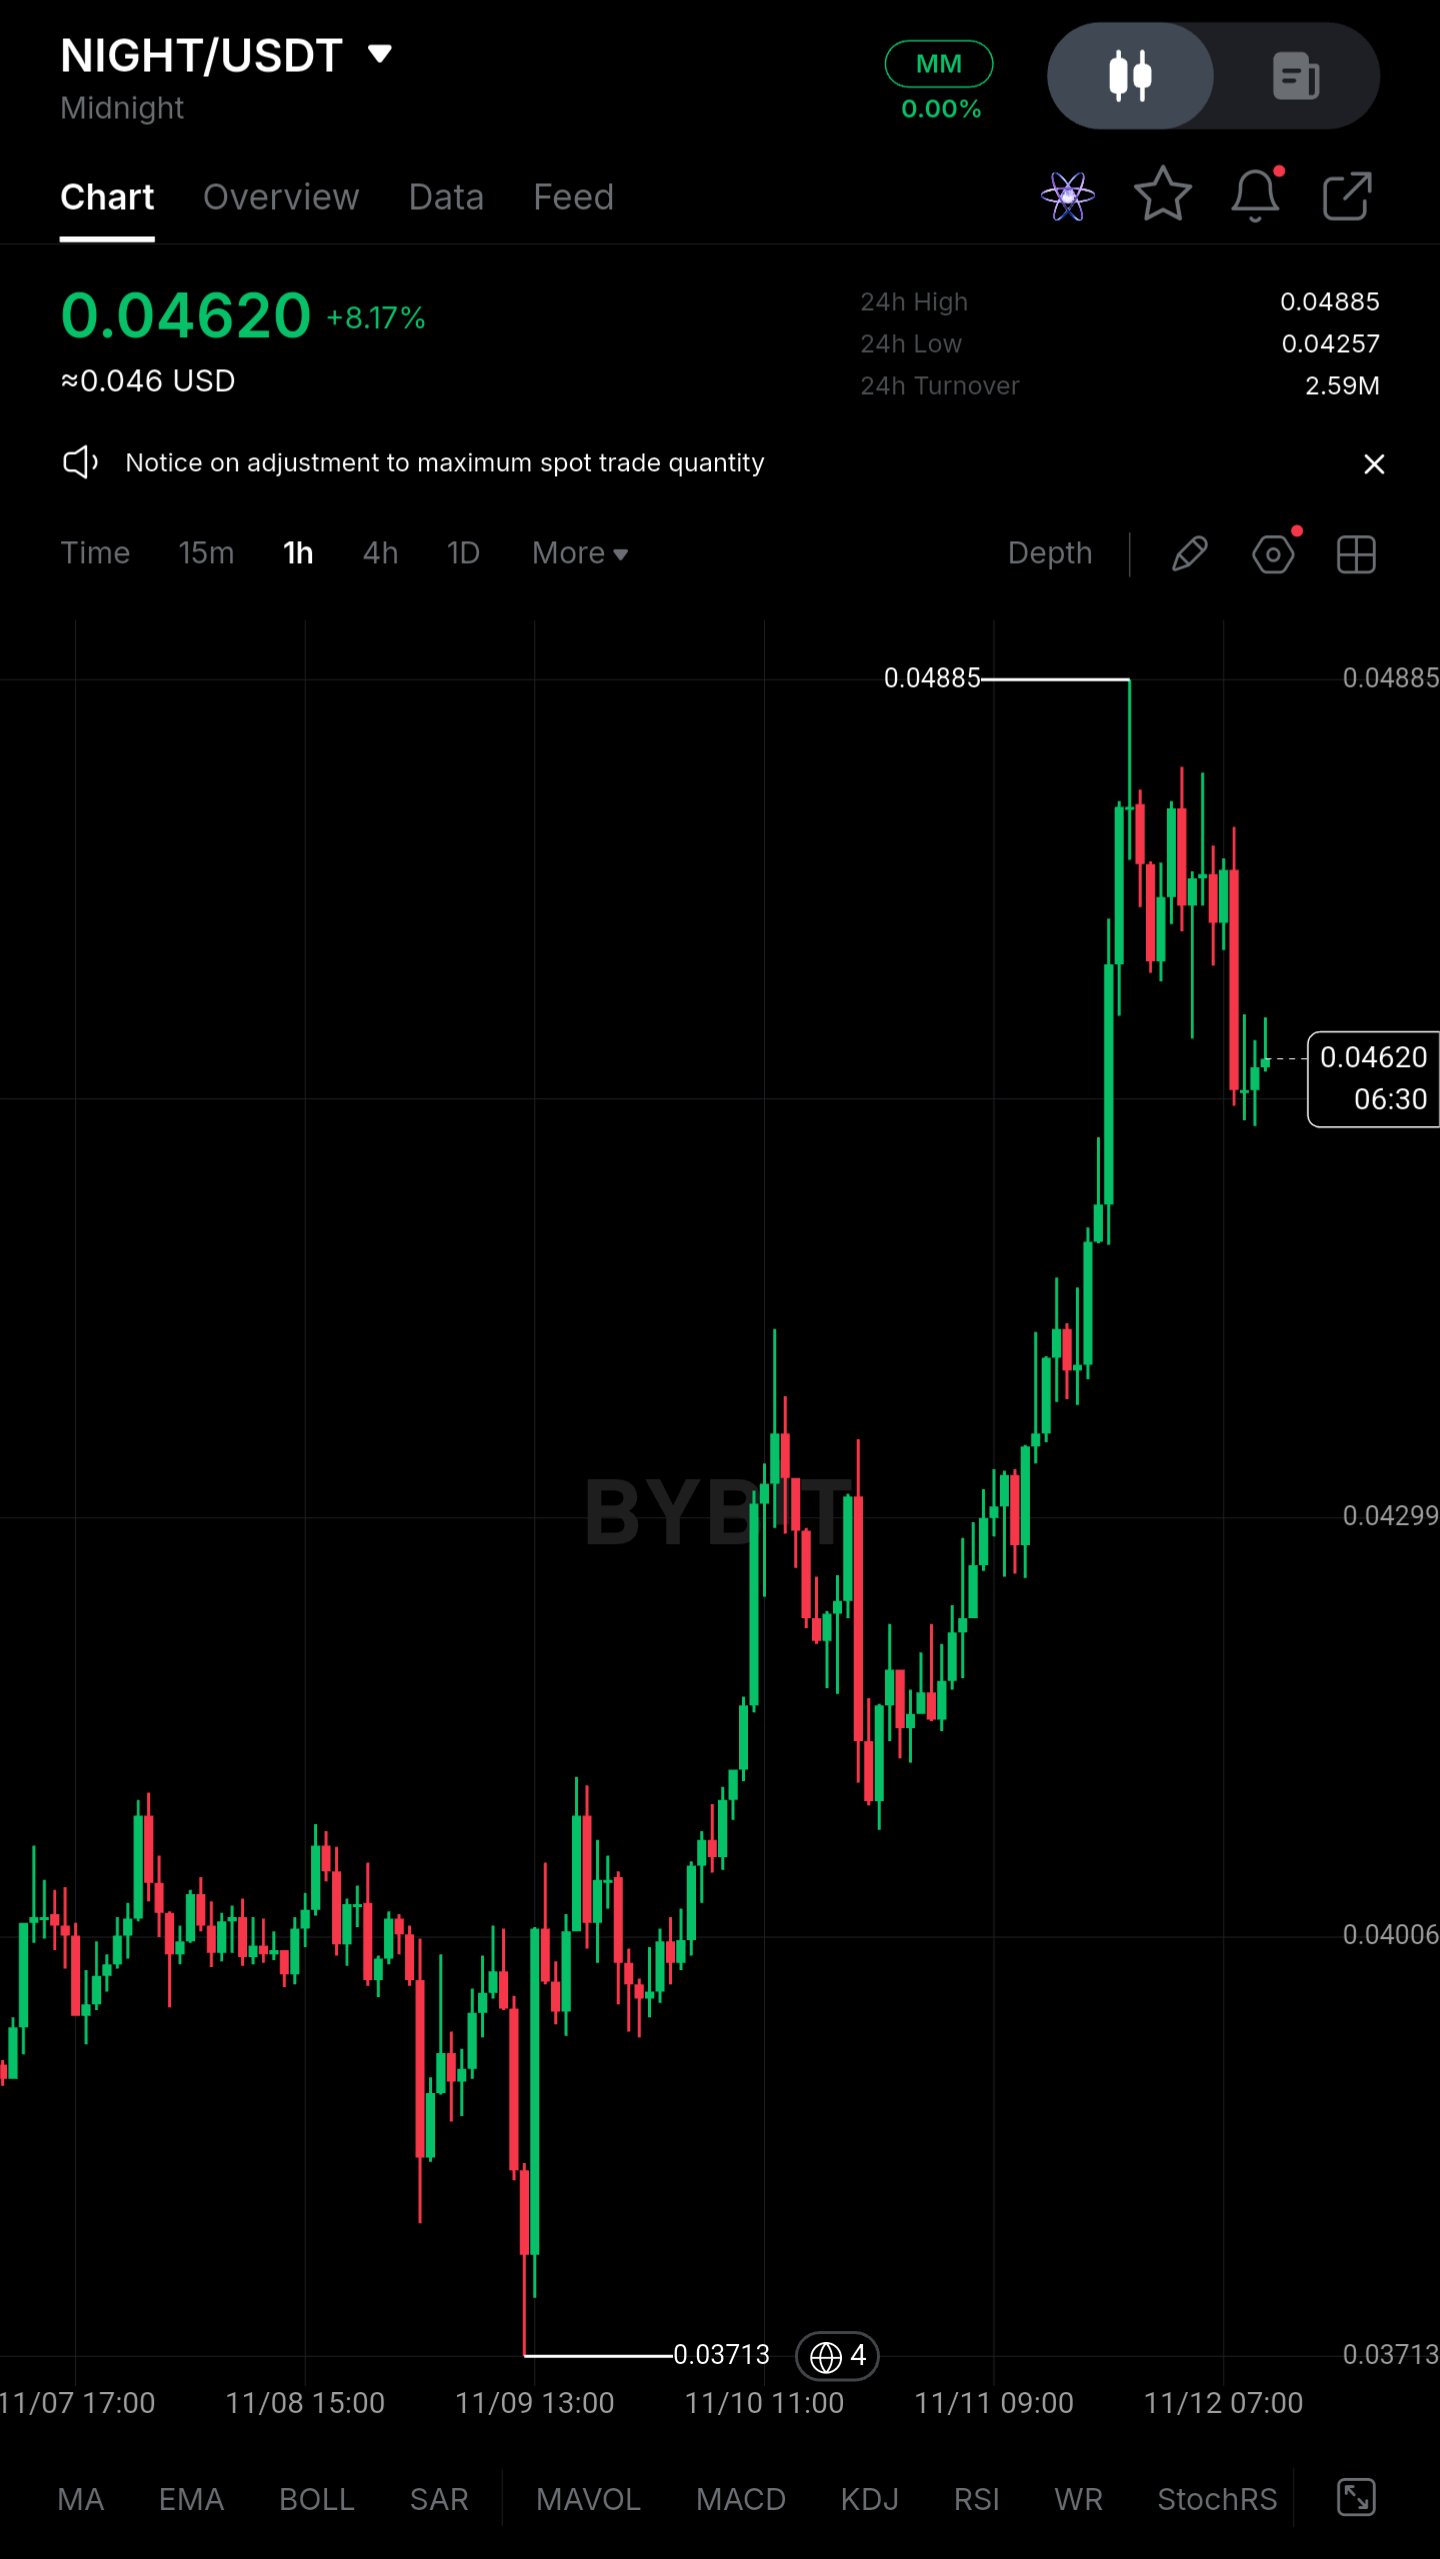
$NIGHTUSDT (Midnight) holds near $0.0462 after a rebound from $0.03713, but I'm not treating this as a recovery yet** NIGHT trades around $0.0462, up 8.17% on the day. It sits roughly 24% above the $0.03713 low from 9 November and about 5% below the 24h high of $0.04885. The bounce was sharp, but the move is already rolling over from its peak. The bigger concern is whether large holders are using this strength to distribute into a derivatives market that looks long-tilted. **Price Action** - Price: about $0.0462 (≈$0.046) - Move: roughly +31% from the $0.03713 low to the $0.04885 high, followed by a roughly 5% pullback - 24h range: $0.04257 to $0.04885, on about $2.59M in turnover - Immediate resistance: $0.0475 to $0.0488, where the latest rejection formed - First support: $0.0430 to $0.0426, the prior consolidation base and the 24h low A reclaim of $0.04885 would signal that buyers can absorb supply at the highs. Even then, the broader structure only shifts from a deep drawdown to a rebound within a range, not to a confirmed trend reversal. **Large Capital Picture** Without ETF-style flow data, large-wallet and exchange-flow behavior is the relevant lens. The sell-off into $0.03713 and the vertical rebound look more like a liquidity-driven swing than steady accumulation. The rally came in impulsive bursts, and the lower highs and long upper wicks near $0.0488 show supply is meeting every push. Demand is present, but it is inconsistent. **Liquidity & Range Conditions** The latest hourly candles are compressing after a sharp red leg from the highs. A narrow range after a fast move is not evidence of accumulation. Turnover of about $2.59M is modest for a 31% swing, which suggests the move may be thinly supported. Stronger spot participation is still needed. **Derivatives Positioning** Exact figures are not visible on a spot chart, so the following are reasonable estimates from the price structure: - Open interest: elevated and rebuilding after the squeeze off the lows - Funding: likely positive, meaning longs are paying shorts - Long share of accounts: likely around 55% to 60% This positioning is vulnerable. If $0.0430 fails, late longs from the $0.044 to $0.048 zone could be forced out, amplifying the move down. **Key Figures** - Current price: ~$0.0462 - Immediate resistance: $0.0475 to $0.0488 - Support zone: $0.0430 to $0.0426 - Recent low: $0.03713 - 24h turnover: ~$2.59M - Open interest: elevated (estimated) - Funding: positive (estimated) - Long share: ~55% to 60% (estimated) **Confirmation Levels** - Bullish: an hourly close above $0.04885 with rising spot volume opens $0.0500, then the mid-$0.05 area. - Bearish: a breakdown below $0.0430 exposes $0.0400, then a retest of the $0.03713 low, with long liquidations likely accelerating the move. **Closing** The stabilization is real but temporary. Rebound strength, large-holder supply and crowded long positioning are all competing at the same time. The decisive signal is whether spot buyers return while leverage stays controlled, or whether another support breakdown triggers fresh long liquidations. *Not financial advice.* #ByXIMPACT