MdSalmanAhmedShanto
2752Me gusta0Compartir en el chat57Aficionados1Seguir
空军头子|仅作观点分享不构成任何投资建议|关注我的人都暴富了
空军头子|仅作观点分享不构成任何投资建议|关注我的人都暴富了
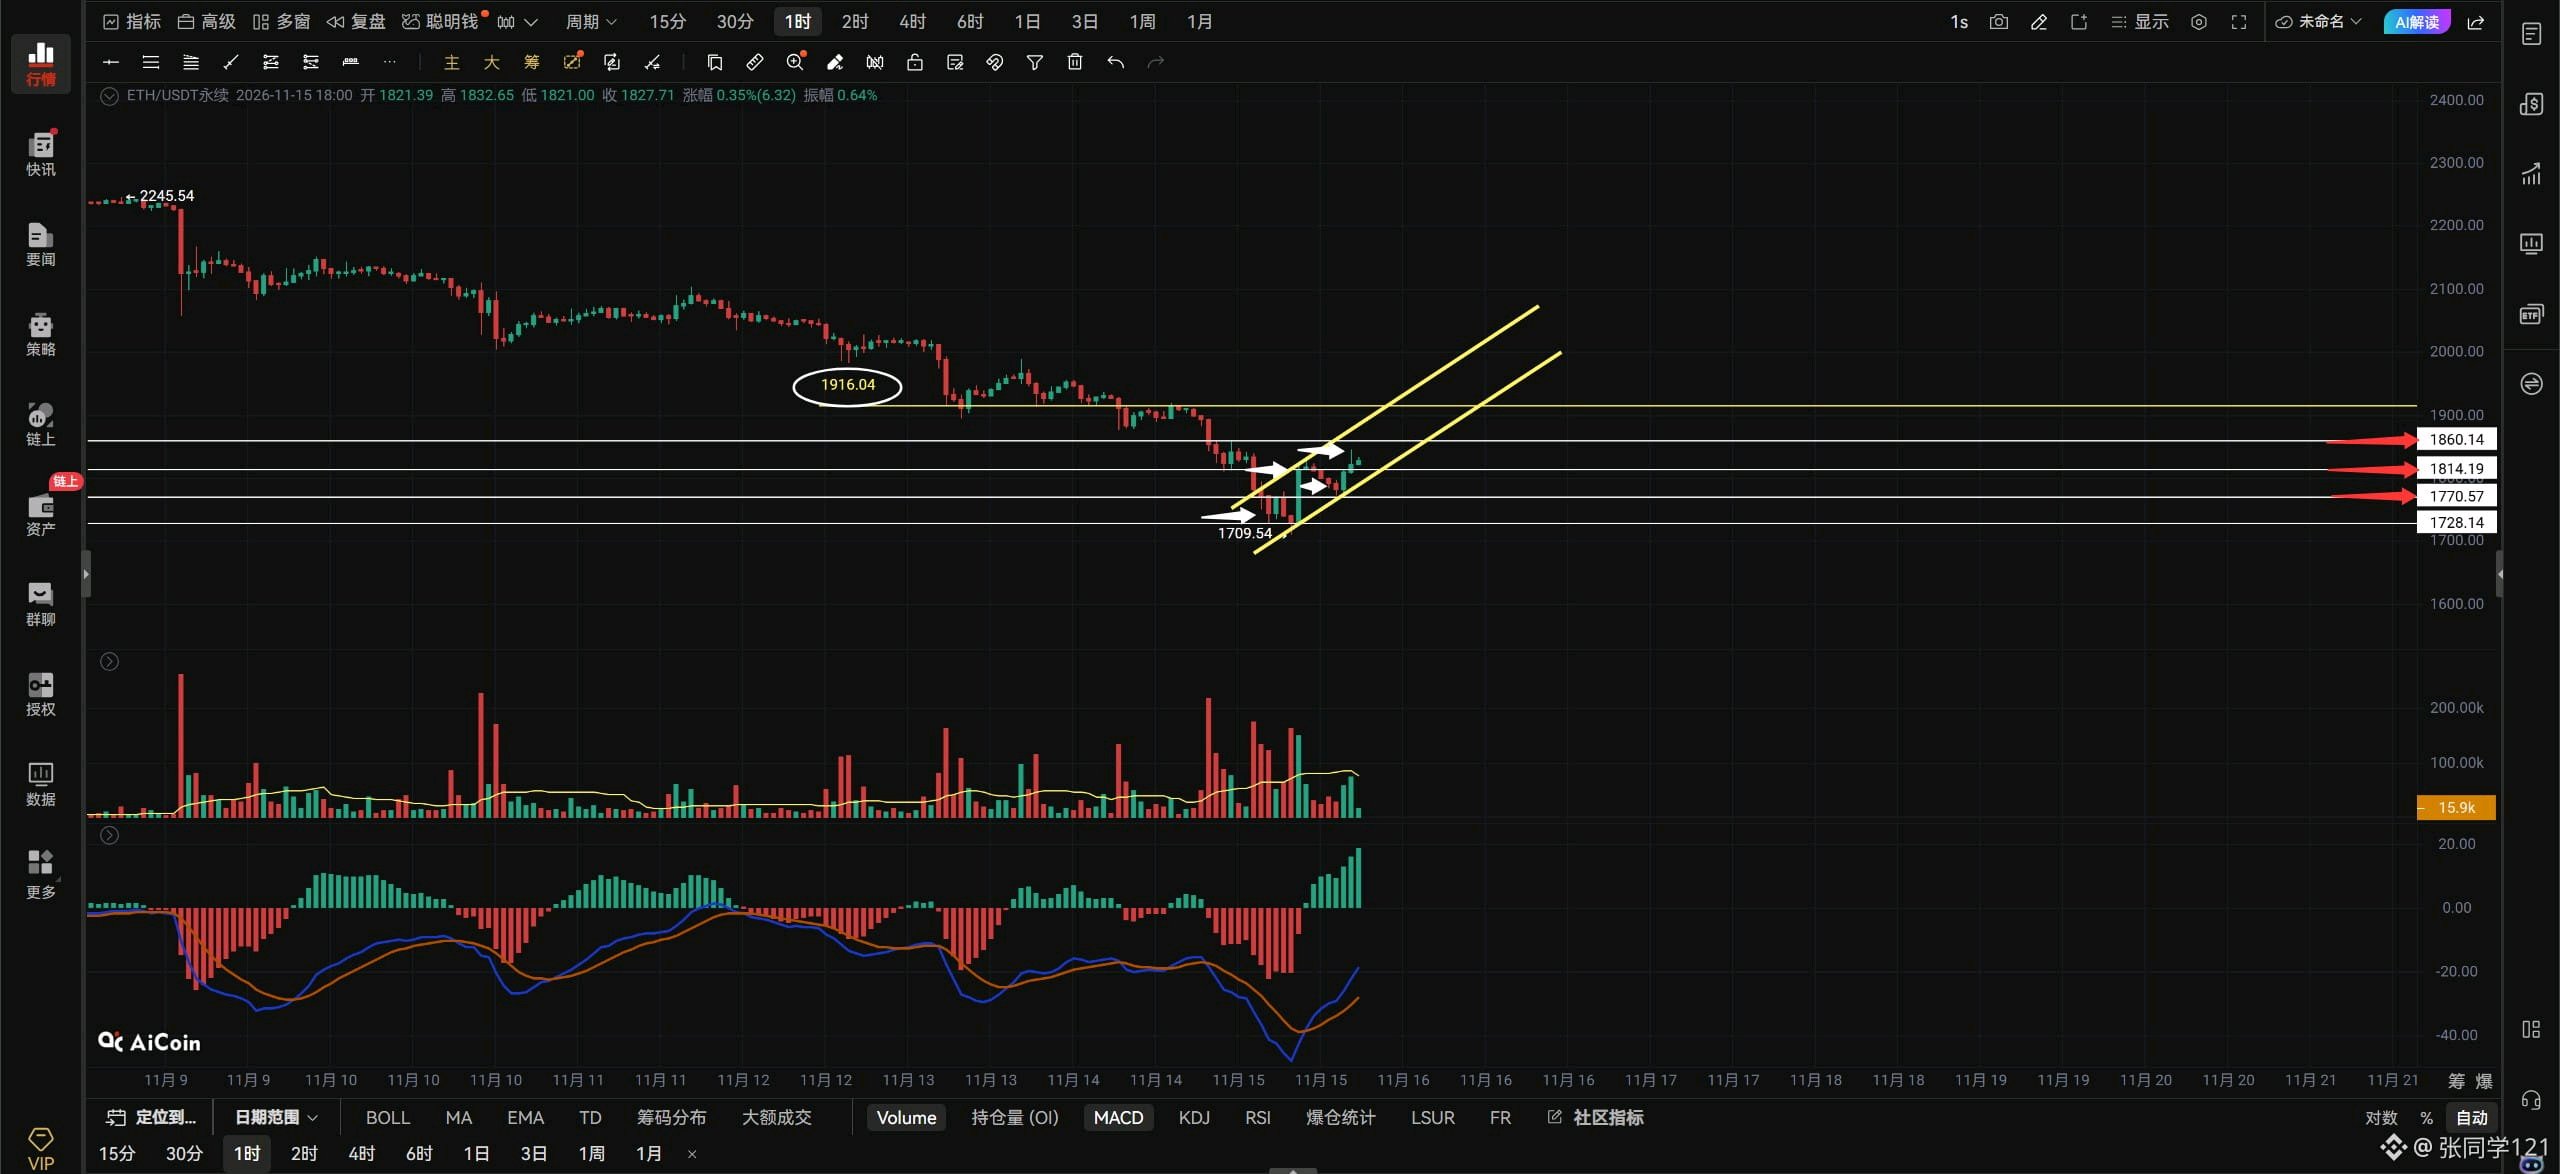
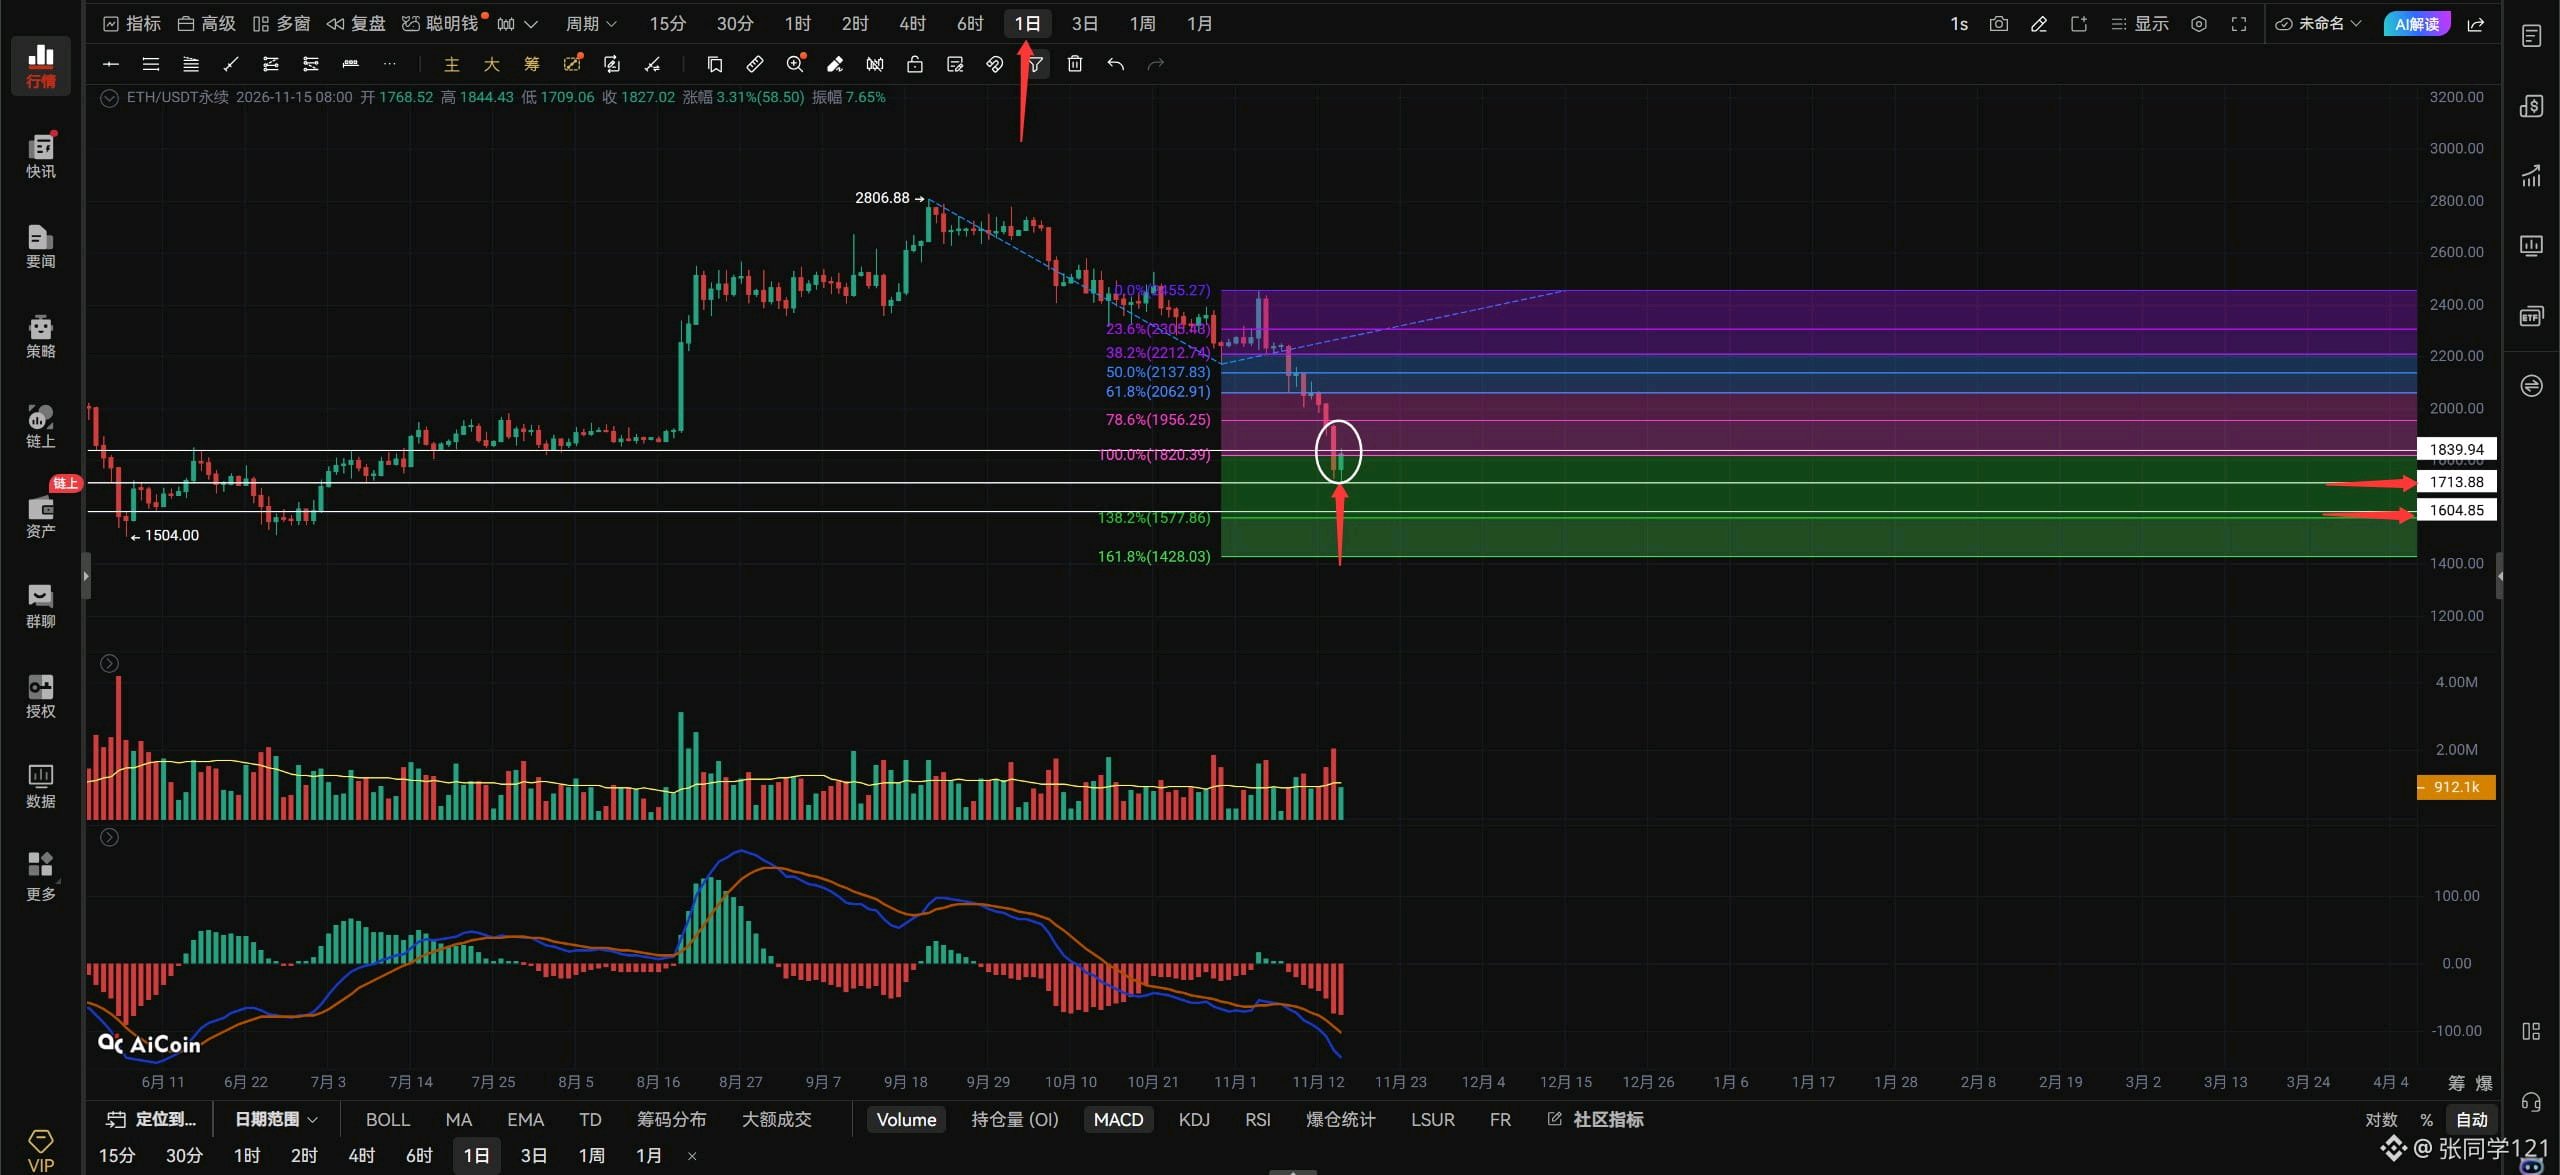
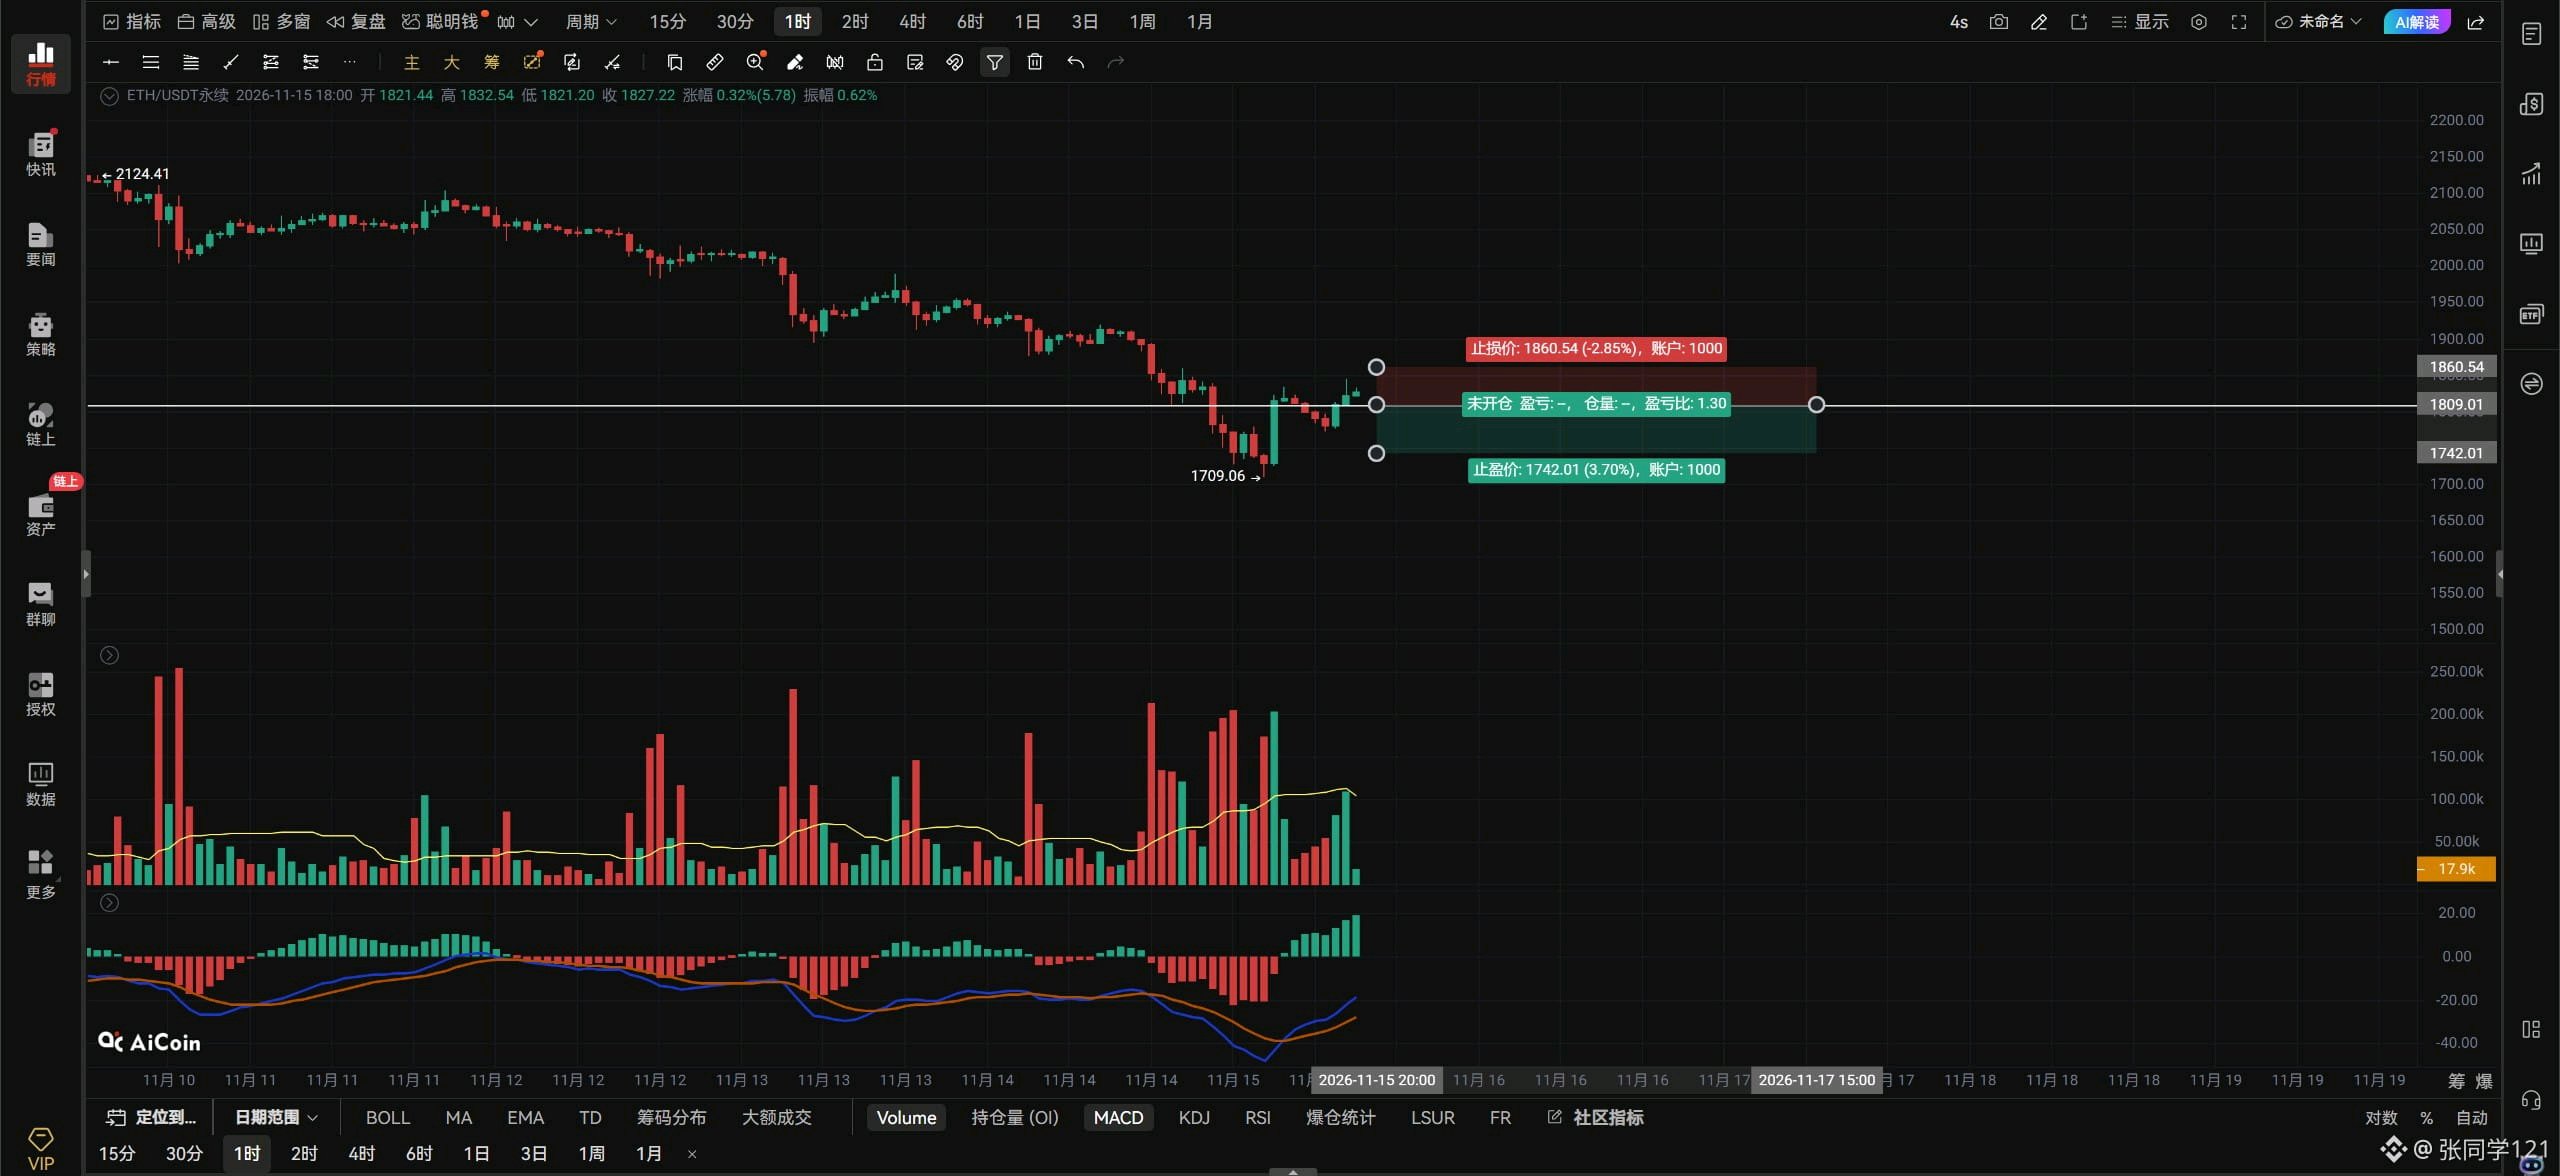
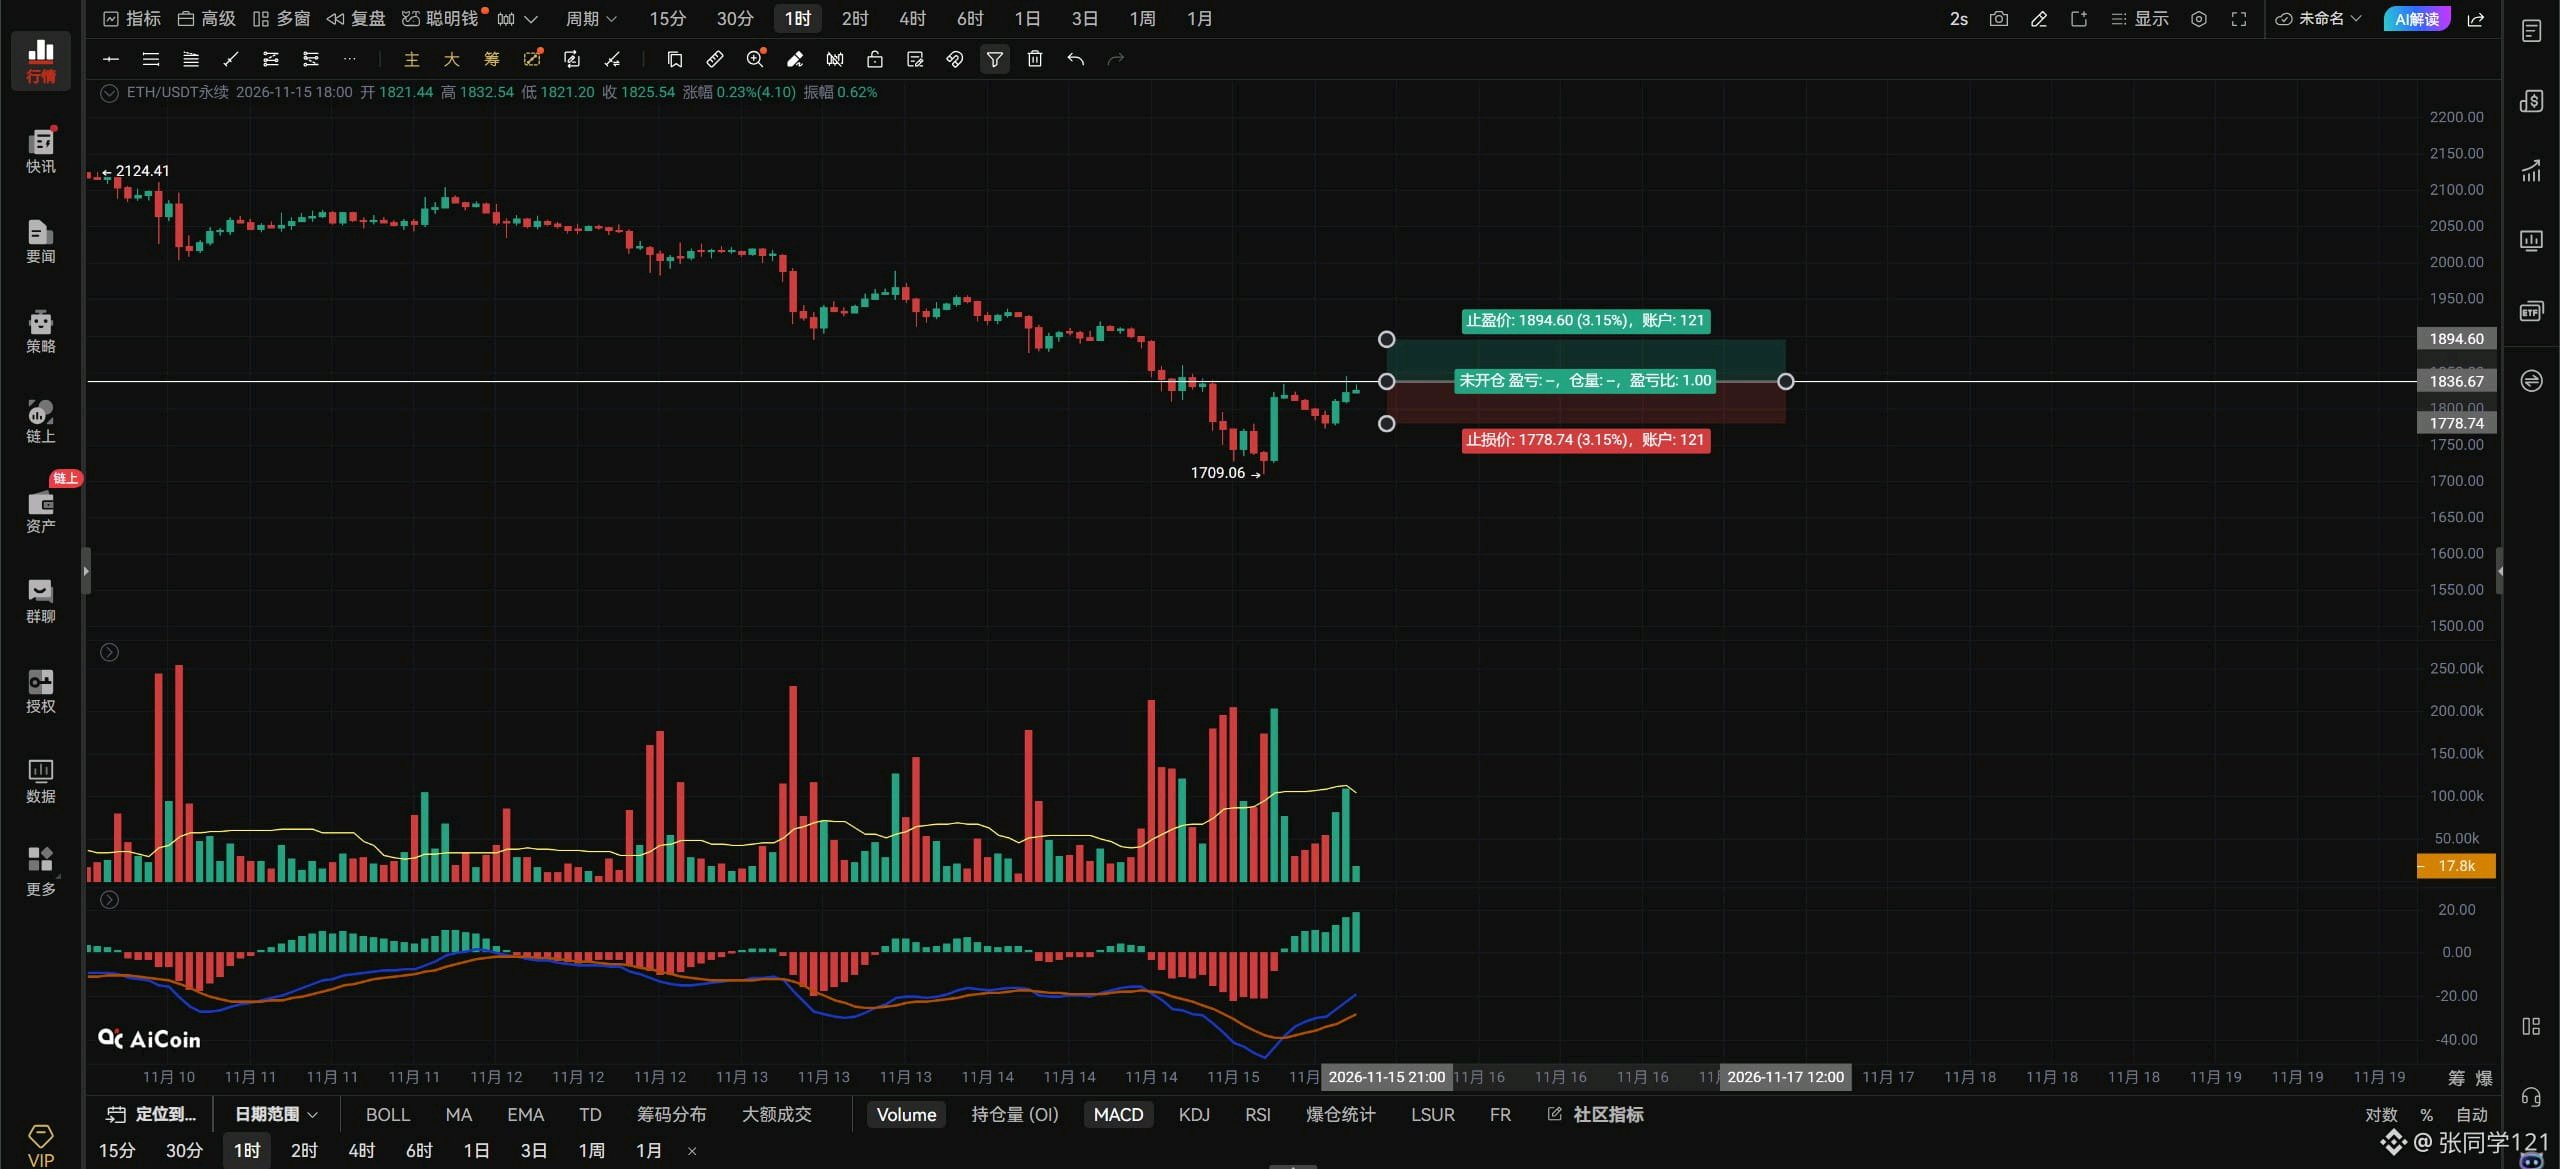
$ETHUSDT Perspectiva de la tarde: 15/11. ETH está subiendo actualmente dentro de un canal ascendente, y tanto sus máximos como sus mínimos están aumentando, tal como indica la flecha blanca. Es posible que ETH esté comenzando un rebote en escala horaria. Si logra mantenerse por encima de la resistencia de 1814, debería continuar con el rebote alcista para probar la resistencia de 1860. Necesitará romper los 1860 antes de que podamos apuntar más alto, hacia los 1916. Mientras el retroceso de ETH no caiga por debajo de 1770, el rebote debería ser fuerte. Si vuelve a caer por debajo de 1770, inevitablemente volverá a probar el mínimo anterior. Incluso si hace una prueba extrema, mientras no rompa el mínimo anterior, no hay problema. Así que, si quieres entrar en largo en ETH ahora, el enfoque más seguro es esperar a que retroceda a la zona de soporte de 1770–1728, buscar una señal de formación de suelo y luego entrar en largo. Si no aparece ninguna señal de compra en esta zona, no operes; significa que el precio podría seguir cayendo. Si ETH rompe por encima de 1836 con un volumen fuerte, los traders agresivos pueden perseguir posiciones largas. Si rompe por debajo de 1809 con un volumen fuerte, persigue posiciones cortas. Vigila los cambios en el volumen y utiliza stop-loss. Si ETH se mantiene por encima de 1836 en el gráfico horario, apunta hacia 1861–1916. Si rompe por debajo de 1809 en el gráfico de 4 horas, apunta hacia 1770–1728. Afortunadamente, ETH encontró soporte cerca de 1713 en el gráfico diario. Si no hubiera logrado encontrar soporte cerca de 1713, el siguiente objetivo bajista en escala diaria habría sido 1600. No hubo noticias bajistas detrás de esta venta masiva, entonces, ¿por qué cayó tanto? ¡Porque fue fin de semana! No hace falta mucho capital para empujar el mercado a la baja durante el fin de semana. Para ETH en el gráfico diario, lo clave es si el cierre diario de mañana puede mantenerse por encima de 1820. Si cierra por encima de 1820, la tendencia bajista diaria de ETH podría llegar a su fin. Además, si el cierre diario de ETH mañana está por encima de 1820, el área marcada por el recuadro blanco formará un patrón de penetración (piercing pattern), lo que respaldaría aún más un rebote a escala diaria. Eso es todo por ahora.#ByXIMPACT
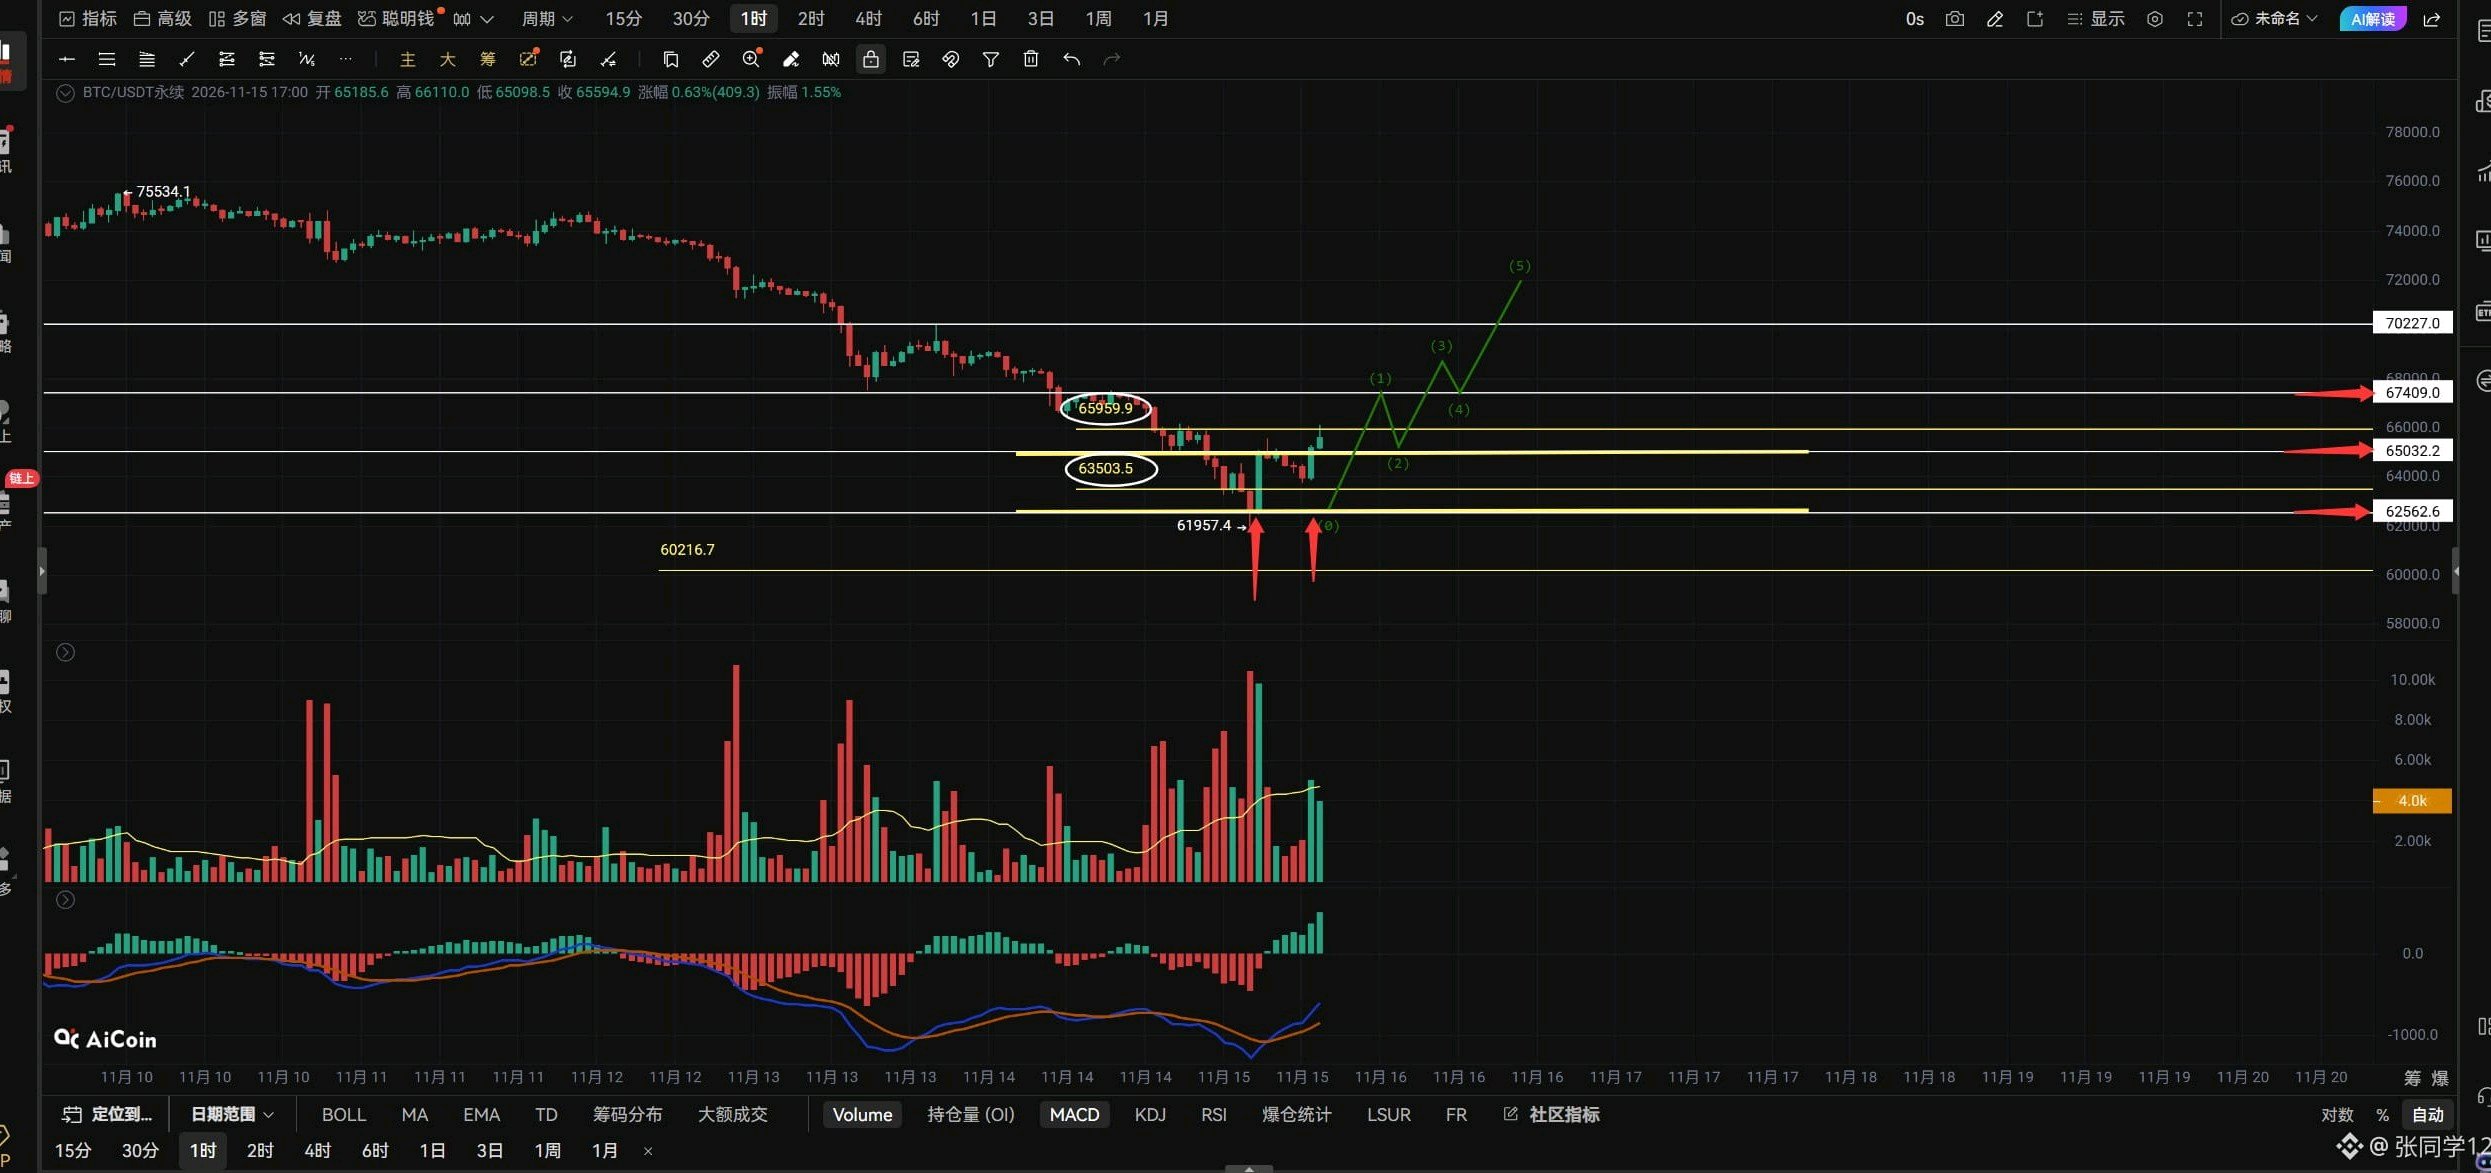
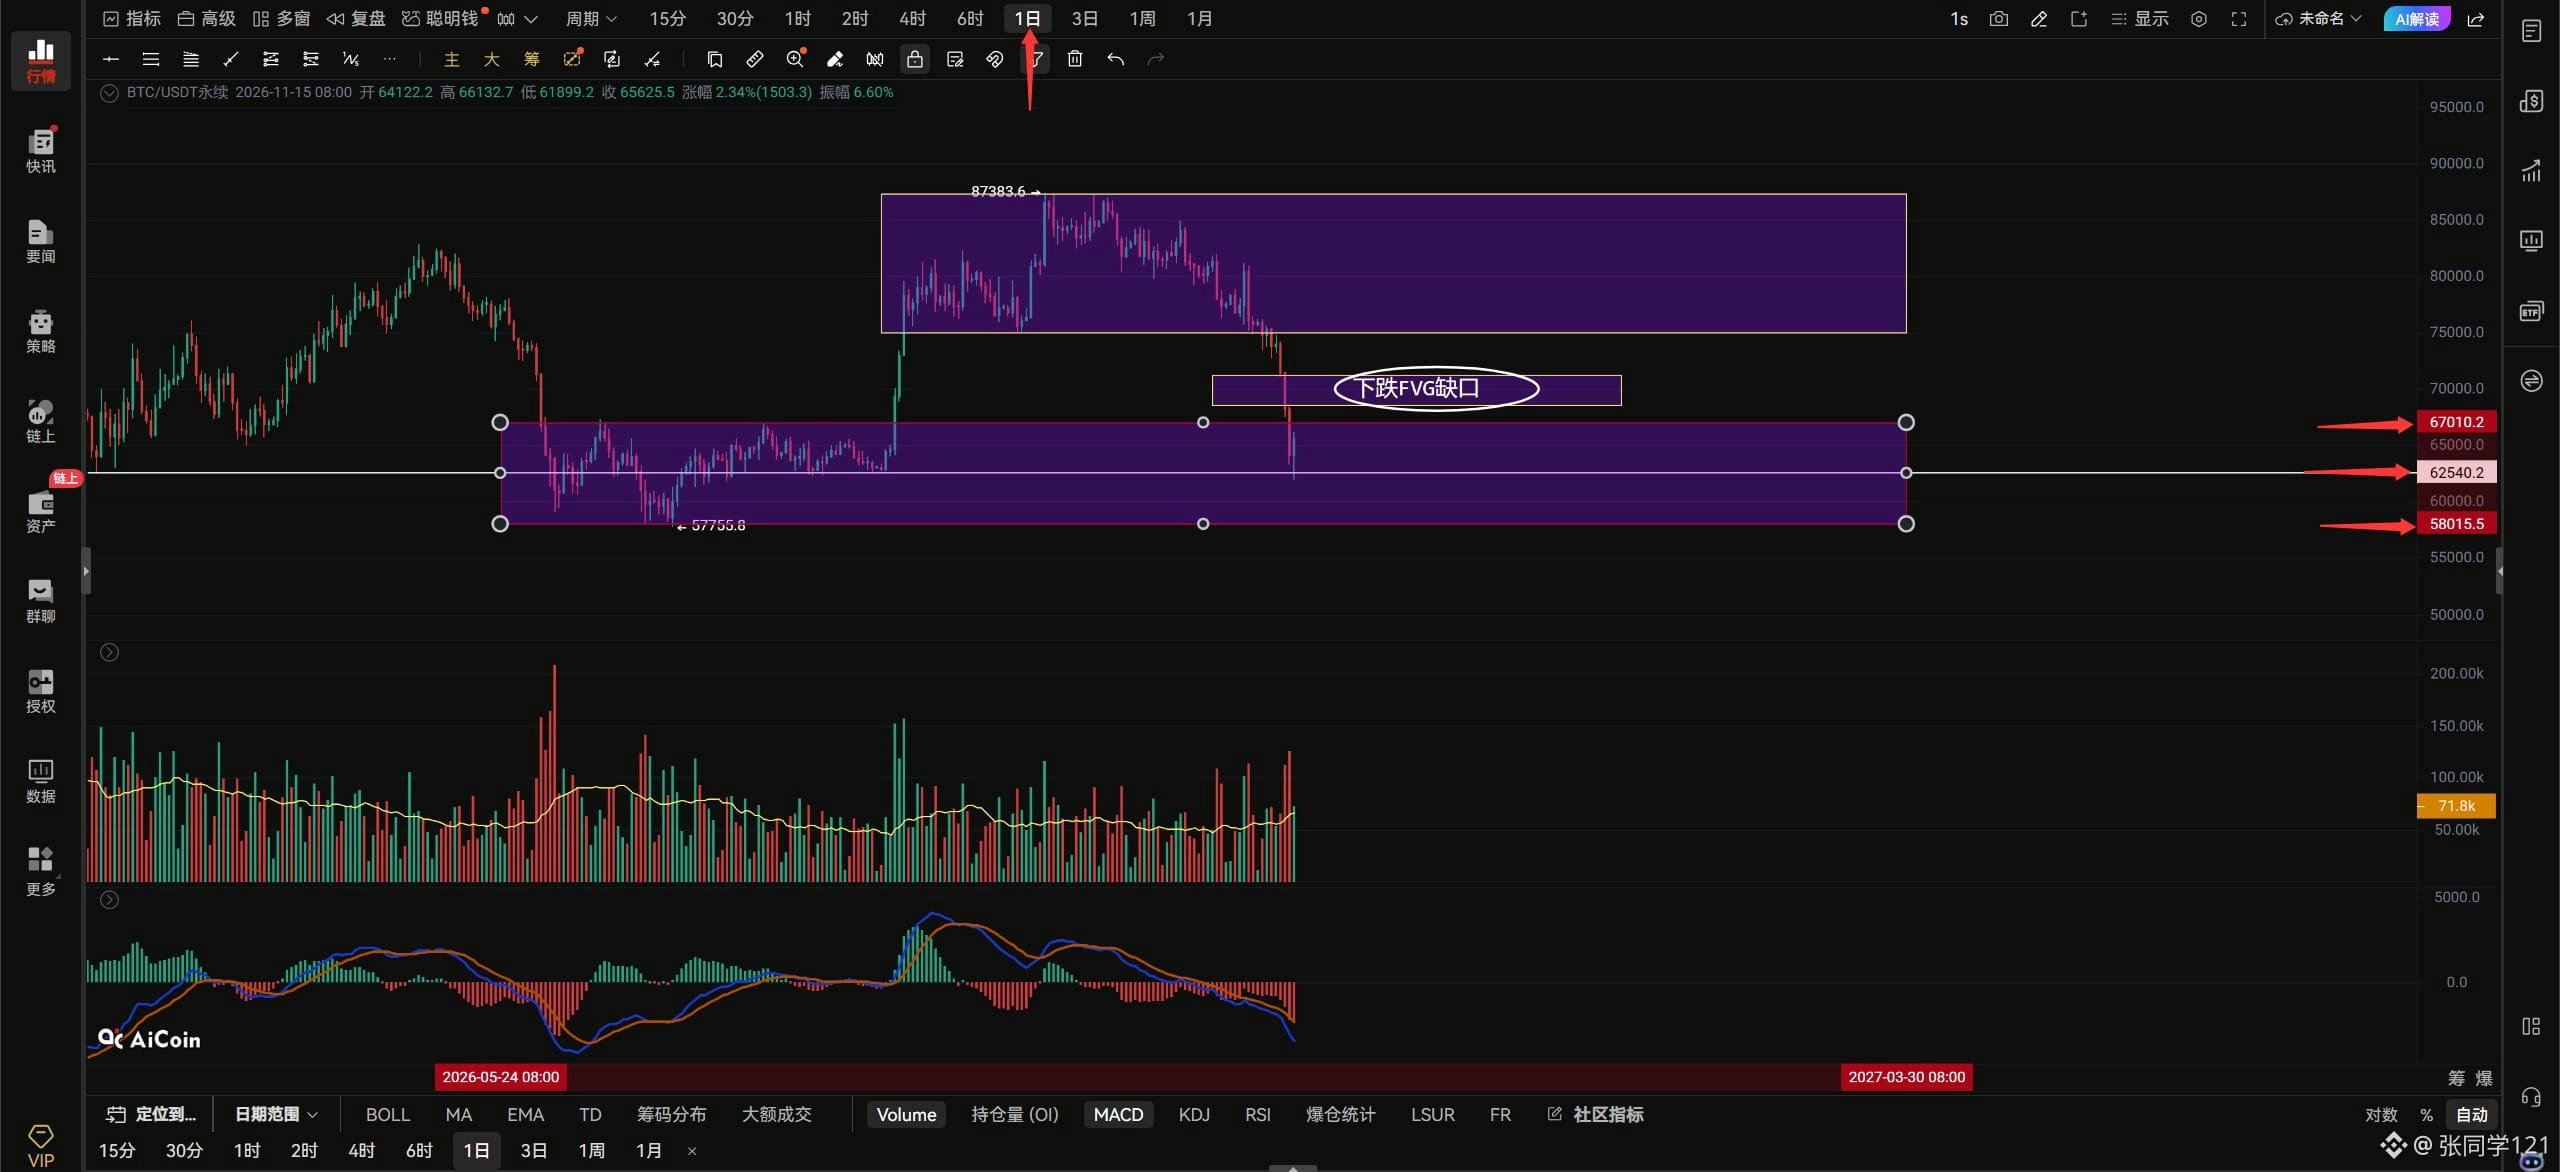
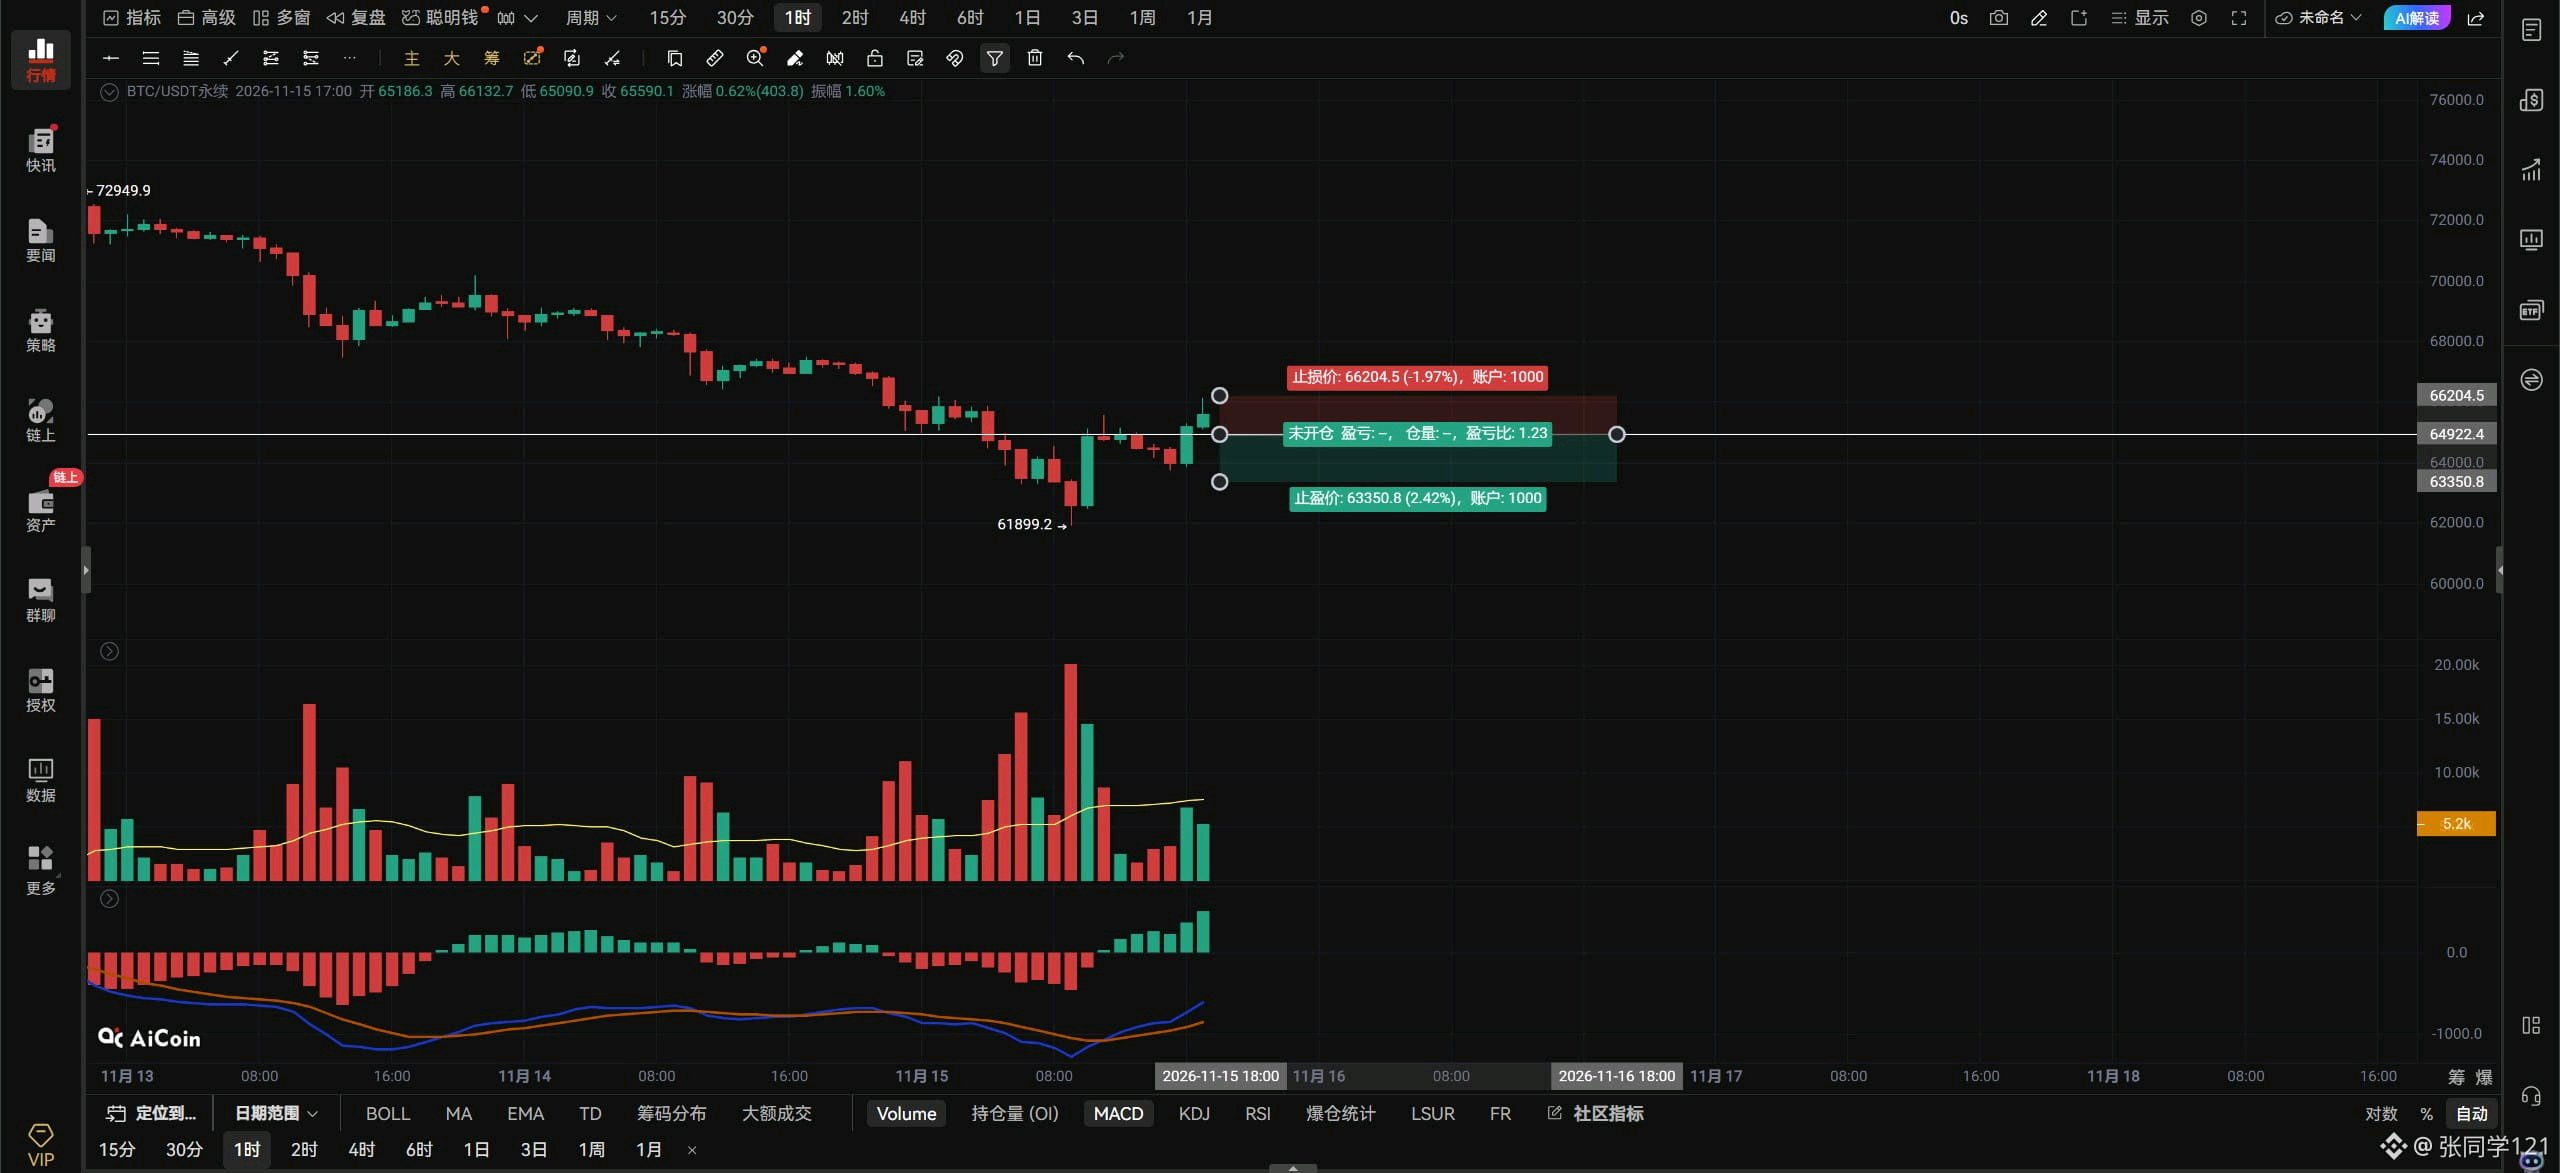
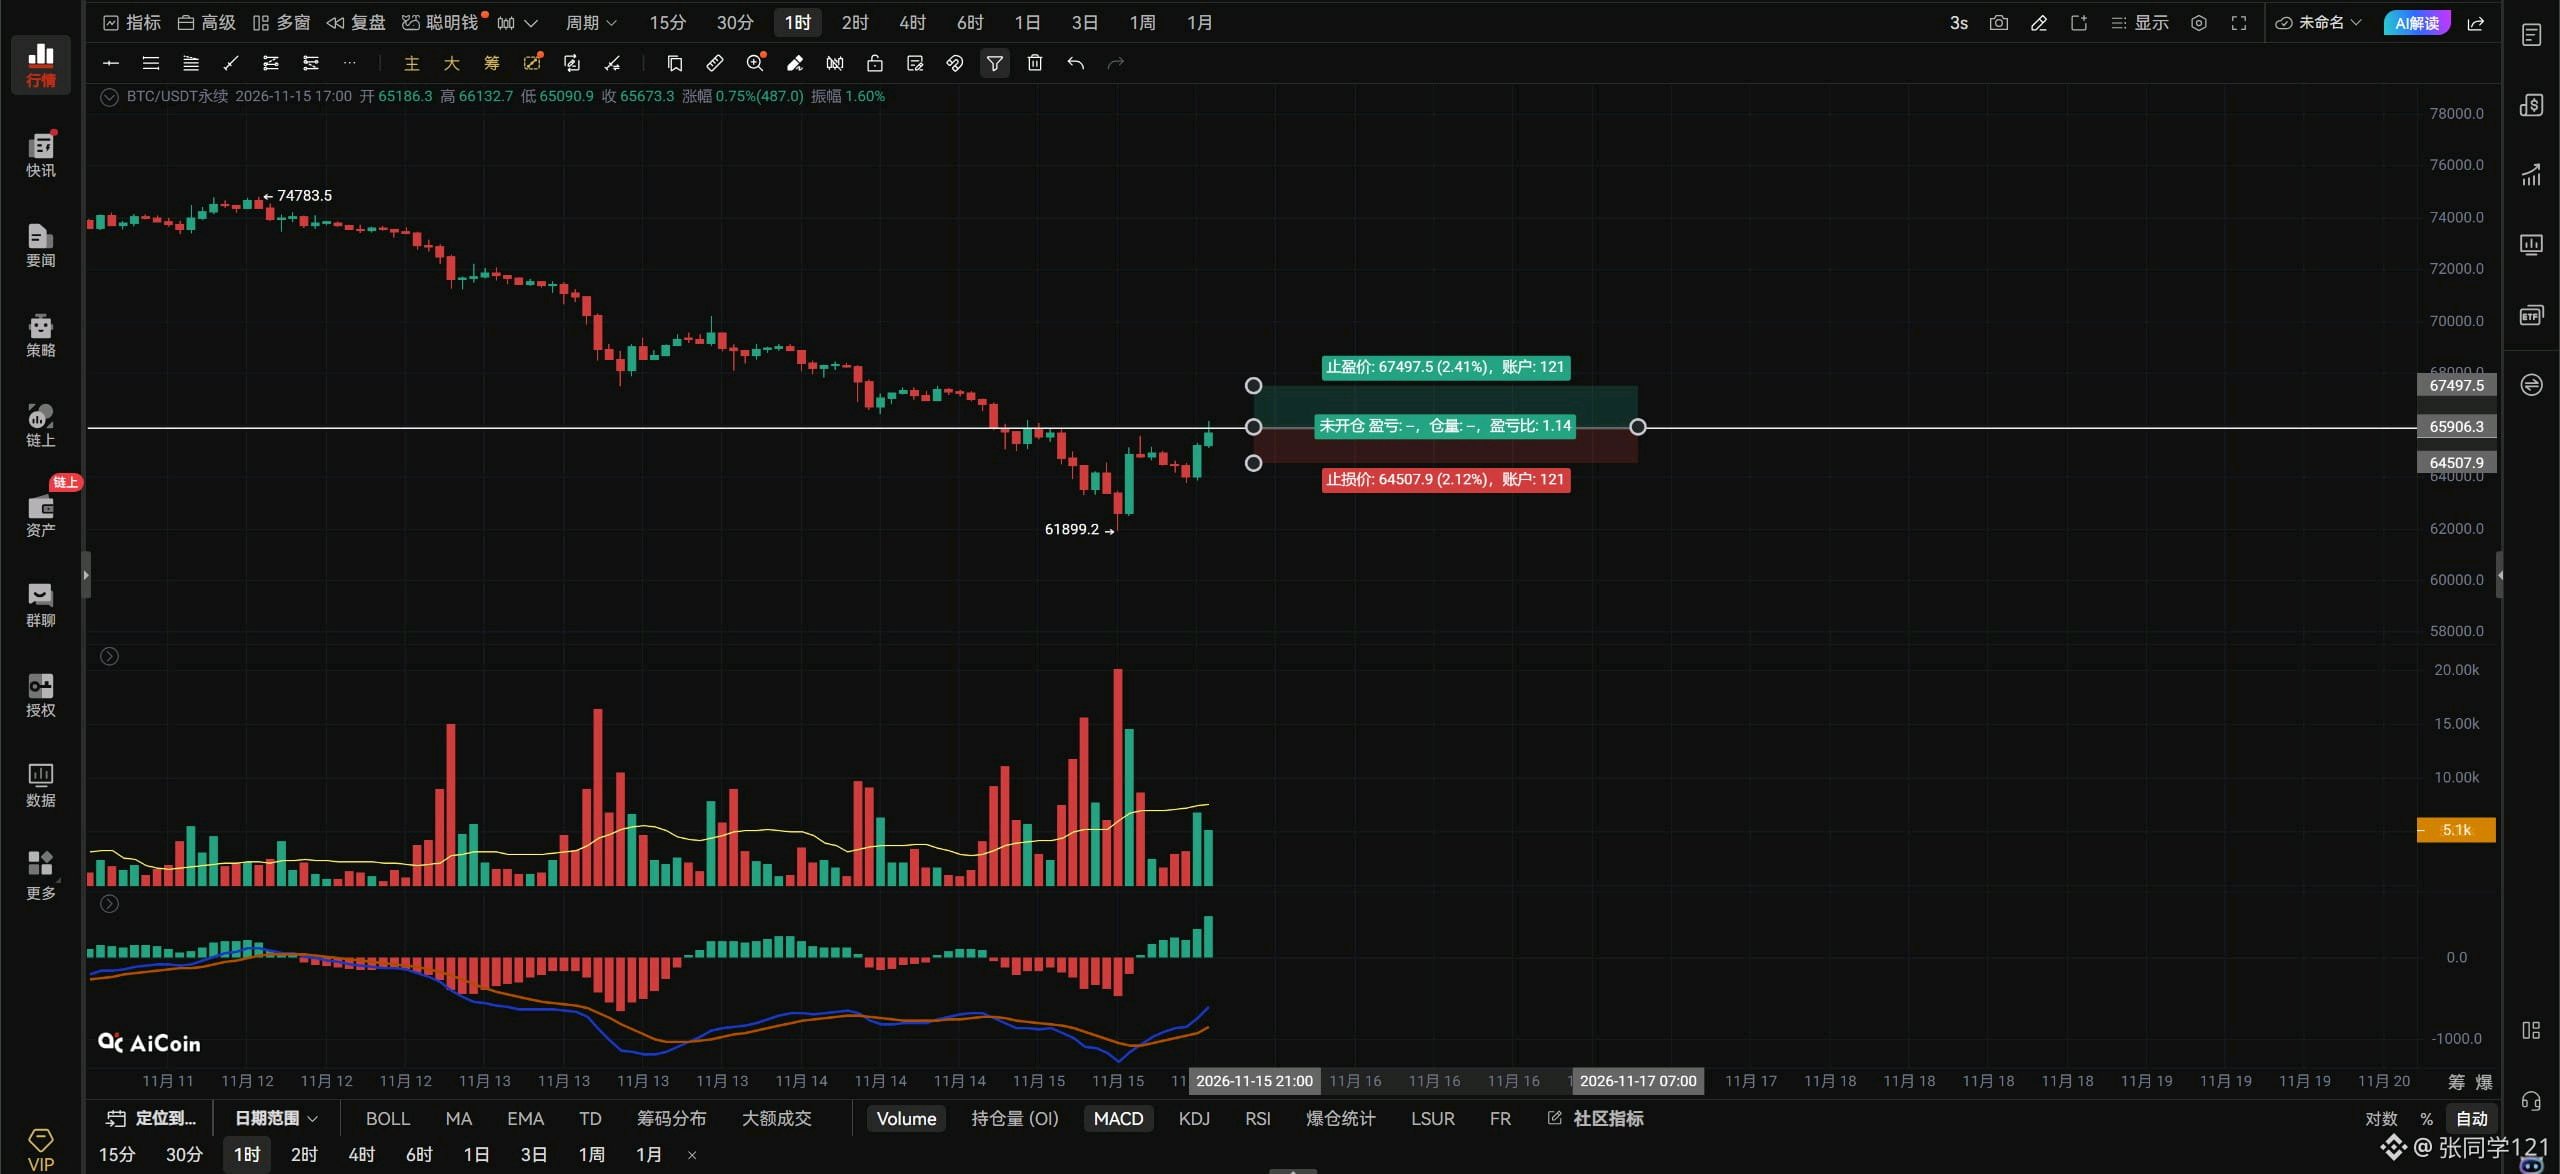
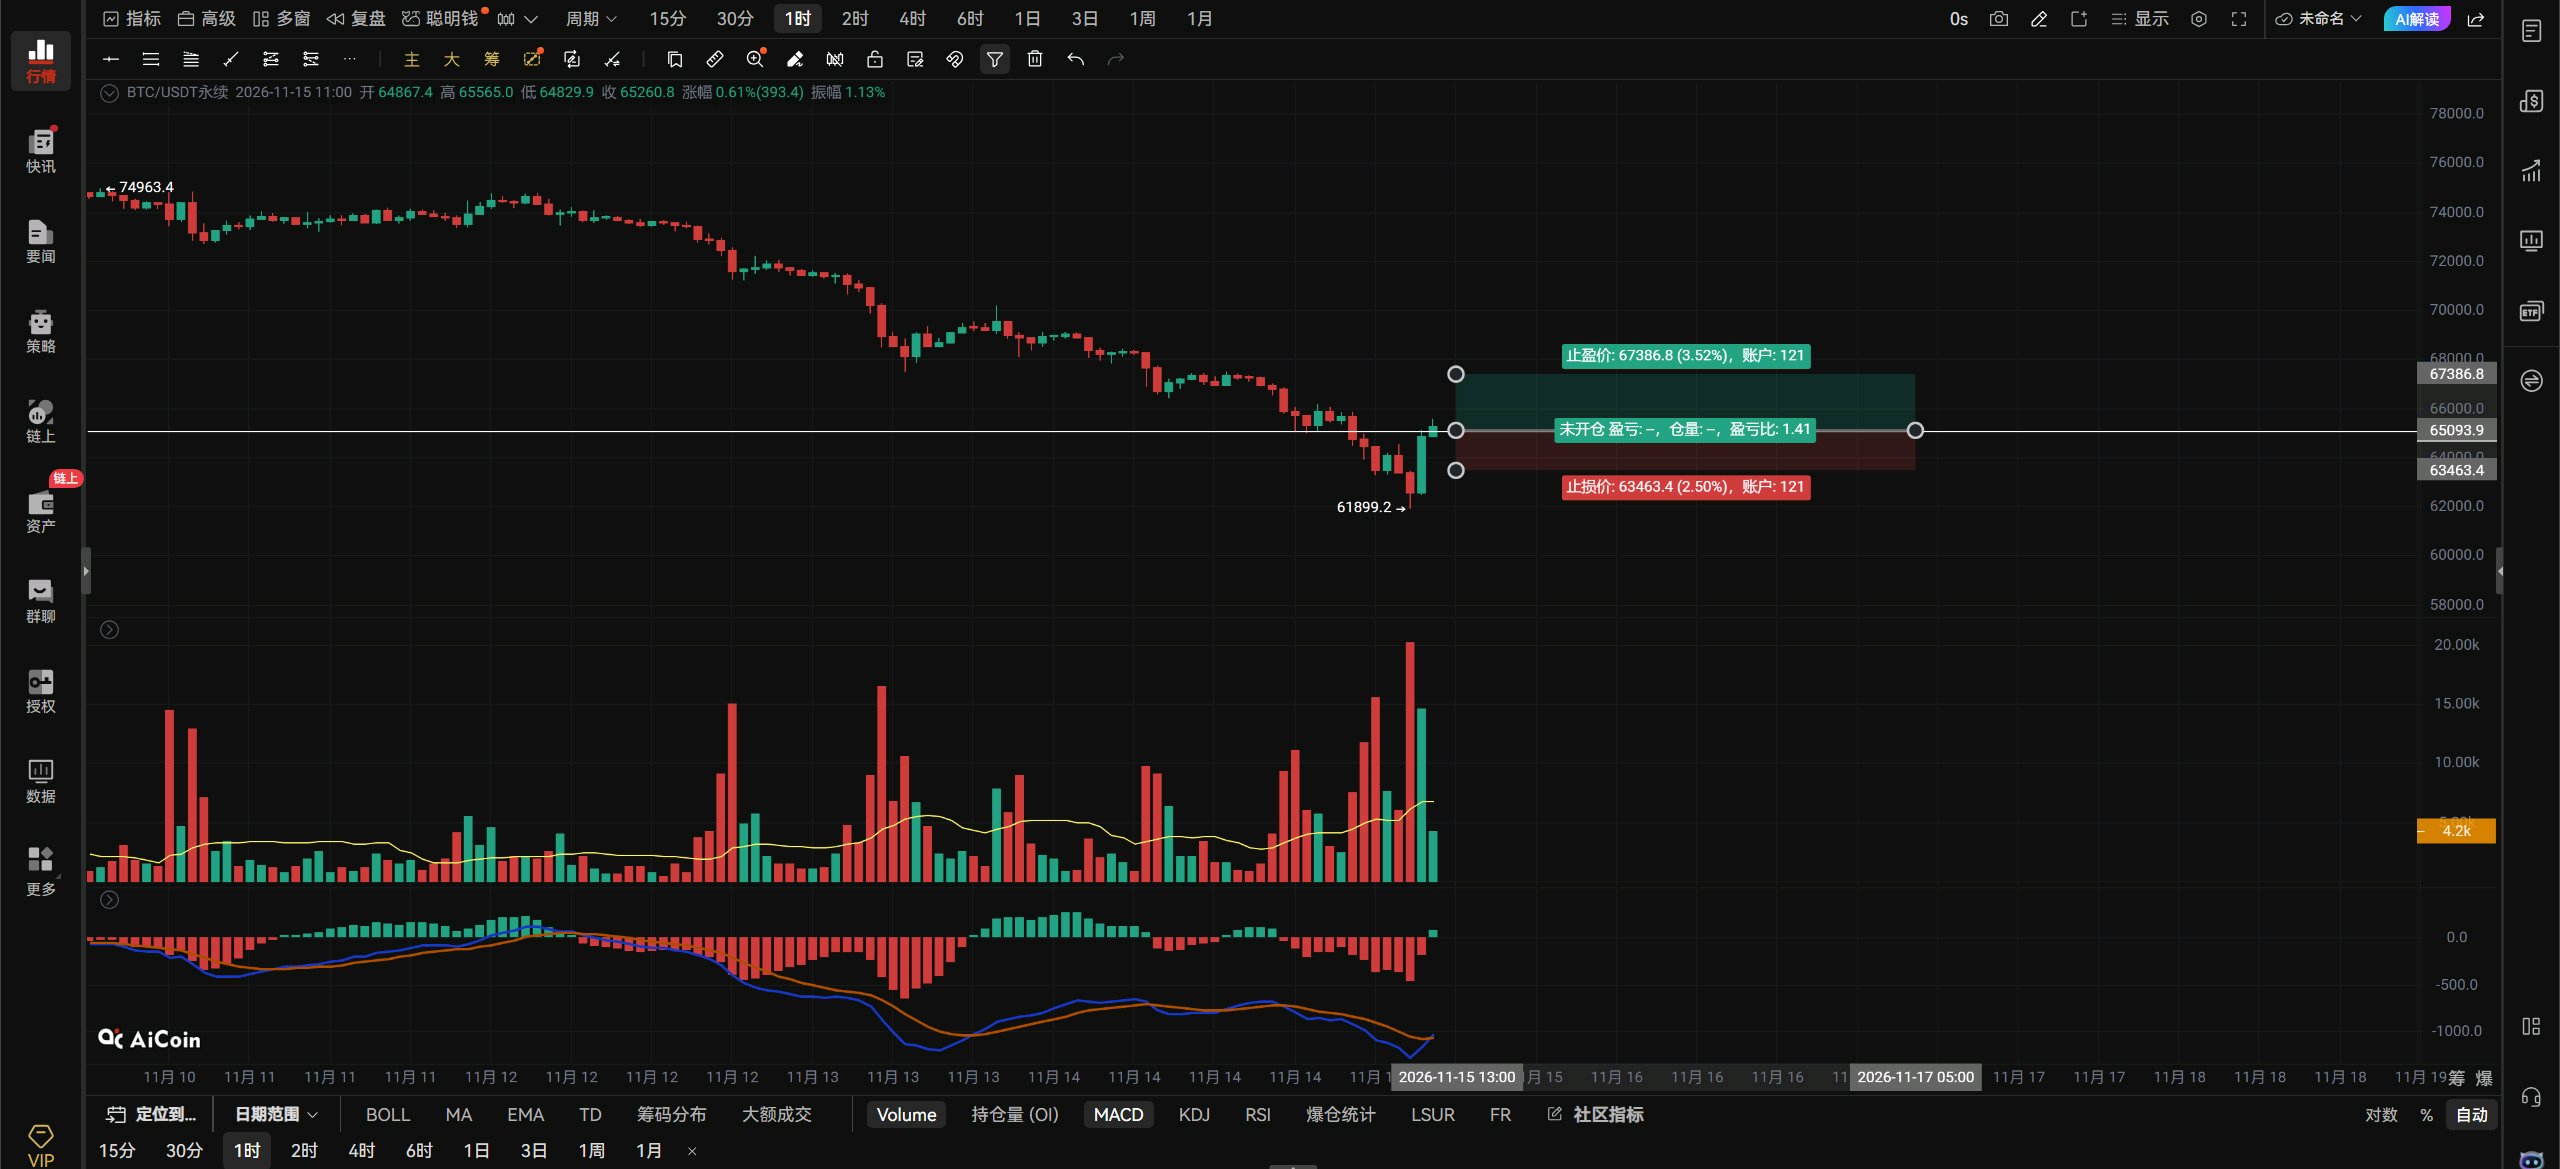
$BTCUSDT Evening Outlook: Nov. 15. Bitcoin has started to rebound and broken through the 65000 resistance, but it has now run into a new resistance at 66000. Bitcoin needs to hold above 65000 on the hourly timeframe to stop falling. To extend the rebound, it must break through 66000; then it could continue upward toward 67400. Next, we’ll see whether Bitcoin can stay above 65000. If it can’t hold above 65000, it will definitely retest the 63500–62500 area. The red arrow below points to the only test of support at 62000 so far. For a genuine uptrend to form, a second retest is inevitable. Only if that second retest forms a double bottom without breaking below the previous low can a healthy upward trend take shape. Bitcoin has fallen so much—do you think it can suddenly shoot straight to the moon? If that’s what you’re thinking, go to sleep! Anything can happen in your dreams. So if you don’t have a long position yet, don’t rush. Bitcoin has now broken through the 65000 resistance, and the 65000–62500 consolidation range has made a higher high and shown a structural break. Just patiently wait for Bitcoin to retest 63500–62500 and show a bottoming signal, then go long. Also, the US stock market is closed for the weekend, and we don’t know what will happen when it opens tomorrow. It could be another deceptive false breakout. If you rush in and go long, then it pulls back, you’ll be stuck in a losing position again. If Bitcoin breaks above 65906 with volume, aggressive traders can go long on the right-hand side. If it breaks below 64922 with volume and the rebound fails to reclaim that level, go short on the right-hand side. Use a stop-loss. On the hourly timeframe, if Bitcoin breaks above and holds 65906, the next targets are 67400–68562. If it can’t get above 65906, those targets are irrelevant. On the 4-hour timeframe, a break below 64922 would put 63500–62500 in view. Bitcoin briefly broke below 62,500 on the daily chart, but has now climbed back above it. Whether it can hold above 62,500 on the daily chart remains to be seen, since the daily close won't be confirmed until 8 a.m. tomorrow. It needs to close above 62,500 then for the daily downtrend to stabilize. For the daily chart to turn upward, it needs to break above 67,000—the upper boundary of the range. Only after breaking above 67,000 can we say the daily downtrend has temporarily ended, opening the door to filling the daily bearish FVG gap in the 68,600–71,100 range. If tomorrow's daily candle doesn't close above 62,500, there's a real chance price will retest 58,000, the lower boundary of the range. On the daily chart, 60,000 and 58,000 are the strongest support levels. If price reaches 60,000, it wouldn't hurt to go another 2,000 lower and test 58,000. Until Bitcoin breaks above 67,000 on the daily chart, the downside risk hasn't gone away. Don't let the current rebound fool you: price fell 25,000 points from 87,000 to 62,000, so a 10,000-point bounce is perfectly reasonable. Who'd stick around if it only ever went down? That's all for now. #ByXIMPACT
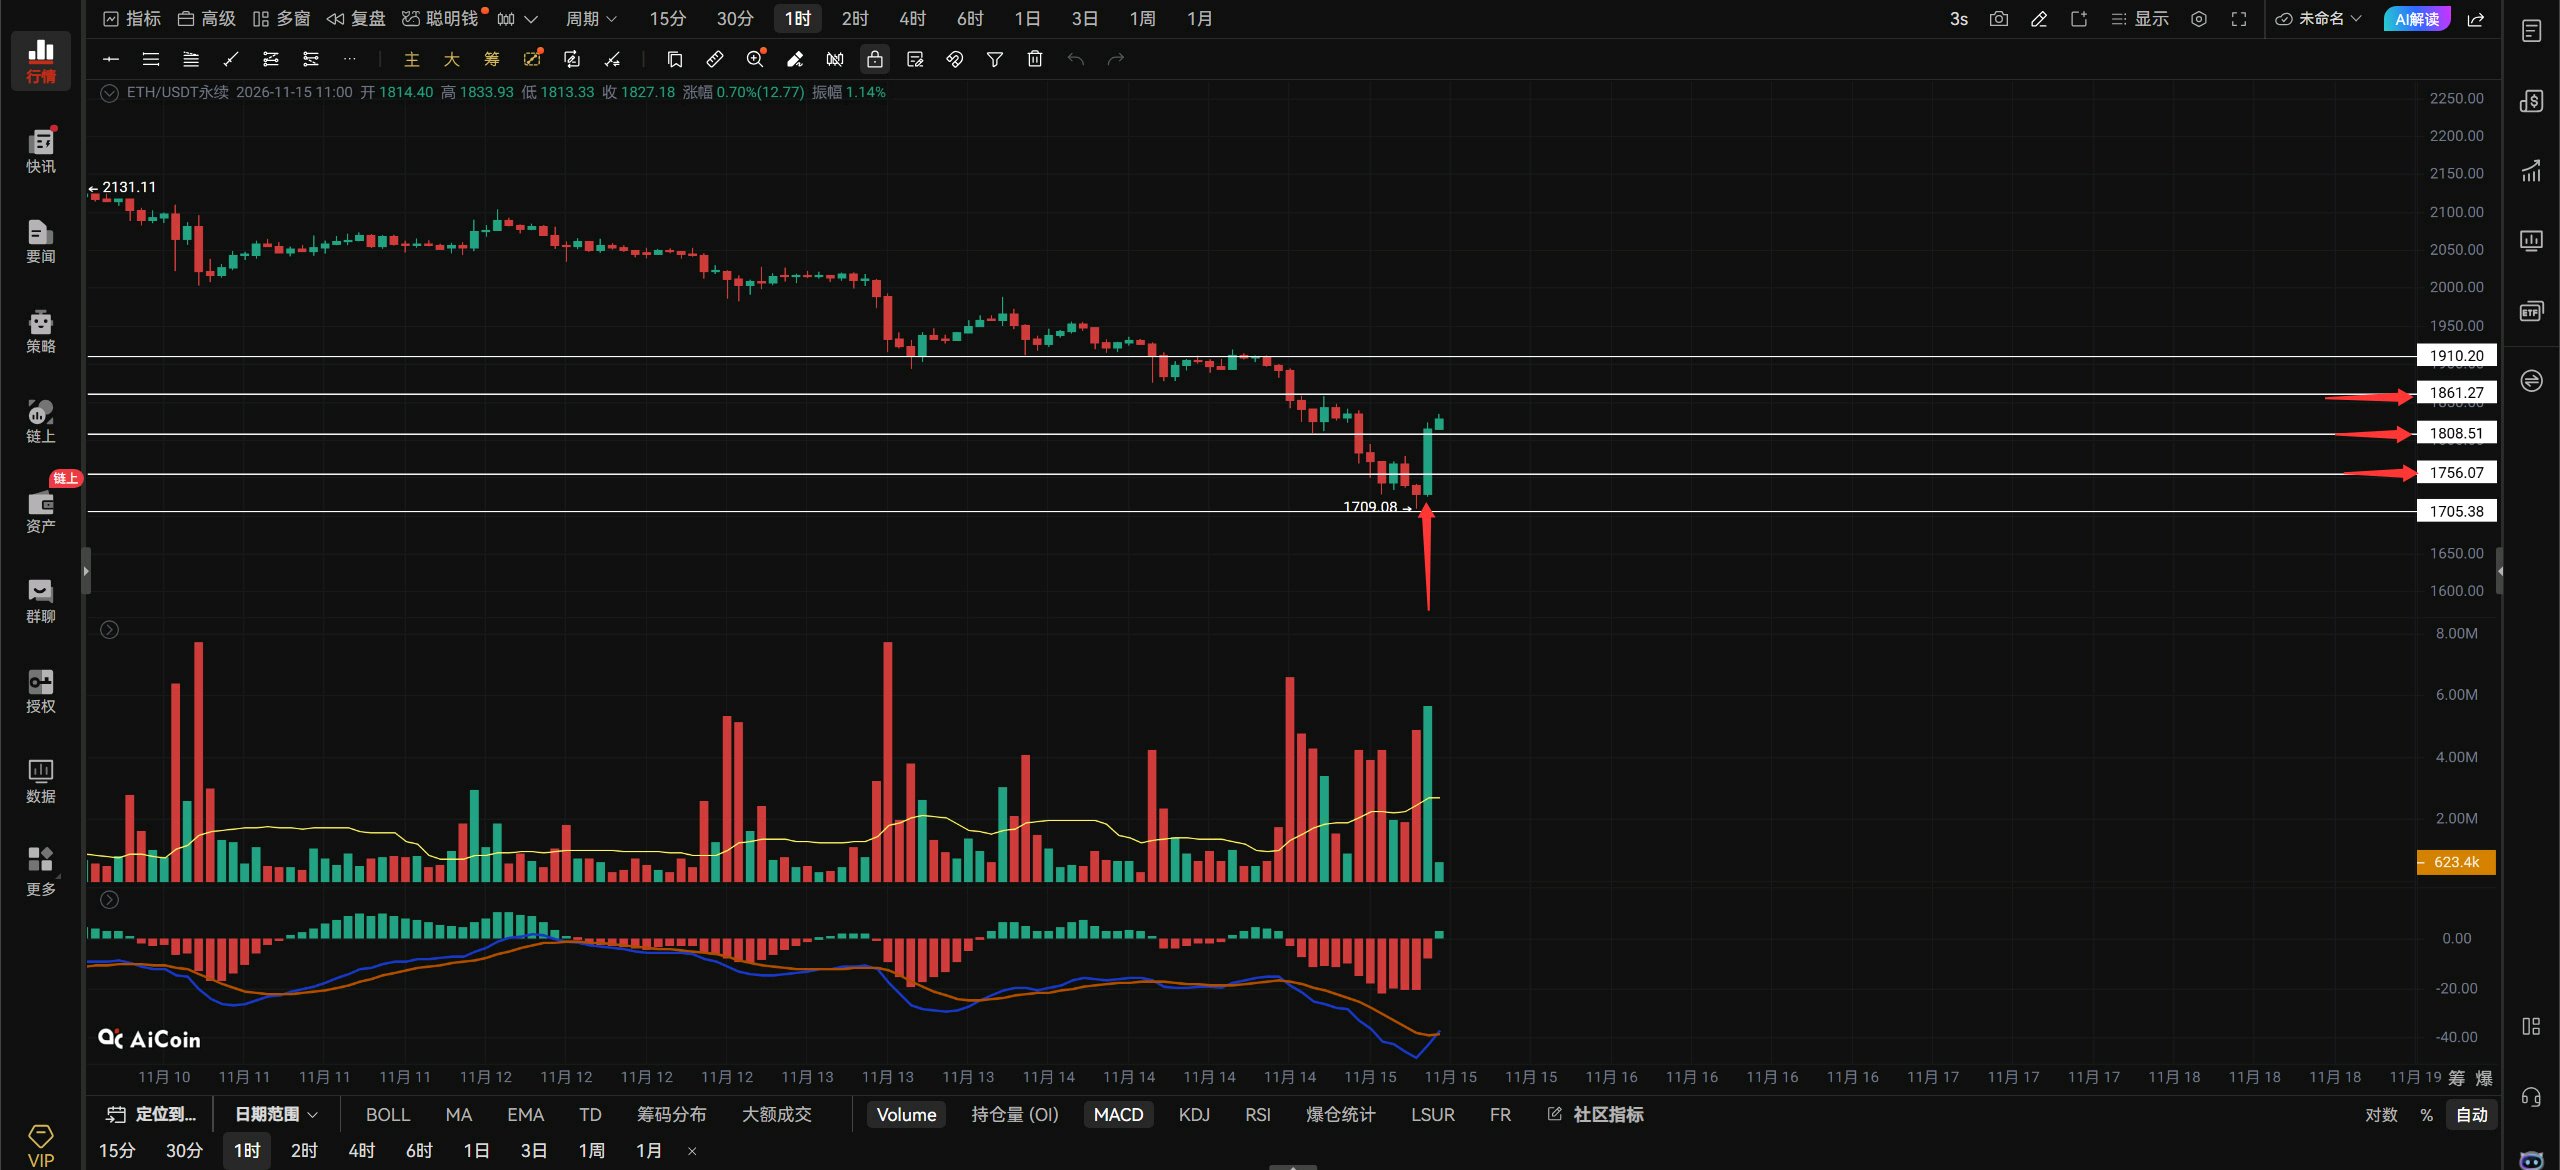
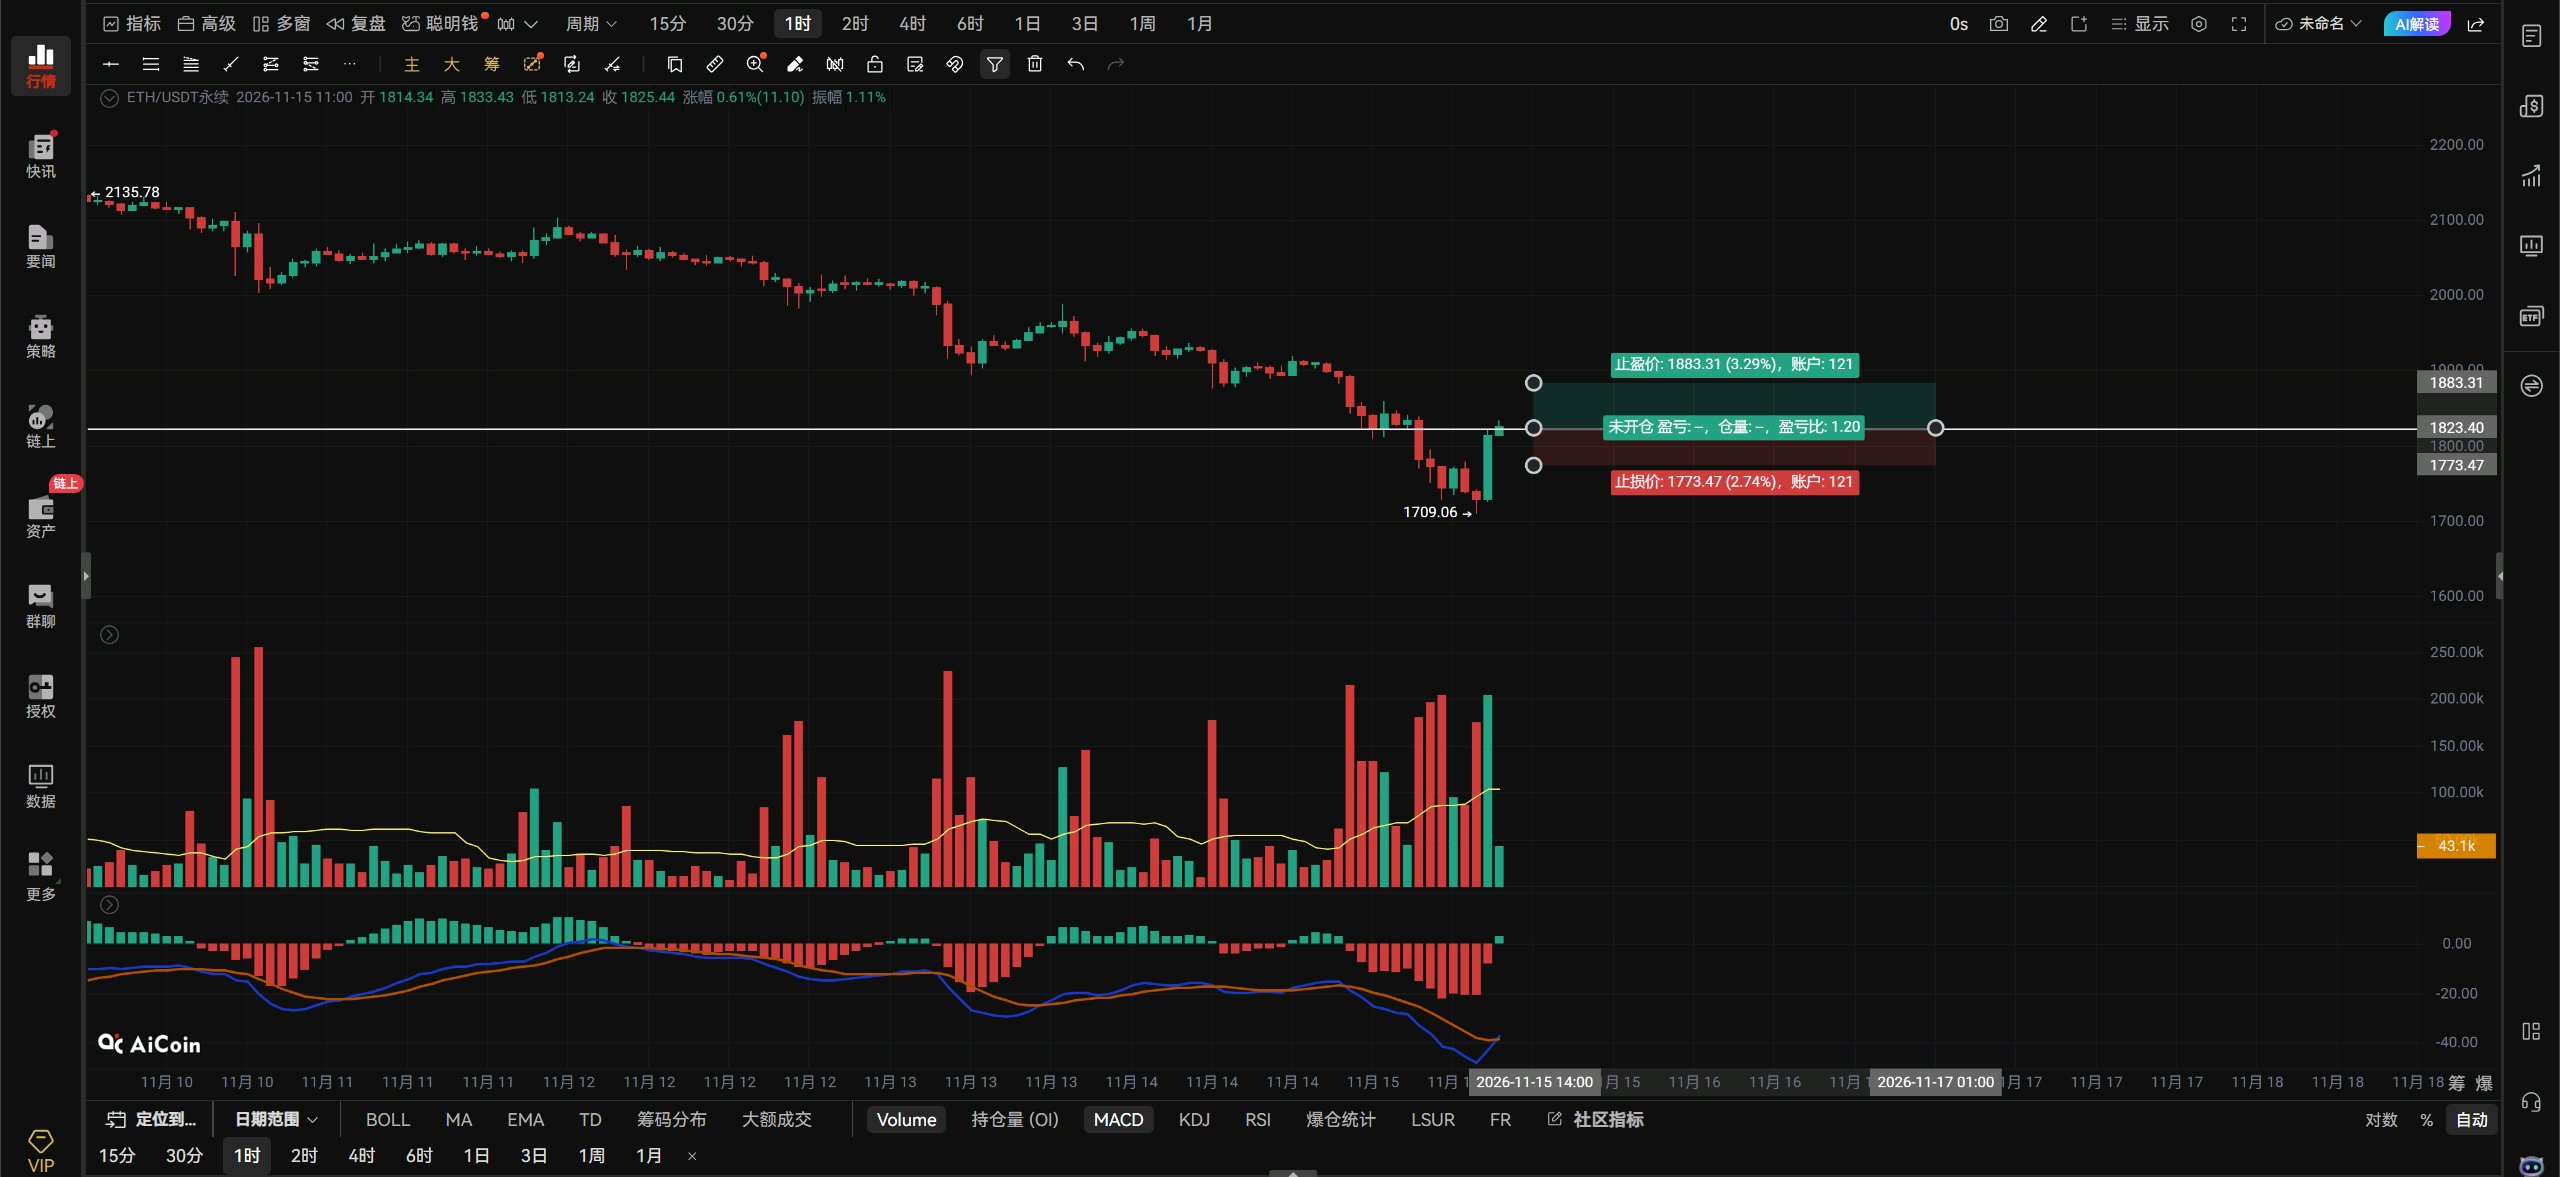
$ETHUSDT $ETH outlook: If ETH breaks above 1821 with strong volume, enter long on the breakout and set a stop-loss. If it breaks below 1784 with strong volume, enter short on the breakdown and set a stop-loss. If a pullback confirms 1740 as support, add one unit to the long position. Stop out if it breaks below 1709. If ETH holds above 1821 on the hourly chart, look for 1861–1910. Watch for a short entry of one unit at 1861. Stop out if it breaks above 1910. Countertrend wick-entry orders: long at 1680; stop out if it breaks below 1648. Resistance above: 1821–1861–1910 Support below: 1784–1740–1709 A 4-hour close below 1784 points to 1740–1709. Below ETH, where the red arrow points, a single bullish candle has pierced through several bearish candles. This shows ETH is currently strong. However, for ETH to continue rebounding, it needs to hold above 1800; only then can it keep moving up toward 1861. If it can't stay above 1800, it should at least pull back to 1756 and consolidate in the 1756–1800 range before choosing a direction. If you want to go long on ETH, it's best to wait for a pullback—don't rush to chase. That's all.#ByXIMPACT
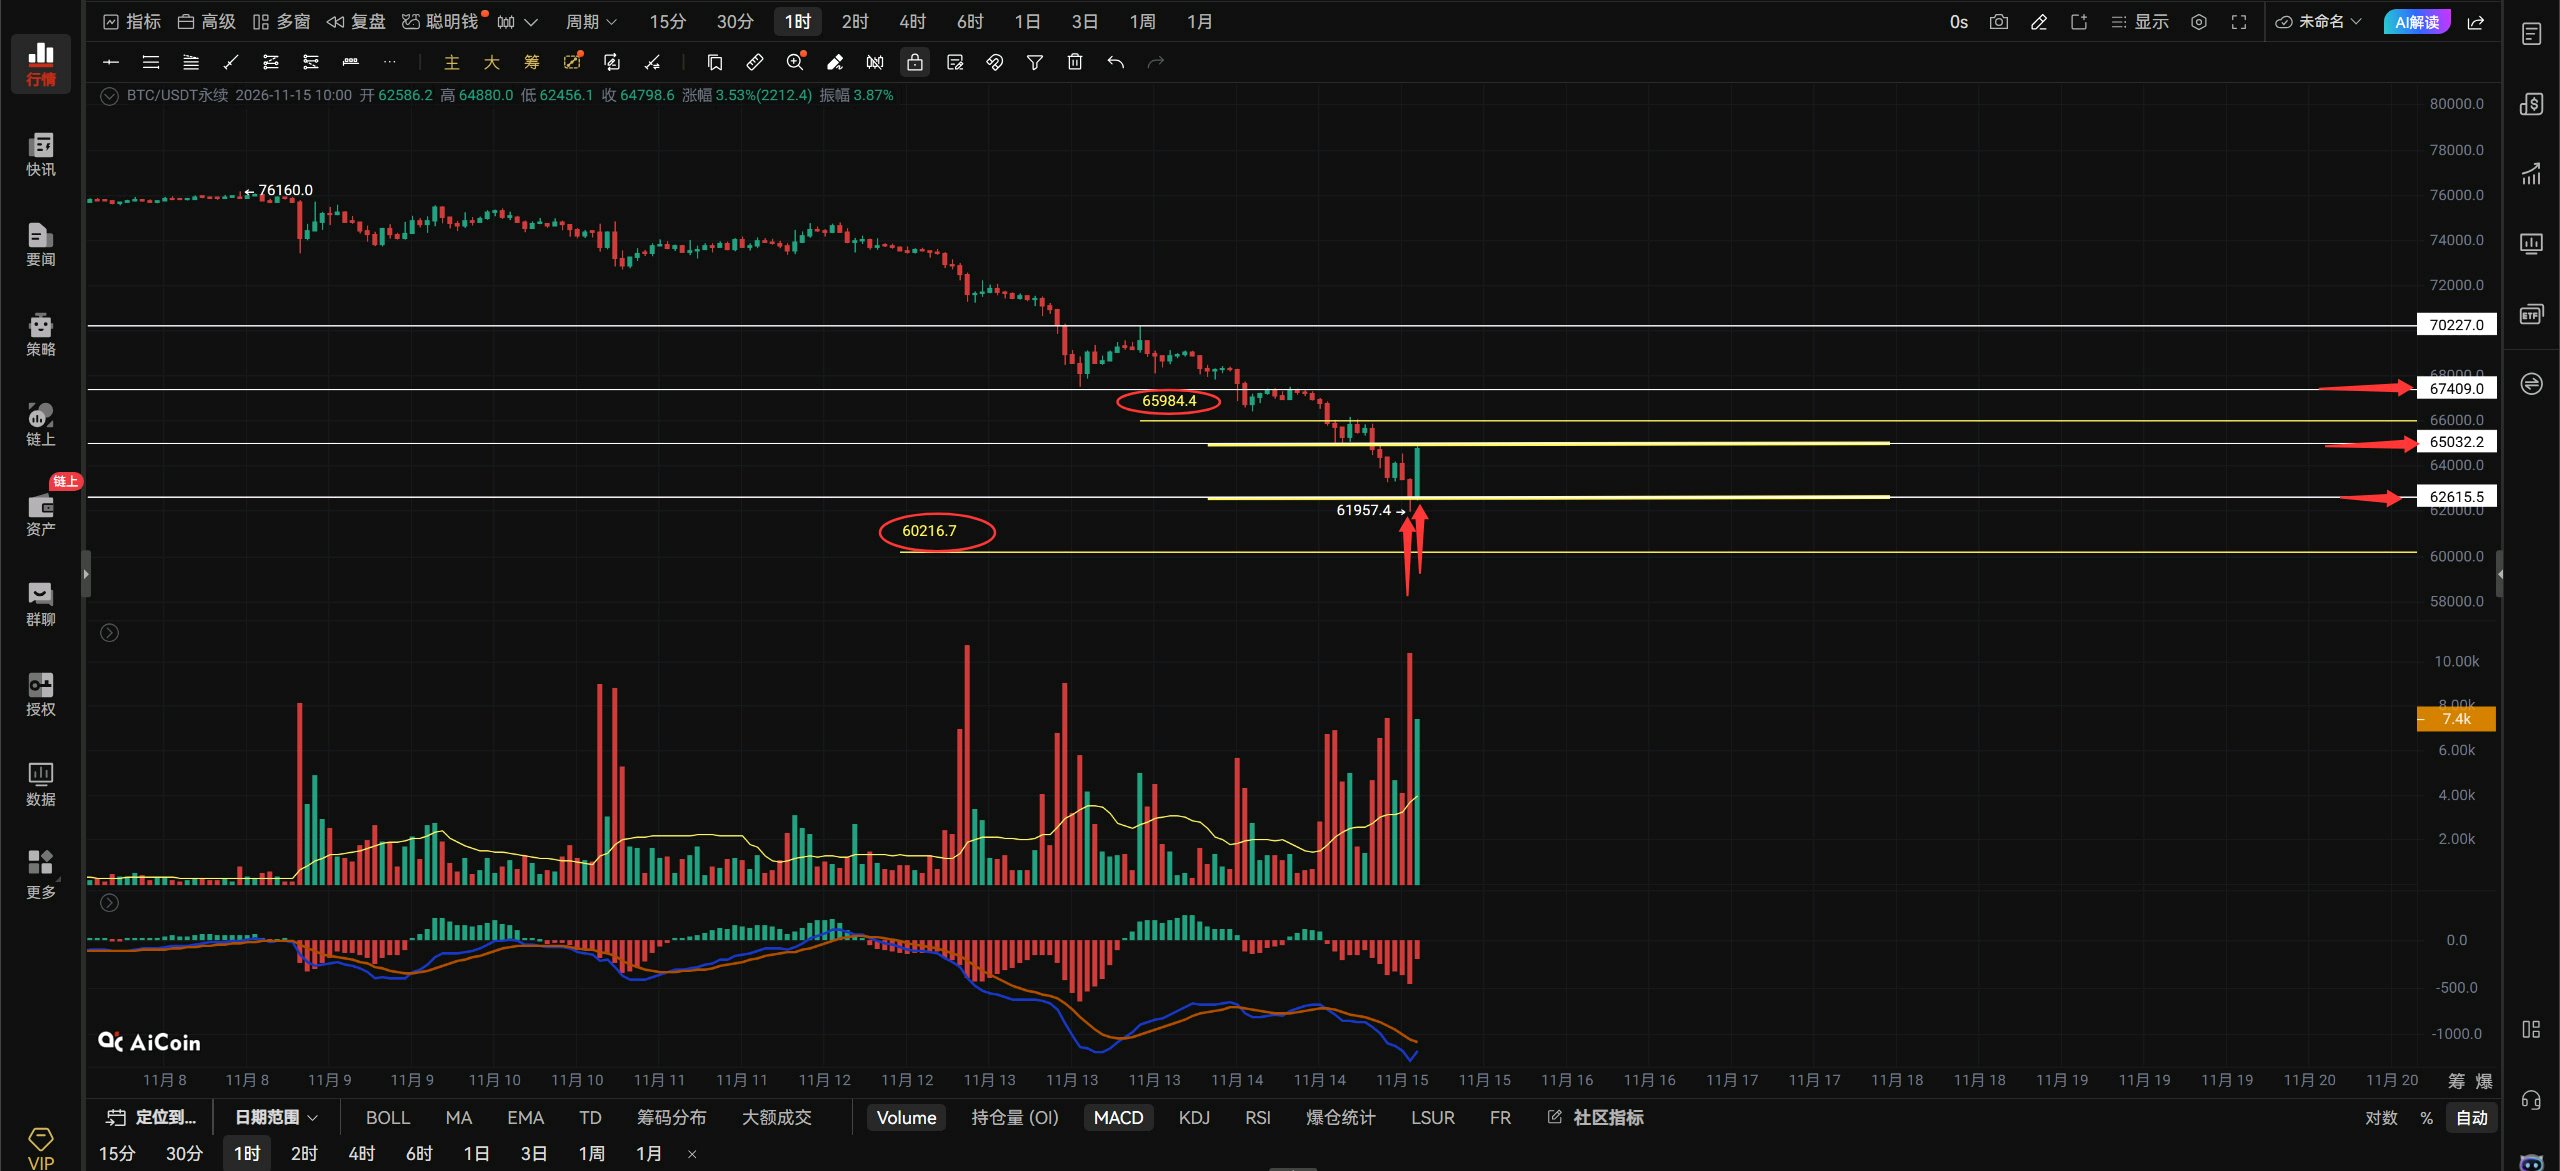
$BTCUSDT 11.15 Midday Market Outlook.🌿 $BTC Viewpoint: The weekend was wild too! I originally thought we’d see a recovery after the weekend’s decline, but I didn’t expect the weekend to be this brutal. In this market, even the world’s top traders would see their capital shrink, let alone us small retail investors. This drop has left me completely speechless; the bulls are desperate. After Bitcoin fell below 67400, it tried to rebound and reclaim 67400, but failed. Then it plunged straight to 65000. It barely paused at 65000 before continuing to fall. When I woke up this morning, I saw Bitcoin had broken below the support levels at 65000 and 62615, dropping straight to a low of 61957. A new low every time you wake up these past few days—who can take that? Bitcoin is now trading in the 65032–62615 range. Has it bottomed out? Bitcoin needs to reclaim 65000 to stop falling and rebound, with 65984–67400 as the upside targets. If it can’t get back above 65000, it may retest the previous low. The red arrow below points to a very nice bullish engulfing pattern, which suggests a rebound is likely on the hourly timeframe. But the rebound must break through the 65000 resistance; otherwise, it won’t be able to continue. Why did such a big rebound occur after the price hit around 62000? Because reaching 62000 activated buying interest around that level. Institutional bulls felt 62000 was worth buying, which is why the reaction was so strong. Next, we’ll see whether 65000 can be broken. If it breaks through, the rebound will continue; if not, wait for a second retest. If 62000 holds on the second retest, this decline will basically have run its course. If 62000 fails to hold, a new low at 60216 could appear before you know it. If you want to go long now, it’s best to wait for a bottoming signal near 62000 after a pullback. Chasing the price directly is a bit risky.#ByXIMPACT
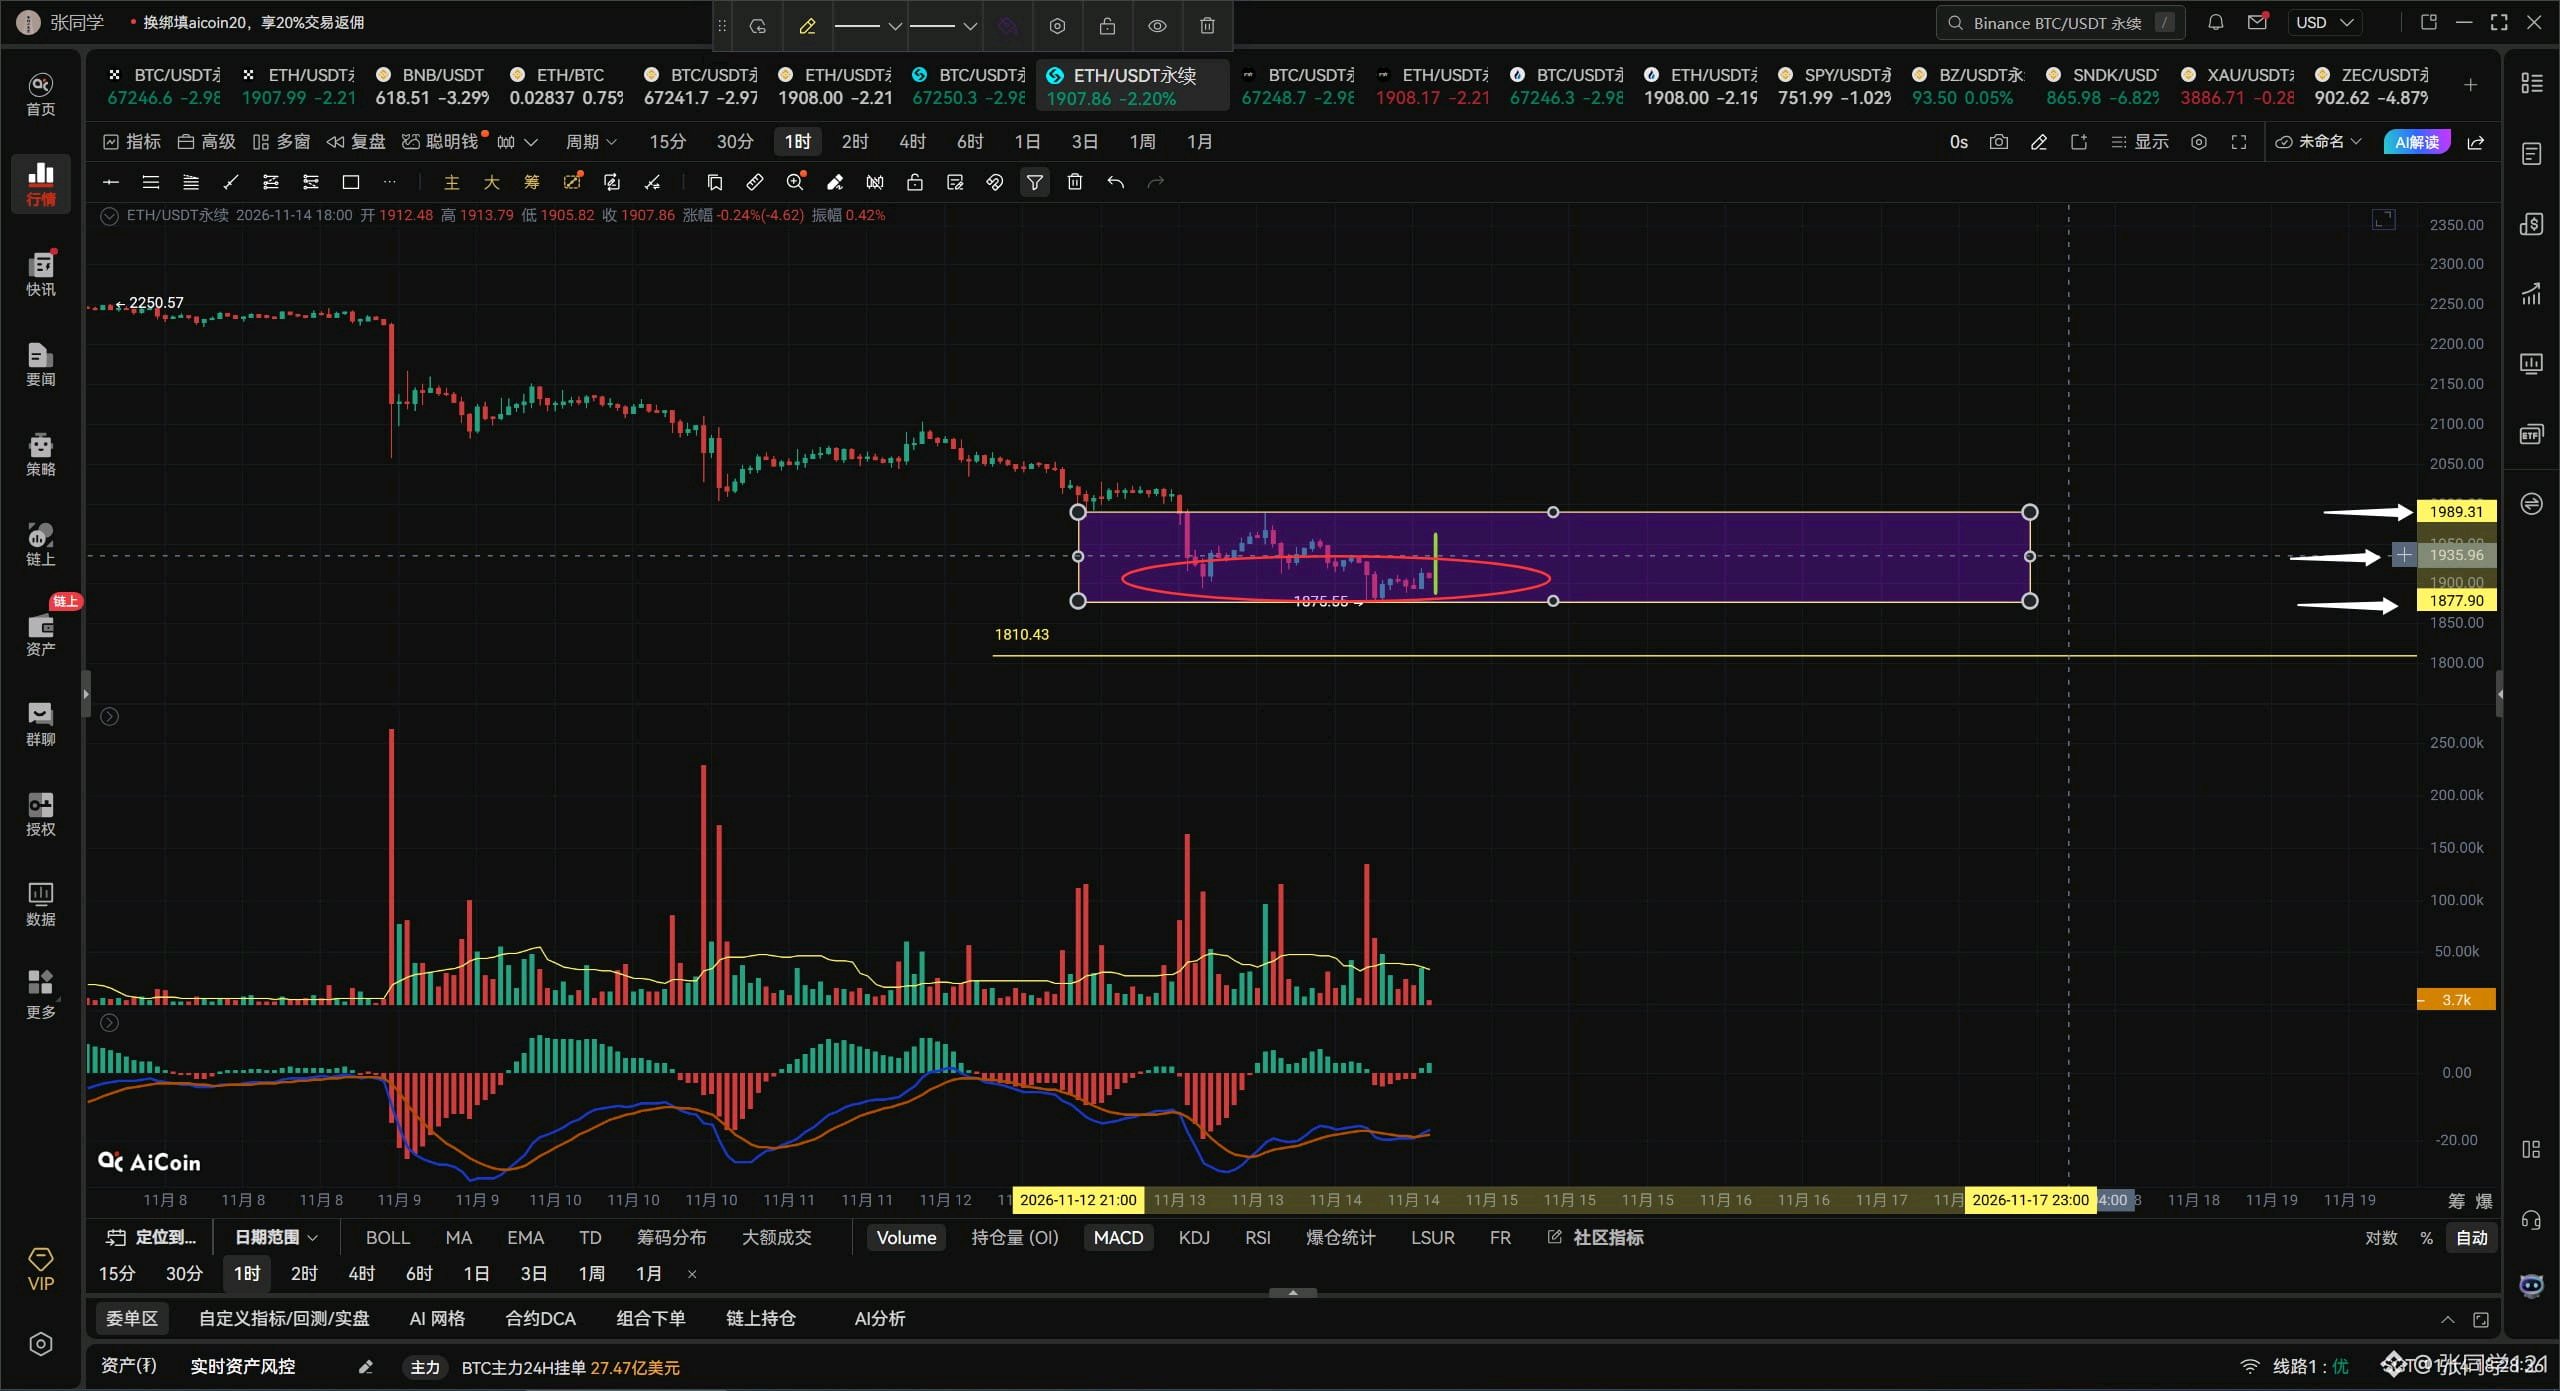
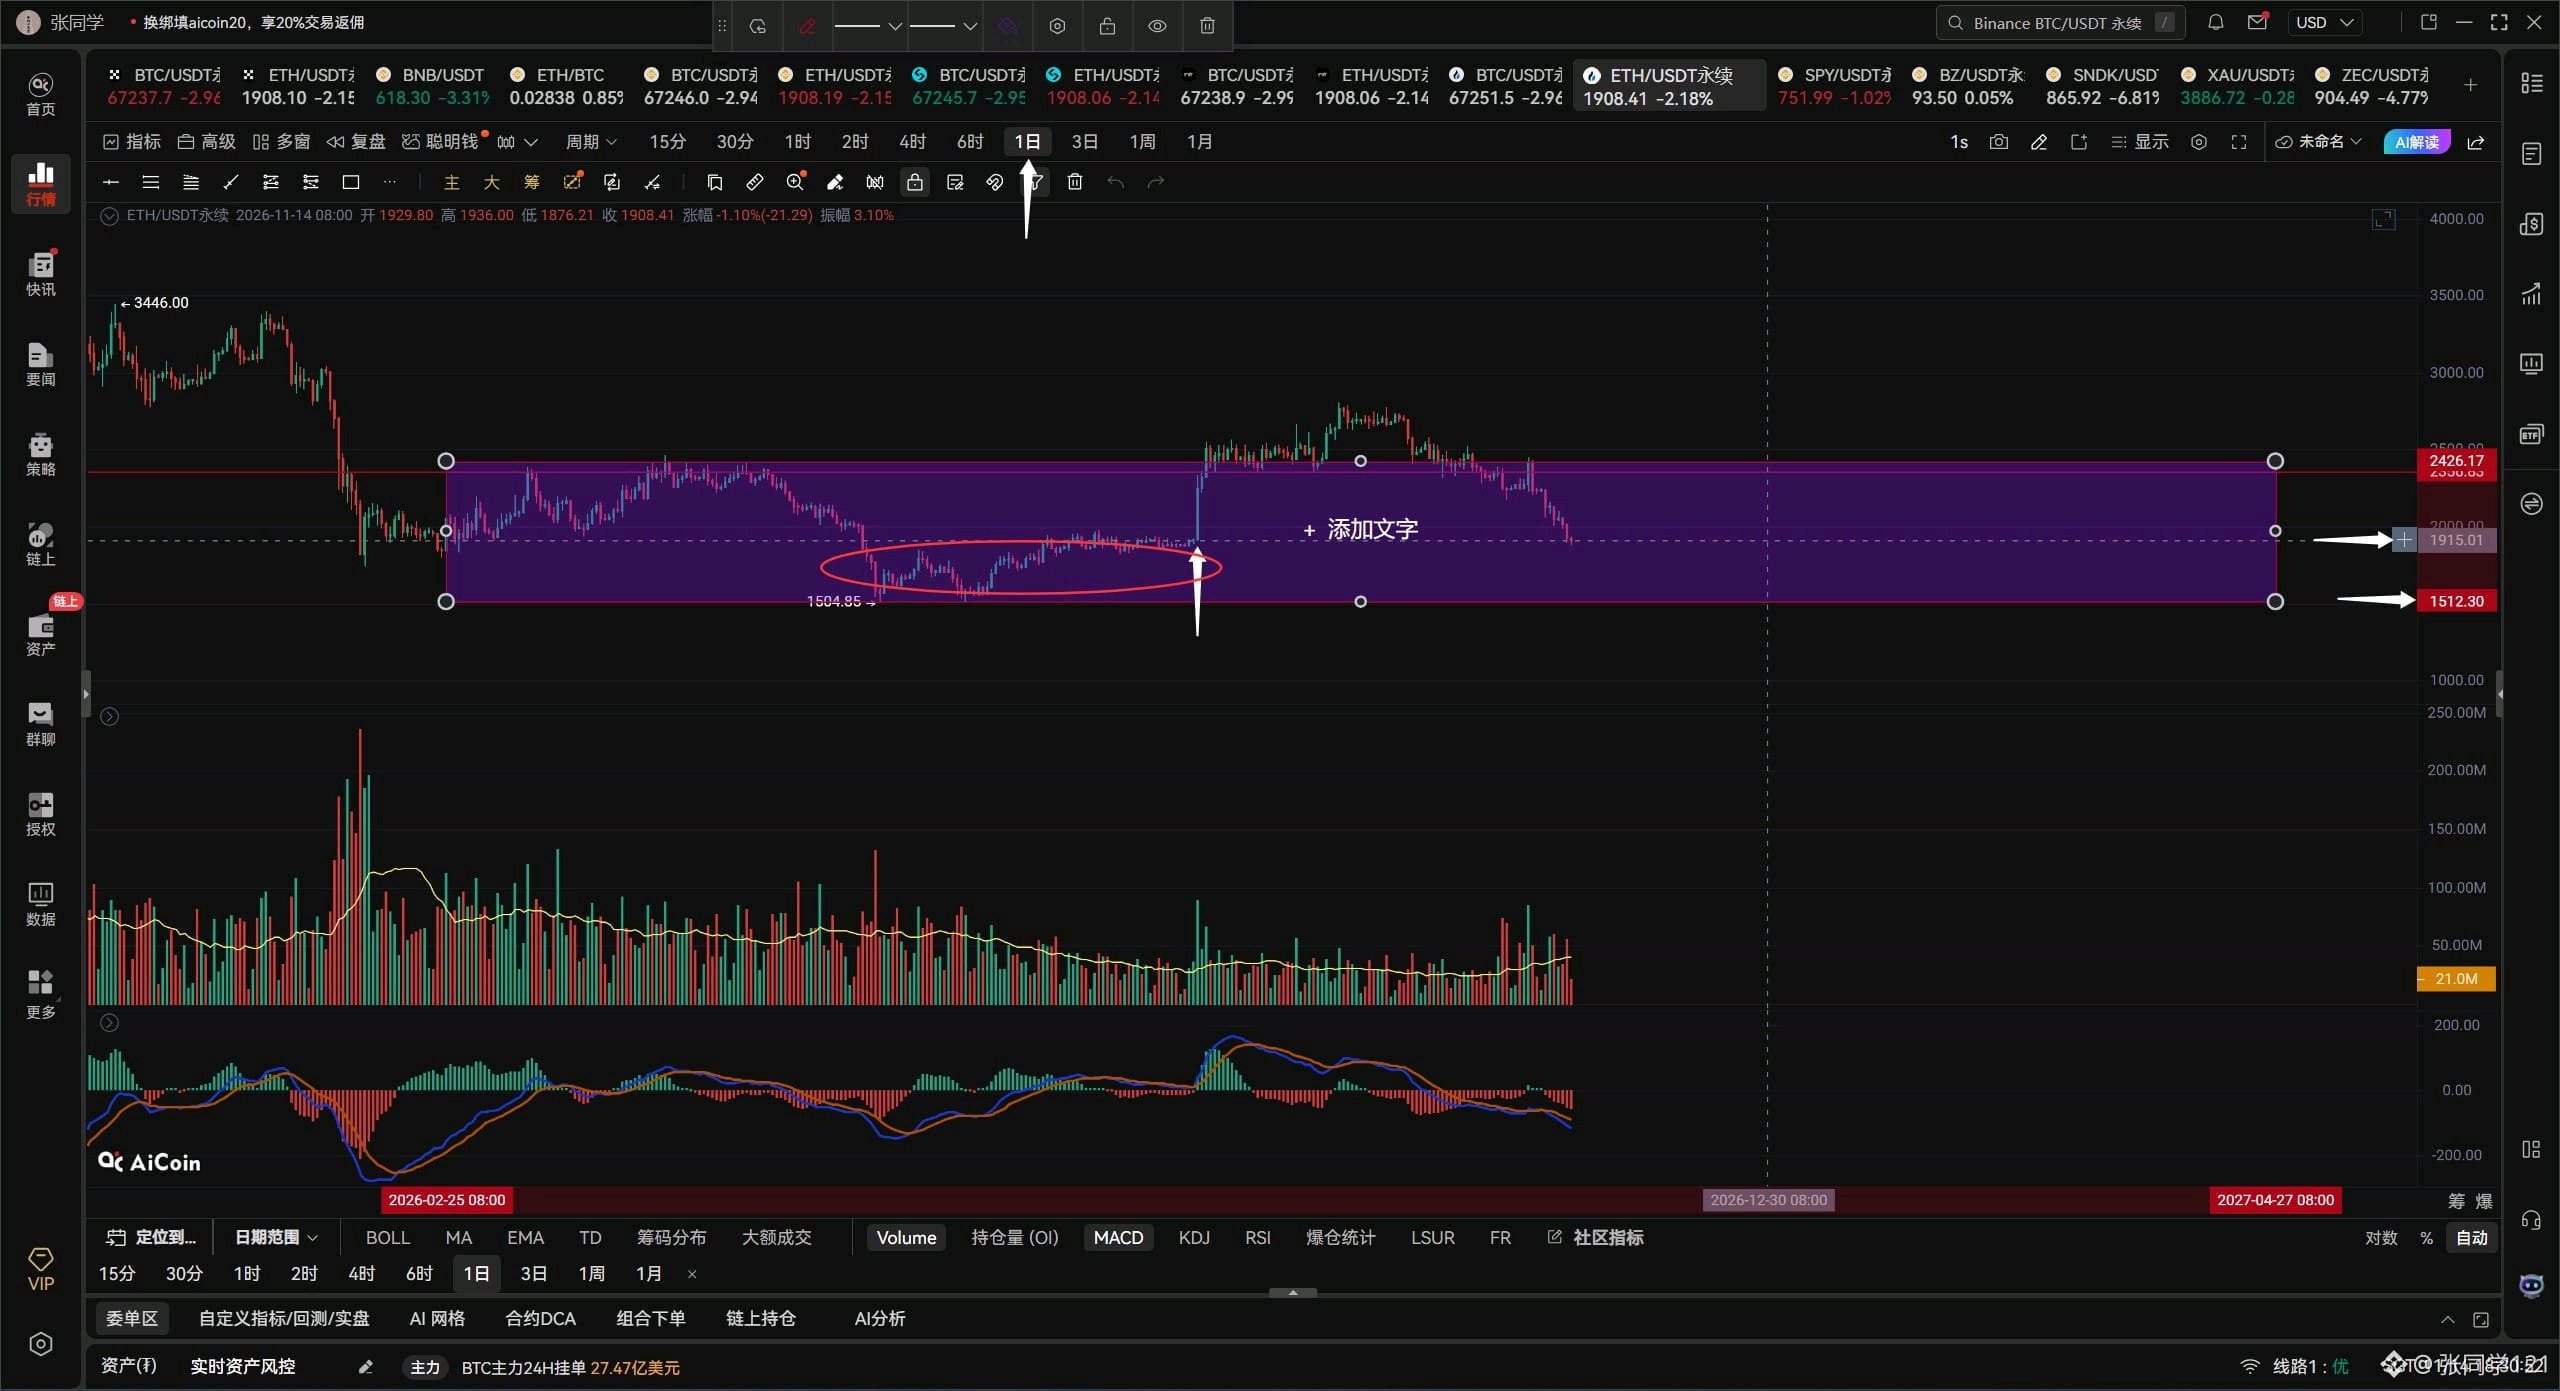
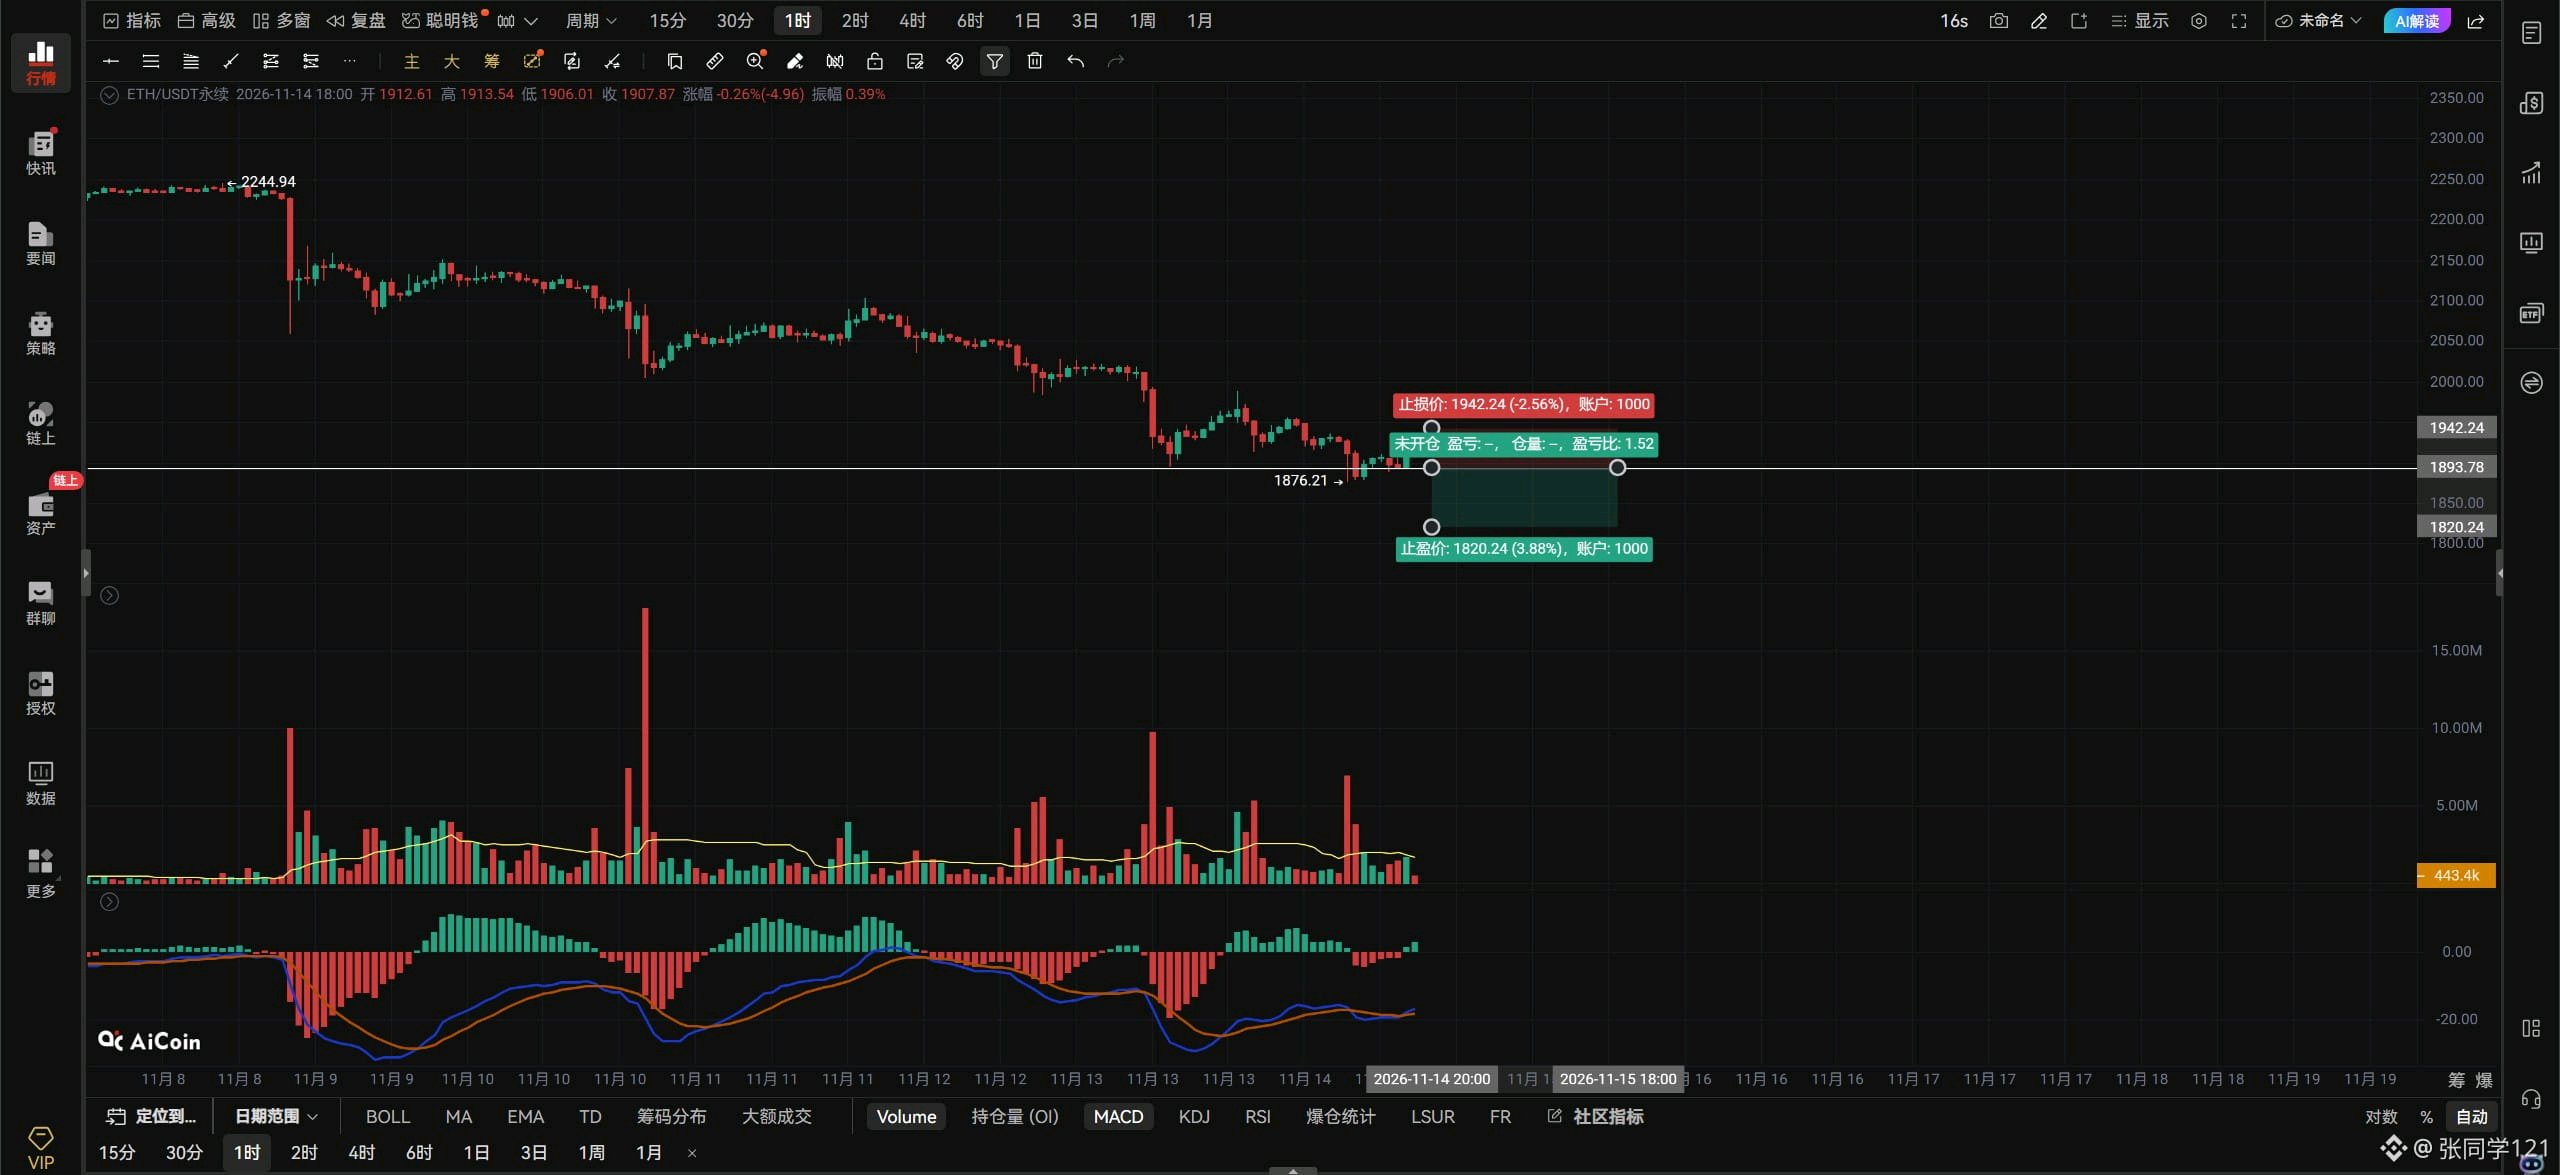
ETHUSDT $ETH Perspectiva para la tarde: 14 de noviembre. ETH se está consolidando actualmente entre 1989 y 1877. Para que ETH suba, debe romper por encima del punto medio del rango y mantenerse ahí para dejar de caer y comenzar un rebote. Ese precio ronda los 1935, porque solo una ruptura por encima de la pequeña zona de consolidación marcada por el recuadro rojo en 1935 puede producir un máximo más alto y extender el rebote hacia el límite superior del rango en 1989. Si no puede romper por encima de 1935, solo puede continuar con una negociación agitada y de rango estrecho entre 1935 y 1877. Y dado que ha estado cotizando por debajo del punto medio del rango, el riesgo de romper por debajo del mínimo anterior es alto. Por lo tanto, para reducir el riesgo de nuevas caídas, ETH debe volver a subir por encima de 1935 y mantenerse ahí. Si ETH rompe por encima de 1912 con volumen, considera entrar en largo; si rompe por debajo de 1893 con volumen, considera entrar en corto. Vigila los cambios en el volumen y utiliza stop-losses. Si ETH se mantiene por encima de 1912 en el gráfico horario, apunta hacia 1935–1989. Si rompe por debajo de 1893 en el gráfico de 4 horas, apunta hacia 1861–1809. En el gráfico diario de ETH, la gran vela alcista indicada por la flecha blanca a continuación ya ha sido rota. Si el cierre diario de mañana no logra volver a entrar dentro de esa vela, el precio podría moverse hacia la zona de consolidación marcada por el recuadro rojo a continuación. ¡No puedo decir con seguridad si llegará a 1500! En cualquier caso, ETH está en serios problemas si no puede mantenerse por encima de 1900. Eso es todo.ByXIMPACT
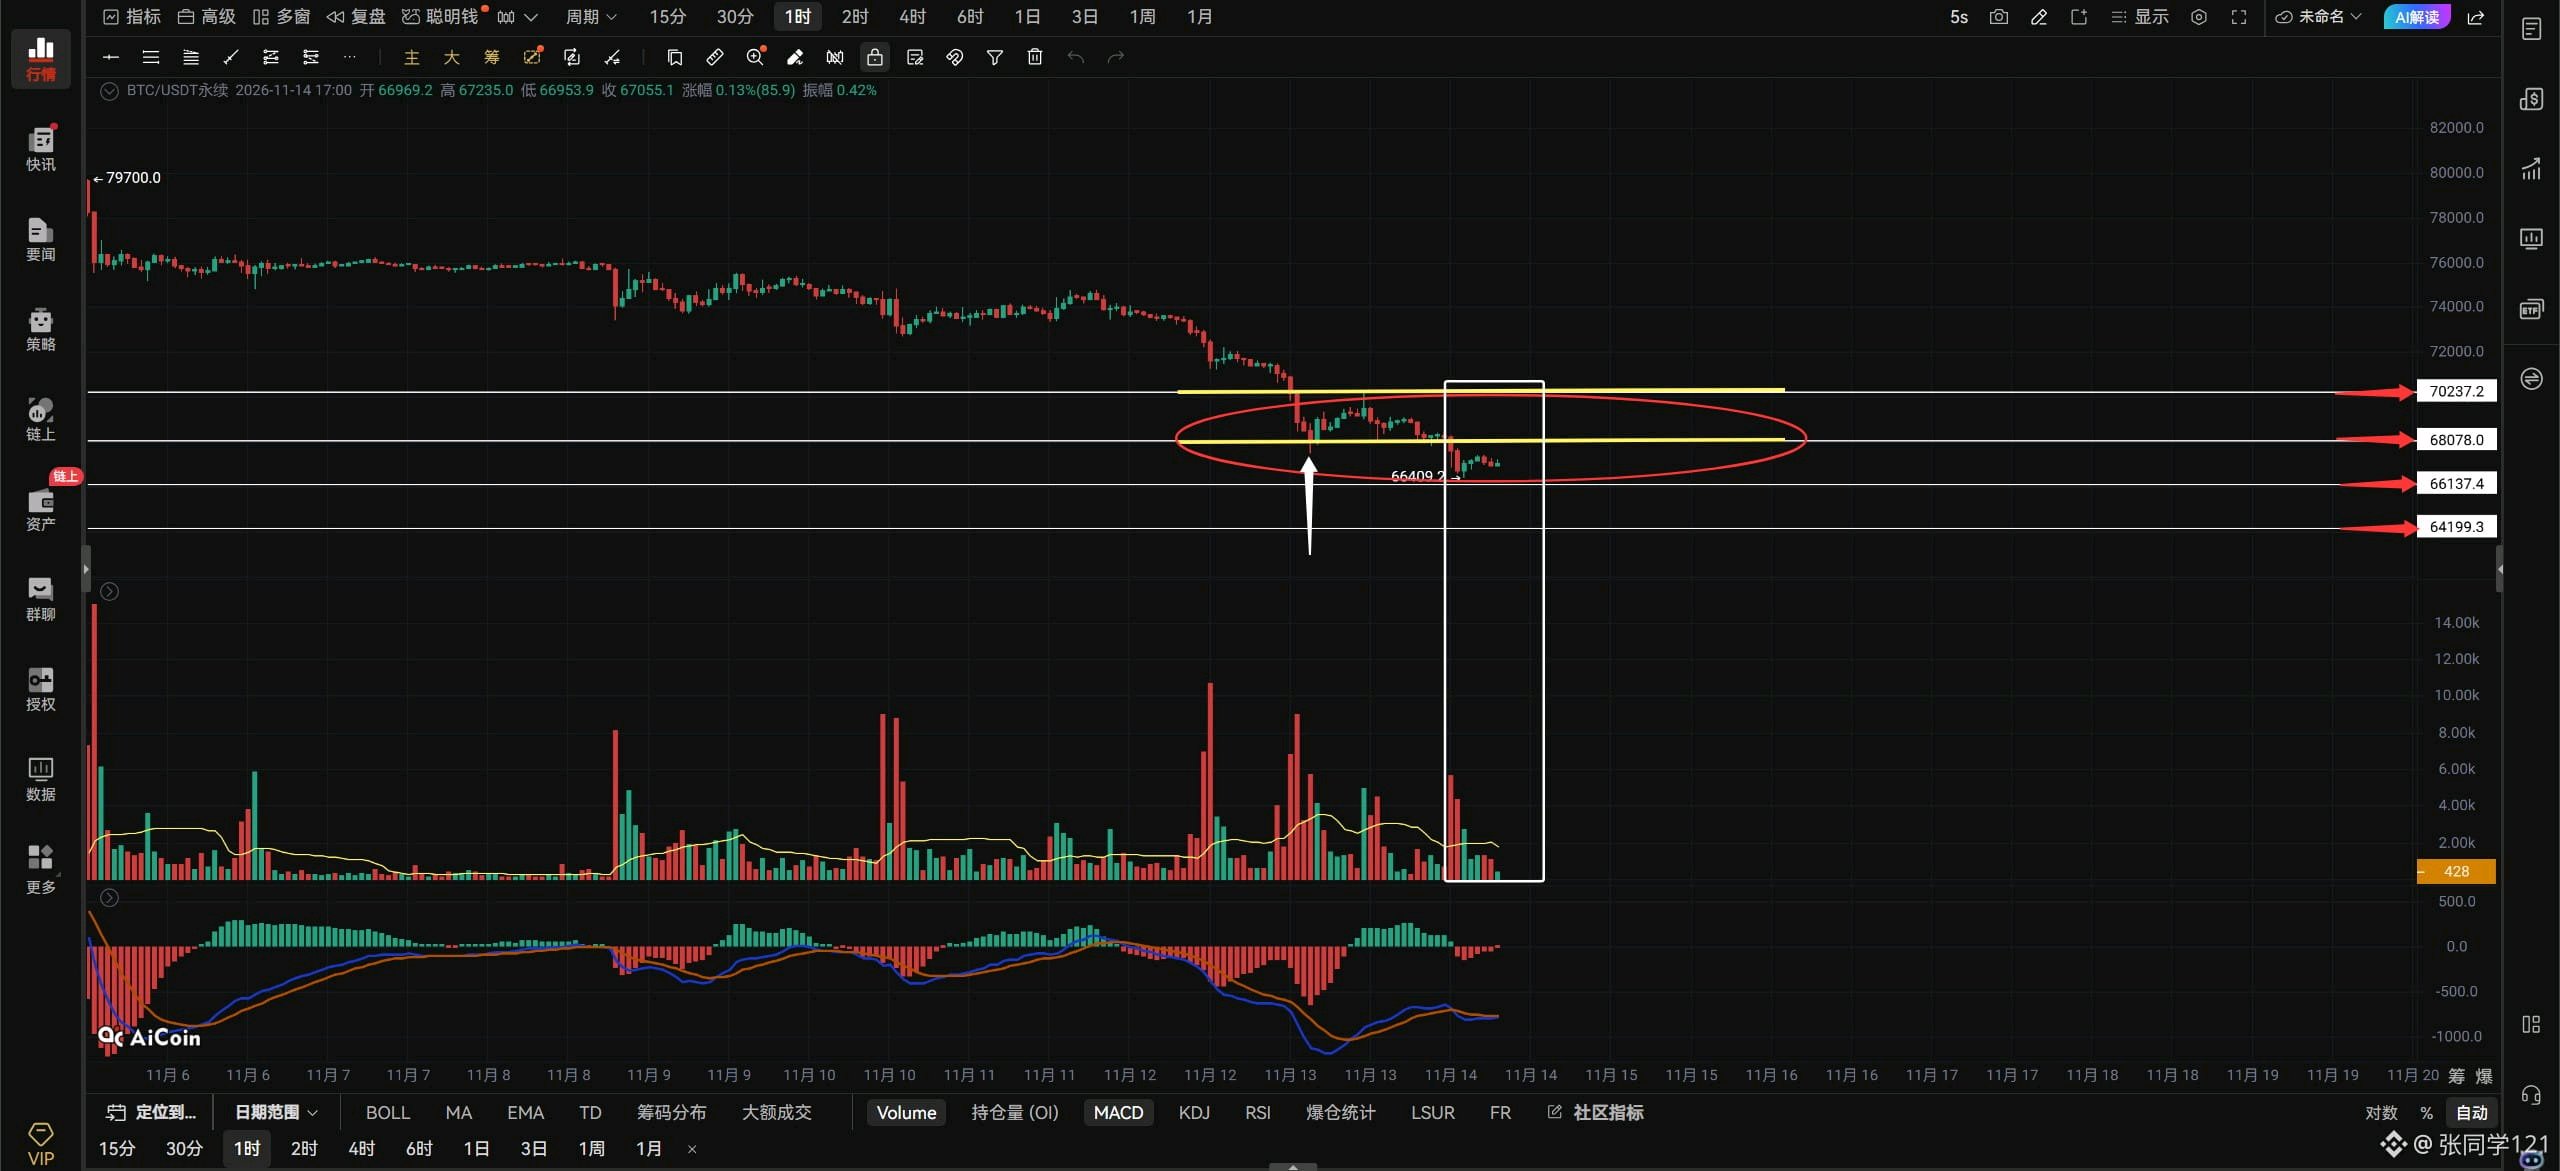
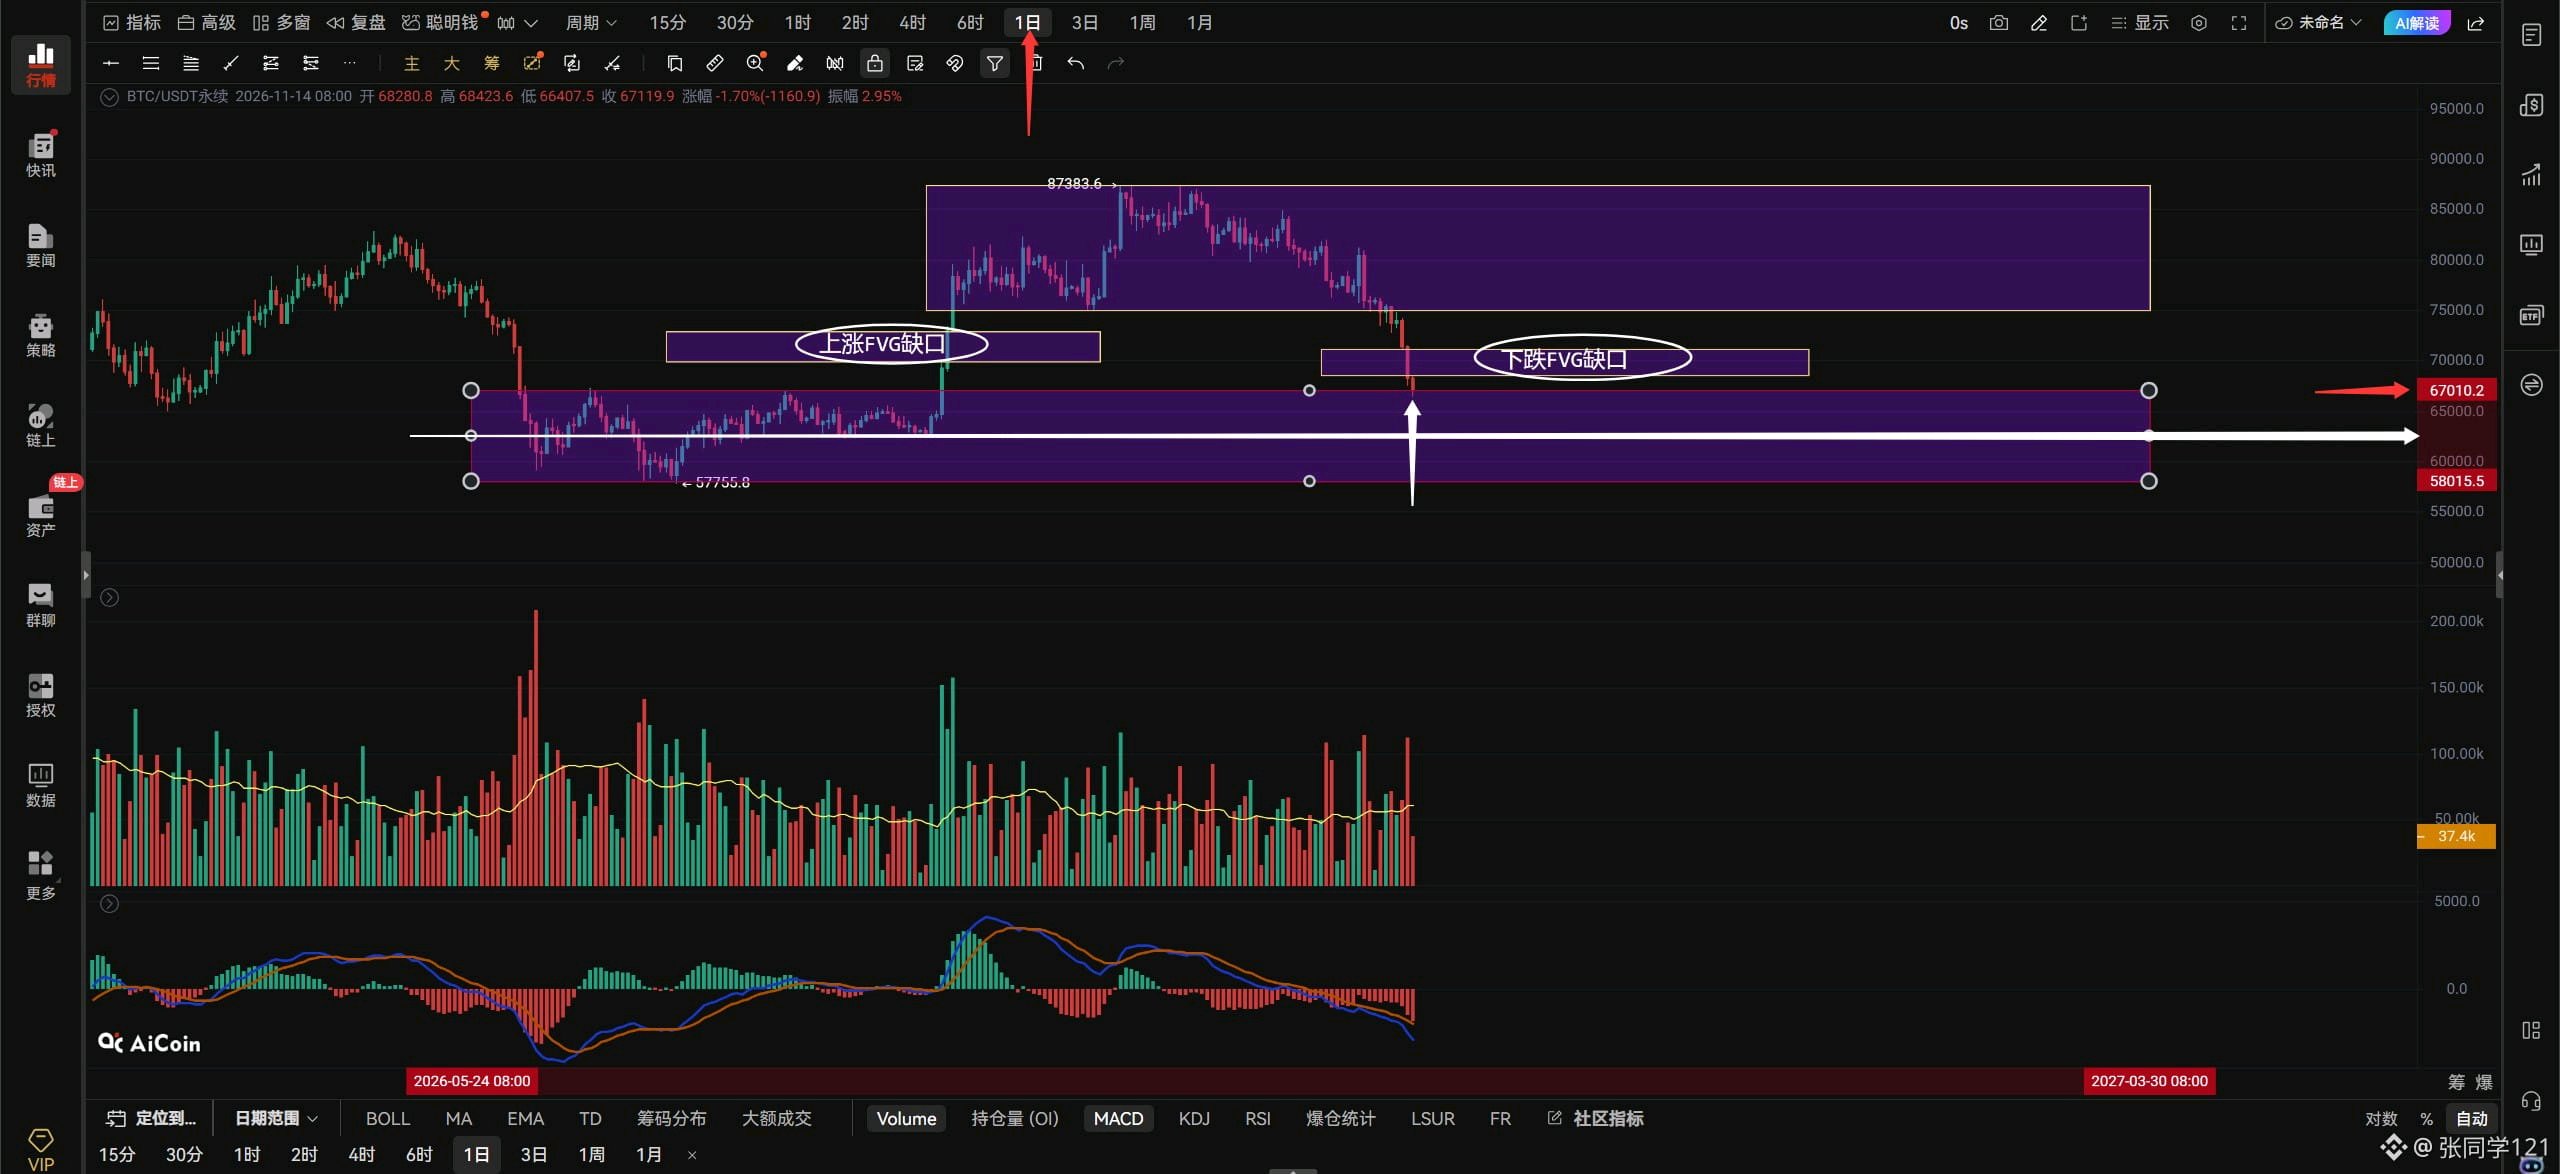
$BTCUSDT $BTC Evening outlook: 11/14. Bitcoin’s price action is heartbreaking 💔! It keeps making new lows—what is going on? Right now, Bitcoin is moving within the consolidation range marked by the red box, around 70237–66137. You can divide this range into two consolidation zones: the upper zone is 70237–68078, and the lower zone is 68078–66137. Bitcoin has now broken below the upper consolidation zone of 70237–68078 and returned to trading in the lower zone. When Bitcoin was consolidating in the upper zone, it meant that bulls at the current level were still operating in a strong range. Now that it’s back in the lower zone, the bulls have returned to a weak range and are moving sideways again. That’s not a good sign. Look at the volume below the candles marked by the white box: there’s volume on the way down, but volume is shrinking on the way up. How can Bitcoin rebound like this? It can’t even reclaim the previous low at 67400, indicated by the white arrow. To stop falling and rebound, it needs to get back above the previous low of 67400 and trade there. Only then can it find a bottom and rebound, with 68000–69000–70000 in view. If it can’t reclaim the previous low, simply holding a consolidation range of 66137–68078 would already be good. Just don’t let it fall below 66137; if it does, then 64199 is in sight. There’s no clear signal that it’s found a bottom, and it can’t get a rebound going. You don’t dare chase a short, and there’s no bottom signal for going long—what are you supposed to do? Stay on the sidelines! If you want to go long, wait for Bitcoin to retest the previous low without breaking below it and show a bottoming signal, then take a small short-term long position. Alternatively, wait for Bitcoin to break into the 67400–68000 resistance zone, then cautiously chase a small long on the right-hand side of the chart. If Bitcoin breaks above 67468 with volume, aggressive traders can chase a long on the right-hand side. If it rebounds to 68500, consider a small short on the left-hand side, with a stop-loss in place.Bitcoin breaks above and holds 67468 on the hourly chart, look for 68078–69000. There’s no point if it can’t get above 67468. If it breaks below 66733 on the 4-hour chart, look down to 66137–64199. The bullish FVG gap on the left side of Bitcoin’s daily chart has been completely filled, but there’s no sign of a bottom—instead, another bearish FVG gap has appeared on the right. The bearish FVG spans 68602–71190. Next, we’ll see whether tomorrow’s daily close can stay within that gap. If Bitcoin can get back inside it, the daily downtrend should stop. If it can’t close back inside, see that large daily consolidation range below, from 67010 to 58015? Price will move back within that range. The current daily candle has already pierced into it, which is dangerous. If tomorrow’s daily close can’t stay above 67000, then based on the range, the strongest support below is around the midpoint at 62000. Scary, huh? If things keep going like this, this market won’t be much fun. Meeting adjourned. #ByXIMPACT
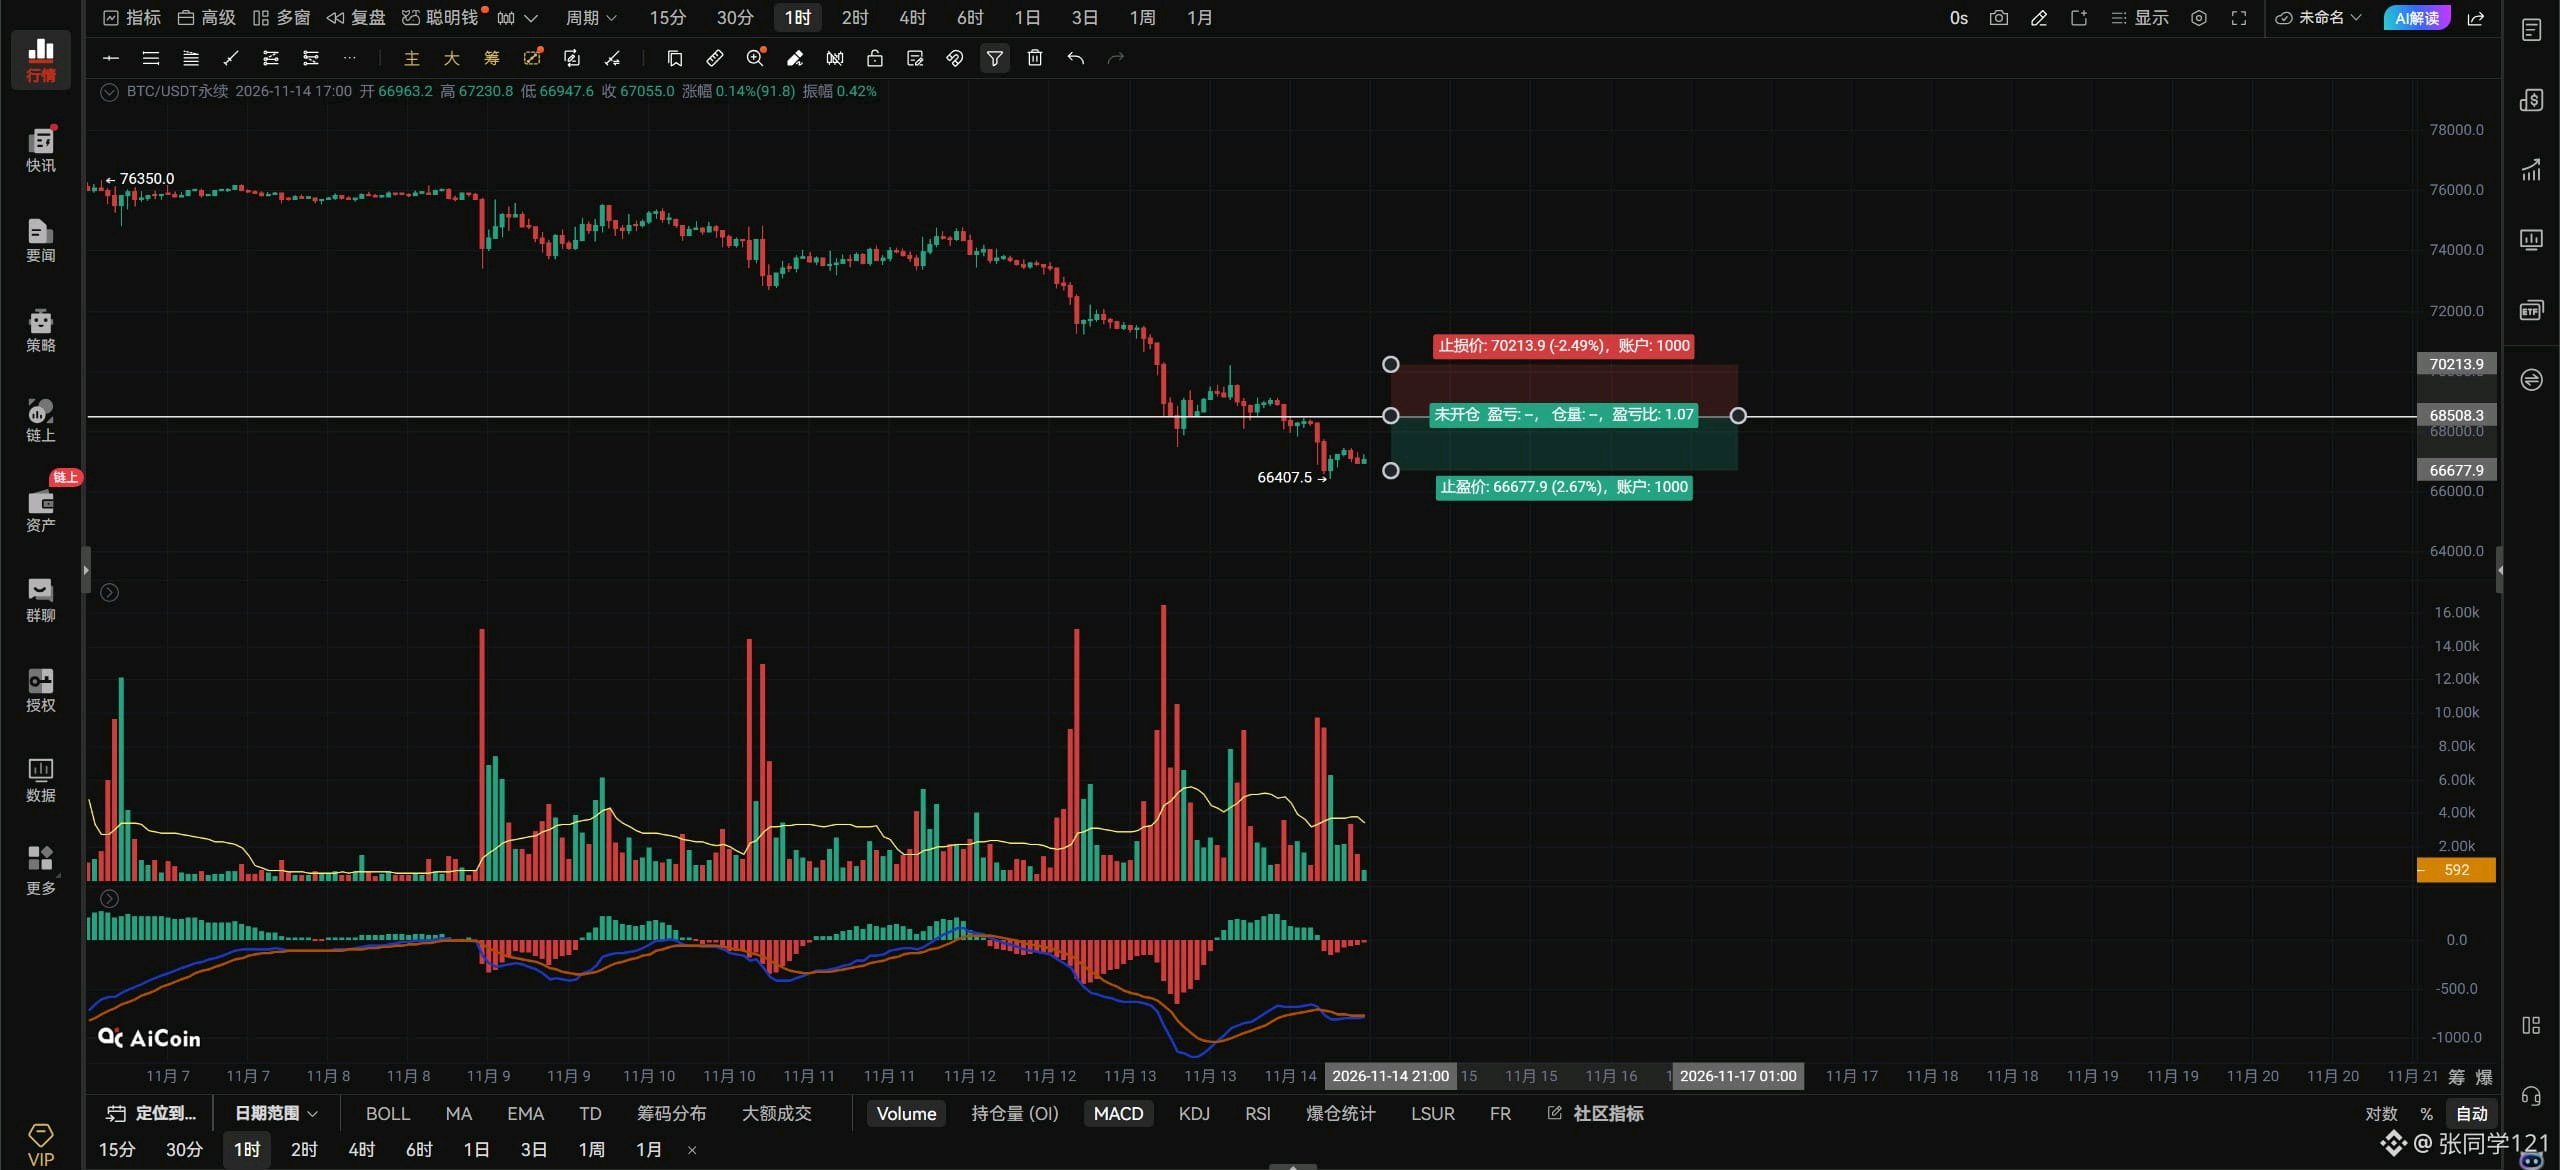
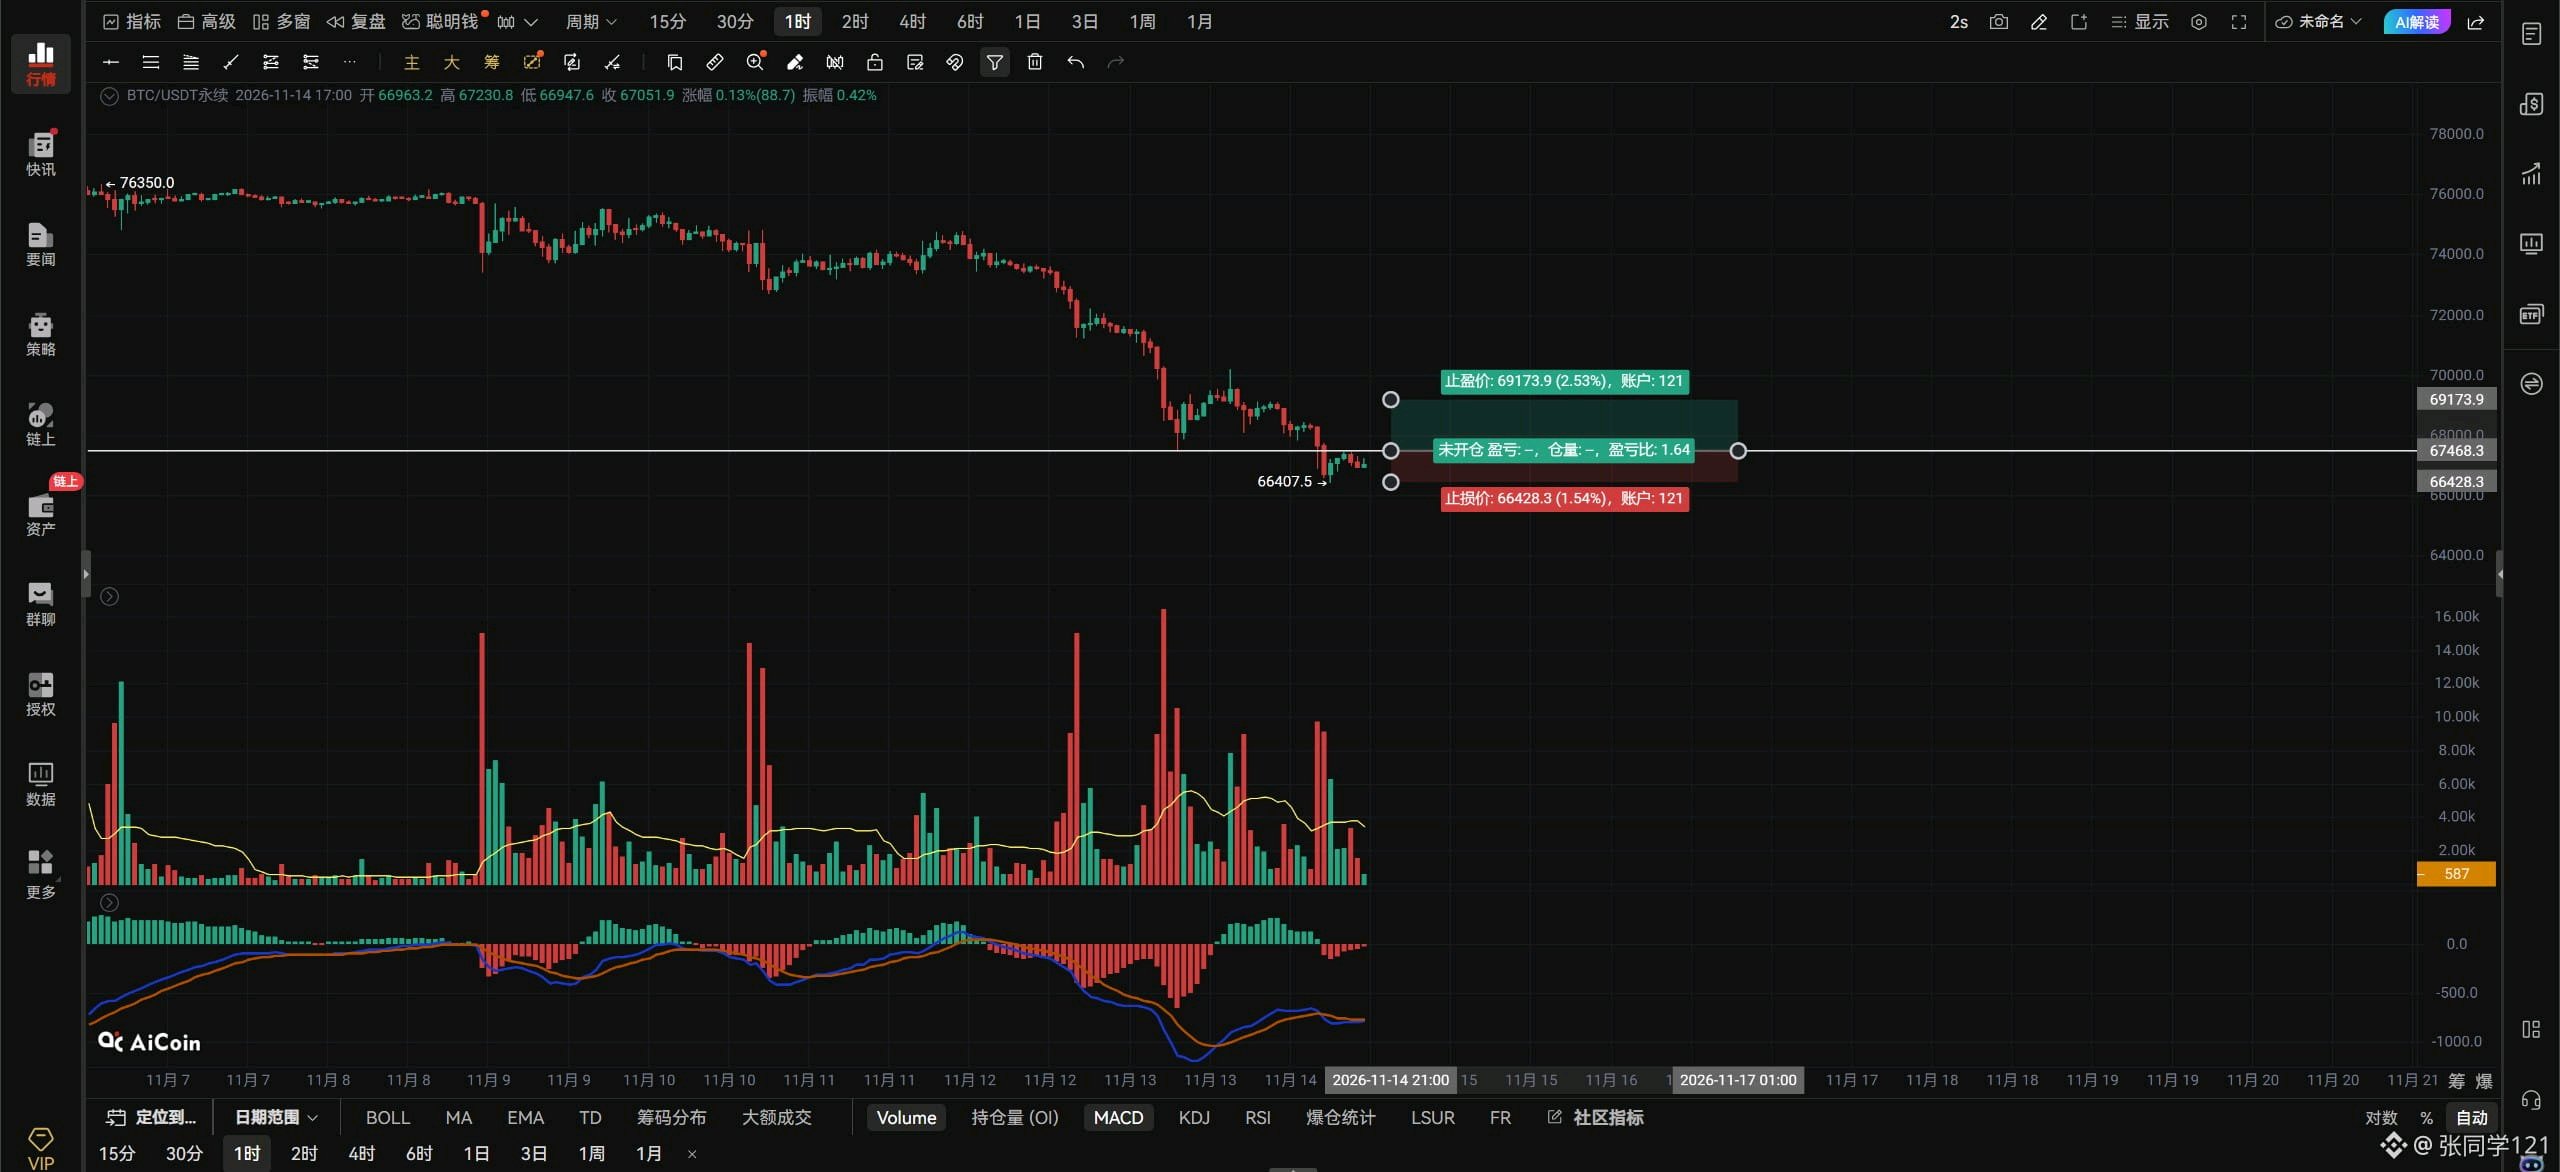
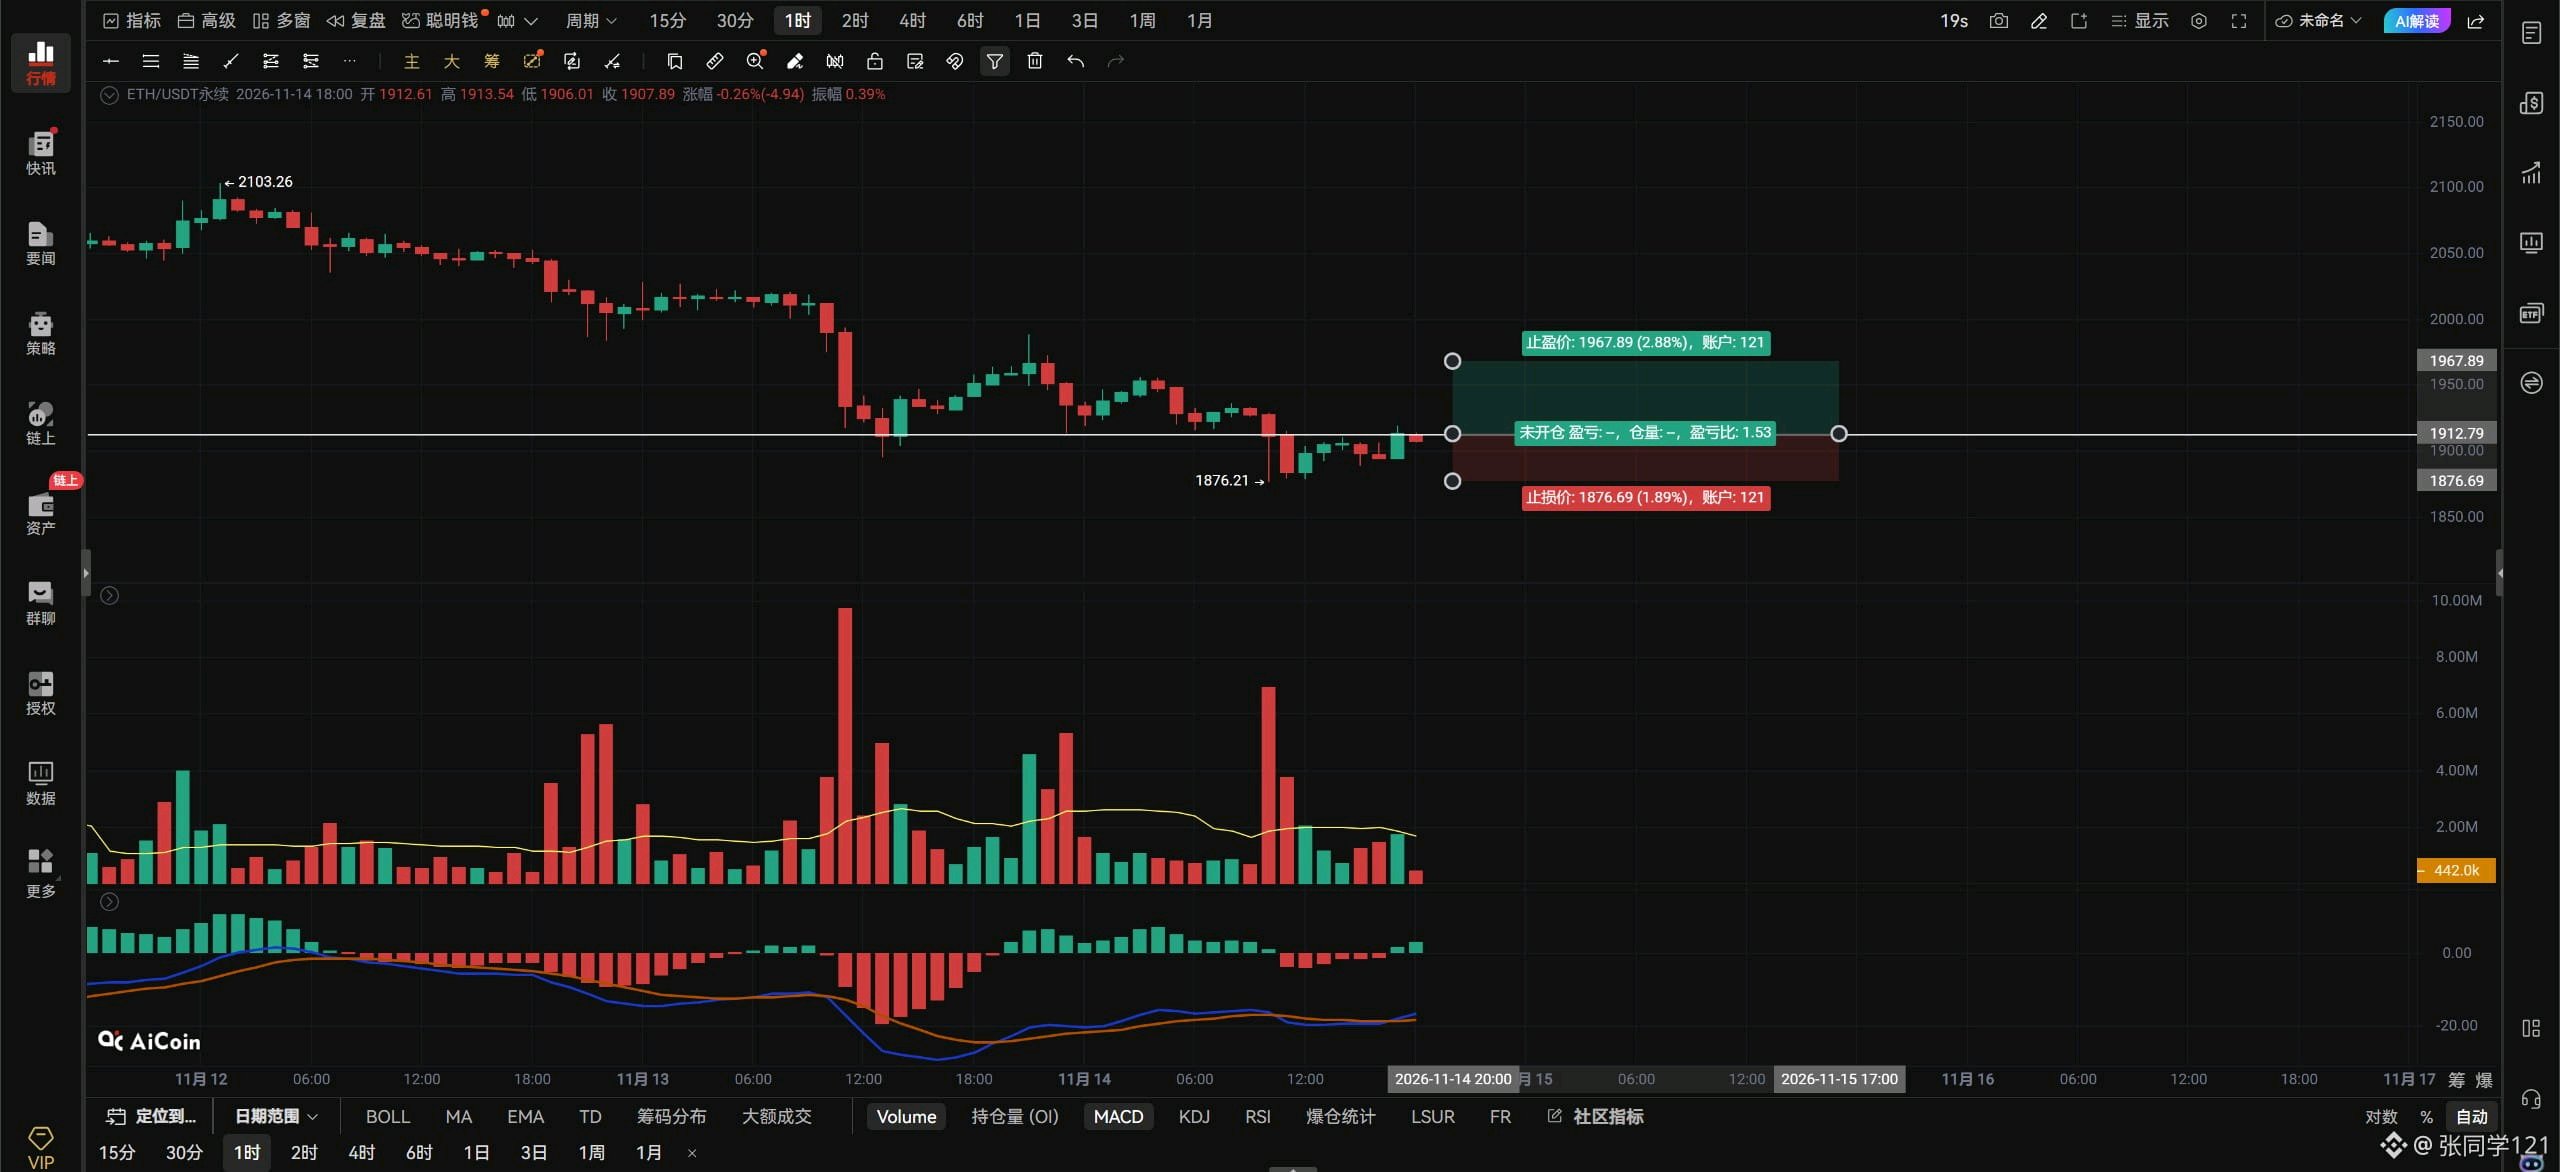
$ETHUSDT Perspectiva: Si ETH supera los 1933 con volumen, entra en largo en el lado derecho; mueve el stop-loss al punto de equilibrio. Si ETH cae por debajo de 1910 con volumen, entra en corto en el lado derecho; utiliza un stop-loss. Si el precio retrocede a 1861 y confirma soporte, entra en largo. Stop-loss si cae por debajo de 1821. Si ETH se mantiene por encima de 1933 en el gráfico horario, apunta a 1955–2003. Estate atento a que ETH alcance los 2003 para entrar en corto. Stop-loss si supera los 2046. Órdenes de mecha en el lado izquierdo: largo en 1800; stop-loss si cae por debajo de 1756. Resistencia arriba: 1933–1955–2003 Soporte abajo: 1910–1861–1821 En el marco temporal de 4 horas, una ruptura por debajo de 1910 apunta a 1861–1821. El triángulo de ETH se ha roto a la baja. La pregunta ahora es si ETH puede volver a entrar en el triángulo. Si lo hace, la consolidación entre 1910 y 1956 continuará. Si no puede, entonces 1800 es el siguiente objetivo. El soporte en 1861 probablemente se romperá. ETH necesita superar los 1956 para dejar de caer y rebotar hacia los 2000; si no puede superar los 1956, solo podrá seguir probando niveles más bajos. Personalmente, creo que veremos un rebote decente solo cuando alcance los 1800. Sesión cerrada.#ByXIMPACT
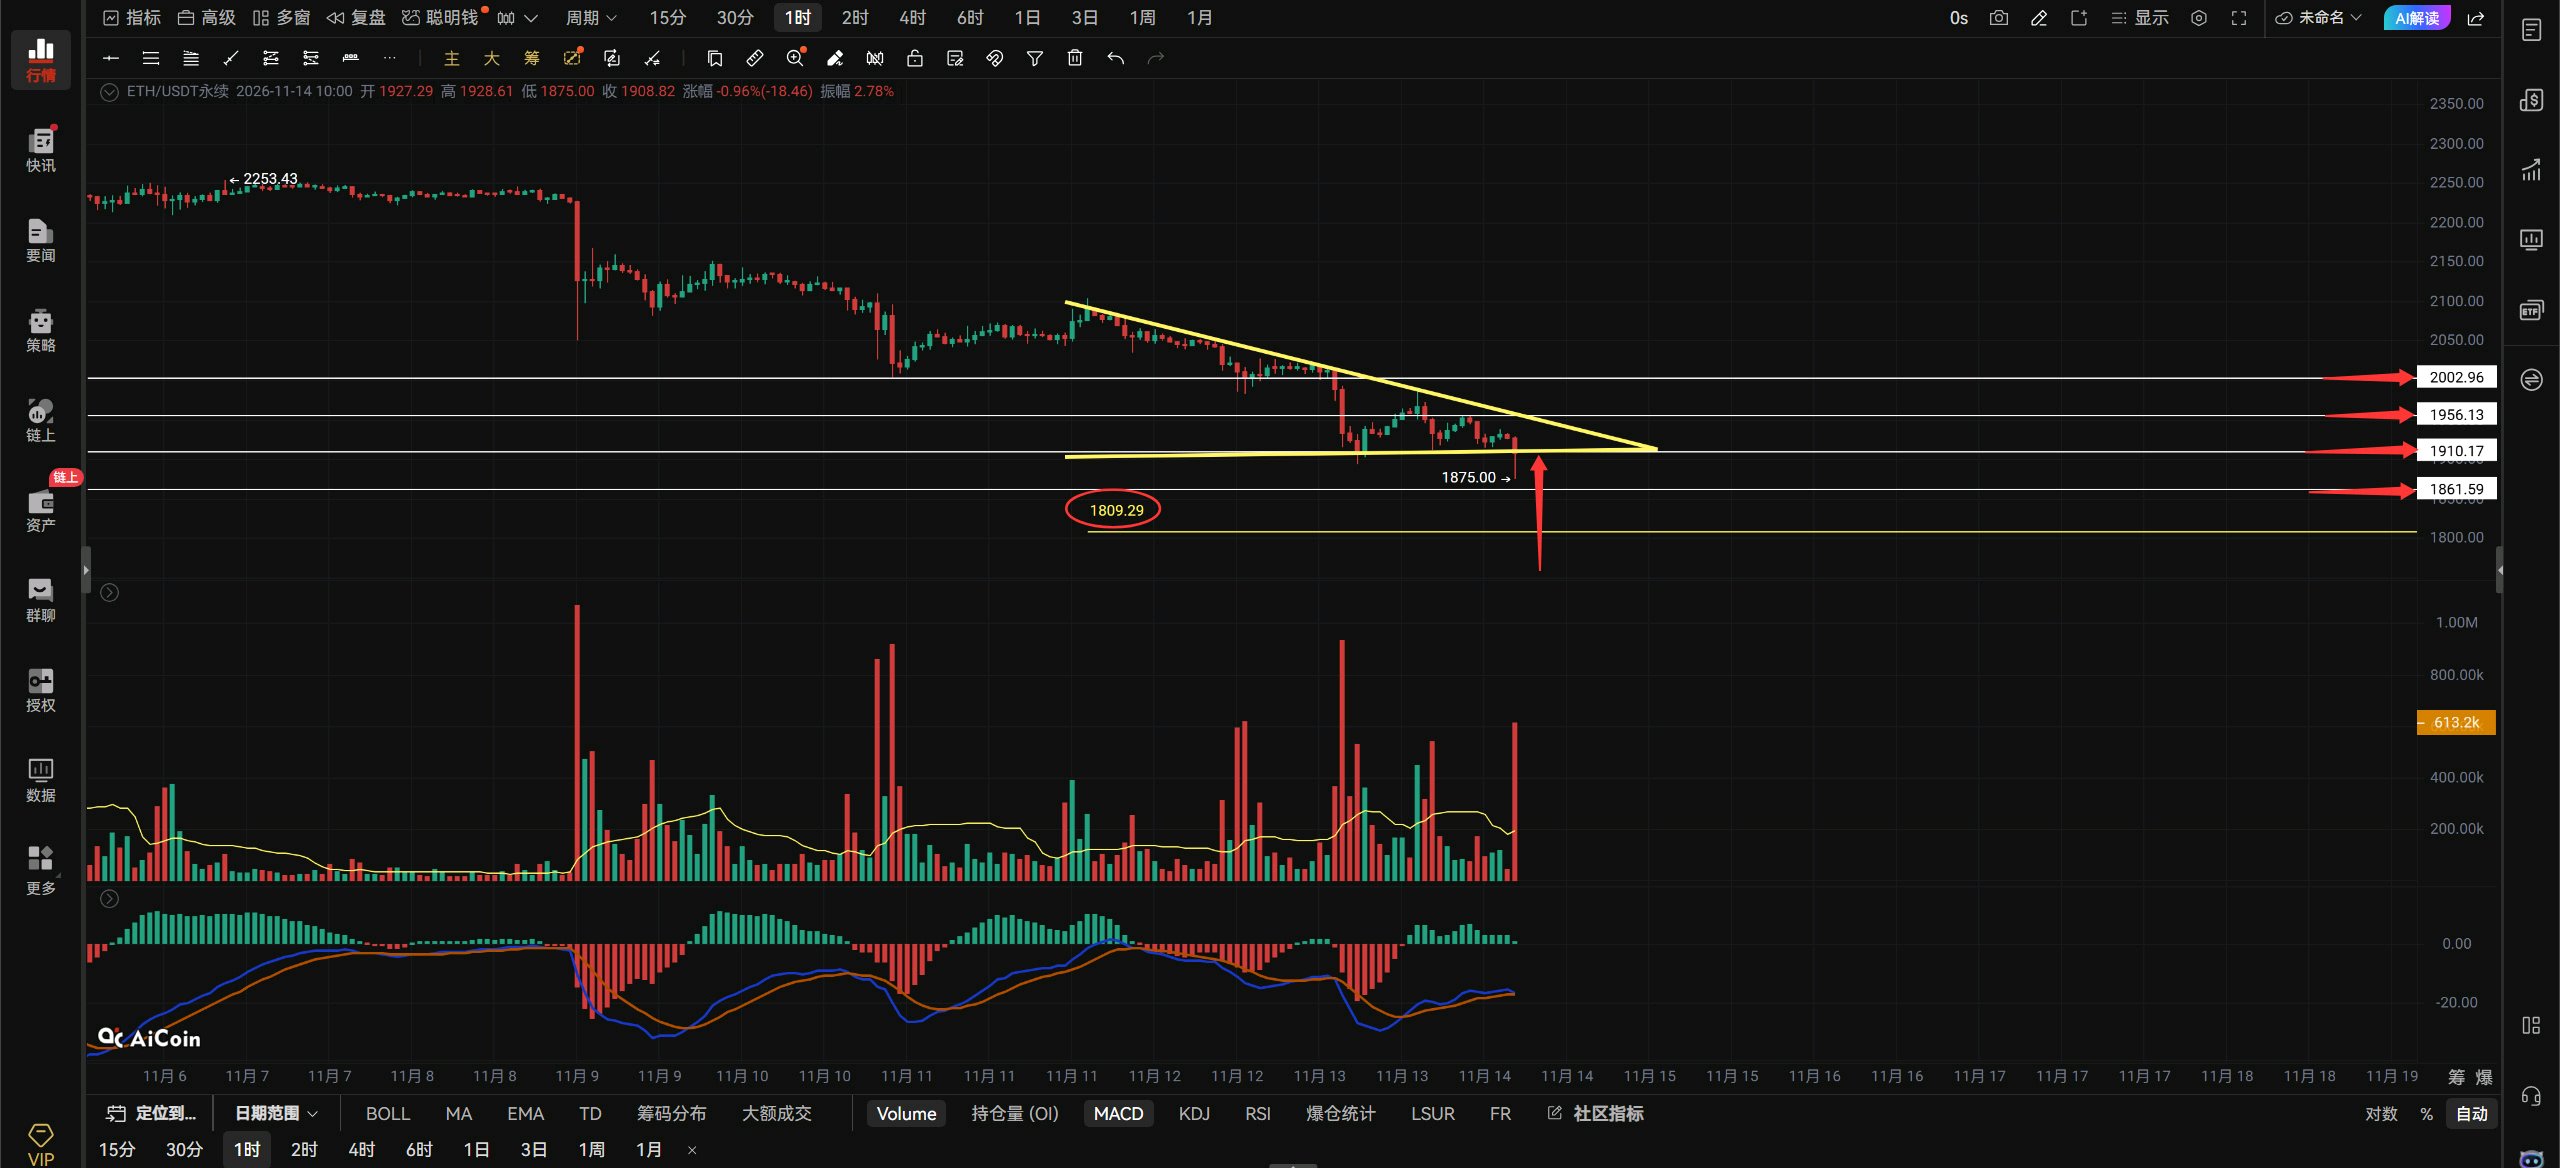
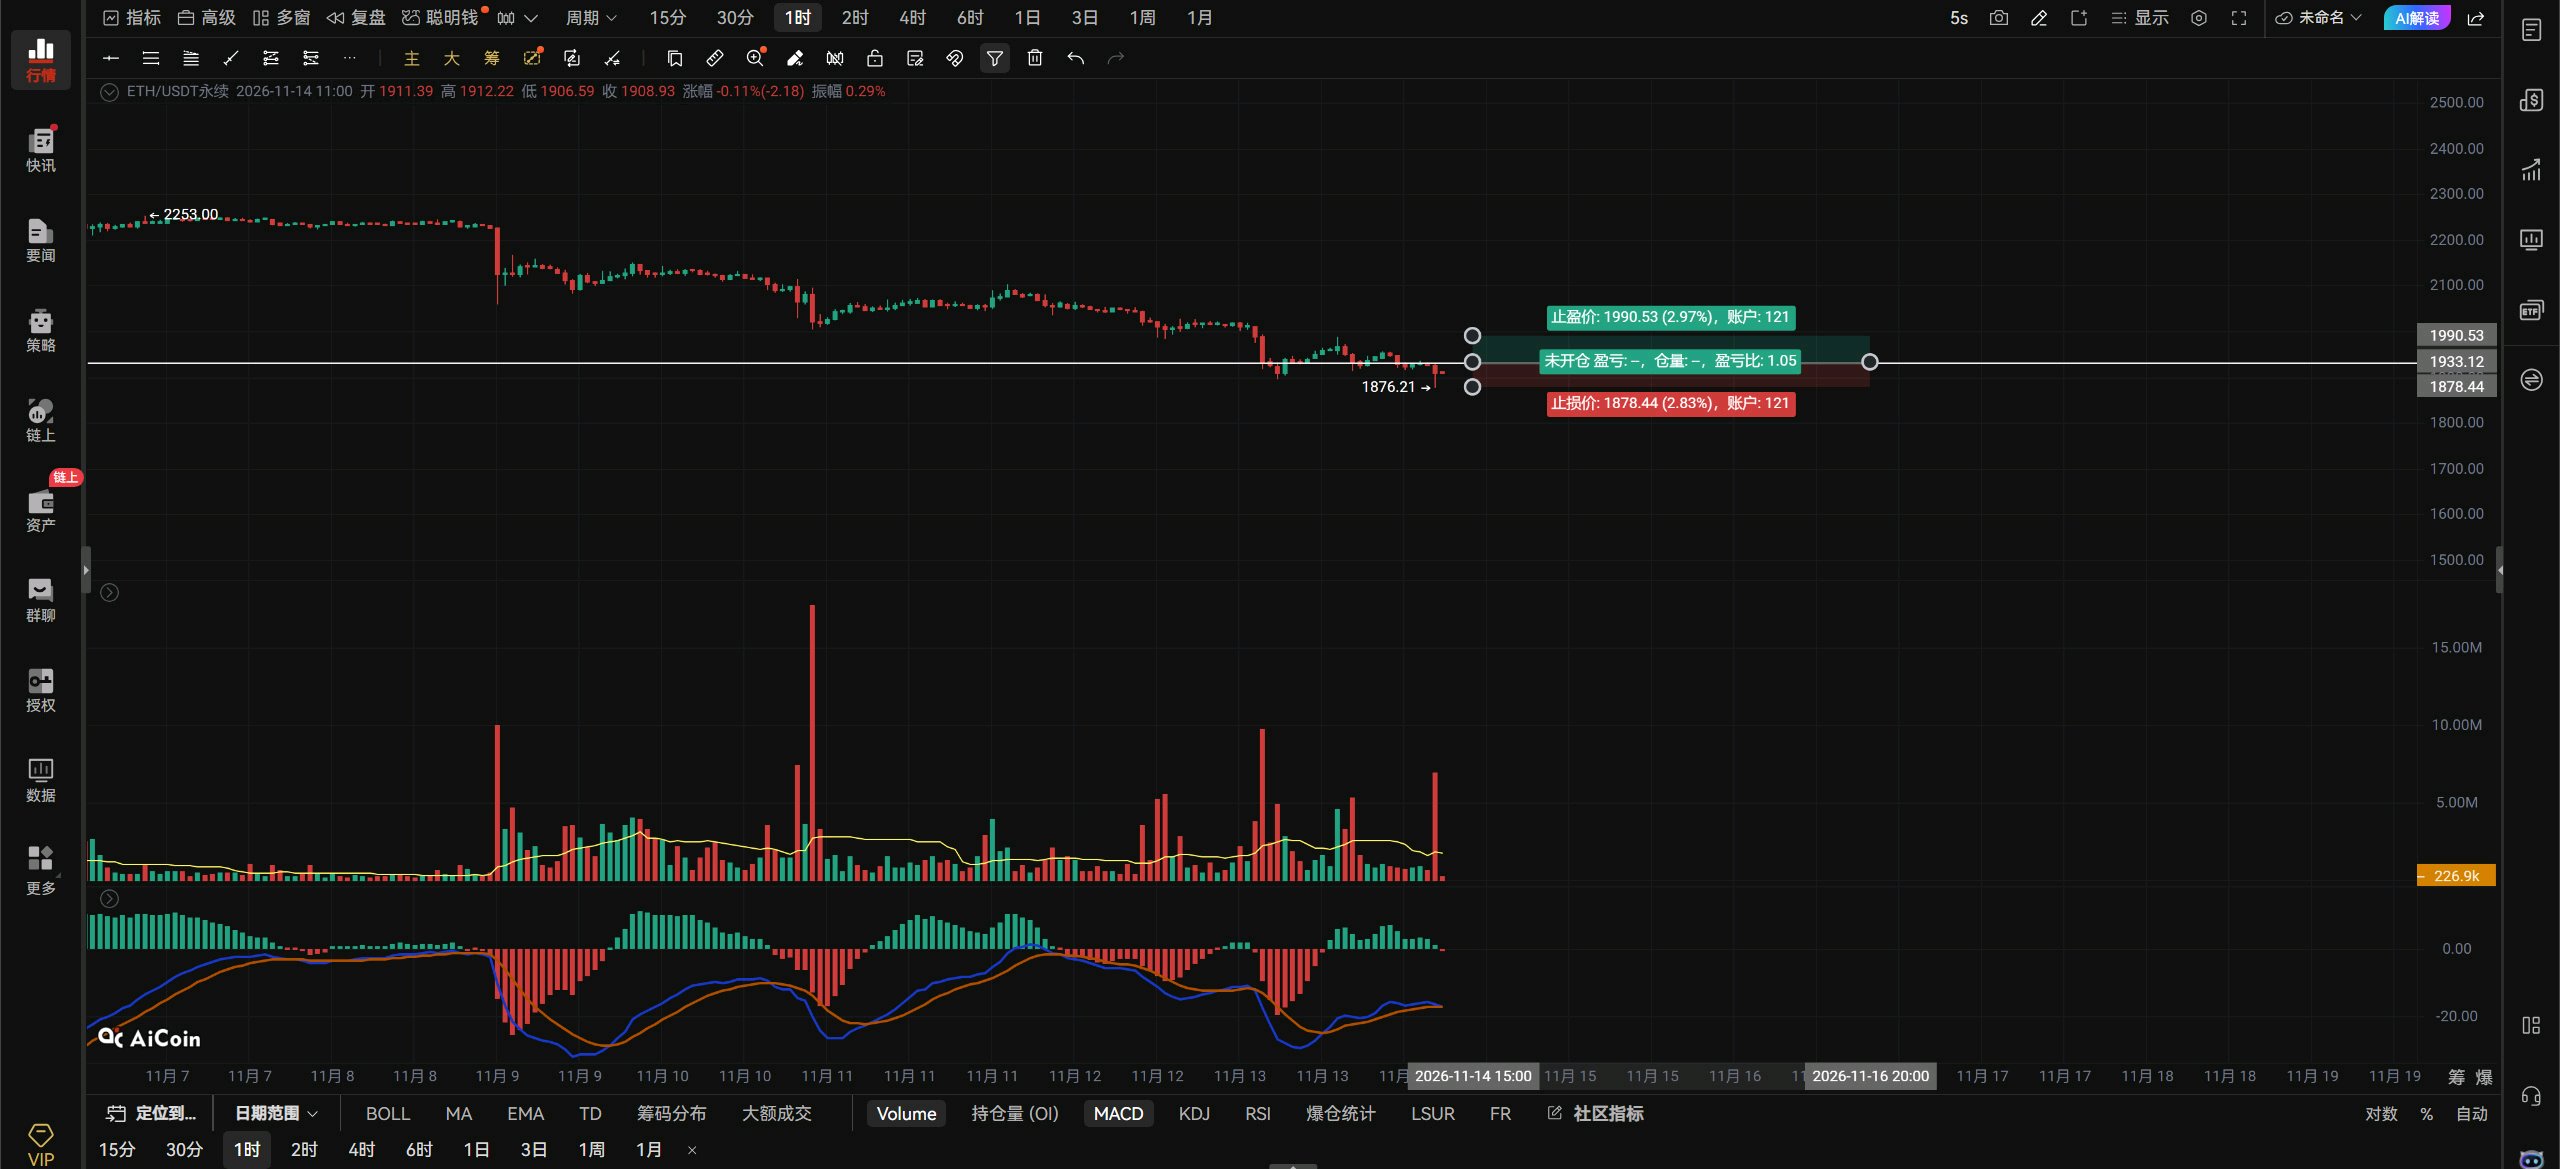
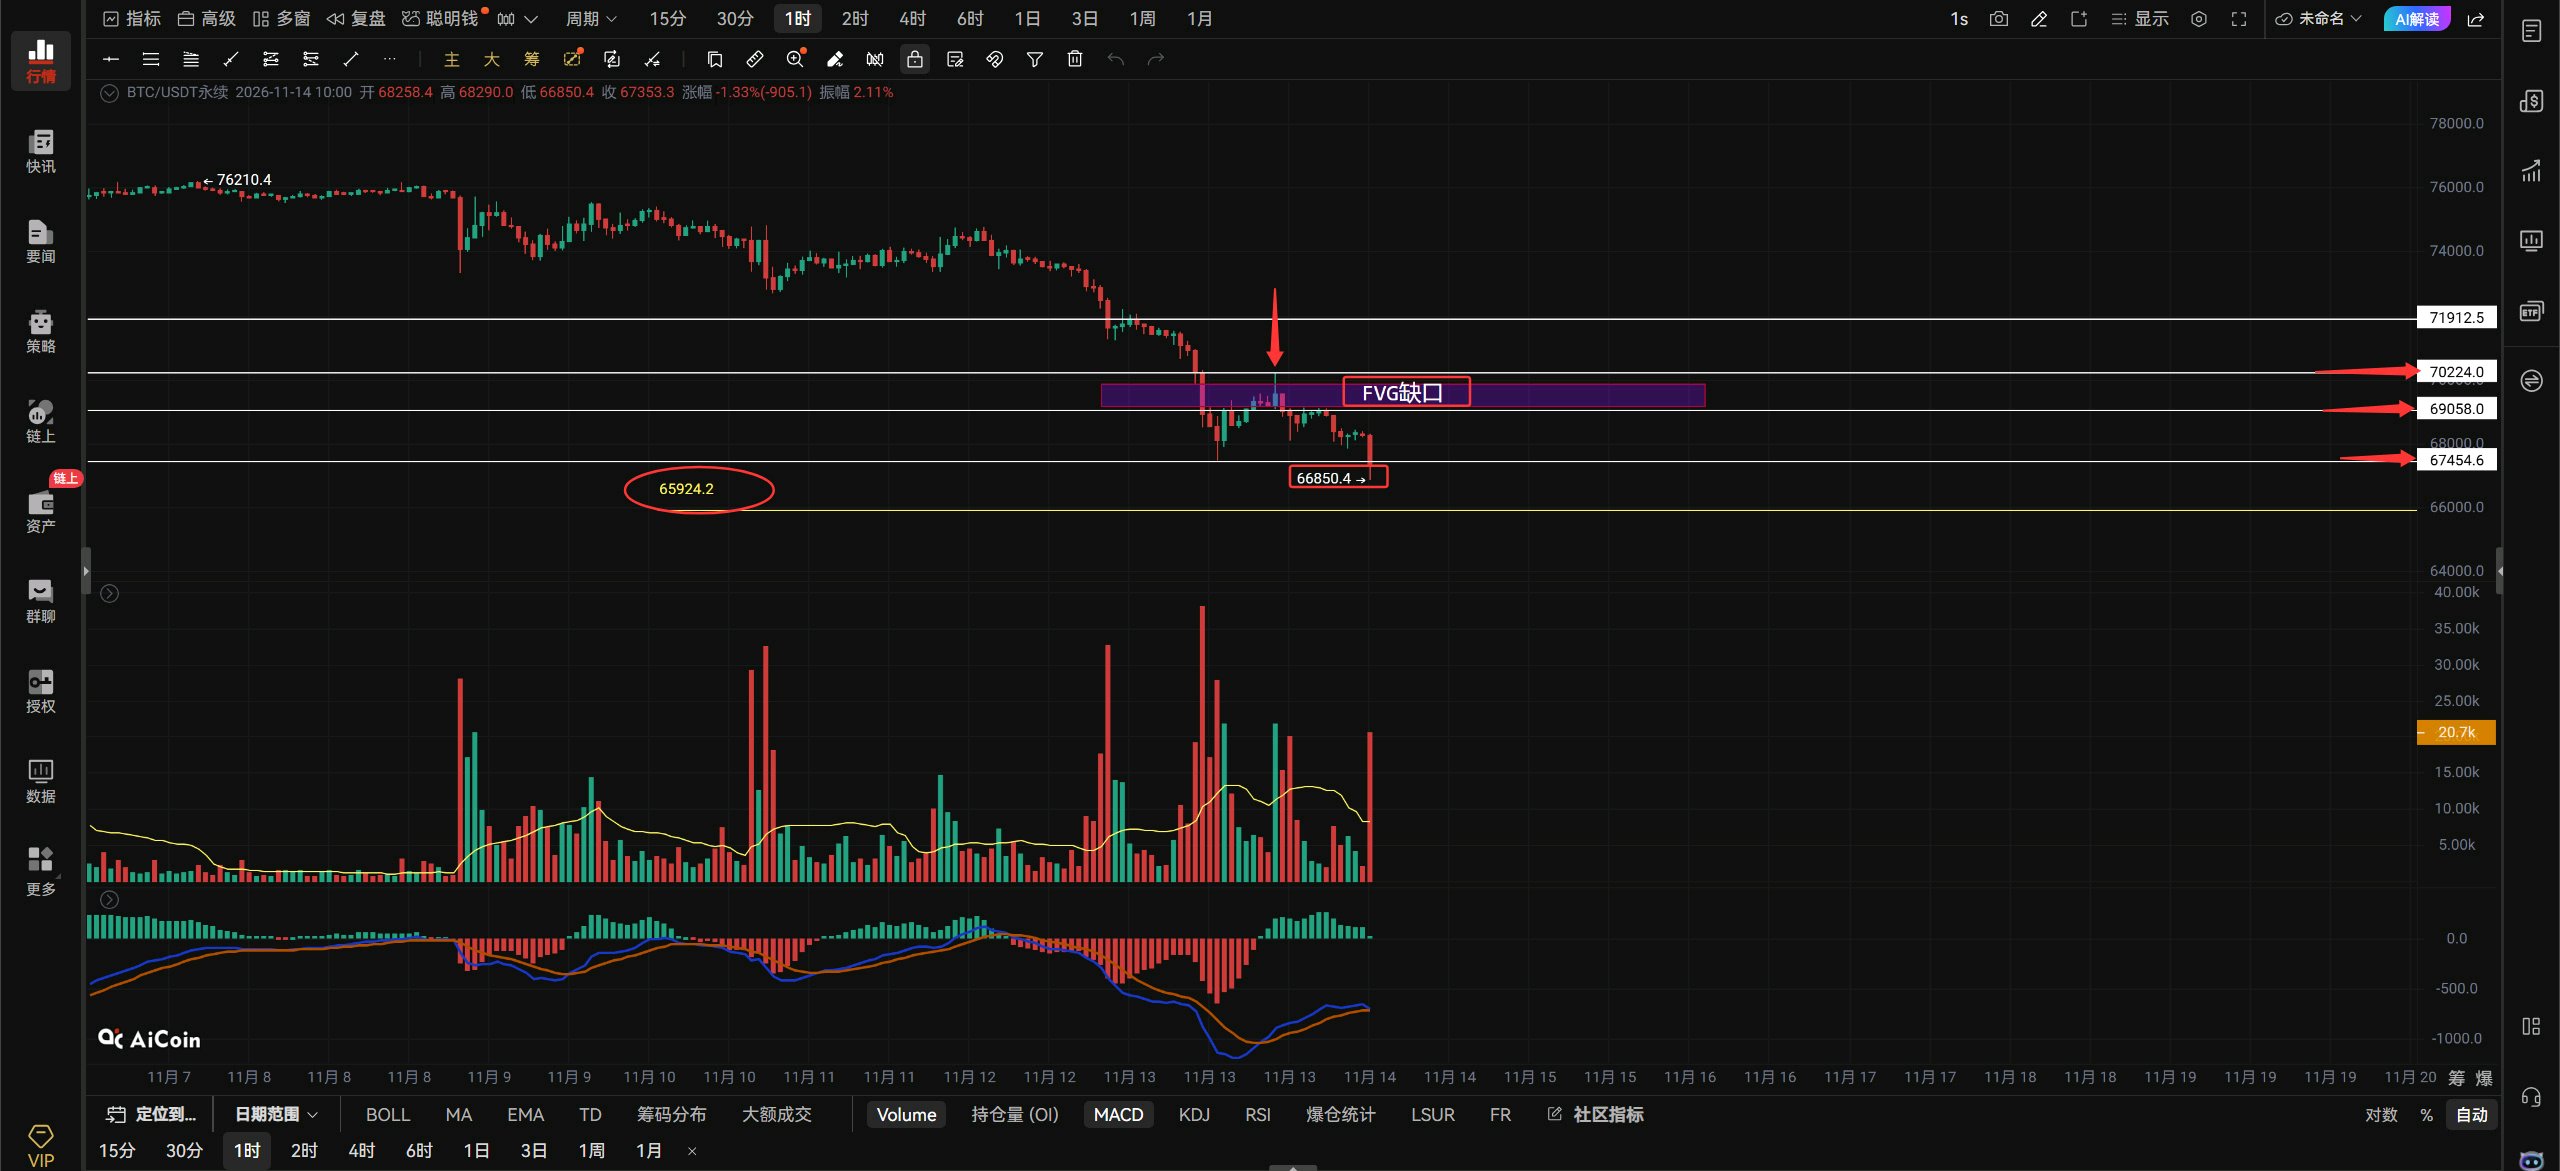
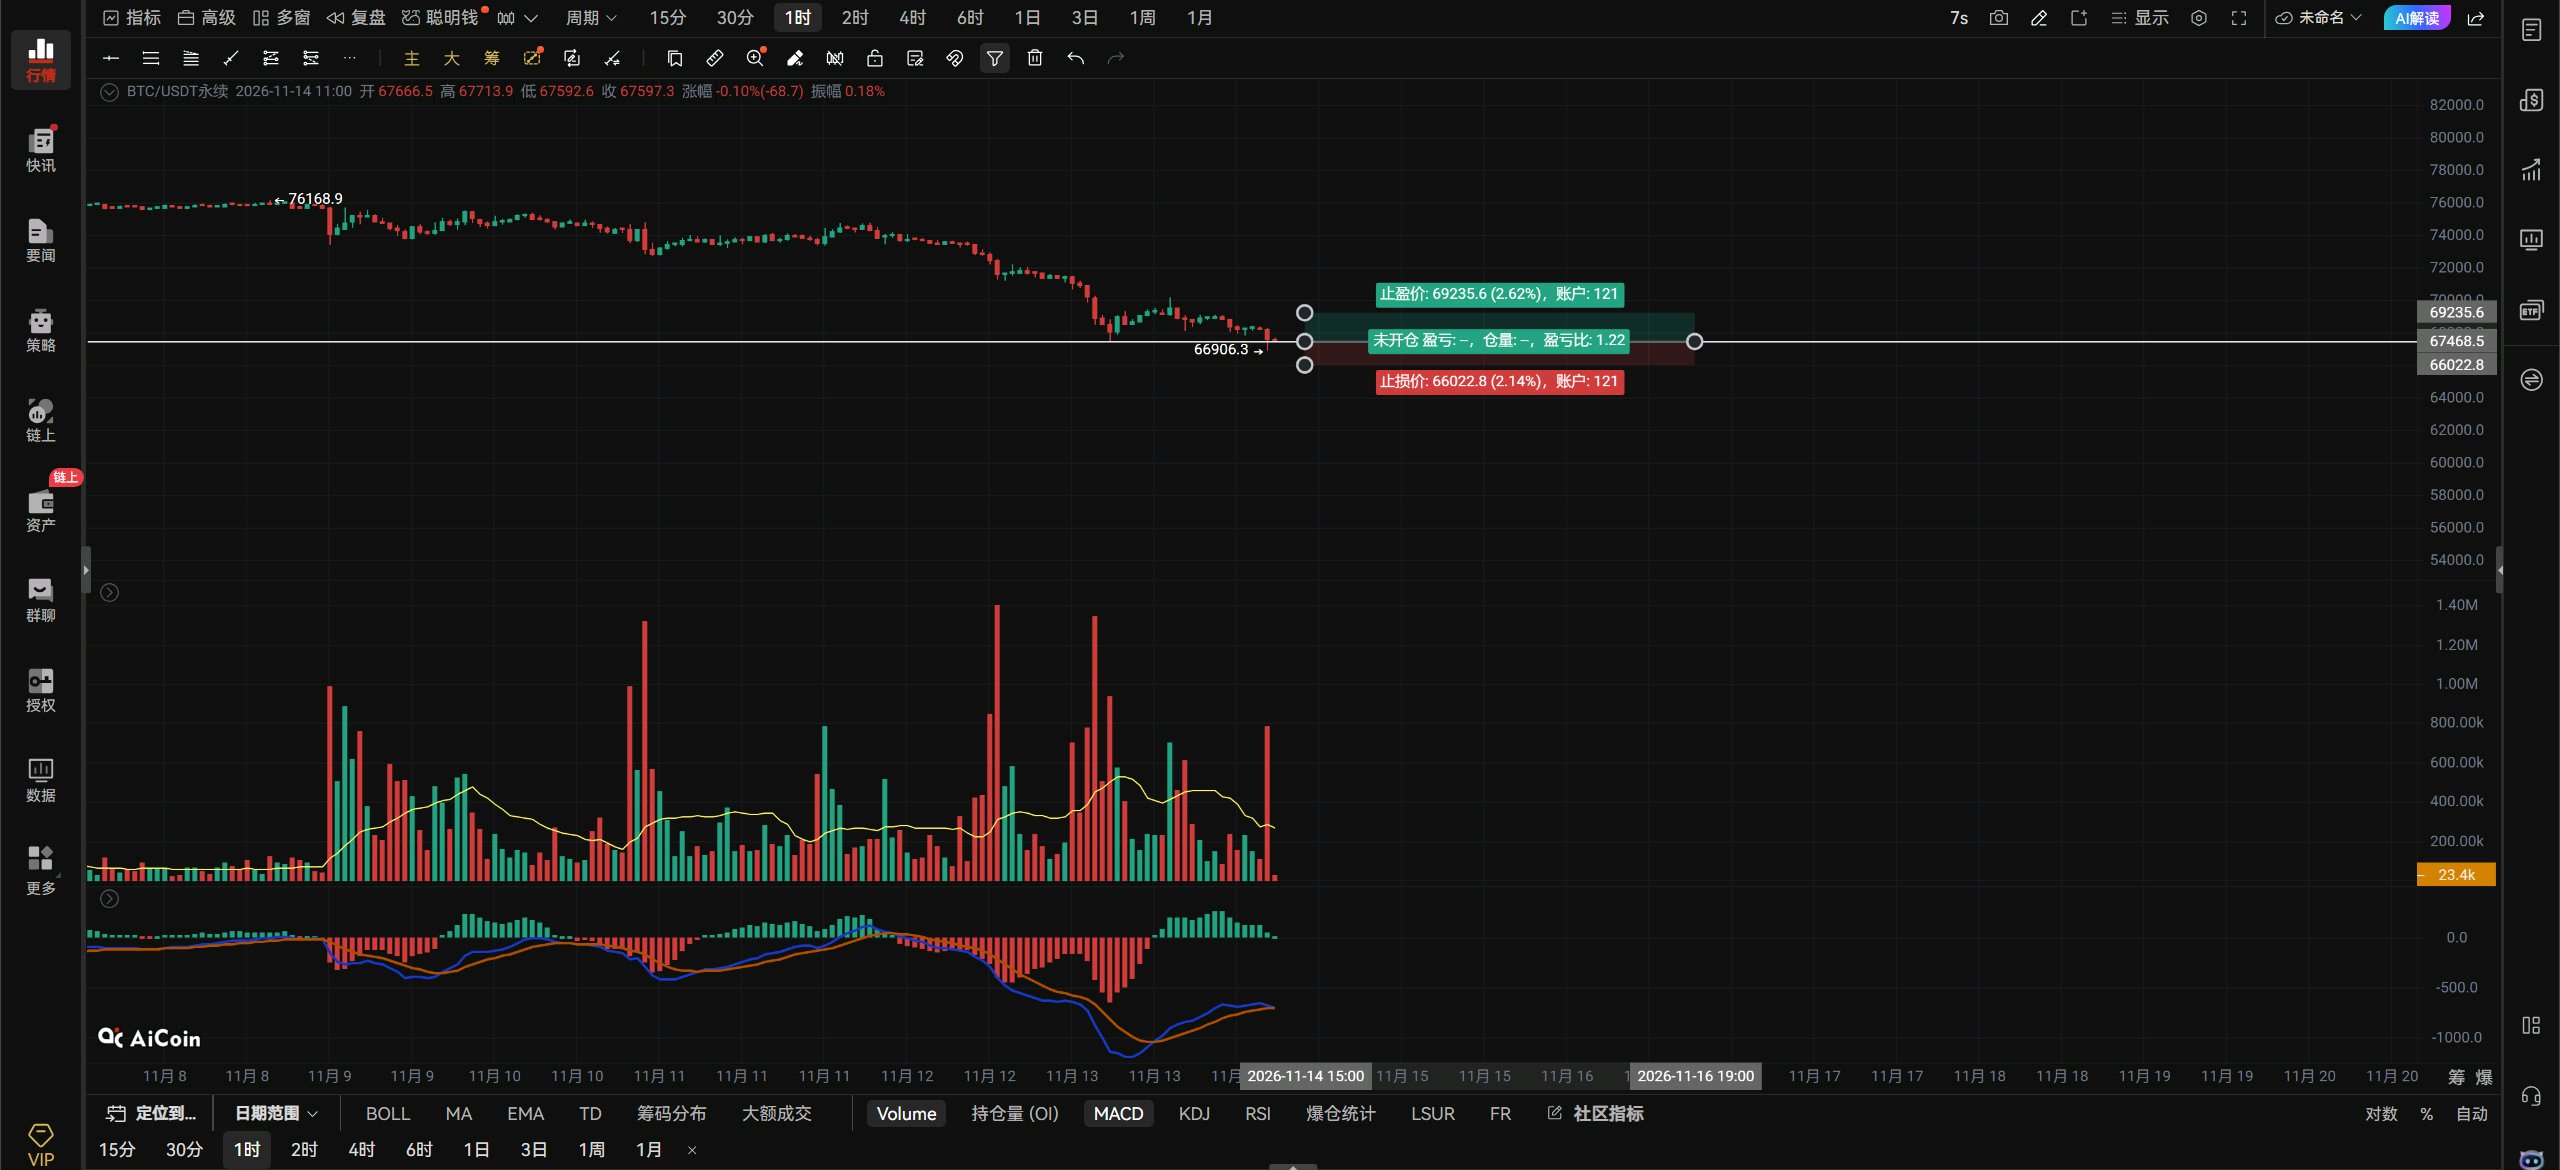
$BTCUSDT 11.14 Midday Market Outlook.🌿 $BTC Outlook: BTC made a low of 67454 yesterday and then started to rebound, filling the FVG gap above. However, the rebound failed to break through the resistance at 70224 or hold above the support at 69058. You could say this rebound was very weak. It then pulled back, broke below 69058 and the previous low, and just made another new low. That’s a new low every day! Now we’ll see whether BTC made this new low to sweep the liquidity at 67454 or is actually looking to continue falling. A sweep of the liquidity at 67454 would be acceptable; if it’s really heading down, then look to the 65924 support below. How can we tell whether it’s sweeping liquidity at 67454 or genuinely falling? Watch to see whether the hourly bearish candle currently in progress can reclaim and hold above 67454 after making a new low. If it can, that’s a liquidity sweep; if it can’t reclaim 67454, then it could fall further. Hopefully this is BTC’s last drop! If BTC can reclaim and hold above 67454, you can take a long for a rebound. Reclaiming and holding above 67454 would also set up a consolidation range between 67454 and 69058, with a chance to challenge 70224. If it can’t reclaim it, then things are looking pretty bleak. If BTC breaks above 67454 with volume, aggressive traders can chase the long on the right side. If it rebounds to 70224, take a short on the left side; use a stop-loss. If BTC breaks above 67454 and holds there on the hourly chart, look toward 69058–70224. If it can’t get above 67454, that’s no good. If BTC breaks below 67454 on the 4-hour chart, look down toward 65924–64421. Resistance above: 69058–70224–71904 Support below: 67454–65924–64421 #ByXIMPACT
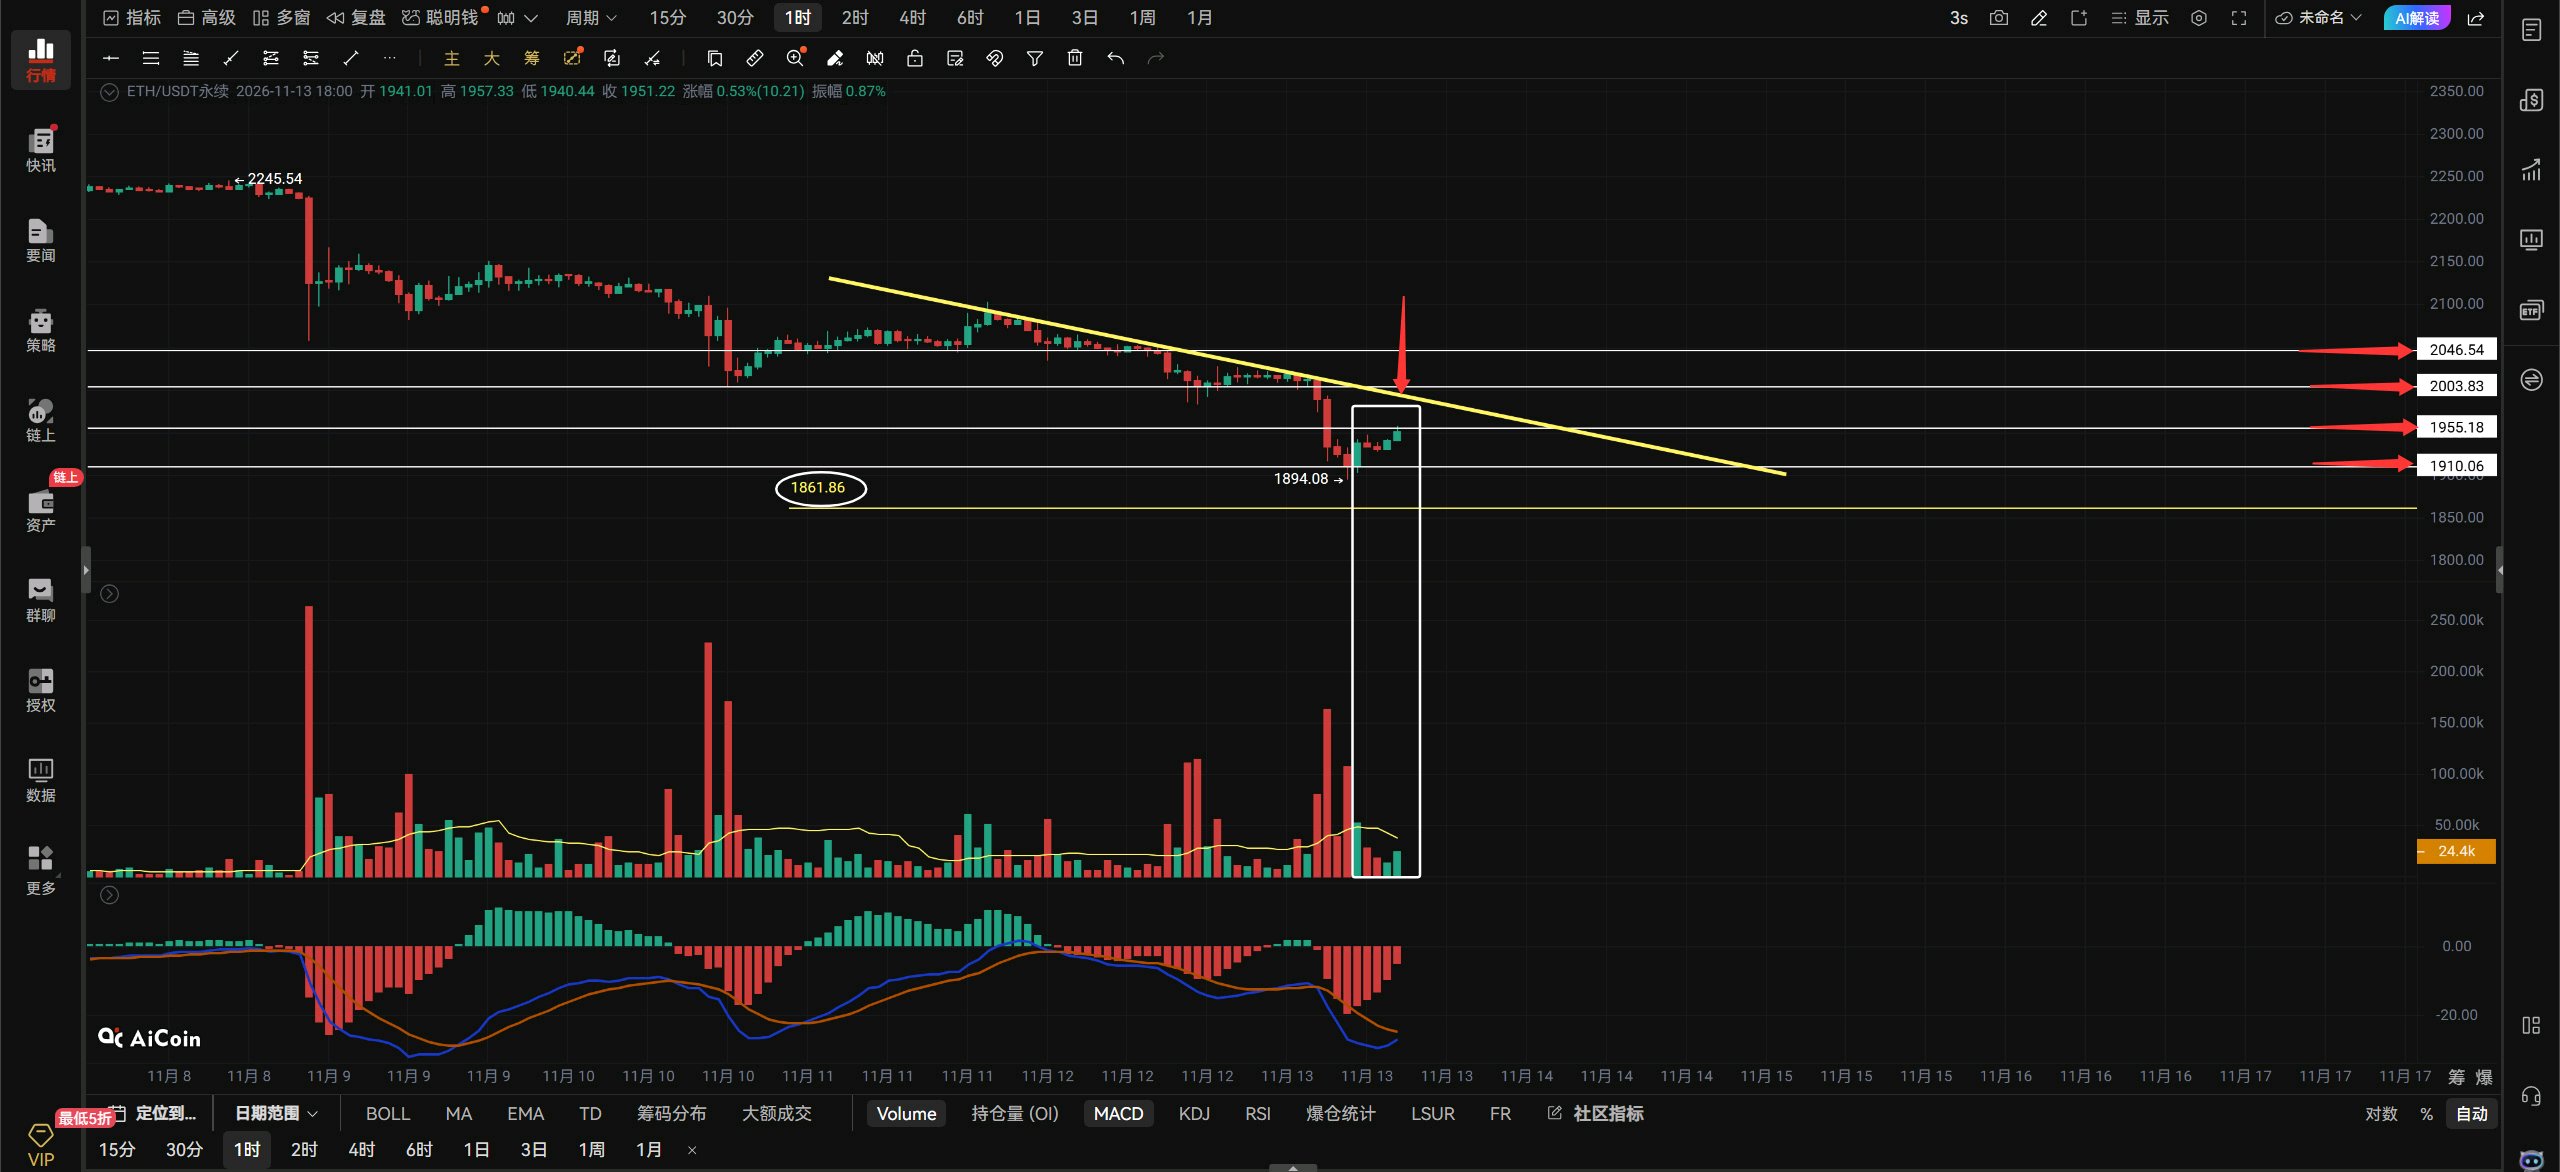
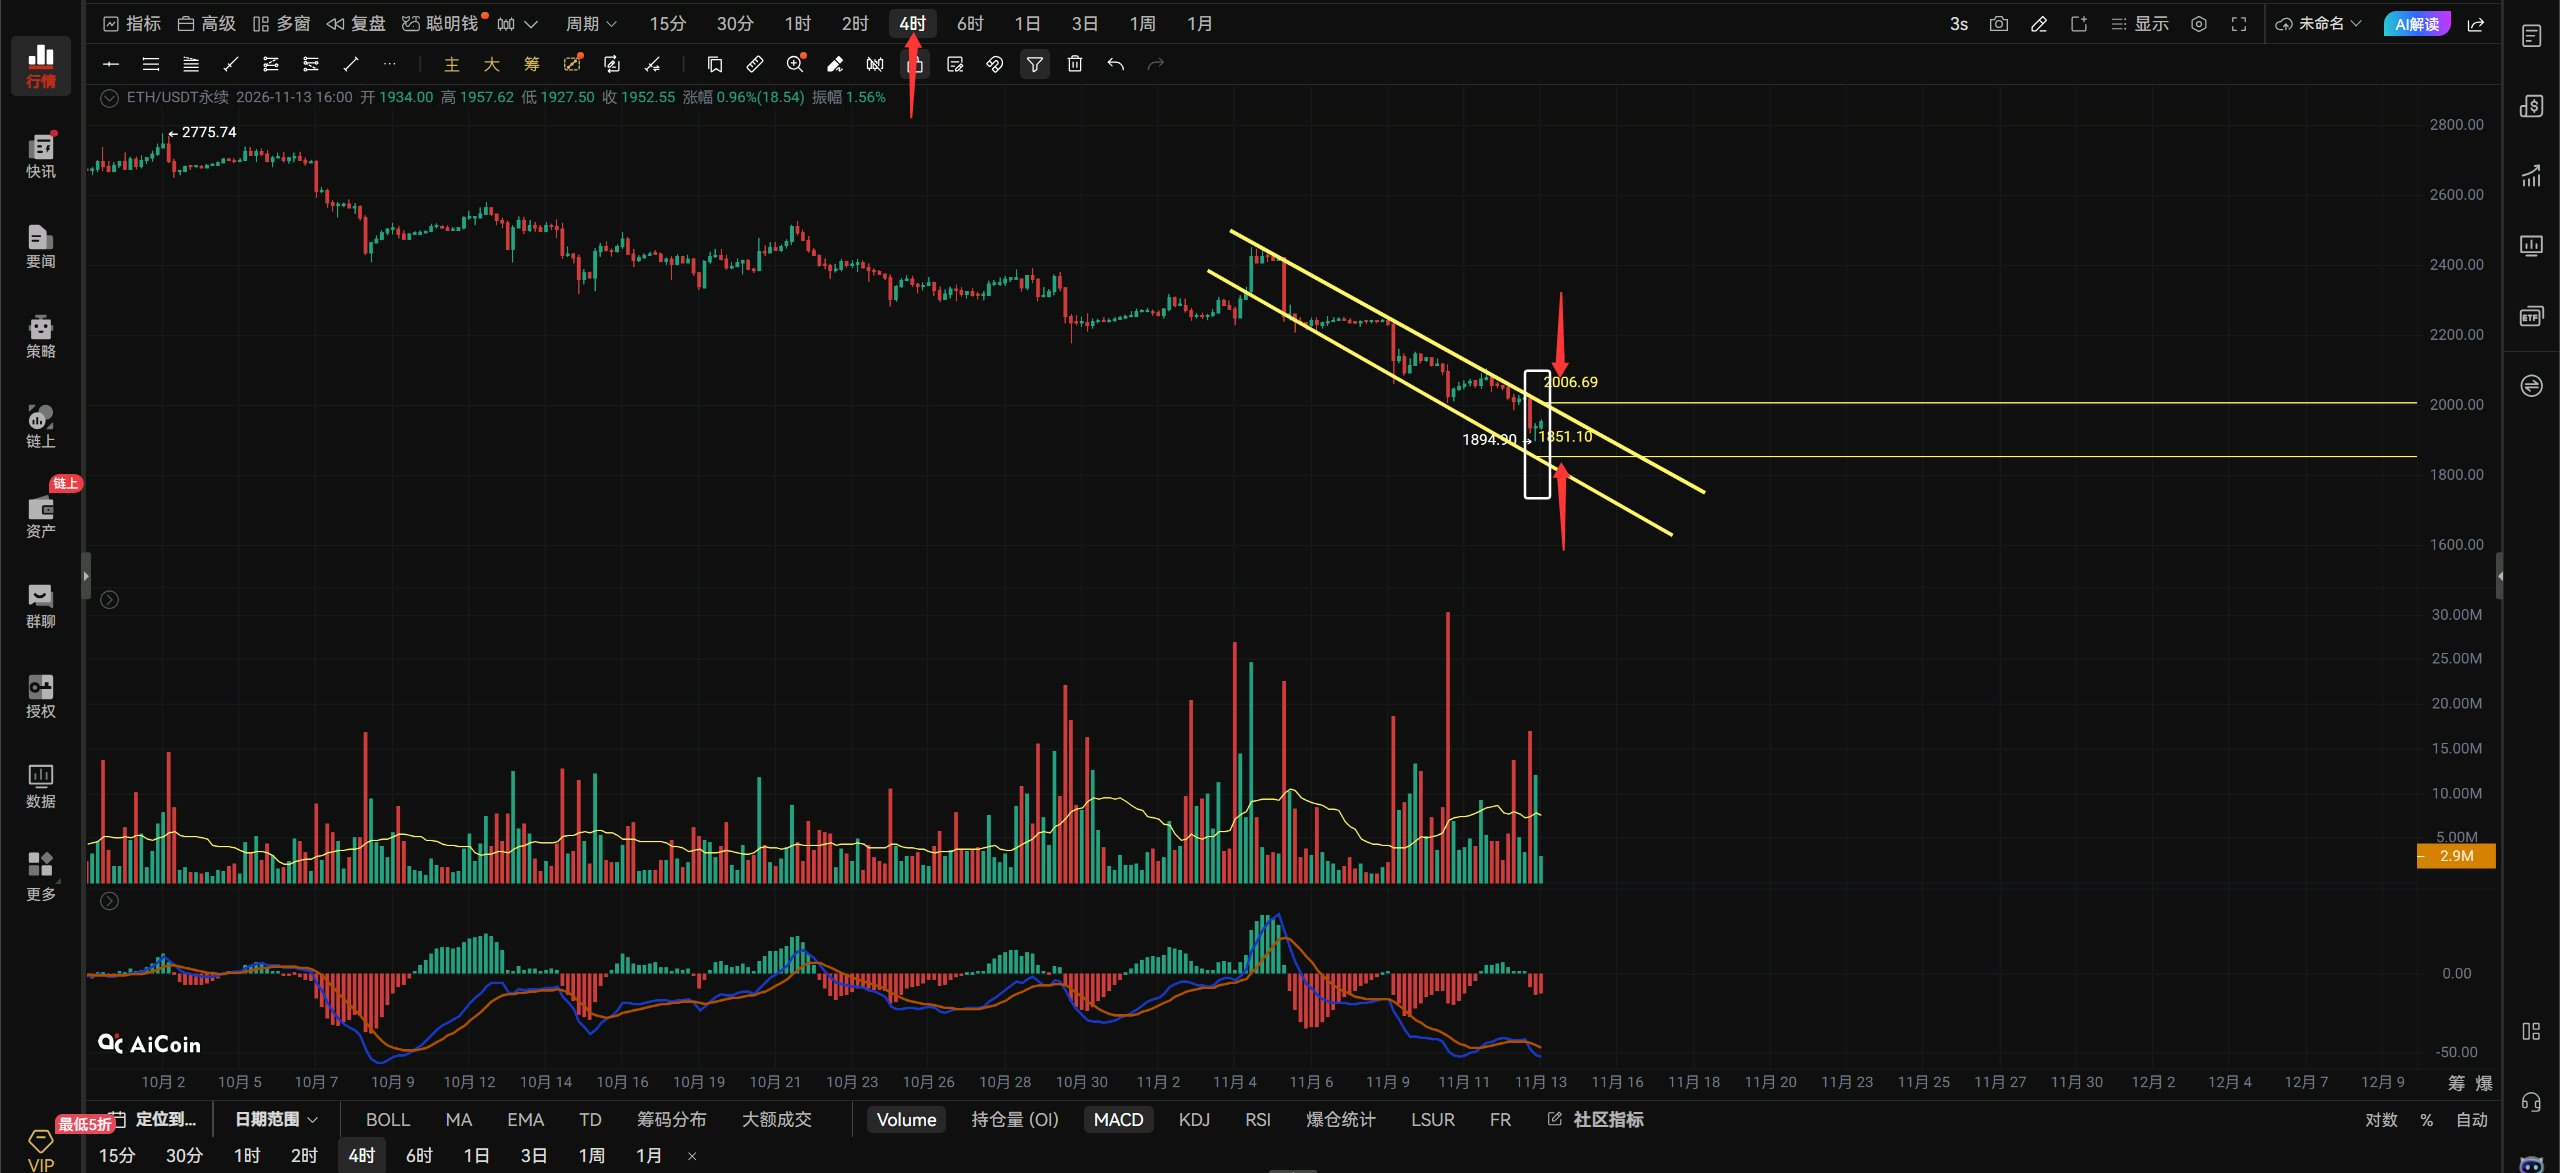
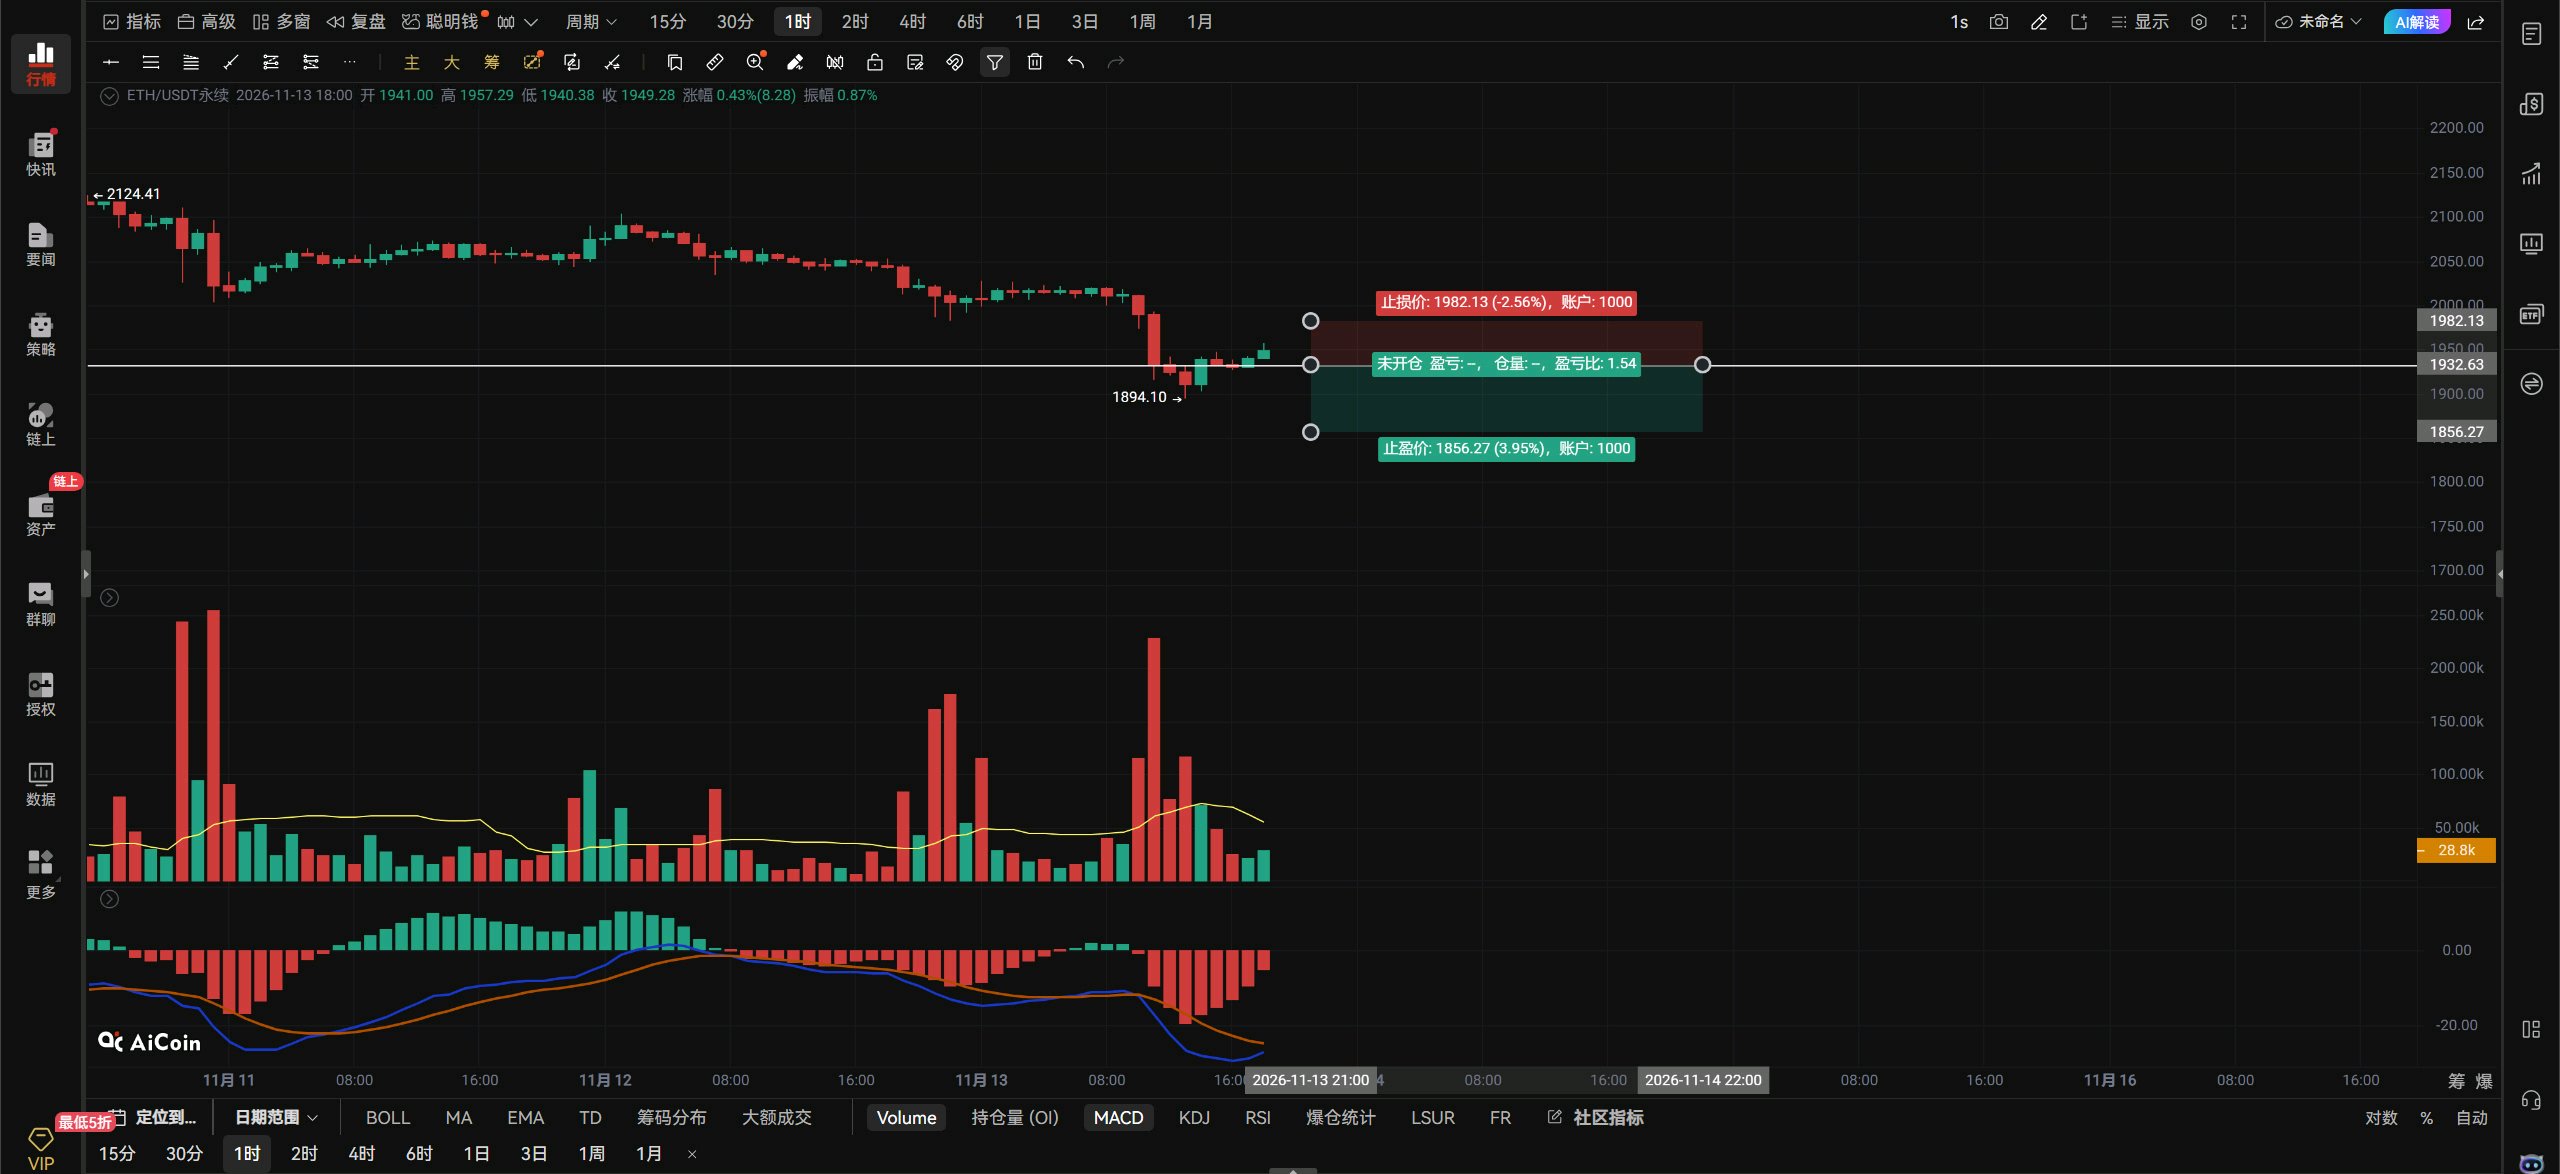
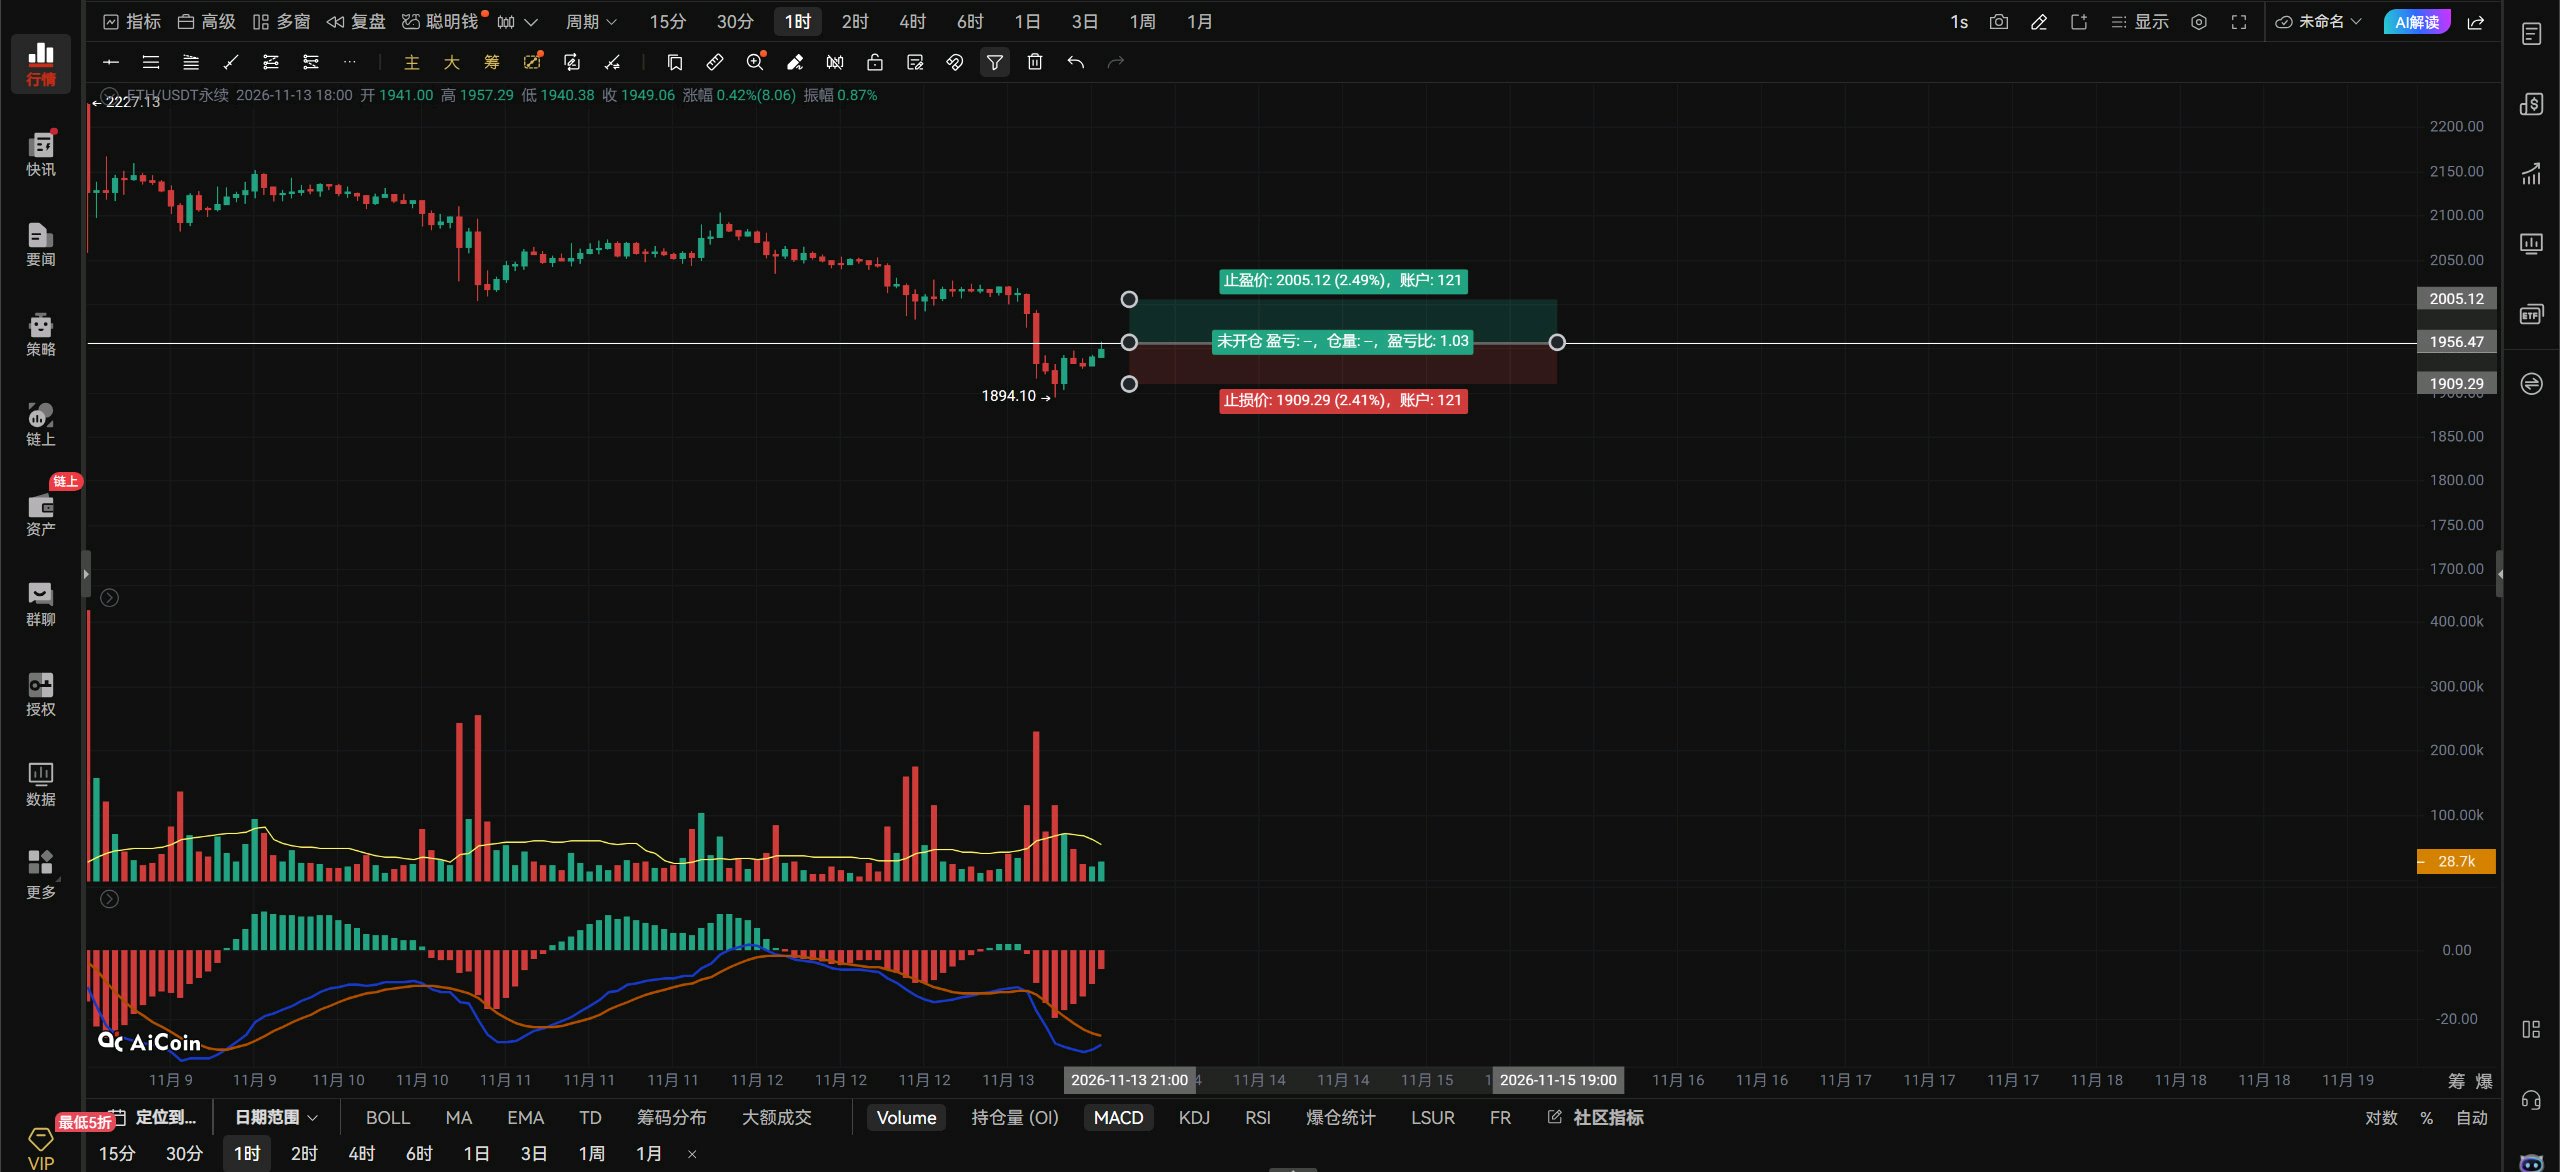
ETHUSDT Perspectiva para la tarde: 13/11. La segunda tortita (Ethereum) rompió por debajo de los 2000, y tras romper los 2000 no hubo ningún rebote. Se nota lo débil que está este mercado; los alcistas están siendo sometidos. En este momento, la segunda tortita solo puede dejar de caer y empezar a rebotar al alza si supera la resistencia en 1955. Solo después de romper los 2000 en el gráfico de una hora se abrirá una tendencia alcista. Si no puede romper los 1955, solo podrá moverse dentro del rango de consolidación de 1955-1910. Si sigue sin poder romper los 1955 y vuelve a probar el mínimo anterior por segunda vez, es muy probable que lo rompa y marque un nuevo mínimo en 1861. Mirando la posición marcada por el recuadro blanco, aunque la segunda tortita ha rebotado algo, al igual que la primera tortita, es solo un rebote con bajo volumen. Un rebote con bajo volumen es como un coche al que solo le queda un sorbo de gasolina: ¿hasta dónde puede llegar? Para la segunda tortita, recuerda simplemente el nivel de 2000. Solo cuando pueda romper los 2000 su subida procederá sin problemas. Si no puede romper los 2000, puede volver a probar el mínimo anterior en cualquier momento, y también romperá por debajo de ese mínimo anterior. Para la segunda tortita, entra en largo por el lado derecho después de romper los 1955 con volumen; entra en corto por el lado derecho después de romper por debajo de los 1932 con volumen. Presta atención a los cambios de volumen y establece tu stop loss. La segunda tortita en el gráfico de una hora, si se mantiene por encima de 1955, apunta hacia arriba, hacia los 2000-2046. En el gráfico de 4 horas, si rompe por debajo de 1932, apunta hacia abajo, hacia los 1894-1861. La segunda tortita en el gráfico de 4 horas está actualmente en tendencia bajista dentro de un canal. Para dejar de caer en el gráfico de 4 horas, debe romper por encima del límite superior del canal en 2000. Solo rompiendo los 2000 en el gráfico de 4 horas puede dejar de caer y empezar a rebotar. Si no puede romper los 2000, entonces vigila el límite inferior del canal de 4 horas en 1851 para ver si puede dejar de caer. Una vez que el nivel de 4 horas rompa por encima del canal en 2000, la posición marcada por el recuadro blanco en el nivel de 4 horas formará un patrón de estrella de la mañana. Así que solo si el nivel de 4 horas rompe los 2000, la segunda tortita podrá dejar de caer y rebotar. Si no puede romper los 2000, el nivel de 4 horas seguirá moviéndose dentro del canal de precios y consolidándose. No sé si la apertura del mercado bursátil de EE. UU. ampliará aún más la caída; si sigue cayendo, no juegues más. Se levanta la sesión. ByXIMPACT
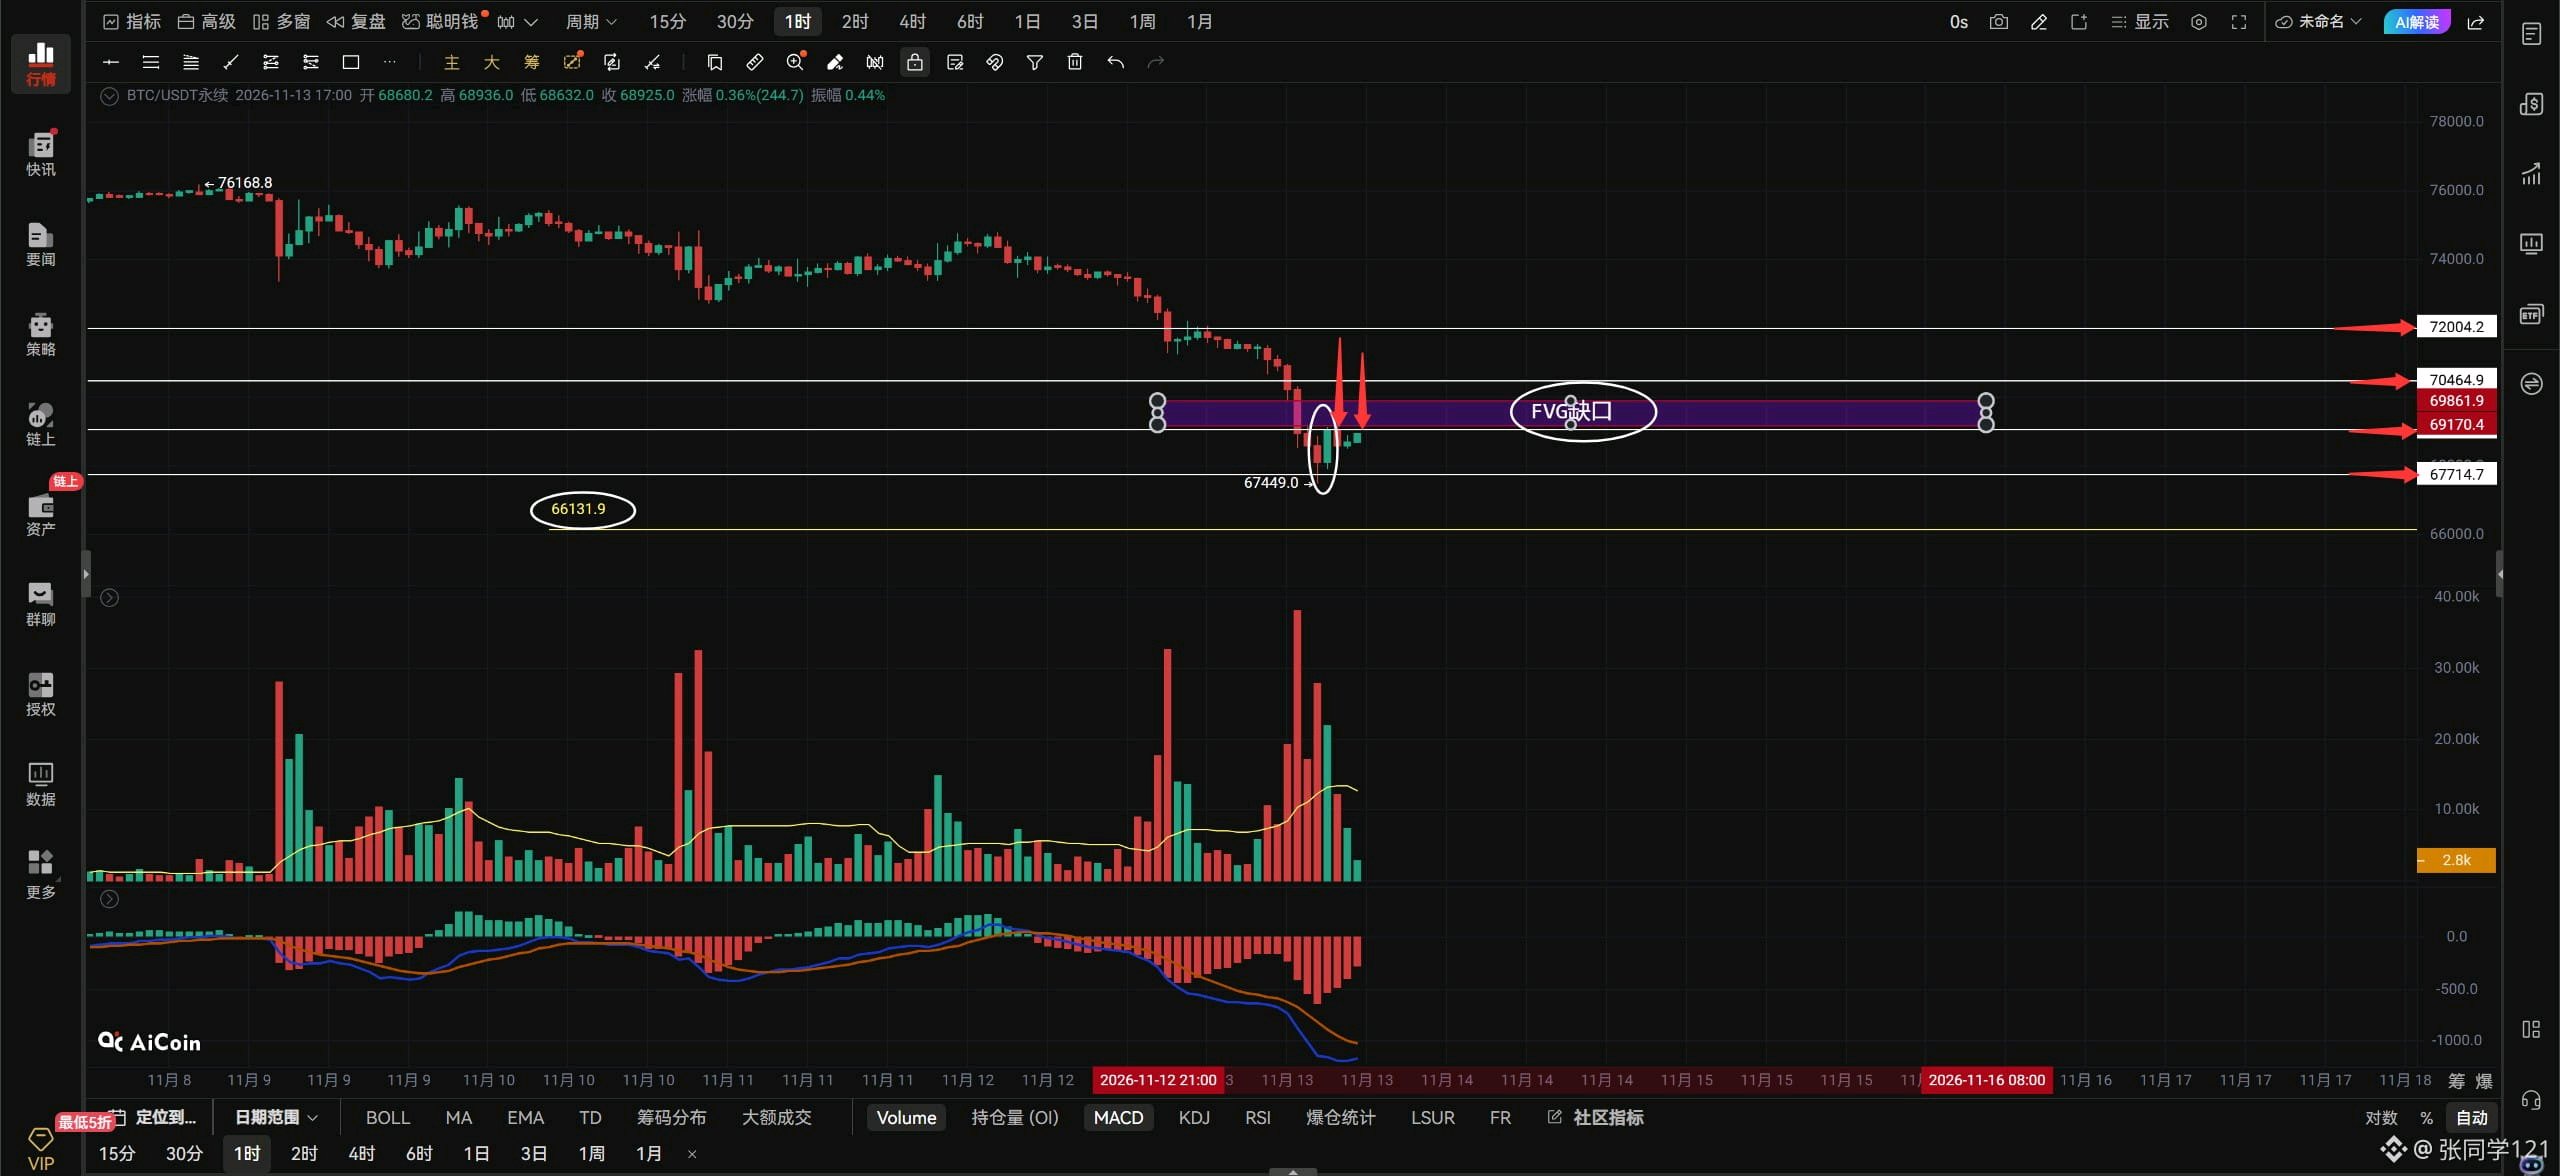
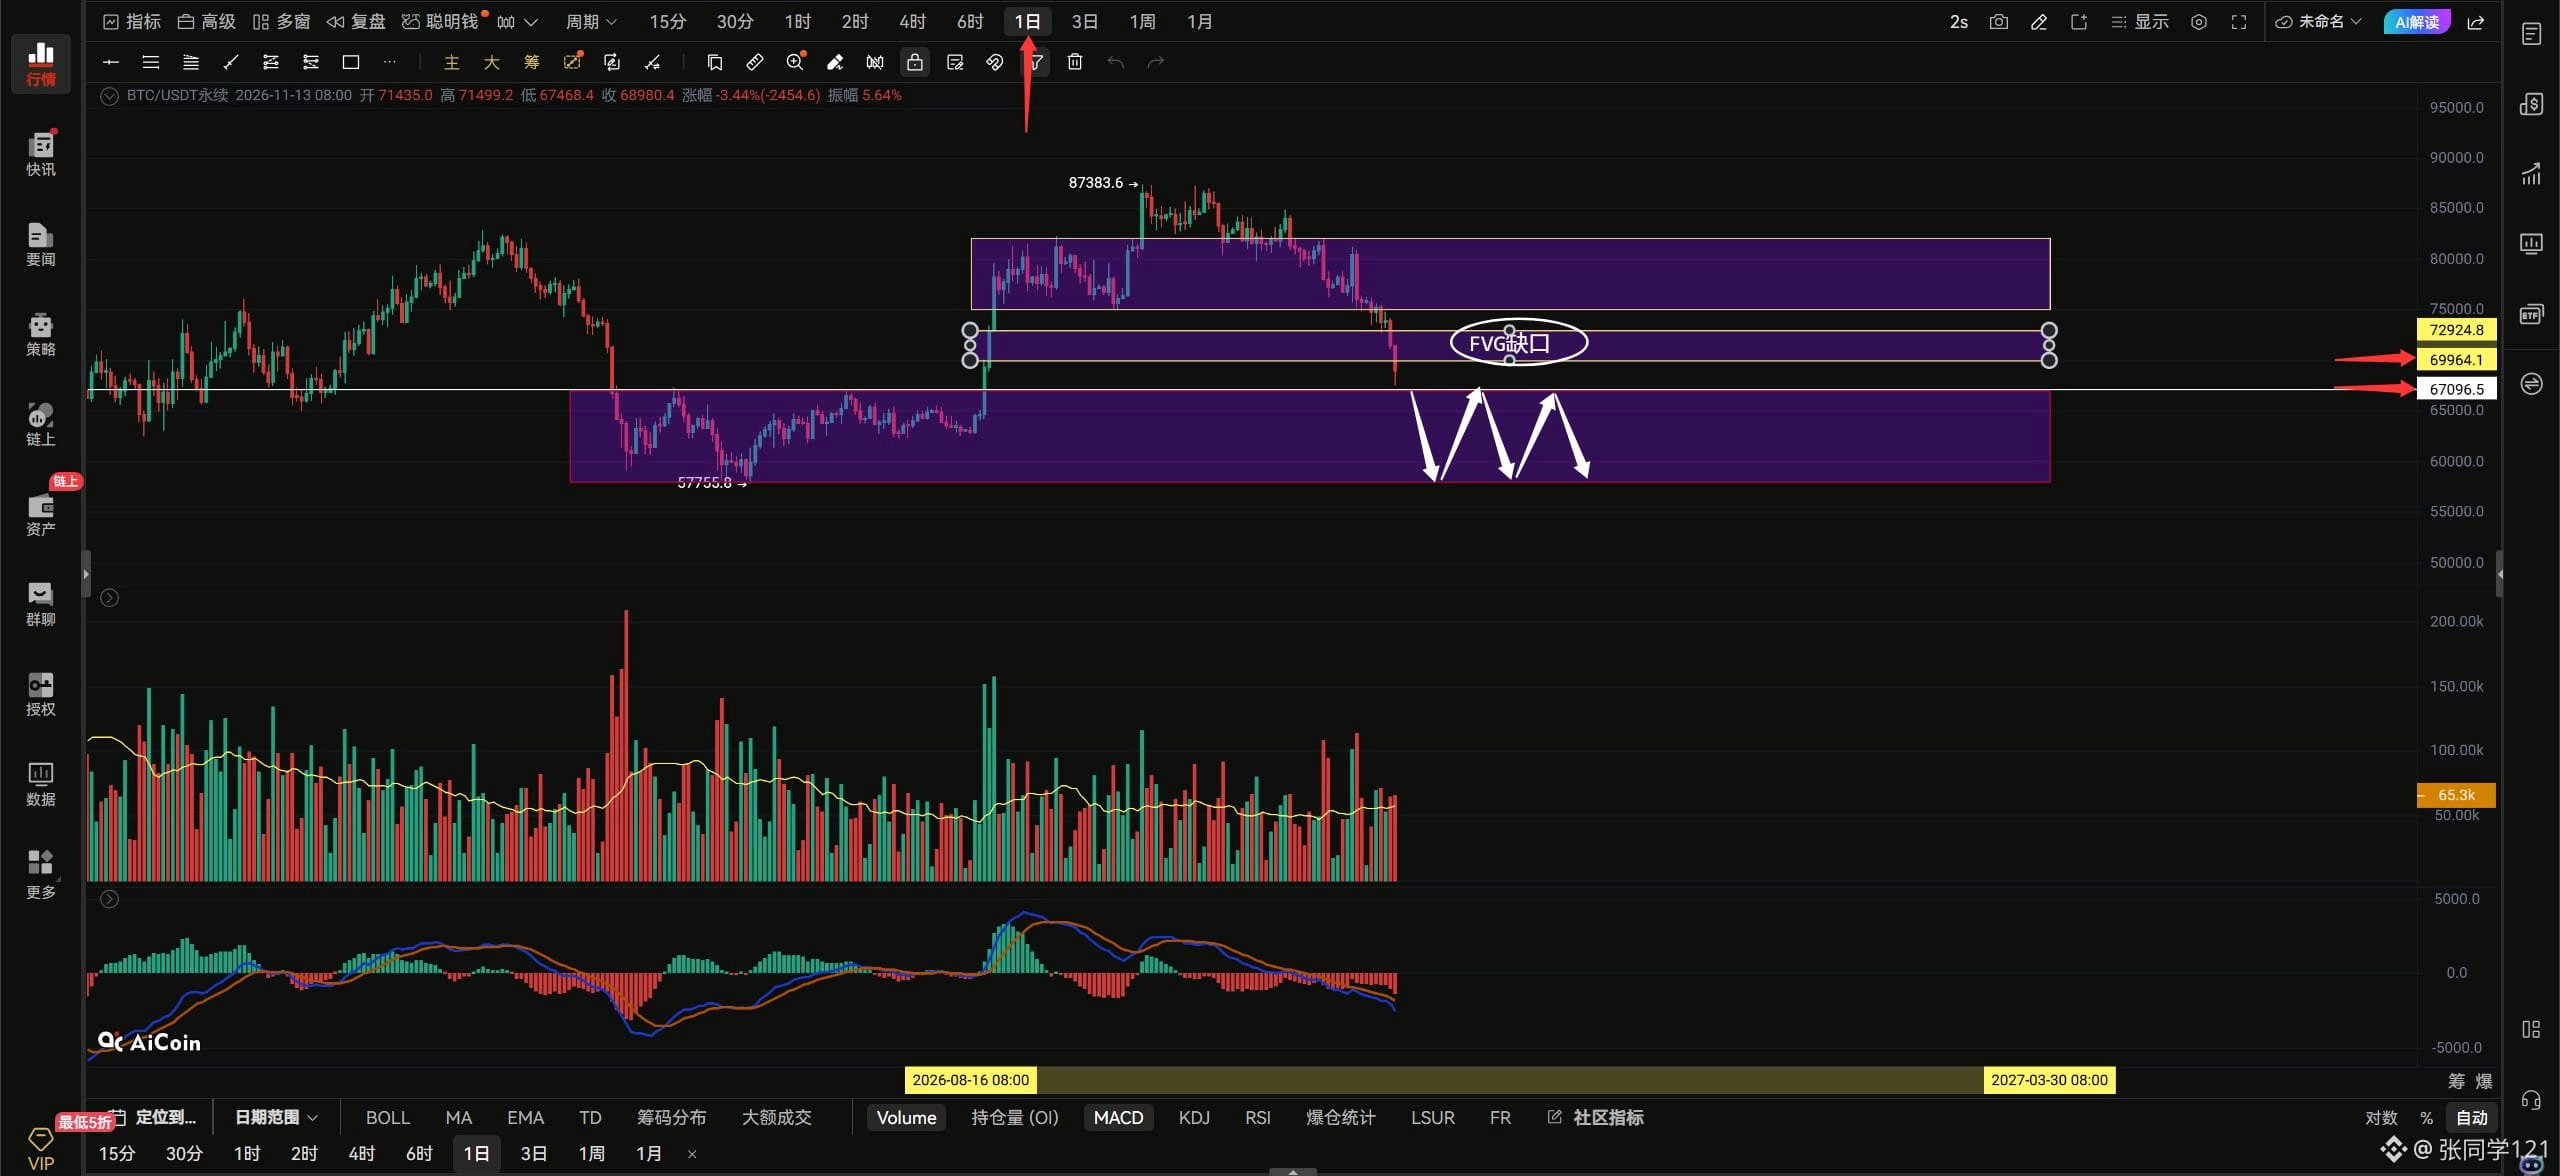
$BTCUSDT $BTC Perspectiva para la tarde: 13/11. La última caída de Bitcoin ha dejado a todos atónitos y confundidos, ¿verdad? ¿Te sientes perdido? ¿Tenéis todos miedo de abrir posiciones en largo ahora? No perdáis los nervios. Simplemente seguid comprando al contado en lotes; mientras creáis que no va a llegar a cero, seguid comprando. ¿Ha tocado fondo Bitcoin ya? La zona marcada por el recuadro blanco de abajo ha mostrado su primera señal de suelo: un patrón envolvente alcista, lo que sugiere un posible rebote en el marco temporal actual. Como muestran las flechas rojas de arriba, ya ha rebotado dos veces, pero no ha logrado romper el nivel de resistencia de 69.000. Eso significa que el rebote carece de fuerza y que los grandes toros no han entrado de lleno. Por tanto, este rebote puede entenderse como un movimiento natural causado por la toma de beneficios de los cortos, más que por una subida impulsada por grandes actores alcistas entrando en el mercado. No os precipitéis solo porque veáis un patrón envolvente alcista. Comprobad si el precio puede romper la resistencia de arriba. Si no puede superar los 69.000 y mantenerse por encima, cuidado con un segundo retesteo del mínimo anterior en 64.779. Bitcoin necesita superar los 69.000 antes de que podamos decir que la tendencia bajista horaria se ha detenido temporalmente, creando una oportunidad de rebote hacia los 70.464. Si no puede romper los 69.000, entonces simplemente mantenerse en un rango lateral entre 67.449 y 69.000 sin seguir cayendo ya sería un buen resultado. Esta caída fue tan brusca que ha aparecido otro gap FVG en el gráfico horario. Si Bitcoin puede volver por encima de 69.000, tendrá que cerrar el gap FVG de arriba, alrededor de 69.170–69.861. Bitcoin está rebotando ahora, pero el volumen de abajo es sinceramente decepcionante: es un rebote de bajo volumen. Solo recordad: si Bitcoin no puede romper los 69.000, no ha tocado fondo en absoluto y no puede rebotar. Mi apuesta es que a Bitcoin aún le queda una caída más, aunque es difícil saber hasta dónde llegará ese último descenso: quizás 66.000 o 65.000. Ya veremos. Mi sesgo personal es que Bitcoin ha caído prácticamente todo lo que tenía que caer; incluso si sigue bajando, probablemente no caerá mucho más, 2.000 puntos como mucho. Así que no tengáis miedo. Si aparece la señal, seguiré yendo en largo. Si queréis ir en largo en Bitcoin, esperad a que reteste el mínimo anterior y muestre otra señal de suelo antes de entrar. Si Bitcoin rompe por encima de 69.000 con un volumen fuerte, los traders agresivos pueden perseguir el largo en el lado derecho. Si rompe por debajo de 68.541 con volumen fuerte y no puede recuperarlo tras un rebote, persigue el corto en el lado derecho. Usad stop loss. Si Bitcoin rompe al alza y se mantiene por encima de los 69.000 en el marco temporal horario, mirad hacia 70.464–72.000. Si no puede superar los 69.000, eso no es bueno. Si rompe por debajo de 67.714 en el gráfico de 4 horas, mirad hacia abajo, hacia los 66.131–64.753. El gap FVG en el gráfico diario de Bitcoin también se ha cerrado por completo. Todo ha ido demasiado lejos 😓. A continuación, veremos si Bitcoin puede volver a situarse por encima del gap FVG en el gráfico diario y operar de nuevo dentro de él. El nivel de precio correspondiente para volver a entrar en el FVG es 70.000; solo entonces el gráfico diario de Bitcoin podrá encontrar un suelo. Por otro lado, si Bitcoin sigue cayendo en el gráfico diario y rompe por debajo del nivel de soporte de 67.000, volverá al rango de consolidación de 67.000–58.000. Sinceramente, no sé dónde podría encontrar un suelo; si os lo dijera ahora, solo sería una suposición. Mejor esperar y ver hacia dónde va Bitcoin. Sesión terminada. ByXIMPACT
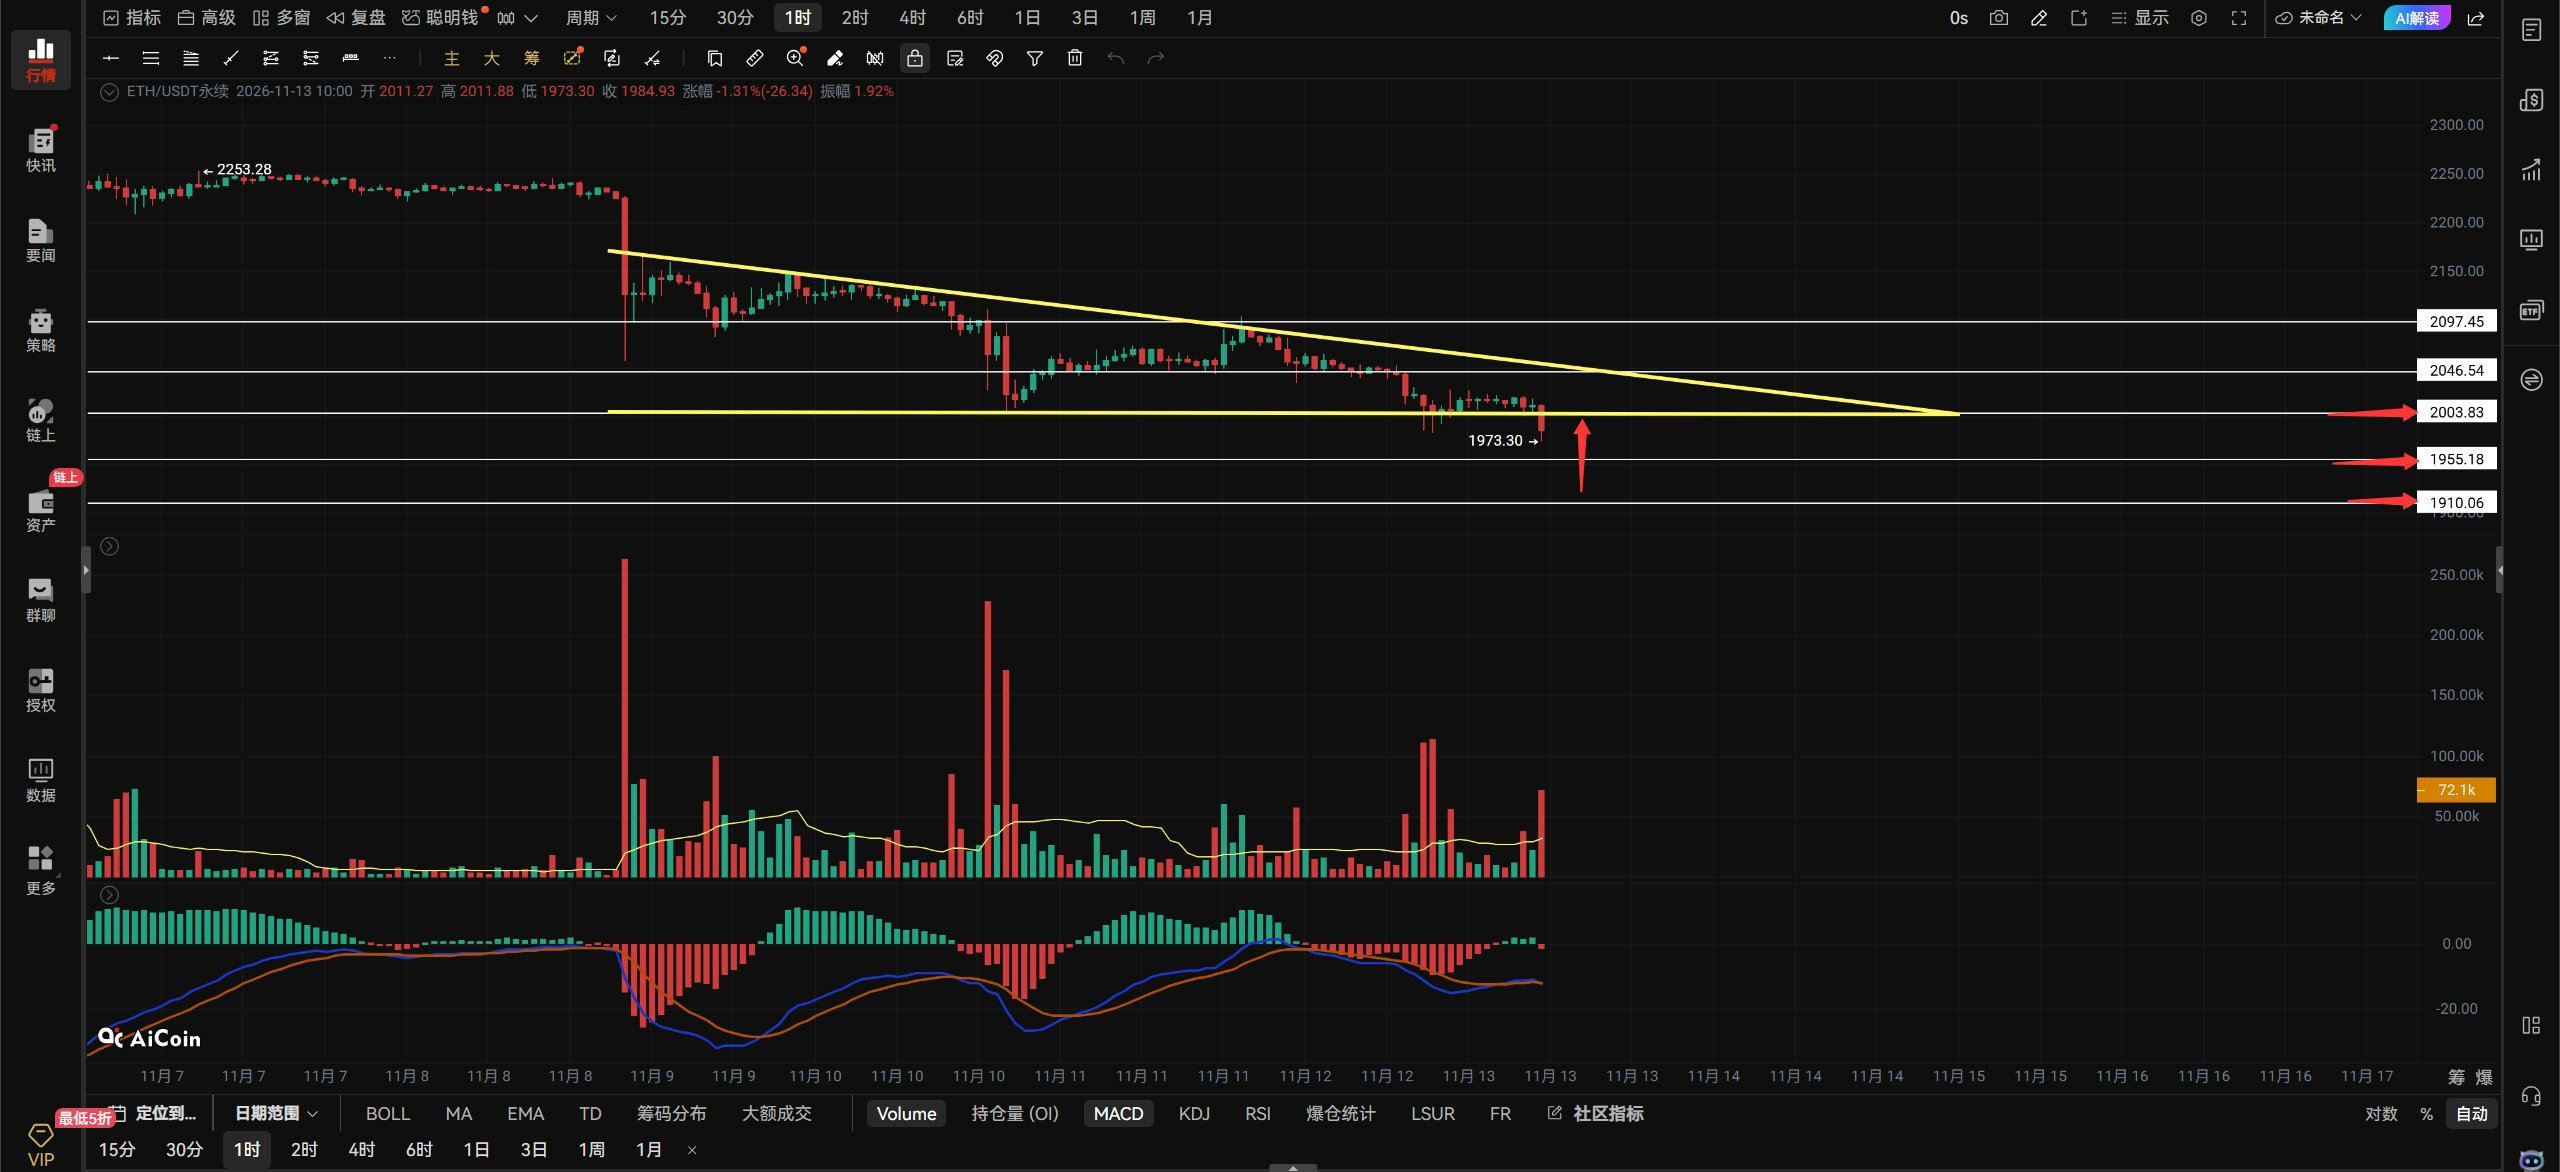
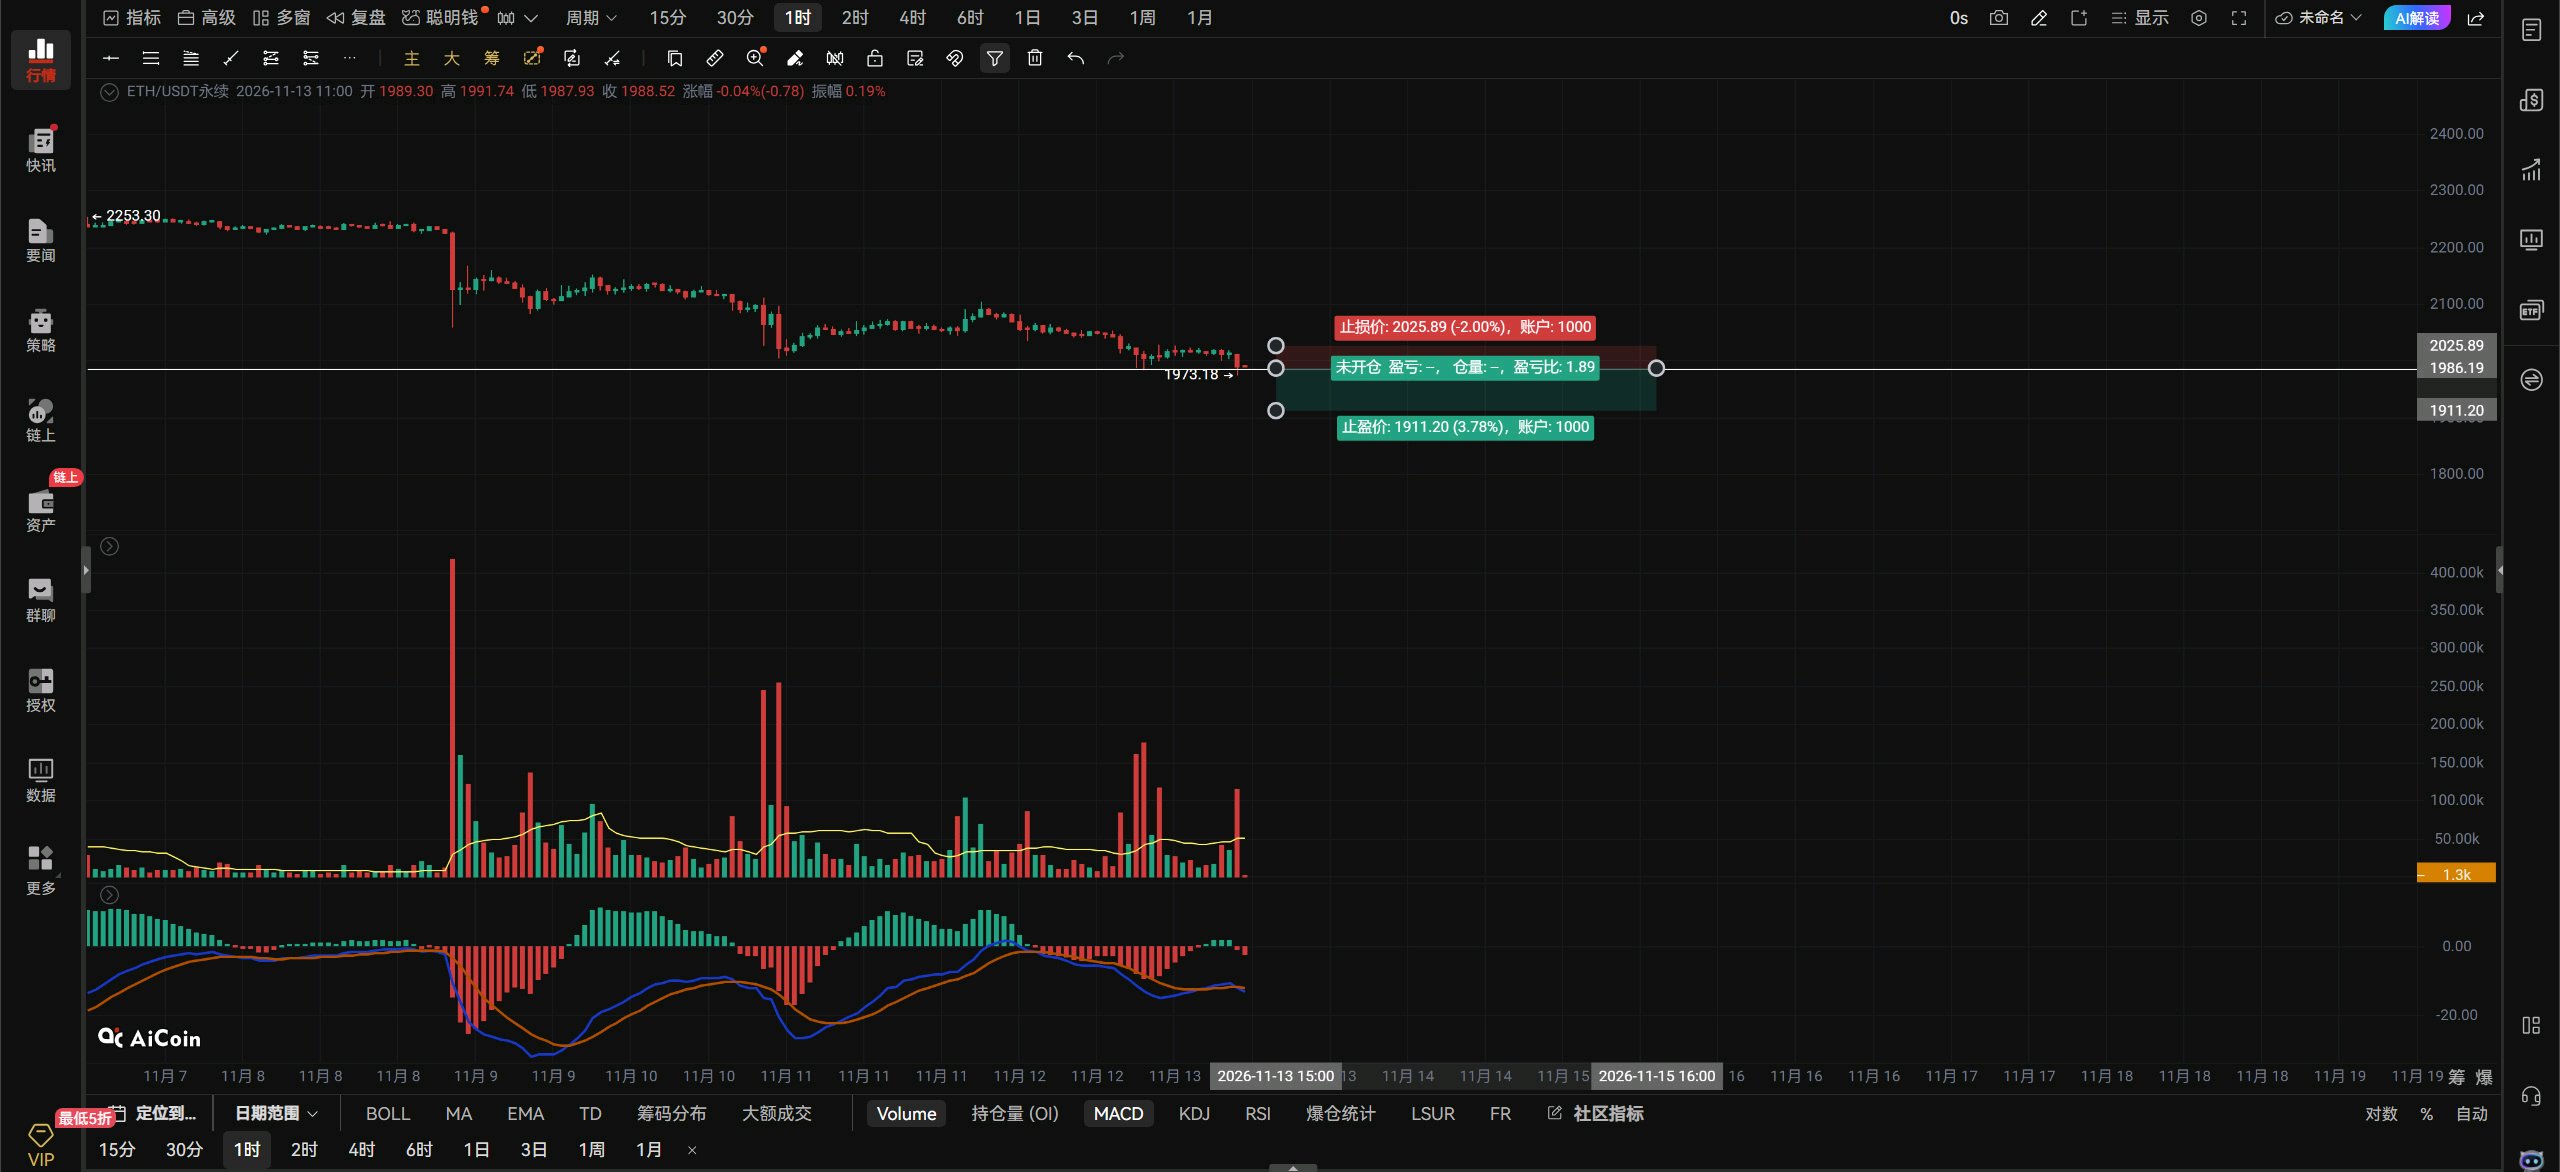
$ETHUSDT $ETH outlook: A high-volume break above 2021: chase the breakout long and use a stop-loss. A high-volume break below 1984: chase the breakdown short and use a stop-loss. If a retest of 1956 confirms support is holding, add one lot to the long position; stop out if it breaks below 1910. If ETH holds above 2021 on the hourly timeframe, look for 2046–2097. Watch for a one-lot short entry around 2046; stop out if it breaks above 2097. Left-side wick order: long at 1900; stop out if it breaks below 1872. Resistance above: 2021–2046–2097 Support below: 1984–1956–1910 On the 4-hour timeframe, a break below 1984 points down to 1956–1910. ETH is currently below the 2000 support. Wait for this hourly candle to close: if it can reclaim 2000, no big deal; if not, look for 1955–1910 next! ETH needs to reclaim 2000 to stop falling. If it can’t, ETH is basically done. That’s all.#ByXIMPACT
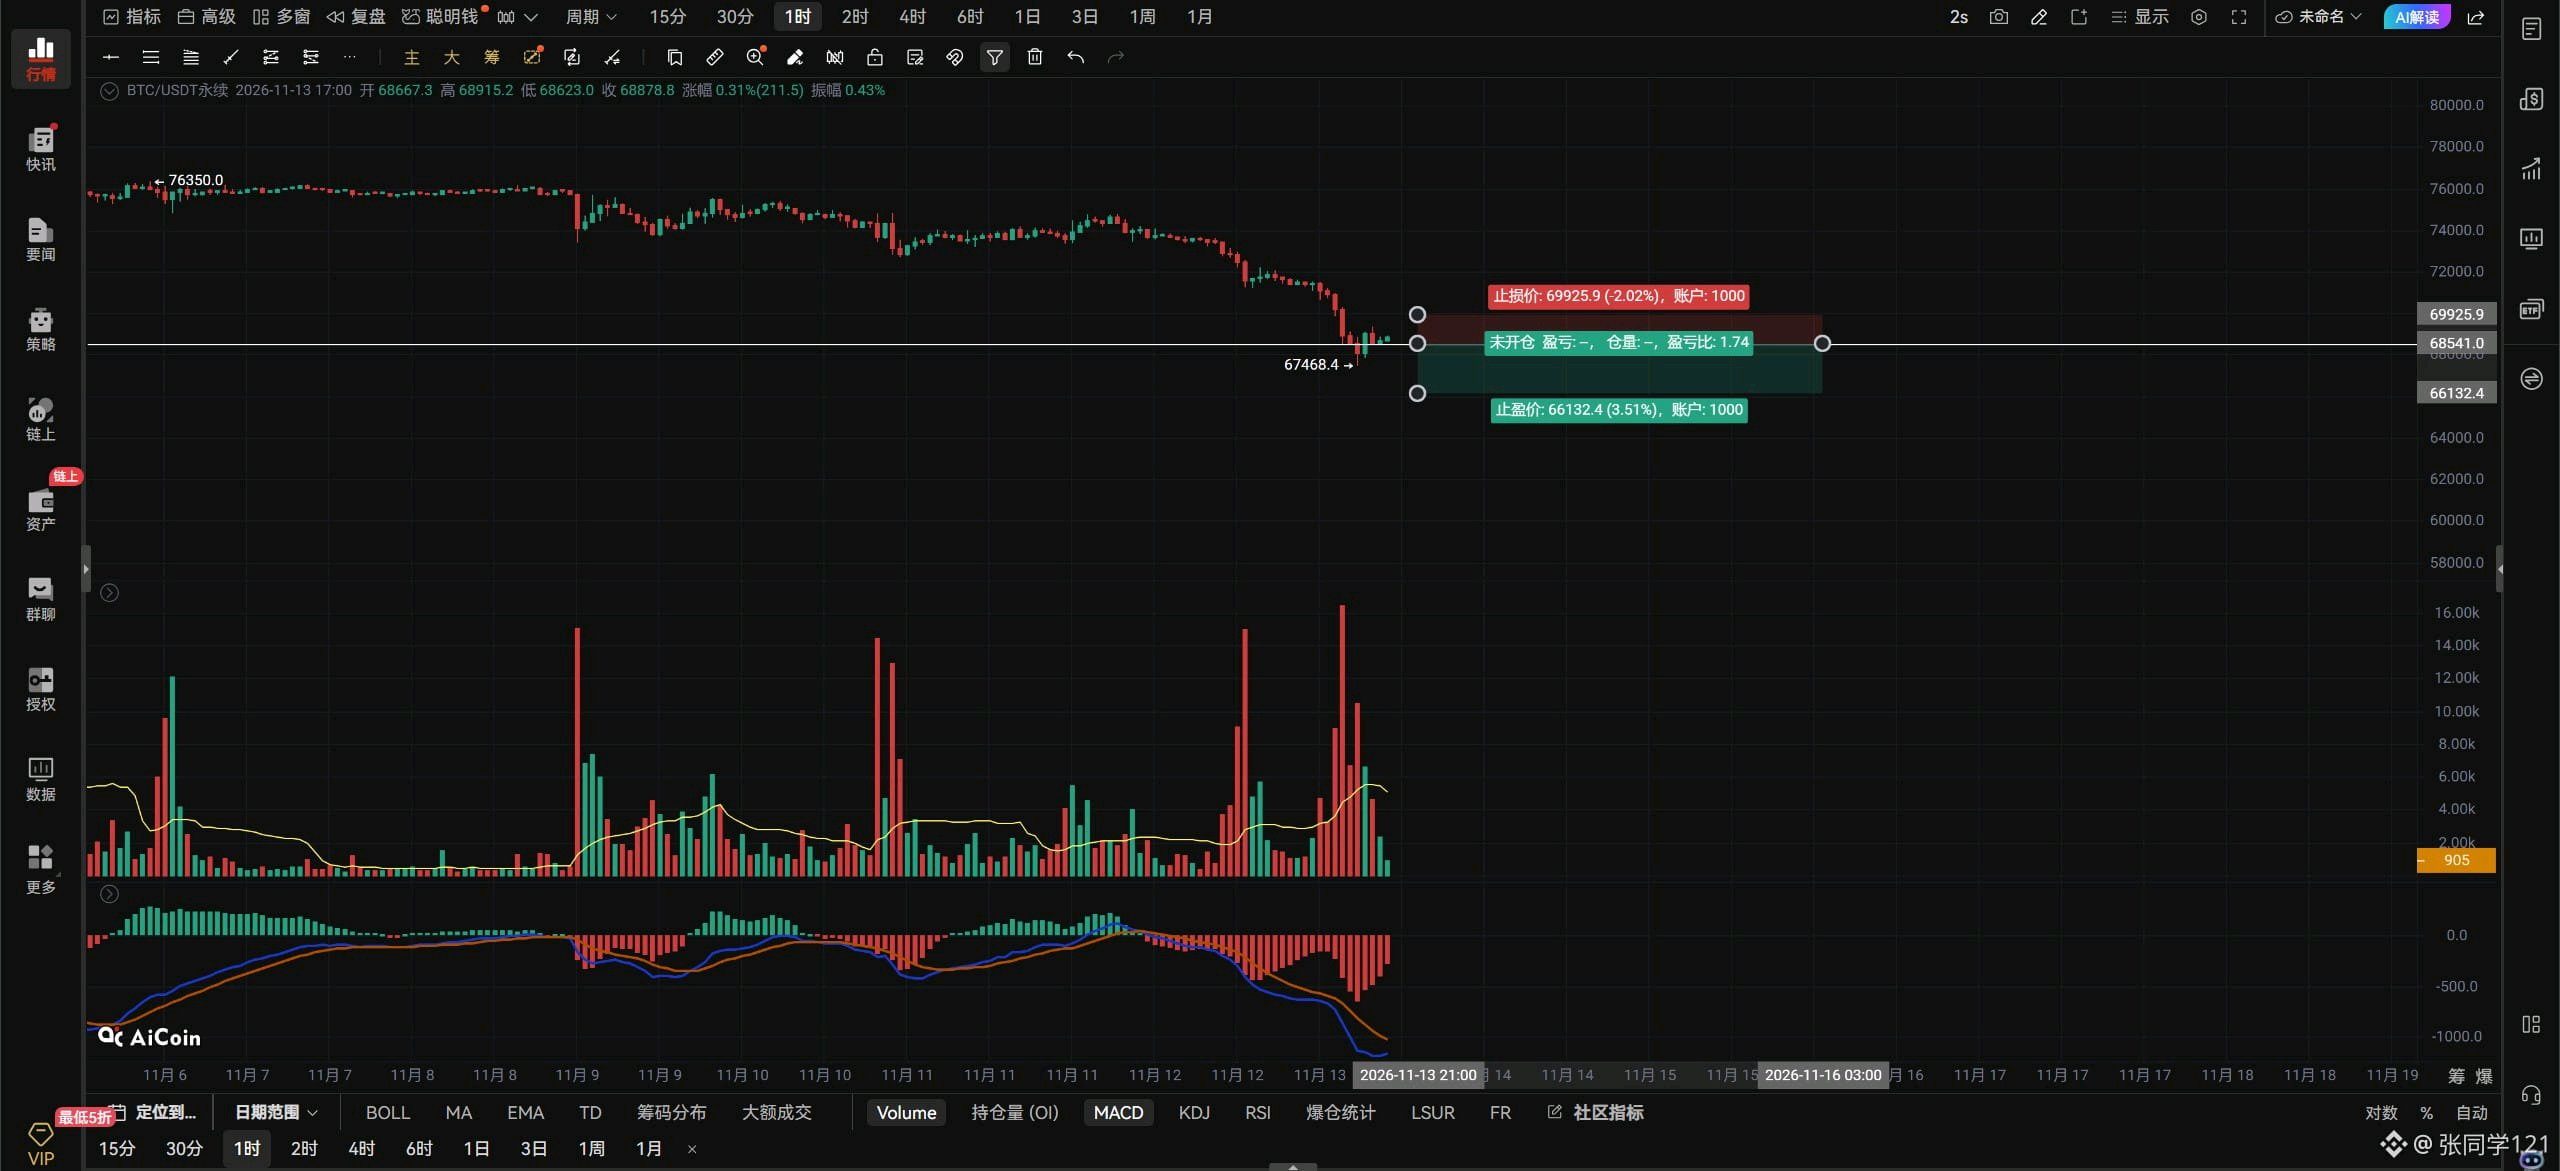
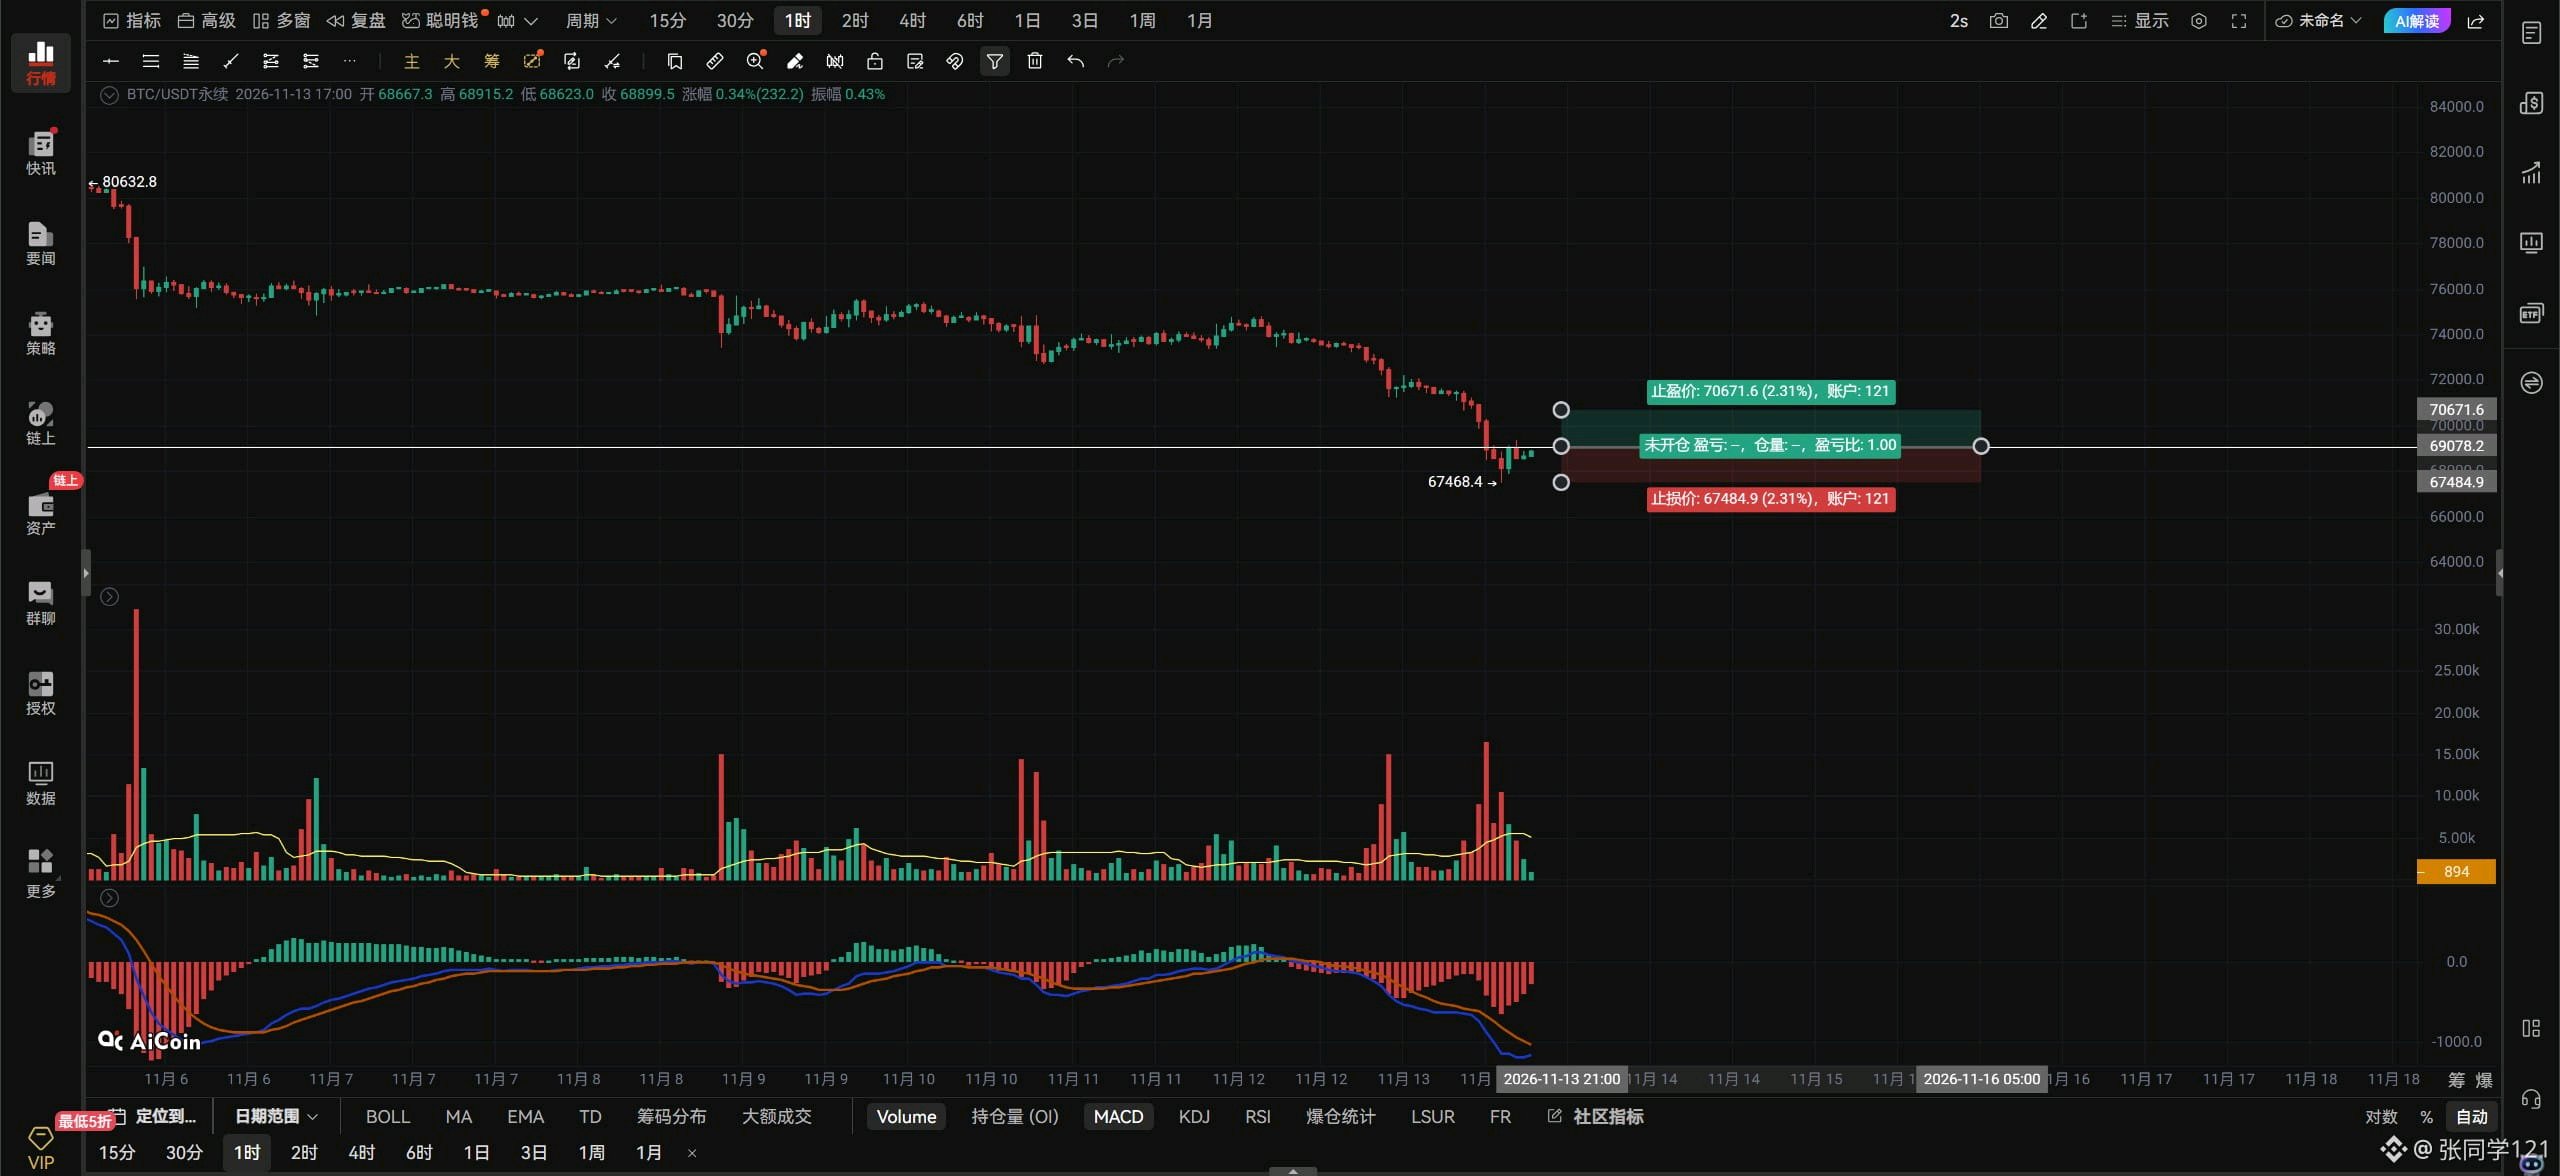
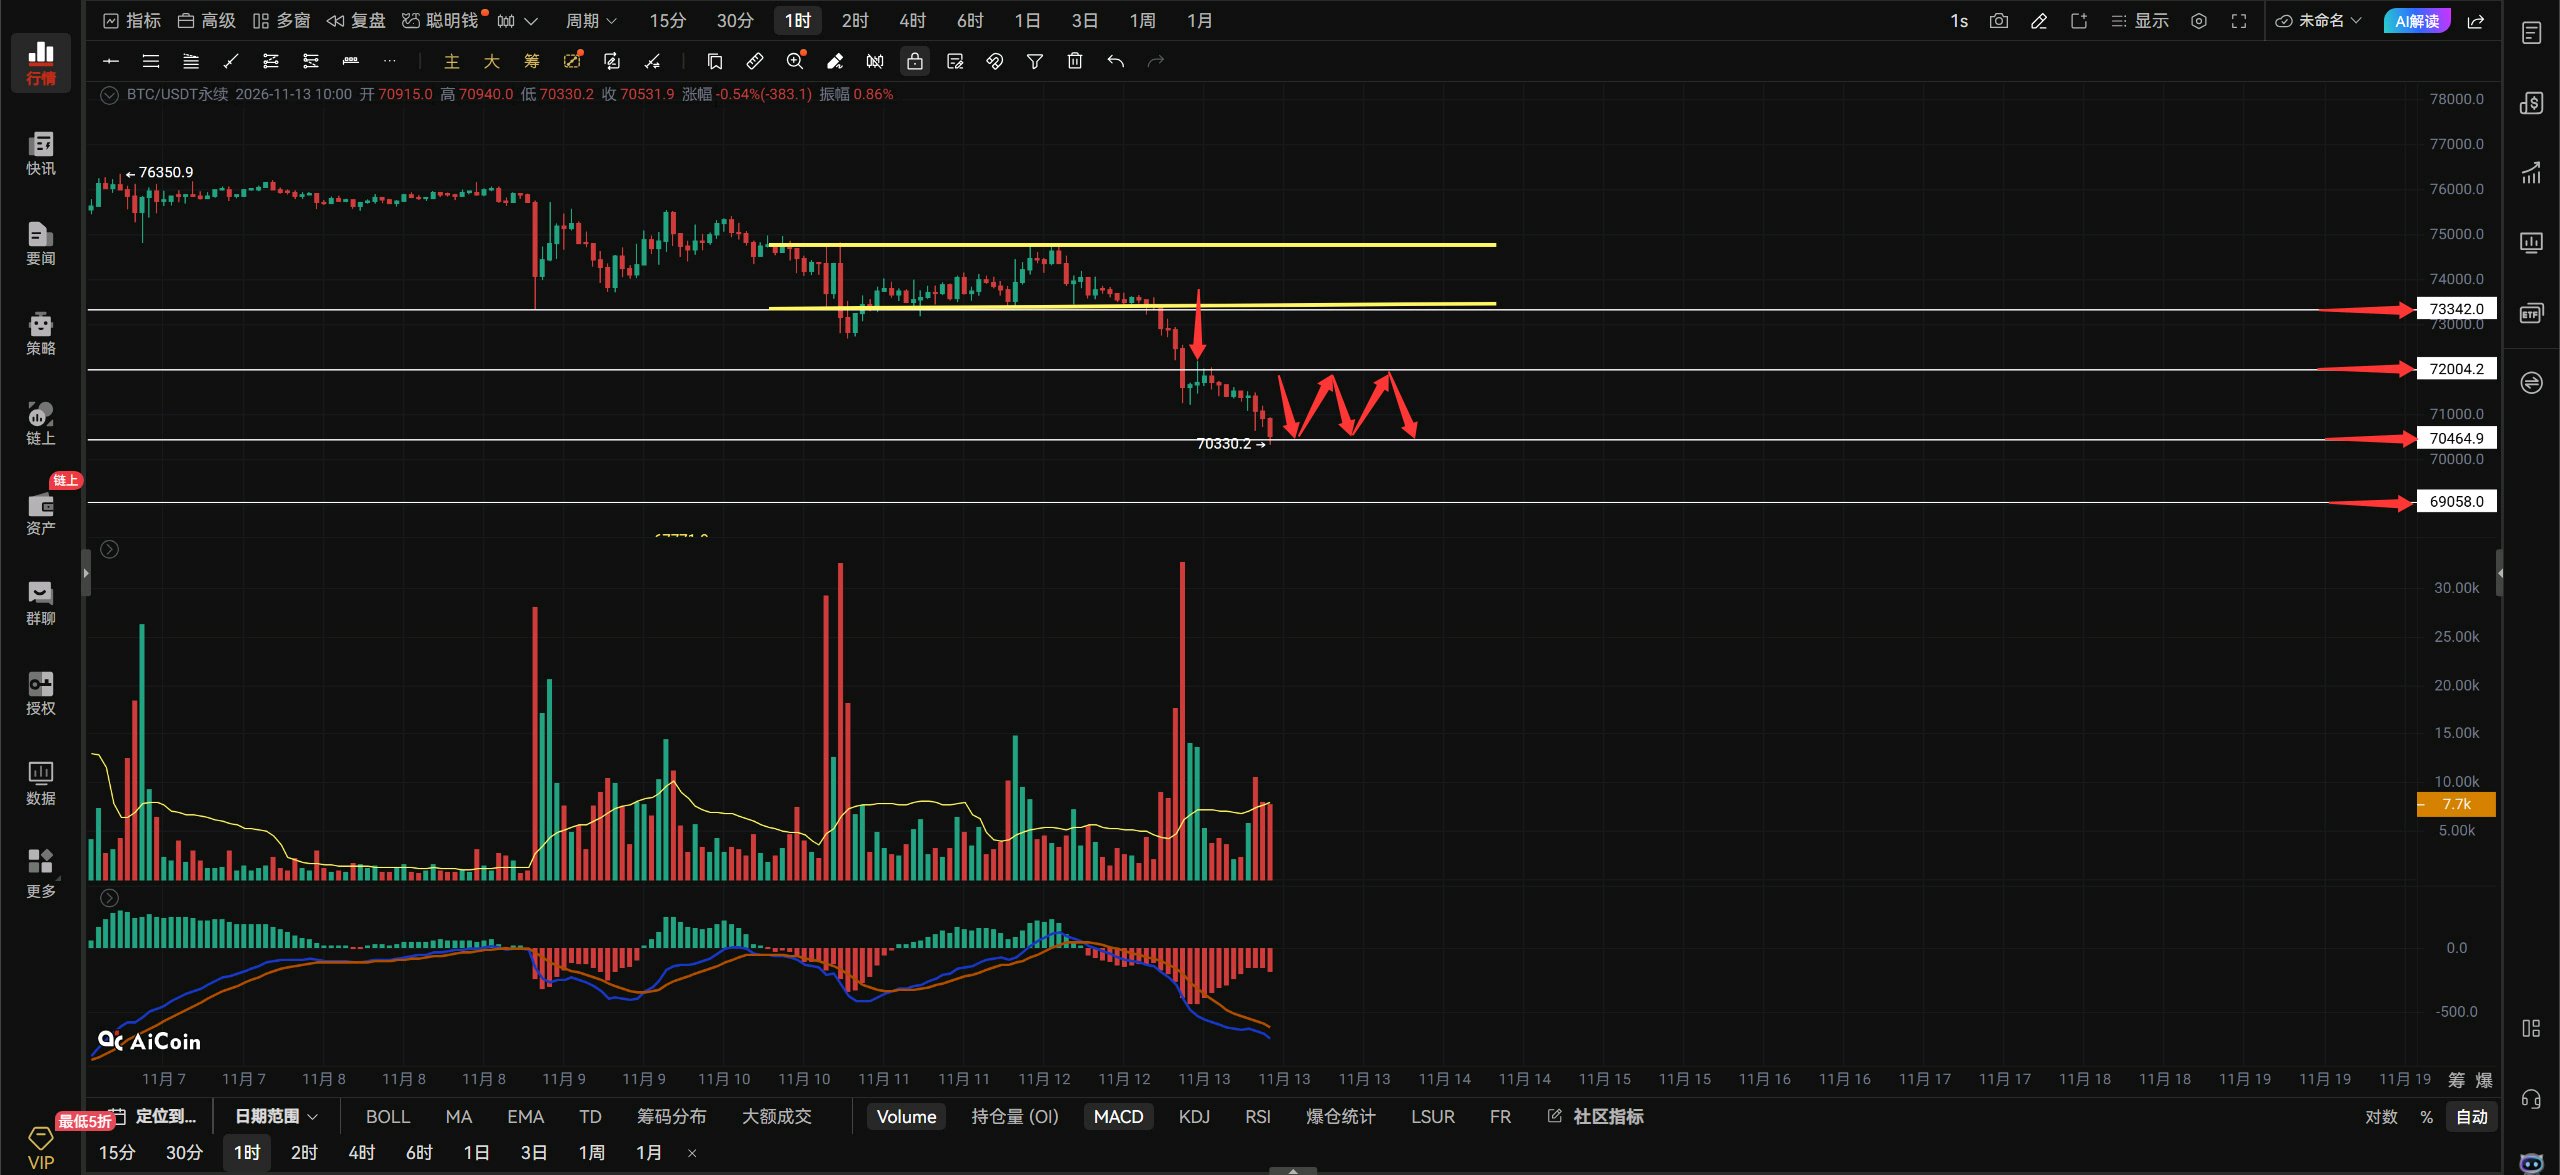
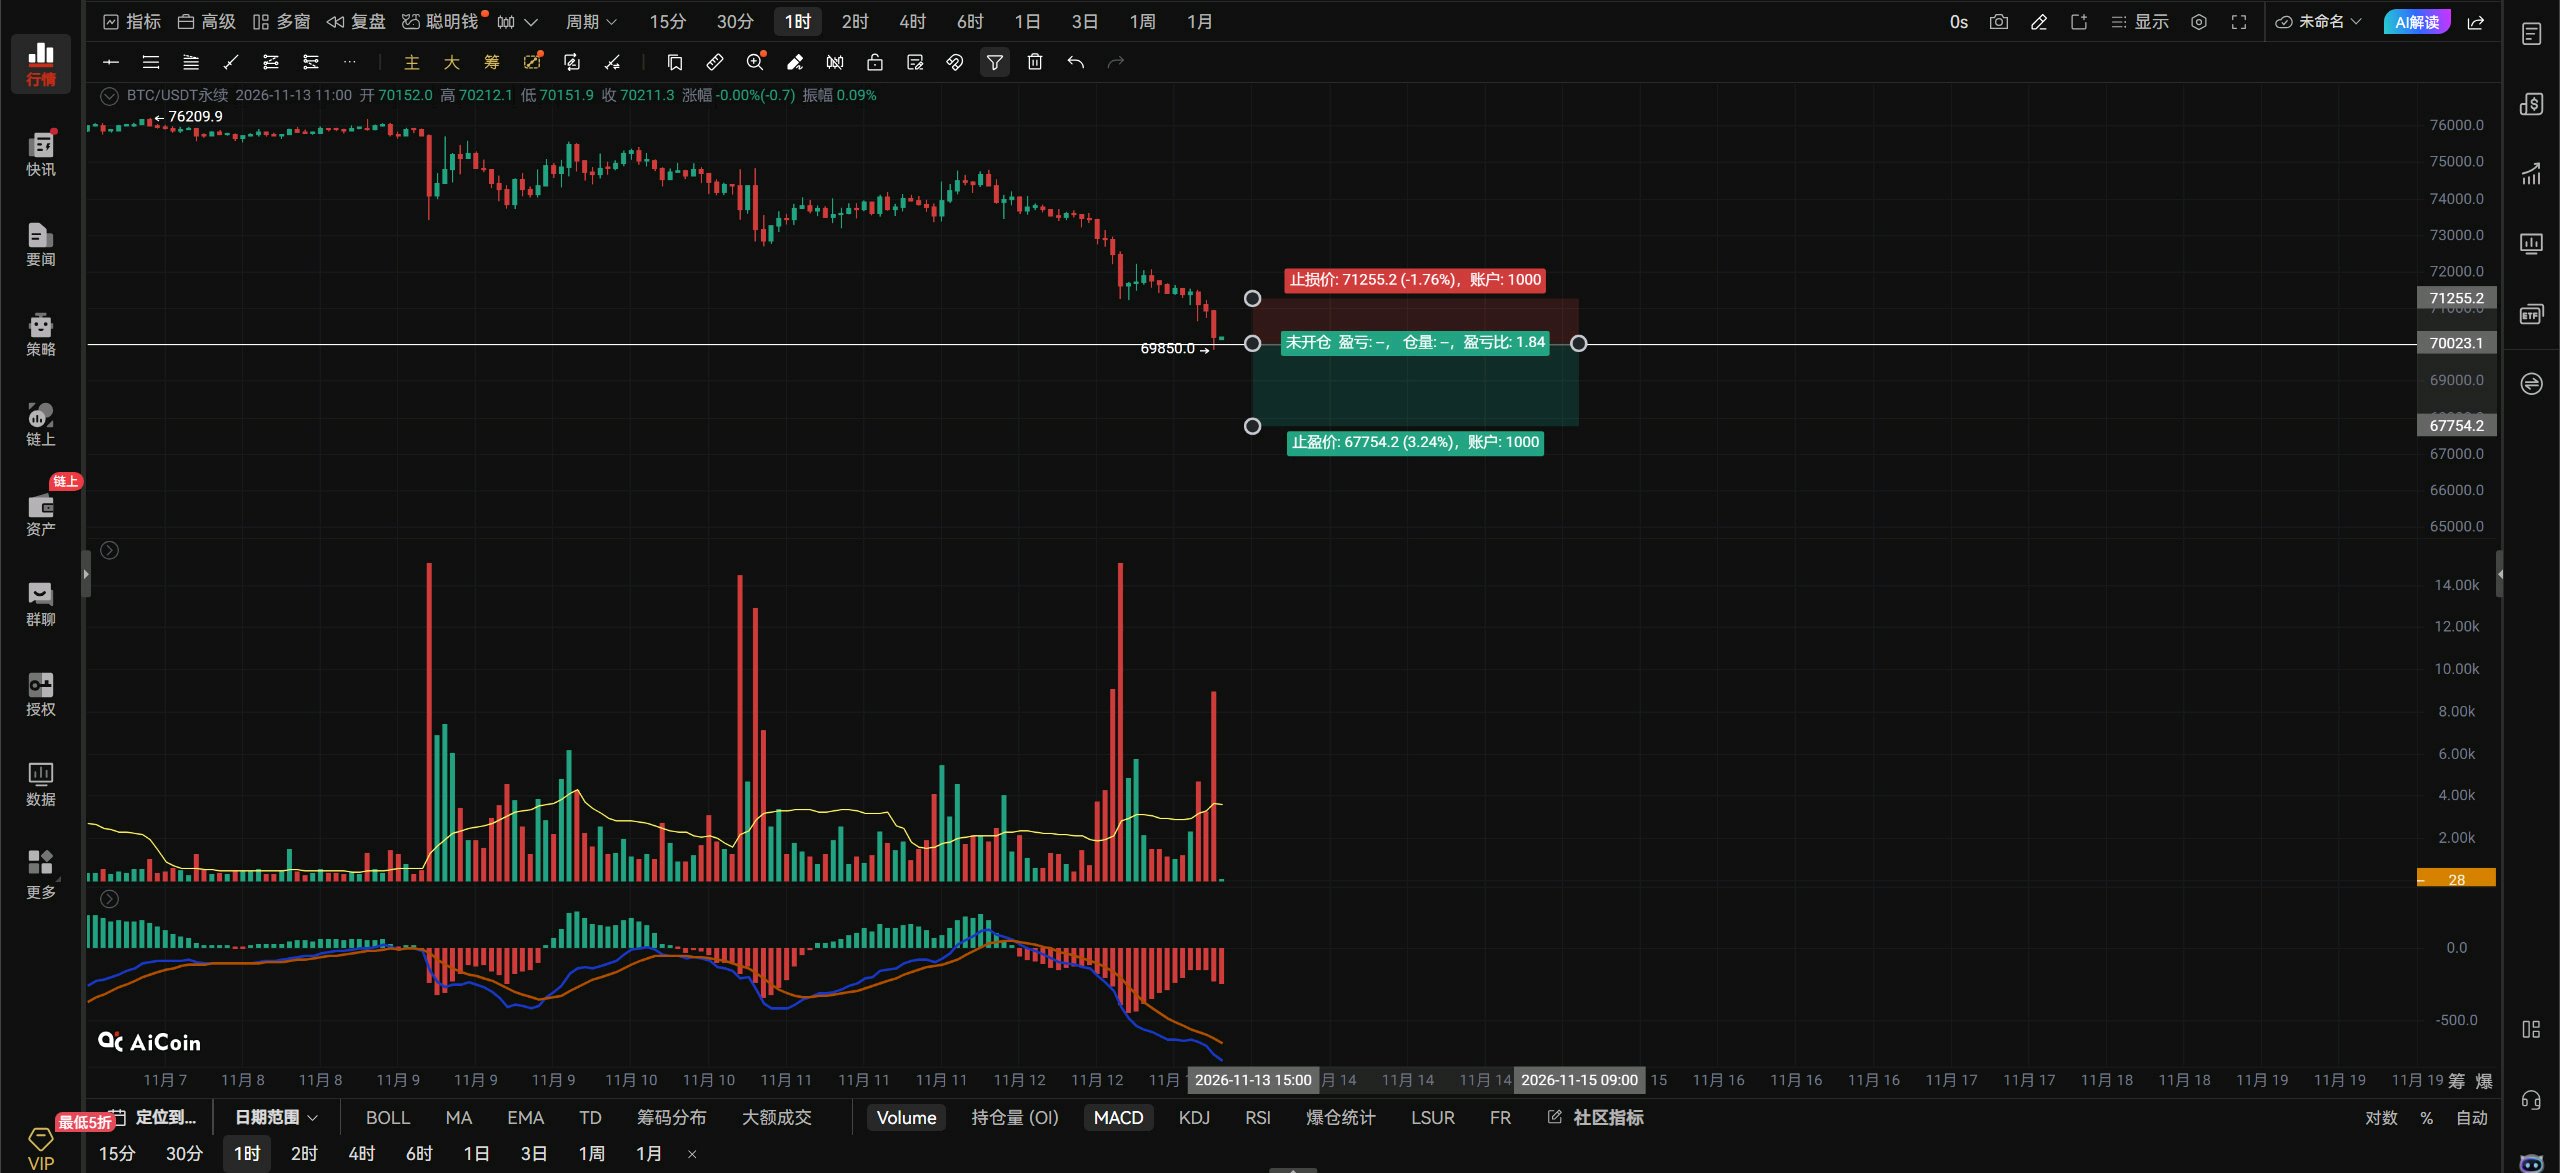
$BTCUSDT Nov. 13 midday market outlook.🌿 $BTC 's view: Bitcoin just keeps falling, and there’s no floor in sight now. Who knows where the bottom is? But I can tell you there are no signs of a bottom yet, because we haven’t seen a downward wick. A bottoming signal will only appear when there’s a rapid plunge accompanied by a wick. The long/short account ratio is still high at 3.0, which shows that retail traders going long are still increasing in number. This slow bleed doesn’t hurt retail longs much; it’s like being cut with a dull knife—painful, but the bulls can take it. It will take consecutive rapid drops to scare the bulls and bring the long/short ratio down. Once the ratio falls and there are fewer people going long, the price can be pushed up. After Bitcoin broke below the 73342 support, it didn’t stay there long; instead, it broke straight through the 72000 support. After breaking 72000, it tried to rebound and reclaim that level, as indicated by the red arrow above, but unfortunately it failed to get back above 72000. If it can’t reclaim it, then it’ll just keep falling! Bitcoin is currently testing support at 70464. If 70464 doesn’t hold, then 70,000 will be lost. Losing 70,000 could trigger panic selling, and once panic selling kicks in, there’s no telling how far it could fall. We’ll have to take it one step at a time. Only when panic selling appears will the bulls get scared and the long/short ratio come down. For now, the support below Bitcoin on the hourly chart is around 69058. At this rate, it looks like the bears won’t stop until they wipe out the bulls. If Bitcoin doesn’t break below 70464 and can consolidate between 70464 and 72000, there’s still a chance of an upward rebound. But if it breaks below 70464, it won’t be able to bounce back. What should you do if you want to go long now? Watch to see whether 70,000 gets briefly broken and then reclaimed. If it does, you can take a small long position; if it breaks straight through, stay out. If Bitcoin breaks above 70464 on strong volume, aggressive traders can chase a long on the right side. If it breaks below 70000 on strong volume and then fails to reclaim it on a rebound, chase a short on the right side. Use a stop-loss. On the hourly chart, if Bitcoin breaks above and holds 70464, look for 72000–73342. If it can’t get above 70464, there’s no point. A break below 70000 on the 4-hour chart points down to 69058–67771. Resistance above: 70464–72000–73342 Support below: 70000–69058–67771#ByXIMPACT
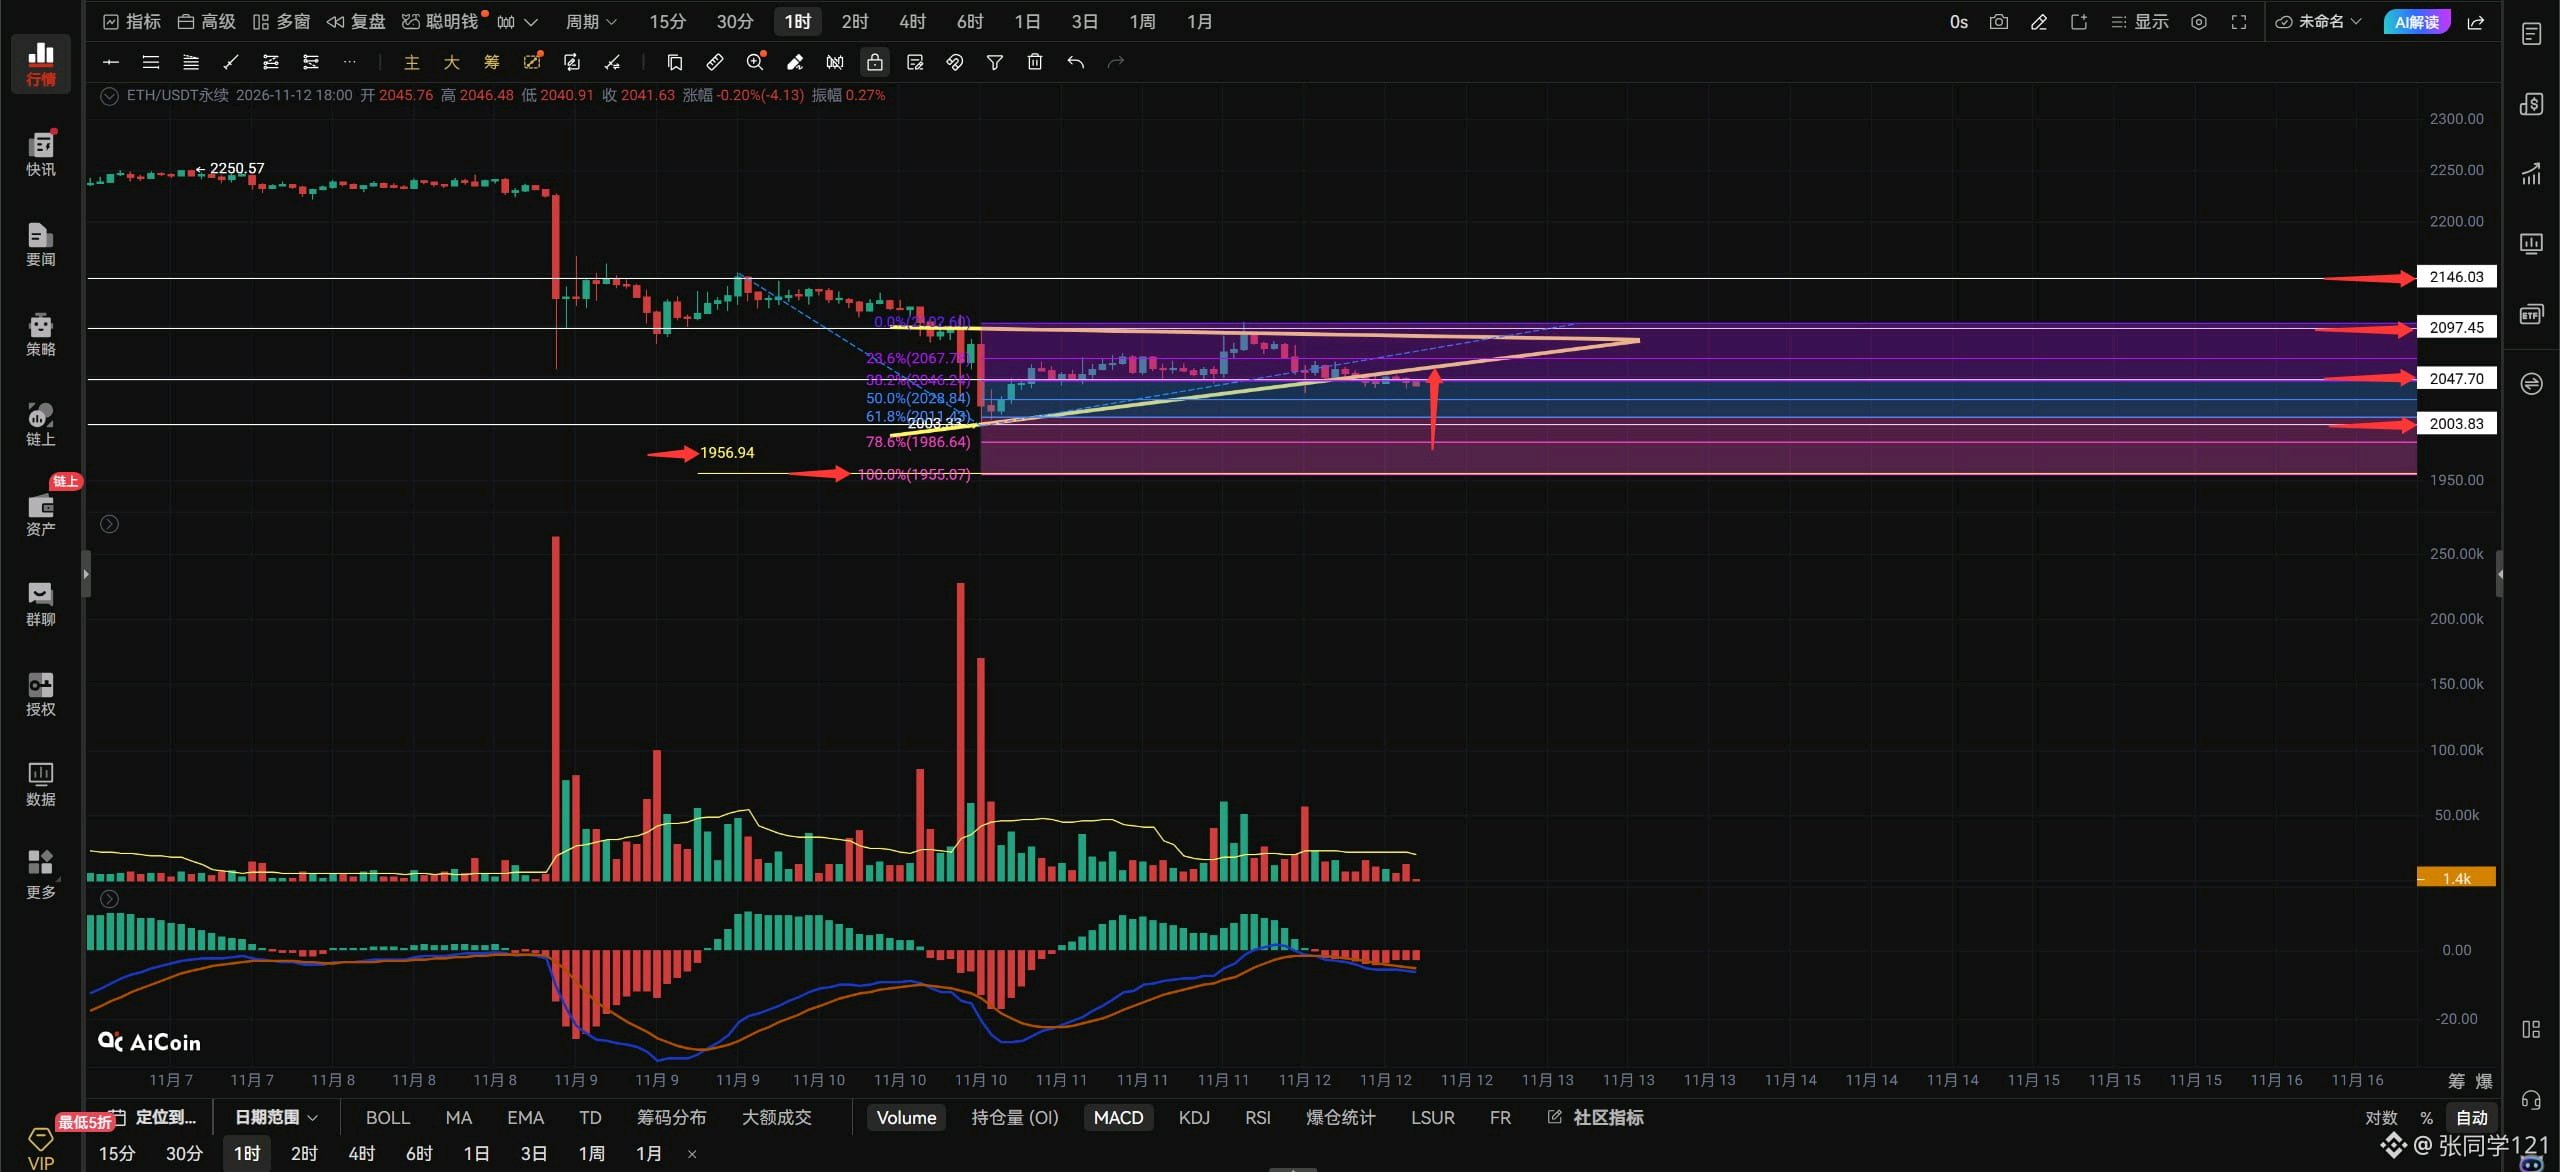
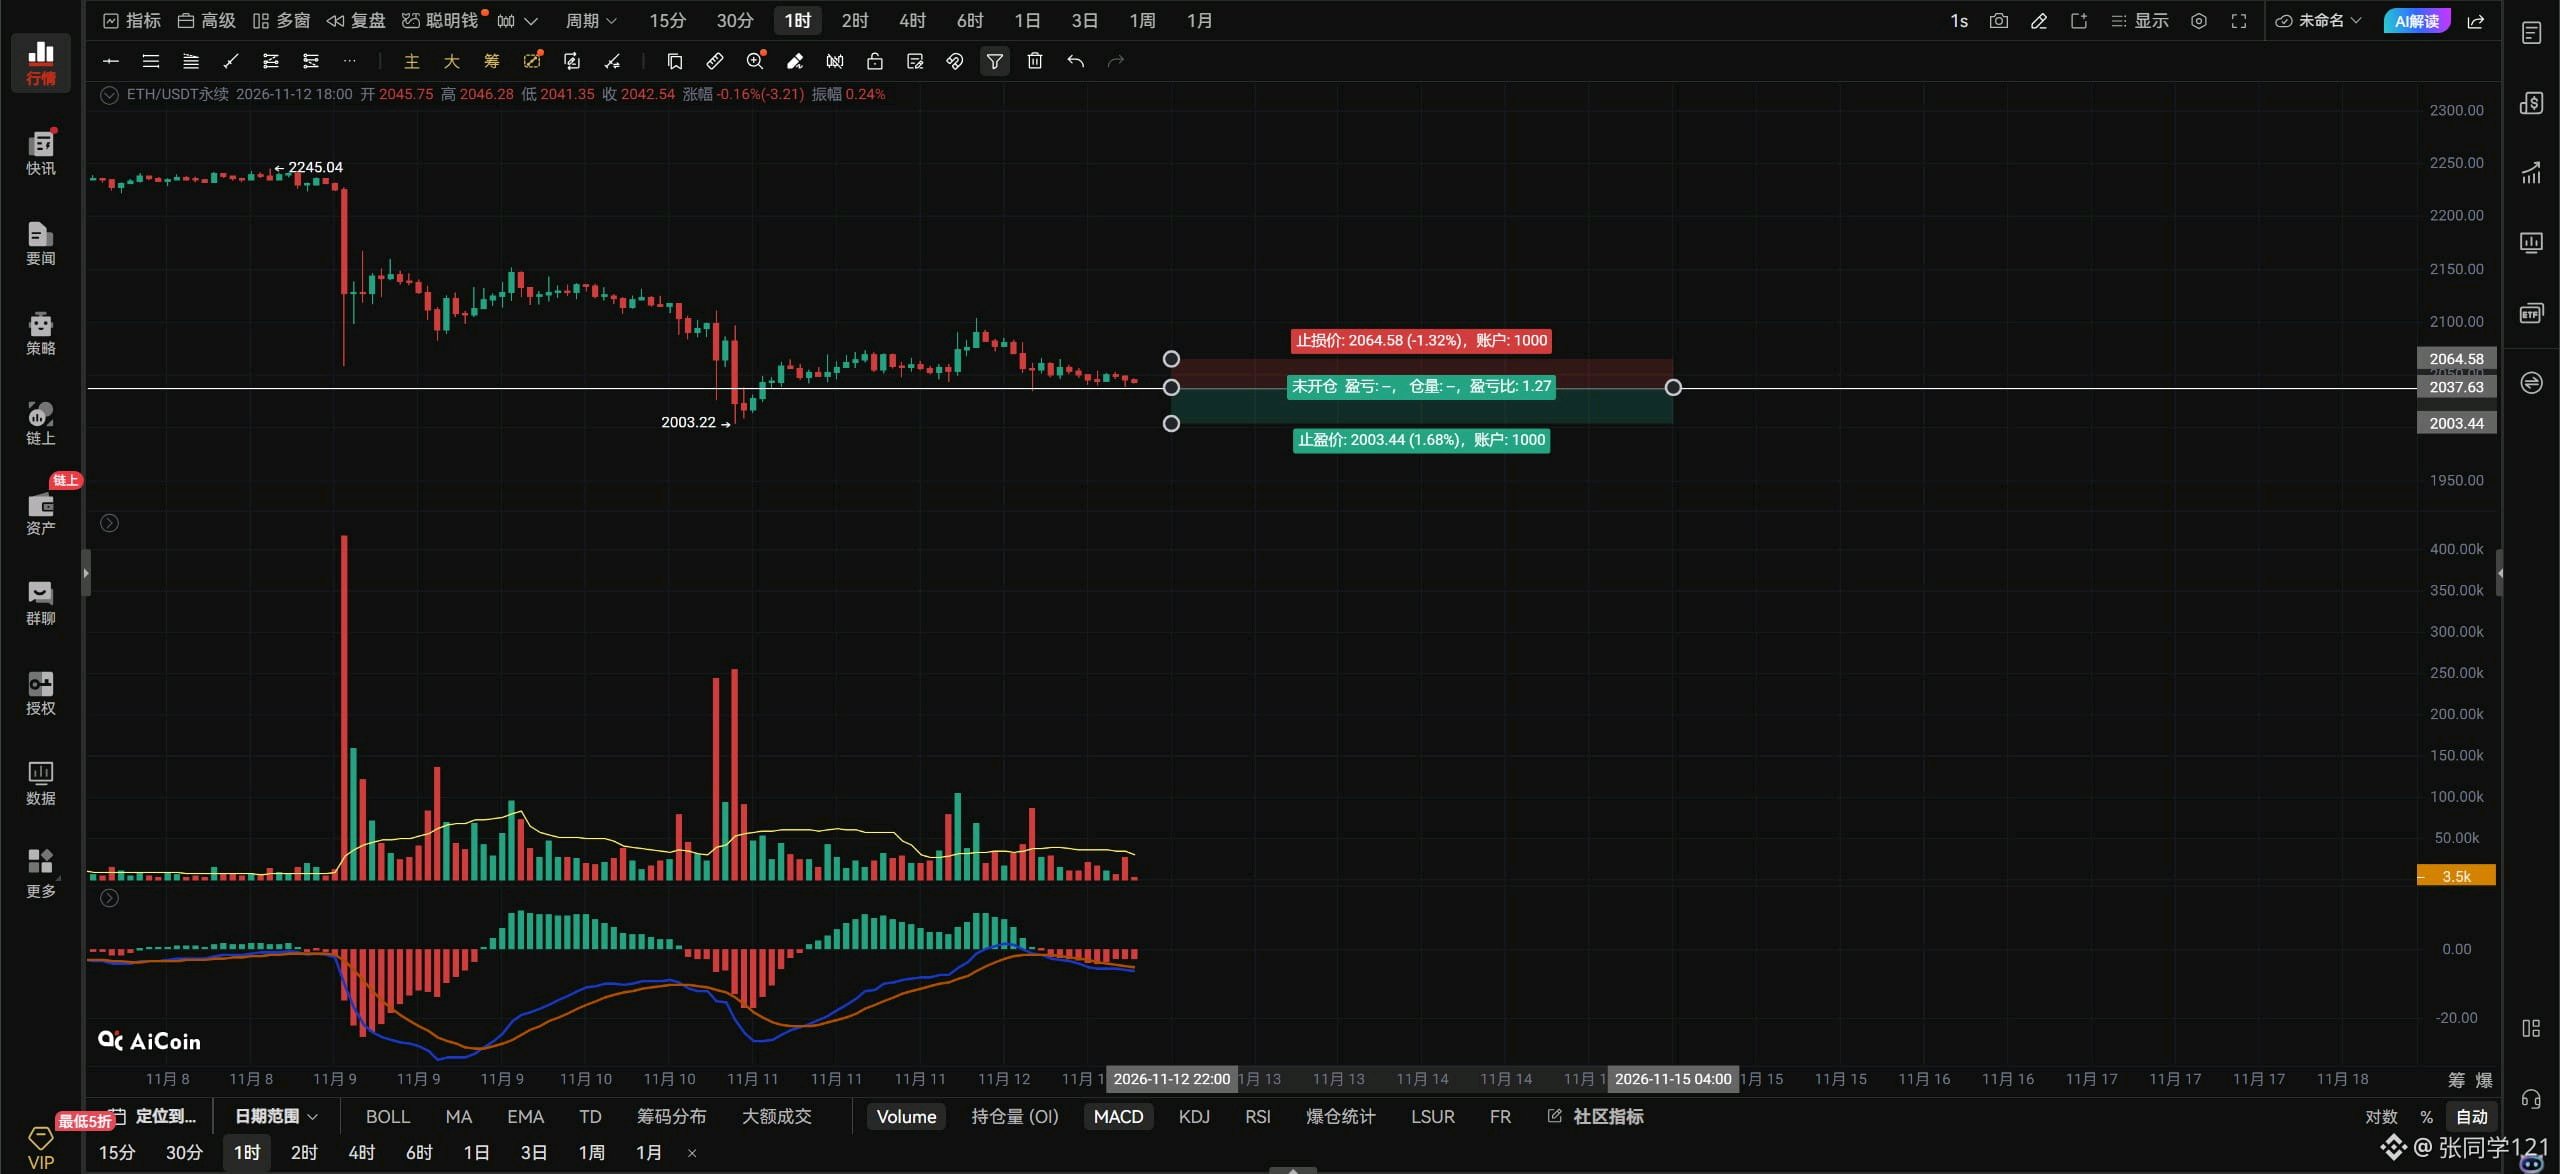
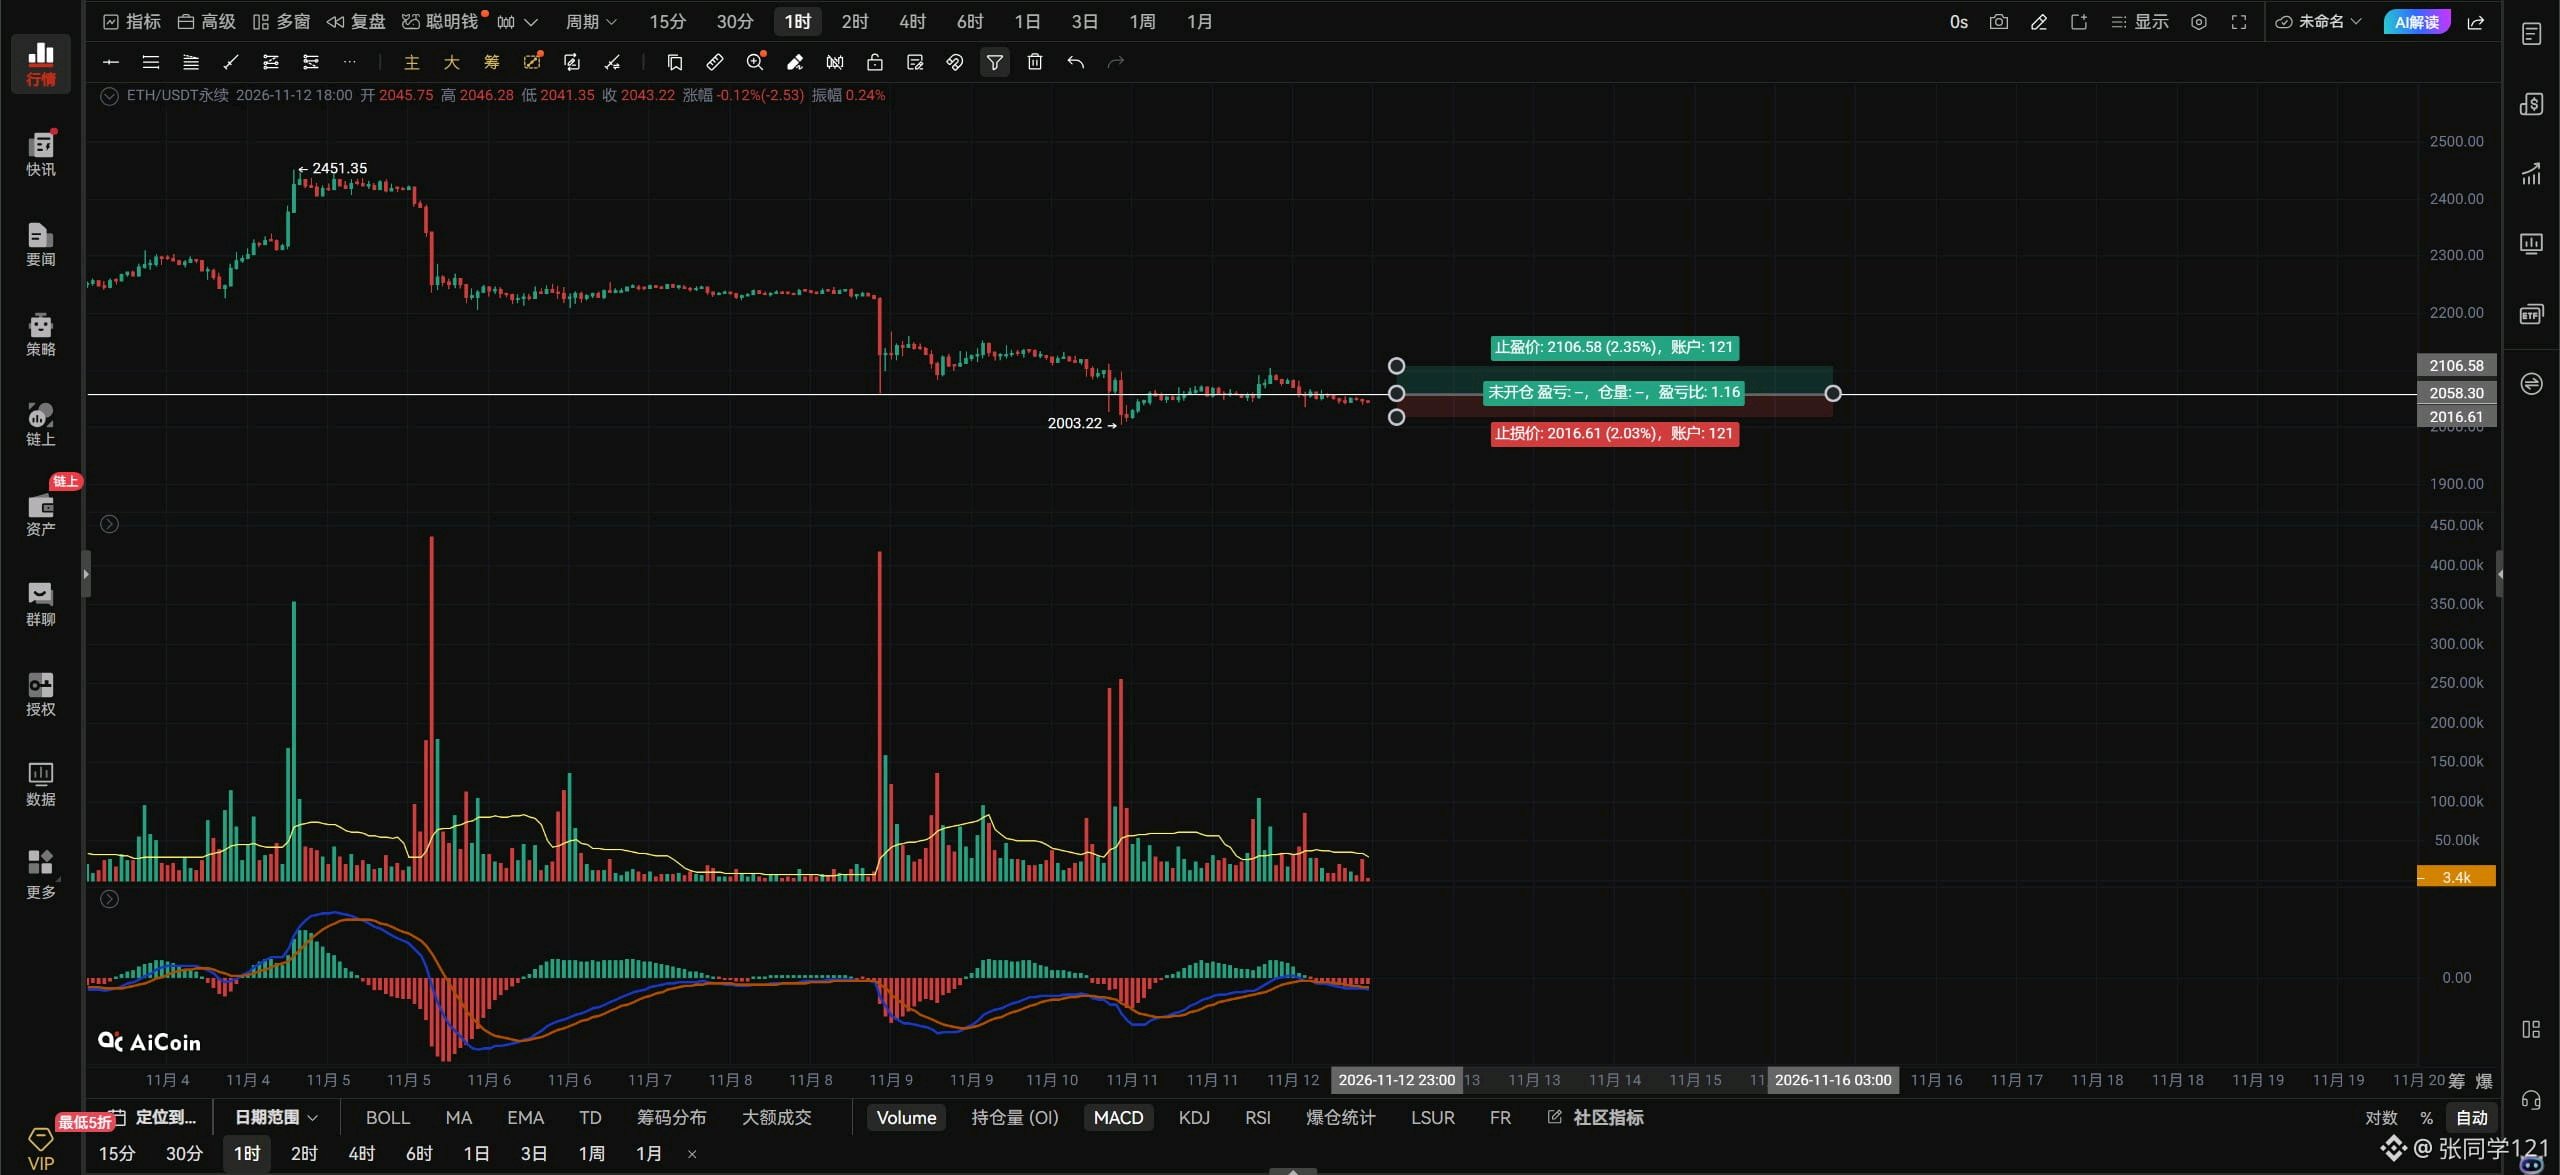
$ETHUSDT Evening outlook: Nov. 12. ETH’s triangle has broken down, and it has also fallen below the 2047 support. If it can’t reclaim 2047, it’s headed for 2000. This price action over the past few days has been really frustrating: it can’t go up, but it can’t go down much either. We don’t know what BTC and ETH are waiting for—or what other news is yet to come. ETH needs to get back above 2047 to stop falling. A break above 2097 could kick off an hourly rebound. If you’re looking to go long on ETH, you can wait for it to retest around 2000 and look for a bottoming signal, or wait for it to break above 2047 and go long on the right side. ETH must hold 2000; if it breaks below that level, Fibonacci levels point to around 1956. For this hourly downswing in ETH to rebound, it needs to break above 2146. Only then can the hourly downtrend shift from its current bearish trend to a bullish one. If ETH breaks above 2058 with strong volume, aggressive traders can go long on the right side. If it breaks below 2037 with strong volume, go short on the right side. Keep an eye on volume and use stop-losses. If ETH holds above 2058 on the hourly chart, look for 2097–2146. If it breaks below 2047 on the 4-hour chart, look for 2000–1956. There’s not much else to say about the other timeframes, since the market has been consolidating for the past few days. ETH spot around 2000 is worth buying, so go ahead and buy spot! Don’t hesitate—you might miss the move up if you’re not paying attention. Don’t assume there’s much further to fall and keep waiting for a lower price to buy spot; constantly chasing lower prices is also a form of greed. That’s all for now. $ETH #ByXIMPACT
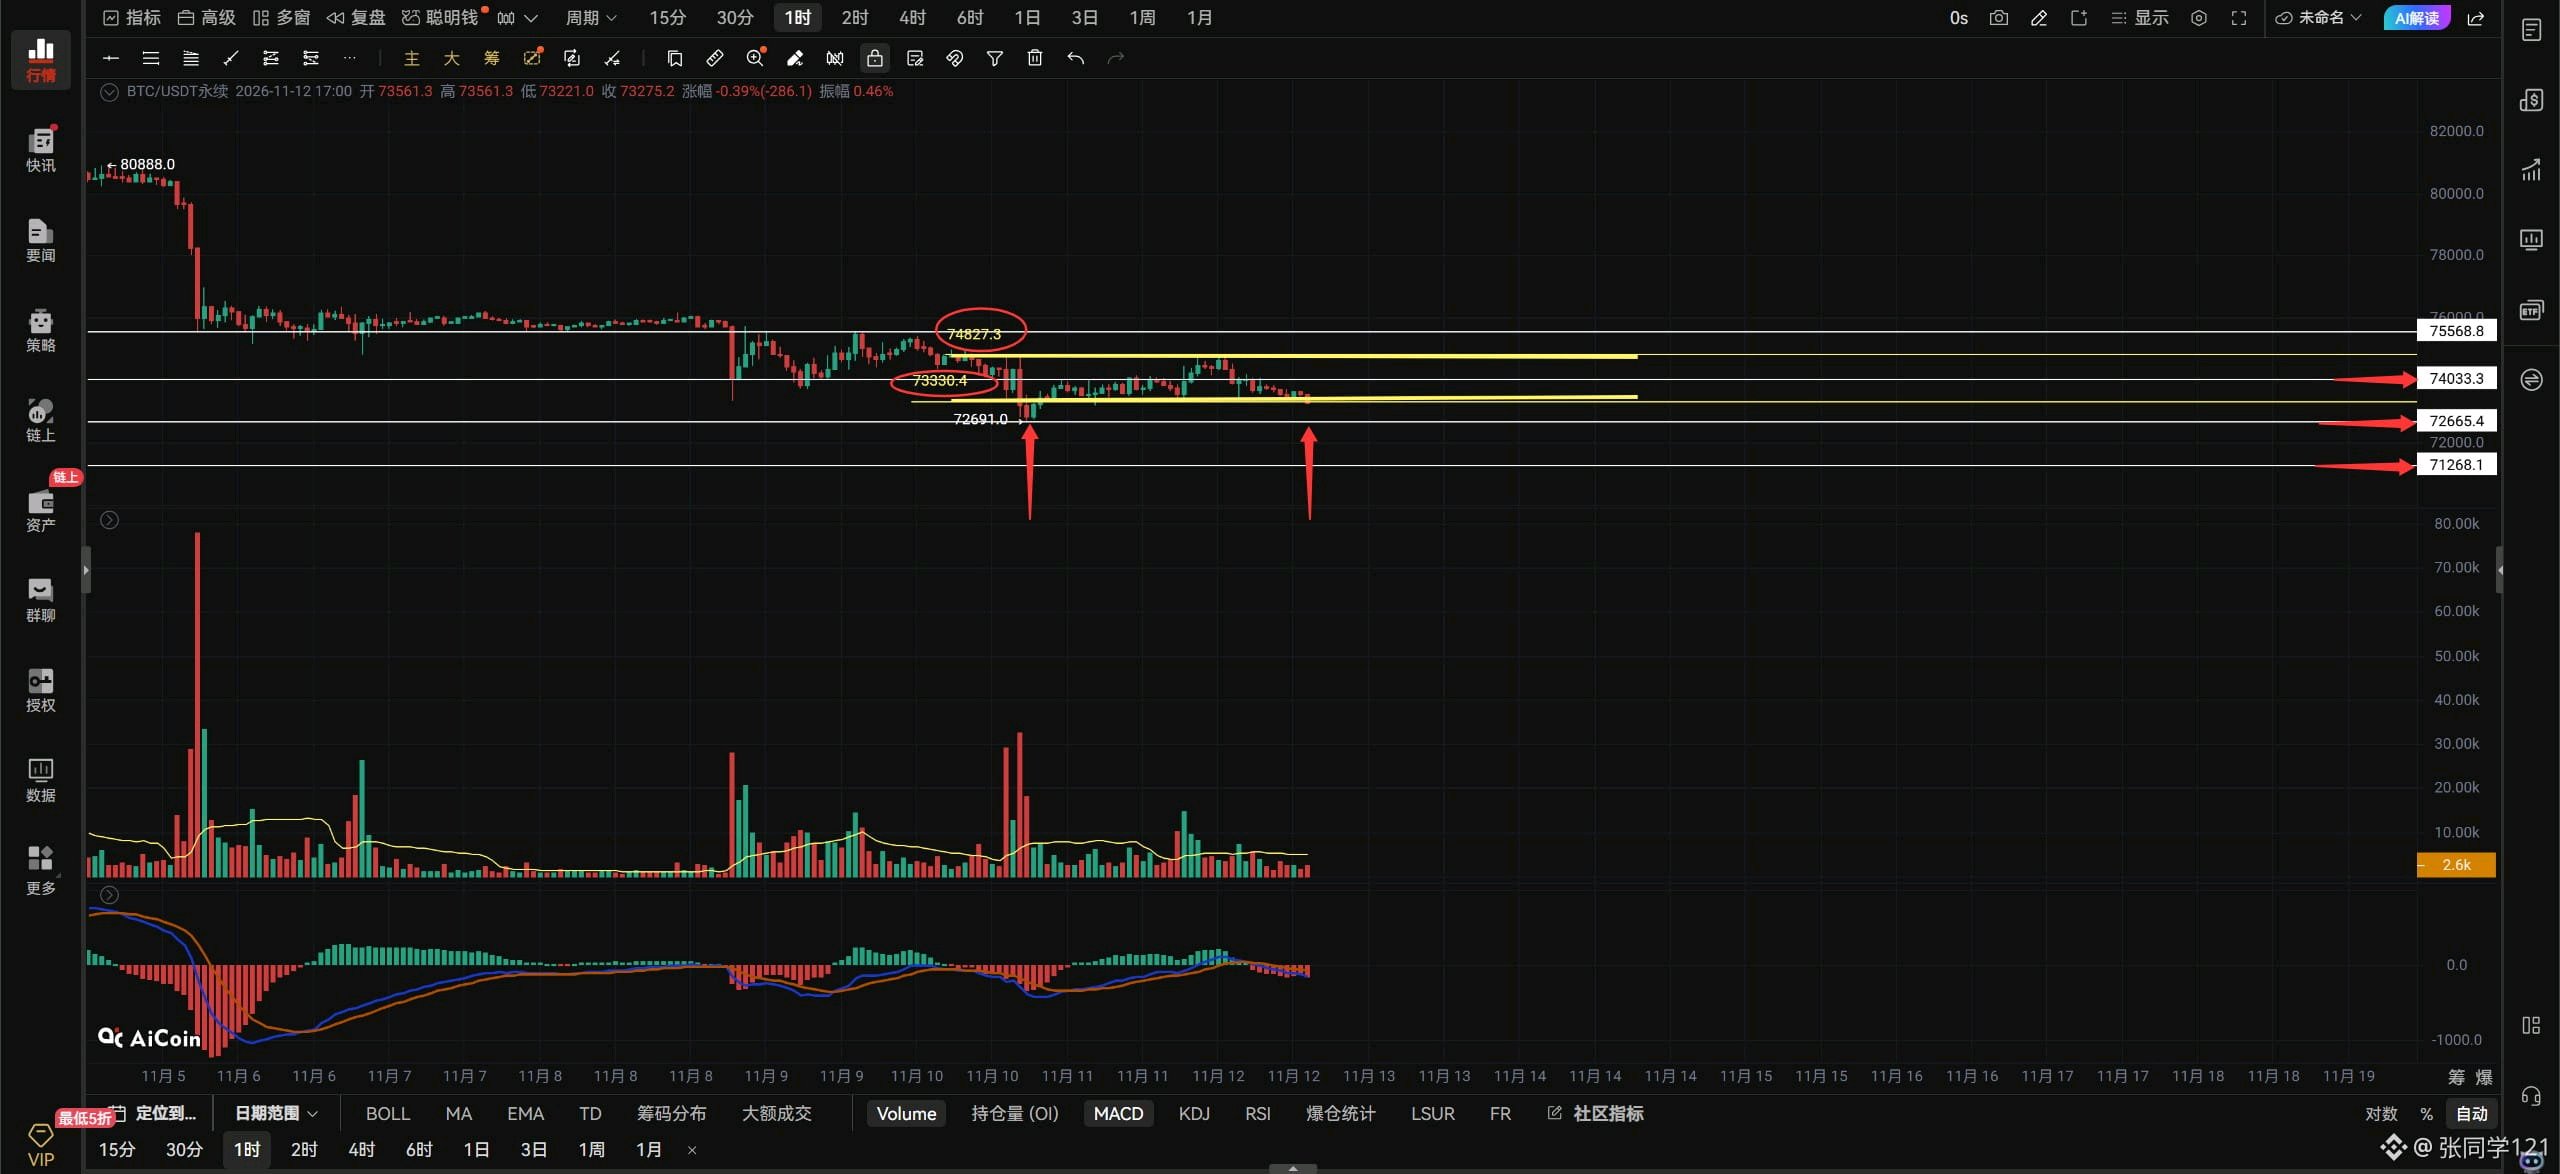
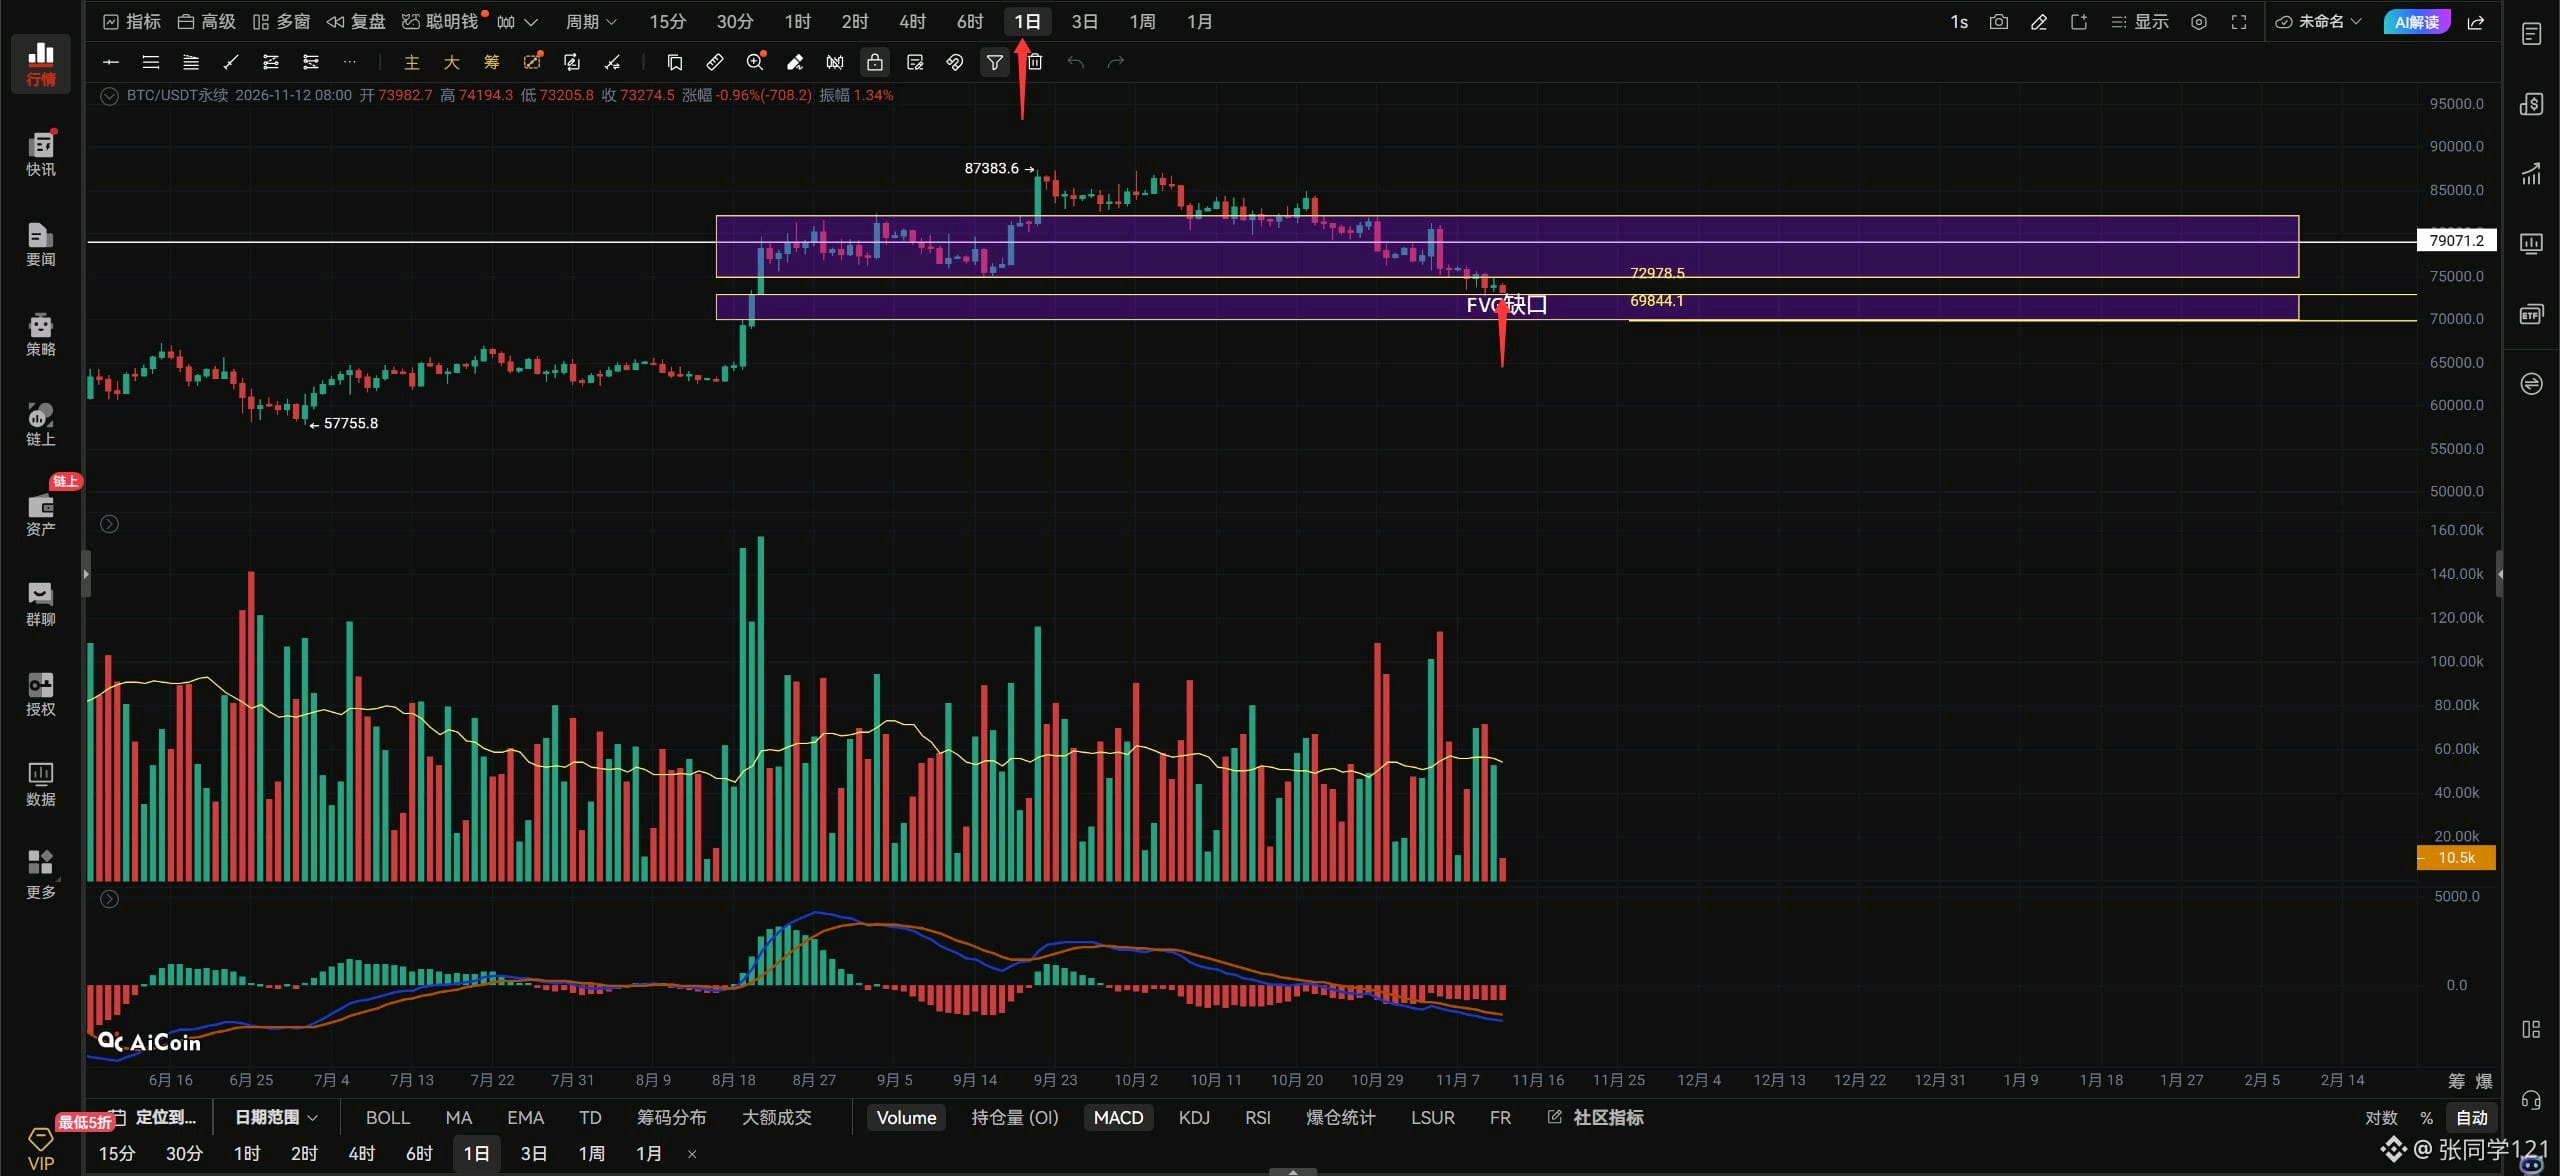
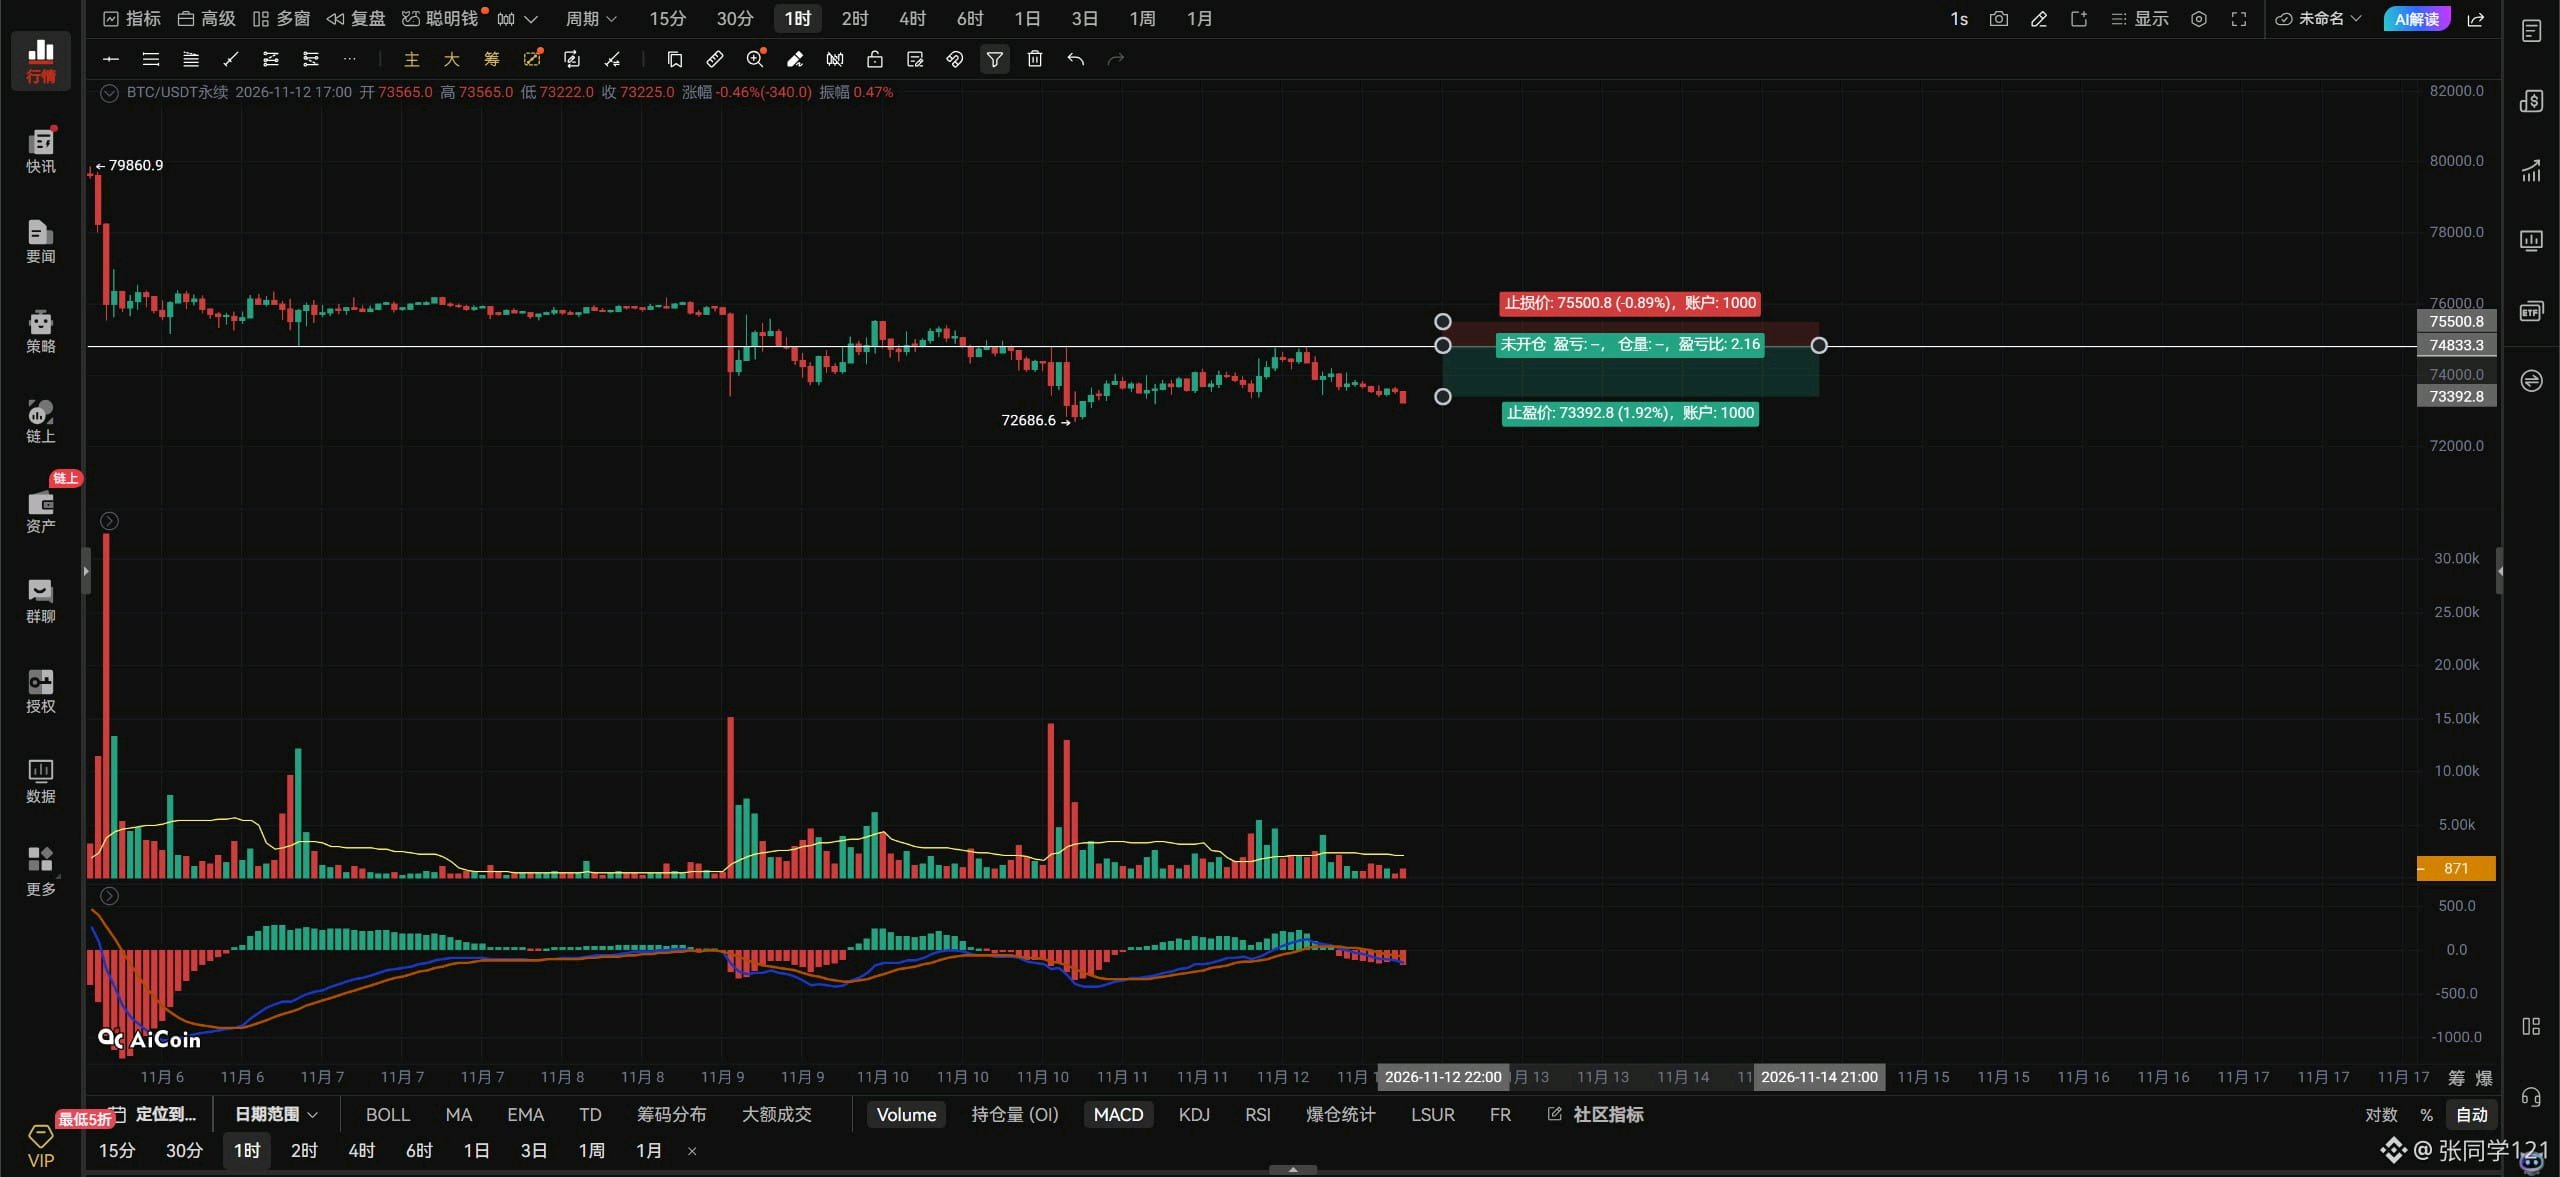
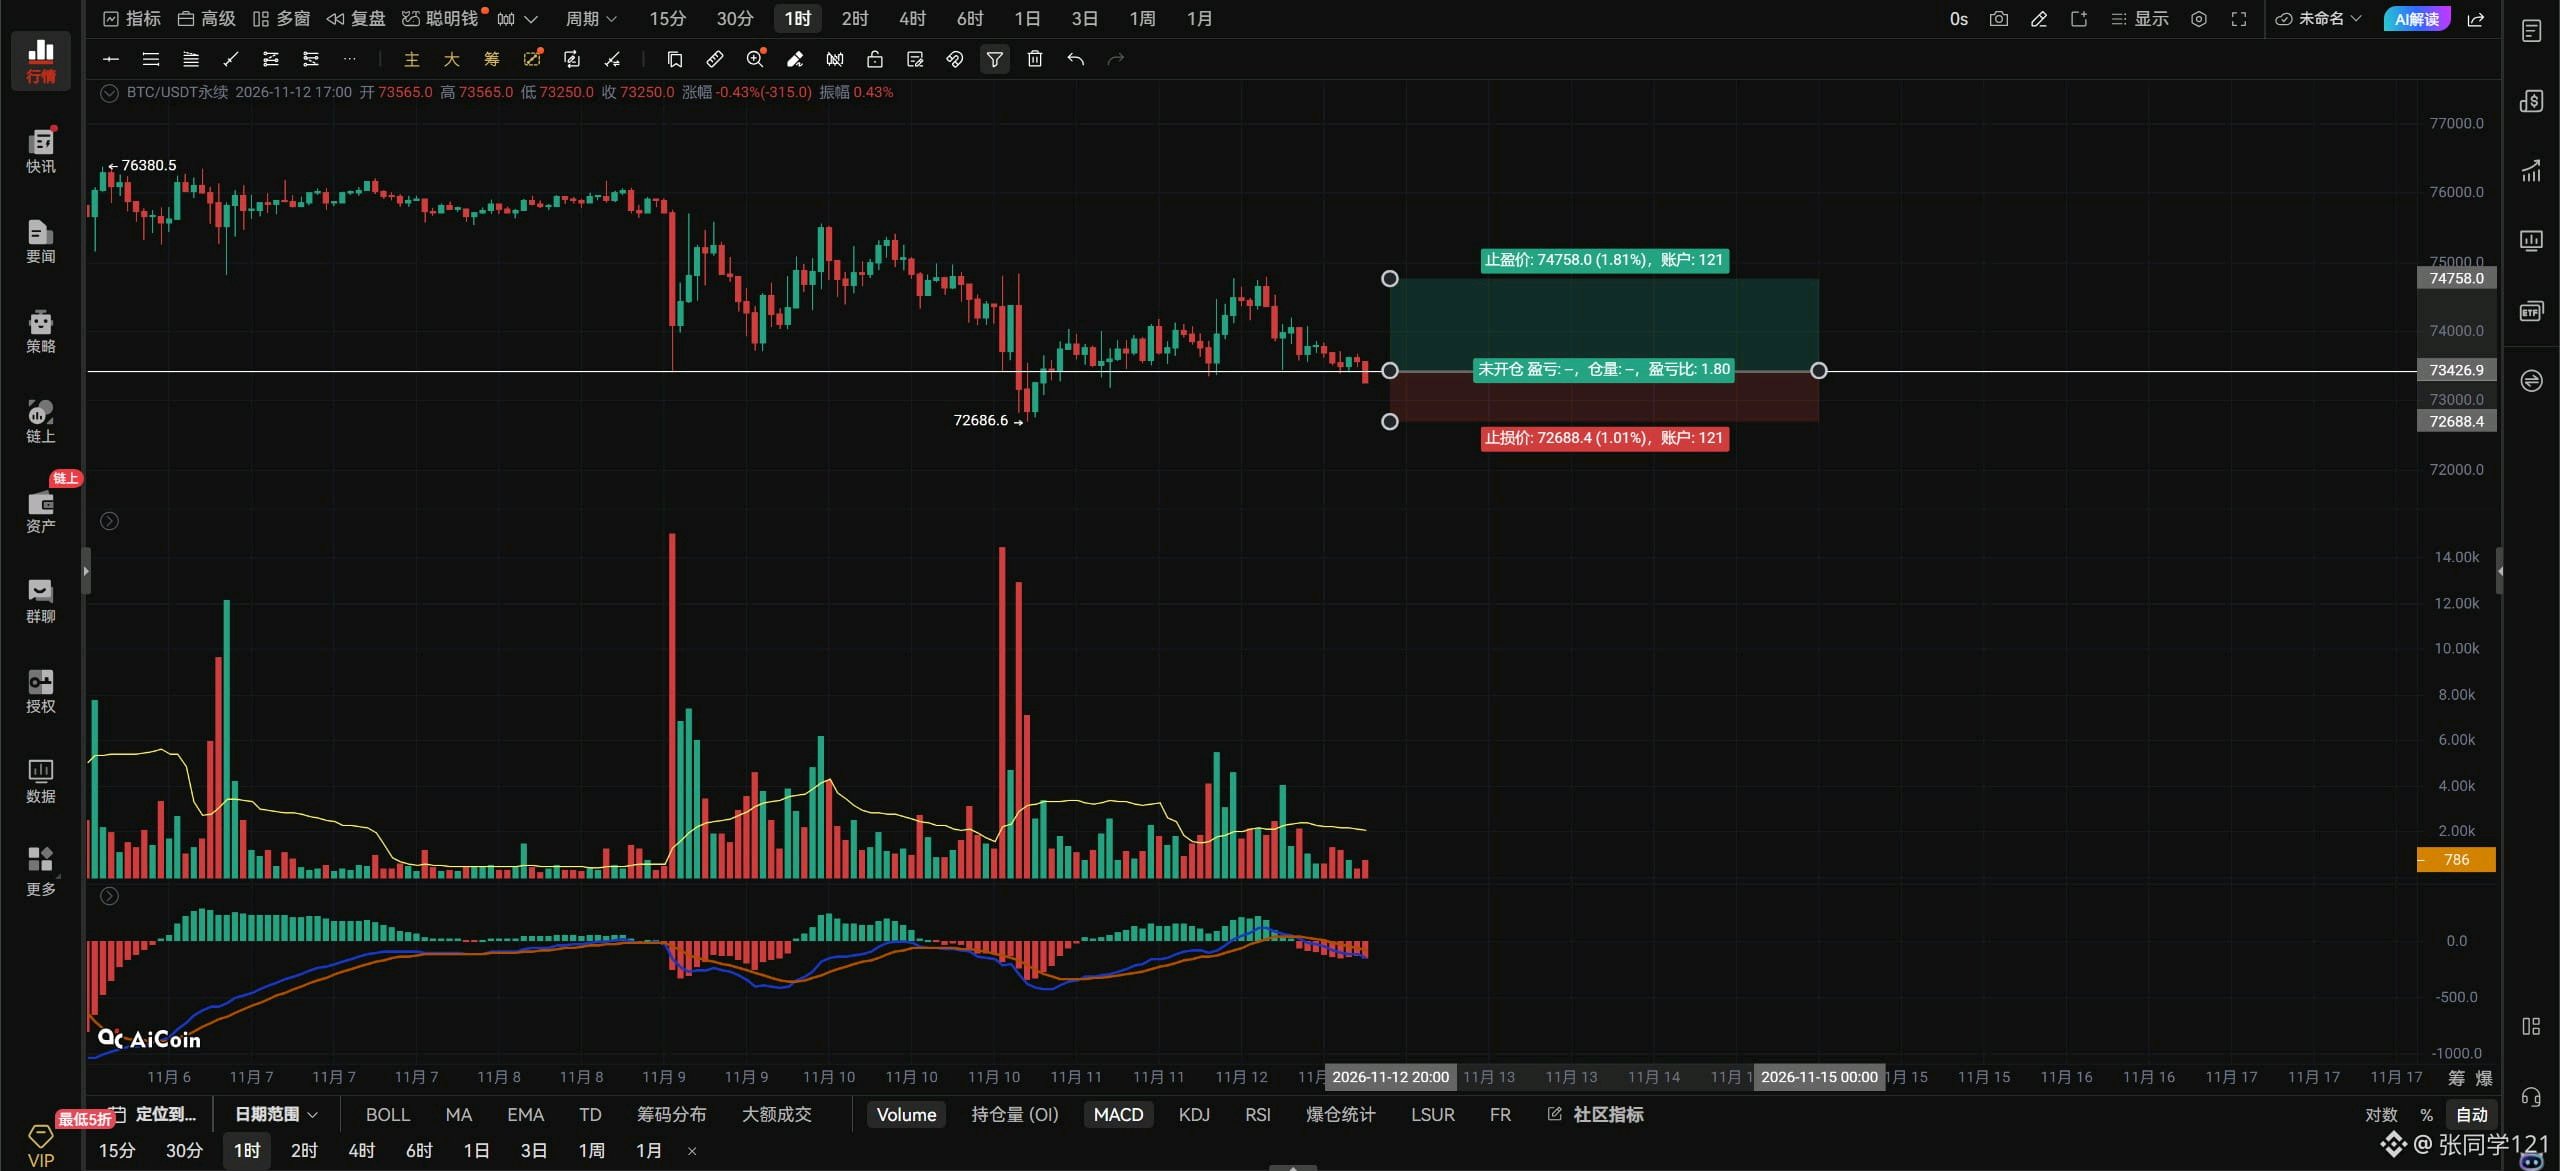
$BTCUSDT Evening market outlook: 11.12. Crude oil is down and Bitcoin is down. Crude oil is up and Bitcoin is still down. U.S. stocks are up and Bitcoin isn't rising either. Will this sell-off ever end? If you keep falling, the bulls won't enter. With no opposing buyers, you bears might as well go play in the mud by yourselves! We've fallen quite a bit; this should be about enough. We’ve dropped this much even without any clear catalyst from bad news—imagine how much further we'd fall if a major shock hit. Bitcoin must not break below the 73333 support. Once 73333 is broken, a second retest of the previous low is on the cards. It would be okay if the previous low holds on the second retest, forming a potential hourly double bottom. If price consolidates between 73333 and 72691, there will still be a chance to challenge the 74000 resistance. If the previous low fails to hold and is cleanly broken, 71268 will be right in front of you. For Bitcoin to stop falling on the hourly chart, it must get back above 74000 and hold there. If it can't reclaim 74000, the slow decline will continue. To extend the rebound, it must break through the 74800 resistance; only then can it continue higher toward 75568. If it can't get past these two levels, Bitcoin will keep fluctuating and ranging. If Bitcoin breaks above 73426 with strong volume, aggressive traders can chase longs on the breakout. If it rebounds to 74833, consider a small, anticipatory short. Be sure to set a stop-loss. If Bitcoin breaks above and holds 73426 on the hourly chart, look for 74000–74800. If it can't get above 73426, there's no point. If it breaks below 73333 on the 4-hour chart, look lower toward 72691–71268. On Bitcoin's daily chart, I hope the bearish candle currently forming—the one indicated by the red arrow below—closes as a bullish candle tomorrow. It doesn't need to be a large one; it just needs to engulf the previous bearish candle. That would form a daily Morning Star pattern. If tomorrow's daily candle doesn't close bullish, then get ready for Bitcoin to fill the FVG gap below! I hope my prediction comes true. That's all for now.#ByXIMPACT
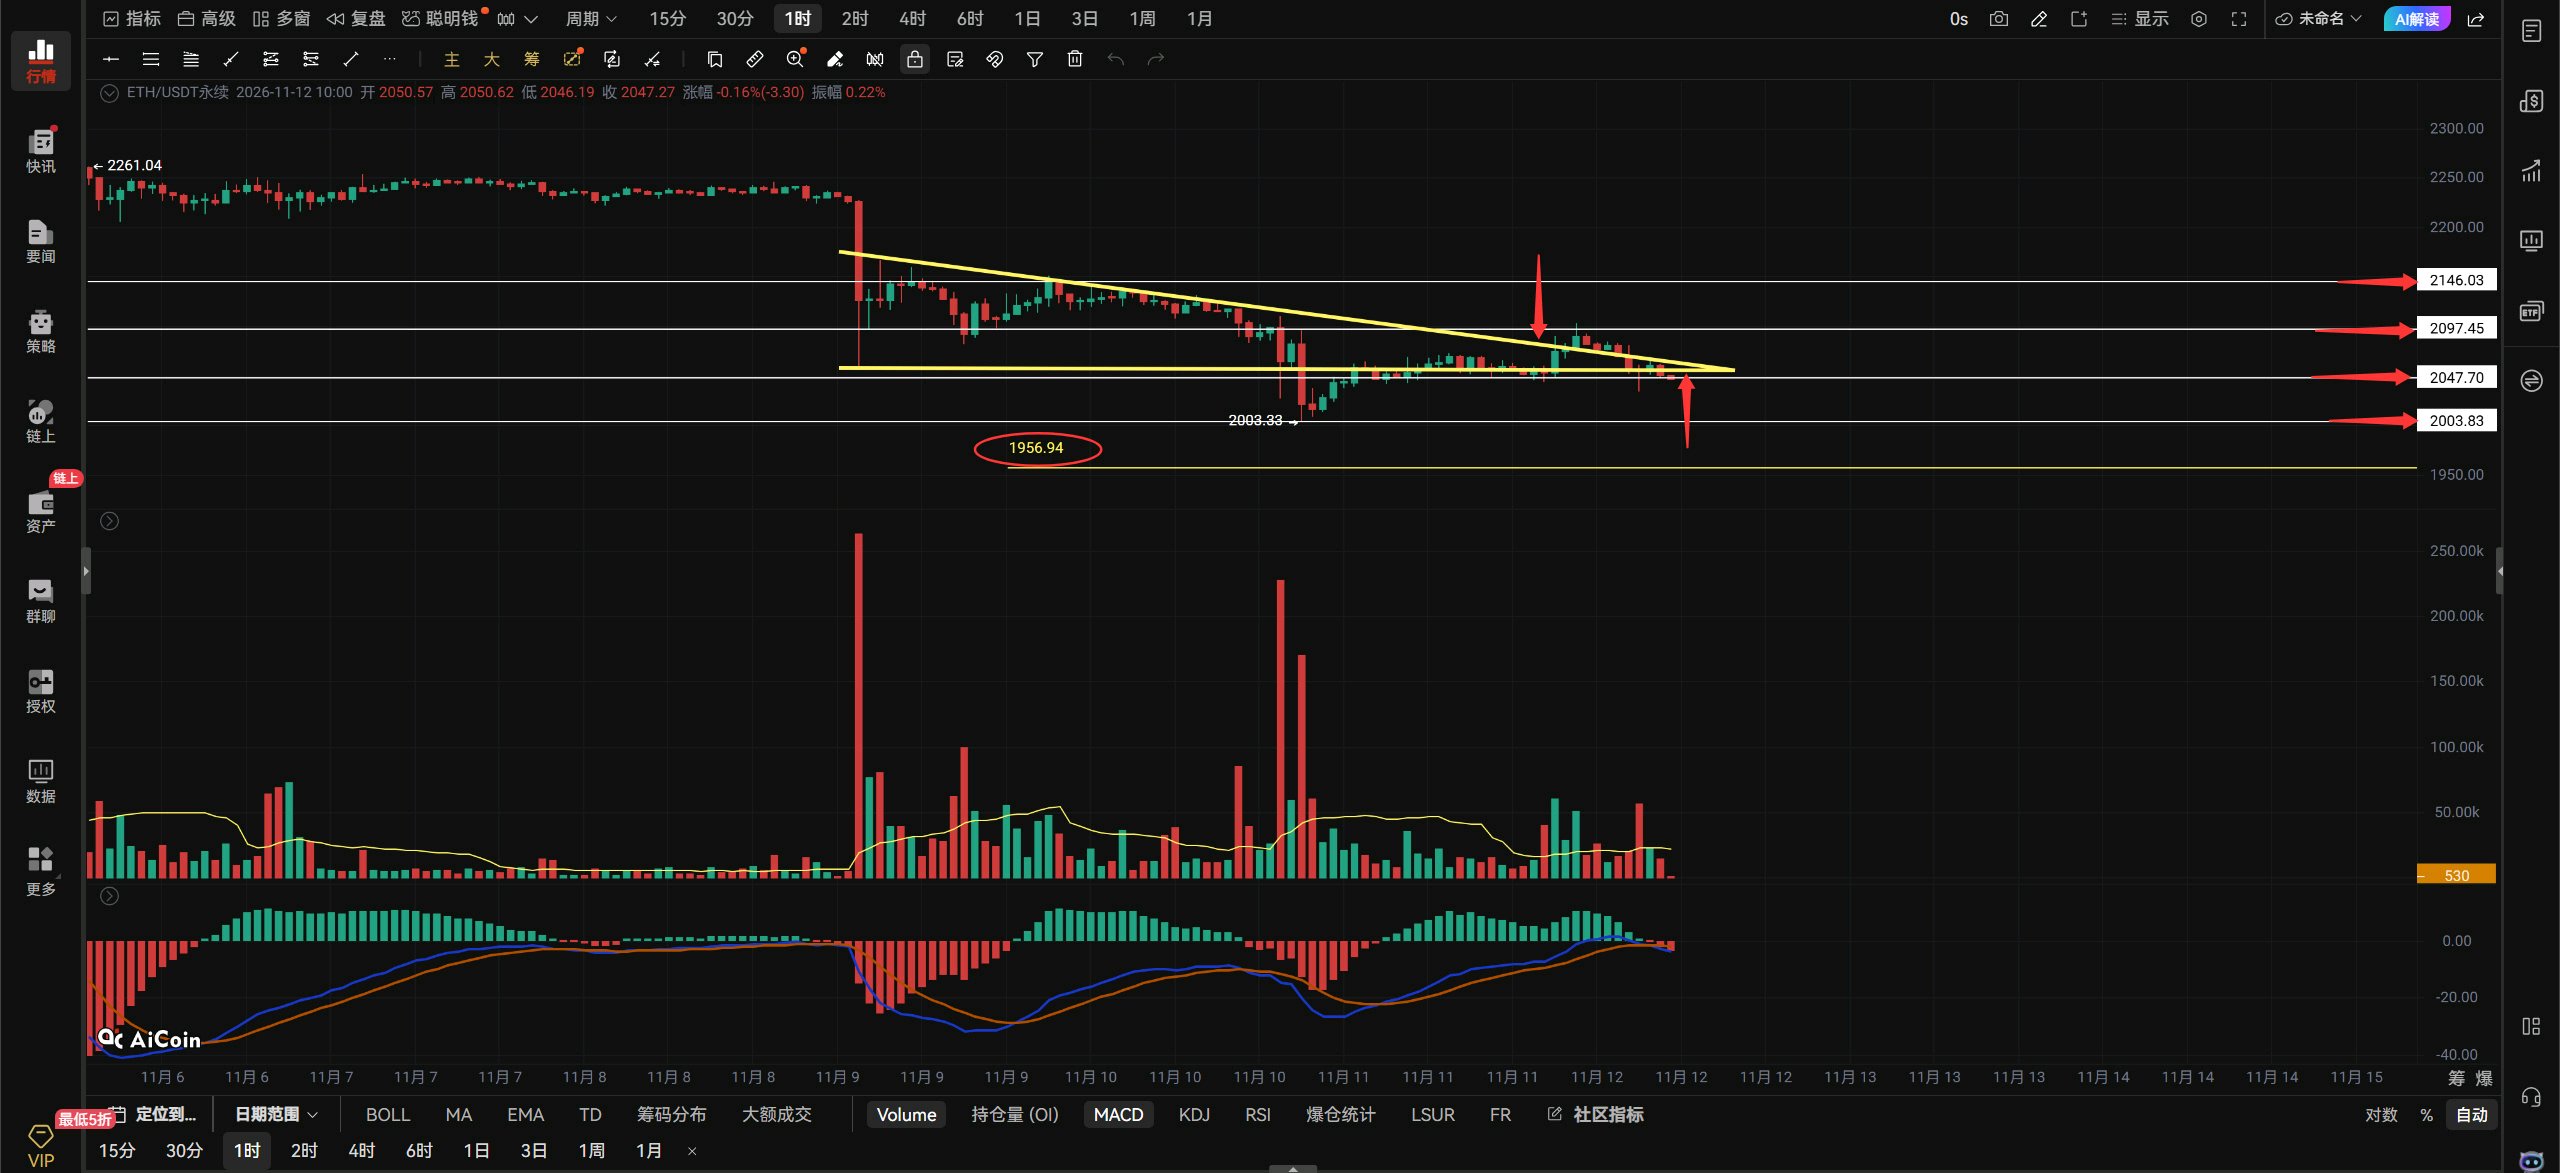
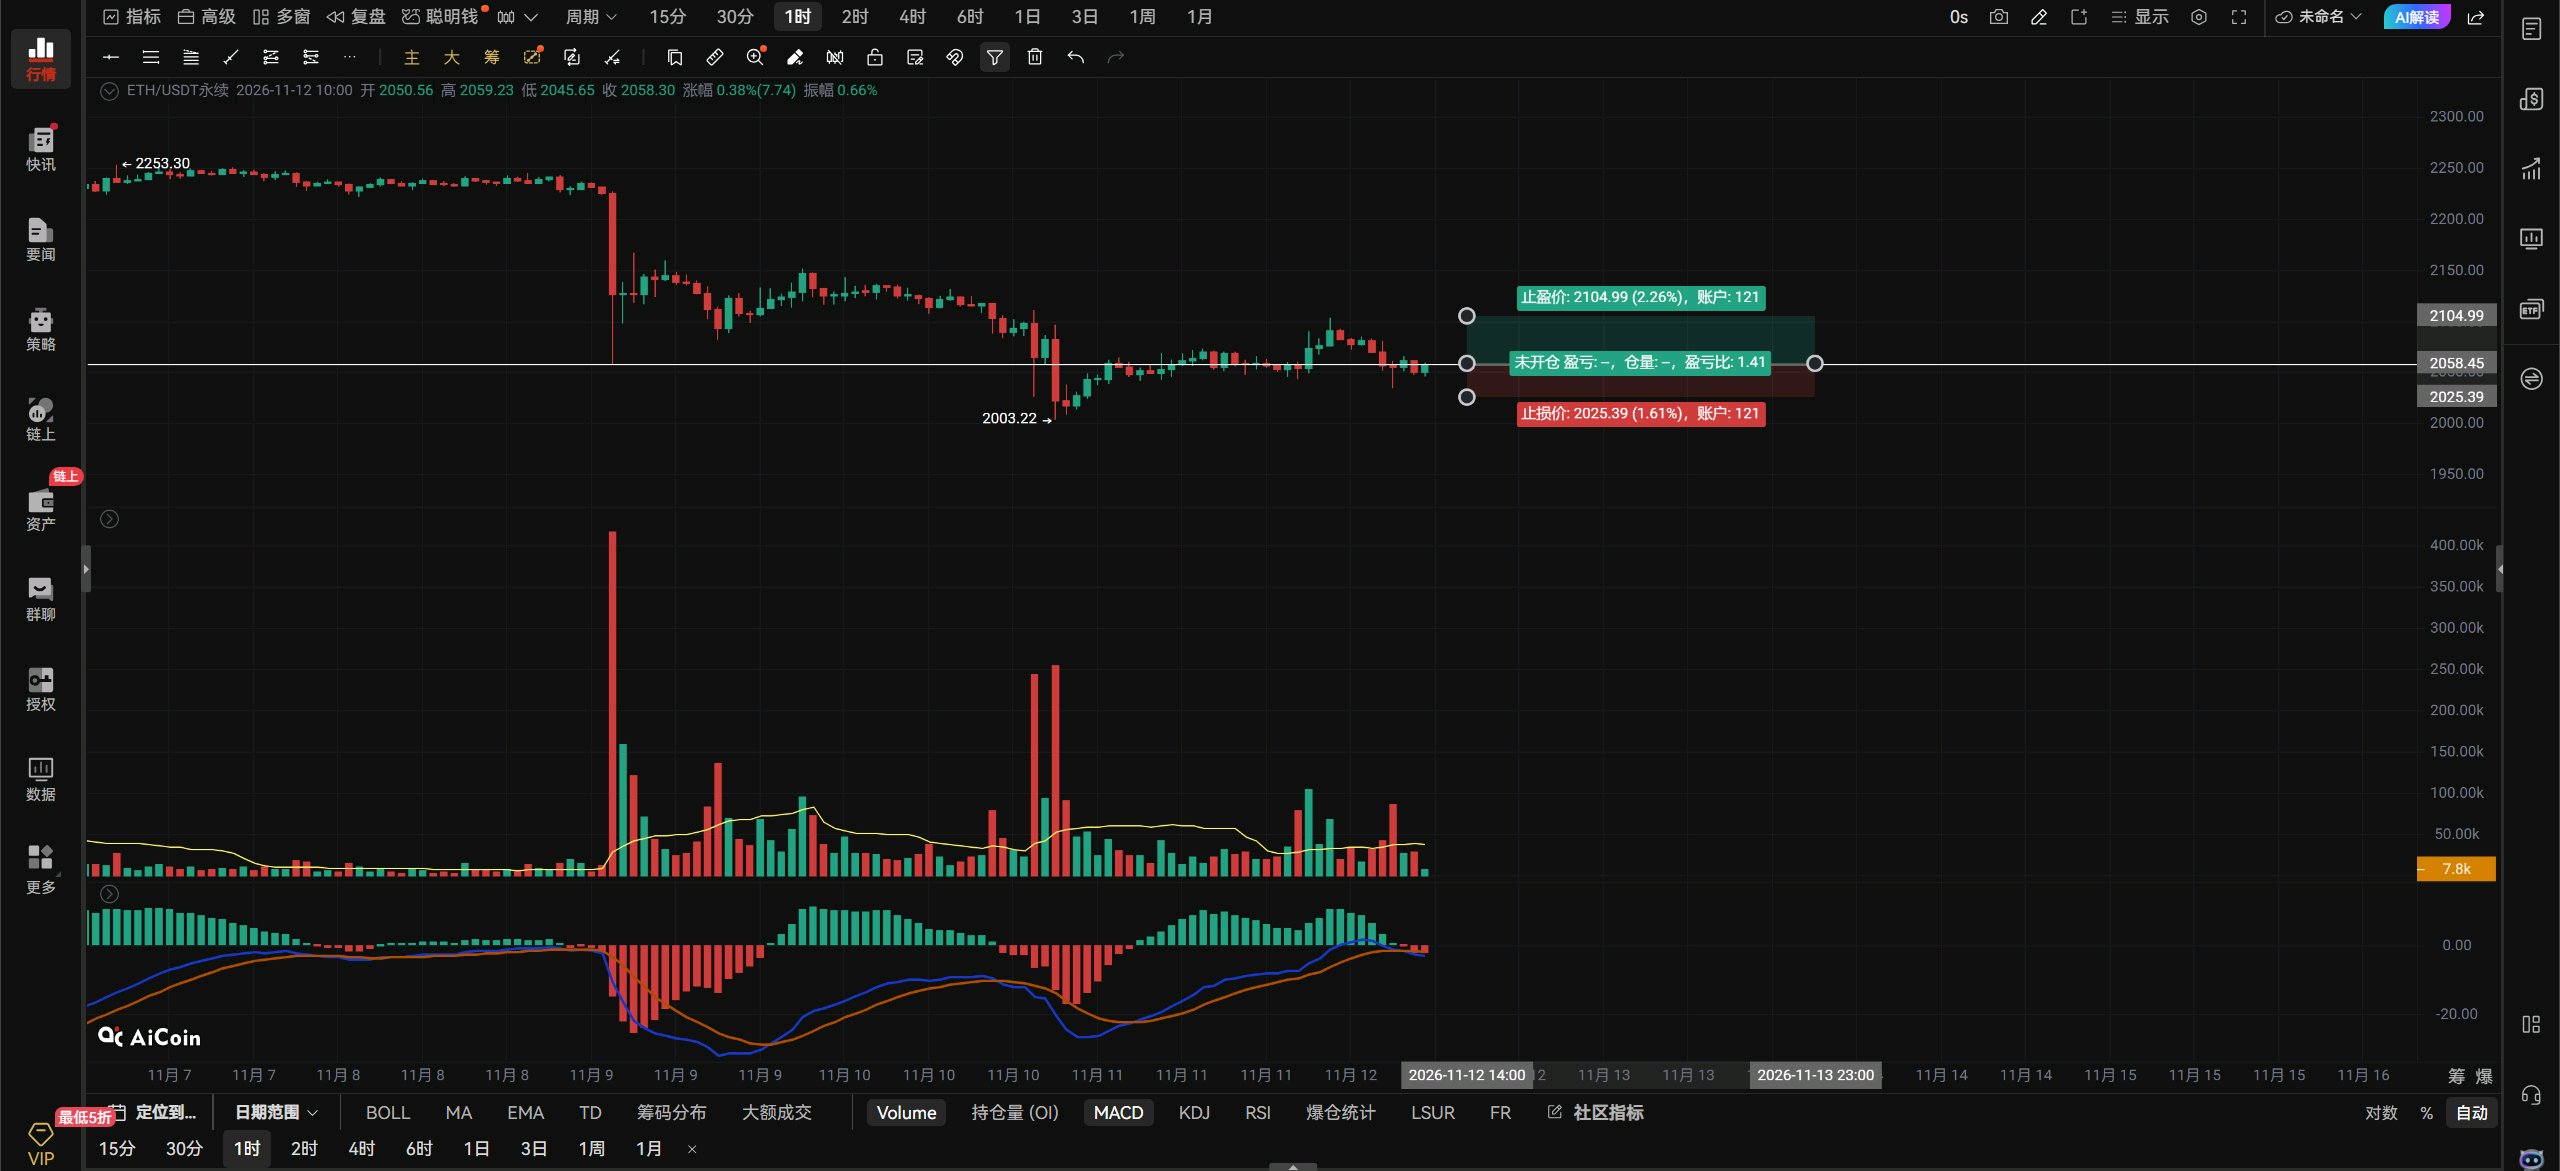
$ETHUSDT Outlook: For ETH, go long on the right side if it breaks above 2058 on strong volume. Set a stop-loss. If it breaks below 2047 on strong volume, go short on the right side. Use a stop-loss. If it retests 2003 and confirms support is holding, go long with one unit. Stop-loss if it breaks below 1956. On the hourly chart, if ETH holds above 2058, look toward 2097–2146. Watch for 2097 above ETH as a place to go short with one unit. Stop-loss if it breaks above 2146. Left-side limit orders: long at 1956; stop-loss if it breaks below 1900. Resistance above: 2058–2097–2146 Support below: 2047–2003–1956 A break below 2047 on the 4-hour chart puts 2003–1956 in view. After the false breakout from the triangle, ETH failed to push straight through 2097 and hold above it. ETH needs to break 2097 on the hourly chart to stop falling and extend its rebound toward resistance at 2146. It failed to get above 2097, and now looks ready to break support at 2047. If 2047 breaks, it will retest the previous low at 2003. If it pulls back to the previous low and holds, a bottom signal could appear, offering a long opportunity. Alternatively, if it briefly breaks below the previous low and then reclaims it, ETH could be a buy. If it breaks below the previous low and fails to recover, don’t go long—the next new low at 1956 is in play. Ideally, ETH will stay above 2047. If it can hold there, it should trade sideways between 2047 and 2097. If it breaks below 2047, ETH is toast again. That’s all.#ByXIMPACT
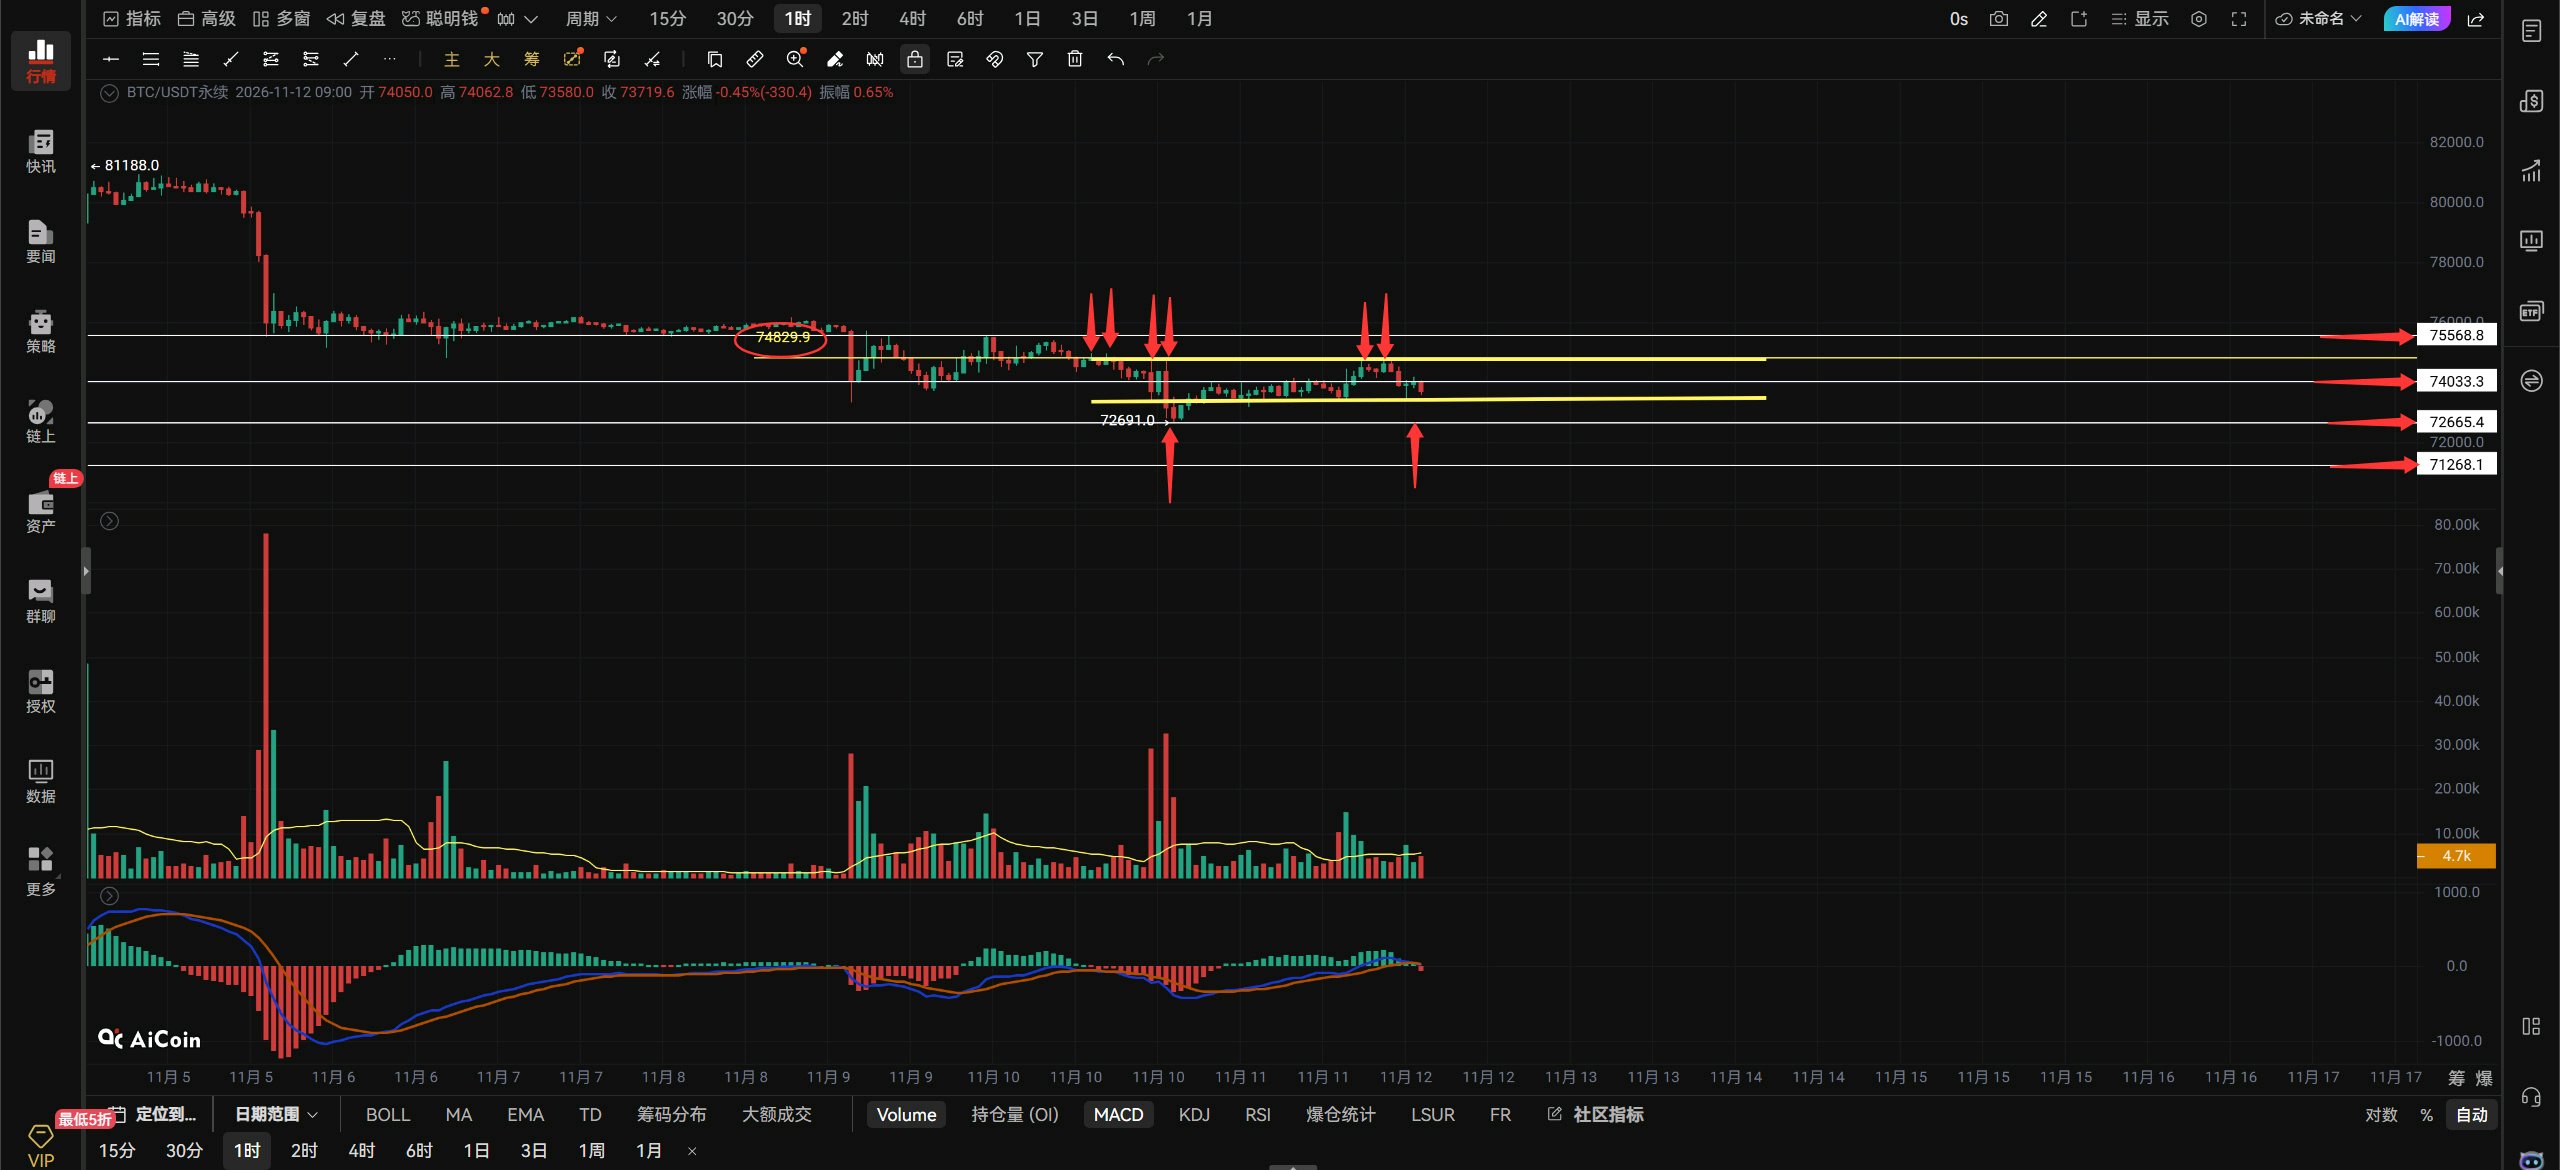
$BTCUSDT Nov. 12 Midday Market Outlook.🫏 $BTC View: Bitcoin’s price action is truly awful—there’s no follow-through at all after even a slight rise. BTC rebounded and broke above 74000, but was blocked by resistance at 74800 and couldn’t extend the rebound. It has now pulled back. Everyone, look at the red arrow above: how many times has 74800 been tested? I’ve lost count. If BTC can’t break through 74800, it can’t extend the rebound. There’s also no positive news specifically supporting BTC, so it looks helpless, isolated, and directionless. When a resistance level has been tested repeatedly without a breakout, it’s now very difficult for BTC to break through on its own. It needs a boost from positive external news; otherwise, it can only pull back. BTC is now trading below 74000 again. Next, we’ll see whether it can reclaim 74000. If it does, it will have another chance to challenge resistance at 74800. If it can’t reclaim 74000, then expect a second retest of the previous low at 72691! If it retests the previous low and holds, a potential double bottom may form. Those looking to go long BTC should watch for a bottom signal at the previous low of 72691, or wait for BTC to break above 74000 and then go long if it retests 74000 without falling below it. If BTC doesn’t break above 74800 or below 72691, expect it to consolidate within this range today! The choppy market is back. Aggressive traders can go long on the right side if BTC breaks above 74000 on strong volume. If it breaks below 73360 on strong volume and the rebound fails to reclaim that level, go short on the right side. Use a stop-loss. On the hourly chart, if BTC breaks above and holds 74000, look toward 74800–75568. If it can’t get above 74000, there’s no point. On the 4-hour chart, if it breaks below 73360, look toward 72691–71268. Resistance above: 74000–74800–75568 Support below: 73360–72691–71268 #ByXIMPACT
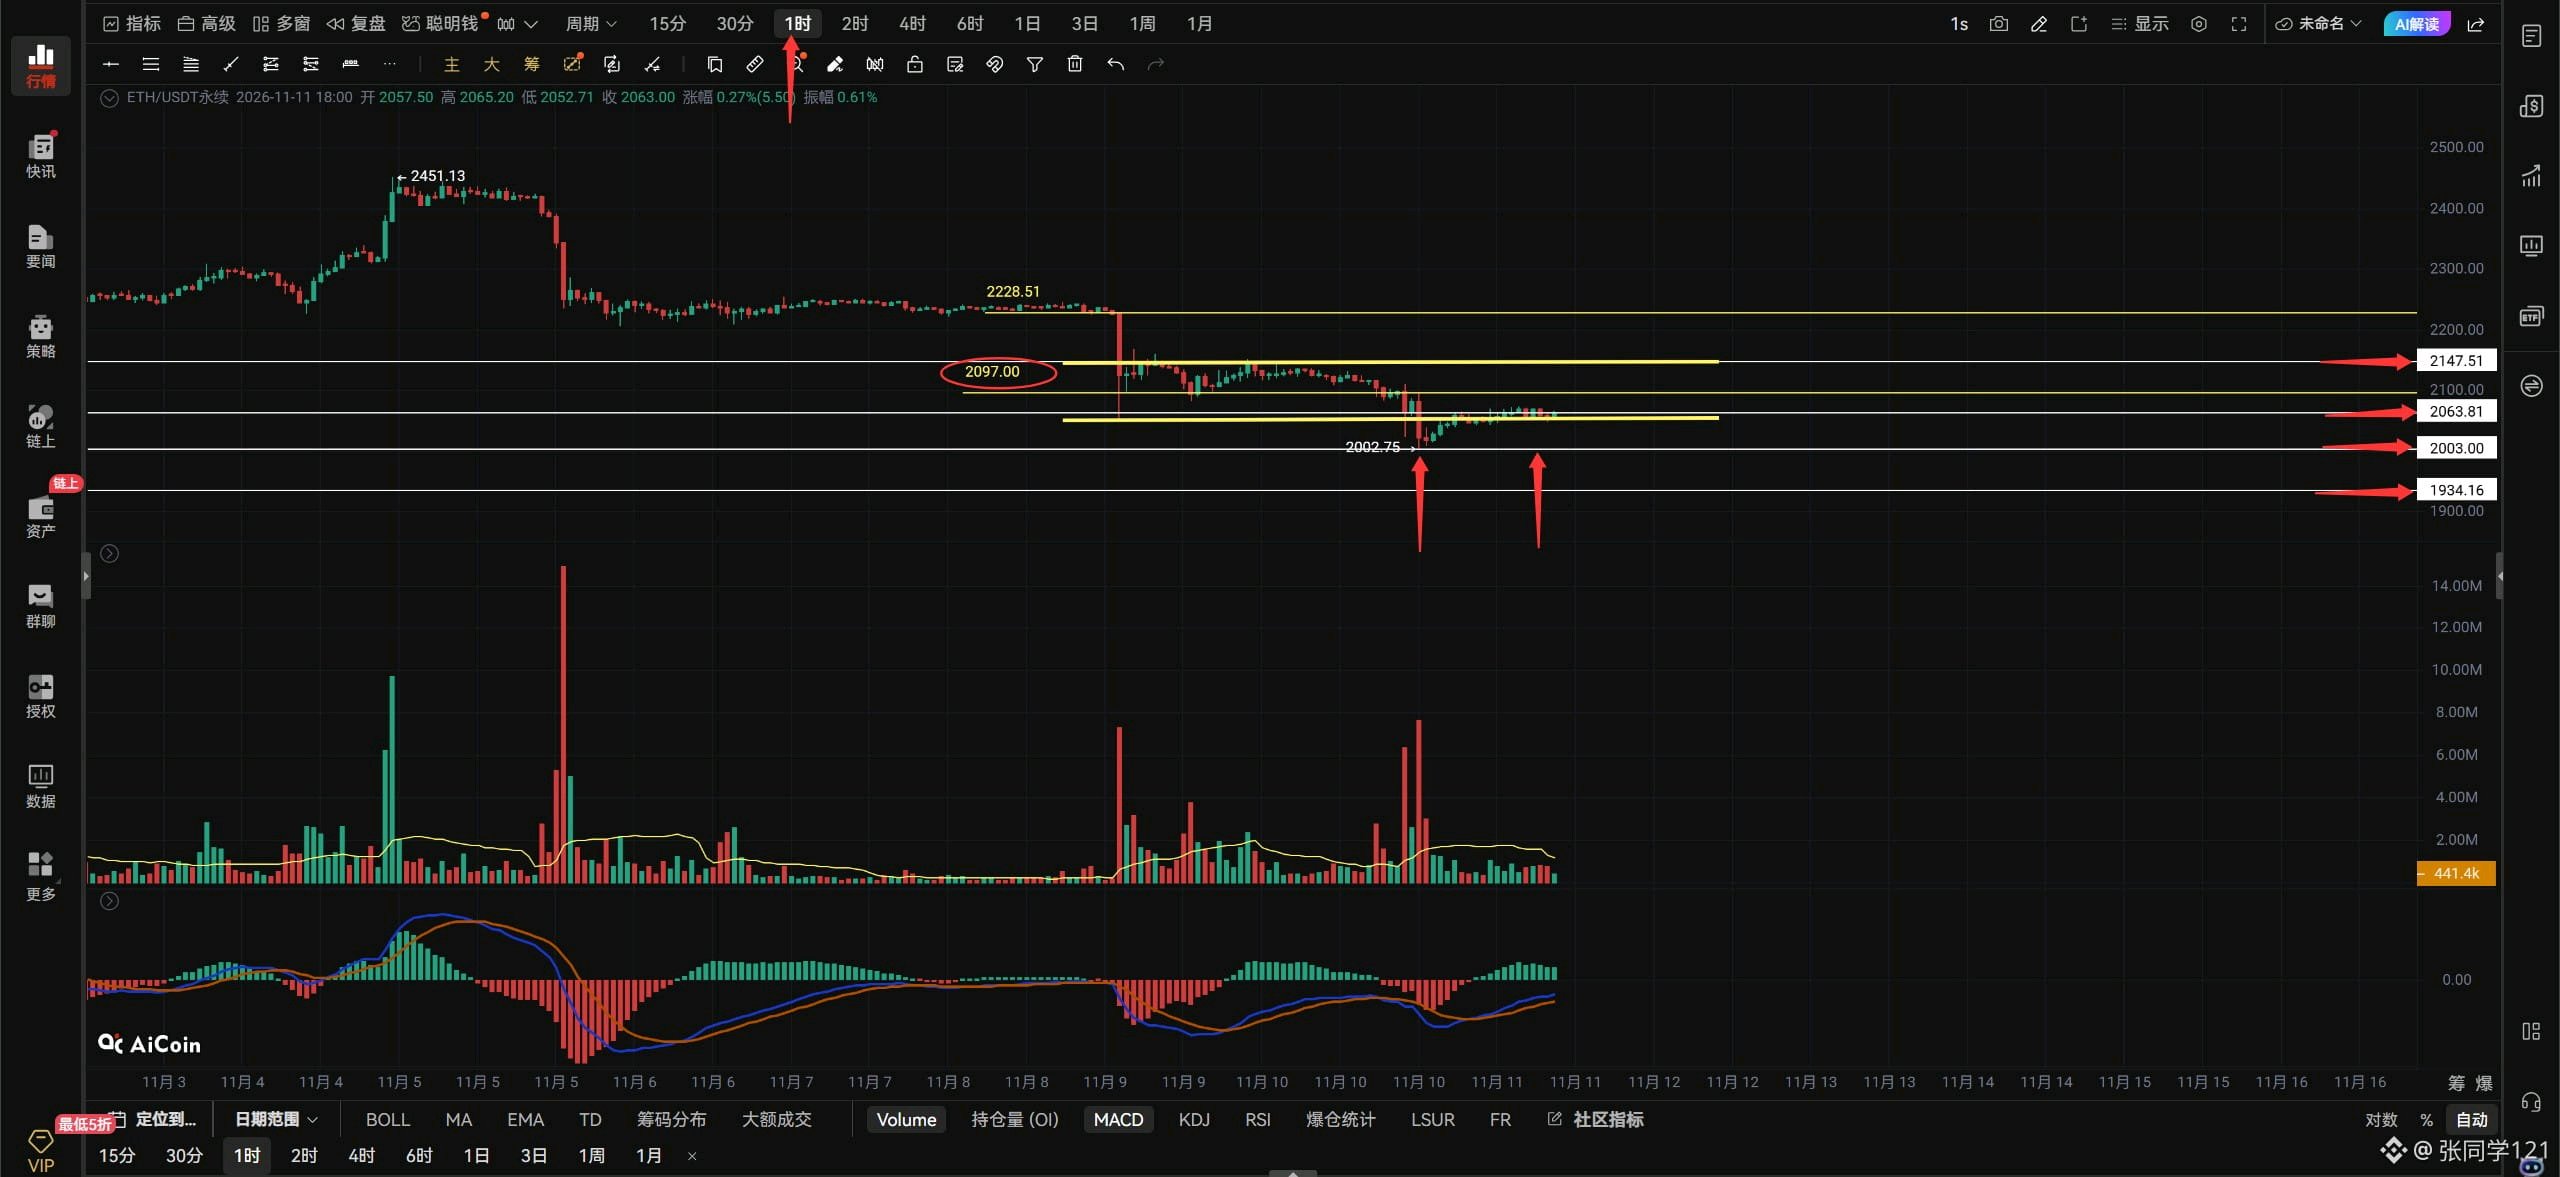
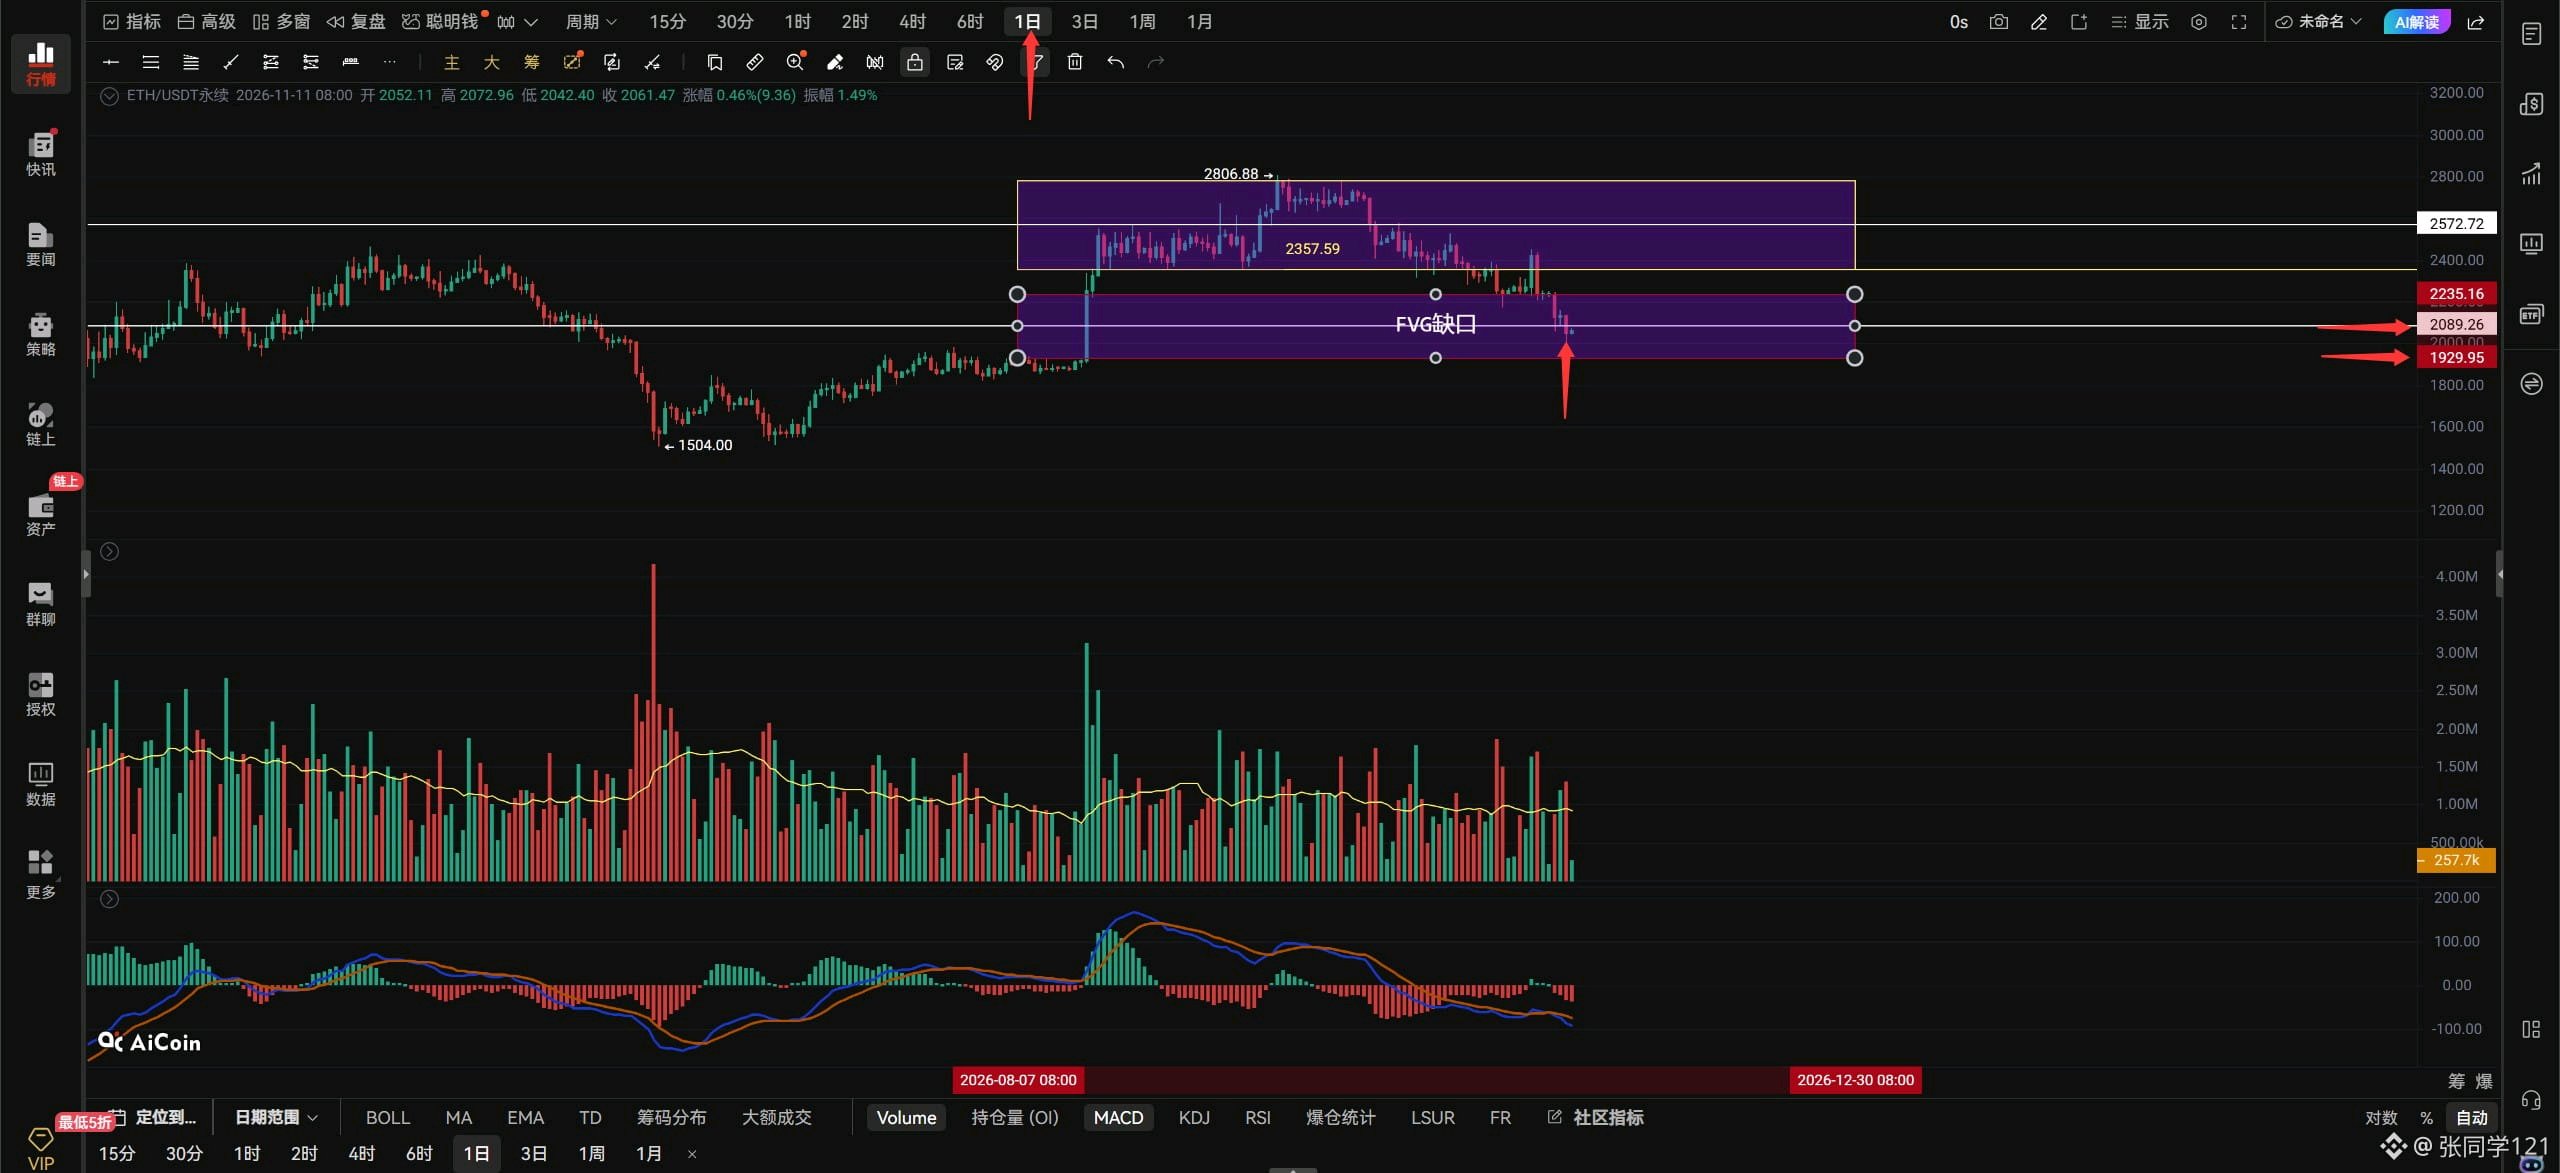
$ETHUSDT Evening outlook: 11/11. Ethereum made a false break below the 2147–2063 consolidation range, but has now moved back above 2063. It must stay above 2063 to find a bottom and rebound, with 2097–2147 as the upside target. Only a break above 2147 would restart the hourly uptrend. If Ethereum pulls back and breaks below 2063, it likely won’t hold the previous low at 2002. 2000 is major support for Ethereum, and this is the first retest of that level. If the first retest of major support at 2000 can’t produce even a $150 rebound, that suggests buyers around 2000 haven’t stepped in—people just aren’t interested. Everyone may have reached the same conclusion: Ethereum is bound to break below 2000. So if Ethereum’s first rebound from 2000 can’t get back above 2147, a second retest of 2000 will certainly break below it. Ethereum will only be temporarily out of danger if it can get back above 2147. If 2000 breaks, watch 1934! If you want to go long on Ethereum, keep an eye on major support at 2000; go long if the retest holds and a long signal appears. If it breaks straight through, wait and see. Go long on Ethereum if it breaks above 2070 with volume; go short if it breaks below 2048 with volume. Watch for changes in volume and use stop-losses. If Ethereum holds above 2070 on the hourly chart, look for 2097–2147. If it breaks below 2048 on the 4-hour chart, look down to 2000–1934. Ethereum’s daily candle ultimately closed below 2089. Ethereum is pretty much cooked; now we’ll see whether 2000 can hold and trigger a strong rebound. If Ethereum can’t get back above 2089 on the daily chart, the next downside target is around 1929. A move to 1929 would completely fill the daily gap. Once the gap is filled, we’ll have to see how much further it can fall. For now, focus mainly on shorting rebounds, with longs as a secondary strategy to catch bounces. Ethereum is already at 2000—are you still not buying spot? Waiting for 1500–1300? If it gets down to 1500–1300, you can add to your position then! But what if it never gets there—won’t you miss out on spot? Buy Ethereum spot in batches! Don’t end up slapping your thigh when it takes off. Meeting adjourned. #ByXIMPACT
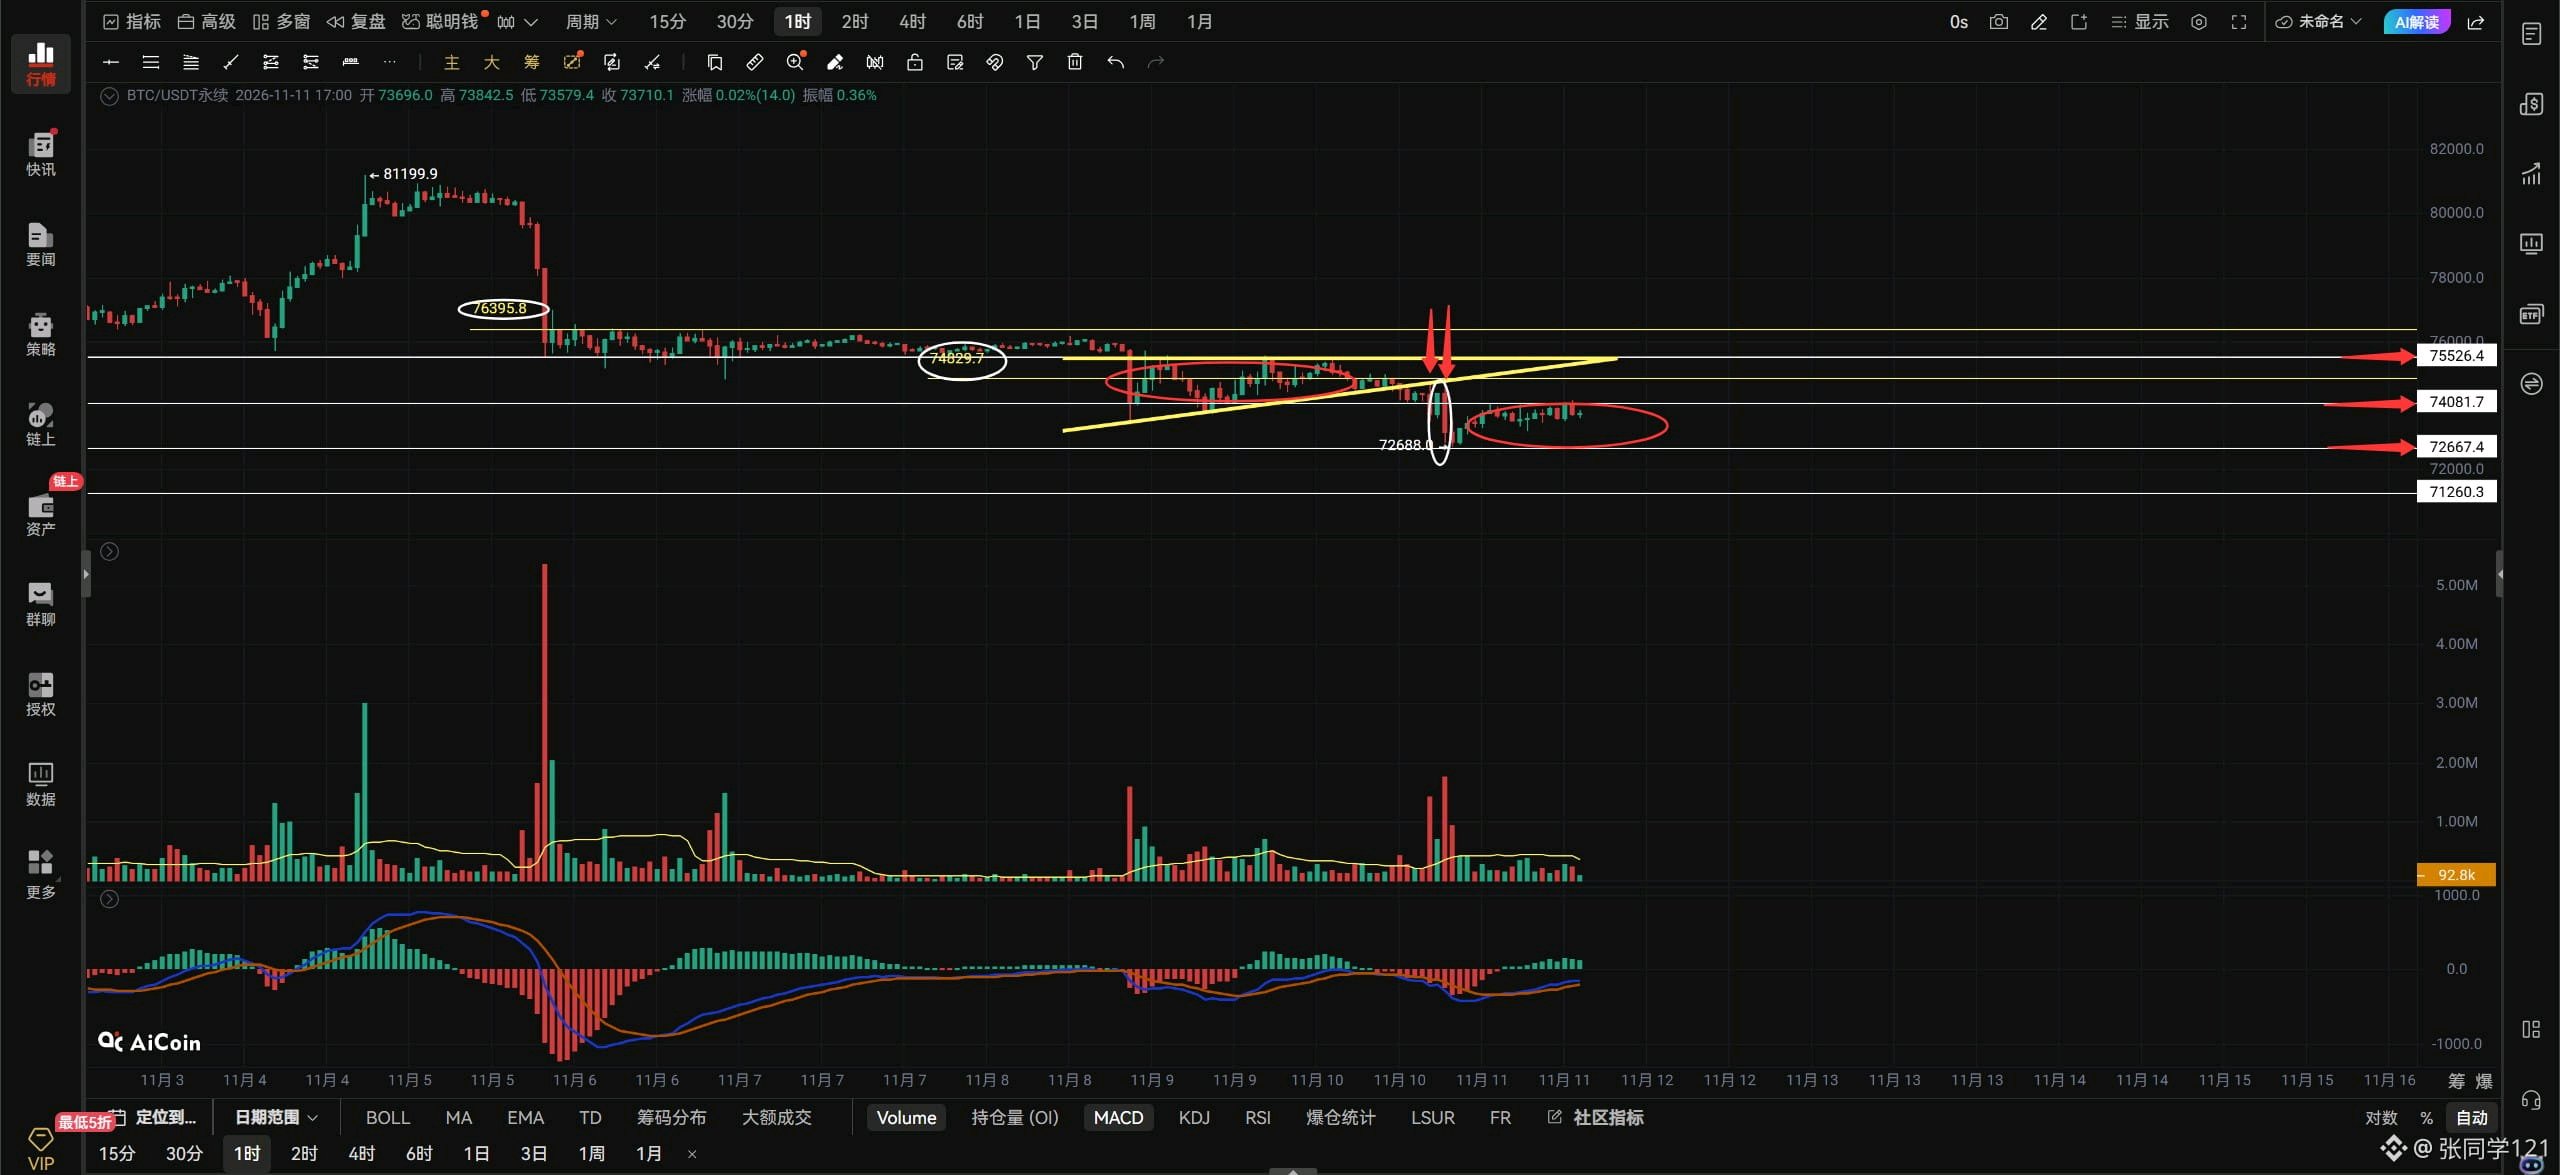
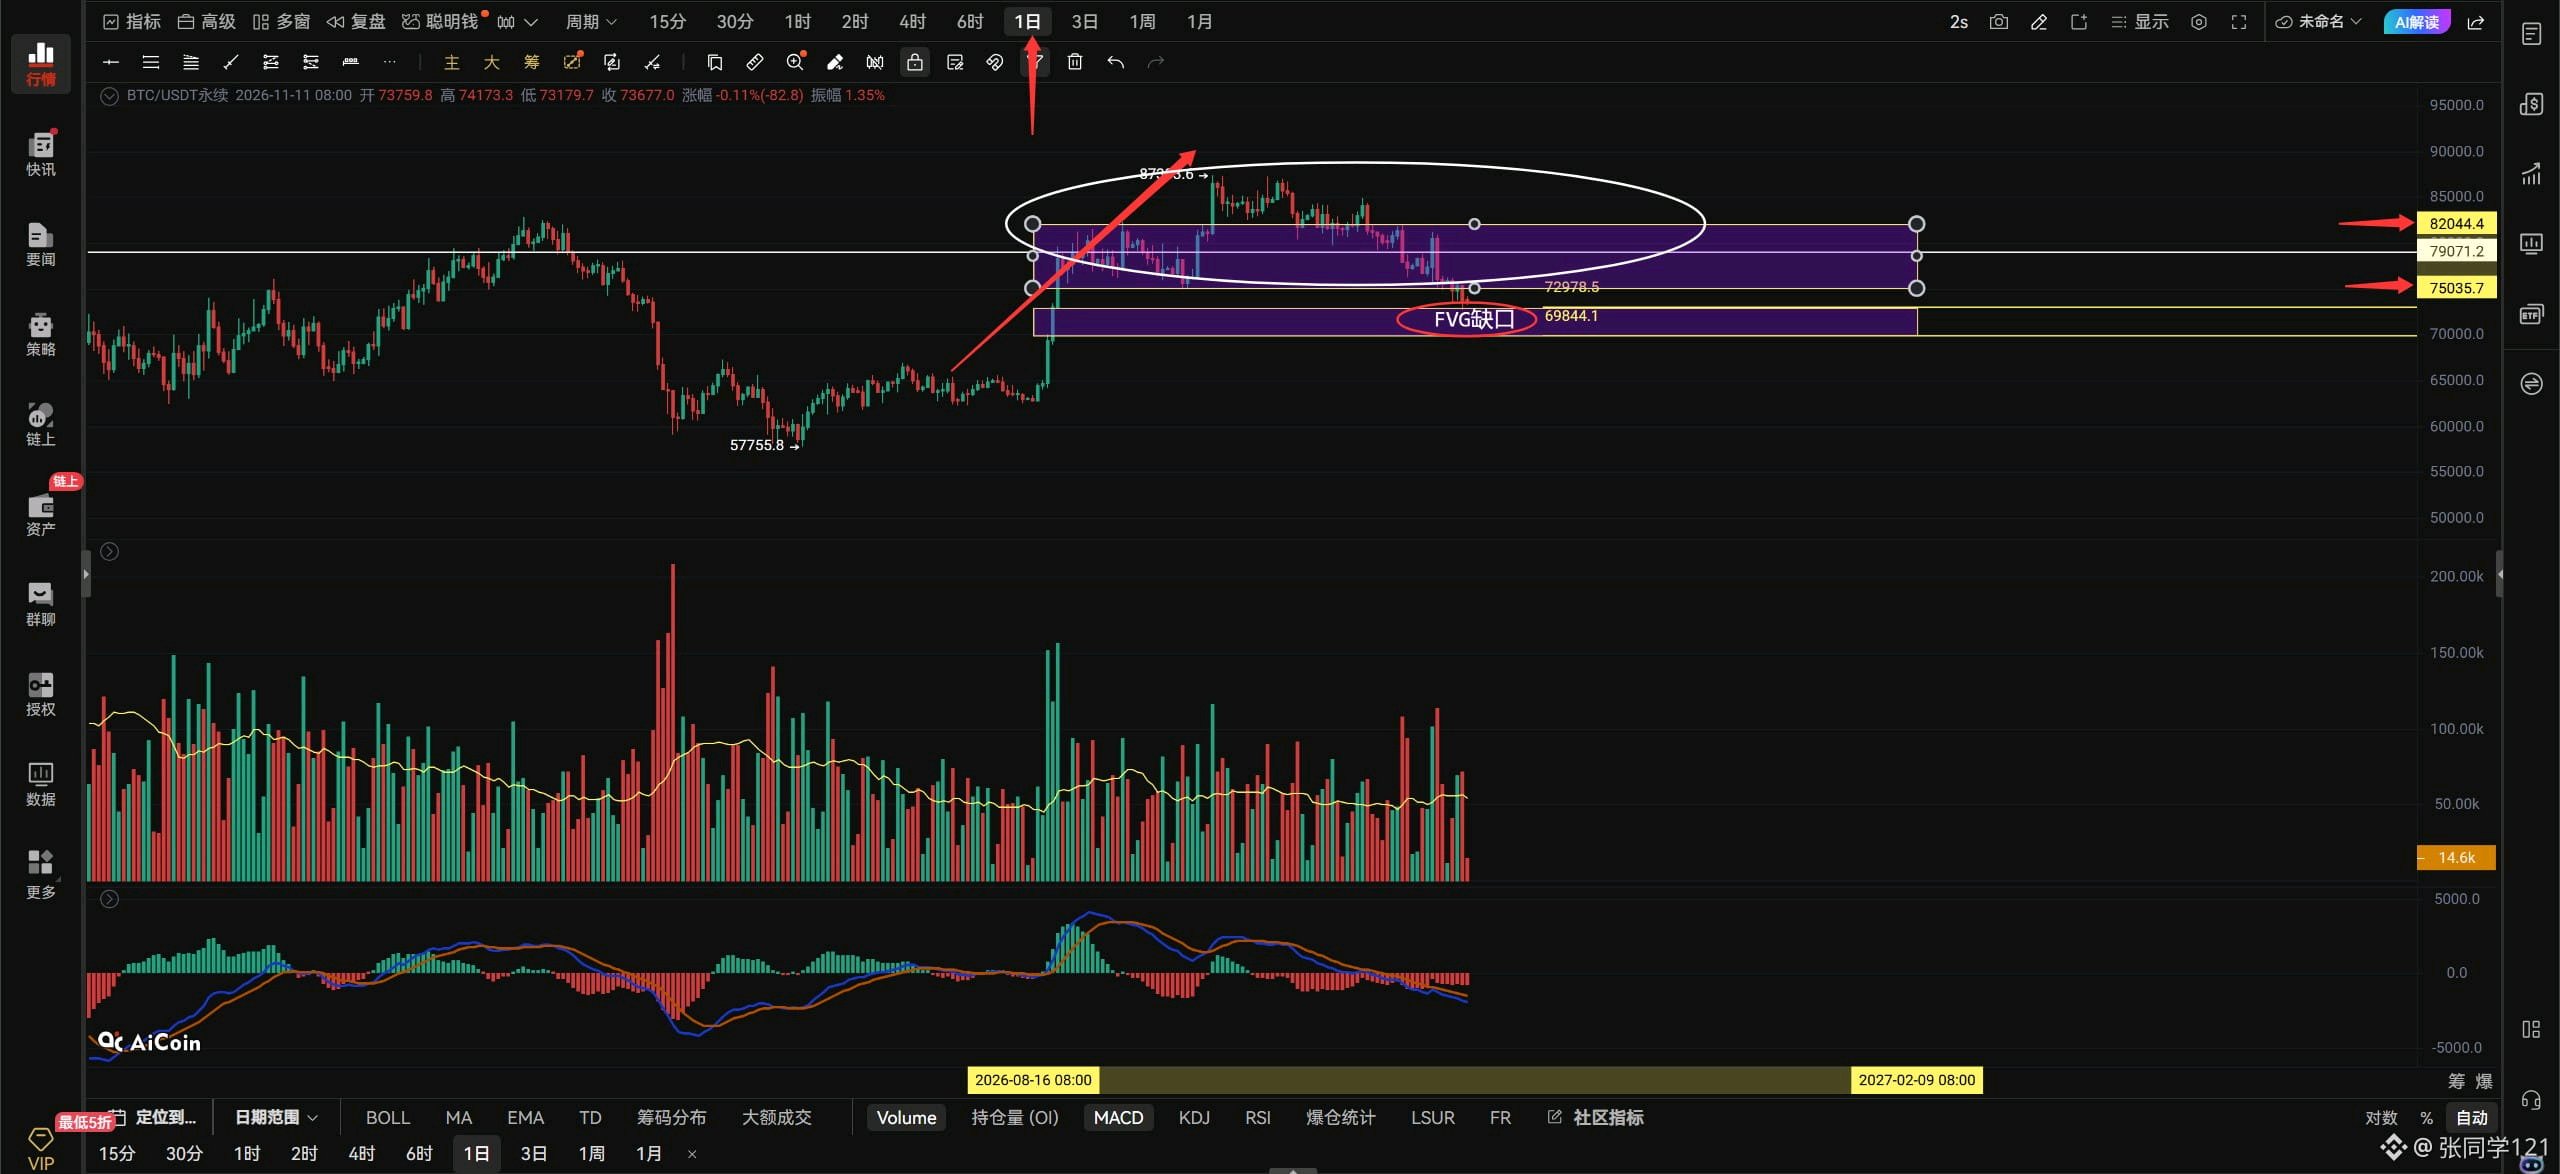
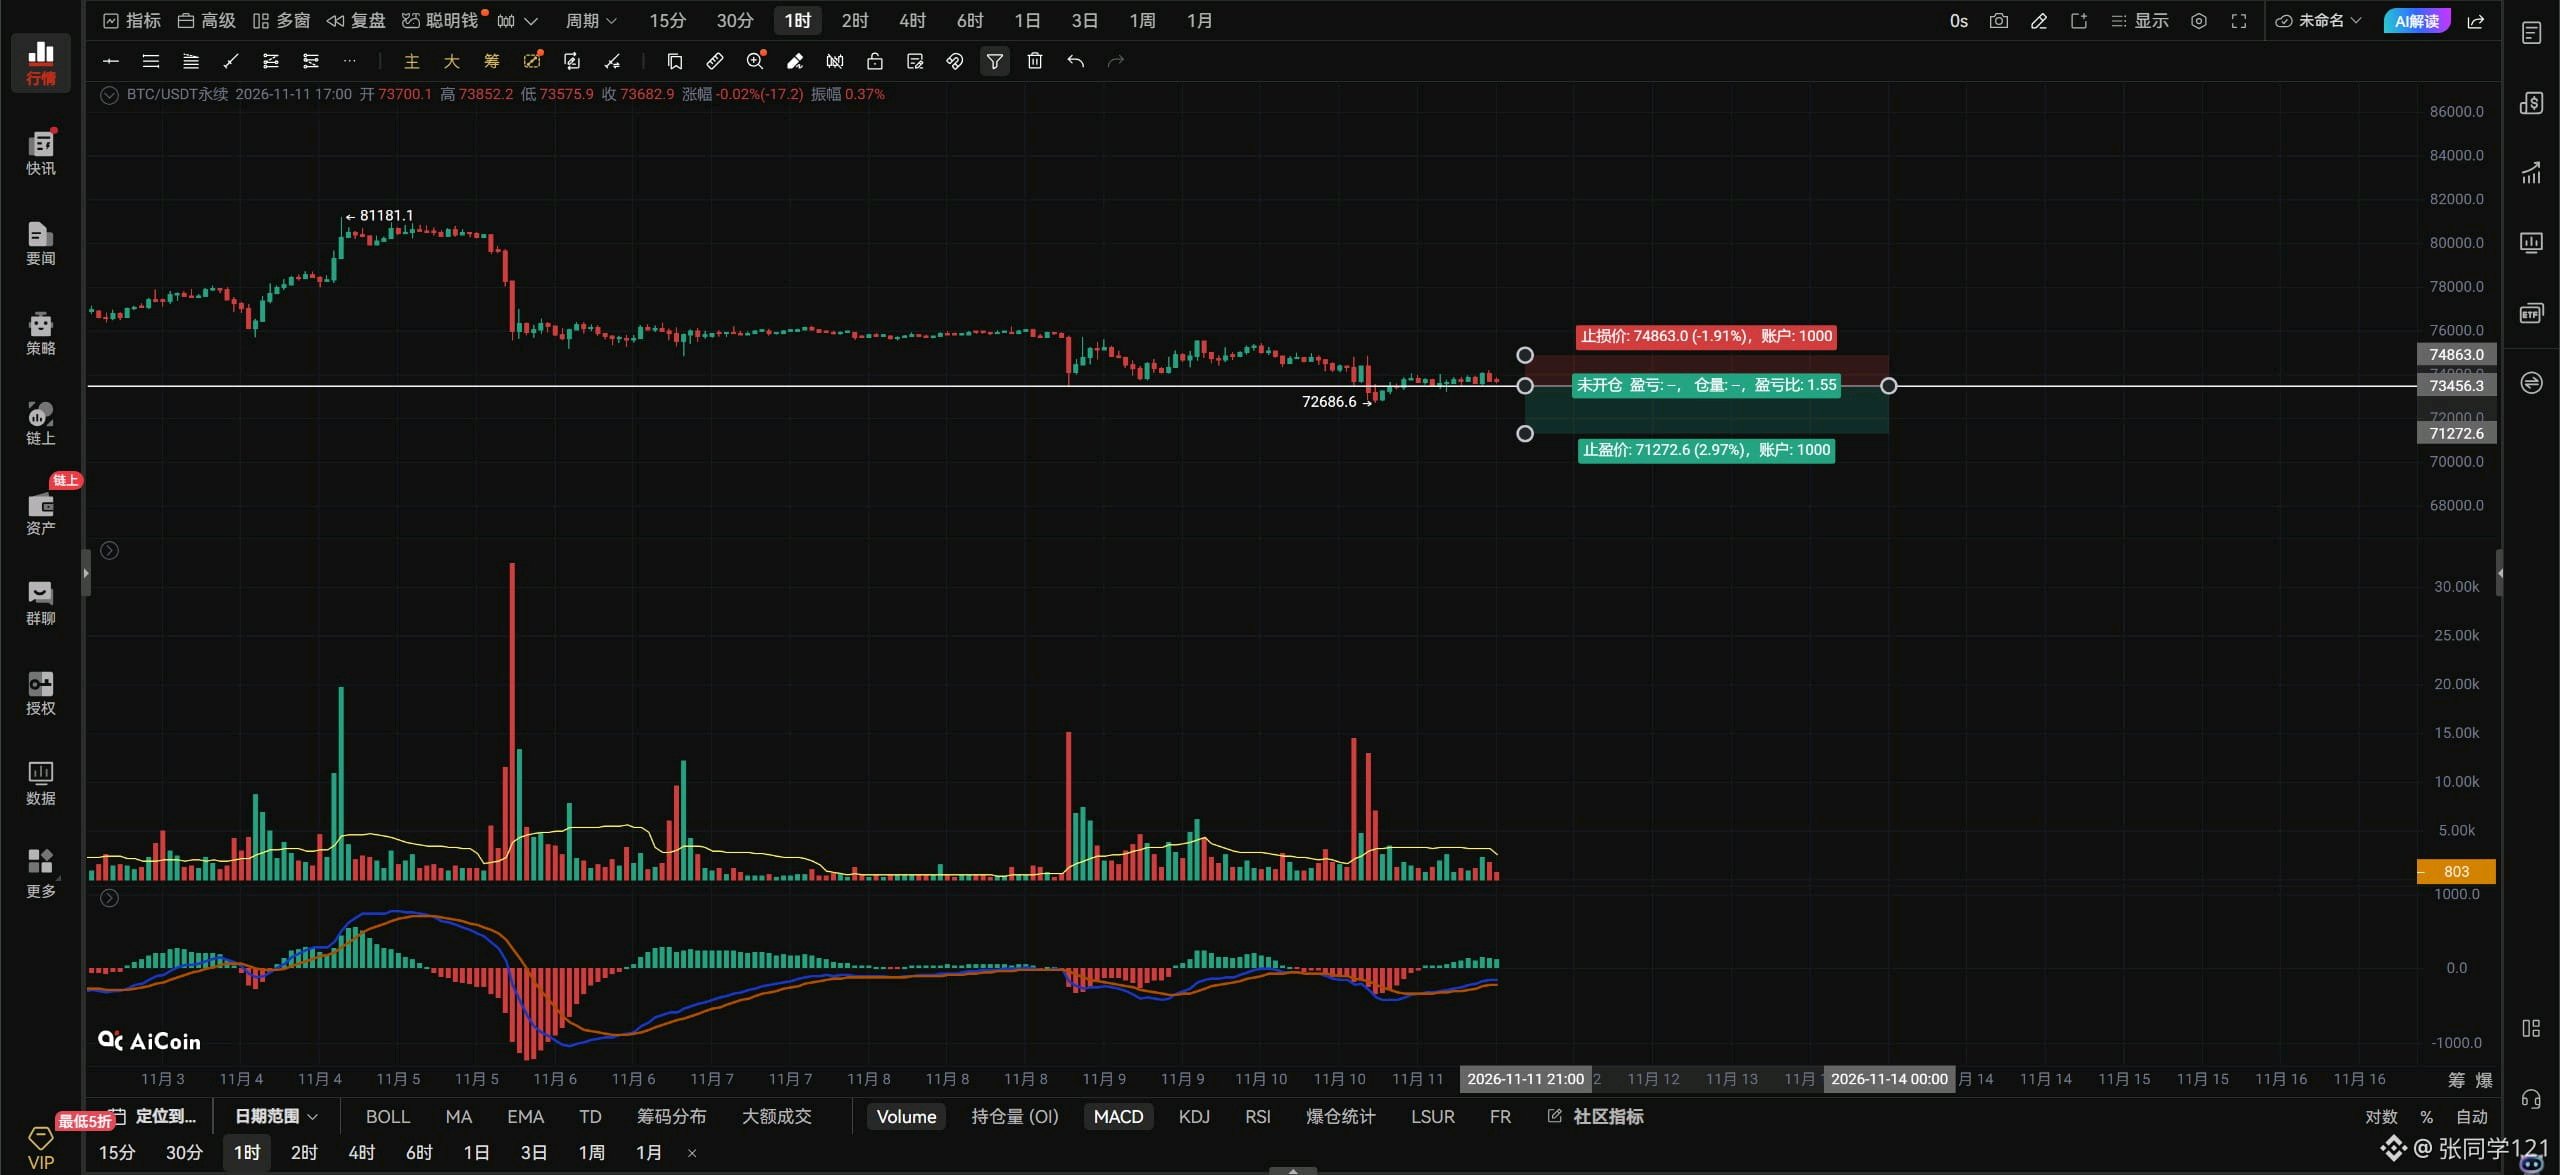
$BTCUSDT Perspectiva vespertina: 11.11. Después de que Bitcoin rompiera por debajo del triángulo, hizo dos intentos de volver a entrar y operar dentro de él, como muestran las flechas rojas de arriba. Desafortunadamente, no logró reingresar al triángulo. Luego, en el área marcada por el recuadro blanco, una vela envolvente bajista lo hizo caer, y marcó un nuevo mínimo en 72688. ¿Qué está haciendo Bitcoin ahora? Está consolidando entre 72688 y 74081, y vuelve a elegir una dirección. A menos que este rango se rompa al alza o a la baja, no habrá una dirección clara; seguirá consolidando dentro de este rango. Para que Bitcoin deje de caer y rebote, debe romper por encima de 74081. Solo entonces podrá realizar un movimiento alcista, con objetivos en 74829, 75526 y 76395. Si no puede superar los 74081, no verás esos tres niveles. ¿Por qué tiene que superar los 74081 para rebotar? Porque 74081–72688 es una zona de consolidación. Si quiere subir, ¿no necesita romper por encima de la zona de consolidación marcada por el recuadro rojo inferior? Necesita formar un máximo más alto en esa zona de consolidación inferior antes de poder volver a operar en la zona del recuadro rojo superior, ¿verdad? Si ni siquiera ha roto la zona de consolidación inferior, ¿cómo esperas que Bitcoin suba? Tienes que ir paso a paso, ¿no? Si vives en un undécimo piso, ¿puedes dar un paso y entrar directamente en tu dormitorio? ¿Acaso puedes volar? 😃! Por el contrario, si el rango de 74081–72688 se rompe a la baja, es probable que veamos un nuevo mínimo en 71260. Cuando Bitcoin cotiza en un rango, lo mejor es evitar realizar operaciones. Si entras durante un rango, el precio simplemente oscilará alrededor de tu precio de entrada. Es mejor quedarse al margen, ¿verdad? Si quieres ir en largo en Bitcoin ahora, esto es lo que debes hacer: espera a que Bitcoin vuelva a probar el mínimo anterior en 72688 y comprueba si aparece una señal de suelo, entonces entra en largo para un rebote; o espera a que rompa por encima de 74081 y luego mantenga ese nivel en un retest antes de ir en largo. La forma más segura de ponerse en corto es esperar a que Bitcoin rebote hacia la zona de resistencia de 75526–76395 y forme un patrón de techo antes de abrir la posición corta. De lo contrario, es mejor no actuar precipitadamente. Si Bitcoin rompe por encima de 74081 con un volumen fuerte, los traders agresivos pueden perseguir el largo en el lado derecho. Si rompe por debajo de 73456 con un volumen fuerte y no logra recuperarlo en un rebote, persigue el corto en el lado derecho. Asegúrate de usar un stop-loss. En el gráfico horario, si Bitcoin rompe por encima y mantiene los 74081, apunta hacia arriba a 74829–75526. Si no puede superar los 74081, esos objetivos son irrelevantes. En el gráfico de 4 horas, si rompe por debajo de 73456, apunta hacia abajo a 72688–71260. La zona de consolidación diaria para Bitcoin entre 75035 y 82044 se ha roto a la baja. Esta ruptura significa que el rally marcado por la gran flecha roja en el gráfico diario ha terminado, porque la estructura de la zona de consolidación encerrada por el gran recuadro blanco ha sido fracturada. A continuación, a menos que Bitcoin vuelva a situarse por encima de 75000 en el gráfico diario, necesitará llenar el hueco FVG diario alrededor de 72978–69844. Y hasta que vuelva a estar por encima de 75000, se avecina una caída aún más pronunciada en el gráfico diario. Bitcoin solo puede evitar que la caída diaria empeore volviendo a superar los 75000. Si no puede volver por encima de 75000 en tres días, el abismo nos está llamando a ti y a mí 🫳🏻 ¡Vamos, vamos, ven a jugar! Se está fresquito aquí abajo. ¡Sesión terminada!#ByXIMPACT
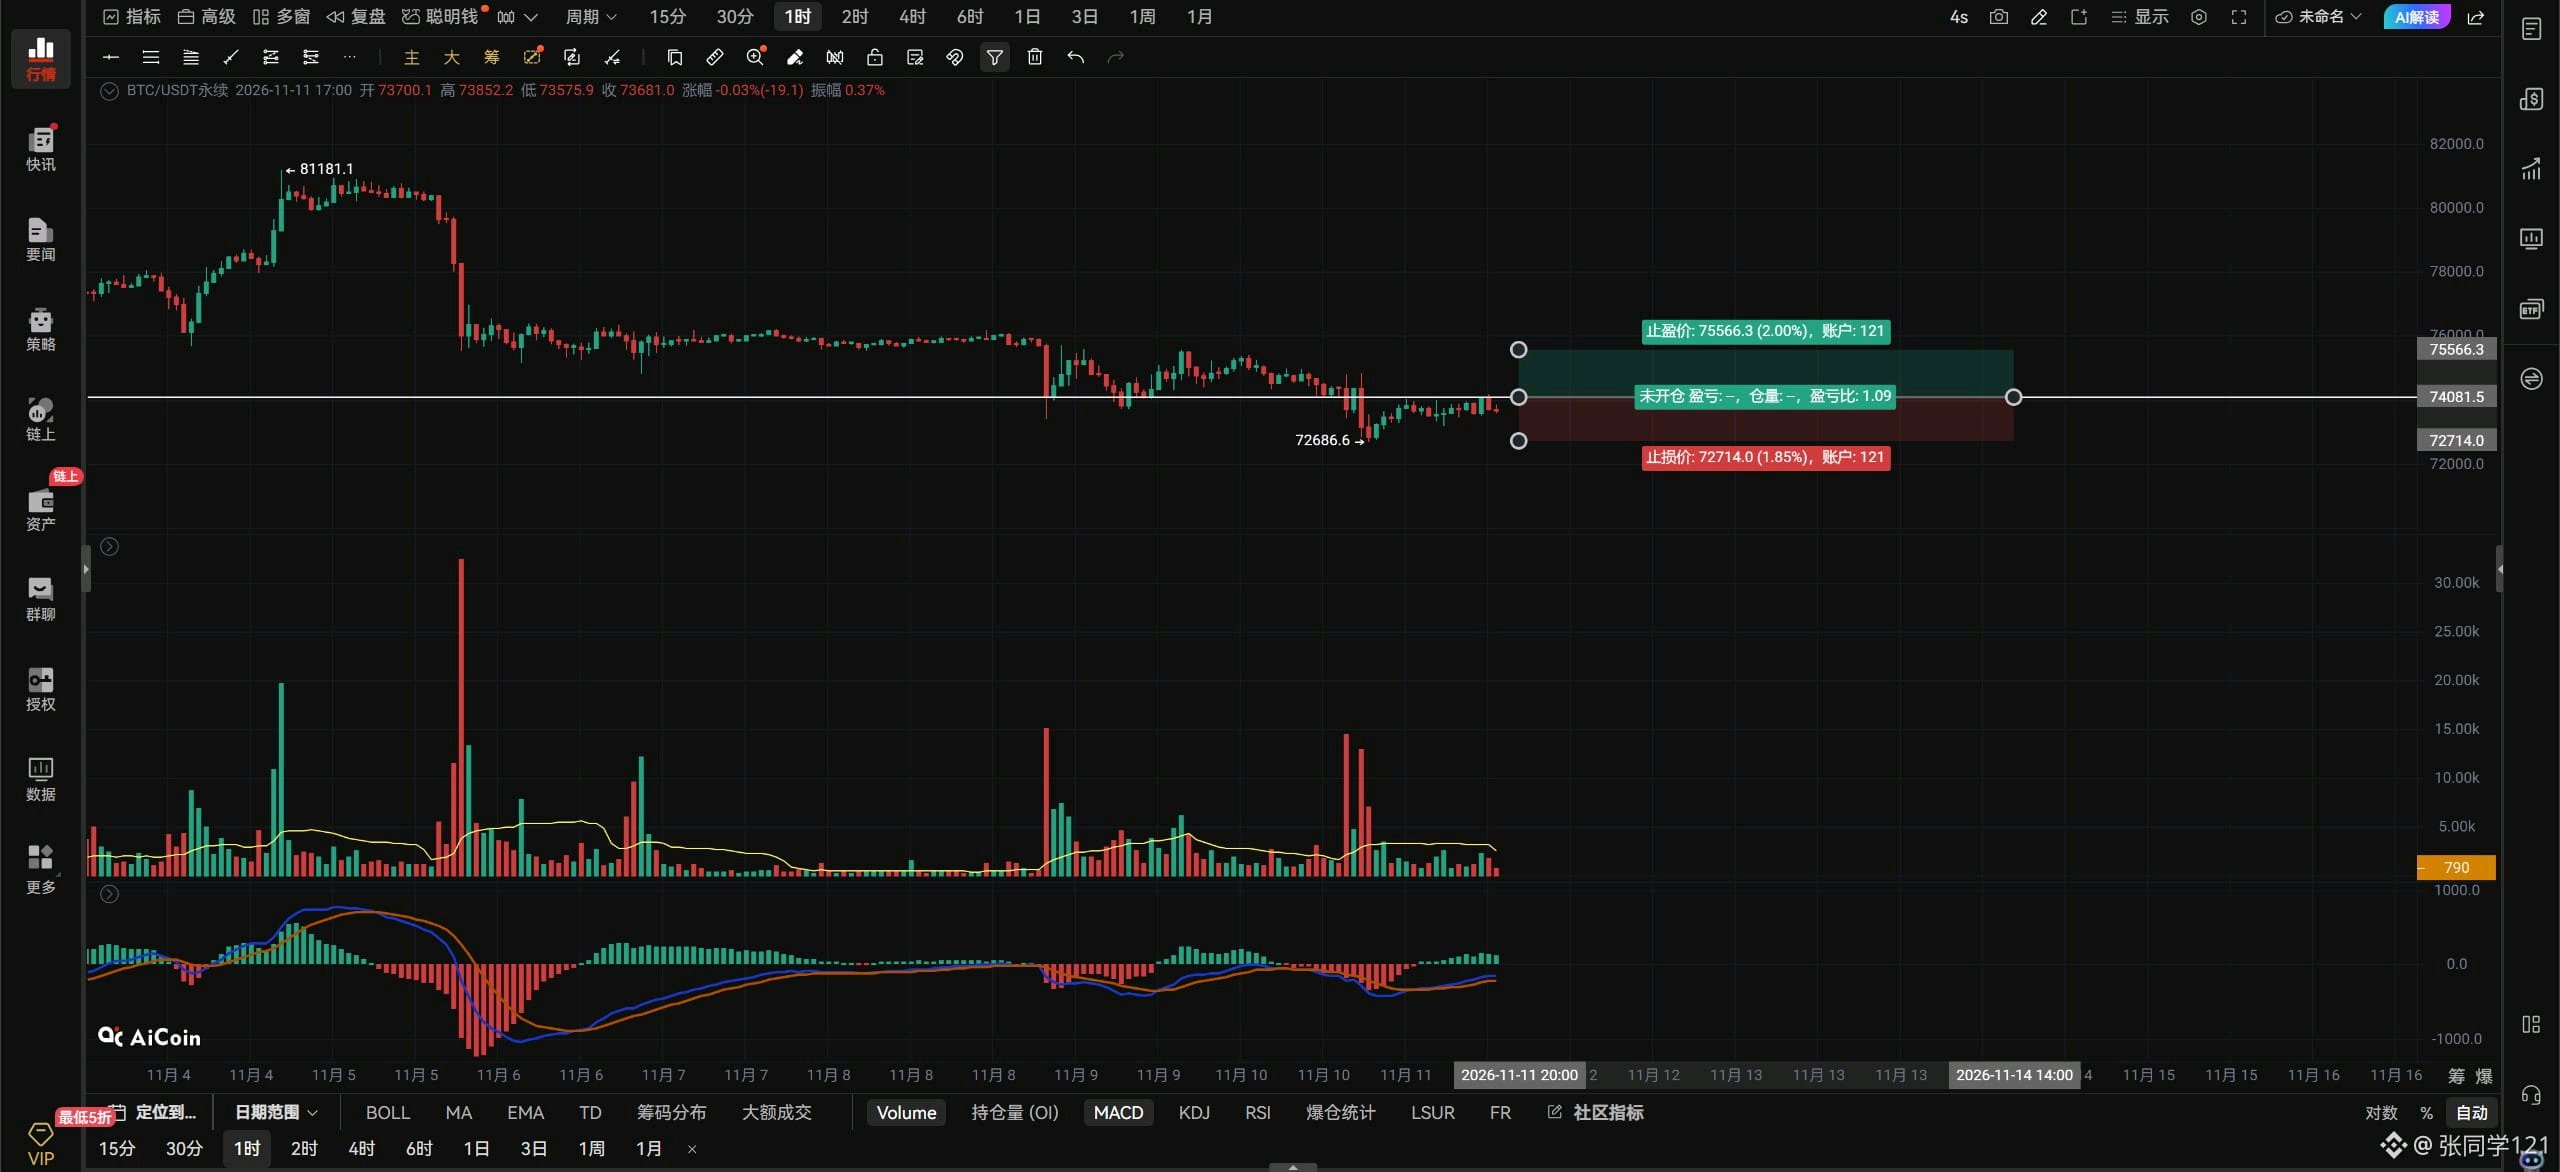
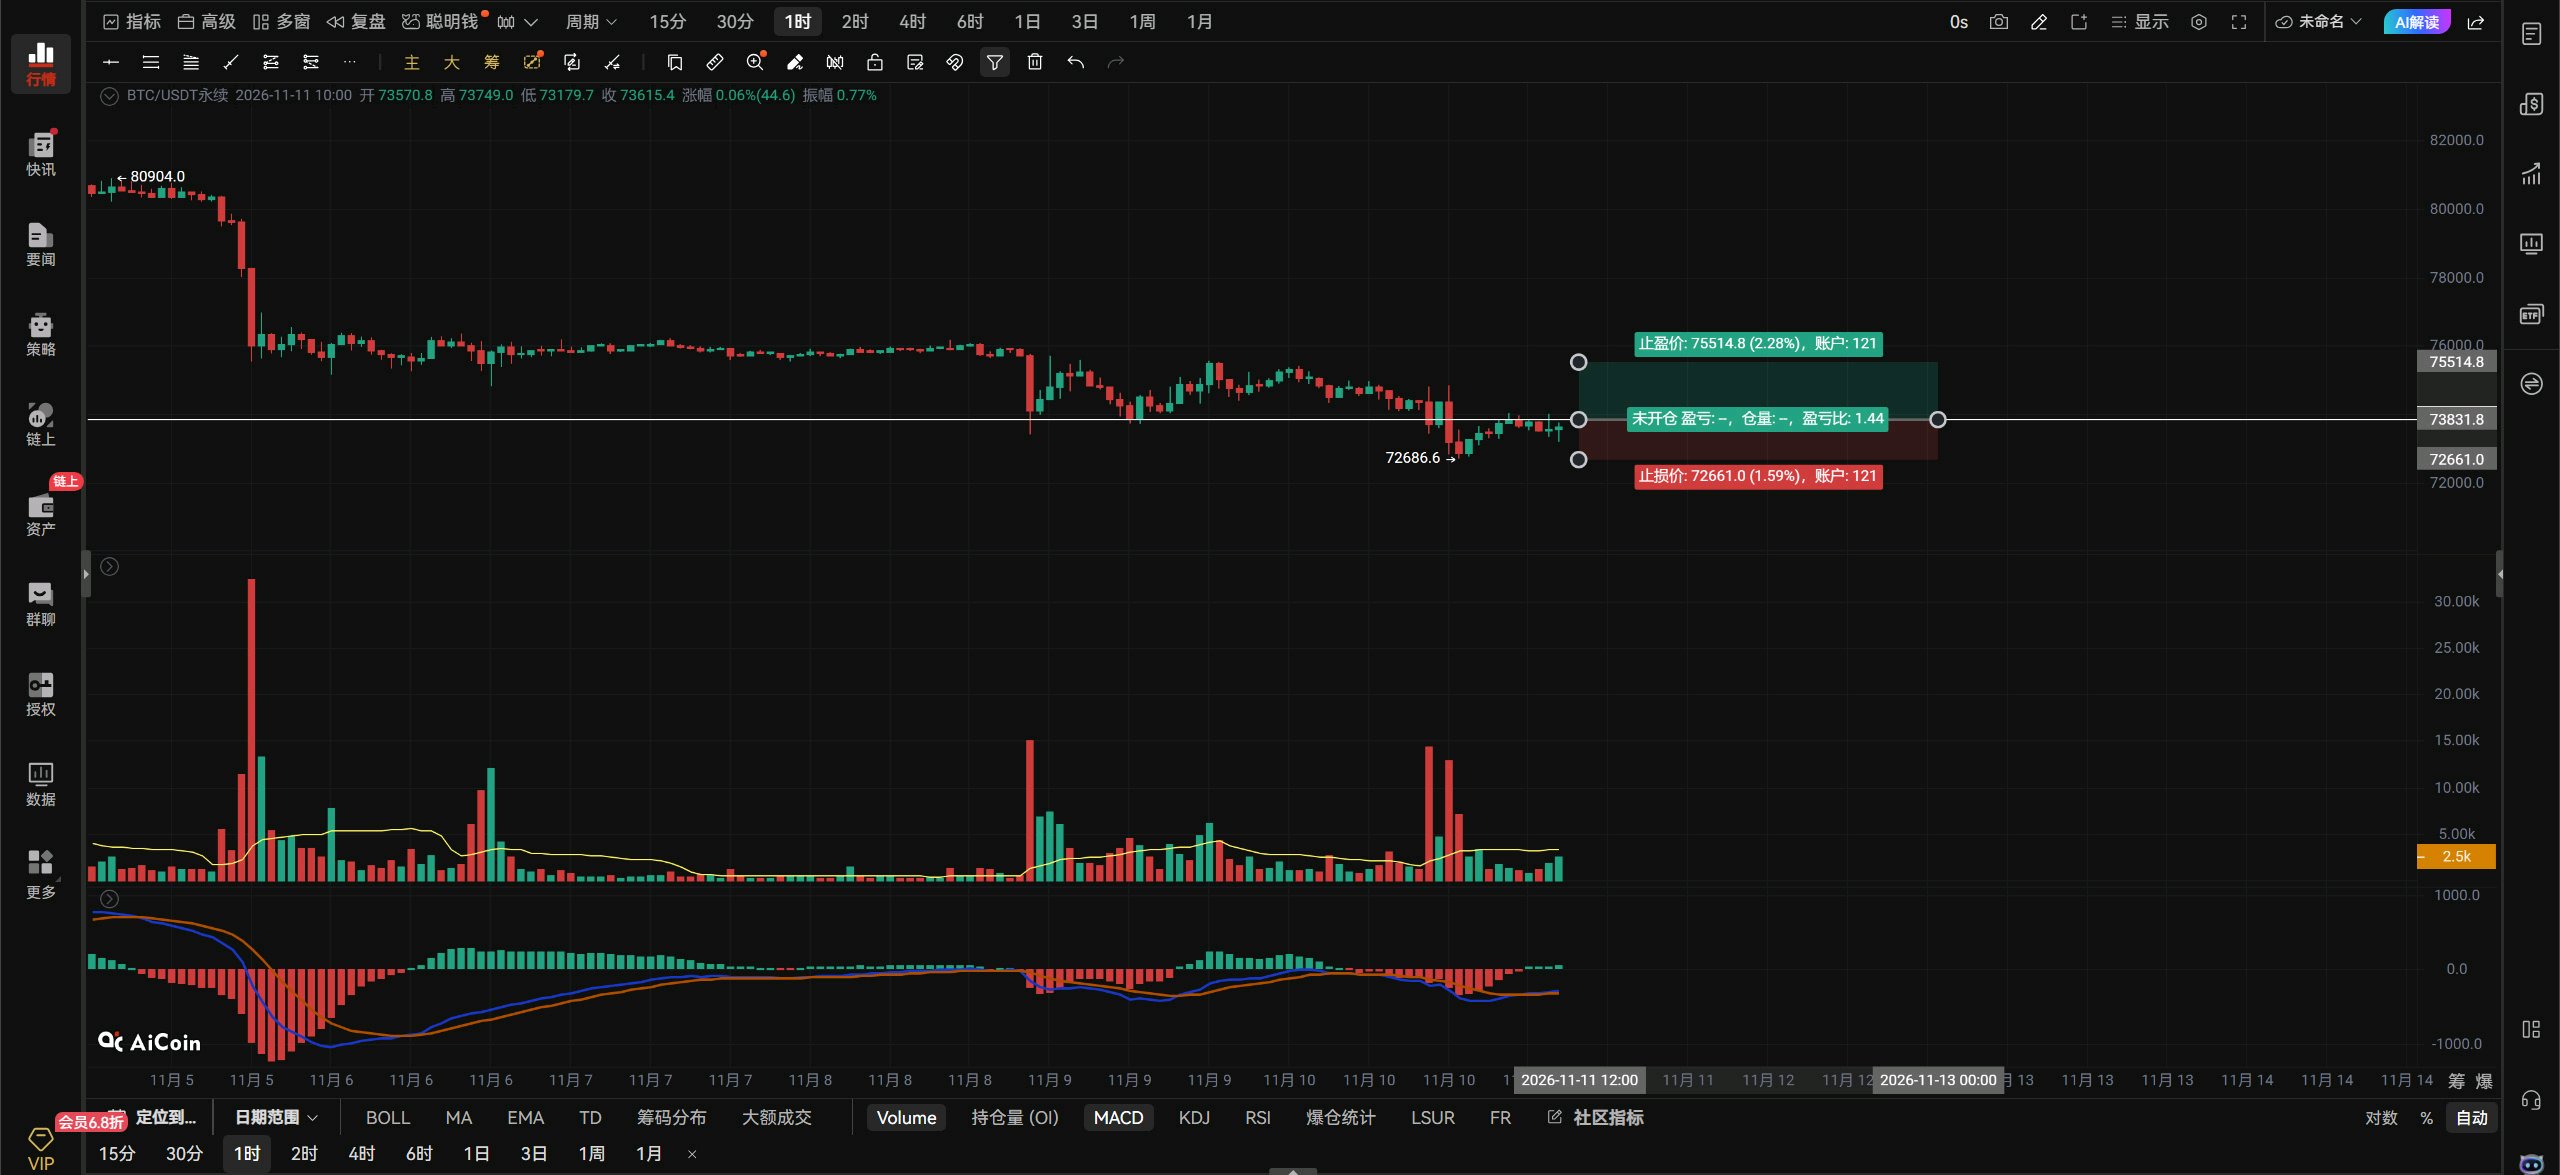
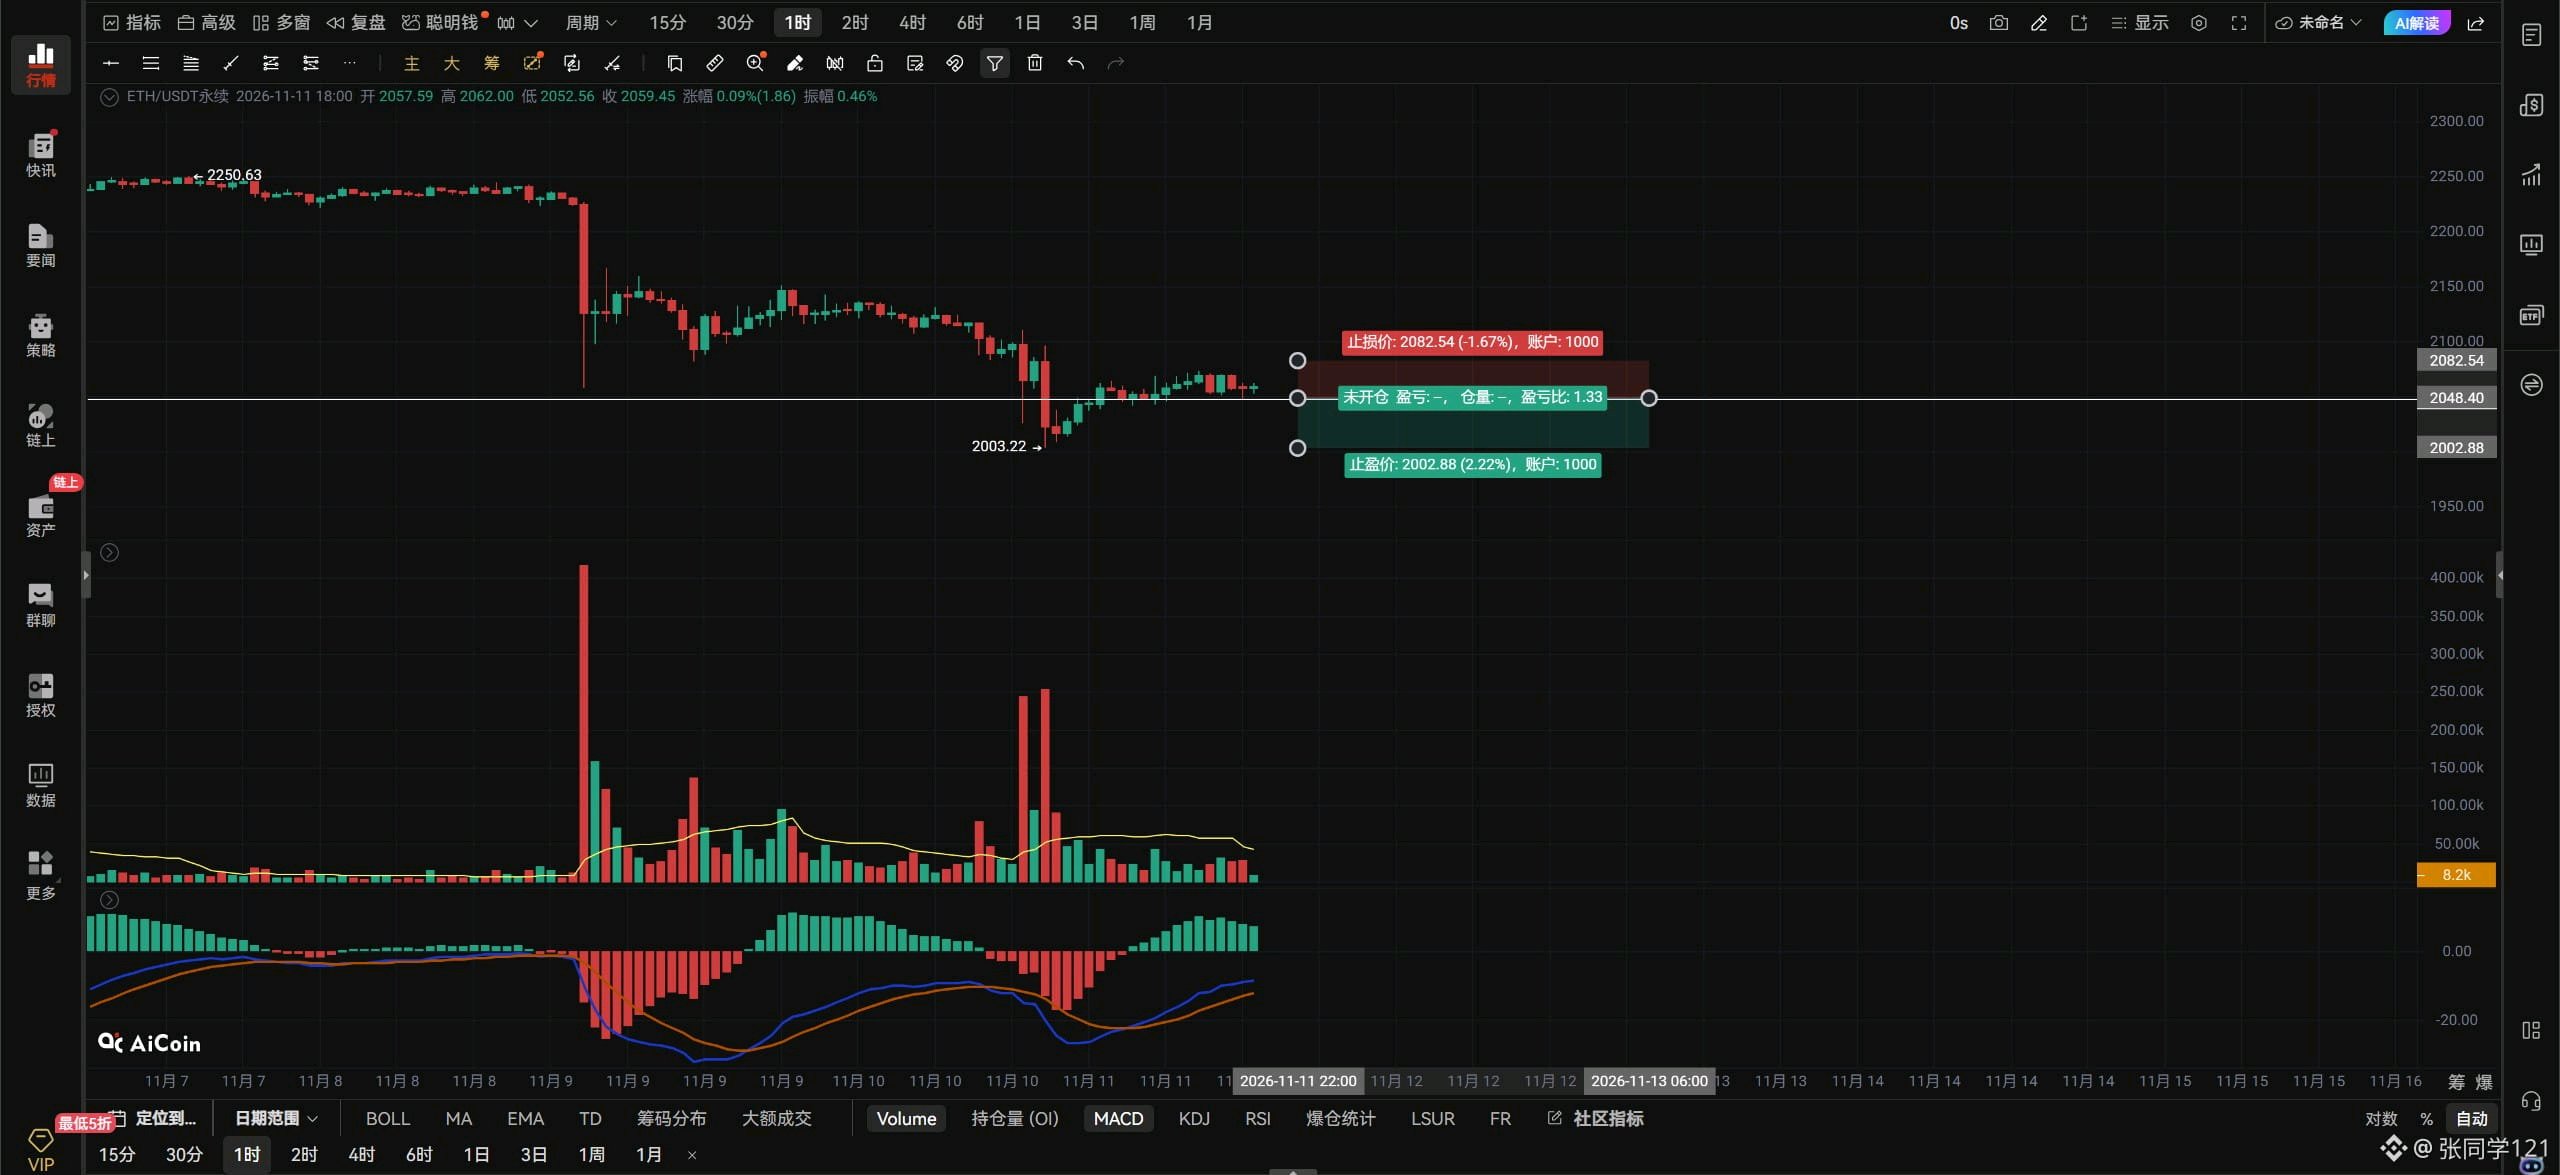
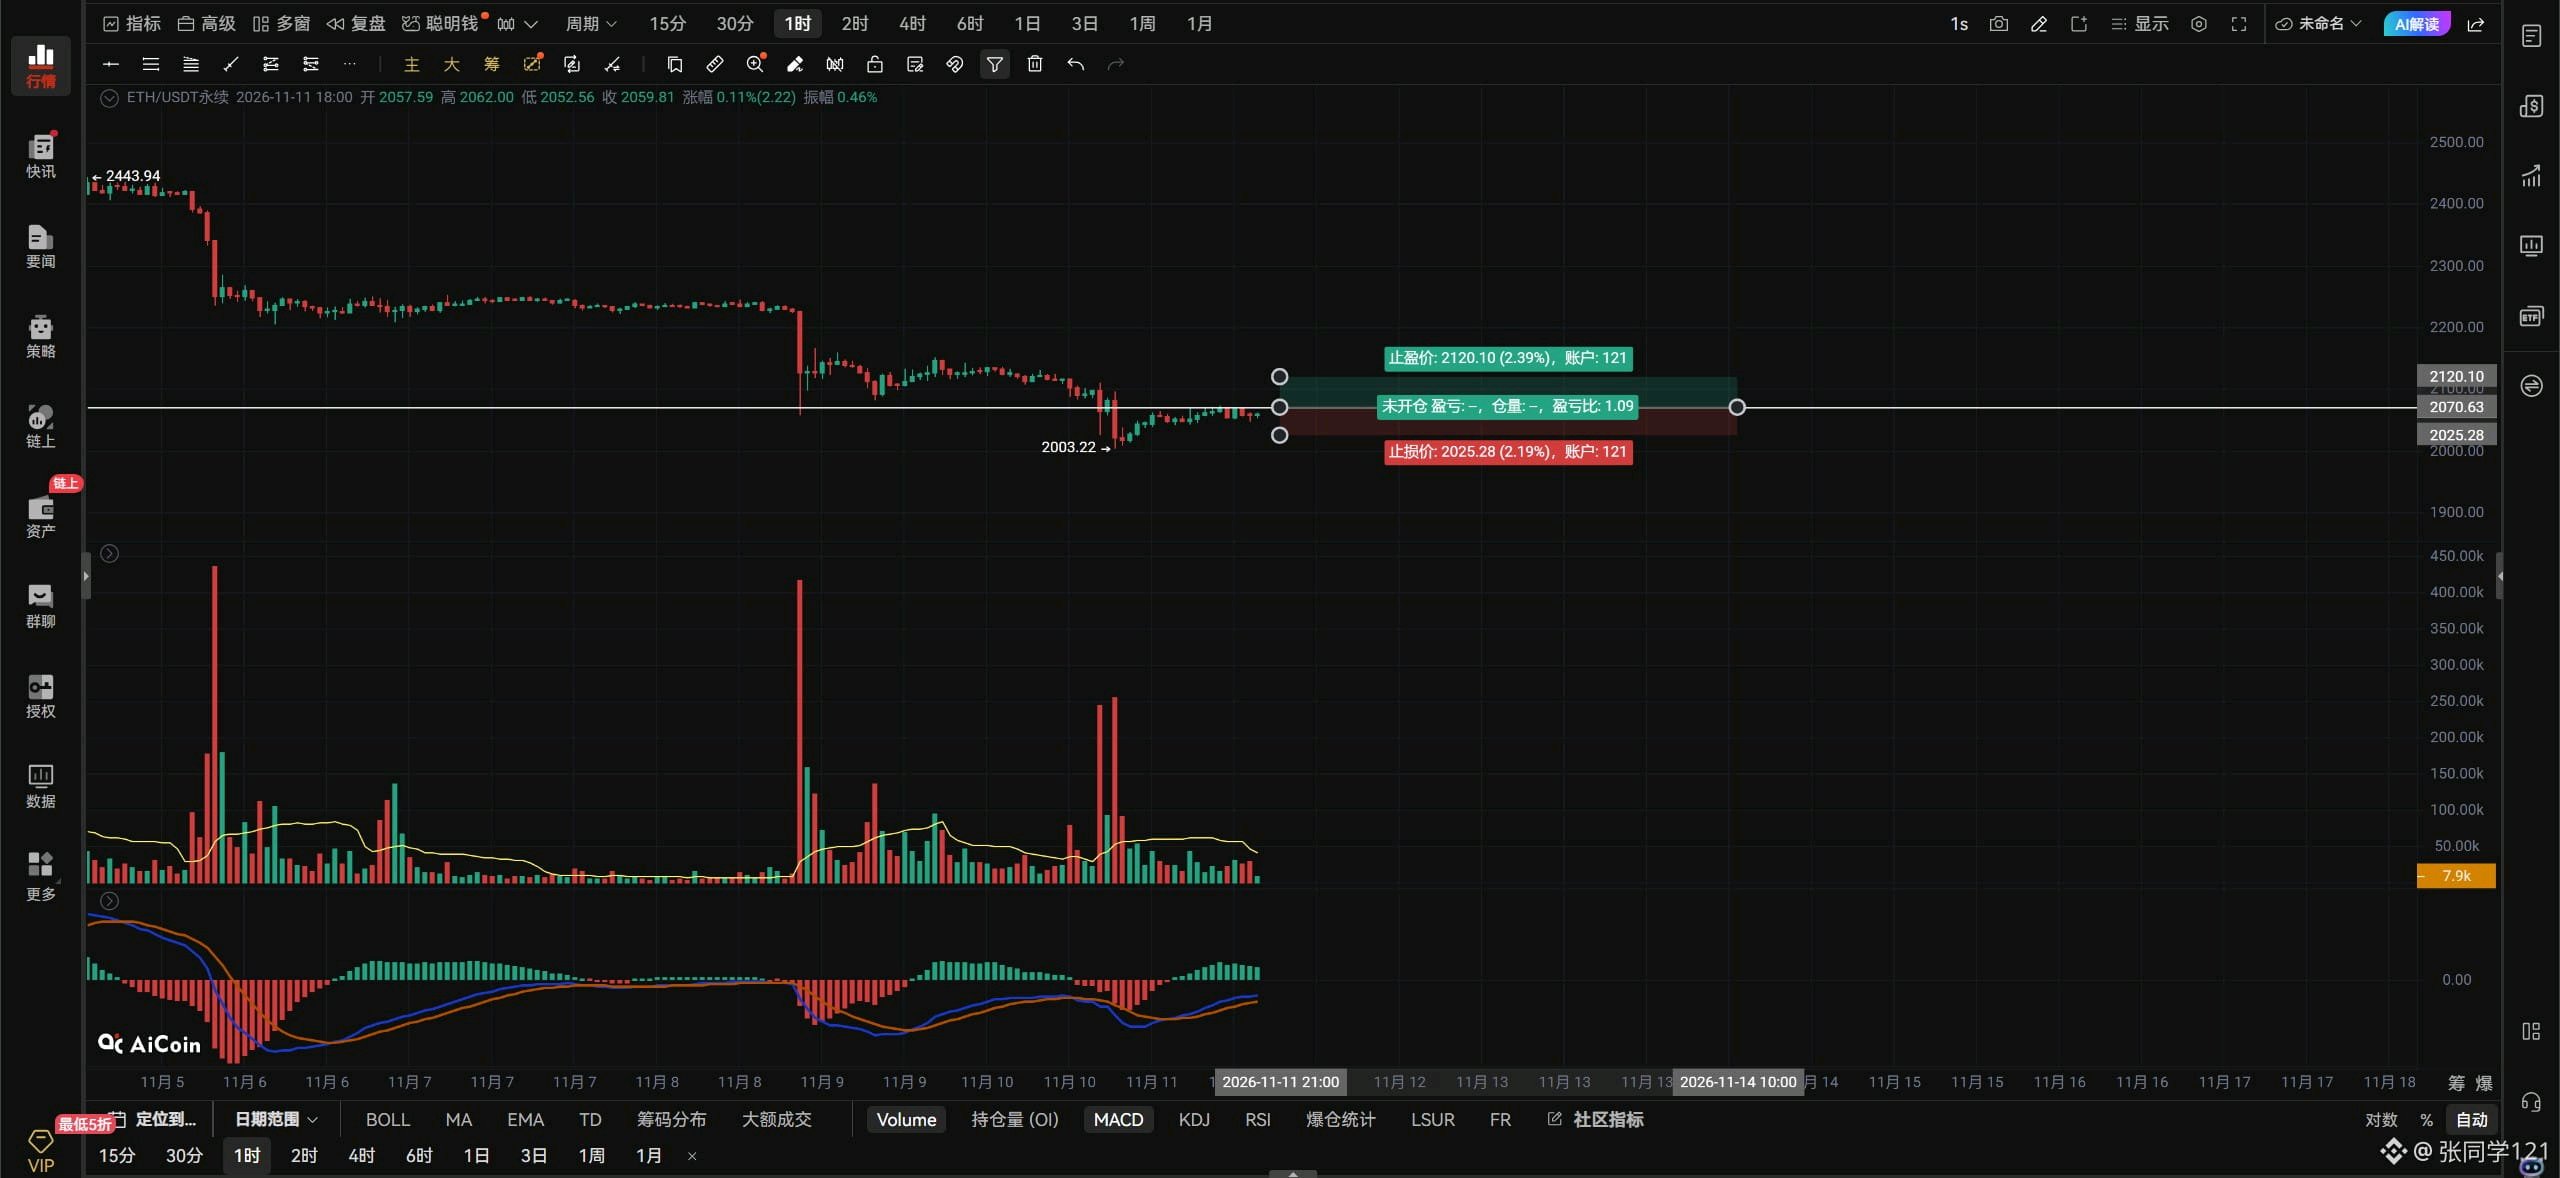
$ETHUSDT 's view: If ETH breaks above 2063 with volume, chase a long on the right side, with a stop-loss in place. If it breaks below 2052 with volume, chase a short on the right side, with a stop-loss in place. If a retest of 2003 confirms that support is holding, add one unit to the long. Stop out if price breaks below 1976. On the hourly chart, if ETH holds above 2063, look for 2092–2147. Watch for ETH to reach 2092 to take a short; stop out if it breaks above 2147. Left-side wick orders: long at 1976; stop out if price breaks below 1938. Resistance above: 2063-2092-2147 Support below: 2052-2035-2003 On the 4-hour chart, a break below 2052 points to 2035-2003. ETH retested the key support at 2000 and held. Now the question is whether ETH can stay above 2035. If it can, the decline may pause for now, with a chance to challenge 2091. If it fails to break 2091, a retest of 2000 will surely break it. Once ETH falls below 2000, the decline could get out of hand. That’s all. #WSOT2026 #ByXIMPACT
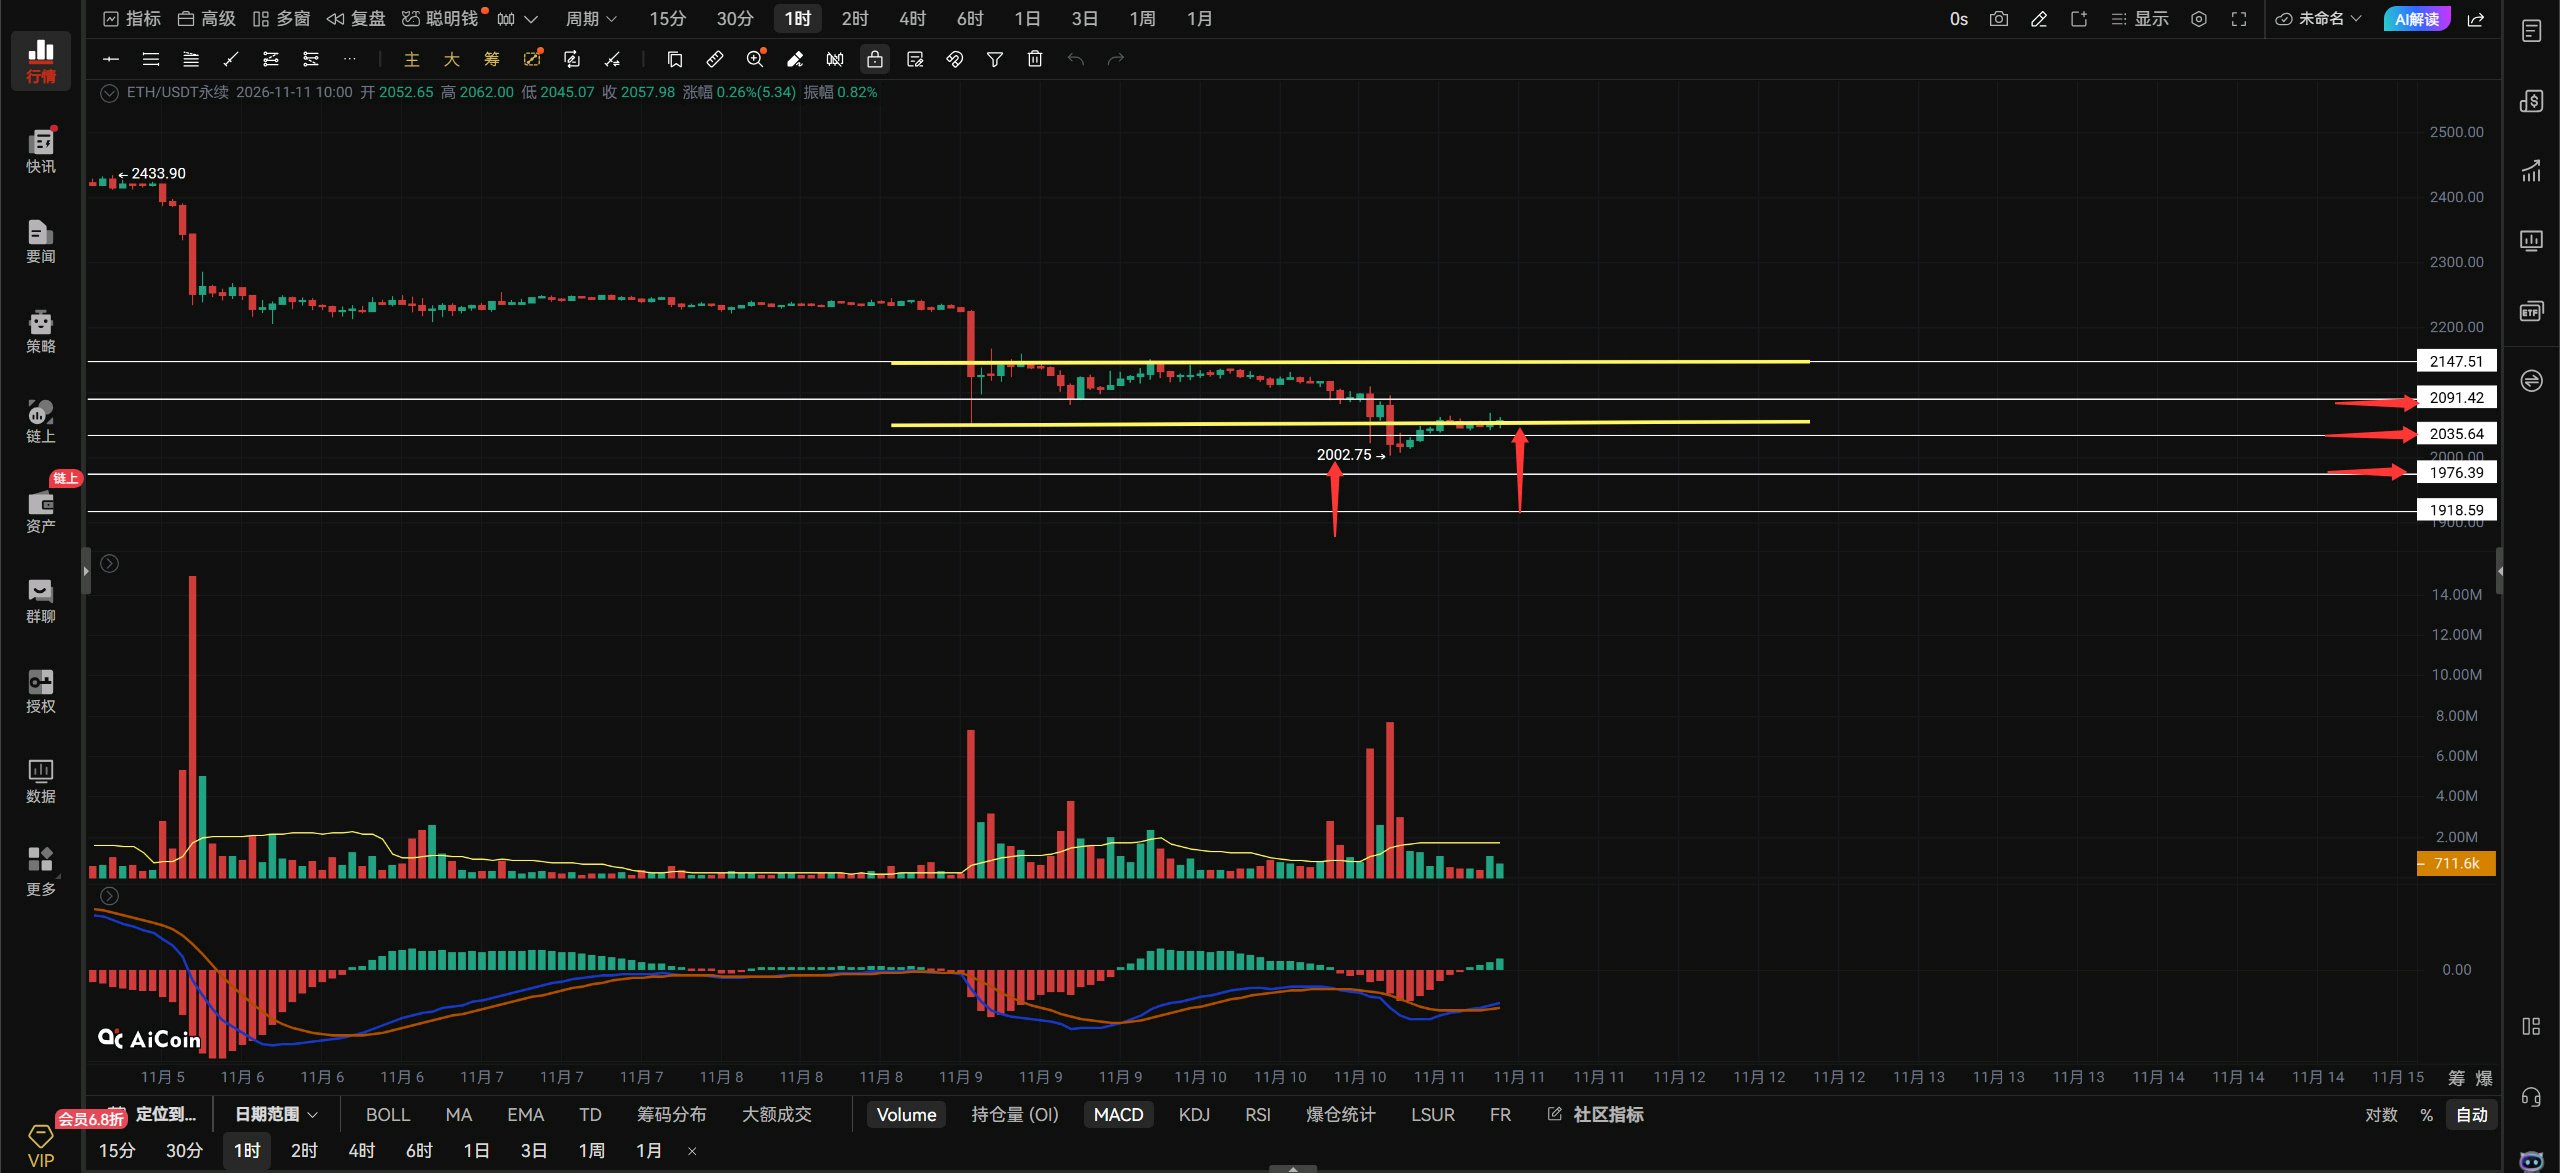
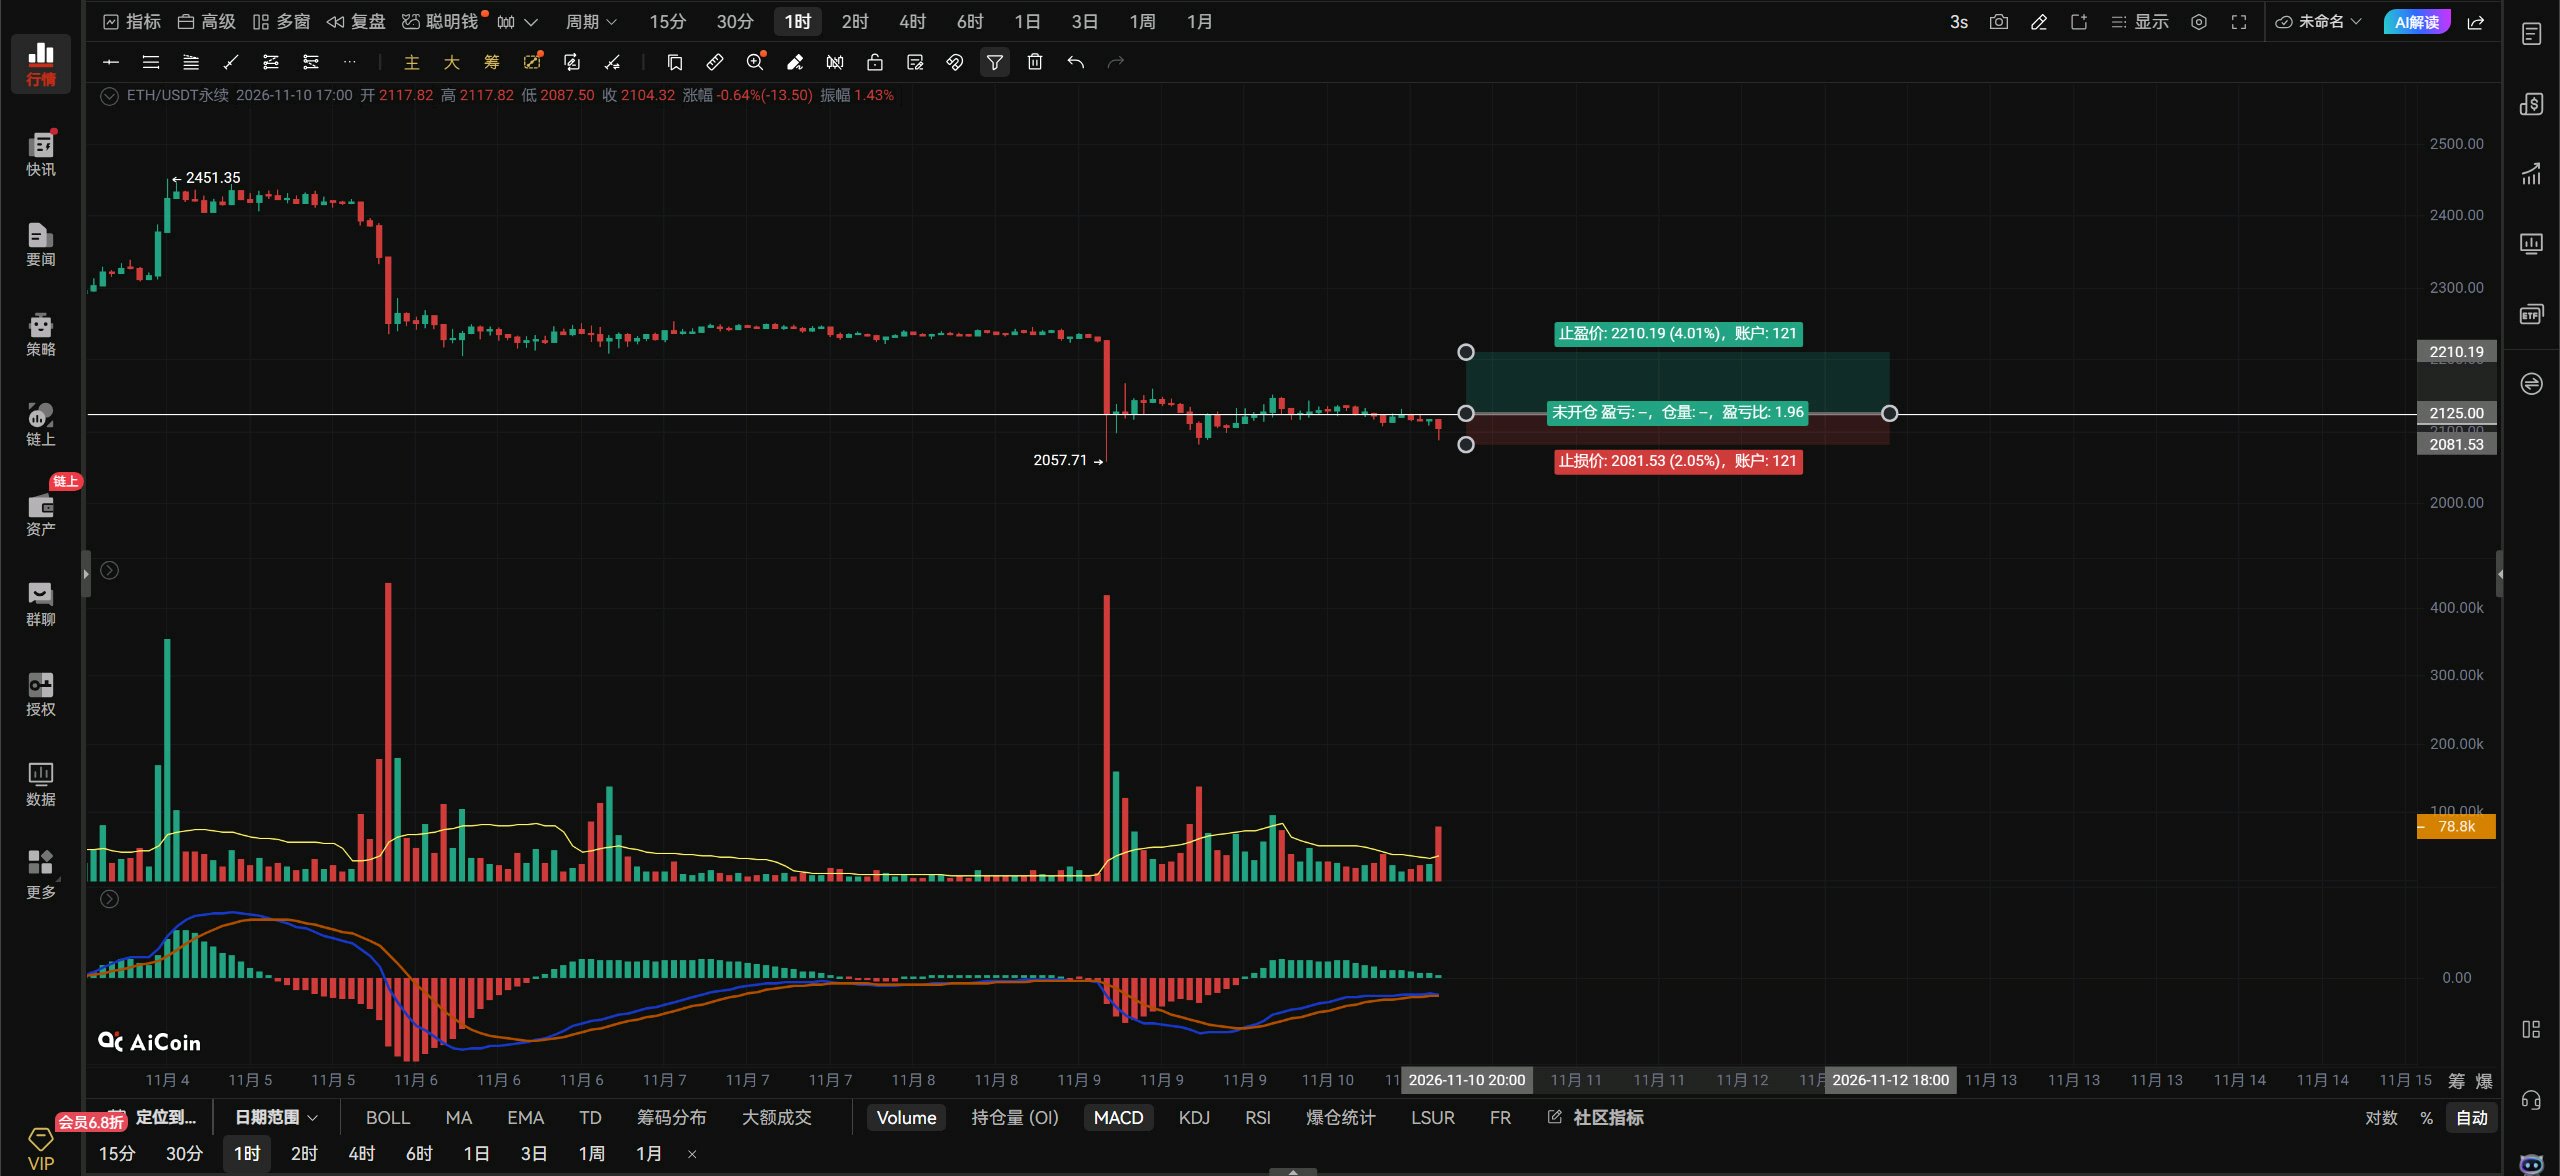
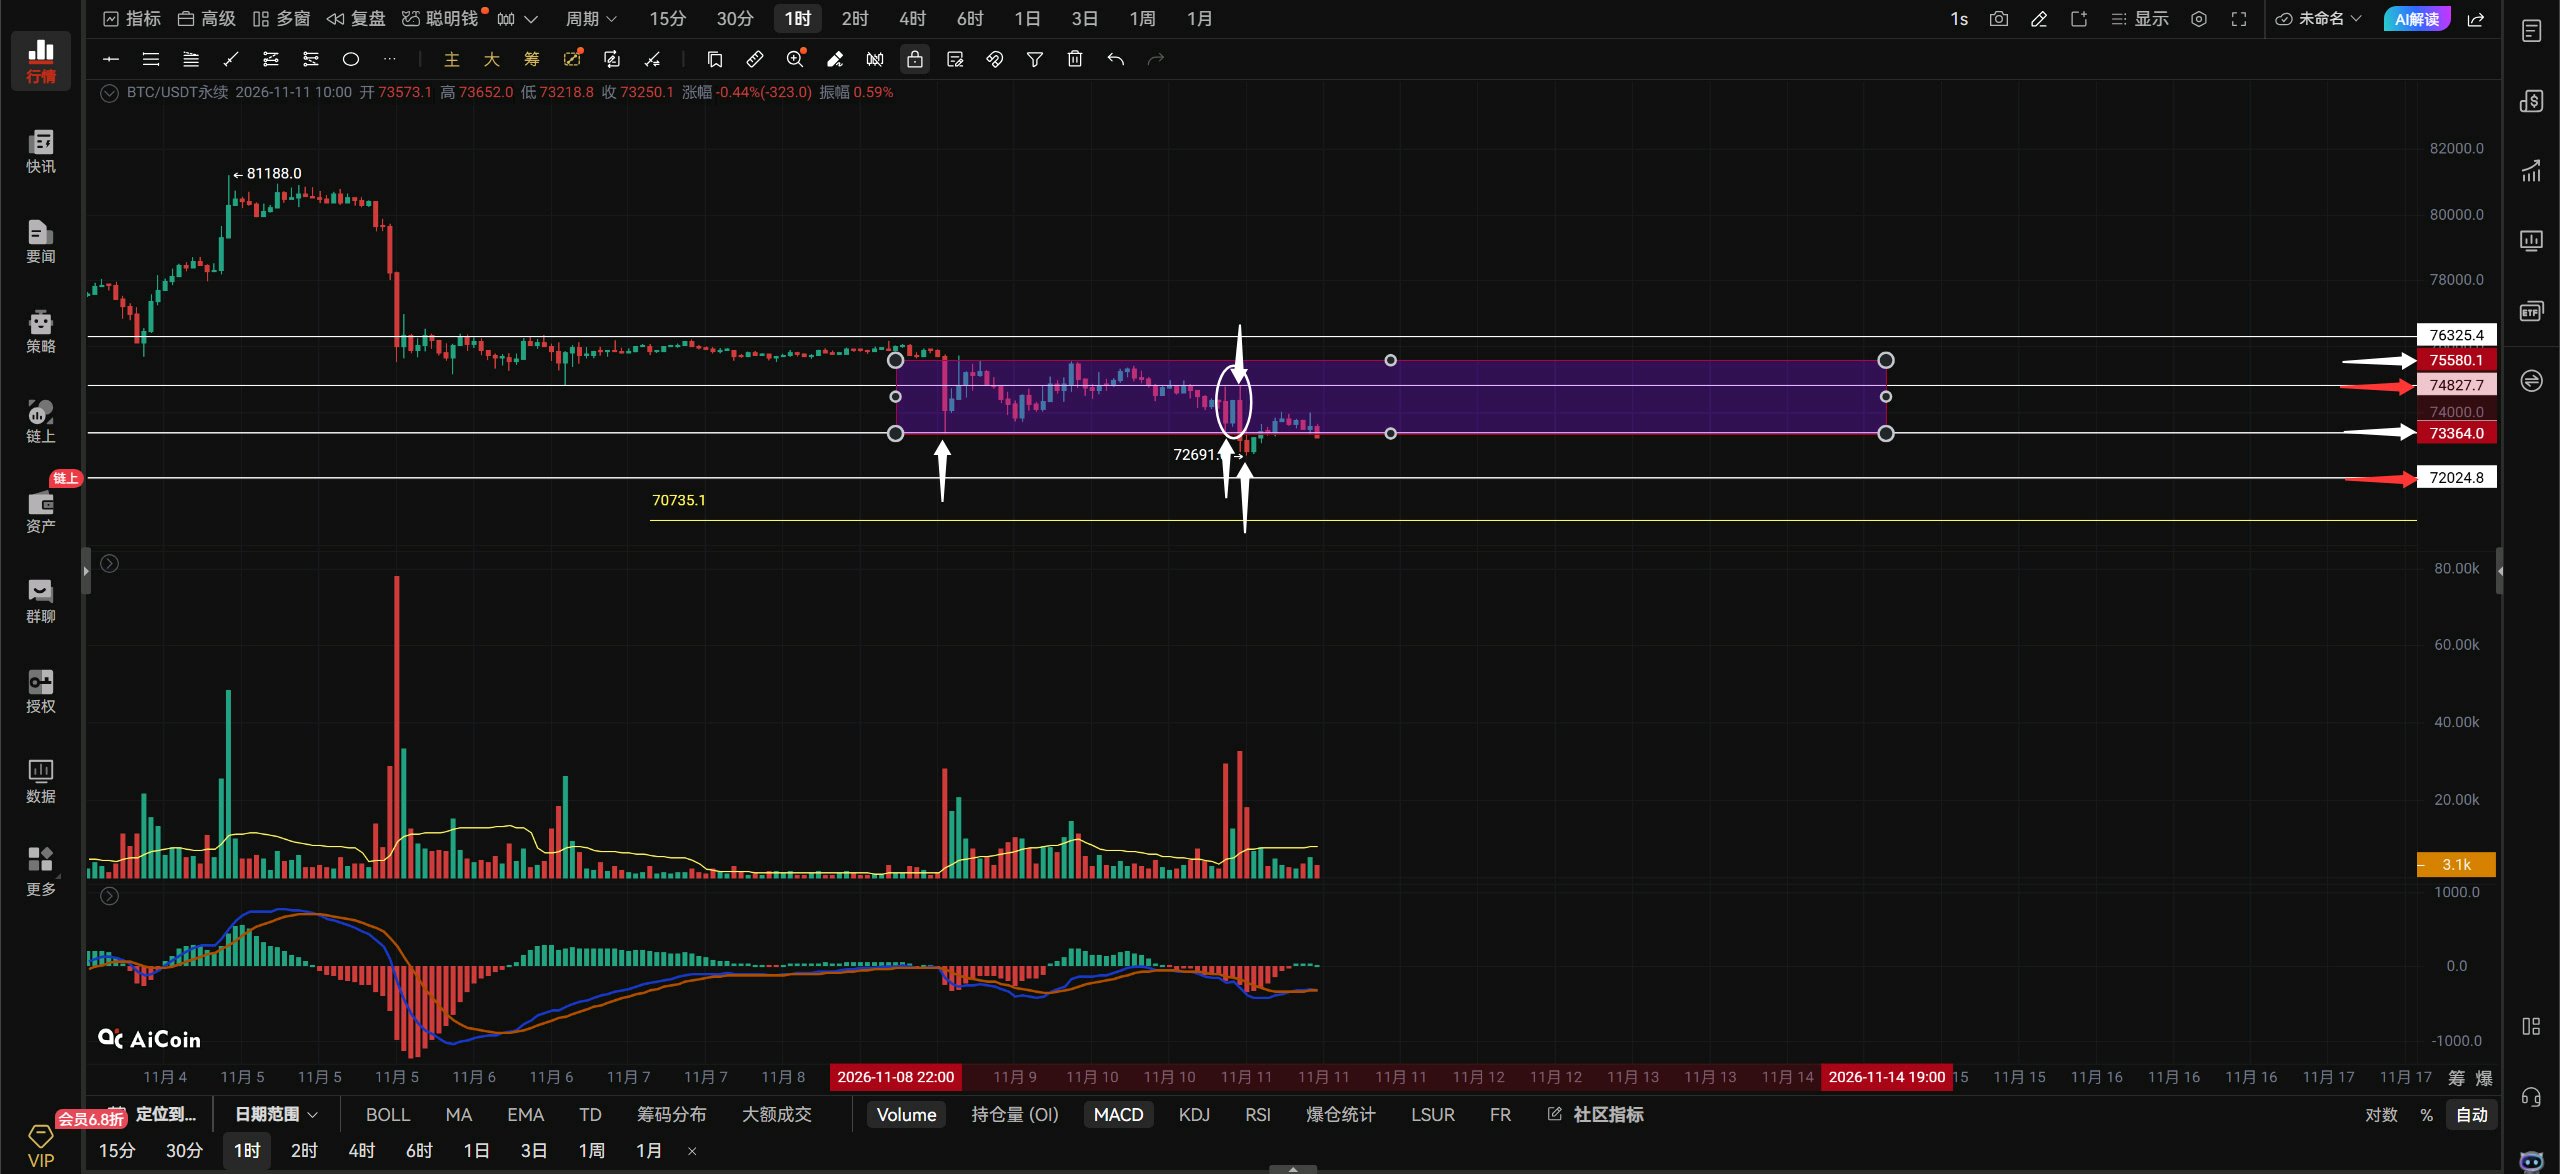
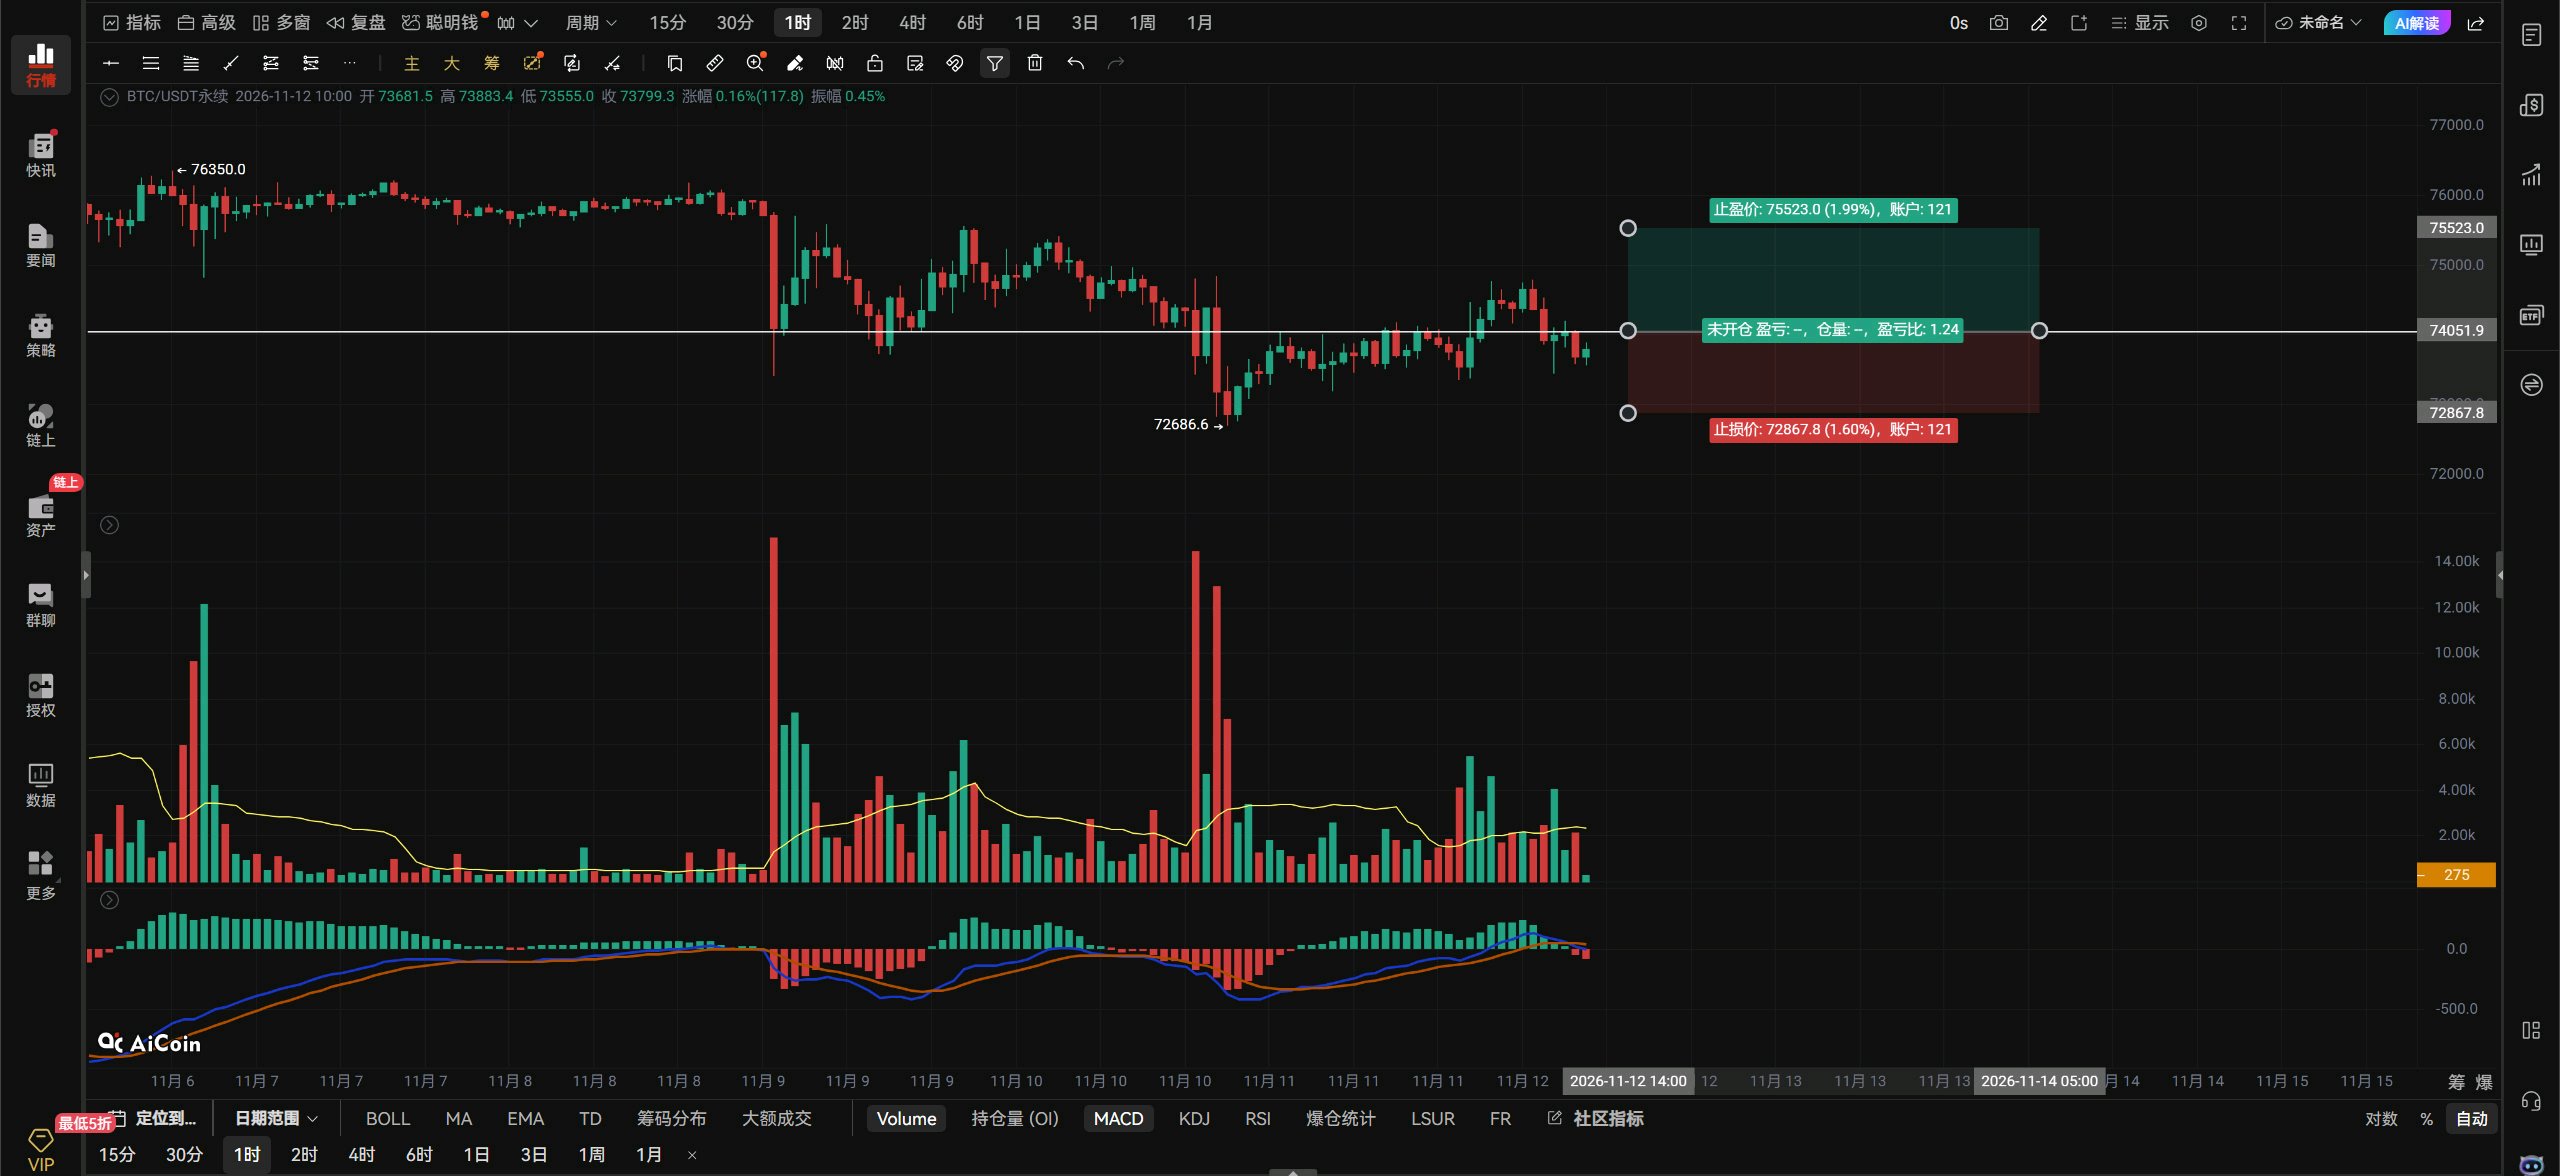
$BTCUSDT 🌿11.11 Midday Market Outlook.🌿 $BTC 's view: Bitcoin has really been discounted again this 11.11. I can tell you very clearly now: there is no bullish trend on any timeframe. Until price reclaims and stays above 75000, every bounce is an opportunity to short. Bitcoin's 75580–73364 consolidation range has been broken. Next, watch whether Bitcoin can hold above 73364. If it can, there's still a chance of an upward bounce; if it can't hold 73364, then wait for Bitcoin to test 72024! I originally thought the previous low wouldn't be broken—the white arrow below points to it—because there wasn't much bad news out there, and a bottom signal appeared in the area marked by the white box. But the bounce failed to break through the resistance at 74827, and then a single large bearish candle smashed through the previous low and made an even lower low. Although Bitcoin has made a lower low, the ratio of long to short positions hasn't fallen; it remains high at 2.9. Looks like everyone's enthusiasm for buying the dip hasn't waned! Everyone wants to buy the dip, and so do I, but looking at the current market, there isn't even a bottom in sight! Price was rising just fine, then suddenly got dumped. For Bitcoin to rise, it must break through the 74827–75580 resistance zone to start a rebound; there's no point if it can't break through this zone. Those looking to go long should watch for Bitcoin to retest the previous low and see if a bottom signal appears before entering; otherwise, wait to short in the 74827–75580 zone! If Bitcoin breaks above 73875 with volume, aggressive traders can chase a long on the right side. If it rebounds to 75539, take a light short on the left side, with a stop-loss in place. On the hourly chart, if Bitcoin breaks above and holds 73875, look for 74827–75539; if it can't get above 73875, there's no point. On the 4-hour chart, if price breaks below 73384, look for 72691–72024. Resistance above: 73875–74827–75539 Support below: 73384–72691–72024 #ByXIMPACT