Kashi Khan tumsa
6190Me gusta0Compartir en el chat242Aficionados448Seguir
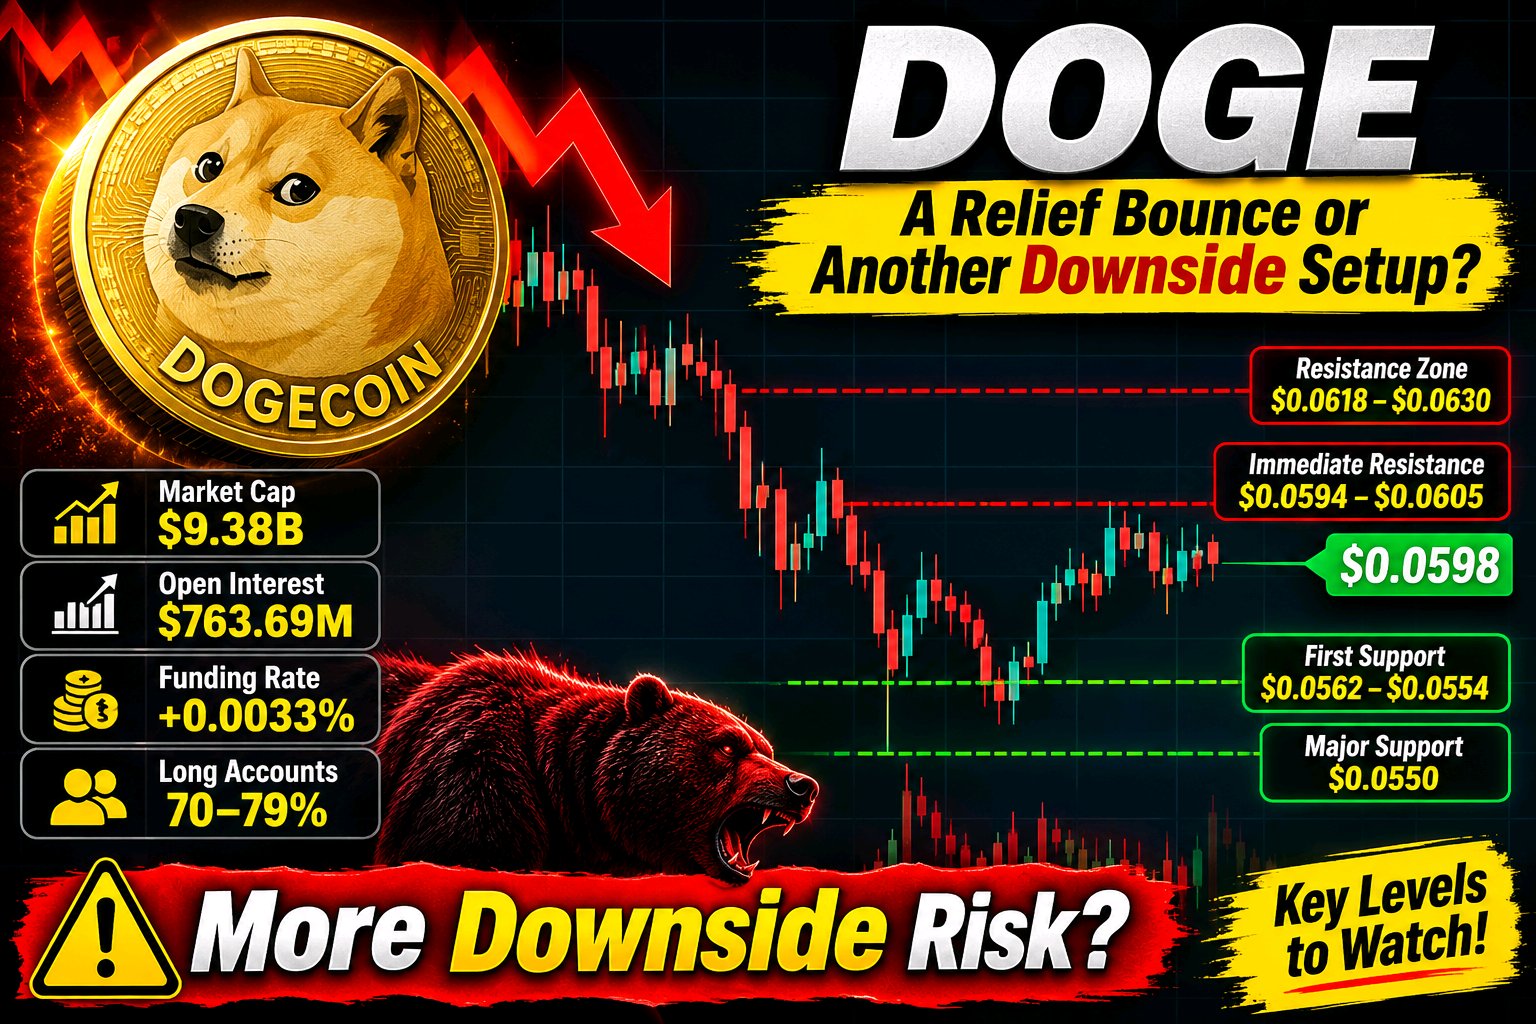
#ByXIMPACT $DOGEUSDT – A Relief Bounce or Another Downside Setup? Dogecoin is trading near $0.0598, recovering from a recent low around $0.0554. Despite the roughly 4.4% 24-hour rebound, DOGE remains down approximately 14.5% over seven days. I am not treating this stabilization as a confirmed recovery yet. The bigger concern is weak institutional demand, elevated futures exposure, and heavily long-tilted positioning that could create additional downside pressure. CoinGlass +1 DOGE has a market capitalization of approximately $9.38 billion. The recent decline has left its broader daily structure under pressure, despite the latest bounce. * Immediate resistance: $0.0594–$0.0605 * Next resistance: $0.0618–$0.0630 * First support: $0.0562–$0.0554 * Major nearby support: $0.0550 A sustained reclaim of $0.0605 would improve short-term momentum and potentially open $0.0618–$0.0630. However, the broader bearish structure remains intact until stronger buying confirms a trend change. Borearis +2 The institutional demand picture remains unconvincing. U.S. spot Dogecoin ETFs reported no net flows on November 13, with two of three funds reporting. The latest 30-session data showed approximately $539K in net outflows and virtually no fresh inflow activity. Meanwhile, DOGE futures volume is approximately 7.4 times spot volume. This suggests derivatives activity is dominating price participation rather than strong, consistent spot accumulation. Crypto ETF +1 The key question remains whether spot buyers can absorb available supply or whether the latest rebound is primarily leveraged positioning. DOGE is attempting to stabilize after a substantial decline, with the recent trading range developing around $0.0554–$0.0601. A narrow range following a sharp sell-off is not evidence of accumulation. The market needs stronger spot volume and sustained acceptance above resistance. Otherwise, another liquidity sweep below $0.0554 remains possible, potentially exposing lower support zones. Current derivatives data deserves close attention. * Total open interest: approximately $763.69M * 24-hour OI change: +1.29% * Weighted funding rate: +0.0033% * Binance long accounts: approximately 70.3% * Bybit long accounts: approximately 79.0% * 24-hour liquidations: approximately $2.67M, including $1.67M in longs. Funding is positive overall, meaning longs are paying shorts, although funding differs across exchanges. The important issue is that a substantial majority of accounts are positioned long. This creates vulnerability if support breaks, particularly with open interest increasing during the latest rebound. A downside move could trigger fresh long liquidations. CoinGlass +1 | Metric | Level | | -------------------- | -------- | | Current price | $0.0598 | | Market cap | $9.38B | | 7-day change | -14.5% | | Immediate resistance | $0.0605 | | First support | $0.0562 | | Recent low | $0.0554 | | Open interest | $763.69M | | Funding rate | +0.0033% | | Long accounts | 70–79% | Bullish confirmation: A decisive reclaim and sustained hold above $0.0605 would improve the short-term structure, opening potential tests of $0.0618 and $0.0630. Strong spot participation is necessary to validate this move. Bearish confirmation: A confirmed breakdown below $0.0554 would expose $0.0536, followed by the $0.0499 region. Elevated long positioning could accelerate the decline through forced liquidations. fullswing.ai +1 DOGE is showing temporary stability, but the broader recovery argument remains unproven. Weak institutional ETF demand, derivatives-heavy trading activity, and crowded long positioning continue to create an unfavorable risk profile. A short-term bounce does not automatically mean selling pressure has disappeared. The decisive signal is whether genuine spot buyers return while leverage remains controlled, or whether another support breakdown triggers a fresh wave of long liquidations. For now, DOGE deserves a cautious, neutral-to-bearish outlook until stronger market structure confirms otherwise.
#ByXIMPACT $FFUSDT muestra un rebote a corto plazo más fuerte, pero la calidad de la compra sigue planteando dudas. Falcon Finance cotiza alrededor de $0,0953, con una subida aproximada del 4,5% en 24 horas. Los movimientos en 1H y 4H son positivos, aunque el rendimiento a 30 días sigue bajando alrededor de un 11%. Parece una mejora del impulso, no una recuperación confirmada en marcos temporales superiores. CoinGlass +1 El RSI de 4H está alrededor de 64, mientras que el RSI diario es de aproximadamente 48. Los compradores a corto plazo han tomado el control, pero la perspectiva del impulso diario sigue siendo relativamente neutral. El desarrollo importante es el movimiento por encima de $0,0940. Esta era una zona de resistencia previa y un pivote diario. Mantenerlo durante un retroceso fortalecería el escenario alcista. El obstáculo inmediato es la zona de $0,0955, cerca del máximo actual de 24 horas. Niveles clave: * Soporte / Defensa: $0,0940 * Confirmación de ruptura: $0,0955 * Próxima resistencia / Objetivo: $0,0994 * Soporte principal a la baja: $0,0901 No perseguiría una posición larga directamente contra una resistencia. Mi configuración condicional es esperar una ruptura convincente por encima de $0,0955 y un retest exitoso. Un cierre diario por debajo de $0,0901 invalidaría la mejora en la estructura. COINOTAG +1 Un detalle merece más atención: el volumen de negociación de futuros es de aproximadamente 29,3 millones de dólares, en comparación con solo 3,3 millones de dólares en volumen al contado (spot). La actividad de derivados es aproximadamente nueve veces mayor que la actividad al contado. Eso sugiere que el apalancamiento está jugando un papel mucho mayor que la demanda real al contado. Una ruptura sin una participación al contado más fuerte podría convertirse fácilmente en una trampa de liquidez. CoinGlass A nivel fundamental, la expansión de la elegibilidad de colateral USDf de Falcon para incluir la stablecoin KGST de Kirguistán es un desarrollo significativo para el ecosistema. Su informe de septiembre también mostró 1.210 millones de dólares en suministro de USDf y un respaldo de reservas del 156,47%. Sin embargo, el crecimiento del protocolo todavía necesita traducirse en una demanda sostenible para FF. Falcon Finance Mi conclusión: Si FF mantiene los $0,0940 y supera los $0,0955, $0,0994 se convierte en la siguiente área a vigilar. No defender los $0,0940 desplazaría la atención de nuevo hacia los $0,0901. ¿Confirmarán finalmente los compradores al contado esta ruptura, o el posicionamiento impulsado por los futuros hace más probable otro rechazo?

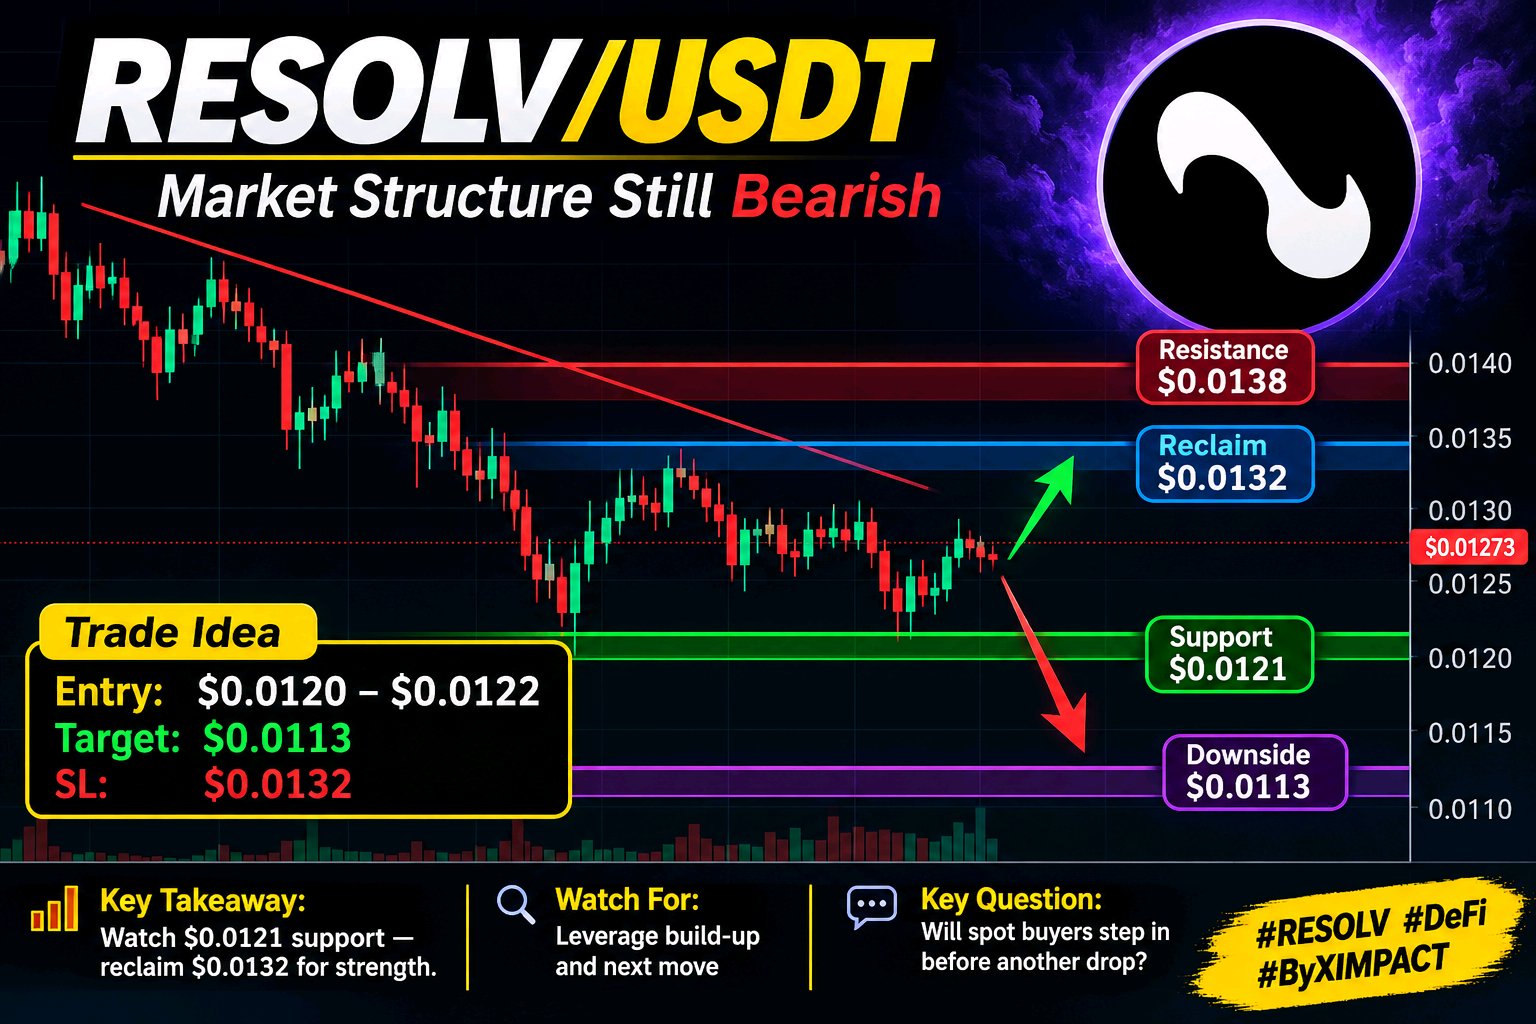
#ByXIMPACT $RESOLVUSDT está mostrando un rebote tras probar nuevos mínimos, pero el mercado de derivados se está expandiendo más rápido que la demanda real al contado (spot). Esa diferencia merece atención. RESOLV cotiza en torno a 0,01273 $, con una bajada aproximada del 0,55 % en 24 horas, tras oscilar entre los 0,01140 $ y los 0,01353 $. La recuperación desde el mínimo aún no ha reparado la estructura general. Los compradores a corto plazo necesitan recuperar los 0,0132 $, mientras que las tendencias de 4H y diaria siguen siendo bajistas. Las lecturas del RSI de 44,3 en 4H y 37,2 en diario confirman que el impulso sigue siendo débil. CoinGlass +1 Los derivados están enviando una advertencia. El interés abierto (Open Interest) ha aumentado un 16,21 % hasta los 6,17 millones de $, mientras que el volumen de futuros se disparó un 229,67 % hasta los 9,97 millones de $. El volumen de negocio de los futuros es aproximadamente 10,5 veces superior al volumen al contado. Mientras tanto, se registraron cerca de 45,63 mil $ en liquidaciones, con un 95 % proveniente de posiciones largas. La financiación (funding) sigue siendo positiva en un 0,0100 % cada 8 horas. Esto sugiere que el apalancamiento está volviendo, pero el mercado al contado aún no ha demostrado suficiente fuerza como para validar una recuperación sostenida. CoinGlass Niveles clave que estoy observando: * Soporte / Defensa: 0,0121 $ — soporte diario importante. * Recuperación: 0,0132 $ — volver a ganar este punto de pivote mejoraría la estructura a corto plazo. * Resistencia: 0,0138 $ — un nivel de confirmación más fuerte. * A la baja: 0,0113 $ — siguiente soporte importante si fallan los 0,0121 $. COINOTAG Tesis de trading condicional: evitaría perseguir una posición a los precios actuales. Una configuración en corto se vuelve más interesante en torno a los 0,0120 $–0,0122 $ solo después de una ruptura confirmada y una recuperación fallida. Objetivo: 0,0113 $. Invalidación: 0,0132 $. Un factor que se pasa por alto es la presión de la oferta: DefiLlama lista un desbloqueo de 18,24 millones de RESOLV para el 26 de noviembre, equivalente a aproximadamente el 3,54 % de la oferta circulante. No garantiza una venta, pero añade otra consideración mientras la liquidez siga siendo limitada. DefiLlama Si los 0,0121 $ se mantienen y se recuperan los 0,0132 $, la configuración bajista se debilita. Si el soporte se rompe, los 0,0113 $ cobran relevancia. ¿Intervendrán los compradores al contado antes de que el apalancamiento aumente aún más, o sigue siendo RESOLV vulnerable a otro barrido de liquidez?
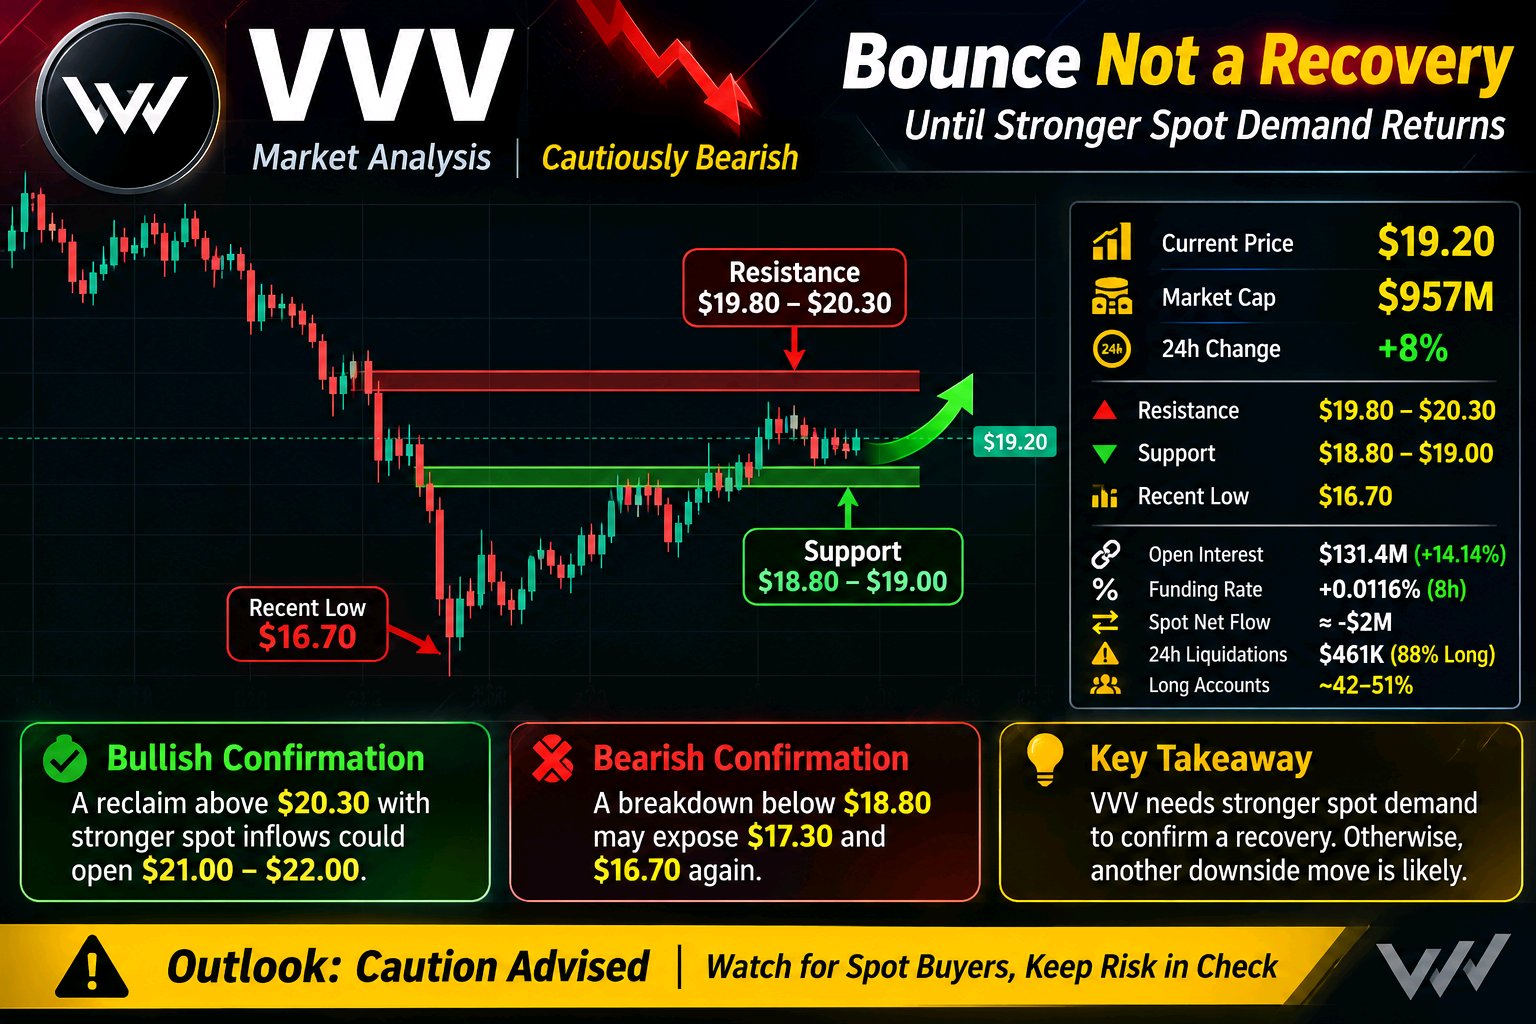
#ByXIMPACT $VVVUSDT is attempting to regain bullish momentum, but the market still needs stronger confirmation. Price is holding near $19.20, with resistance at $19.80–$20.30 and support around $18.80–$19.00. Rising open interest and positive funding suggest leverage is returning. Without stronger spot demand, another downside move remains possible. A clean breakout above $20.30 could open the door toward $21–$22. Until then, patience and risk management matter.
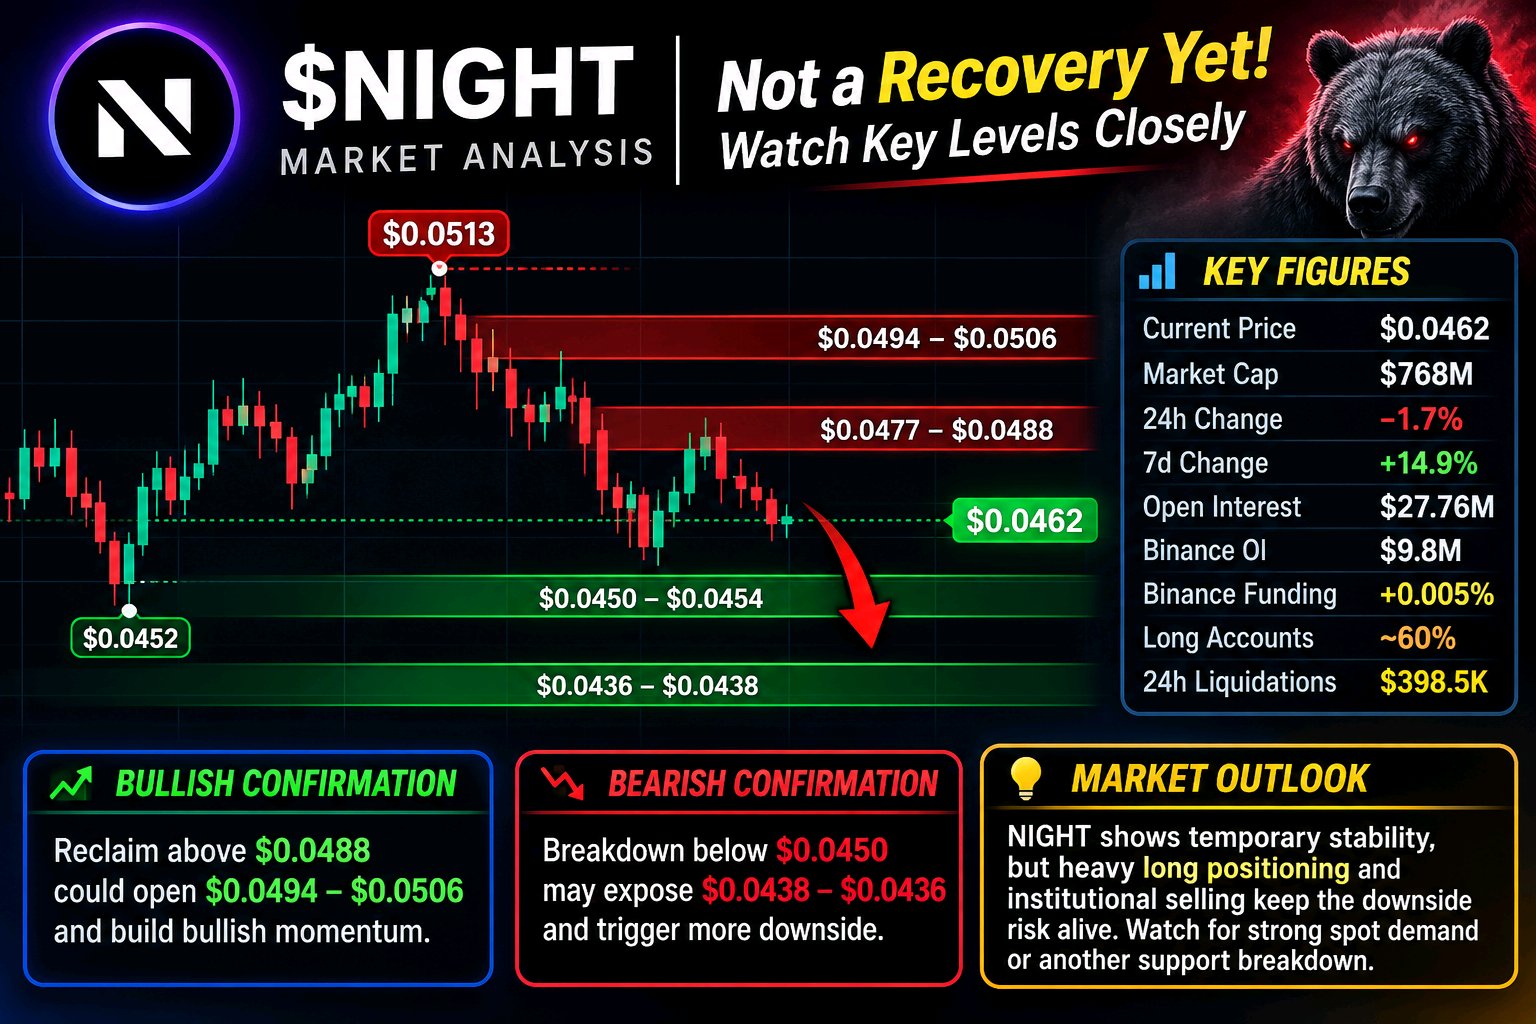
#ByXIMPACT $NIGHTUSDT (Midnight) — Market Structure, Liquidity & Derivatives Analysis NIGHT is trading around $0.0462, following a rejection from the recent $0.0513 high and a pullback toward $0.0452. I am not treating the current stabilization as a confirmed recovery. The weekly structure remains positive, but the short-term picture is more complicated. Spot inflows are competing with rising futures open interest, while leveraged positioning remains tilted toward longs. The key question is whether genuine spot demand can absorb selling pressure before another liquidity sweep develops. NIGHT has a market capitalization of approximately $768 million. It is down around 1.7% over 24 hours but remains approximately 14.9% higher over seven days. The rejection from $0.0513 toward $0.0452 represents an approximately 11.9% retracement. Price is now attempting to stabilize above the $0.0450–$0.0454 support area. Immediate resistance sits around $0.0477–$0.0488, followed by $0.0494–$0.0506. A sustained reclaim of these levels would improve the short-term structure, but the market still needs stronger confirmation before the broader recovery narrative becomes credible. CoinGlass +2 NIGHT does not have the same established ETF-flow channel as Bitcoin or Ethereum, so exchange-flow data is more relevant here. The latest available aggregate flow snapshot shows approximately $2.2 million in spot net inflows, compared with around $6.5 million in futures net outflows. This suggests some spot demand is present, but it does not establish sustained institutional accumulation. The divergence between spot and derivatives activity needs monitoring, particularly while price struggles to reclaim nearby resistance. There is not enough verified evidence to claim that large institutions are consistently accumulating NIGHT. CoinGlass The immediate range is approximately $0.0452–$0.0488, following the rejection near $0.0513. A narrow trading range after a sharp move does not automatically indicate accumulation. It can also represent temporary balance before another expansion in volatility. Spot volume has increased, but stronger and sustained buying participation is still required to absorb supply around resistance. A breakdown below $0.0450 would put the next support levels under pressure. Aggregate open interest across exchanges is approximately $27.76 million, up around 10.9% over 24 hours. Binance-specific open interest is approximately $9.8 million, also showing an increase of roughly 11%. Binance funding is around +0.005% per four hours, meaning longs are paying shorts. Approximately 60% of Binance accounts are positioned long, while top traders are around 57% long by position size. This is a meaningful long-side imbalance. However, rising open interest alongside price weakness also indicates growing short participation. The market is not one-sided, but the long-heavy account distribution creates vulnerability if support breaks. Approximately $398,500 in liquidations occurred over 24 hours, with 56% attributed to longs. CoinGlass +2 * Current price area: $0.0462 * Market capitalization: $768M * Immediate resistance: $0.0477–$0.0488 * Higher resistance: $0.0494–$0.0506 * First support: $0.0450–$0.0454 * Next support: $0.0436–$0.0438 * Recent low: $0.0452 * Aggregate open interest: $27.76M * Binance open interest: $9.8M * Binance funding: +0.005% * Binance accounts long: Approximately 60% * 24-hour liquidations: $398.5K 7\. Confirmation Levels Bullish confirmation: A sustained reclaim above $0.0488 would improve the short-term structure and open the way toward $0.0494–$0.0506. A stronger move above $0.0513 would provide more convincing evidence that buyers are regaining control. Bearish confirmation: A decisive breakdown below $0.0450 would expose the $0.0438–$0.0436 support zone. Losing that region would increase the risk of additional long liquidations and a deeper retracement. NIGHT is showing temporary stability, and its weekly performance remains constructive. However, rising open interest, positive funding and a long-heavy account distribution create conditions where a failed support level could trigger further liquidation pressure. Spot inflows are encouraging, but they have not yet produced a decisive resistance reclaim. The next meaningful signal is whether spot buyers return with enough strength to absorb selling while leverage remains controlled, or whether another support breakdown triggers fresh long liquidations
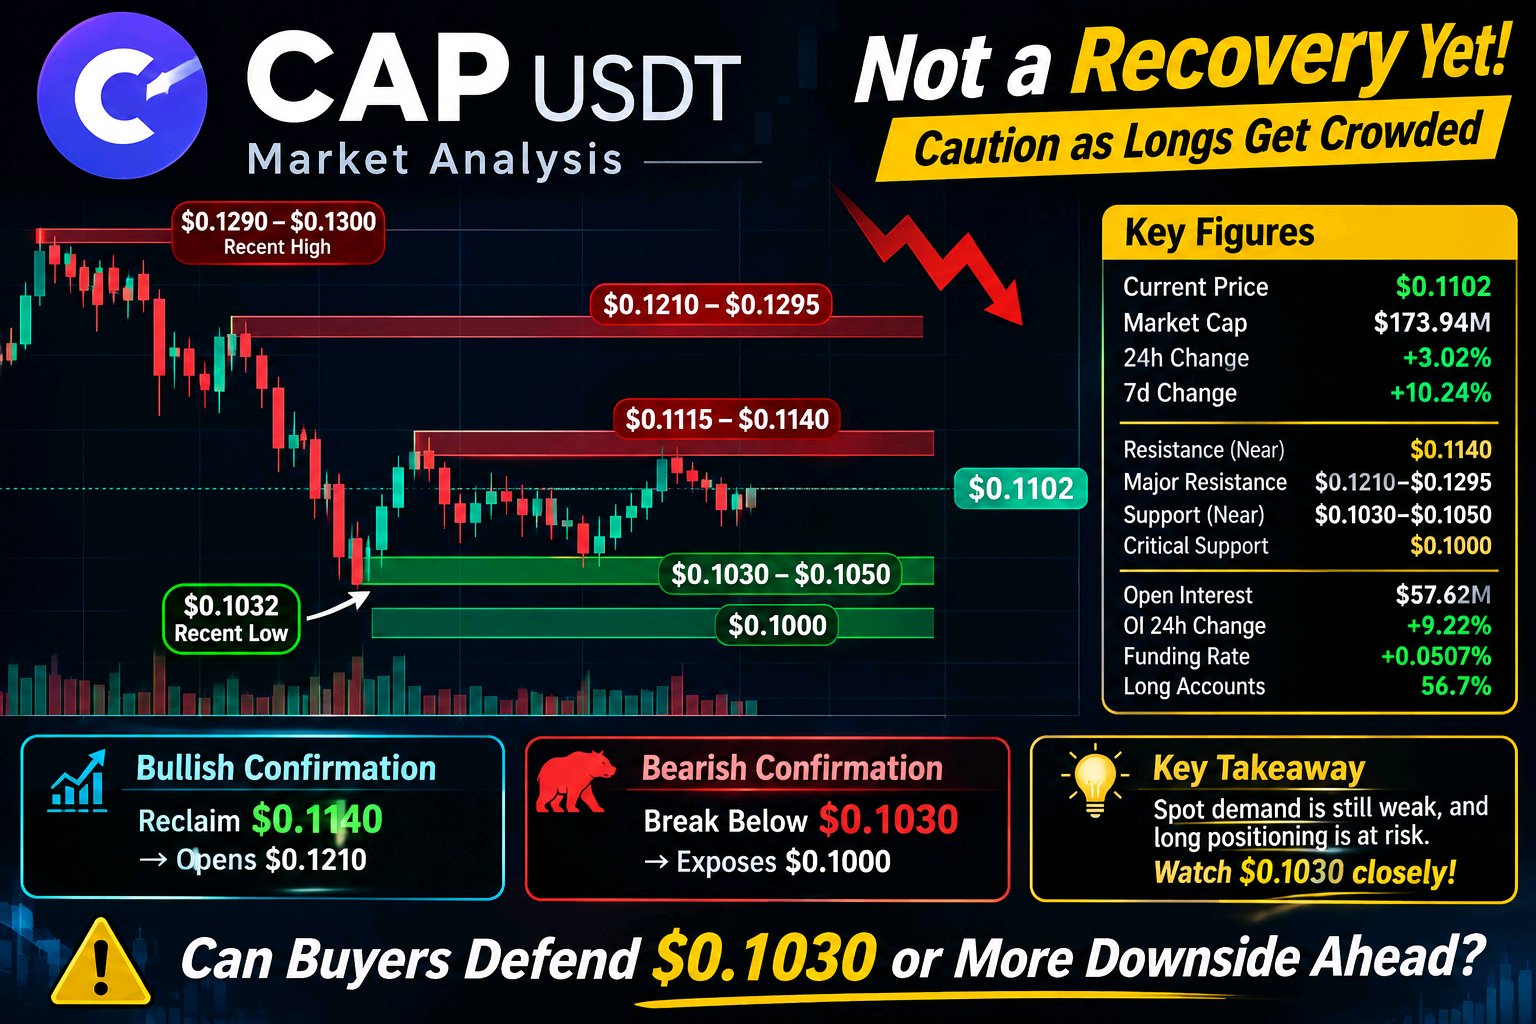
#ByXIMPACT $CAPUSDT cotiza alrededor de los 0,1102 $, tras un fuerte rechazo desde la zona de 0,1290 $–0,1300 $ y un reciente descenso hacia los 0,1032 $. Todavía no trato la estabilización actual como una recuperación confirmada. La mayor preocupación es la divergencia entre la demanda al contado (spot) y la actividad de derivados, con un interés abierto en aumento, una financiación que sigue siendo fuertemente positiva y un posicionamiento en largo que está cada vez más saturado. CAP ha subido aproximadamente un 3,02 % en 24 horas y un 10,24 % en siete días, con una capitalización de mercado cercana a los 173,9 millones de dólares. Sin embargo, el precio se mantiene aproximadamente un 14,6 % por debajo de su máximo reciente. La zona de resistencia inmediata se sitúa entre 0,1115 $ y 0,1140 $, seguida de 0,1210 $–0,1295 $. A la baja, el soporte inicial se sitúa alrededor de 0,1030 $–0,1050 $, con un soporte estructural más fuerte cerca de los 0,1000 $. Una recuperación sostenida de los 0,1140 $ mejoraría la estructura a corto plazo y abriría potencialmente un movimiento hacia los 0,1210 $. Hasta entonces, el último rebote sigue siendo vulnerable a otro rechazo. CoinGlass +1 La divergencia entre contado y futuros merece atención. Los datos recientes agregados de los exchanges muestran aproximadamente 1,7 millones de dólares en salidas netas de spot, mientras que el interés abierto de futuros ha aumentado a aproximadamente 57,62 millones de dólares. El volumen spot ronda los 31,35 millones de dólares frente a los 137,20 millones de dólares en volumen de futuros. Esto sugiere que los derivados están desempeñando un papel mucho más importante en la actividad actual que la participación en spot. No hay ningún catalizador de flujo de ETF verificado aplicable a CAP, por lo que los flujos de los exchanges y la actividad de grandes posiciones proporcionan una imagen más relevante. Los datos disponibles no confirman un evento específico de liquidación institucional o un catalizador relacionado con los exchanges. CoinGlass +1 CAP está intentando estabilizarse entre aproximadamente 0,1030 $ y 0,1140 $ tras su rechazo desde el máximo reciente. Sin embargo, un rango de negociación estrecho tras una fuerte caída no es prueba de acumulación. El hecho de que la actividad de futuros siga siendo significativamente mayor que la actividad spot plantea una pregunta importante: ¿están los compradores reales de spot absorbiendo la oferta disponible, o es el apalancamiento lo que está apoyando temporalmente el precio? Es necesaria una mayor participación de compra spot para establecer una estructura alcista más duradera. El posicionamiento en derivados es cada vez más importante. * Interés abierto agregado: aproximadamente 57,62 millones de dólares. * Aumento del OI en 24 horas: aproximadamente 9,22 %. * Tasa de financiación (funding rate): aproximadamente +0,0507 % cada 8 horas. * Cuentas globales de Binance: aproximadamente 56,7 % en largo. * Posiciones de los mejores traders de Binance: aproximadamente 68,8 % en largo. Una financiación positiva significa que las posiciones largas están pagando a los cortos para mantener la exposición. La elevada tasa de financiación, combinada con el aumento del interés abierto, sugiere un incremento del apalancamiento y un posicionamiento alcista. Esto genera vulnerabilidad si se rompe el soporte. Un movimiento por debajo de los 0,1030 $ podría obligar a los largos apalancados a reducir la exposición, acelerando potencialmente la presión vendedora. CoinGlass +1 | Métrica | Nivel | | --------------------- | --------------- | | Precio actual | 0,1102 $ | | Capitalización de mercado | 173,94 M$ | | Resistencia inmediata | 0,1140 $ | | Resistencia principal | 0,1210 $–0,1295 $ | | Primer soporte | 0,1030 $–0,1050 $ | | Soporte crítico | 0,1000 $ | | Mínimo reciente | 0,1032 $ | | Interés abierto | 57,62 M$ | | Cambio OI 24h | +9,22 % | | Tasa de financiación | +0,0507 % | | Cuentas en largo | 56,7 % | CoinGlass +2 Confirmación alcista: Una recuperación sostenida de los 0,1140 $, respaldada por un mayor volumen spot y una financiación controlada, mejoraría la estructura y abriría la posibilidad de probar los 0,1210 $ y, eventualmente, los 0,1295 $. Confirmación bajista: Una ruptura decisiva por debajo de los 0,1030 $ expondría el nivel de 0,1000 $, seguido de 0,0900 $ si la presión vendedora se acelera. CAP muestra una estabilidad temporal y su rendimiento reciente de siete días sigue siendo positivo. Sin embargo, el movimiento actual compite con lecturas negativas de flujo spot, un aumento del interés abierto, una financiación positiva elevada y un posicionamiento de los mejores traders fuertemente inclinado hacia posiciones largas. La señal decisiva es si los compradores reales de spot regresan mientras el apalancamiento permanece controlado, o si otra ruptura del soporte desencadena nuevas liquidaciones de largos. Hasta que esa distinción quede clara, este rebote merece precaución en lugar de ser tratado como una recuperación confirmada.
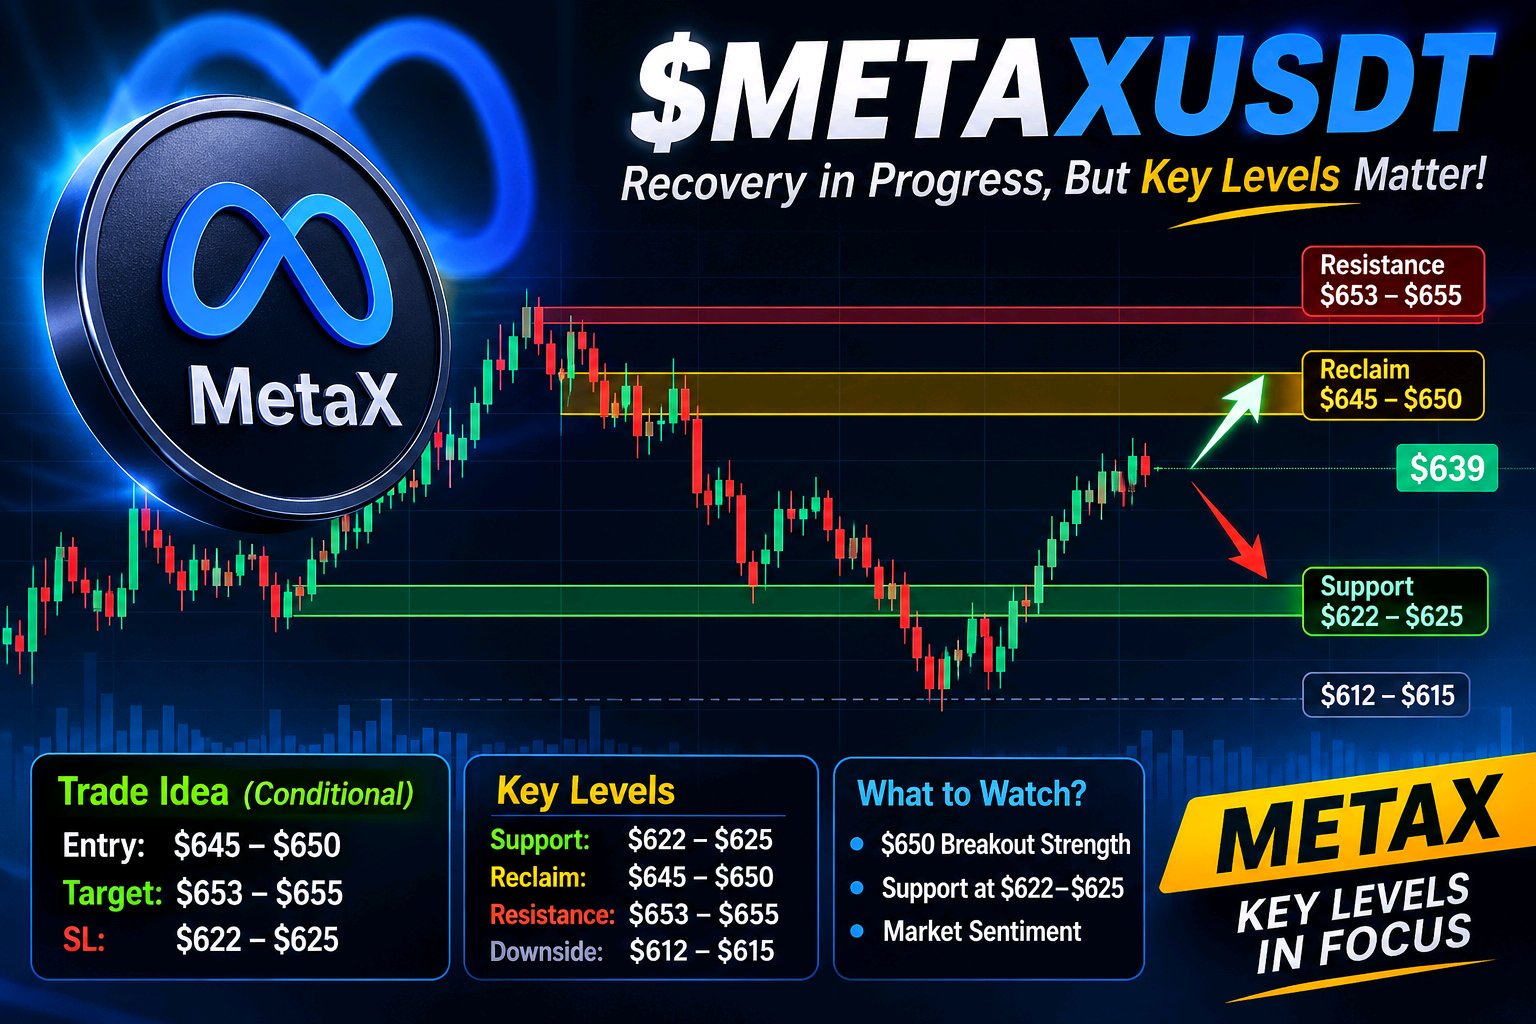
#ByXIMPACT $METAXUSDT is recovering, but the bigger structure still needs confirmation. Trading near $639, METAX is up roughly 2% over 24 hours after rebounding from the $622–$625 area. The latest completed daily session traded between $624.81 and $644.62. Buyers have returned, but they have not cleared the main resistance yet. Bybit +1 The short-term battle is around $644–$650. Recent sessions show a recovery from the November 11–12 decline, but the move is still inside a broader range. TradingView's technical summary currently rates the daily picture Neutral while the weekly outlook remains Sell. That makes it too early to call this a confirmed trend reversal. TradeAlmanac +1 Key levels: * Support / Defense: $622–$625 — recent lows where buyers stepped in. * Reclaim: $645–$650 — clearing this zone would strengthen the recovery. * Resistance: $653–$655 — previous rejection area. * Downside: $612–$615, followed by $598 — relevant if support breaks. I would not force an entry around $639. A sustained reclaim of $650 with stronger spot participation would offer a better confirmation. Bybit's METAXUSDT listing is a spot pair, so I am not using unverified futures OI, funding or liquidation figures to manufacture a derivatives thesis. TradingView +1 The fundamental picture adds another layer. Meta reported 26% year-over-year Q3 revenue growth, but its 2026 capital expenditure outlook stands at $135–145 billion. The opportunity is AI-driven growth; the risk is whether future monetization justifies that investment burden. Meta Reports Third Quarter 2026 Results +1 One detail worth watching: xStocks can trade on secondary markets 24/7, while issuer issuance and redemption operate 24/5. Weekend price movements can therefore be influenced more by token-market liquidity than fresh underlying equity trading. xStocks Docs +1 If $622–$625 holds and $650 is reclaimed, $653–$655 becomes the next test. Lose support, and $612–$615 returns to focus. Would you trust a $650 breakout during the weekend, or wait for confirmation when the underlying equity market reopens?
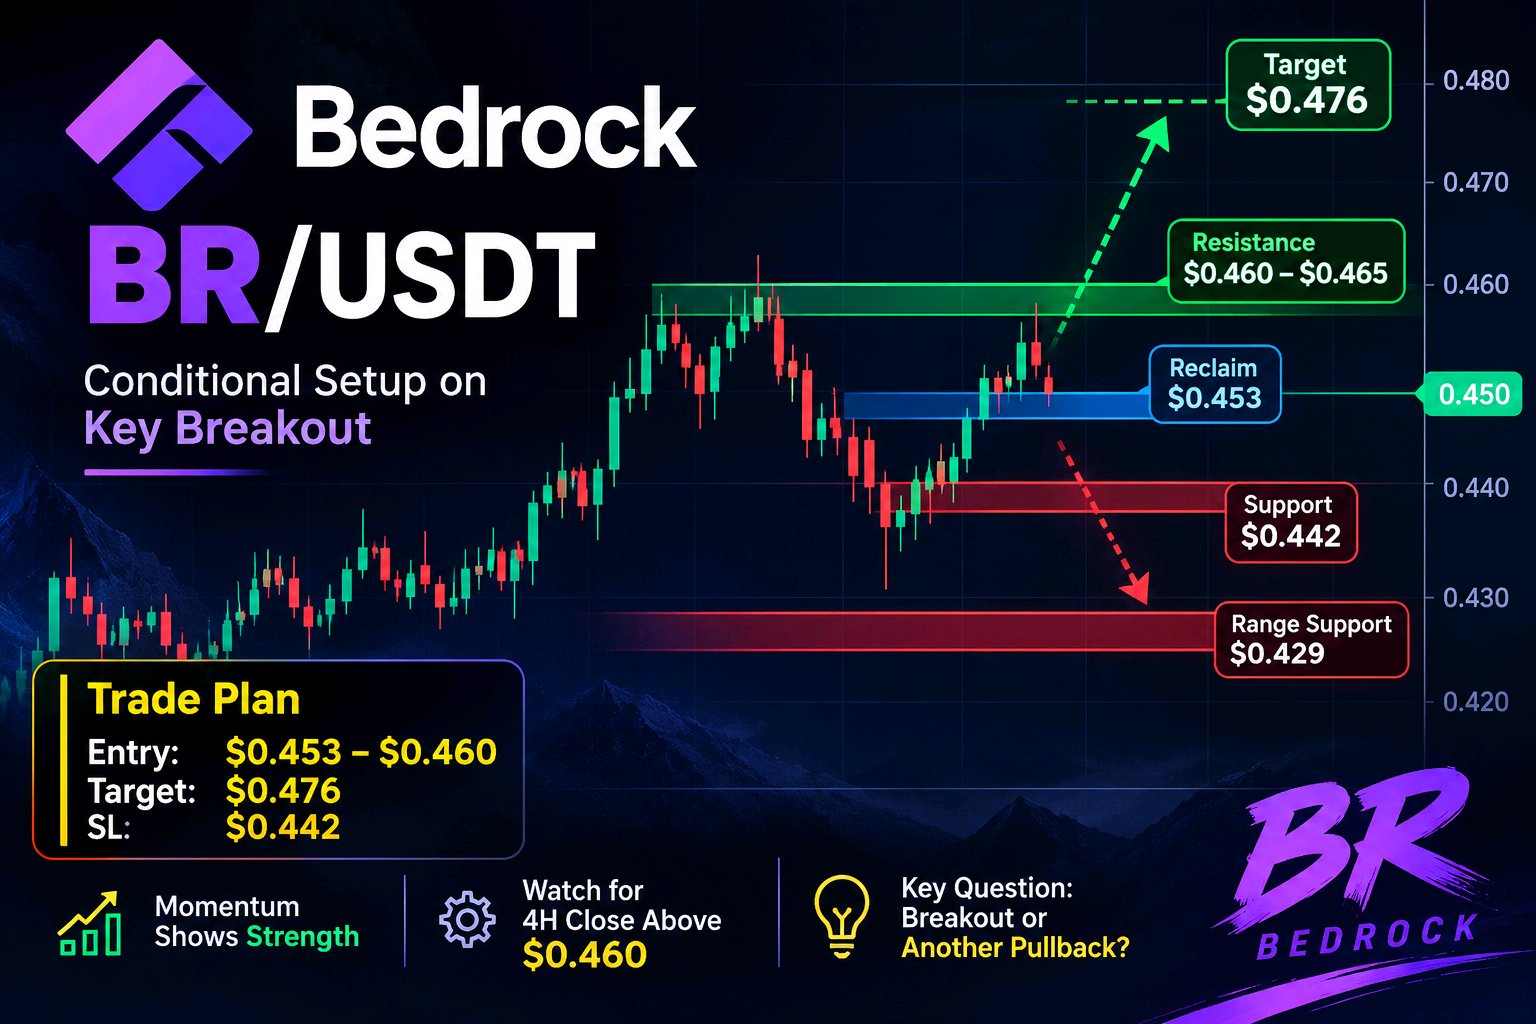
ByXIMPACT $BRUSDT está mostrando resiliencia mientras BTC y ETH siguen bajo presión vendedora, pero no estoy listo para confirmar que esto sea una ruptura definitiva. La verdadera prueba es si los compradores pueden convertir la resistencia cercana en soporte. BR cotiza alrededor de $0,45, con una subida aproximada del 1,6% en 24 horas. El impulso a corto plazo ha mejorado, con lecturas positivas en 1H y 4H, pero el precio se acerca a una zona de resistencia donde la continuación necesita confirmación. Los niveles que estoy siguiendo: - Soporte: $0,442 — el pivote diario y primera línea de defensa. - Soporte de rango: $0,429 — una ruptura aquí debilitaría la recuperación. - Recuperación: $0,453 — necesita mantenerse como soporte. - Resistencia: $0,460–$0,465 — la zona que los toros deben superar. - Objetivo alcista: $0,476 si la ruptura se mantiene. Tesis de trading: No perseguiría el precio actual. Una posición larga condicional se vuelve interesante después de un cierre en 4H por encima de $0,460 y un retest exitoso. Entrada: $0,453–$0,460 tras confirmación Objetivo: $0,476 Invalidación/SL: $0,442 Los derivados añaden otra capa. El interés abierto ronda los $22,24M, un 4,97% más, mientras que las posiciones largas representaron el 84% de aproximadamente $12,38K en liquidaciones de 24 horas. El apalancamiento está aumentando, pero las posiciones largas siguen siendo atrapadas. Un detalle que a menudo se pasa por alto son los fundamentales de Bedrock: el TVL del protocolo ronda los $275,6M, un 26,8% menos en 30 días. Esa divergencia es importante. Un precio del token al alza sin una mejora en la actividad del ecosistema merece un escrutinio adicional. La debilidad de BTC y ETH también hace que una ruptura independiente sea más difícil de sostener. Mi enfoque: si BR mantiene los $0,453 y supera los $0,460–$0,465, los $0,476 cobran relevancia. Fallar en los $0,442 pone de nuevo en el punto de mira los $0,429 y potencialmente los $0,419. ¿Demostrarán los compradores este movimiento con una demanda al contado más fuerte, o es la actividad de derivados la que está haciendo la mayor parte del trabajo?
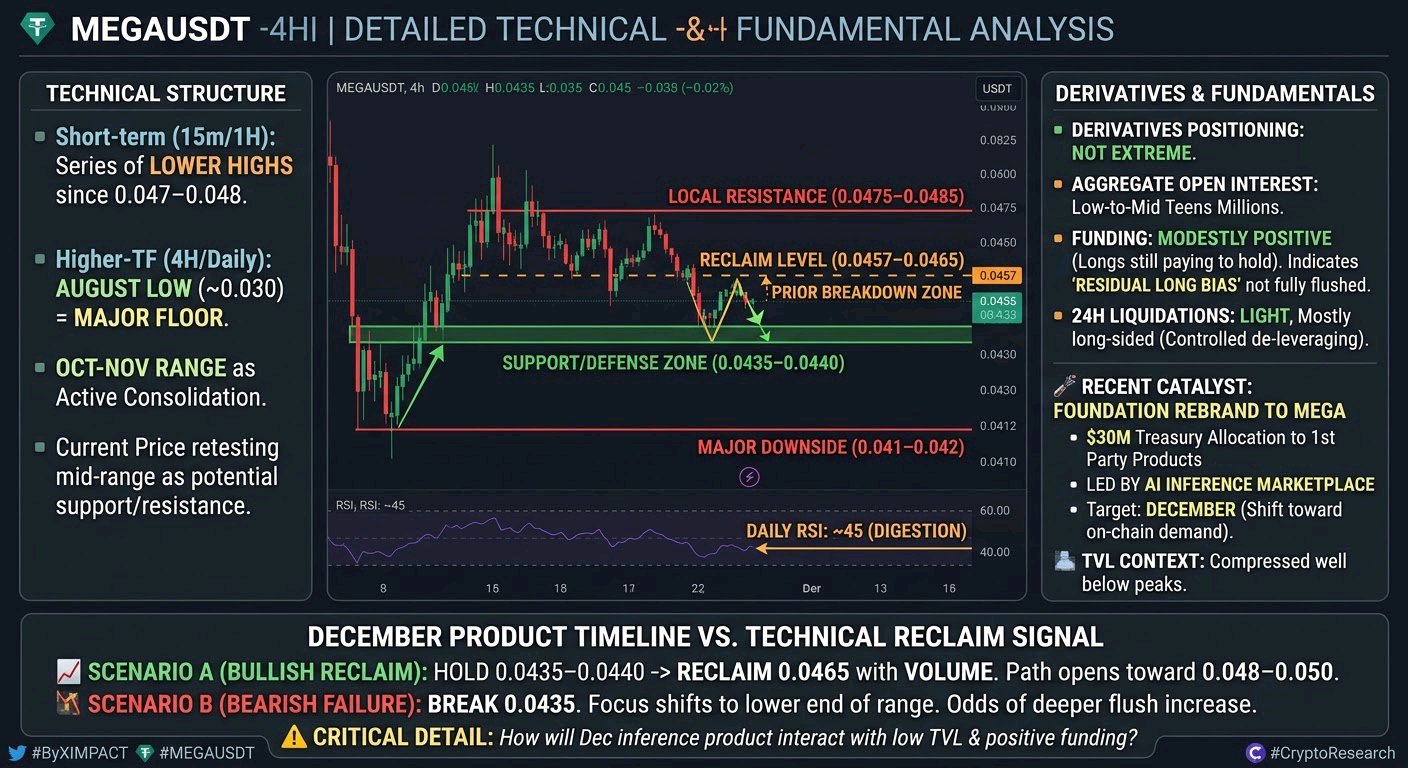
#ByXIMPACT $MEGAUSDT sits near 0.045 after a multi-day pullback from the early-November region above 0.05, even as the broader market sits in extreme fear with BTC holding the low 67k area and ETH near 1900. Price is coiling just above the recent 24h lows while funding remains modestly positive across major venues, with longs still paying to stay in. The short-term structure on 15m/1H has been a series of lower highs since the rejection near 0.047–0.048, but the 4H/Daily still shows the August low near 0.030 as the major higher-timeframe floor and the October–November range as the active consolidation zone. Current price is retesting the underside of the mid-range that previously acted as support on the way up. RSI on the daily has cooled into the mid-40s, consistent with digestion rather than panic selling. Derivatives positioning is not extreme. Aggregate open interest sits in the low-to-mid teens of millions of dollars, with Bybit’s share relatively modest. 24h liquidations have been light and mostly long-sided on the dips, which suggests the move lower has been more controlled de-leveraging than a cascade. Positive funding indicates residual long bias that has not yet been fully flushed. The recent catalyst is the foundation’s rebrand to MEGA and the explicit $30 million treasury allocation toward first-party products, led by an AI inference marketplace targeted for December. That is a clear shift from pure chain infrastructure toward on-chain demand generation. Whether the market prices in any incremental activity before the launch remains the open question, especially with TVL still compressed well below earlier peaks. Key levels I am watching: Support / Defense: 0.0435–0.0440 (recent swing lows and the floor of the current range) Reclaim: 0.0457–0.0465 (prior breakdown zone that needs to be recovered for structure to improve) Resistance: 0.0475–0.0485 (recent local highs) Major downside: 0.041–0.042 (October low region) If price holds the 0.0435–0.0440 zone and reclaims 0.0465 with rising volume, the path toward 0.048–0.050 reopens as the next logical area. Failure of 0.0435 would shift focus to the lower end of the broader range and increase the odds of a deeper flush while positive funding still exists. One detail that still feels under-discussed is how the December inference product could interact with the current low TVL and residual long positioning: any genuine early traction would arrive against a relatively clean derivatives backdrop, while a quiet launch would leave the existing longs exposed into a thin market. Does the December product timeline matter more for positioning here, or is the immediate technical reclaim of 0.0465 the cleaner signal given the broader market weakness?
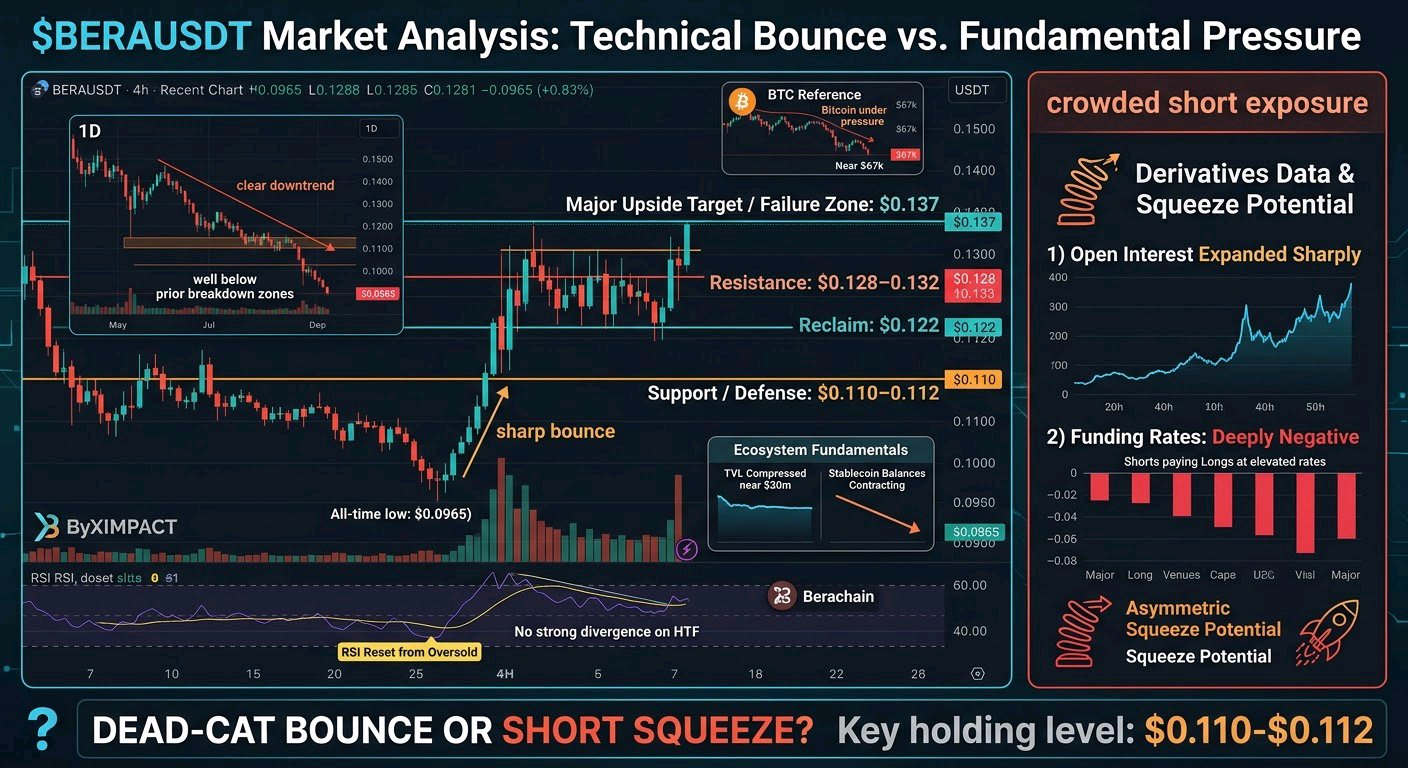
#ByXIMPACT $BERAUSDT just printed a sharp bounce off its all-time low while Bitcoin sits under pressure near $67k. Price reclaimed the $0.11 area after tagging roughly $0.0965 two days ago, ran as high as the mid-$0.13s, and is now consolidating with volume still elevated. The short-term structure on the 1H/4H flipped constructive after the flush. Buyers defended the extreme low and forced a higher low, but the daily remains in a clear downtrend with price still well below prior breakdown zones. RSI on the 4H has reset from oversold without yet showing strong divergence on higher timeframes. The current level matters because it sits right at the edge of the recent rebound base—holding here keeps the short-term recovery intact; losing it reopens the path back toward the ATL. Derivatives data shows open interest expanded sharply alongside the move while funding rates sit deeply negative across major venues. Shorts are paying longs at elevated rates, which creates asymmetric squeeze potential if price can hold and push higher. That positioning is the overlooked detail most pure chart readers miss: the bounce is not just technical—it is occurring into crowded short exposure. No fresh project catalyst explains the move. Ecosystem TVL remains compressed near $30m with stablecoin balances still contracting, so the rebound looks more like a liquidity-driven reaction to extreme oversold conditions than a fundamental shift. Key levels I am watching: Support / Defense: $0.110–0.112 (recent rebound base) Reclaim: $0.122 (first meaningful resistance from the bounce) Resistance: $0.128–0.132 Major upside target / failure zone: $0.137 (24h high) or back below $0.100 if the base fails If $BERA holds the $0.110–0.112 zone and reclaims $0.122 with follow-through volume, the short-term structure improves and $0.128–0.137 becomes the next area of interest. If $0.110 fails cleanly, the bounce thesis weakens and a retest of the ATL region becomes the higher-probability path. Does the extreme negative funding make a short squeeze more likely from here, or is this still just a dead-cat bounce inside a larger downtrend?
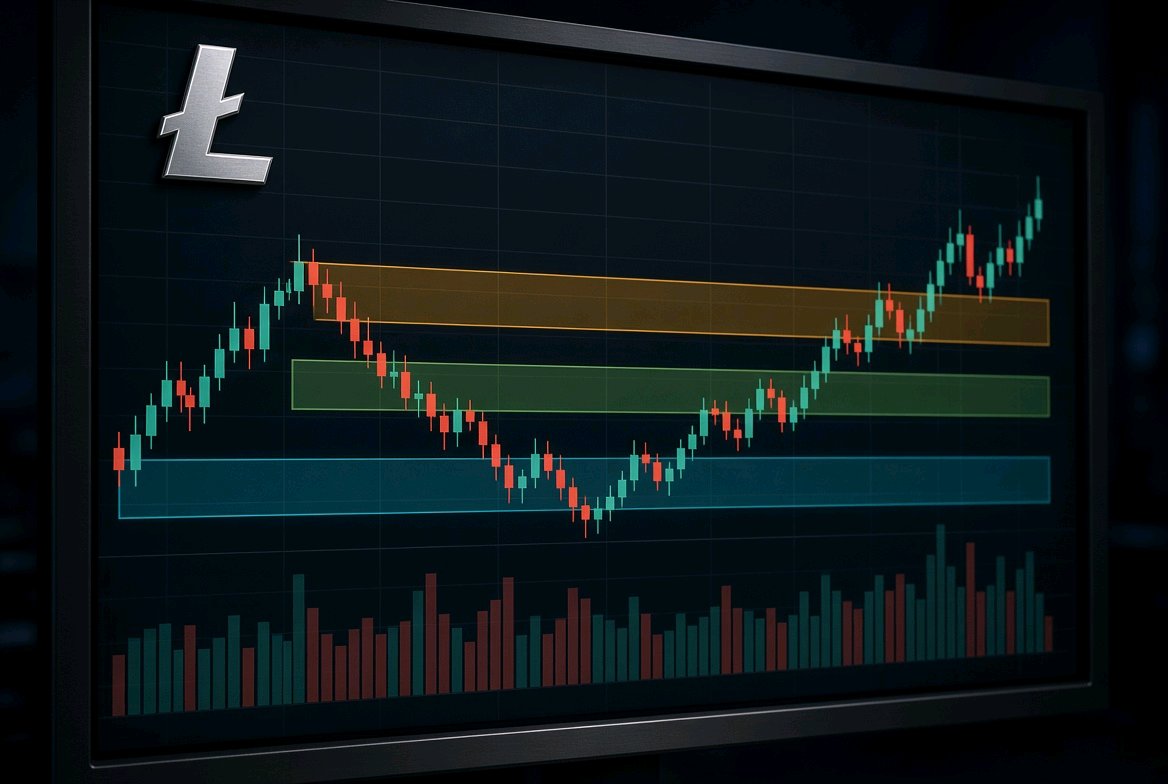
#ByXIMPACT $LTCUSDT sits near $48.8–49.2 after probing the mid-$47s, with daily RSI still hovering in the low 30s. The contradiction is clear: a multi-week decline has flushed leveraged longs hard, yet the higher-timeframe structure remains firmly lower and Bitcoin’s own weakness is keeping any bounce contained. No clean high-conviction directional trade is justified right now. The evidence points to a conditional long only on a decisive reclaim of the recent breakdown zone, not a blind buy into the current range. Recent price action shows a steady grind lower from the low-$50s, with the sharpest leg arriving when price lost the $50–51 area that had previously acted as short-term support. On the 4H the structure is still series of lower highs; on the daily the price remains well below the 20- and 50-period averages. The $47.7–48.1 zone is the immediate defense that has so far attracted buyers, but it has not yet produced a higher low that would change the character of the move. Derivatives data adds context without forcing a thesis. Open interest sits near $350M and has been relatively stable through the latest decline, while the bulk of recent liquidations have been long-side. Funding remains modestly negative. That combination suggests the forced selling has already occurred, yet fresh aggressive short positioning has not fully taken over. A further push lower would therefore need fresh spot or futures selling rather than another cascade of longs. The fundamental backdrop is not empty. LitVM’s LiteForge testnet migration to new infrastructure and the Foundation’s public note that mainnet is approaching keep the smart-contract narrative alive. That development could eventually improve demand for LTC as gas and settlement, but it is not yet translating into price support while the broader market is risk-off. Key levels that matter: Support / Defense: $47.7–48.1 — the zone that absorbed the latest flush and the lower Bollinger band region on the daily. Reclaim: $49.6–50.0 — recovery of the breakdown area that would start neutralizing the short-term bearish structure. Resistance: $50.4–51.0 — prior swing highs and the first meaningful supply. Major downside: $46.0–46.5 — next measured support if the current defense fails. Second-order observation: the market has already liquidated a large portion of the long leverage that was present at higher levels. If price can hold the $47.7–48.1 band while Bitcoin stabilizes, the absence of remaining long fuel reduces the probability of a cascade-style continuation lower and raises the odds of a range or short-covering bounce. Conversely, a clean break of that band with rising OI would signal that new shorts are in control. If $LTCUSDT holds $47.7–48.1 and reclaims $49.6–50.0 on expanding volume, the structure improves and $51.5–52 becomes the next area worth watching. If the defense fails and price closes below $47.7 with follow-through, the path opens toward the mid-$46s and the thesis shifts to waiting for a deeper base. Is the $49.6–50.0 reclaim the more important near-term signal, or does the still-bearish daily structure make another test of the $47.7 zone the higher-probability path while Bitcoin remains soft?
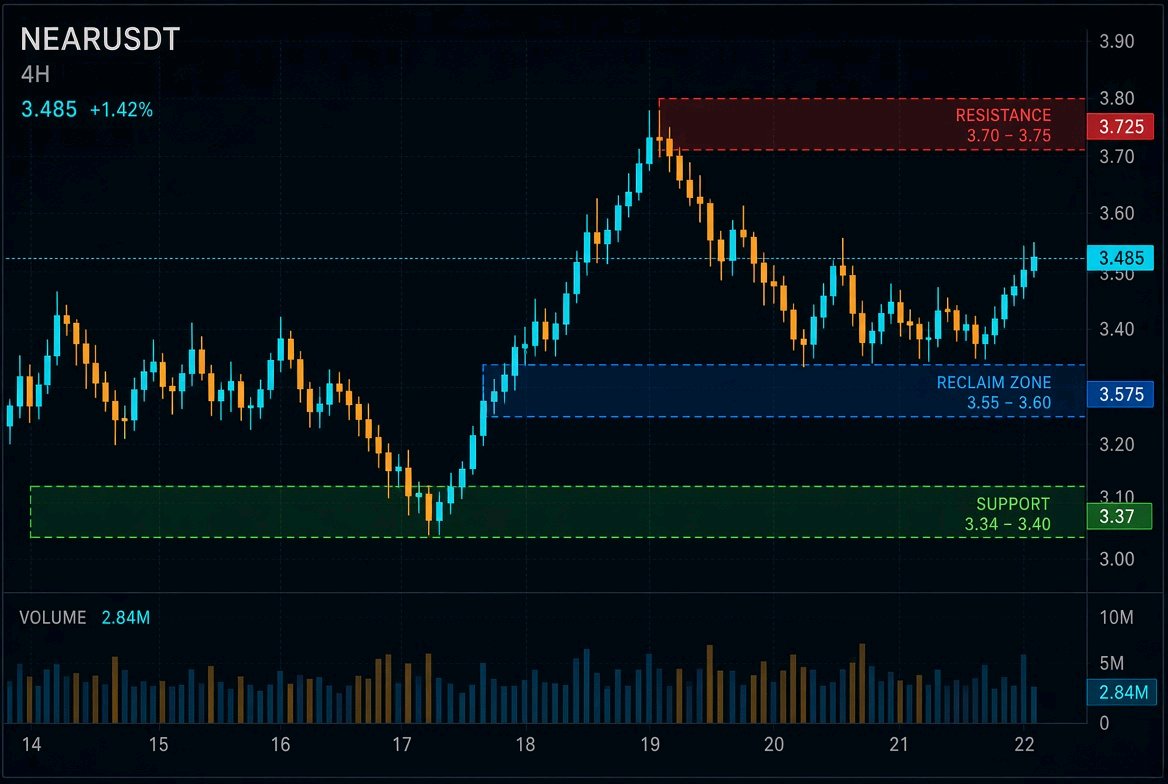
#ByXIMPACT $NEARUSDT Price is holding near $3.43 after slicing through the $3.50–3.60 zone that previously acted as support, while daily RSI sits in the mid-30s. The short-term bounce off the $3.27–3.34 lows looks more like short-covering than a structural reclaim. On the 4H the sequence of lower highs remains intact; each rally attempt has been sold into. The daily chart still shows a clear downtrend from the October peak near $6, with price now testing the lower end of the multi-week range. The $3.40 area is the immediate decision point—holding it keeps the recent base alive, losing it opens the path back toward the $3.20–3.25 cluster that marked the November 12 flush. Funding has stayed positive around +0.01% while open interest across major venues sits near $600M+. Longs continue to pay, and the last 24 hours of liquidations have been heavily skewed toward the long side. That combination usually means residual leverage is still leaning long even as price grinds lower. A further break of support would force those positions to exit into already thin demand. No single fundamental catalyst is driving the current tape; the broader market remains in risk-off mode with BTC dominance elevated and alt liquidity selective. NEAR’s own activity metrics have not offset the technical and positioning pressure. Key levels Support / defense: $3.34–3.40 (recent swing lows and the zone that absorbed the last flush) Reclaim: $3.55–3.60 (prior breakdown level; a 4H close back above would improve the short-term structure) Resistance: $3.70–3.75 (next supply shelf) Major downside: $3.20–3.25 (next liquidity pocket if $3.34 fails) If $3.40 holds and price reclaims $3.55 on rising volume, the immediate short bias softens and $3.70 becomes the next area to watch. If $3.34 breaks with acceleration in long liquidations, the thesis flips and $3.20–3.25 is the logical next magnet. Is the persistent positive funding more of a warning that another long flush is still possible, or does the $3.34 hold finally force shorts to cover?
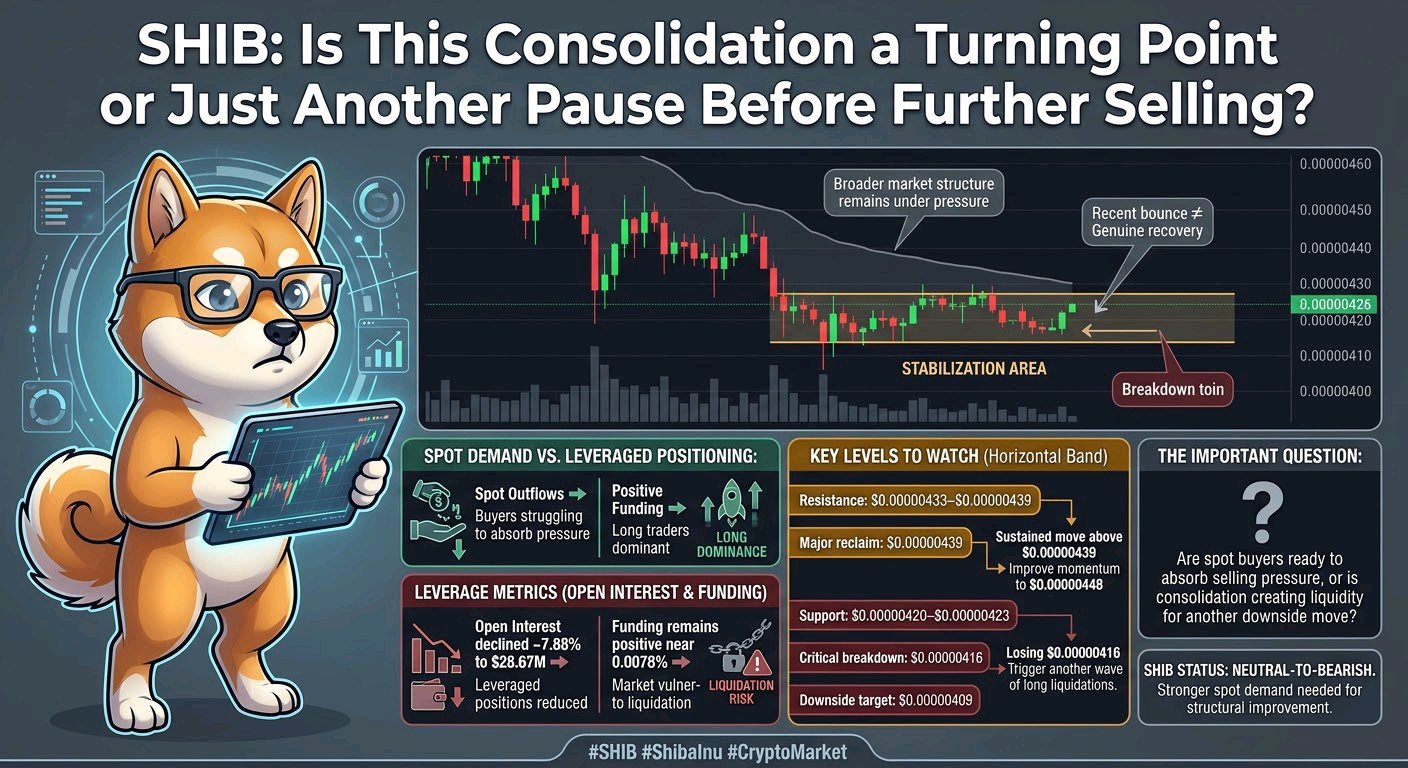
ByXIMPACT $SHIBUSDT : ¿Es esta consolidación un punto de inflexión o simplemente otra pausa antes de que continúen las ventas? SHIB muestra señales de estabilización a corto plazo cerca de $0.00000426, pero la estructura general del mercado sigue bajo presión. El rebote reciente no es suficiente para confirmar una recuperación real. La mayor preocupación es el desequilibrio entre la demanda al contado y las posiciones apalancadas. Las salidas de capital al contado sugieren que los compradores siguen teniendo dificultades para absorber la presión vendedora, mientras que la financiación positiva indica que los traders en largo siguen dominando. El interés abierto ha disminuido aproximadamente un 7,88%, situándose en 28,67 millones de dólares, lo que sugiere que se están reduciendo las posiciones apalancadas. Mientras tanto, la financiación se mantiene positiva cerca del 0,0078%, dejando al mercado vulnerable a otro evento de liquidación. Niveles clave a vigilar: - Resistencia: $0.00000433–$0.00000439 - Recuperación importante: $0.00000439 - Soporte: $0.00000420–$0.00000423 - Ruptura crítica: $0.00000416 - Objetivo bajista: $0.00000409 Un movimiento sostenido por encima de $0.00000439 podría mejorar el impulso a corto plazo y abrir el camino hacia los $0.00000448. Sin embargo, perder el nivel de $0.00000416 podría desencadenar otra oleada de liquidaciones de posiciones largas. La pregunta importante es si los compradores al contado están finalmente listos para absorber la presión vendedora, o si esta consolidación simplemente está creando liquidez para otro movimiento a la baja. Por ahora, SHIB permanece neutral a bajista hasta que una mayor demanda al contado confirme una mejora estructural.
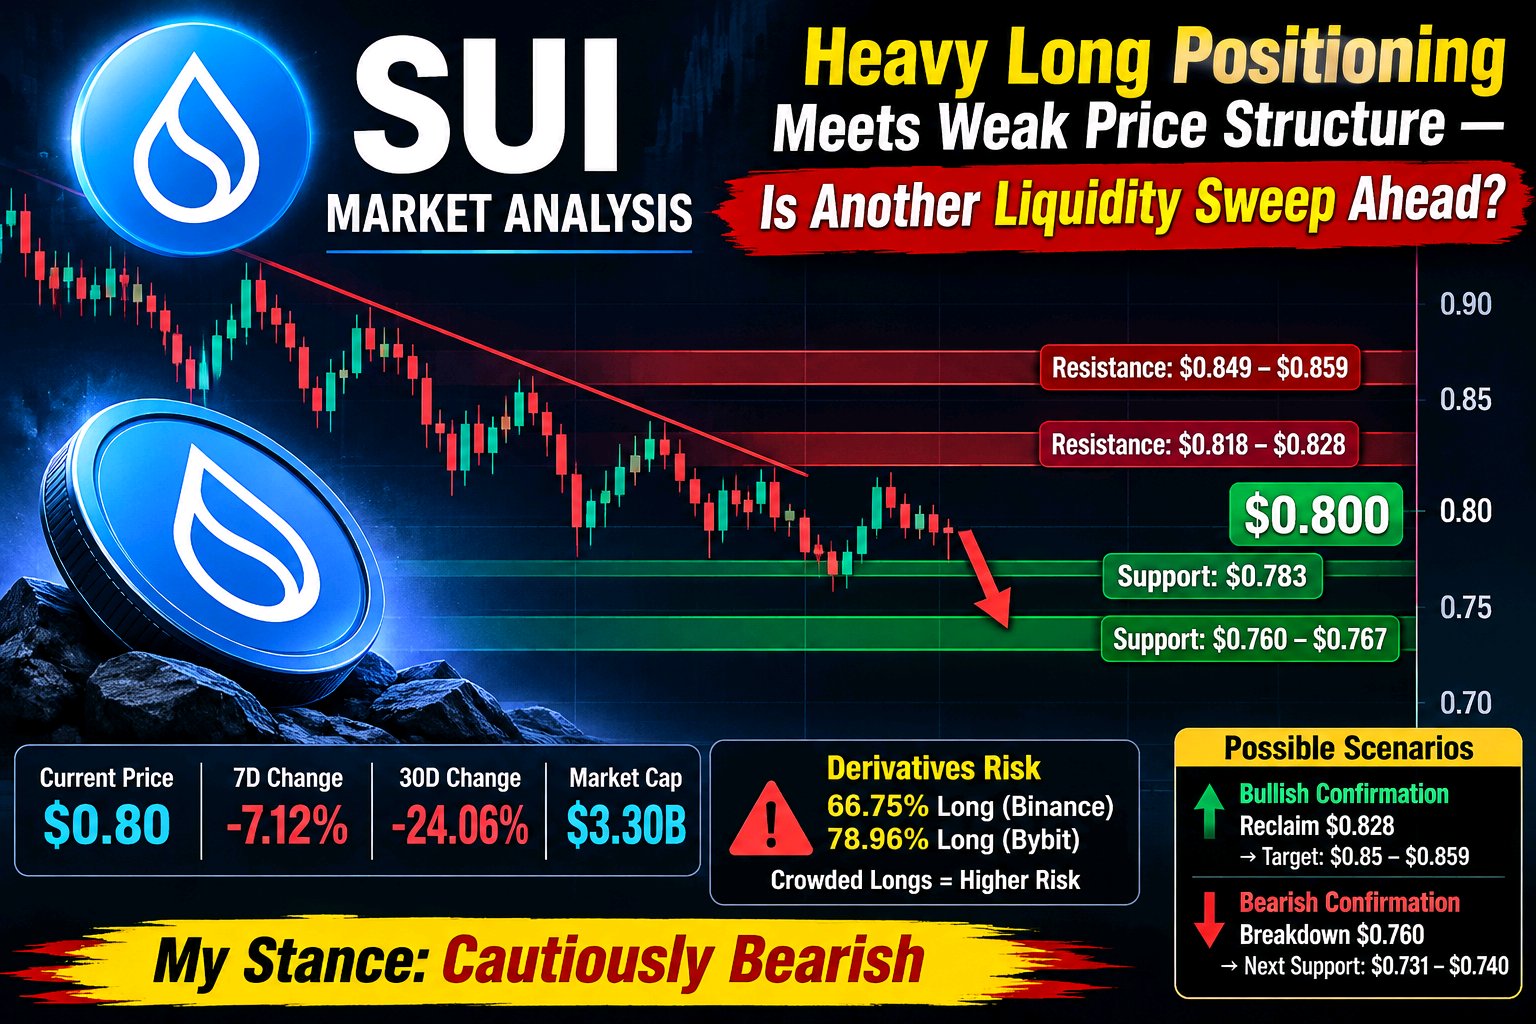
ByXIMPACT $SUIUSDT cotiza alrededor de 0,80 $, pero la estabilidad actual del precio aún no confirma una recuperación genuina. La mayor preocupación es el desequilibrio en el posicionamiento de derivados. Alrededor del 66,75 % de las cuentas de Binance y el 78,96 % de las cuentas de Bybit están posicionadas en largo. Esto crea una vulnerabilidad bajista potencial si los compradores no logran defender los niveles de soporte clave. Niveles clave a vigilar: - Precio actual: 0,80 $ - Resistencia: 0,818 $ – 0,828 $ - Resistencia importante: 0,849 $ – 0,859 $ - Soporte: 0,783 $ - Soporte crítico: 0,760 $ – 0,767 $ Escenario alcista: Una recuperación sólida de los 0,828 $ podría abrir la puerta hacia los 0,85 $ – 0,859 $. Escenario bajista: Perder los 0,760 $ podría desencadenar otro barrido de liquidez hacia los 0,731 $ – 0,740 $. Mi perspectiva sigue siendo cautelosamente bajista hasta que una demanda spot más fuerte confirme una reversión. La verdadera pregunta es sencilla: ¿están los compradores spot listos para absorber la presión de venta, o se están preparando las posiciones largas abarrotadas para otro evento de liquidación?
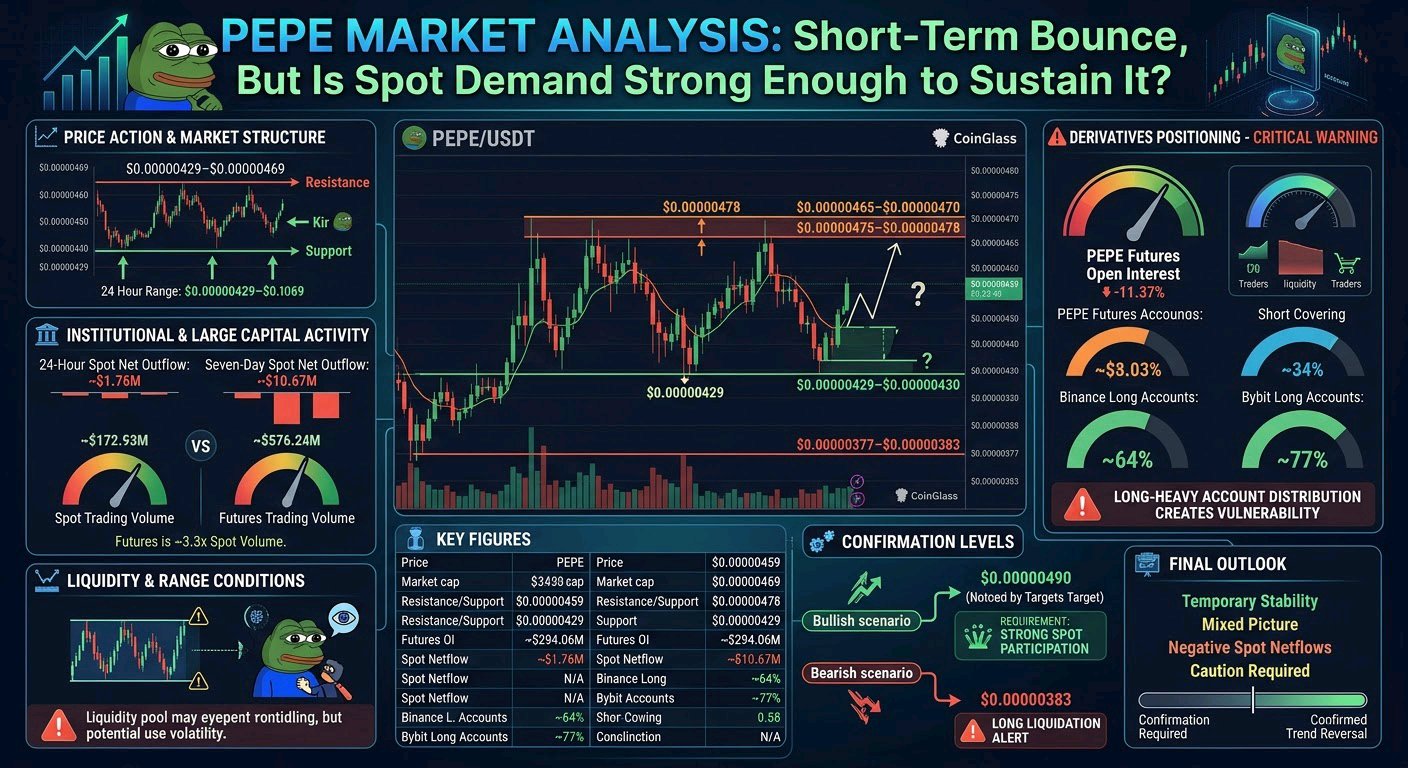
#ByXIMPACT $PEPEUSDT : A BOUNCE IS HAPPENING, BUT THE REAL RECOVERY IS STILL UNCONFIRMED! $PEPE is showing short-term strength after bouncing from $0.00000429 toward $0.00000459. However, the bigger picture still demands caution. Here’s what traders should watch: 📊 Key Resistance: - $0.00000465–$0.00000470 - $0.00000475–$0.00000478 🟢 Bullish Scenario: A strong 4H breakout above $0.00000478 could open the door toward $0.00000490–$0.00000495. 🔴 Bearish Scenario: Losing $0.00000429 could expose $0.00000383–$0.00000377, especially if leveraged longs start getting liquidated. ⚠️ What Concerns Me? - Spot outflows remain negative. - Futures open interest is down 11.37%. - Long positioning remains heavily concentrated. - Futures volume is significantly higher than spot volume. This suggests the current bounce may be driven partly by short covering rather than strong fresh spot demand. My Take: PEPE has momentum, but momentum alone doesn't confirm a trend reversal. I'm watching $0.00000478 closely. Until buyers reclaim that level with convincing spot volume, I remain cautious. Don't confuse a temporary bounce with a confirmed recovery.
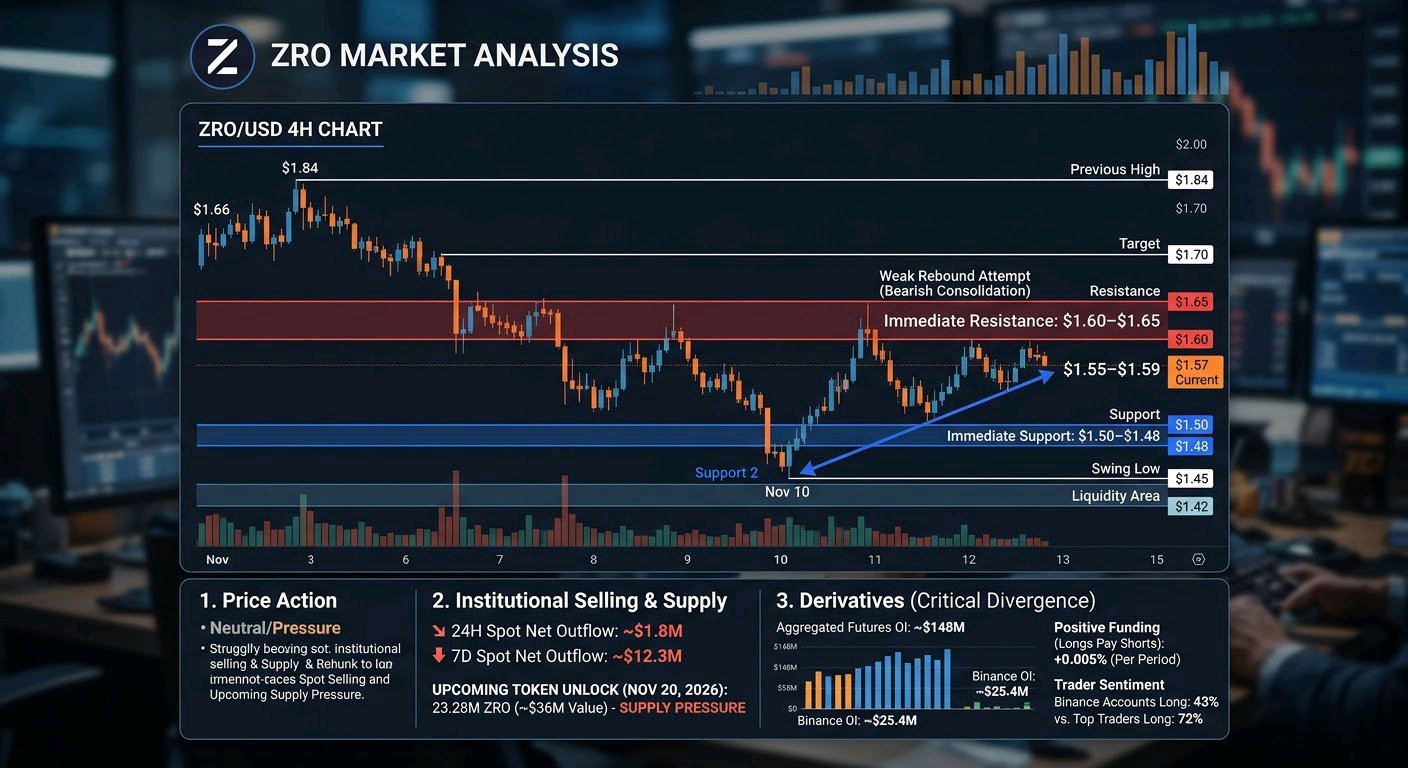
ZRO is trading around $1.55–$1.59, following a decline from the $1.66 area to a recent low near $1.45 on November 10. The subsequent rebound is worth watching, but I am not treating this consolidation as a confirmed recovery yet. The bigger concern is persistent spot selling, derivatives-driven activity, and an upcoming token unlock that could introduce additional supply. ZRO has recovered approximately 9% from its recent $1.45 low, but the broader short-term structure remains under pressure. * Current price: $1.55–$1.59 * Approximate market capitalization: $620M–$645M * Immediate resistance: $1.60–$1.65 * First support: $1.50–$1.48 * Recent swing low: $1.45 A sustained move above $1.65 would improve the short-term structure and potentially open the $1.70–$1.84 region. However, repeated rejection around resistance would keep the lower-high structure intact. CoinMarketCap +1 The spot market is showing an important warning signal. CoinGlass data indicates approximately: * $1.6M–$2M in 24-hour spot net outflows. * Approximately $12.3M in seven-day spot net outflows. * Around $85.6M in futures volume against $16.35M in spot volume. This means futures activity is significantly outweighing genuine spot participation. Futures buying alongside spot selling creates an unstable foundation for a recovery. Another concern is the upcoming November 20 token unlock, estimated at approximately 23.28M ZRO, worth around $36M at the quoted valuation. This represents an additional potential supply overhang. CoinGlass +1 ZRO is attempting to stabilize after its decline, but the $1.48–$1.65 region remains important. A narrow trading range following a sharp decline does not automatically indicate accumulation. It can also represent temporary equilibrium before another liquidity expansion. Stronger spot buying is necessary to absorb existing selling pressure. Without that confirmation, a return toward $1.48 and potentially $1.45 remains possible. Current derivatives data presents a mixed picture. * Aggregated futures open interest: approximately $148M. * Binance perpetual open interest: approximately $25.4M. * Funding rate: approximately +0.005% per period on Binance. * Aggregated funding: approximately +0.0068% per 8 hours. * Binance accounts long: approximately 43%. * Top traders' positions: approximately 72% long by size. This distinction matters. The broader account distribution is not overwhelmingly long, but larger trader positions are considerably more long-tilted. Positive funding means longs are paying shorts. If support breaks while larger leveraged positions remain exposed, another round of long liquidations could accelerate downside volatility. Seandra AI +1 | Metric | Level | | ------------------------ | ------------ | | Current price area | $1.55–$1.59 | | Market cap | $620M–$645M | | Immediate resistance | $1.60–$1.65 | | First support | $1.50–$1.48 | | Recent low | $1.45 | | Aggregated futures OI | ~$148M | | Binance OI | ~$25.4M | | Binance funding | +0.005% | | Binance accounts long | 43% | | Top traders long by size | 72% | | Upcoming unlock | Nov 20, 2026 | Bullish confirmation: A sustained reclaim above $1.65 with increasing spot volume would be the first meaningful improvement. That could open a move toward $1.70 and subsequently $1.84. Bearish confirmation: A decisive breakdown below $1.48 would expose the recent $1.45 low. Losing that level could bring the $1.42 liquidity area into focus. ZRO is showing temporary stability, but the underlying evidence does not yet establish a sustainable recovery. Negative spot flows, futures-heavy participation, concentrated larger-trader long exposure, and the upcoming token unlock remain competing pressures. The decisive question is whether genuine spot buyers return and absorb selling while leverage stays controlled, or whether another support breakdown triggers fresh long liquidations. For now, ZRO remains neutral-to-bearish until $1.65 is convincingly reclaimed. #ByXIMPACT $ZROUSDT
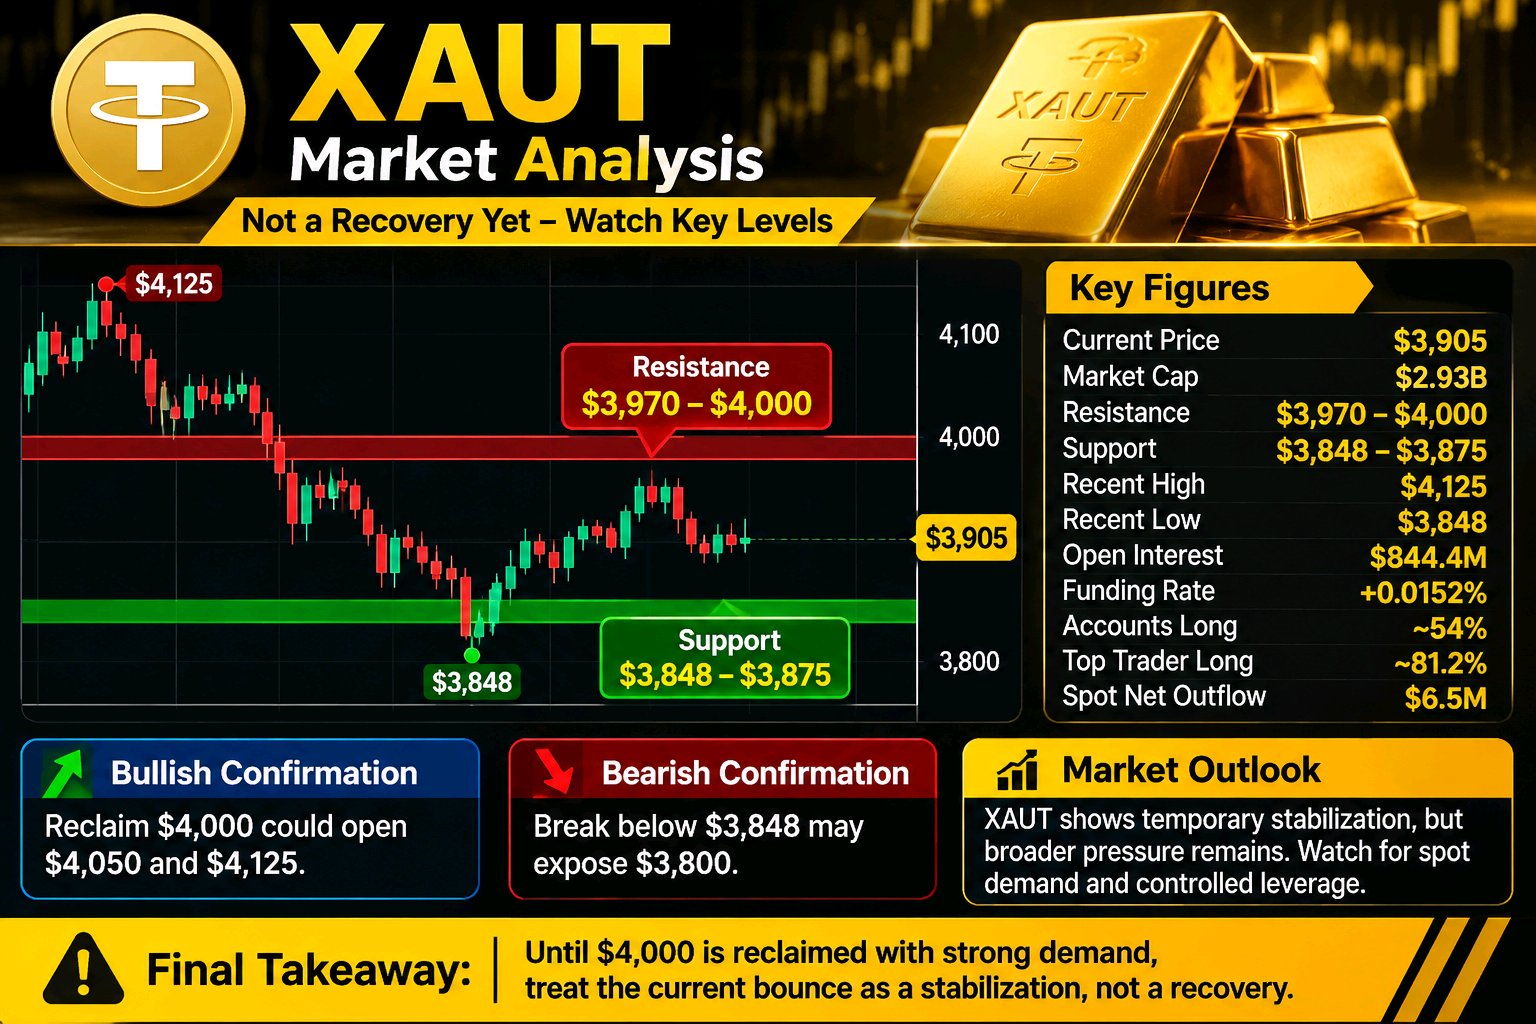
#ByXIMPACT $XAUTUSDT is trading around $3,905, following a decline from the $4,125 area toward a recent low near $3,848. The latest bounce is not yet convincing enough to call a recovery. The bigger concern is continued selling pressure in spot markets while derivatives positioning remains tilted toward leveraged longs, creating the possibility of another downside liquidity sweep. XAUT has declined approximately 3.5% over seven days and around 6.7% from its recent $4,125 high to the $3,848 low. Market capitalization is approximately $2.93 billion. The immediate resistance zone sits at $3,970–$4,000, while initial support remains around $3,848–$3,875. A sustained reclaim of $4,000 would improve the short-term structure and potentially open a move toward $4,050 and $4,125. However, the broader 30-day and 90-day trends remain negative, so one recovery attempt is not enough to establish a trend reversal. XAUT's market structure requires a different institutional-flow perspective because it is backed by physical gold rather than being a conventional ETF. The latest derivatives and flow snapshot shows approximately: * Spot net outflows: $6.5 million. * Futures net outflows: $15.7 million. * Open interest increased approximately 5.74% despite negative price performance. This combination suggests that capital positioning is expanding without convincing spot demand supporting the price. One positive fundamental development is Tether Gold's November 12 announcement of a completed KPMG audit. The audit covered allocated gold backing worth approximately $2.246 billion at December 31, 2025. This improves reserve transparency but does not independently confirm fresh market demand. Tether +2 The $3,848–$4,000 area is becoming an important short-term trading range following the rejection near $4,125. A narrow range after a decline should not automatically be interpreted as accumulation. The market needs stronger spot buying and sustained volume to demonstrate that buyers are absorbing available supply. A breakdown below $3,848 could expose the psychological $3,800 level. Derivatives remain an important source of risk. * Open Interest: Approximately $844.4 million. * OI change: +5.74%. * Funding rate: +0.0152% per 8 hours. * Futures volume: Approximately $560 million. * 24-hour liquidations: Approximately $1.01 million. * Long liquidation share: Approximately 97%. A separate exchange-positioning snapshot shows roughly 54% of accounts holding longs, while top traders hold approximately 81.2% long exposure by position size. Positive funding means long positions are paying shorts. Combined with elevated open interest and substantial long liquidations, this creates vulnerability if support fails. CoinGlass +1 | Metric | Level | | ------------------------- | ------------- | | Current price | $3,905 | | Market cap | $2.93B | | Resistance | $3,970–$4,000 | | Support | $3,848–$3,875 | | Recent high | $4,125 | | Recent low | $3,848 | | Open interest | $844.4M | | Funding | +0.0152% | | Accounts long | ~54% | | Top trader positions long | ~81.2% | | Spot net outflow | $6.5M | Bullish confirmation: A sustained reclaim of $4,000 would improve market structure, potentially opening $4,050 and $4,125. Strong spot volume and declining leverage would make this move more credible. Bearish confirmation: A decisive 4-hour breakdown below $3,848 would expose $3,800. Continued negative spot flows and elevated long exposure could accelerate the move through fresh long liquidations. XAUT is showing temporary stabilization, but the broader structure remains under pressure. Recent reserve-audit progress improves fundamental transparency, yet token-market outflows and increasingly leveraged positioning remain important concerns. The decisive question is whether genuine spot buyers return and absorb selling pressure while derivatives leverage remains controlled, or whether another support breakdown triggers fresh long liquidations. Until $4,000 is reclaimed with convincing spot demand, the current bounce should be treated as a stabilization attempt rather than a confirmed recovery.
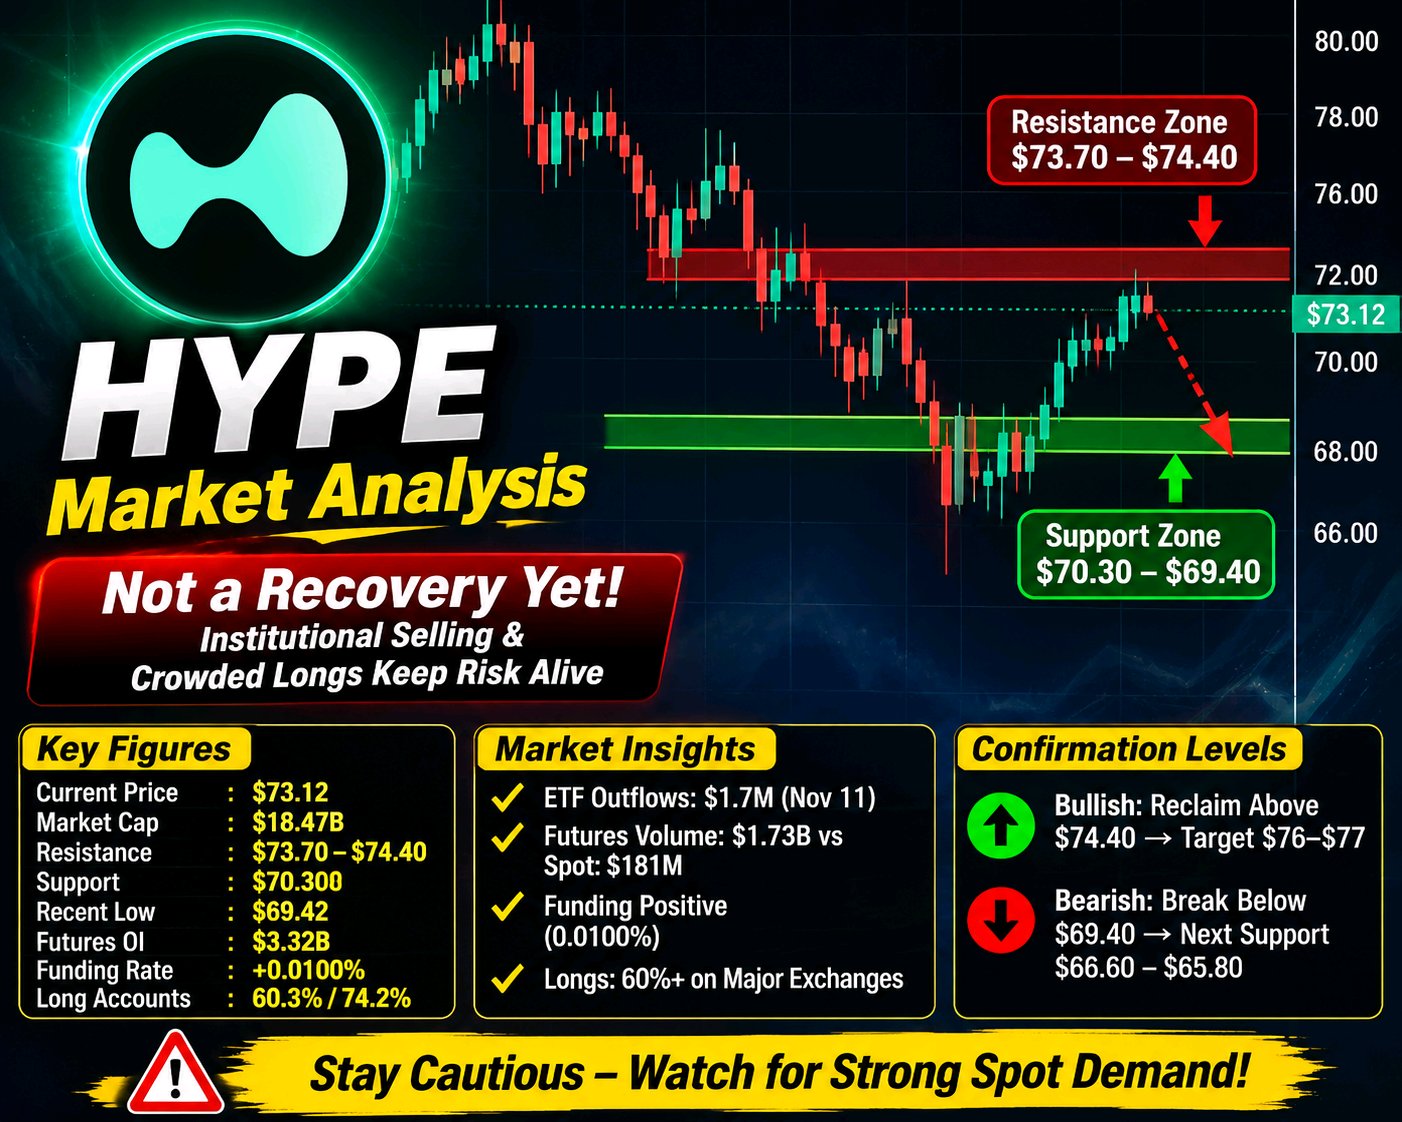
#ByXIMPACT $HYPEUSDT cotiza alrededor de los 73,12 $, intentando estabilizarse tras probar un mínimo reciente cerca de los 69,42 $. El rebote aún no confirma una recuperación. La preocupación general sigue siendo la salida de capital institucional, la débil participación en el mercado al contado (spot) y un posicionamiento en derivados que sigue conllevando un riesgo bajista considerable. HYPE ha recuperado aproximadamente un 5,3 % desde su mínimo reciente, pero sigue acumulando una caída de alrededor del 6,8 % en los últimos siete días y se sitúa aproximadamente un 25 % por debajo de su máximo histórico de septiembre. La capitalización de mercado es de aproximadamente 18.470 millones de dólares. La zona de resistencia inmediata se sitúa entre los 73,70 $ y 74,40 $, mientras que el soporte inicial se concentra alrededor de los 70,30 $ - 69,40 $. Una recuperación sostenida por encima de los 74,40 $ mejoraría la estructura a corto plazo y potencialmente abriría el camino hacia los 76 $ - 77 $. Sin embargo, las perspectivas técnicas en los gráficos de 4 horas y diarios siguen siendo bajistas. La demanda sigue siendo inconsistente. Los ETF de contado (spot) de HYPE registraron aproximadamente 1,7 millones de dólares en salidas netas el 11 de noviembre, aunque esa cifra aún se basaba en informes parciales. En los 30 días de negociación anteriores, los flujos de los ETF reportados mostraron aproximadamente 60,6 millones de dólares en salidas netas. Las billeteras grandes rastreadas también muestran una postura cautelosa: un conjunto de datos de siete días registró 37,2 millones de dólares en distribución de HYPE frente a solo 1,6 millones de dólares en acumulación, junto con 12,1 millones de dólares en posiciones cortas adicionales. Estas cifras no establecen que todos los grandes inversores estén vendiendo, pero tampoco proporcionan pruebas sólidas de una acumulación sostenida. HYPE está intentando mantenerse por encima de la región de 70 $ - 73 $ tras su reciente descenso. Sin embargo, el volumen de futuros de 24 horas es de aproximadamente 1.730 millones de dólares, en comparación con los aproximadamente 181 millones de dólares en volumen al contado. Por lo tanto, la actividad en futuros es sustancialmente mayor que la participación directa en el mercado al contado. Un rango de negociación estrecho tras una fuerte caída no debe interpretarse automáticamente como acumulación. Se necesita una demanda al contado más fuerte para absorber la oferta disponible y establecer un suelo más duradero. El interés abierto total en futuros rastreados es de aproximadamente 3.320 millones de dólares, un aumento de alrededor del 2,74 % en 24 horas. La financiación (funding) sigue siendo positiva cerca del 0,0100 %, lo que equivale a aproximadamente un 10,9 % anualizado. El posicionamiento de las cuentas es particularmente importante: * Binance: aproximadamente 60,3 % en largo (long). * Bybit: aproximadamente 74,2 % en largo (long). * Liquidaciones en 24 horas: aproximadamente 7,04 millones de dólares. * Liquidaciones de posiciones largas: aproximadamente 6,87 millones de dólares. Las billeteras de alto valor de Hyperliquid rastreadas muestran una imagen diferente, con aproximadamente 649 millones de dólares en posiciones cortas (shorts) frente a 522 millones de dólares en posiciones largas (longs). Esta divergencia sugiere que las cuentas de intercambio ordinarias siguen inclinadas hacia posiciones largas, mientras que las billeteras grandes rastreadas son más defensivas. Si el soporte se rompe, la acumulación de posiciones largas podría provocar otra caída impulsada por liquidaciones. * Precio actual: 73,12 $ * Capitalización de mercado: 18.470 millones de dólares * Resistencia inmediata: 73,70 $ - 74,40 $ * Primer soporte: 70,30 $ * Mínimo reciente: 69,42 $ * Próximo soporte bajista: 66,60 $ - 65,80 $ * Interés abierto en futuros: 3.320 millones de dólares * Tasa de financiación: +0,0100 % * Cuentas en largo: 60,3 % en Binance / 74,2 % en Bybit * Salida neta de ETF: 1,7 millones de dólares el 11 de noviembre (informe parcial) Confirmación alcista: Una recuperación sostenida por encima de los 74,40 $ debilitaría la presión bajista inmediata y abriría la posibilidad de un movimiento hacia los 76 $ - 77 $. Una confirmación más sólida requiere una mayor participación al contado y un interés abierto controlado. Confirmación bajista: Una ruptura decisiva por debajo de los 69,40 $ expondría la región de los 66,60 $ - 65,80 $, donde liquidaciones adicionales de posiciones largas podrían intensificar la presión vendedora. HYPE muestra una estabilidad temporal, pero la estabilidad por sí sola no es prueba de un cambio de tendencia. Las salidas de los ETF, la distribución de las 'ballenas' rastreadas y el elevado posicionamiento apalancado siguen siendo riesgos importantes. La pregunta decisiva es si los compradores al contado regresarán con suficiente fuerza para absorber la presión vendedora mientras el apalancamiento se mantiene controlado, o si otra ruptura del soporte desencadenará nuevas liquidaciones de posiciones largas. Hasta que esto no quede claro, el intento de recuperación merece cautela en lugar de convicción alcista.
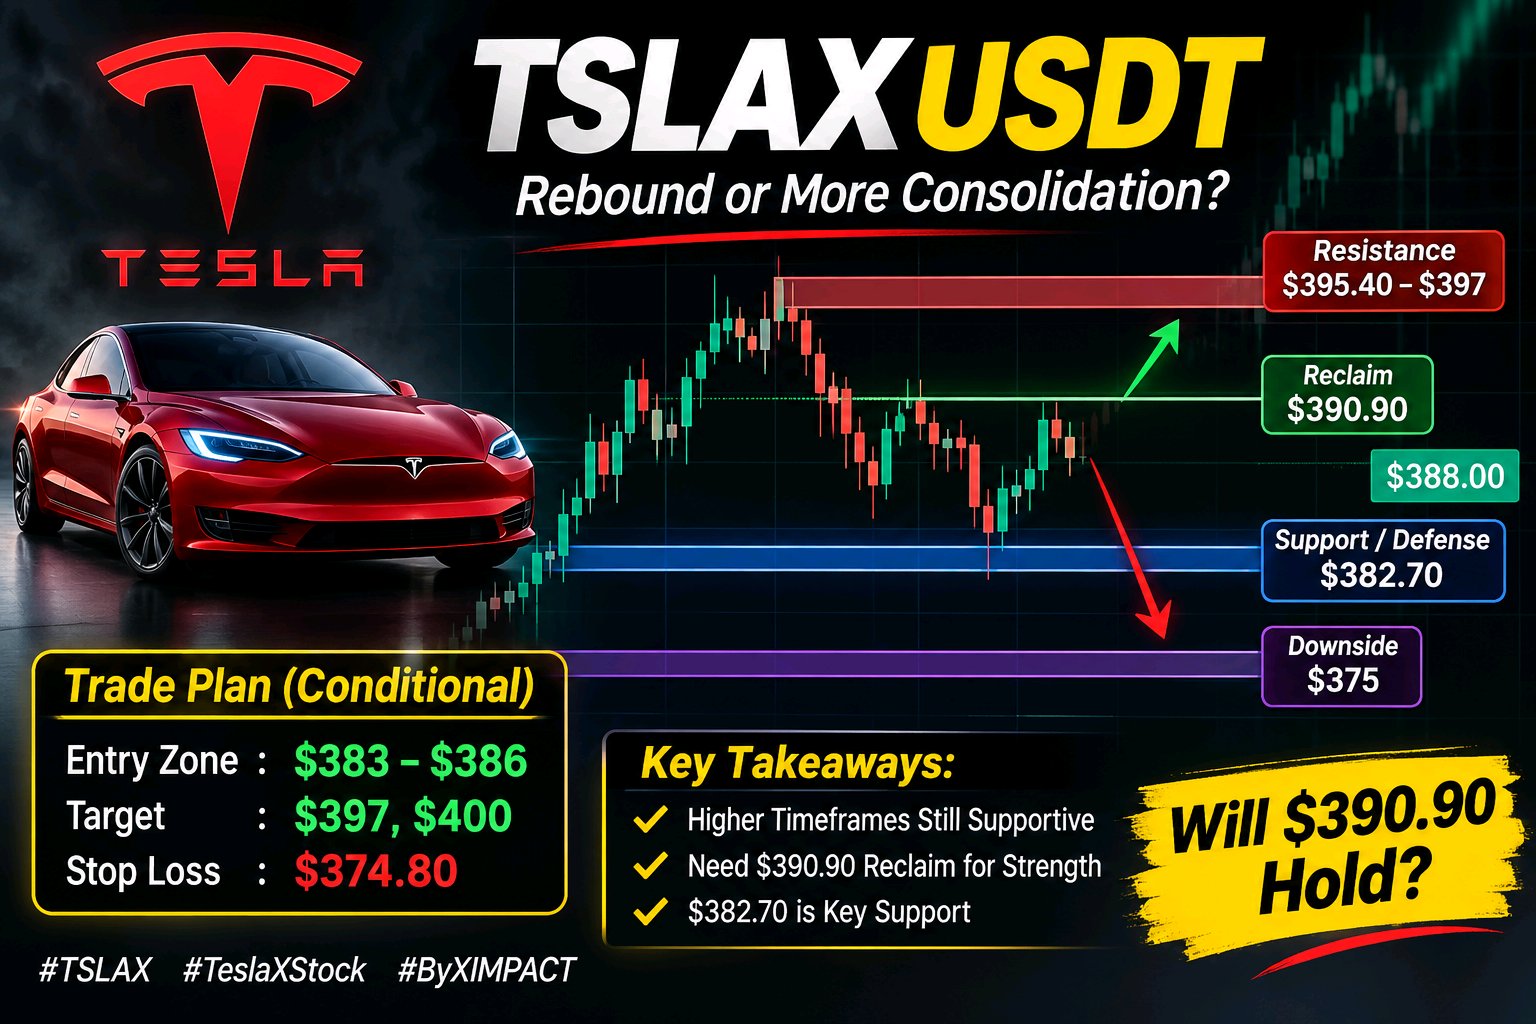
#ByXIMPACT $TSLAXUSDT is showing an interesting disconnect: the higher timeframes support the rebound, but price still needs to prove it can hold above the next resistance zone. TSLAX is trading around $388, up approximately 0.3% over 24 hours, with a recent range of $384.65–$394.71. Tesla shares closed November 11 at $390.84 after gaining 2.91%, but TSLAX is still struggling to establish acceptance above that reference level. CoinGecko +1 The timeframe picture is mixed. The 15-minute reading is neutral, while 1H, 4H and Daily signals lean bullish. Weekly remains bearish. Daily RSI around 54 also suggests positive but not overheated momentum. This looks more like an intermediate rebound facing short-term consolidation than a confirmed long-term trend reversal. FXEmpire +1 Trade thesis: I would avoid chasing price here. A conditional long becomes more interesting if $383–$386 holds and buyers reclaim $390.90. Entry zone: $383–$386 Target: $397, with $400 as the next extension Invalidation/SL: $374.80 Key levels: * Support/Defense: $382.70 — important daily support. * Reclaim: $390.90 — previous close and daily pivot. * Resistance: $395.40–$397 — recent high and resistance cluster. * Downside: $375 — next meaningful support if the defense fails. COINOTAG +1 Aggregated TSLAX perpetual open interest is around $977K, just 1.4% of market cap, while funding is slightly positive at 0.0061%. That suggests some long positioning, but not an obviously crowded leverage trade. CoinGecko One catalyst worth watching is Finland's provisional approval of Tesla Assisted Driving. It supports Tesla's European software-expansion narrative, although EU-wide approval is still unresolved. Reuters The overlooked detail: TSLAX tracks Tesla's underlying share price. Actual TSLA demand and Nasdaq trading conditions matter more here than a Bitcoin-led altcoin move. Backed Assets If $382.70 holds and $390.90 is reclaimed, $397–$400 becomes relevant. Lose support, and $375 comes back into focus. Would you prioritize a confirmed $390.90 reclaim, or wait for buyers to prove themselves around $382.70 first?
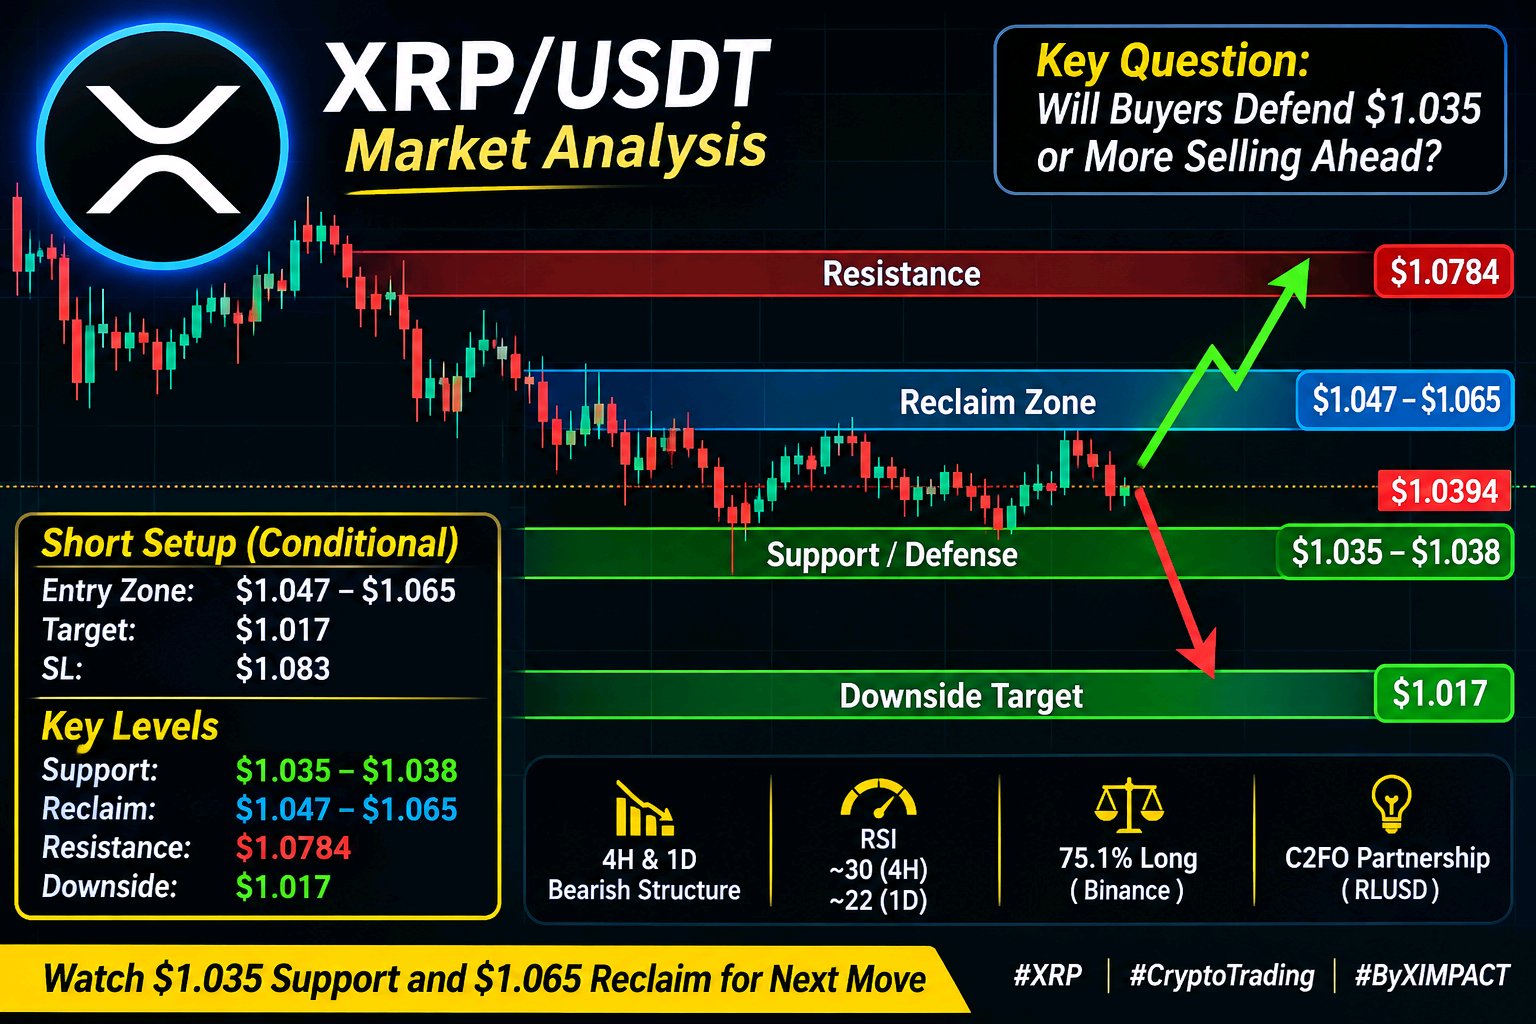
#ByXIMPACT $XRPUSDT is approaching a critical support area, but the current price action still looks more like selling pressure than a genuine recovery. XRP is trading around $1.0394, down approximately 1.77% over 24 hours, with the latest Binance perpetual range between $1.0352 and $1.0805. The short-term picture remains weak. Both 1H and 4H taker-flow readings show strong selling pressure. On the higher timeframes, the 4H and daily structures remain bearish. RSI is around 30.1 on 4H and 22.5 on the daily chart. This signals an oversold market, but oversold conditions alone do not confirm a reversal. My preferred approach is to avoid chasing shorts directly into support. I would rather watch for a weak recovery followed by rejection. Conditional short setup: Entry zone: $1.047–$1.065 Target: $1.017 Invalidation: $1.083 Key levels: Support/Defense: $1.035–$1.038. This area is close to the current 24H low. Reclaim: $1.047–$1.065. Holding above this region would improve short-term structure. Resistance: $1.0784. A reclaim would challenge the bearish setup. Downside: $1.017. This is the next important support area if current defense fails. Derivatives positioning adds another concern. Around 75.1% of Binance XRP perpetual accounts are long, while funding remains positive at 0.0096% per eight hours. That means long holders are still paying shorts despite aggressive selling. Another downside move could force additional long-position unwinding. There is also a fundamental detail worth separating from price action. Ripple's recent C2FO partnership brings trade-finance settlement onto XRPL using RLUSD. That supports ecosystem activity, but RLUSD settlement does not automatically translate into immediate spot demand for XRP. Bitcoin and Ethereum weakness are adding pressure to the broader market. If XRP defends $1.035 and reclaims $1.065–$1.078, I would reconsider the bearish view. A clean breakdown below $1.035 puts $1.017 back in focus. Will buyers defend $1.035 before leveraged long positioning creates another wave of selling?