
KAZ_0
4046Me gusta0Compartir en el chat65Aficionados31Seguir
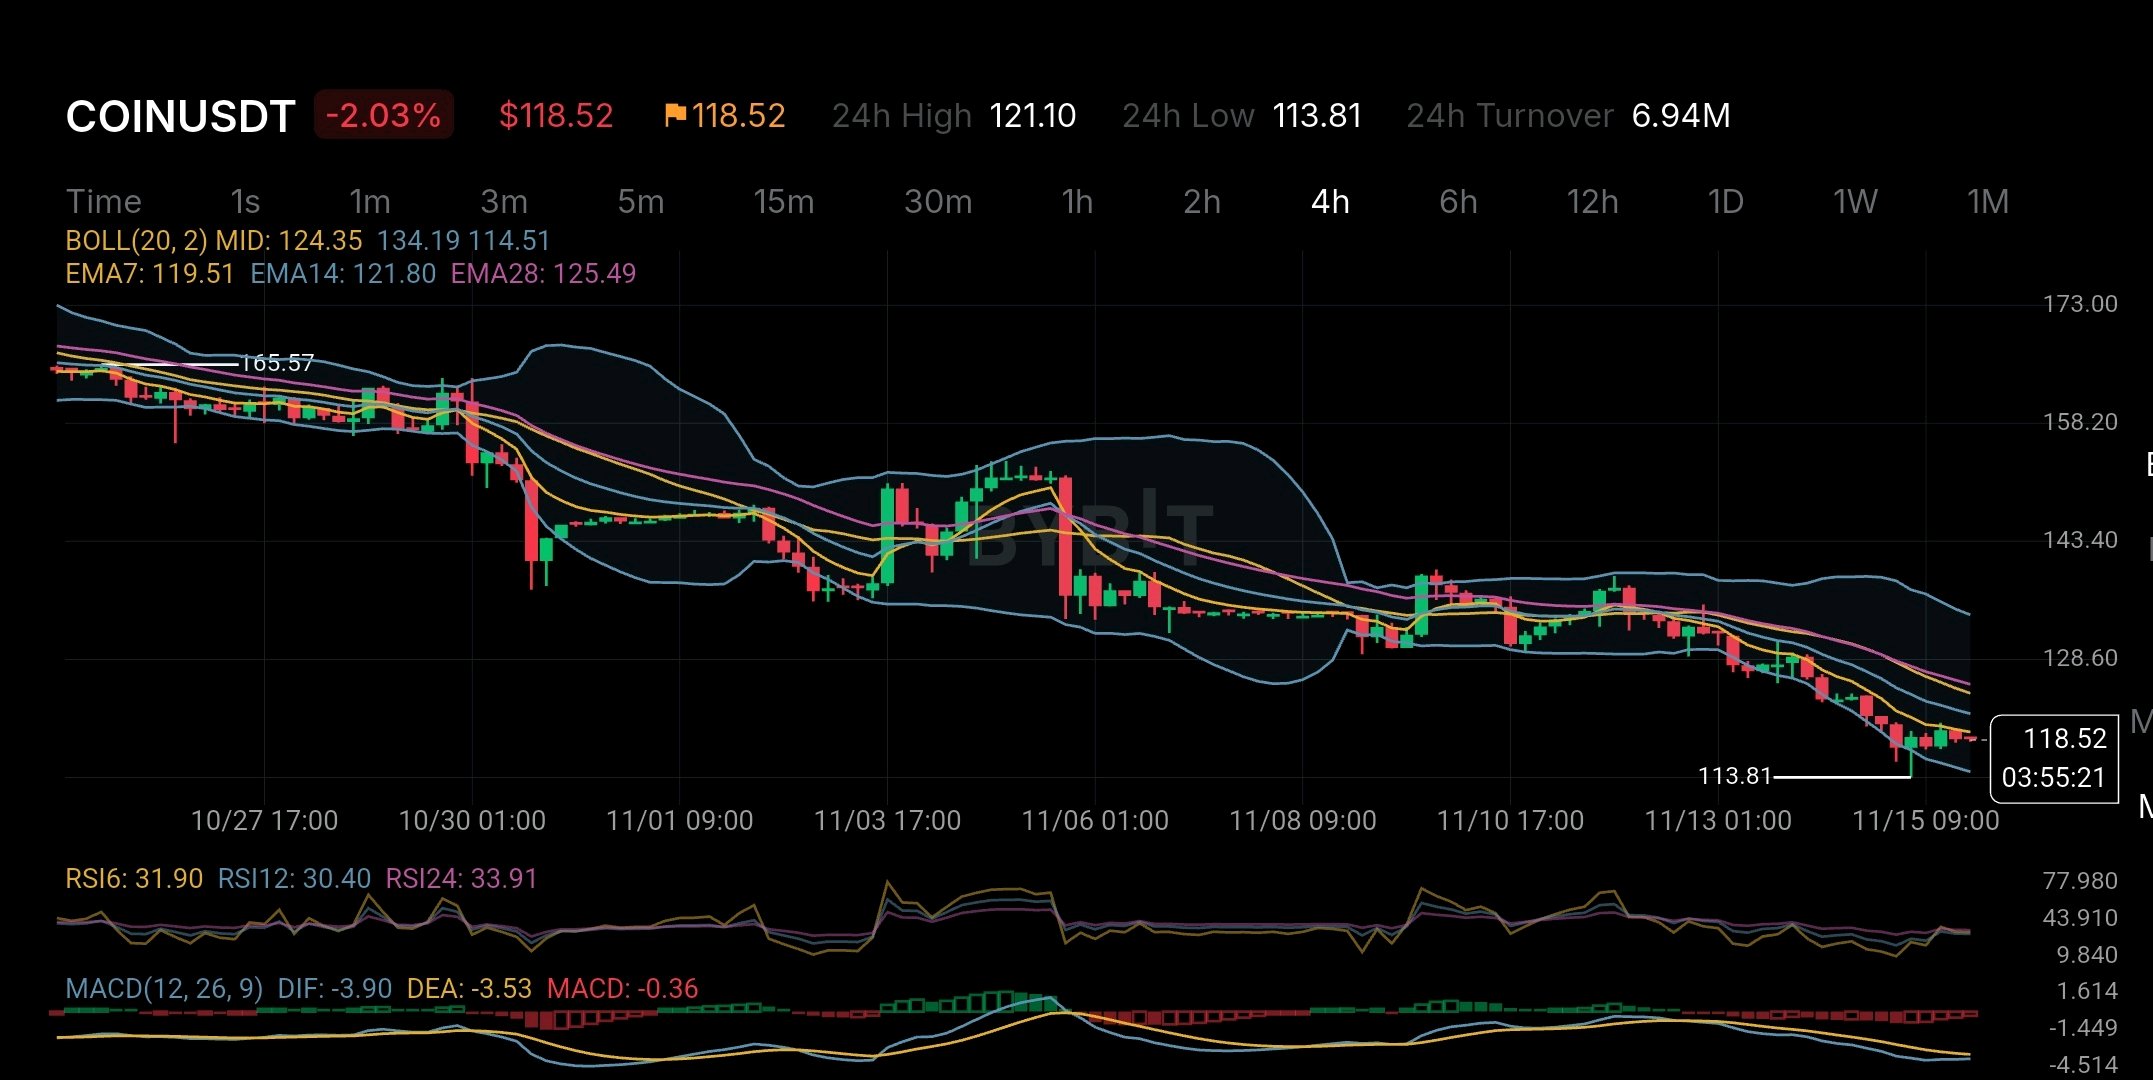
Coinbase reportó unos ingresos netos de 718,7 millones de dólares en el tercer trimestre de 2026. Pero hay un detalle detrás de ese beneficio que los inversores no deberían pasar por alto. Su ingreso neto ajustado fue de solo 77,7 millones de dólares. La diferencia provino principalmente de una ganancia de 715 millones de dólares en criptoactivos mantenidos como inversión. Esto significa que el beneficio principal parece mucho más sólido que el rendimiento operativo ajustado de la empresa. Hay otro detalle importante. Coinbase generó 1.220 millones de dólares en ingresos en el tercer trimestre, lo que supone un descenso del 35 % en comparación con el mismo periodo del año anterior. Los ingresos por transacciones cayeron un 44 %, hasta los 590,2 millones de dólares. Esto demuestra hasta qué punto Coinbase sigue dependiendo de la actividad en el mercado de criptomonedas, incluso mientras se expande hacia otros negocios. También hay un lado positivo. Los ingresos por suscripciones y servicios alcanzaron los 570,2 millones de dólares y representaron alrededor del 49 % de los ingresos netos totales. Los mercados de predicción también superaron los 200 millones de dólares en ingresos anualizados. Esta diversificación podría hacer que Coinbase sea más resistente cuando la actividad de comercio de criptomonedas se ralentice. Pero el mercado de valores no ignora los riesgos. Si observamos el gráfico de 4 horas de COINUSDT, el precio se sitúa en torno a los 118,52 dólares tras un descenso constante desde la zona de los 165 dólares. El precio cotiza por debajo de la EMA7 en 119,51 dólares, la EMA14 en 121,80 dólares y la EMA28 en 125,49 dólares. Las tres medias móviles apuntan a una presión vendedora. Las lecturas del RSI están cerca de 30, lo que sugiere que los vendedores han empujado al mercado a una zona de sobreventa. Sin embargo, sobreventa no significa automáticamente que se avecine una reversión. El MACD también sigue siendo negativo, lo que significa que el impulso bajista no ha desaparecido claramente. La zona de 113,81 dólares es un soporte cercano importante a vigilar. Si los compradores defienden esta zona y el precio vuelve a subir por encima de los 121,80 dólares, el mercado podría empezar a mostrar signos de recuperación. Por otro lado, una ruptura clara por debajo de los 113,81 dólares podría abrir la puerta a otra pierna bajista. Una cosa más que los traders deberían entender: COINUSDT en Bybit es un contrato perpetuo que rastrea las acciones de Coinbase. No proporciona la propiedad real de las acciones, derechos de voto ni dividendos. Para mí, la mayor conclusión es esta. Coinbase está construyendo nuevas fuentes de ingresos más allá del trading de criptomonedas, pero sus últimos resultados muestran que los beneficios principales todavía pueden verse fuertemente influenciados por las ganancias del mercado de criptomonedas. La verdadera pregunta es si sus crecientes negocios recurrentes pueden llegar a ser lo suficientemente fuertes como para sostener a la empresa incluso cuando el mercado de criptomonedas deje de ayudar. #WSOTMuestraTuOperaciónConIAParaGanar10USDT #ByXIMPACT
Algo que muchos inversores pueden estar pasando por alto sobre SUI es que una mayor actividad en la red no siempre se traduce en más valor para el token. Y esto es algo que vale la pena analizar. Según los últimos datos disponibles, Sui gestionó alrededor de 73,39 millones de transacciones en 24 horas con cerca de 70.268 direcciones activas. Su ecosistema DeFi también contaba con unos 363-375 millones de dólares en TVL. Estos números se ven bien, pero hay otra cara de la moneda. Las comisiones diarias de la red se situaron en torno a los 4.511 dólares, mientras que las aplicaciones en Sui generaron unos 55.000 dólares en ingresos. Son dos cosas distintas, pero plantean una pregunta importante: Si la gente está usando tanto la red Sui, ¿cuánta de esa actividad genera valor real para los poseedores de SUI? Sui cuenta con una tecnología sólida detrás. Utiliza el lenguaje de programación Move, un sistema único basado en objetos y el protocolo de consenso Mysticeti para hacer que las transacciones sean más rápidas y eficientes. Eso es una ventaja clara. Pero una buena tecnología por sí sola no garantiza un mayor valor del token. Para los poseedores de SUI, lo importante es si un mayor número de usuarios en la red creará más demanda del token a través de las comisiones por transacción, el staking y el crecimiento del ecosistema. También está el problema del suministro. SUI tiene un suministro máximo de 10 mil millones de tokens, pero no todos están en circulación actualmente. Con el tiempo, entrarán más tokens en el mercado, lo que podría generar presión de venta si la demanda no crece lo suficiente. Al observar el gráfico de 4 horas, la situación sigue siendo débil. SUI cotiza por debajo de las EMA7, EMA14 y EMA28. El MACD también es negativo, mientras que el RSI ronda los 35. Esto demuestra que los vendedores siguen teniendo el control. Es posible una recuperación, pero el gráfico aún no ha confirmado un cambio de tendencia. Para mí, la mayor duda sobre SUI no es la rapidez con la que su red puede procesar las transacciones. Es si esa creciente actividad puede generar una demanda real y duradera para el token SUI. Una red puede volverse popular, pero la verdadera prueba es si su token se beneficia de esa popularidad. $SUIUSDT #IMPACTbyTrade

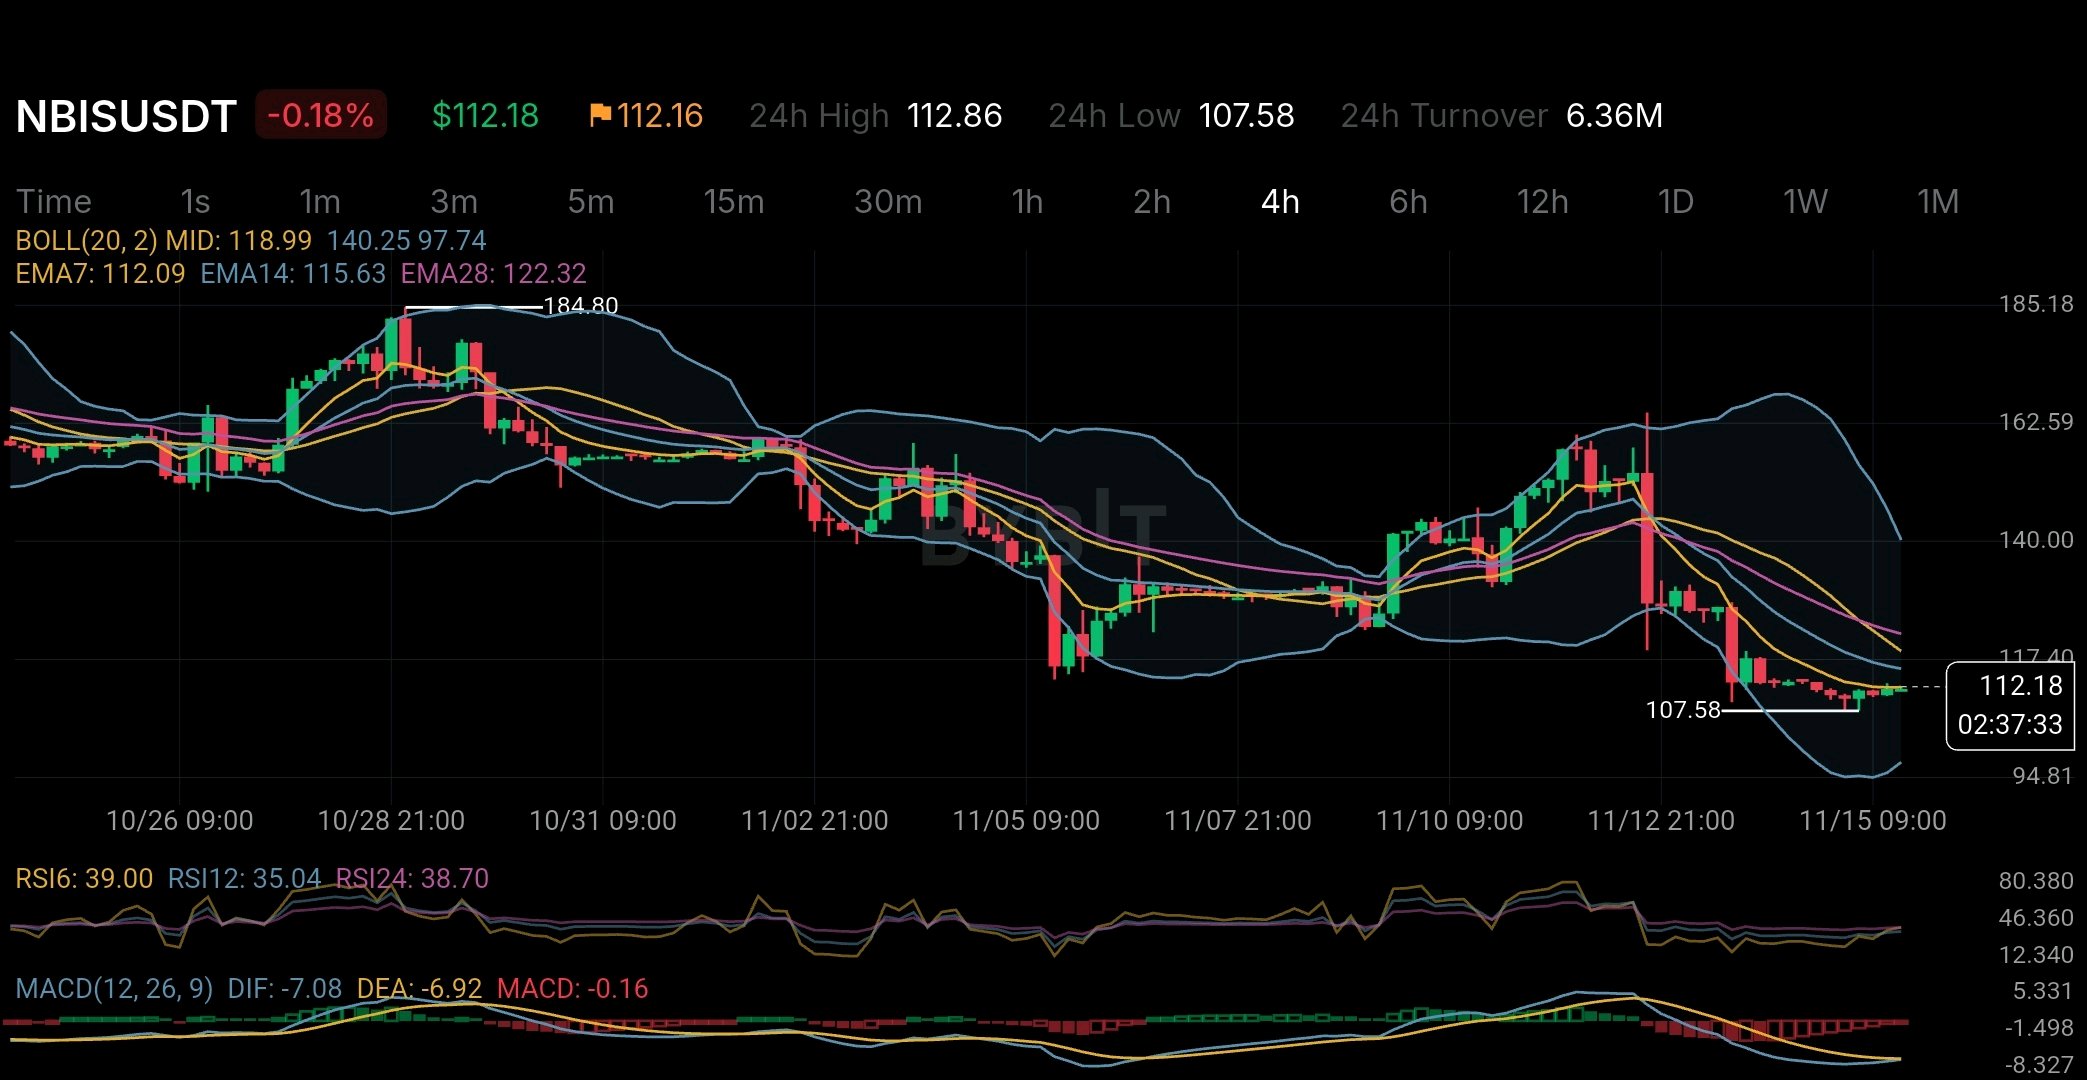
Nebius acaba de reportar un crecimiento de ingresos interanual del 571 %. Pero hay un detalle en sus últimos resultados que merece más atención que el titular. No todo ese crecimiento provino de su negocio tradicional de IA en la nube. Nebius reportó 980,8 millones de dólares en ingresos para el tercer trimestre de 2026. Aproximadamente 325 millones de dólares fueron ingresos no recurrentes procedentes del despliegue inicial de su modelo de asociación de infraestructura de activos ligeros. He aquí por qué esto es importante. Bajo este modelo, los socios financian, poseen y operan los centros de datos. Nebius aporta su arquitectura de infraestructura, pila de software, experiencia en hardware y relaciones con los clientes. Este es un cambio estratégico interesante. En lugar de financiar cada GPU y centro de datos por sí mismo, Nebius puede expandir su huella global de IA en la nube utilizando infraestructura financiada por socios externos. La ventaja potencial es sustancial: mayor capacidad de computación sin cargar con toda la carga de capital. Pero hay otra cara de la moneda. Nebius gastó aproximadamente 7,3 mil millones de dólares en propiedades, equipos y activos intangibles solo en el tercer trimestre. Su inversión de nueve meses en estos activos alcanzó aproximadamente los 15,4 mil millones de dólares. Mientras tanto, el flujo de caja operativo de las operaciones continuas fue negativo en 273 millones de dólares durante el tercer trimestre. Eso crea una distinción importante entre el crecimiento de los ingresos y el crecimiento financieramente sostenible. El modelo de activos ligeros podría mejorar la eficiencia del capital con el tiempo, pero los inversores aún necesitan ver cuántos ingresos recurrentes genera, qué tan rentables se vuelven esas asociaciones y si la demanda de los clientes justifica la infraestructura que se está desplegando. También existe un desafío competitivo. Nebius opera frente a gigantes establecidos de la nube y proveedores especializados en infraestructura de IA como CoreWeave. El acceso a GPU, electricidad, capacidad de centros de datos y financiación puede determinar quién captura la próxima fase de la demanda de IA. El gráfico de mercado añade otra dimensión. En la instantánea del 15 de noviembre, NBISUSDT cotiza alrededor de 112,18 $ en el marco temporal de cuatro horas. El precio se mantiene por debajo de las EMA de 14 y 28, mientras que las lecturas del RSI alrededor de 35 indican un impulso débil. El MACD también es ligeramente negativo. Esto no establece una reversión. Muestra que el sentimiento del mercado aún no ha alcanzado al crecimiento reportado por la empresa. Una aclaración importante: NBISUSDT en Bybit es un contrato perpetuo liquidado en USDT que sigue las acciones de Nebius Group, no un token cripto convencional con tokenomics de blockchain independientes. La verdadera pregunta en torno a Nebius no es si existe demanda de infraestructura de IA. Es si la empresa puede convertir la enorme demanda e inversión en flujos de caja duraderos y rentables antes de que el costo de la expansión se convierta en un problema mayor que el propio crecimiento. #ByXIMPACT
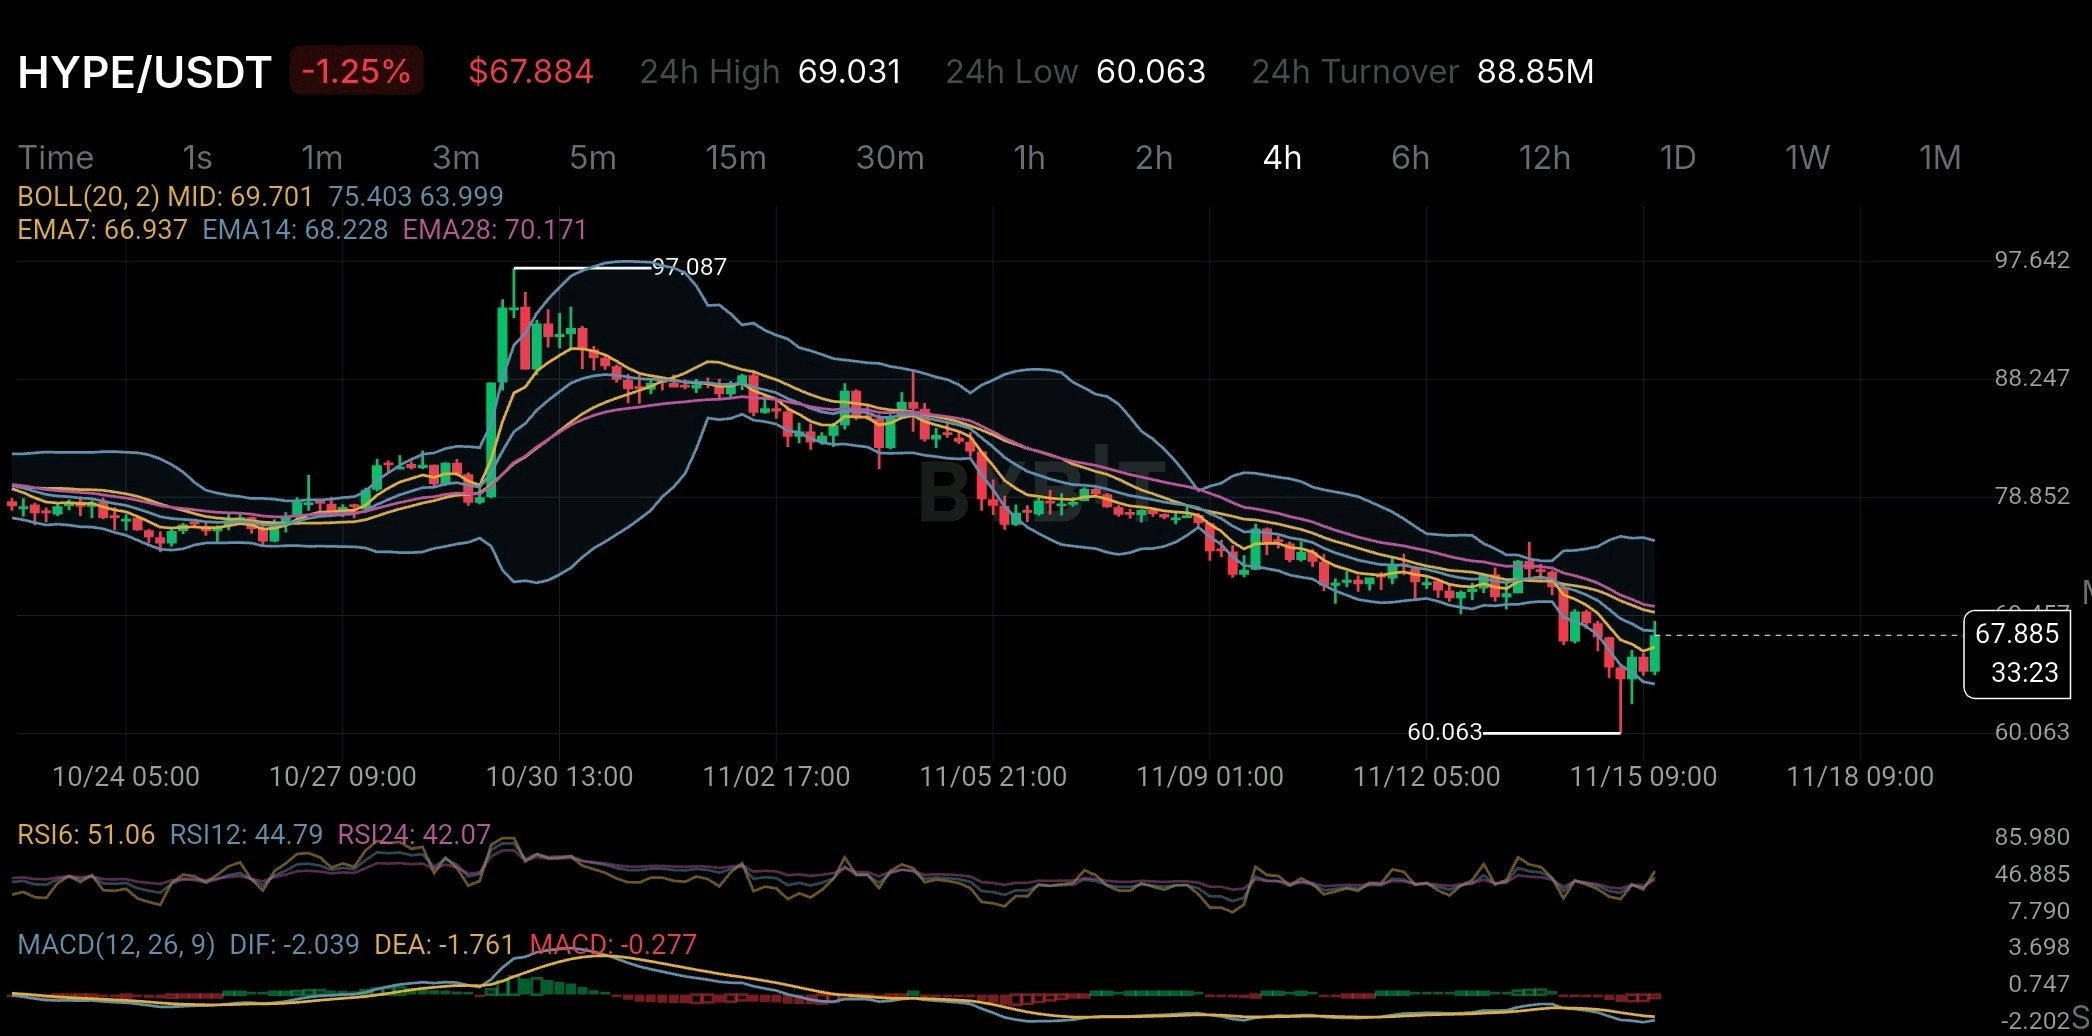
HYPE has something that many crypto tokens don't: a system that uses trading fees to buy HYPE tokens and burn them permanently. But despite this system the price has still dropped from around $97 to $60 on the 4-hour chart. This is something worth looking at more closely. One of the most interesting parts of Hyperliquid is its Assistance Fund. According to its official documents trading fees are used to buy HYPE tokens through this fund. The tokens collected are then permanently burned. The numbers are important. A September 2026 SEC filing reported that 99% of protocol fees went to the Assistance Fund. By September 8 around 47.1 million HYPE tokens had been bought and permanently removed from circulation. That's equal to 4.7% of the original supply. This connects the platform's trading activity directly to HYPE demand. More trading can generate more fees. More fees can mean more HYPE purchases and fewer tokens in circulation. But there is one important thing to understand: Token burns do not guarantee a higher price. They create buying demand but they cannot stop the price from falling. If investors sell more HYPE than the fund buys the price can still go down. Market conditions liquidity and investor sentiment also play a major role. The chart shows this clearly. HYPE recently dropped to $60.063 before recovering to around $67.884. However the price is still below EMA14 at $68.228 and EMA28 at $70.171 on the 4-hour chart. MACD is also still negative which means the overall downward trend has not clearly ended. The recent recovery is a positive sign but it is too early to call it a trend reversal. For investors the most important thing is not just how many HYPE tokens are burned. What matters is whether the demand created by real platform activity can become stronger than the selling pressure. HYPE has an interesting advantage because its token demand is connected to actual platform activity rather than depending only on hype. But even a strong token-burning system cannot guarantee a higher market price. The real challenge for HYPE is simple: Can actual platform demand become stronger than the pressure from people selling their tokens? $HYPEUSDT #ByXIMPACT

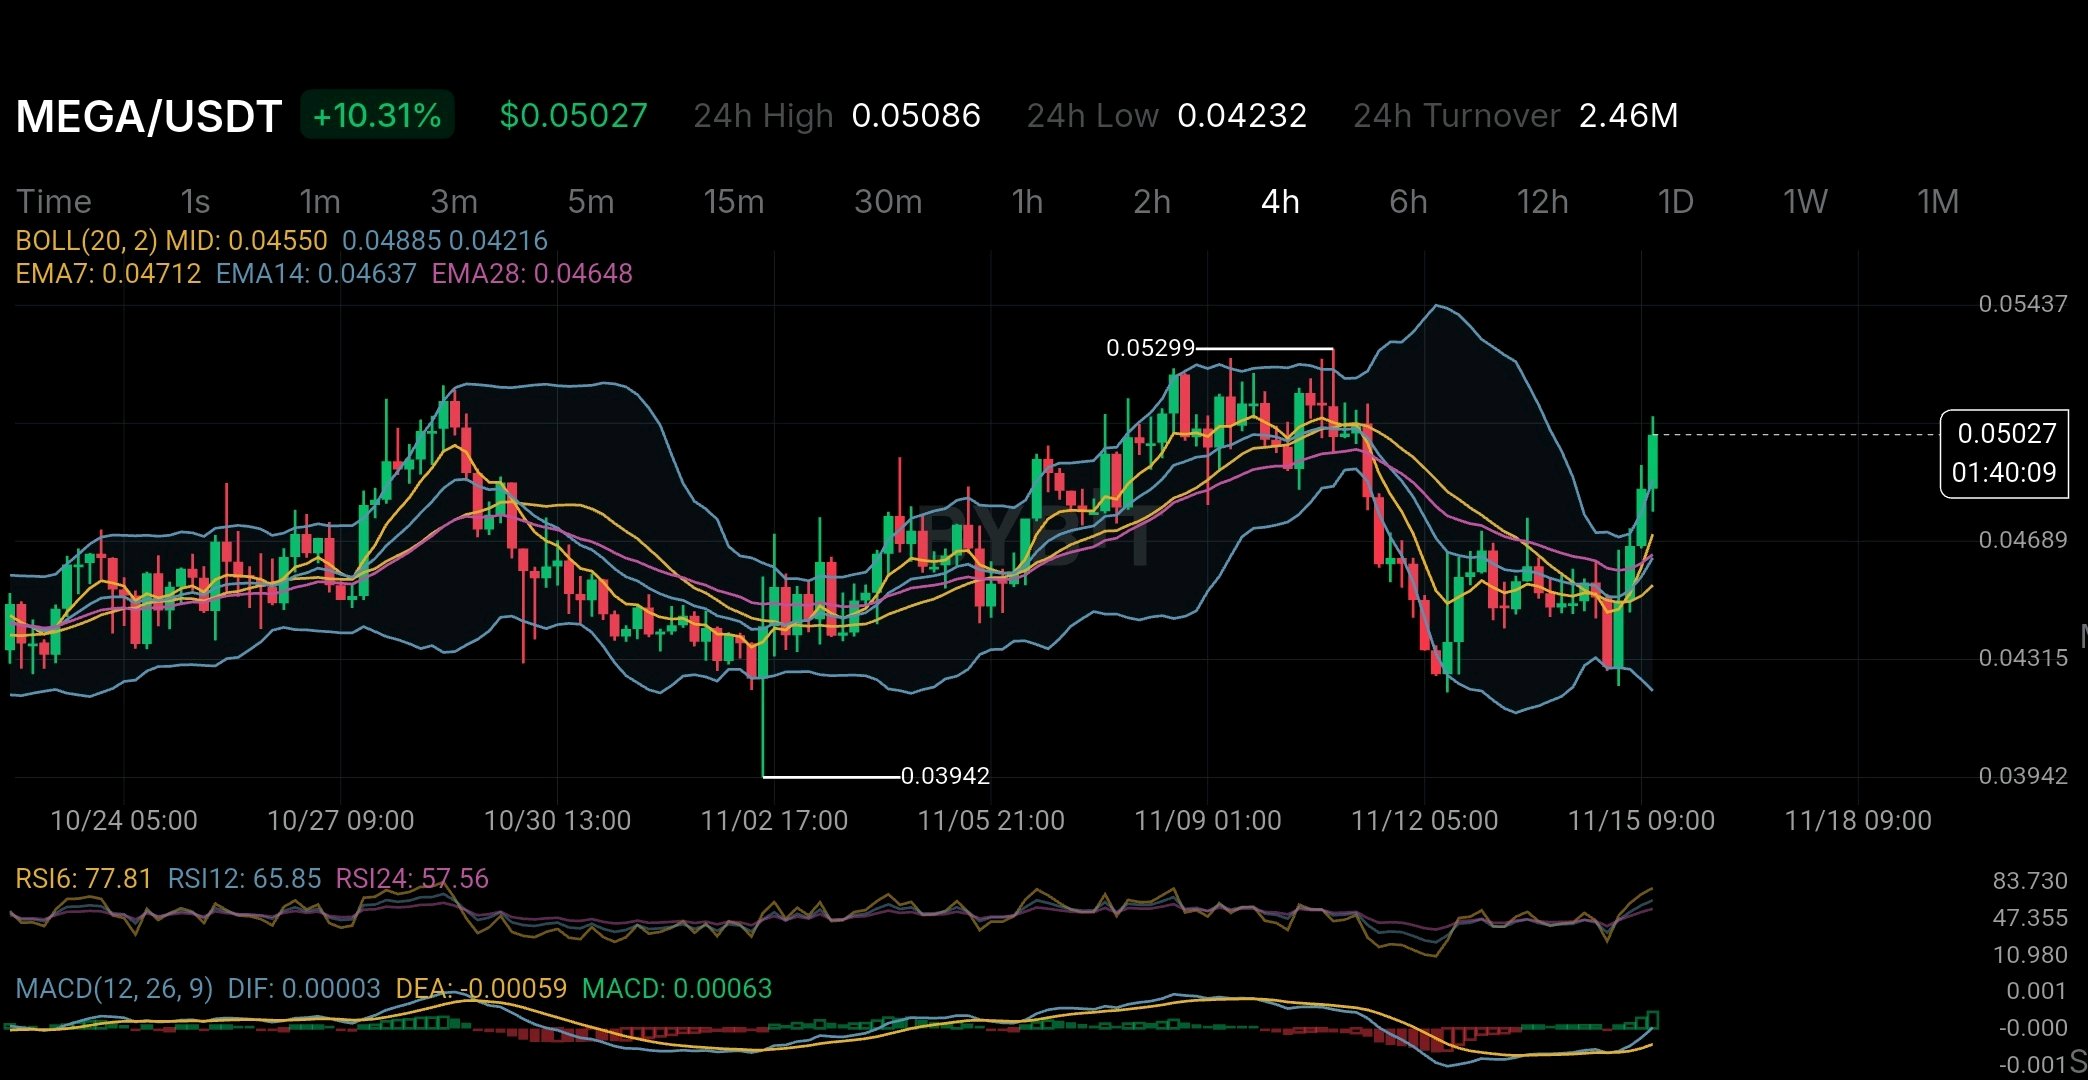
MEGA is up 10.31% but there is something happening behind the scenes that deserves more attention than the price increase. MegaETH seems to be changing its plans. On November 10 the team announced a $30 million treasury investment to build new products. The first big project is a decentralized AI marketplace expected to launch in December. The idea is simple. Instead of using just one AI provider developers could choose between different providers and compare their prices speed and performance. But there is something interesting here. MegaETH started with one main goal: building a fast Ethereum Layer 2 network. Now the team wants to do more than just build blockchain technology. It also wants to create useful products on top of that network. So why is this happening? There are some numbers worth looking at. According to CoinDesk's November 14 report MegaETH's DeFi TVL had dropped to around $8.8 million from its previous high of more than $245 million. That is a big drop. It shows that the project still needs to attract more users and money into its ecosystem. Another important update came on November 13 when MEGA announced a 20% reduction in its workforce. The changes affected teams working on blockchain development wallets and ecosystem support. This does not mean the project is failing. But it does show that the team is changing its priorities. MEGA's token supply is also worth watching. According to its official token distribution information around 53% of the total supply is set aside for KPI-based rewards. In simple words tokens are distributed based on how well the network meets certain goals instead of following only a fixed release schedule. This approach connects token rewards with the growth of the ecosystem. However there is something investors should understand. A growing project does not always mean a more valuable token. Holding MEGA does not give investors direct ownership of the company or guarantee them a share of its revenue. This becomes even more important now that the team is moving into the AI space. Now let's look at the 4-hour chart. MEGA is trading around $0.05027 with a 10.31% gain. The price has moved above the upper Bollinger Band at $0.04885 while RSI6 is at 77.81. MACD has also turned positive which shows that buying momentum is getting stronger. But there is one thing to be careful about. RSI is already high so the price could face a pullback after this strong move. For me the real story is not just the AI idea or today's price increase. It is whether MegaETH can turn its new plans into real users and activity. The AI marketplace could open a new growth opportunity for the project. But the real test will be whether this growth also creates real value for MEGA holders. A strong project needs more than a good idea. It needs results that people can actually see. $MEGAUSDT #IMPACTbyTrade
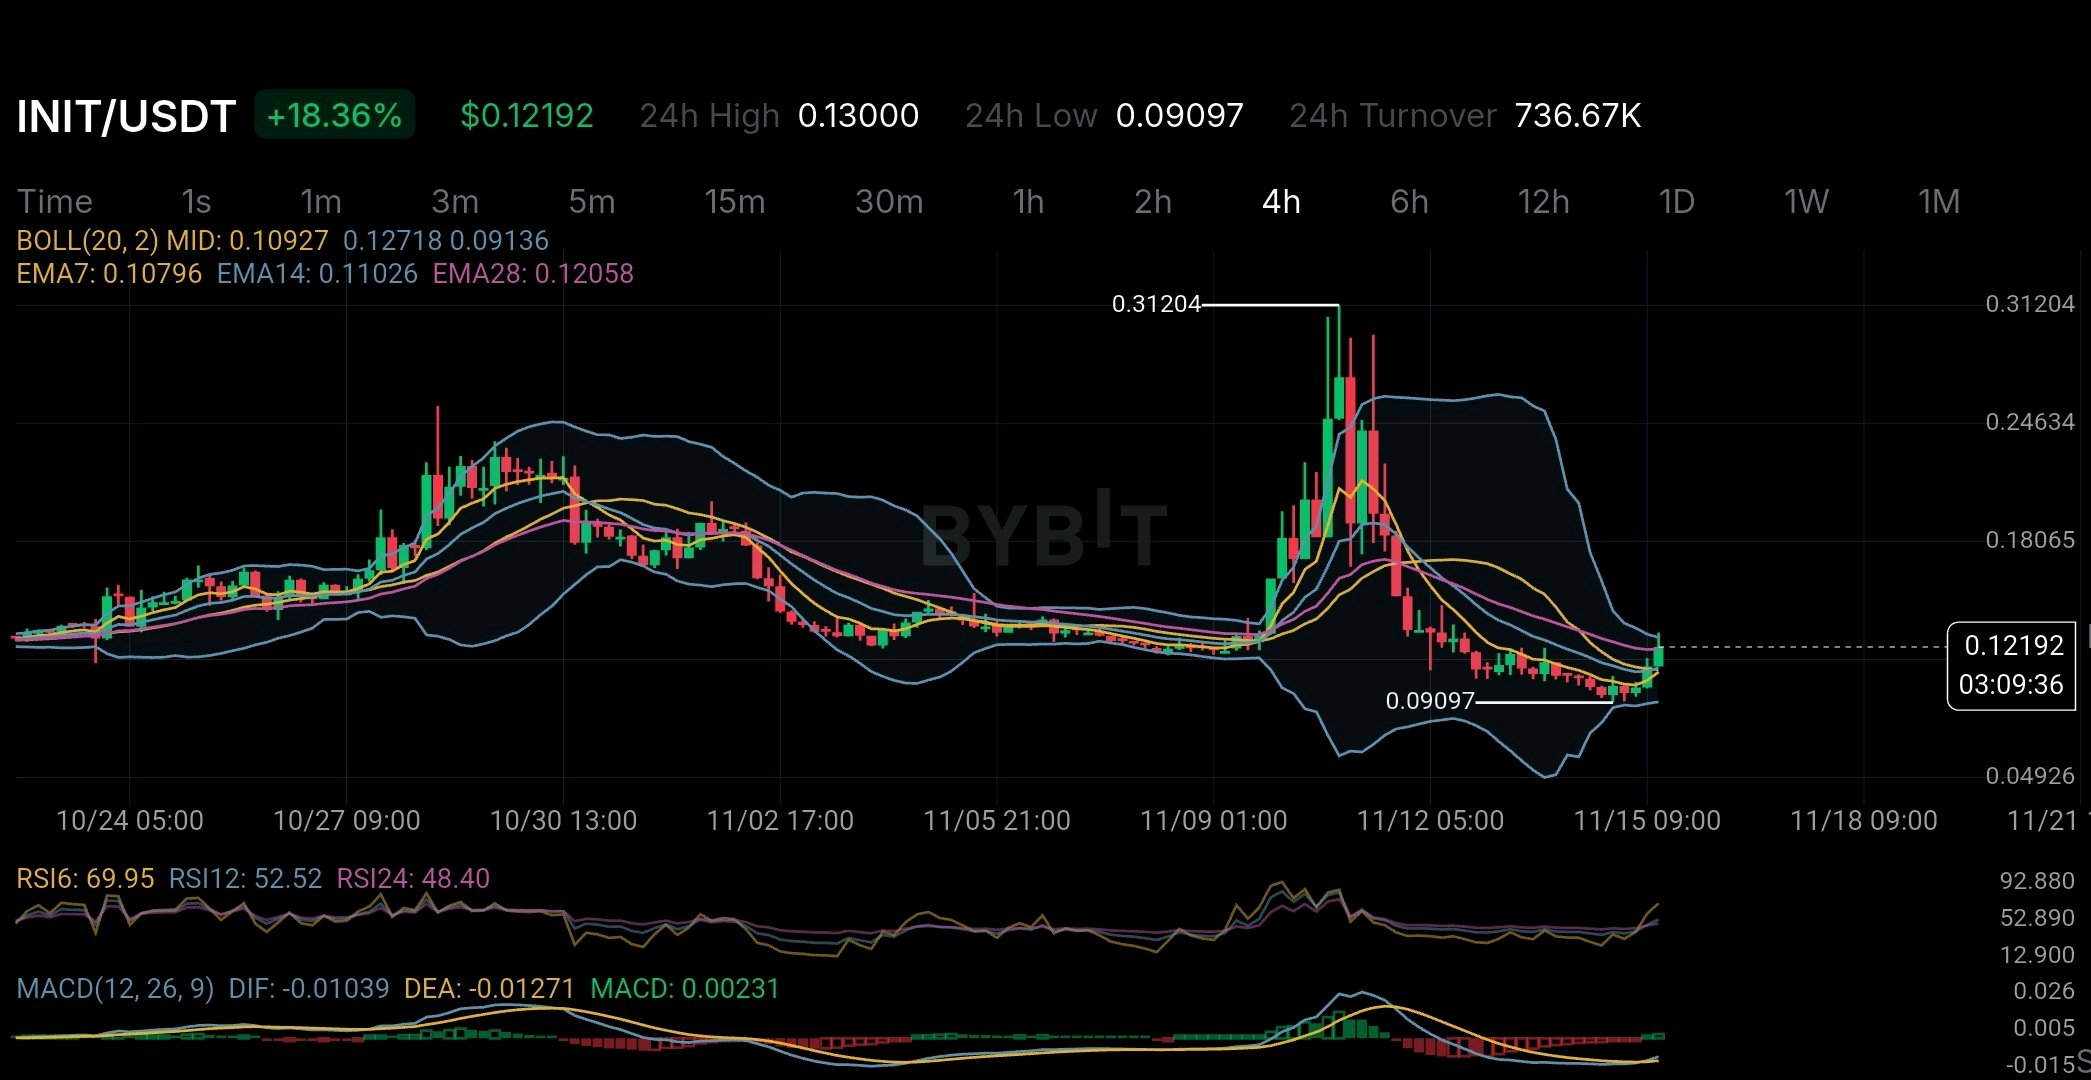
INIT is up 18.36% on the 4H chart but there is something important happening with its token supply. The main thing to understand is that unlocked tokens and tokens actually available in the market are not always the same. Here is the bigger concern. According to DefiLlama's November 10 analysis around 96 million INIT tokens were already vested but were not included in the circulating supply. It also reported an annual inflation rate of 57.28%. There is another thing worth watching. DefiLlama's market data showed average futures trading volume of around $90.5M compared to only $19.9M in spot volume. Open interest was also close to 77% of market cap. Funding was negative which means short traders were paying long traders. This makes the current rally interesting. The price could be rising partly because short traders are closing their positions rather than because of strong buying in the spot market. On the 4H chart INIT has moved above its EMA levels and MACD has turned positive. But RSI6 is already close to 70 which means the short-term move may be getting overheated. I would like to see stronger spot buying before trusting this recovery. A price pump is one thing. Keeping that price strong while more tokens enter the market is a completely different challenge. The big question is whether INIT can maintain this momentum when supply pressure increases. $INITUSDT #IMPACTbyTrade
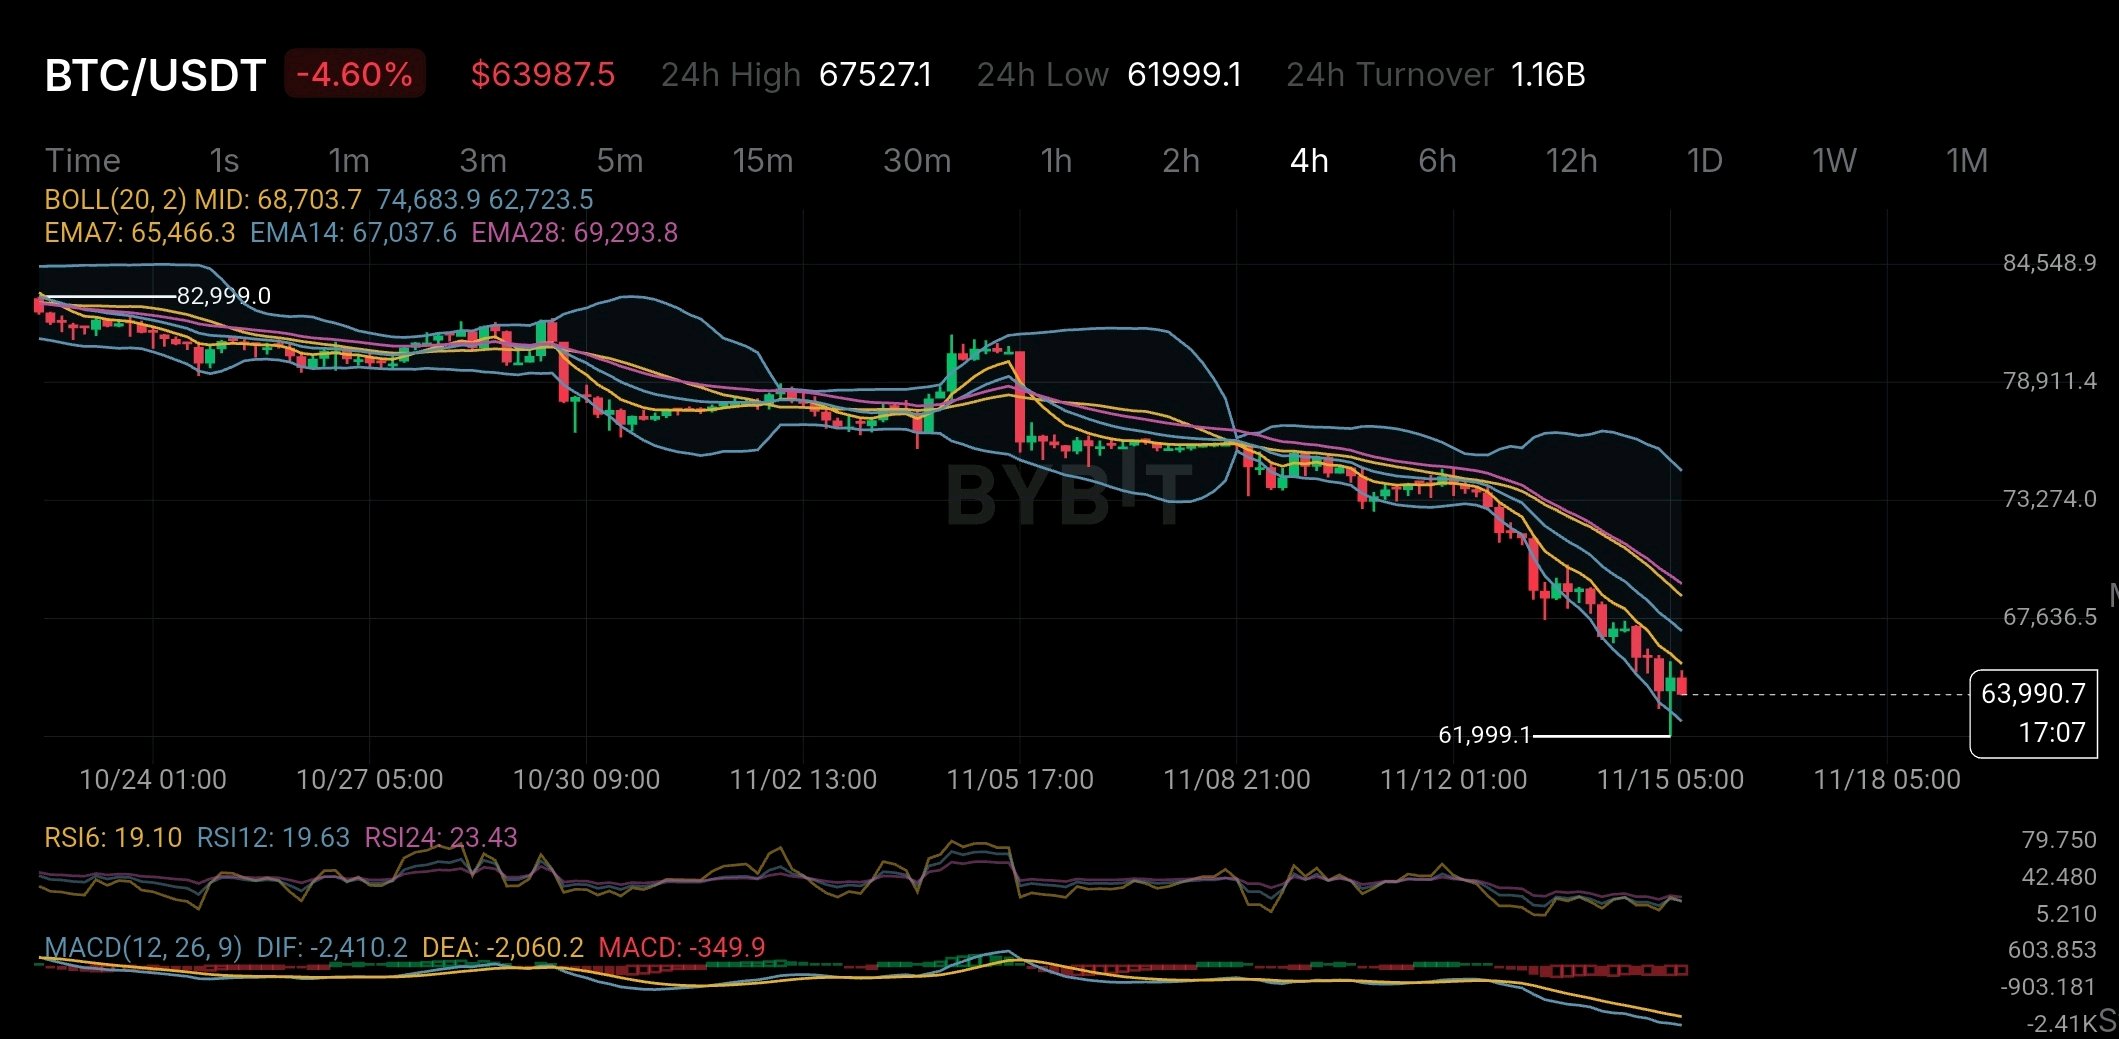
Bitcoin is showing more weakness than a normal price drop. What worries me is how quickly buyers have lost control on the 4-hour chart. BTC is trading around $63,987 after dropping nearly 4.6%. It also recently touched $61,999. One thing I noticed is that all the momentum indicators are looking weak. RSI is around 19–23 and BTC is trading below the 7 14 and 28 EMAs. MACD is also showing negative momentum. This tells me that sellers are still in control. But the very low RSI also makes me think about one thing. Are sellers getting tired or is another drop coming? For me the bigger concern is not just the chart. It is the demand from big investors. US spot Bitcoin ETFs have seen around $2.3 billion in money flowing out during November so far. Nine out of the first ten trading sessions were negative. Another important detail is that the crypto market saw around $1.64 billion in liquidations within 24 hours on November 13. Most of these losses came from traders who were using leverage to bet on higher prices. So this drop is not only about weak chart signals. A stronger US dollar and expectations of higher interest rates are also putting pressure on risky assets like Bitcoin. The main level I am watching is $61,999. If BTC breaks below this support with strong selling pressure then we could see another move down. But if buyers defend this level and BTC starts moving back above the short-term EMAs then a recovery bounce could happen. I also think the low RSI is worth watching. It could lead to a quick bounce but it does not mean the bottom is confirmed. Bitcoin still has a maximum supply of 21 million coins. Its block reward is also 3.125 BTC after the 2024 halving. But there is one important thing to understand. Limited supply does not guarantee higher prices when buyers are not coming into the market. That is what I am watching right now. Bitcoin's long-term supply has not changed but demand in the short term is getting weaker. The big question is whether buyers will step in around $62K or whether Bitcoin needs another drop before finding a stable bottom. $BTCUSDT #IMPACTbyTrade
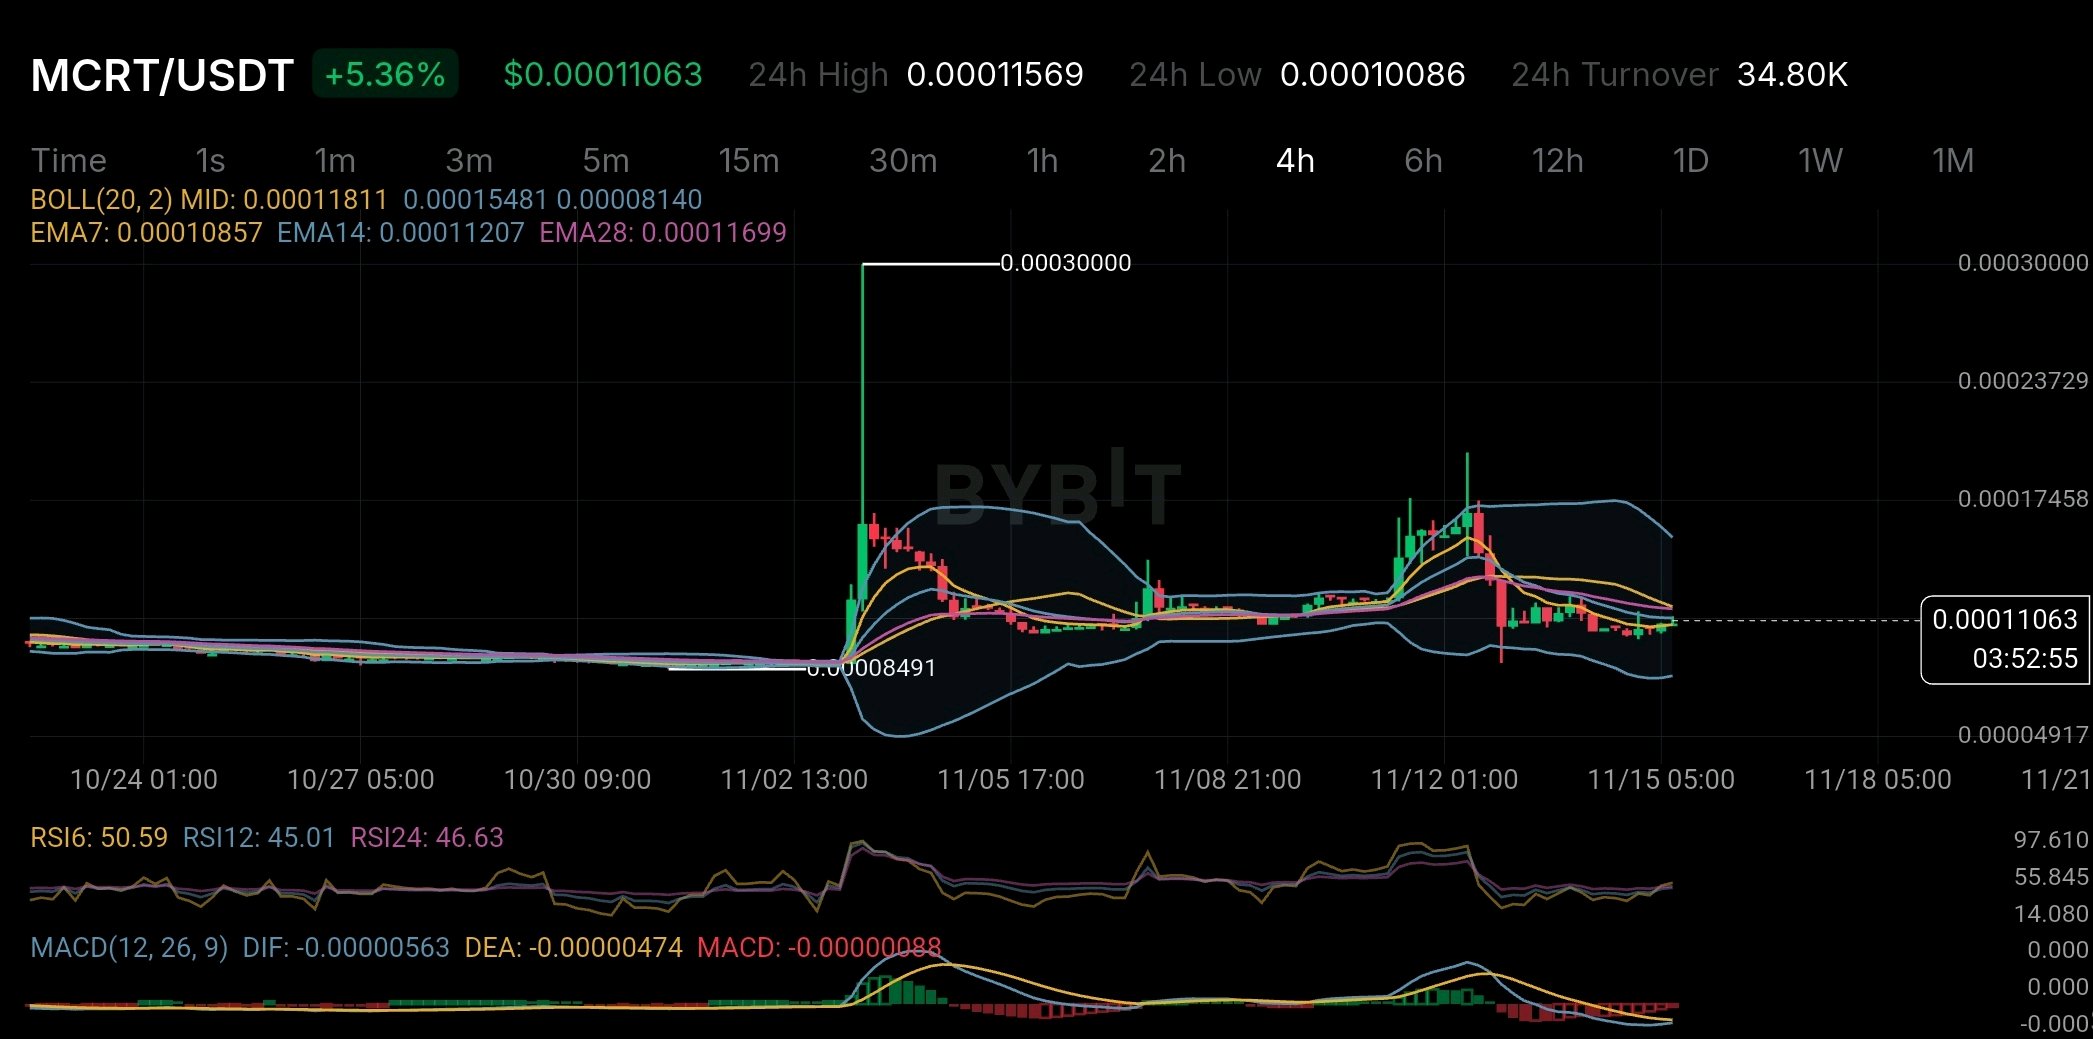
MCRT muestra cierta recuperación en el gráfico de 4H, pero todavía no estoy seguro de que los compradores tengan el control total. El precio está actualmente alrededor de 0,00011063 $ tras una subida del 5,36%. Pero hay algunas cosas que quiero ver antes de ponerme demasiado alcista. Algo que me llamó la atención es el suministro de tokens. MagicCraft tiene un suministro máximo de 10 mil millones de MCRT. Según su tokenomics oficial, no existe un sistema de quema de tokens. Alrededor del 43,5% del suministro se reservó para el crecimiento de los juegos y del ecosistema, mientras que otro 12% se destinó a recompensas por staking. Esto significa que las futuras liberaciones de tokens y la demanda real son aspectos importantes a vigilar. También noté una gran diferencia en los datos de suministro circulante. El sitio web oficial estimaba alrededor de 8,4 mil millones de MCRT para octubre de 2026, mientras que CoinGecko muestra alrededor de 5,038 mil millones de tokens en circulación y un suministro total de 7,2 mil millones. Estas cifras pueden provenir de diferentes métodos de informe, pero la diferencia merece ser observada. Ahora, mirando el gráfico, MCRT sigue por debajo de la EMA14 y la EMA28. La banda central de Bollinger está alrededor de 0,00011811 $. El RSI está cerca de ser neutral y el MACD sigue siendo negativo. Por ahora, esto parece más un precio intentando estabilizarse que una clara reversión de tendencia. Estoy vigilando la zona de 0,000112 $ - 0,000118 $. MCRT necesita moverse por encima de esta zona para mostrar mayor fortaleza. A la baja, 0,000100 $ es un nivel de soporte importante a vigilar. Personalmente, quiero ver a los compradores empujar el precio por encima de las medias móviles antes de confiar demasiado. Una vela verde está bien, pero la gran pregunta es si la demanda real del juego puede respaldar el token con el paso del tiempo. $MCRTUSDT #IMPACTbyTrade
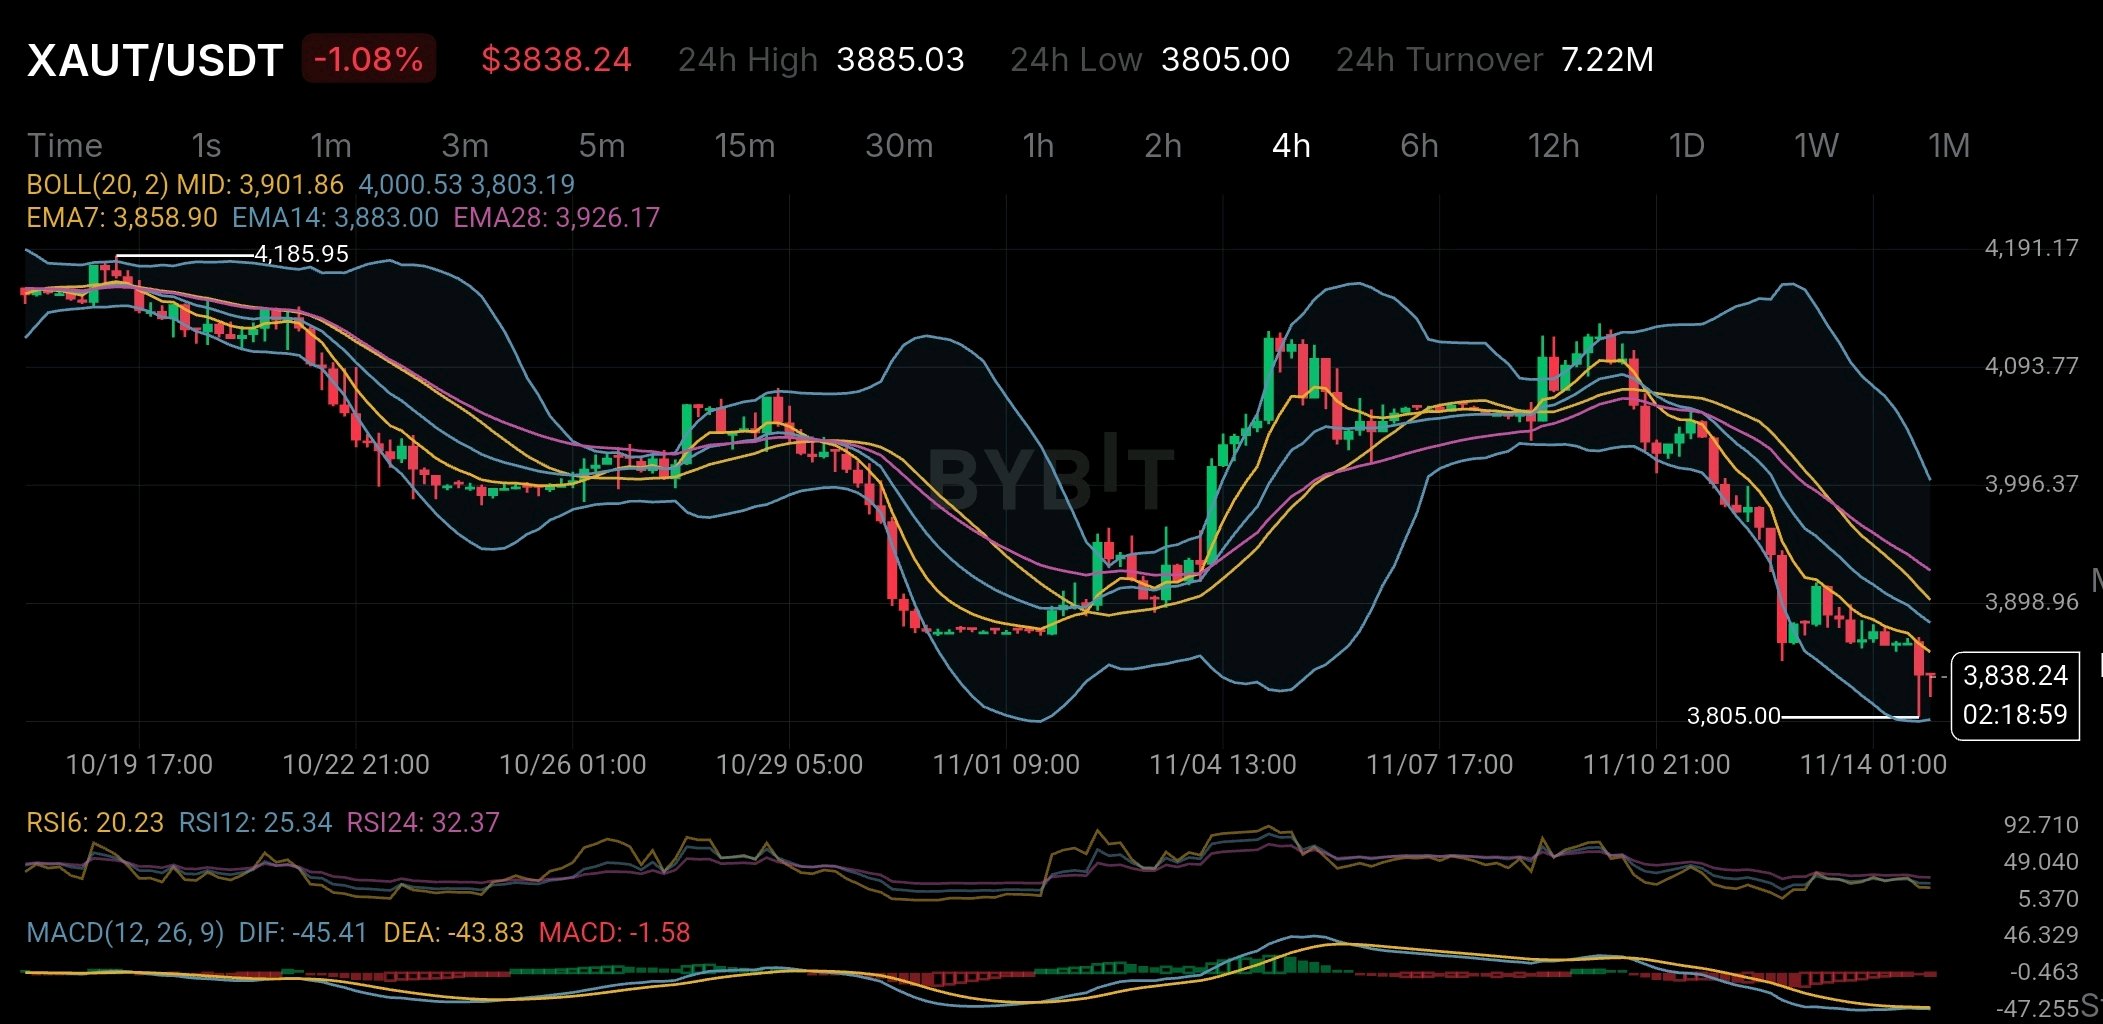
Algo que me parece interesante de XAUT es que el respaldo en oro no es lo único en lo que deberían fijarse los inversores. He estado estudiando Tether Gold y hay un detalle en sus cifras de reservas que me ha llamado la atención. Según el informe de reservas del 30 de septiembre de 2026, Tether había emitido 827.417,63 XAUT, respaldados por la misma cantidad de oro físico en onzas troy finas. Pero aquí hay algo que merece la pena analizar. De esos tokens, 709.323,66 ya se habían vendido, mientras que 118.093,97 estaban en manos de una entidad relacionada y listados como disponibles para la venta. Eso es aproximadamente el 14,3% de la oferta emitida. No lo veo como una señal de alerta inmediata porque esos tokens también están cubiertos por las reservas de oro declaradas. Aun así, creo que es importante entender la diferencia entre la oferta total emitida y la cantidad que ya está circulando en manos de los compradores. También hay otra cosa que la gente no siempre tiene en cuenta. Poseer XAUT no significa que puedas presentarte fácilmente y recoger oro físico cuando quieras. El canje conlleva requisitos de KYC, comisiones y acuerdos de entrega en Suiza. Así que hay un poco más detrás de tener oro tokenizado que simplemente guardar un token en tu billetera. Ahora, mirando el gráfico de 4 horas, XAUT cotiza alrededor de los 3.838,24 $ y el panorama a corto plazo no parece muy sólido. El precio se sitúa por debajo de la EMA7 en 3.858,90 $, la EMA14 en 3.883 $ y la EMA28 en 3.926,17 $. El RSI6 está alrededor de 20,23, lo que muestra una fuerte presión vendedora, mientras que el MACD sigue siendo negativo. El nivel de 3.805 $ es el soporte al que le estoy siguiendo la pista. Si los compradores entran en esta zona, podríamos ver algo de recuperación. Pero no quiero hablar de un cambio de tendencia hasta que el precio empiece a moverse de nuevo por encima de las EMAs. Personalmente, sigo encontrando que XAUT es una forma interesante de obtener exposición al oro a través de blockchain. Pero no me fijaría solo en el respaldo en oro al evaluarlo. La oferta, la liquidez y el proceso real de canje de oro físico importan igual de mucho. Esa es la parte a la que creo que los inversores deberían prestar más atención. $XAUTUSDT #ByXIMPACT

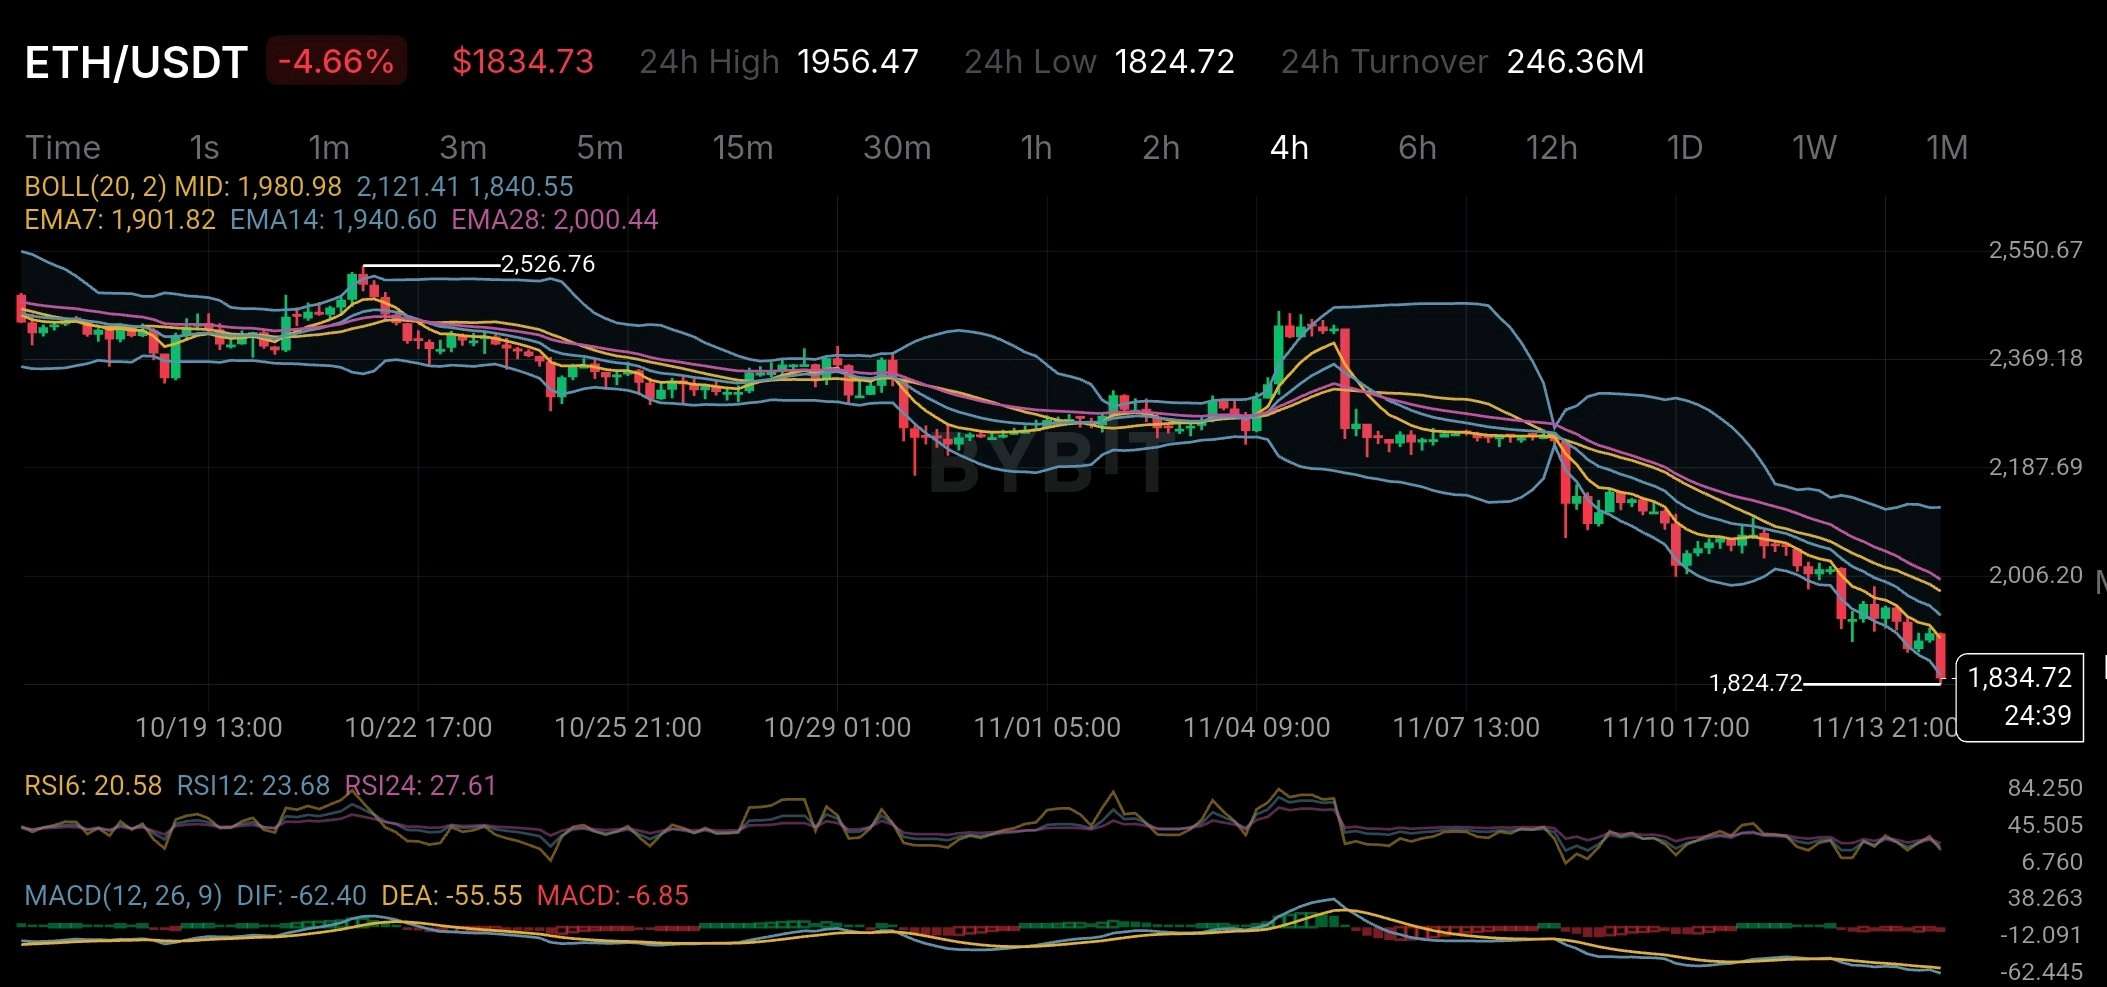
Ethereum parece estar seriamente sobrevendido en el gráfico de 4 horas. Pero hay algo con lo que los traders deberían tener cuidado antes de cantar victoria sobre un suelo. ETH cotiza alrededor de los 1.834 $ y la tendencia general sigue apuntando a la baja. Fíjate en las medias móviles. La EMA 7 está en 1.901 $, mientras que la EMA 14 se sitúa en 1.940 $ y la EMA 28 ronda los 2.000 $. El precio está por debajo de las tres. Esto demuestra que los vendedores siguen teniendo el control y el mercado aún no nos ha dado una señal clara de reversión de tendencia. Pero hay una parte interesante en el gráfico. El RSI 6 ha caído a 20,58, mientras que el RSI 12 está en 23,68 y el RSI 24 en 27,61. Los tres están por debajo de 30. Eso nos indica que la venta ha sido bastante agresiva. A estos niveles, un rebote a corto plazo no sería sorprendente. Sin embargo, estar sobrevendido no significa que el precio tenga que revertirse inmediatamente. El MACD también sigue siendo negativo. El DIF está en -62,40 mientras que el DEA está en -55,55. Así que, por ahora, el impulso sigue siendo débil. Hay otra faceta de Ethereum que merece atención. A menudo se describe a ETH como un activo deflacionario porque las comisiones por transacción se queman a través del mecanismo EIP-1559. Pero eso no significa que su oferta esté siempre reduciéndose. Según las últimas cifras disponibles para el 14 de noviembre, se emitieron aproximadamente 89.721 ETH en los últimos 30 días, mientras que solo se quemaron 2.934 ETH. Esto resultó en una emisión neta de alrededor de 86.787 ETH. Es una diferencia importante. Ethereum quema ETH cuando los usuarios pagan las comisiones base. Pero cuando la actividad de la red es baja, se queman menos comisiones mientras que las recompensas de los validadores siguen añadiendo nuevos ETH a la circulación. Esto significa que la historia deflacionaria de Ethereum depende en gran medida de la demanda de la red. Un ecosistema en crecimiento no hace automáticamente que ETH sea deflacionario. Volviendo al gráfico, ETH también cotiza cerca de la banda inferior de Bollinger, alrededor de 1.840 $. El mínimo reciente de 1.824,72 $ es otro nivel que merece la pena vigilar. Un movimiento por encima de 1.901 $ podría ser la primera señal de mejora en el impulso. Más allá de eso, el rango de 1.940 $ a 2.000 $ sigue siendo una zona de resistencia importante. Por ahora, estoy observando tanto la acción del precio como la dinámica de la oferta. ETH puede estar sobrevendido, pero la gran pregunta es si la demanda compradora puede volver con la suficiente fuerza como para cambiar la tendencia. $ETHUSDT #ByXIMPACT

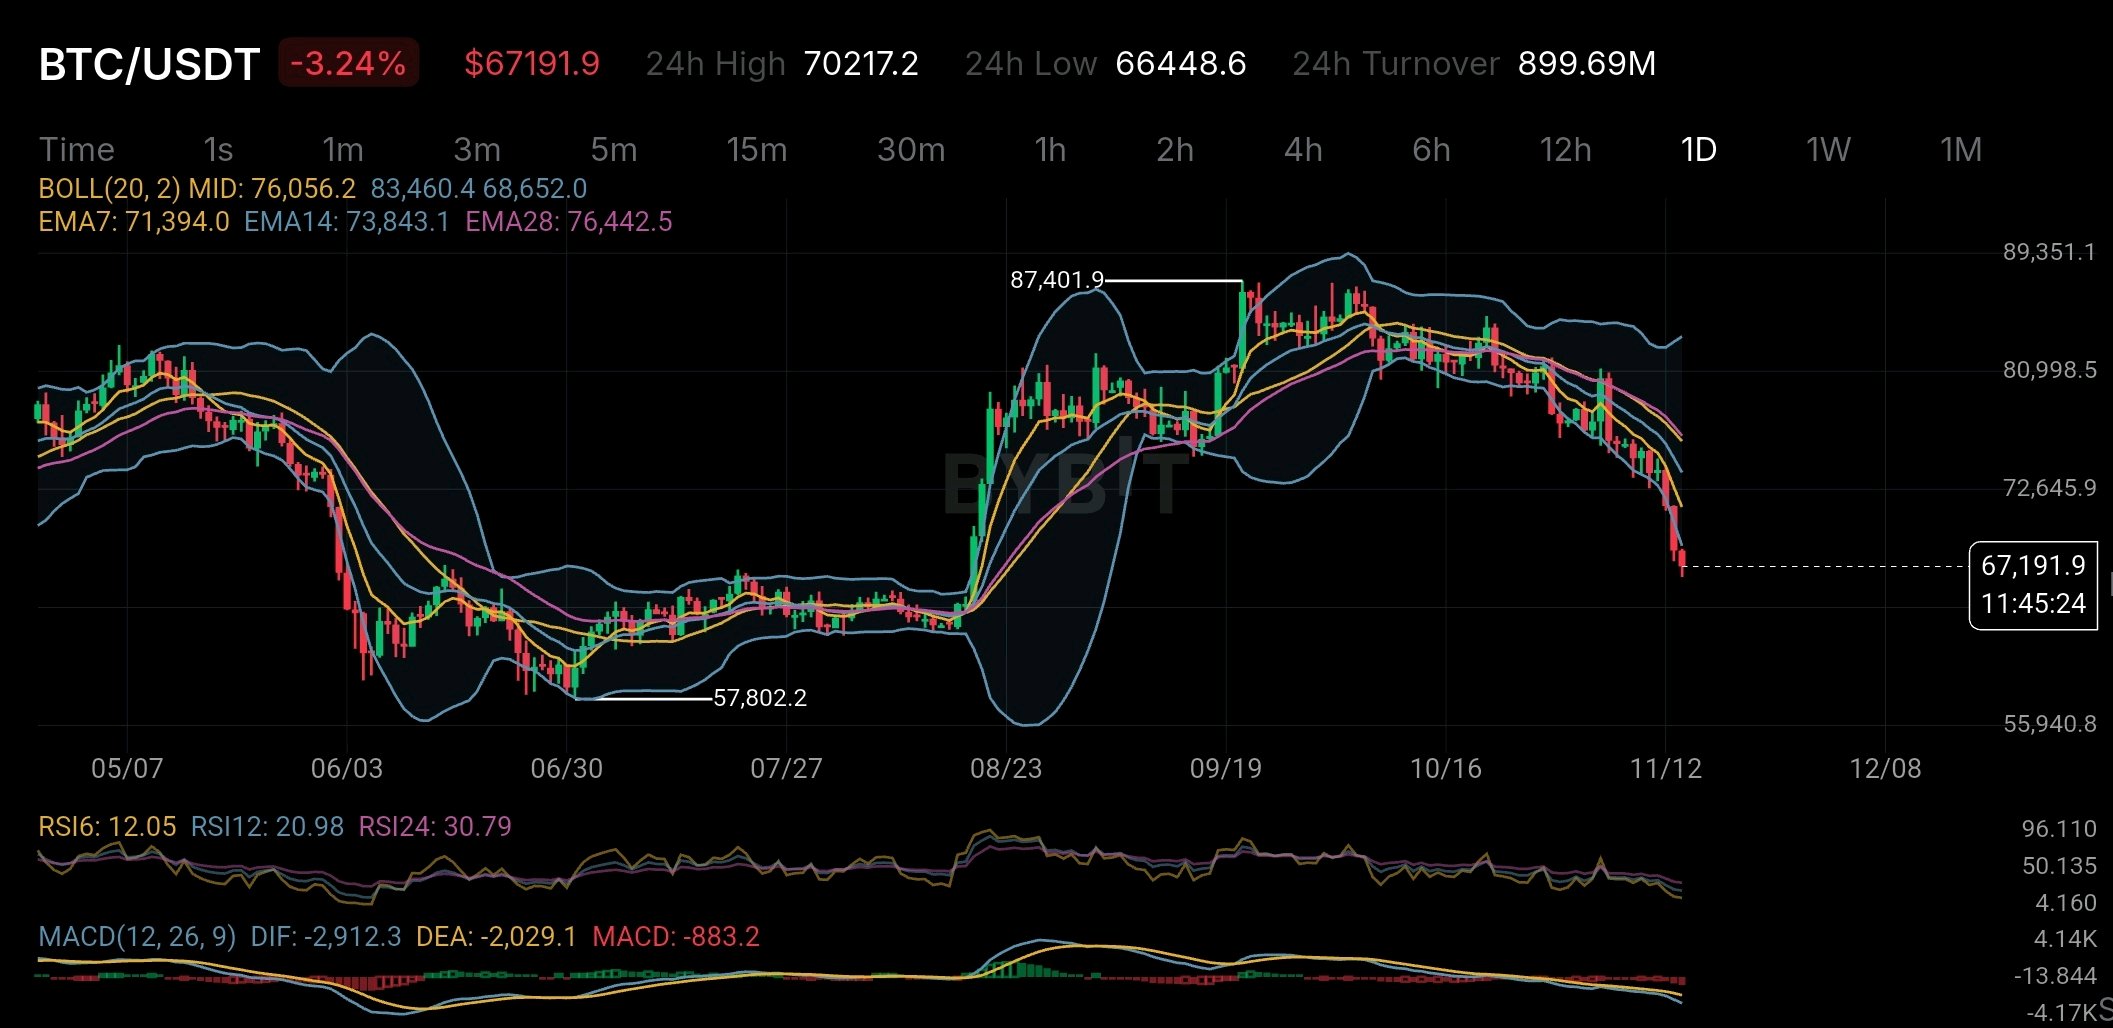
Bitcoin está ahora mismo en una situación de sobreventa profunda, pero eso no significa necesariamente que hayamos tocado fondo. BTC cotiza alrededor de los 67.191 $, con una caída de más del 3 % en el día. Lo que me ha llamado la atención no es solo la bajada del precio, sino lo débiles que se han vuelto los indicadores diarios. Las lecturas del RSI son inusualmente bajas. El RSI(6) se sitúa en 12,05; el RSI(12) en 20,98 y el RSI(24) en 30,79. Estos niveles sugieren que los vendedores han tenido el control durante bastante tiempo. Pero aquí es donde la cosa se pone interesante. Muchos traders ven un RSI sobrevendido e inmediatamente empiezan a buscar una oportunidad de compra. El problema es que las condiciones de sobreventa pueden durar mucho más de lo esperado, especialmente cuando la tendencia general sigue apuntando a la baja. Y el gráfico actual de Bitcoin no muestra mucha fuerza. El precio cotiza por debajo de las tres medias móviles exponenciales: EMA7: 71.394 $ EMA14: 73.843 $ EMA28: 76.442 $ Esto nos indica que el impulso a corto, medio y largo plazo está bajo presión. El MACD tampoco ofrece mucho consuelo. Tanto el DIF como la DEA permanecen en territorio negativo, mientras que el histograma también es negativo. Otro nivel importante a vigilar es el punto medio de las Bandas de Bollinger, situado en torno a los 76.056 $. BTC cotiza considerablemente por debajo, lo que demuestra lo mucho que se ha alejado el precio de su promedio reciente. Aun así, no descartaría un rebote de alivio. Cuando la venta se vuelve tan agresiva, son posibles las recuperaciones a corto plazo. Pero un rebote por sí solo no significa que la tendencia haya cambiado. Vale la pena vigilar el mínimo reciente en torno a los 66.448 $. Si los compradores logran defender esta zona, BTC podría intentar una recuperación. Si ese soporte falla, no se puede ignorar una mayor presión a la baja. Por ahora, me interesa más ver la entrada de los compradores que intentar predecir un suelo exacto. Una cosa está clara: Bitcoin está profundamente sobrevendido, pero la tendencia general sigue siendo débil. A veces, la parte más difícil del trading no es encontrar una buena entrada, sino saber diferenciar entre un mercado en caída y un mercado que finalmente está listo para recuperarse. $BTCUSDT #ByXIMPACT #WSOTMuestraTuOperaciónConIAParaGanar10USDT #WSOT2026

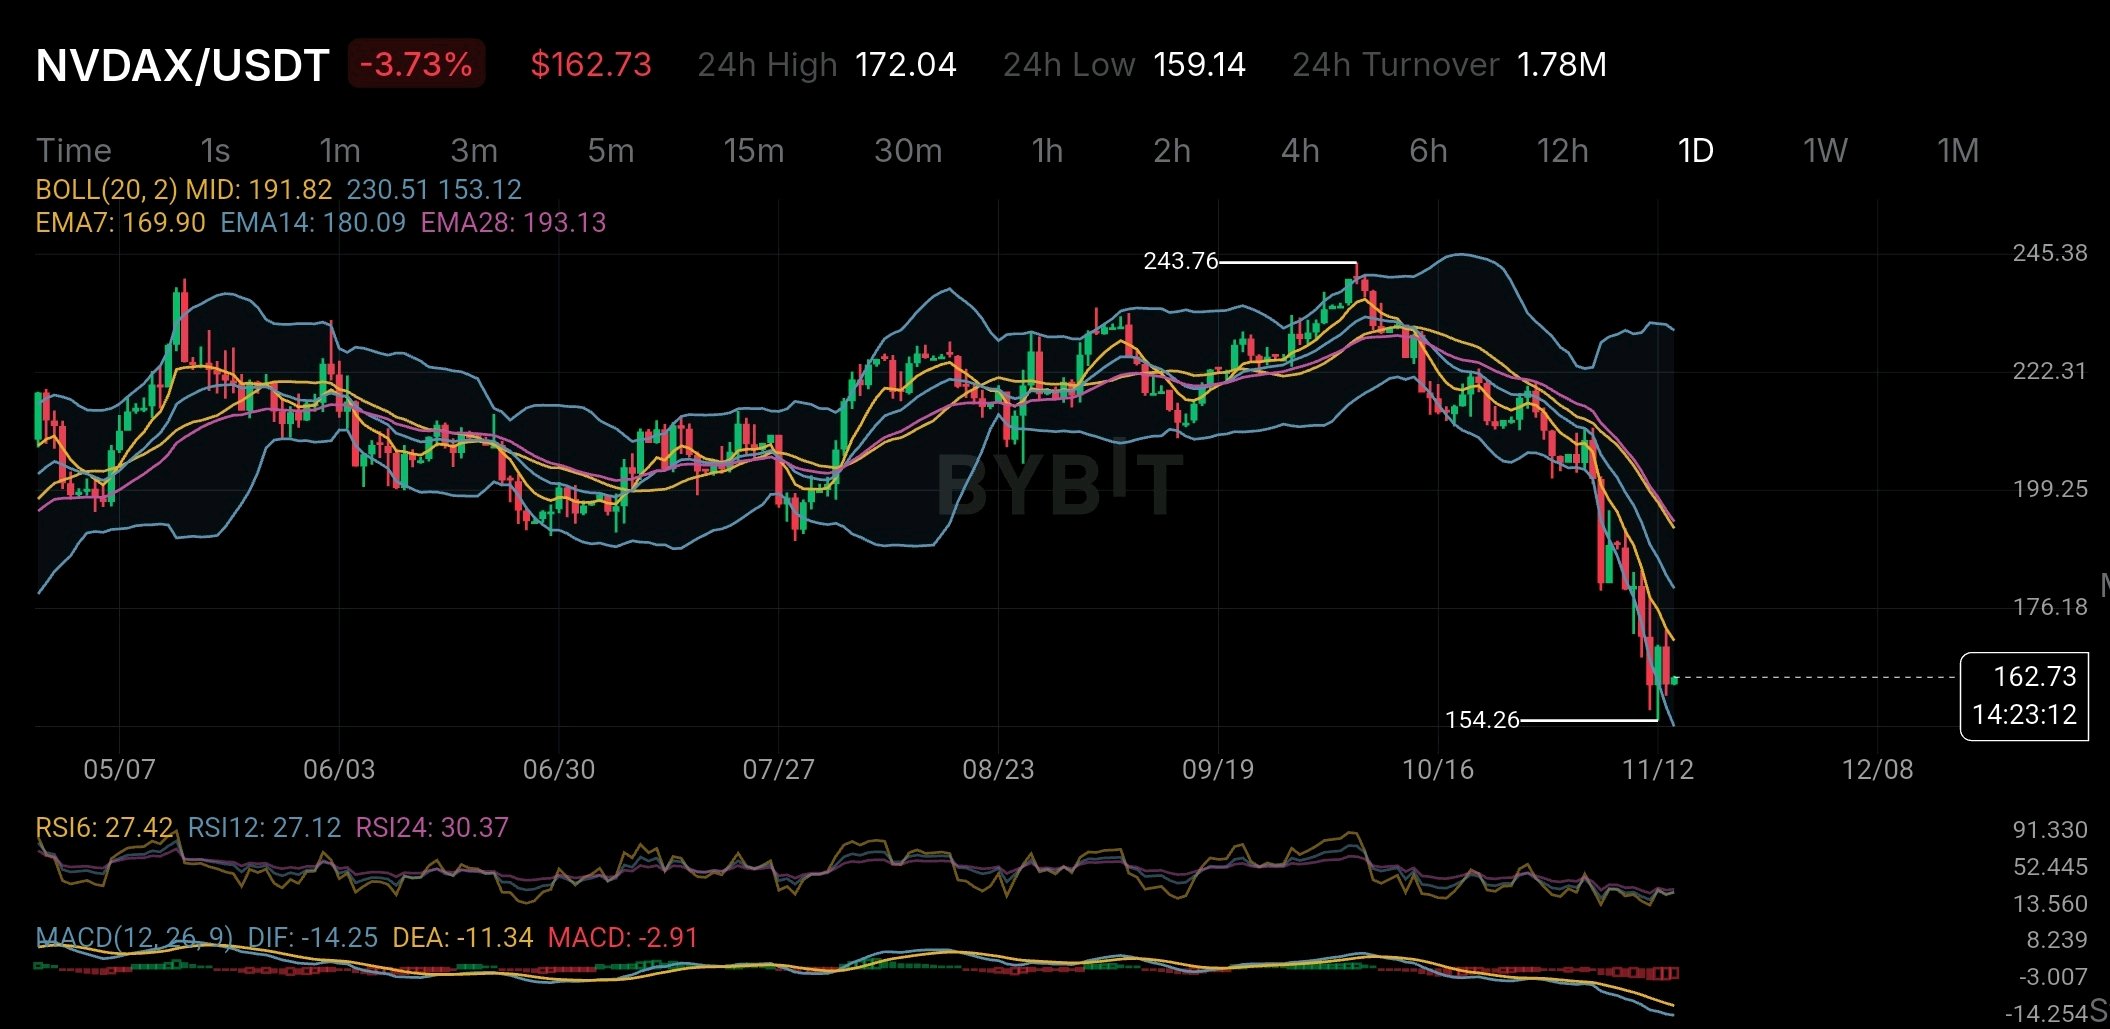
NVDAX is falling sharply but there is something about this token that many traders may not fully understand. At $162.73 NVDAX is down 3.73% on the daily chart. RSI6 is at 27.42 while RSI12 is at 27.12. Both readings show strong selling pressure. Price is also below all three major EMAs. EMA7 is at $169.90 EMA14 at $180.09 and EMA28 at $193.13. The chart looks weak. But the bigger story is not just about the price. NVDAX is a tokenized version of NVIDIA stock issued through Backed Finance. It is designed to follow NVIDIA's share price and is intended to be backed 1:1 by actual NVIDIA shares held in custody. Sounds simple. But there is an important difference. Buying NVDAX does not mean you own NVIDIA shares. According to Bybit's official xStocks terms holders do not receive shareholder voting rights or direct ownership of the company. They also do not receive dividends directly. Any dividend value may instead be reflected through an adjustment to the token's multiplier. There is another detail worth understanding. Bybit provides the trading platform but it does not issue or hold the underlying shares. The tokens are issued and redeemed by Backed Finance. Bybit also clearly states that it does not guarantee redemption liquidity or fair market pricing. It also says it does not independently verify or monitor the underlying collateral. This creates an important difference between owning a traditional NVIDIA share and holding NVDAX. You get exposure to NVIDIA's price through a blockchain-based token but you also take on issuer and custody risks. Now look at the chart again. NVDAX has fallen close to its recent low of $154.26. The price is also near the lower Bollinger Band at $153.12. A short-term bounce is possible but the negative MACD and downward EMA structure suggest that sellers are still in control. The $154 area is worth watching. A break below it could bring more selling pressure while a recovery above $170 would be an early sign of improving momentum. NVDAX offers an interesting way to access traditional stocks through crypto markets. But investors should remember one thing: Getting exposure to a company's share price and actually owning its shares are two very different things. $NVDAXUSDT #ByXIMPACT

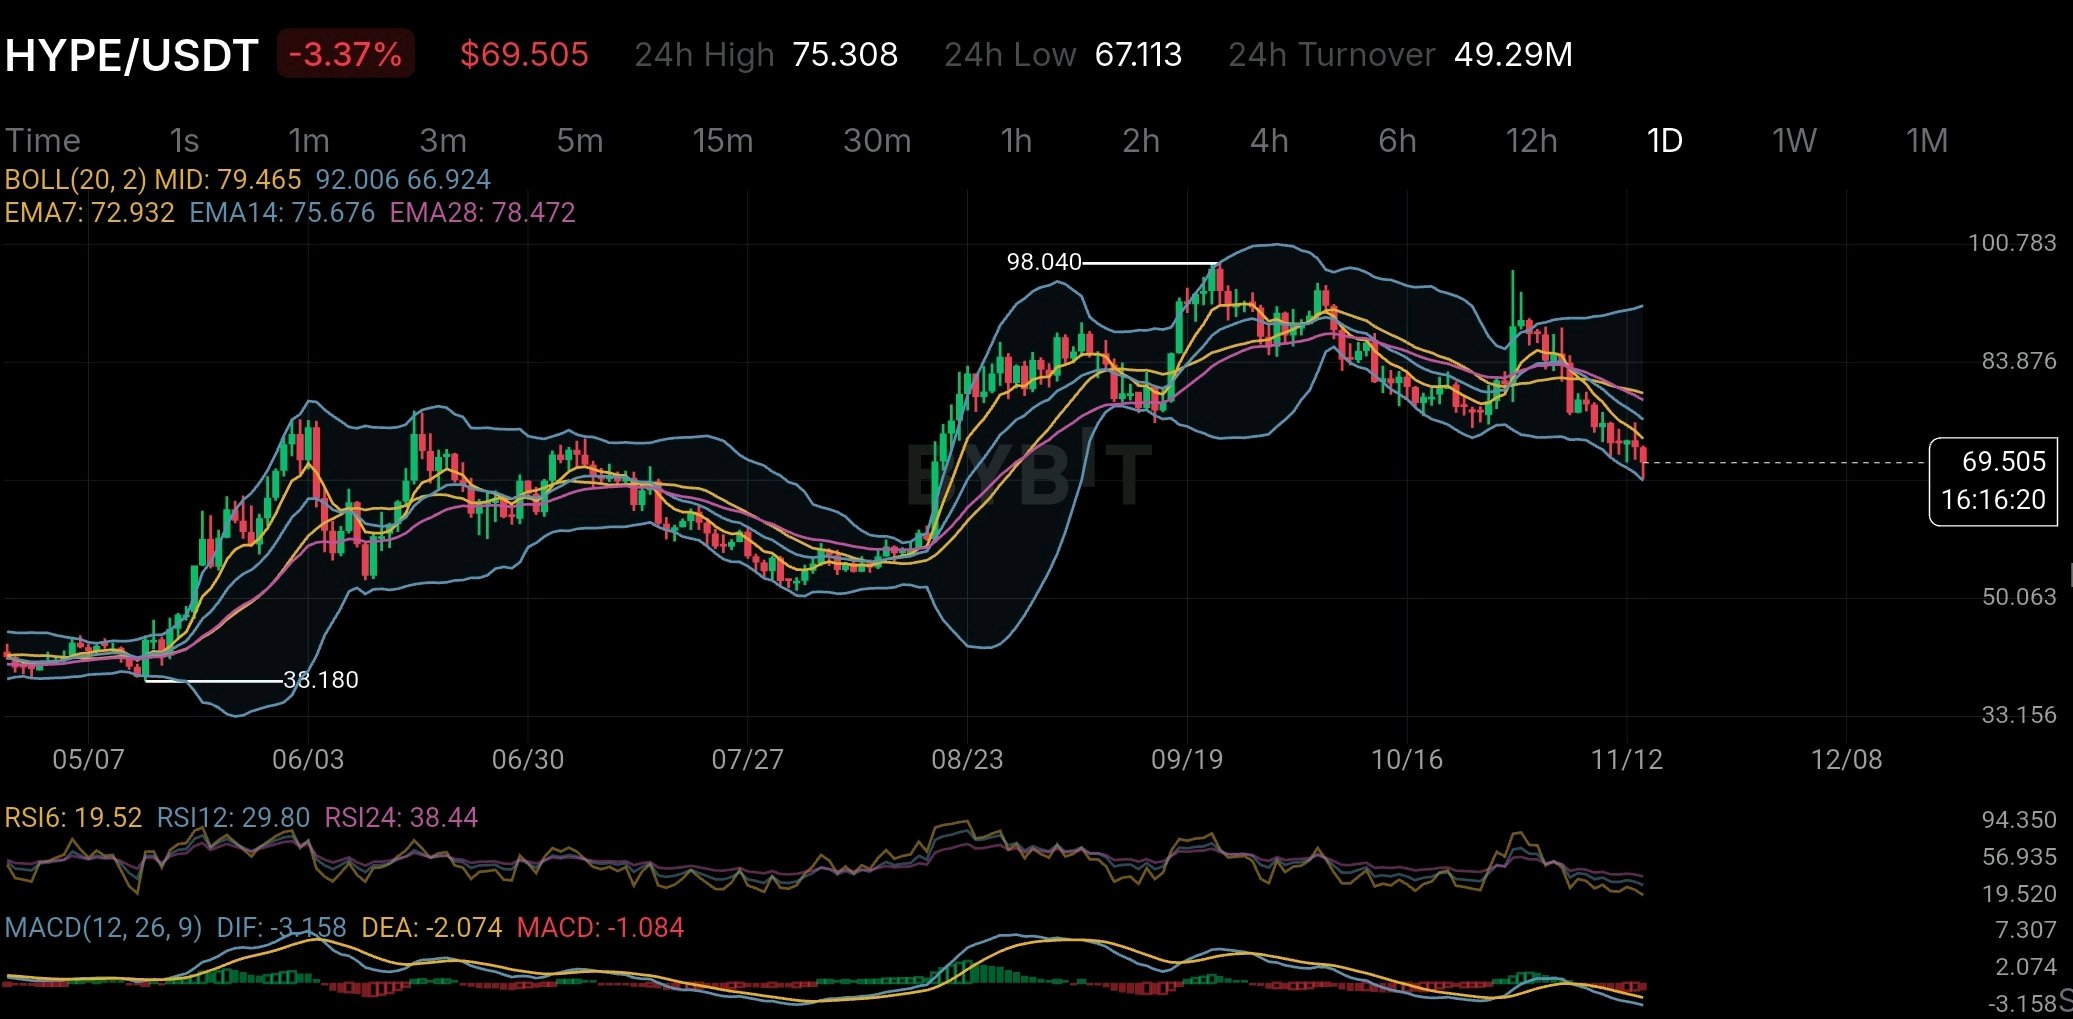
HYPE has already removed nearly 50 million tokens from circulation through its buyback mechanism. Yet there is another supply factor that investors should not ignore. The real question is whether HYPE's token burns can keep pace with the supply that has yet to enter the market. Hyperliquid has one of the more interesting token economics models in the crypto market. According to its November 2026 investor disclosures approximately 99% of protocol fees are directed toward the Assistance Fund. That fund purchases HYPE directly from the open market and permanently removes acquired tokens from circulation. The disclosed buybacks had reached approximately 48.3 million HYPE by October 28 2026. That is a meaningful amount. It creates a direct connection between trading activity and token demand. When the exchange generates more fees the mechanism has more capital available to purchase HYPE. But here is the part that deserves more attention. HYPE originally had a maximum supply of 1 billion tokens. Even after accounting for approximately 50 million tokens removed through buybacks and network fee burns the remaining supply structure still contains substantial future distribution. The November disclosures show approximately 410 million HYPE allocated to future emissions and community rewards and another 61 million allocated to the Hyper Foundation. There are also 238 million tokens allocated to core contributors. This creates an interesting contradiction. HYPE has a genuine mechanism that creates recurring market demand and reduces available supply. However the long-term supply picture cannot be understood by looking at burns alone. The pace of future emissions matters just as much. If protocol revenue continues growing the buyback mechanism could become an important structural advantage. But if emissions and unlocked allocations grow faster than actual demand the positive effect of those purchases could become less significant. The chart is also showing a different side of the story. HYPE is trading around $69.50 on the daily timeframe after falling from the September high near $98. Price is below EMA 7 at $72.93 EMA 14 at $75.67 and EMA 28 at $78.47. Daily RSI 6 is near 19.52 which indicates heavily oversold short-term momentum. That makes the current weakness interesting but it does not confirm a reversal. Sellers still have control of the visible trend. For me the most important metric to watch is not simply how many HYPE tokens get burned. It is whether real protocol revenue can consistently absorb the supply entering circulation. A strong buyback mechanism can support a token's economics but sustainable demand must eventually do more than compensate for new supply. That is the real test for HYPE. Sources: Hyperliquid Strategies November 5 2026 disclosures and HYPE daily chart provided. $HYPEUSDT #ByXIMPACT

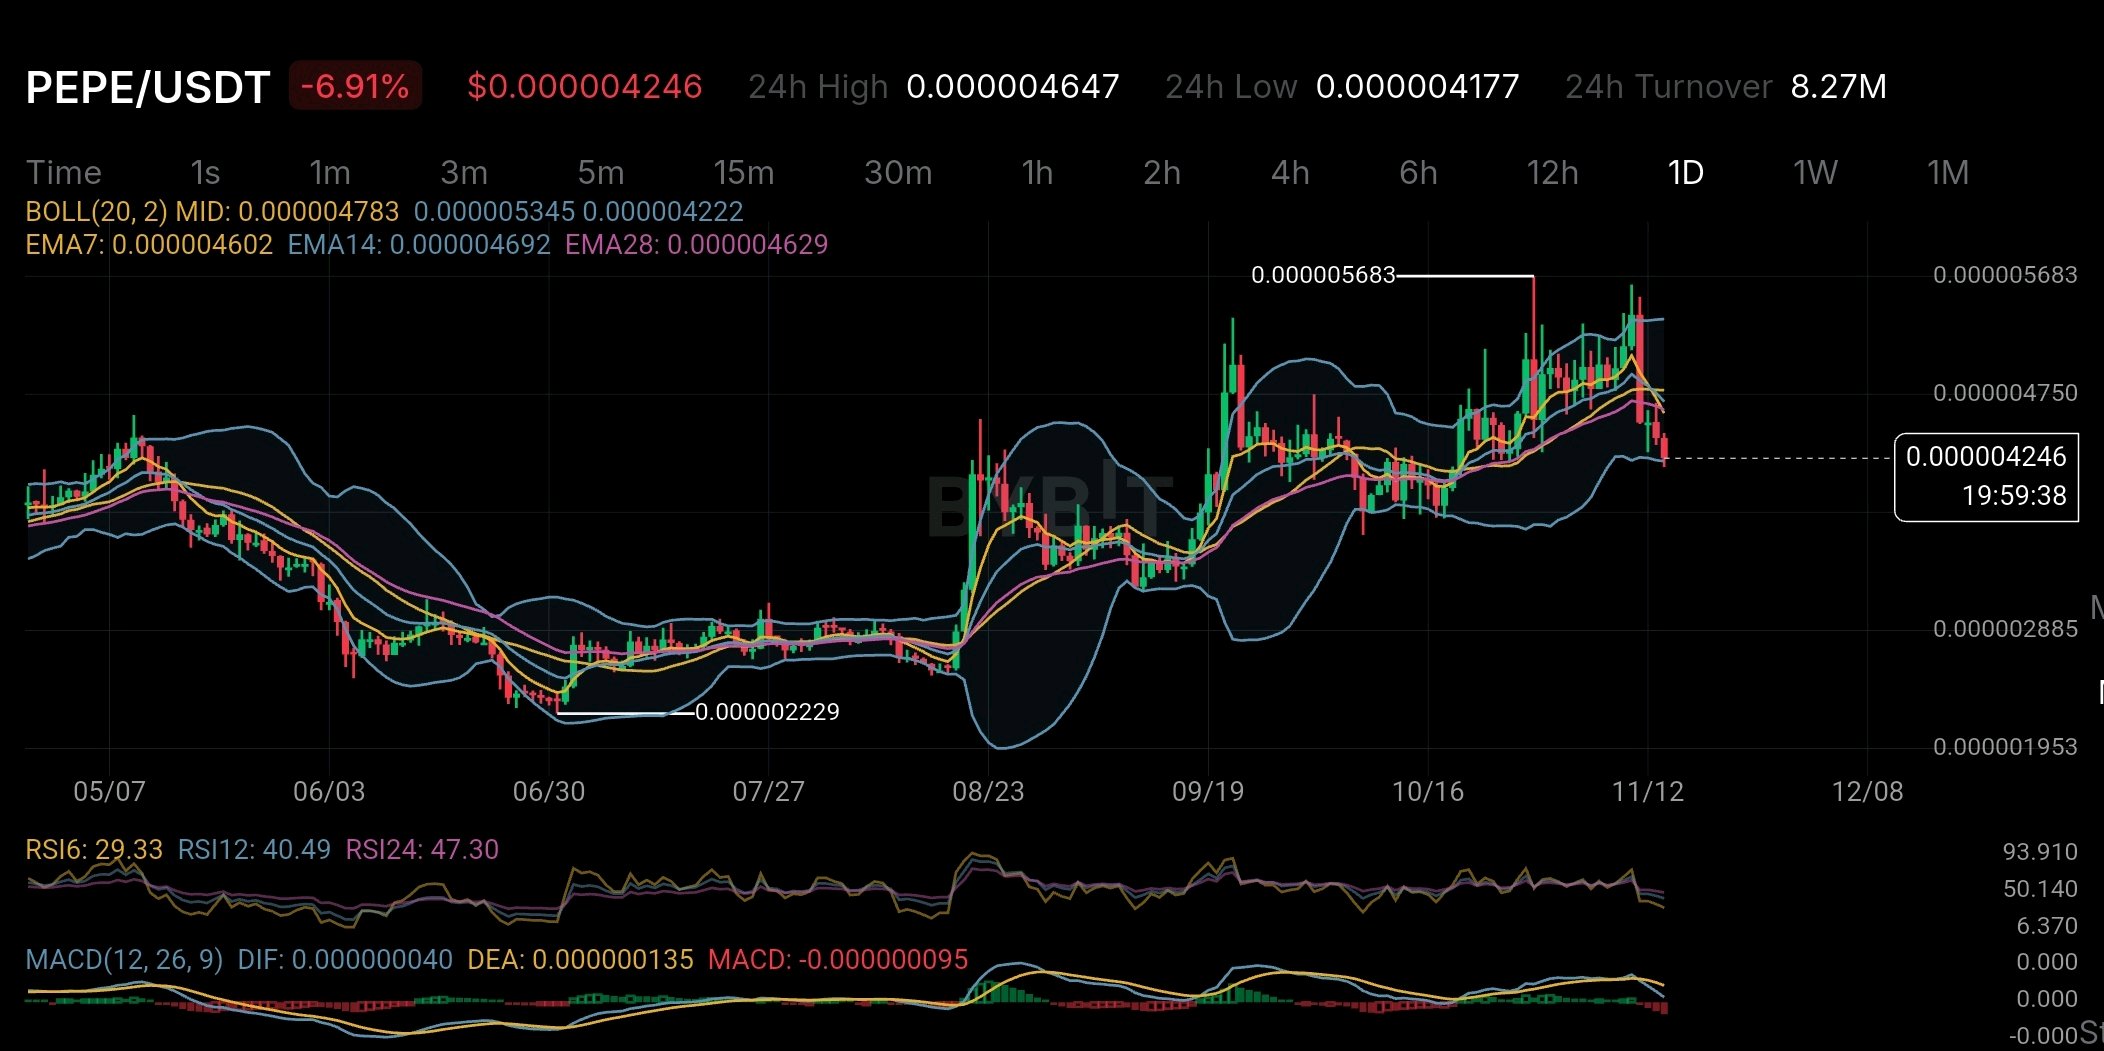
A PEPE casi no le queda presión por desbloqueos programados, pero eso no significa que su oferta esté totalmente libre de riesgo de venta. Hay un detalle importante oculto en su historial de distribución que merece más atención. Según la presentación ante la SEC de Canary Capital de abril de 2026, PEPE no tiene un calendario formal de vesting o desbloqueo, con aproximadamente el 98,4% de su oferta original ya en circulación a fecha de enero de 2026. Suena positivo, ¿verdad? Pero aquí está la parte interesante: el mismo documento informa de que las 10 direcciones de monederos más grandes poseían alrededor del 41% de la oferta en circulación. Curiosamente, 11 de las 15 direcciones principales pertenecían a exchanges, lo que significa que la concentración bruta de los monederos no representa necesariamente a 15 grandes titulares individuales. Aun así, la propiedad desconocida a través de múltiples monederos sigue siendo un riesgo real. Ahora miremos el gráfico diario. PEPE cotiza alrededor de 0,000004246 $, con una caída del 6,91%. El precio ha caído por debajo de la EMA7, EMA14 y EMA28, mientras que el RSI6 se sitúa cerca de 29,33. El MACD también se ha vuelto negativo. Esto sugiere que la presión vendedora es actualmente más fuerte, aunque el RSI bajo deja espacio para un rebote de alivio a corto plazo. La distinción clave es que PEPE no se enfrenta a un calendario tradicional de vesting y desbloqueo, pero las tenencias concentradas y la demanda impulsada por el sentimiento pueden seguir creando una seria presión vendedora. Para PEPE, la gran pregunta no es solo cuántos tokens están desbloqueados. Es quién controla la oferta que puede llegar realmente al mercado. $PEPEUSDT #ByXIMPACT

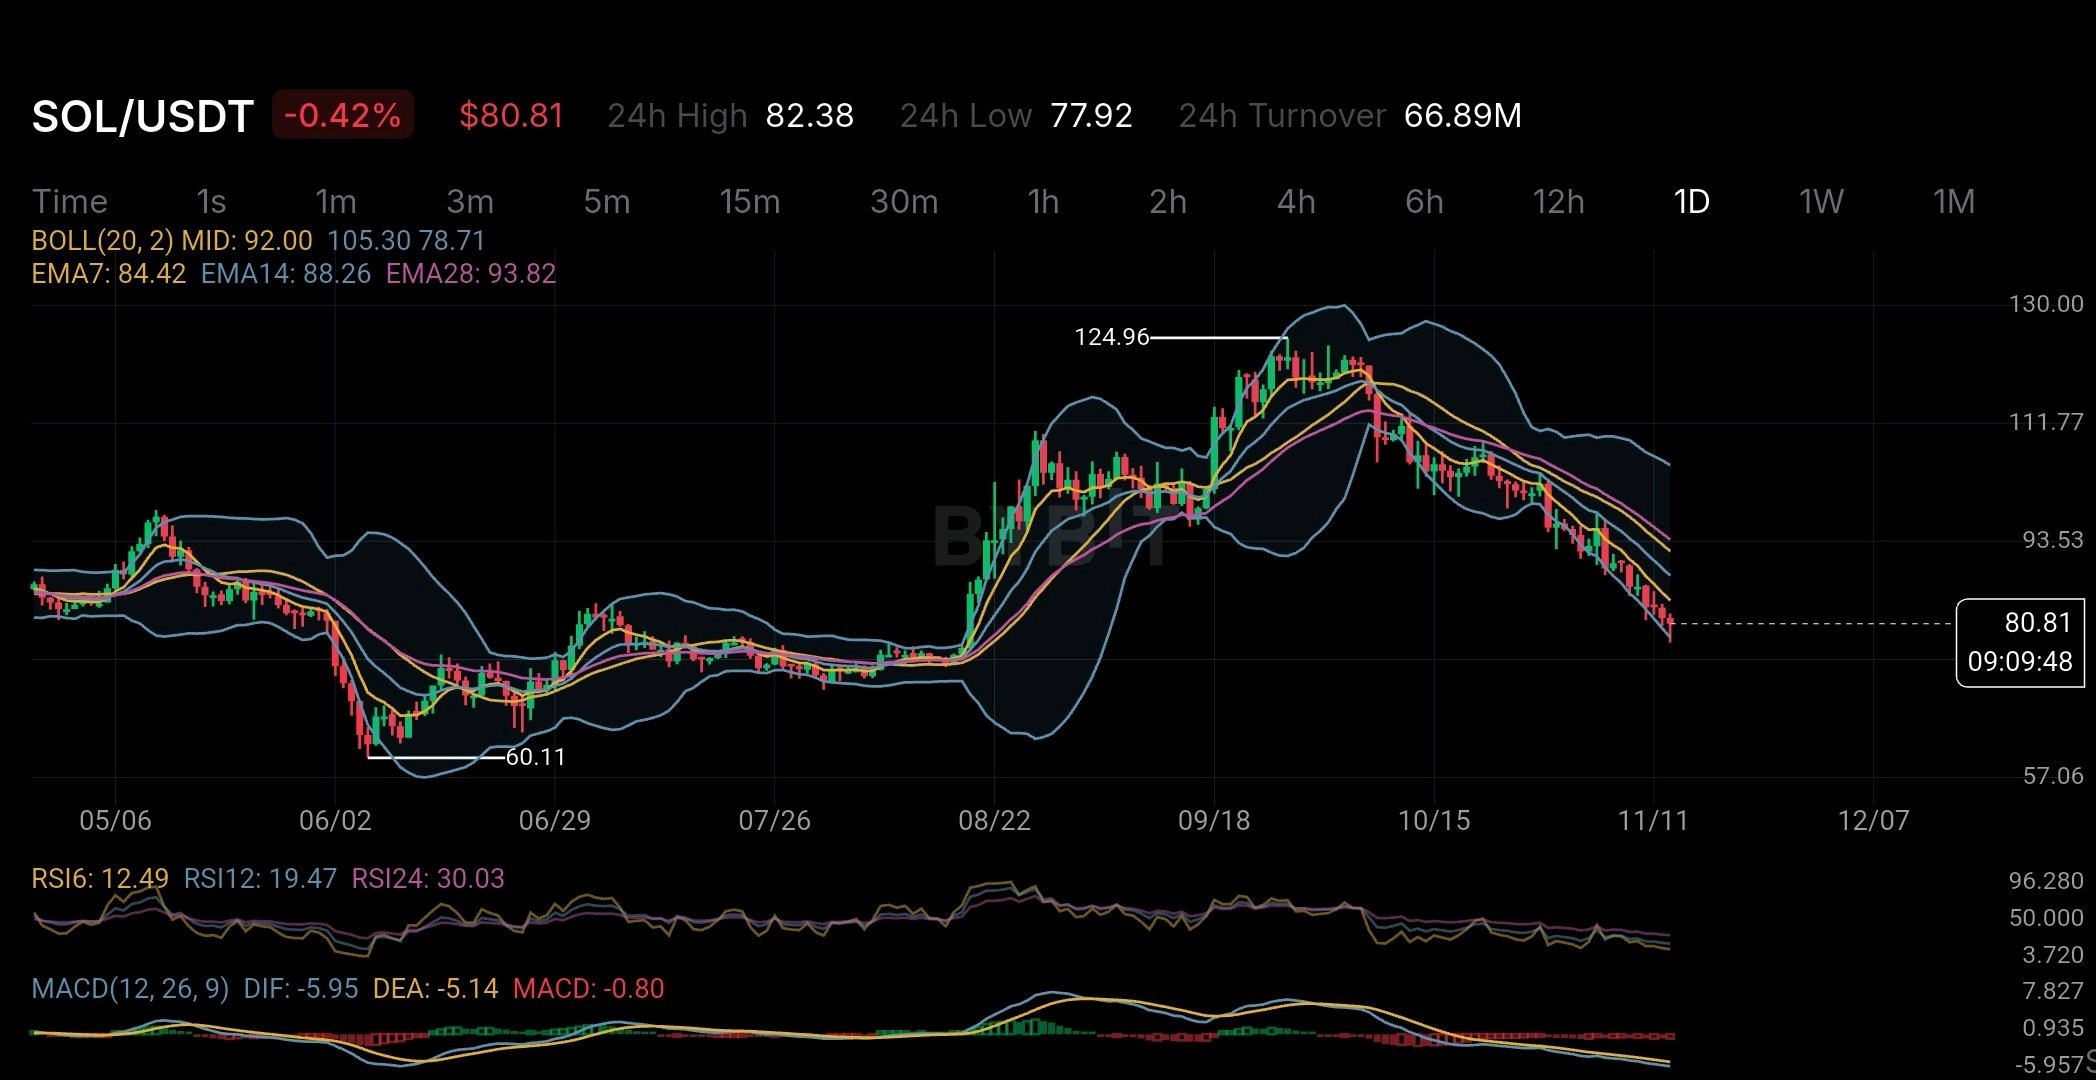
SOL parece sobrevendido ahora mismo, pero hay algo más importante sucediendo detrás de su precio que los inversores deberían entender. Alrededor de los 80,81 $, el RSI diario de SOL ha caído a 12,49. Este es un nivel muy bajo. El precio también está por debajo de las tres principales EMA: EMA7 en 84,42 $, EMA14 en 88,26 $ y EMA28 en 93,82 $. Podría producirse un rebote en el precio pronto. Pero estar sobrevendido no significa que se haya confirmado el suelo. Una cosa que hace interesante a Solana es cómo funciona su oferta de tokens. A diferencia de otros proyectos que liberan grandes cantidades de tokens en momentos determinados, SOL añade nuevos tokens regularmente mediante recompensas por staking. Estas recompensas ayudan a los validadores a mantener la red en funcionamiento y segura. Solana comenzó con una tasa de inflación anual del 8 %. Esta tasa estaba planificada para disminuir un 15 % cada año hasta alcanzar el 1,5 %. Pero algo importante ha cambiado. En agosto de 2026, Solana aprobó la SGP-0002. Este cambio aumenta la reducción anual de la inflación del 15 % al 30 %. El objetivo es alcanzar la meta de inflación del 1,5 % alrededor de 2029 en lugar de 2032. Esta es una buena noticia para los titulares a largo plazo porque entrarán menos tokens SOL nuevos al mercado con el tiempo. Pero hay otra cara de la moneda. La investigación del tercer trimestre de 2026 de Blockworks informó que se habían hecho staking de alrededor de 441,3 millones de SOL. Las recompensas por staking tuvieron un valor de aproximadamente 495 millones de dólares durante el trimestre. Casi todas estas recompensas provenían de tokens recién creados en lugar de tarifas de transacción. Esto es algo a lo que los inversores deberían prestar atención. Las recompensas por staking pueden parecer dinero gratis, pero no lo son. Cuando entran nuevos SOL en el mercado, esto puede reducir el valor de la participación de los titulares existentes si no están haciendo staking. Incluso las personas que hacen staking deben entender cuánto de su recompensa está simplemente cubriendo este efecto. Ahora veamos el gráfico de nuevo. SOL se está acercando a la zona de 78–80 $. Su banda de Bollinger inferior está alrededor de 78,71 $. El RSI muestra que la presión de venta es muy alta. Sin embargo, las EMA a la baja y el MACD negativo muestran que la tendencia general sigue siendo débil. Una recuperación es posible, pero los indicadores aún no han confirmado un cambio de tendencia. Para Solana, reducir la inflación es un buen paso. Pero el verdadero desafío es atraer a más usuarios y generar más ingresos por tarifas para que la red no tenga que depender tanto de la creación de nuevos tokens. Una blockchain se vuelve más fuerte cuando la gente la usa porque proporciona valor real, no solo porque les da recompensas. $SOLUSDT #ByXIMPACT

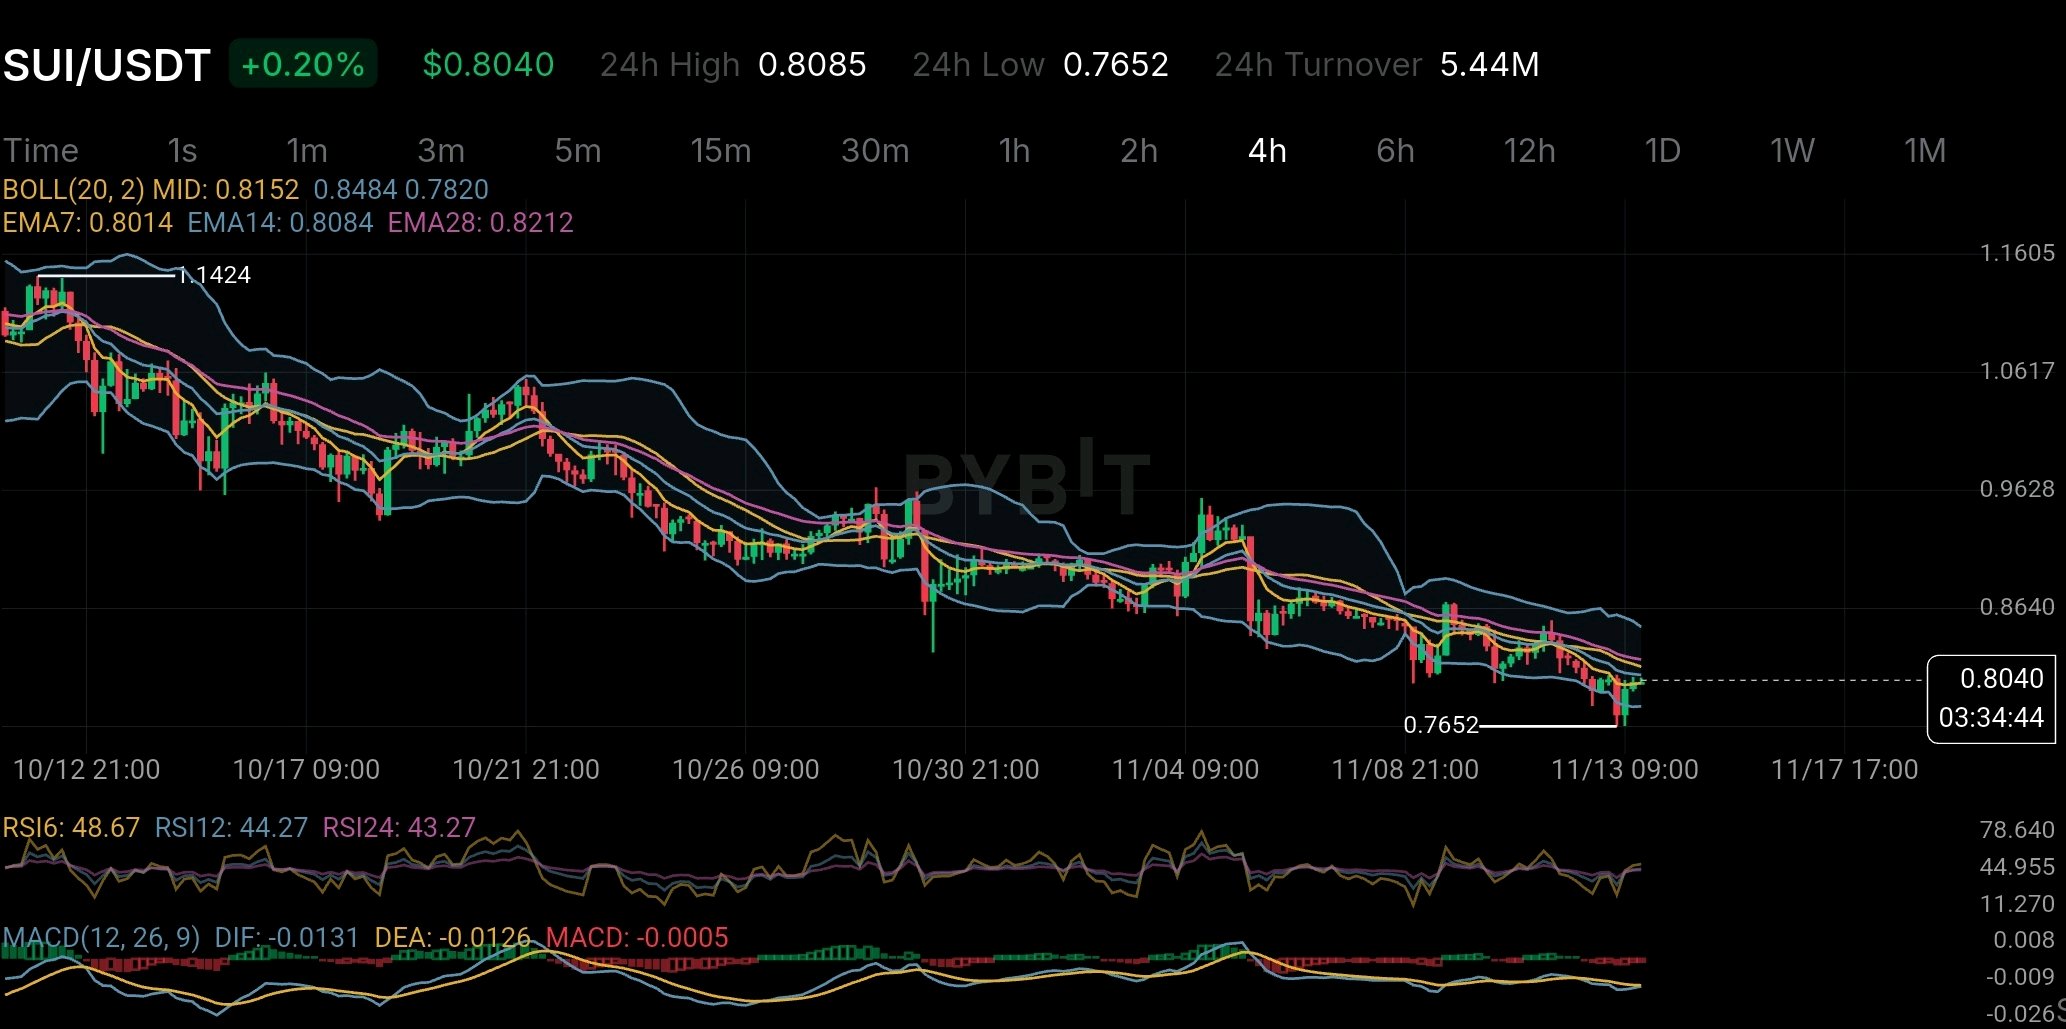
Sui está procesando casi 60 millones de transacciones al día, pero las comisiones de su red cuentan una historia sorprendentemente distinta. Ese contraste merece más atención que otra discusión sobre el precio de SUI. Según los datos del 13 de noviembre de DefiLlama, Sui registró aproximadamente 59,43 millones de transacciones en 24 horas, generando solo 2.668 dólares en comisiones de cadena. Mientras tanto, las aplicaciones de todo el ecosistema generaron alrededor de 142.283 dólares en comisiones. La distinción es importante. La arquitectura de Sui está diseñada para transacciones de alto rendimiento y bajo coste. Esa es una ventaja competitiva genuina para las aplicaciones que requieren una actividad frecuente en la cadena. Pero el volumen de transacciones por sí solo no establece valor económico. La gran pregunta es cuánta de esa actividad crea una demanda sostenible para el propio SUI. El token es necesario para el gas, el staking y la gobernanza, pero el uso de la red no se traduce automáticamente en una captura de valor proporcional del token. El gráfico añade otra preocupación. A 0,8040 dólares, SUI sigue por debajo de sus EMA de 14 y 28 periodos en el marco temporal de 4H. El RSI se está recuperando hacia niveles neutrales, pero el MACD sigue ligeramente negativo. Así que hay dos cosas distintas a observar: si la actividad de la red se vuelve económicamente significativa y si los compradores pueden recuperar las medias móviles en descenso. Puede que Sui esté ganando la batalla del rendimiento. La prueba a largo plazo es si ese éxito se traduce en una demanda económica más fuerte para su token nativo. $SUIUSDT #IMPACTbyTrade

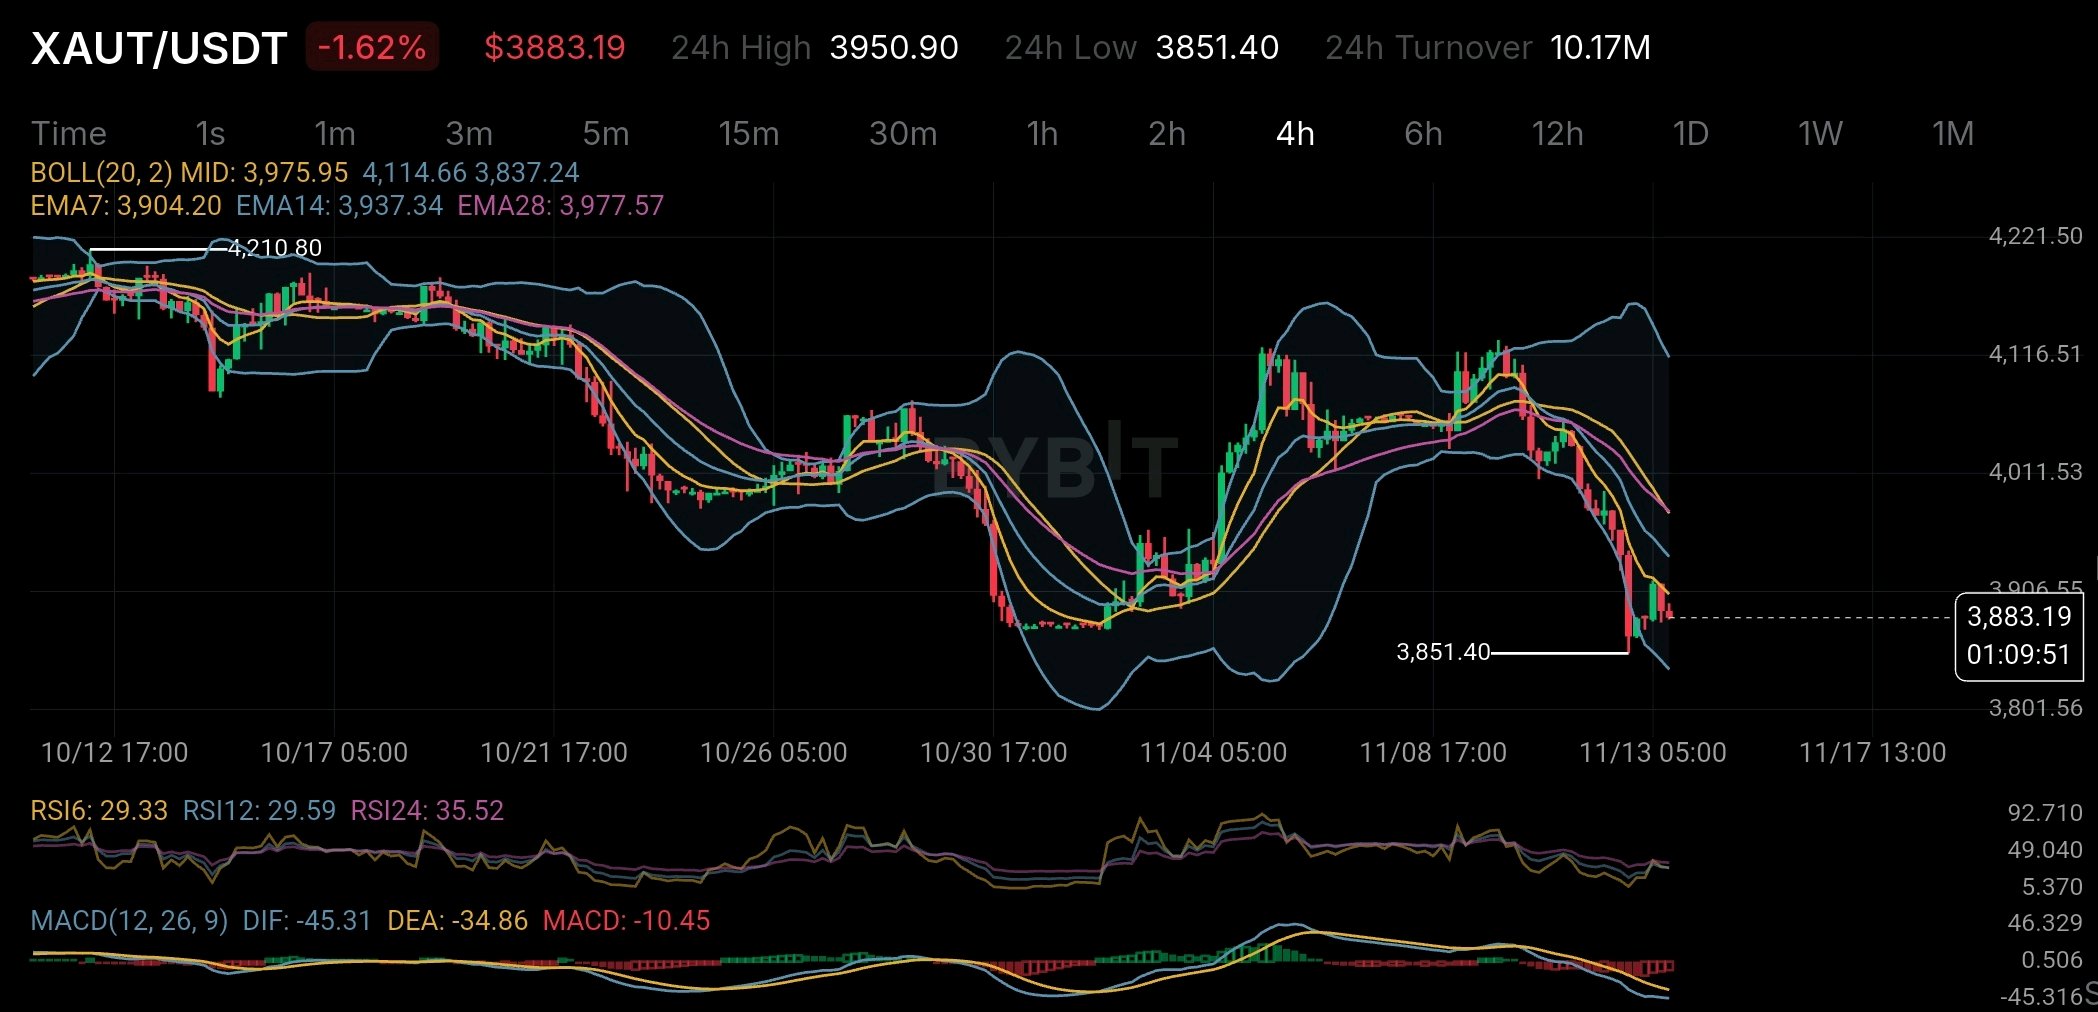
He estado observando XAUT y algo me llamó la atención más allá de la reciente acción del precio. El informe de reservas de Tether Gold del 30 de septiembre de 2026 mostró 827.417,63 XAUT respaldados por exactamente 827.417,63 onzas troy finas de oro físico. Parece sencillo, pero hay otro detalle que vale la pena vigilar. Del total de la oferta acuñada, 709.323,66 XAUT se habían vendido, mientras que 118.093,97 tokens seguían disponibles para la venta a través de Alpha Group Commodities, una entidad relacionada. Eso es aproximadamente el 14,3% de la oferta acuñada. No estoy diciendo que esto signifique que se avecine una presión de venta. Pero sí creo que es algo que los poseedores deberían tener en cuenta. La oferta disponible importa, especialmente cuando la demanda empieza a cambiar. En cuanto a la verificación, KPMG completó recientemente una auditoría independiente de los estados financieros de 2025 del emisor, mientras que la garantía de reservas de BDO de septiembre de 2026 confirmó el respaldo en oro en esa fecha de informe. Ahora, mirando el gráfico de 4H, las cosas no son particularmente fuertes. XAUT cotiza alrededor de 3.883 $, por debajo de las tres medias móviles exponenciales (EMA): EMA7, EMA14 y EMA28. El RSI se sitúa cerca de 29 y el MACD sigue siendo negativo. El impulso es claramente bajista por ahora. El RSI sugiere condiciones de sobreventa, pero eso por sí solo no es suficiente para predecir una reversión. Personalmente, estaría atento a dos cosas: cómo evoluciona la demanda de oro y si la oferta disponible de XAUT se convierte en un factor. Tener oro físico respaldando un token es una cosa. Entender la dinámica de la oferta detrás de él es otra. Eso es lo que creo que merece más atención. $XAUTUSDT #IMPACTbyTrade

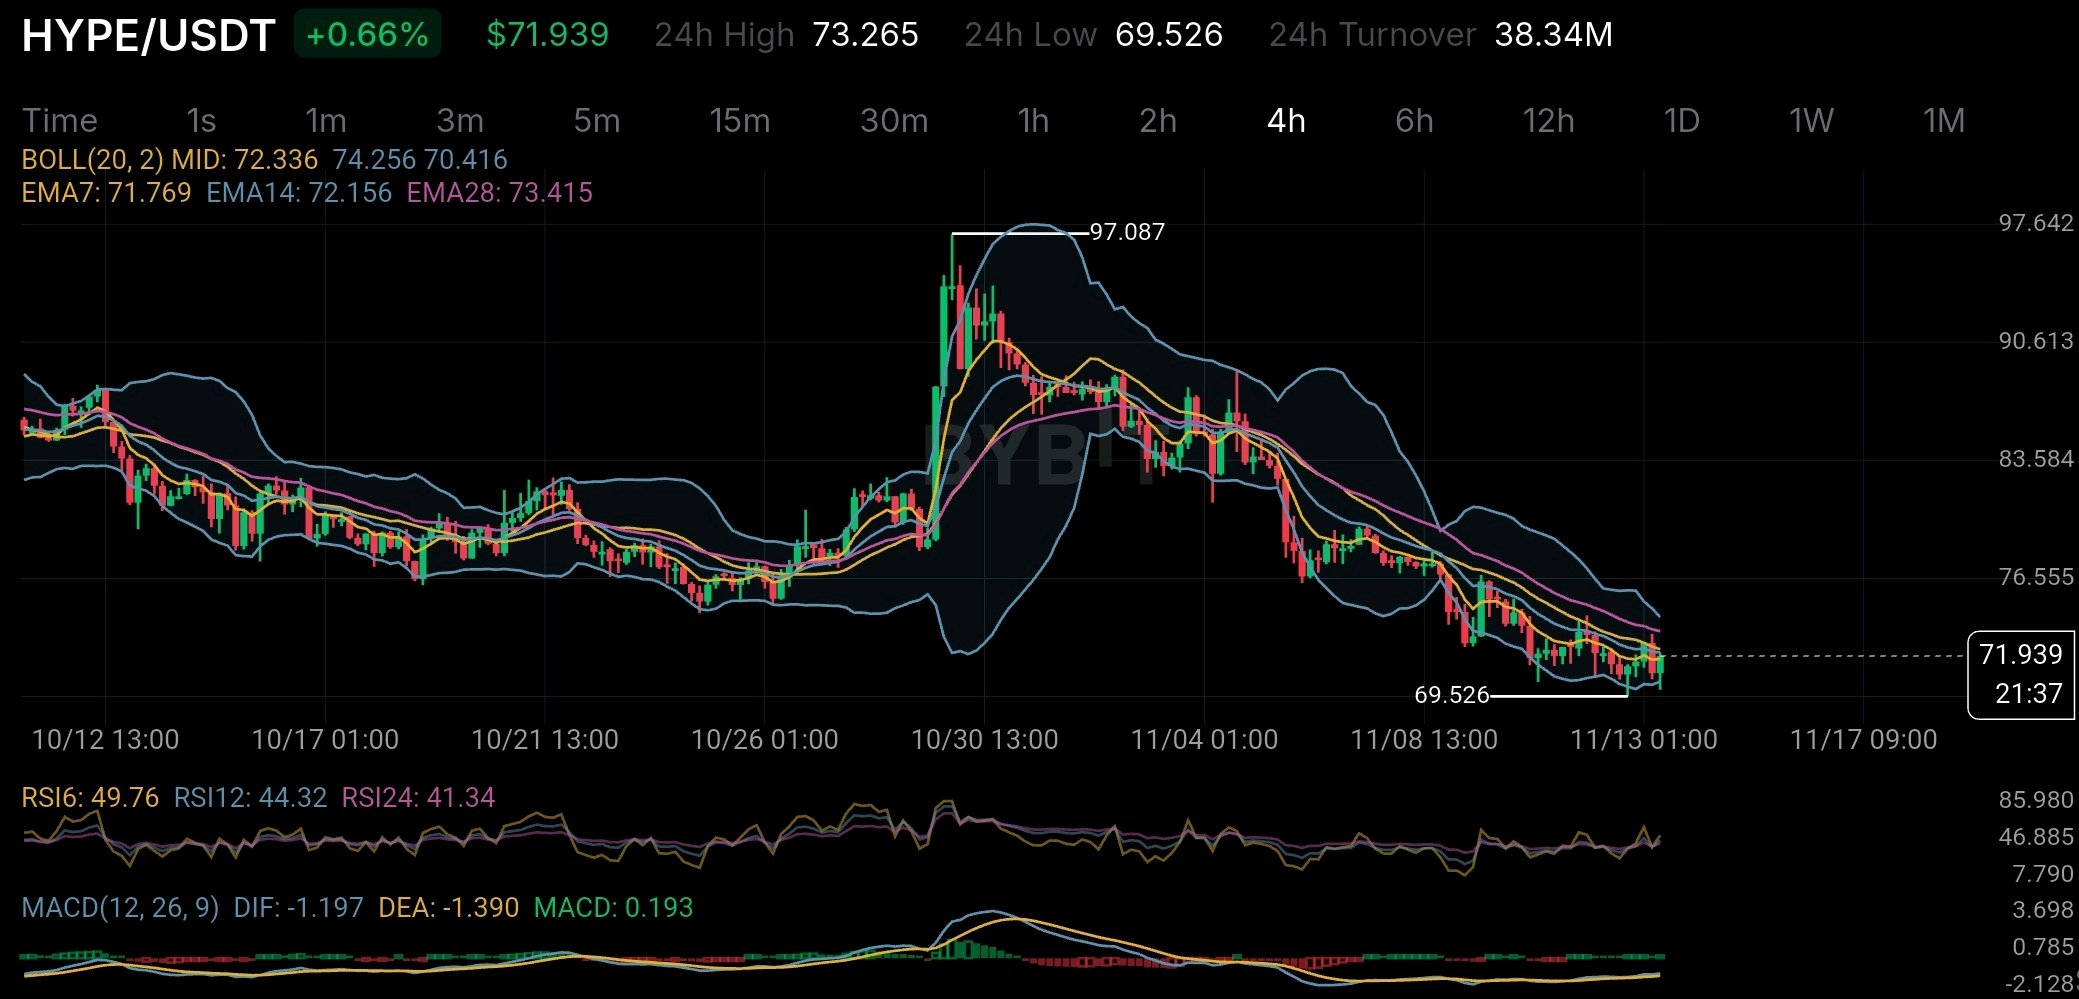
One thing I find interesting about HYPE is that its buyback and burn mechanism is actually tied to the activity happening on Hyperliquid. But there's another side of this story that I think traders shouldn't ignore. According to Hyperliquid's September 2026 SEC filing 99% of protocol fees go to the Assistance Fund which uses those funds to buy HYPE from the open market. By September 8 around 47.1 million HYPE had been permanently burned. That's roughly 4.7% of the original 1 billion supply. That's a meaningful amount and it creates a direct link between platform activity and demand for the token. More trading activity means more fees which can lead to more HYPE purchases and burns. Sounds positive right? There's just one thing worth keeping in mind. HYPE has a maximum supply of 1 billion tokens. Around 38.9% is allocated to future community emissions and rewards while another 23.8% goes to core contributors. So while the burn mechanism helps reduce supply it doesn't mean selling pressure will simply disappear. New tokens and future emissions still matter. Looking at the 4-hour chart HYPE is trading around $71.94 still below EMA14 at $72.16 and EMA28 at $73.42. The Bollinger midline is also sitting around $72.34. The recent low at $69.526 is the level I'm watching for support. There are a couple of encouraging signs. RSI is starting to recover and the MACD histogram has turned slightly positive. Selling pressure may be easing but I'm not ready to call this a trend reversal yet. My trade setup: I'm watching the $72.3–$73.4 zone for a possible bullish breakout. I would prefer to see a solid 4H candle close above this area before considering a long entry. If the breakout holds and price successfully retests this zone then $76.55 is my first upside level to watch followed by $83.58. On the other hand $69.526 is the key support. A breakdown below this level would invalidate my bullish recovery setup and make me reconsider the trade. I don't want to chase a green candle here. Confirmation matters more than trying to catch the exact bottom. Long term I think the real question is simple: can Hyperliquid generate enough economic activity to keep buyback demand ahead of new supply entering the market? Because burning tokens is one thing. Maintaining demand while emissions continue is a completely different challenge. That's what I'll be watching with HYPE. Not just the burn numbers but whether the actual business activity can support the token over time. $HYPEUSDT #IMPACTbyTrade

Bitcoin is facing a combination that deserves more attention than an oversold RSI: aggressive long liquidations and weakening institutional demand. Looking at the BTC/USDT 4-hour chart, the selling pressure is difficult to ignore. BTC is trading around $68,823, down 6.66%, after touching $67,563. The price has broken below the lower Bollinger Band at $69,738, while EMA 7, EMA 14 and EMA 28 are all sitting above the market. But the technical picture is only half the story. According to available derivatives data, Bitcoin experienced roughly $352 million in liquidations over 24 hours, with approximately $346 million coming from long positions. That's a massive imbalance. It suggests leveraged buyers were caught on the wrong side, and forced selling likely accelerated the decline. There's another detail worth watching: institutional flows. US spot Bitcoin ETFs recorded six consecutive days of net outflows through November 12, totaling approximately $1.49 billion. When leveraged traders are being forced out while ETF investors are withdrawing capital, the market loses two potential sources of buying support simultaneously. This is why I wouldn't treat an extremely low RSI as an automatic buying signal. The 4-hour RSI readings are particularly stretched: RSI 6 is 5.54, RSI 12 is 15.01 and RSI 24 is 24.78. A relief bounce wouldn't be surprising, but oversold conditions can persist during strong downtrends. For me, $67,563 is the immediate level to watch. A sustained breakdown could expose BTC to another leg of selling. On the recovery side, $70,900 and $72,100 are important EMA resistance areas. Reclaiming them would be an early sign that sellers are losing control. The bigger question is whether fresh spot demand returns after this liquidation wave. Bitcoin doesn't necessarily need more leveraged buyers right now. It needs buyers willing to absorb actual selling pressure. An oversold market can produce a bounce. But only sustained demand can build a recovery. $BTCUSDT #IMPACTbyTrade

ONDO is approaching a supply event that I think the market needs to pay more attention to. The next major token unlock is scheduled for January 18, 2027, and the amount involved is pretty significant. According to Tokenomics.com, around 1.71 billion ONDO tokens are expected to enter circulation on that date. That's 17.1% of the maximum supply and an estimated 35.1% of the current market cap. Here's what caught my attention: only around 48.7% of ONDO's 10 billion maximum supply is currently circulating. The rest is still subject to the vesting schedule. But there's more to this than just another token unlock. The upcoming distribution is allocated roughly 46.3% to the community, 38.6% to the foundation and 15.1% to private investors. That breakdown matters because unlocked tokens don't automatically mean selling pressure. Some could go toward ecosystem development, while others might eventually find their way onto exchanges. I also think there's something investors should understand about ONDO itself. According to its official documentation, ONDO is mainly a governance token for the Ondo DAO and Flux Finance. Being part of a growing real-world asset sector doesn't automatically mean token holders own the underlying tokenized assets or receive their yields. Now, looking at the chart, ONDO is trading around $0.3327 on the supplied 4-hour timeframe, down 6.75%. Price is below EMA7, EMA14 and EMA28, while RSI6 is around 16.72. That's deeply oversold in the short term, but it doesn't necessarily mean a reversal is coming. The overall structure is still showing lower highs and lower lows. There's another thing worth watching: derivatives activity is considerably higher than spot activity. CoinGlass reported roughly 3.8 times more futures volume than spot volume on November 13, alongside heavy long liquidations. My concern isn't that ONDO lacks a strong RWA narrative. It's whether demand for the token can keep up with the growing circulating supply while the market is already under pressure. An oversold RSI can lead to a bounce, but it doesn't fix a supply imbalance. For me, the real test isn't just whether buyers can defend $0.33. It's whether genuine demand can keep pace with the tokens entering circulation. $ONDOUSDT #IMPACTbyTrade