Block Best
4679Me gusta0Compartir en el chat76Aficionados71Seguir
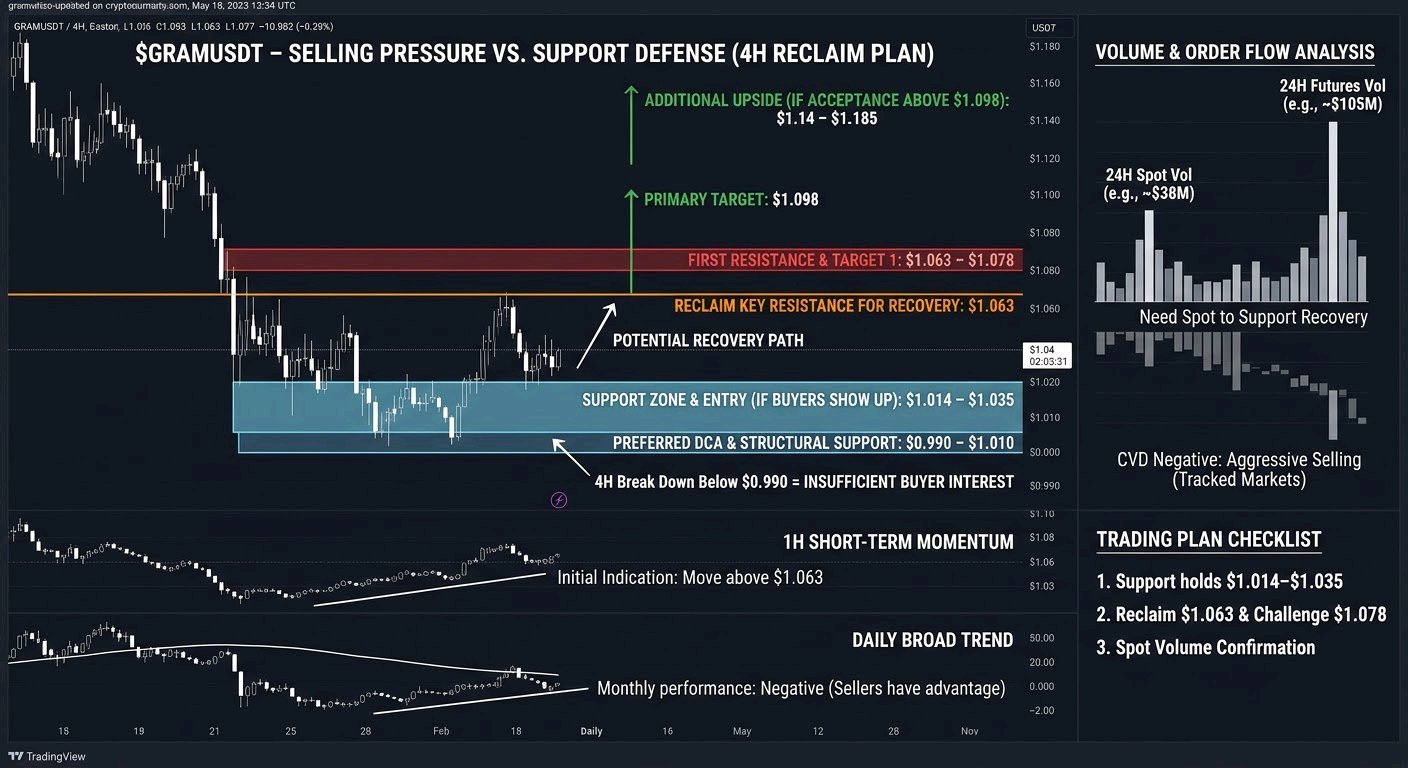
$GRAMUSDT – SELLING PRESSURE IS STILL PRESENT, BUT I'M WATCHING THE $1.06 RECLAIM FOR A POSSIBLE RECOVERY $GRAM is approaching an important decision zone, and I'm paying close attention to how price reacts around the $1.01–$1.04 support area. The market is showing mixed signals. While the 4H structure has some recovery potential, the 1H and daily trends remain under pressure. I don't want to assume a bullish reversal before buyers prove they can take control. Market Overview GRAM is trading around $1.04–$1.05, with recent price action showing continued weakness after a significant decline. On the broader timeframe, the monthly performance remains negative, suggesting that sellers still have the advantage in the bigger picture. I'm monitoring the 1H and 4H charts closely. A sustained move above $1.063 would be the first indication that short-term momentum is improving. The next important resistance sits around $1.078, followed by the $1.098–$1.14 region. Volume Analysis GRAM has maintained meaningful trading activity, with recent market data showing approximately $105M in futures volume and $38M in spot volume over 24 hours in one reported snapshot. However, trading activity alone doesn't confirm accumulation. Recent order-flow data also showed negative cumulative volume delta, indicating that aggressive selling has been outweighing buying across tracked markets. For me, the important signal will be whether spot buyers start supporting the recovery rather than relying entirely on futures activity. My Trading Plan I'm interested in a potential recovery setup, but I want confirmation before committing to a position. Initial Entry Zone: $1.014–$1.035 Preferred DCA Level: $0.990–$1.010, only if support holds and buyers show a clear reaction. First Resistance: $1.063–$1.078 Primary Target: $1.098 Additional Upside Potential: $1.14–$1.185 if momentum strengthens and price establishes acceptance above the previous resistance zones. My preferred confirmation is a strong 4H recovery followed by a successful retest. I don't want to chase a sudden green candle without evidence that buyers are taking control. What Could Go Wrong? The biggest risk is another breakdown below the $1.014 support area. If sellers push price below this level, the $0.990 region becomes an important structural support to watch. A sustained 4H breakdown below $0.990 would significantly weaken my recovery expectations and could open the door to another downward move. I also want to see improving spot demand. If futures activity increases while spot buying remains weak, any recovery could struggle to maintain momentum. Risk management remains essential. I would rather miss an entry than hold a position through a confirmed structural breakdown. My Perspective GRAM is interesting because price is approaching a major support region while trading activity remains relatively strong. However, I don't see enough confirmation to call this a confirmed bullish reversal yet. My focus is on three things: 1. Whether $1.014–$1.035 attracts genuine buying interest. 2. Whether GRAM can reclaim $1.063 and challenge $1.078. 3. Whether spot volume starts supporting upward price movement. My expectation is a possible short-term recovery if buyers defend the current support region. A move toward $1.098 and potentially $1.14 becomes more interesting after resistance is reclaimed. For now, I'm staying patient. The support reaction and the $1.063 breakout will tell me much more than simply guessing the next direction. $GRAMUSDT #IMPACTbyTrade
$NVDAXUSDT – HEAVY SELLING HAS HIT THIS TOKENIZED PLAY, AND I'M WATCHING ONE CRITICAL LEVEL Market Overview NVDAX is the tokenized tracker for NVIDIA stock, and right now it's telling a very different story than the broader crypto market. While major digital assets have been relatively stable, NVDAX has been under intense pressure, mirroring the sharp selloff in NVIDIA's underlying equity. The token dropped over 5% in a single day recently, with a 7-day decline of nearly 19%, which tells me this isn't just normal crypto volatility—this is a repricing of the equity exposure . Looking at the chart, the market structure has shifted decisively bearish. Price broke below the key $172 support level that had been holding, and that breakdown accelerated the move lower . The daily technicals are flashing strong sell signals, with price sitting below every major moving average. The 20-day EMA has crossed below the 200-day SMA, which is a structural warning sign I don't ignore . Volume Analysis The volume profile here is what really grabbed my attention. Recent sessions in the underlying NVIDIA stock saw volume roughly 3 to 4 times the normal average, which looks like capitulation-style selling rather than orderly profit-taking . On the tokenized side, 24-hour spot volume has been substantial, but the futures volume changes across exchanges have been erratic—some venues showing massive percentage swings in participation . When I see this kind of volume with a breakdown below major support, it tells me sellers are in control. I'm not interested in catching a falling knife until volume dries up and price stabilizes. My Trading Plan I'm not rushing into a long here. The structure is broken, and earnings are approaching on November 17, which adds event risk . My plan is reactive, not predictive. · Initial Entry Zone: I'm watching the $164–$166 area. This aligns with the former multi-month low from earlier in the year and represents the next logical demand zone . I want to see price stabilize here with declining sell volume before considering a position. · Preferred DCA Level: If $164 fails and price flushes toward $155–$158, I'd be interested in scaling in, but only if I see a clear rejection wick and volume divergence. That would signal exhaustion. · First Resistance: $172–$174. This is the broken support turned resistance. A reclaim of this zone would be the first sign that the immediate downtrend is losing steam . · Primary Target: $188–$190, which aligns with the gap area from the recent breakdown and prior consolidation . · Additional Upside Potential: $200–$205. That's where the broken 200 SMA and 20 EMA sit. Reclaiming that would be a real trend repair, but I'm not counting on it unless NVIDIA earnings surprise to the upside . What Could Go Wrong? The obvious risk is that this isn't a bottom—it's a pause. The daily RSI is deeply oversold, but oversold can persist in a strong downtrend, and the ADX shows a one-sided bearish trend . If $164 breaks with conviction, the next structural support is much lower, and there's little prior price action to slow it down. The bigger risk is the November 17 earnings event. If NVIDIA guides lower or cites supply constraints and data center visibility issues, NVDAX could gap down hard. I'm sizing positions accordingly and keeping stops tight. A breakdown below $155 would invalidate my entire bullish recovery thesis. My Perspective NVDAX is interesting precisely because it's uncomfortable right now. Tokenized equities like this give crypto traders direct exposure to equity volatility, and that's exactly what we're seeing. The selling has been aggressive, but aggressive selling often creates the conditions for sharp relief rallies—especially when the underlying stock is this oversold and analysts are split between calling it overdone and cutting targets. I'm not a buyer yet. I'm watching $164 to see if buyers show up. If they do, I'll take a small position with a tight stop and let the market prove itself. If they don't, I'll wait. The earnings catalyst on November 17 will likely decide the next major move, and I'd rather react to the market's verdict than guess it. #ByXIMPACT
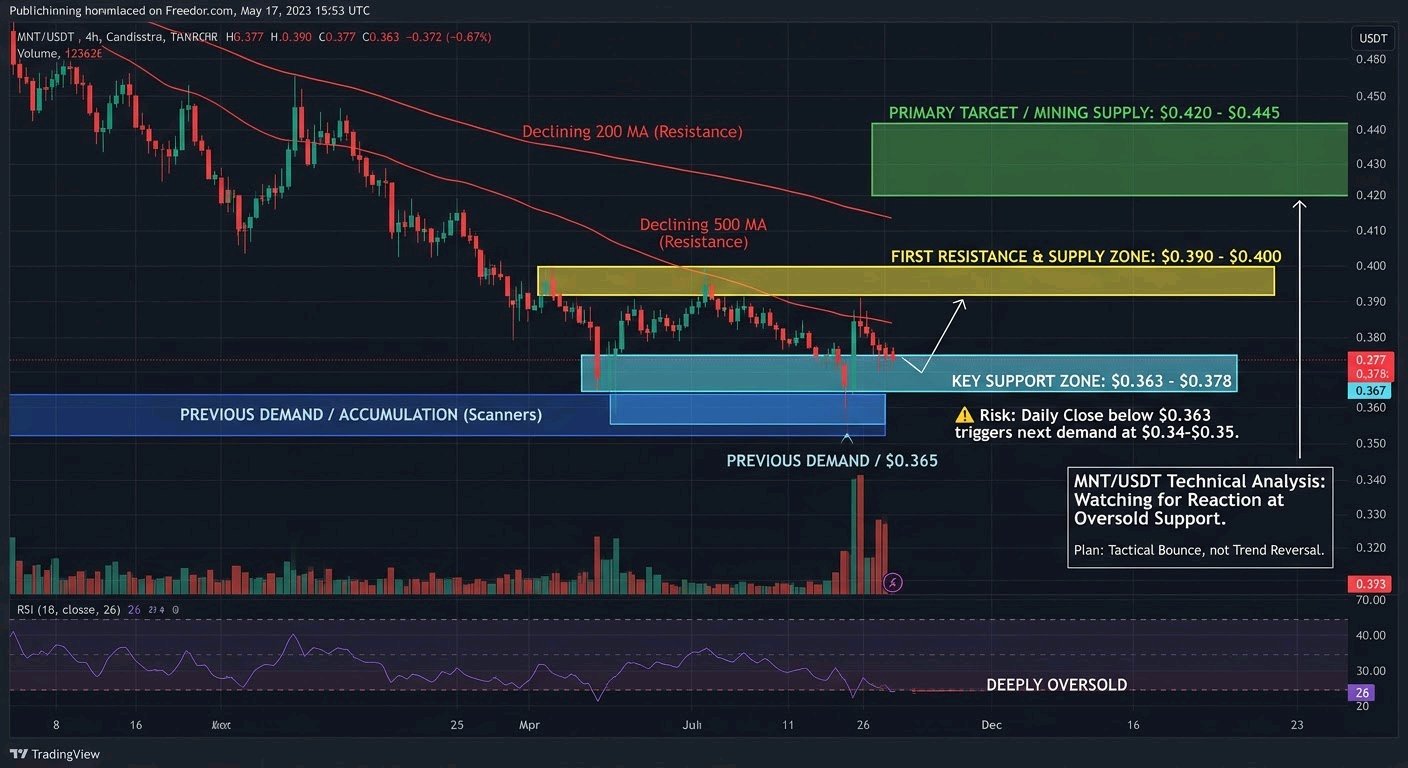
$MNTUSDT - PRICE IS DEEPLY OVERSOLD NEAR KEY SUPPORT, AND I’M WATCHING FOR A REACTION.** Mantle continues to lag the broader market in this risk-off environment. While Bitcoin and the majors have shown occasional stabilizations, MNT has kept grinding lower, printing a clear series of lower highs and lower lows. On the daily and 4-hour timeframes the structure remains bearish, with price sitting well below the major moving averages. The 24-hour range has been roughly $0.3635–$0.4002, and we’re currently hovering near the lower end of that range around $0.376–$0.378. RSI on the higher timeframes has dropped into the mid-20s, which is deeply oversold territory. That doesn’t guarantee a bounce, but it does increase the odds of at least a short-term relief reaction if buyers step in at these levels. **Volume Analysis** 24-hour trading volume is running around $43 million. Participation has picked up during the latest leg lower, which is typical of continuation selling rather than quiet accumulation. The increased volume on the downside confirms that sellers are still in control for now. Any meaningful rebound will need to show a clear shift in volume character—higher volume on green candles and absorption at support—rather than just a low-volume bounce that gets sold into. **My Trading Plan** I’m treating this as a potential mean-reversion / relief-bounce setup only, not a trend reversal. - **Initial Entry Zone**: $0.370 – $0.378 (current area and just above the 24h low). I’m only interested on signs of stabilization or a higher low forming on the lower timeframes. - **Preferred DCA Level**: $0.355 – $0.365. This aligns with the recent accumulation zone identified by several scanners and sits just above the deeper structural support near $0.34–$0.36. - **First Resistance**: $0.390 – $0.400. This is the upper end of the recent daily range and the first real supply area. A clean reclaim and hold above $0.400 would be the first sign of improving structure. - **Primary Target**: $0.420 – $0.445. This is where I expect the first meaningful supply to appear on any bounce. - **Additional Upside Potential**: $0.48 – $0.50 if the broader market stabilizes and MNT starts showing relative strength. I’m not chasing. I want confirmation of buying interest (absorption, higher lows, or a break of short-term structure) before sizing up. **What Could Go Wrong?** The primary risk is straightforward continuation of the downtrend. A clean break and daily close below $0.363 would open the door to the next demand zone around $0.34–$0.35. Below that, the path of least resistance remains lower toward the $0.30–$0.31 area that has acted as longer-term support in the past. As long as price remains below the declining moving averages and fails to reclaim $0.40 with conviction, the bearish bias stays intact. Oversold conditions can persist longer than expected in a risk-off environment, so any long positions need tight risk management and clear invalidation levels. **My Perspective** MNT is interesting right now precisely because it is stretched to the downside and sitting near a zone that previously attracted demand. The oversold RSI and proximity to recent lows create a reasonable risk/reward for a tactical bounce trade. That said, the higher-timeframe structure is still clearly bearish, and the coin is showing relative weakness versus the broader market. I’m watching two things closely: 1. Whether buyers can defend the $0.36–$0.37 area and force a higher low. 2. Whether any bounce is accompanied by expanding volume or simply gets sold into at the first resistance. Until we see a shift in market structure and relative strength, I’m treating upside as corrective rather than the start of a new trend. Patience and strict risk management remain the priority here. #IMPACTbyTrade
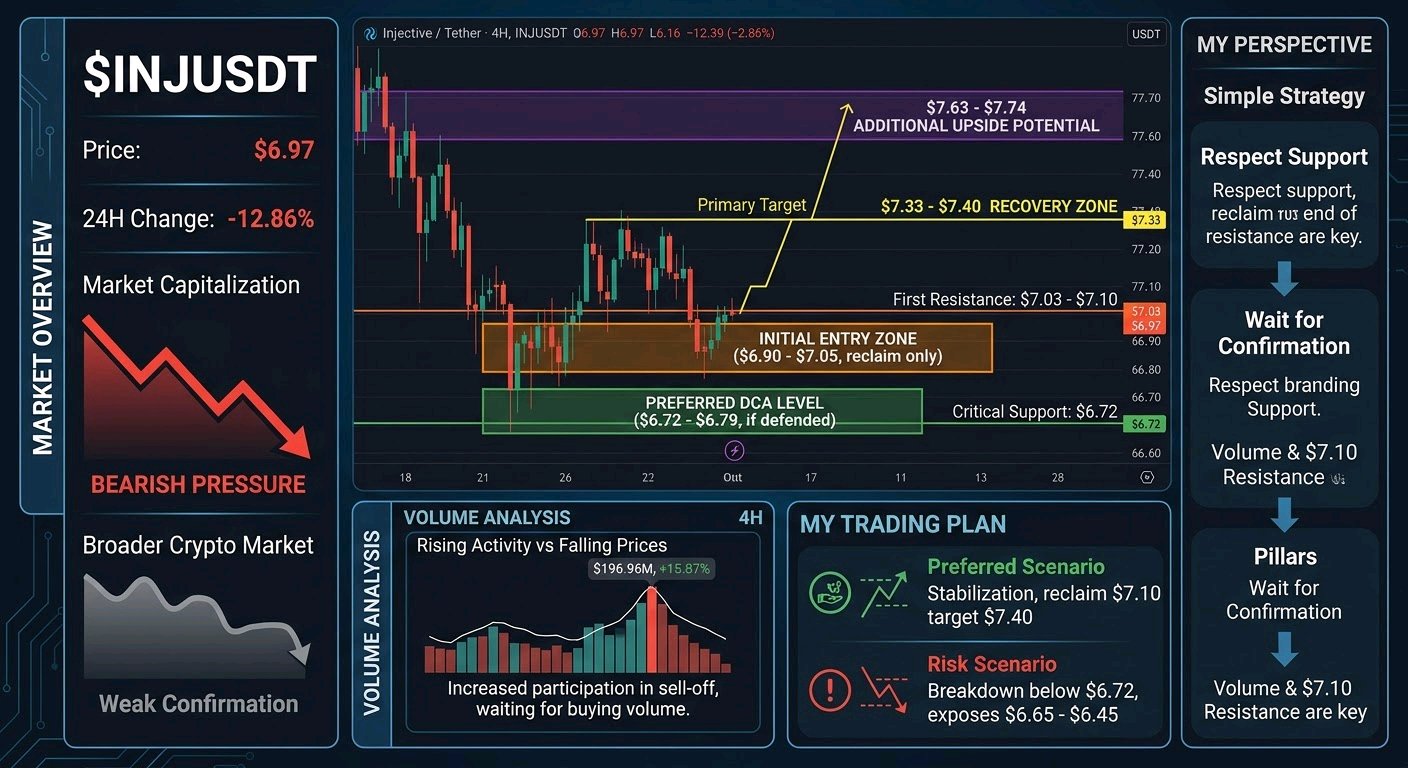
$INJUSDT – SELLING PRESSURE IS RISING, BUT I'M WATCHING THE $7.40 RECOVERY ZONE Injective ($INJ) is showing a challenging price structure right now. The recent decline has increased volatility, and I'm watching closely to see whether buyers can defend the current demand area or whether another leg down is developing. Market Overview INJ is trading around $6.97, with a sharp decline of approximately 12.86% over the last 24 hours. The recent price action shows that sellers have taken control of the short-term structure. On the 4H timeframe, bearish pressure remains visible, while the daily structure also needs stronger buying confirmation before I consider a meaningful trend reversal. Compared with the broader crypto market, I would avoid calling this relative strength without further confirmation. For now, my focus is on how INJ reacts around its nearby support levels. Volume Analysis 24-hour trading volume is approximately $196.96M, with reported volume growth of around 15.87%. What interests me here is the combination of rising trading activity and falling prices. This suggests increased participation during the sell-off, meaning buyers still need to prove that they can absorb the available selling pressure. I want to see buying volume return alongside a recovery in price before considering a stronger bullish continuation. My Trading Plan I'm keeping the following levels on my watchlist: • Initial Entry Zone: $6.90 – $7.05 (only after bullish confirmation and a successful reclaim). • Preferred DCA Level: $6.72 – $6.79 (if buyers defend this demand zone). • First Resistance: $7.03 – $7.10. • Primary Target: $7.33 – $7.40. • Additional Upside Potential: $7.63 – $7.74. My preferred scenario is a stabilization above the $6.72–$6.79 support area, followed by a reclaim of $7.10. A sustained move above that resistance could create room for a recovery toward $7.40. If momentum improves further, the next area I'm watching is $7.63–$7.74. I don't want to chase a bounce without confirmation. A successful retest of reclaimed resistance would make the setup more interesting. What Could Go Wrong? The biggest risk is that INJ fails to hold its nearby demand zone. A breakdown below $6.72 would weaken the immediate recovery scenario and could expose the market to additional downside pressure. I'm also watching the $6.65–$6.45 area as a deeper support region. Losing that zone would suggest that sellers are still controlling the larger price movement. For me, a bullish setup becomes considerably weaker if price continues making lower lows without a meaningful increase in buying participation. My Perspective I'm interested in INJ because the current volatility is creating an important decision area for both buyers and sellers. However, I don't see enough confirmation to blindly call this a reversal. The short-term structure remains under pressure, and buyers need to reclaim $7.10 before I become more confident about a recovery. My immediate expectation is a possible consolidation around current levels, followed by an attempt to recover toward $7.33–$7.40 if demand holds. I'm watching volume, support reactions, and the $7.10 resistance closely. My strategy is simple: respect the support, wait for confirmation, and let price action decide the next move. $INJUSDT #ByXIMPACT
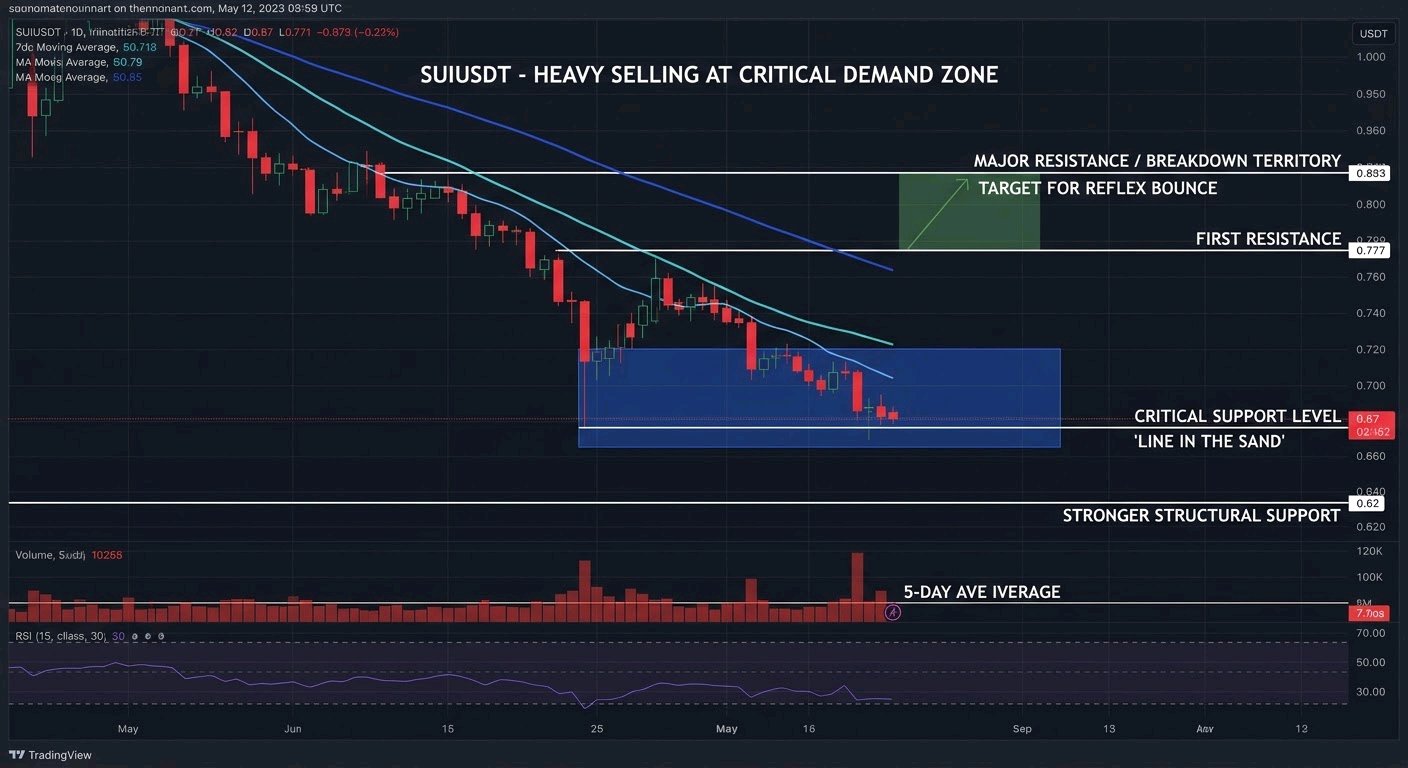
$SUIUSDT – HEAVY SELLING HAS PUSHED PRICE INTO A CRITICAL DEMAND ZONE, AND I’M WATCHING FOR A REACTION HERE. Sui has taken a serious hit over the past 24 hours, dropping over 12% at one point to trade near $0.70 before settling around the $0.71–$0.72 region . This move stands out because it’s not just a mild pullback—it’s a decisive break below the short-term structure that had been forming earlier in the month. While the broader crypto market has seen its own volatility, SUI’s decline feels heavier, showing clear relative weakness. The daily chart shows price now sitting well below the 7-day, 20-day, and 50-day moving averages, with the 7-day at $0.79 and the 20-day at $0.85 acting as overhead supply . What I’m monitoring closely is the $0.67 level—this is the immediate line in the sand. A clean loss of that zone would expose the $0.62 area next, which is the stronger structural support . The volume picture here is interesting but not yet conclusive. Binance spot volume has been around $50 million, and the volume-price regime sits at roughly 0.53x versus the 5-day average . That tells me this pullback has been a relatively low-volume decline rather than a panic-driven capitulation. In one sense, that’s constructive—sellers haven’t forced a disorderly flush. But it also means we haven’t seen the kind of high-volume absorption that often marks a durable bottom. I’m not seeing a surge in buying participation yet, which keeps me cautious about calling this a clean reversal. The funding rate on Binance Futures is slightly negative at -0.0170%, meaning shorts are paying longs . That can hint at crowded short positioning, but it’s not a standalone signal. My trading plan is built around patience and levels. I’m interested in an initial entry zone between $0.70 and $0.72, which is where price is currently stabilizing. If we see a deeper flush, my preferred DCA level sits near $0.67—this is the immediate support that needs to hold to keep the oversold bounce thesis alive. The first resistance I’m watching is $0.77; reclaiming that would be the first sign that sellers are losing grip. Above that, $0.83 is the more meaningful hurdle, aligning with the 20-day average and prior breakdown territory . My primary target for a reflex bounce is the $0.81–$0.83 region, with additional upside potential toward $0.87 if momentum genuinely shifts. What would confirm the setup for me is a hold above $0.67 followed by a volume-backed reclaim of $0.77. The risk here is real and needs to be respected. The daily RSI is around 30, which is near oversold but not a guaranteed reversal signal . If $0.67 breaks decisively, the setup weakens quickly and $0.62 becomes the next demand zone to watch. A breakdown below that would invalidate the bounce thesis entirely and suggest the broader downtrend is resuming. I’m also mindful that open interest has been falling across most venues during this drop, which means traders are cutting positions rather than adding fuel for a sharp rebound . That lowers the probability of a violent short squeeze. My perspective is that SUI is in a weak trend with oversold conditions underneath it—a combination that leaves room for a reflex bounce but not enough technical repair to call the decline finished . The $0.67 level is what I’m watching next. If buyers defend it and volume starts to expand on the upside, I’ll be interested in the bounce toward $0.83. If it fails, I’ll step aside and wait for the $0.62 area to see if a more durable base forms. This is a setup that requires discipline, not conviction betting. $SUIUSDT #ByXIMPACT
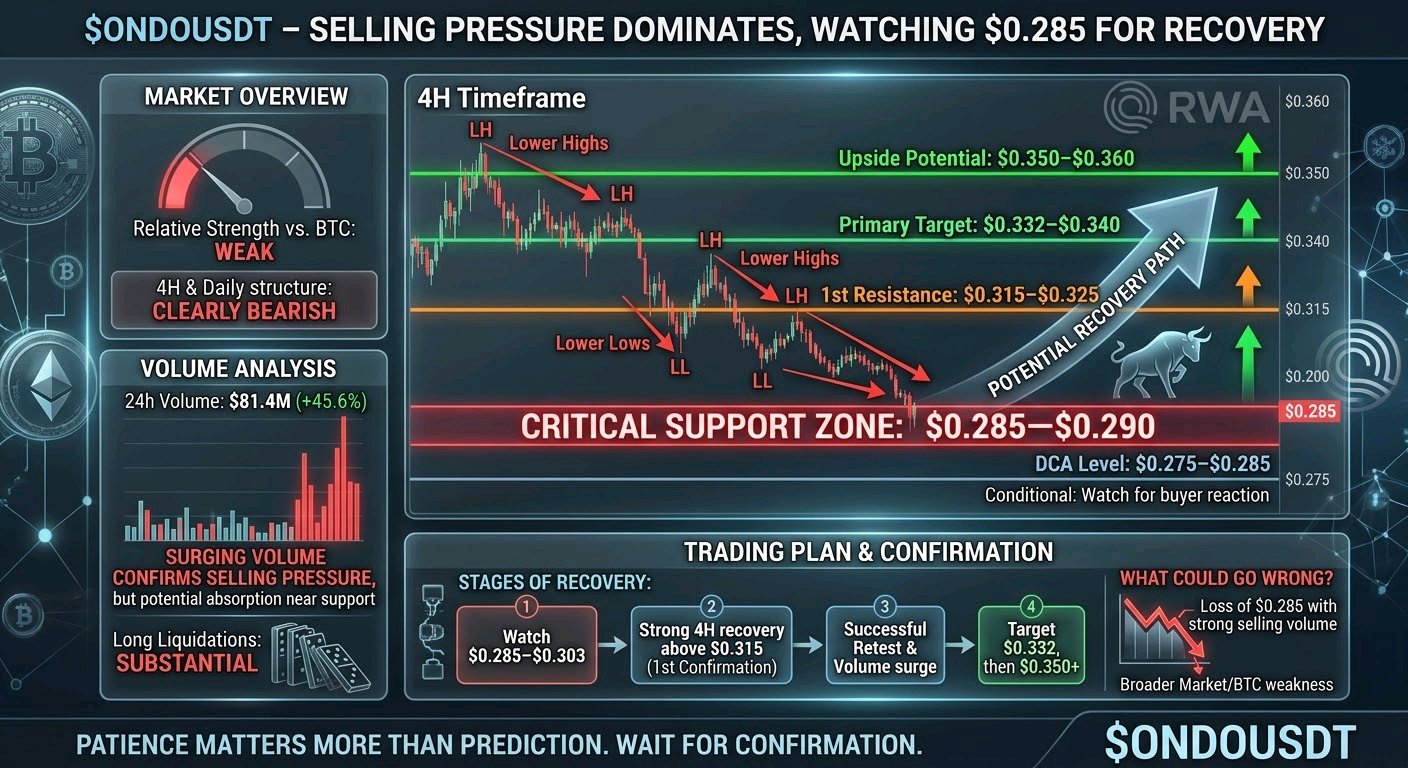
$ONDOUSDT – SELLING PRESSURE IS STILL DOMINATING, BUT I'M WATCHING THE $0.285 SUPPORT FOR A POTENTIAL RECOVERY. Market Overview ONDO is facing considerable selling pressure, currently trading around $0.30 after losing approximately 8–9% over the last 24 hours. Compared with Bitcoin, ONDO is showing relative weakness. BTC has also declined, but ONDO's downside move has been considerably stronger. On the 4H and daily timeframes, I'm watching a clear bearish structure. Price has continued forming lower highs and lower lows, with previous support zones failing to hold. The important area right now is $0.285–$0.290. Buyers need to defend this zone if ONDO is going to establish a meaningful short-term recovery. Volume Analysis Trading activity has increased during this decline. Aggregated spot-market data shows approximately $81.4M in 24-hour volume, up around 45.6% from the previous period. Futures activity is also elevated, with substantial long liquidations. This tells me that the recent move is not simply a quiet price correction. There is meaningful market participation behind the selling pressure. However, increased volume alone does not confirm a reversal. I want to see buyers absorbing sell orders before considering a stronger bullish move. My Trading Plan I'm interested in a potential recovery, but I don't want to chase the price while the market structure remains bearish. My levels to watch: - Initial Entry Zone: $0.292–$0.303 - Preferred DCA Level: $0.275–$0.285, only if buyers show a clear reaction. - First Resistance: $0.315–$0.325 - Primary Target: $0.332–$0.340 - Additional Upside Potential: $0.350–$0.360 My first confirmation would be a strong 4H recovery above $0.315, followed by a successful retest. If that happens with improving buying volume, I'll be more interested in holding for the $0.332–$0.340 resistance area. A sustained breakout above that zone could open the door toward $0.350–$0.360. What Could Go Wrong? The biggest risk is another breakdown below $0.285. If ONDO loses this area with strong selling volume, the current recovery idea becomes weaker, and I would avoid forcing a long position. The $0.275 area is my next downside reference, but I would need fresh price action to confirm whether buyers are willing to defend it. I'm also watching Bitcoin closely. If broader market weakness continues, ONDO could struggle to recover even if its own selling pressure begins to slow. My Perspective ONDO is interesting at these levels because price is approaching an important short-term support area after an extended decline. However, I don't consider the current price action a confirmed bullish reversal. My approach is to watch how price behaves around $0.285–$0.303. If buyers step in, volume improves, and ONDO starts reclaiming resistance levels, I expect a recovery attempt toward $0.332 and potentially $0.350. For now, patience matters more than prediction. I'm watching the support reaction and waiting for confirmation before committing to a stronger bullish outlook. The opportunity is there, but the market needs to prove that buyers are back in control. #ByXIMPACT
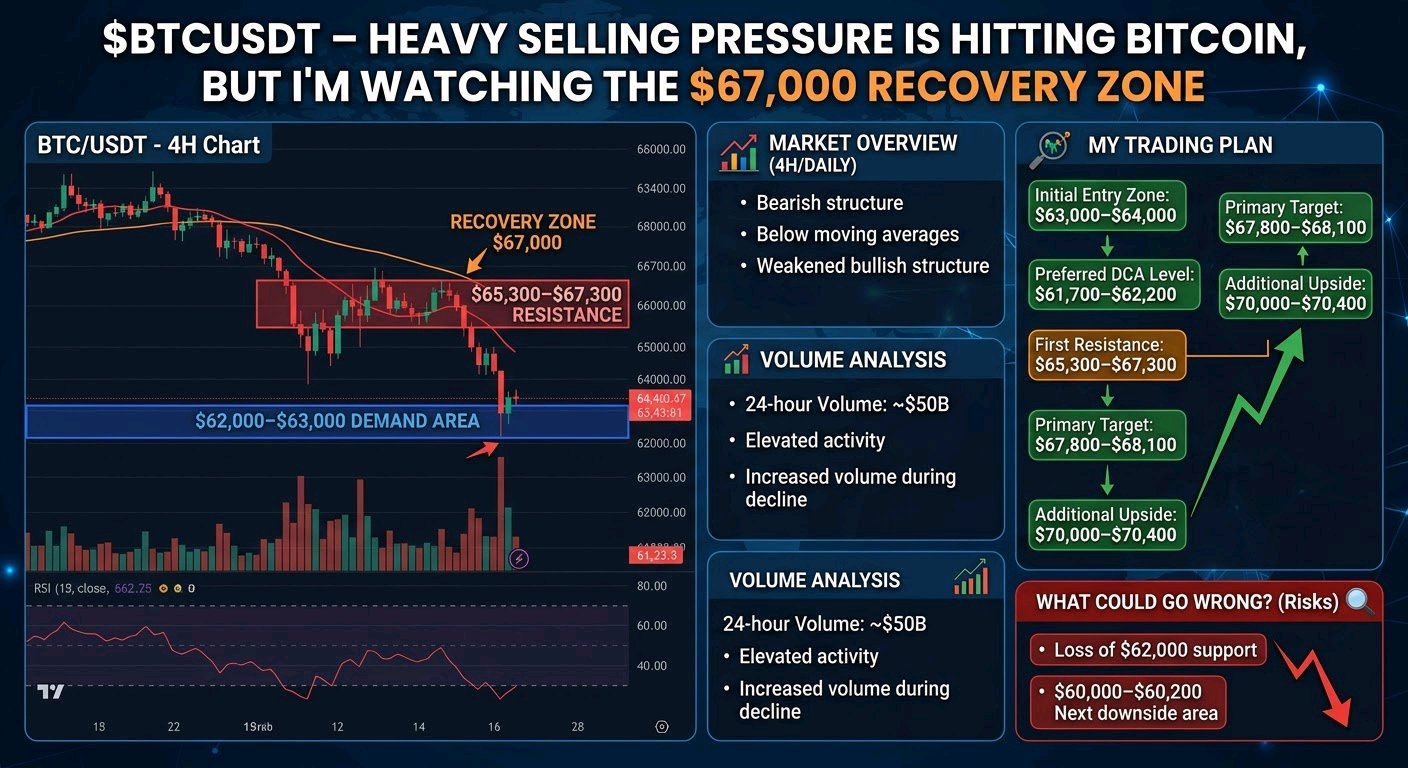
$BTCUSDT – HEAVY SELLING PRESSURE IS HITTING BITCOIN, BUT I'M WATCHING THE $67,000 RECOVERY ZONE Bitcoin is going through a significant correction, and the current price action deserves attention. BTC is trading around $64,400, down approximately 4% over the last 24 hours. Sellers are still controlling the short-term structure, but the recent decline is also pushing momentum indicators into oversold territory. I'm watching the $62,000–$63,000 demand area closely because this zone could become important for the next recovery attempt. Market Overview On the 4H and daily timeframes, Bitcoin is showing a bearish structure, with price trading below important moving averages. The recent selling pressure has weakened the bullish structure, and BTC has struggled to maintain its previous trading range. For now, I'm not treating every bounce as a trend reversal. Bitcoin needs to reclaim important resistance levels and establish higher highs and higher lows before I become more confident about a bullish continuation. Volume Analysis Bitcoin's 24-hour trading volume is approximately $50 billion, showing substantial market participation. Recent market data also indicates elevated trading activity compared with the 30-day average. This tells me that the current movement is attracting significant participation. However, increased volume during a decline does not automatically mean accumulation. I want to see stronger buying volume and a convincing recovery before confirming that buyers are taking control. My Trading Plan I'm approaching BTC with a cautious strategy rather than chasing the current movement. Initial Entry Zone: $63,000–$64,000 Preferred DCA Level: $61,700–$62,200 First Resistance: $65,300–$67,300 Primary Target: $67,800–$68,100 Additional Upside Potential: $70,000–$70,400 My preferred scenario is for BTC to defend the $62,000–$63,000 region, establish a higher low, and reclaim $65,300. A strong 4H close above this level, supported by increasing buying volume, would improve the recovery outlook. If buyers successfully push through $67,300, I'm interested in a potential continuation toward $68,000 and eventually $70,000. What Could Go Wrong? The biggest risk is another wave of selling pressure. If Bitcoin loses the $62,000 support area on strong volume, the current recovery scenario becomes considerably weaker. Below that region, I'm watching $60,000–$60,200 as the next important downside area. I don't want to average down blindly if market structure continues making lower lows. A confirmed breakdown would make me reconsider the entire setup rather than force a bullish position. My Perspective Bitcoin is at an important technical point. The short-term structure remains bearish, and I respect that. However, oversold conditions and elevated trading activity make the next reaction around $62,000–$63,000 particularly interesting. I'm watching how buyers respond to this demand area and whether BTC can reclaim $65,300 with convincing momentum. My preferred scenario is a recovery toward $67,000–$68,000, but confirmation matters more than prediction. For now, I'm staying patient, respecting the downside risk, and waiting for buyers to prove their strength. #ByXIMPACT
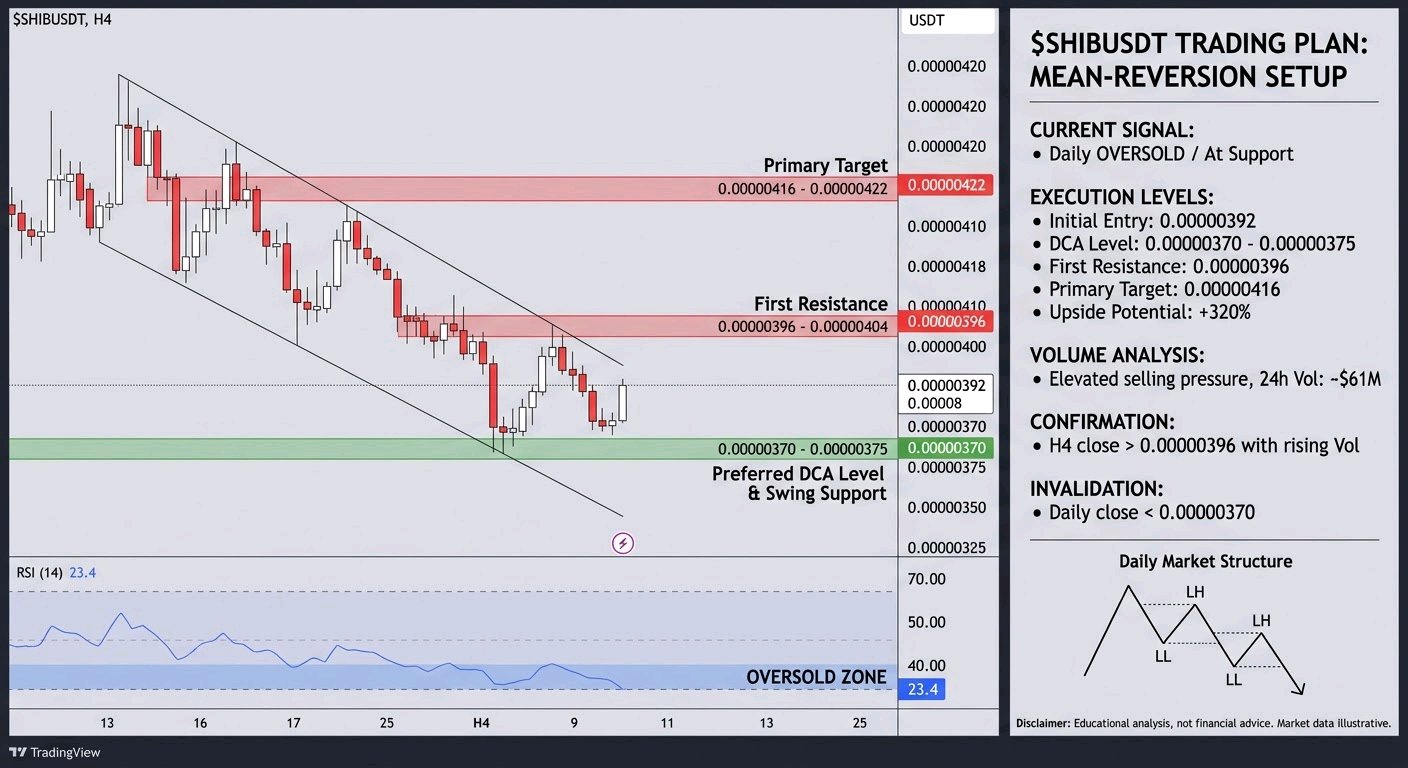
$SHIBUSDT - OVERSOLD ON THE DAILY, PRESSURE AT KEY SUPPORT, AND I’M WATCHING THE REACTION CLOSELY.** SHIB is trading near 0.00000390–0.00000392 after another weak session, down roughly 6–7% in the last 24 hours. The broader market has been soft, but SHIB is showing clear relative weakness, sitting well below its recent range and under most short- and medium-term moving averages. On the daily and 4-hour charts the structure remains lower highs and lower lows. Price has been grinding lower for weeks and is now pressing into a zone that multiple swing pivots and technical levels have marked around 0.00000370–0.00000374. I’m monitoring the 4-hour and daily timeframes most closely right now. The daily RSI has dropped into the mid-20s, which is oversold territory and the lowest readings we’ve seen in recent months. That alone does not reverse a trend, but it does raise the chance of at least a short-term relief bounce if buyers step in at this support. **Volume Analysis** 24-hour volume across major pairs has been elevated relative to the quieter sessions earlier in the week, with figures commonly reported in the $50–70 million range. The increase has largely accompanied the downside move, which tells me participation is still skewed toward sellers. Rising volume on a decline is not ideal for an immediate reversal, but if we start to see volume expand on any bounce off the current support while RSI holds or turns higher, that would be a constructive shift. Until then, the volume profile still favors caution on the long side. **My Trading Plan** I’m treating this as a potential mean-reversion setup rather than a trend-following long. - **Initial Entry Zone:** 0.00000385 – 0.00000395 (current area if support holds and we see a higher low form on the 4-hour). - **Preferred DCA Level:** 0.00000370 – 0.00000375. This is the nearest confirmed swing support. I’m only interested in adding if price tests it with clear rejection and volume does not accelerate lower. - **First Resistance:** 0.00000396 – 0.00000404. A clean reclaim and hold above this area would be the first sign that short-term selling pressure is easing. - **Primary Target:** 0.00000416 – 0.00000422. This zone lines up with recent swing highs and prior resistance. - **Additional Upside Potential:** 0.00000426 – 0.00000438 if momentum builds and the broader market cooperates. Confirmation for me would be a 4-hour close back above the immediate resistance cluster with rising volume and RSI turning higher from oversold. Without that, I’m not forcing size. **What Could Go Wrong?** The path of least resistance has been down. A daily close below 0.00000370–0.00000374 would open the door to further downside toward the 0.00000354–0.00000356 area and potentially deeper. That would invalidate the short-term bounce thesis and force me to step aside. Even if support holds temporarily, any bounce that fails quickly under the 0.00000400–0.00000404 zone would still leave the larger structure bearish. Liquidity is thinner at these levels, so sharp moves in either direction remain possible. **My Perspective** SHIB is interesting here purely because of the oversold daily conditions and the proximity to a well-defined support zone. The market structure is still clearly bearish, so I’m not looking for a major trend reversal. What I’m watching is whether this support can produce a tradable bounce and whether volume starts to favor the buyers on any rebound. If we get a clean reaction and reclaim of the first resistance cluster, the risk-reward for a short-term long becomes more attractive. If support breaks with conviction, I’ll stay on the sidelines. Right now the evidence points to a market that is stretched to the downside but still controlled by sellers. I’m patient, defined in my levels, and ready to adjust if the price action changes. #IMPACTbyTrade
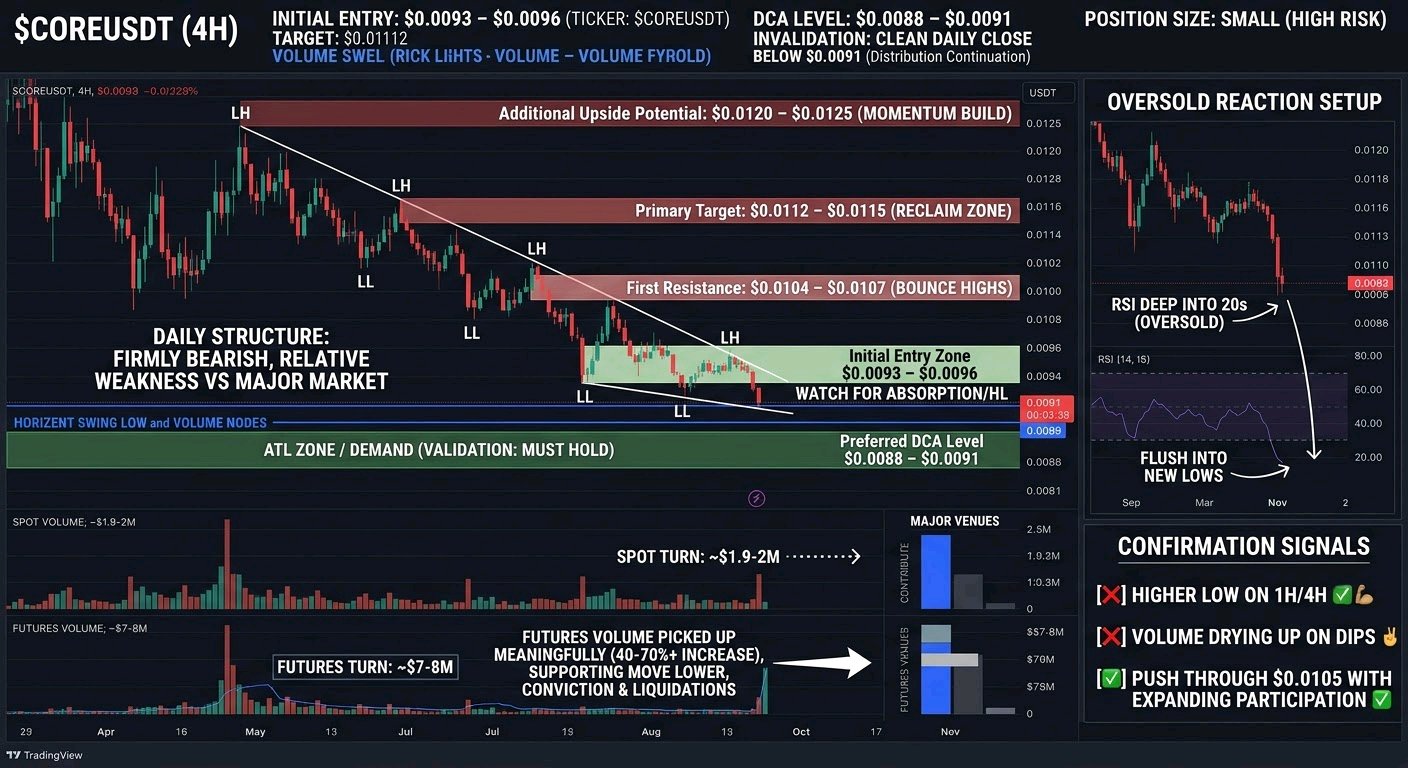
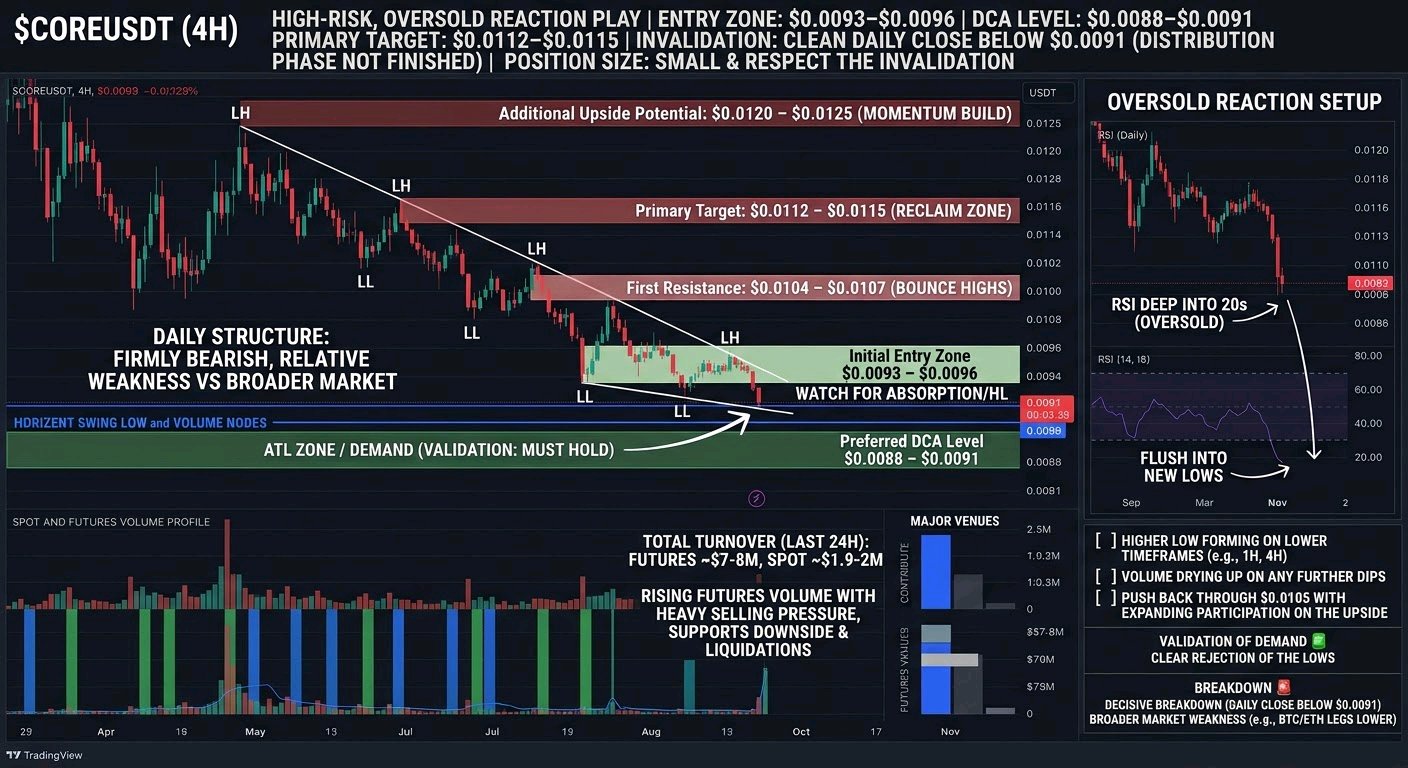
$COREUSDT has been under clear relative weakness versus the broader market. While majors have seen volatility, CORE continues printing lower highs and lower lows on the higher timeframes, with the daily structure remaining firmly bearish. I’m primarily monitoring the 4H and daily charts here. Price recently swept down toward the $0.0091 area (fresh multi-month/ATL zone) before a modest bounce attempt, but sellers have kept control overall. The market structure shows consistent distribution rather than accumulation so far. ## Volume Analysis Futures volume has picked up meaningfully in the last 24 hours (reports showing increases in the 40-70%+ range on major venues, with total futures turnover around the $7-8M area and spot closer to $1.9-2M). This elevated participation on the downside supports the move lower rather than a quiet grind. Higher volume during the selloff suggests real conviction from sellers and liquidations (longs taking the majority of the forced closes). Increased activity like this can either accelerate continuation or, if buyers step in hard near extremes, set up a sharper short-covering bounce. Right now the volume profile still favors the bears. ### My Trading Plan I’m treating this as a high-risk, oversold reaction setup rather than a clean trend-following long. - **Initial Entry Zone**: $0.0093 – $0.0096 (near the recent flush low and current trading area). I’m only interested on clear signs of absorption or a higher low forming on the lower timeframes. - **Preferred DCA Level**: $0.0088 – $0.0091 if it retests or slightly undercuts the recent low with declining volume. - **First Resistance**: $0.0104 – $0.0107 (recent bounce highs and prior consolidation). - **Primary Target**: $0.0112 – $0.0115 on a successful reclaim and hold above the first resistance. - **Additional Upside Potential**: $0.0120 – $0.0125 if momentum builds and the broader market stabilizes. These levels matter because they align with the recent swing structure and volume nodes. Confirmation for me would be a higher low on the 1H/4H combined with volume drying up on any further dips, followed by a push back through $0.0105 with expanding participation on the upside. ### What Could Go Wrong? A short-term bounce is possible given how oversold the RSI readings have become (deep into the 20s on daily), but the larger trend is still down. The $0.0091 zone needs to hold as demand; a clean daily close below it would open the door to further downside and invalidate any near-term long bias. Deeper structural support sits lower, and continued high-volume selling would confirm the distribution phase is not finished. Broader market weakness or another leg lower in BTC/ETH would also pressure CORE further. Risk management is non-negotiable here — position size small and respect the invalidation. ### My Perspective CORE is interesting right now purely as a tactical oversold reaction play after the aggressive selloff and elevated futures volume. The price action has been weak relative to the market, and the structure remains bearish, so I’m not forcing a strong directional bias. Continuation lower is still the higher-probability path until proven otherwise, but the flush into new lows with rising volume creates the kind of extreme conditions where a relief bounce can appear quickly. I’m watching for either a clear rejection of the lows with volume confirmation or a decisive breakdown. Overall expectation is for choppy, high-volatility price action in the near term rather than a clean sustained move. Staying patient and letting the levels do the talking. #IMPACTbyTrade
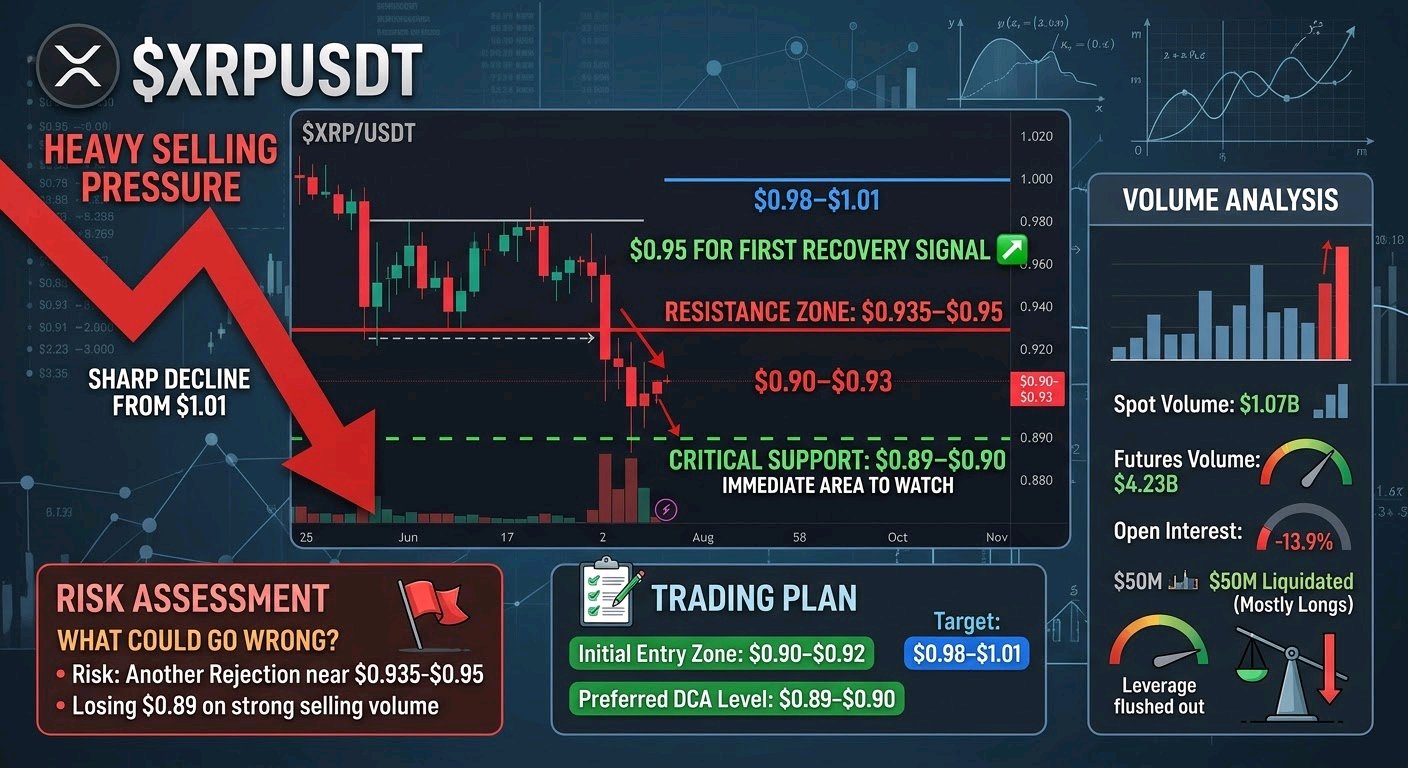
$XRPUSDT – HEAVY SELLING PRESSURE IS HITTING THE MARKET. I'M WATCHING $0.95 FOR THE FIRST RECOVERY SIGNAL. Market Overview XRP is facing significant selling pressure, and the short-term market structure remains bearish. The price is trading around $0.90–$0.93, following a sharp decline from the $1.01 area. Over the last 24 hours, XRP has dropped approximately 9–11%, showing more weakness than Bitcoin, which declined around 5% over the same period. On the daily timeframe, sellers are still controlling the broader price action. The recent breakdown has weakened the bullish structure, and I'm not interested in calling a bottom without confirmation. The immediate area I'm watching is $0.89–$0.90. Holding this zone could provide the foundation for a short-term recovery. Volume Analysis Trading activity has increased during the sell-off. Recent market data shows approximately $1.07B in spot trading volume and $4.23B in futures volume over 24 hours across tracked markets. Open interest has also declined by approximately 13.9%, while nearly $50M in futures positions have been liquidated, with the majority coming from long positions. This suggests significant leverage has been flushed out of the market. However, increased activity during a decline does not automatically indicate accumulation. I want to see buyers returning with stronger spot participation before treating this move as a confirmed reversal. My Trading Plan I'm approaching XRP cautiously and looking for confirmation rather than chasing a falling market. - Initial Entry Zone: $0.90–$0.92, only if buyers defend the support area and lower-timeframe structure starts improving. - Preferred DCA Level: $0.89–$0.90, provided the market shows a clear rejection of lower prices. - First Resistance: $0.935–$0.95. - Primary Target: $0.98–$1.01. - Additional Upside Potential: A confirmed breakout and sustained acceptance above $1.01 could open the door for a larger recovery. My preferred confirmation would be a higher low on the 4H timeframe, followed by a strong reclaim of $0.95 with improving volume. Without that confirmation, I would rather remain patient than force an entry. What Could Go Wrong? The biggest risk is another rejection near the immediate resistance zone. If XRP loses $0.89 on strong selling volume, the current recovery idea becomes weaker. A sustained breakdown would suggest that sellers are still controlling the market and that deeper demand needs to be tested. I'm also watching the broader Bitcoin market because continued weakness across major cryptocurrencies could put additional pressure on XRP. For now, I would avoid aggressive leverage and keep position sizes controlled. A support level is only useful when price action confirms that buyers are defending it. My Perspective XRP is interesting here because the recent sell-off has created an important decision zone. A significant amount of leveraged long exposure has already been liquidated, but that alone isn't enough to establish a bullish reversal. I'm watching $0.89–$0.90 as the immediate area where buyers need to step in. If XRP stabilizes, builds a higher low, and reclaims $0.95, I would become more interested in a move toward $0.98–$1.01. My current bias remains cautious because the broader structure is still under pressure. I'm not looking to predict the exact bottom. I'm looking for evidence that sellers are losing control and buyers are finally stepping back into the market. #IMPACTbyTrade
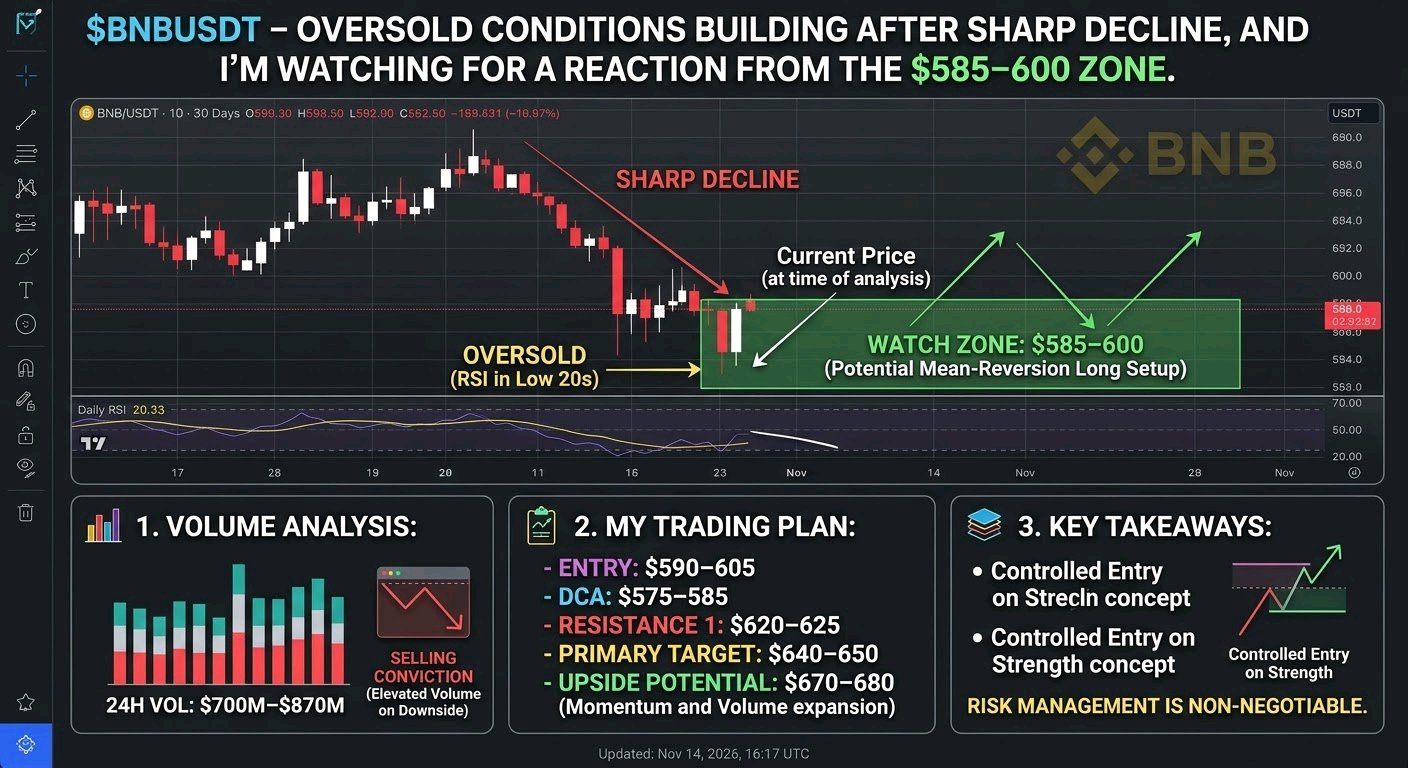
*-$BNBUSDT OVERSOLD CONDITIONS BUILDING AFTER SHARP DECLINE, AND I’M WATCHING FOR A REACTION FROM THE $585–600 ZONE.** BNB is under clear pressure today, trading near the $595–615 area after another leg lower. The broader market has been soft, and BNB is participating fully in the downside rather than showing relative strength. On the daily and 4H charts the structure remains bearish — lower highs and lower lows, price sitting well below the key moving averages, and momentum still pointed down. What stands out is how stretched the selloff has become. RSI on the daily is deep in oversold territory (low 20s), and several oscillators are flashing similar readings. Price has been rejected from the mid-620s/630s and is now testing the lower end of the recent range. The $600–605 area has acted as a short-term pivot; a sustained break below it opens the path toward the next demand zones. ## Volume Analysis 24-hour volume remains elevated in the $700M–$870M range across major pairs. The selling has been accompanied by meaningful participation rather than a quiet drift lower. Elevated volume on the downside confirms conviction from sellers for now, but it also means that any genuine reversal attempt will need similar or higher volume to be credible. Quiet bounces in this environment tend to fail quickly. ### My Trading Plan I’m treating this as a potential mean-reversion setup rather than a trend-following long. - **Initial Entry Zone**: $590–605 — looking for price to stabilize and show some absorption here. - **Preferred DCA Level**: $575–585 — if the current zone fails and we get a deeper flush into stronger historical demand. - **First Resistance**: $620–625 — the recent swing area and nearest overhead supply. A clean reclaim and hold above this would be the first positive sign. - **Primary Target**: $640–650 — previous consolidation and a logical area for partial profit-taking on any relief bounce. - **Additional Upside Potential**: $670–680 if momentum and volume expand on the recovery. I’m waiting for clear price action confirmation (higher low, reclaim of a short-term structure level, or a volume spike on the bounce) before sizing up. Blind buying into the trend is not the play here. ### What Could Go Wrong? The downside risk is real. If $585–590 fails to hold with volume, the next meaningful support sits lower and the oversold reading can persist longer than most expect. A decisive breakdown would invalidate the bounce thesis and keep the bearish structure intact. Broader market weakness or continued risk-off flows would accelerate that scenario. Position sizing and clear invalidation levels are non-negotiable in this environment. ### My Perspective BNB is interesting right now precisely because the selloff looks stretched. Oversold conditions on a major coin with solid underlying utility often produce tradable reactions, even inside a larger downtrend. I’m not calling a major bottom — the higher-timeframe structure is still bearish — but the risk/reward for a tactical long from the current demand zone is starting to look more balanced than it was a few days ago. I’m monitoring whether buyers step in with conviction around $590–600 and whether volume confirms any attempt higher. A failed bounce and continued lower highs would keep me on the sidelines or looking for short opportunities on retests of resistance. For now, the setup I’m most interested in is a controlled entry on strength from these levels with tight risk management. Stay disciplined. The market will tell us soon enough whether this is just another pause in the downtrend or the start of a meaningful relief move. $HYPEUSDT #IMPACTbyTrade
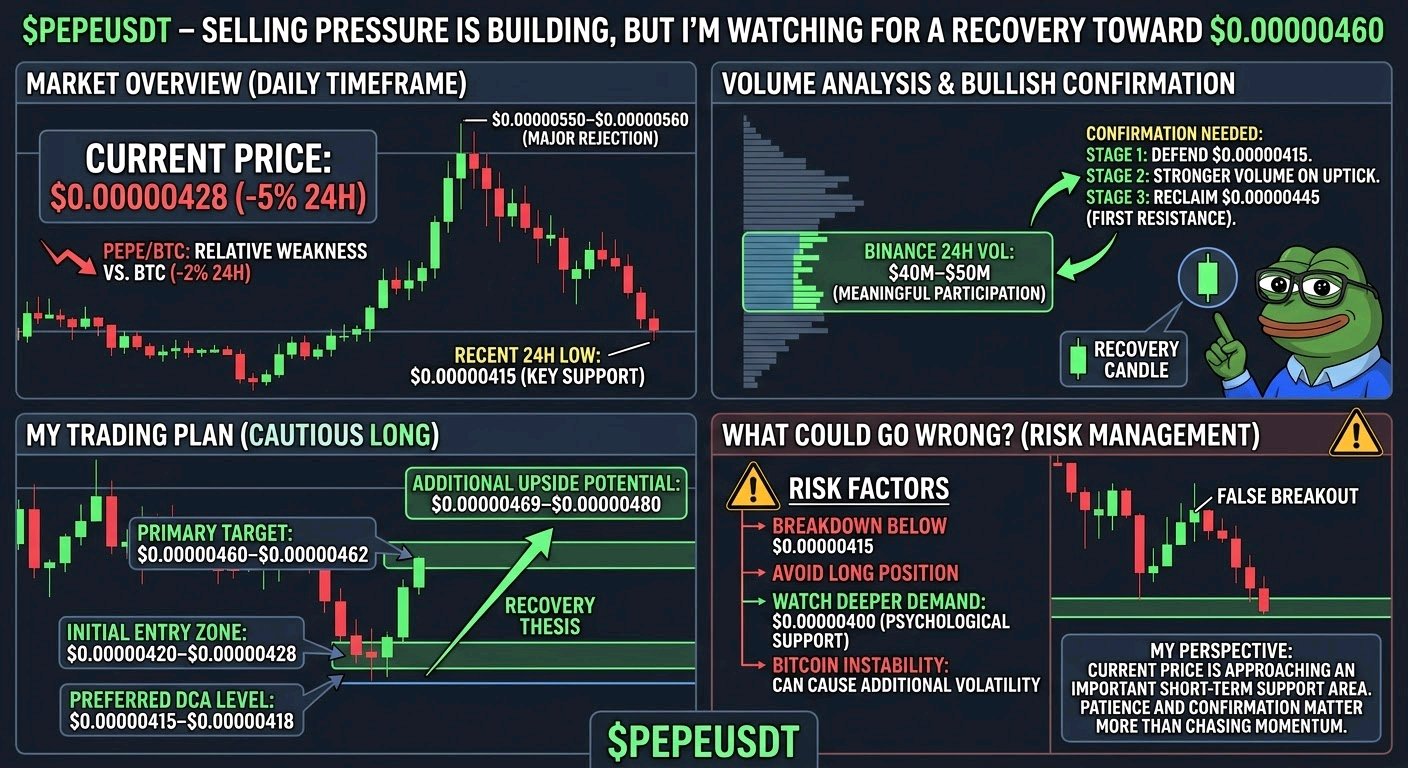
$PEPEUSDT – SELLING PRESSURE IS BUILDING, BUT I'M WATCHING FOR A RECOVERY TOWARD $0.00000460 Market Overview PEPE is facing noticeable selling pressure, currently trading around $0.00000428, down approximately 5% over the last 24 hours. Compared with Bitcoin, which has declined around 2% during the same period, PEPE is showing relative weakness. This tells me buyers are not yet showing enough strength to lead the recovery. On the daily timeframe, the recent structure remains under pressure following the rejection around $0.00000550–$0.00000560. I'm now watching whether PEPE can establish a stable base above its recent lows or whether sellers will push it toward another demand zone. Volume Analysis Binance's 24-hour PEPE/USDT trading volume is approximately $40M–$50M based on recent market snapshots. This confirms meaningful trading participation during the decline. However, volume alone doesn't confirm accumulation. I want to see buyers stepping in with stronger volume and a convincing recovery candle before treating this move as a confirmed bullish reversal. My Trading Plan I'm interested in a cautious long setup, but I don't want to chase the price while selling pressure remains active. - Initial Entry Zone: $0.00000420–$0.00000428 - Preferred DCA Level: $0.00000415–$0.00000418 - First Resistance: $0.00000445 - Primary Target: $0.00000460–$0.00000462 - Additional Upside Potential: $0.00000469–$0.00000480 The $0.00000415 area is particularly important because it represents the recent 24-hour low. For bullish confirmation, I want to see PEPE defend this area, reclaim $0.00000445, and maintain buying pressure above that level. A successful breakout could open the way toward the $0.00000460–$0.00000469 resistance region. What Could Go Wrong? The biggest risk is another rejection followed by a breakdown below $0.00000415. If that happens, I would avoid forcing a long position and watch for deeper demand around the psychological $0.00000400 area. A sustained move below that region would weaken the recovery thesis and could expose PEPE to further downside. I also want to see Bitcoin stabilize. If broader market selling continues, meme coins like PEPE could experience additional volatility. My Perspective I'm watching PEPE closely because the current price is approaching an important short-term support area. The recent decline has created an interesting potential recovery opportunity, but I don't consider the bullish reversal confirmed yet. My plan is to watch how price reacts around $0.00000415–$0.00000428. If buyers defend this zone and reclaim nearby resistance, I'm expecting a possible recovery toward $0.00000460 and potentially $0.00000480. For now, patience and confirmation matter more than chasing momentum. I'm watching the support reaction closely. The next strong move will depend on whether buyers can finally take control. #IMPACTbyTrade
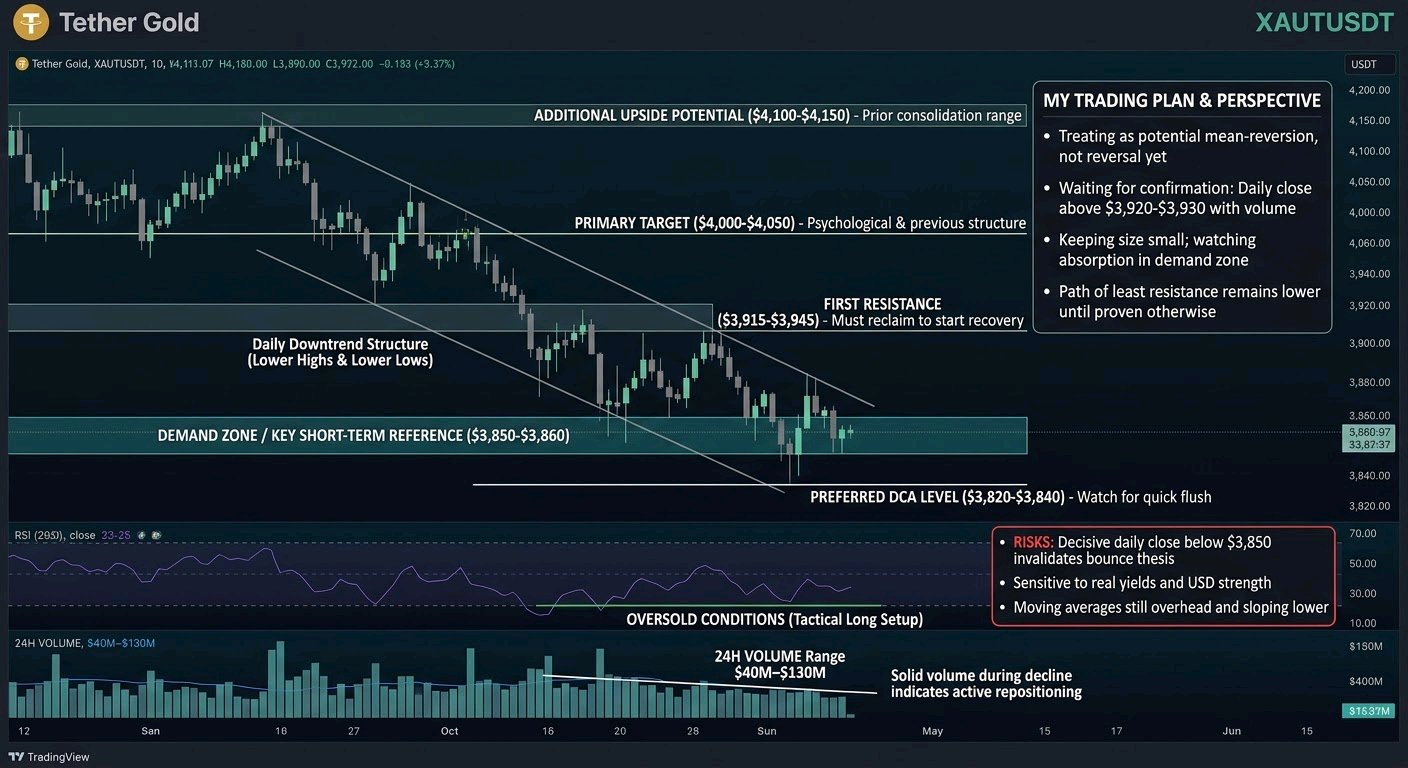
- $XAUTUSDT HOLDING NEAR RECENT LOWS AFTER THE SELL-OFF, AND I’M WATCHING HOW THIS DEMAND ZONE BEHAVES.** Tether Gold is trading around $3,860–$3,870 after a clear multi-week decline. While the broader crypto market has seen mixed action, XAUT has shown relative weakness, sitting roughly 4.8% lower over the past week and still well below the $4,000–$4,100 zone it occupied earlier this month. On the daily timeframe the structure remains lower highs and lower lows, with price currently pressing into the $3,850–$3,860 area that marked the recent swing low. That zone is the key short-term reference. A clean hold and bounce here would be the first constructive sign after the sell-off. Failure to defend it opens the door to further downside. # Volume Analysis 24-hour volume has been solid in the $40M–$130M range across spot markets (higher when including futures). Participation has not collapsed, which means the move lower was real rather than a low-liquidity drift. Elevated volume on the decline usually means the market is still actively repositioning. Until we see volume expand on a reclaim of higher levels, the bias stays cautious. ## My Trading Plan I’m treating this as a potential mean-reversion setup from oversold conditions (RSI daily around 33–35), not a high-conviction trend reversal yet. - **Initial Entry Zone:** $3,855–$3,870 Current price action is already testing this demand area. I’m interested in a controlled entry on signs of absorption (wicks into the low, higher low forming on lower timeframes). - **Preferred DCA Level:** $3,820–$3,840 If the low gets taken out with a quick flush, this is where I’d look to add, provided the broader gold market doesn’t break hard. - **First Resistance:** $3,915–$3,945 This is the nearest supply zone and the area that needs to be reclaimed and held before any meaningful recovery narrative starts. - **Primary Target:** $4,000–$4,050 Psychological round number and previous structure. A move back into this region would confirm short-term buyers are stepping in with conviction. - **Additional Upside Potential:** $4,100–$4,150 Only if momentum and volume expand after clearing $4,000. That would put price back into the prior consolidation range. Confirmation for me is a daily close back above $3,920–$3,930 with rising volume. Without that, I’m keeping size small. ### What Could Go Wrong? A decisive break and daily close below $3,850 would invalidate the short-term bounce thesis and likely target the next structural demand area lower. Gold itself remains sensitive to real yields and dollar strength, so any renewed risk-off or stronger USD move could pressure XAUT further. The daily trend is still down, RSI is oversold but can stay oversold, and moving averages (20/50) are still overhead and sloping lower. A failure here would simply continue the existing structure. ### My Perspective XAUT is interesting right now precisely because it is stretched to the downside on the short-term charts while still tracking physical gold. The $3,850–$3,860 zone is the clearest near-term decision point. I’m watching for either a clean bounce with volume or a breakdown that forces a deeper retest. Continuation lower is still the path of least resistance until proven otherwise, but the oversold readings and proximity to recent lows make a tactical long from here worth monitoring with tight risk. I’m staying patient and size-disciplined. The next few daily closes around this support will tell us whether buyers are ready to defend or if the path of least resistance remains lower. #IMPACTbyTrade
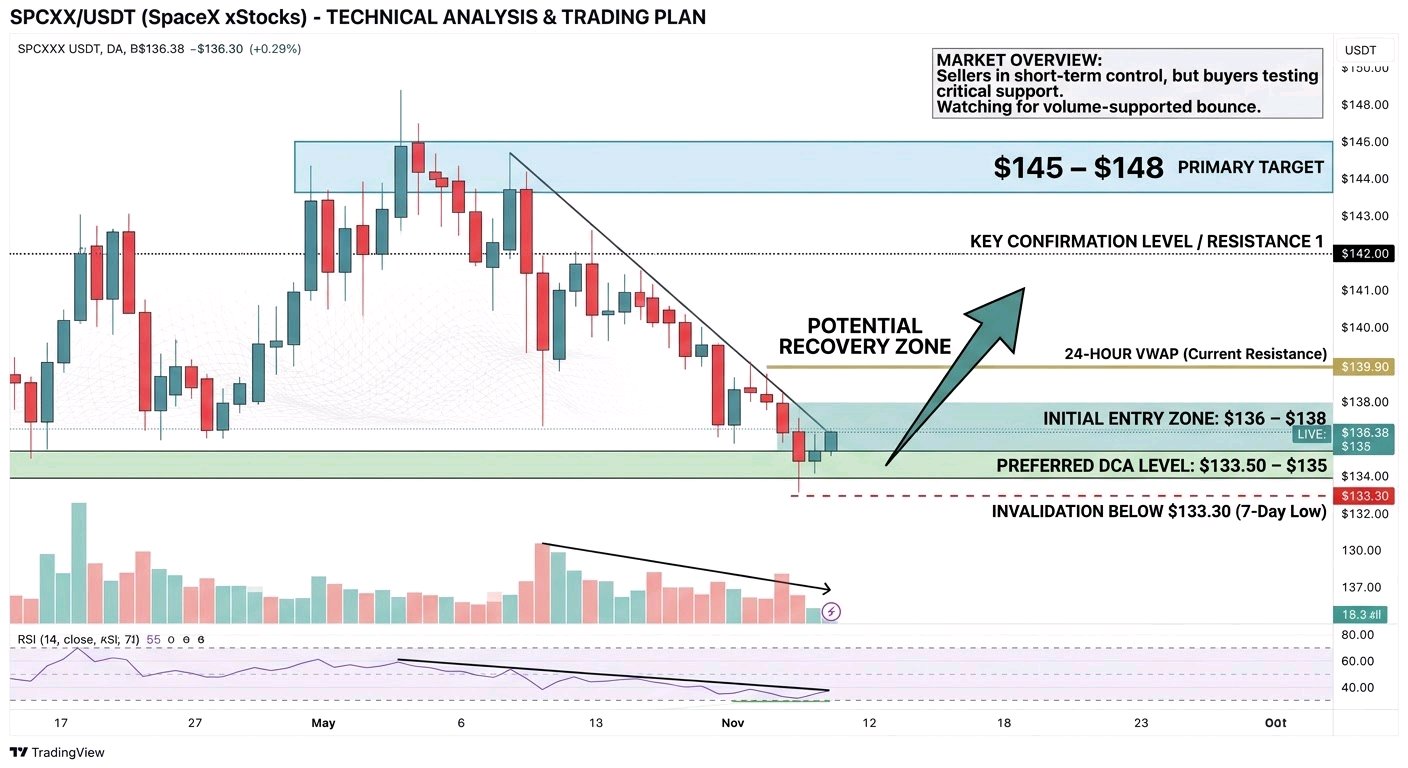
$SPCXXUSDT – SELLING PRESSURE IS TESTING KEY SUPPORT, AND I'M WATCHING FOR A RECOVERY TOWARD $142–$148. Market Overview I'm keeping a close eye on SPCXXUSDT because its recent price action is showing an important battle between buyers and sellers. SPCXX, which represents tokenized SpaceX equity through the xStocks framework, is currently trading around $136.38 based on the latest available market snapshot. Over the last 24 hours, price has declined approximately 3.20%, while the broader 7-day performance remains slightly positive at around 1%. The recent trading range is between $135.98 and $141.42. This tells me that sellers currently have short-term control, but buyers are approaching an important support area. I'm particularly interested in how price reacts around the $136 zone before considering a stronger directional move. Volume Analysis SPCXX has recorded approximately $5.64 million in 24-hour trading volume, representing a decline of around 10.10% compared with the previous day. This reduction in volume is worth monitoring. The current decline is not accompanied by increasing overall trading participation, which means I want to see stronger buying activity before treating this move as a confirmed bullish reversal. For me, a recovery supported by increasing volume would provide a much stronger indication that buyers are returning. My Trading Plan I'm approaching this setup with patience rather than chasing price after the recent decline. Initial Entry Zone: $136–$138 Preferred DCA Level: $133.50–$135 First Resistance: $139.90–$142 Primary Target: $145–$148 Additional Upside Potential: $150–$155, if buyers reclaim resistance with convincing volume. The $139.90 area is particularly important because it represents the reported 24-hour VWAP region. A sustained move above this area could improve short-term momentum. My preferred confirmation would be a strong recovery above $142, followed by a successful retest of that level as support. What Could Go Wrong? The biggest risk is that sellers continue controlling the market and push price below the $136 support area. If that happens, I would watch the $133–$135 region for the next potential demand reaction. A sustained breakdown below the recent 7-day low around $133.30 would significantly weaken my recovery outlook. I don't want to average down blindly if market structure continues deteriorating. Protecting capital is more important than forcing an entry. My Perspective What makes SPCXX interesting right now is the combination of its recent price correction, relatively strong weekly performance, and the important support zone currently being tested. I'm not calling this a confirmed bullish reversal yet. My expectation is that SPCXX could attempt a recovery toward $140–$142 if buyers defend the current area and trading participation improves. A convincing breakout could then open the way toward $145–$148. For now, I'm watching the $136 support zone closely. I would rather wait for confirmation than enter without a clear signal. Patience, volume confirmation, and disciplined risk management will determine my next move. #ByXIMPACT
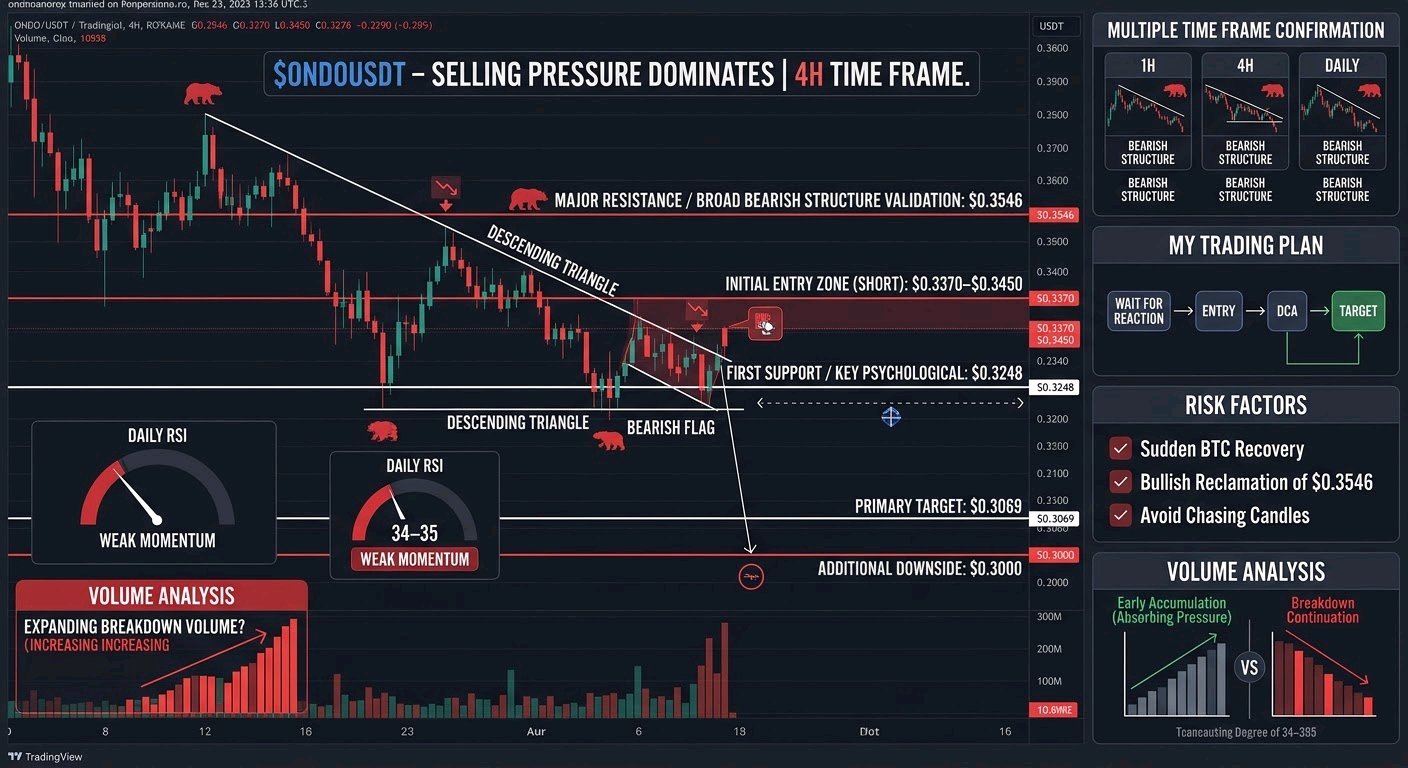
$ONDOUSDT – SELLING PRESSURE IS STILL DOMINATING, AND I'M WATCHING $0.3248 AS THE NEXT IMPORTANT LEVEL. I'm keeping a close eye on ONDO because its recent price action suggests that buyers are still struggling to regain control. The market is trading around $0.332, and the broader technical structure remains under pressure. Market Overview ONDO has been making lower highs, showing that sellers are maintaining control on the 1H, 4H, and daily timeframes. The price is trading below important trend-recovery levels, and the daily RSI is around 34–35, indicating weak momentum. One level I'm particularly interested in is $0.3372. A sustained recovery above this area could provide the first indication that buyers are returning. However, until ONDO reclaims the $0.3546 resistance zone, I don't consider the broader bearish structure invalidated. Volume Analysis Reported aggregated 24-hour trading volume is approximately $106 million, although volume figures can differ between exchanges and data providers. I'm watching whether selling volume starts declining near support. If buyers begin absorbing sell pressure while trading activity increases, that could indicate early accumulation. On the other hand, expanding volume during a breakdown would increase the possibility of further downside. My Trading Plan I'm not interested in chasing price at current levels. I'd rather wait for a meaningful reaction around resistance before considering an entry. Initial Entry Zone (Short): $0.3370–$0.3450 Preferred DCA Level: $0.3540–$0.3595, only if price shows a clear rejection. First Support: $0.3248 Primary Target: $0.3069 Additional Downside Potential: $0.3000 For a bullish recovery, I want to see ONDO reclaim $0.3546 with convincing volume. If that happens, the next upside areas I'm monitoring are $0.3752 and $0.3958. What Could Go Wrong? The biggest risk for bearish positions is a strong recovery above $0.3546. If ONDO reclaims this level and maintains acceptance above it, selling pressure could weaken considerably. On the downside, $0.3248 is an important support area. A decisive breakdown could expose $0.3069, followed by the psychological $0.3000 zone. I'm also keeping the broader market in consideration because a sudden Bitcoin recovery could change ONDO's short-term direction. I would avoid adding to a losing position without fresh confirmation. My Perspective ONDO remains interesting, but I don't see enough confirmation to call this a bullish reversal yet. The current structure favors caution, with sellers holding the advantage across multiple timeframes. My focus is on the reaction around $0.3248 and whether buyers can reclaim $0.3372. If support breaks with increasing selling pressure, I expect the market to explore lower demand areas. If buyers reclaim $0.3546 with strong participation, I'll reconsider the bearish outlook. For now, patience and confirmation matter more than trying to predict the exact bottom. I'm watching the levels, not chasing the candles. #IMPACTbyTrade
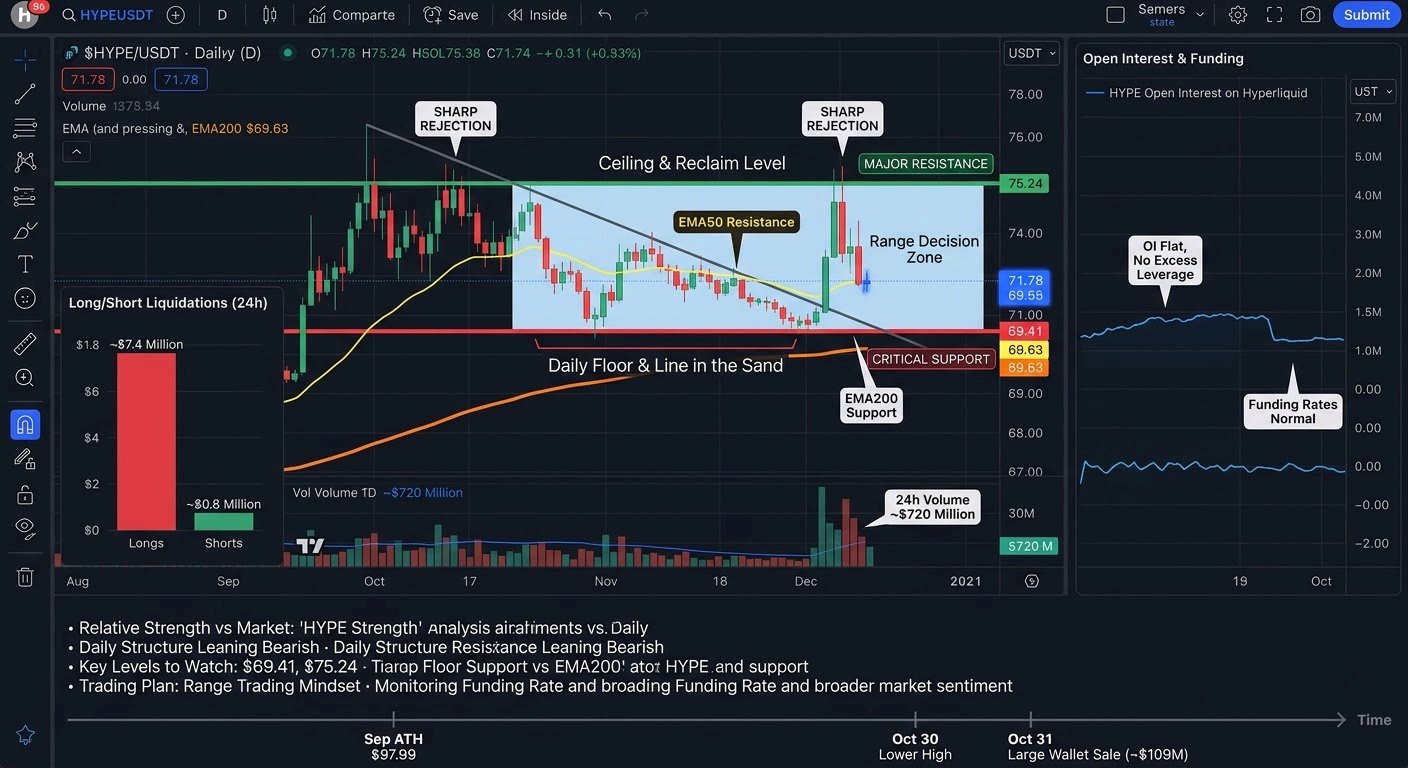
* $HYPEUSDT is trading near the $68–71 zone after another session of pressure, sitting roughly 28% below its September ATH around $98. The broader market has been soft, with Bitcoin also under pressure, yet HYPE continues to attract substantial participation relative to its size. On the daily and 4H charts I’m monitoring most closely, price has been grinding lower in a clear short-term downtrend while still holding above some of the deeper structural levels that formed during the October pullback. The recent range has been roughly $67–$75, with repeated tests of the lower end. # Volume Analysis 24-hour volume remains elevated, frequently printing in the $1.0–1.2B range across major sources. That level of turnover is meaningful for a top-10 asset and shows active two-way interest rather than pure apathy. Elevated volume during the decline suggests sellers are still present, but it also creates the liquidity needed for a sharper reaction if buyers step in at support. Sustained high participation often precedes larger directional moves once a level finally holds or breaks cleanly. # My Trading Plan I’m treating this as a potential support-reaction setup rather than chasing strength higher right now. - **Initial Entry Zone**: $67–$69. This is the area where recent daily lows and short-term demand have clustered. I’m interested in seeing buyers defend here with higher lows on the lower timeframes. - **Preferred DCA Level**: $64–$66. If the first zone fails, this deeper pocket aligns with prior reaction zones and would improve average entry if the structure still looks constructive on the daily. - **First Resistance**: $72–$75. Reclaiming and holding above the recent session highs would be the first sign that sellers are losing control. - **Primary Target**: $78–$82. A clean break and hold above $75 opens room toward the next visible supply zone from earlier in the month. - **Additional Upside Potential**: $88–$92 if momentum expands and the broader market stabilizes. That area contains previous swing highs and would represent a more meaningful recovery from the current drawdown. I’m looking for confirmation through volume expansion on any bounce and a shift from lower highs/lower lows into higher lows on the 4H. Without that, I’m staying patient. # What Could Go Wrong? A decisive daily close below $66–$67 would weaken the immediate bounce thesis and open the door to a deeper move toward the $60–$62 region, where stronger historical demand sits. Continued high volume on the downside without absorption would signal that the short-term trend remains firmly in sellers’ hands. Broader market weakness (especially if Bitcoin loses key levels) would also reduce the odds of a clean recovery in HYPE. In that case the setup simply invalidates and I step aside rather than force a trade. # My Perspective HYPE remains one of the more interesting large-cap names because of its consistent volume and the way it has previously absorbed sell-offs before expanding higher. The current price action is a classic post-ATH digestion phase — nothing unusual, but also nothing to force. Right now the evidence leans toward continued short-term pressure or a range, yet the elevated participation and proximity to recent lows keep me watching for a reaction. I’m monitoring the $67–$69 zone closely over the next few sessions. A strong defense there with improving volume would make the long side more attractive; a clean break lower would shift my focus to waiting for better structure. Either way, the levels are clear and the risk is defined. #ByXIMPACT
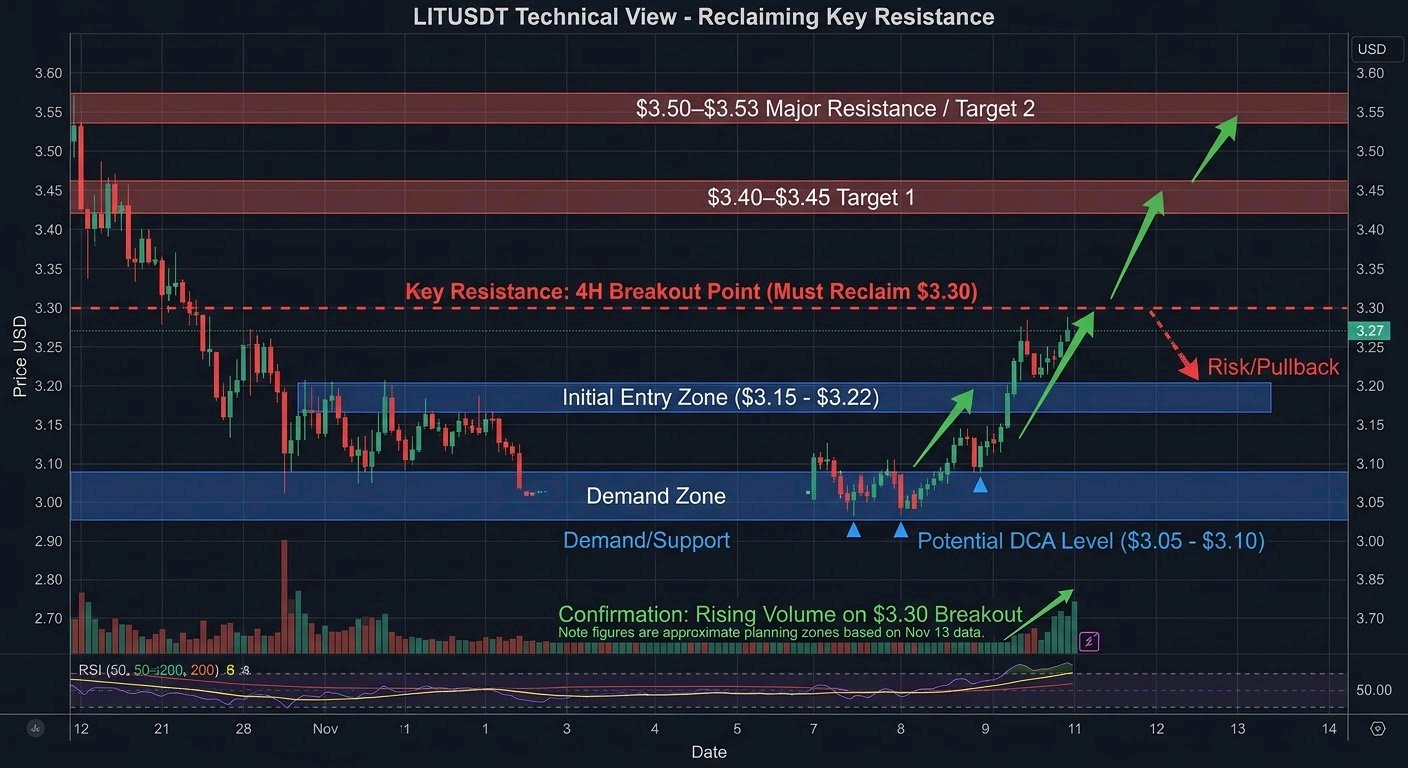
$LITUSDT BUYERS ARE DEFENDING THE $3.00 ZONE, AND I'M WATCHING A BREAKOUT TOWARD $3.50+ LITUSDT is showing signs of recovery after recent selling pressure, but I don't want to confuse a short-term bounce with a confirmed trend reversal. I'm watching the $3.00–$3.10 demand area closely. This zone has attracted buying interest, while the $3.30 region remains an important resistance that buyers need to reclaim. My focus is on whether LIT can build a stronger structure and sustain buying pressure rather than simply produce another temporary bounce. Market Overview The recent price structure shows that LIT experienced a pullback from the $3.50 area before finding support around $3.00–$3.10. The latest available market snapshots show LIT trading around $3.20–$3.27. The $3.30 level is the immediate upside barrier, while $3.40–$3.53 represents the next important resistance region. CoinGlass +2 On the daily timeframe, the recent decline suggests that sellers have not completely lost control. However, the recovery from the $3.00 area is worth monitoring. I'm also watching the 4-hour structure for higher lows and a sustained reclaim of resistance. That would provide better evidence of bullish continuation. Volume Analysis LIT has maintained meaningful derivatives activity. The latest available Binance perpetual snapshot reported approximately $51.64 million in 24-hour trading volume, with open interest around $44.37 million. Open interest was down approximately 0.74% over 24 hours. CoinGlass This suggests that trading participation remains active, but the decline in open interest does not yet confirm aggressive new position building. For me, the important confirmation will be increasing volume alongside a sustained move above $3.30. My Trading Plan I'm approaching LIT with a cautiously bullish bias while respecting the nearby resistance levels. * Initial Entry Zone: $3.15–$3.22 * Preferred DCA Level: $3.05–$3.10 * First Resistance: $3.30 * Primary Target: $3.40–$3.45 * Additional Upside Potential: $3.50–$3.53 I would prefer to see buyers defend the entry area and establish higher lows before increasing exposure. A convincing 4-hour close above $3.30, supported by stronger volume, would improve the probability of a move toward $3.40 and potentially $3.50. # What Could Go Wrong? The biggest risk is another rejection around $3.30. If buyers fail to maintain momentum, LIT could revisit the $3.15 area. A breakdown below $3.05 would weaken the recovery structure and expose the deeper $3.00 demand zone. A sustained move below $3.00 would invalidate my immediate bullish scenario and suggest that sellers are regaining control. I would rather wait for confirmation than chase a breakout without sufficient buying pressure. #My Perspective LIT is interesting because the market has already shown a reaction from the $3.00 demand region. I'm not calling this a confirmed bullish reversal yet. I want to see stronger volume, a healthier 4-hour structure, and a successful reclaim of $3.30. My preferred scenario is consolidation followed by a breakout toward $3.40–$3.50. For now, I'm watching the $3.15–$3.30 range closely. The next decisive move outside this range could provide a clearer trading opportunity. My approach is simple: respect the demand zone, wait for confirmation, and let price action determine the next move. Market-data note: Figures are based on the latest available November 13, 2026 snapshots, not a verified live November 14 quote. Levels are approximate technical planning zones, not guaranteed execution prices. #ByXIMPACT
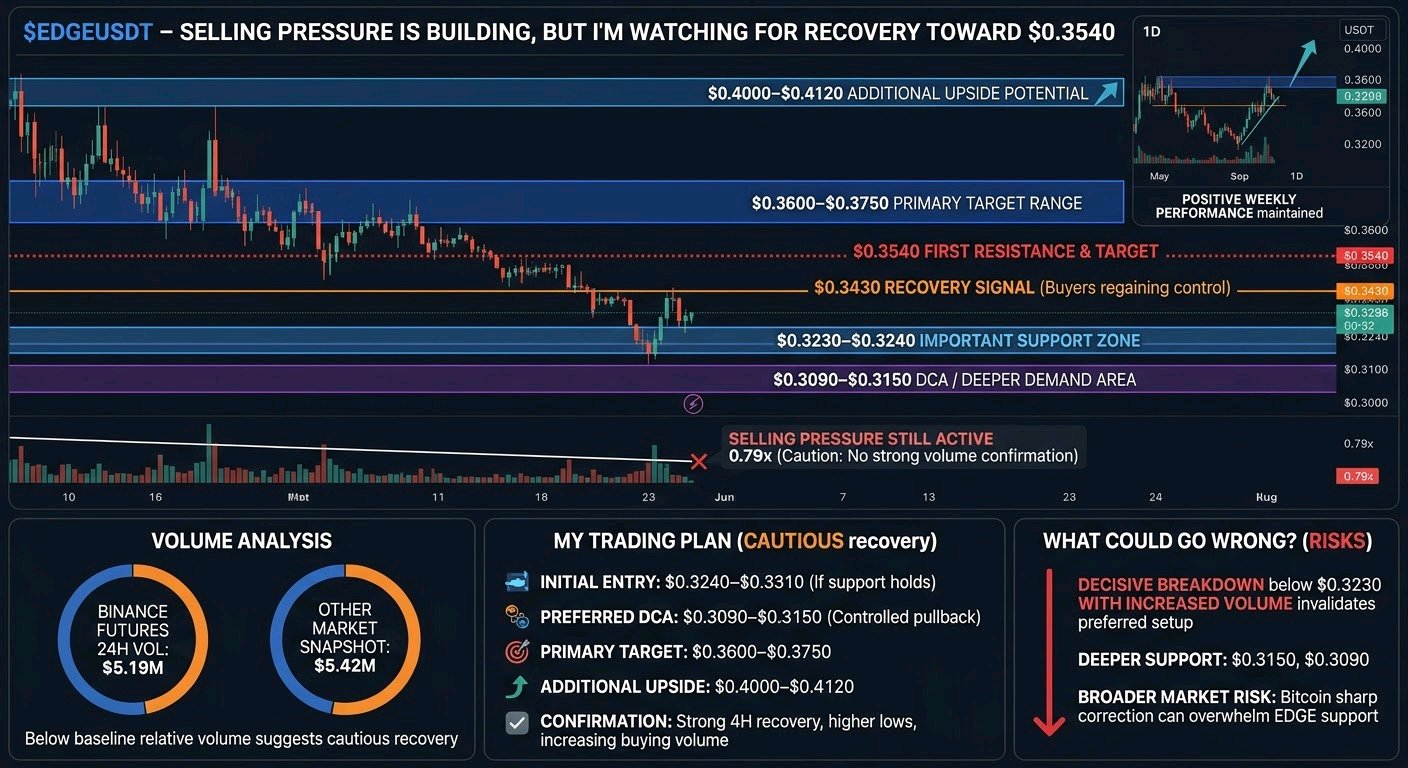
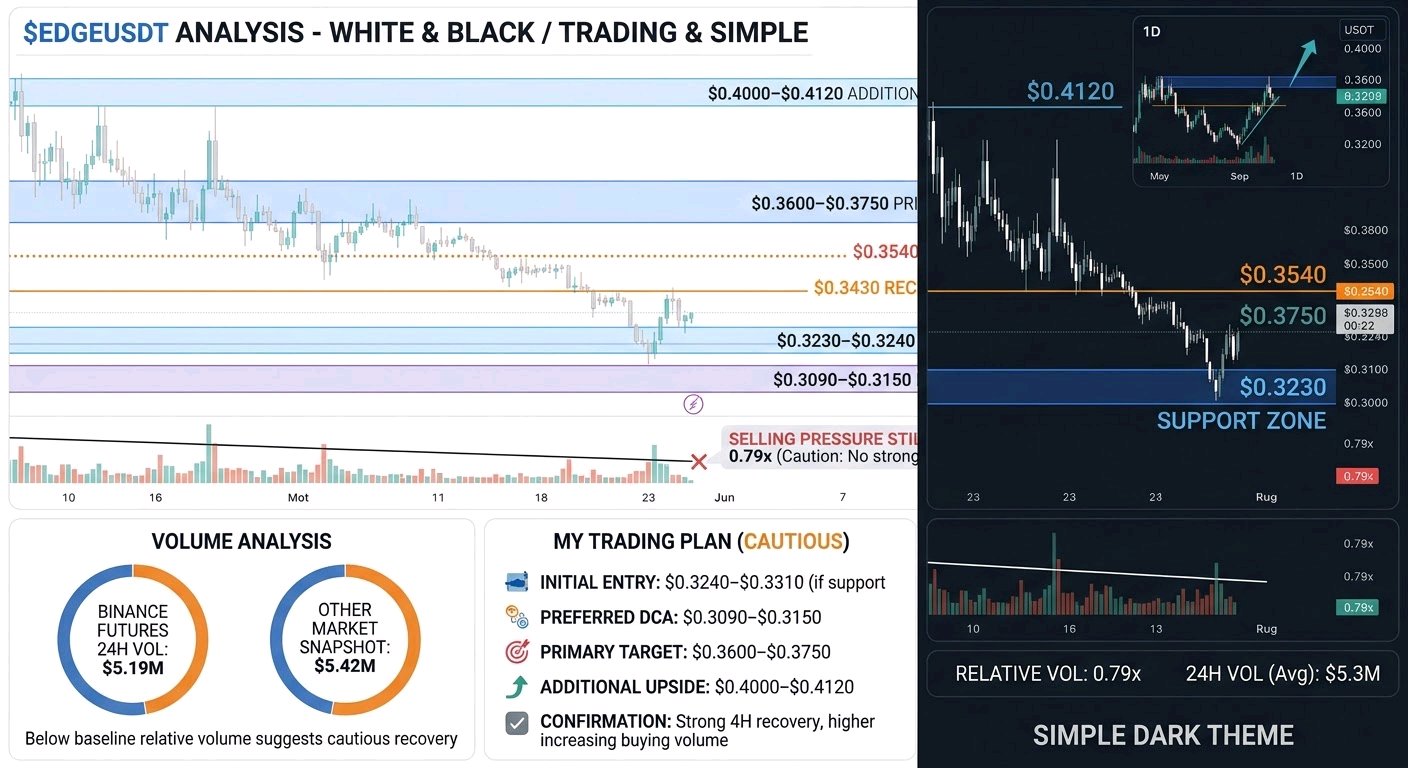
$EDGEUSDT – SELLING PRESSURE IS BUILDING, BUT I'M WATCHING FOR A RECOVERY TOWARD $0.3540 Market Overview EDGE is showing mixed price action. The broader short-term structure remains under pressure, even though the coin has maintained a positive weekly performance. The available November 13 market snapshot places EDGE around $0.3361–$0.3279, with a 24-hour decline of approximately 3–4%. I'm paying particular attention to the 4H and 1D timeframes. The recent pullback suggests sellers are still active, but the $0.3230–$0.3240 area is an important support zone to watch. A recovery above $0.3430 would be an early sign that buyers are regaining control. Volume Analysis Available Binance Futures data shows approximately $5.19M in 24-hour trading volume, while another market snapshot reports around $5.42M. Relative volume was reported at approximately 0.79x its baseline, suggesting participation was below the usual reference level. This is important because the current recovery does not yet have convincing volume confirmation. I want to see stronger buying activity before treating this pullback as a confirmed bullish reversal. My Trading Plan I'm approaching EDGE with a cautious bullish recovery scenario rather than chasing the price. • Initial Entry Zone: $0.3240–$0.3310, only if support holds and buyers show a clear reaction. • Preferred DCA Level: $0.3090–$0.3150, if the market experiences another controlled pullback. • First Resistance: $0.3430–$0.3540. • Primary Target: $0.3600–$0.3750. • Additional Upside Potential: $0.4000–$0.4120. These are conditional technical zones based on the available market snapshots, not guaranteed execution levels. My confirmation would be a strong 4H recovery, higher lows, and increasing buying volume. Without those signals, I would rather wait than enter aggressively. What Could Go Wrong? The biggest risk is a decisive breakdown below $0.3230. If sellers push through this support with increasing volume, the recovery scenario becomes weaker. In that situation, $0.3150 and the deeper $0.3090 demand area become important levels to monitor. A sustained breakdown below $0.3090 would invalidate my preferred short-term bullish setup and could expose EDGE to further downside. I also don't want to ignore broader market conditions. If Bitcoin experiences another sharp correction, EDGE could struggle to recover even if its own support initially holds. My Perspective EDGE is interesting because its weekly performance has remained positive despite the recent short-term selling pressure. However, I don't consider the current price action a confirmed breakout. I'm watching how price behaves around $0.3230–$0.3310. If buyers defend this region and volume starts increasing, I would expect a recovery attempt toward $0.3430, followed by $0.3540. For now, patience is more important than chasing momentum. I want confirmation from price action and volume before increasing exposure. My focus: Support holding first, volume confirmation second, and then a potential move toward $0.3750. $EDGEUSDT #IMPACTbyTrade
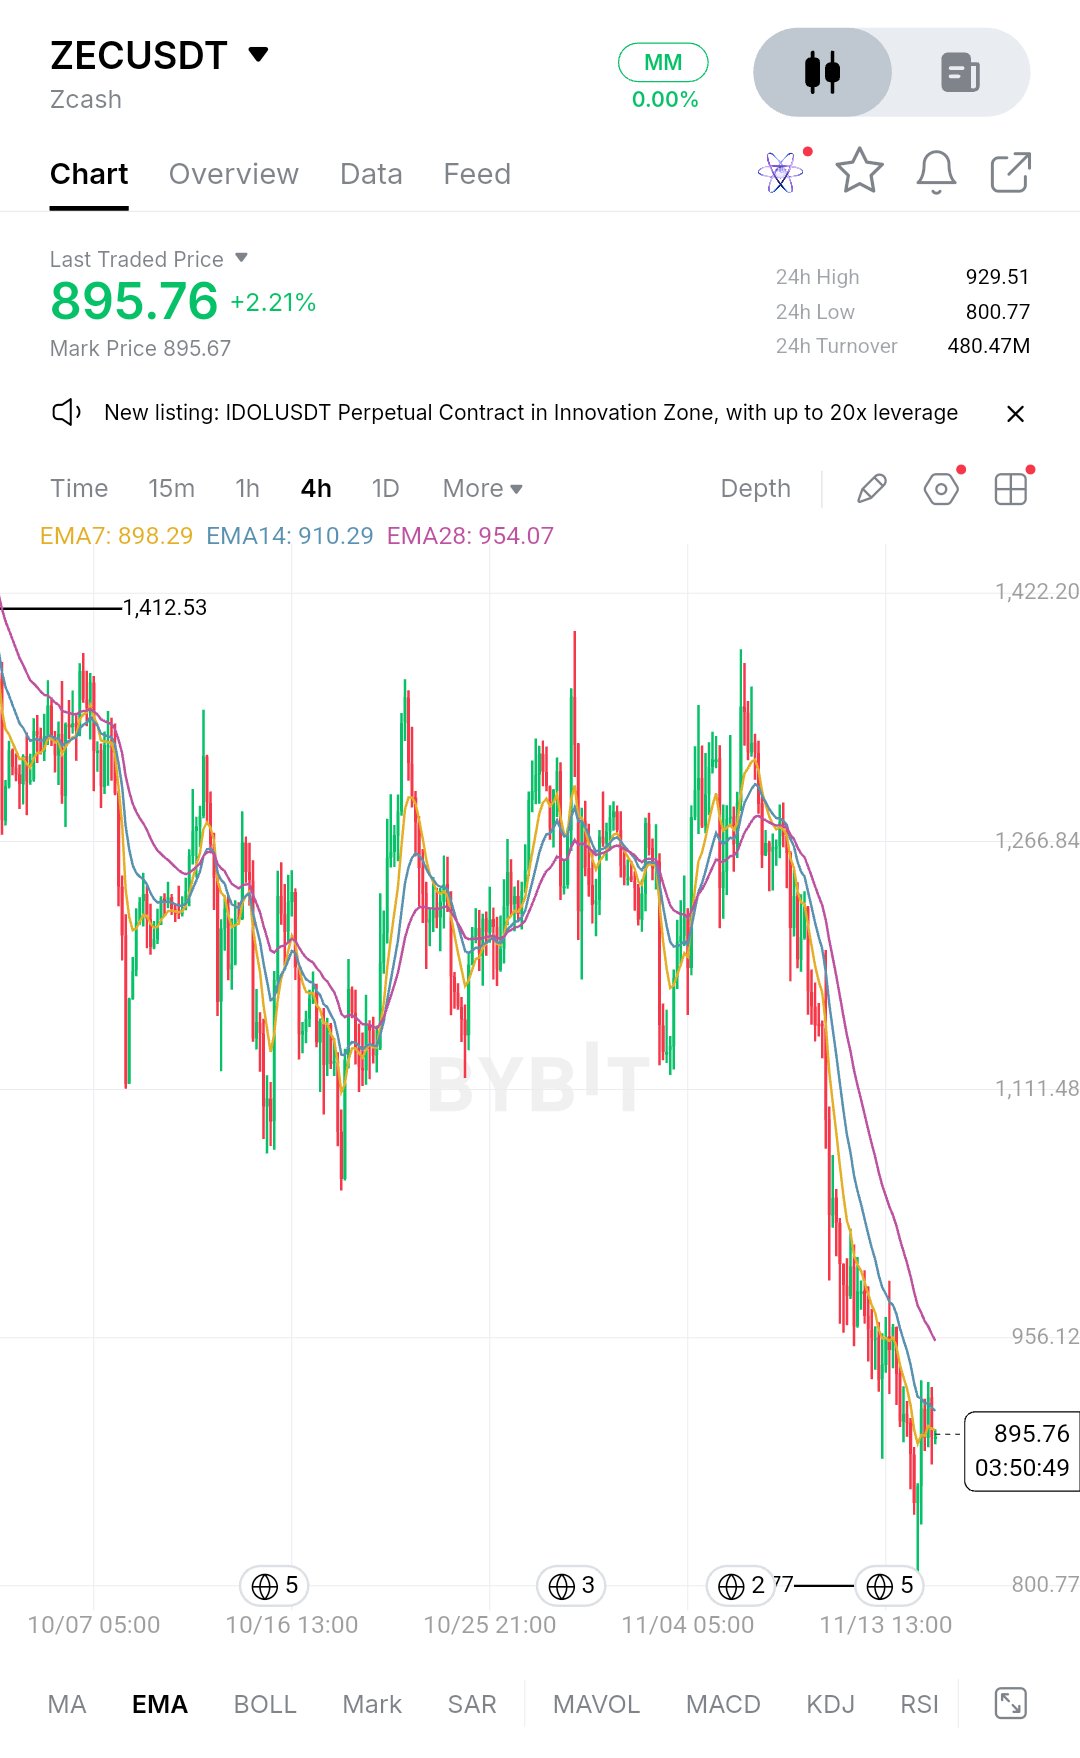
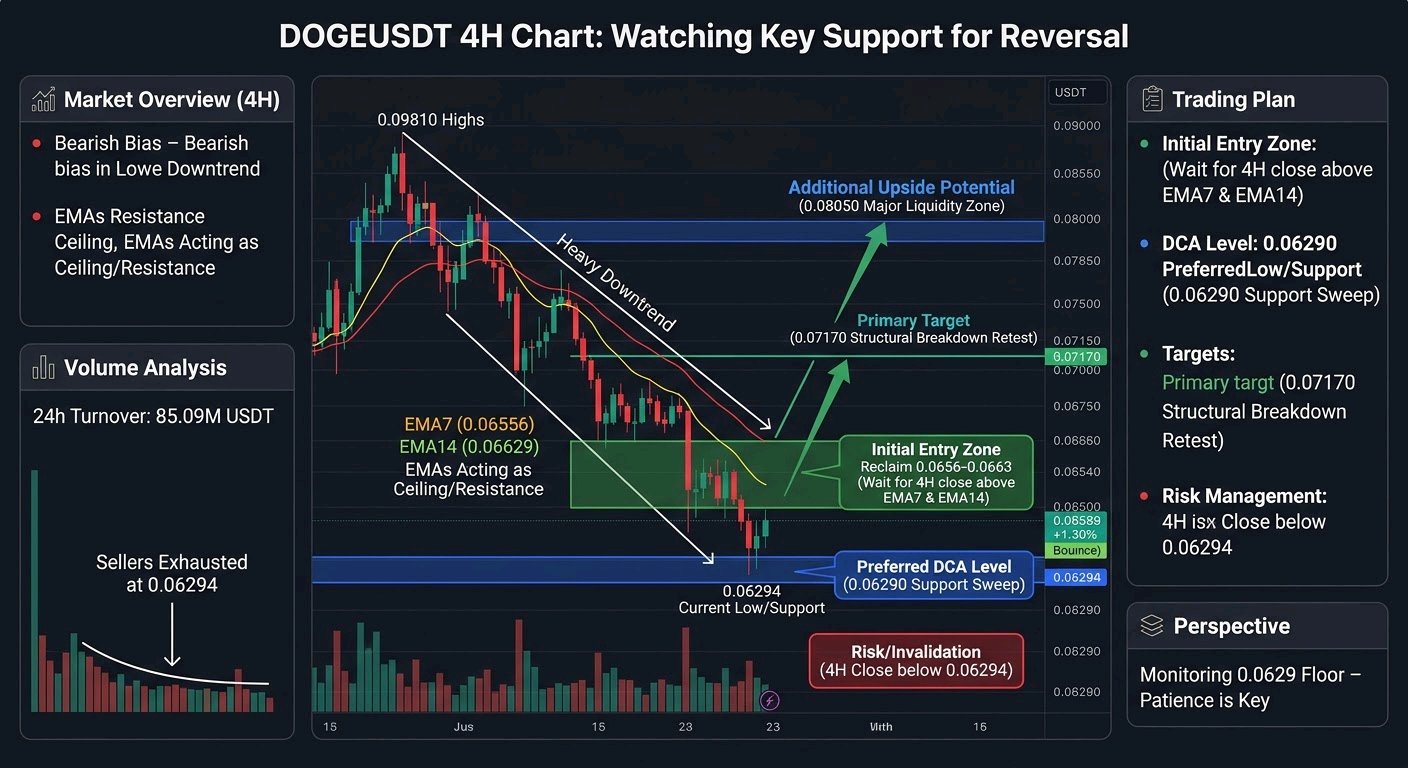
$DOGEUSDT – BEARISH PRESSURE PERSISTS, BUT I’M WATCHING THIS KEY SUPPORT ZONE FOR A REVERSAL. B. Market Overview Looking at the 4-hour chart, Dogecoin is clearly trading in a heavy downtrend. We’ve seen a sustained bleed from the 0.09810 highs, with price action consistently making lower highs and lower lows. Currently, DOGE is hovering around 0.06589, showing a slight 24-hour bounce of +1.30%, but the broader market structure remains incredibly weak. The immediate resistance is formed by the 4H EMAs, which are acting as a ceiling. Specifically, the EMA7 is at 0.06556, the EMA14 at 0.06629, and the EMA28 sitting higher at 0.06762. The price is struggling to gain momentum above these dynamic resistance levels, and until we see a clean break and close above the EMA cluster, the bears remain in full control of this timeframe. C. Volume Analysis The 24-hour turnover sits at 85.09M USDT, with a 24-hour range between 0.06294 and 0.06665. What I’m paying close attention to is the volume behavior at the current lows. We are seeing some participation attempting to defend the 0.06294 support level, which resulted in that slight green daily candle. However, this volume isn't aggressive enough to signal a definitive trend shift yet. It looks more like sellers are exhausted in the short term rather than buyers aggressively stepping in. D. My Trading Plan Given the strong downtrend, I’m not looking to catch a falling knife blindly. My plan is to wait for confirmation of a short-term bottom. · Initial Entry Zone: I’m interested in a speculative long if price reclaims the EMA7 and EMA14, roughly between 0.0656 and 0.0663. A 4H close above this zone would signal a temporary shift in momentum. · Preferred DCA Level: If we see a sweep of the recent lows, my preferred DCA level is right around the 0.06290 support. · First Resistance: The immediate hurdle is the EMA28 at 0.06762. · Primary Target: If the setup confirms, my first realistic target is a retest of the recent structural breakdown area around 0.07170. · Additional Upside Potential: If broader market sentiment turns bullish, the next major liquidity zone sits near 0.08050. E. What Could Go Wrong? This is still a bearish chart, so risk management is vital. The main risk is that this small bounce is just a relief rally before another leg down. If the price fails to hold the 0.06294 support level, the setup is invalidated, and we could see a rapid flush toward deeper demand zones. A 4H candle close below 0.06294 would confirm continued bearish dominance, and I would immediately step aside rather than trying to guess the next bottom. F. My Perspective While the overall 4-hour structure is ugly, I find DOGE interesting right here simply because it is sitting at a critical liquidity level. The market has punished altcoins recently, and DOGE is no exception. However, the slight bounce we are seeing suggests short-term sellers might be running out of steam. I’m not expecting a miracle V-shaped recovery, but a relief rally back to the mid-0.07s is a very realistic scenario if buyers can reclaim the EMAs. For now, I’m monitoring the 0.0629 floor like a hawk. If it holds, I’ll look for my entry trigger. If it breaks, I wait. Patience is the trade here. #ByXIMPACT
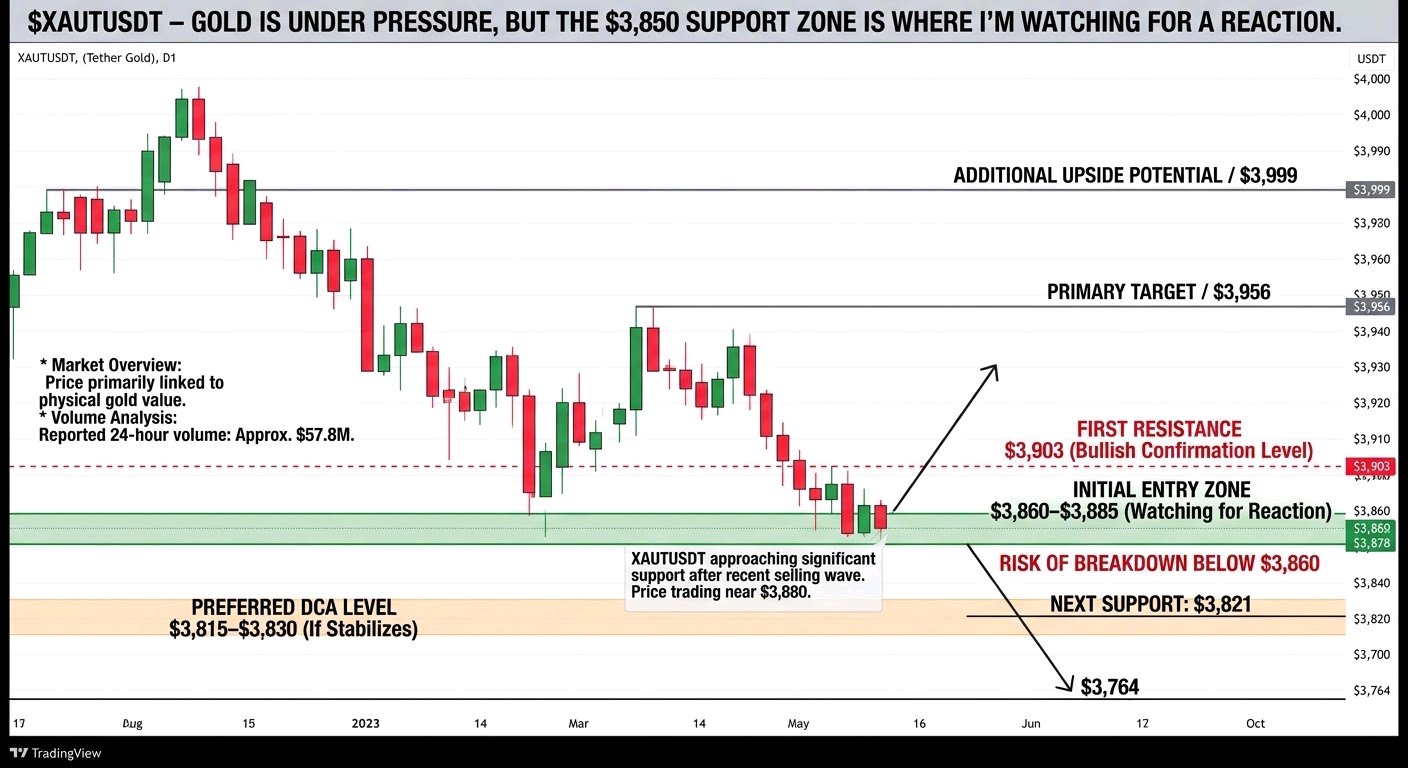
$XAUTUSDT – GOLD IS UNDER PRESSURE, BUT THE $3,850 SUPPORT ZONE IS WHERE I'M WATCHING FOR A REACTION. XAUTUSDT is showing some weakness after another selling wave, with price trading around the $3,880 area. What interests me here is that the market is approaching an important support region after several consecutive sessions of downside pressure. I'm not looking to chase a move in either direction. I want to see how buyers react around the recent lows because that reaction could determine whether XAUT starts recovering or extends its correction. Market Overview XAUT, also known as Tether Gold, is different from most crypto assets because it represents tokenized gold rather than a typical speculative cryptocurrency. Its price is primarily linked to the value of physical gold. The recent market structure is showing weakness. XAUT has declined from the $4,000 area and is now testing the lower part of its recent trading range. The latest available Binance market snapshot shows approximately $3,878, with a 24-hour decline of around 2.15%. Interestingly, Bitcoin also experienced a larger decline over the same reported period. This highlights why I prefer analyzing XAUT through gold-market conditions rather than treating it exactly like a regular altcoin. My attention is on the daily and 4H structure, particularly whether price can reclaim nearby resistance. Volume Analysis The reported 24-hour Binance trading volume is approximately $57.8M. This indicates meaningful market participation, but volume alone doesn't confirm that buyers are taking control. I'm watching for stronger buying activity around support and whether the next recovery attempt can hold its gains. If volume expands during an upward move and price reclaims resistance, that would give me more confidence in a potential recovery. My Trading Plan I'm approaching XAUT with a cautious bullish recovery scenario, but I want confirmation before committing to a position. Initial Entry Zone: $3,860–$3,885 This is the immediate support region I'm watching. I would prefer to see buyers defend the area and establish a bullish reaction before considering an entry. Preferred DCA Level: $3,815–$3,830 This is a deeper support area near the next daily support reference. I would only consider adding if the market stabilizes rather than breaking down aggressively. First Resistance: $3,903 This is the first important recovery level. A sustained move above it would be an encouraging sign that short-term selling pressure is easing. Primary Target: $3,956 If buyers reclaim $3,903, this becomes the next resistance area I'd monitor. Additional Upside Potential: $3,999 A stronger breakout above $3,956 could bring the psychological $4,000 region back into focus. For confirmation, I want to see a solid 4H close above resistance followed by a successful retest. I don't want to mistake a temporary bounce for a confirmed trend reversal. What Could Go Wrong? The biggest risk is that sellers continue controlling the market and push XAUT below its current support region. A sustained breakdown below $3,860 would weaken the immediate recovery setup. If that happens, I'm watching $3,821 as the next important support reference, followed by the $3,764 area. A failure to hold these levels would suggest that the correction still has room to develop. I also want to avoid adding positions simply because the price looks cheaper. Support must produce a reaction, and risk should remain controlled if the market continues lower. My Perspective XAUT is interesting because its current weakness comes at a time when the market is testing an important gold-linked support region. I'm not expecting an immediate recovery without confirmation. The first thing I want to see is buyers defending $3,860 and pushing price back above $3,903. If that happens, $3,956 and eventually $3,999 become reasonable upside areas to monitor. For now, my bias is cautiously bullish only if support holds and buyers regain short-term control. Otherwise, I would rather wait for a better setup than force a trade. My key focus is simple: watch $3,860 for support and $3,903 for confirmation. The next meaningful move will depend on which side takes control of this range. #IMPACTbyTrade $MNTUSDT