TUWALLIYE
3995Me gusta0Compartir en el chat92Aficionados40Seguir
Technical Analysis and Risk management
Technical Analysis and Risk management
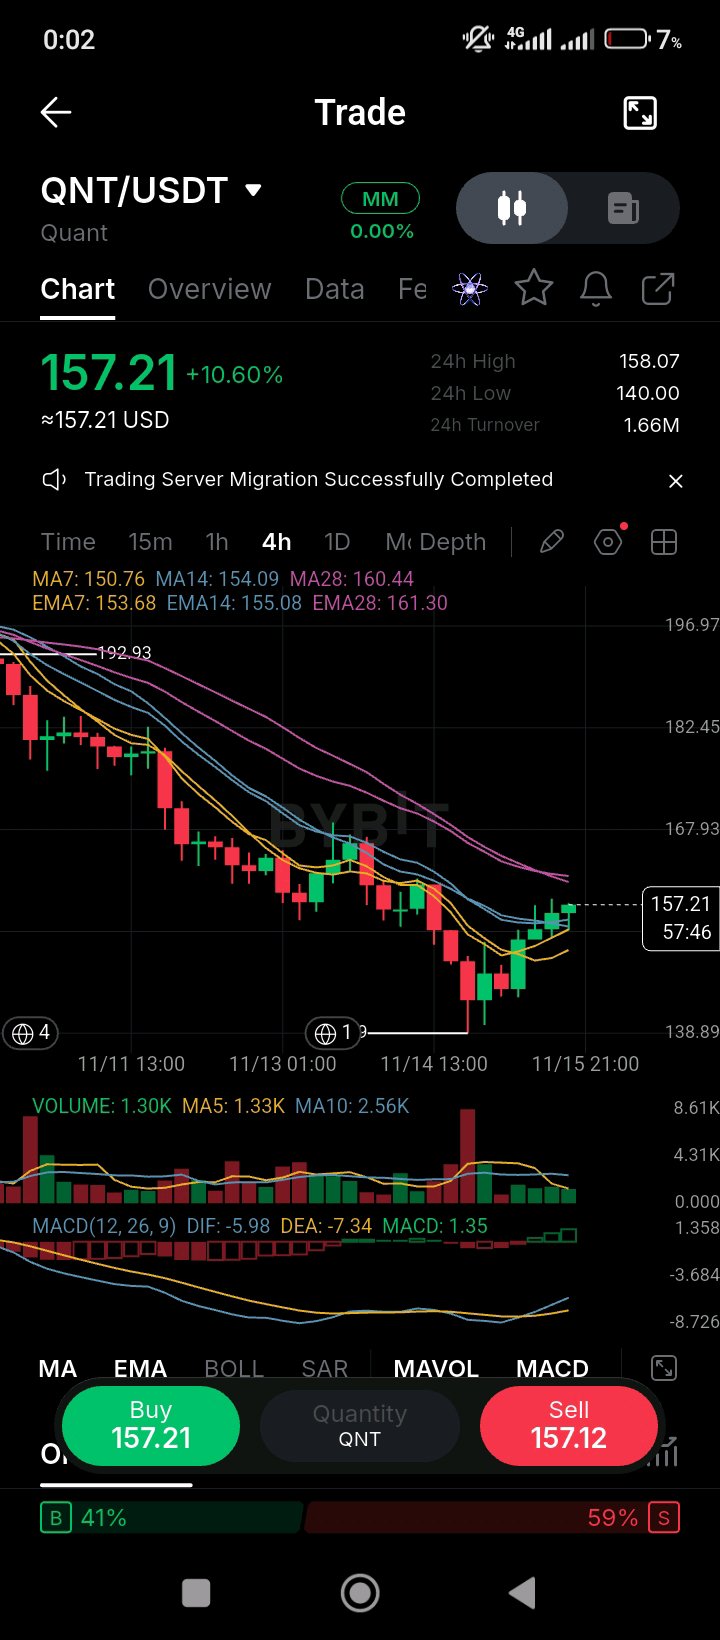
QNT bounced 10.6% off a 140 low today to 157.21, but it's still about 19% below where it traded at the start of the week and the order book is leaning sell. The November 5 move was a market-wide selloff: CoinMarketCap put QNT's 5.7% drop that day at roughly the same size as a 5.2% fall in total crypto market cap, with no Quant-specific news. The same day, COINOTAG reported a 6.9% rally on reports that The Clearing House was moving tokenized-deposit payments onto Quant's network. So the token is still trading on two different stories: the banking adoption that drove September's surge, and the risk appetite that sets the day-to-day moves. The bank pilots haven't been reversed, but they haven't produced steady buying either. On the chart, QNT is up 10.60% to 157.21, with a 24-hour range of 140.00 to 158.07. Price is above the MA7 (150.76), MA14 (154.09) and EMA7 (153.68) and EMA14 (155.08), but still under the MA28 (160.44) and EMA28 (161.30). MACD is positive (1.35), with the DIF (-5.98) crossing above the DEA (-7.34). Volume (1.30K) is roughly level with the MA5 (1.33K) and well below the MA10 (2.56K), so the bounce isn't drawing much buying. The order book is 59% sell-side. The 160.4 to 161.3 MA28 and EMA28 are the level to clear. A close above them on rising volume would bring the 165 area back into view. A loss of 140 would reopen the early-week lows. $QNTUSDT #ByXIMPACT
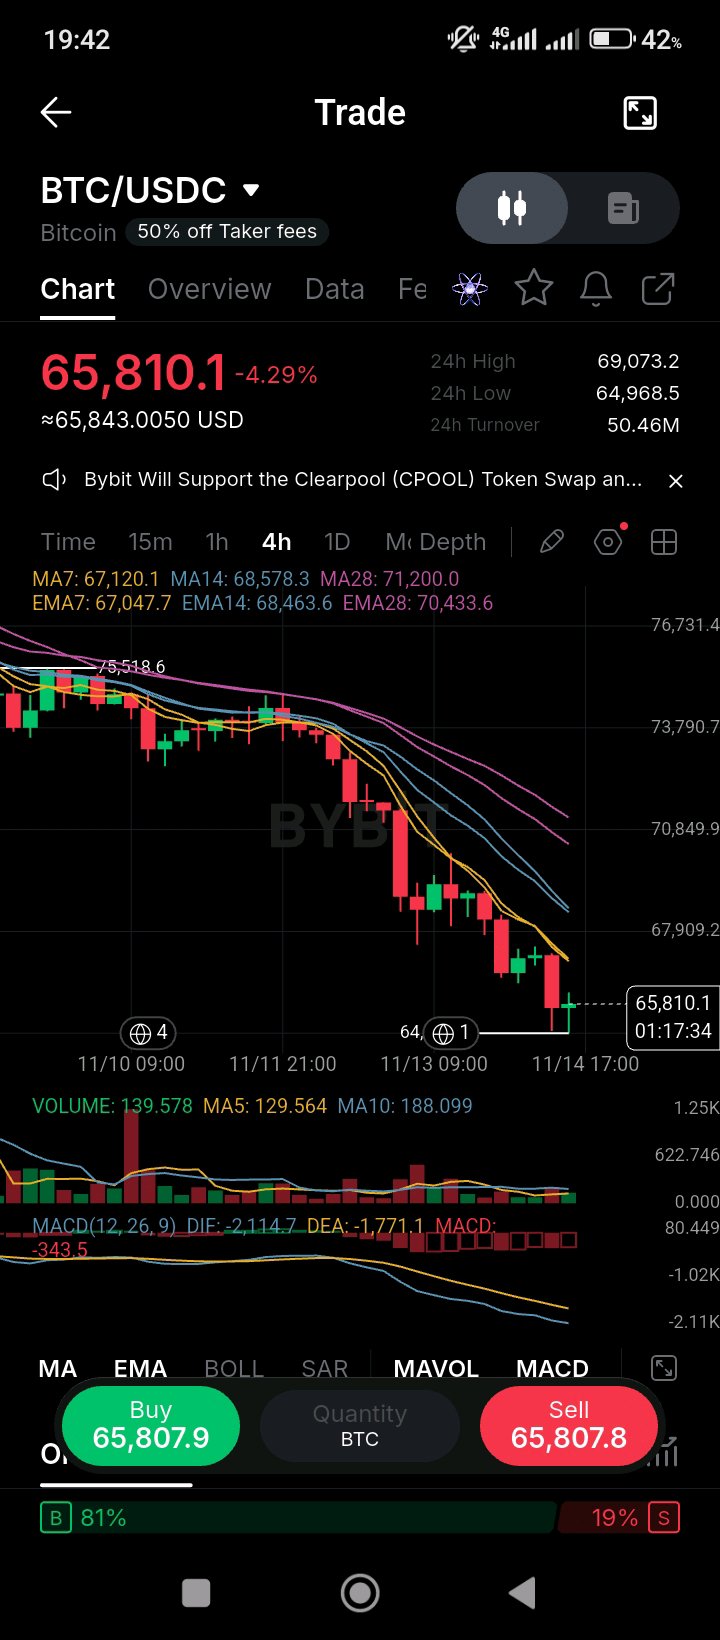
Bitcoin broke below $66,000 today, and $215 million of leveraged positions were liquidated in one hour, so the chart is now in forced-selling territory. On November 9, Bitcoin closed below its 50-week moving average, at about $75,488, for the first time since September, and more than $1 billion of crypto long positions were liquidated in 24 hours. Today's move extends that break: 24/7 Wall St reported the drop below $66,000 at about 9:56 a.m. ET, and Ethereum fell below $1,850 in the same hour. Spot ETF flows have been the other half of the story. The Block reported heavy outflows around the November 9 move, which removed the institutional bid that carried the summer rally. I haven't been able to verify a single trigger for today's sell-off, so I'm not attributing it to one. On the chart, BTC is down 4.29% to 65,810.1, with a 24-hour range of 64,968.5 to 69,073.2. Price is below every moving average shown: the MA7 (67,120.1), MA14 (68,578.3) and MA28 (71,200.0), and the EMA7 (67,047.7), EMA14 (68,463.6) and EMA28 (70,433.6). MACD is deeply negative (DIF -2,114.7 under DEA -1,771.1), and the histogram is at -343.5 and still widening. Volume (139.578) is above the MA5 (129.564) but below the MA10 (188.099), so this leg is being driven by liquidations rather than broad participation. The order book shows 81% buy-side resting bids, which is at odds with the candle. The 64,968 low is the level that matters most. A break below it would open the way toward the 60,000 area that analysts were flagging. A reclaim of the 67,050 EMA7 and 68,460 EMA14 would be the first sign that the liquidation flush is ending. $BTCUSDT #ByXIMPACT
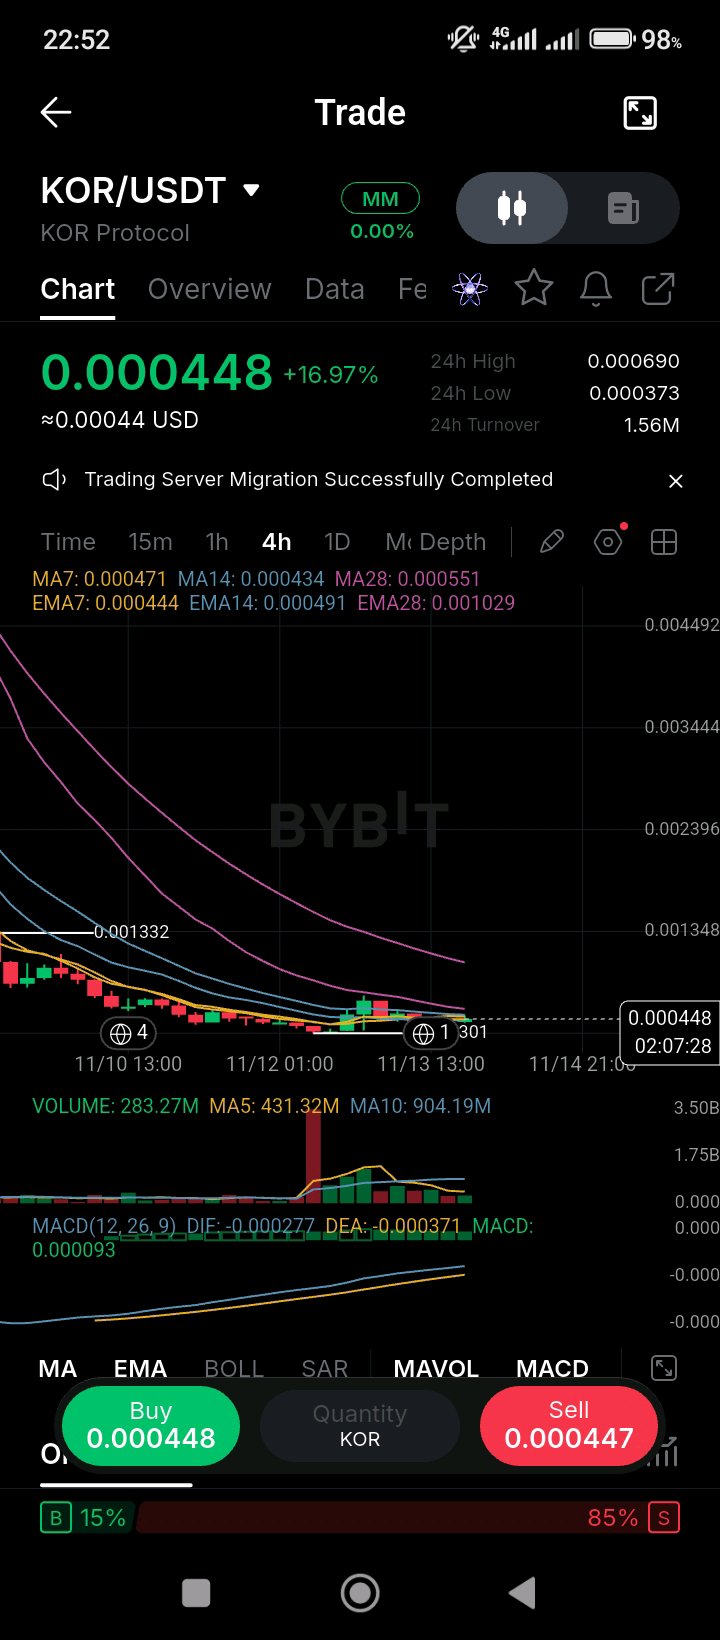
KOR is up 17% today at 0.000448, but it's still about 97% below its November 4 launch high of 0.032, and the token has been dominated by airdrop and reward supply since listing. KOR listed on November 4 and hit an all-time high of about $0.032 that day, then fell hard as the Kor Protocol airdrop claim opened. The claim window closed on November 9 at 14:00 UTC. A CoinMarketCap-linked AI note put the drop down to profit-taking and Launchpool rewards, and KuCoin's two reward campaigns, worth 1.8 million KOR together, run through November 20. Circulating supply is about 2.28 billion of 10 billion, so the unlocked float is small and the pressure from rewards is outsized. Sources disagree on the all-time low, with figures ranging from $0.0005 to $0.0012, and on where the token trades now, so use the chart rather than any single quote. The protocol itself, an onchain clearinghouse for creative assets on Base, and any Binance listing are both unconfirmed. On the chart, KOR is up 16.97% to 0.000448, within a 24-hour range of 0.000373 to 0.000690. Price sits above the MA7 (0.000471)? No, it is below the MA7 but above the MA14 (0.000434) and EMA7 (0.000444), and well below the MA28 (0.000551) and EMA28 (0.001029), so the longer averages are far overhead. MACD is slightly positive (0.000093), with the DIF (-0.000277) still under the DEA (-0.000371). Volume (283.27M) is well below the MA5 (431.32M) and MA10 (904.19M), so the bounce is coming on light volume. The order book is 85% sell-side, which is the main reason to be cautious on this move. The 0.000434 to 0.000444 averages are the level holding this bounce. A loss of the 0.000373 low would reopen the November lows. Rebuilding toward the 0.000551 MA28 would need volume the chart isn't showing yet. $KORUSDT $BTCUSDT #ByXIMPACT
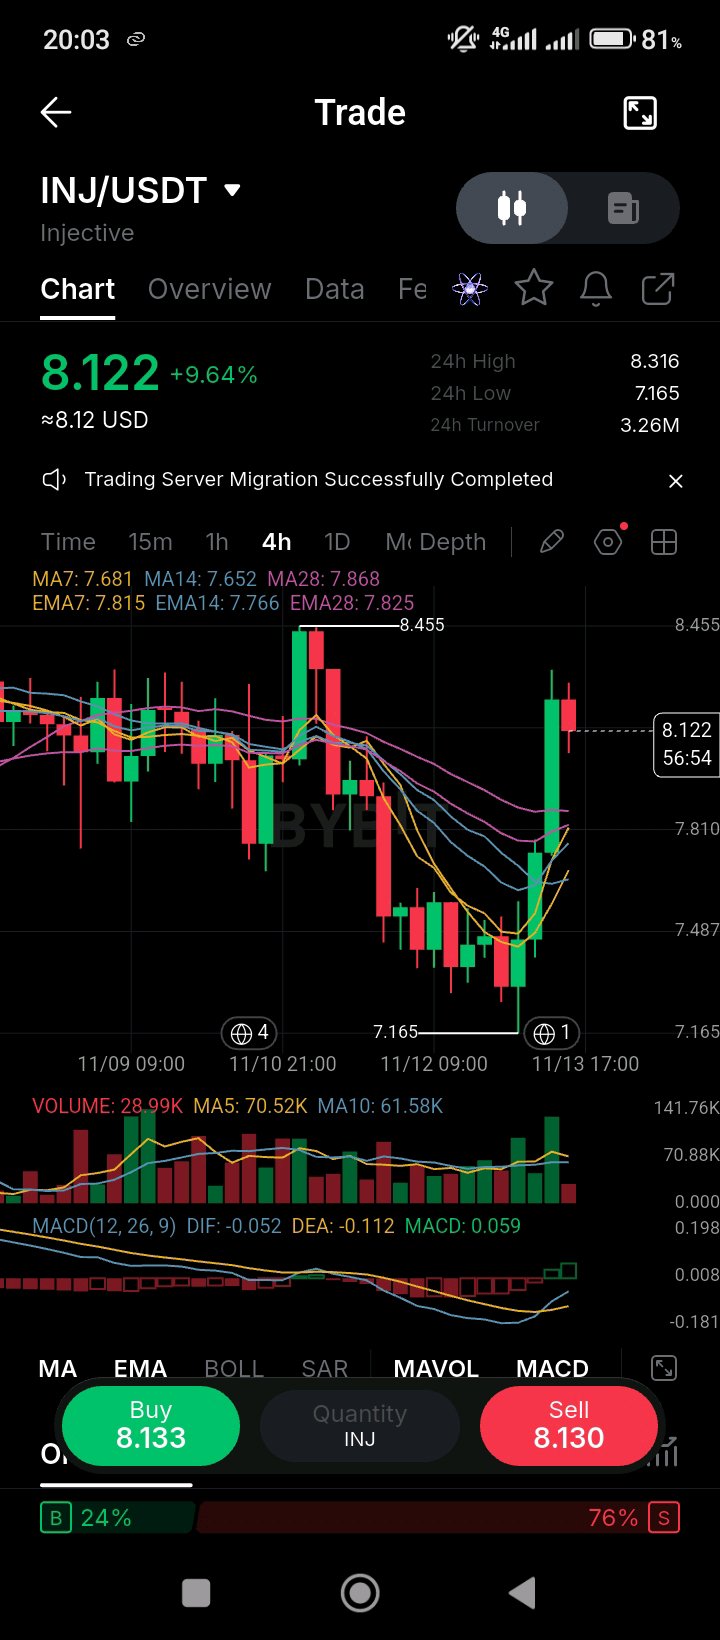
INJ is up 9.64% today to 8.122, the first move above its MA stack since the October high, and the order book is still 76% sell-side. The catalyst is the Canary Staked INJ ETF (INJC), which started trading on Nasdaq on November 5. The fund holds and stakes INJ, and CoinMarketCap credited it with a 3.18% move over the next two days. The launch was the first US product in the category, and the SEC shows a second INJ application, from 21Shares, still pending. On November 8, Injective marked its fifth anniversary and reported $12.86 billion of onchain trading from November 2025 to November 2026, with $1.8 billion of that in perpetuals on real-world assets. Issuance was also cut to 2.2% to 4.4% a year in January, which tightens supply over time. The ETF seeding, though, didn't involve much new spot buying, which is why the move has been choppy. One CMC note said the early INJC inflows looked like seed capital rather than fresh demand, so the staking flows are worth tracking over the next few weeks. On the chart, INJ sits above the MA7 (7.681), MA14 (7.652) and MA28 (7.868), and above the EMA7 (7.815), EMA14 (7.766) and EMA28 (7.825), so the candle has cleared every average shown. The 8.455 high from this week is the next level to clear. MACD is positive (0.059), with the DIF (-0.052) crossing up through the DEA (-0.112). Volume (28.99K) is well under the MA5 (70.52K) and MA10 (61.58K), so the rally is coming on light participation. The order book is 24% buy and 76% sell. The 7.87 MA28 is the nearest support on any pullback, and the 7.65 to 7.82 average band is the cushion below it. A close above 8.46 on rising volume would show buyers chasing the ETF story. A loss of 7.65 would bring the mid-week low of 7.17 back into view. $INJUSDT #ByXIMPACT
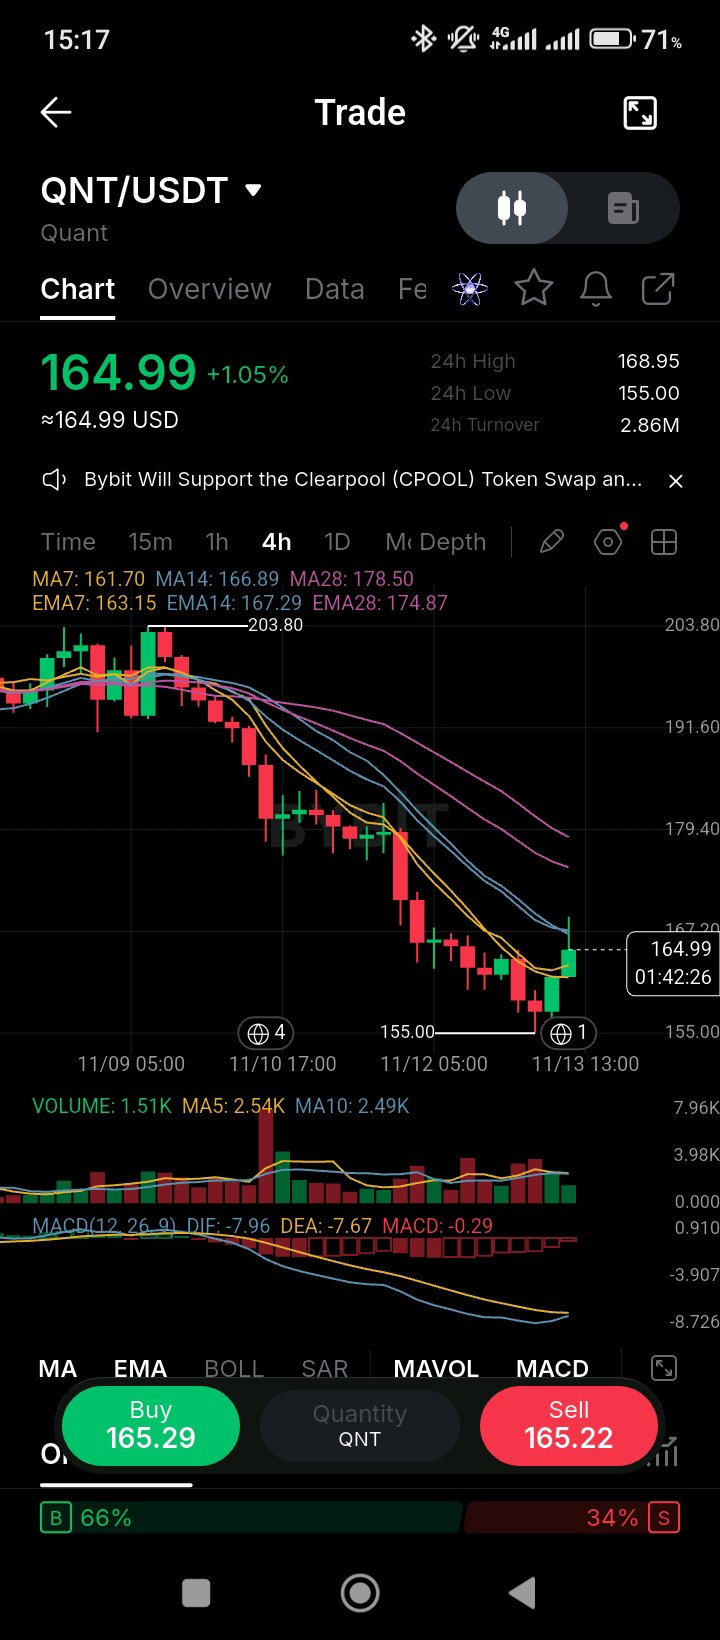
QNT is at 164.99, about 19% below the 203.80 high from November 9, and the decline has tracked the broader market rather than anything Quant announced. On November 5, CoinMarketCap attributed a 5.7% QNT drop to a market-wide selloff that took total crypto market cap down about 5% over 24 hours, and noted no Quant-specific news, listings, unlocks or exploits. On November 10, the drop deepened: coinotag reported QNT fell 6.89% to $187.57 in 24 hours, with open interest rising quickly, which it read as new short positions rather than long liquidations. Bitcoin fell only 0.59% in the same window, so QNT was moving well beyond the market. The same day was the US CPI release, which was the main macro event. The Clearing House partnership and the bank-tokenisation pilots from September are still in place, but the token has traded on sentiment and positioning in November, not on those announcements. The chart is in a clear downtrend. QNT is up 1.05% to 164.99, on a 24-hour range of 155.00 to 168.95. Price sits above the MA7 (161.70) and EMA7 (163.15), but below the MA14 (166.89), MA28 (178.50), EMA14 (167.29) and EMA28 (174.87), so every longer average is stacked overhead. MACD is negative (-0.29), with the DIF (-7.96) under the DEA (-7.67) and both lines falling. Volume (1.51K) is below the MA5 (2.54K) and MA10 (2.49K). The order book leans 66% buy-side on a green bar that is still well under the averages. The 155 low is the level to hold, and the 167 to 167.3 MA14 and EMA14 cluster is the first resistance to clear. A break below 155 would open the next leg lower. $QNTUSDT #ByXIMPACT
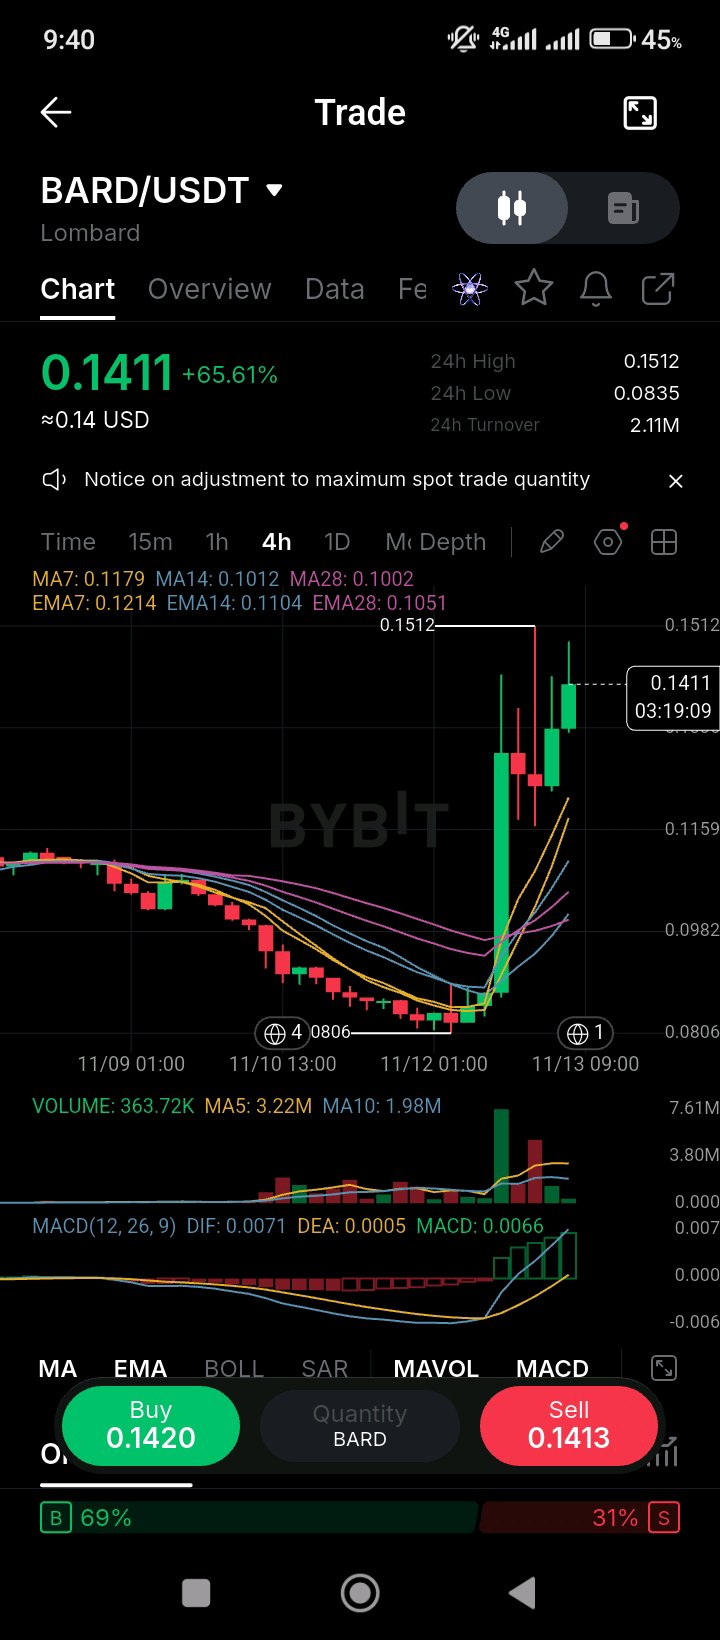
BARD is up 65% today, but there's no catalyst I can confirm for the move, and a token unlock is due in five days. Lombard's BARD launched in early March, peaking at $1.70 on March 5 before falling to a low of $0.1029 on August 3. The protocol's Chainlink CCIP 2.0 migration on September 28 gave it a security upgrade, and the Season 3 airdrop claim closed on October 29. The token's own supply schedule is the immediate risk: RootData lists a 13.75 million BARD unlock on November 18, worth about $1.5 million at current prices, with the same-sized release repeating monthly through early 2027. That's a small unlock against the 340 million circulating, but it arrives right after a 65% rally, so the market will test whether buyers absorb it. I couldn't find a news item that explains today's move, so I'm not attributing it to one. On the chart, BARD is up 65.61% to 0.1411, on a 24-hour range of 0.0835 to 0.1512. Price is far above the MA7 (0.1179), MA14 (0.1012) and MA28 (0.1002), and above the EMA7 (0.1214), EMA14 (0.1104) and EMA28 (0.1051). MACD is strongly positive (0.0066), with the DIF (0.0071) well above the DEA (0.0005). Volume (363.72K) is above the MA10 (1.98M)? No, it's well under both the MA5 (3.22M) and MA10 (1.98M), so the candle is not drawing volume at the level of the recent averages. The order book is 69% buy-side. The 0.1179 MA7 and 0.1214 EMA7 are the support that decides whether the move holds. A close back below 0.1012 would erase most of the gain. $BARDUSDT #ByXIMPACT
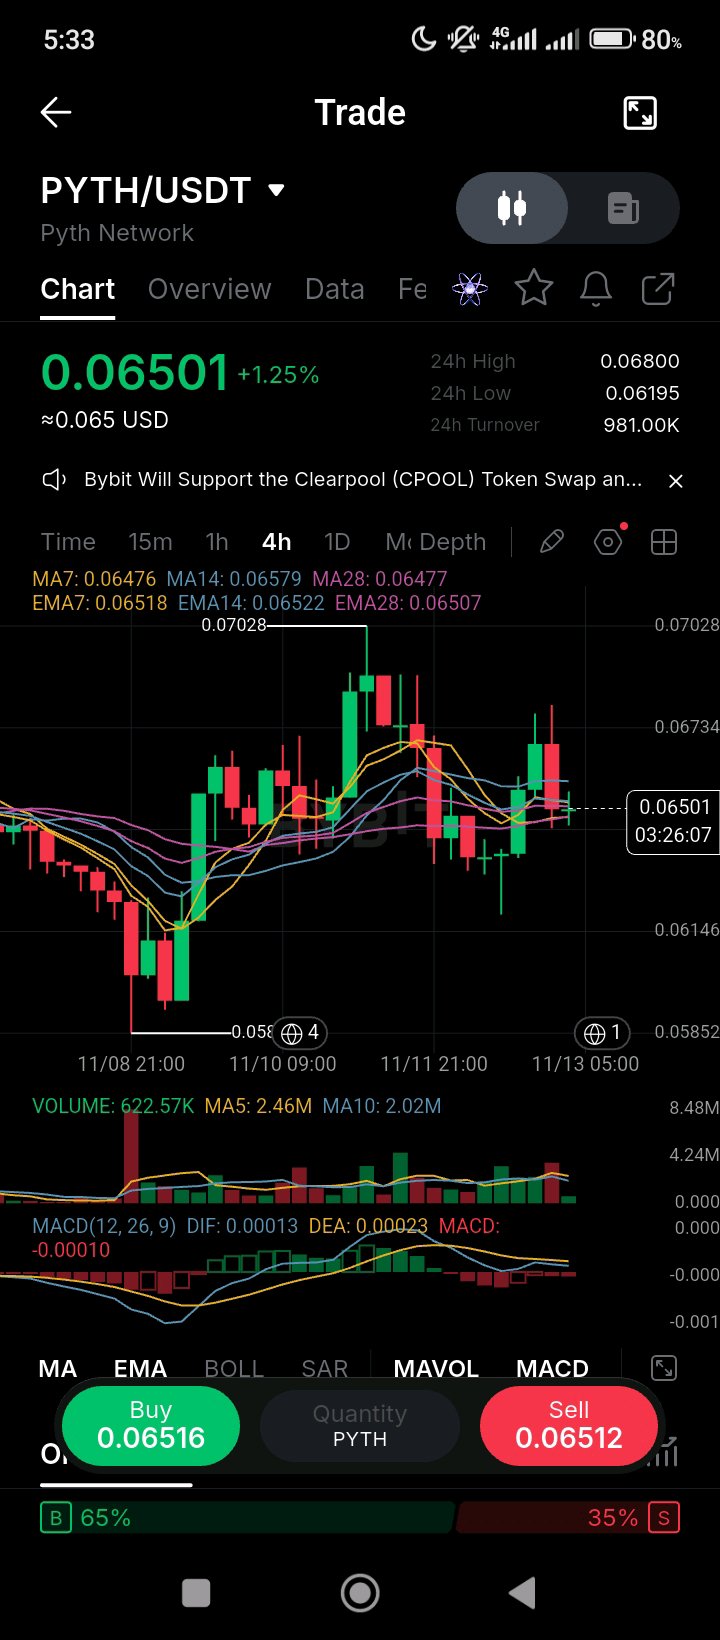
Pyth's revenue has been growing faster than its token price, and the buyback program is the mechanism that's meant to connect the two. Pyth's October 2026 report, published November 3, put annualized subscription revenue at $13.67 million, up 18.9% from September. That's the most concrete number in this thread for a token that has been trading on sentiment. The revenue comes from institutional market data products, and the protocol's RWA perpetuals work has built a role for Pyth's feeds in a large part of tokenized-asset trading. The buyback is the mechanism to watch: the PYTH Reserve, launched in December 2025, directs 33% of the DAO treasury toward monthly open-market purchases, funded by protocol revenue. The bigger check is whether revenue keeps compounding, since the buyback only matters if income keeps funding it. On the chart, PYTH is up 1.25% to 0.06501, with a 24-hour range of 0.06195 to 0.06800. Price sits above the MA7 (0.06476) and MA28 (0.06477) and the EMA7 (0.06518), but slightly below the MA14 (0.06579) and EMA14 (0.06522), so the averages are tangled right at the current price. MACD is slightly negative (-0.00010), with the DIF (0.00013) crossing up through the DEA (0.00023). Volume (622.57K) is well under the MA5 (2.46M) and MA10 (2.02M), so today's candle isn't drawing much participation. The order book is 65% buy-side. The 0.0658 MA14 is the level that decides the next move. A close above it on rising volume would open the way toward the 0.0703 November high. A loss of the 0.0619 low would undo the bounce. $PYTHUSDT #ByXIMPACT
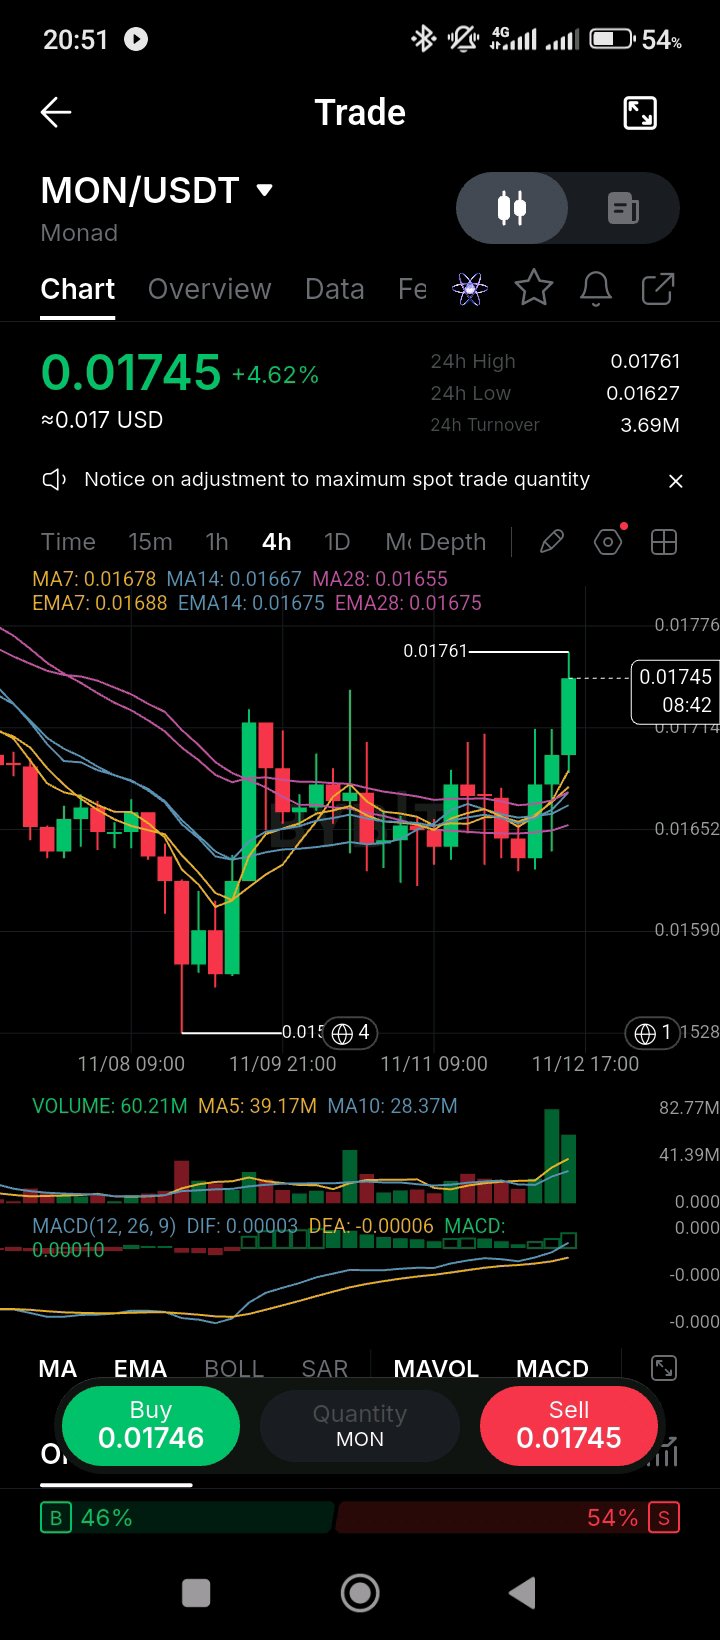
MON is up 4.6% at 0.01745, roughly 35% below its late-September level, and the first insider unlock lands on November 24, twelve days from now. Monad's mainnet and MON token went live on November 24, 2025, with more than 50% of the 100 billion supply locked at launch and vesting through 2029. The first large insider unlock is scheduled for November 24, 2026. Coinspeaker's German coverage puts the release at about 16.8 billion MON, while Cryptorank's coverage describes monthly unlocks of around 1.16 billion after the initial release, and I couldn't reconcile those two figures, so check the vesting schedule before sizing a position. On the positive side, Monad's DeFi TVL passed $1 billion in September, and the network has had at least two upgrades in 2026. On September 29, MON traded near $0.027 with a circulating market cap around $316 million, which means most of the valuation is still in the locked supply, and the unlock is the main variable for the next few weeks. The chart shows a bounce from the 0.01627 low, with the price up 4.62% to 0.01745 and a 24-hour range that tops out at 0.01761. Price is above the MA7 (0.01678), MA14 (0.01667) and MA28 (0.01655), and above the EMA7 (0.01688), EMA14 (0.01675) and EMA28 (0.01675), so the averages are stacked in a tight band below the candle. MACD is barely positive (0.00010), with the DIF (0.00003) above the DEA (-0.00006). Volume (60.21M) is above both the MA5 (39.17M) and MA10 (28.37M), so this push has real participation behind it. The order book is 54% sell-side. The 0.01761 intraday high is the level to clear. The 0.01655 to 0.01688 average band is the support to hold. A loss of 0.01627 would signal the unlock is starting to weigh on the price. $MONUSDT #ByXIMPACT
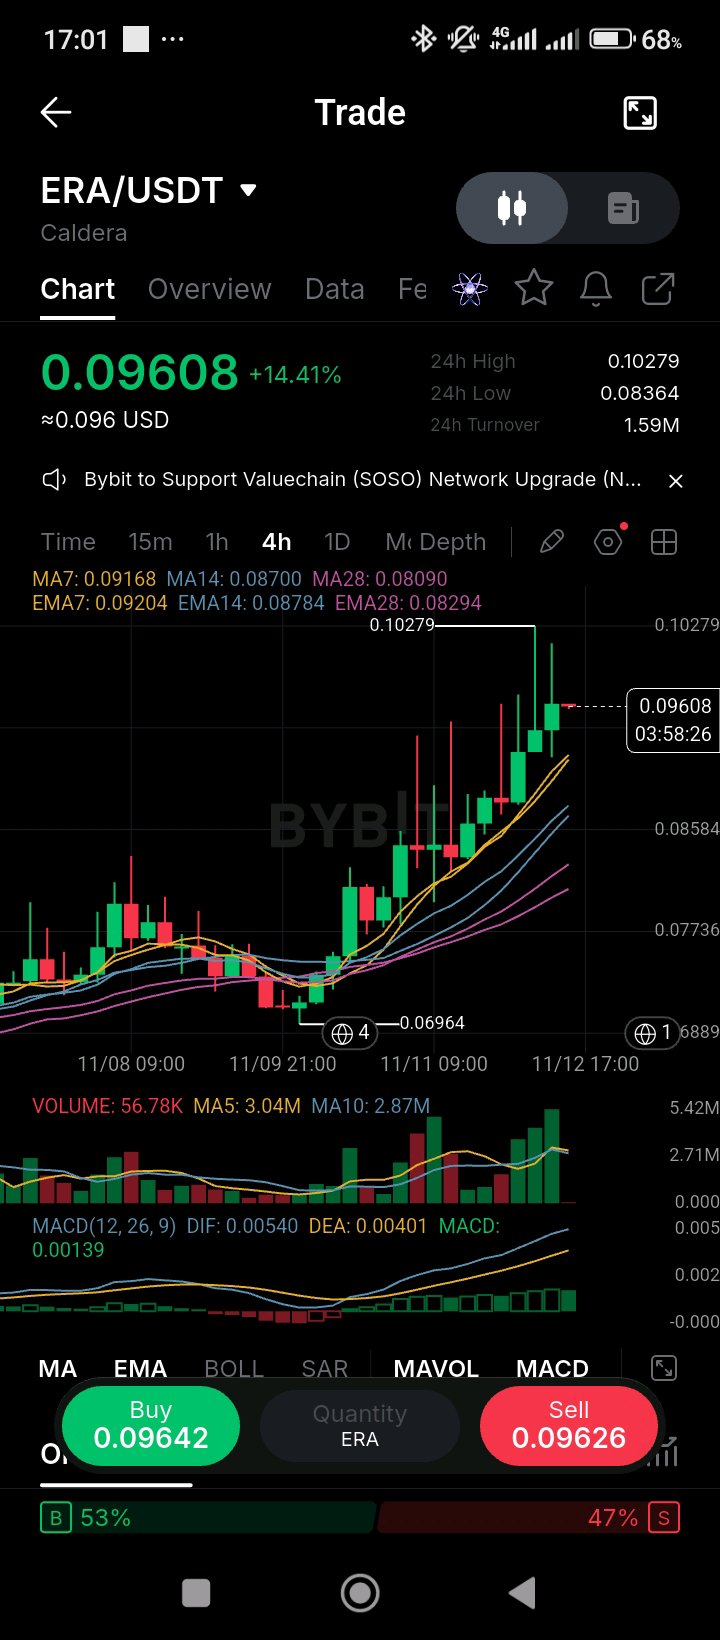
ERA is up 14% today, roughly 40% above its November low of 0.06964, and the move sits against a supply backdrop that's been heavy all summer. Caldera's ERA token, the native token of its Metalayer network for connecting Ethereum rollups, has been dominated by unlocks since July. A July 17 release put between 26.4 million and 77.5 million tokens into the market, which CoinMarketCap put at 12.6% to 52% of market capitalization, and another 26.4 million went to private investors in August. CMC's circulating figure is about 148.5 million out of a 1 billion total, roughly 15% of supply, so the unlock schedule still has a long way to run. The token set its all-time low of about $0.0545 on August 19. Caldera's own announcements haven't tied the November move to a specific catalyst, and CMC's November 10 overview describes the role of ERA only in general terms, so there's no news event to point to here. On the chart, ERA is up 14.41% to 0.09608, on a 24-hour range of 0.08364 to 0.10279. Price is above the MA7 (0.09168), MA14 (0.08700) and MA28 (0.08090), and above the EMA7 (0.09204), EMA14 (0.08784) and EMA28 (0.08294). The 0.10279 high is the level to clear. MACD is positive (0.00139), with the DIF (0.00540) above the DEA (0.00401), so momentum is building. Volume (56.78K) is well under the MA5 (3.04M) and MA10 (2.87M), so this surge is running on very thin participation. The order book is 53% buy-side. The 0.0917 MA7 and 0.0920 EMA7 are the support to hold. A close above 0.1028 on rising volume would be a real breakout. A loss of 0.0870 would undo the move. $ERAUSDT #ByXIMPACT
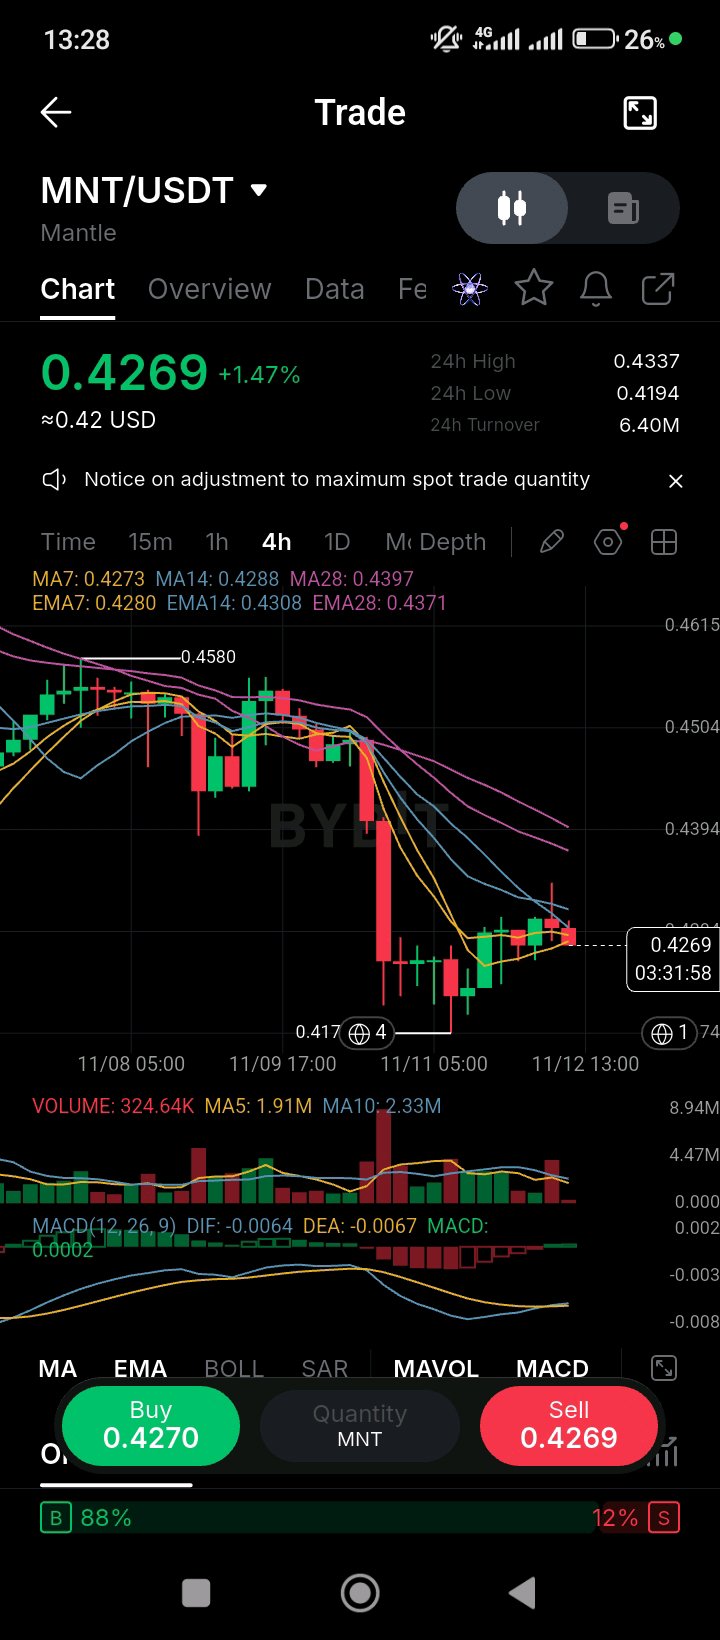
MNT is at 0.4269, down about 60% over the year, and the protocol's next budget cycle is the newest supply item on the table. On October 28, Mantle's core team proposed a fourth budget cycle covering July 2026 to June 2027, with $40 million in USDx and 150 million MNT allocated to operations and ecosystem growth. The plan renews automatically every 12 months, and it can't go to a vote until delegators finish allocating their MNT. The 150 million MNT figure is a meaningful amount of supply directed at ecosystem spending, so the vote outcome matters for the token's supply picture. In July, the Mantle Super Portal moved from LayerZero to Chainlink CCIP, which strengthened MNT's cross-chain security, and the market has largely ignored that upgrade. CoinMarketCap's October 29 note put the 5 to 6% drop that week down to an altcoin selloff rather than anything Mantle-specific, and the CMC coverage from September had credited the USDG integration for a 3.7% gain. On the chart, MNT is up 1.47% to 0.4269, on a 24-hour range of 0.4194 to 0.4337. Price sits above the MA7 (0.4273) and EMA7 (0.4280), but below the MA14 (0.4288), MA28 (0.4397), EMA14 (0.4308) and EMA28 (0.4371), so the overhead averages are still stacked above the price. MACD is essentially flat (0.0002), with the DIF (-0.0064) just above the DEA (-0.0067), so the cross is only starting. Volume (324.64K) is well under the MA5 (1.91M) and MA10 (2.33M), so this bounce is coming on very thin participation. The order book is 88% buy-side. The 0.4288 MA14 and 0.4308 EMA14 are the level to clear. A close above the 0.4397 MA28 would be the first sign of a trend change, and a loss of the 0.4170 low would reopen the November lows. $MNTUSDT #ByXIMPACT
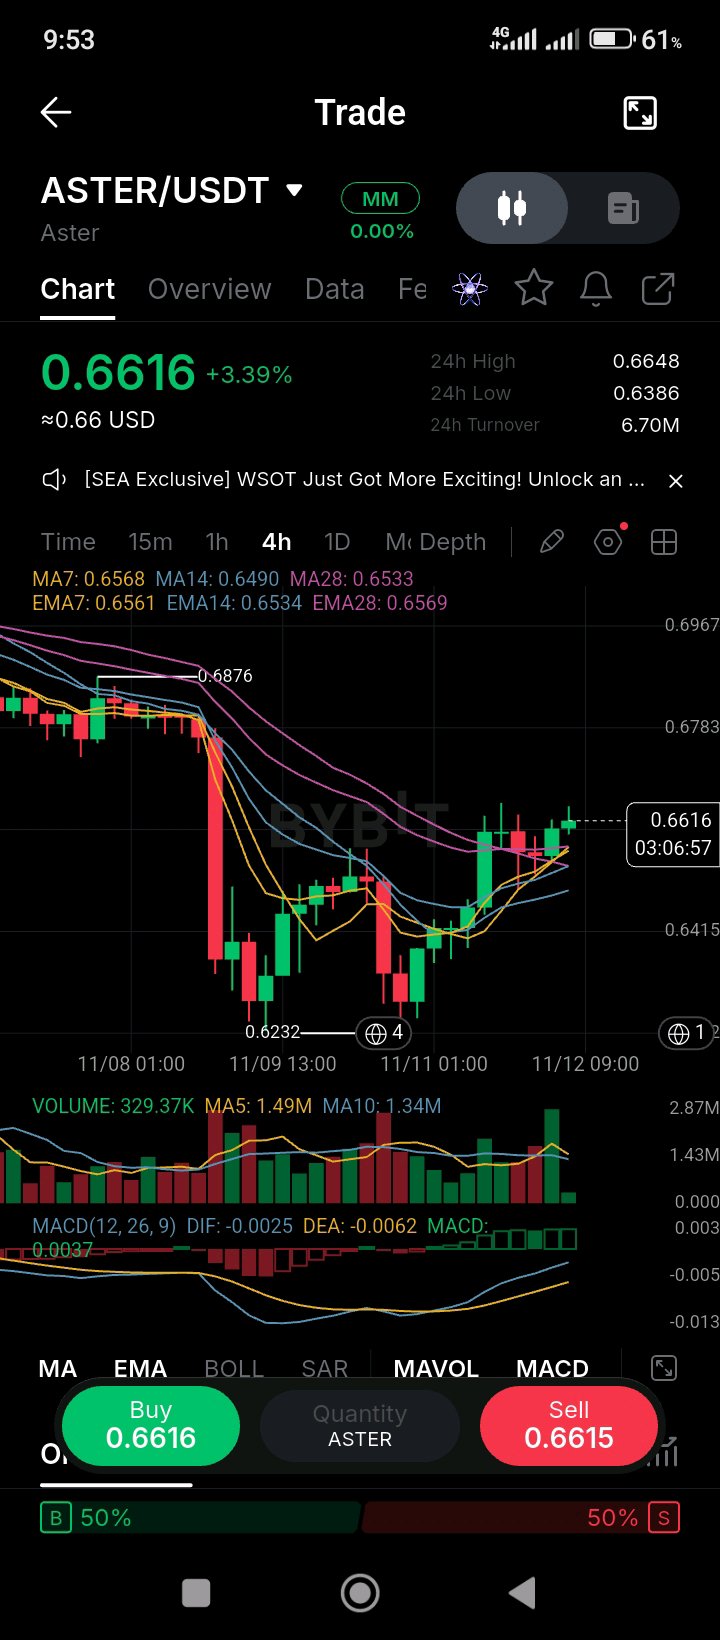
the Stage 6 airdrop is in its claim window through December 4, so the token has a known supply event running alongside the price action. On November 4 at 12:00 UTC, Aster opened the Stage 6 claim for holders who picked the six-month vesting option, letting them claim their full allocation in one step. The claim window runs to December 4, and the allocation page shows how much of the airdrop is still locked. That means a block of tokens that was vesting over months can reach the market within the next few weeks, and claimants who want to take profit will have that option. On the buyback side, the program has been routing up to 99% of daily fees to repurchases since June, and a matching team-allocation burn was added then too. Those buybacks and burns are the offset to that claim supply, and the tug-of-war between them is the main thing to watch this month. On the chart, ASTER is up 3.39% to 0.6616, on a 24-hour range of 0.6386 to 0.6648. Price sits above the MA7 (0.6568), MA14 (0.6490) and MA28 (0.6533), and above the EMA7 (0.6561) and EMA14 (0.6534). The EMA28 (0.6569) is just overhead, which makes it the nearest level to clear. MACD has turned positive on the histogram (0.0037), with the DIF (-0.0025) above the DEA (-0.0062). Volume (329.37K) is well under the MA5 (1.49M) and MA10 (1.34M), so this rebound is coming on light participation. The order book is split 50/50. The 0.6569 EMA28 and 0.6876 November high are the two levels to watch. A close above 0.6569 on rising volume would open the way back toward 0.69 to 0.70. A loss of the 0.6232 low, which came in on November 10, would put the bounce in doubt. $ASTERUSDT #ByXIMPACT
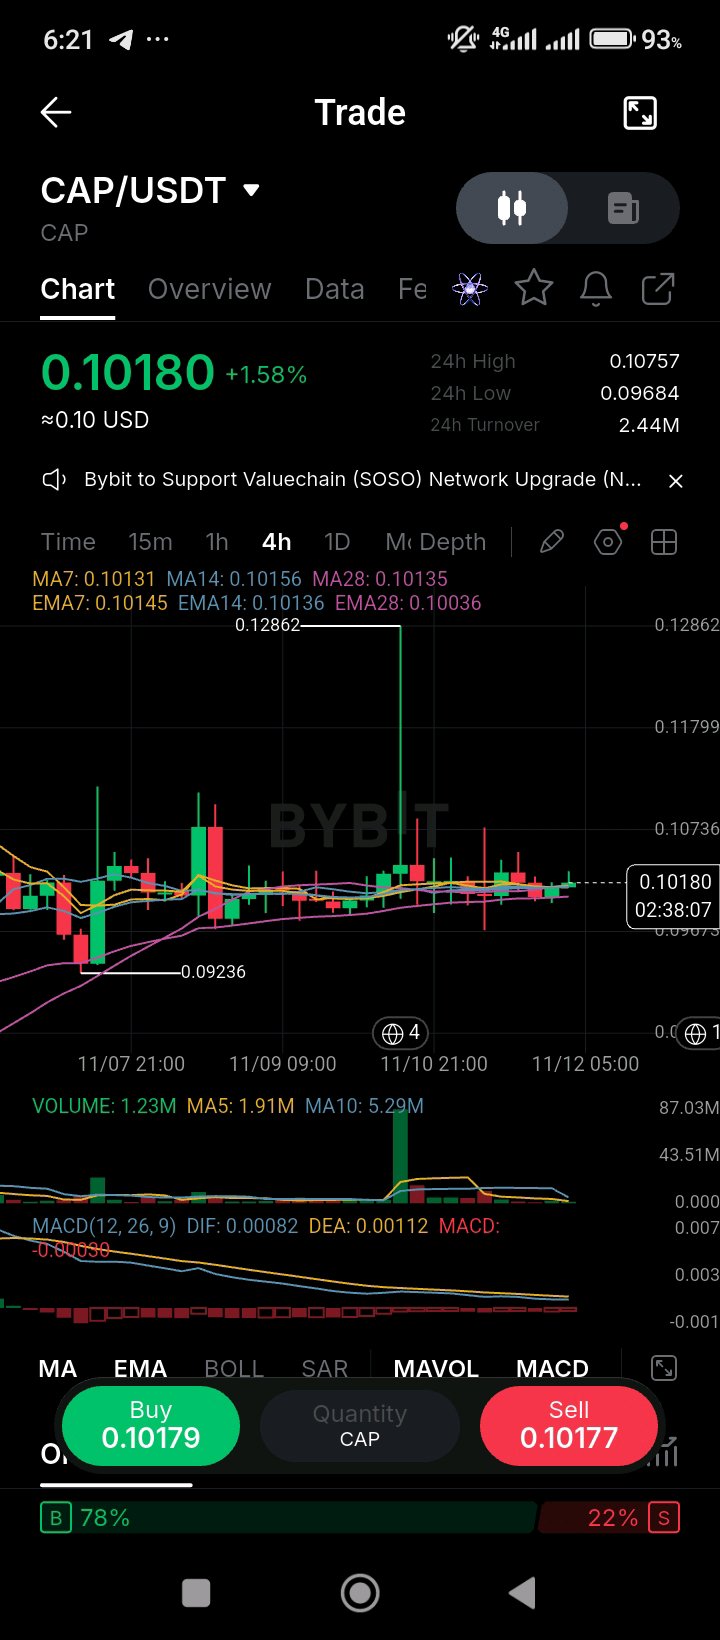
CAP is at 0.1018, about nine and a half times its June auction price, and the chart is holding the averages after a November 10 wick to 0.12862. The auction cleared at $0.011 in late June, a $106 million fully diluted valuation, with $16.4 million of bids from 1,002 participants and 5.5 times oversubscription. Trading began June 26, and by early July the token had posted nearly $900 million of volume in its first 10 days, with a first-day close near a $325 million FDV. The Block lists 1.6 billion CAP circulating out of 10 billion total. At today's price that is roughly a $163 million circulating market cap against about a $1.02 billion fully diluted value, so most of the valuation is still unlocked-in-the-future supply. The governance rights cover risk parameters, borrower whitelisting and fee models, so the token's value depends on protocol decisions rather than on a fixed revenue stream. The chart shows a range after the spike. CAP is up 1.58% to 0.10180, with a 24-hour range of 0.09684 to 0.10757. Price sits on the averages: the MA7 (0.10131), MA14 (0.10156) and MA28 (0.10135) are bunched within a few hundredths of a cent, and the EMA7 (0.10145), EMA14 (0.10136) and EMA28 (0.10036) are in the same band. The 0.09236 low is the level below which this range breaks. MACD is slightly negative (histogram -0.00030), with the DIF (0.00082) above the DEA (0.00112) and the lines close together. Volume (1.23M) is well under the MA5 (1.91M) and MA10 (5.29M), so the range is trading quietly. The order book is 78% buy-side. The 0.1014 to 0.1016 averages are the level to reclaim above. A close above the 0.1286 spike high would be a real breakout. A loss of 0.0924 would undo the range. $CAPUSDT #ByXIMPACT
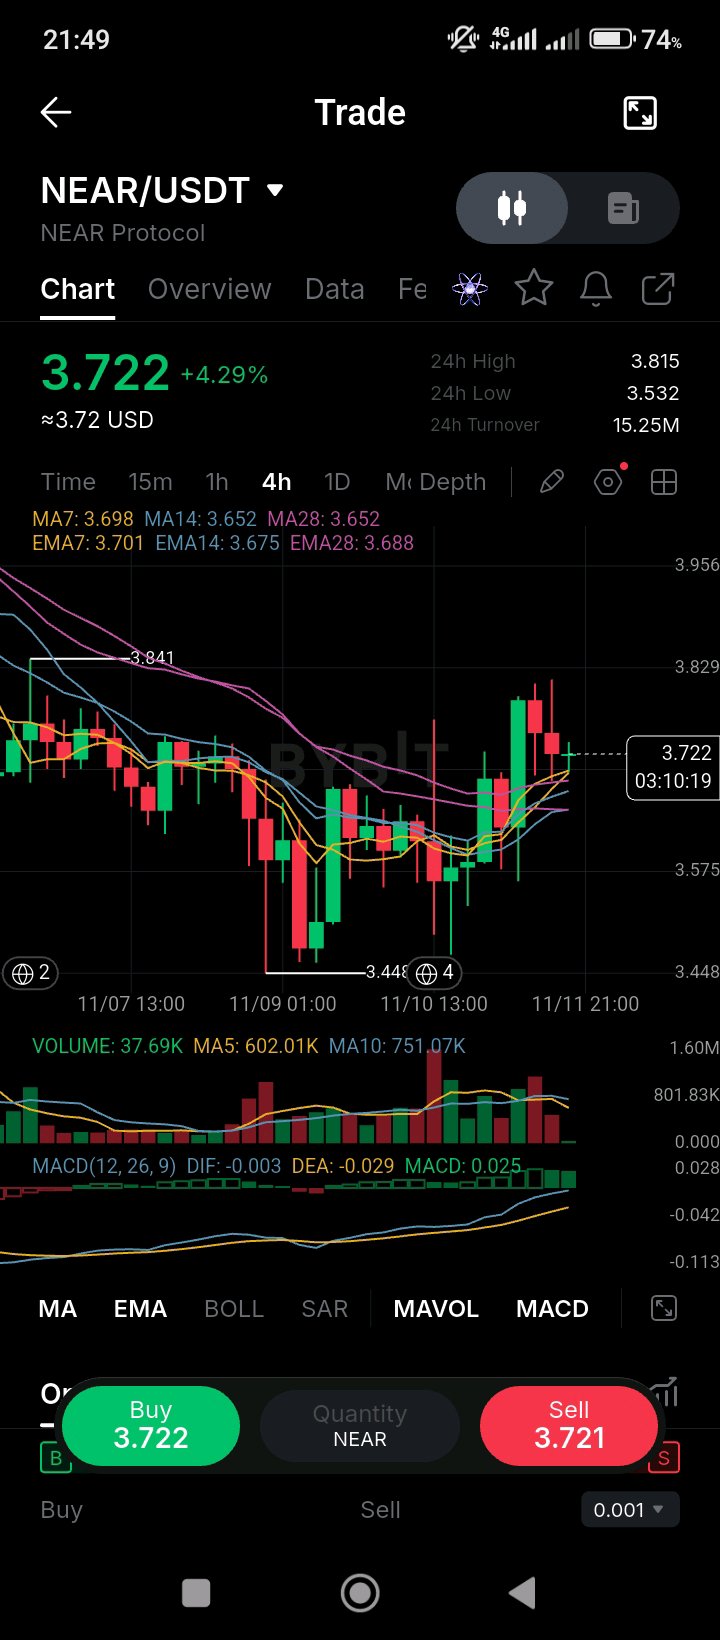
NEAR has been cut back to 3.72, but the supply side got a real change this month, and the Intents business is still growing. On November 2, NEAR holders approved HSP-029, a proposal to cut annual token issuance, with 99.9% of participating voting power in favor. Cointelegraph reported the token fell 7% on November 3 despite the vote, so the market has treated the supply cut as a long-term change, not a short-term catalyst. The protocol's Intents product, the cross-chain trading layer, hit a record daily fee of more than $400,000 in November and passed $10 million in cumulative fees, per Todayonchain. The regulated side is softer. The Bitwise NEAR ETF (NRR) posted its second straight weekly outflow in the week to November 8, totalling $4.38 million. NEAR fell about 15% in the first week of November, and CoinMarketCap put the 200-day average near $3.60 as the key support. On the chart, NEAR is up 4.29% to 3.722, on a 24-hour range of 3.532 to 3.815. Price is above the MA7 (3.698), MA14 (3.652) and MA28 (3.652), and above the EMA7 (3.701), EMA14 (3.675) and EMA28 (3.688), so every average on the chart is now below the price. MACD is positive (0.025), with the DIF (-0.003) above the DEA (-0.029). Volume (37.69K) is well under the MA5 (602.01K) and MA10 (751.07K), so this bounce is running on very light participation. The 3.65 to 3.70 cluster is the level to hold, since it's the MA14, MA28 and EMA7 together. A close above the 3.84 high would show buyers are back. A loss of the 3.60 support would bring the November low back into view. $NEARUSDT #ByXIMPACT
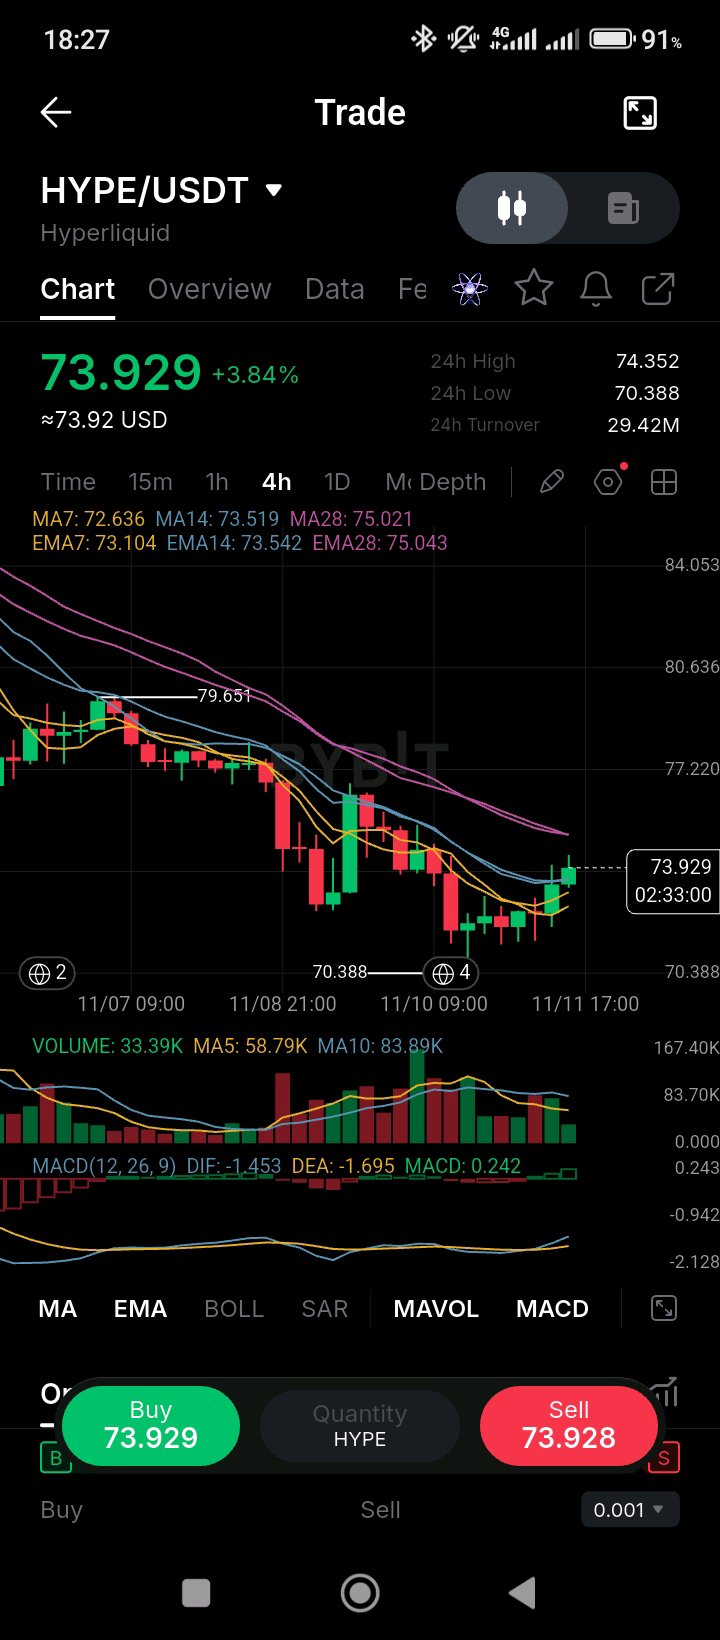
Perfil del Token: Hyperliquid ($HYPE) Hyperliquid ($HYPE) es el activo nativo de utilidad, gobernanza y staking que impulsa a **Hyperliquid**, una appchain de Capa 1 de alto rendimiento creada específicamente para el trading descentralizado de derivados perpetuos. Utilizando un motor de consenso de alto rendimiento construido a medida, capaz de procesar decenas de miles de órdenes por segundo con una finalidad inferior a un segundo, Hyperliquid combina la velocidad y la experiencia de usuario (UX) de un exchange centralizado con la transparencia sin custodia de las DeFi. Respaldado por una tokenomics de estructura fija, asegura la red a través de un consenso de prueba de participación (proof-of-stake) del validador nativo, cubre las comisiones de gas de las transacciones a nivel de protocolo e impulsa la gobernanza del ecosistema en toda su infraestructura de libros de órdenes de spot y derivados en expansión. Análisis Técnico: HYPE/USDT — Rebote Local y Prueba de Media Móvil de 4 Horas (4H) En el gráfico de 4 horas, HYPE cotiza alrededor de **$73.929** (+3.84%)[span_0](start_span)[span_0](end_span), iniciando una recuperación tras su reciente mínimo local de **$70.388**[span_1](start_span)[span_1](end_span) después de una corrección de varios días desde su máximo de **$79.651**[span_2](start_span)[span_2](end_span). * **Acumulación de Resistencia Dinámica de Medias Móviles:** La acción del precio está probando actualmente la resistencia inmediata superior creada por la cinta de medias móviles[span_3](start_span)[span_3](end_span). El precio ha superado los **$72.636 (MA7)**[span_4](start_span)[span_4](end_span) y **$73.104 (EMA7)**[span_5](start_span)[span_5](end_span), y está presionando directamente contra los **$73.519 (MA14)**[span_6](start_span)[span_6](end_span) y **$73.542 (EMA14)**[span_7](start_span)[span_7](end_span). Una resistencia superior más alta se sitúa en los **$75.021 (MA28)**[span_8](start_span)[span_8](end_span) y **$75.043 (EMA28)**[span_9](start_span)[span_9](end_span). Se requiere un cierre decisivo de 4 horas por encima de los $73.55 para confirmar un cambio estructural y apuntar hacia un impulso hacia la zona de liquidez de $77.22–$79.65[span_10](start_span)[span_10](end_span). * **Base de Soporte y Barrido de Suelo:** El soporte local inmediato está firmemente anclado en el suelo de **$70.388** (con mínimos de 24 horas en $70.388)[span_11](start_span)[span_11](end_span). Mantener la acción del precio por encima de este nivel mantiene intacto el rango de consolidación a corto plazo[span_12](start_span)[span_12](end_span); una ruptura por debajo de $70.38 corre el riesgo de expandir el movimiento bajista hacia una demanda macro más profunda[span_13](start_span)[span_13](end_span). * **Perfil de Volumen y MACD:** El volumen de 4 horas se registra en **33.39K HYPE ($29.42M USDT de volumen de negocios en 24h)**[span_14](start_span)[span_14](end_span), mostrando una absorción constante por parte de los compradores desde el mínimo (con una MA de volumen de 5 periodos de 58.79K y una línea base de 10 periodos de 83.89K)[span_15](start_span)[span_15](end_span). El MACD de 4 horas (DIF: -1.453, DEA: -1.695) ha impreso un cruce alcista con un histograma positivo (**MACD: +0.242**)[span_16](start_span)[span_16](end_span), lo que señala una transición de impulso hacia territorio positivo mientras el precio desafía la resistencia de la media móvil de 14 periodos[span_17](start_span)[span_17](end_span). ¿Estás comprando HYPE al contado cerca del suelo de soporte de $70.38, o esperando un cierre confirmado de 4 horas por encima del clúster de medias móviles de $73.55? $HYPEUSDT #ByXIMPACT
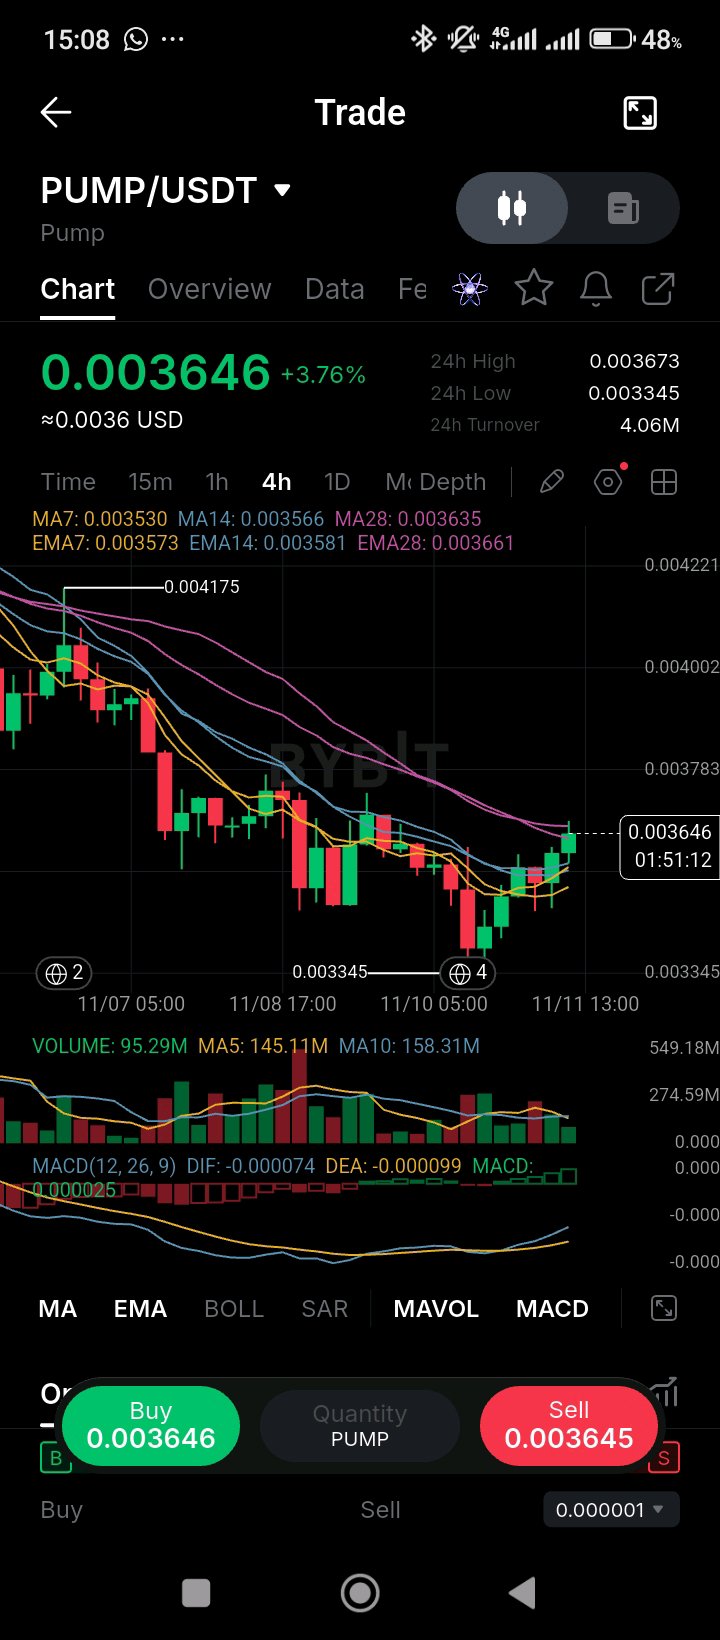
PUMP is up 3.76% today, but the bigger story is the platform's own treasury sales, which are weighing on the token. According to a crypto.news report summarized by CoinMarketCap on November 7, Pump.fun moved another 76,111 SOL, worth about $6.85 million, to a Kraken deposit address on November 6. That brings its estimated cumulative SOL sales to about 5.55 million SOL, roughly $882 million, at an average of about $158.88. The same day, PUMP fell 3.32% in a weak market, and CoinMarketCap tied the move to beta and de-risking rather than a platform-specific break. Whether those SOL sales are treasury management or something else is disputed, and Pump.fun hasn't given a full accounting, so the number is best treated as a reported figure. The token's supply policy is clearer: in April, the platform burned about 36% of circulating supply, roughly $370 million of PUMP, and moved to a 50% revenue buyback model. On the chart, PUMP is up 3.76% to 0.003646, on a 24-hour range of 0.003345 to 0.003673. Price sits above the MA7 (0.003530) and MA14 (0.003566), and the EMA7 (0.003573) and EMA14 (0.003581), but it's still under the MA28 (0.003635)? No, price is above it too, so the price sits above every average on the chart except the EMA28 (0.003661), which is just overhead. MACD is turning positive (0.000025), with the DIF (-0.000074) just under the DEA (-0.000099). Volume (95.29M) is well below the MA5 (145.11M) and MA10 (158.31M), so the bounce isn't drawing much buying. The 0.004175 high from November 7 is the level to reclaim. The EMA28 at 0.003661 is the close to clear. A break above it on rising volume would test the 0.004175 high. A loss of 0.003345 would put the sell-off back in control. $PUMPUSDT #ByXIMPACT
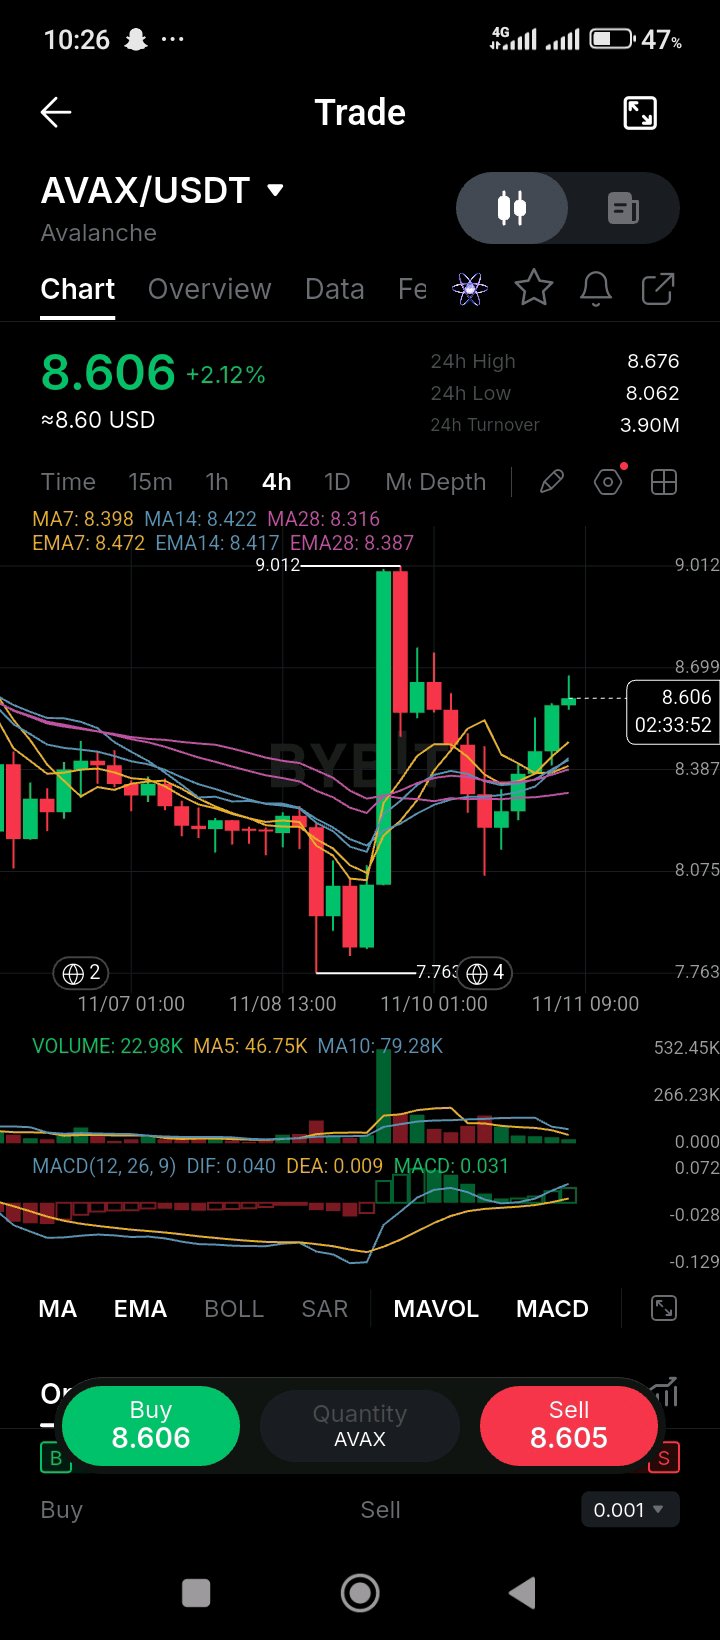
AVAX/USDT — AVAX is back above $8.60 after falling below $8 on November 8, and the chart is now sitting between two groups of moving averages with the next unlock already behind it. On November 8, the Avalanche Foundation's scheduled vesting released 1,666,800 AVAX, worth about $14 million at October 31 prices and under 0.4% of the 444 million in circulation. It was a planned step on the published schedule, not a new decision, so its direct price impact is small. The bigger context is the drop: per cryptonews, AVAX fell 27.6% over the 28 days ended November 8, which left it below $8 and lagging both Bitcoin and Ether. On the treasury side, AVAT's preliminary Q3 report from November 5 shows 13.31 million AVAX held as of September 30, with about 91% staked, which means most of its position is earning yield rather than sitting idle. Full Q3 results and a call are due on November 19. On the chart, AVAX is up 2.12% to 8.606 on a 24-hour range of 8.062 to 8.676. Price sits above the MA7 (8.398), MA14 (8.422) and MA28 (8.316), and above the EMA7 (8.472) and EMA14 (8.417), but still under the EMA28 (8.387)? No, above it too, so price is above every average on the chart. The spike high is 9.012 and the low is 7.763. MACD is positive (0.031), with the DIF (0.040) above the DEA (0.009). Volume (22.98K) is under half the MA5 (46.75K) and well below the MA10 (79.28K), so this bounce isn't drawing much participation. The 8.42 MA14 and 8.47 EMA7 are the first levels to hold. A close back above 9.01 would open the November spike high, and a loss of 8.32 would put the 7.76 low in view. $AVAXUSDT #ByXIMPACT
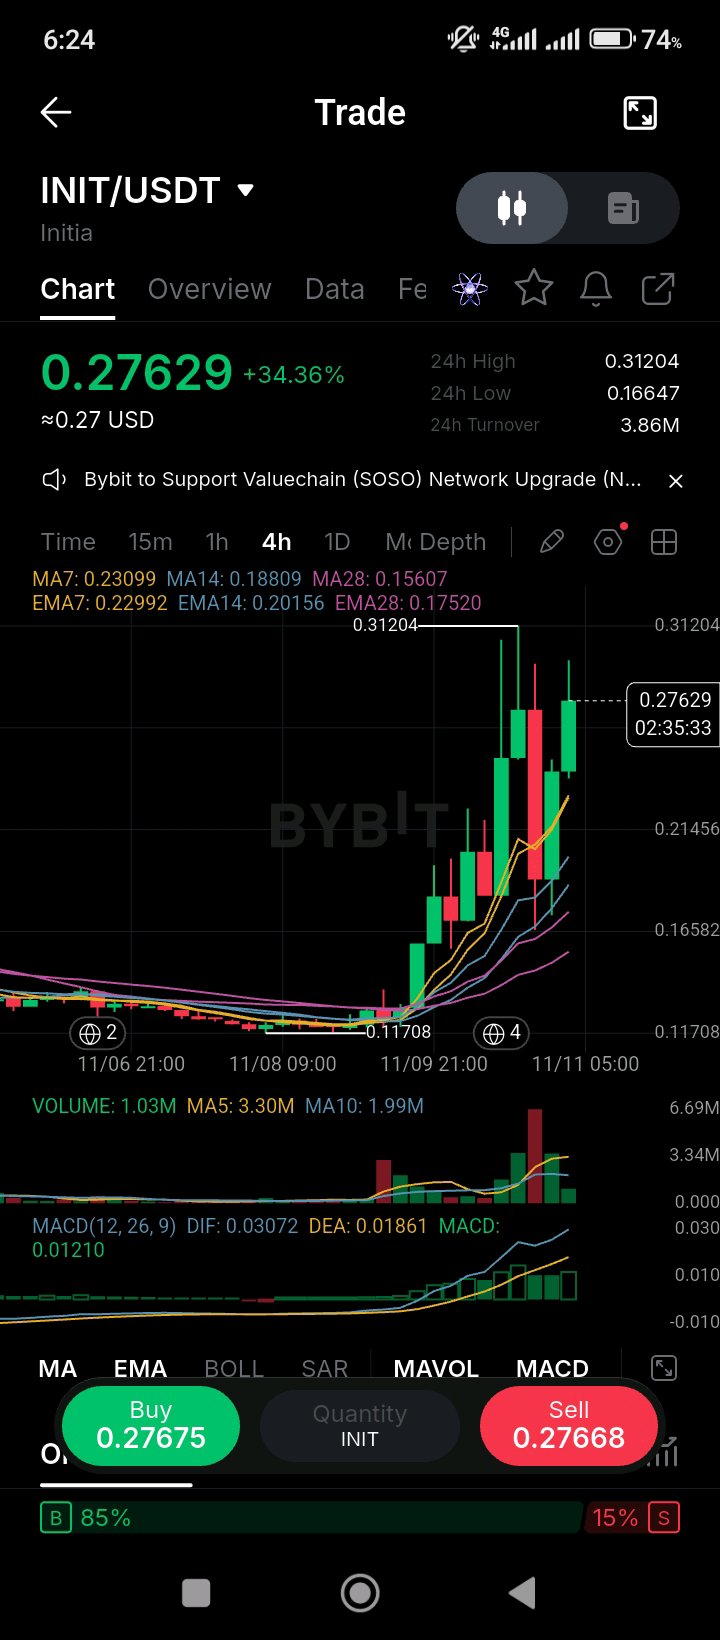
$INITUSDT Initia rallied more than 34% today even after its L1 was halted following a $615K exploit, which makes this a rally that the market is treating as separate from the security risk. On November 10, Initia halted its layer-1 chain after compromised rollup keys let an attacker drain about $615K, according to Whale Alert and Crypto News. The network's native token reportedly surged more than 60% at one point, while the exploit itself is still being reported as it develops. This is the second security incident in the past few weeks, following an October 23 event where reports said an attacker minted tokens. The team's unlock delay, which moved investor vesting to April 2027, was the main supply-side positive earlier this year. Holding a halted chain is still a bigger issue than a price spike, and any restart, post-mortem, or compensation plan will matter more than the current candle. The chart shows the move from the 0.11708 low to a 0.31204 high, and today's bar is up 34.36% to 0.27629. Price sits well above its MA7 (0.23099), MA14 (0.18809) and MA28 (0.15607), and above the EMA7 (0.22992), EMA14 (0.20156) and EMA28 (0.17520). MACD is positive (0.01210), with the DIF (0.03072) above the DEA (0.01861). Volume (1.03M) is under the MA5 (3.30M) and MA10 (1.99M), so the candle is running on lighter participation than the earlier spike. The order book is 85% buy-side, but that is a thin book after a halt, so its reading is less useful than usual. The 0.31204 high is the level to clear, and the 0.23 MA7 is the first support on any pullback. A loss of the 0.20 cluster would signal that the post-exploit buying has faded. #ByXIMPACT
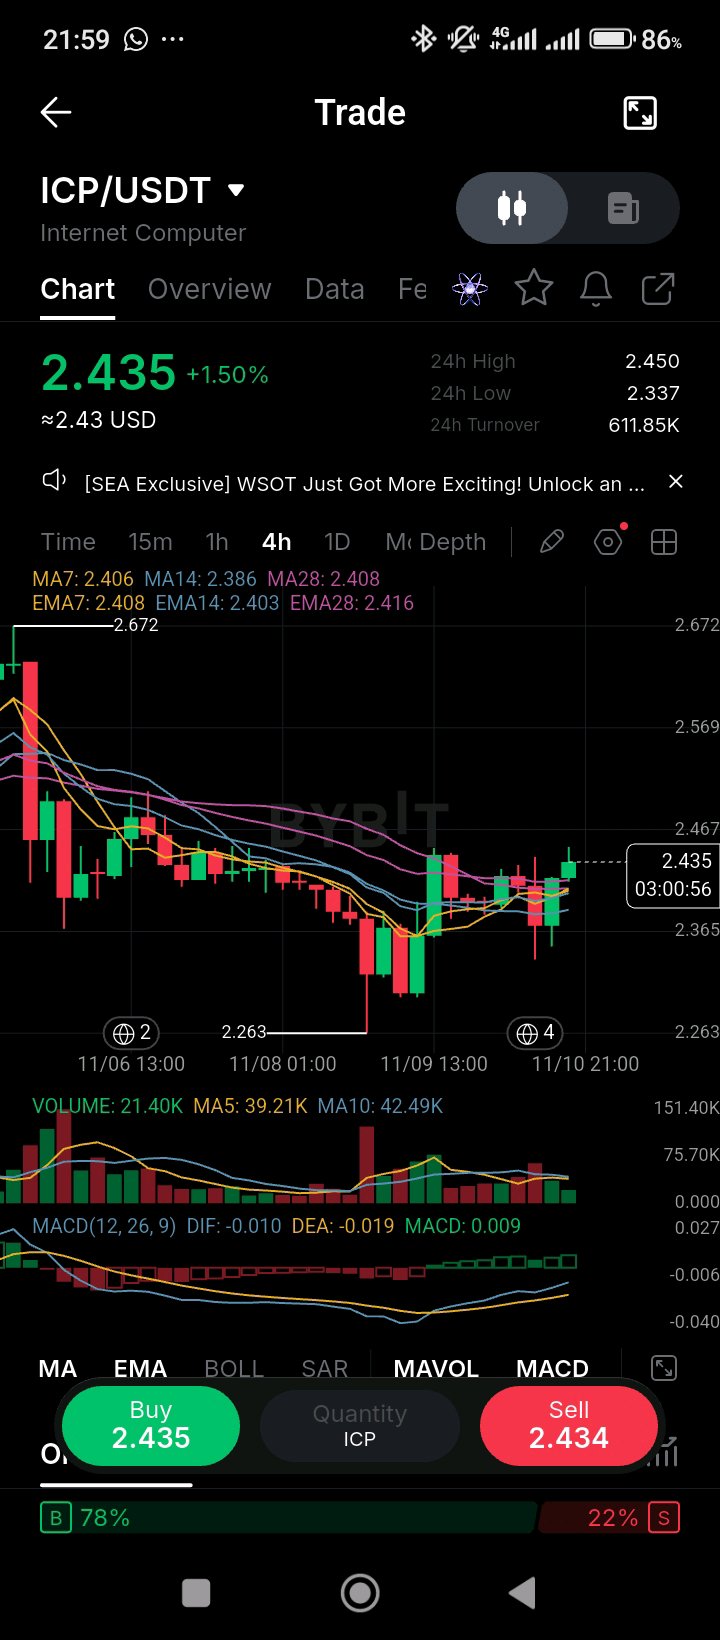
Internet Computer is back above all its moving averages on a day the broader market sold off, and the protocol's supply reform is the part most traders are still pricing in. In March, DFINITY announced a "Mission 70" economic revision that cuts ICP's inflation by about 70%, with cloud engine revenue split 80% to node providers and 20% burned. That makes the token's value depend on real usage fees rather than on new issuance, which is a meaningful change. The distribution side moved too: Upbit listed ICP with KRW pairs in March, adding one of the most active retail markets in crypto. On November 2, the MULTI/DEX play-mode update went live, a fully on-chain order book in test mode with no real funds, and the price barely reacted at about $2.50. CoinMarketCap's note from November 5 found no ICP-specific news behind a 5.6% drop that day, which points to the wider market rather than the protocol. The chart shows ICP holding above its averages. It's up 1.50% to 2.435, on a 24-hour range of 2.337 to 2.450. Price sits above the MA7 (2.406), MA14 (2.386) and MA28 (2.408), and above the EMA7 (2.408), EMA14 (2.403) and EMA28 (2.416). MACD is positive (0.009), with the DIF (-0.010) crossing up through the DEA (-0.019). Volume (21.40K) is about half the MA5 (39.21K) and MA10 (42.49K), so the bounce isn't drawing much participation. The order book is 78% buy-side. The 2.41 to 2.42 averages, where the MA28 and EMA28 sit, are the first level to hold. A close above the 2.45 intraday high would test the 2.67 November high. A loss of 2.41 would bring the 2.26 low back into view. $ICPUSDT #ByXIMPACT
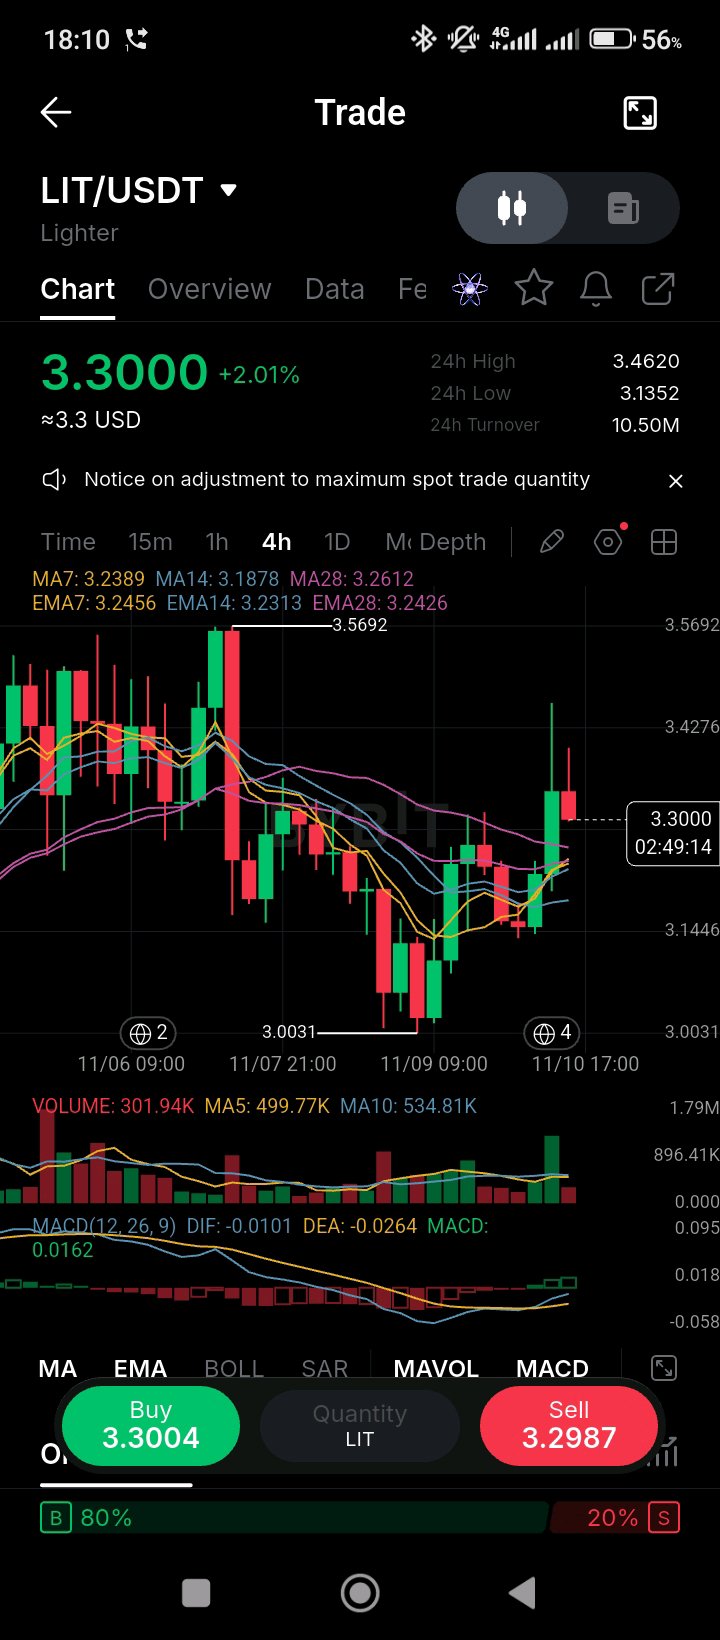
look at Lighter, and the token is now above all three averages after the November bounce, but the protocol's security setup is the part traders rarely check. A DataWallet explainer updated in October 2026 puts Lighter's annual protocol revenue near $26 million, which goes toward public-market buybacks for holders. That's consistent with the buyback story from the earlier posts, and the monthly figure works out to roughly $2 million to $3 million. The same piece flags a security item worth knowing: an October upgrade added two guardian roles that can pause batches and withdrawals for up to 72 hours, and neither role has been assigned yet. Lighter is still classed as a Stage 0 rollup, because its security council can bypass the 21-day upgrade delay. Users can still exit to Ethereum if the system freezes, but the team has a fast path for upgrades that hasn't been tested with an exit window. None of that is a red flag on its own, but it's the kind of detail to track before sizing a position. The chart has turned up. LIT is up 2.01% to 3.3000 on a 24-hour range of 3.1352 to 3.4620. Price is above the MA7 (3.2389), MA14 (3.1878) and EMA7 (3.2456), EMA14 (3.2313) and EMA28 (3.2426), but still under the MA28 (3.2612), which sits just overhead. MACD is positive (0.0162), with the DIF (-0.0101) crossing up through the DEA (-0.0264). Volume (301.94K) is under the MA5 (499.77K) and MA10 (534.81K), so this leg is coming in on light participation. The order book is 80% buy-side. The 3.26 MA28 is the level that matters. A close above it on rising volume would open the way back to the 3.57 high. A fall back below the 3.13 low would undo the November bounce. $LITUSDT #ByXIMPACT
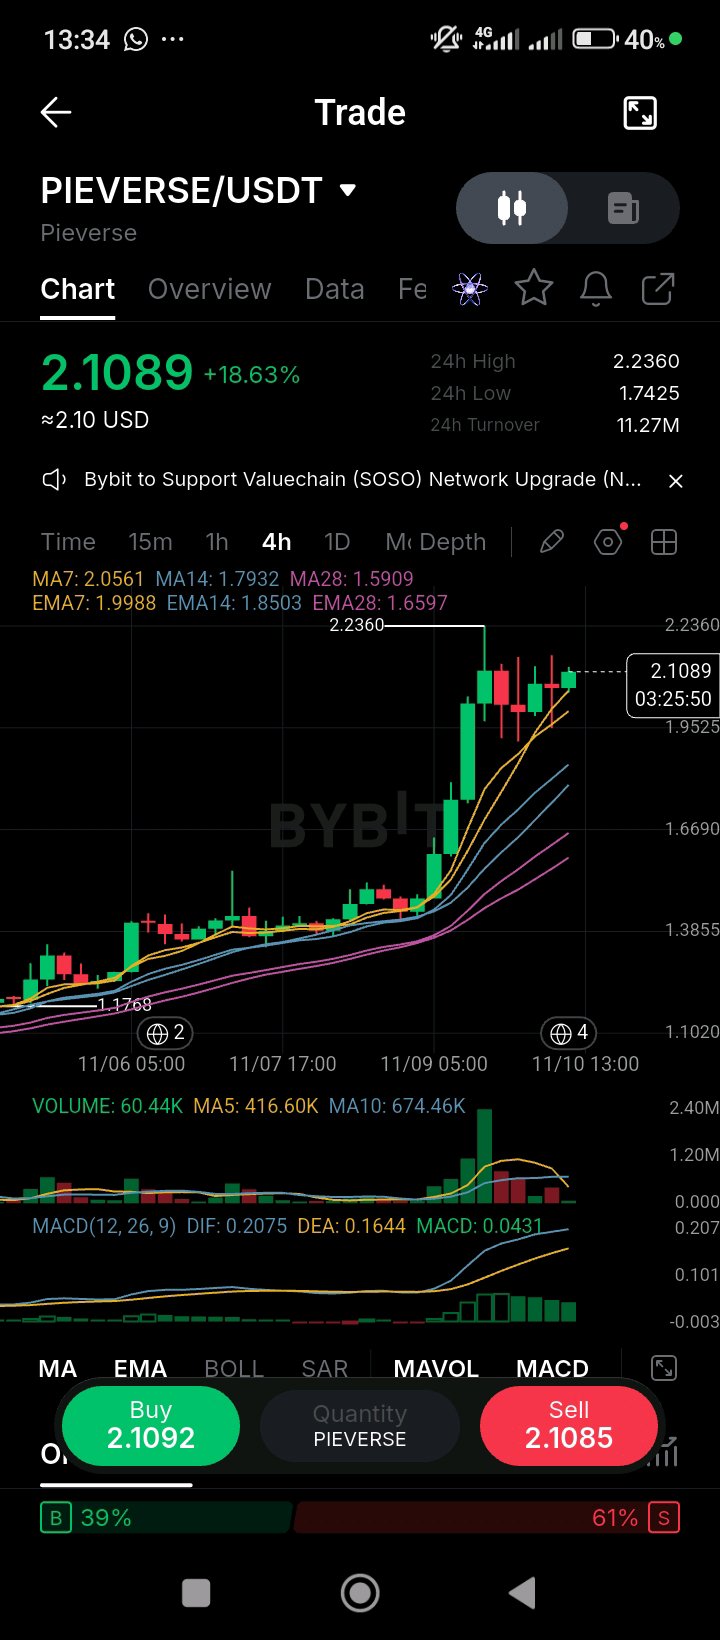
Token Profile: Pieverse ($PIEVERSE) Pieverse ($PIEVERSE) is a decentralized multi-chain ecosystem token powering interactive virtual experiences, digital asset marketplaces, and community-driven Web3 applications. Operating with specialized utility across immersive virtual worlds and tokenized reward protocols, connects creator economies with decentralized liquidity rails. Designed with an ecosystem-focused tokenomics model, the native token underpins platform governance, cross-chain marketplace settlements, staking incentives, and ecosystem growth allocations across participating virtual infrastructure networks. Technical Breakdown: PIEVERSE/USDT — 4-Hour (4H) Bullish Expansion & Moving Average Support On the 4-hour chart, PIEVERSE is trading around **$2.1089** (+18.63%)[span_0](start_span)[span_0](end_span), maintaining strong upside momentum after staging an aggressive parabolic markup leg toward its local high of **$2.2360**[span_1](start_span)[span_1](end_span) from a previous consolidation base around **$1.1768**[span_2](start_span)[span_2](end_span). * **Moving Average Dynamic Support Ribbon:** Price action is well-supported above a strongly bullish, upward-sloping moving average stack[span_3](start_span)[span_3](end_span). Immediate dynamic support is rising sharply at **$2.0561 (MA7)**[span_4](start_span)[span_4](end_span) and **$1.9988 (EMA7)**[span_5](start_span)[span_5](end_span), with broader trend support trailing at **$1.8503 (EMA14)**[span_6](start_span)[span_6](end_span), **$1.7932 (MA14)**[span_7](start_span)[span_7](end_span), **$1.6597 (EMA28)**[span_8](start_span)[span_8](end_span), and **$1.5909 (MA28)**[span_9](start_span)[span_9](end_span). Sustaining a 4-hour close above the $1.99–$2.05 dynamic support zone keeps the active bullish continuation structure fully intact[span_10](start_span)[span_10](end_span). * **Support Base & Resistance Defenses:** Immediate upside resistance is anchored at the recent swing peak of **$2.2360**[span_11](start_span)[span_11](end_span). Structural floor support is firmly established at the multi-day base low of **$1.1768**[span_12](start_span)[span_12](end_span), with intermediate local pullbacks supported around the 24h low of **$1.7425**[span_13](start_span)[span_13](end_span). * **Volume & MACD Profile:** 4-hour turnover registers at **11.27M USDT**[span_14](start_span)[span_14](end_span), backed by strong historical volume spikes during the primary impulse leg (with a 5-period MA volume of 416.60K and 10-period baseline of 674.46K)[span_15](start_span)[span_15](end_span). The 4-hour MACD (DIF: 0.2075, DEA: 0.1644) remains firmly positive above zero[span_16](start_span)[span_16](end_span), accompanied by expanding green histogram bars (MACD: 0.0431)[span_17](start_span)[span_17](end_span), confirming robust buying momentum during this consolidation phase below highs[span_18](start_span)[span_18](end_span). Are you riding the momentum continuation toward a break of the $2.23 high, or waiting to bid a pullback retest near the $2.00 dynamic support ribbon? $PIEVERSEUSDT $TRXUSDT #ByXIMPACT