612 Ceros
10964Me gusta0Compartir en el chat4647Aficionados4595Seguir
📊 Crypto strategist | Market signals daily | Trade smart, not emotional. Find me on X: @612Ceros
📊 Crypto strategist | Market signals daily | Trade smart, not emotional. Find me on X: @612Ceros
LTC bajo presión mientras BTC se mantiene estable
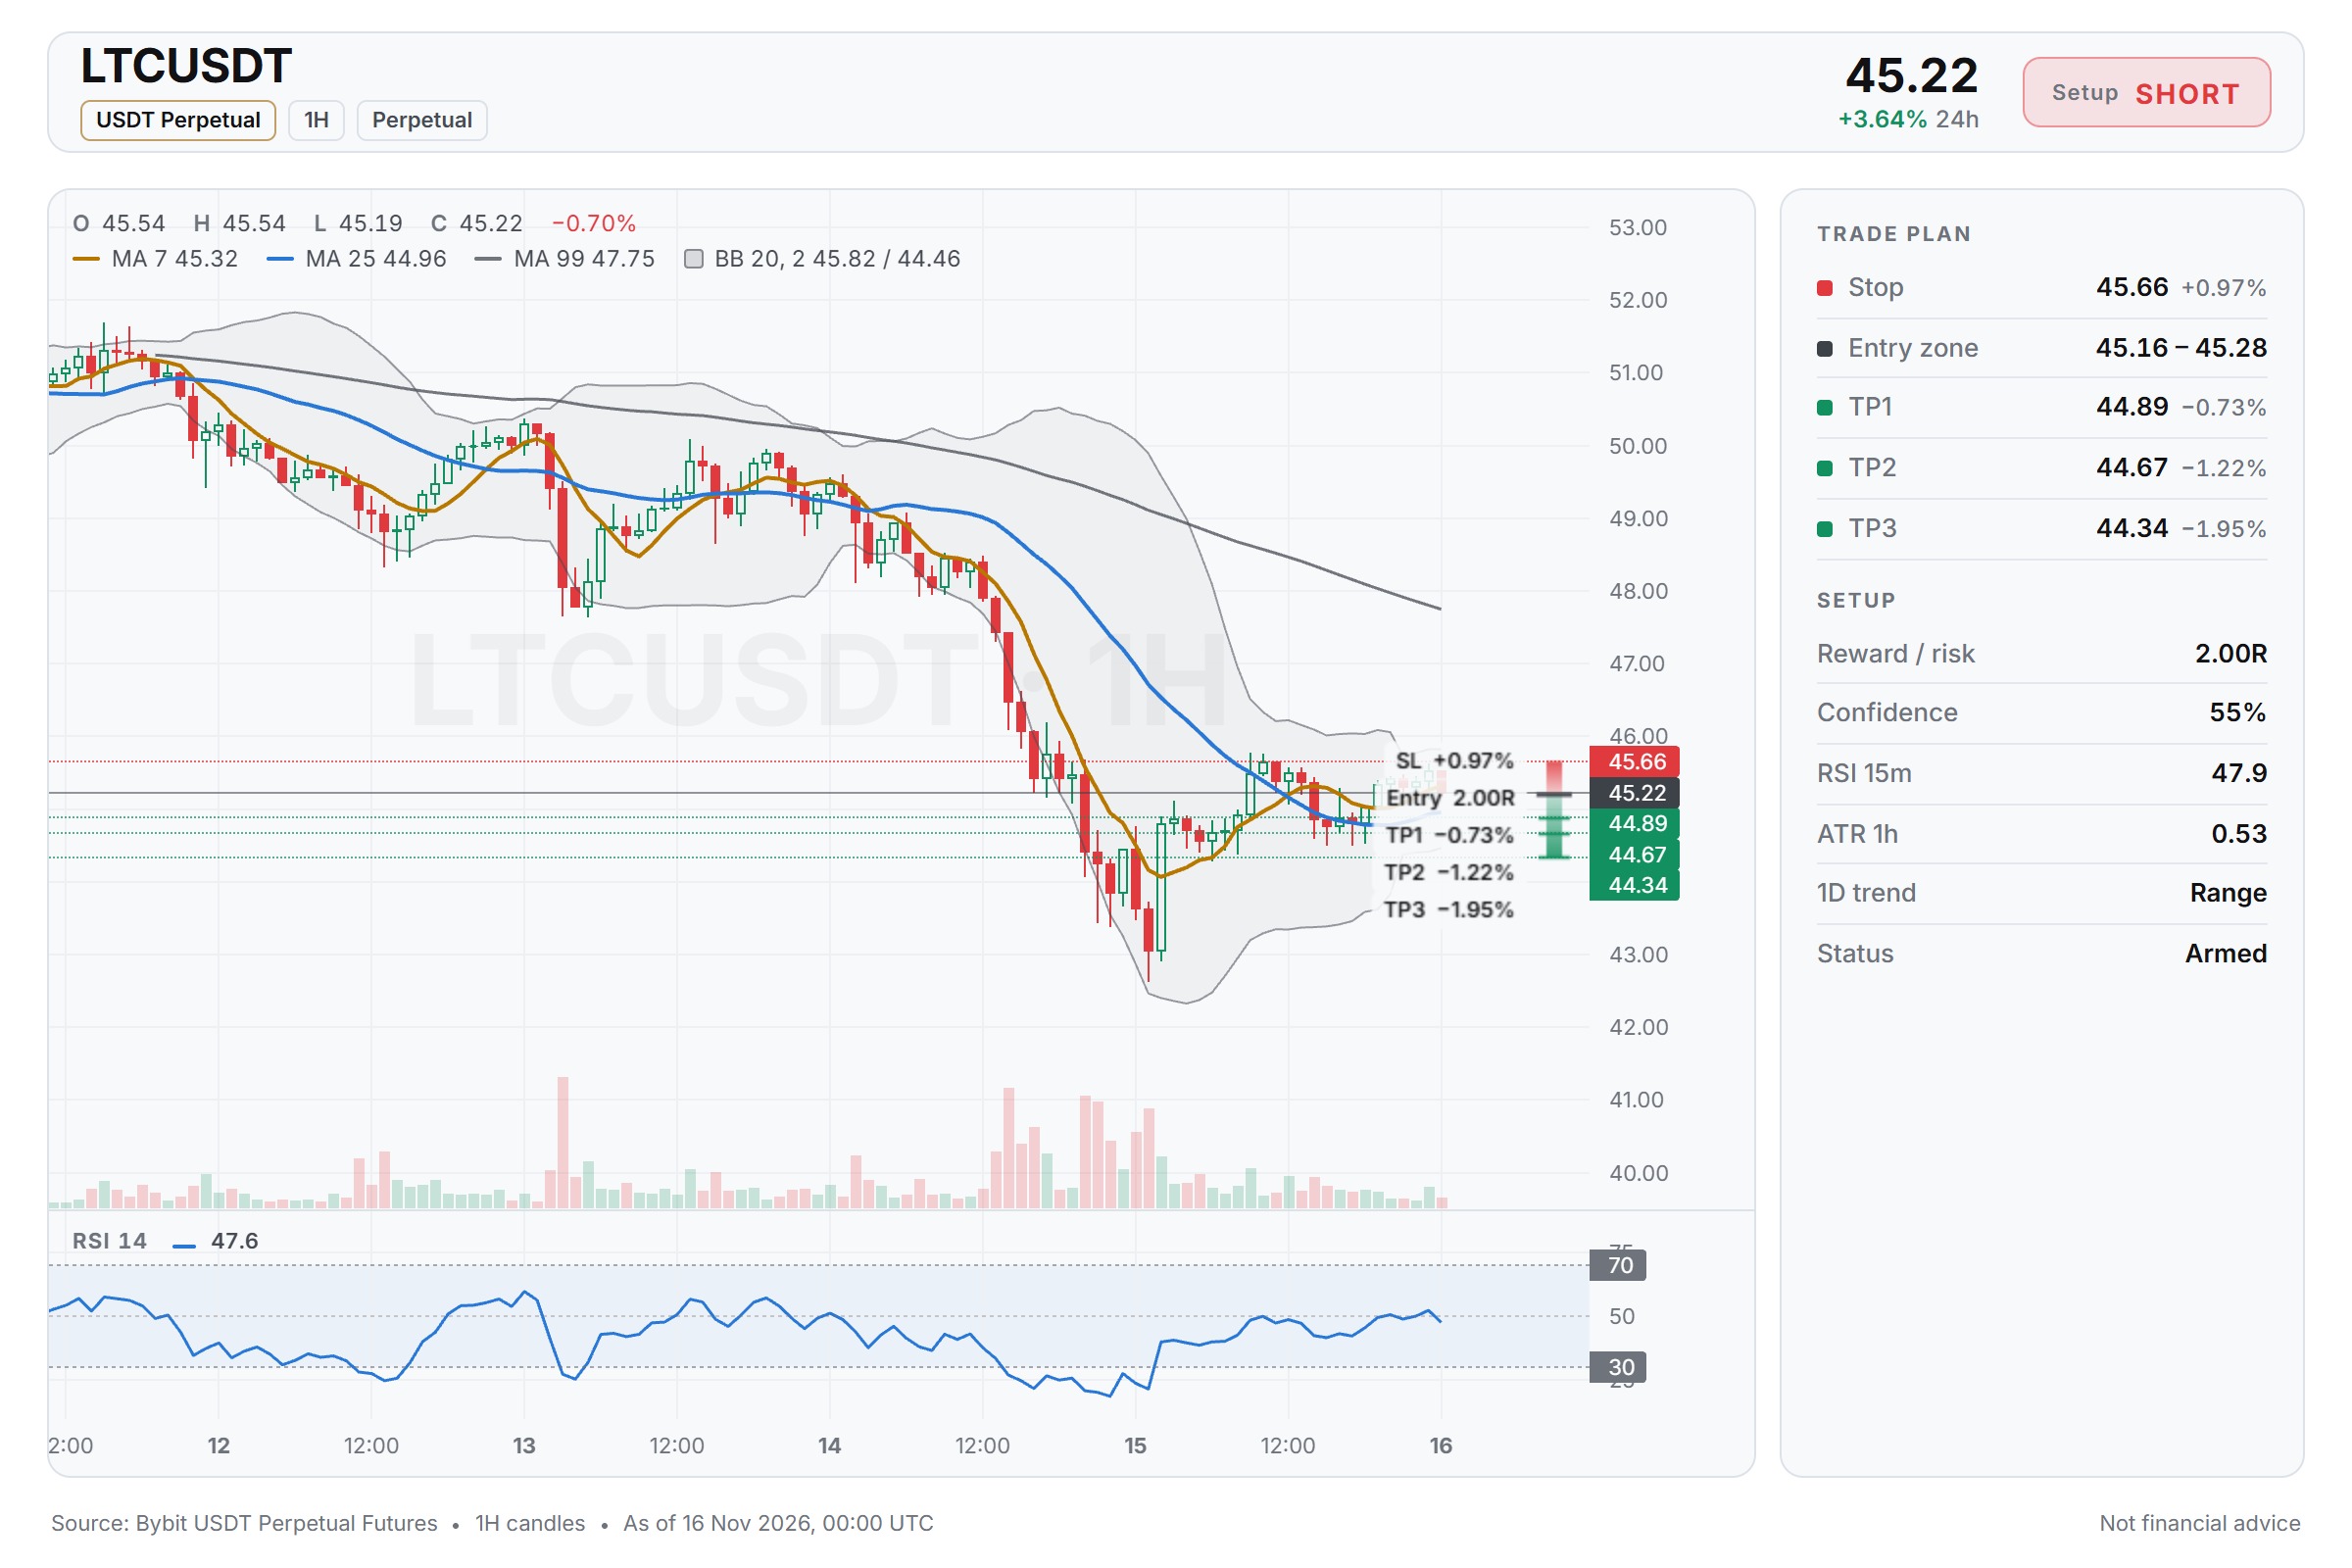
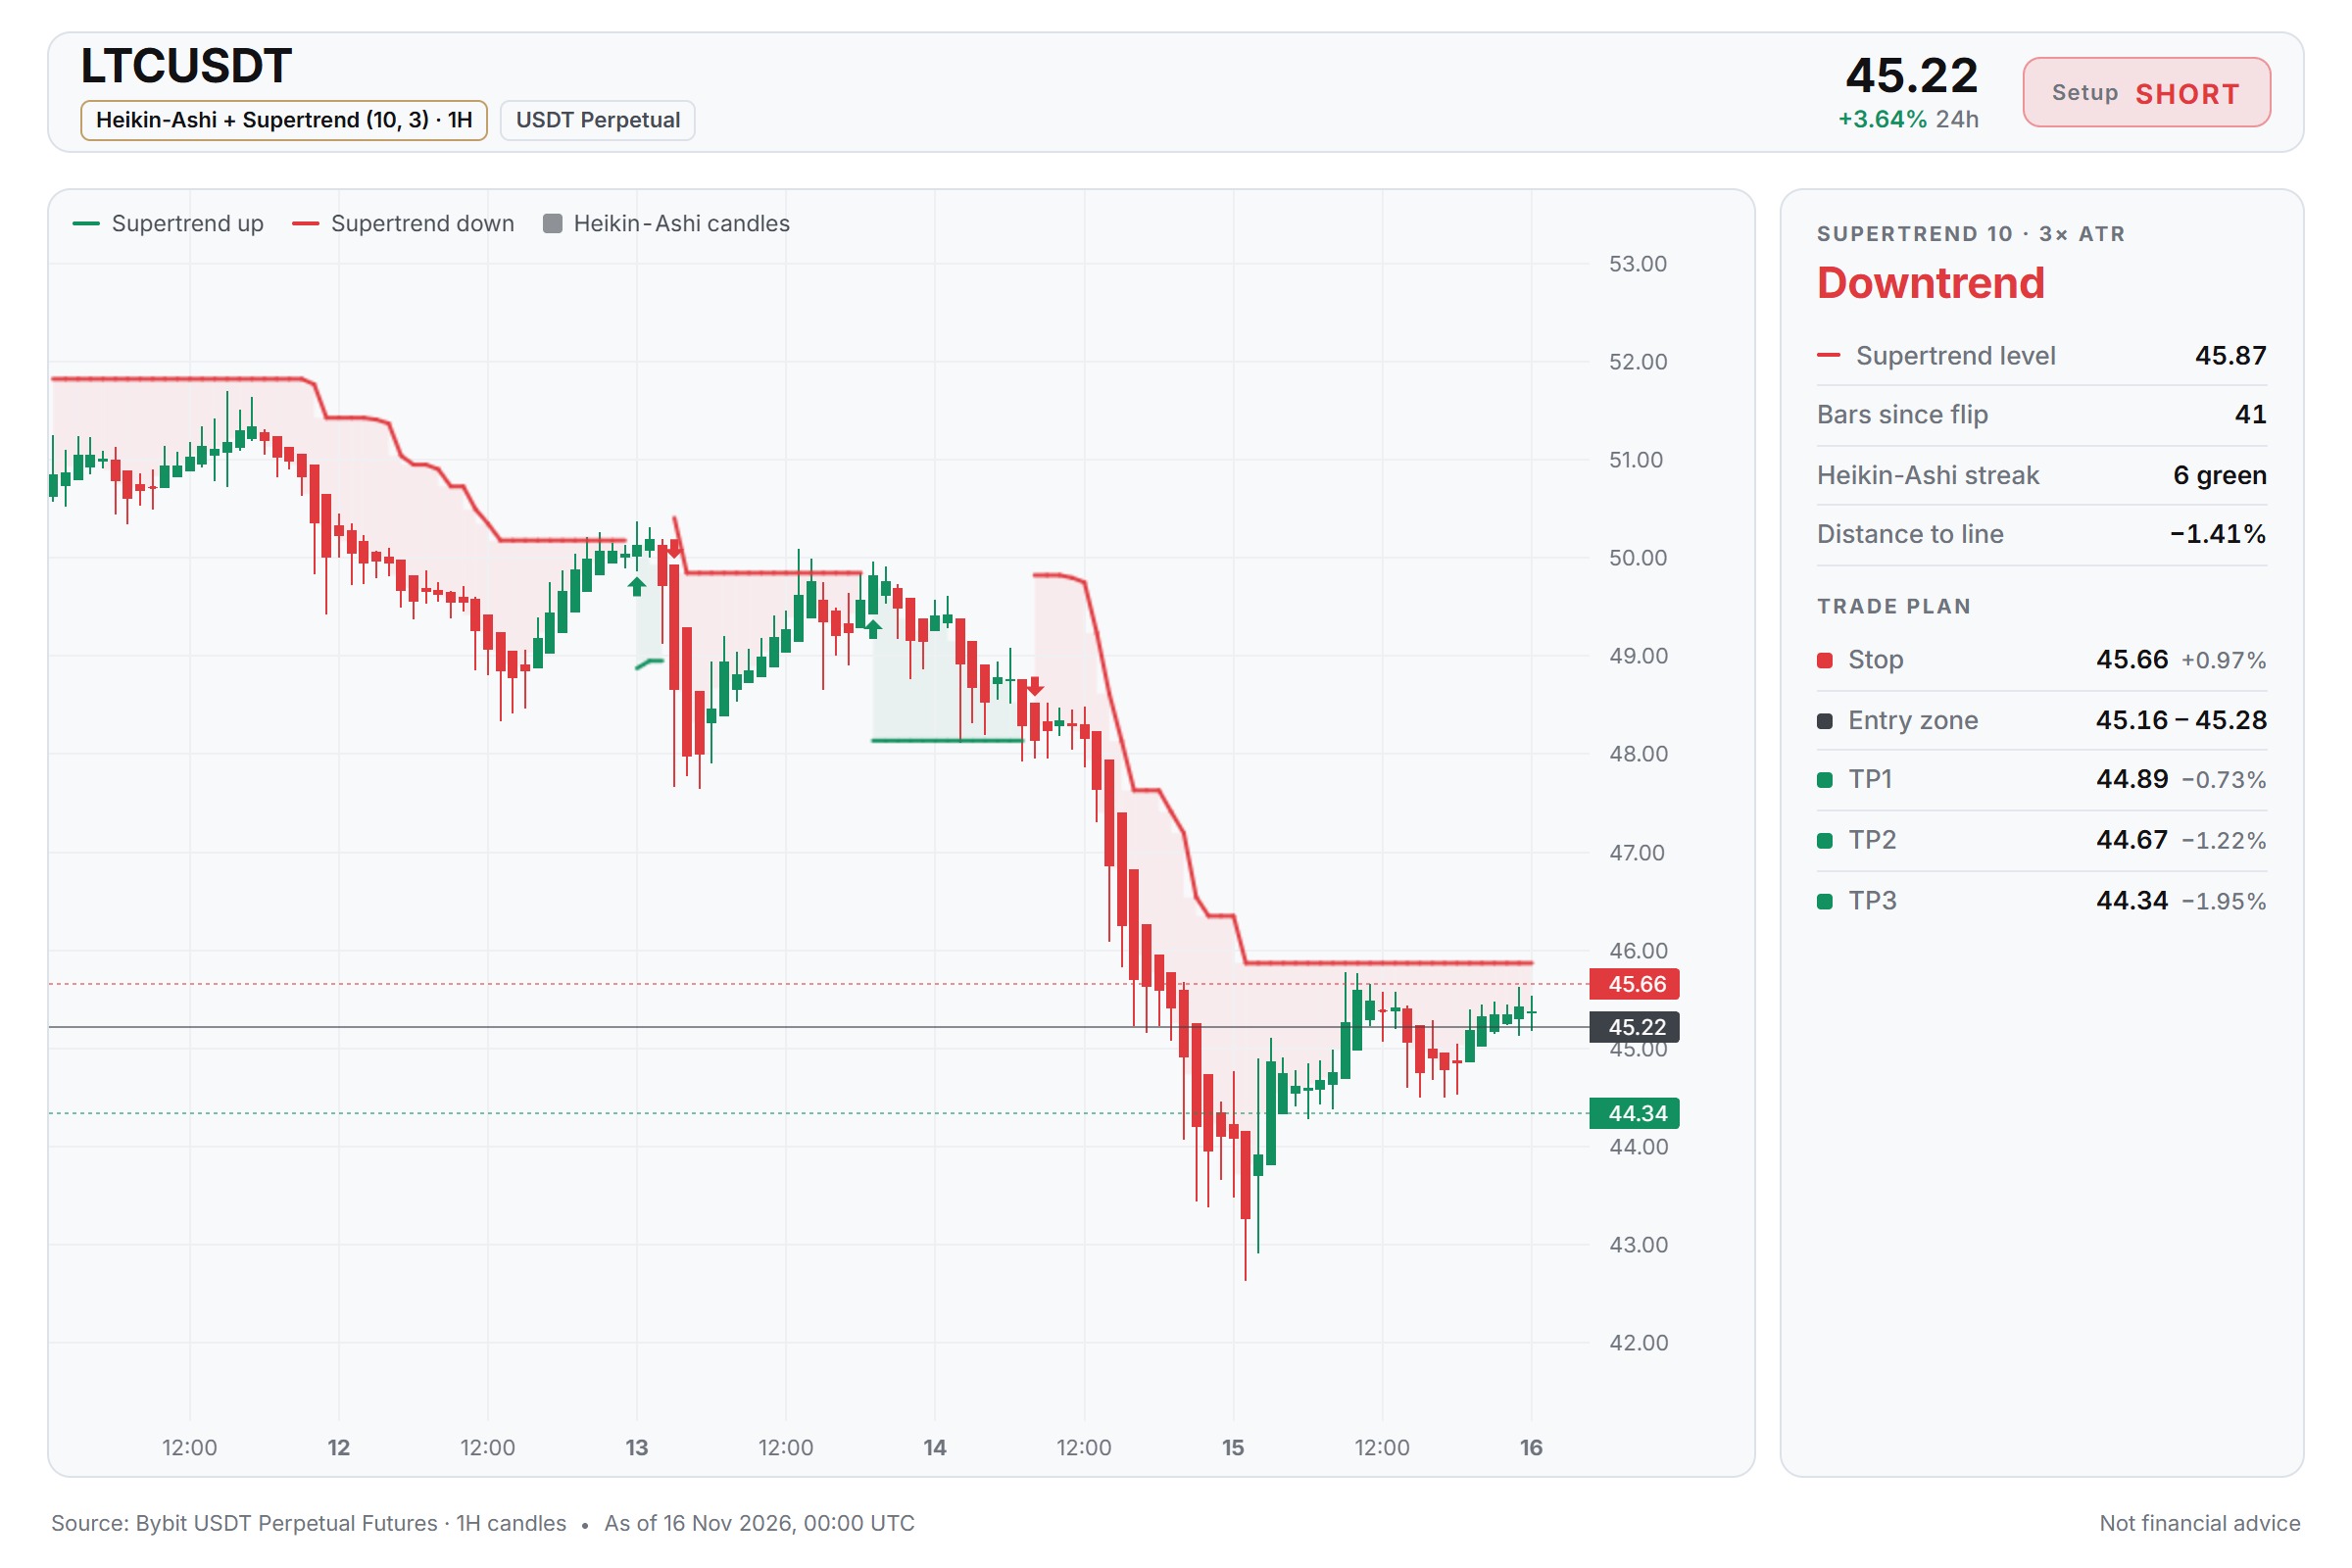
$LTC/USDT — SHORT Entrada: 45.16 - 45.28 SL: 45.66 TP1: 44.89 TP2: 44.67 TP3: 44.34 Estoy vigilando de cerca $LTC/USDT porque el RSI de 15m está cerca de 48, lo que sugiere espacio para más caídas. Con la tendencia de BTC neutral, una entrada en corto alrededor de 45.16 a 45.28 ofrece una configuración clara. Mi SL se sitúa en 45.66, con el TP2 en 44.67 y el TP3 en 44.34. ¿Creen que LTC empujará hacia 44.34 o es más probable un retesteo de 45.66 primero? ⚠️ Análisis de mercado personal solamente. NFA (No es asesoramiento financiero) — gestiona tu riesgo y DYOR (haz tu propia investigación). Contenido educativo, no es asesoramiento de inversión ni una recomendación para comprar, vender, depositar o retirar ningún activo. Sin promoción pagada ni enlaces de referencia/afiliados.$LTCUSDT#WSOT2026 #WSOTMuestraTuOperaciónIAParaGanar10USDT
AVAX Dip: Smart Short Setup?
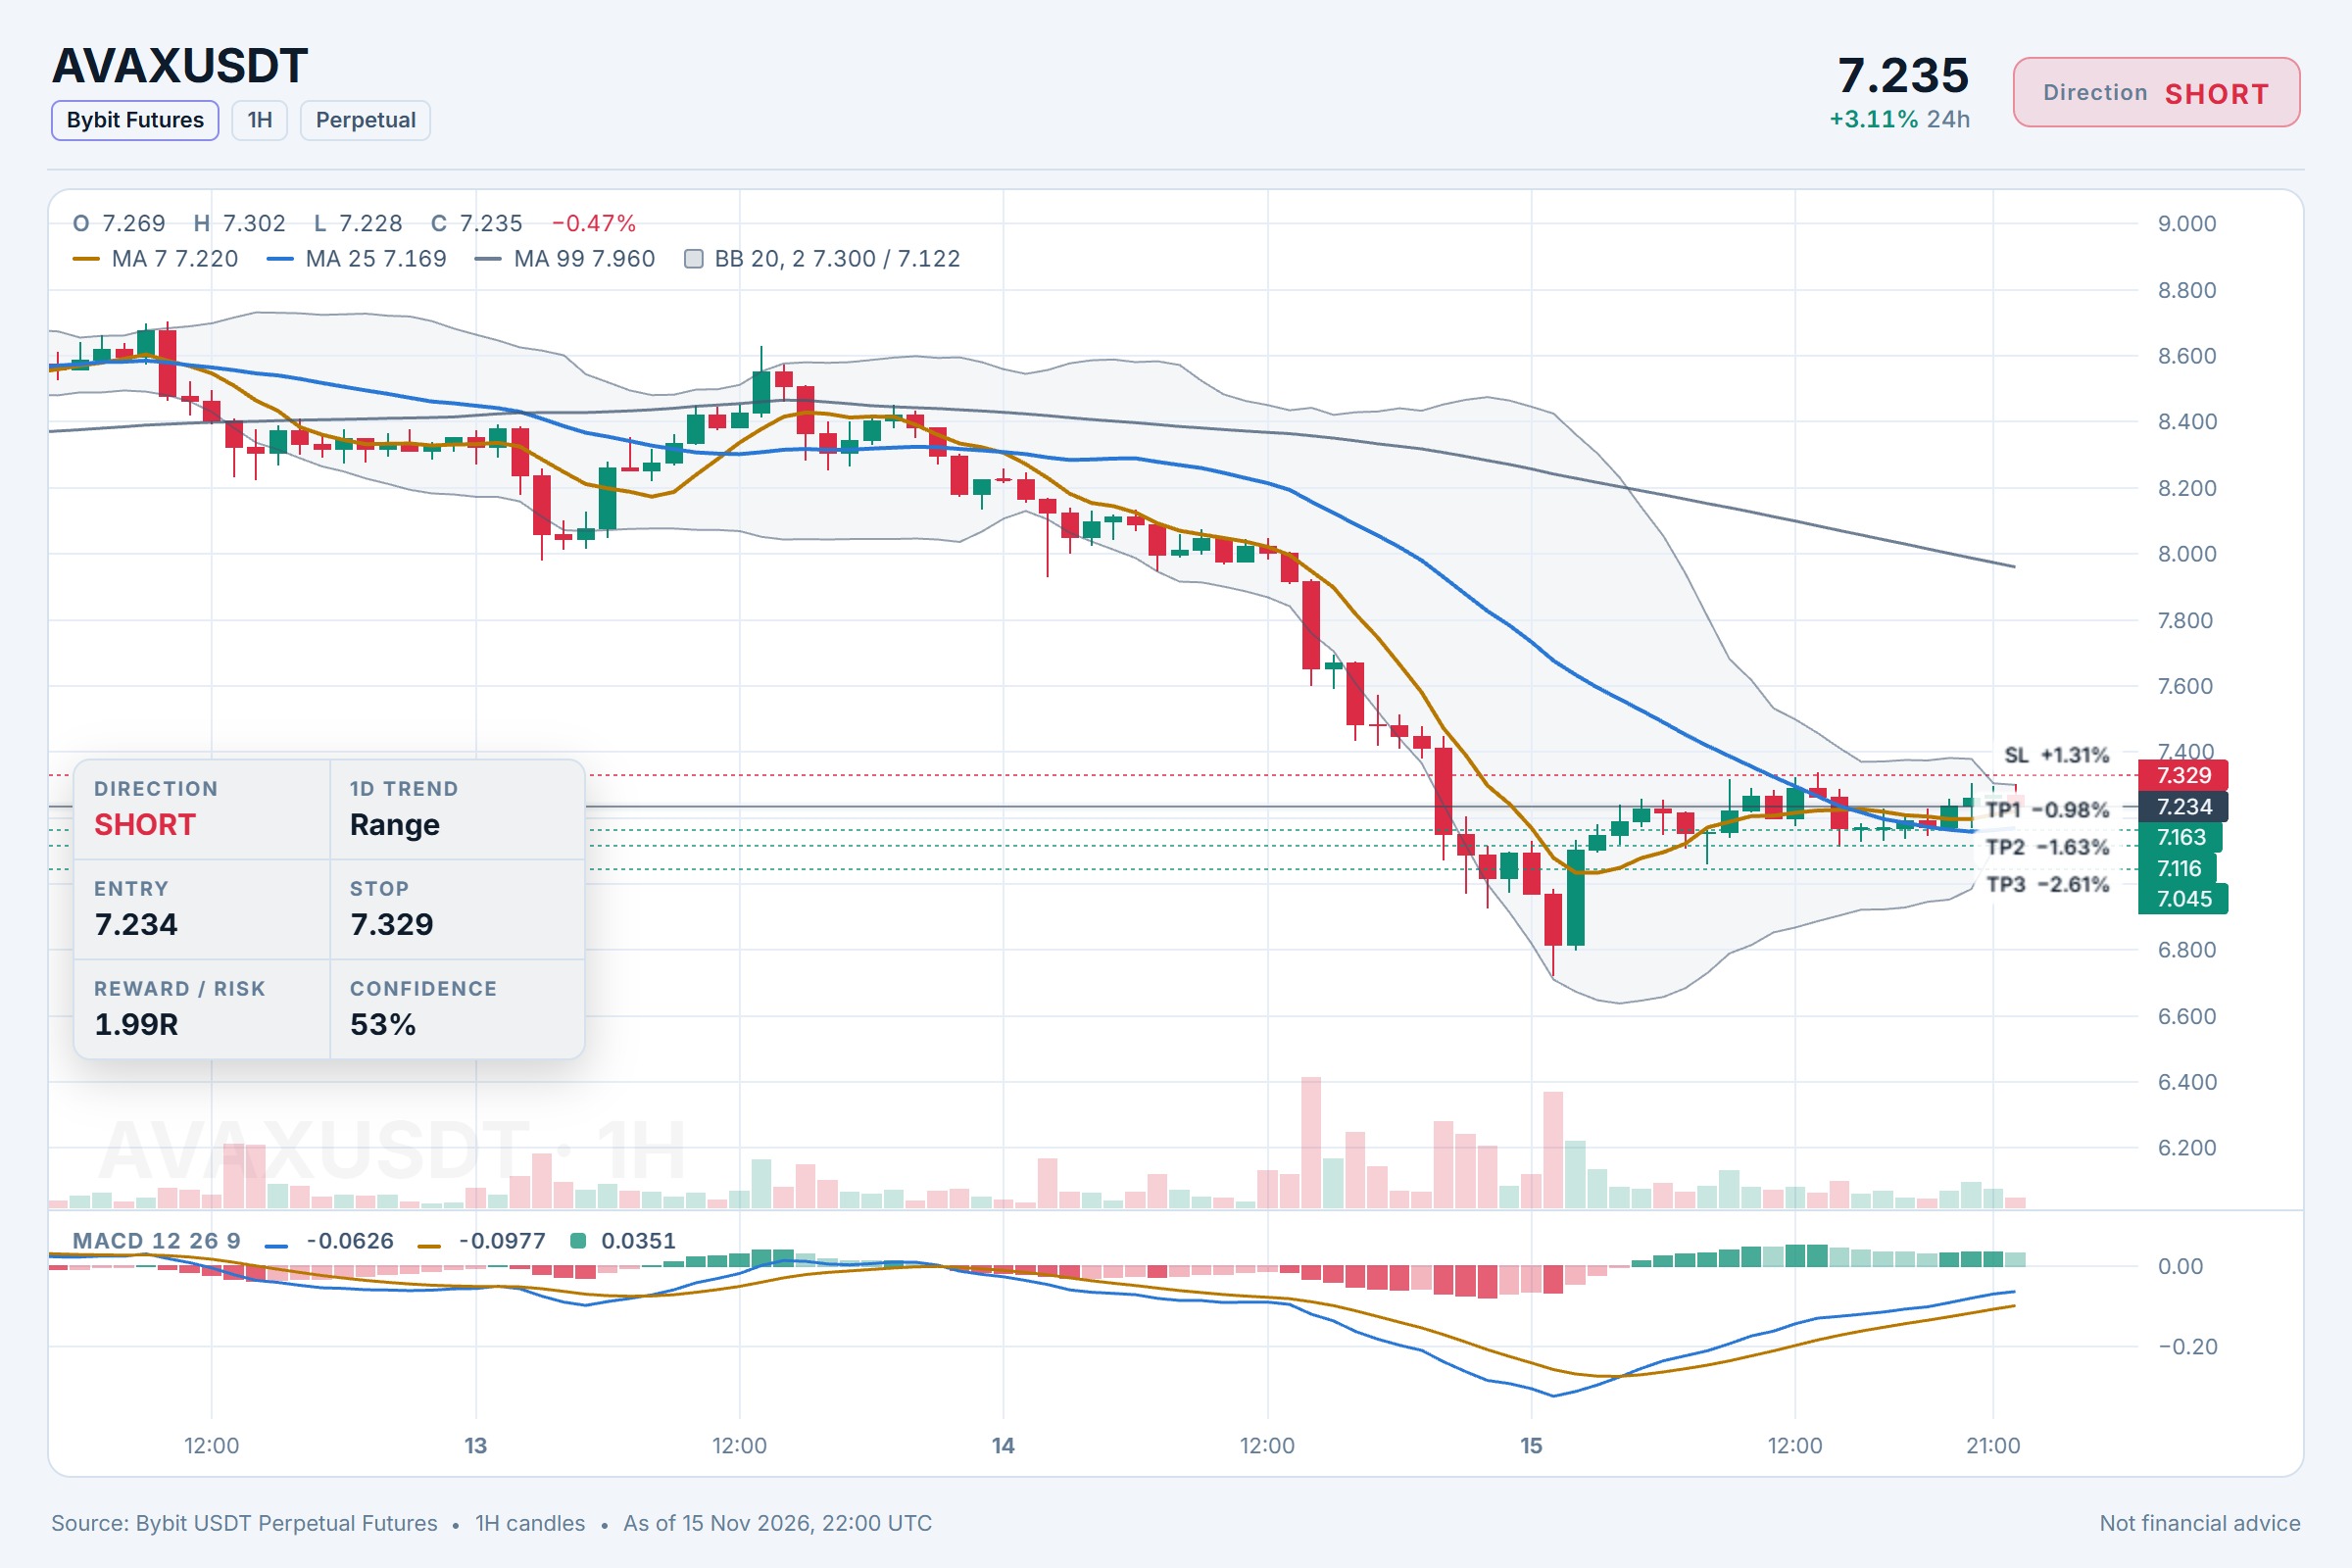
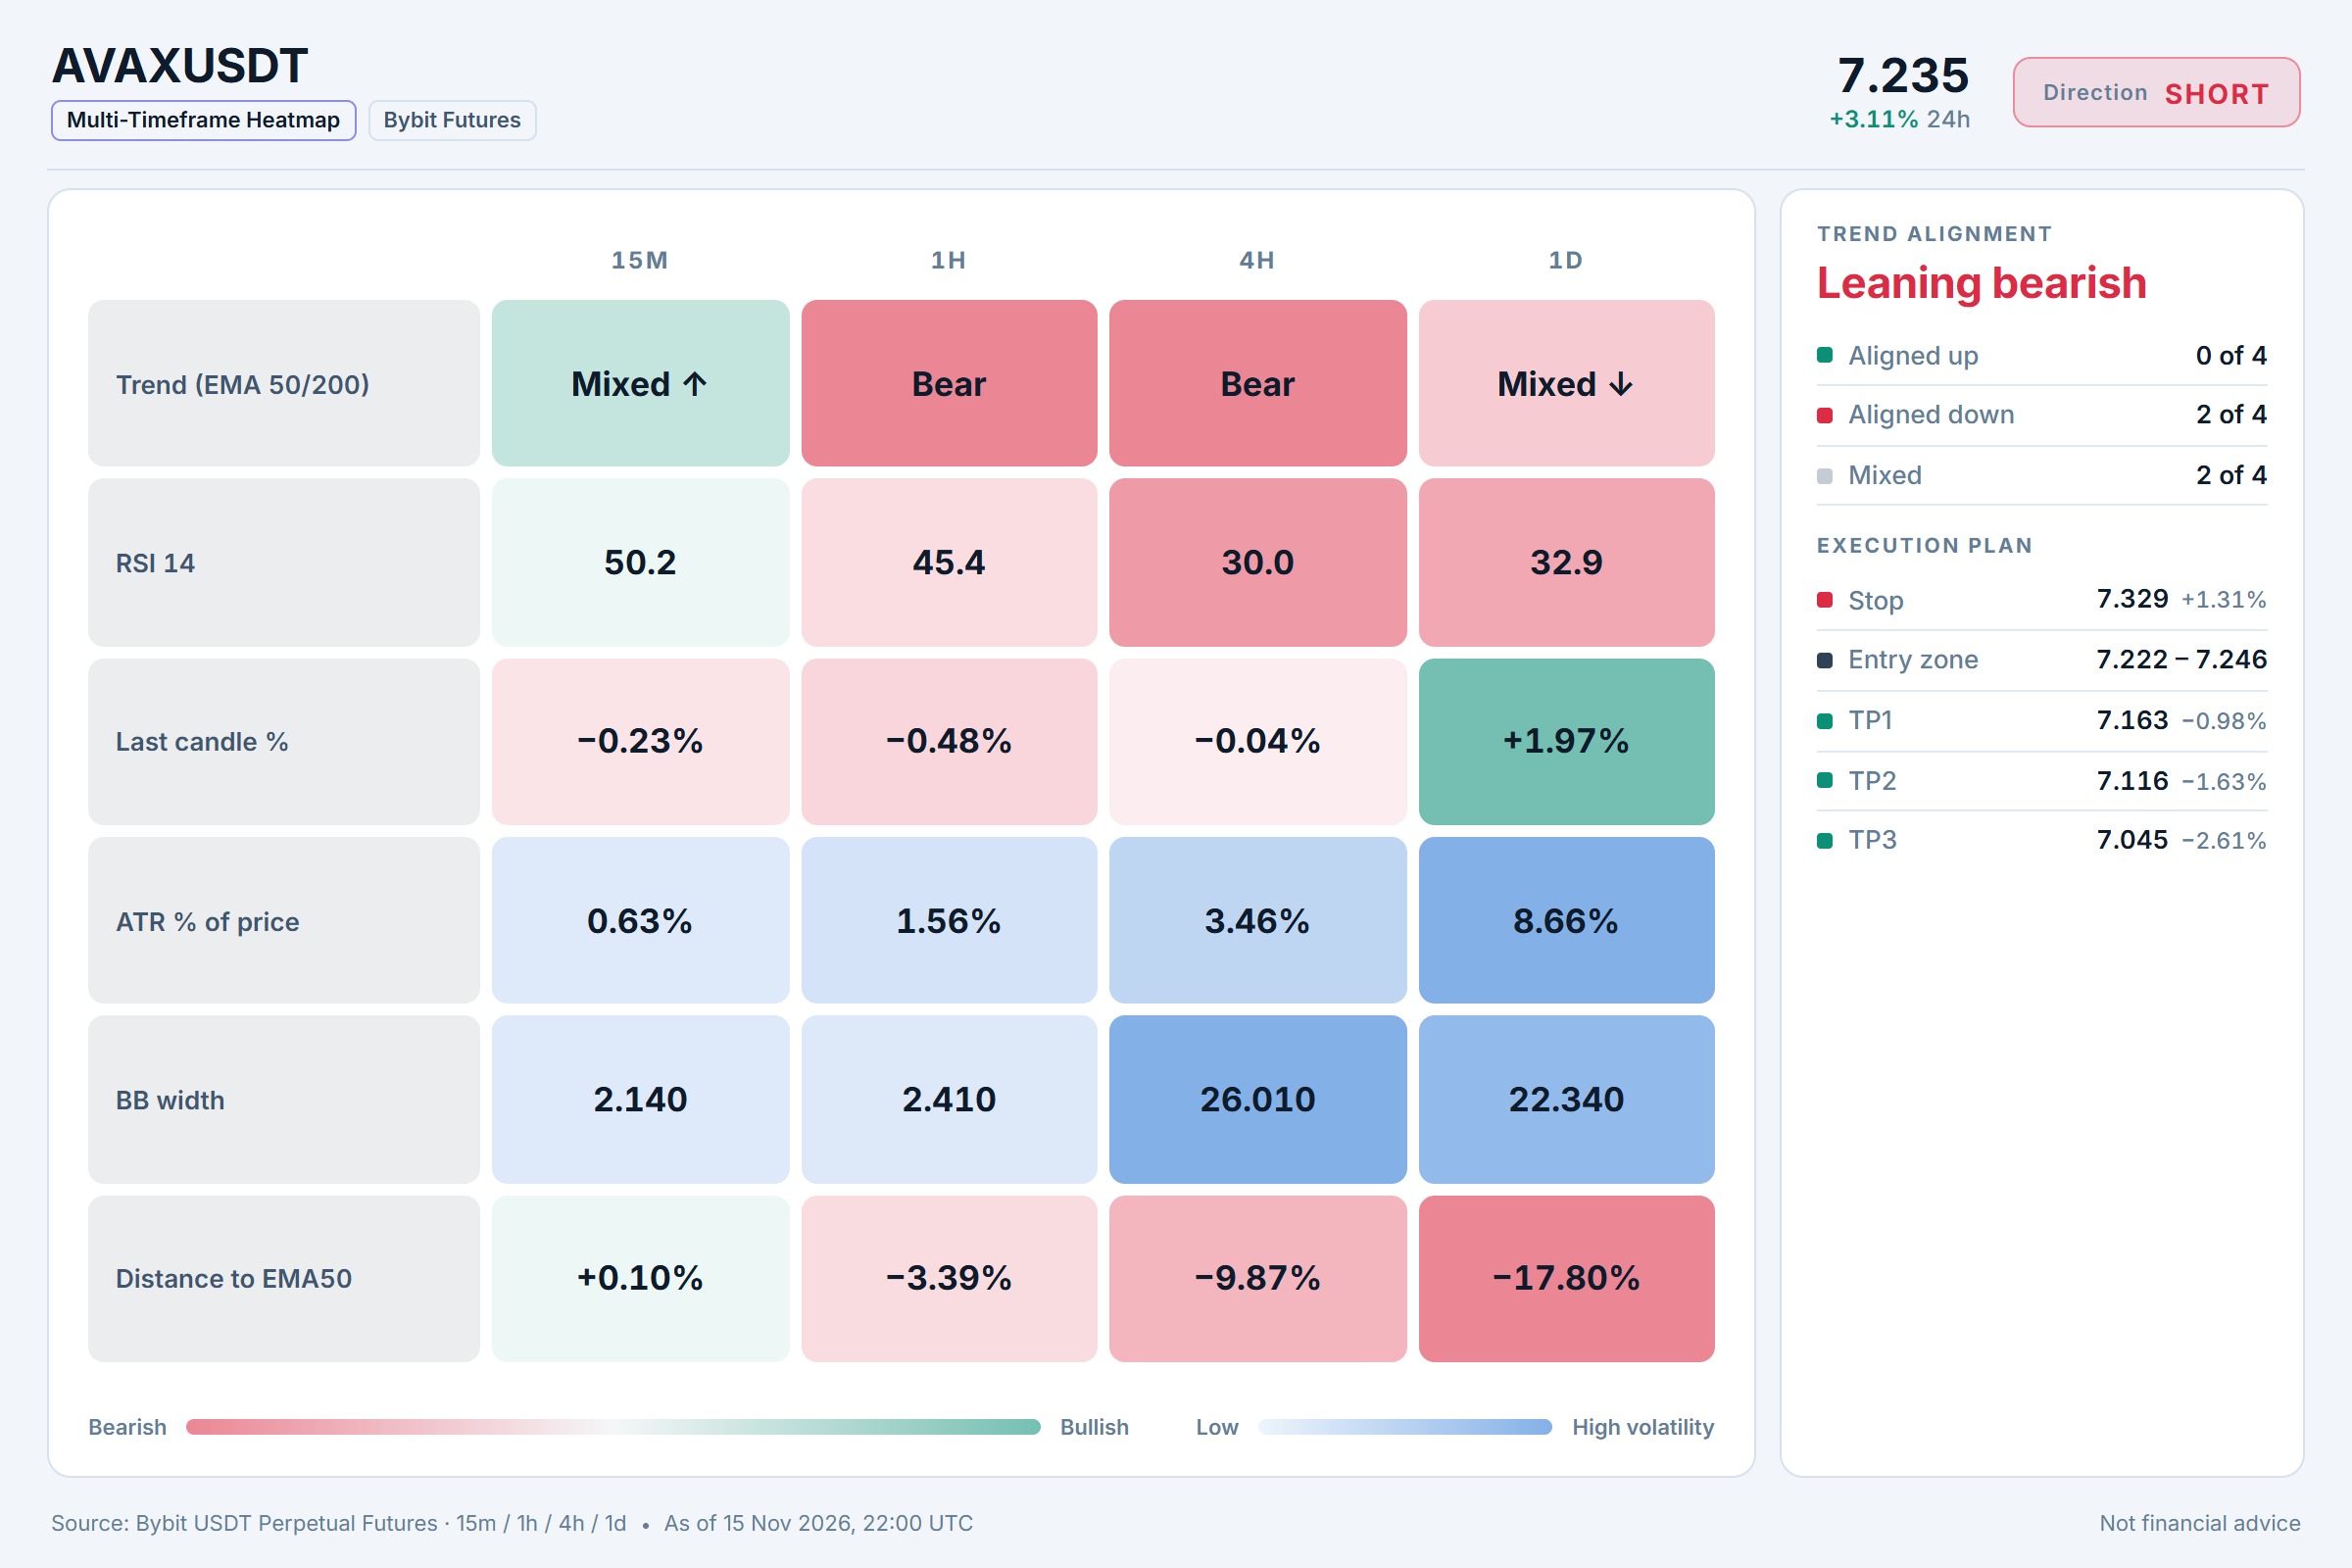
$AVAX/USDT — SHORT Entry: 7.222 - 7.246 SL: 7.329 TP1: 7.163 TP2: 7.116 TP3: 7.045 I'm watching AVAX closely at 7.234 as BTC holds its bullish trend, and the 15m RSI sitting at 50.16 tells me momentum is flat — meaning sellers could step in soon. With price wedged between 7.222 and 7.246, I think a short here offers a clean risk-to-reward profile, especially with TP2 at 7.116 and TP3 at 7.045 nearby. The key will be whether BTC's momentum stays firm enough to drag AVAX down with it or if AVAX decouples and bounces. Do you agree this is a good short opportunity, or would you wait for BTC to confirm first? ⚠️ Personal market analysis only. NFA — manage risk and DYOR. Educational content, not investment advice or a recommendation to buy, sell, deposit, or withdraw any asset. No paid promotion or referral/affiliate links.$AVAXUSDT#WSOT2026 #WSOTShowYourAITradeToEarn10USDT
¿GRAM/USDT preparándose silenciosamente para un pequeño breakout?
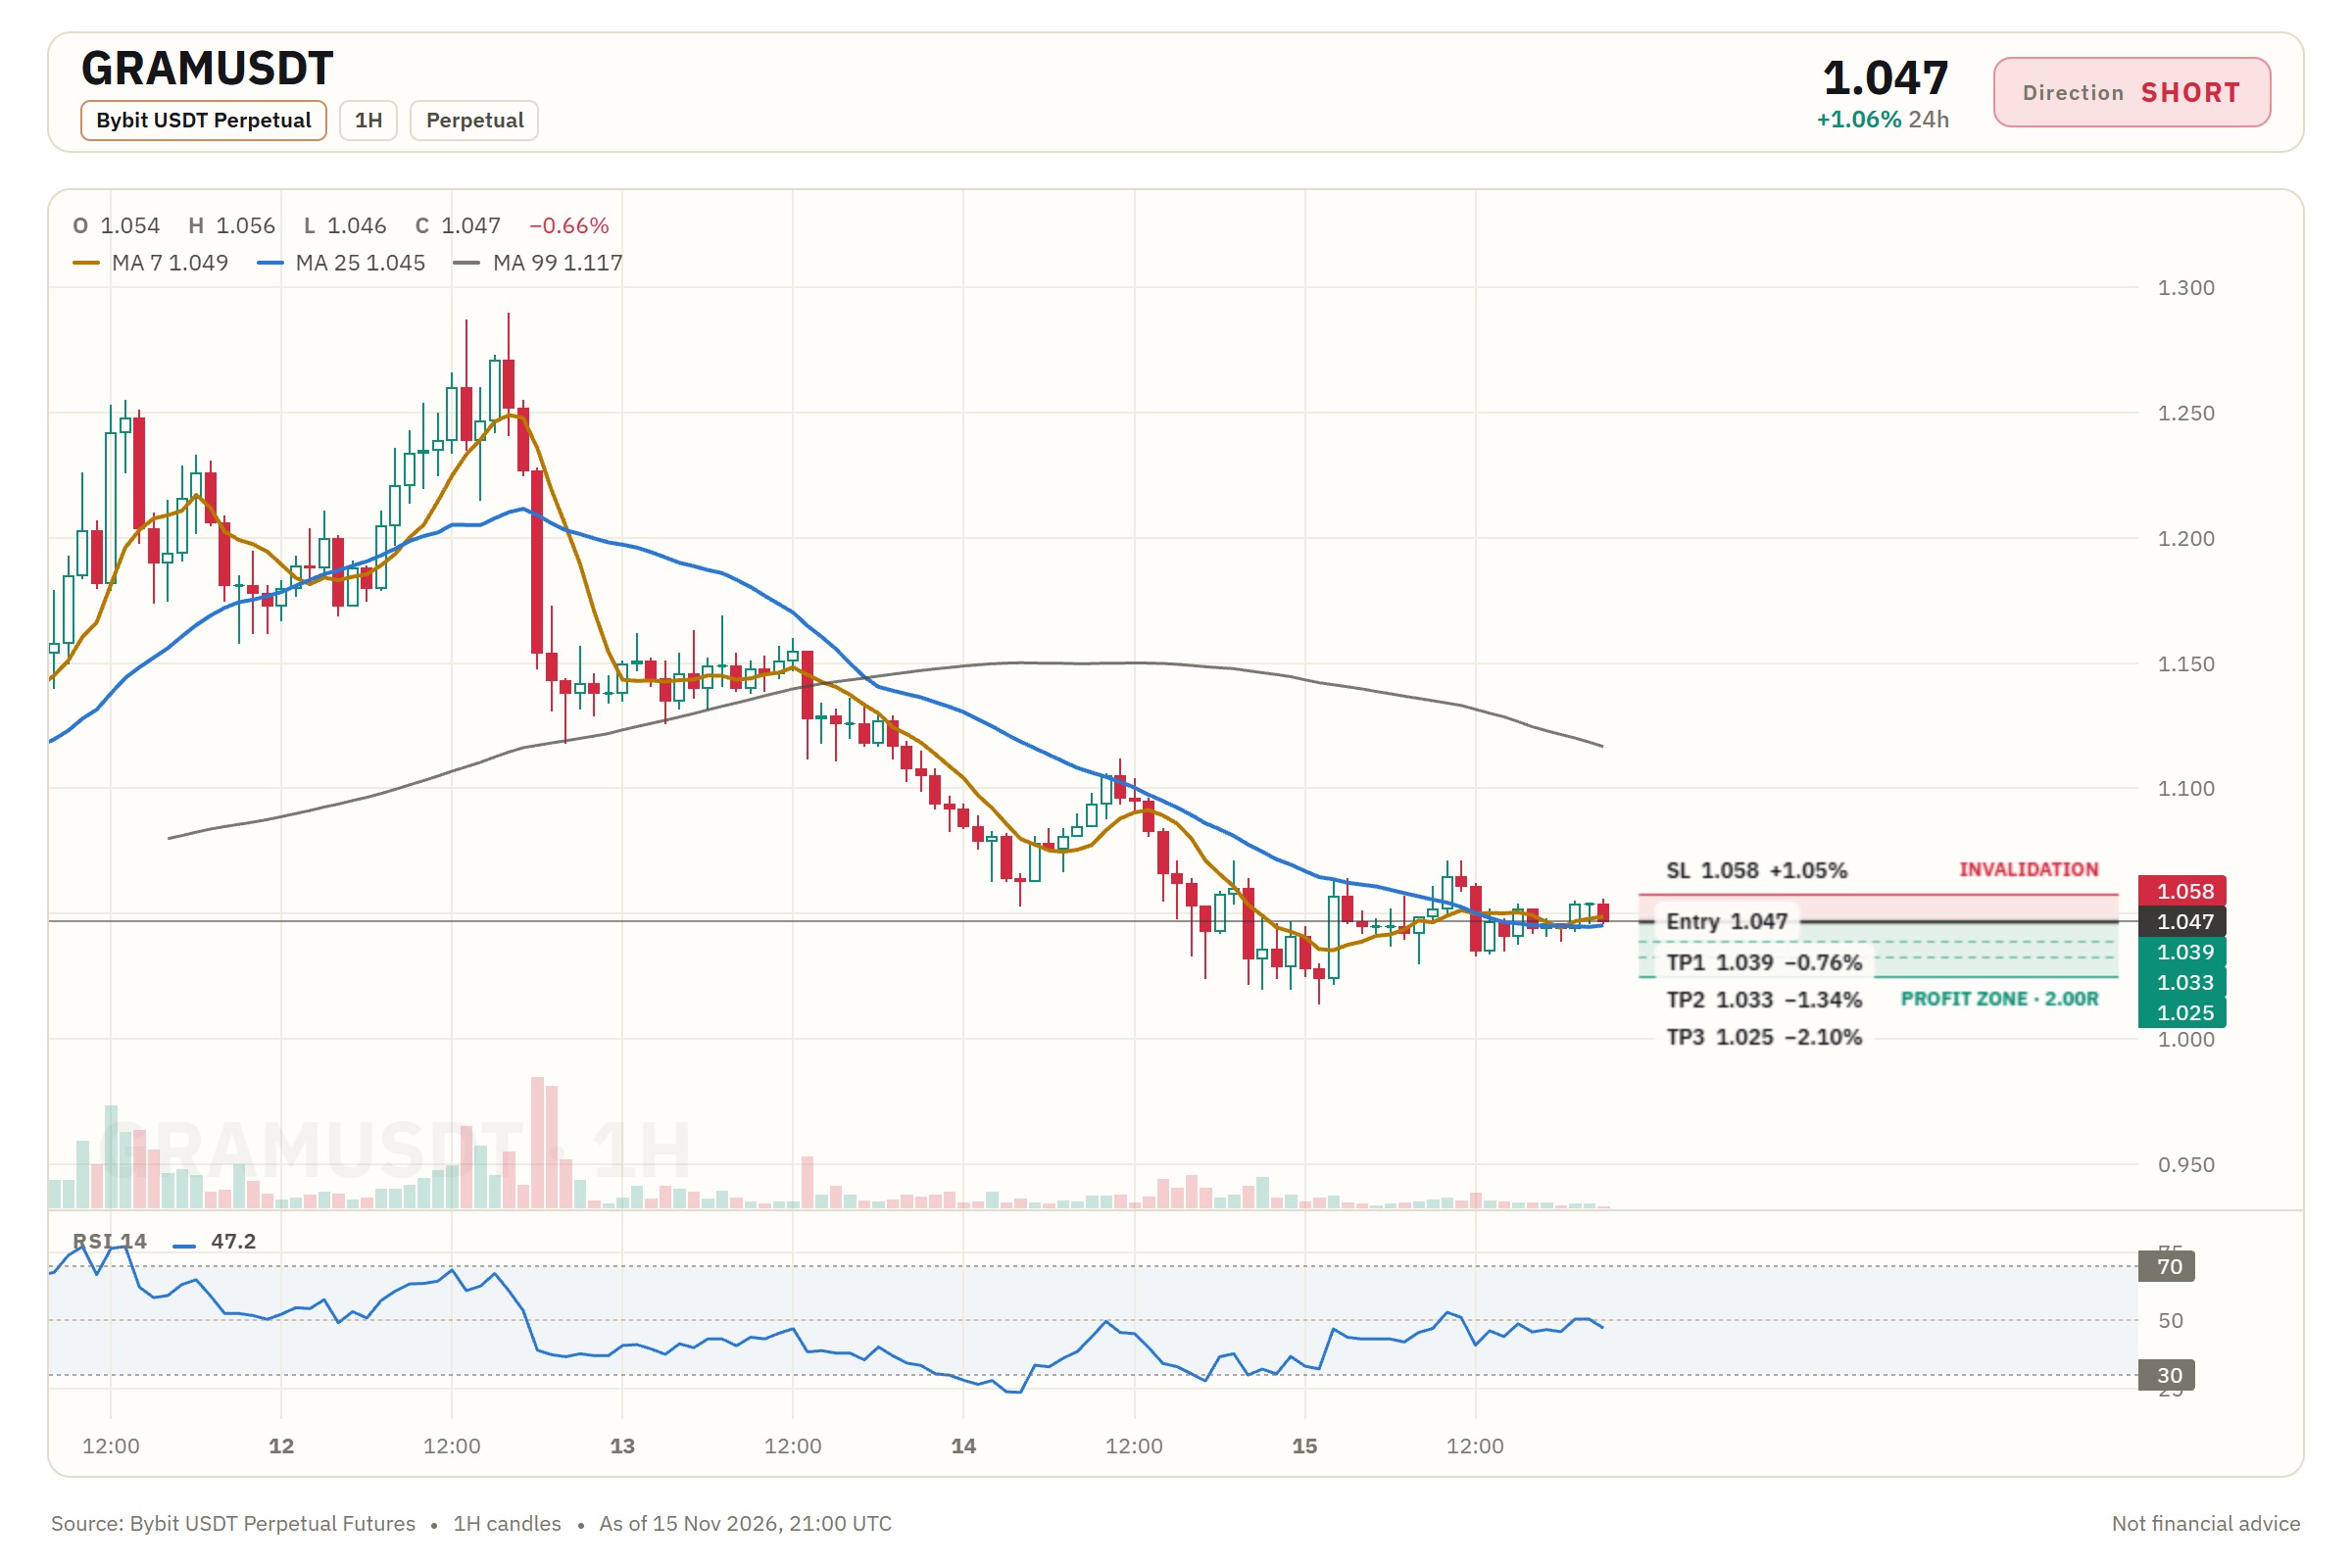
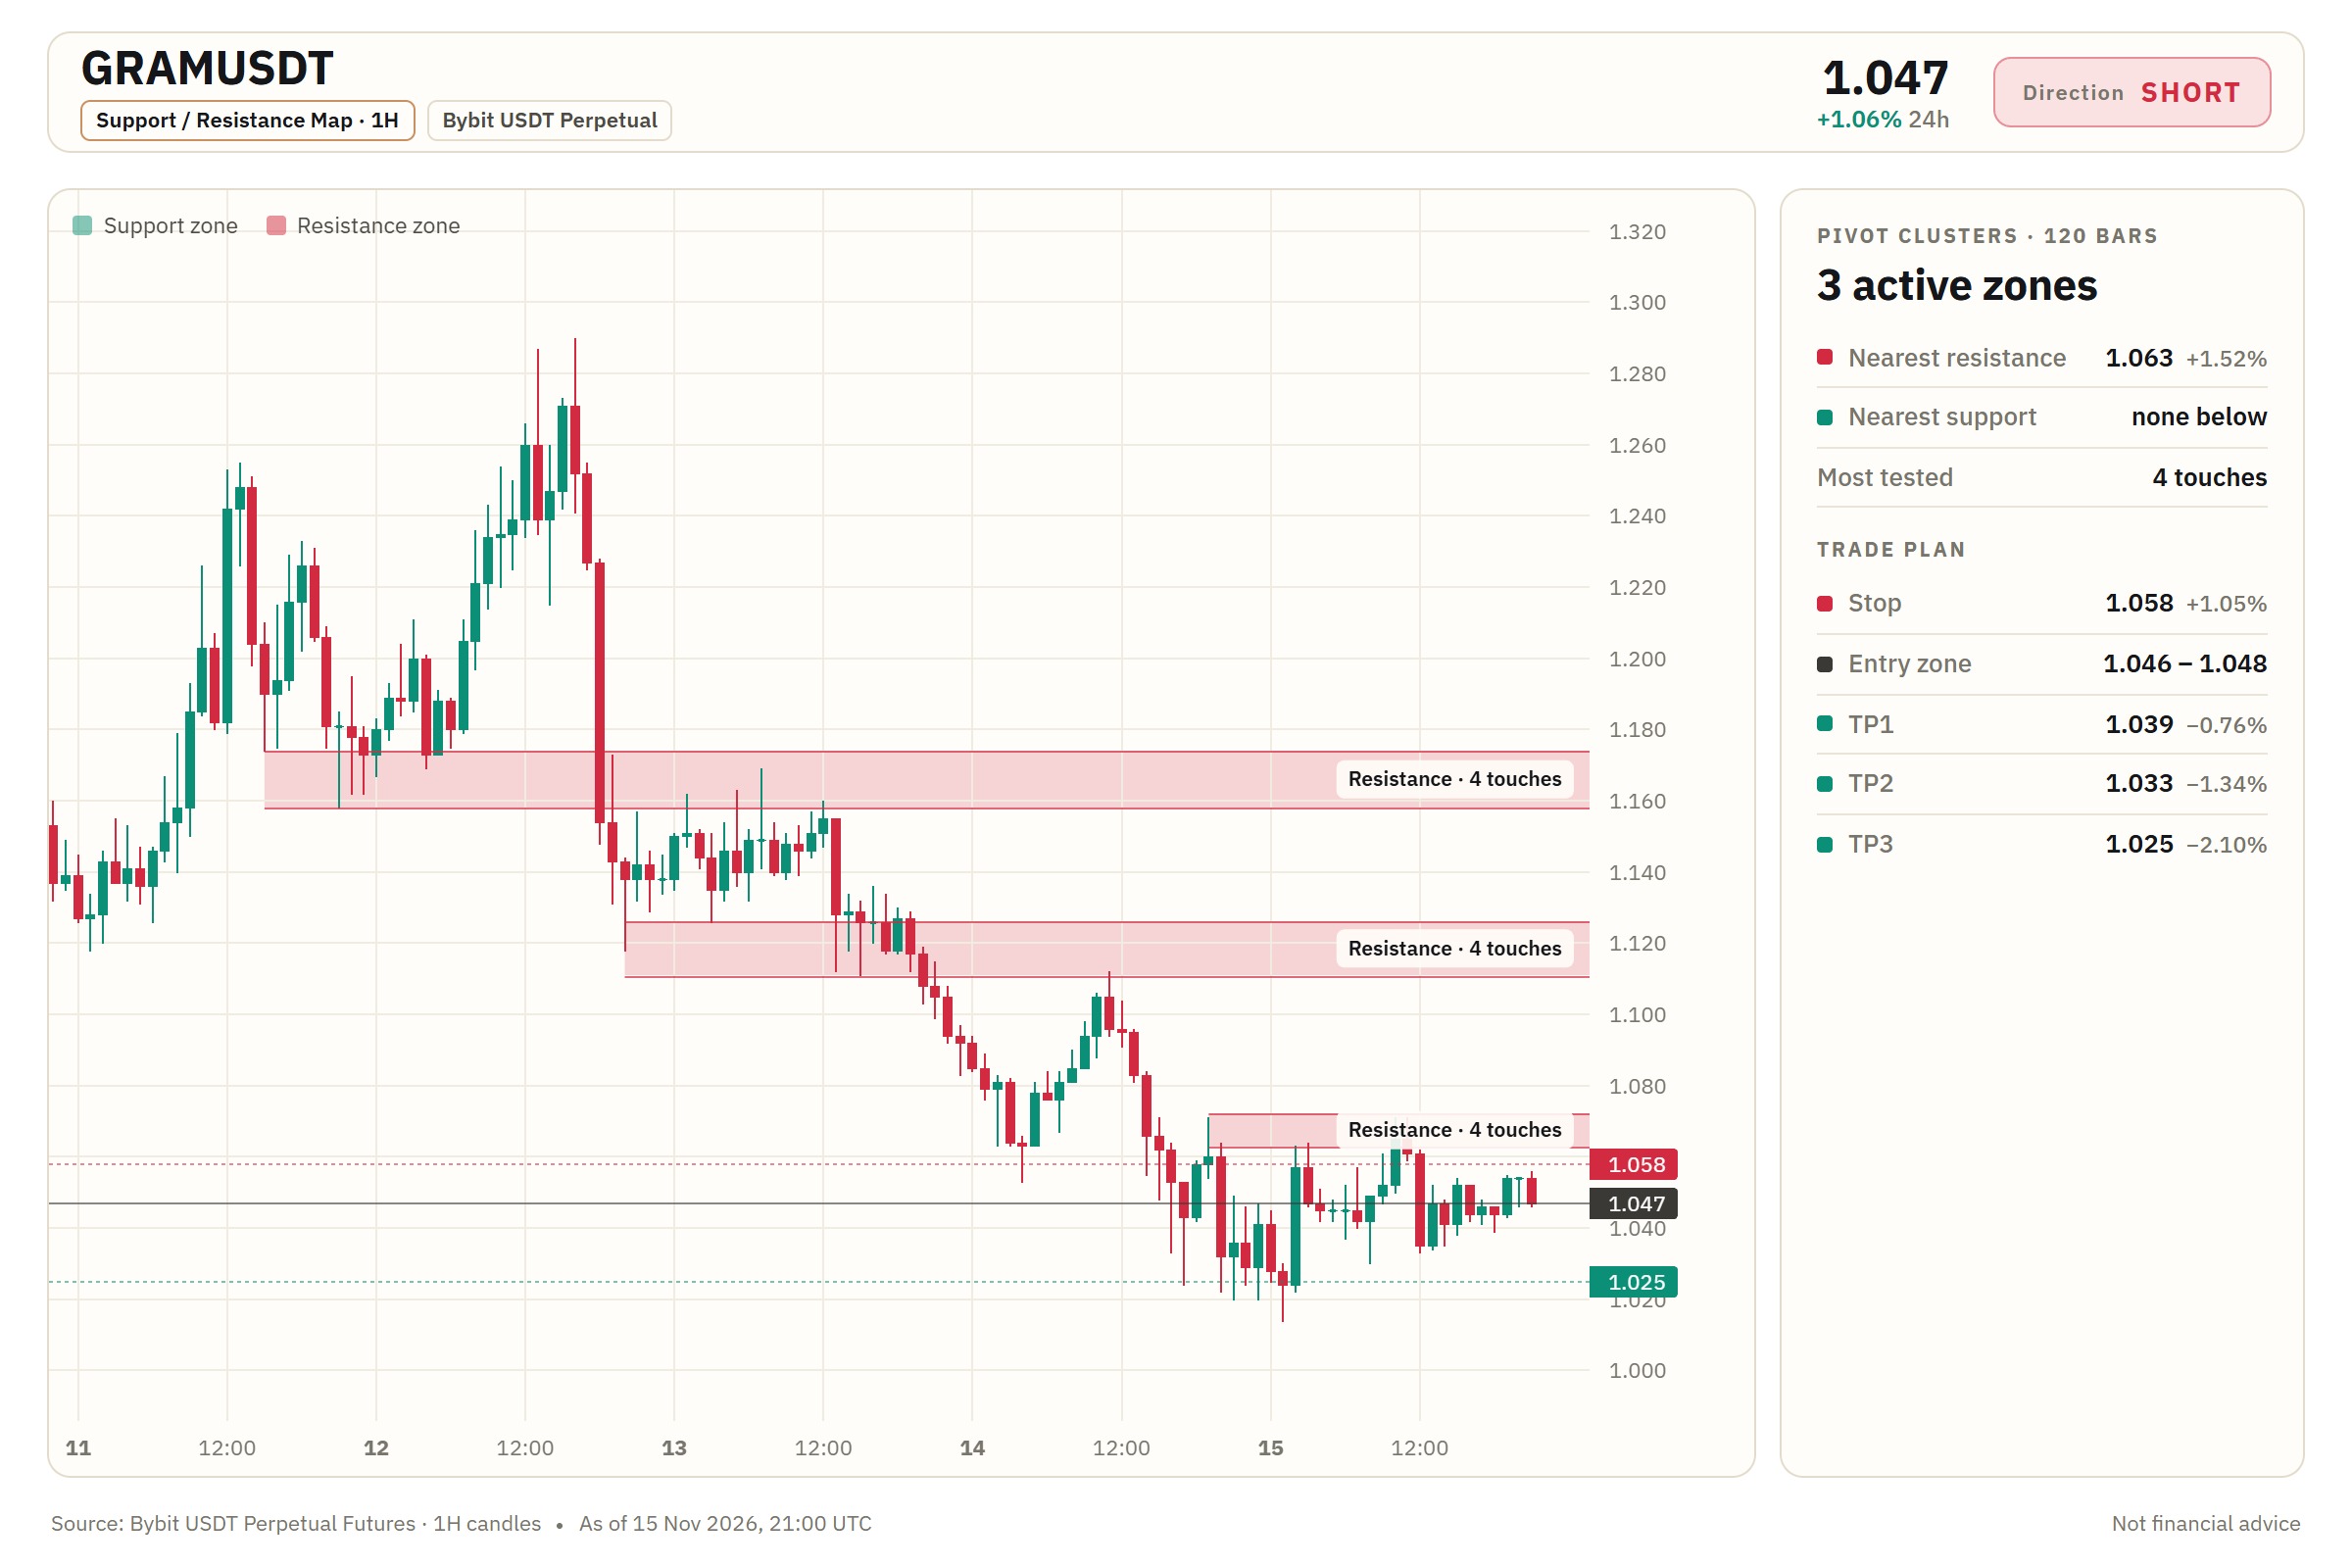
$GRAM/USDT — POSICIÓN EN CORTO (SHORT) Entrada: 1.046 - 1.048 SL (Stop Loss): 1.058 TP1 (Take Profit 1): 1.039 TP2 (Take Profit 2): 1.033 TP3 (Take Profit 3): 1.025 Estoy observando el RSI de 15m en 48.04 y veo que el impulso cambia a bajista dentro de una banda de entrada estrecha de 1.046–1.048. Con la tendencia de BTC plana, una ruptura clara desde esta zona podría abrir paso a un movimiento significativo hacia el TP2 en 1.033 y más adelante al TP3 en 1.025, mientras que 1.058 sirve como el nivel clave de invalidación. ¿Creen que la tendencia neutral de BTC permitirá que $GRAM/USDT llegue al TP2, o es más probable que primero haya un retesteo de 1.058? ⚠️ Solo análisis personal de mercado. NFA (No es asesoramiento financiero) — gestionen su riesgo y hagan su propia investigación (DYOR). Contenido educativo, no es asesoramiento de inversión ni una recomendación para comprar, vender, depositar o retirar ningún activo. Sin promociones pagadas ni enlaces de referencia/afiliados.$GRAMUSDT#WSOT2026 #WSOTMuestraTuOperaciónIAParaGanar10USDT
INJ Bearish as BTC Stalls
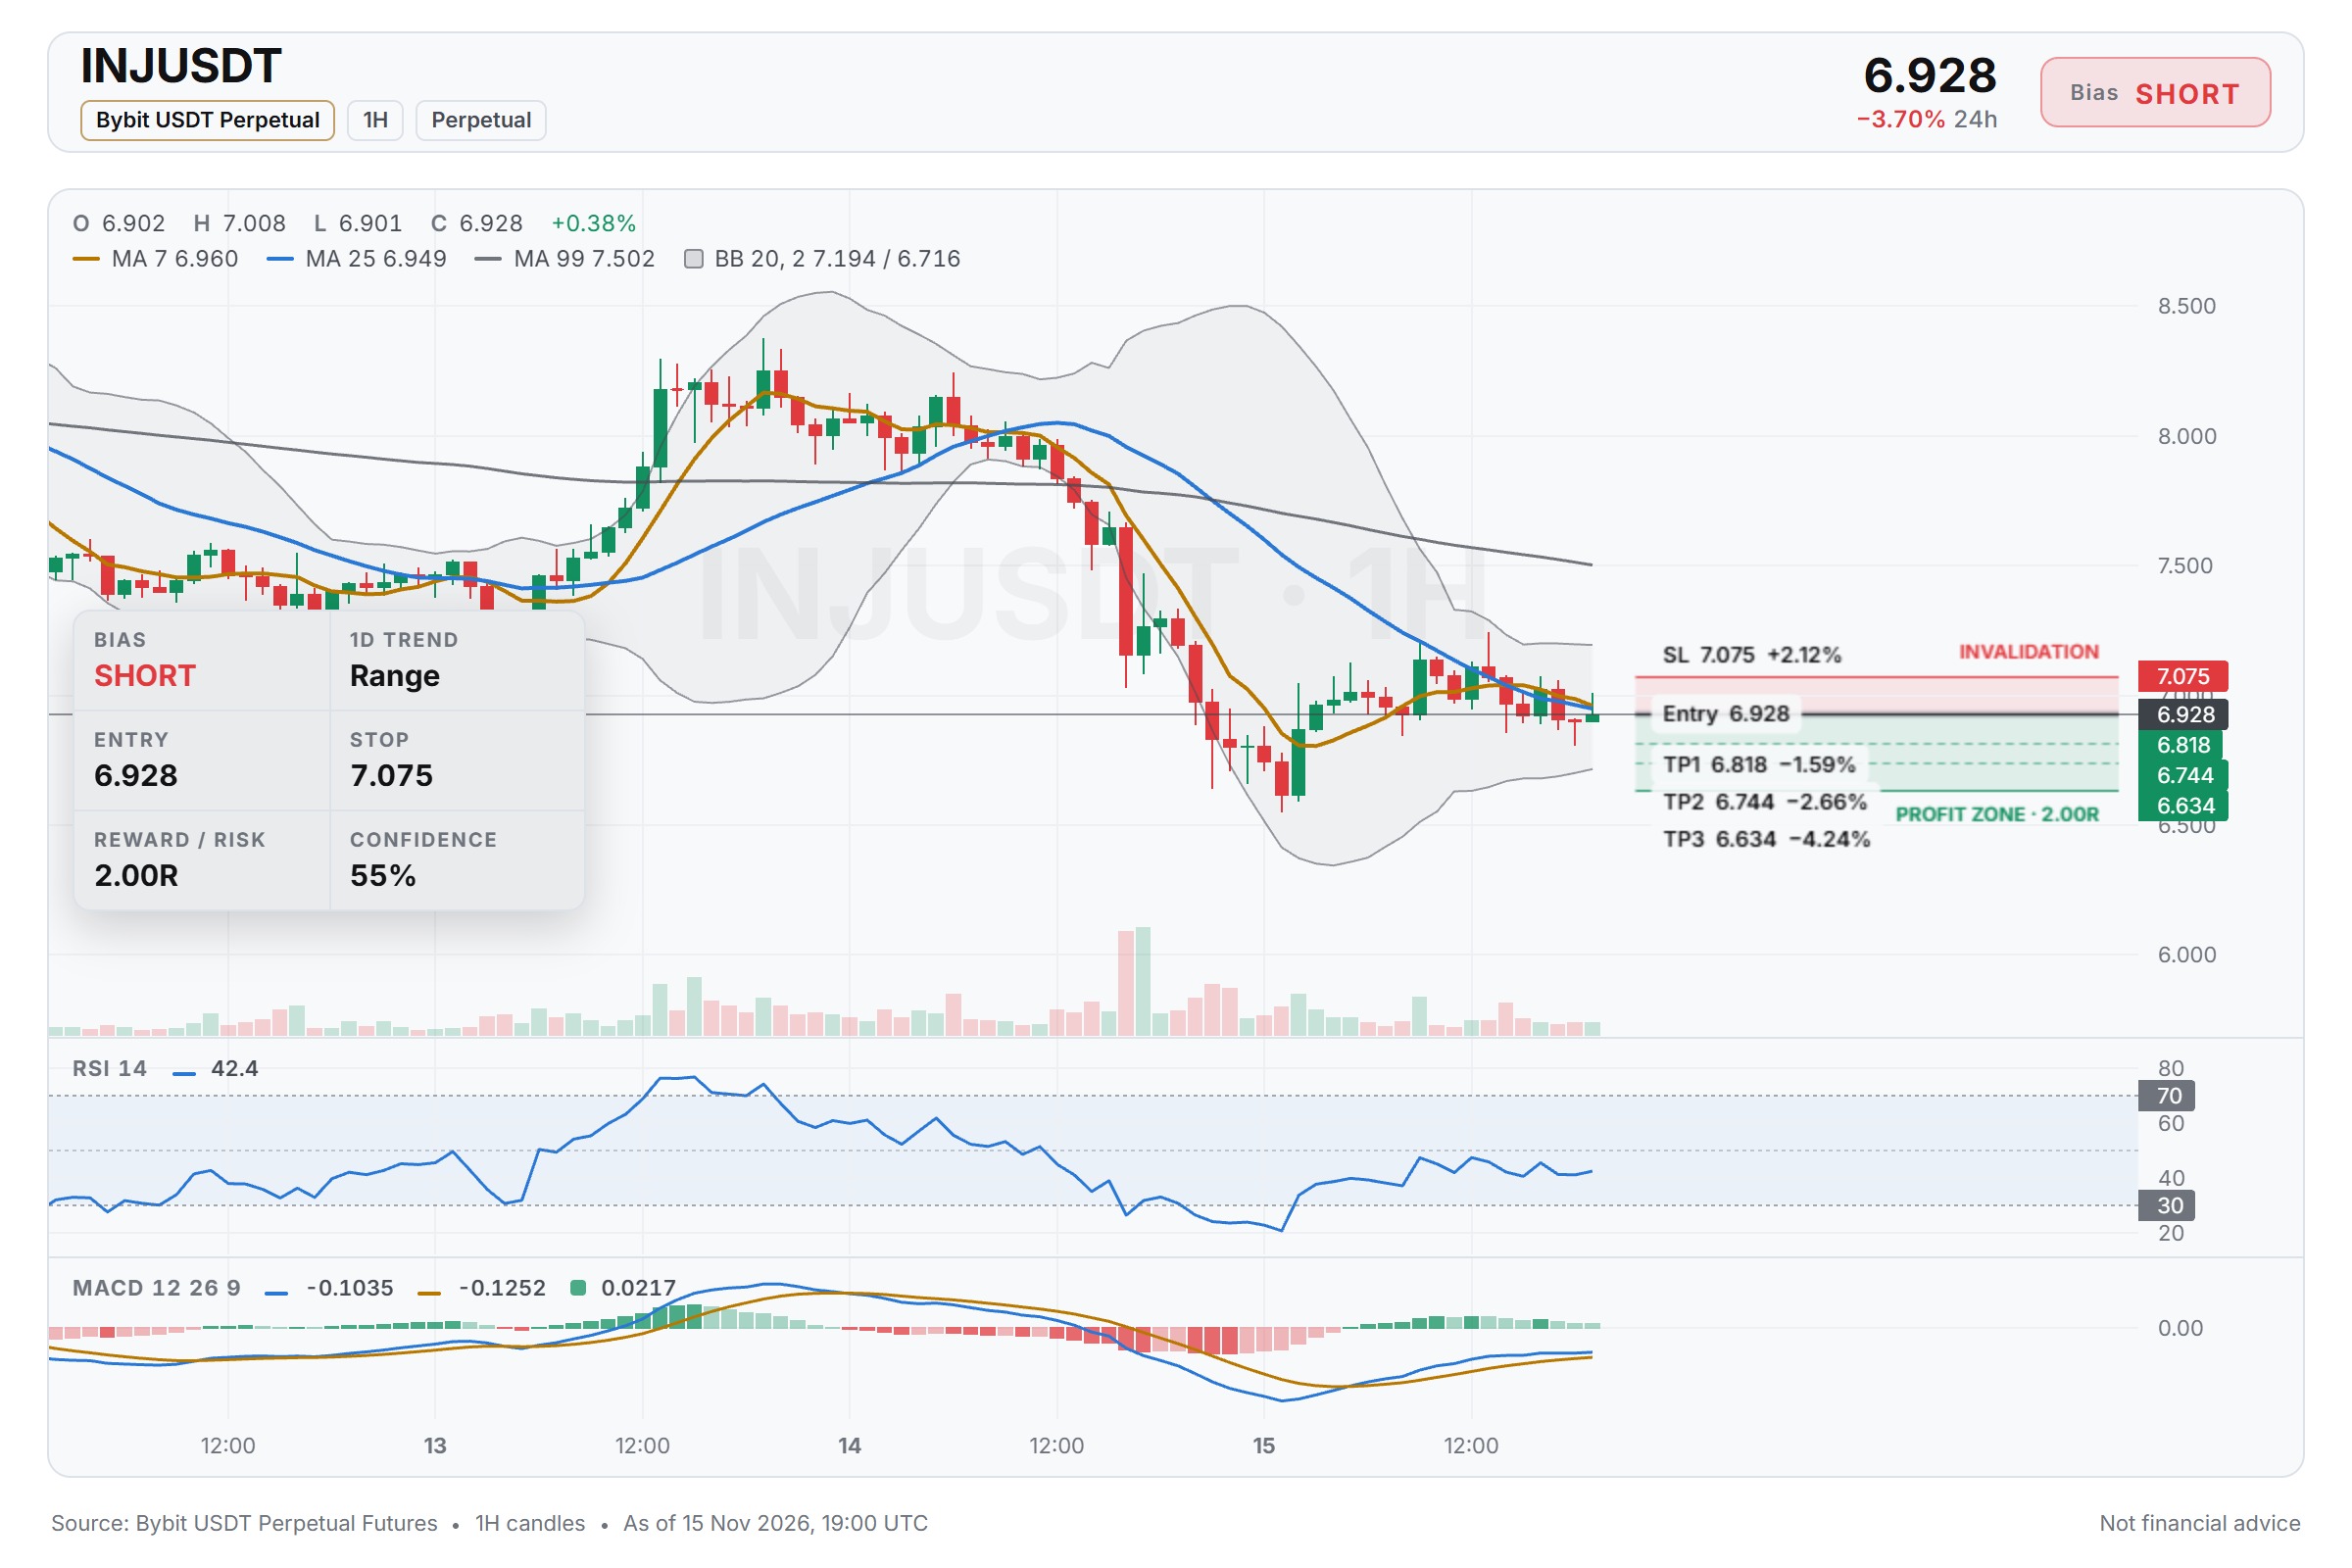
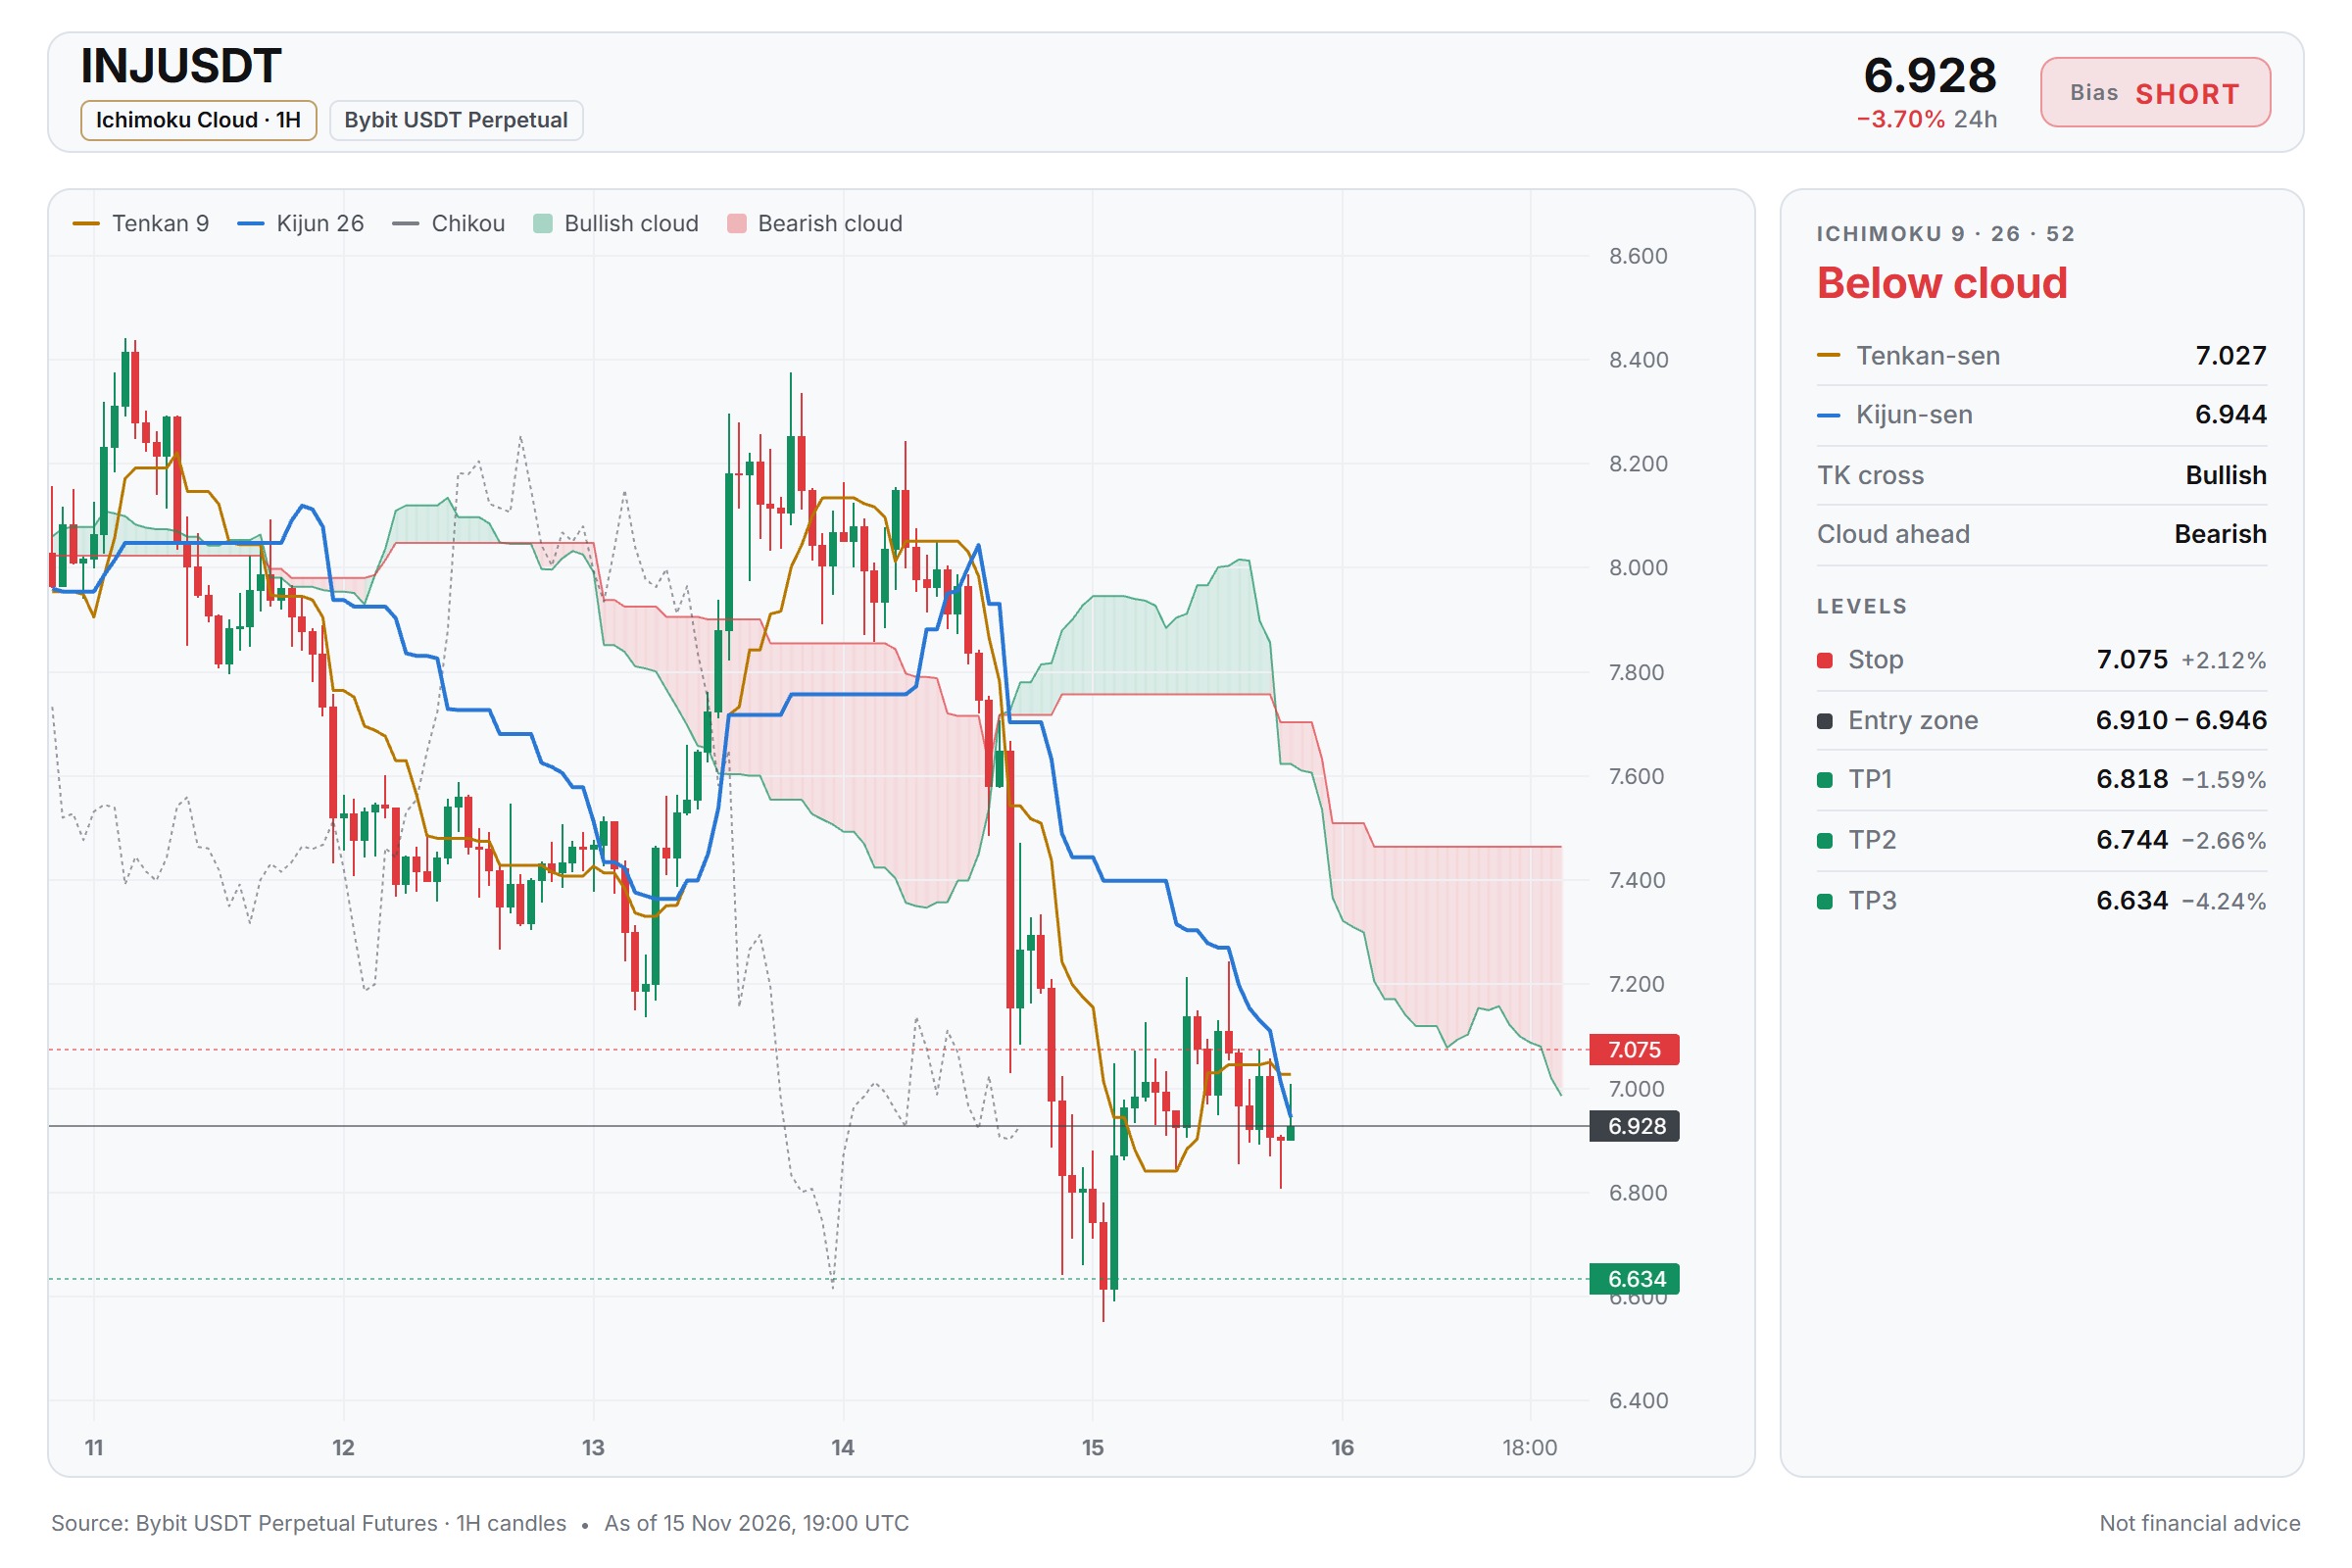
$INJ/USDT — SHORT Entry: 6.910 - 6.946 SL: 7.075 TP1: 6.818 TP2: 6.744 TP3: 6.634 From my view, the 15m RSI around 47 shows fading momentum while the short setup forms. With BTC trend neutral, a failure at 6.946 could open a path toward the TP2 and TP3 zones. I watch the SL at 7.075 as the key invalidation level. Do you think INJ will break the entry range before BTC gives a clearer direction? ⚠️ Personal market analysis only. NFA — manage risk and DYOR. Educational content, not investment advice or a recommendation to buy, sell, deposit, or withdraw any asset. No paid promotion or referral/affiliate links.$INJUSDT#WSOT2026 #WSOTShowYourAITradeToEarn10USDT
Why this APEX dip might keep descending soon.
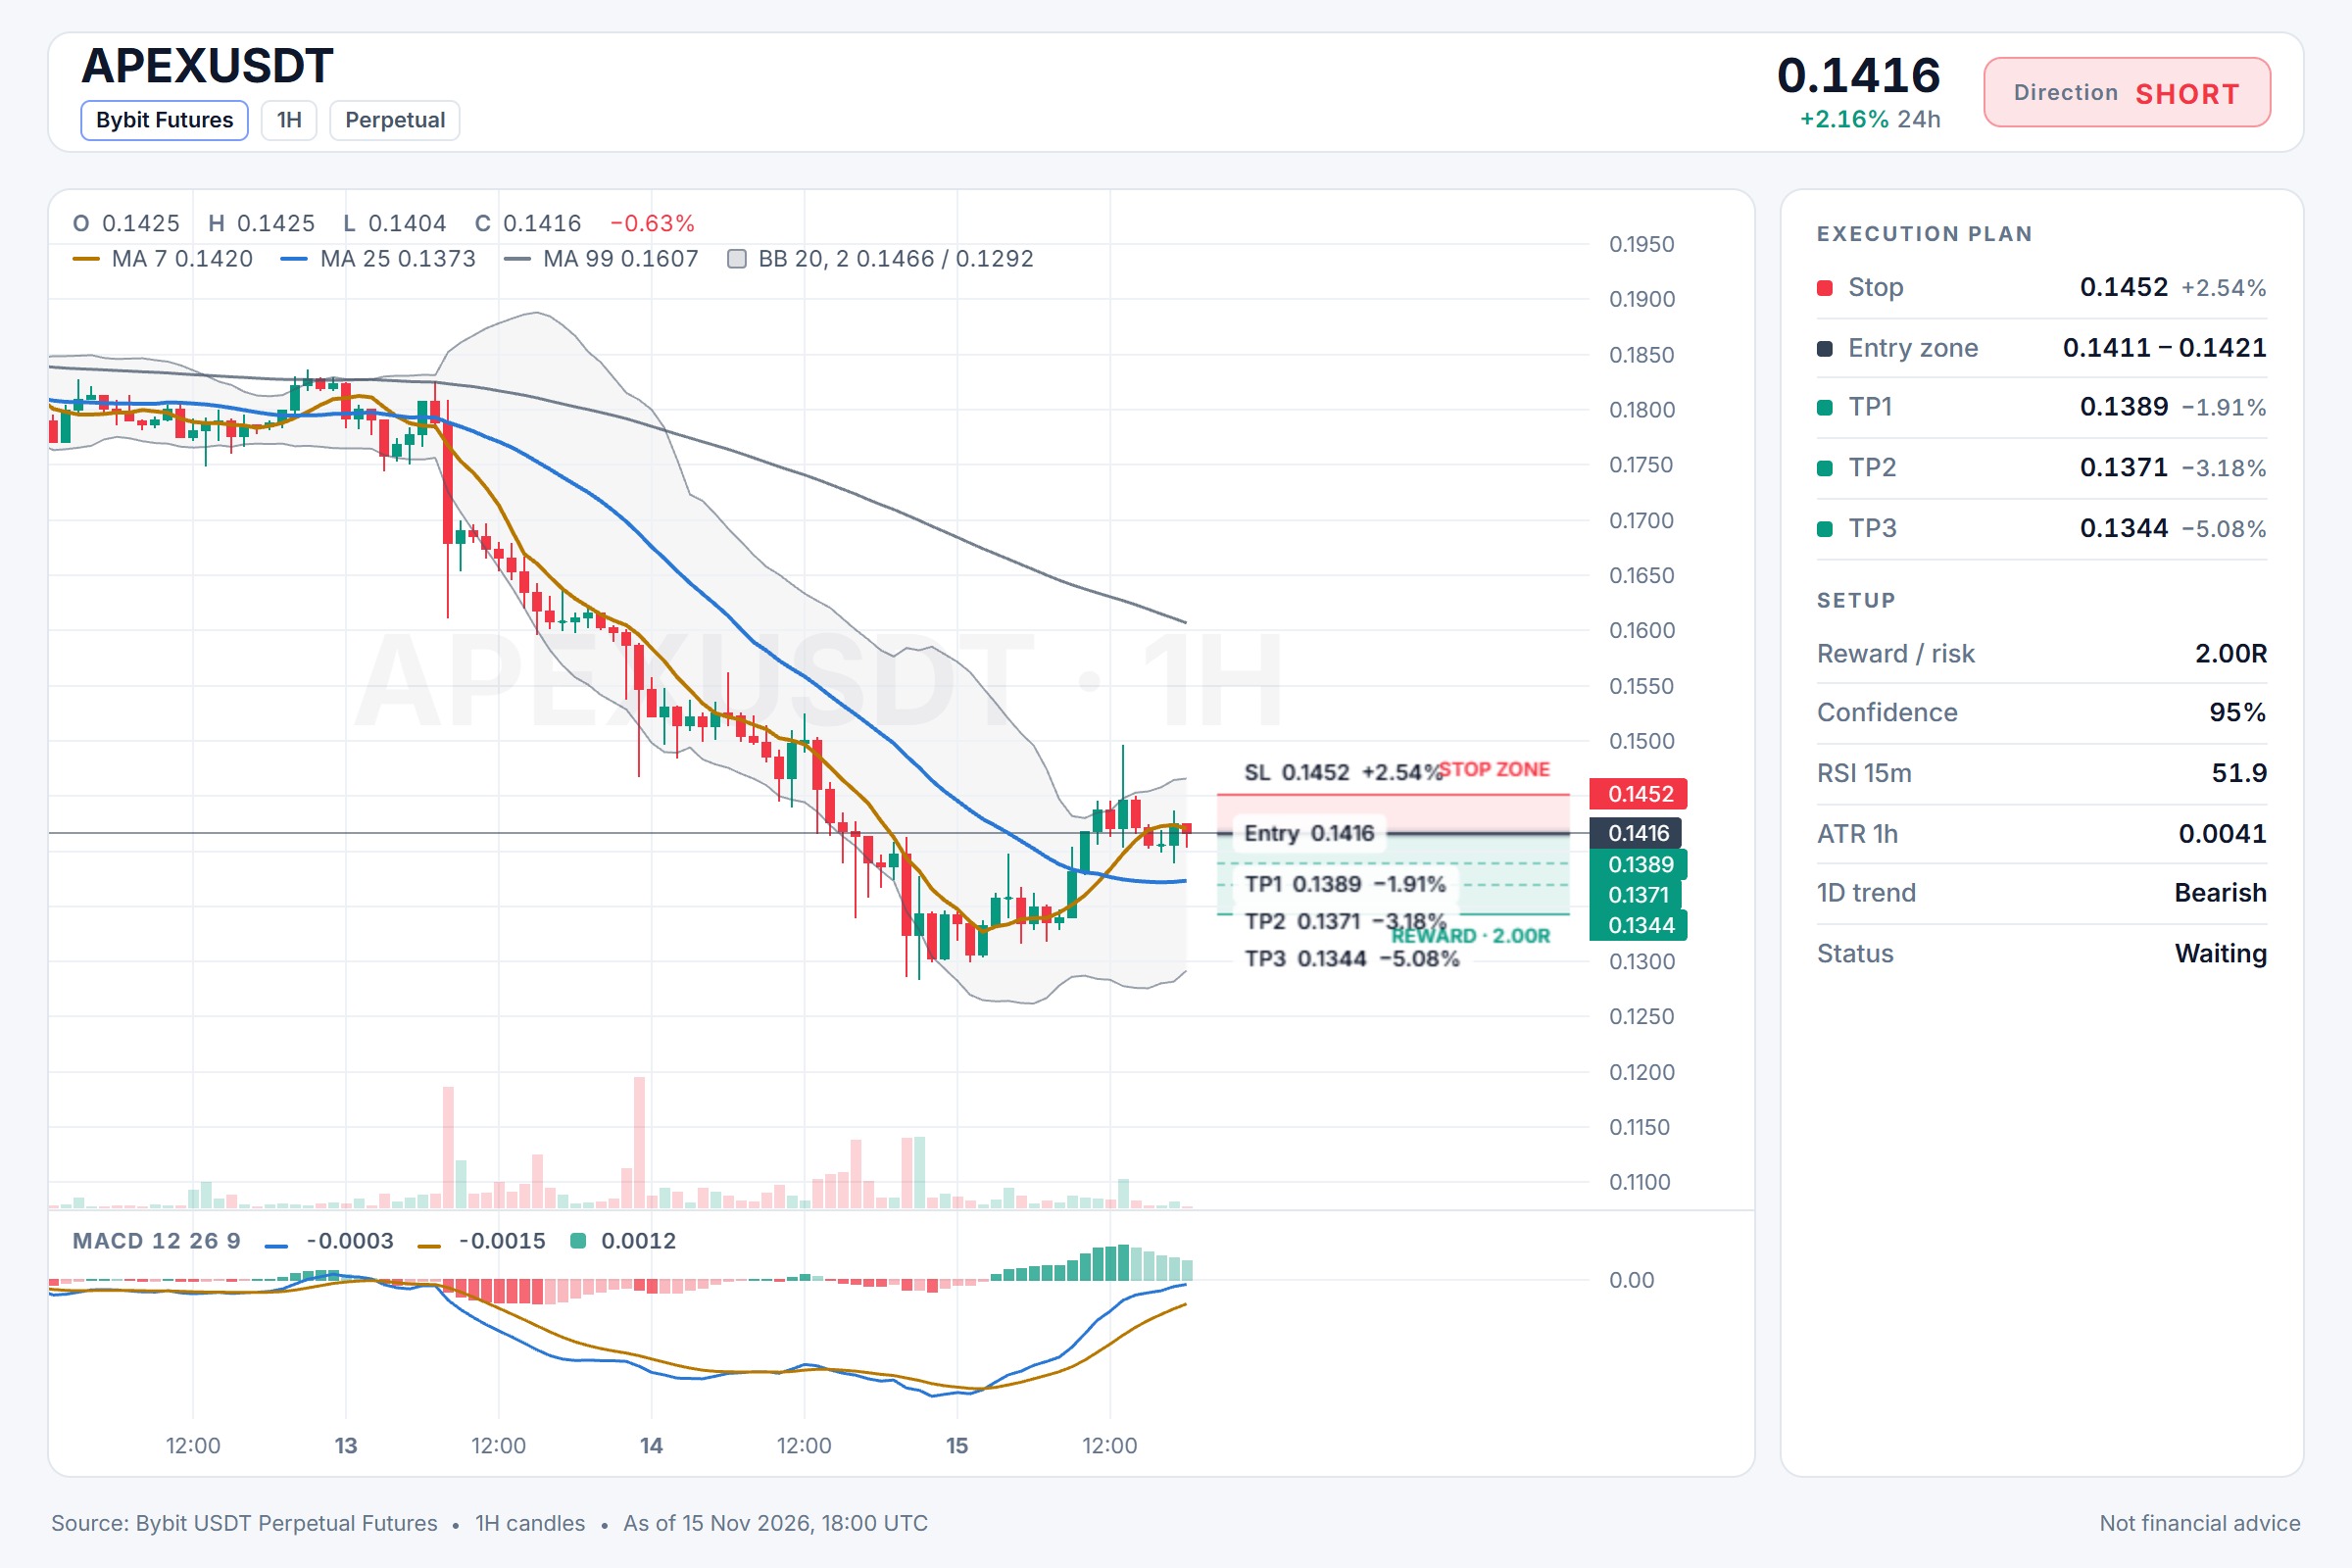
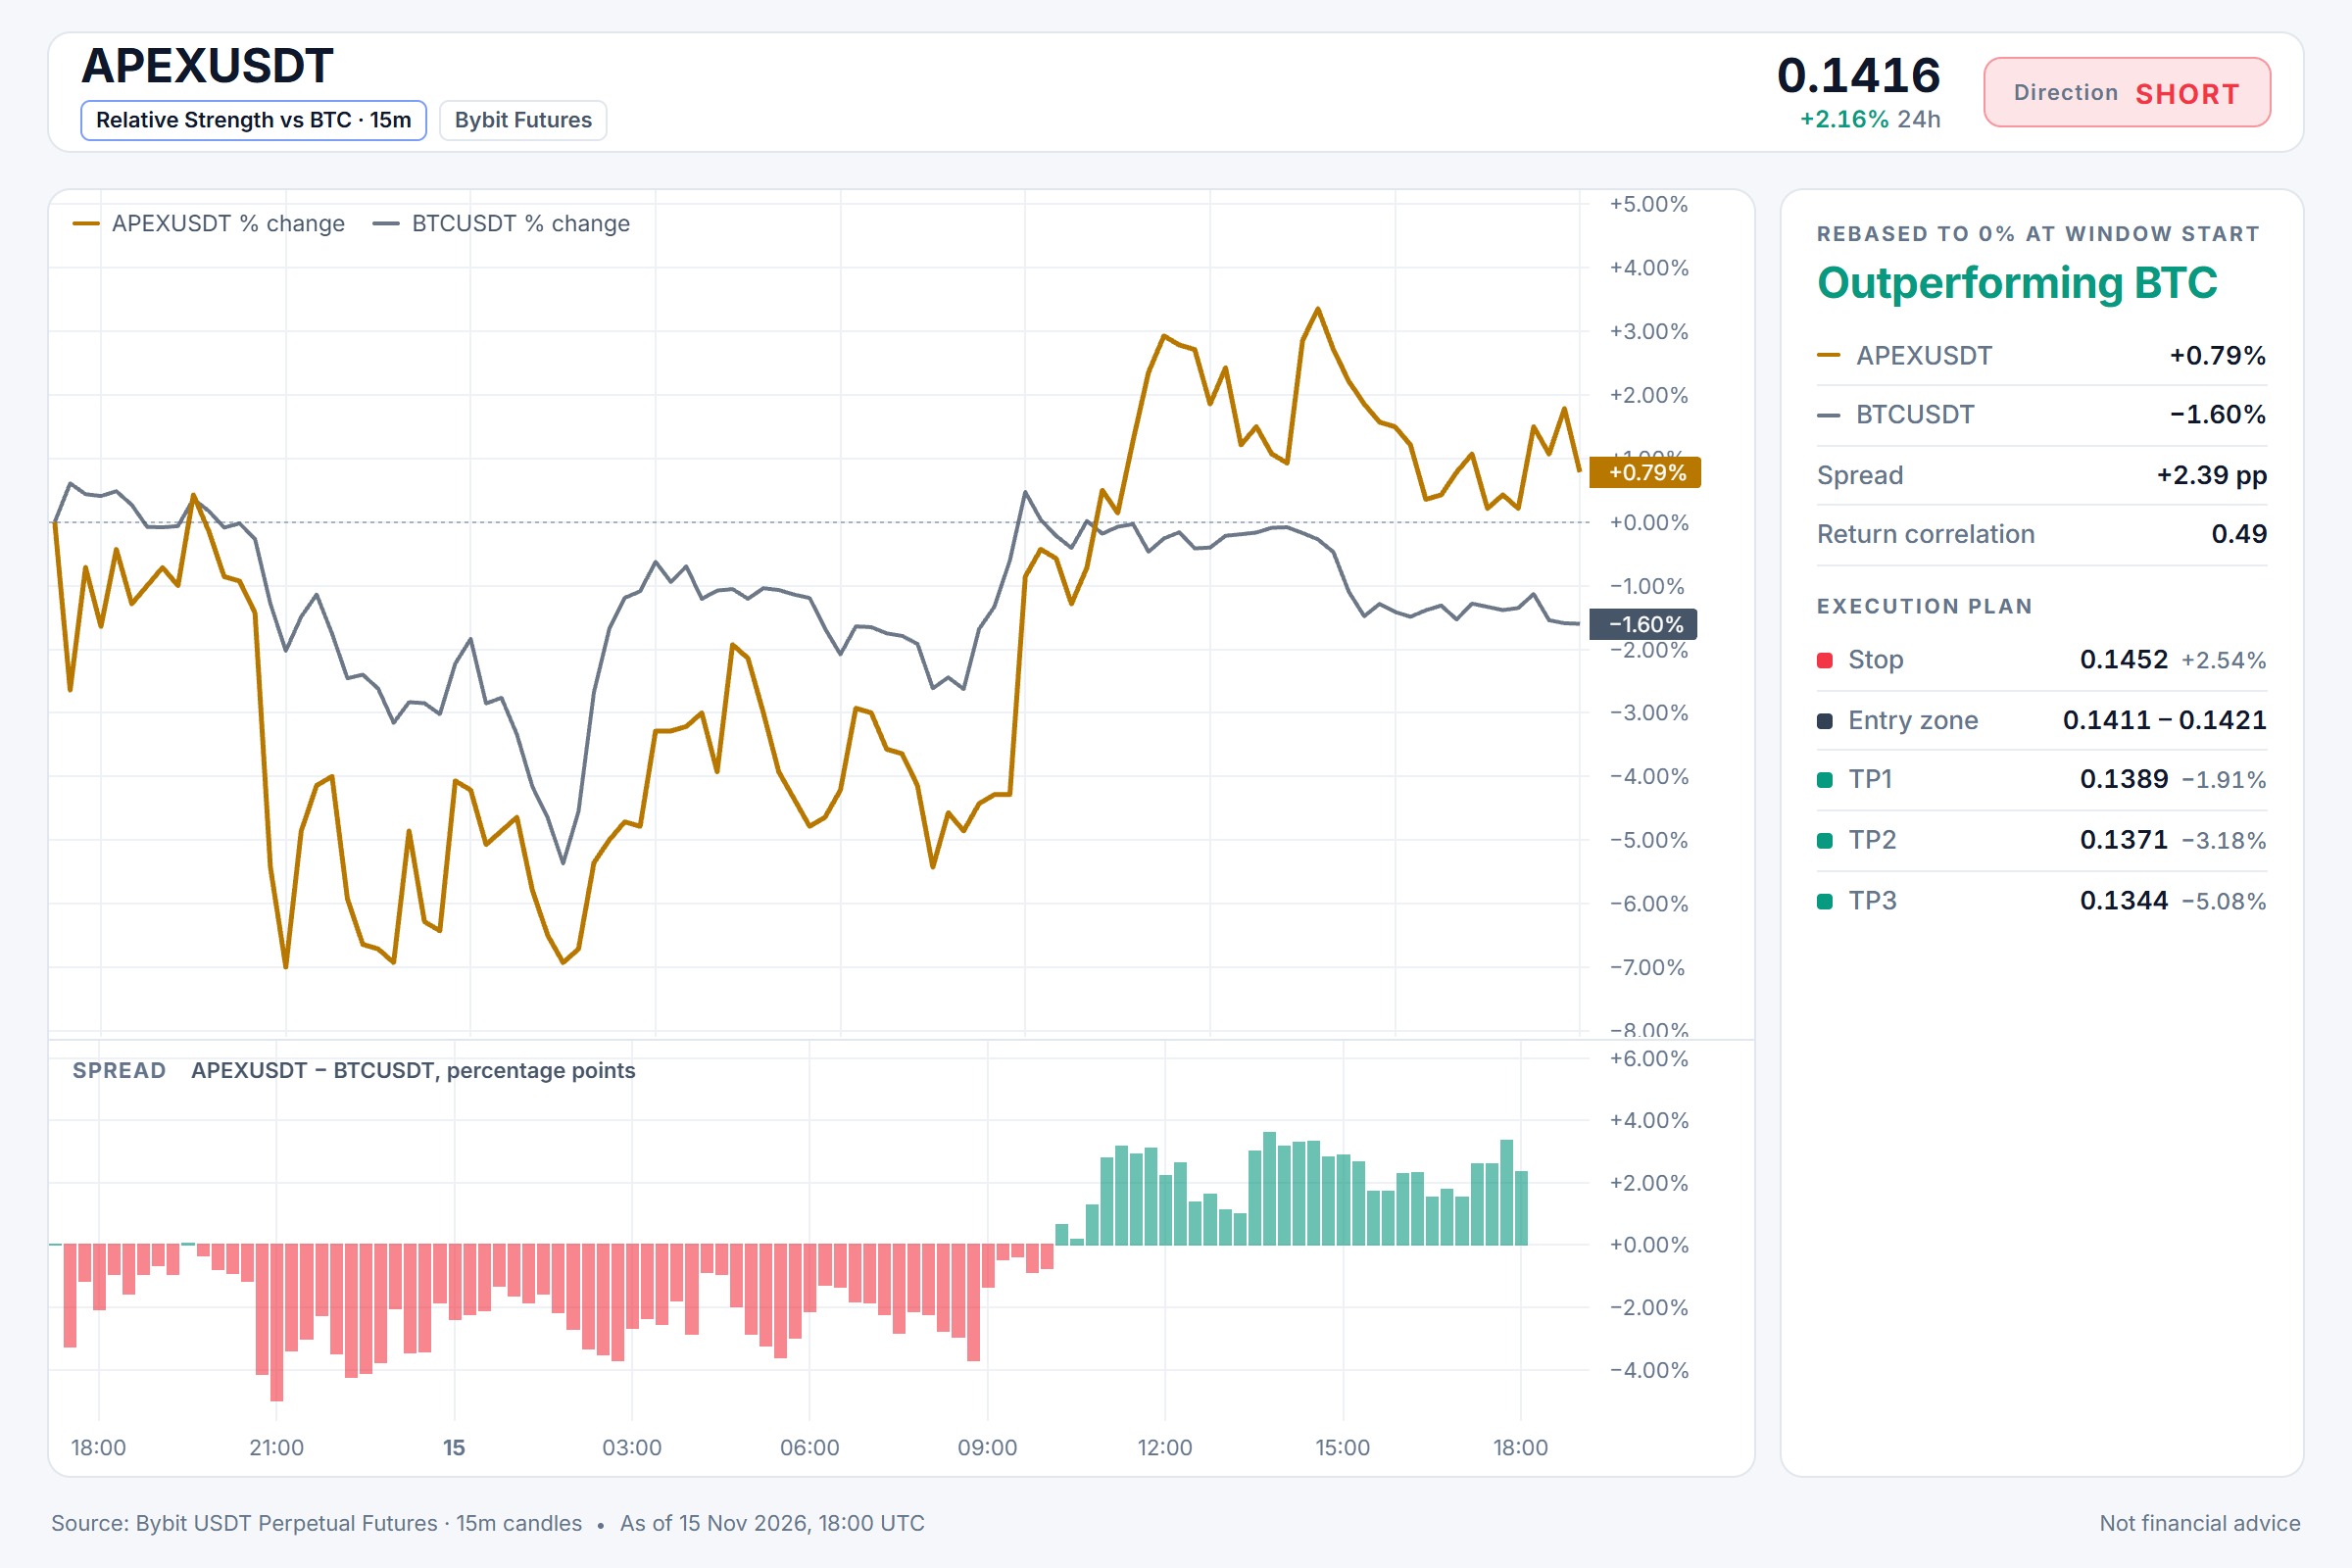
$APEX/USDT — SHORT Entry: 0.1411 - 0.1421 SL: 0.1452 TP1: 0.1389 TP2: 0.1371 TP3: 0.1344 With BTC trending bearish and 15m RSI sitting at 51.88, momentum here feels hesitant. APEX drifting into the 0.1411 to 0.1421 entry area could offer a short path toward 0.1371 and possibly 0.1344 if sellers step in. Do you agree this short setup has enough follow-through, or would you wait for a deeper pullback? ⚠️ Personal market analysis only. NFA — manage risk and DYOR. Educational content, not investment advice or a recommendation to buy, sell, deposit, or withdraw any asset. No paid promotion or referral/affiliate links.$APEXUSDT#WSOT2026 #WSOTShowYourAITradeToEarn10USDT
BNB RSI Bearish Divergence Near 590: What's Next?
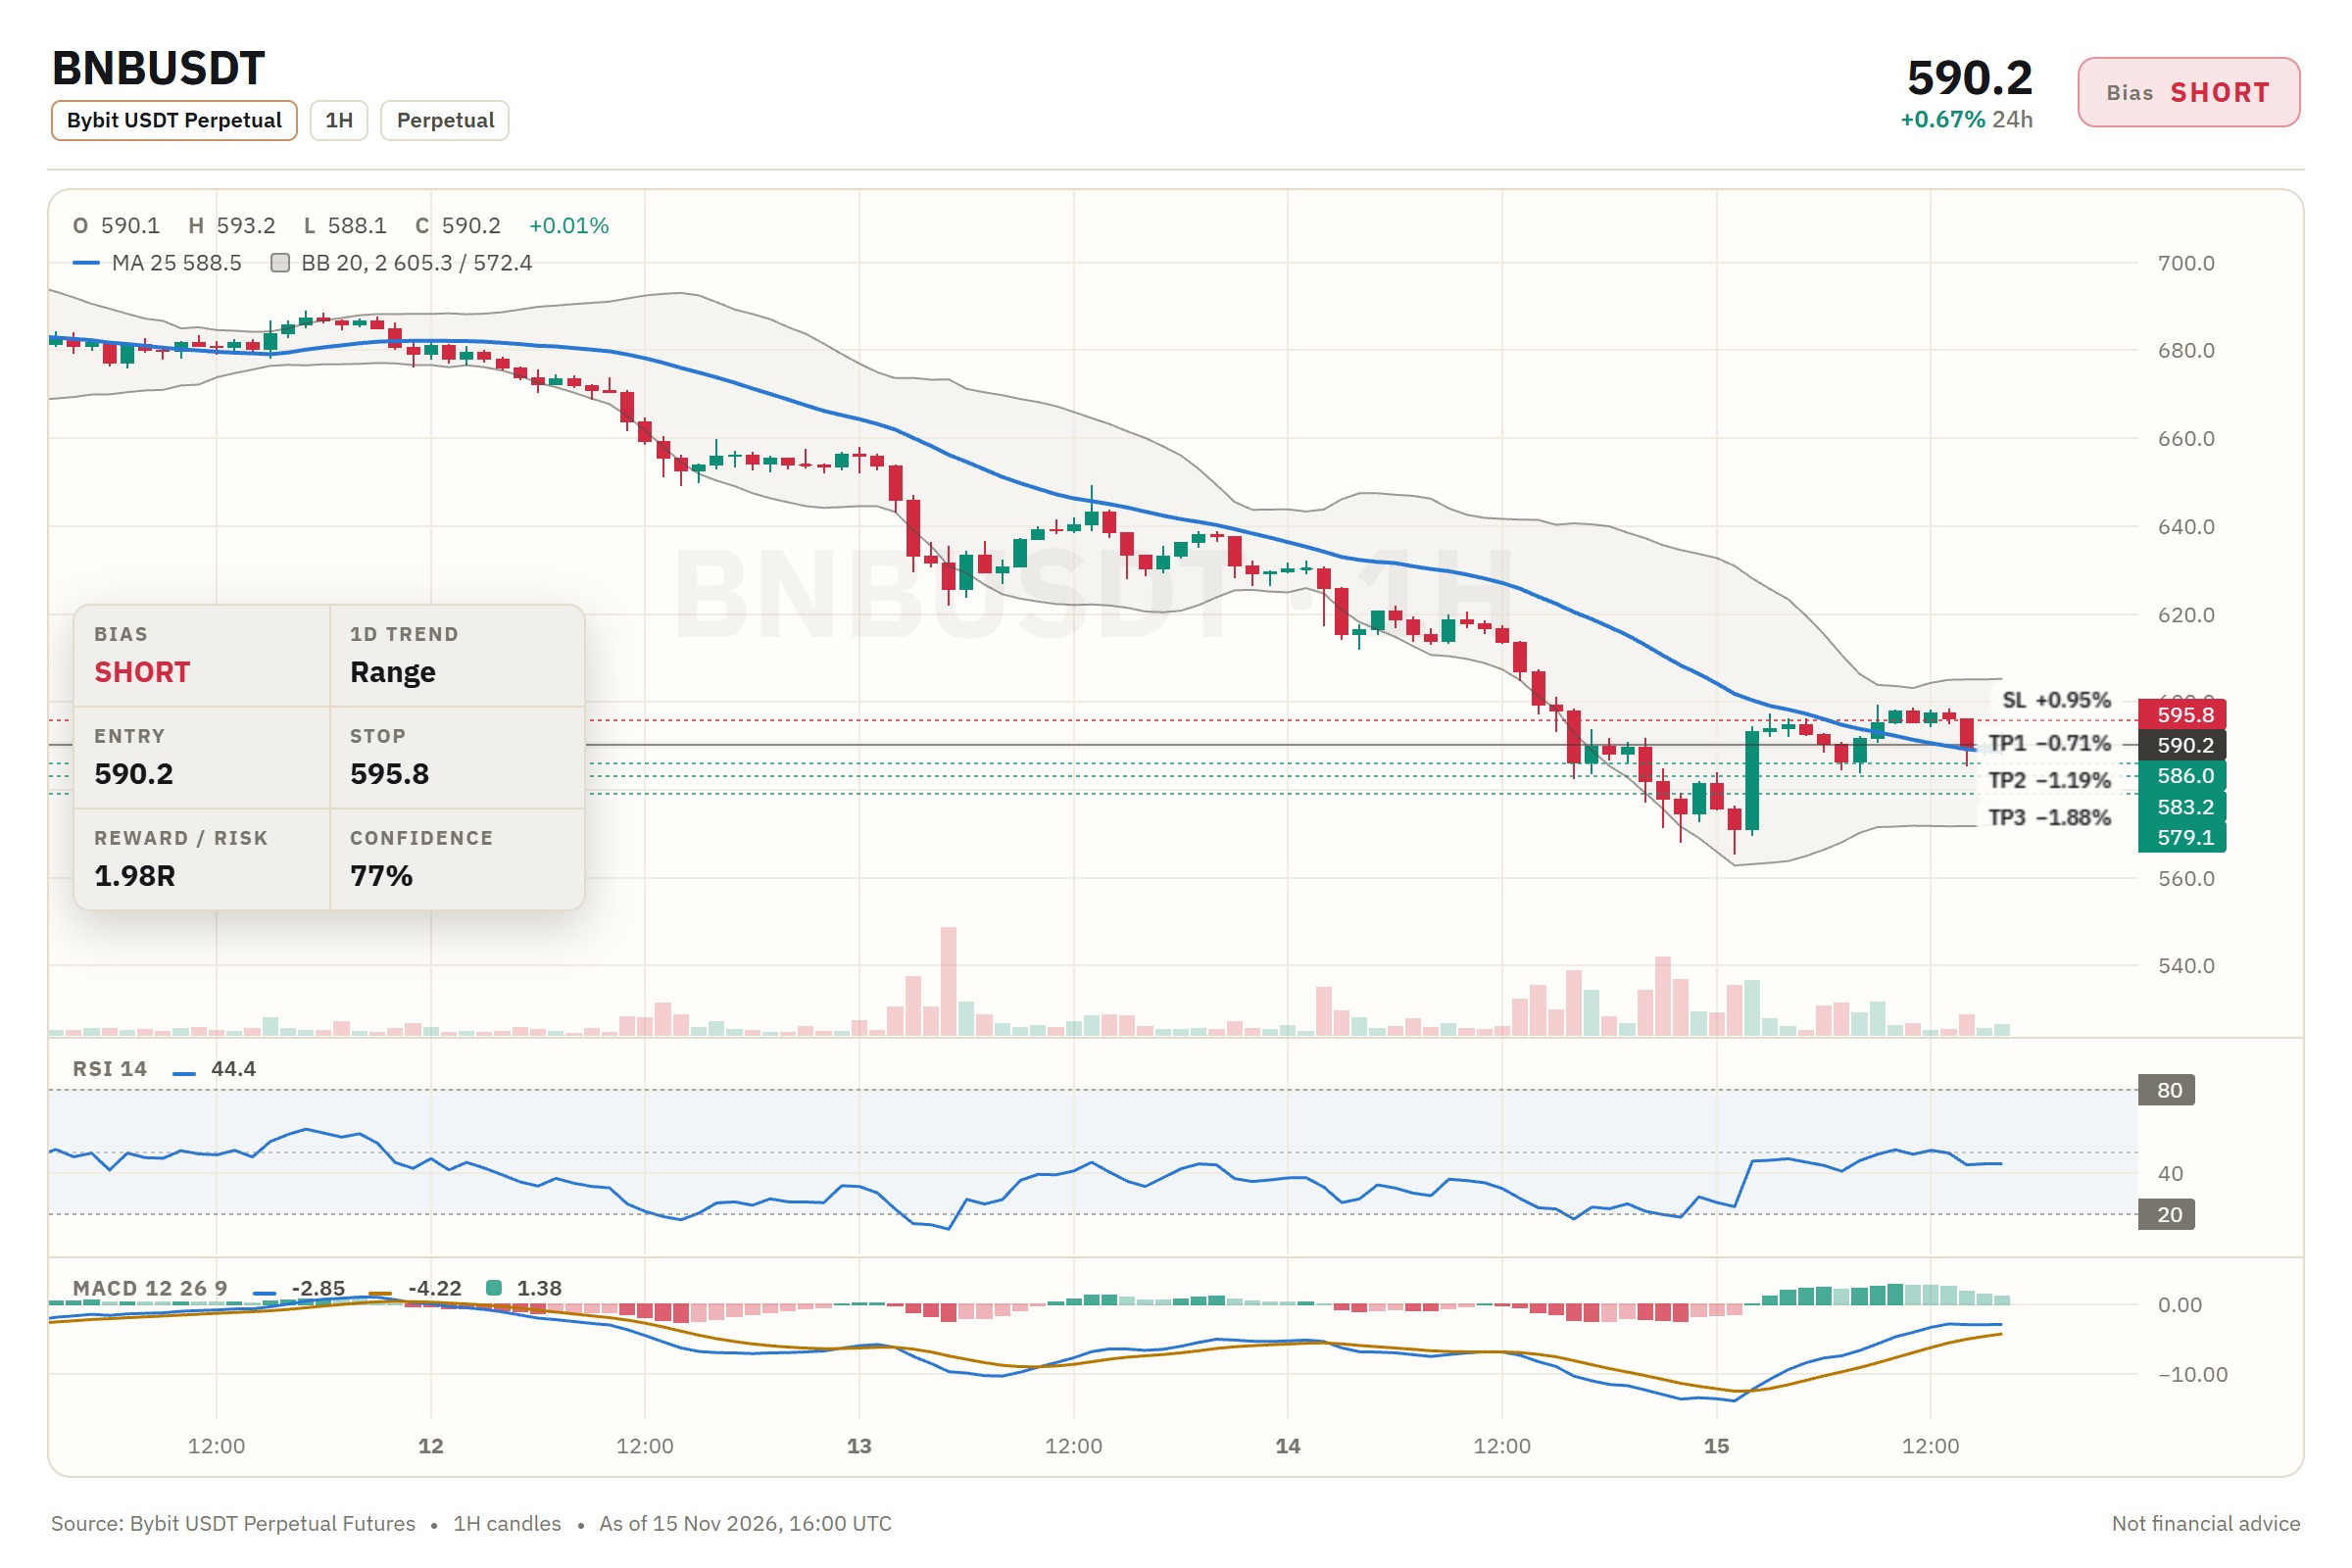
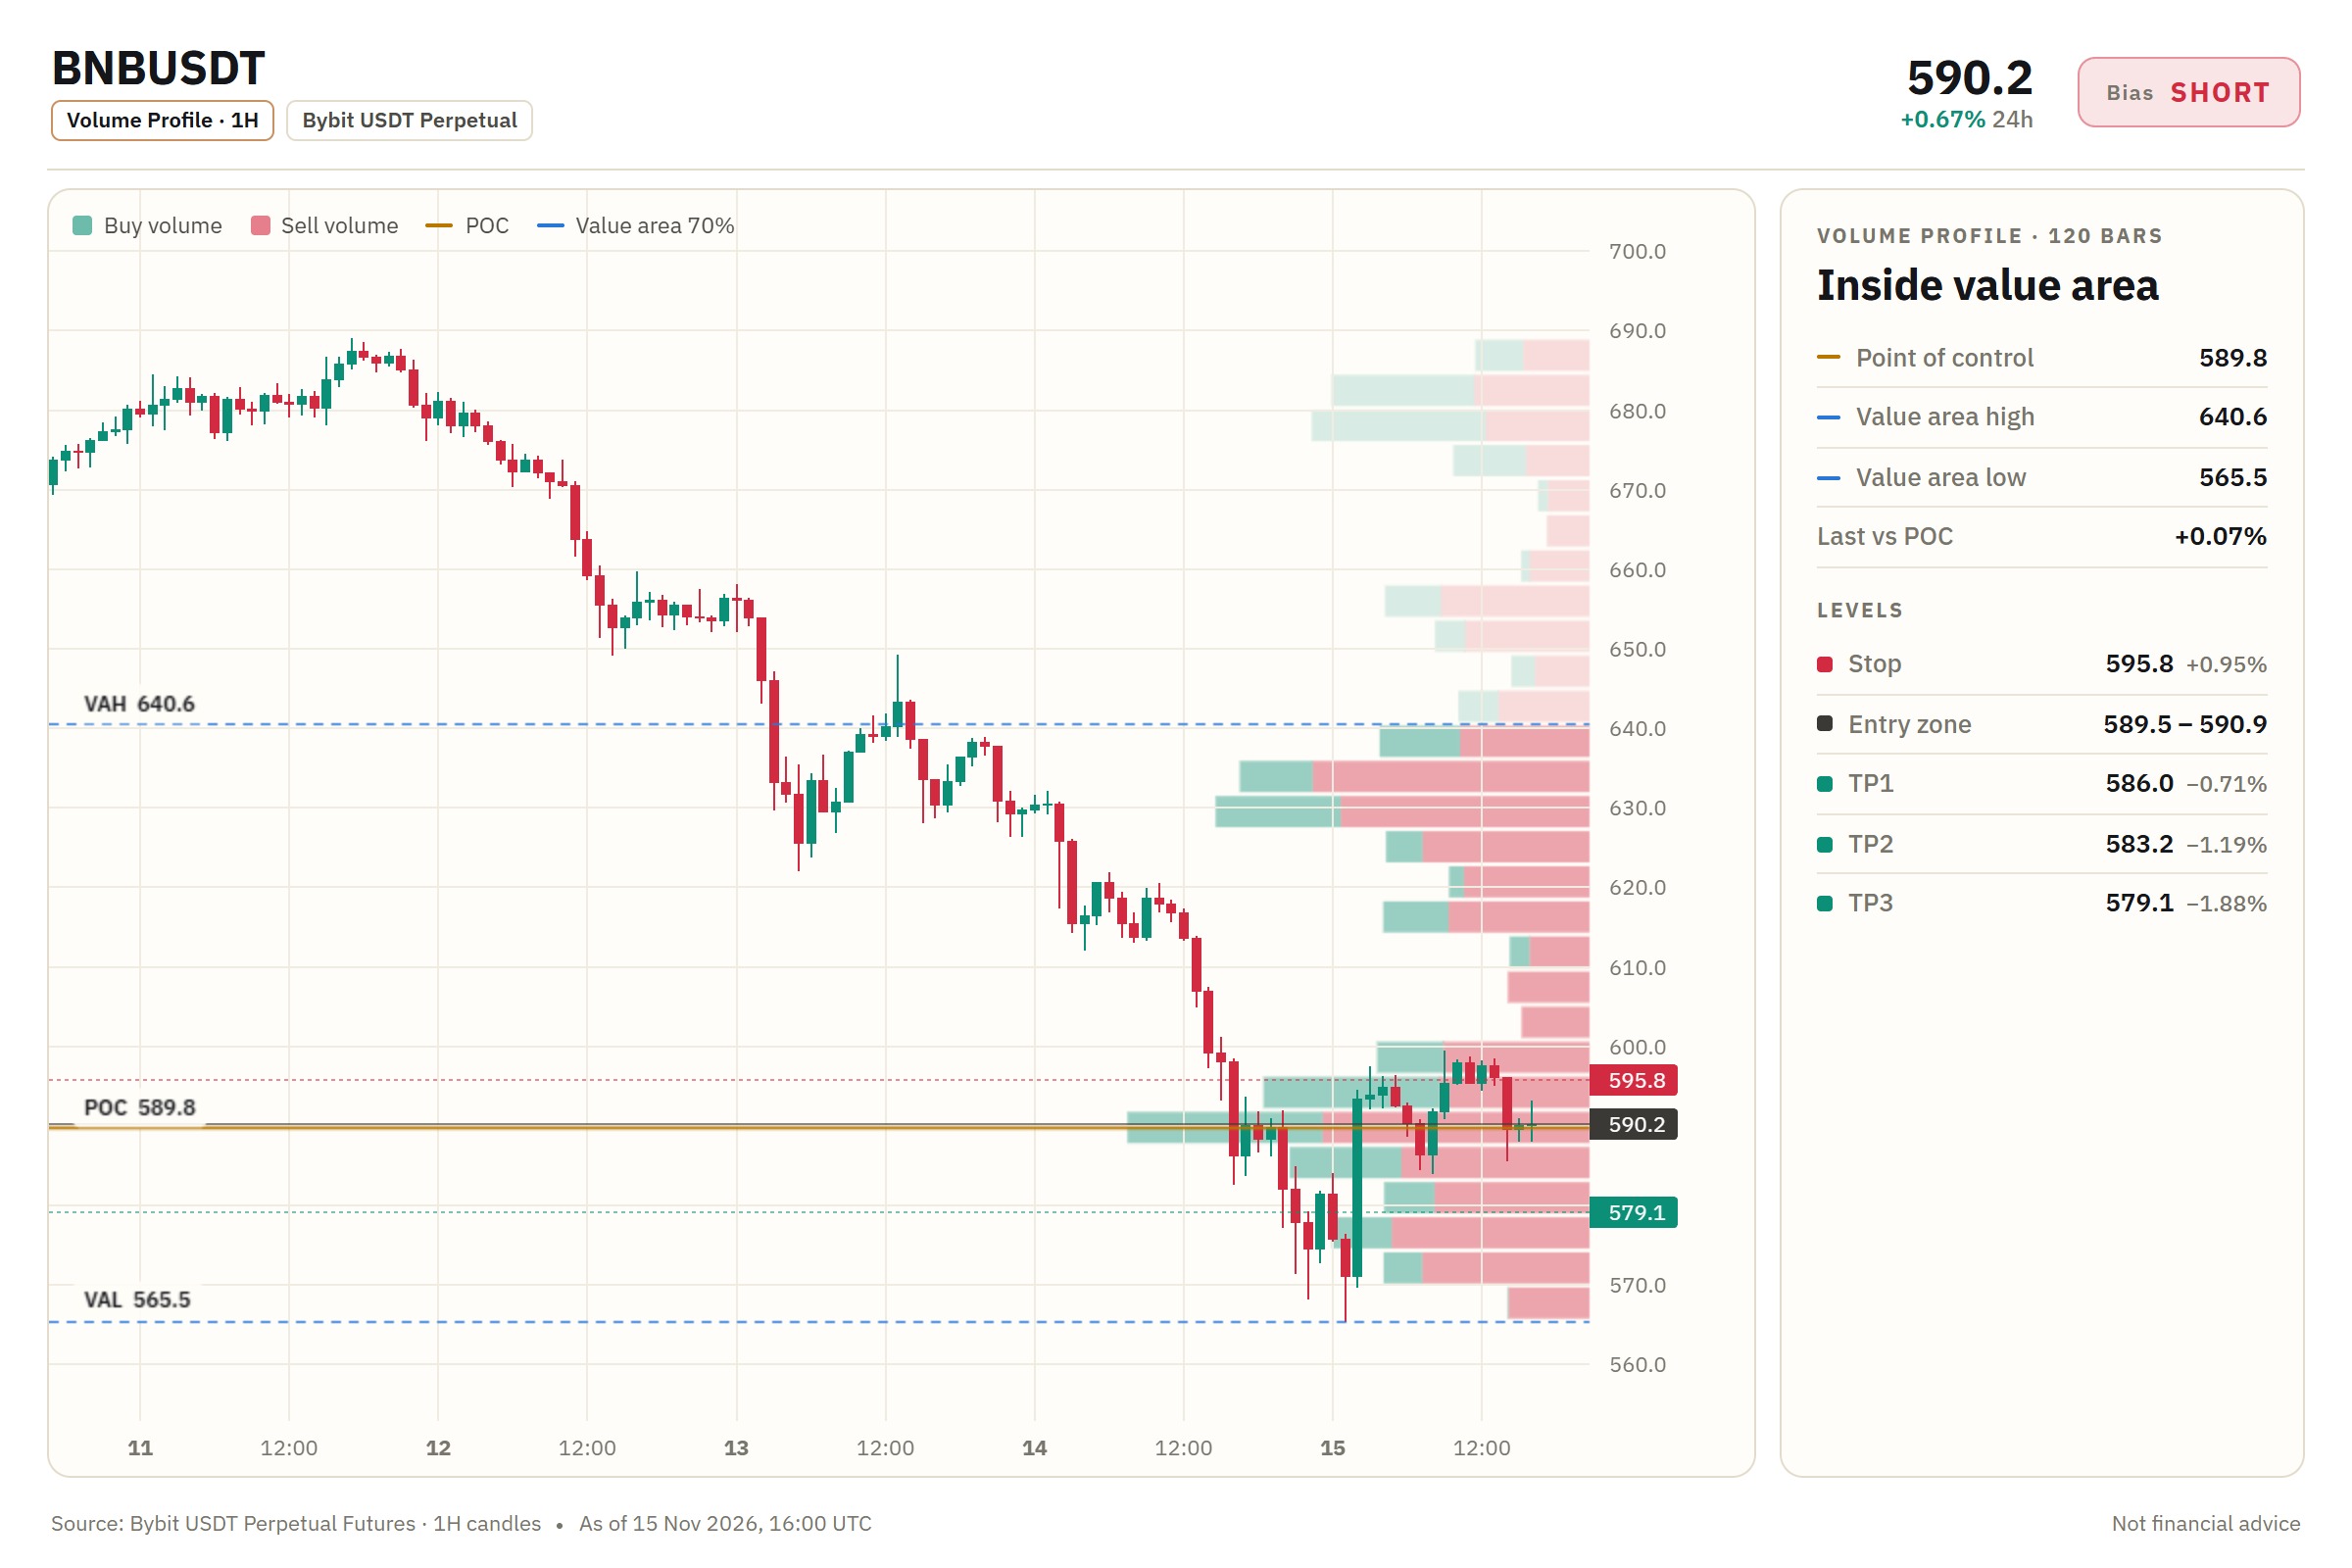
$BNB/USDT — SHORT Entry: 589.5 - 590.9 SL: 595.8 TP1: 586.0 TP2: 583.2 TP3: 579.1 I'm watching BNB carefully around 590.2 as BTC's bearish trend continues to weigh on the broader market. The 15m RSI sitting at 42.17 shows weakening momentum, and with price near the upper end of a tight range, I see a short opportunity forming. A retest of this area could give us a clean entry if sellers step in. Do you agree that waiting for RSI confirmation below 40 is smarter than entering here? ⚠️ Personal market analysis only. NFA — manage risk and DYOR. Educational content, not investment advice or a recommendation to buy, sell, deposit, or withdraw any asset. No paid promotion or referral/affiliate links.$BNBUSDT#WSOT2026 #WSOTShowYourAITradeToEarn10USDT
Why ARB's RSI Near Midline Has Me Short
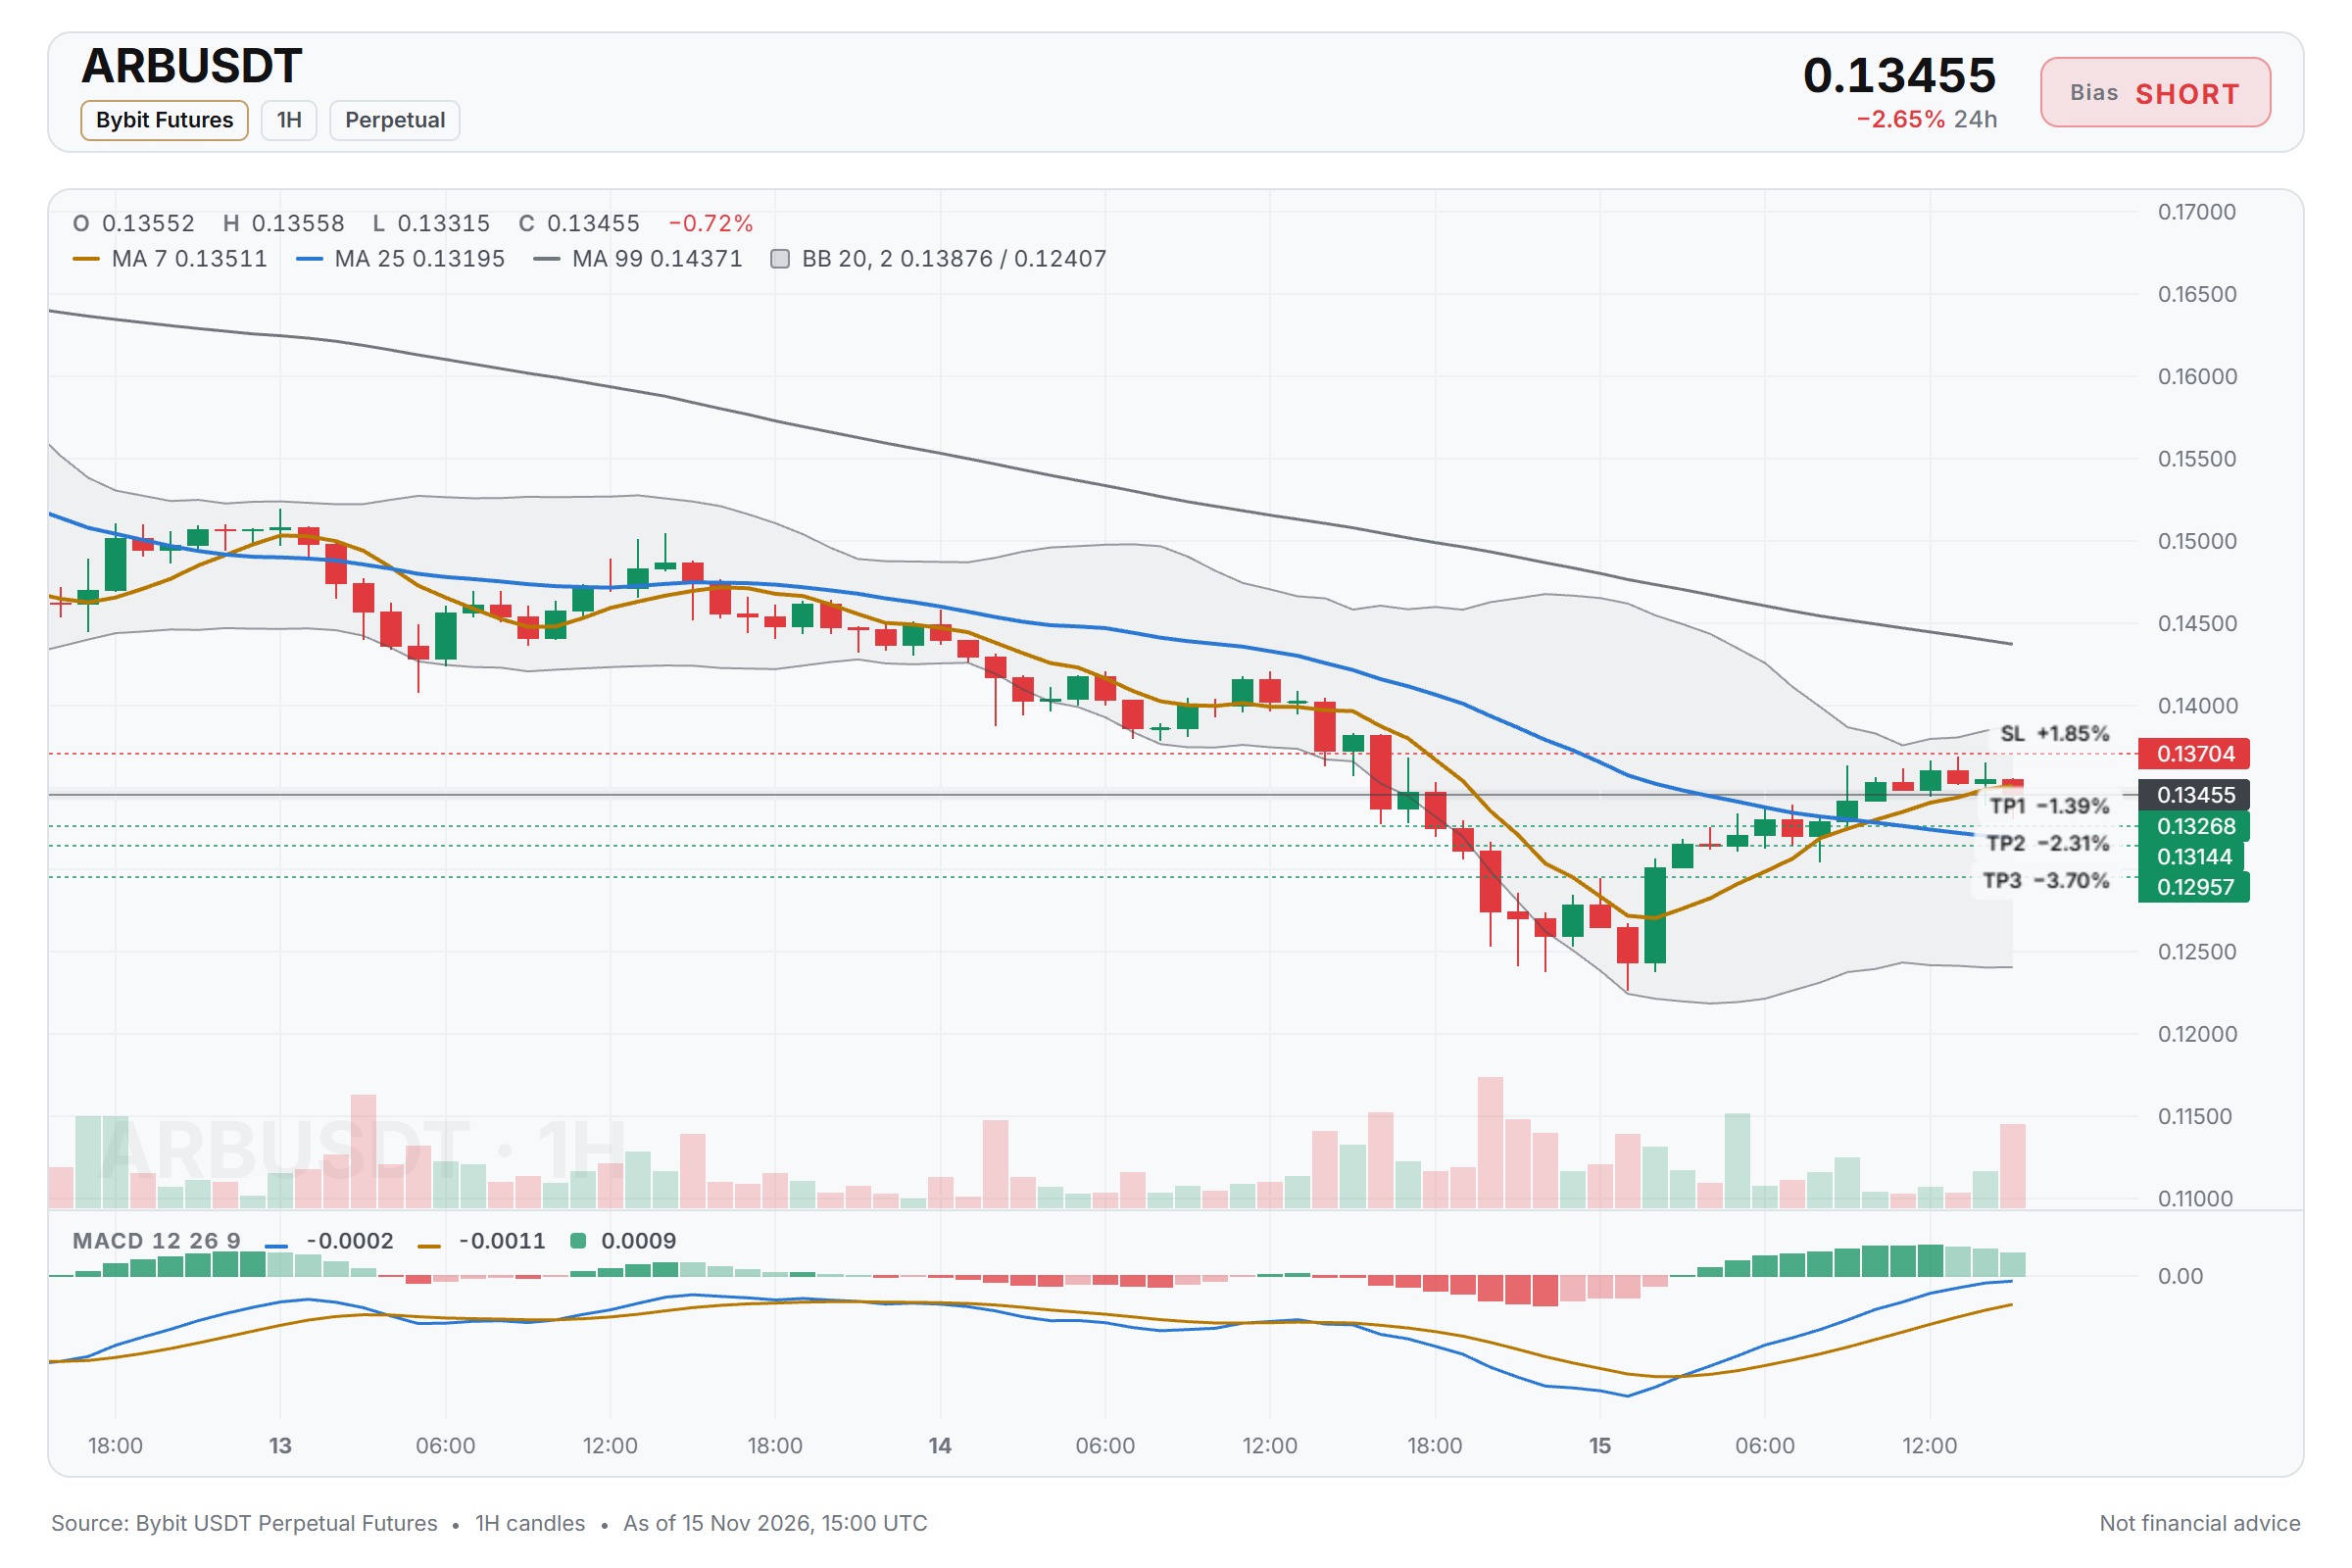
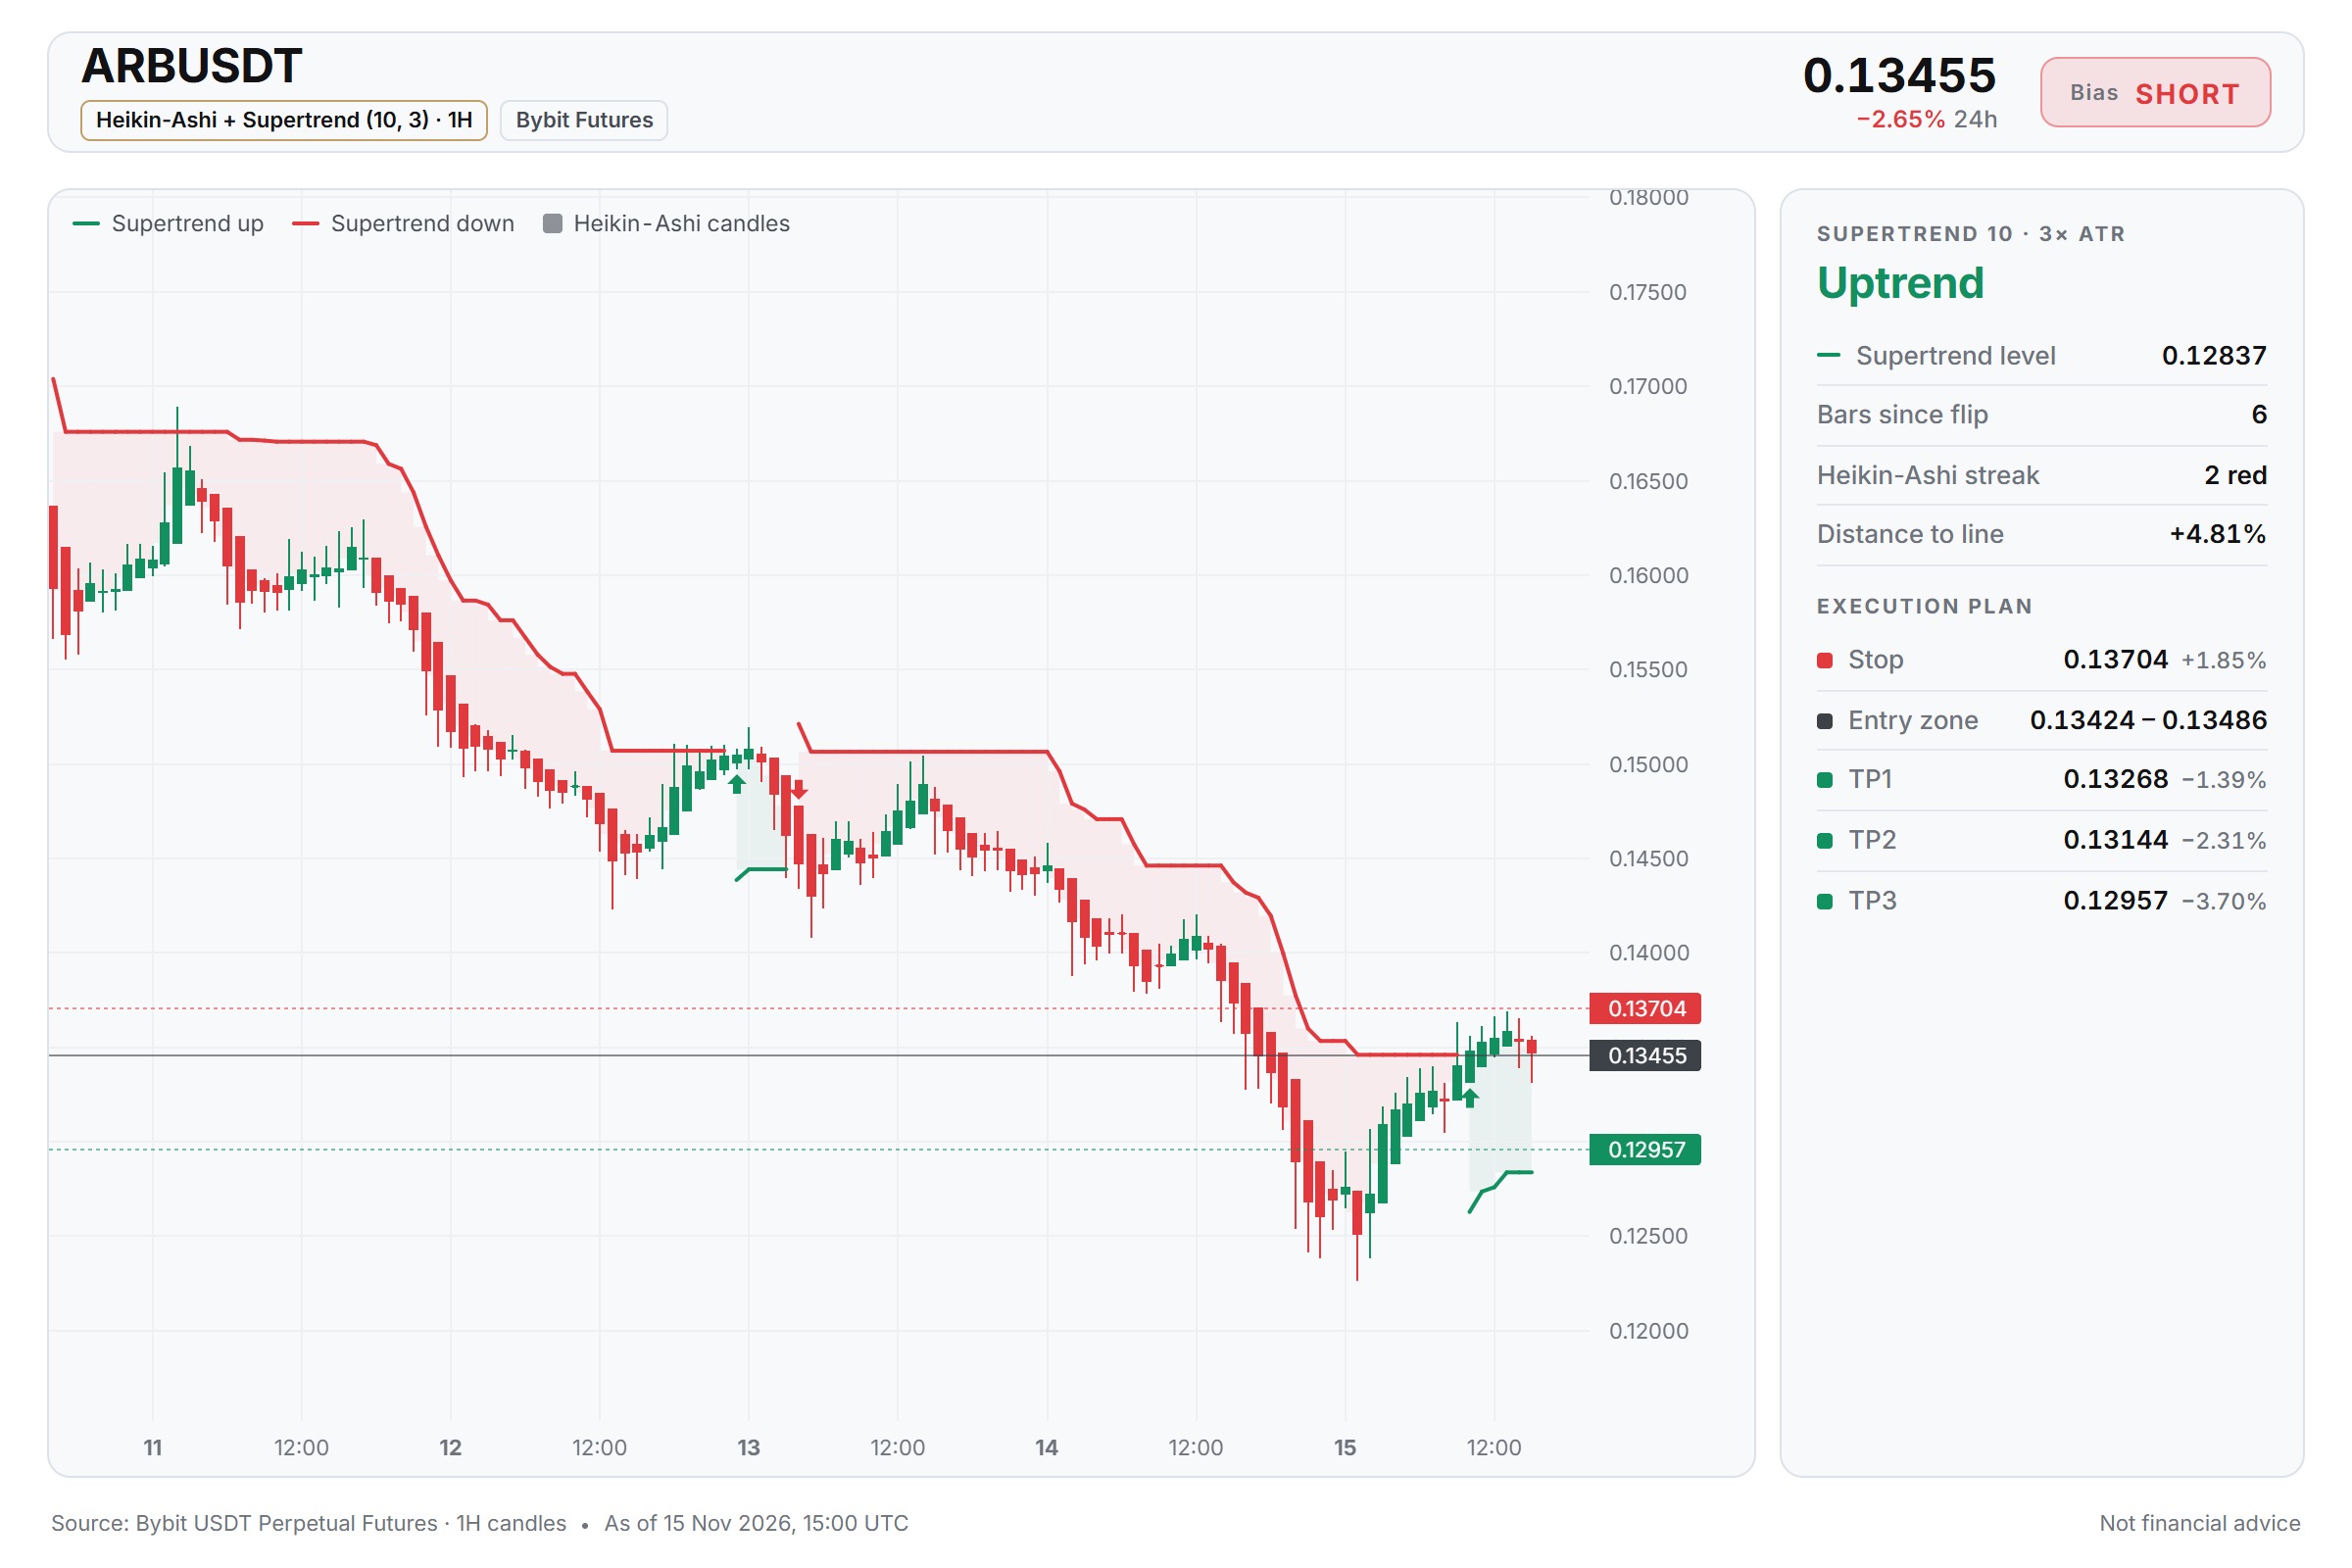
$ARB/USDT — SHORT Entry: 0.13424 - 0.13486 SL: 0.13704 TP1: 0.13268 TP2: 0.13144 TP3: 0.12957 BTC is in a neutral trend, and ARB is mirroring that hesitation — price is stuck around 0.13455 with 15m RSI at 48.57, neither overbought nor oversold but leaning soft. The momentum here isn't pushing upward; it's fading from recent highs, and I see a clean setup to fade the bounce. I'd look to enter around 0.13424 to 0.13485, with invalidation above 0.13704. If bears take control, first goal is 0.13144, second is 0.12957. Do you think ARB breaks down from here or does it retest the recent highs first? ⚠️ Personal market analysis only. NFA — manage risk and DYOR. Educational content, not investment advice or a recommendation to buy, sell, deposit, or withdraw any asset. No paid promotion or referral/affiliate links.$ARBUSDT#WSOT2026 #WSOTShowYourAITradeToEarn10USDT
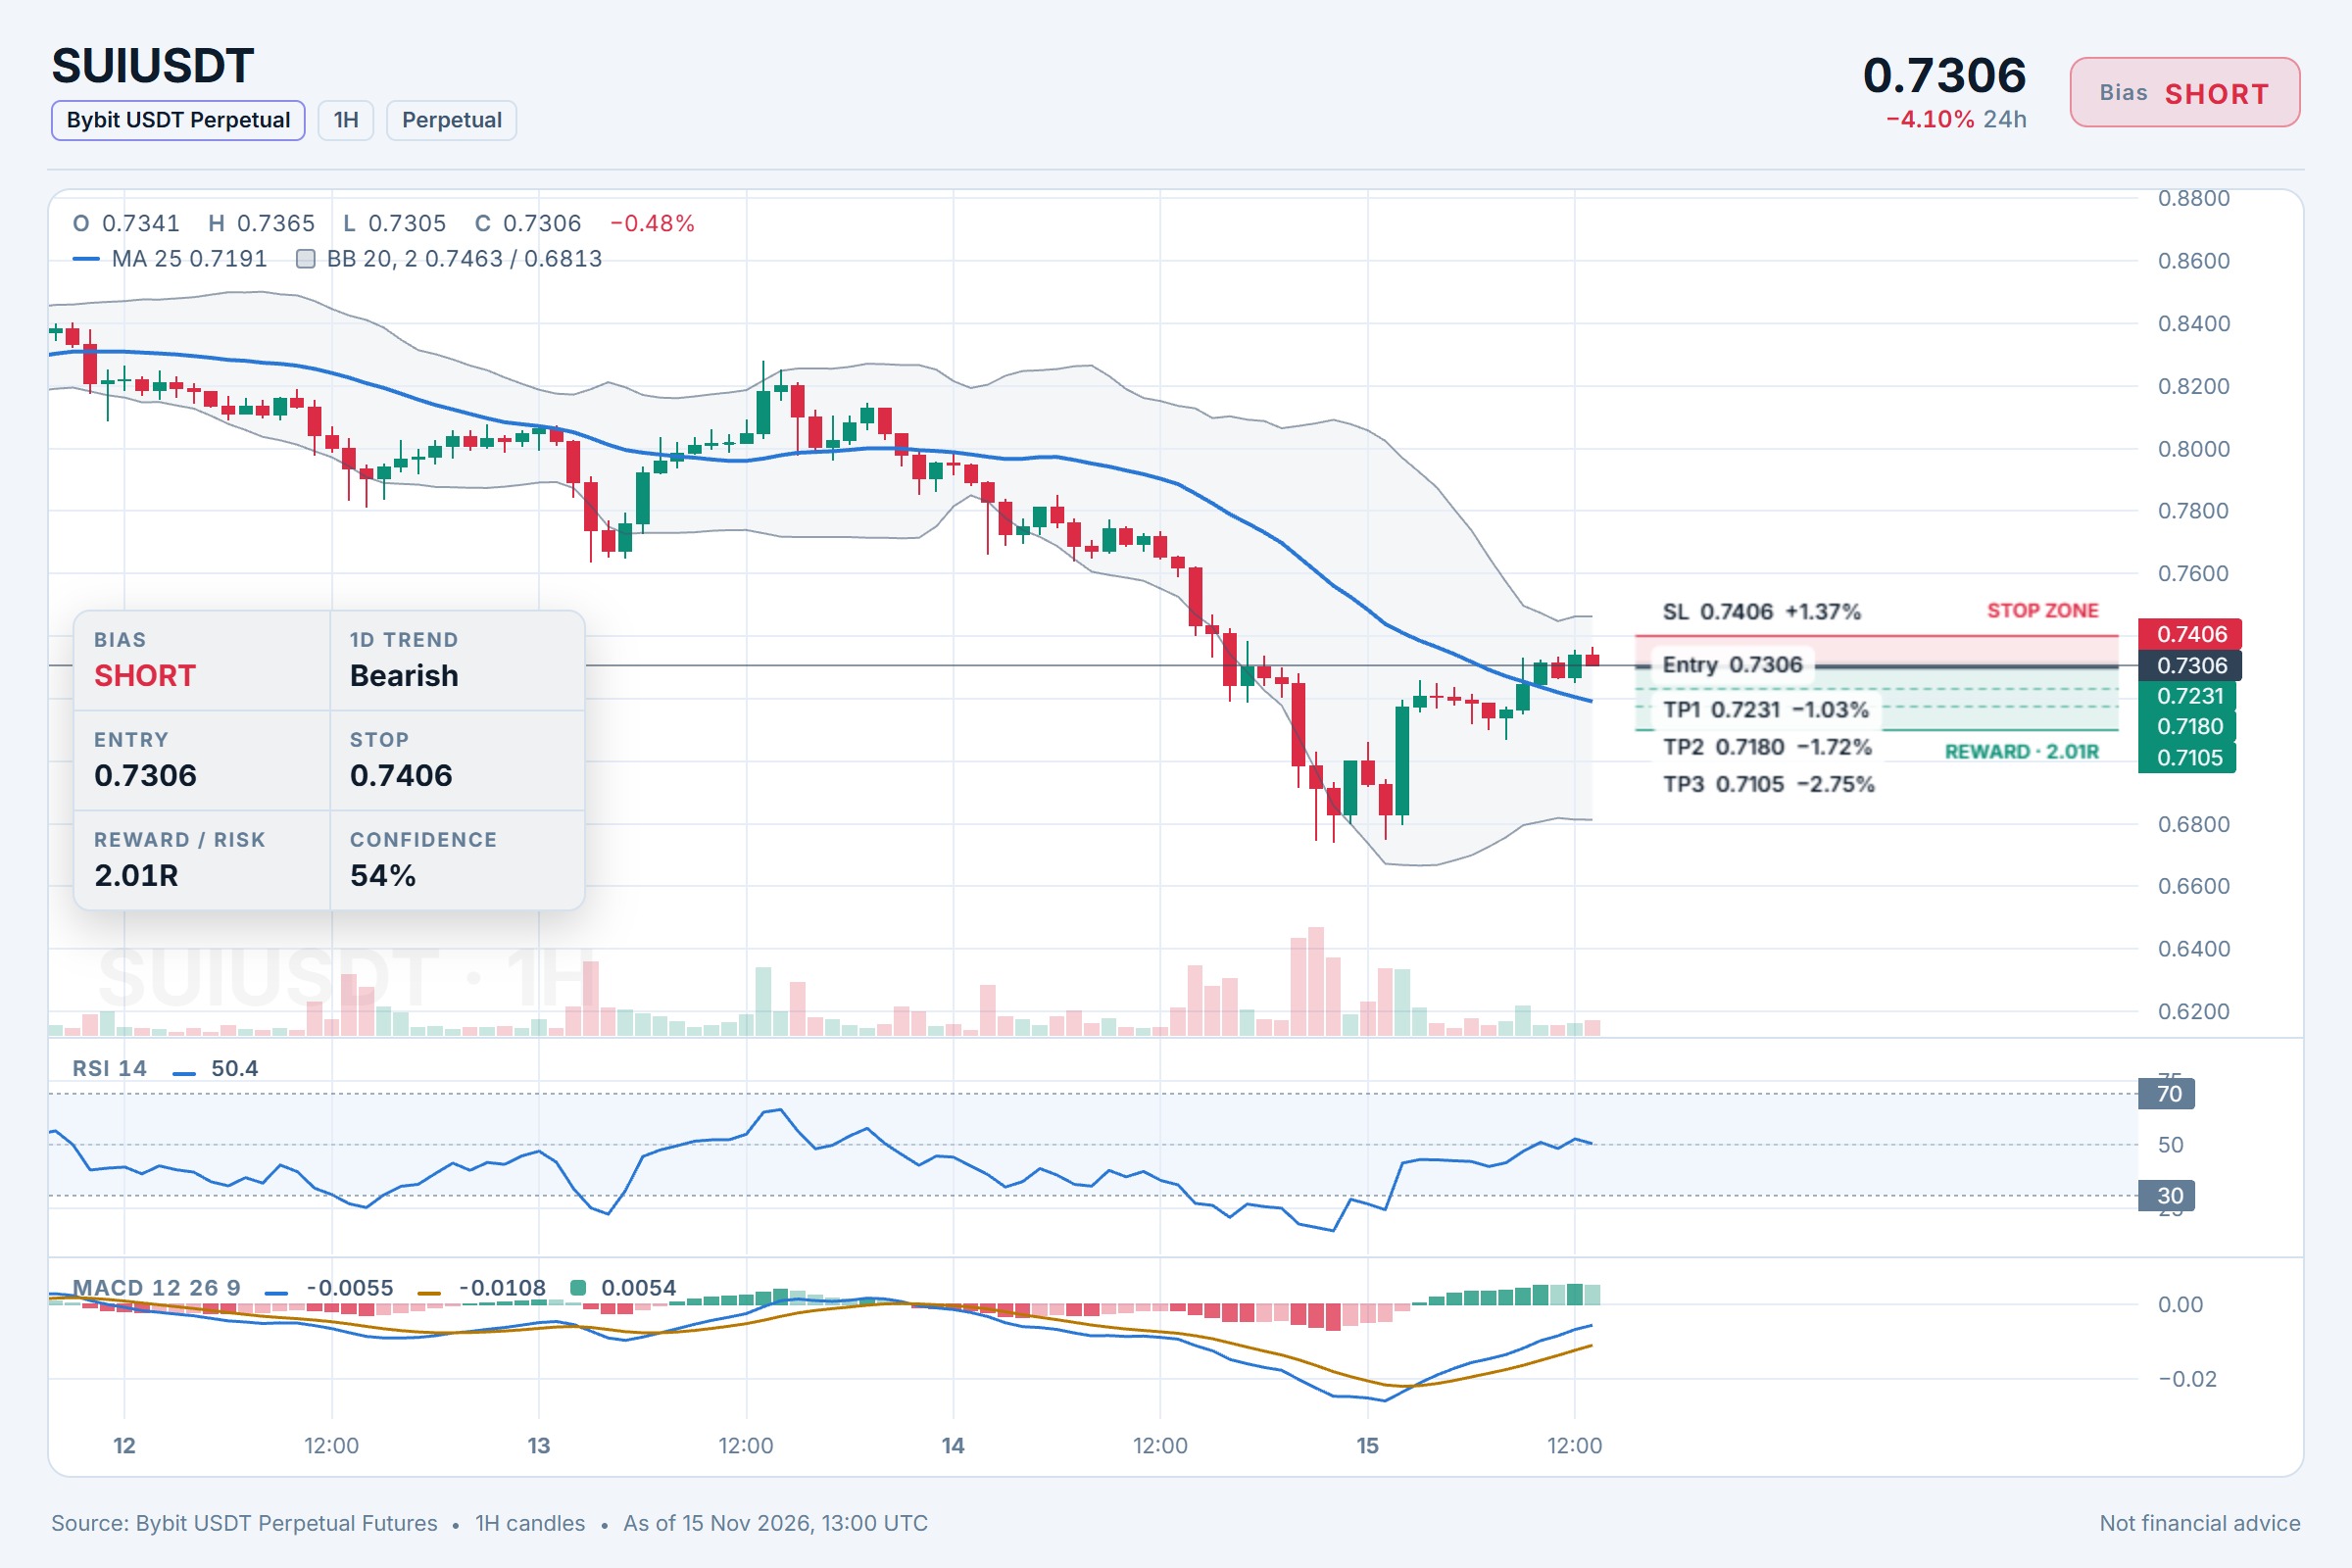
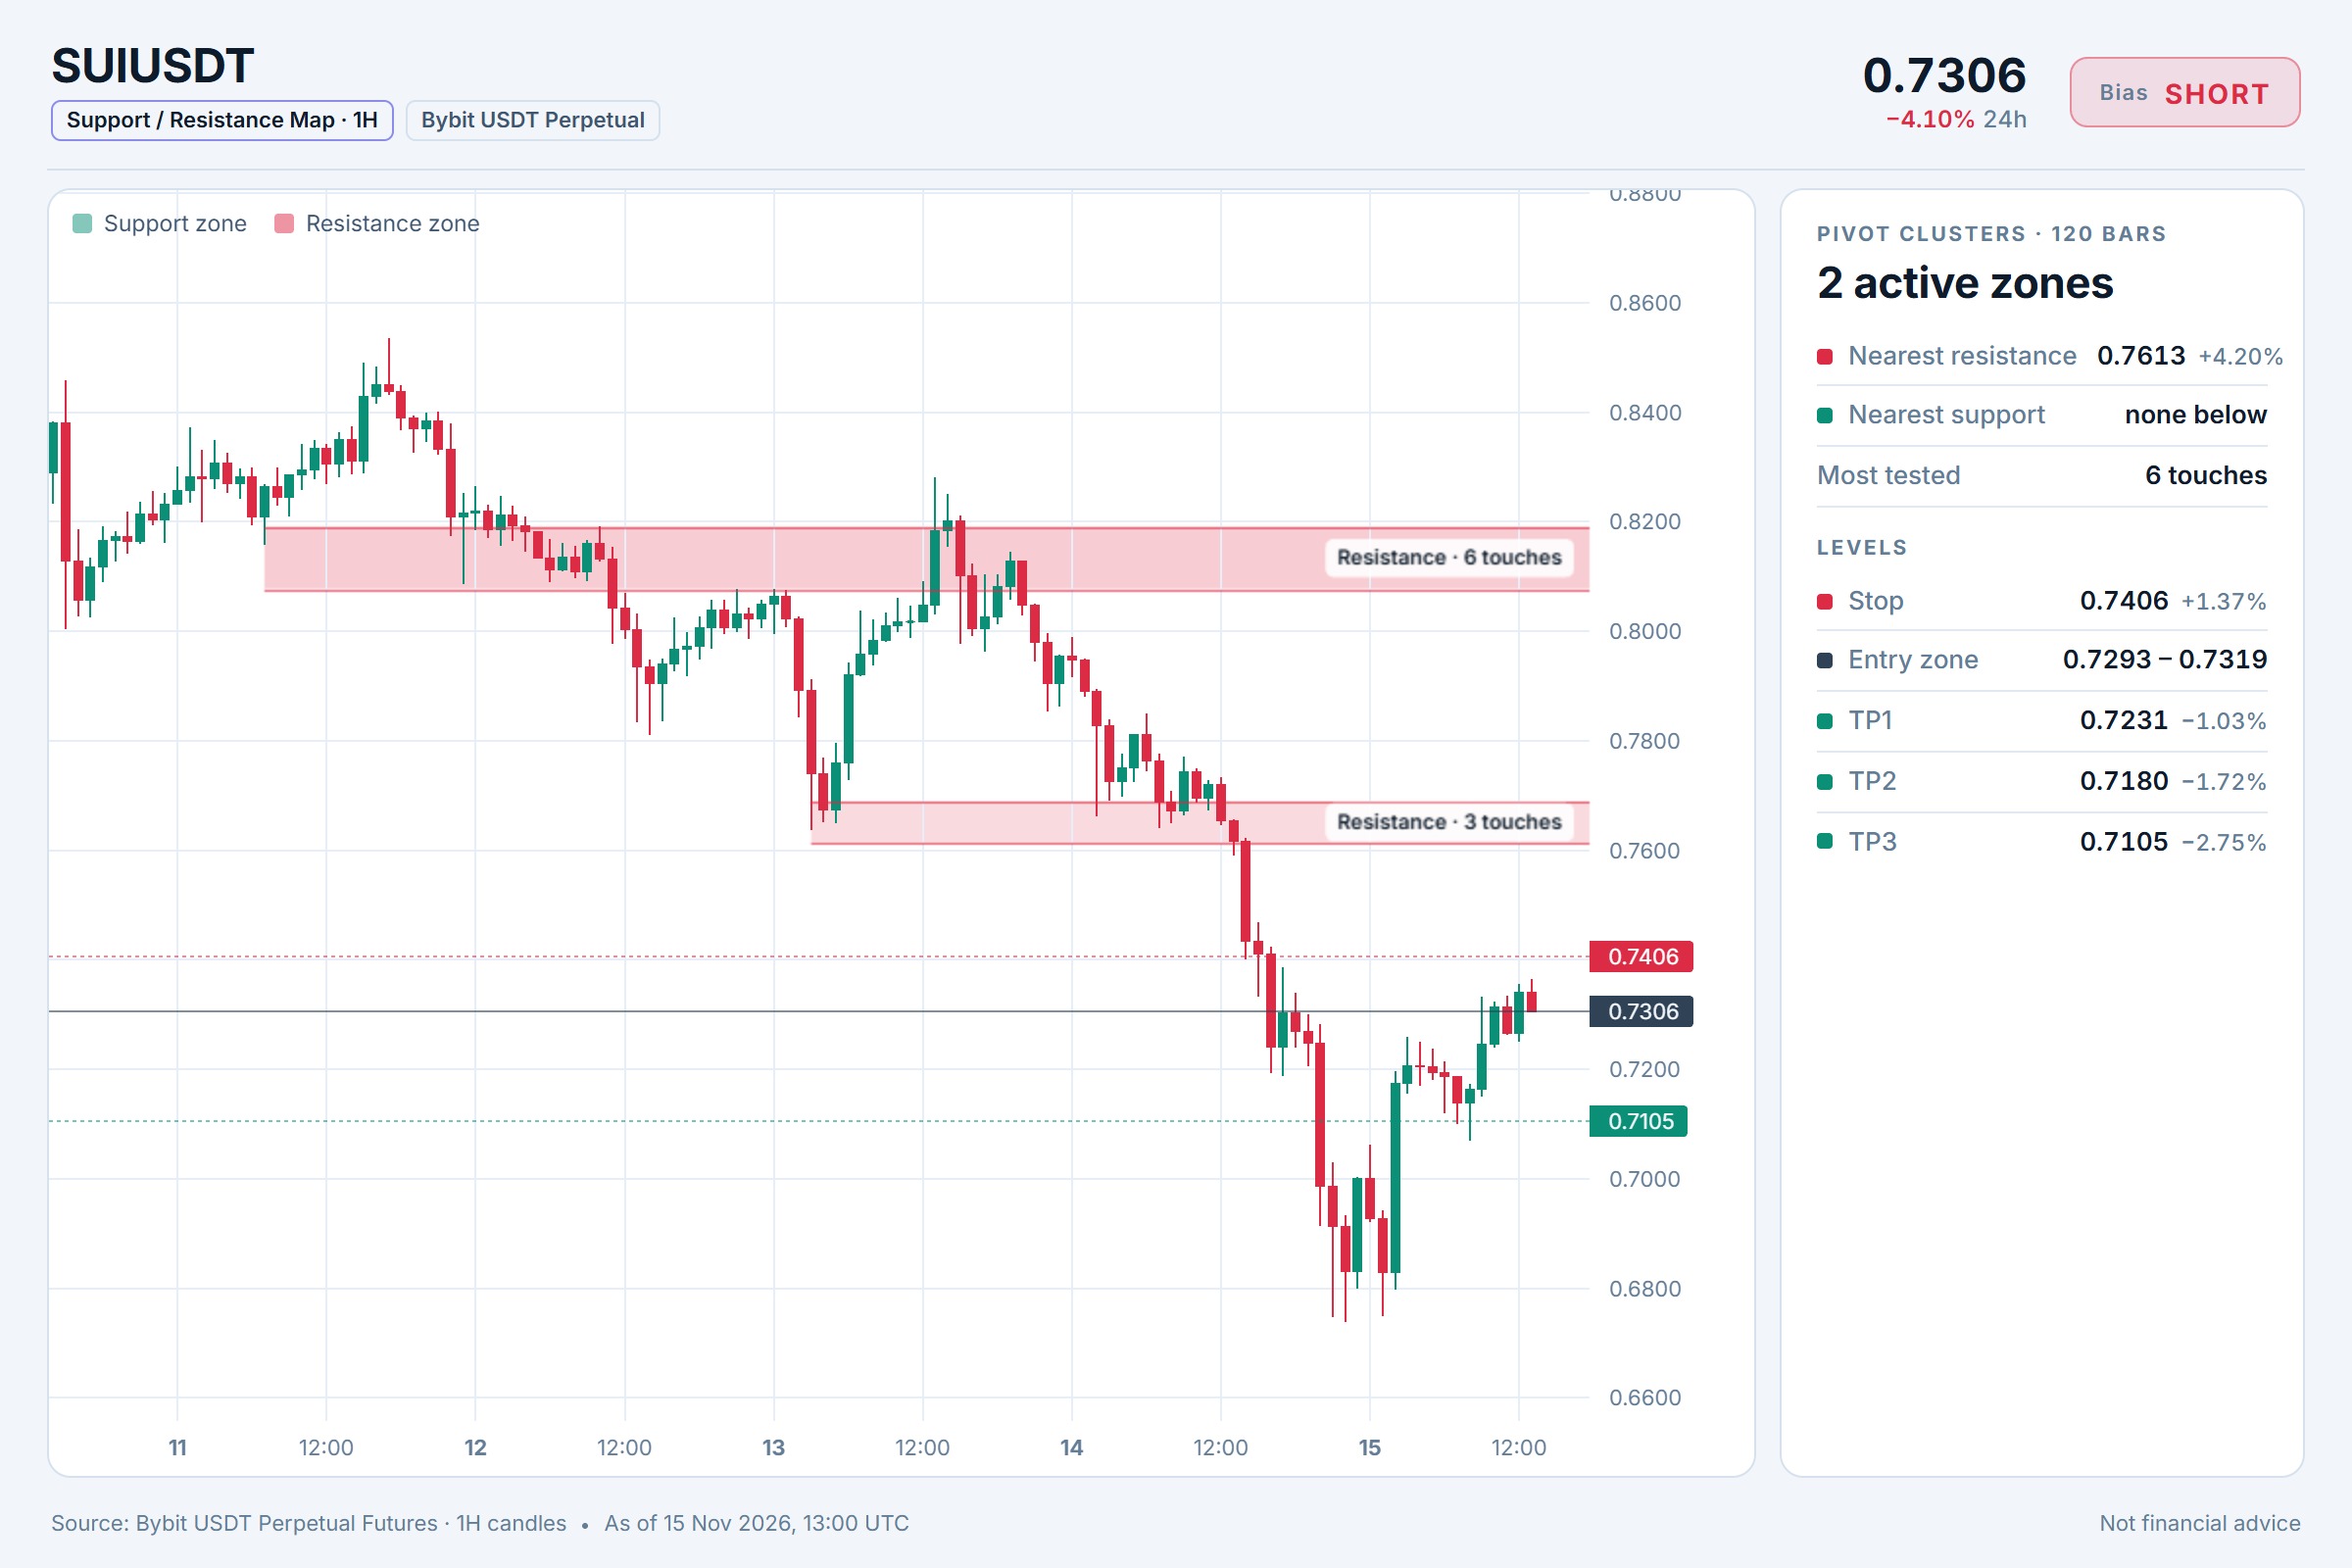
SUI Tests Resistance as BTC Stays Bullish
$SUI/USDT — SHORT Entry: 0.7293 - 0.7319 SL: 0.7406 TP1: 0.7231 TP2: 0.7180 TP3: 0.7105 I’m watching $SUI/USDT closely as it pushes into the upper part of the entry range. BTC’s bullish trend is providing a backdrop, but the 15m RSI sitting near 54 suggests momentum is not firmly on the long side. I see a potential short setup forming, with clear invalidation and defined targets if price reverses from here. Do you think SUI will break higher with BTC, or is this a local top worth fading? ⚠️ Personal market analysis only. NFA — manage risk and DYOR. Educational content, not investment advice or a recommendation to buy, sell, deposit, or withdraw any asset. No paid promotion or referral/affiliate links.$SUIUSDT#WSOT2026 #WSOTShowYourAITradeToEarn10USDT
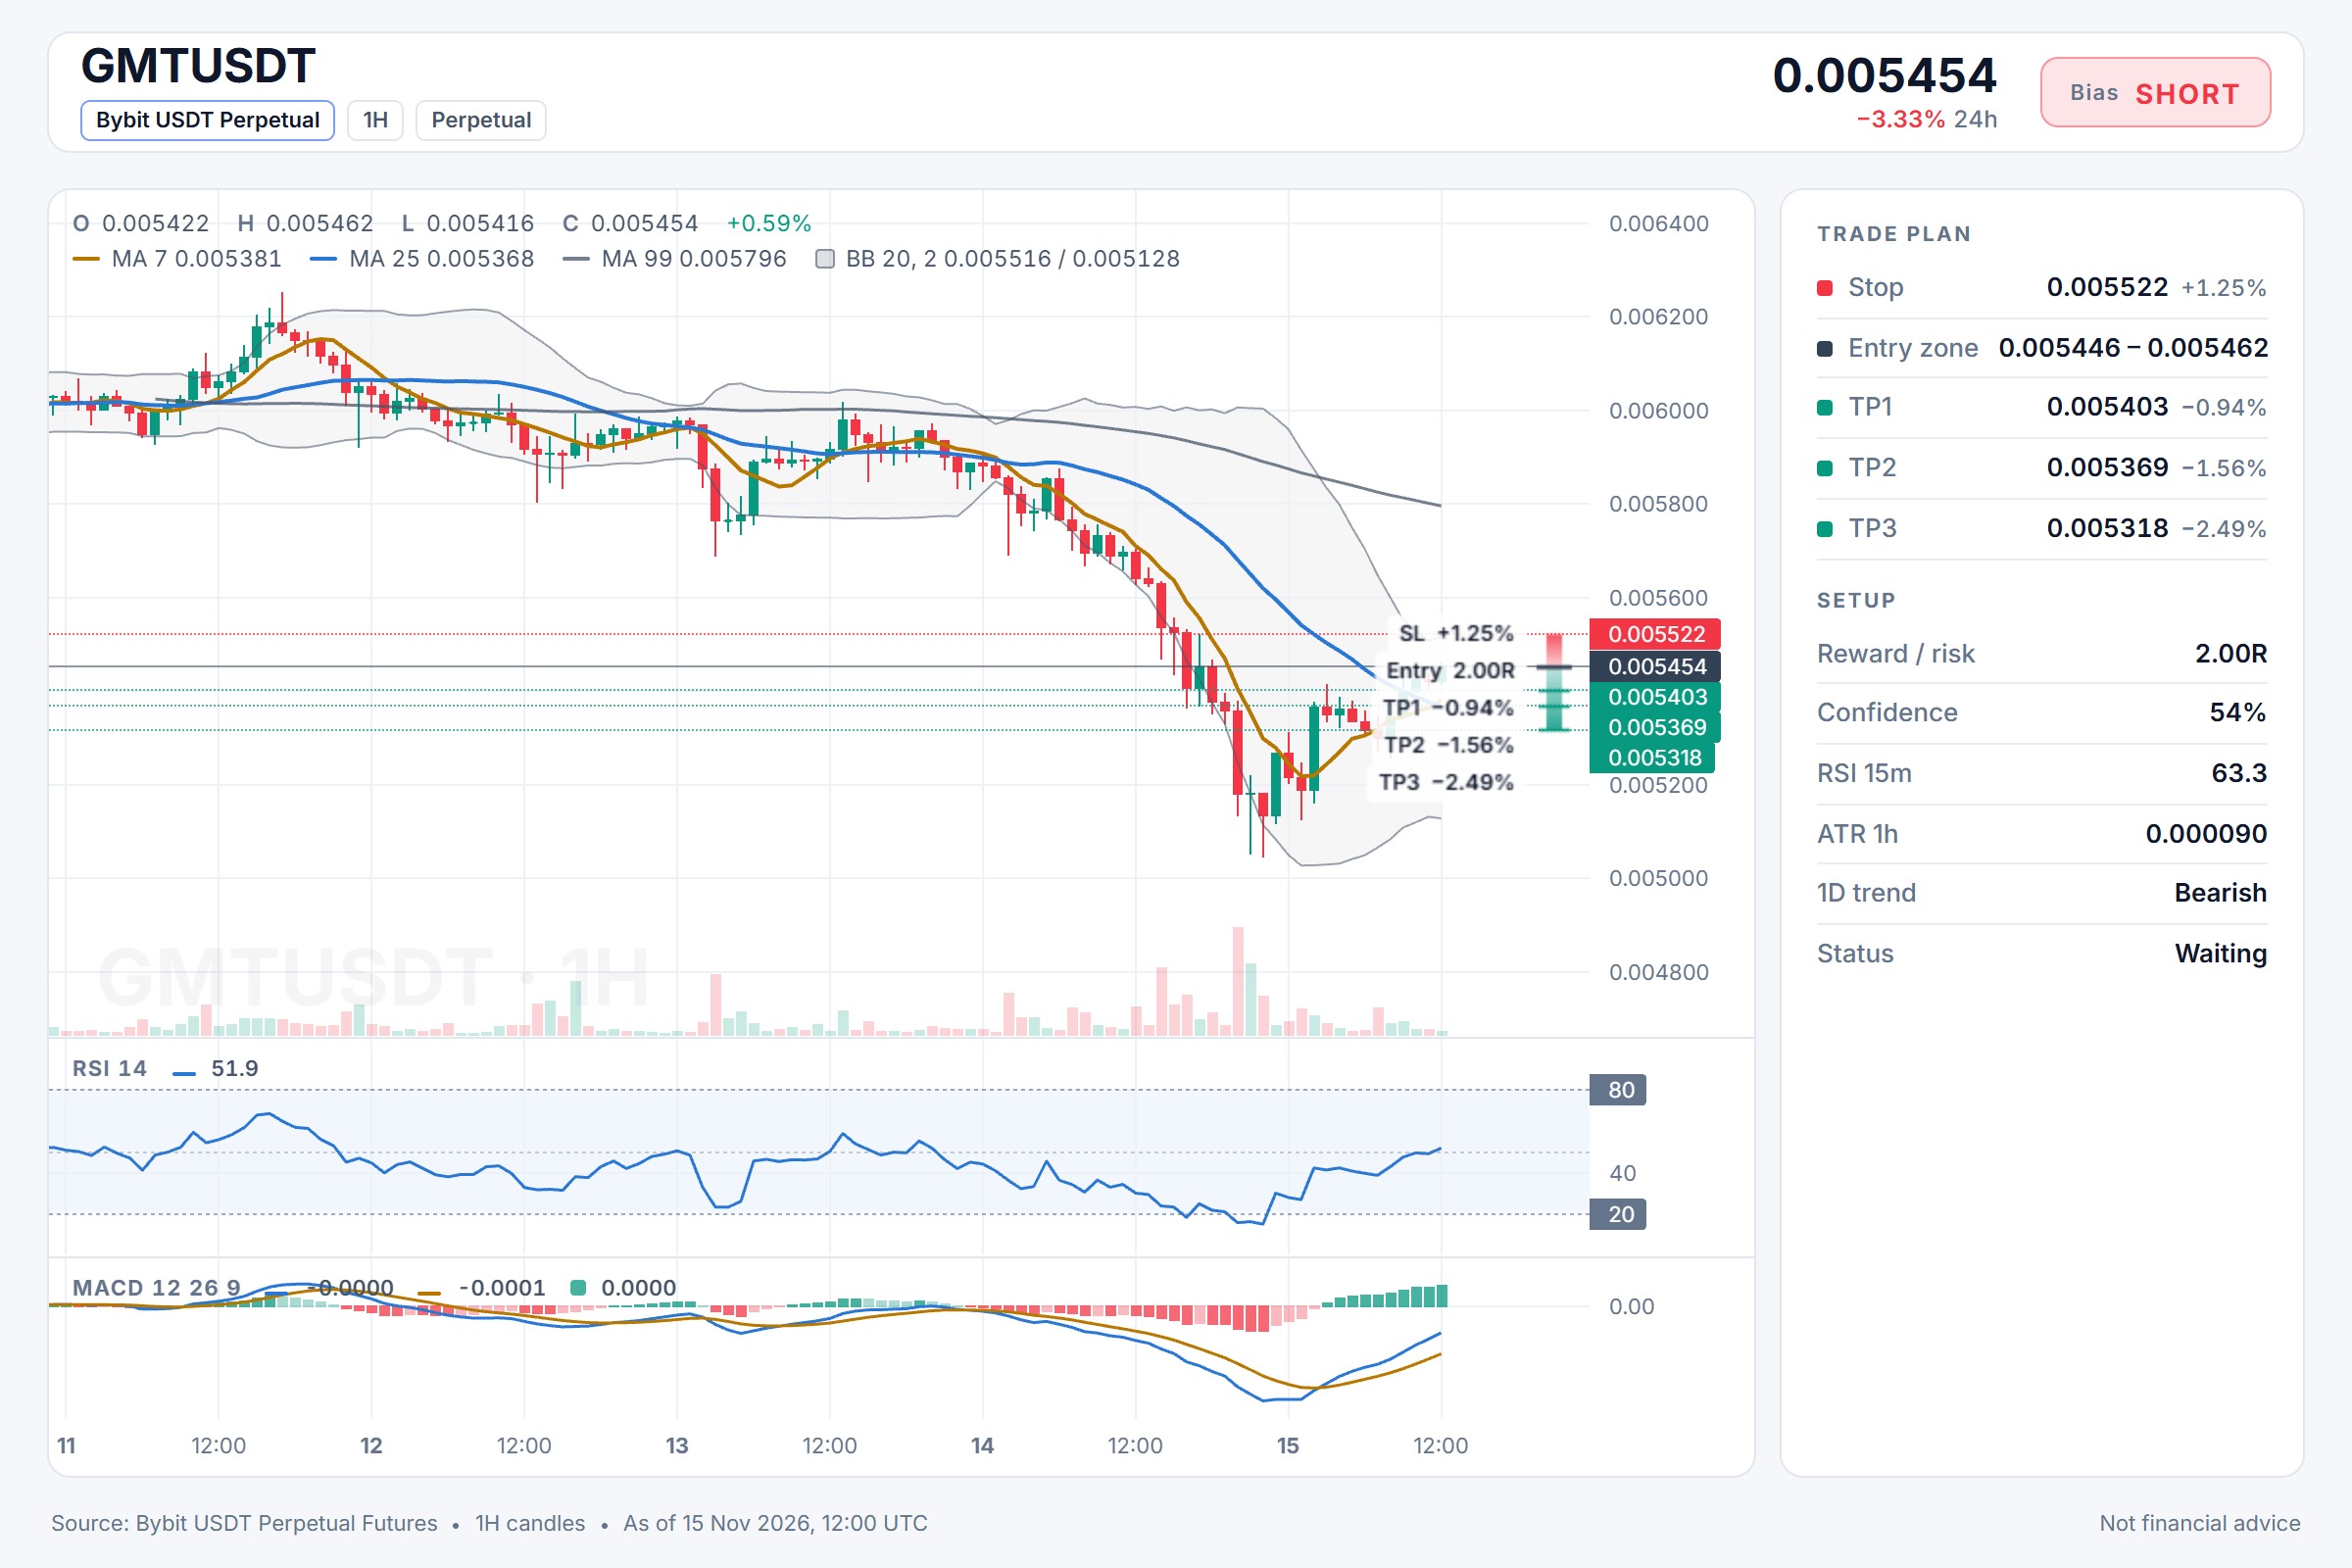
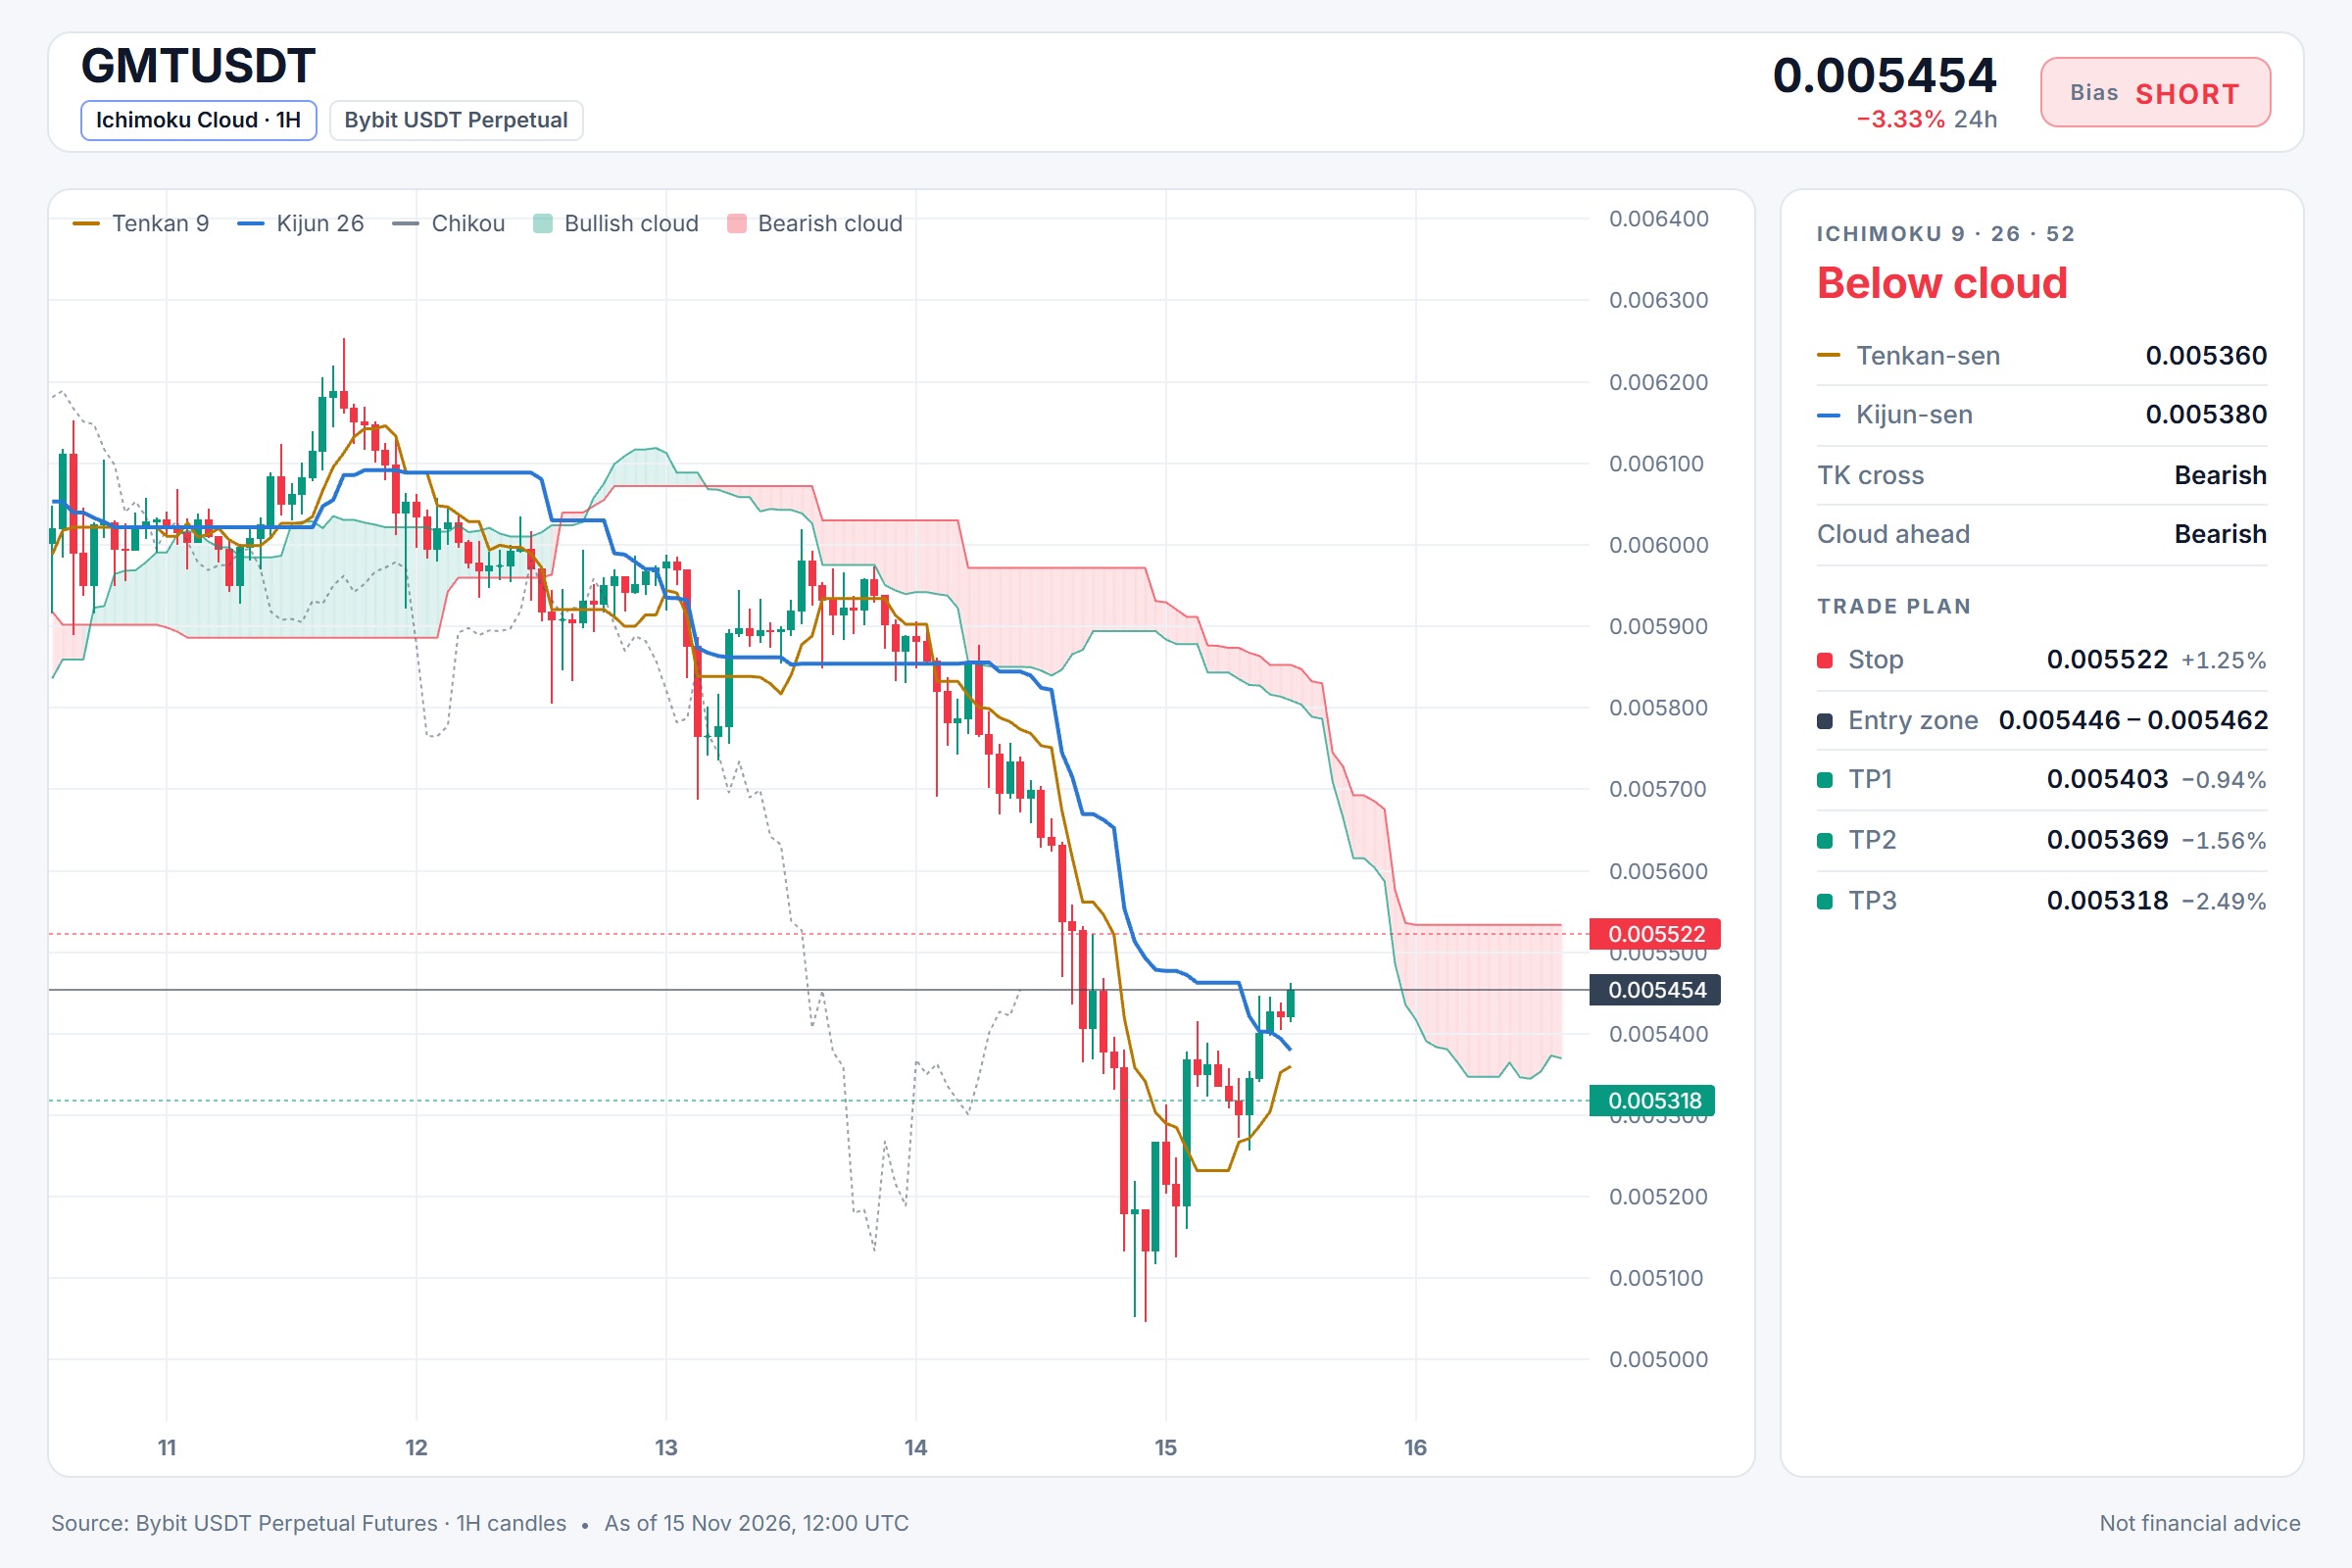
GMT/USDT Resistance on Bullish BTC Day
$GMT/USDT — SHORT Entry: 0.005446 - 0.005462 SL: 0.005522 TP1: 0.005403 TP2: 0.005369 TP3: 0.005318 With BTC trending higher, the 15m RSI sitting at 63.25 and momentum still pointing down, $GMT/USDT is showing clear shorting potential. Enter around 0.005454, stop at 0.005522, with targets at 0.005369 and 0.005318. Do you think this bearish momentum holds while BTC stays bullish? ⚠️ Personal market analysis only. NFA — manage risk and DYOR. Educational content, not investment advice or a recommendation to buy, sell, deposit, or withdraw any asset. No paid promotion or referral/affiliate links.$GMTUSDT#WSOT2026 #WSOTShowYourAITradeToEarn10USDT
LDO vs BTC: Why One Drifts Lower
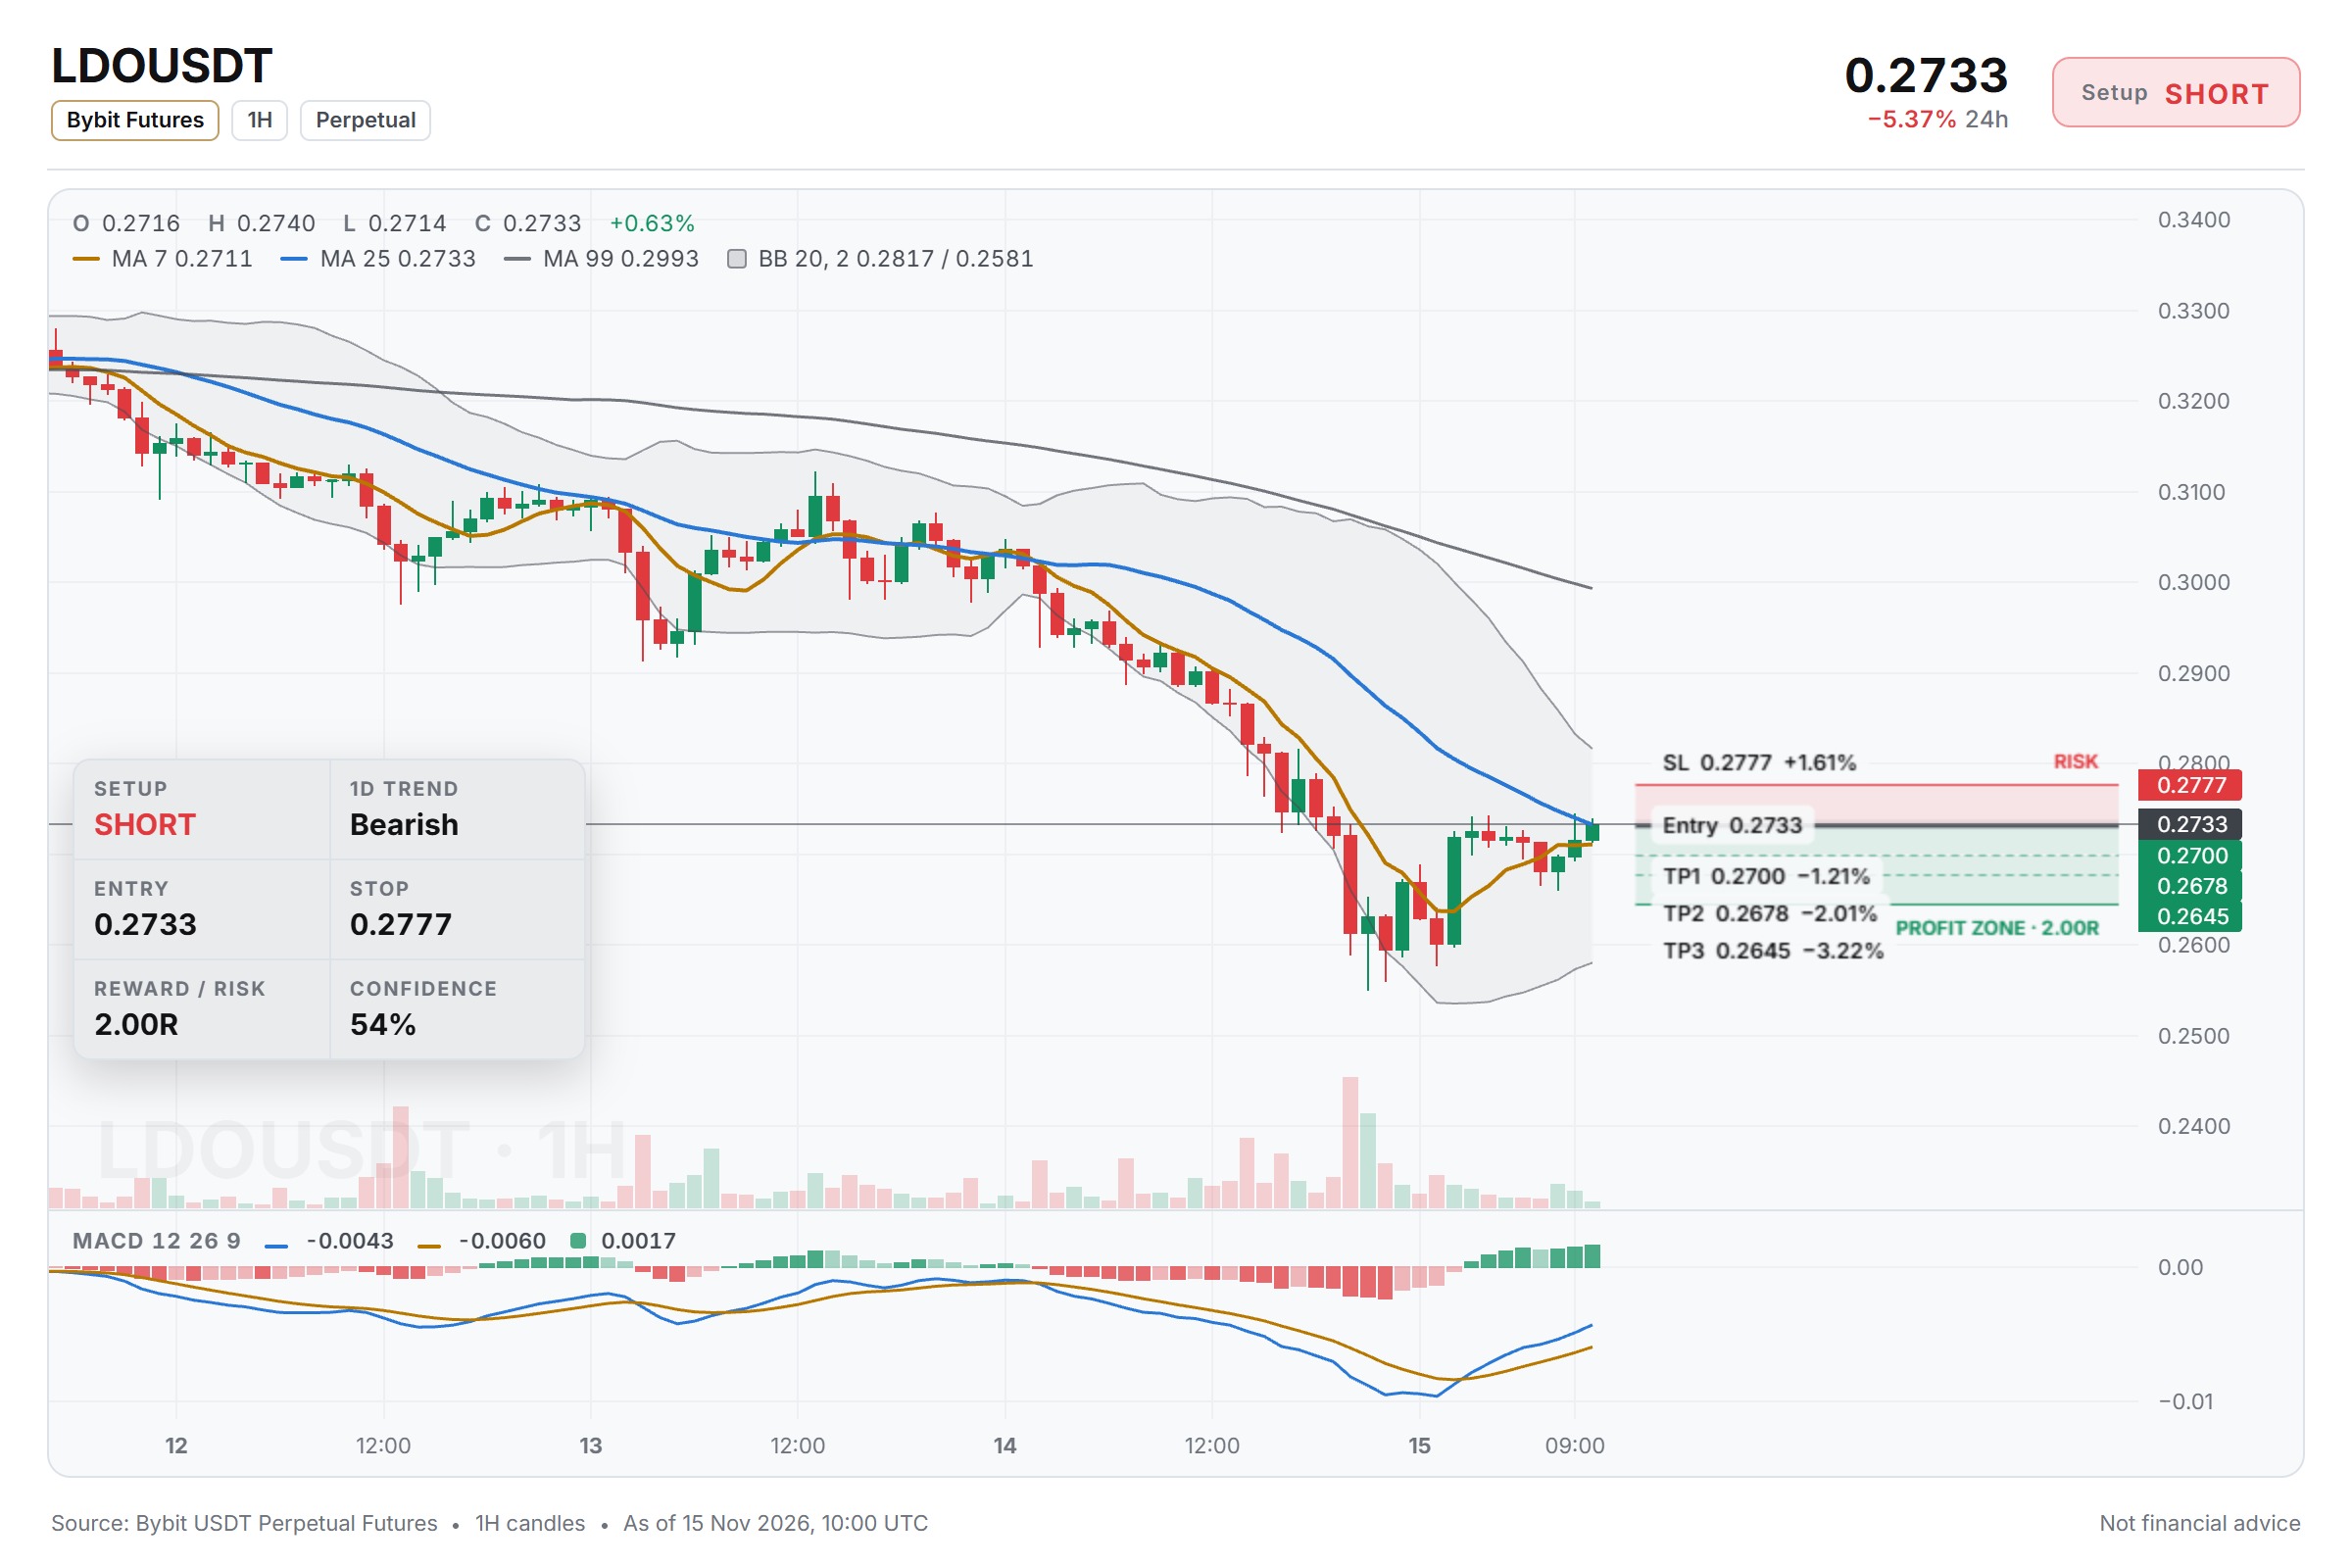
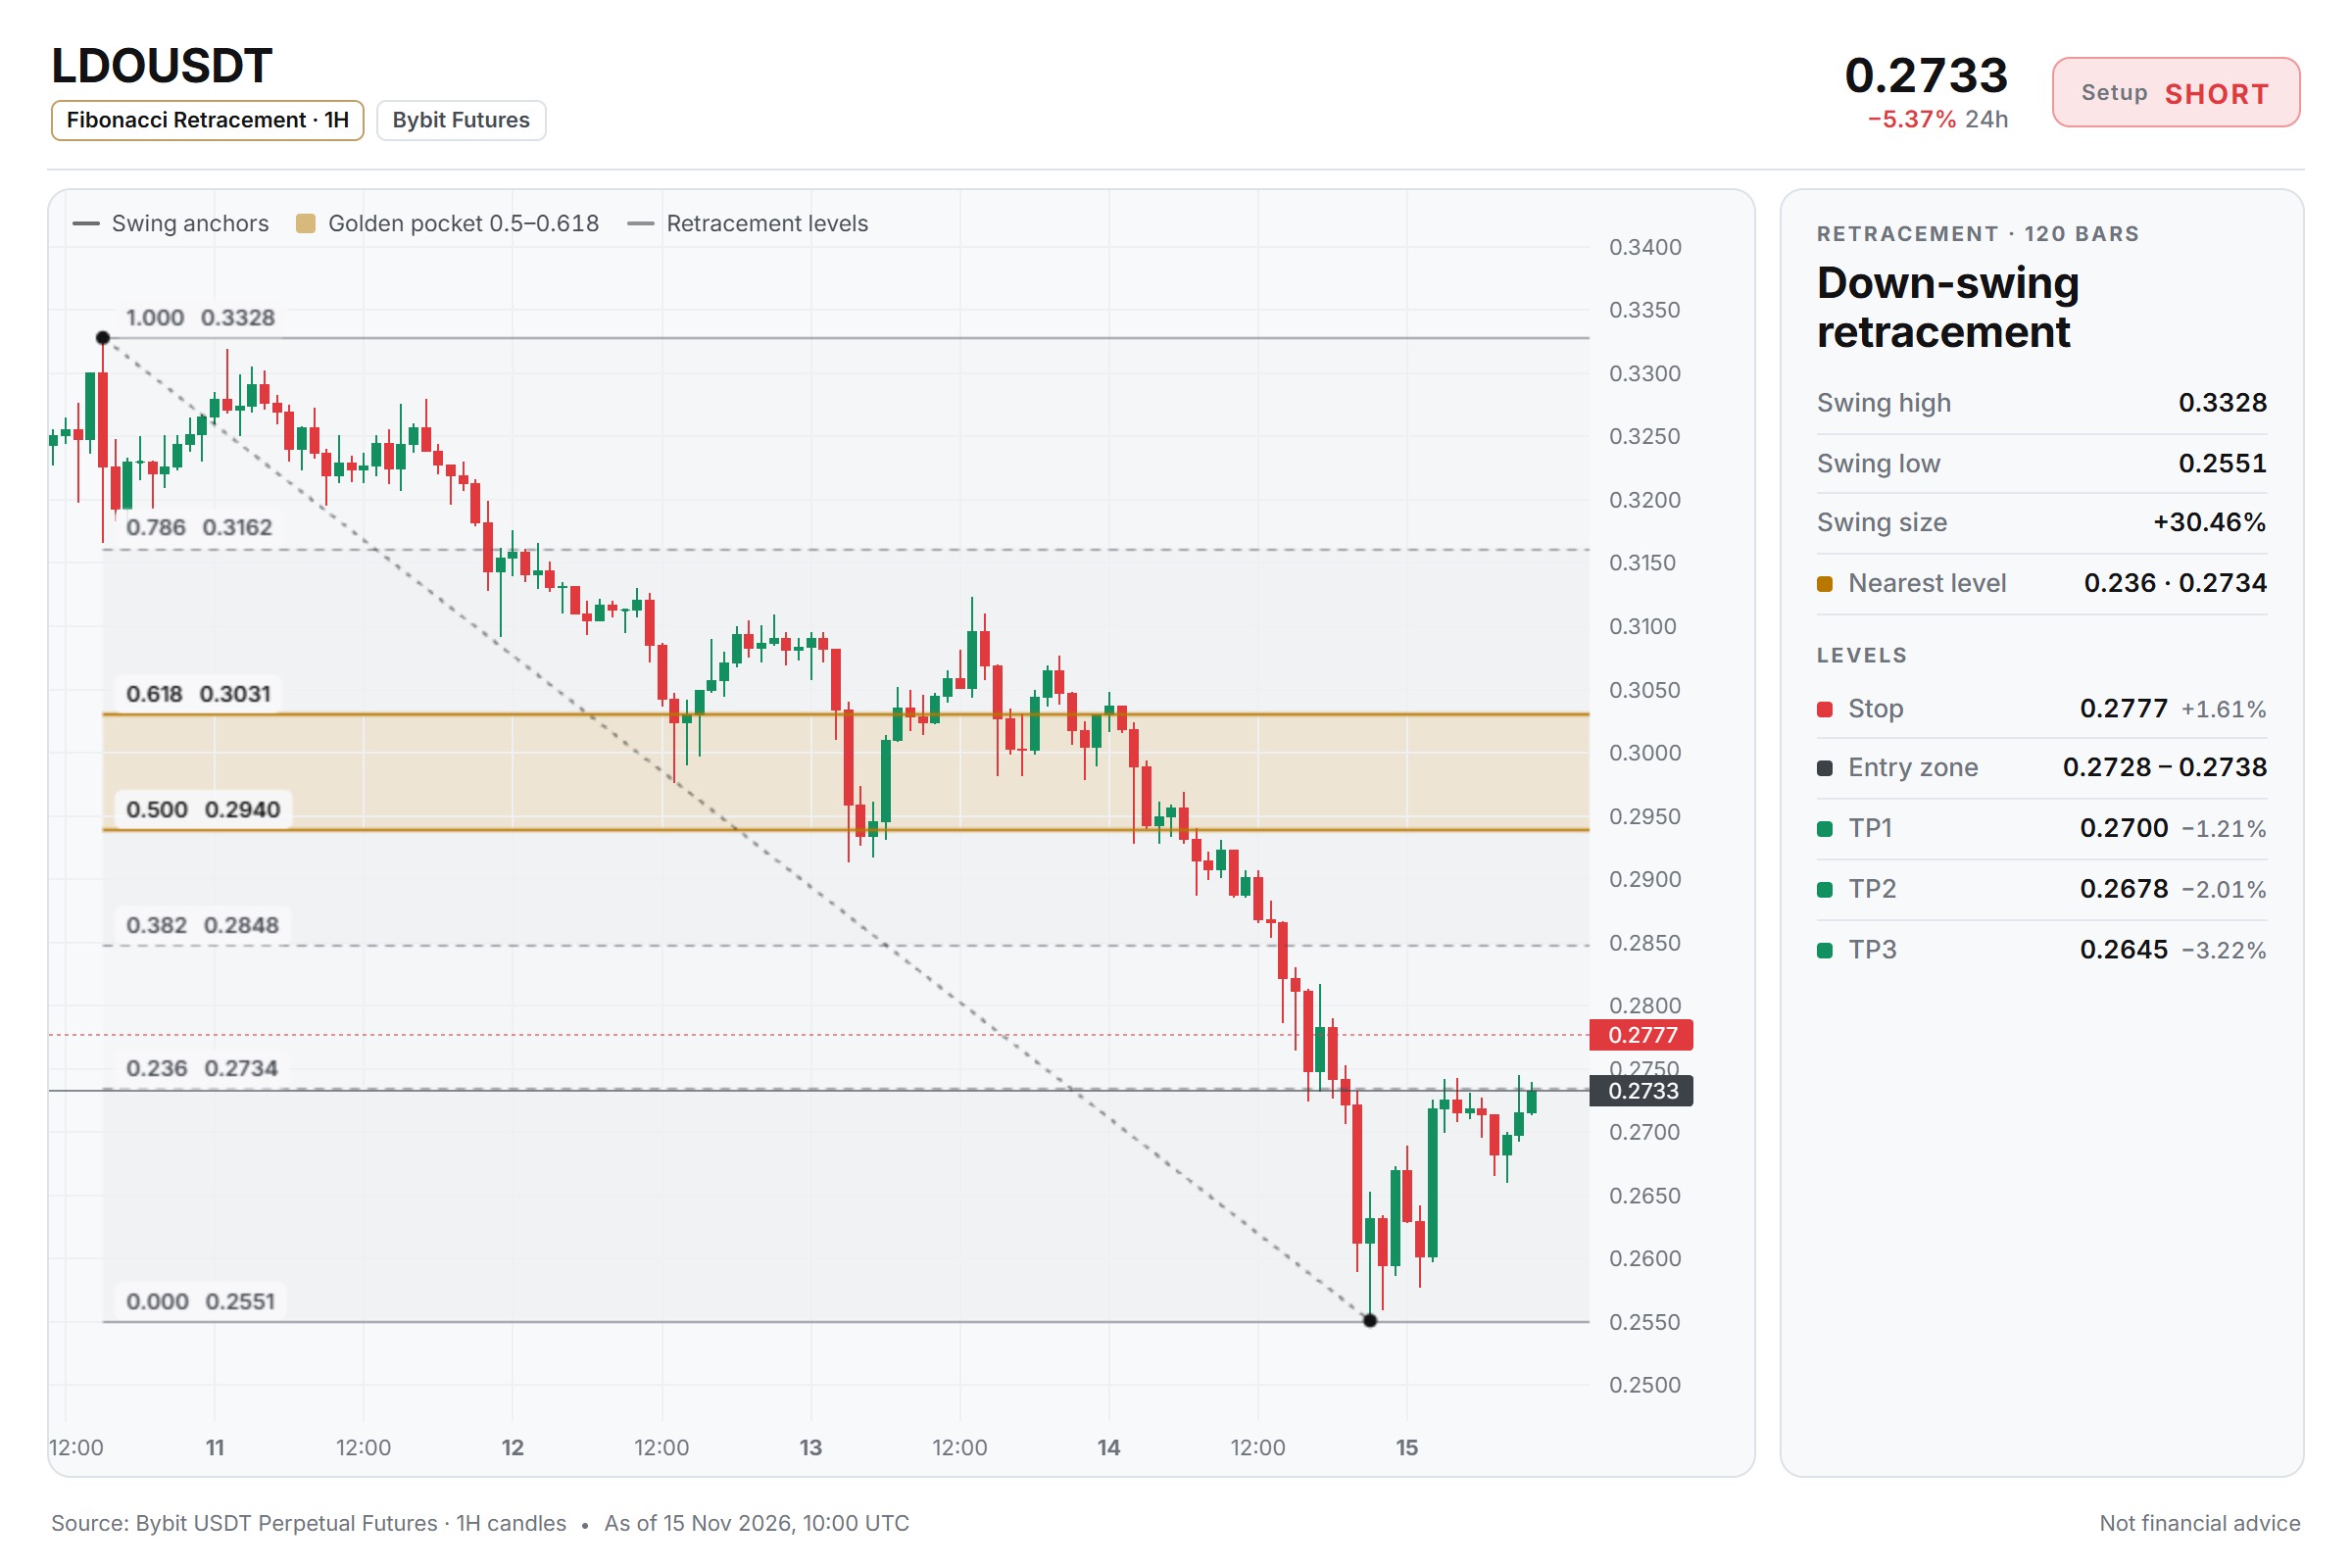
$LDO/USDT — SHORT Entry: 0.2728 - 0.2738 SL: 0.2777 TP1: 0.2700 TP2: 0.2678 TP3: 0.2645 I'm noticing $LDO/USDT sitting at 0.2733 with 15m RSI near 57.77 — that's a mild bearish divergence against BTC's bullish trend. Momentum here looks tired, and with two downside targets layered in, the risk-reward toward the downside feels more reasonable than chasing continuation. Do you agree that momentum fading here warrants a short bias, or would you wait for a clearer retest before committing? ⚠️ Personal market analysis only. NFA — manage risk and DYOR. Educational content, not investment advice or a recommendation to buy, sell, deposit, or withdraw any asset. No paid promotion or referral/affiliate links.$LDOUSDT#WSOT2026 #WSOTShowYourAITradeToEarn10USDT
KASU 15m RSI at 67: Pullback Watch
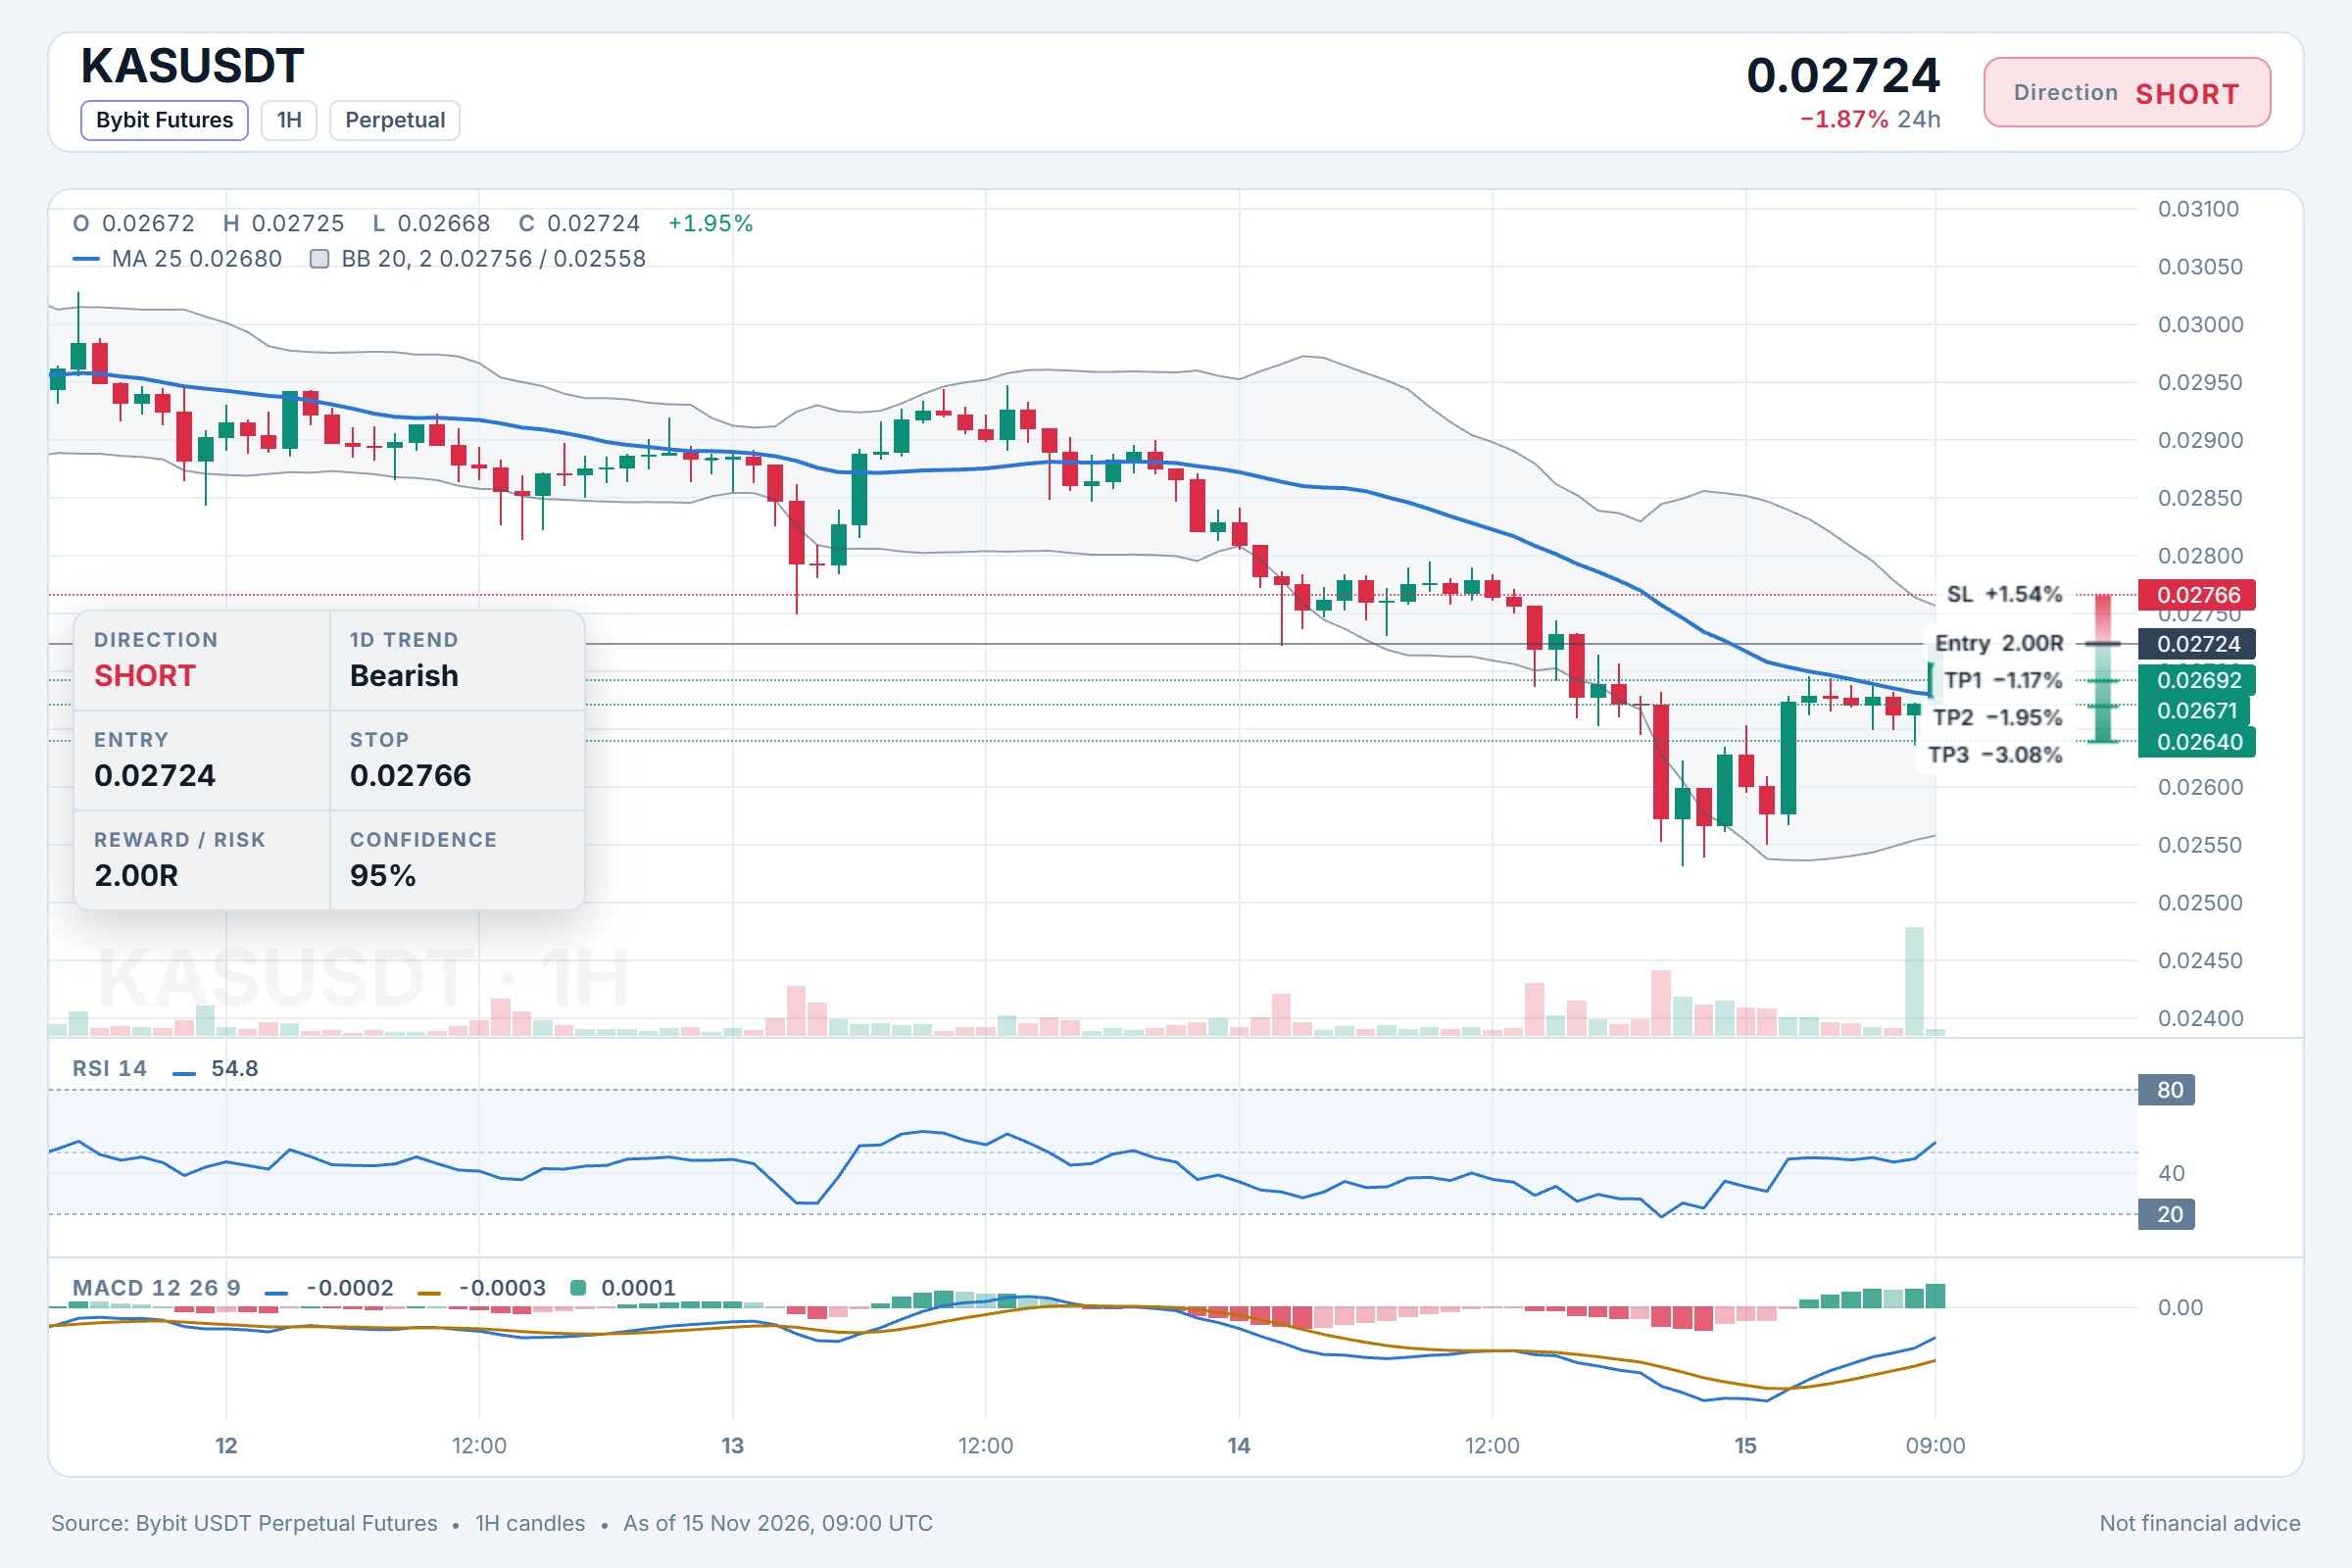
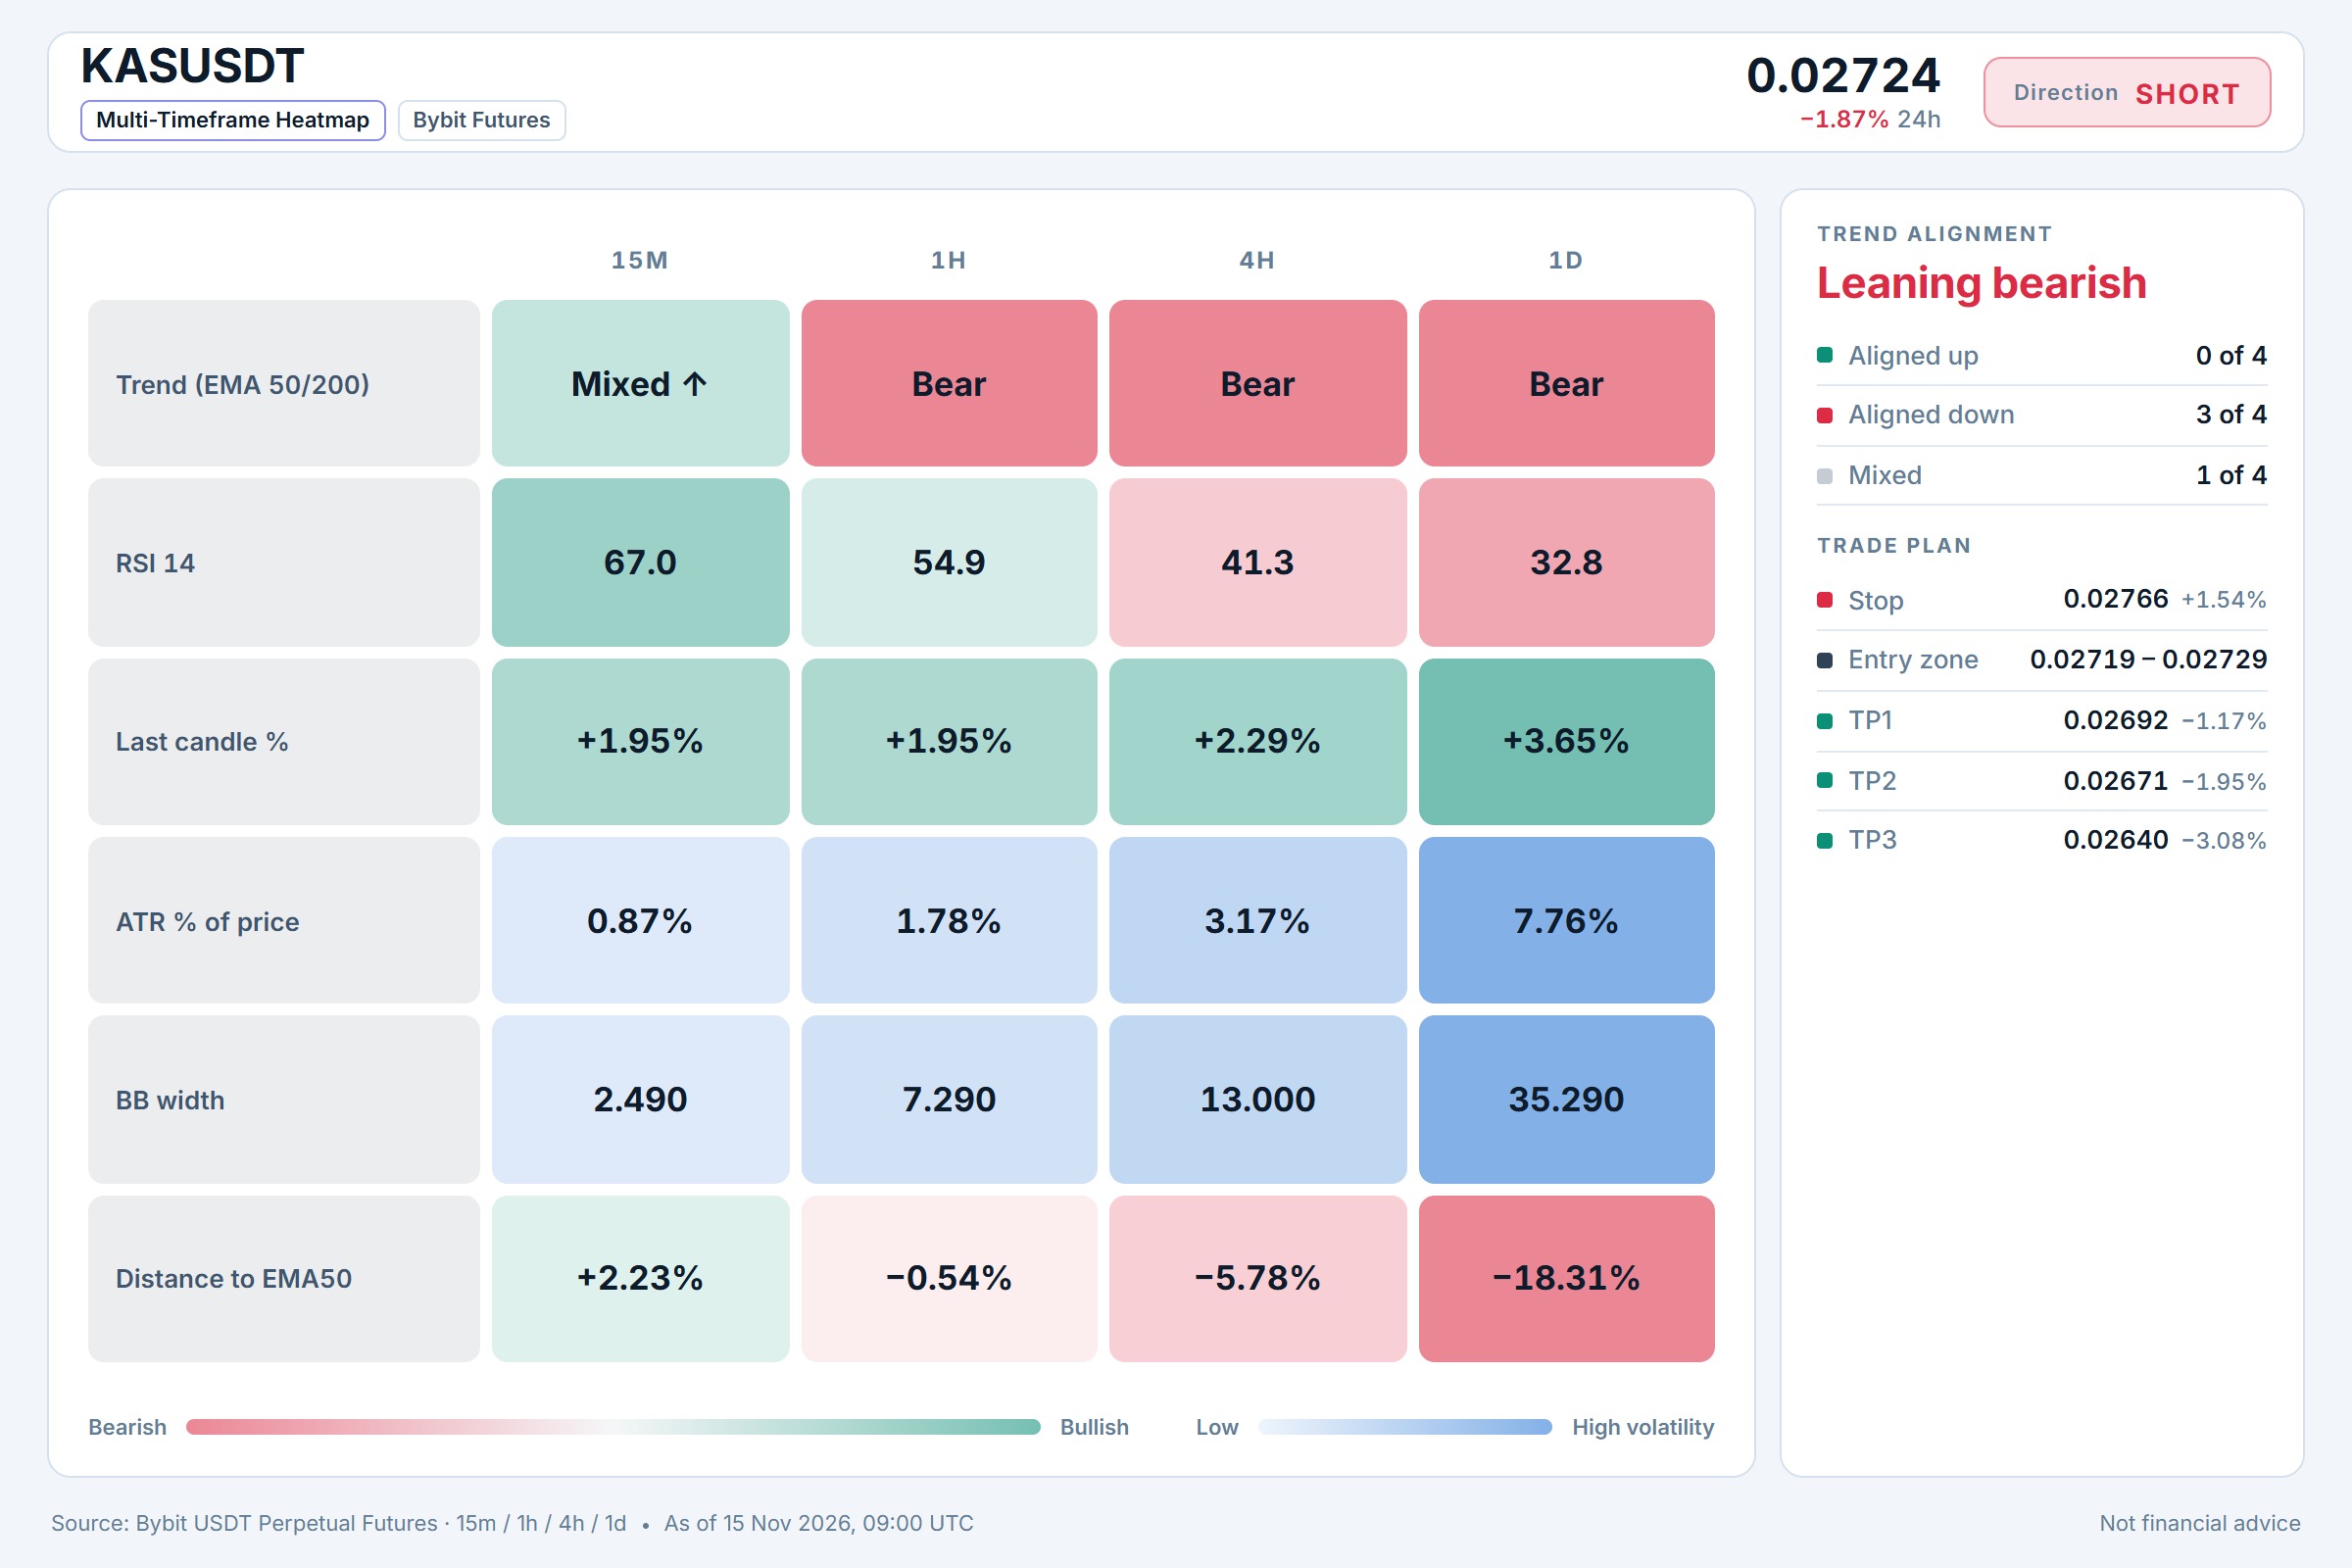
$KAS/USDT — SHORT Entry: 0.02719 - 0.02729 SL: 0.02766 TP1: 0.02692 TP2: 0.02671 TP3: 0.02640 I'm leaning short here because BTC trend is neutral, so KASU needs to find its own direction — and the 15m RSI sitting at 66.98 tells me momentum is climbing into a zone where sellers often step in. Price is hovering around 0.02724, and if it pushes into the 0.02719 to 0.02729 area, I'd look to enter around 0.02724. The setup gives a clean invalidation level at 0.02766, with profit targets at 0.02671 and 0.02640 below. Do you think RSI divergence at this level signals a real reversal, or will buyers defend these lows? ⚠️ Personal market analysis only. NFA — manage risk and DYOR. Educational content, not investment advice or a recommendation to buy, sell, deposit, or withdraw any asset. No paid promotion or referral/affiliate links.$KASUSDT#WSOT2026 #WSOTShowYourAITradeToEarn10USDT
HBAR May Slide Further as BTC Stays Under Pressure
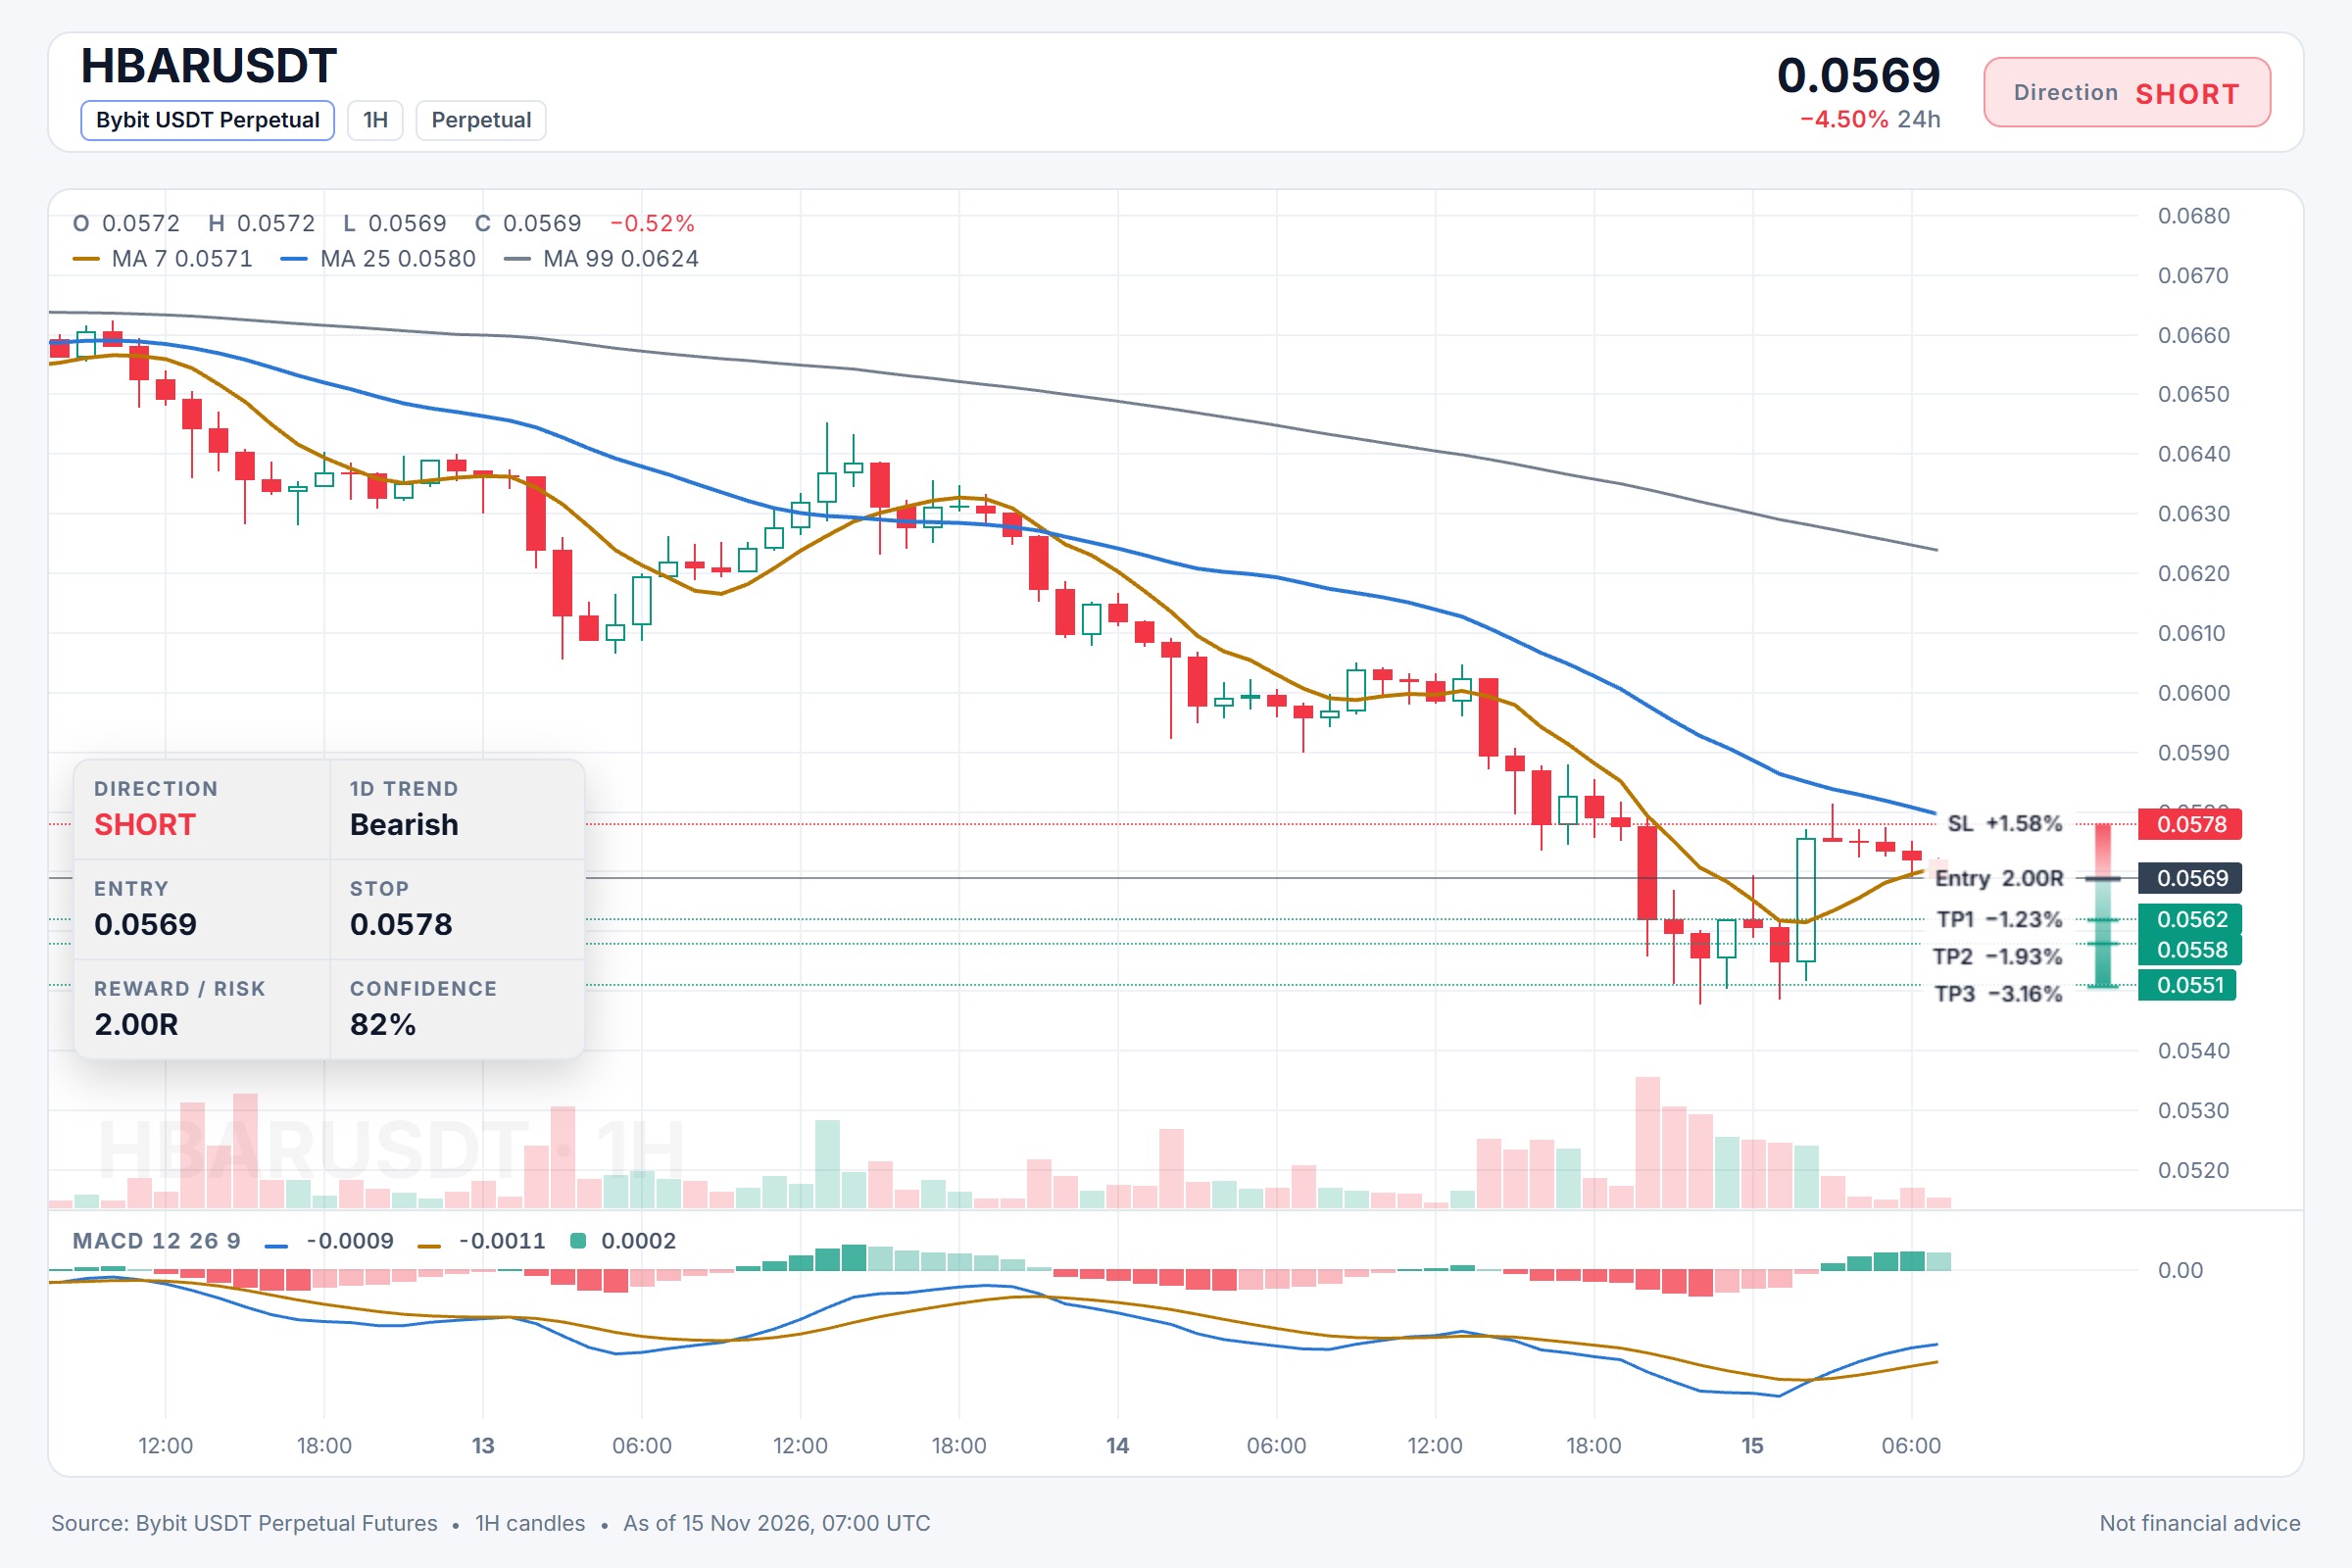
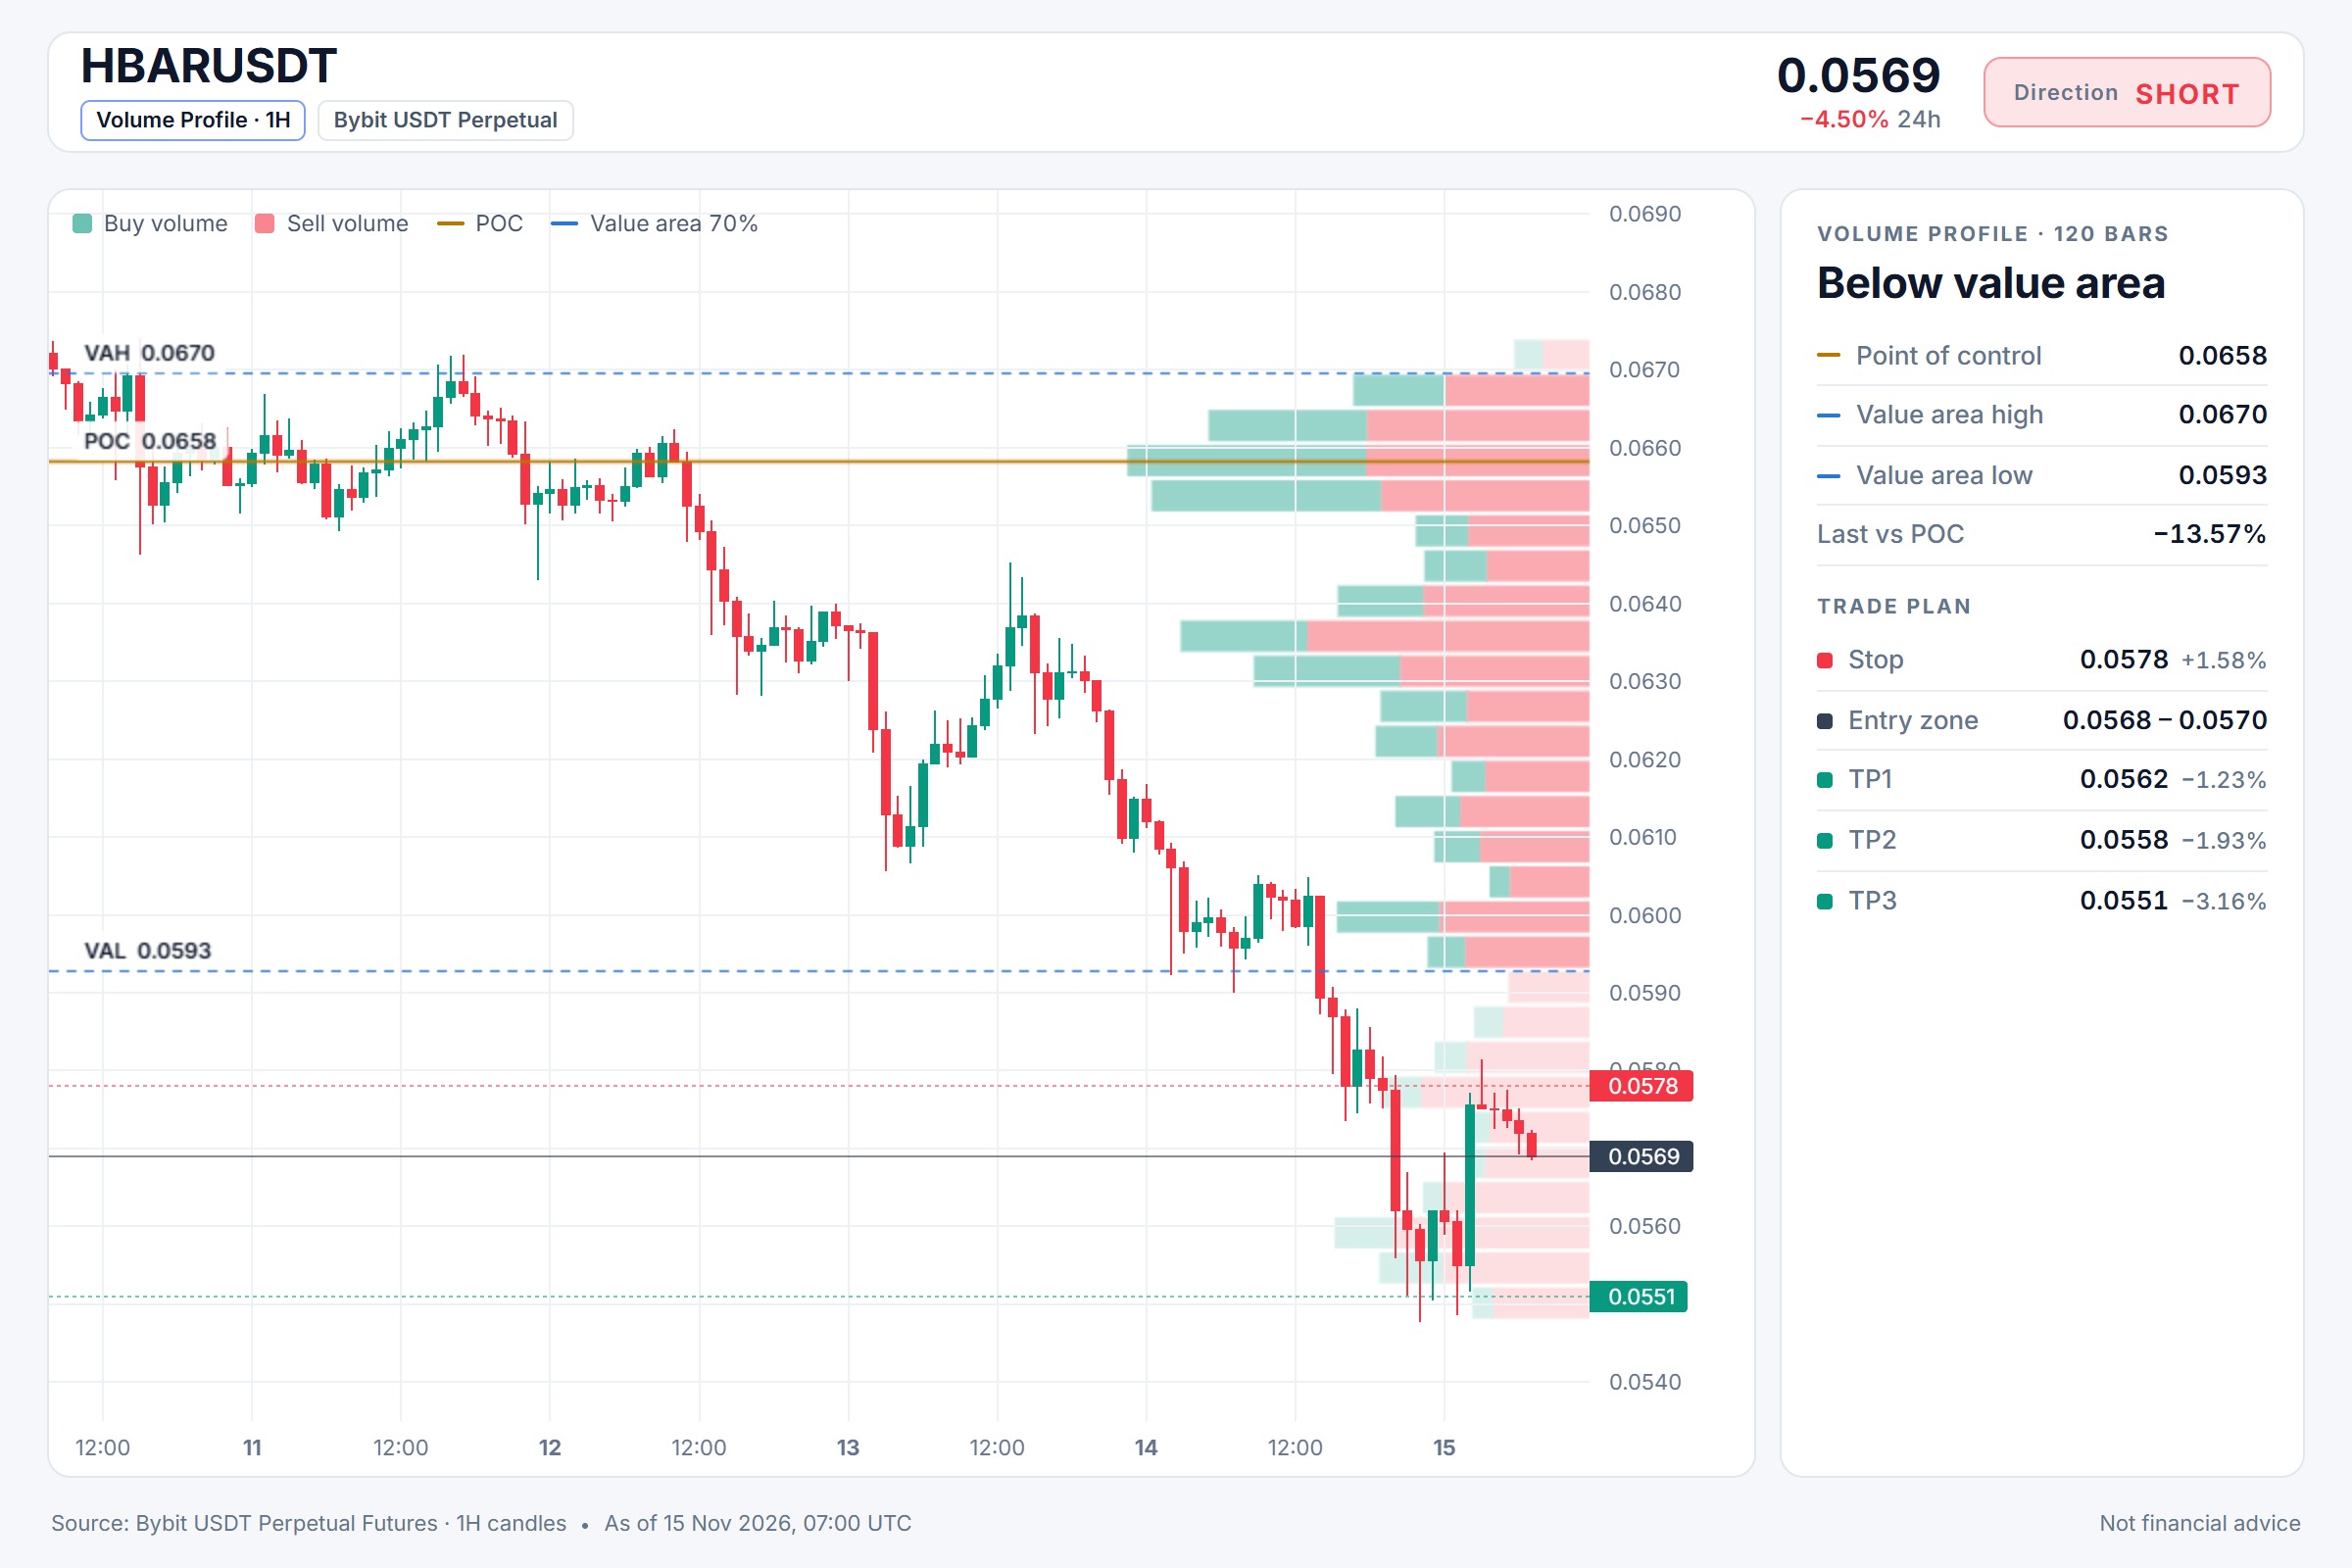
$HBAR/USDT — SHORT Entry: 0.0568 - 0.0570 SL: 0.0578 TP1: 0.0562 TP2: 0.0558 TP3: 0.0551 BTC is clearly bearish, and HBAR is drifting with that momentum. The 15m RSI sits at 46.22, showing bearish momentum is still intact. Entering around 0.0569 with a short bias fits the broader trend. Keeping SL at 0.0578 and targeting TP2 0.0558 and TP3 0.0551 respects the existing structure. Do you see HBAR reversing before it reaches TP2, or is the bearish move continuing? ⚠️ Personal market analysis only. NFA — manage risk and DYOR. Educational content, not investment advice or a recommendation to buy, sell, deposit, or withdraw any asset. No paid promotion or referral/affiliate links.$HBARUSDT#WSOT2026 #WSOTShowYourAITradeToEarn10USDT
CHZ: Potential Downside Looms
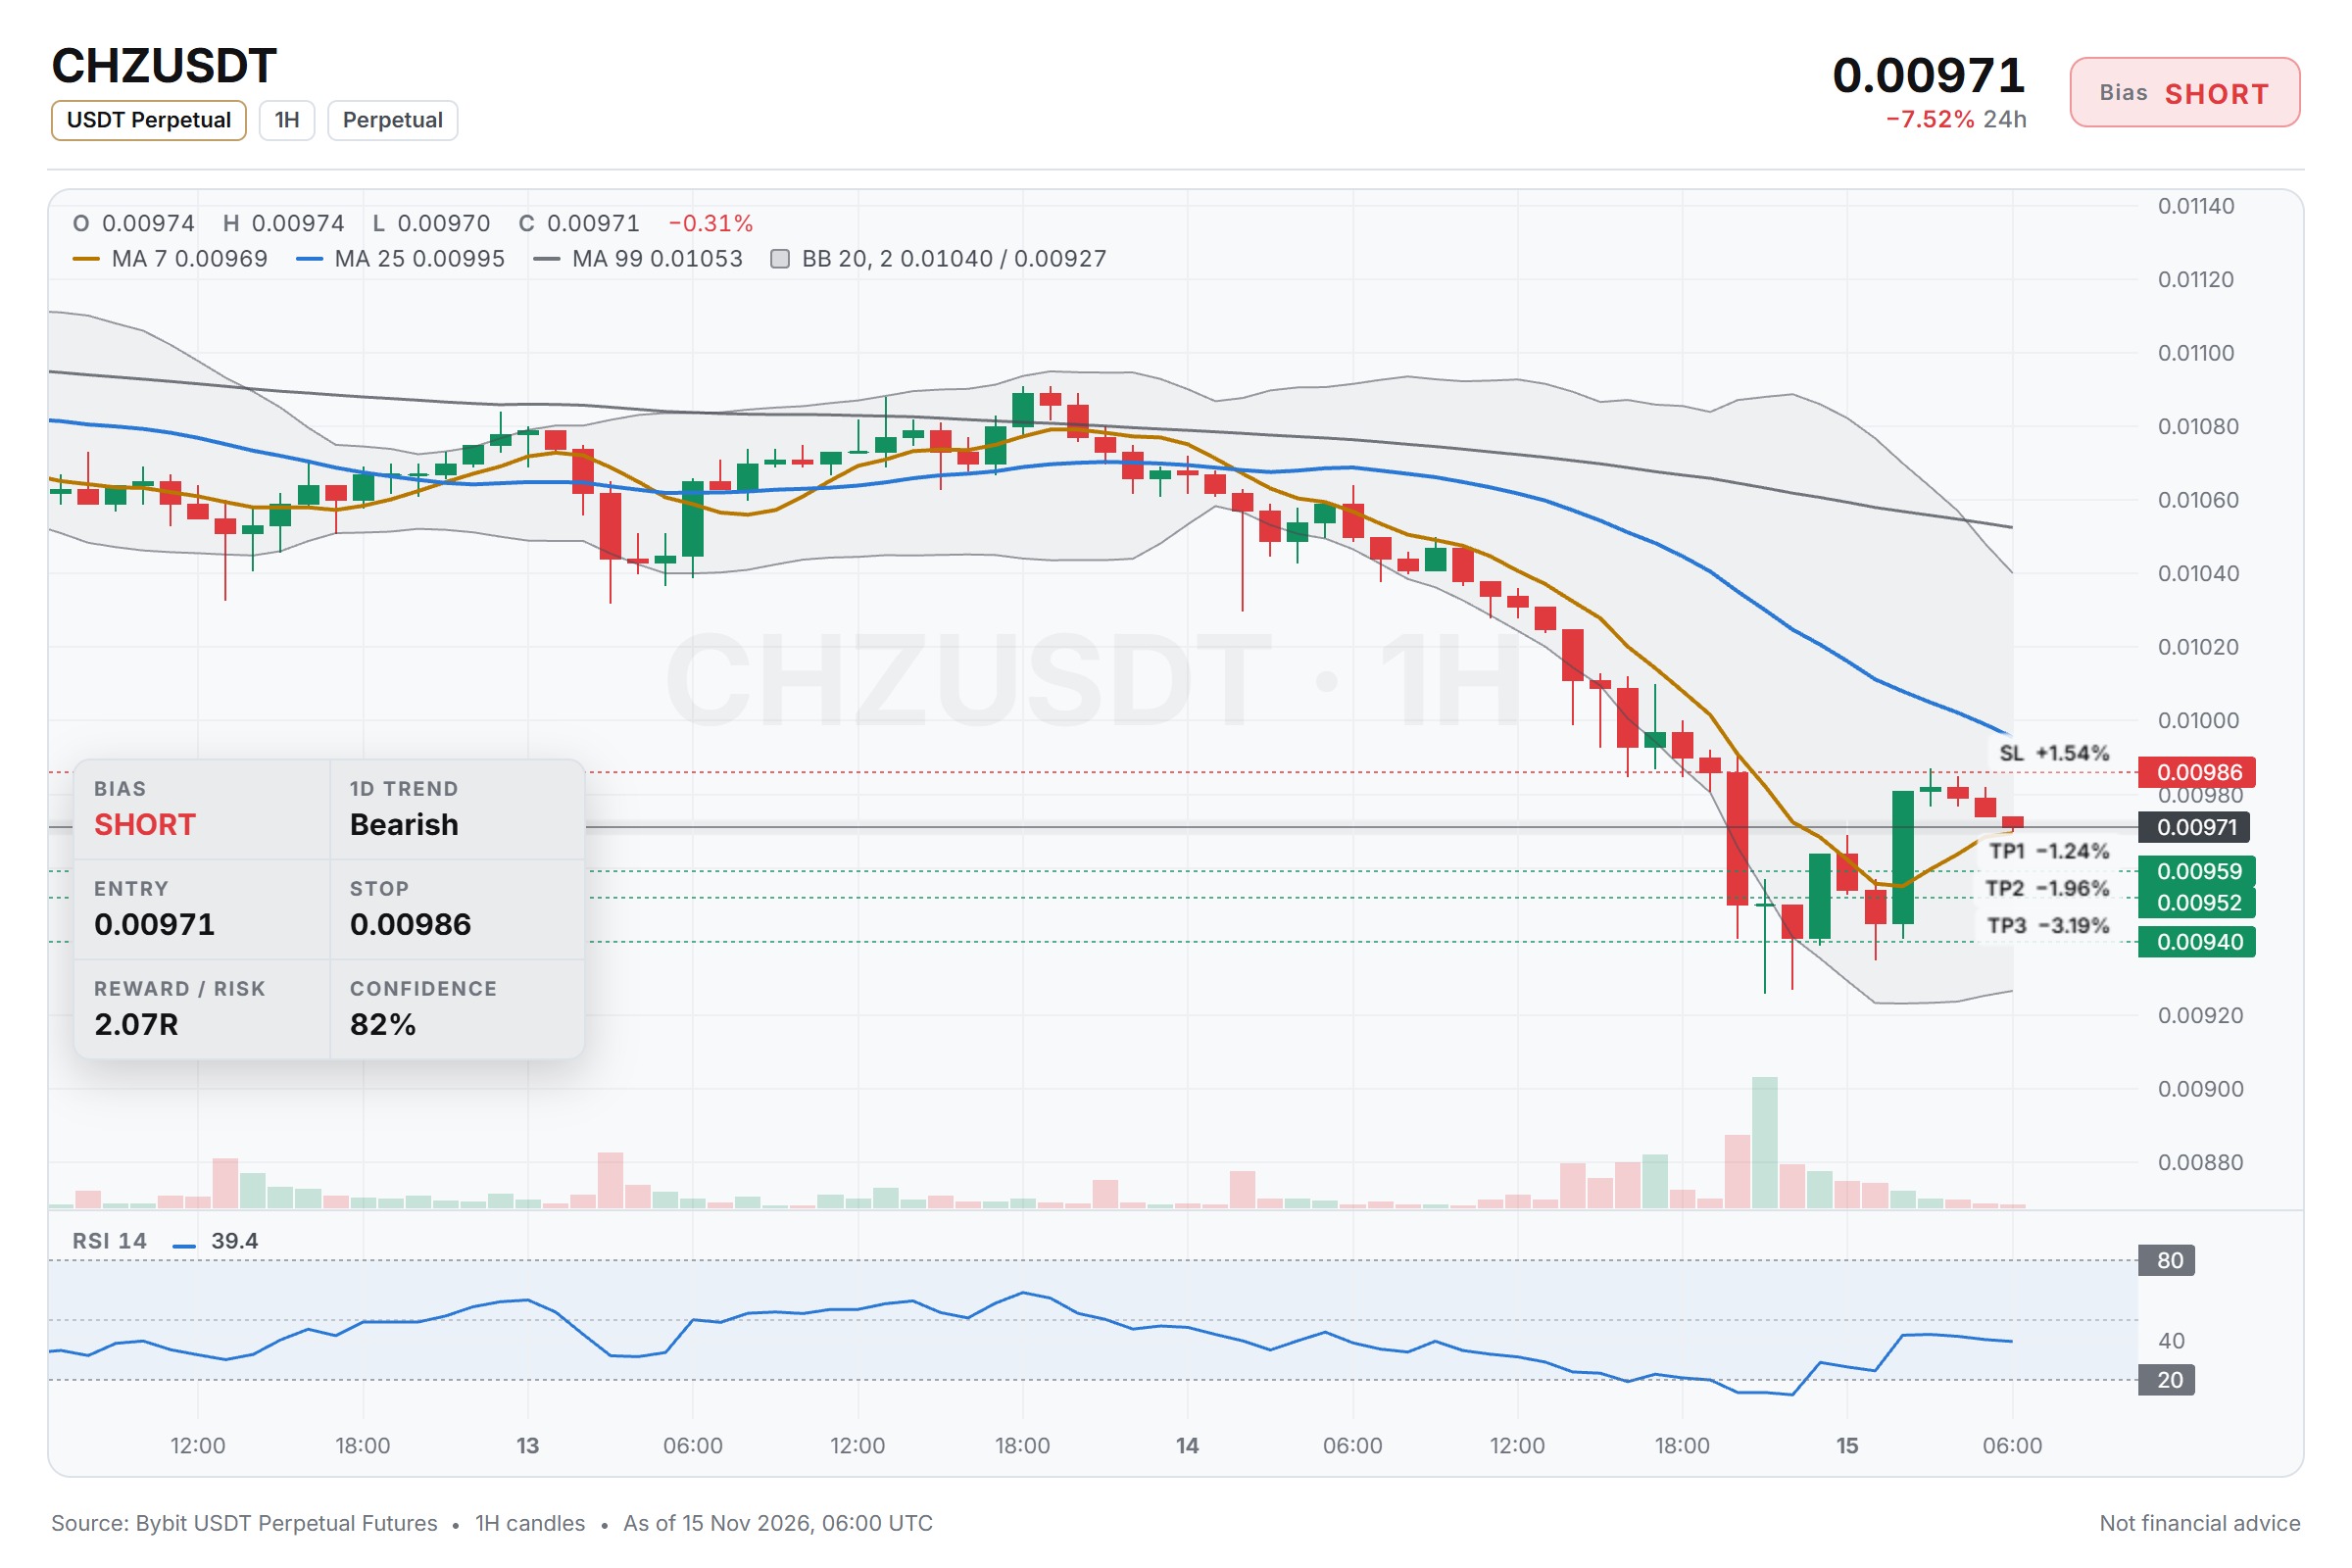
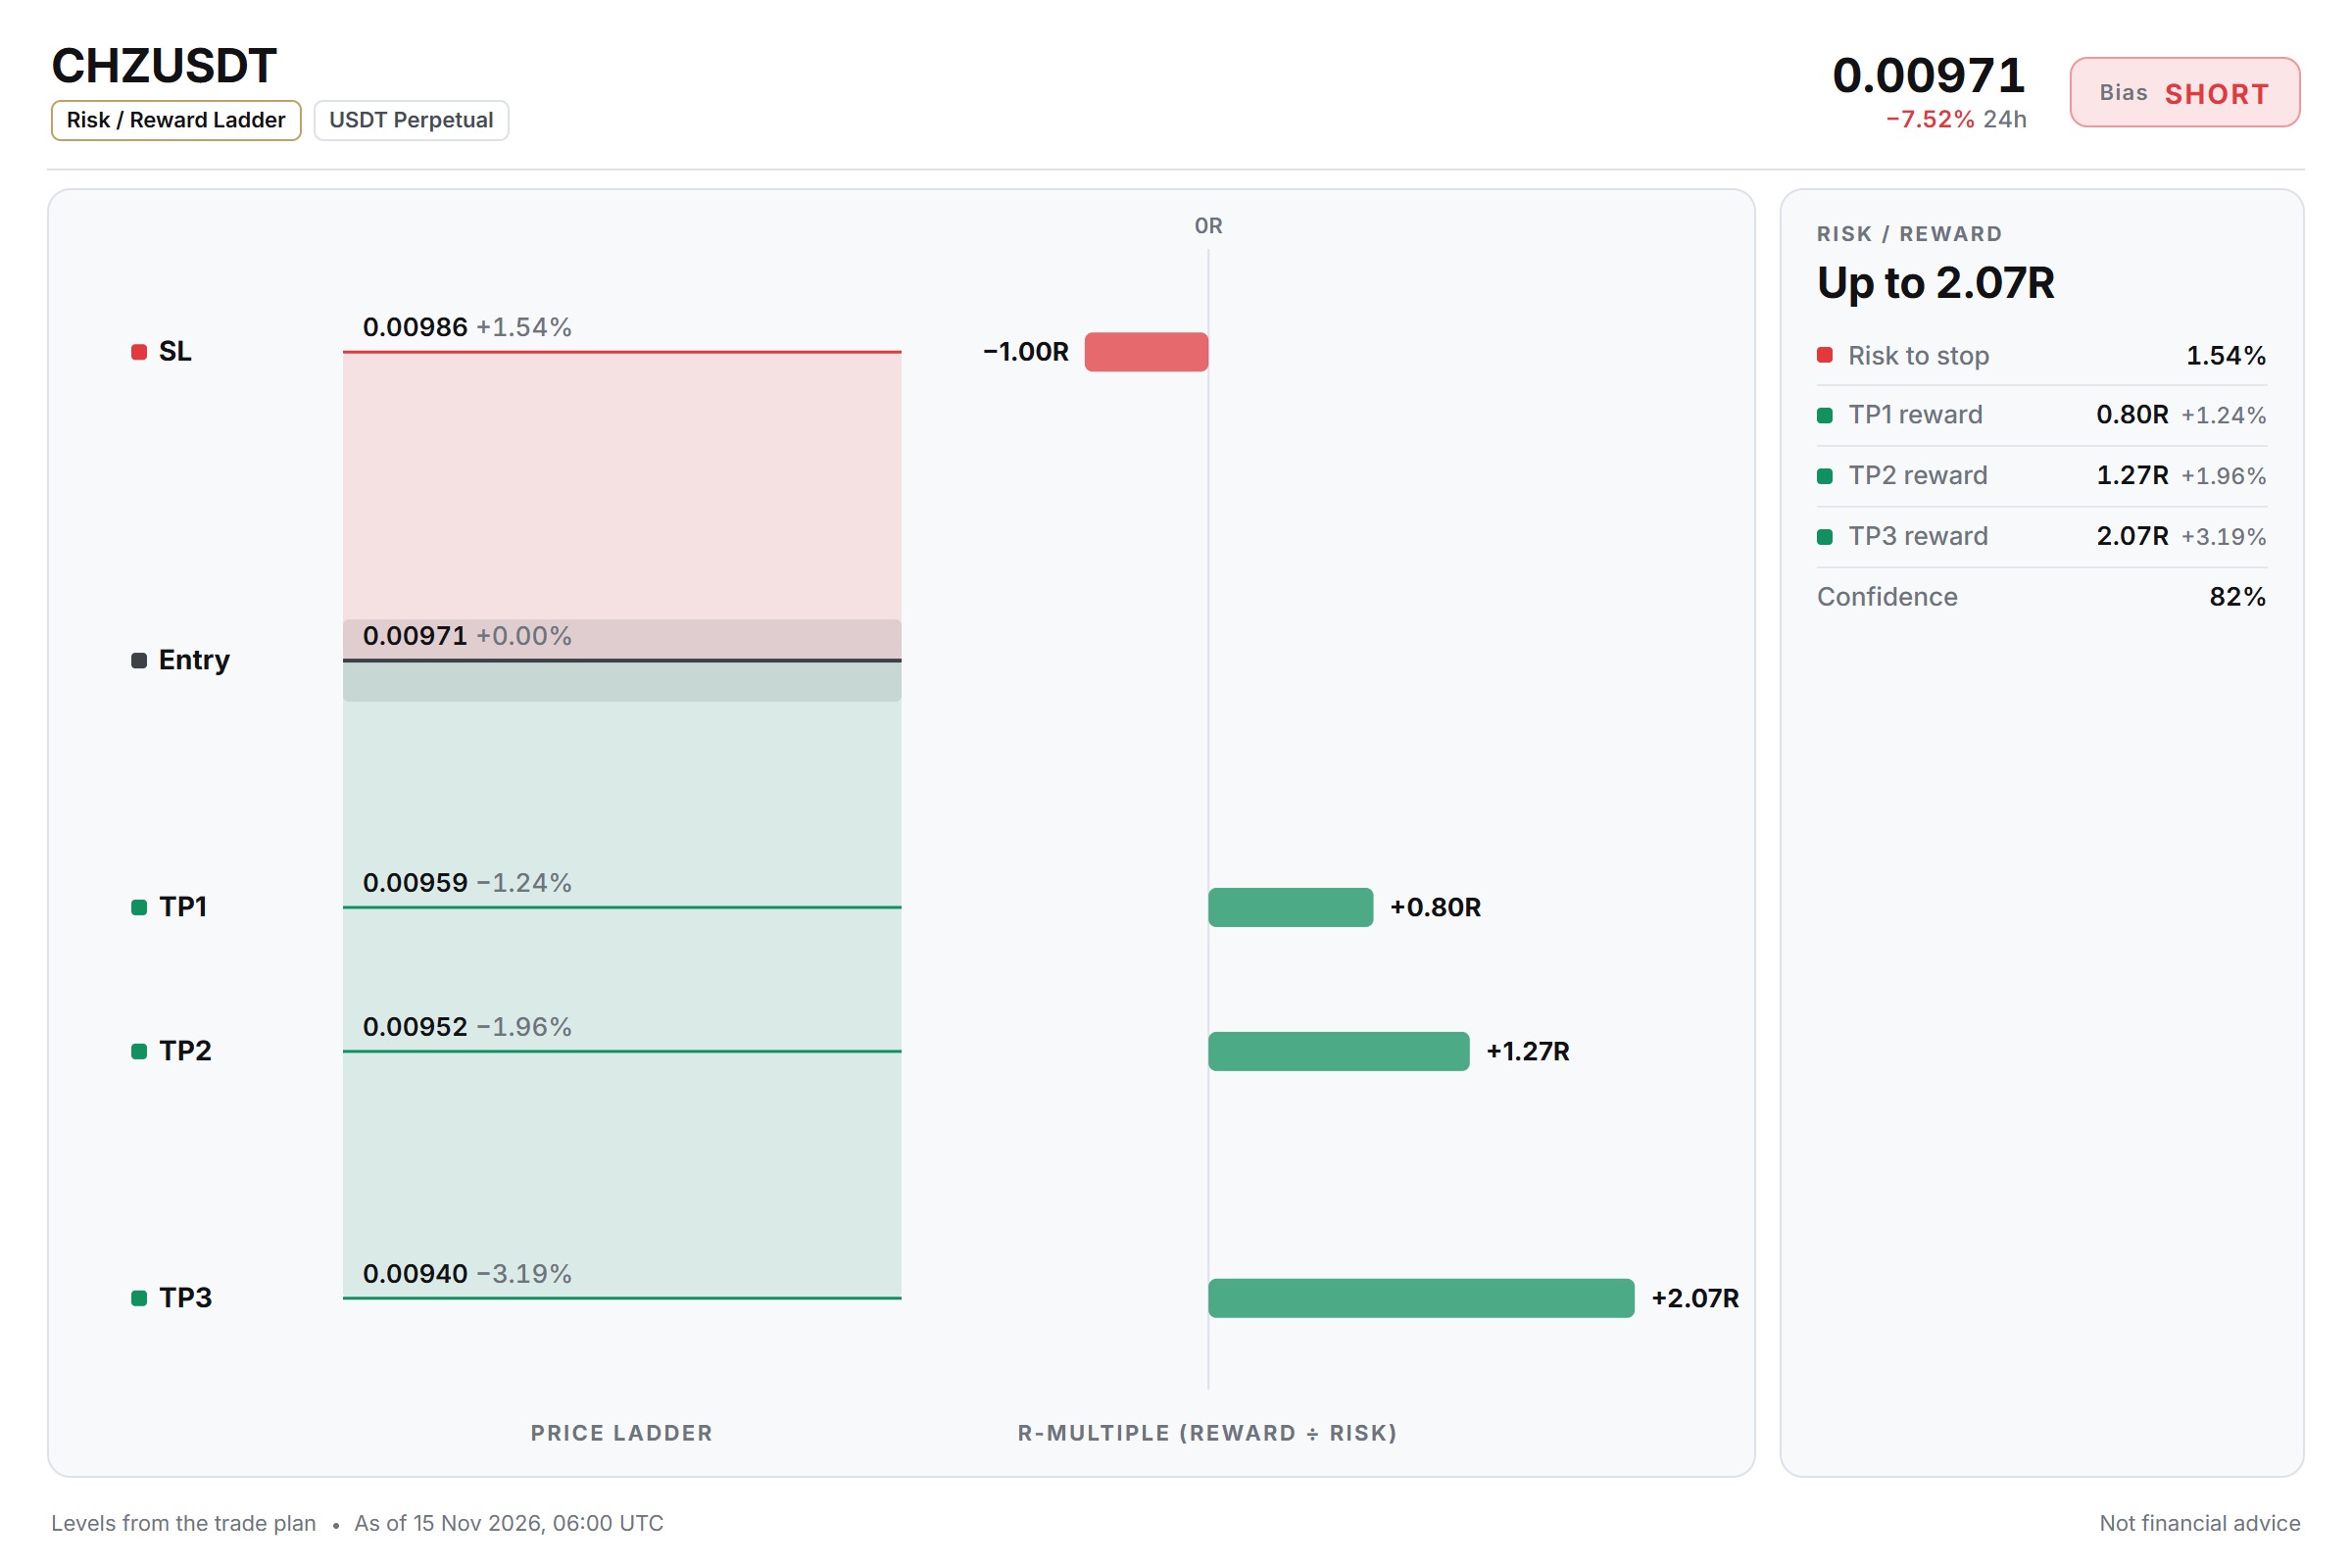
$CHZ/USDT — SHORT Entry: 0.00969 - 0.00973 SL: 0.00986 TP1: 0.00959 TP2: 0.00952 TP3: 0.00940 With BTC trending bearish, CHZ is sitting at 0.00971 with 15m RSI at 48.19 — momentum is fading from the recent swing. The price is drifting toward the 0.00969 to 0.00973 zone where I'd consider entering around 0.00971. A move below that level could open the path toward 0.00952 first, then 0.00940. Invalidation sits at 0.00986, which I'd treat as a clear level to step away. This setup matters because the broader market tone is soft, and CHZ hasn't shown enough buying pressure to disagree with that. Do you think CHZ has enough downside left to make this worth the risk, or would you sit on the sidelines and wait for BTC to clarify? ⚠️ Personal market analysis only. NFA — manage risk and DYOR. Educational content, not investment advice or a recommendation to buy, sell, deposit, or withdraw any asset. No paid promotion or referral/affiliate links.$CHZUSDT#WSOT2026 #WSOTShowYourAITradeToEarn10USDT
Why OP might slide further when BTC stays neutral.
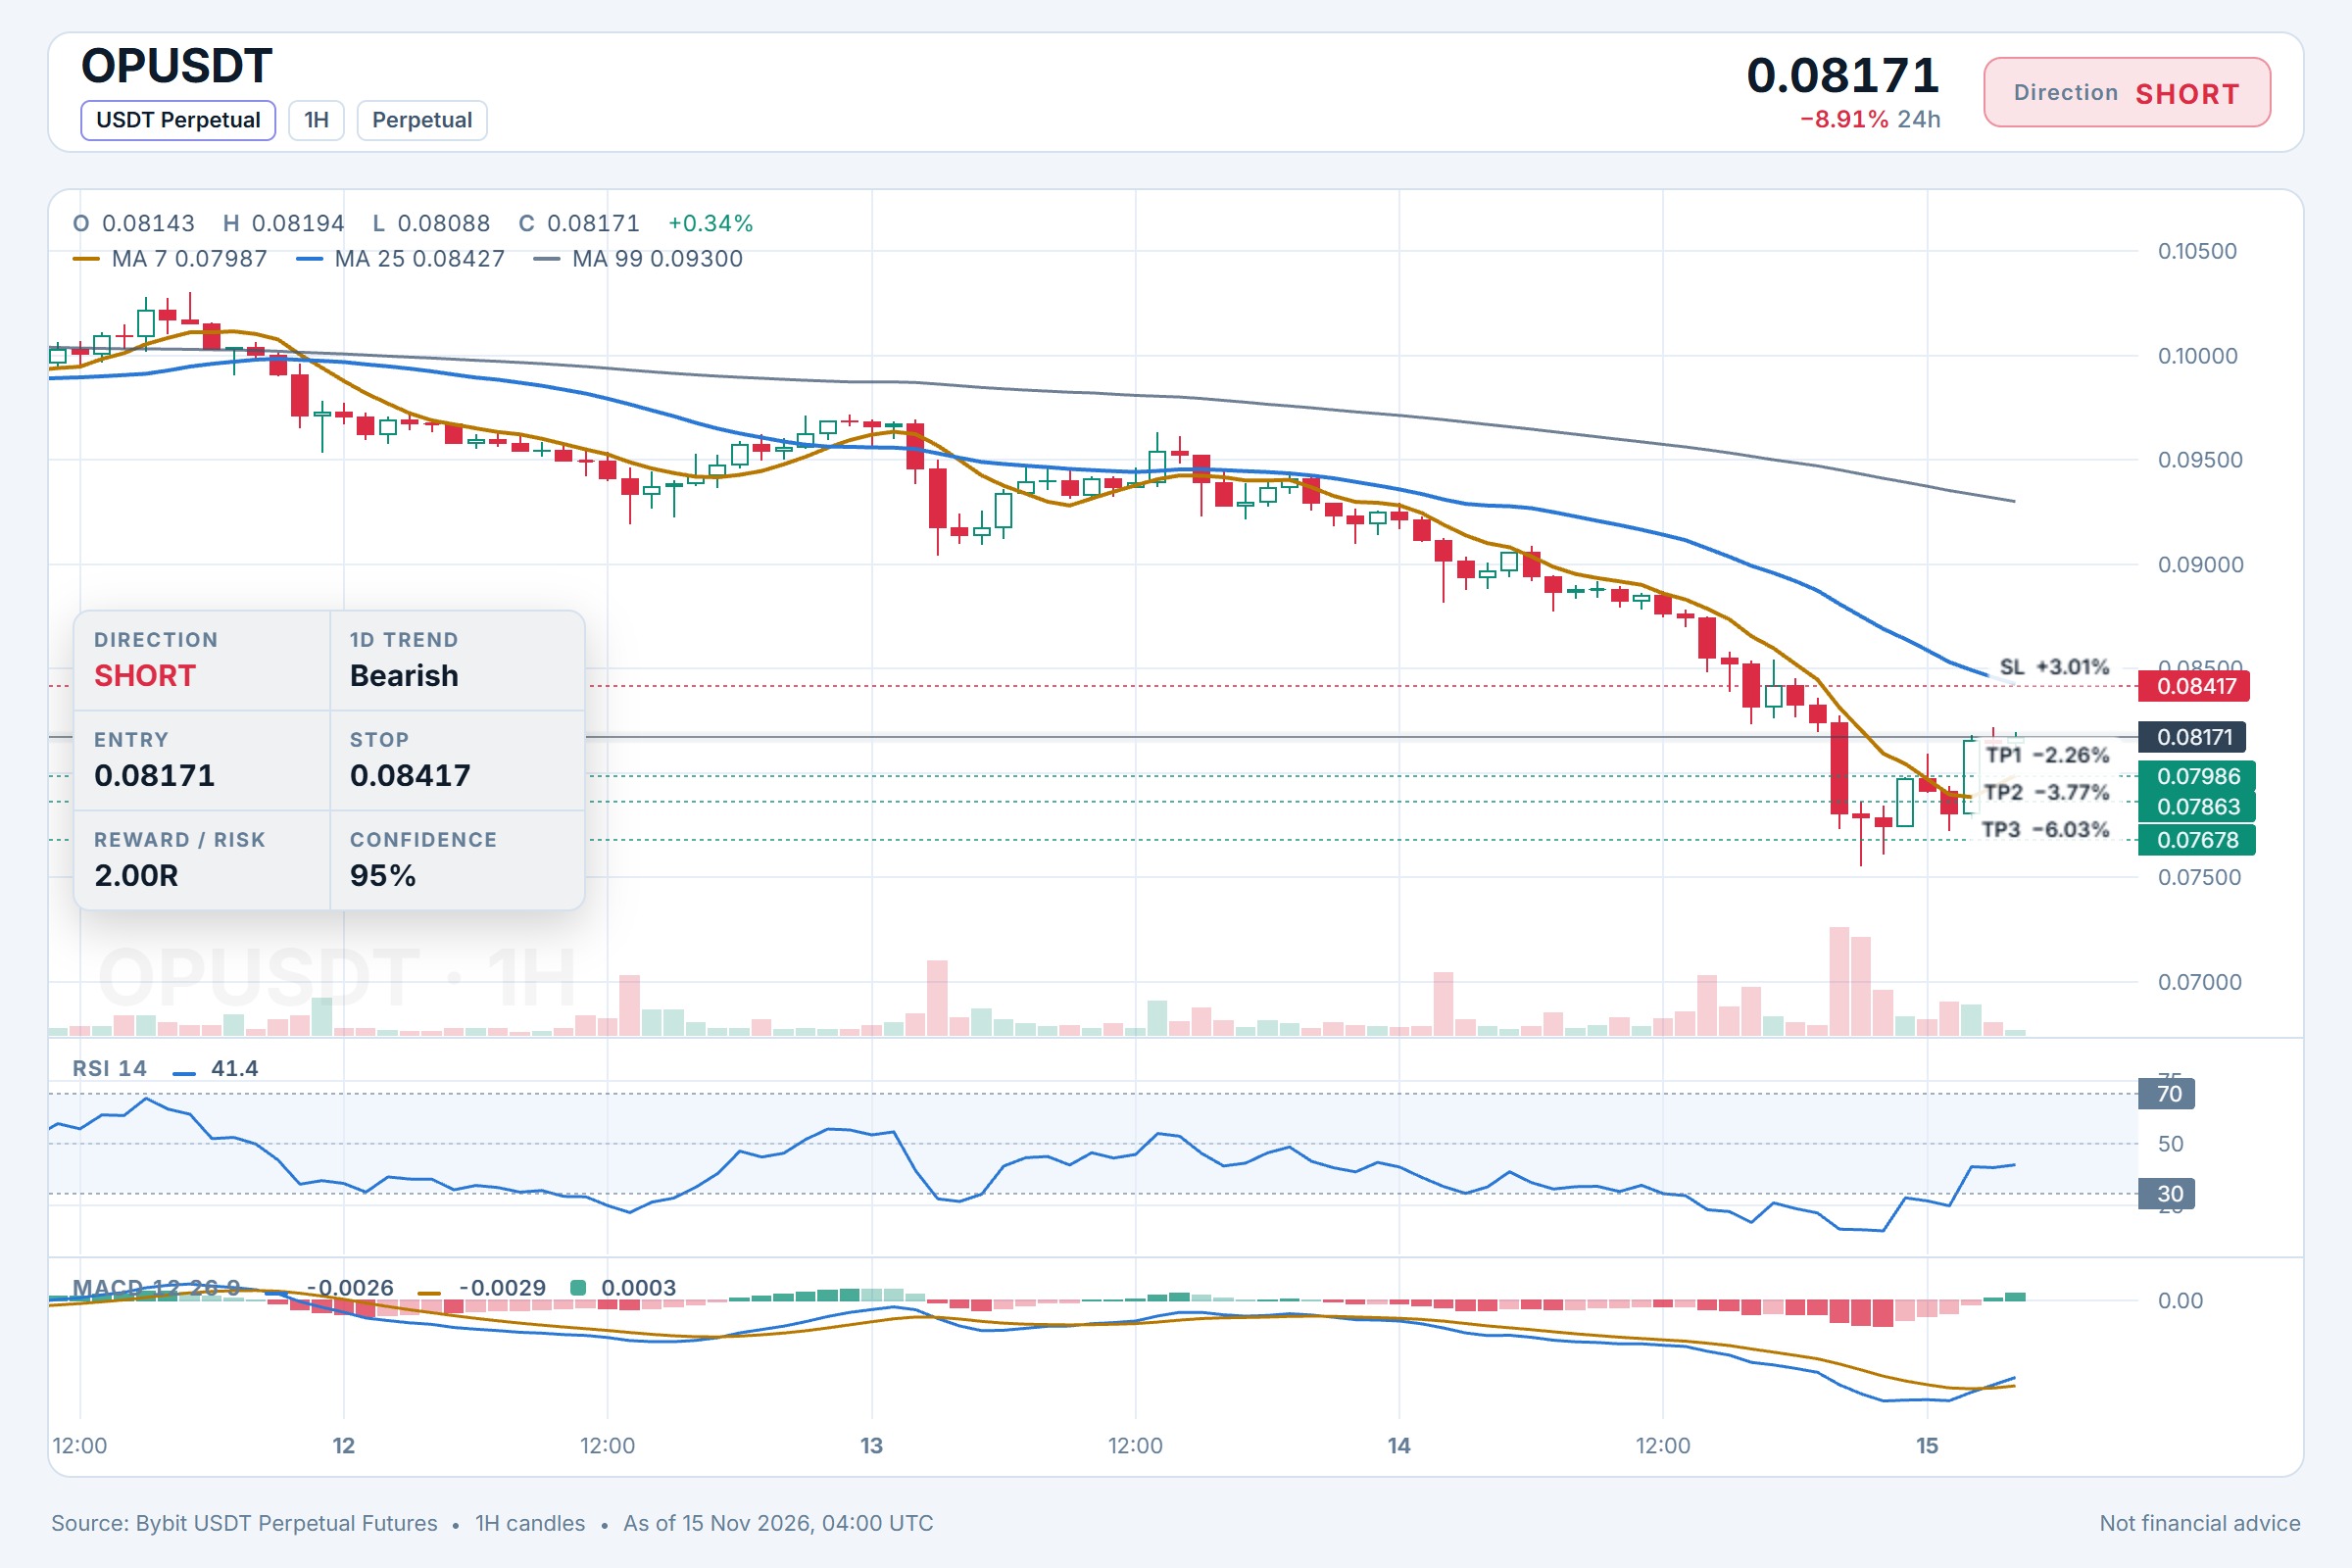
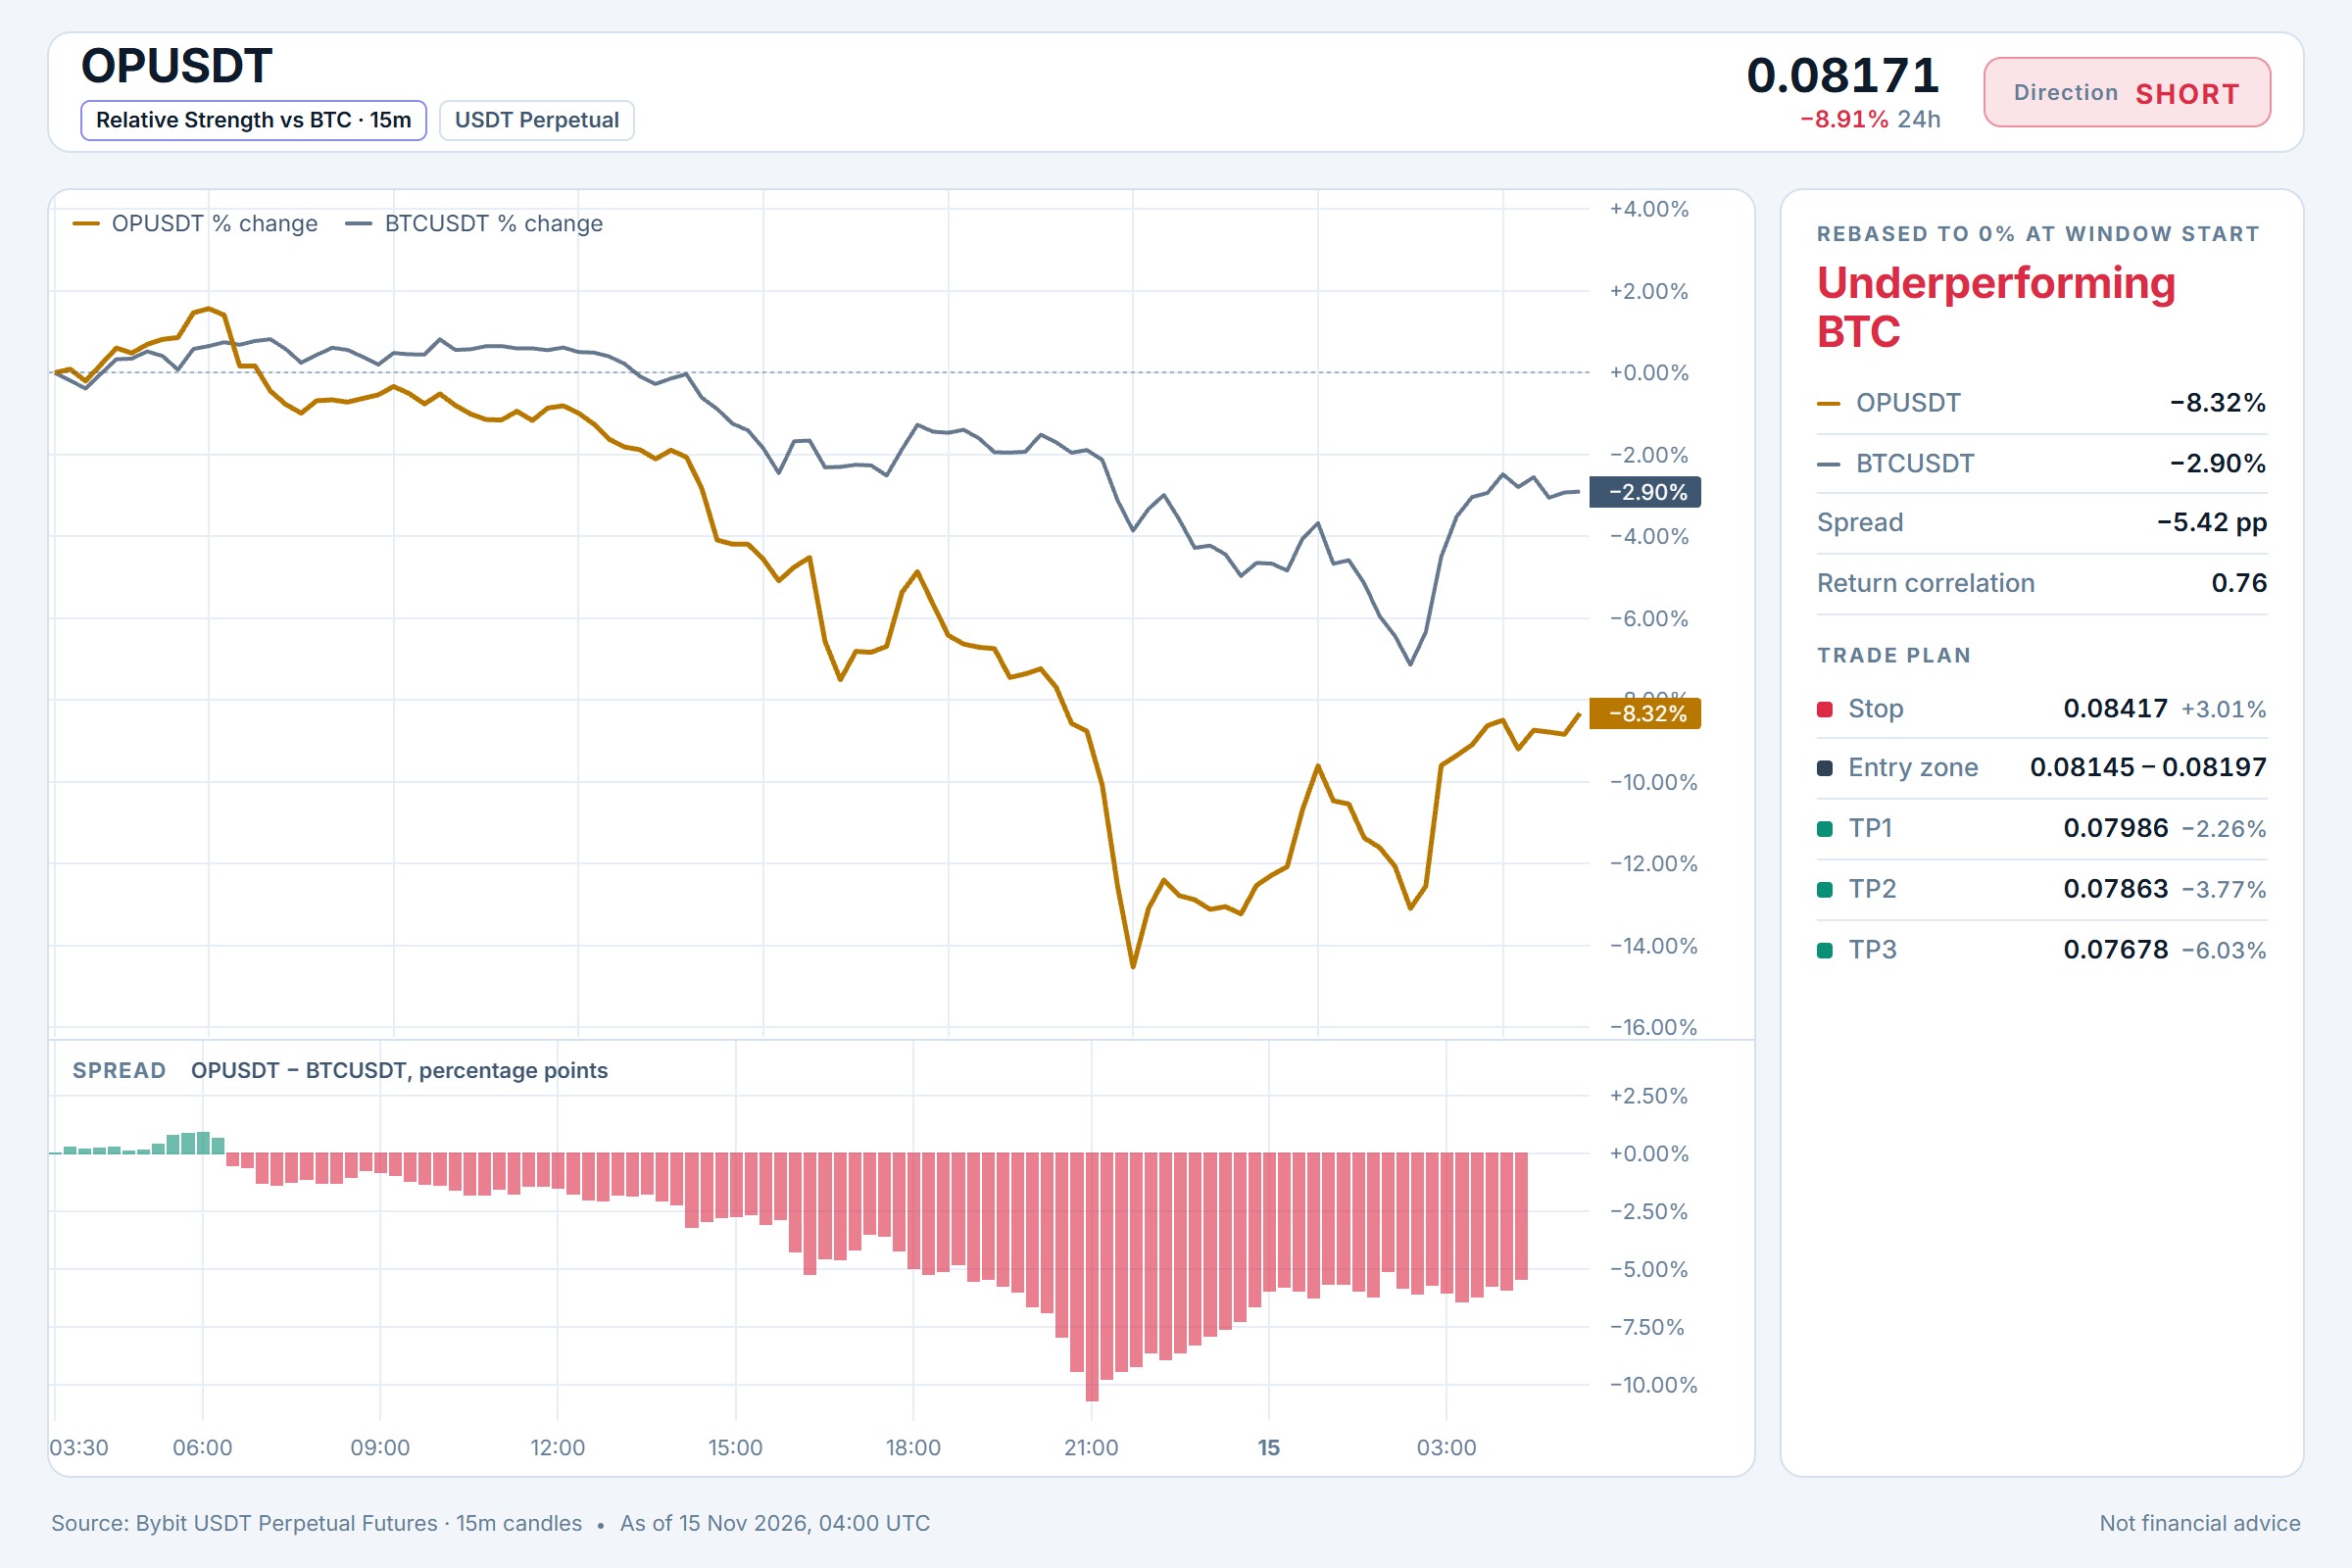
$OP/USDT — SHORT Entry: 0.08145 - 0.08197 SL: 0.08417 TP1: 0.07986 TP2: 0.07863 TP3: 0.07678 Momentum on the 15m RSI sits at 58.78, leaning neither overbought nor oversold, which often gives short sellers room when BTC itself lacks clear direction. A move from the current 0.08171 area down toward 0.07863 and 0.07678 would align with a classic retest of lower levels, provided the entry zone around 0.08145 to 0.08197 holds as an invalidation boundary. Does neutral BTC trend plus a 15m RSI near 59 set up a clean slide for OP, or is a reversal more likely first? ⚠️ Personal market analysis only. NFA — manage risk and DYOR. Educational content, not investment advice or a recommendation to buy, sell, deposit, or withdraw any asset. No paid promotion or referral/affiliate links.$OPUSDT#WSOT2026 #WSOTShowYourAITradeToEarn10USDT
DYDX Short Bias vs BTC Neutral
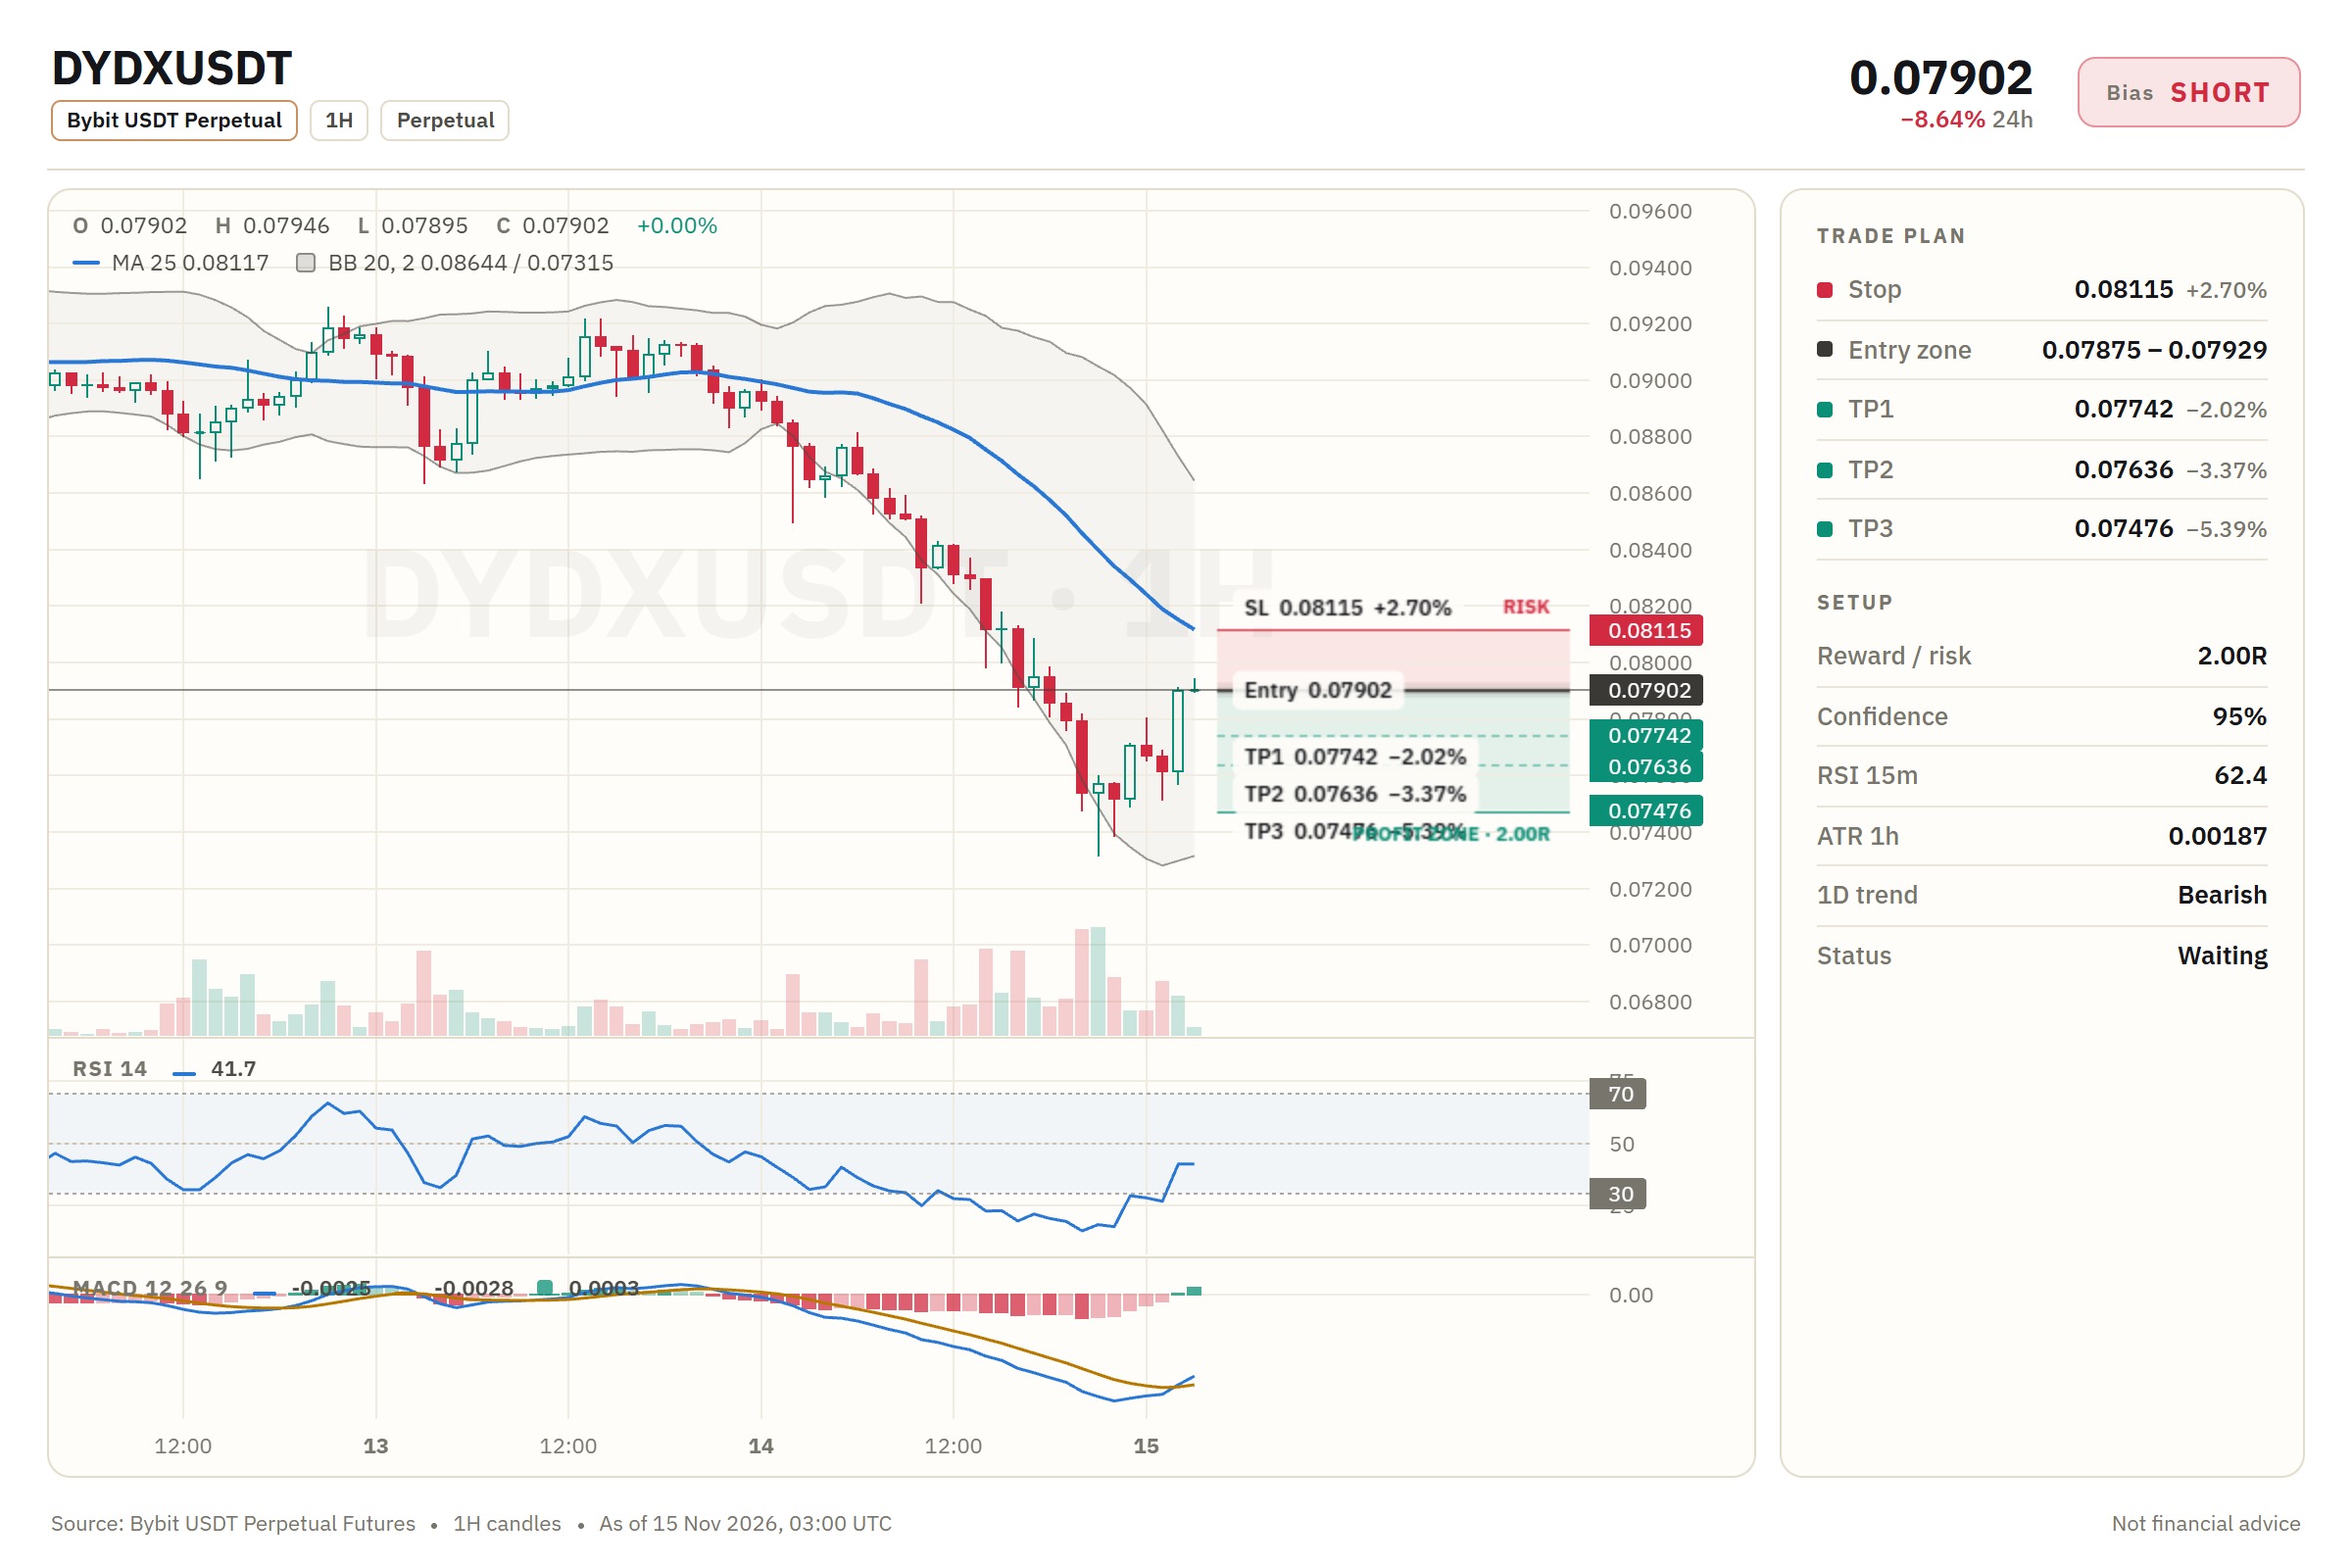
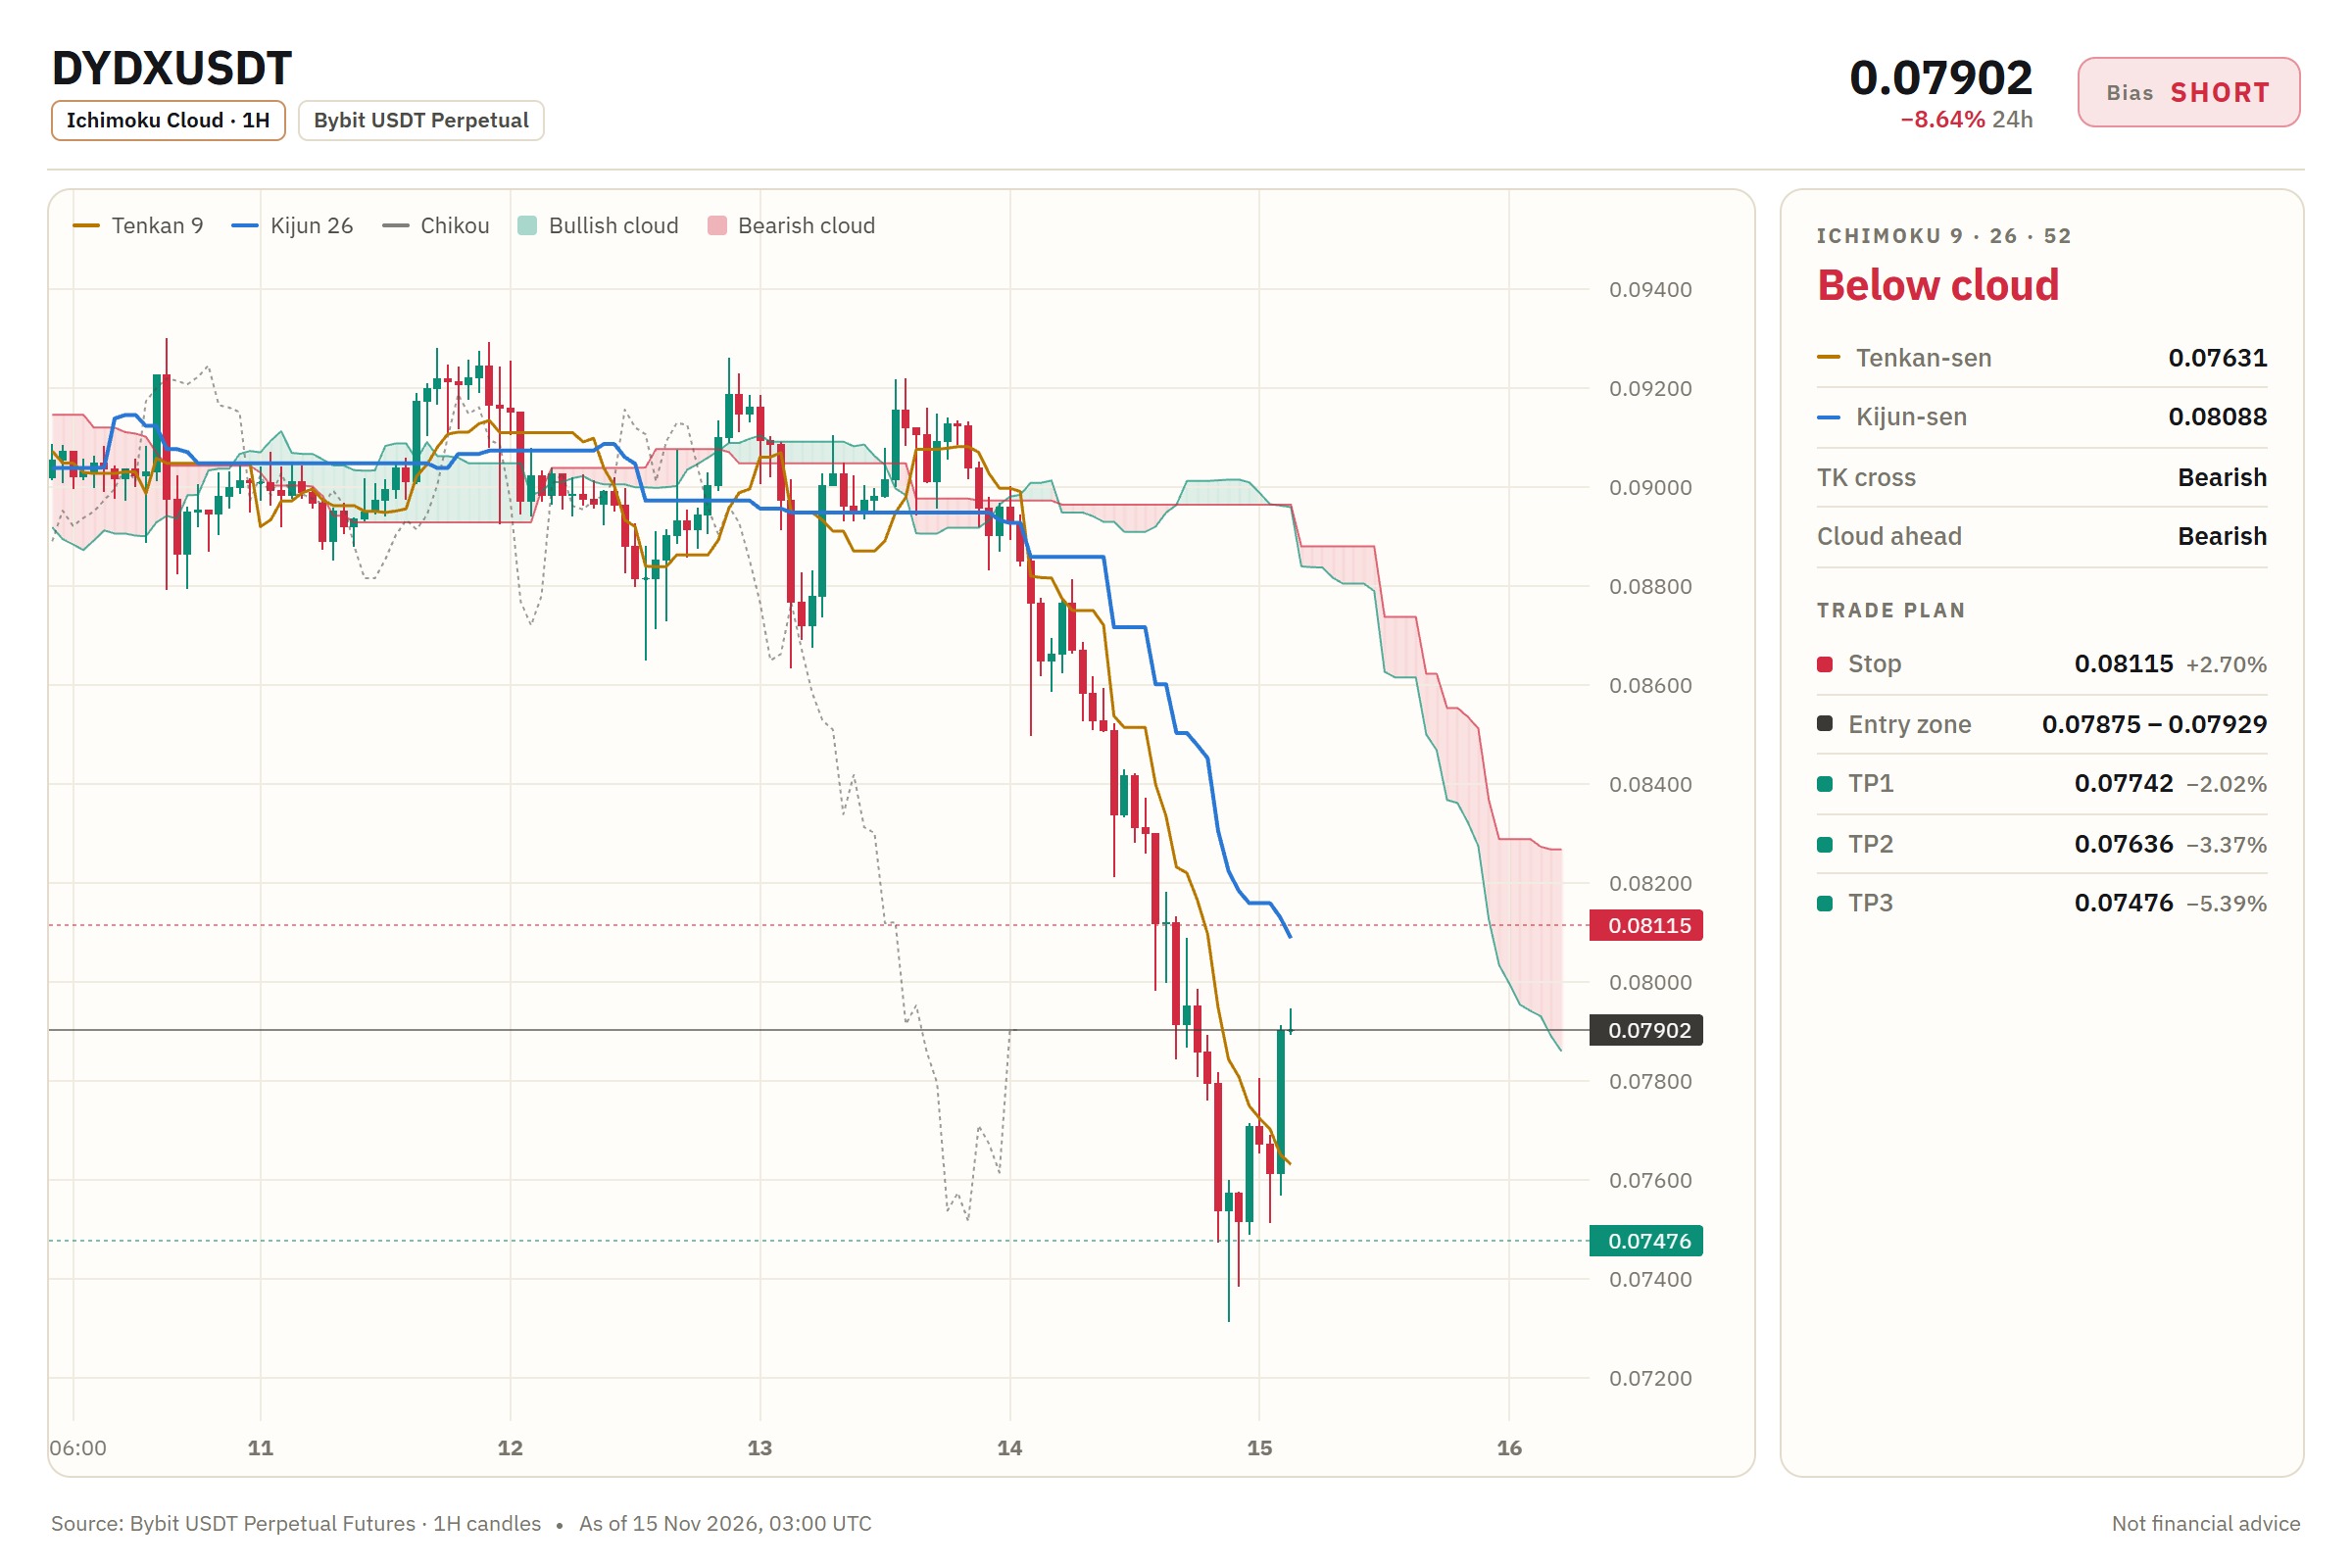
$DYDX/USDT — SHORT Entry: 0.07875 - 0.07929 SL: 0.08115 TP1: 0.07742 TP2: 0.07636 TP3: 0.07476 I am watching the 15m RSI sit at 62.43 and see momentum leaning bearish from the 0.07902 zone. With BTC trend flat, a clean break below 0.07875 would confirm local exhaustion and open room toward TP2 0.07636 and TP3 0.07476. Keeping SL at 0.08115 respects the immediate invalidation level above the entry range of 0.07875 to 0.07929. Does RSI staying above 60 keep this short viable, or would you wait for a re-test first? ⚠️ Personal market analysis only. NFA — manage risk and DYOR. Educational content, not investment advice or a recommendation to buy, sell, deposit, or withdraw any asset. No paid promotion or referral/affiliate links.$DYDXUSDT#WSOT2026 #WSOTShowYourAITradeToEarn10USDT
BCH RSI Near 33: Why I'm Short
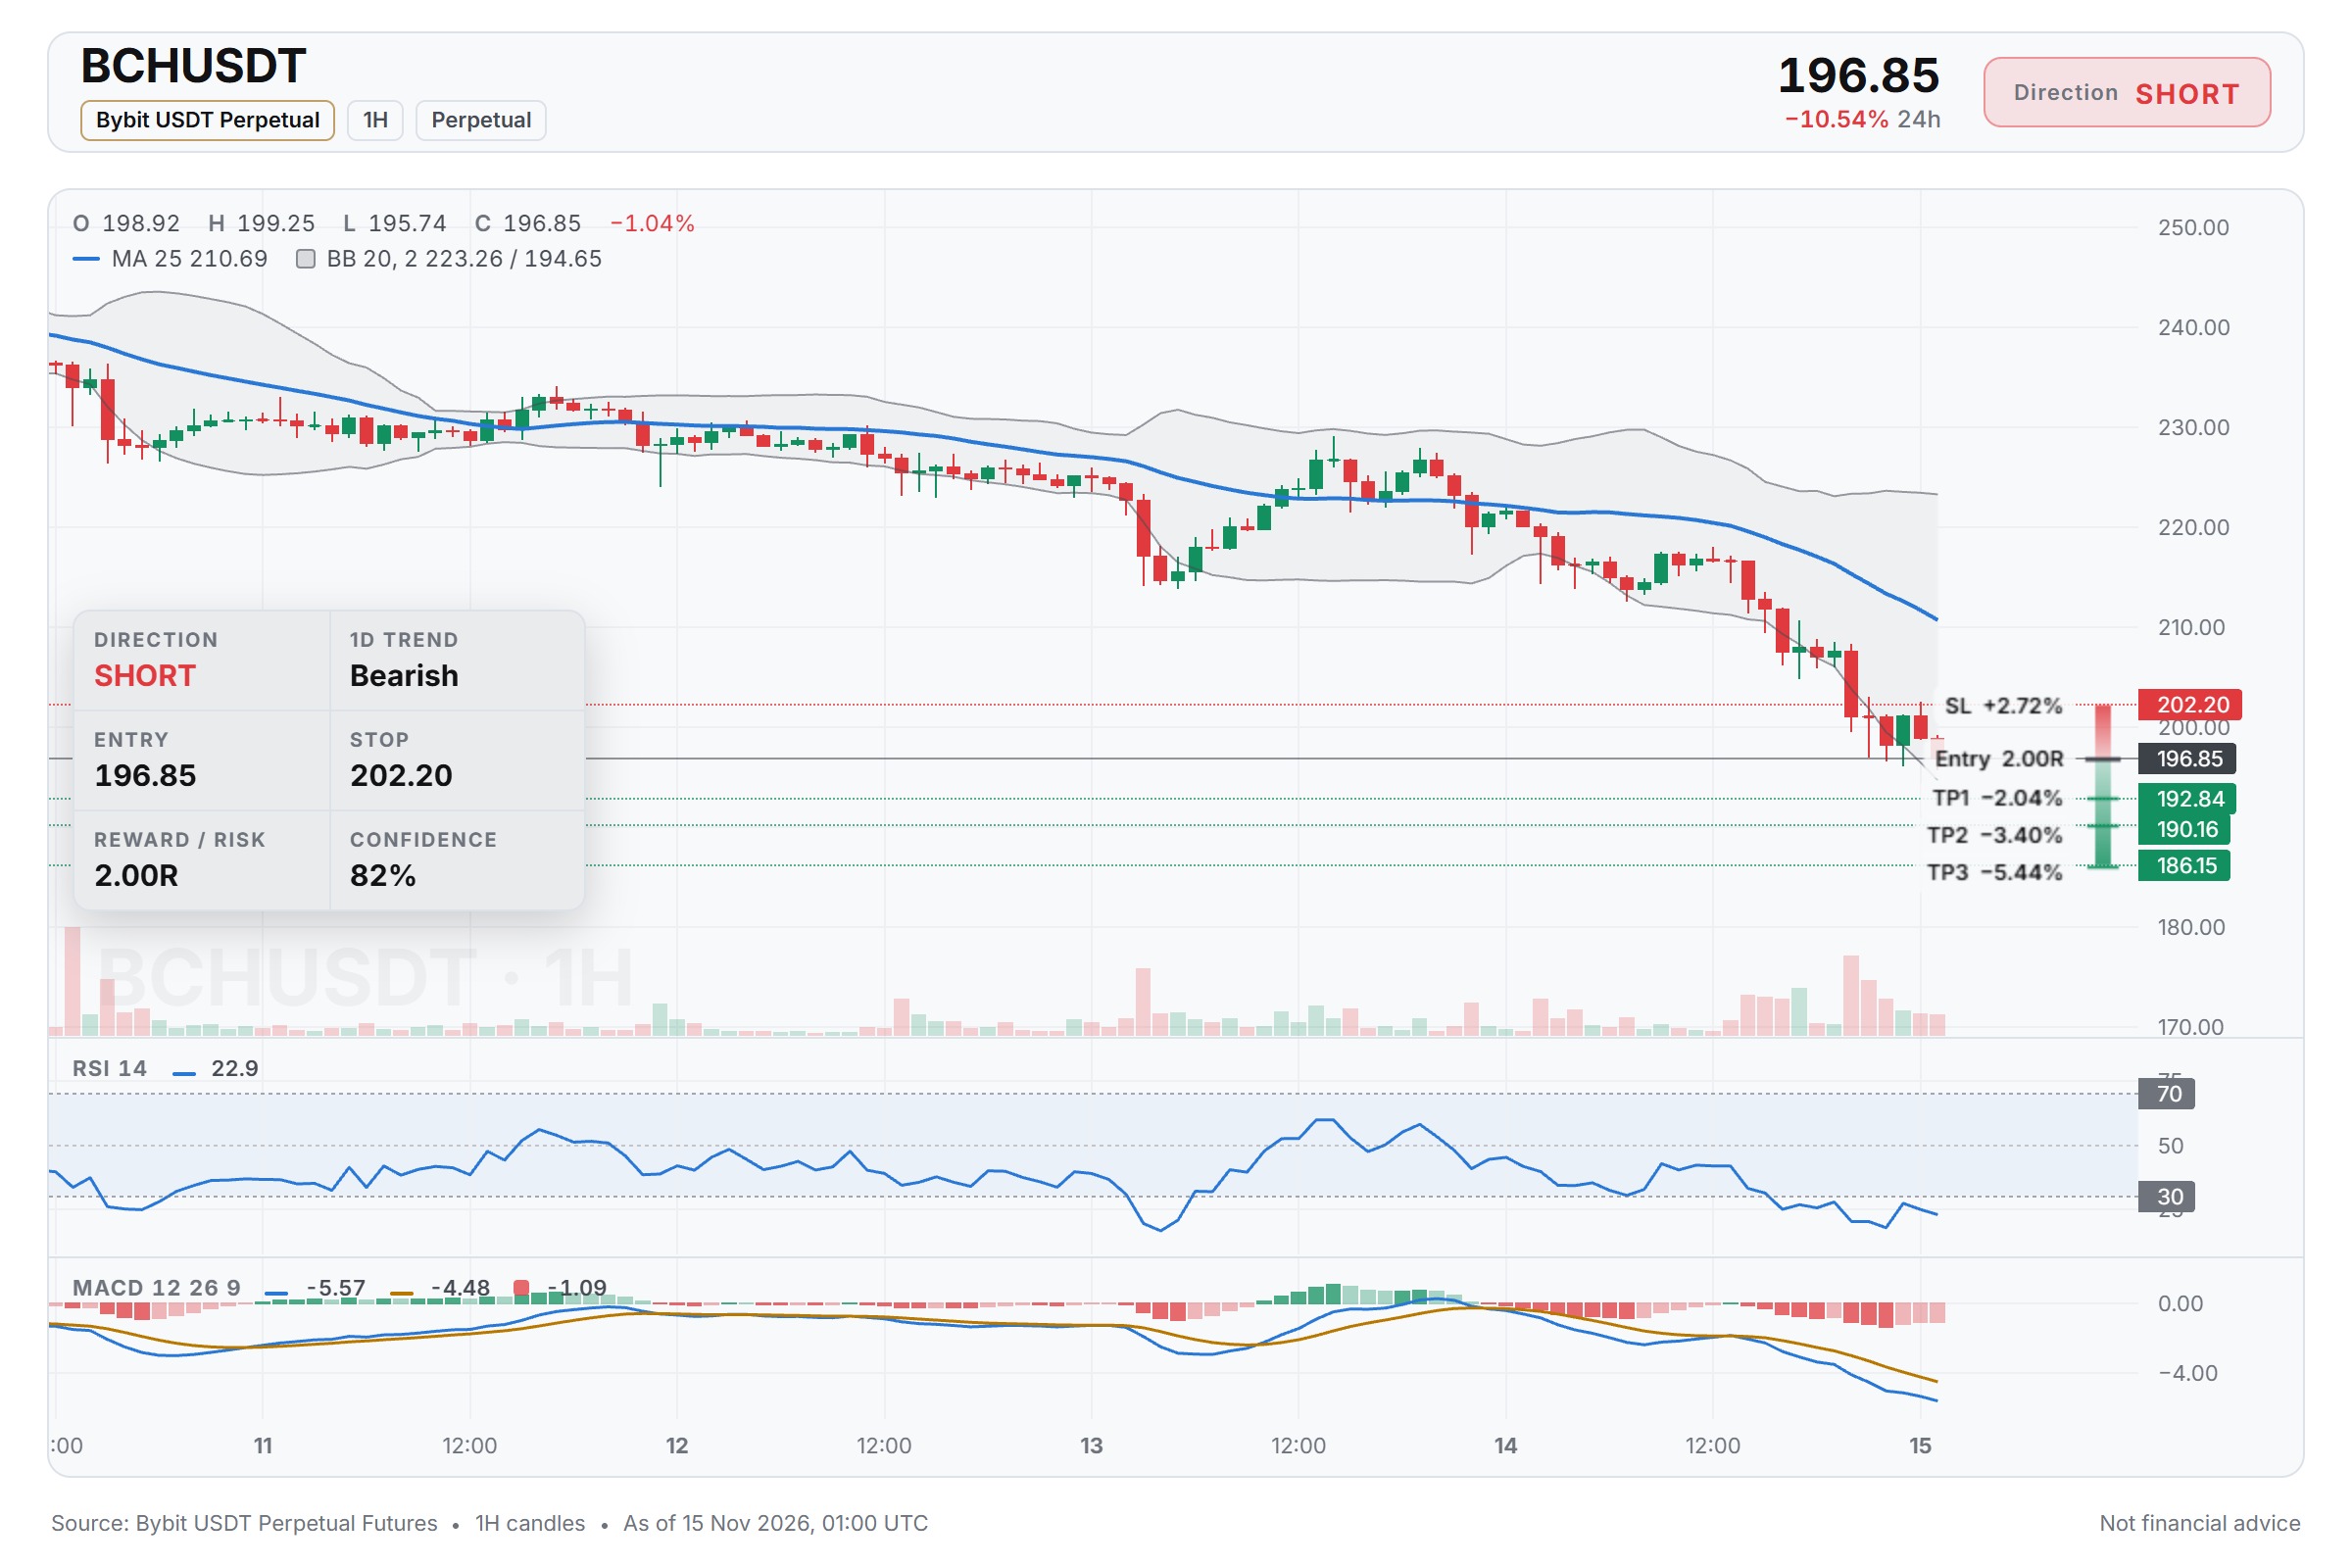
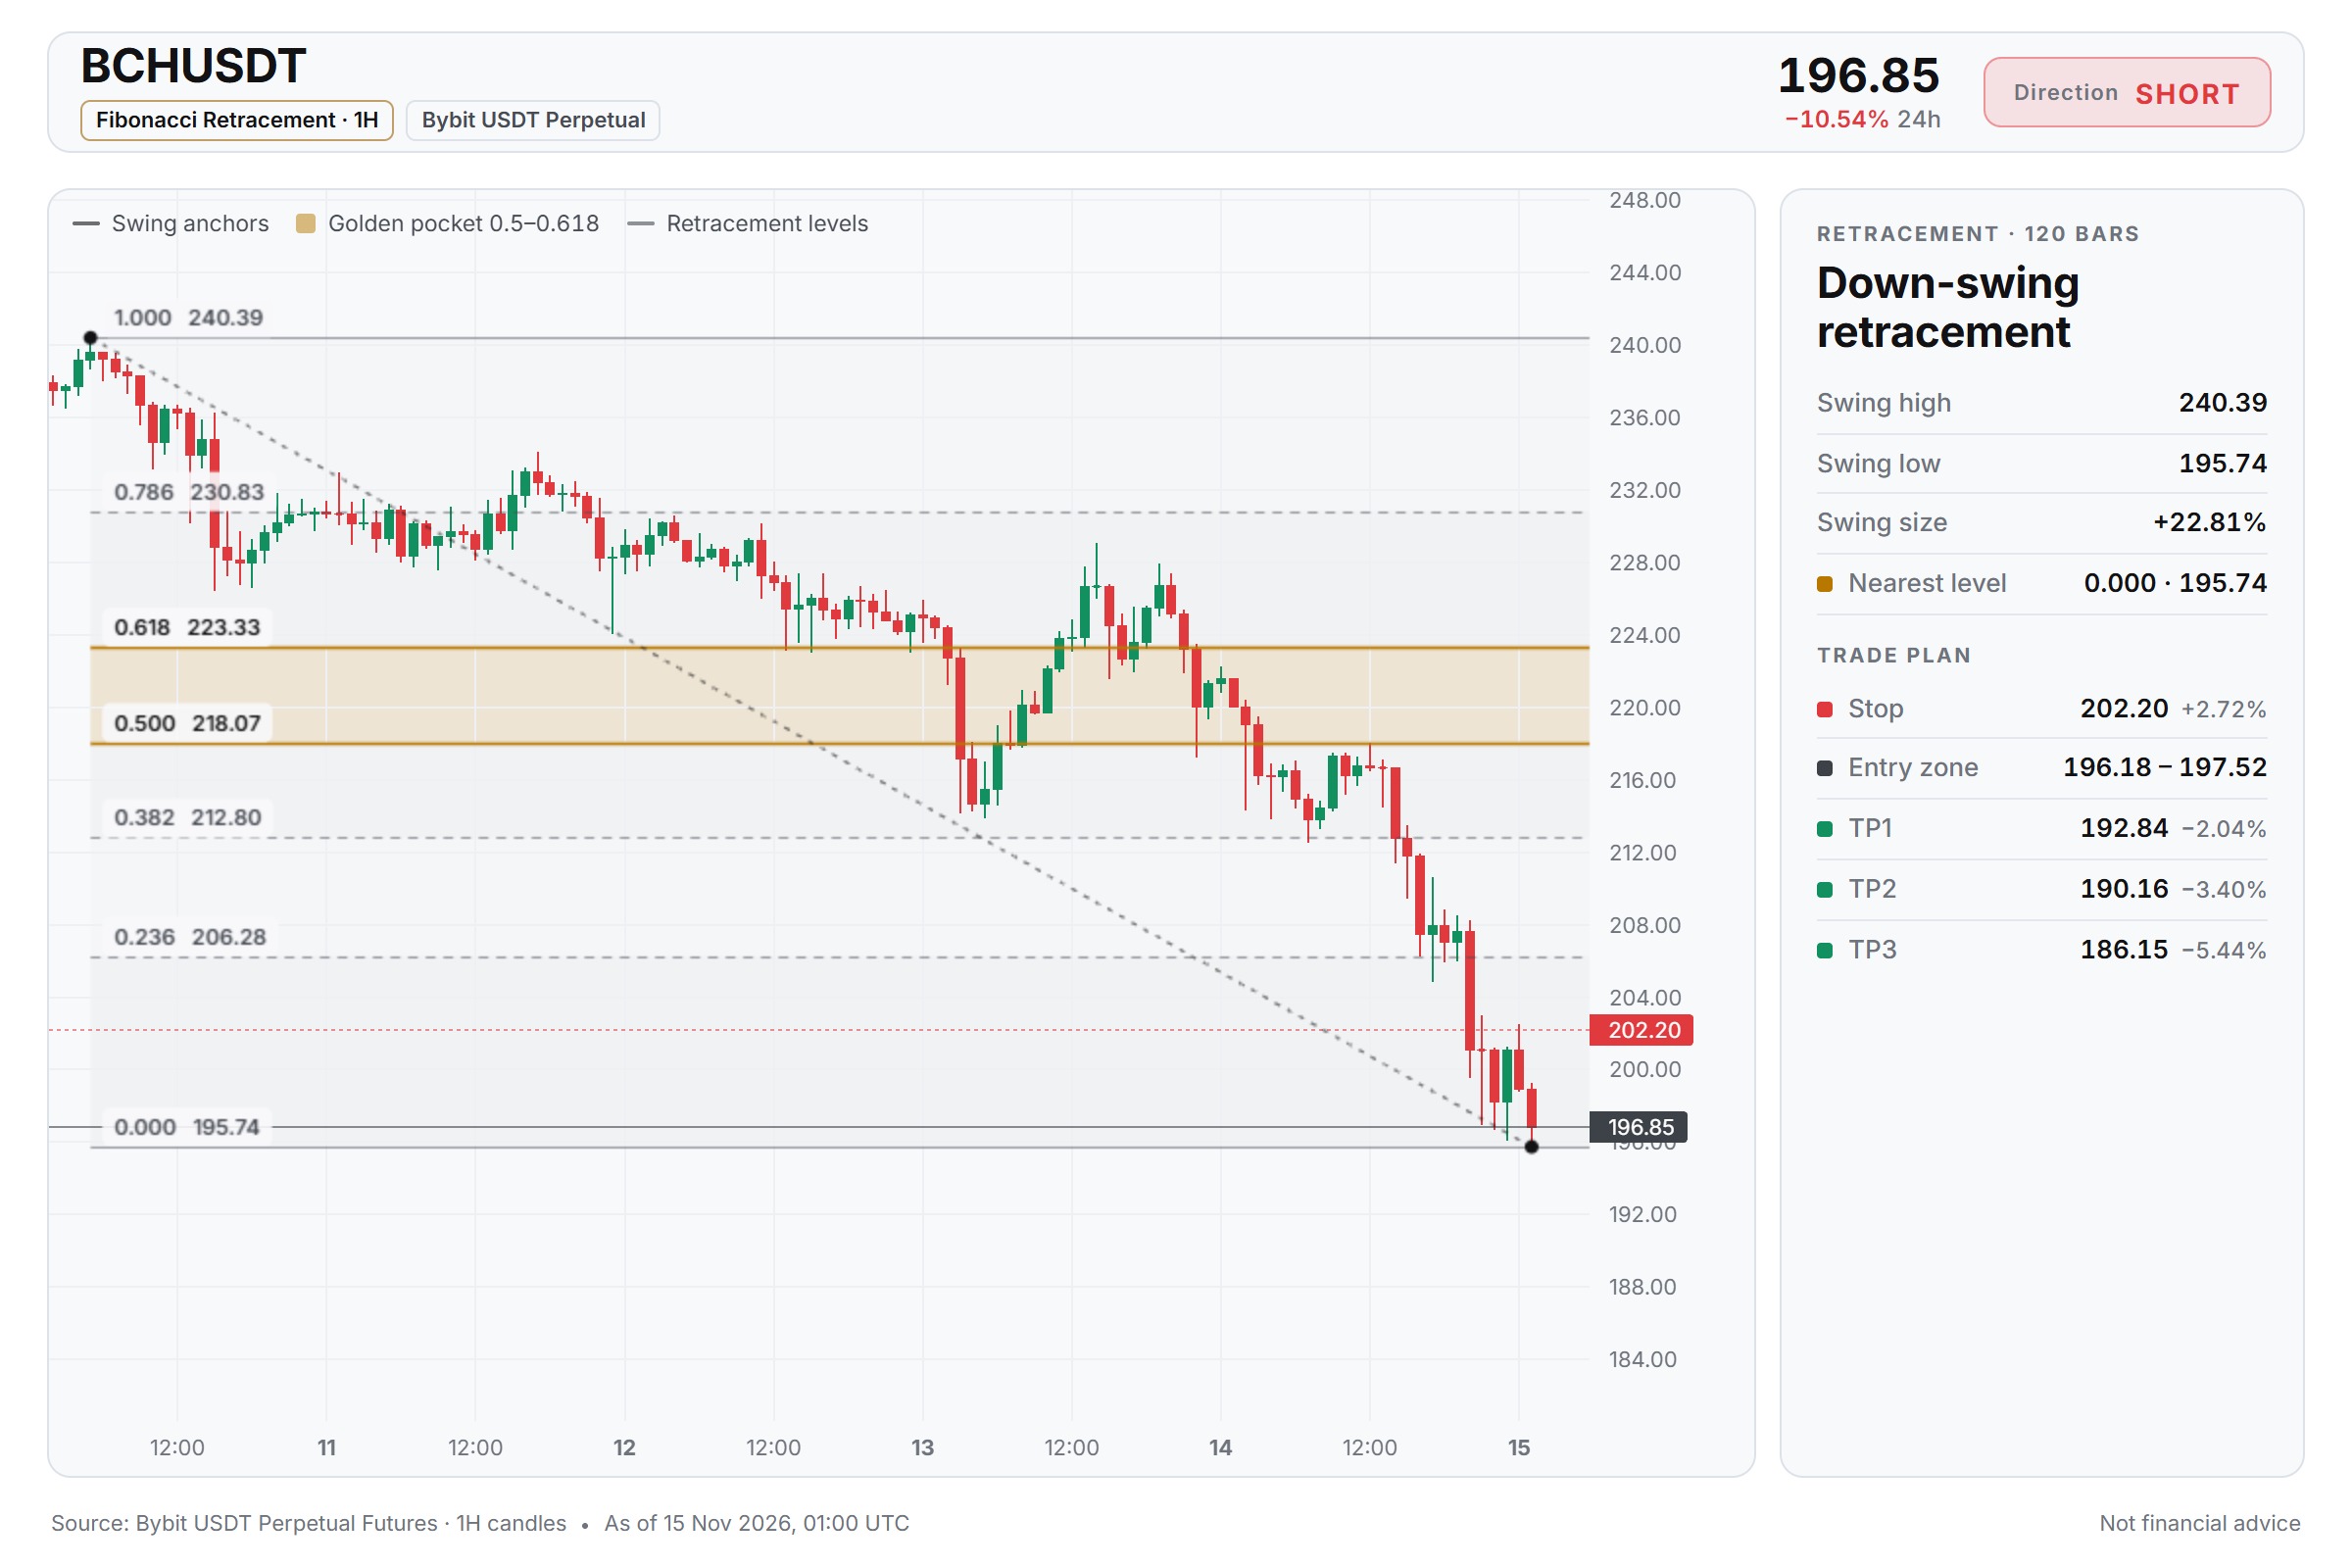
$BCH/USDT — SHORT Entry: 196.18 - 197.52 SL: 202.20 TP1: 192.84 TP2: 190.16 TP3: 186.15 BTC's bearish trend is dragging the market down, and BCH is following suit. With 15m RSI at 33.59, momentum is weakening fast but hasn't fully rolled over yet. That gap between current price and the lower targets makes this setup worth considering. Do you think this RSI level is enough for a short entry, or would you wait for a retest? ⚠️ Personal market analysis only. NFA — manage risk and DYOR. Educational content, not investment advice or a recommendation to buy, sell, deposit, or withdraw any asset. No paid promotion or referral/affiliate links.$BCHUSDT#WSOT2026 #WSOTShowYourAITradeToEarn10USDT
Configuración de short para CCU que vale la pena vigilar
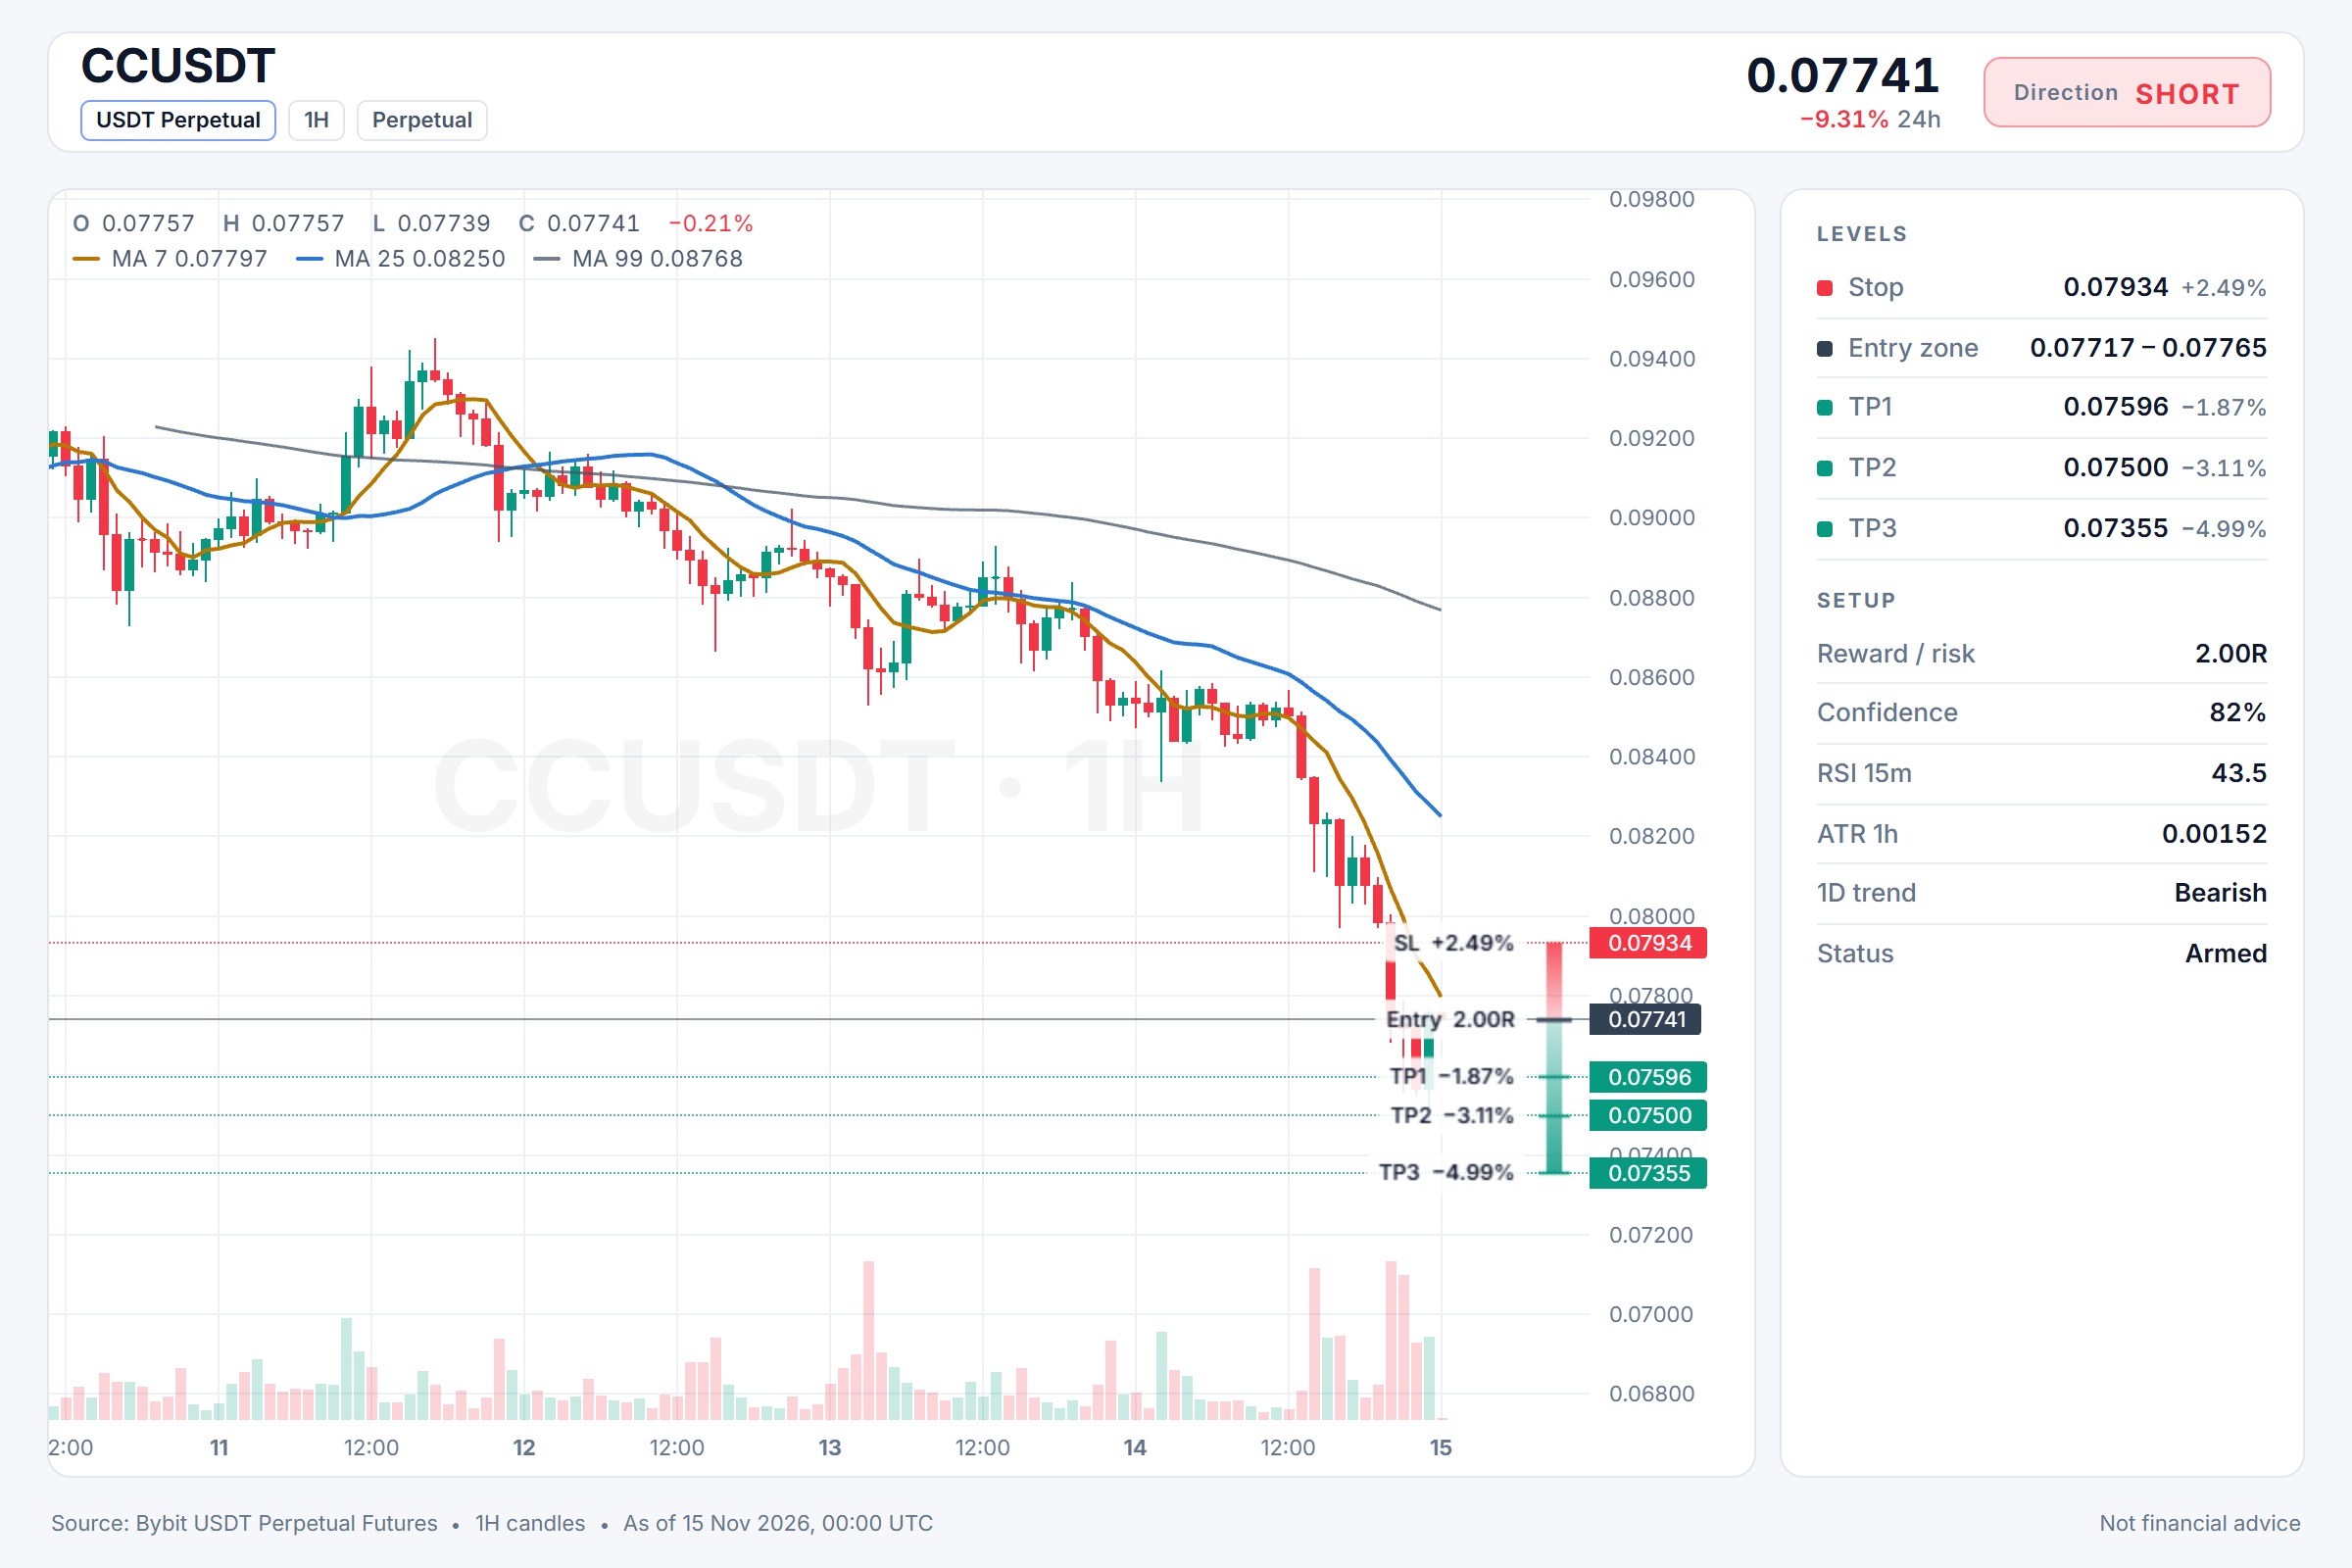
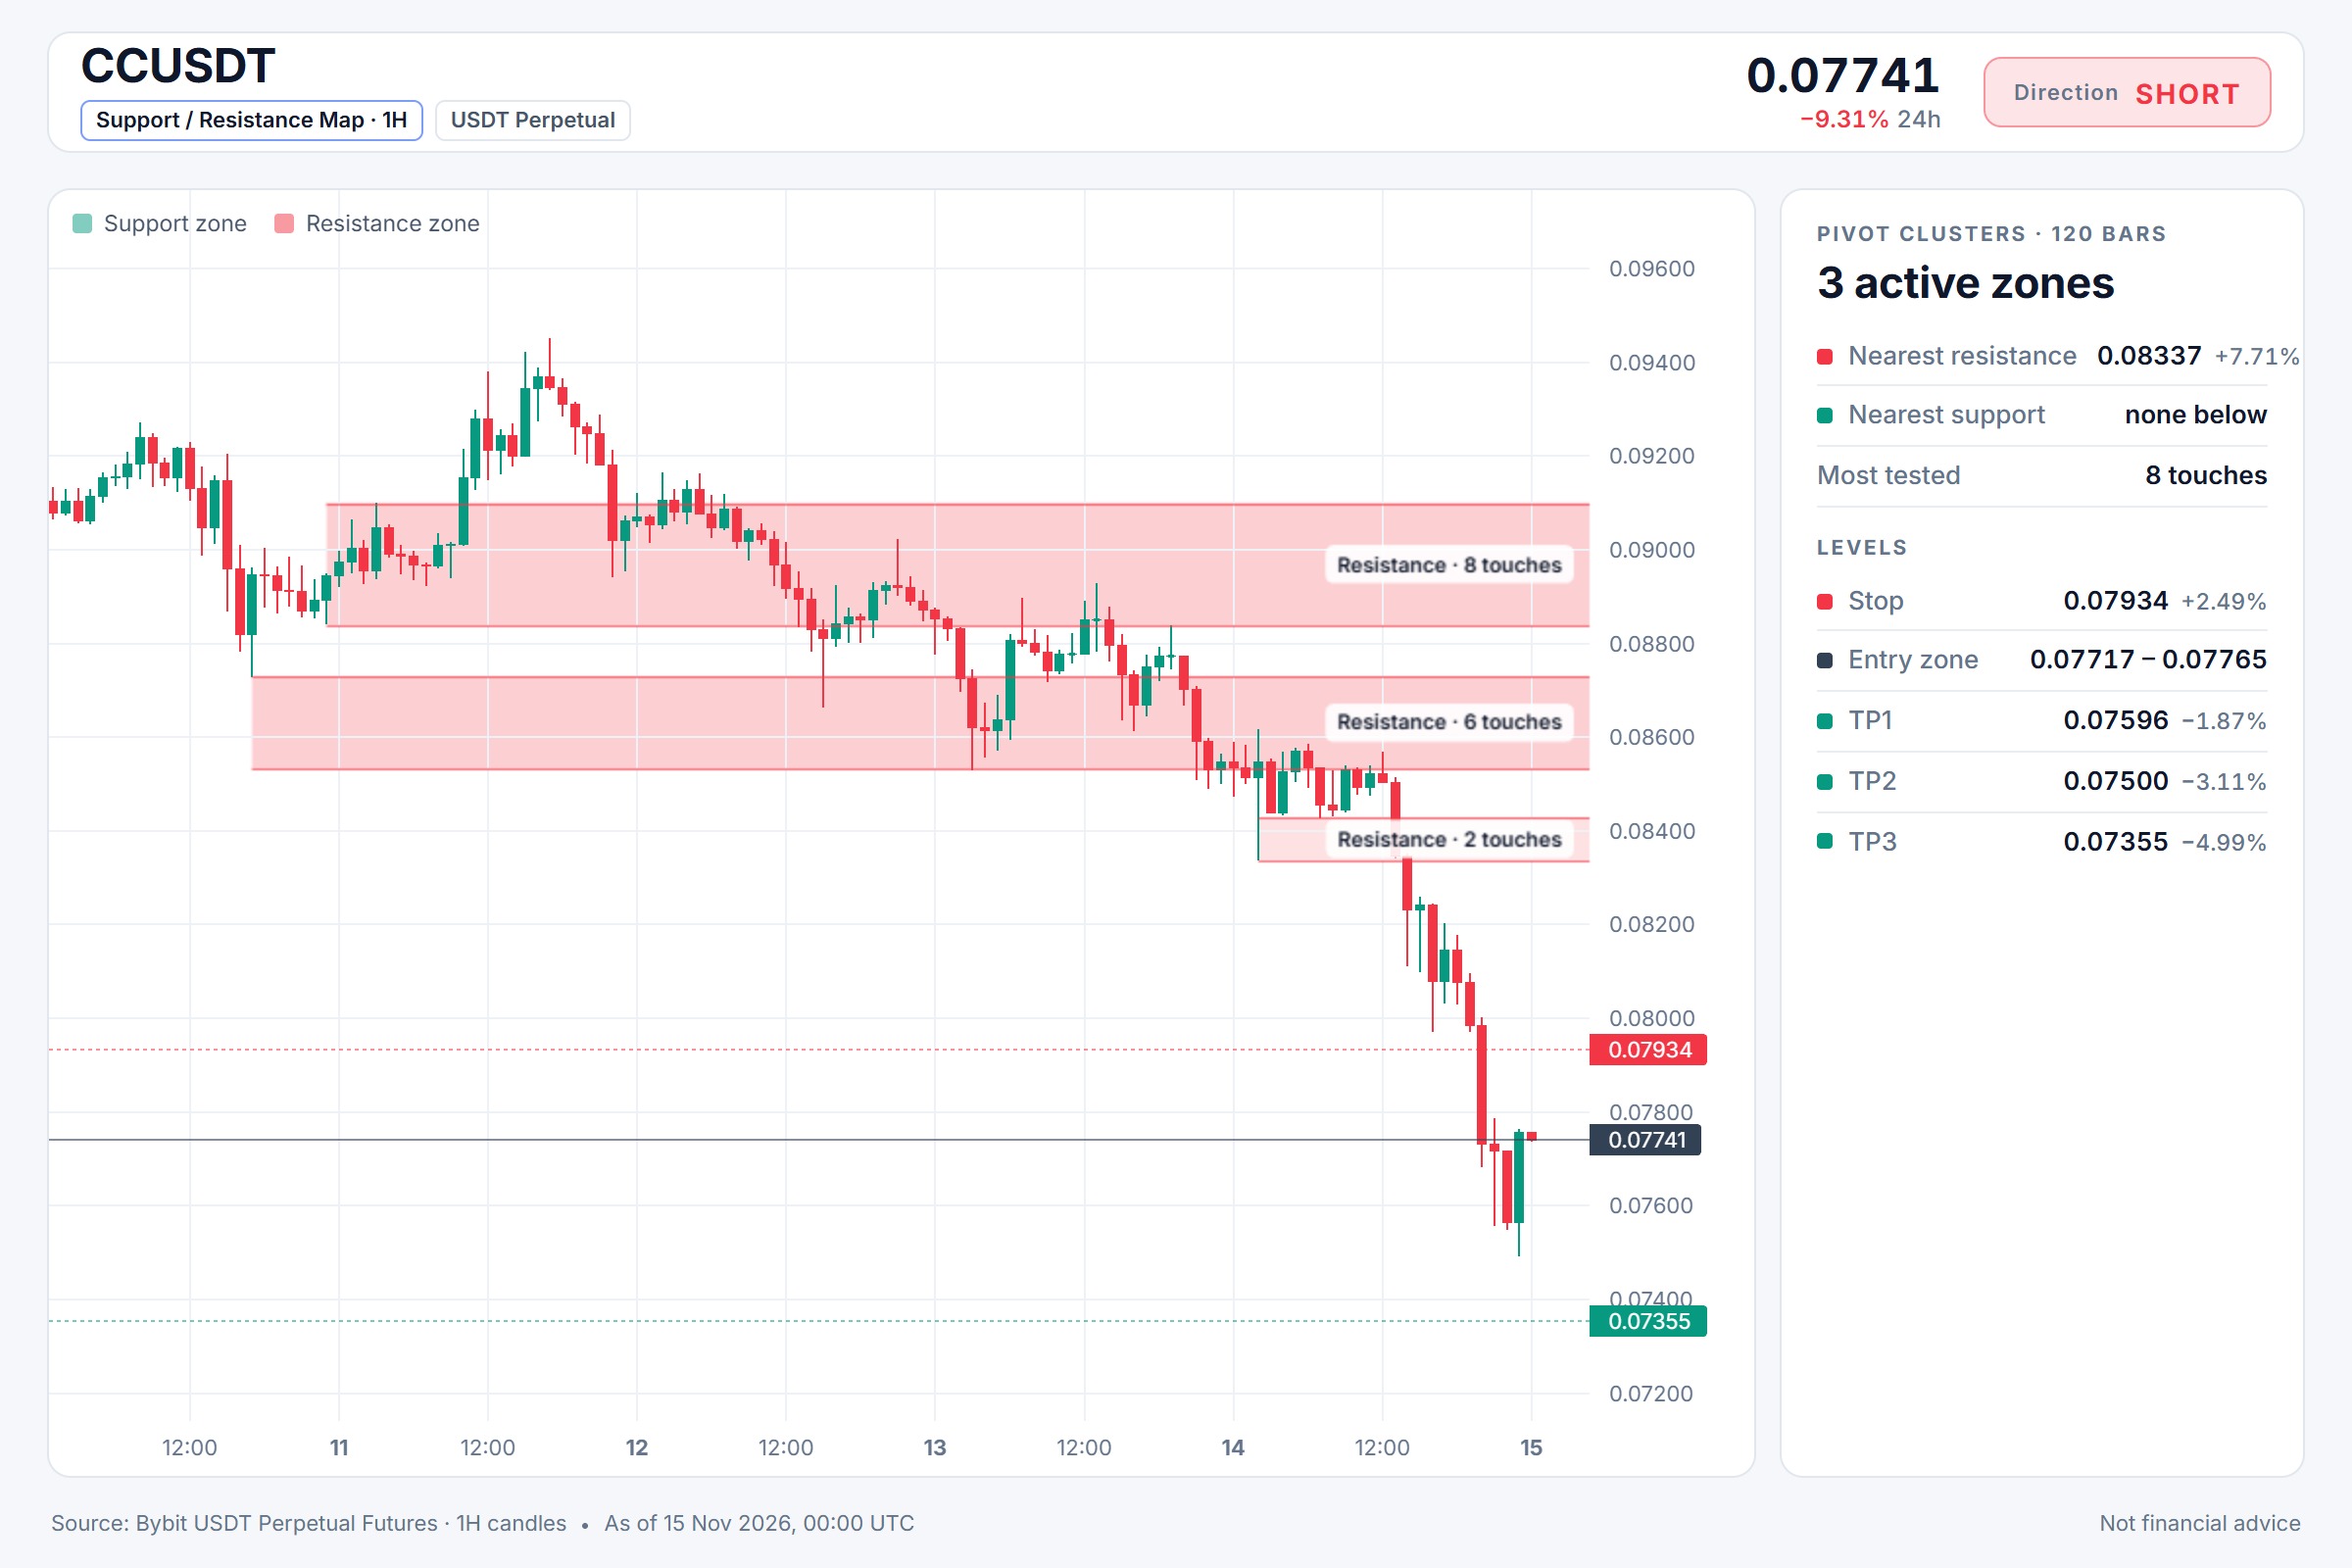
$CC/USDT — SHORT Entrada: 0.07717 - 0.07765 SL: 0.07934 TP1: 0.07596 TP2: 0.07500 TP3: 0.07355 BTC tiene una tendencia bajista y CCU se encuentra en 0.07741 con un RSI de 15m en 43.52; todavía está por debajo del nivel neutral, pero aún no está sobrevendido. Esto significa que el impulso podría inclinarse más hacia la baja antes de que los compradores entren en acción. Estoy buscando entrar alrededor de 0.07717 a 0.07765, manteniendo el riesgo controlado con un nivel de invalidación en 0.07934. El primer objetivo es 0.07500, y si la presión de venta continúa, 0.07355 se convierte en la jugada extendida. ¿Crees que CCU tiene suficiente impulso bajista para alcanzar los 0.07355, o te saldrías después del primer take-profit? ⚠️ Solo análisis de mercado personal. NFA (No es asesoramiento financiero): gestiona tu riesgo y haz tu propia investigación (DYOR). Contenido educativo, no es asesoramiento de inversión ni una recomendación para comprar, vender, depositar o retirar ningún activo. Sin promoción pagada ni enlaces de referencia/afiliados.$CCUSDT#WSOT2026 #WSOTMuestraTuOperaciónIAParaGanar10USDT
El RSI de JTO señala un mayor riesgo de caída
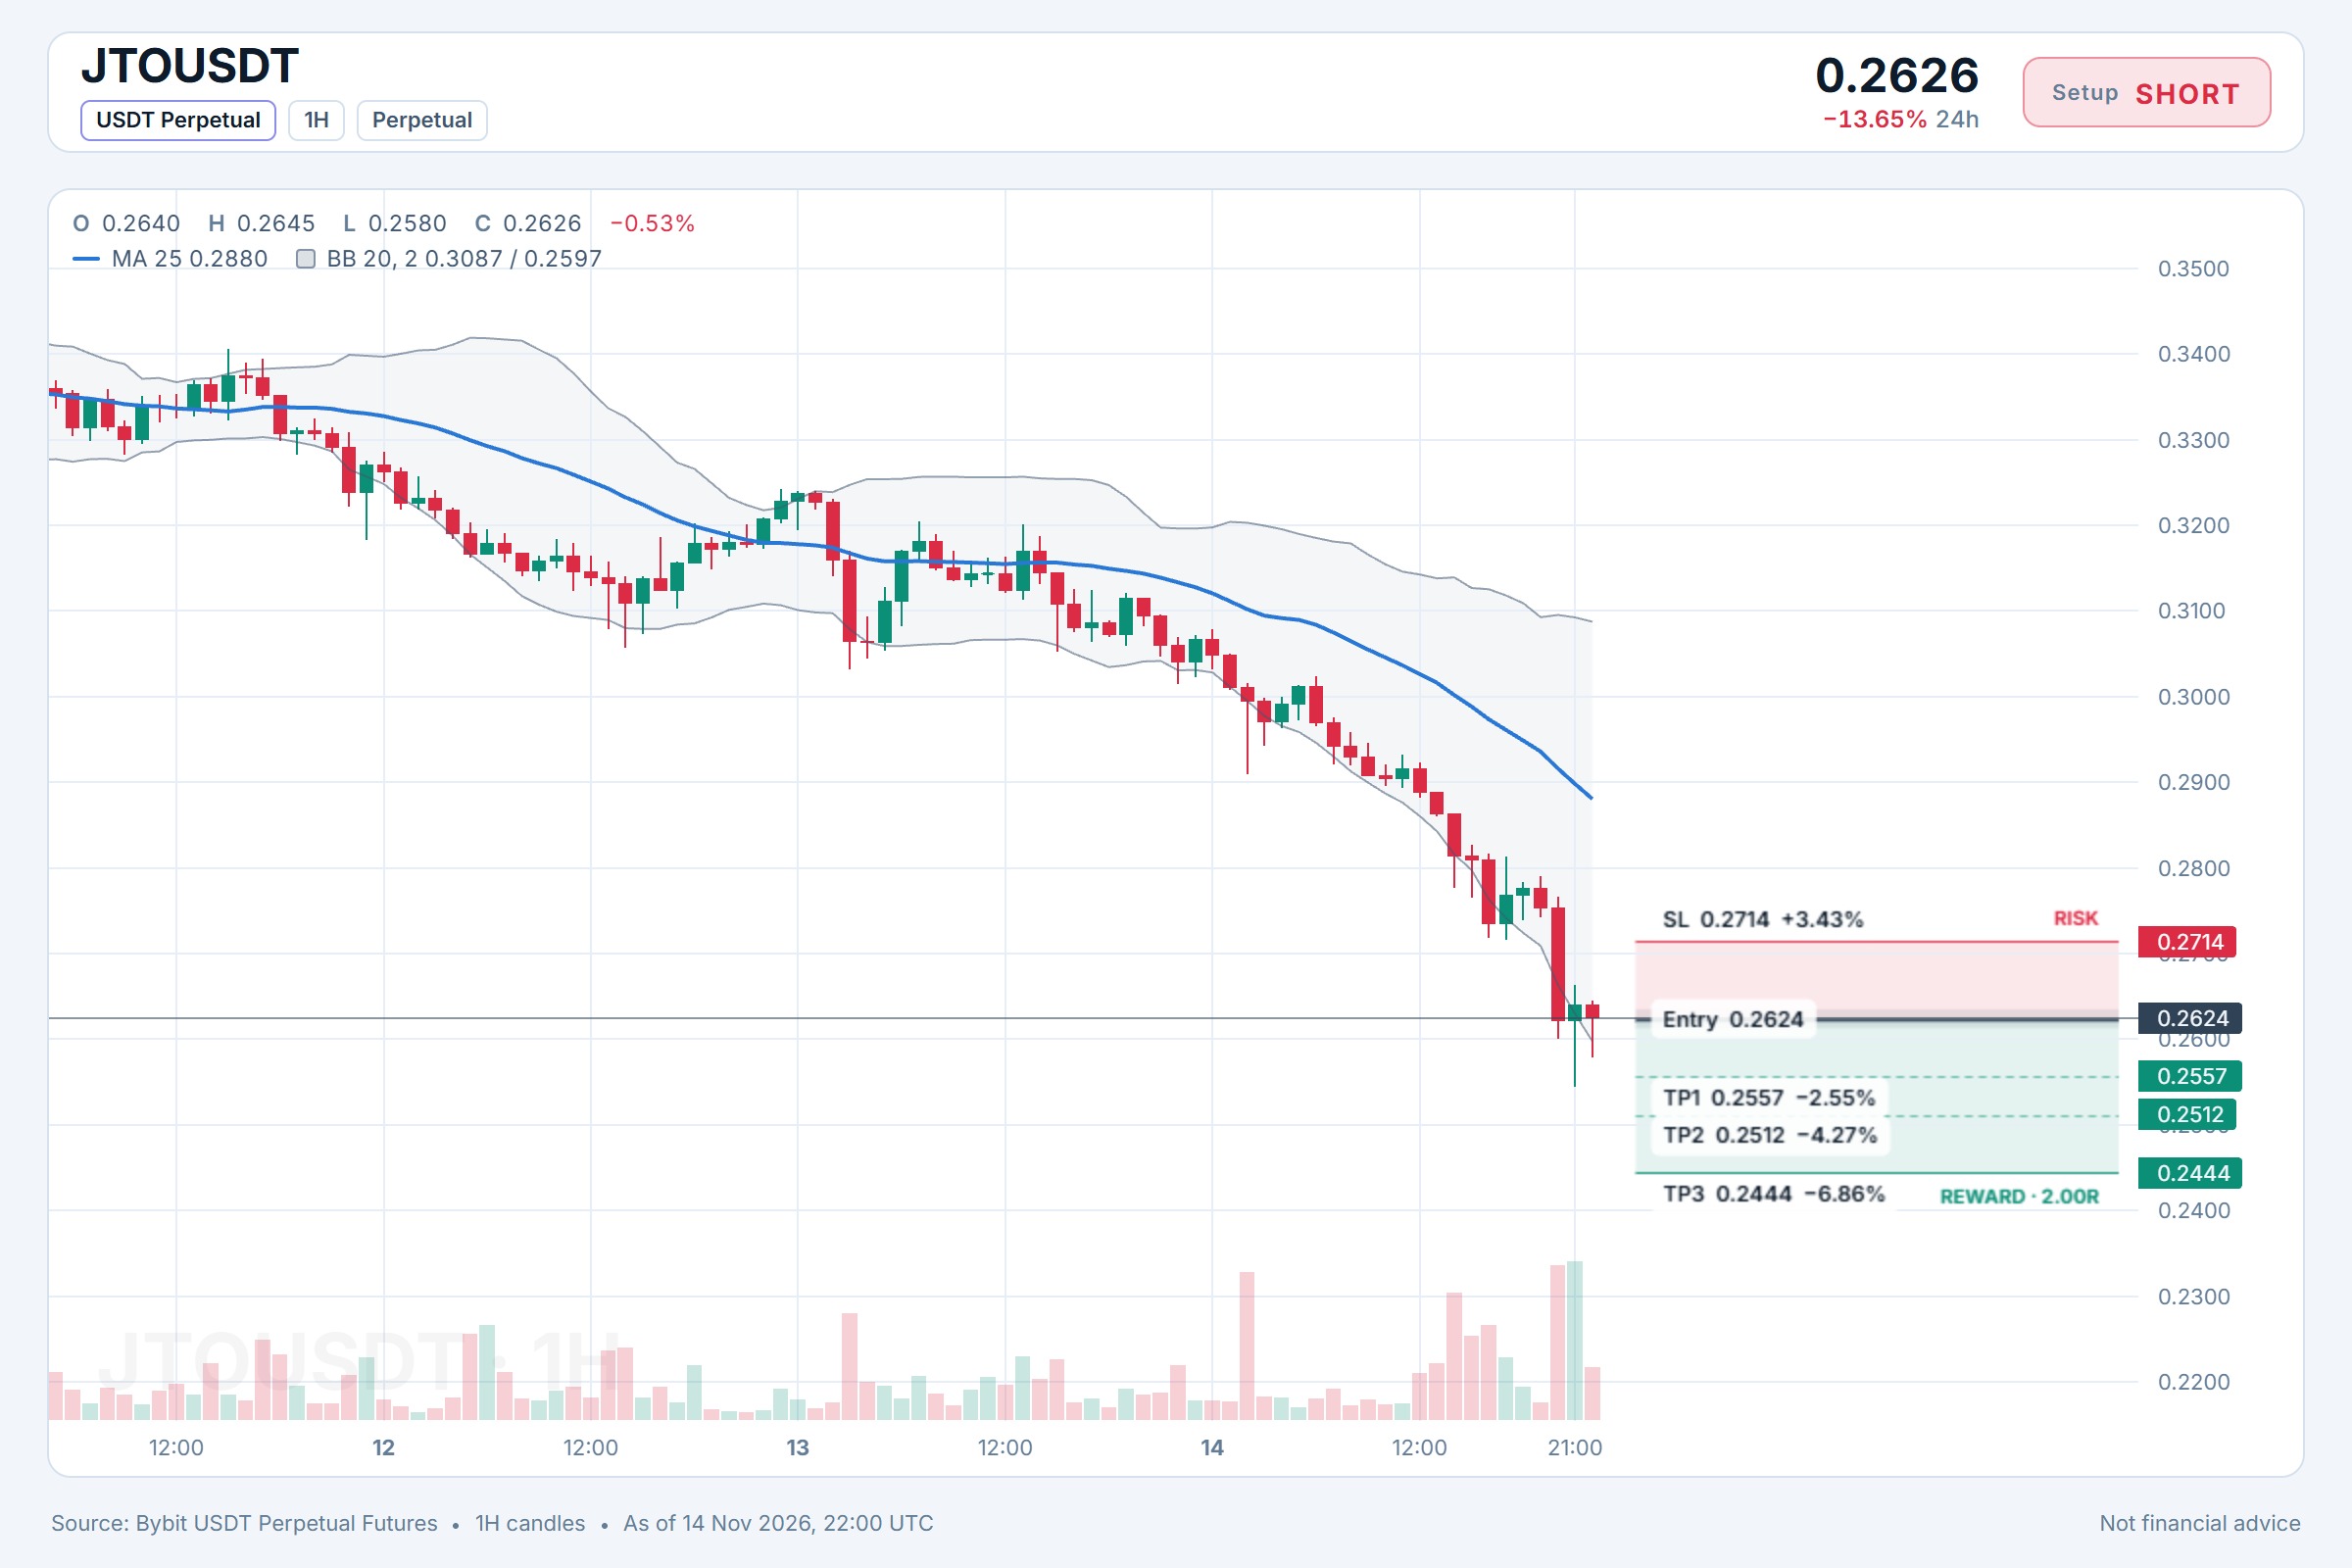
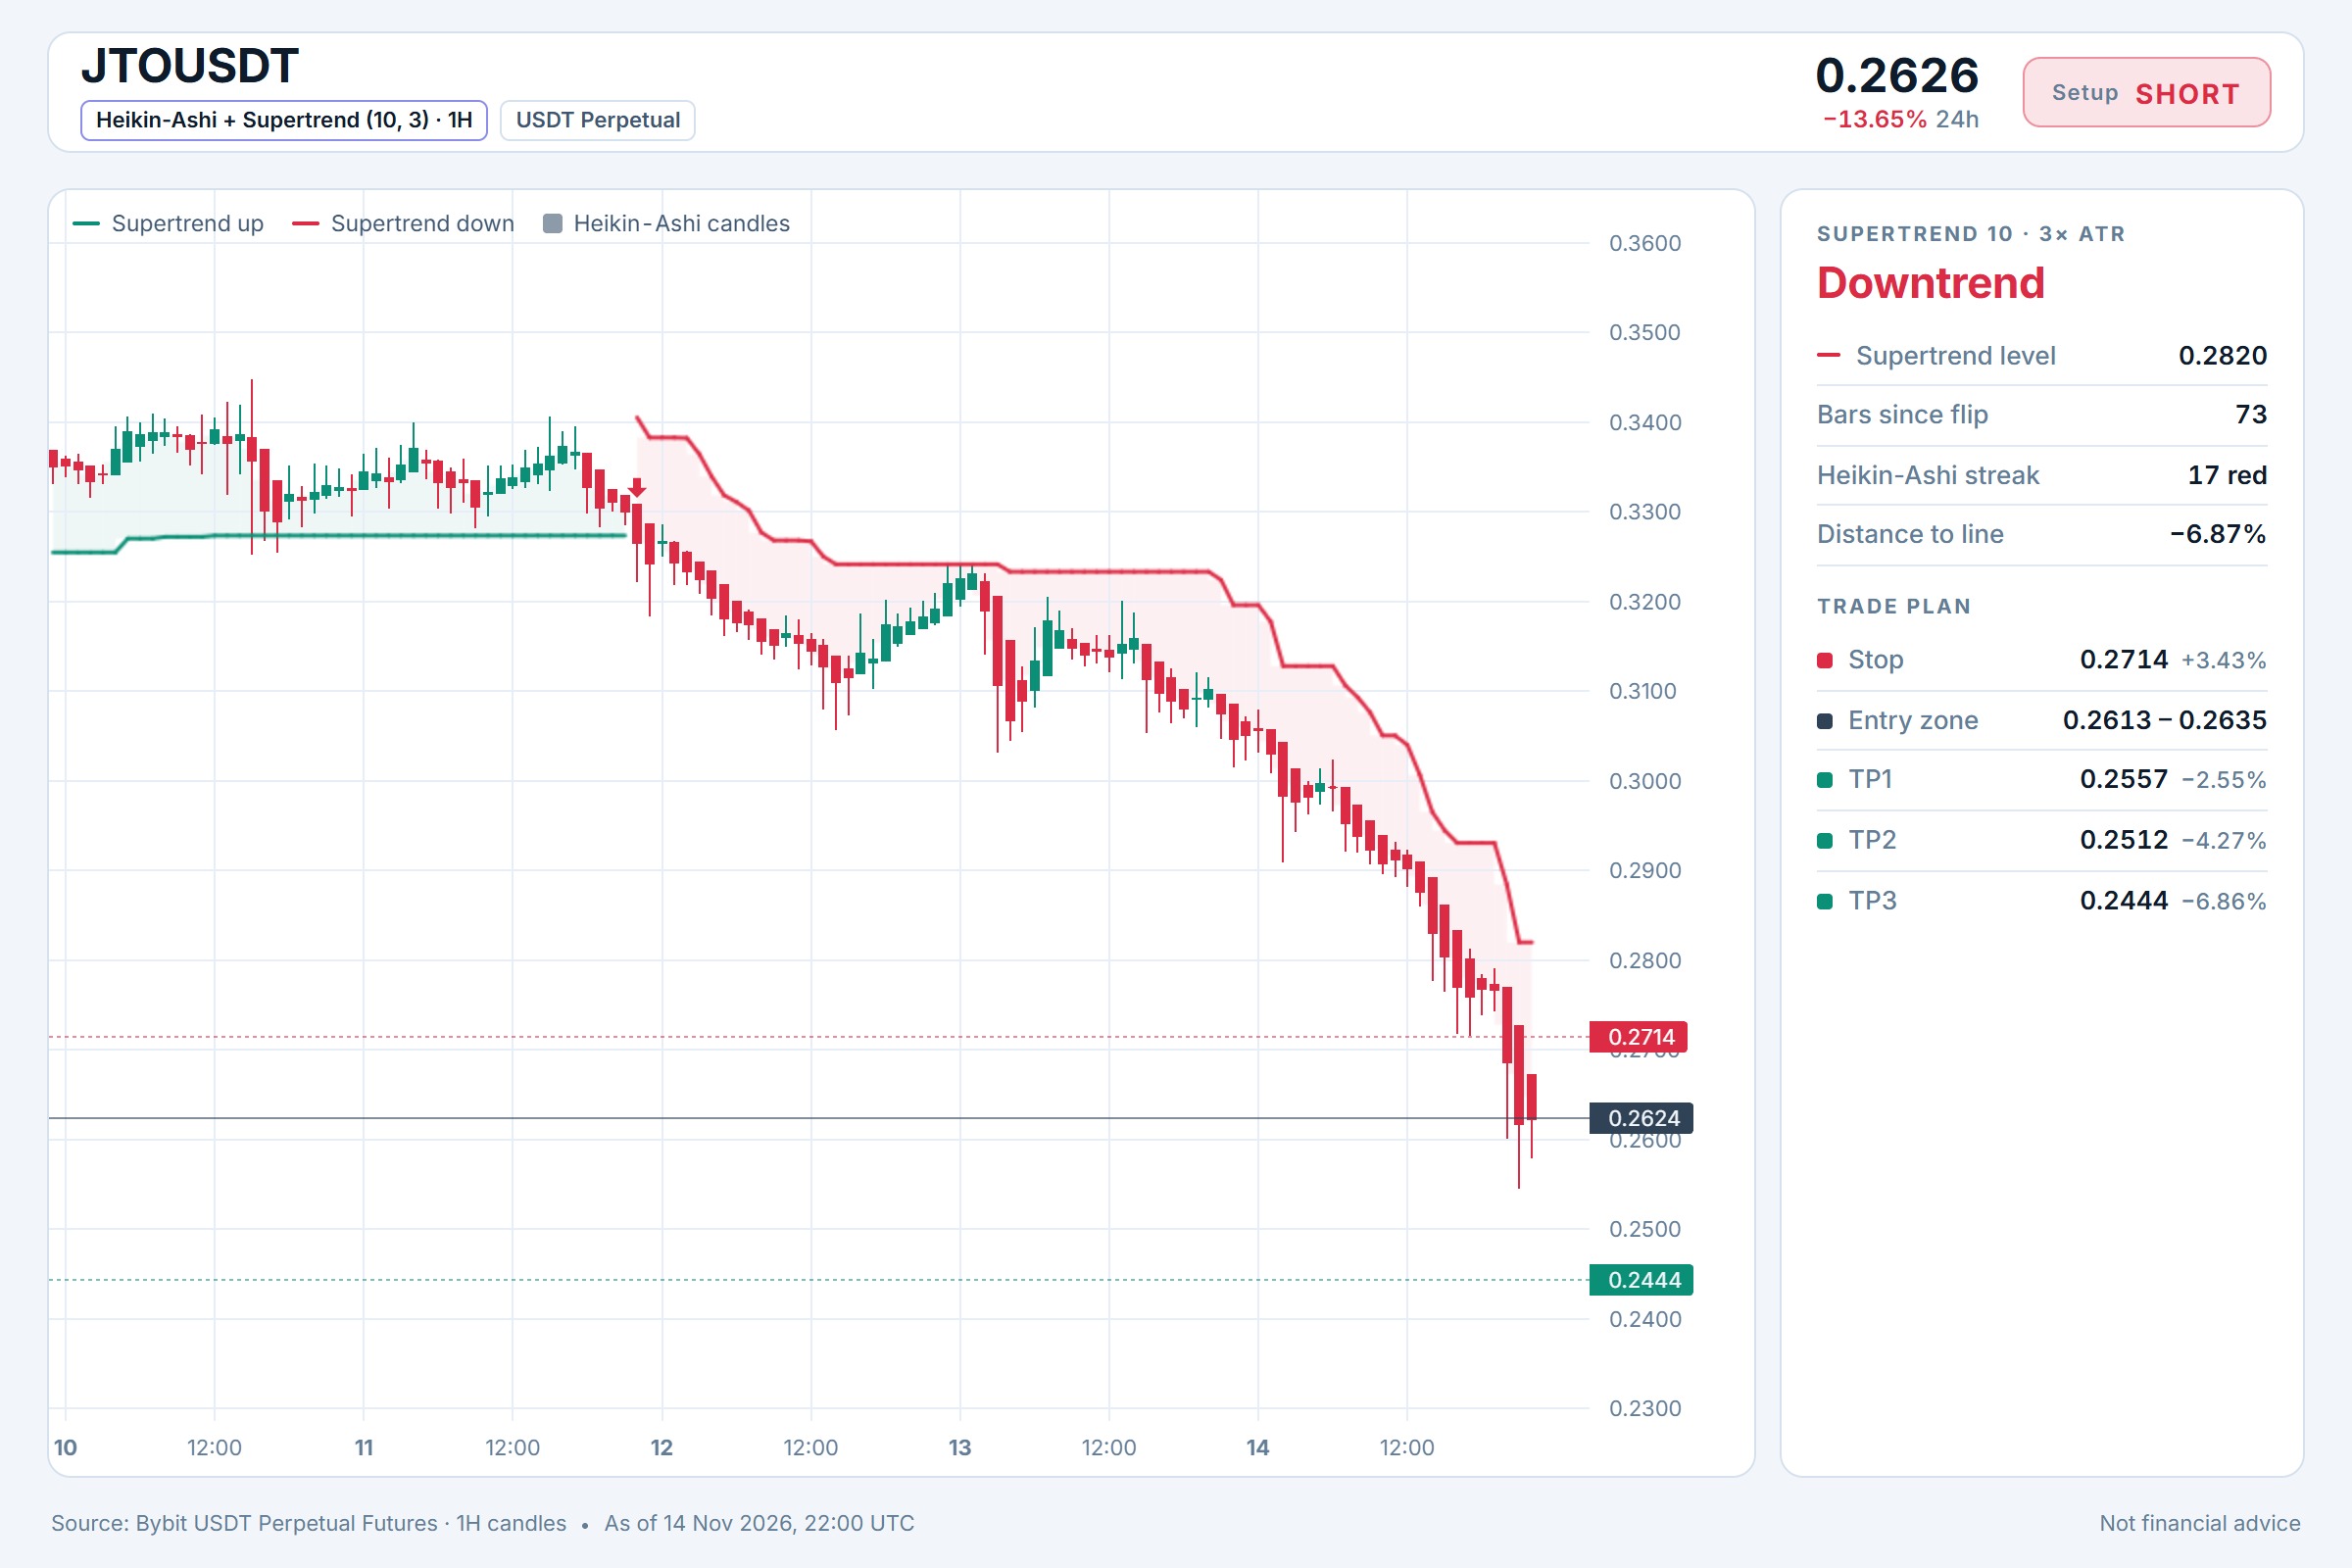
$JTO/USDT — CORTO Entrada: 0.2613 - 0.2635 SL: 0.2714 TP1: 0.2557 TP2: 0.2512 TP3: 0.2444 Estoy vigilando $JTO/USDT de cerca ya que la tendencia de BTC sigue bajista, arrastrando a la mayoría de las altcoins hacia abajo. El RSI de 15m en 32.87 me indica que la presión de venta aún no ha cedido por completo y el momentum sigue favoreciendo a los vendedores. El precio está rondando cerca de un clúster de resistencia local, lo que podría ofrecer una entrada clara para cortos si los compradores no logran defender esta zona. ¿Crees que JTO vuelva a visitar los 0.2444 o encontrará un piso y revertirá al alza primero? ⚠️ Solo análisis de mercado personal. NFA (no es consejo financiero) — gestiona tu riesgo y haz tu propia investigación (DYOR). Contenido educativo, no es consejo de inversión ni una recomendación para comprar, vender, depositar o retirar ningún activo. Sin promociones pagadas ni enlaces de referidos/afiliados.$JTOUSDT#WSOT2026 #WSOTMuestraTuOperaciónIAParaGanar10USDT
$HMSTR Tests Bearish BTC Alignment at 0.000137
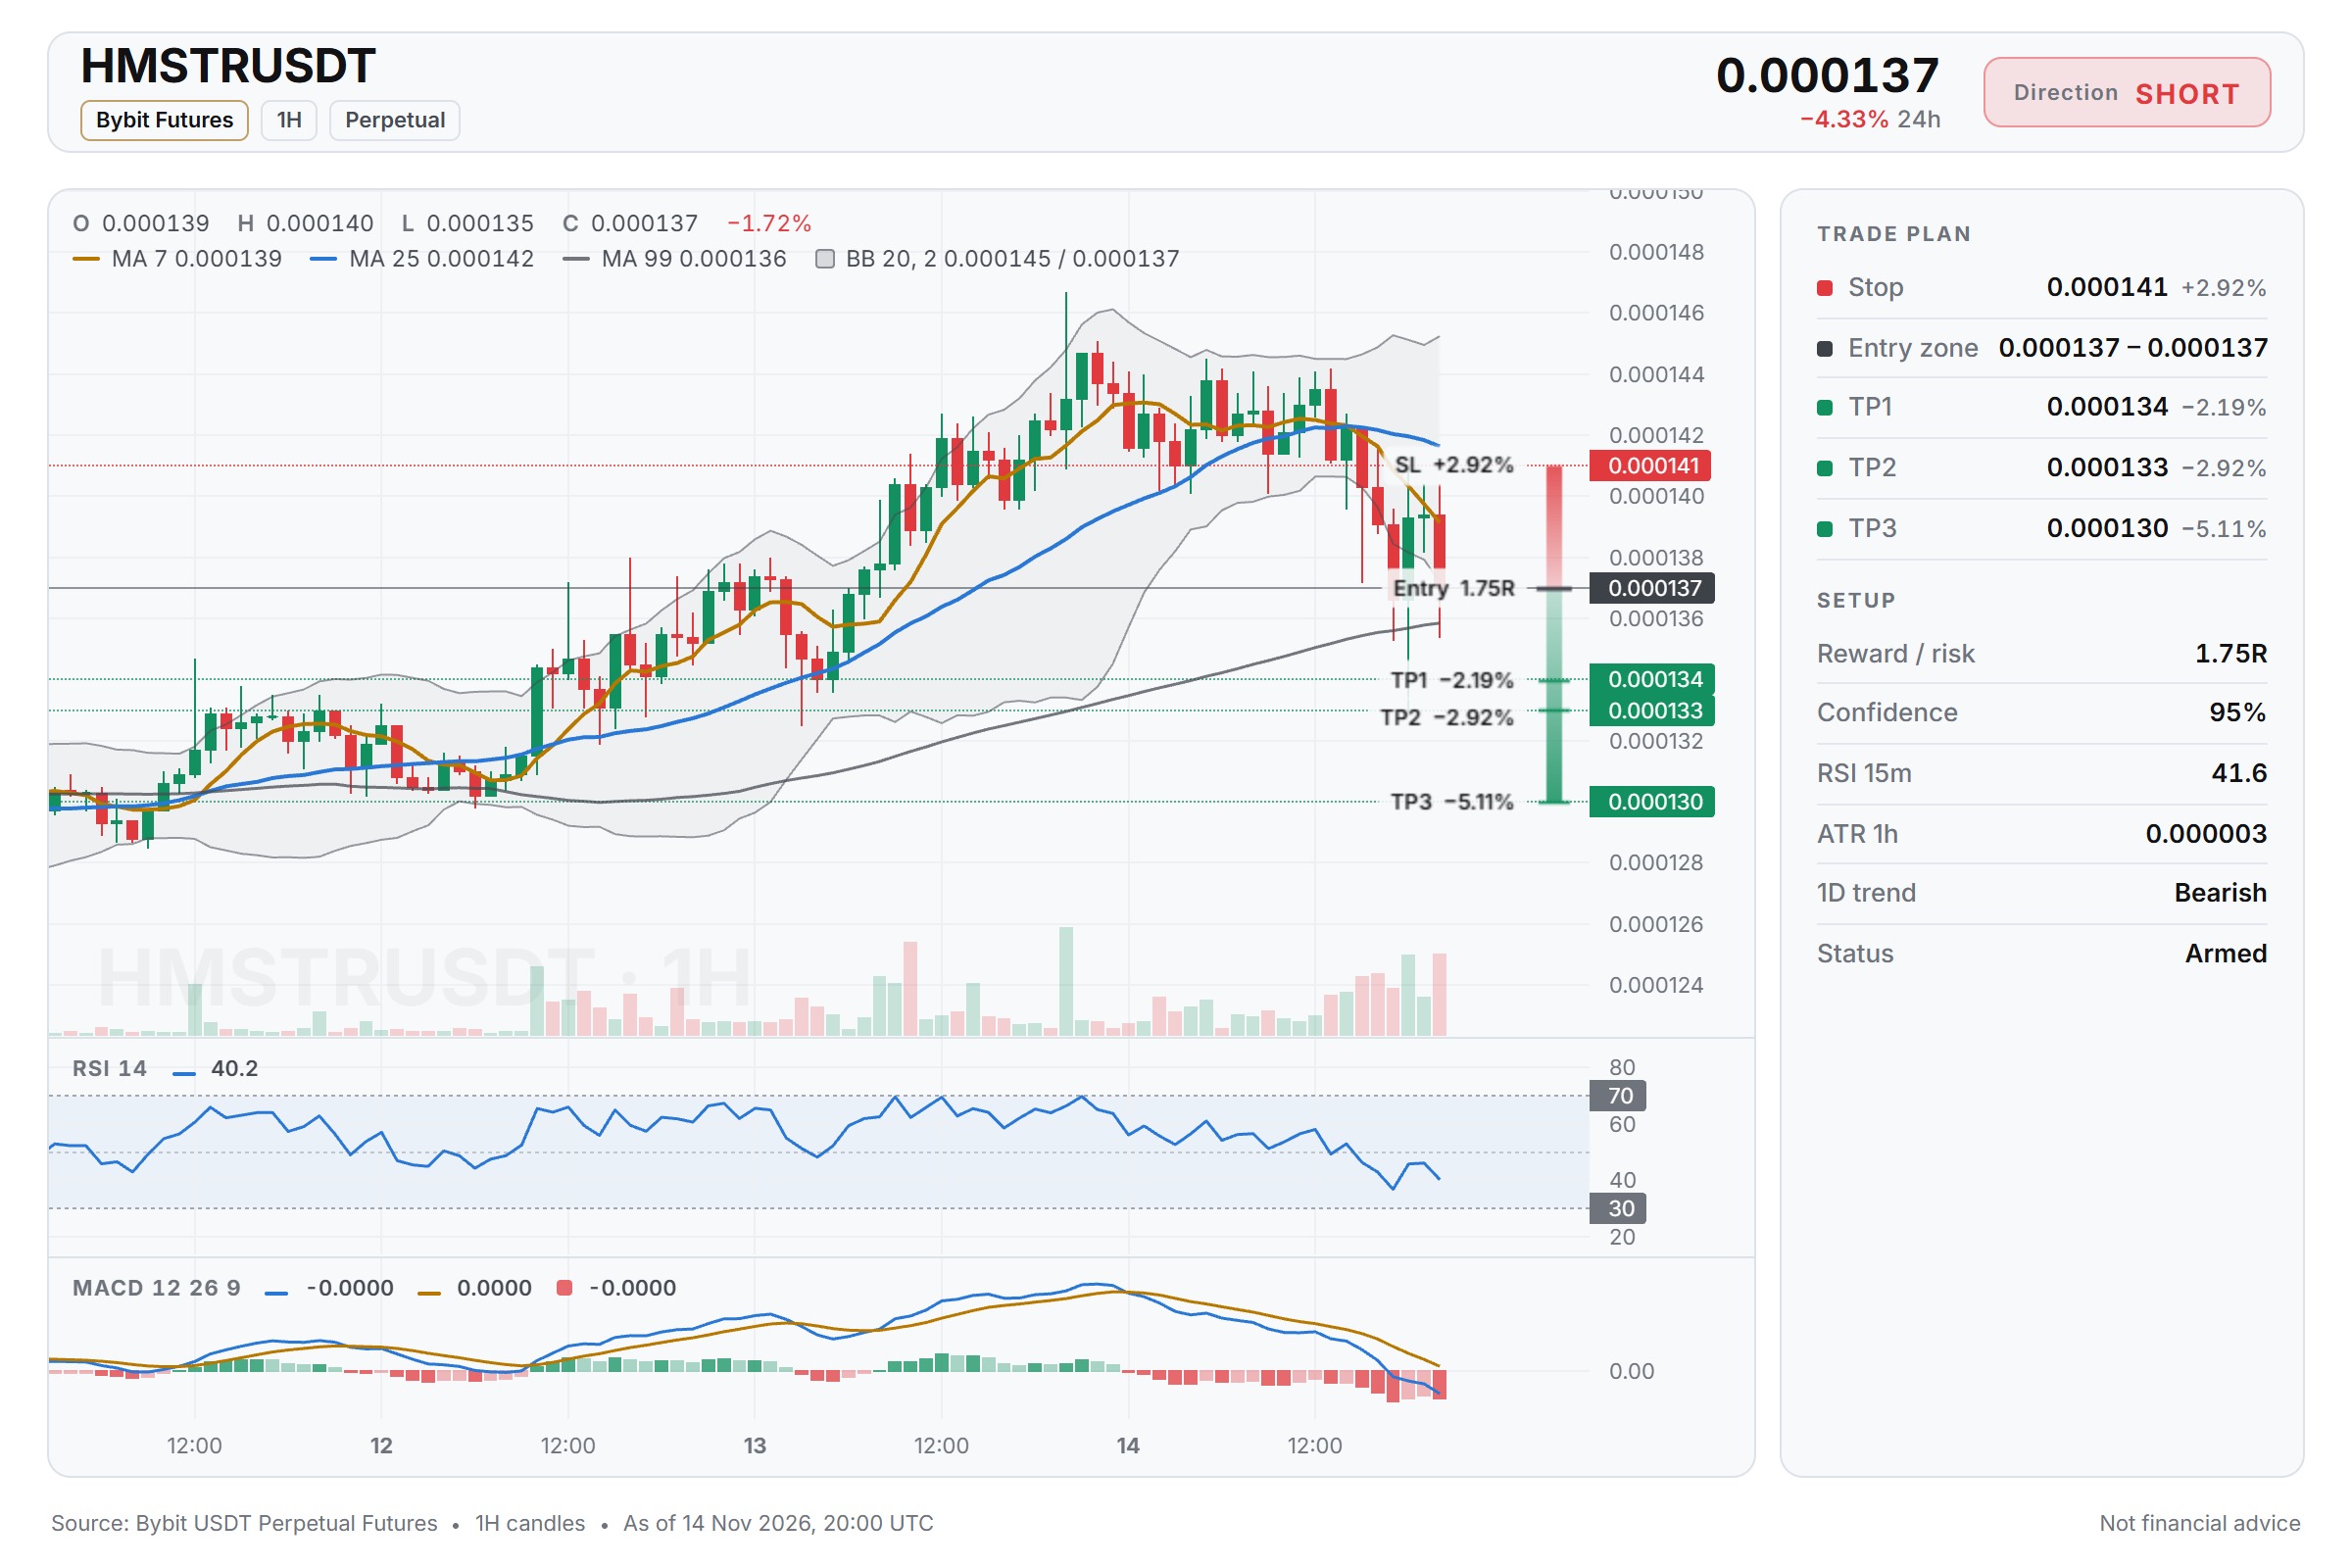
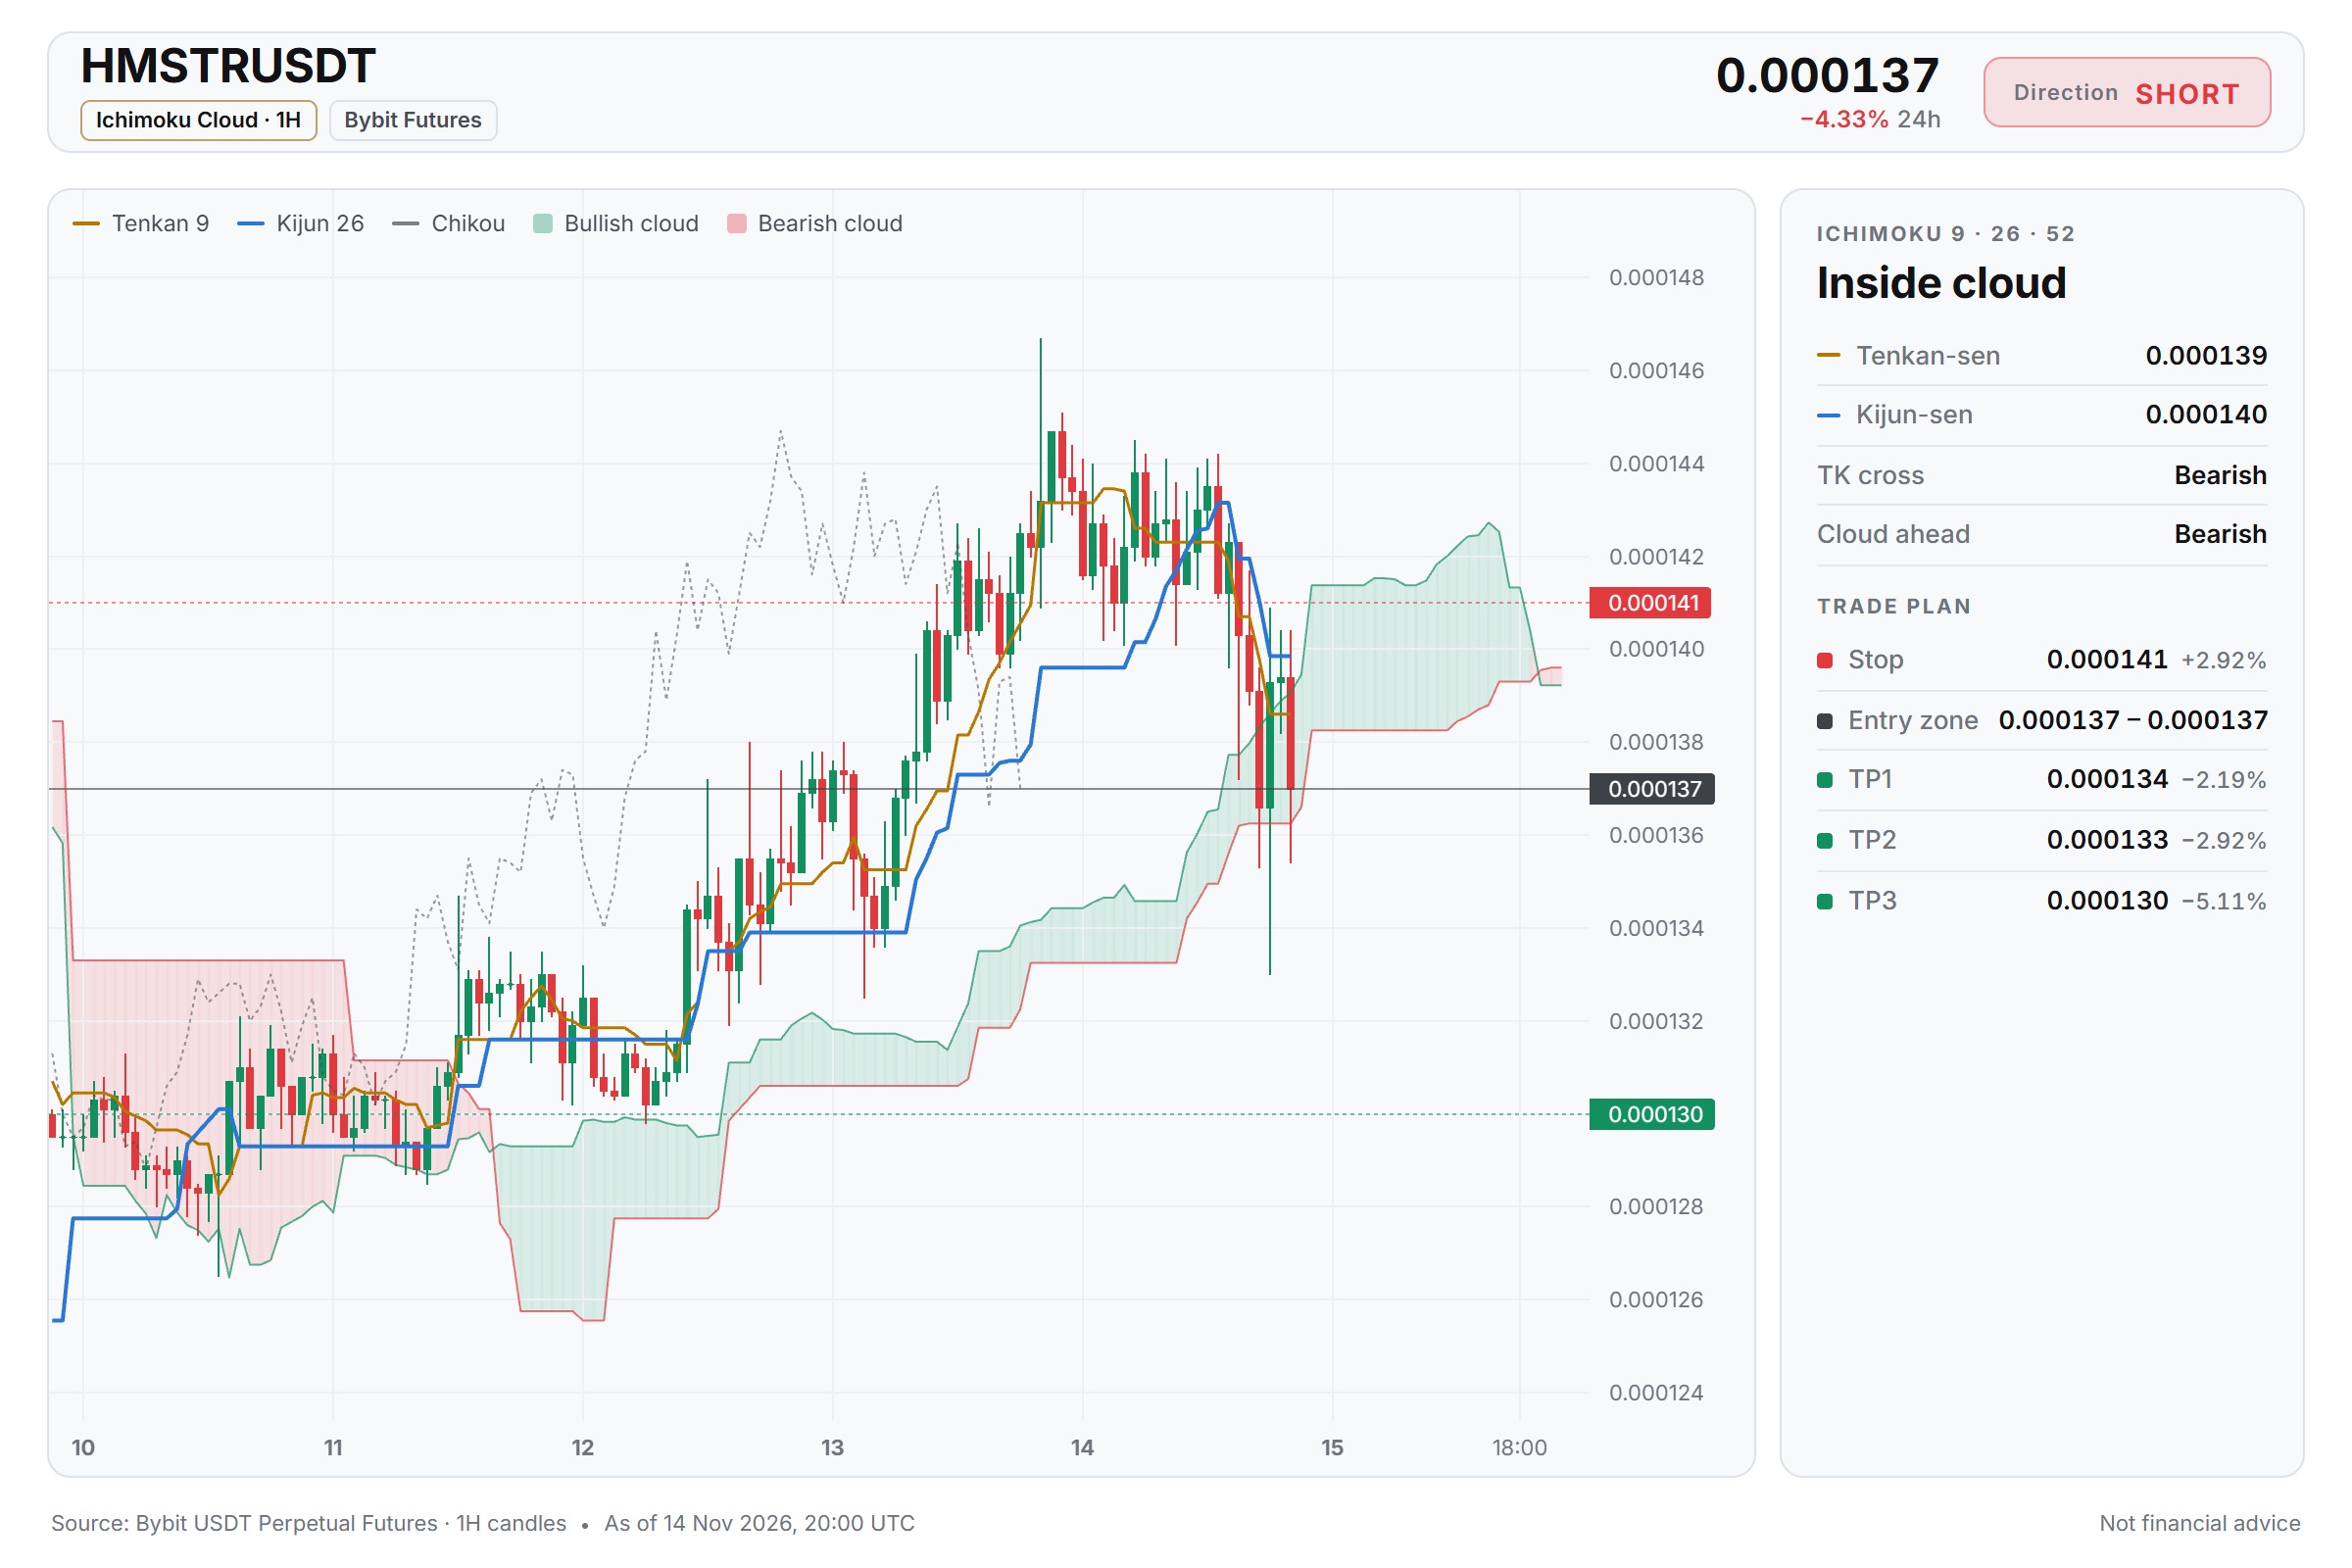
$HMSTR/USDT — SHORT Entry: around 0.000137 SL: 0.000141 TP1: 0.000134 TP2: 0.000133 TP3: 0.000130 I see a short setup forming as BTC pressure stays negative and RSI sits below neutral around 41.58, suggesting momentum is tilting downward. Entering around 0.000137 with SL at 0.000141 and targets at 0.000133 and 0.000130. Do you think HMSTR can retest 0.000130 if BTC continues to drift lower? ⚠️ Personal market analysis only. NFA — manage risk and DYOR. Educational content, not investment advice or a recommendation to buy, sell, deposit, or withdraw any asset. No paid promotion or referral/affiliate links.$HMSTRUSDT#WSOT2026 #WSOTShowYourAITradeToEarn10USDT
El RSI de APE está cerca de niveles de sobreventa, vigílalo de cerca
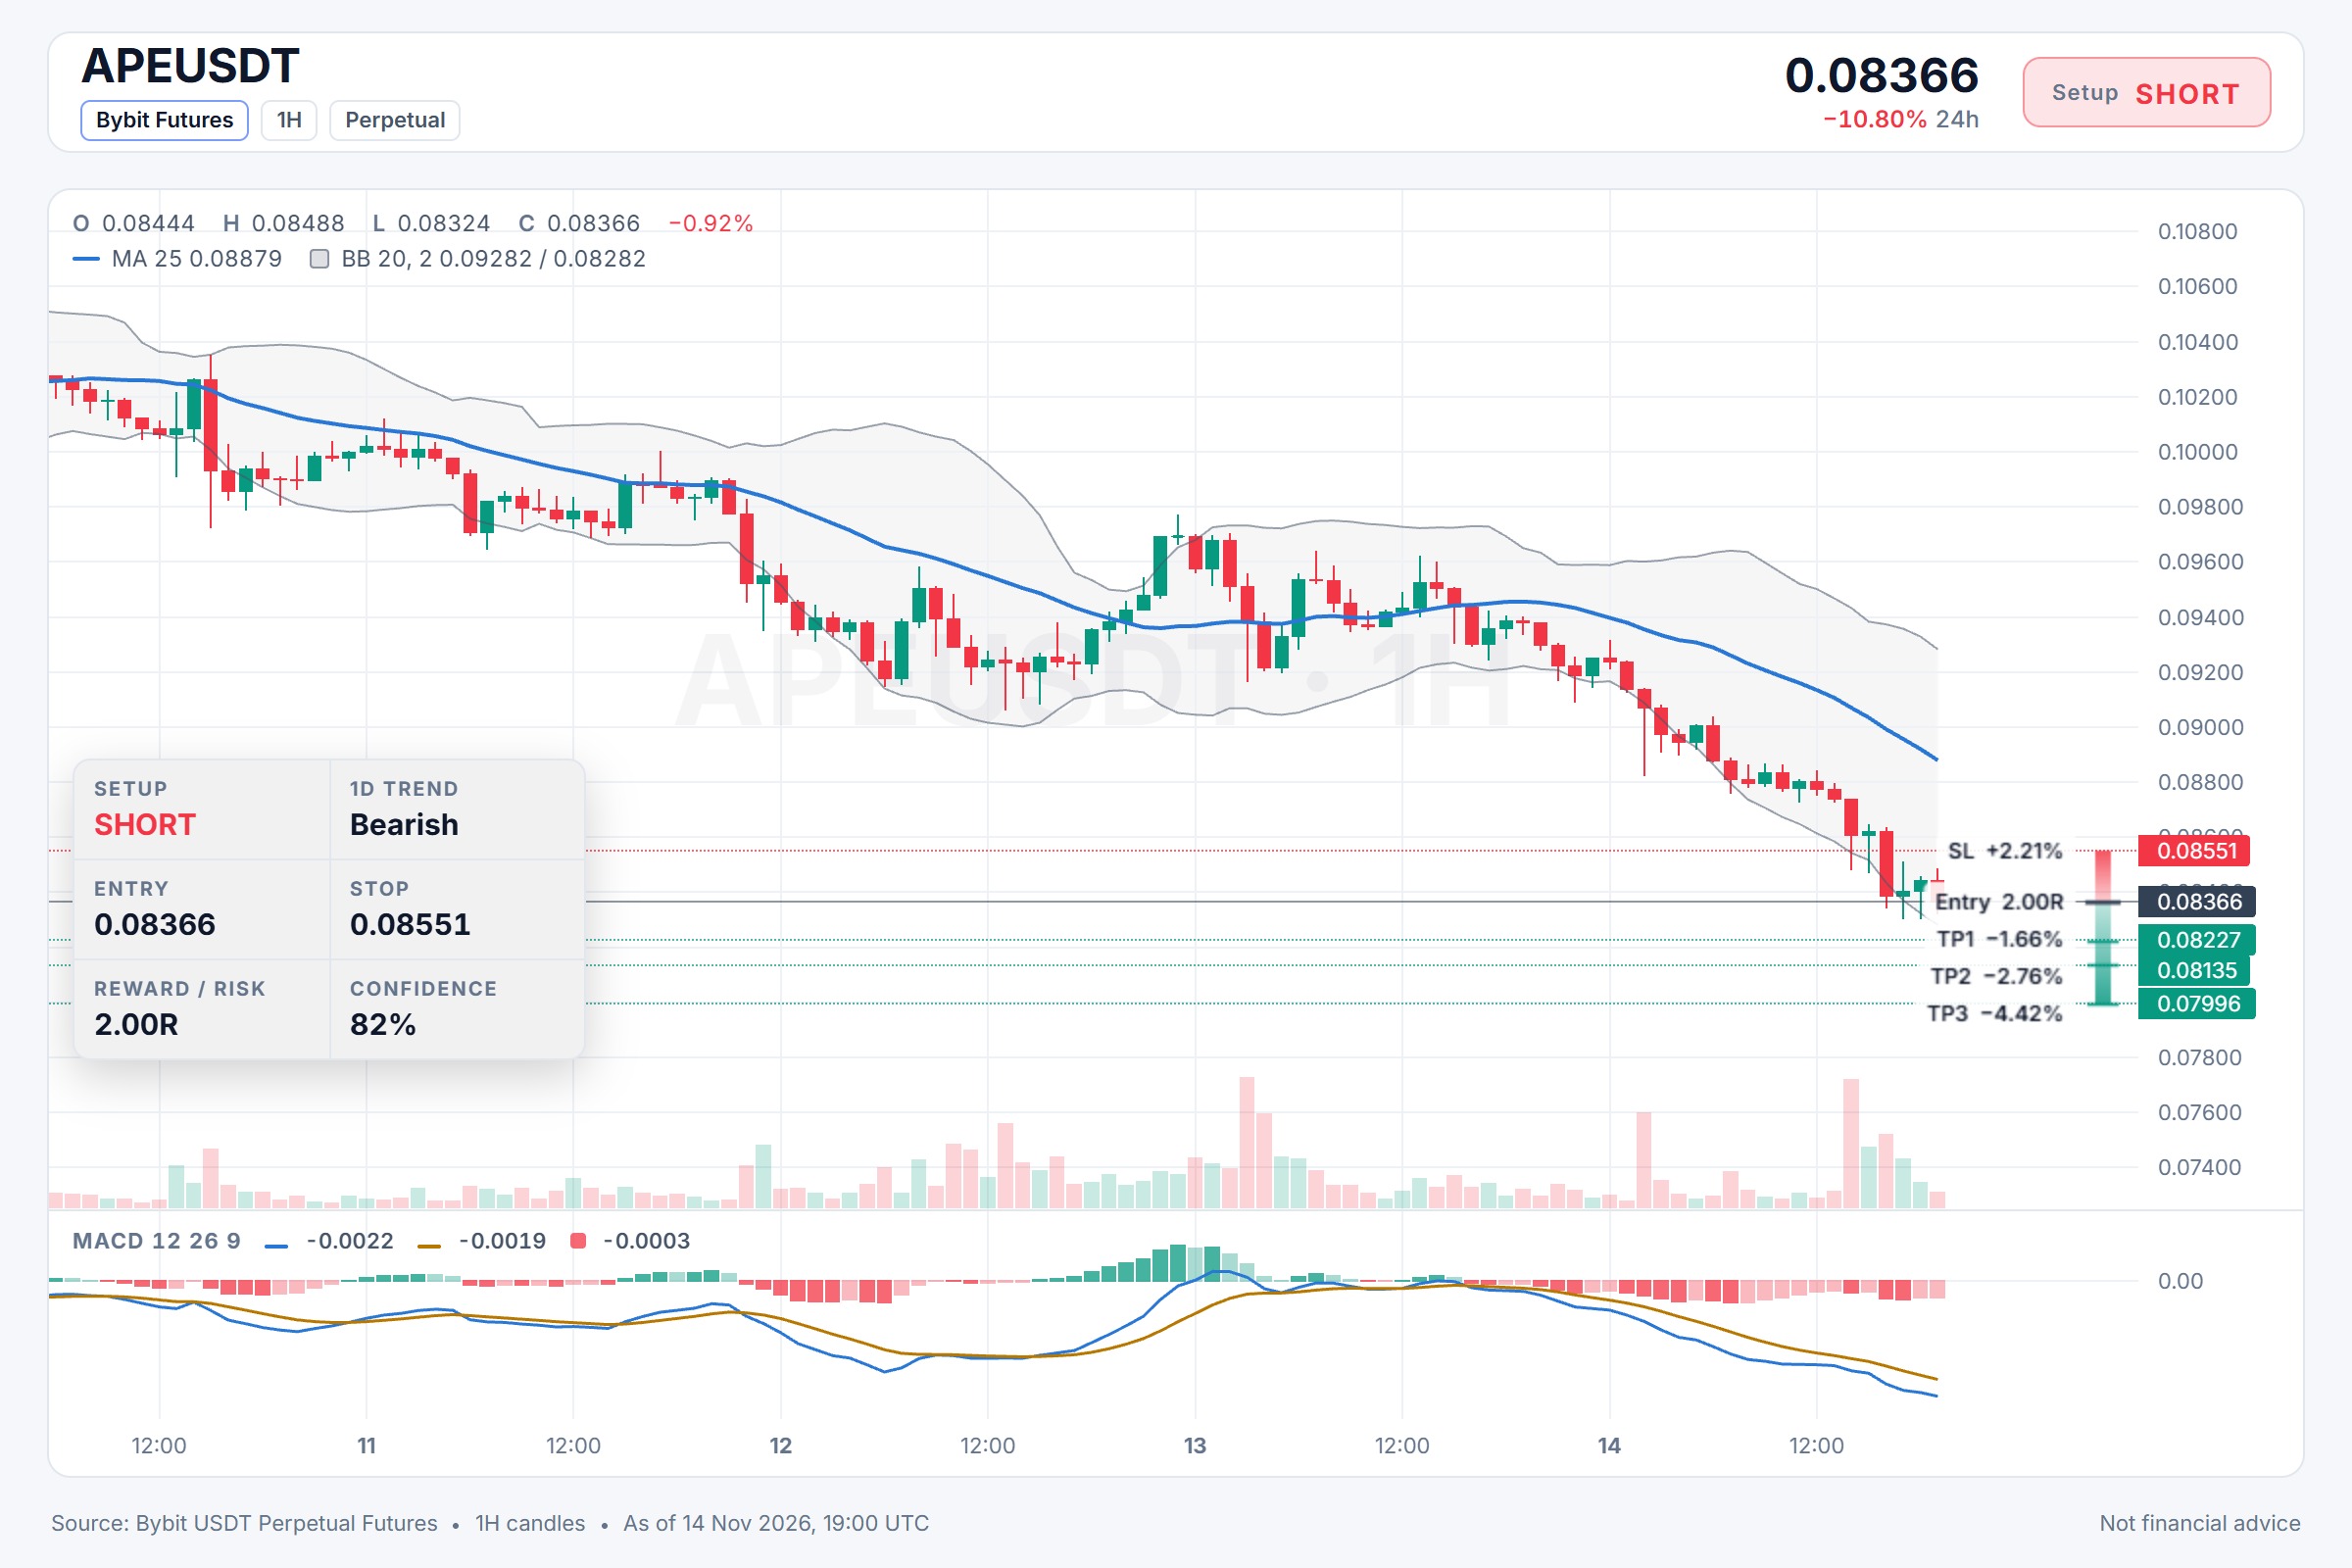
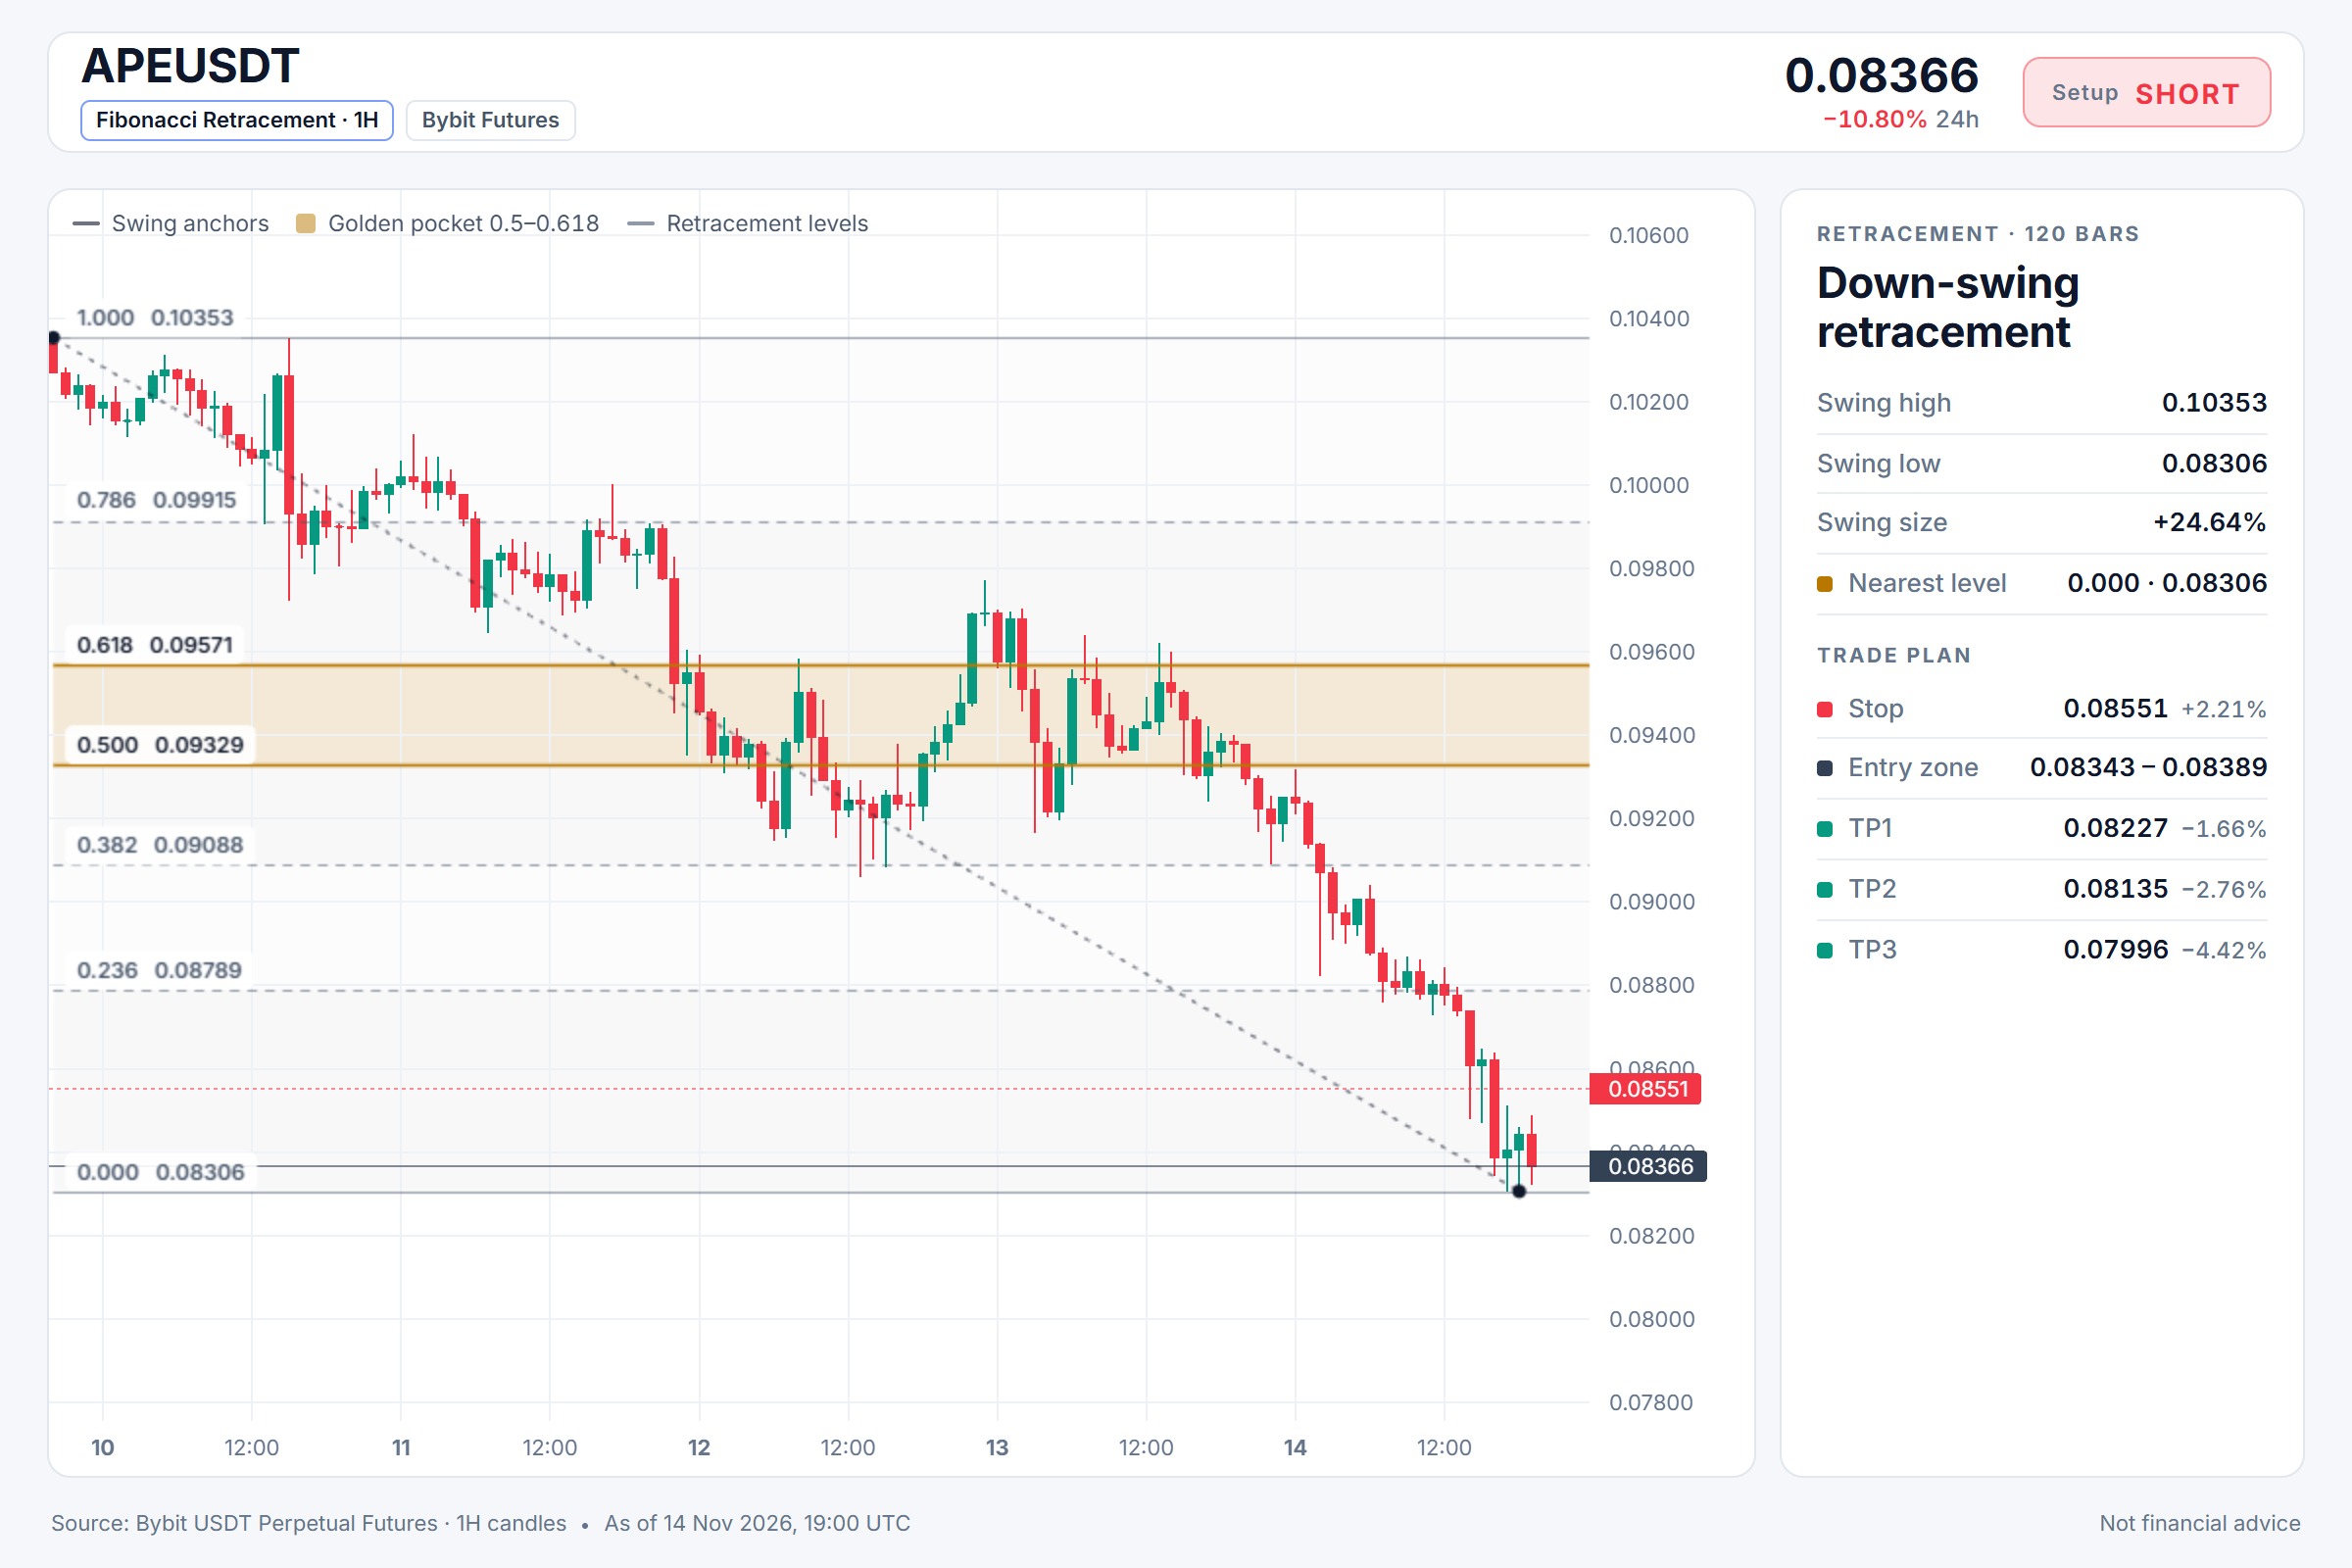
$APE/USDT — POSICIÓN EN SHORT Entrada: 0.08343 - 0.08389 SL: 0.08551 TP1: 0.08227 TP2: 0.08135 TP3: 0.07996 Noto que $APE/USDT se mantiene justo por debajo de un nivel de resistencia clave, mientras que la tendencia de BTC sigue siendo bajista, lo cual históricamente anima a los vendedores a retomar el control. El RSI de 15m en 36.31 muestra que el impulso se está enfriando pero aún no se agota por completo, así que una entrada en short alrededor de 0.08343 a 0.08389 podría alinearse con la continuación en lugar de una reversión. Con el TP2 en 0.08135 y el TP3 en 0.07996, la relación riesgo-beneficio parece estructurada si el precio respeta el SL en 0.08551. ¿Creen que APE seguirá a BTC más abajo o encontrará un piso local primero? ⚠️ Solo análisis de mercado personal. NFA (no es asesoría financiera) — gestionen su riesgo y hagan su propia investigación (DYOR). Contenido educativo, no es asesoramiento de inversión ni una recomendación para comprar, vender, depositar o retirar ningún activo. Sin promoción pagada ni enlaces de referidos/afiliados.$APEUSDT#WSOT2026 #WSOTMuestraTuOperaciónIAParaGanar10USDT