BITPIA
3484Me gusta0Compartir en el chat48Aficionados77Seguir
Full Time Trader
Full Time Trader
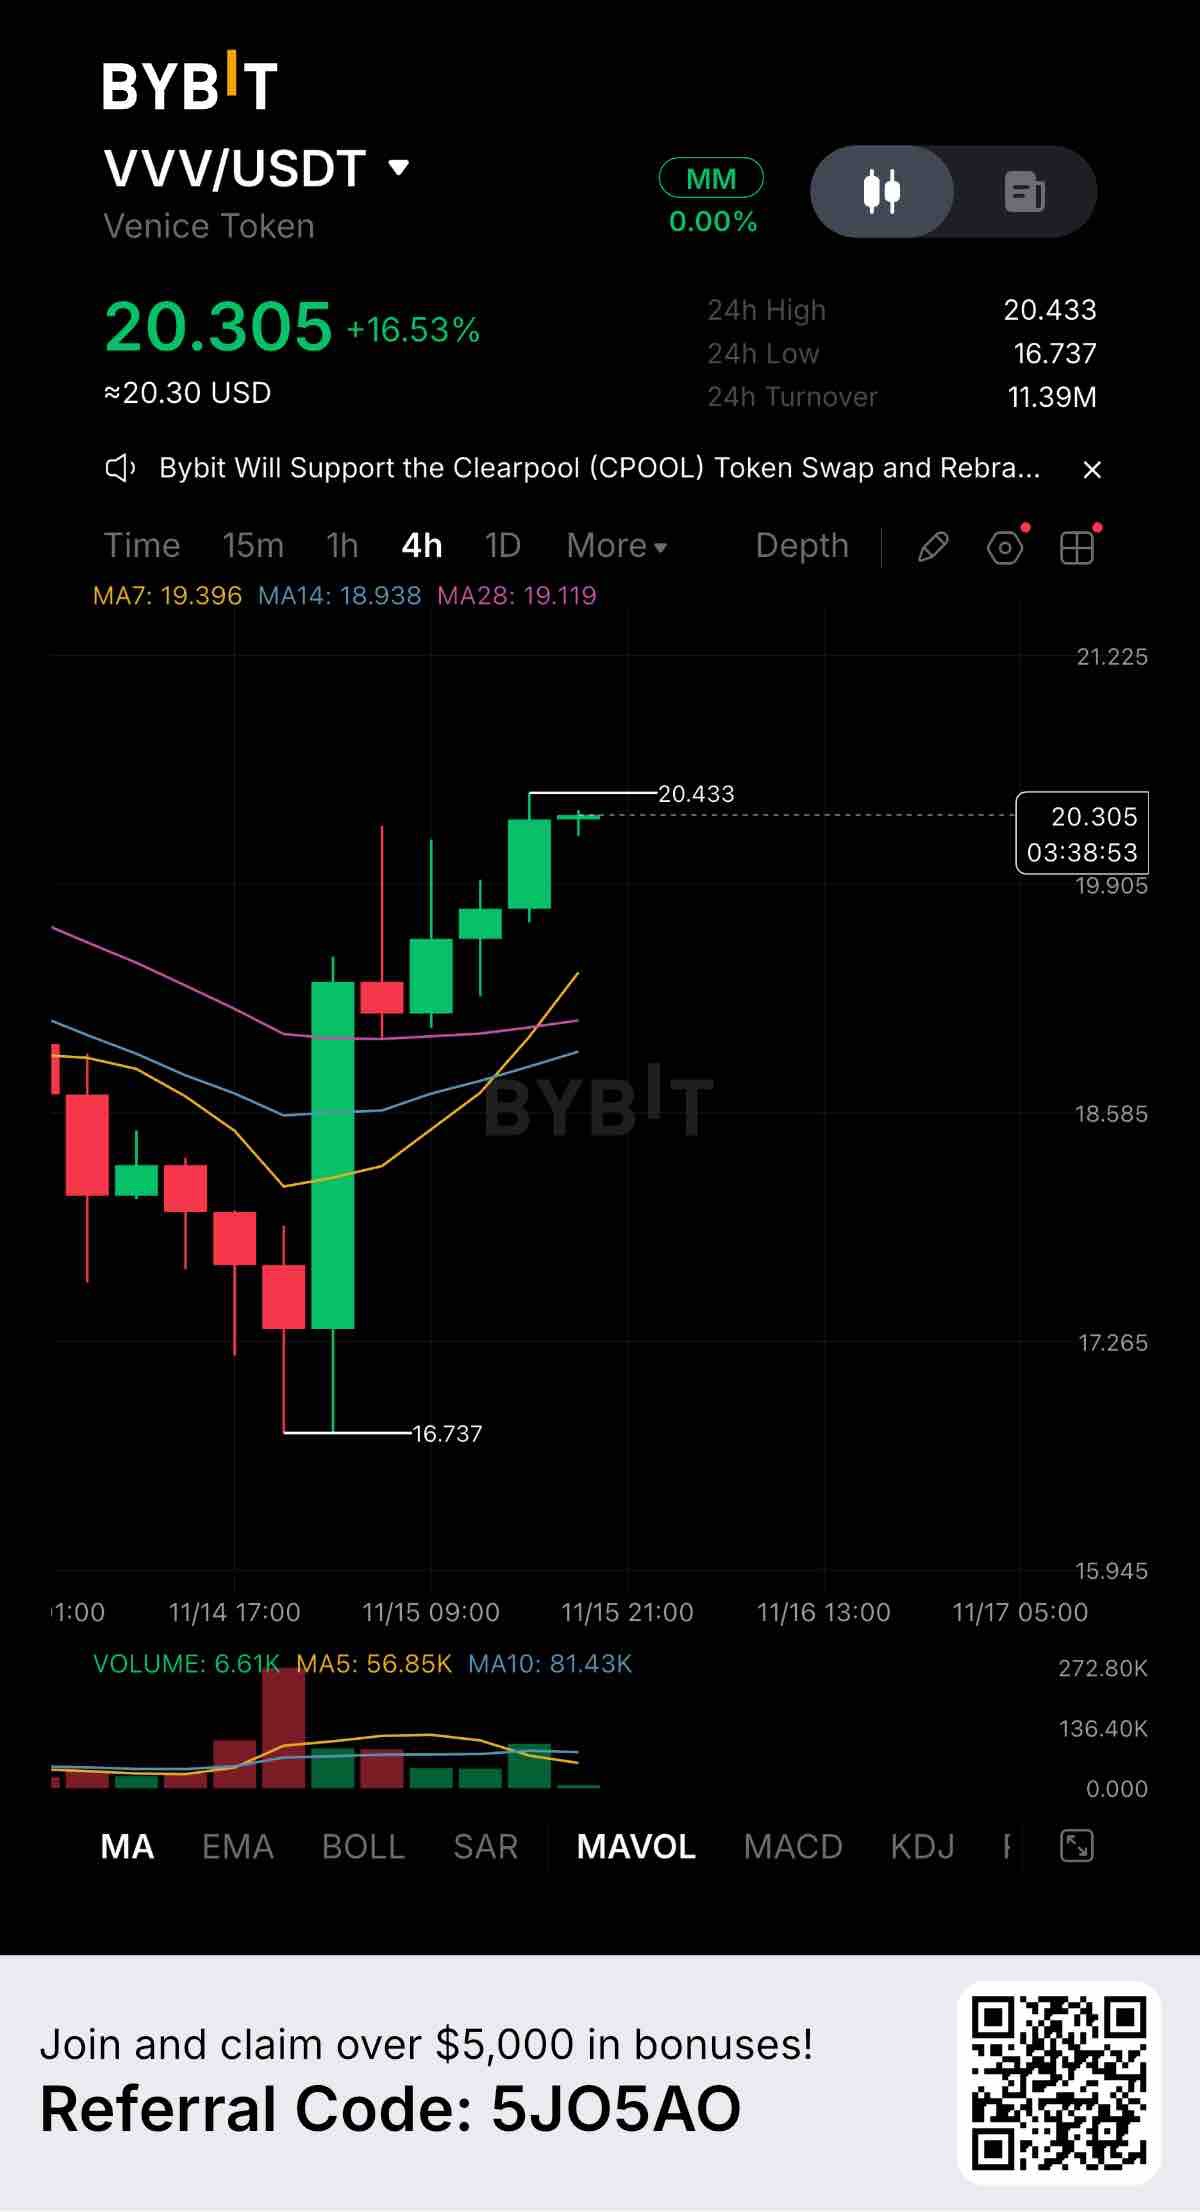
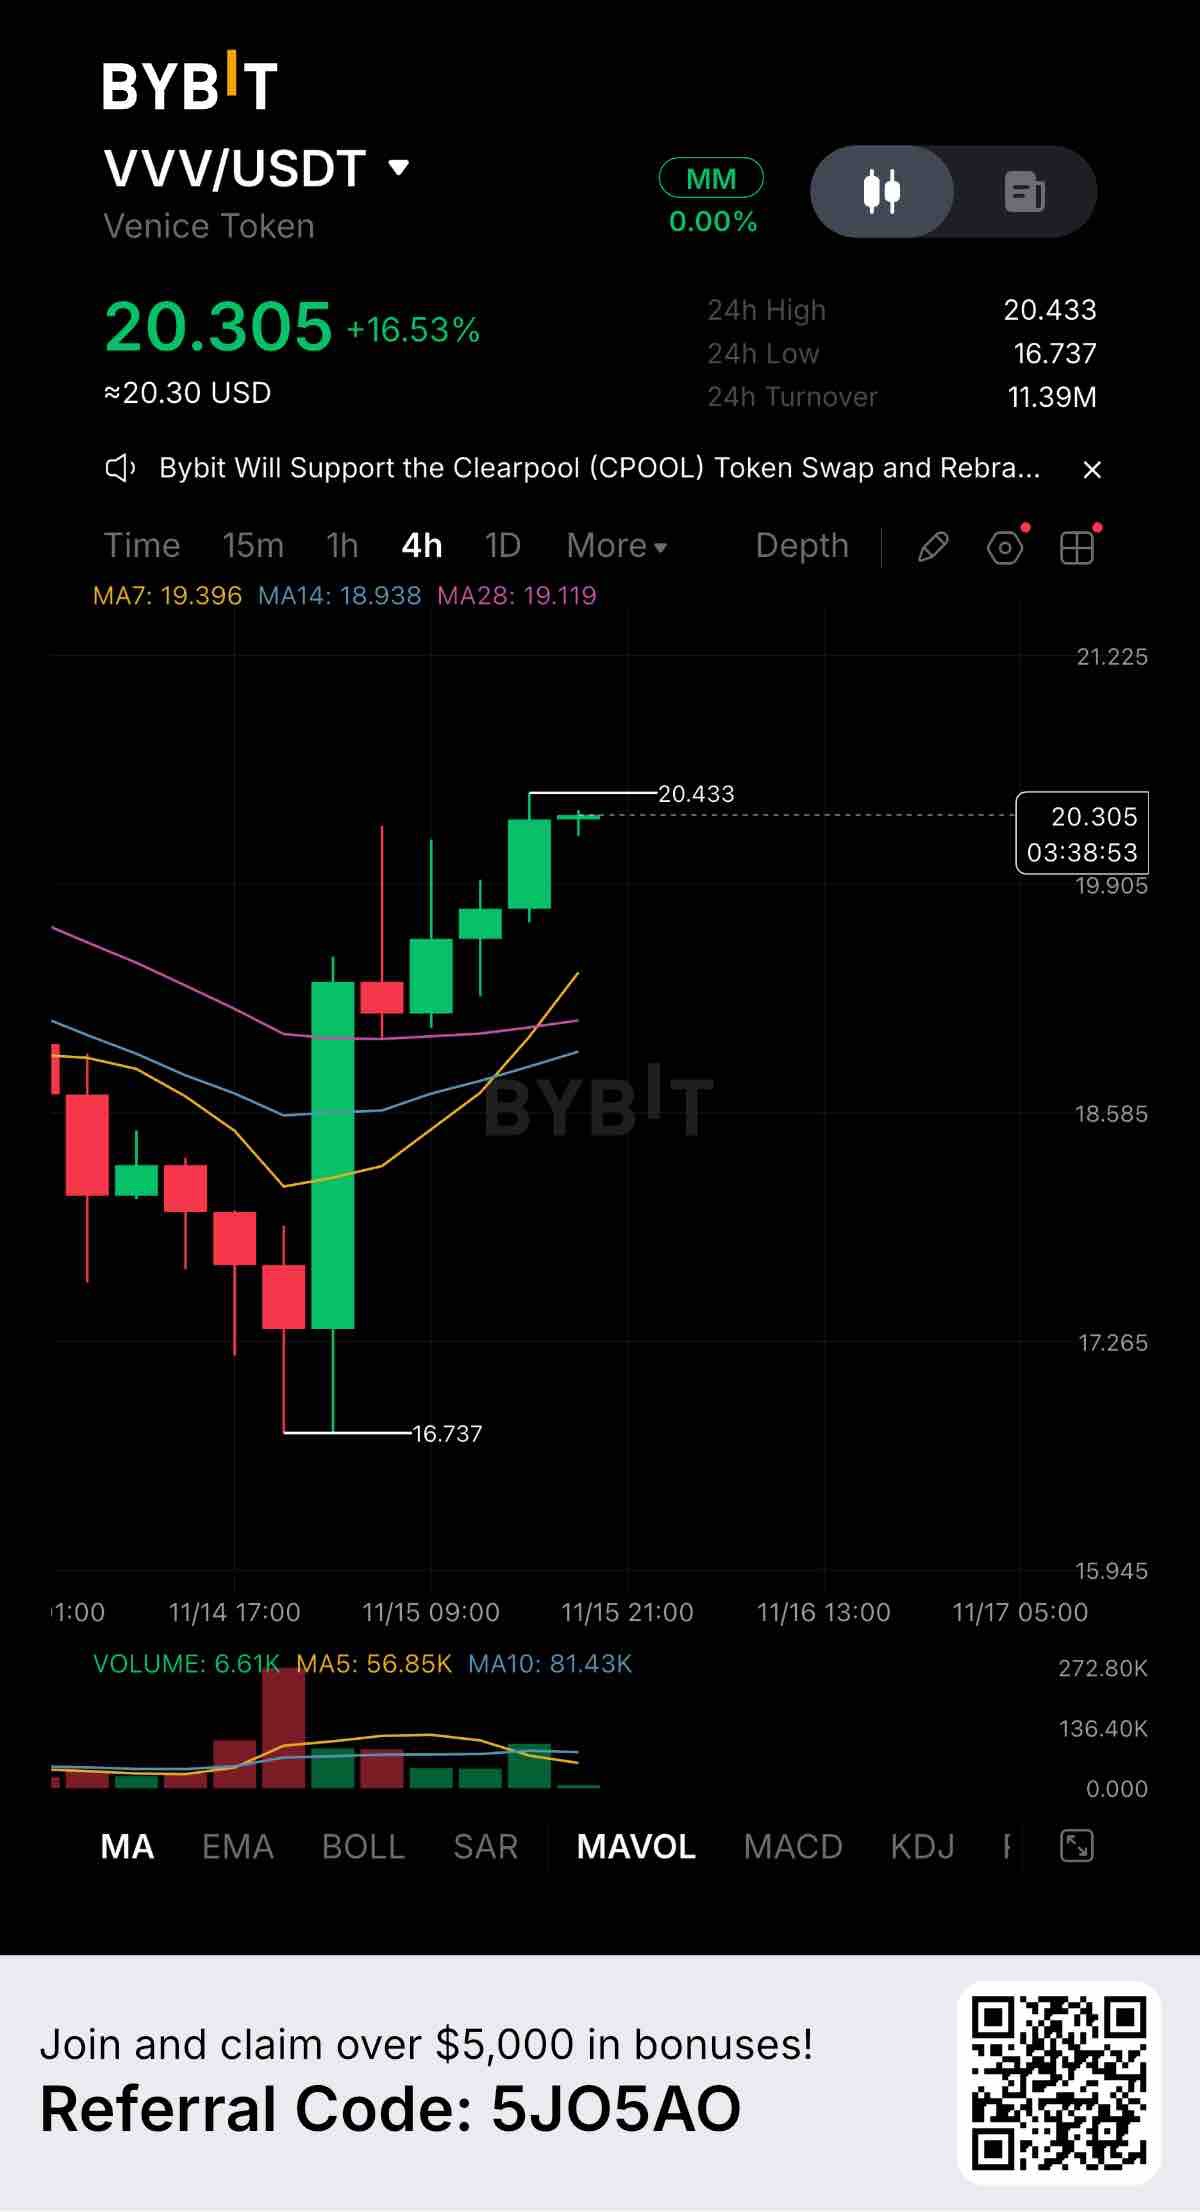
$VVVUSDT está mostrando una recuperación potente en la gráfica de 4 horas, cotizando actualmente en 20.305 con una impresionante ganancia del +16.53%. Después de una caída pronunciada hasta 16.737, los compradores intervinieron agresivamente con una vela verde masiva, revirtiendo completamente la tendencia e impulsando el precio hacia una tendencia alcista fuerte y constante. Niveles clave a vigilar: Resistencia: 20.433 (El máximo actual de 24 horas, actuando como el techo inmediato) Soporte 1: 19.396 (Media móvil de 7 días, la primera zona de soporte dinámica) Soporte 2: 16.737 (Mínimo de 24 horas, el piso estructural principal) Las medias móviles están totalmente alineadas con los toros. El precio se cotiza muy por encima de la MA7, MA14 y MA28. La gráfica muestra una serie de libro de máximos más altos y mínimos más altos, con compradores entrando con confianza para apoyar cada pequeño retroceso. El volumen es un factor importante aquí. El volumen de negociación de 24 horas es de unos masivos 11.39M USDT. Aunque el rebote inicial tuvo un volumen explosivo, el ascenso constante desde entonces muestra una presión de compra sostenida en lugar de solo una contracción rápida. Fundamentalmente, Venice Token (VVV) tiene claramente una alta demanda en este momento. Este tipo de recuperación en forma de V suele indicar una fuerte convicción por parte de los compradores, quienes están ansiosos por acumular en las caídas. Si los compradores logran romper y mantenerse por encima de 20.433, podríamos ver un impulso hacia el descubrimiento de precios. Sin embargo, debido a que el precio se está extendiendo, esperar un ligero retroceso hacia el soporte de 19.396 podría ofrecer una entrada más segura. ¿Estás aprovechando este impulso de VVV o esperando una nueva prueba? Cuéntanos tu estrategia en los comentarios. #ByXIMPACT #WSOT2026
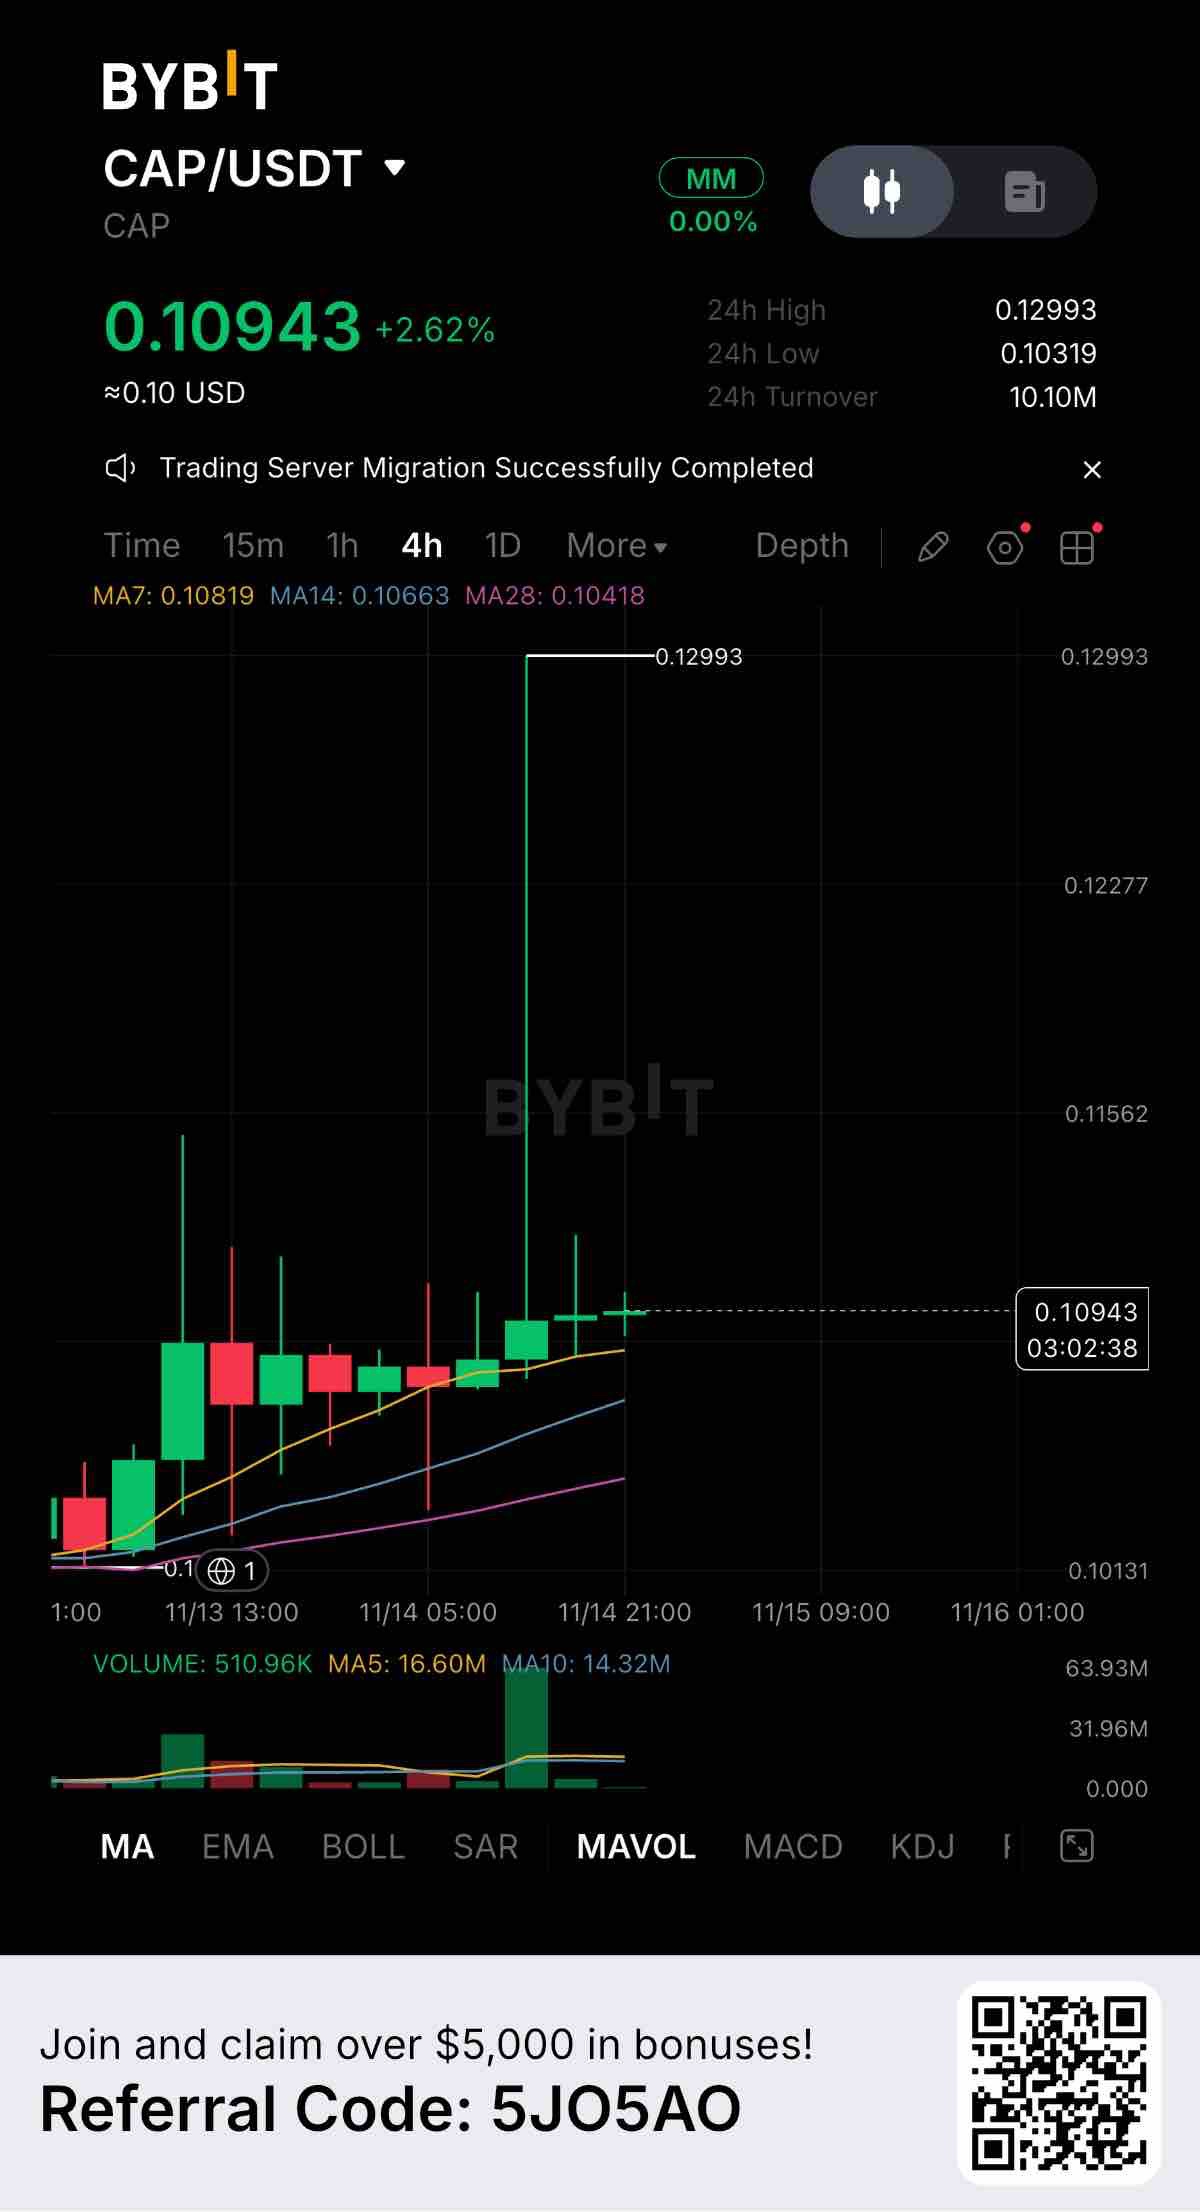
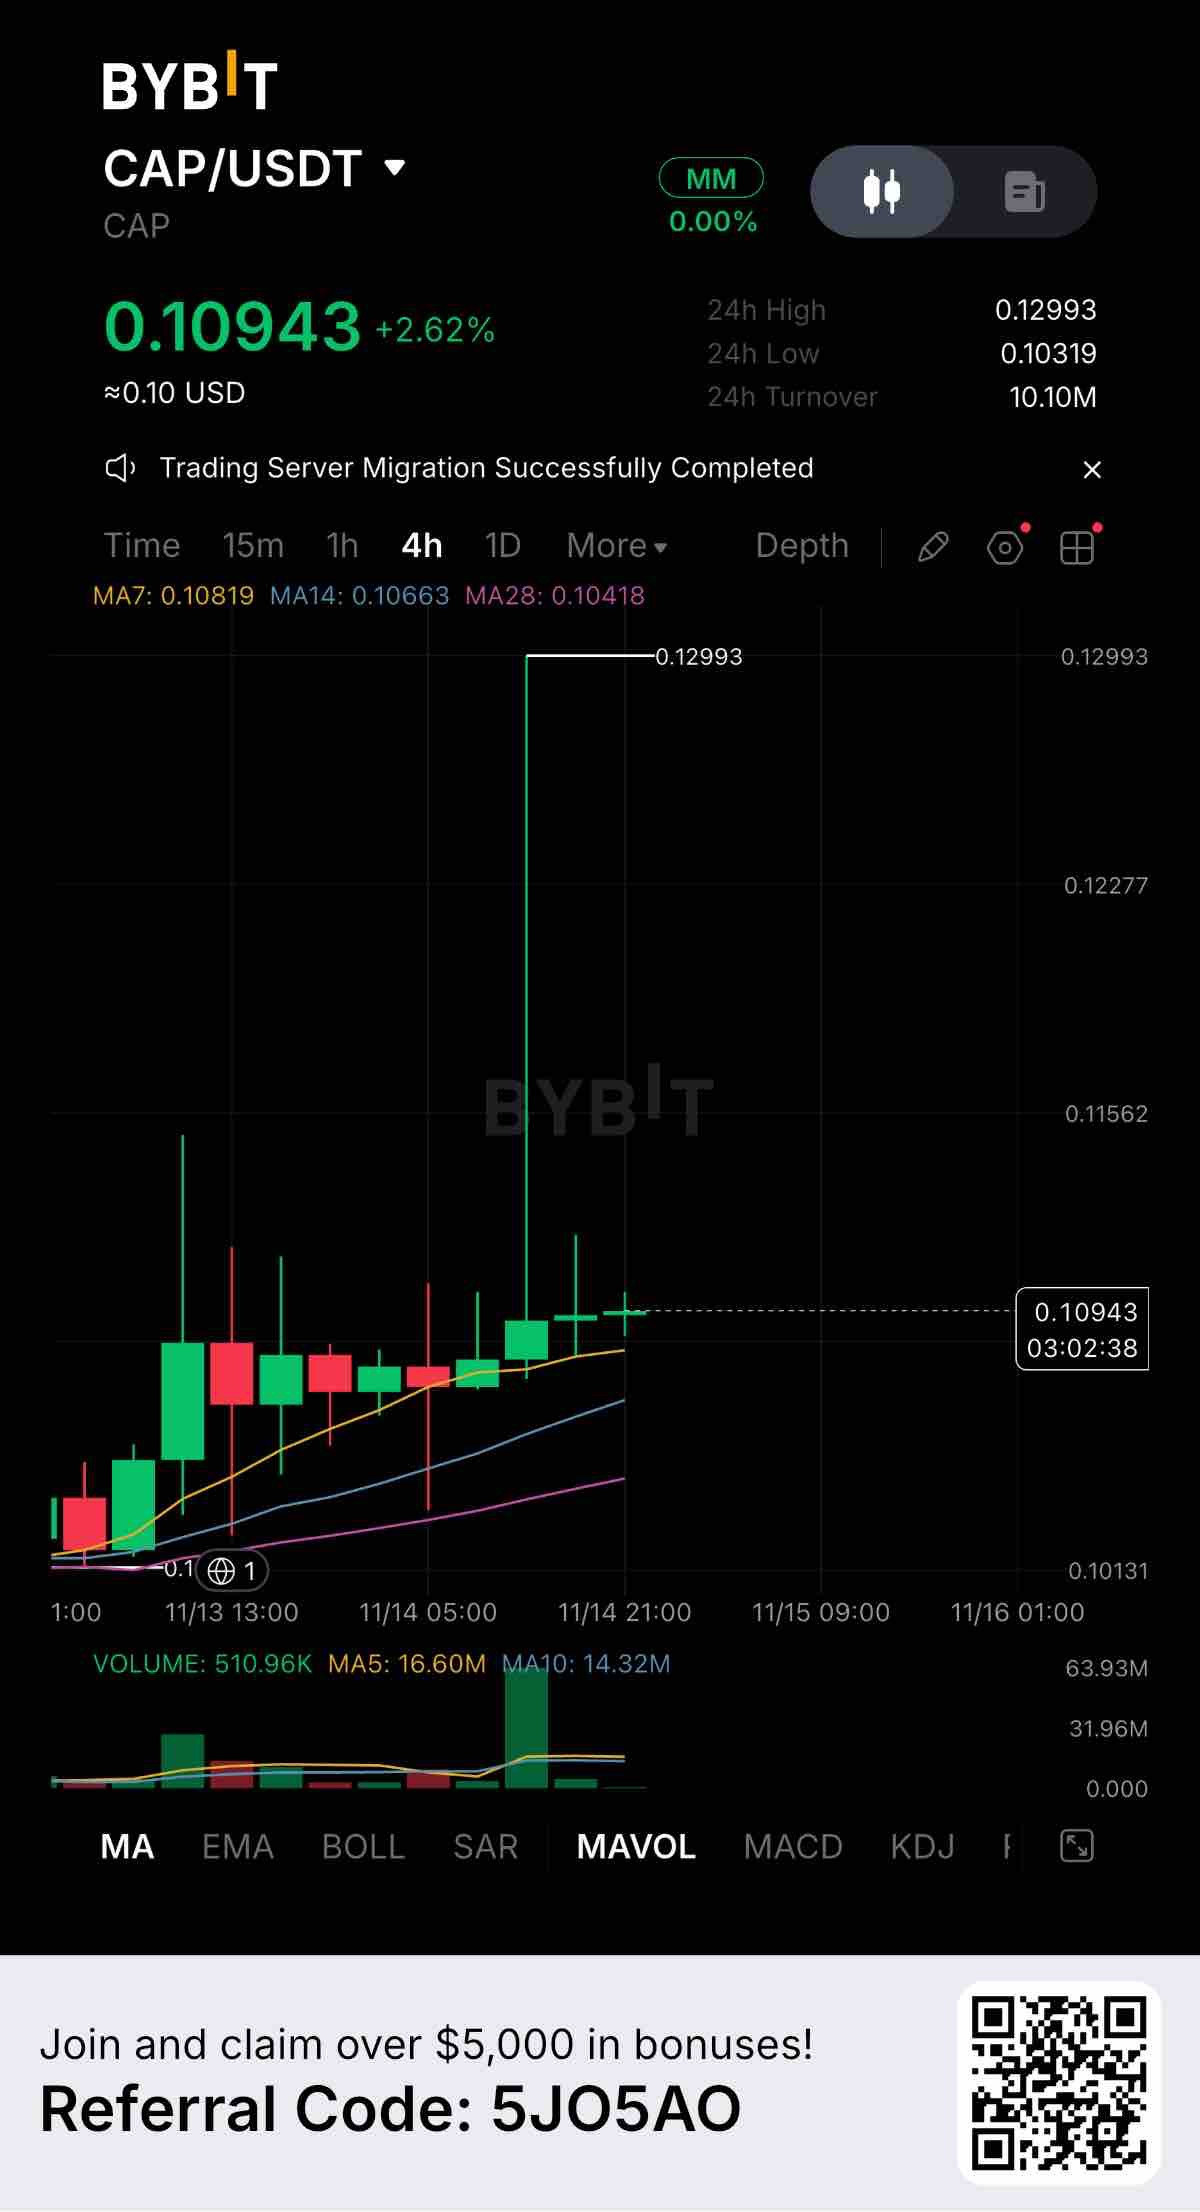
$CAPUSDT está mostrando una volatilidad extrema en la gráfica de 4 horas, cotizando actualmente en 0.10943 con una ganancia del +2.62%. Aunque el porcentaje diario parece modesto, la gráfica en sí cuenta una historia salvaje. Acabamos de presenciar un pico masivo de liquidez con una enorme barra de volumen verde que envió el precio disparándose hasta 0.12993, solo para ser rechazado inmediatamente y empujado todo el camino hacia abajo. Niveles clave a observar: Resistencia: 0.12993 (El máximo masivo de 24 horas y la parte superior de la mecha de rechazo) Soporte 1: 0.10819 (MA de 7 días, actuando actualmente como el piso inmediato) Soporte 2: 0.10319 (Mínimo de 24 horas, la base estructural) Mirando los promedios móviles, la tendencia más amplia sigue apuntando al alza. El precio se mantiene por encima de la MA7, MA14 y MA28. Sin embargo, esa enorme mecha superior es una clara señal de advertencia de que los vendedores están defendiendo fuertemente los precios más altos. El precio ahora se está consolidando e intentando estabilizarse por encima de la MA de 7 días. El volumen es el factor más crítico aquí. El volumen de operaciones de 24 horas es de unos masivos 10.10M USDT. El pico en el volumen confirma que los grandes jugadores están activos en este mercado, pero el rechazo significa que los toros perdieron esa batalla específica. Si los compradores pueden mantener este nivel de soporte de 0.10819 y construir una base, es posible una nueva prueba de los máximos. Pero si este soporte se rompe, podríamos ver una caída pronunciada de vuelta hacia los mínimos de 0.10319. ¿Cómo interpretas esta configuración de CAP? ¿Estás esperando una ruptura confirmada, o esa mecha de rechazo es una advertencia para mantenerse alejado? Vamos a discutirlo abajo. #ByXIMPACT #WSOT2026
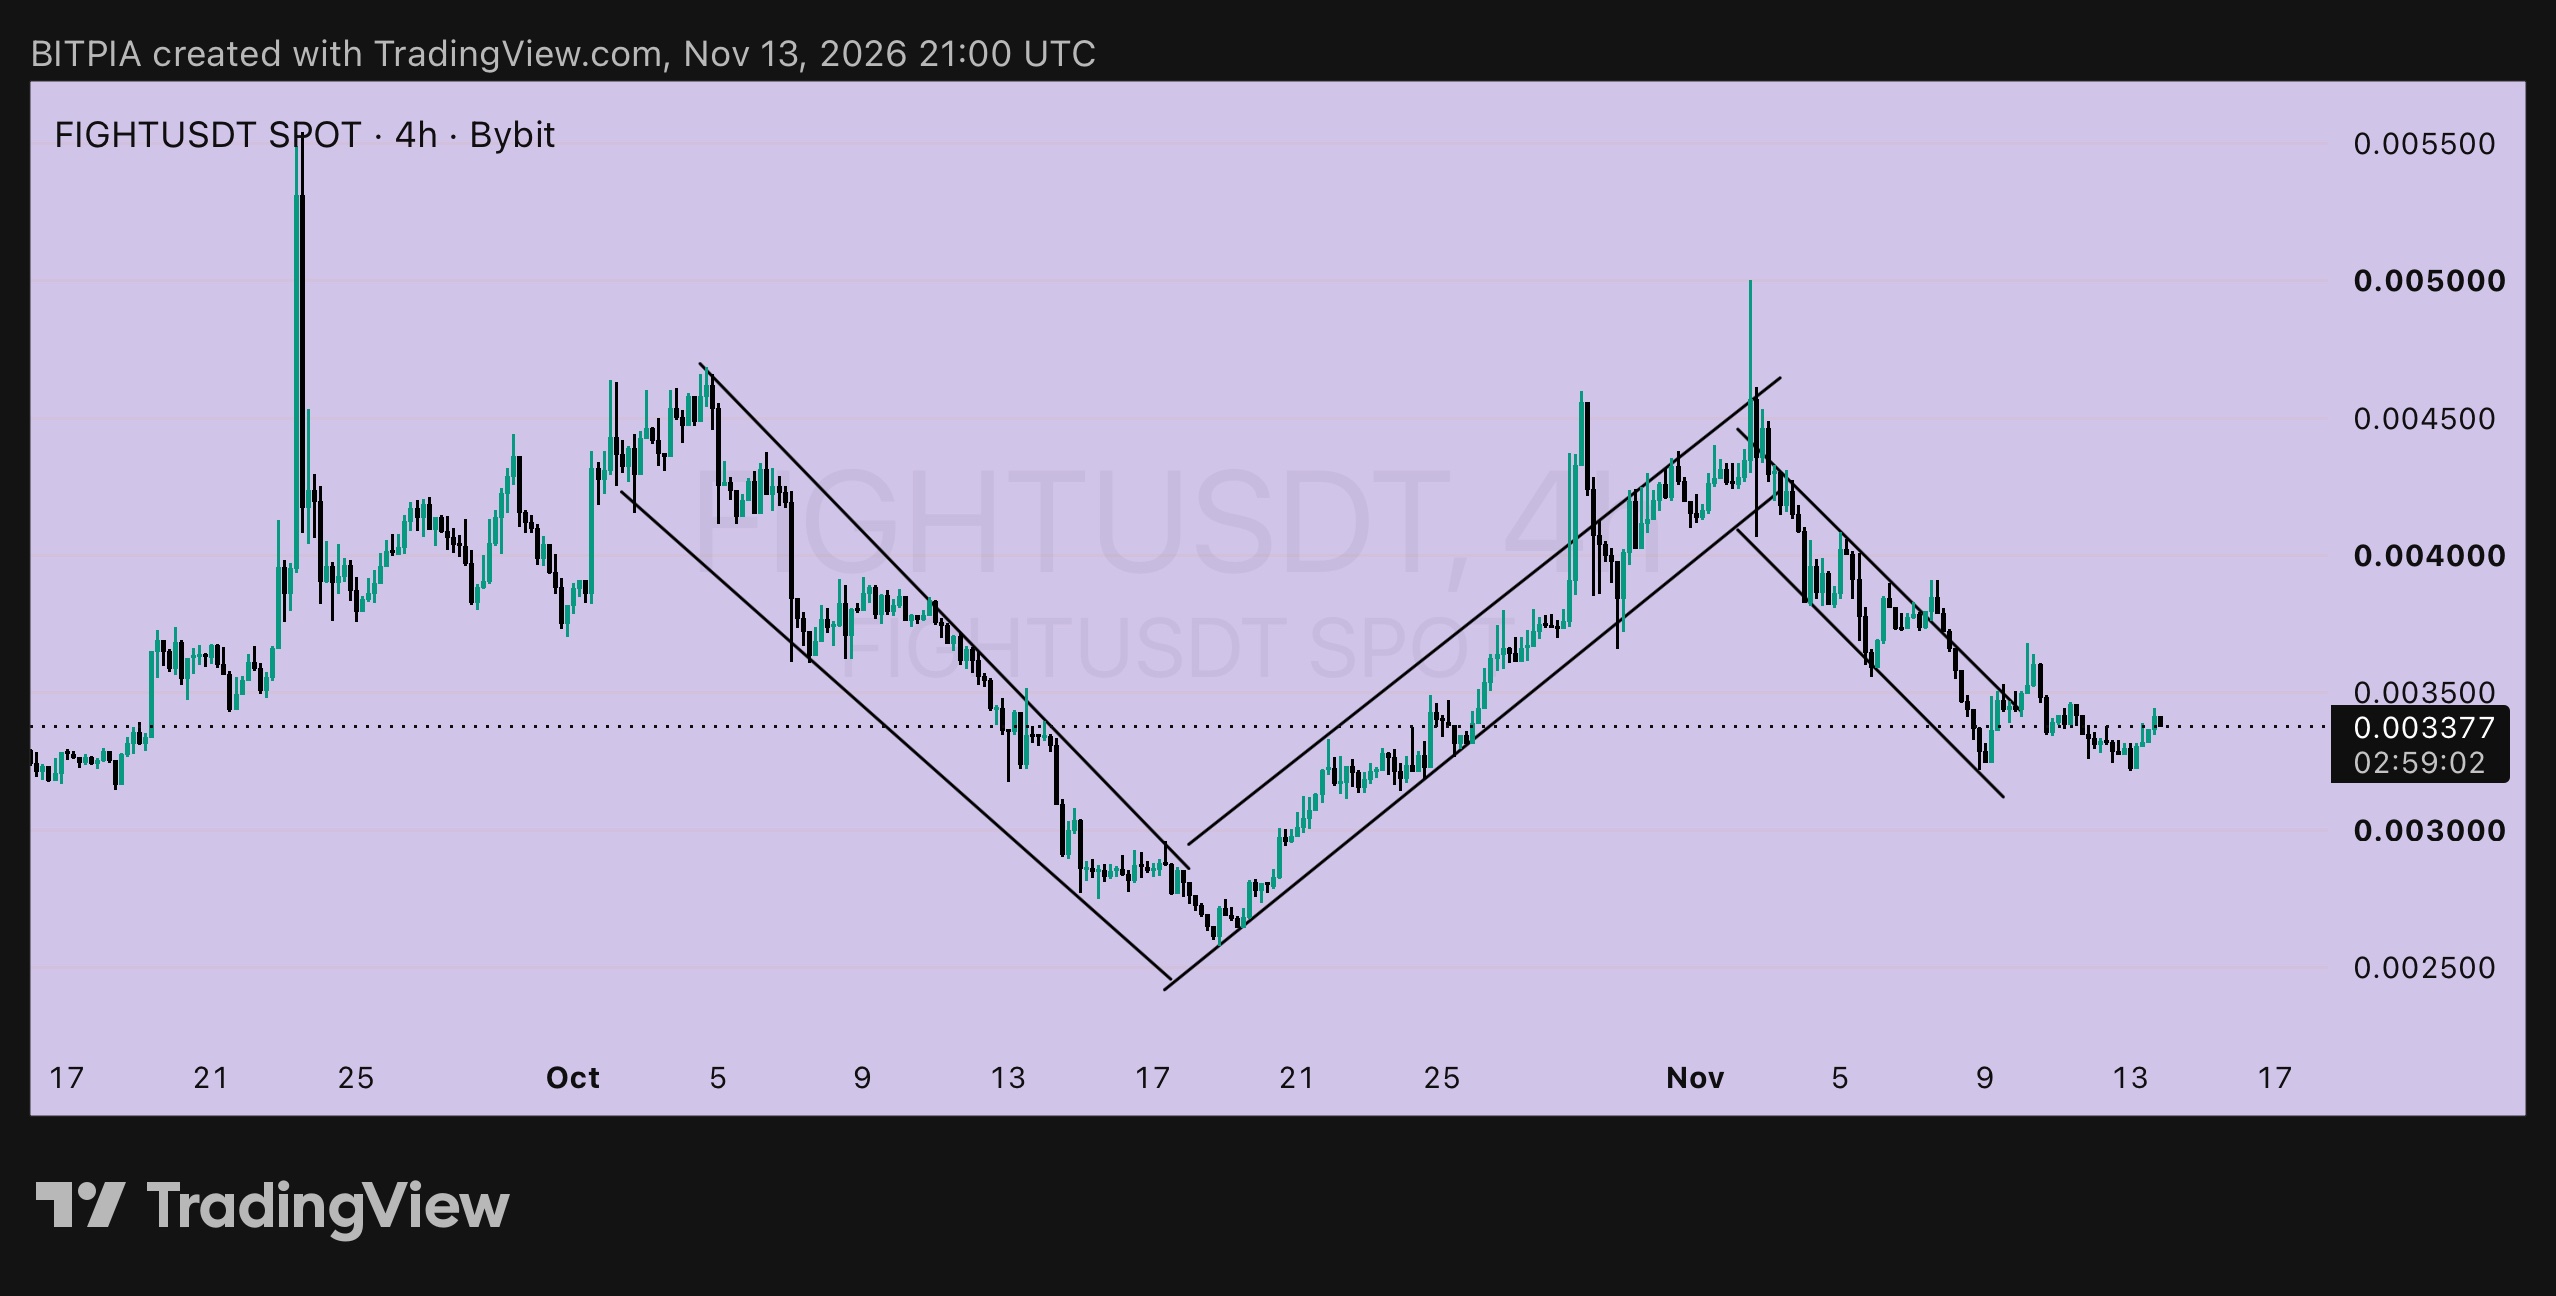
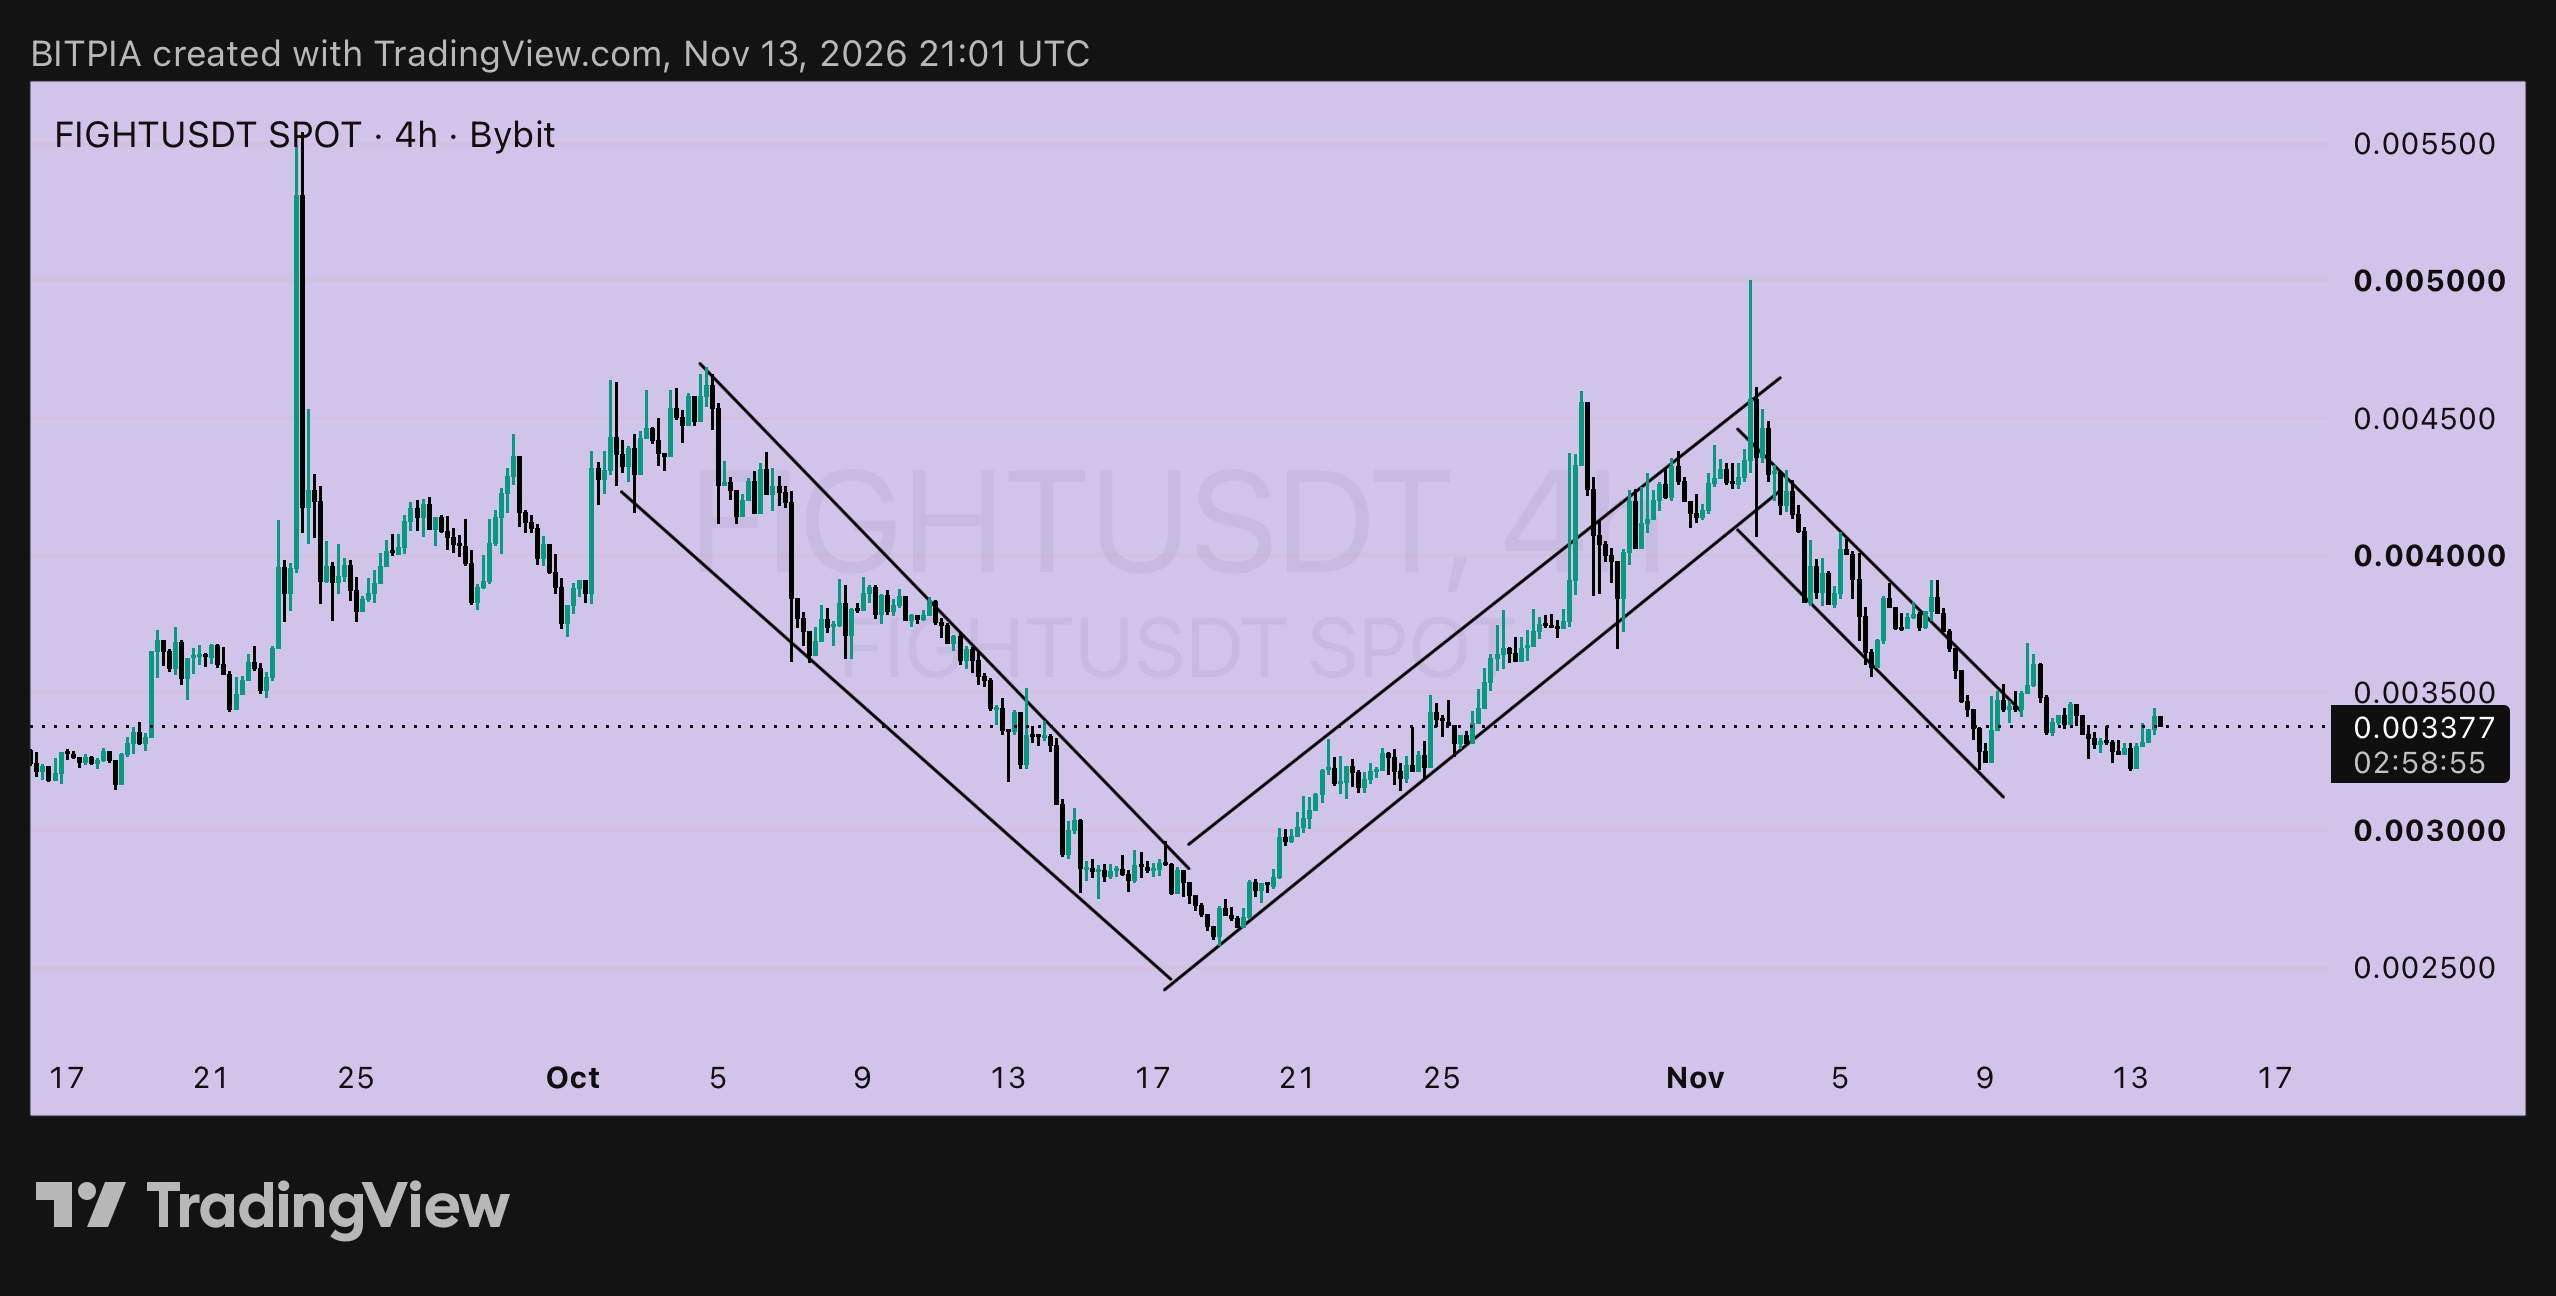
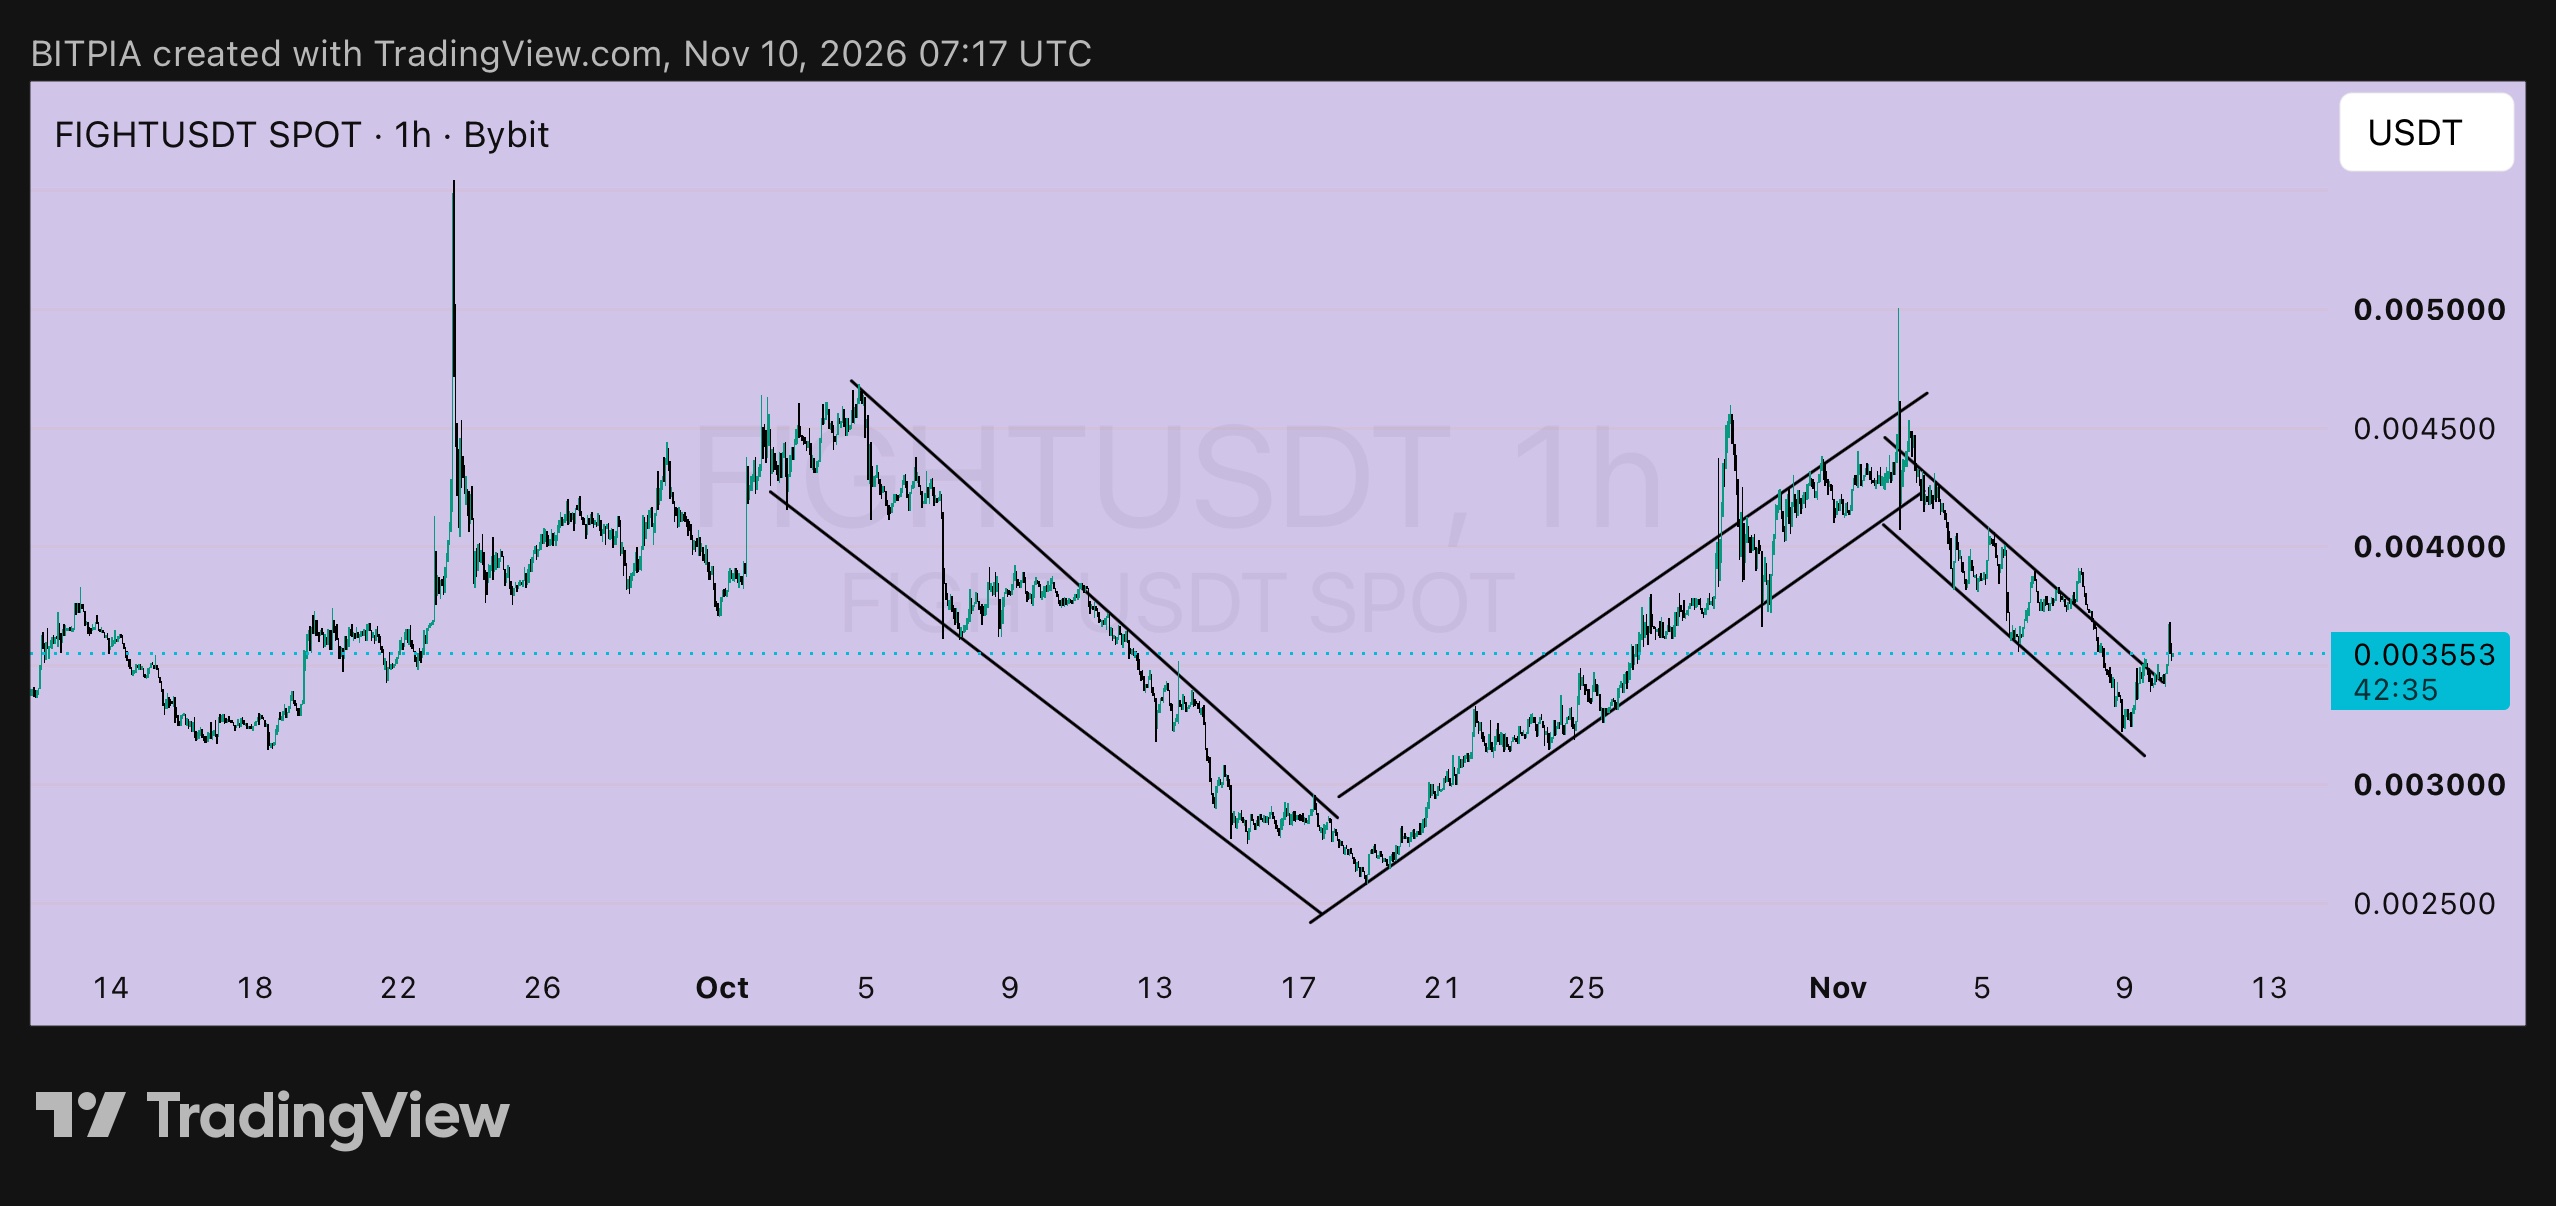
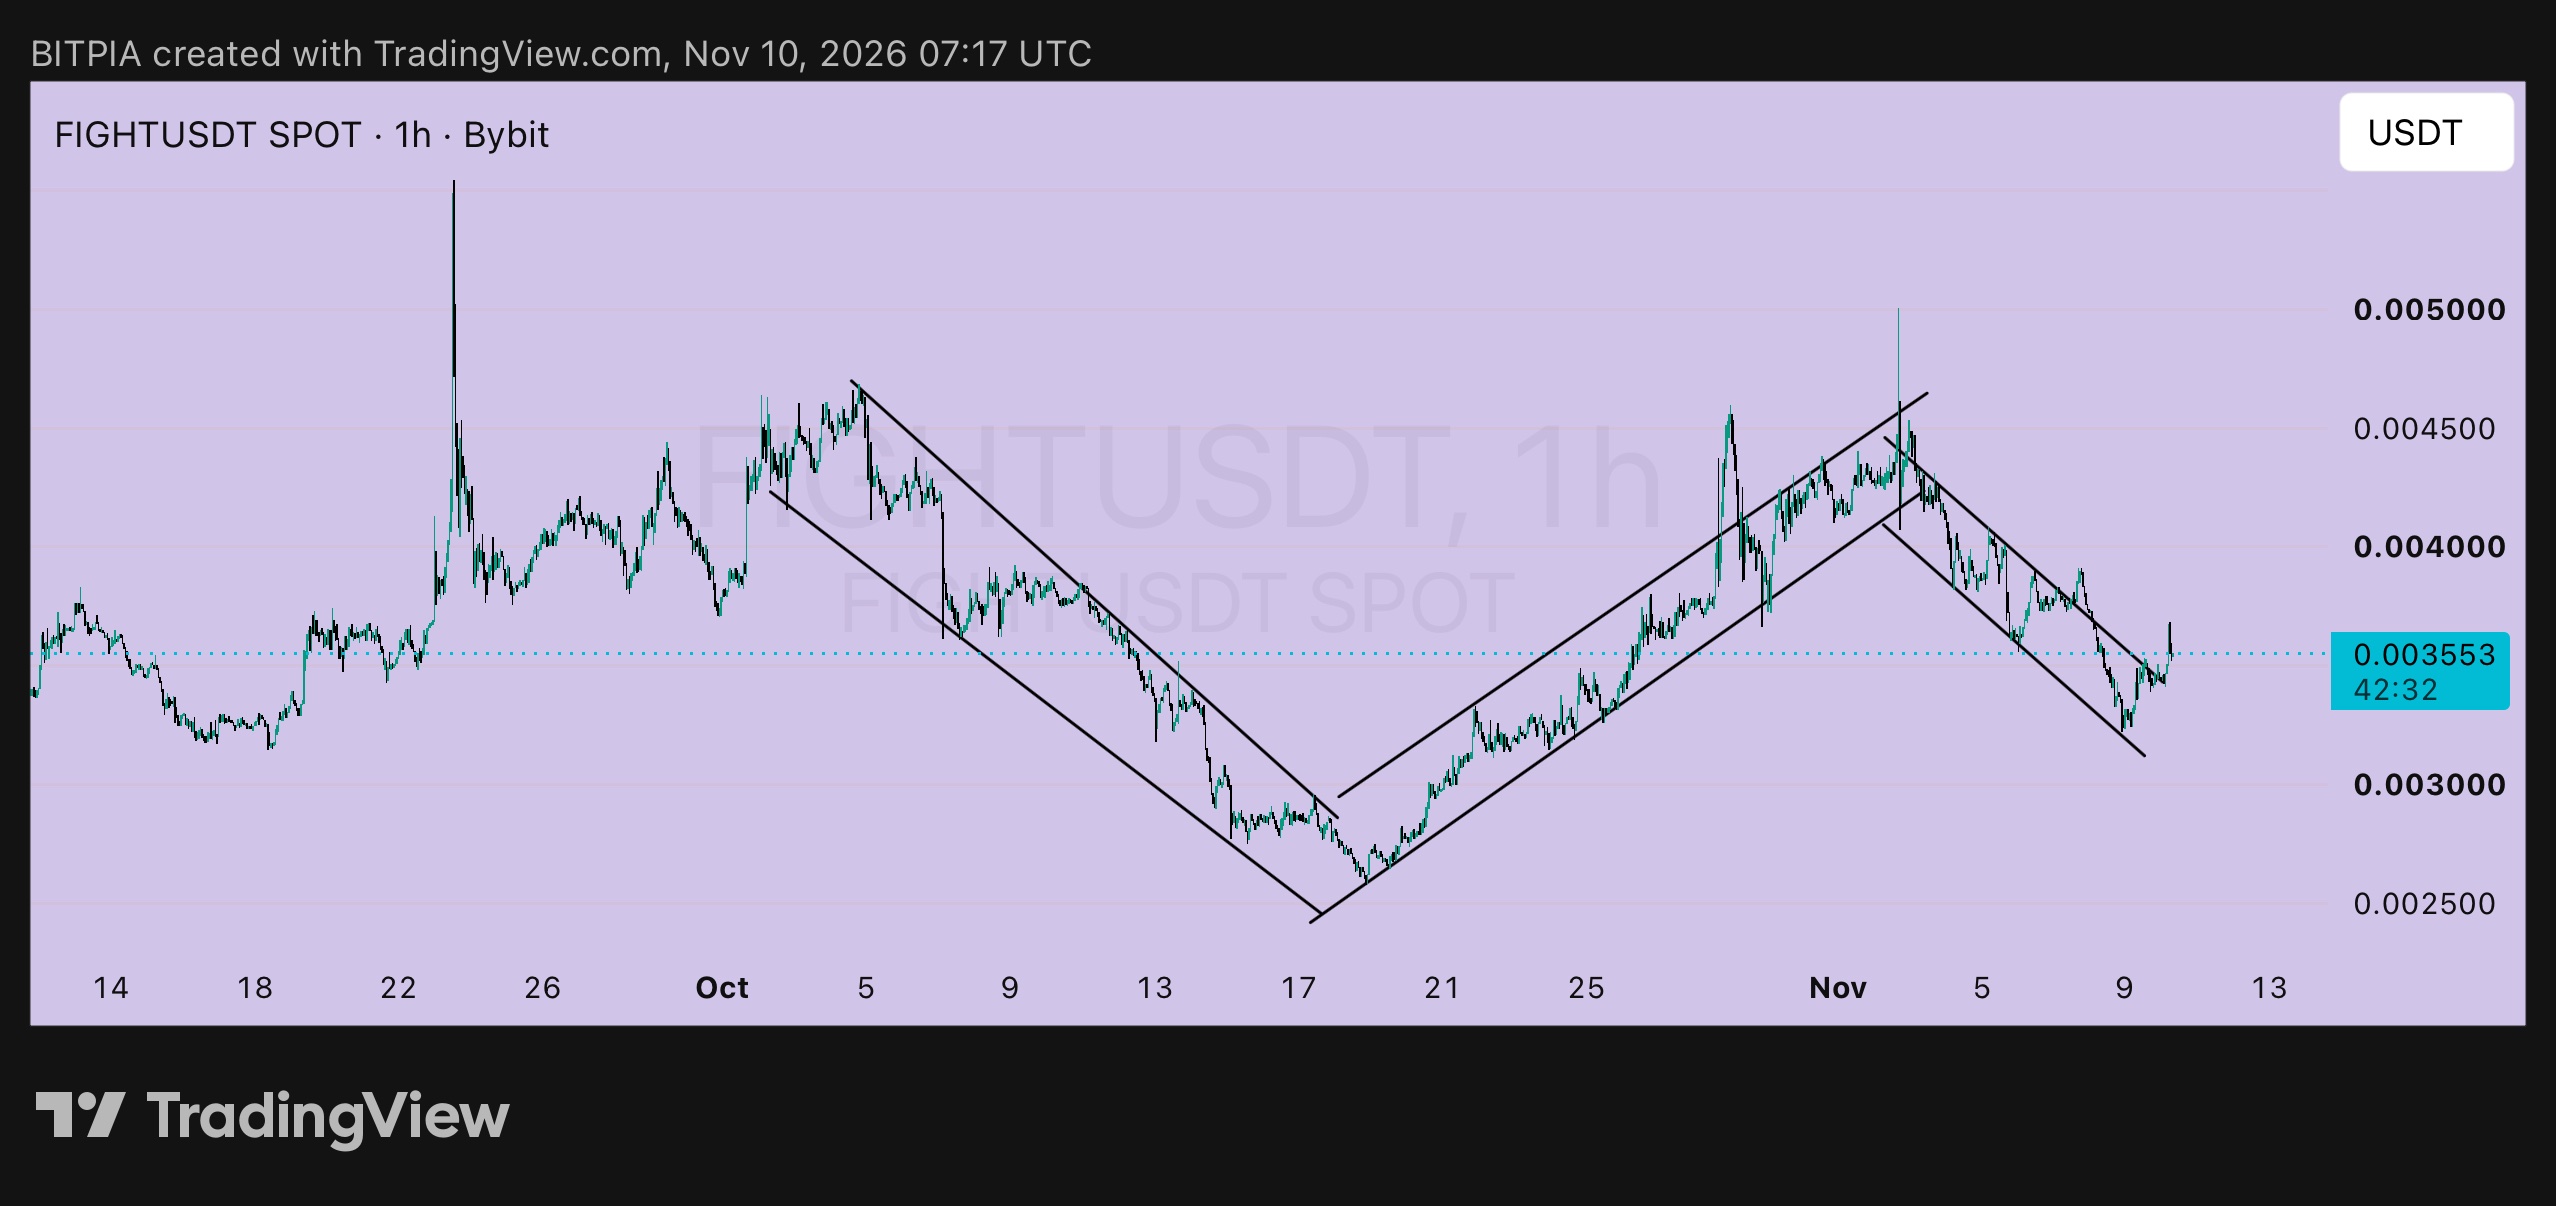
$FIGHTUSDT 4h: ¿un doble suelo en 0.00322? 🔍 El 10 de nov. publiqué $FIGHT en 0.003553 después de que rompió el canal bajista, con dos planes: un cierre por encima de 0.00358 (entrada 0.00360, stop 0.00330) o una nueva prueba cerca de 0.00345 (stop 0.00322). Esto es lo que pasó y lo que veo ahora. ➤ Lo que pasó ▸ El precio llegó a cerca de 0.00367 el 11 de nov., pero no se mantuvo por encima de 0.00358 por mucho tiempo, así que ese máximo es un máximo más bajo ▸ Luego retrocedió e hizo un mínimo cerca de 0.00322 ayer, esencialmente el mismo mínimo del 9 de nov. ▸ Si tomaste la entrada de la nueva prueba cerca de 0.00345 y usaste el stop de 0.00322, estuviste en o muy cerca de ser sacado por el stop, cerca de -1R. Si esperaste un cierre de 4h, tu stop podría seguir activo. De cualquier manera, no oculto el hecho de que el tramo alcista falló ➤ Lo que veo ahora ▸ Un doble suelo cerca de 0.00322, formado con cuatro días de diferencia ▸ El precio está en 0.003377, rebotando, pero todavía dentro del canal bajista en la gráfica de 4h ▸ El patrón de zigzag anterior de octubre no se ha repetido. El mercado dio un máximo más bajo en su lugar Un doble suelo puede ser el inicio de una base, o solo una pausa antes de otro tramo a la baja. Quiero pruebas, no esperanza. ➤ Plan A: el suelo ▸ Entrada: alrededor de 0.00330, solo si el nivel de 0.00322 se mantiene por tercera vez ▸ Stop-loss: debajo de 0.00310 ▸ Riesgo por unidad: 0.00020 ▸ Objetivo 1: 0.00360, +0.00030, cerca de 1.5R ▸ Objetivo 2: 0.00385, +0.00055, cerca de 2.75R ▸ Objetivo 3: 0.00420, +0.00090, cerca de 4.5R ➤ Plan B: esperar la ruptura ▸ Disparador: un cierre de 4h por encima de 0.00350 ▸ Entrada: alrededor de 0.00355 ▸ Stop-loss: debajo de 0.00330 ▸ Riesgo por unidad: 0.00025 ▸ Objetivos: 0.00385 (cerca de 1.2R) y 0.00420 (+0.00065, cerca de 2.6R) ➤ Qué lo cancela Un cierre de 4h por debajo de 0.00310 significa que el doble suelo ha fallado. Entonces 0.0030 y el área de 0.0026 de octubre son los siguientes niveles a vigilar, y yo esperaría. Tamaño de posición pequeño, y bajo apalancamiento si usas perpetuos. No es consejo financiero. Haz tu propia investigación y solo arriesga lo que puedas permitirte perder. #ByXIMPACT #WSOT2026
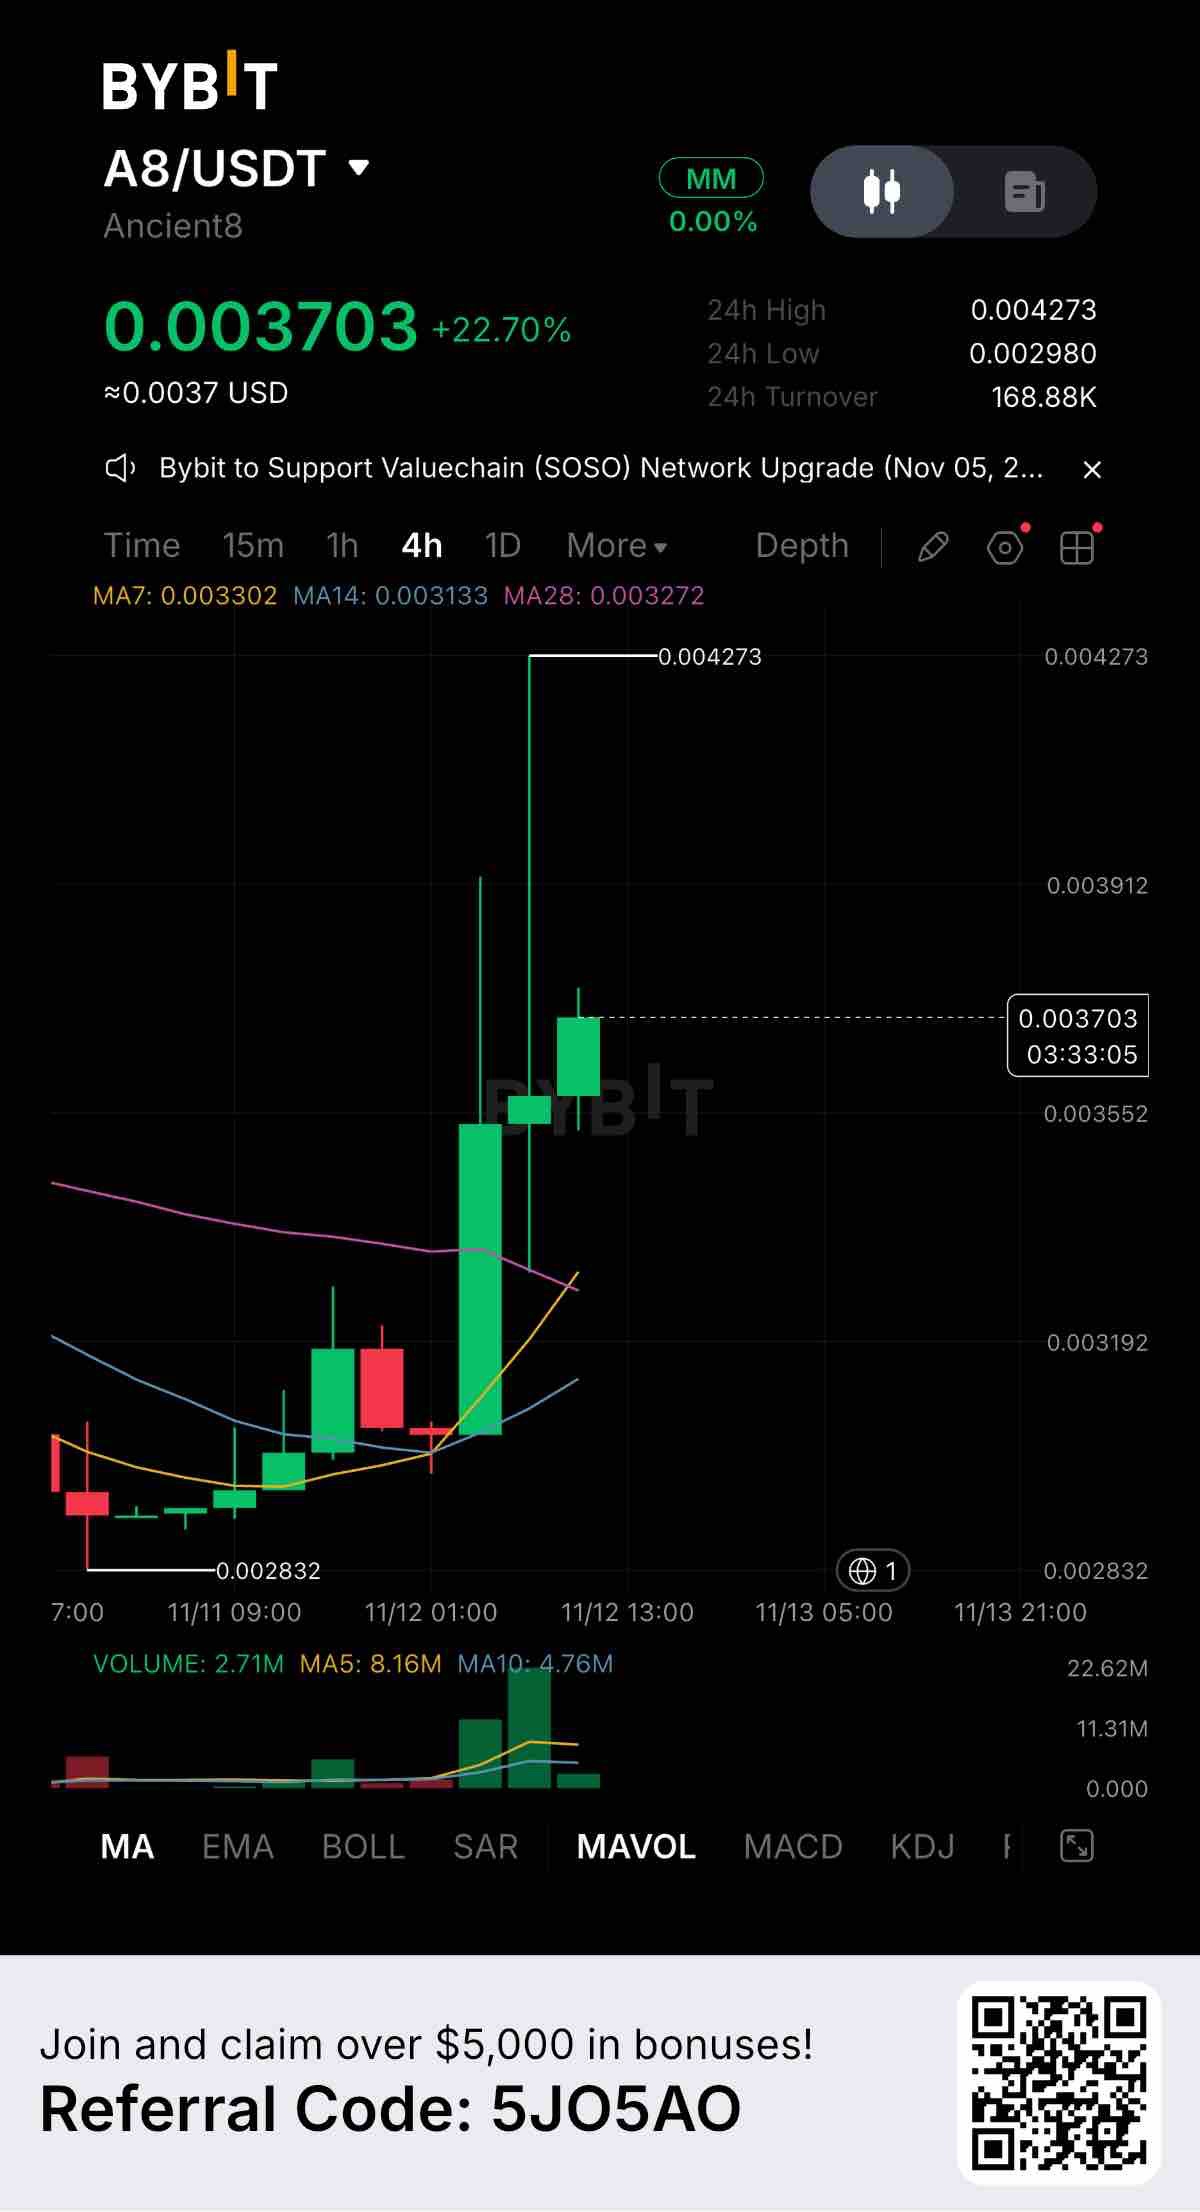
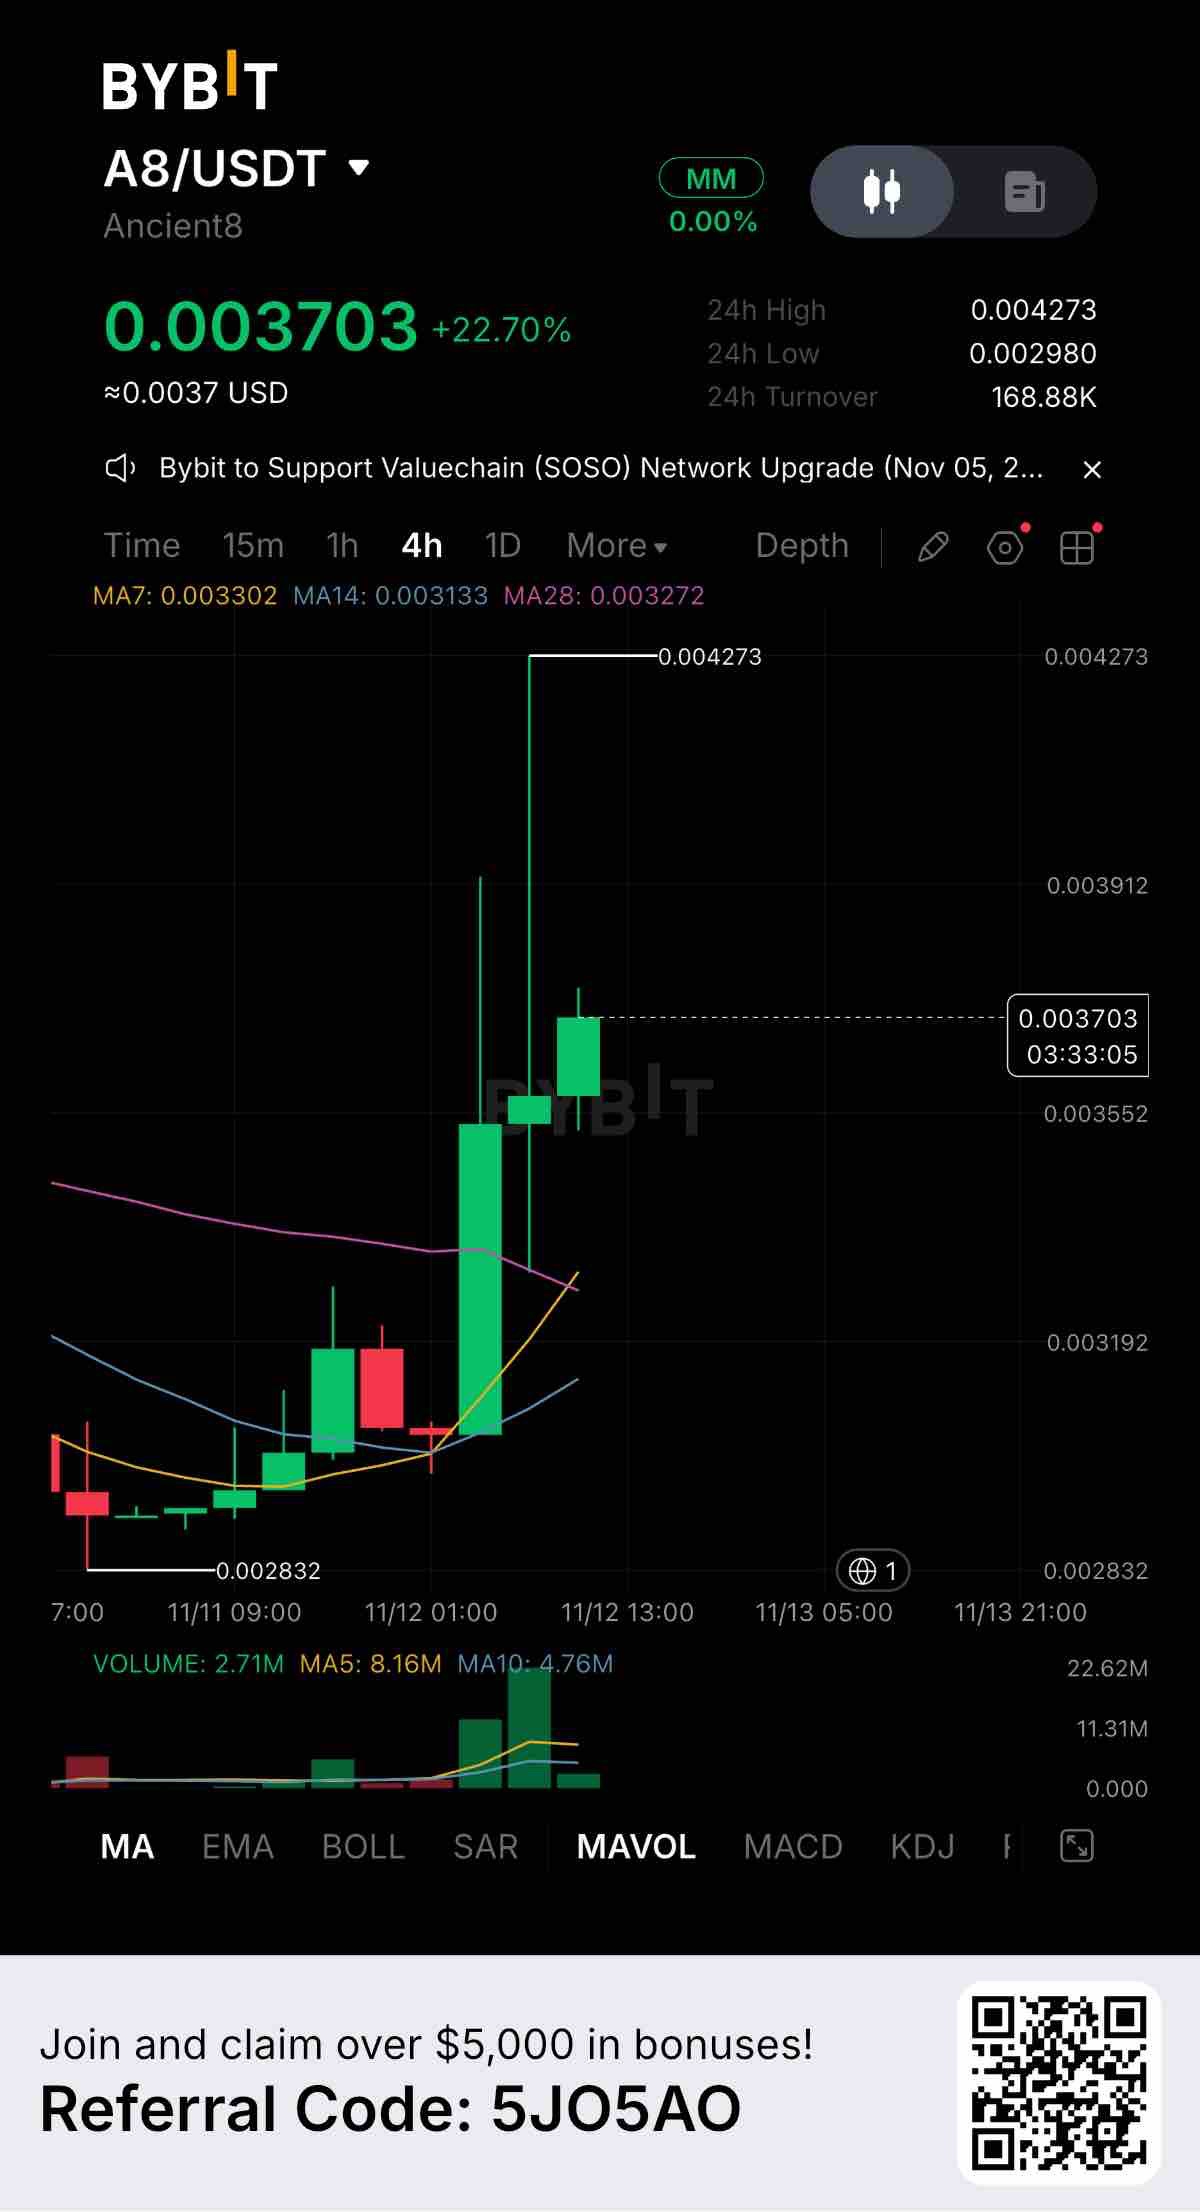
$A8USDT is putting on a wild show on the 4-hour chart, currently trading at 0.003703 with a massive +22.70% gain. This chart is a textbook example of extreme volatility. We saw an aggressive pump that left a massive upper wick stretching all the way to 0.004273 before sellers forcefully pushed the price back down. Key Levels to Watch: Resistance: 0.004273 (The top of the massive wick and the clear 24-hour high) Support 1: 0.003302 (7-day MA, the immediate dynamic support holding the current price) Support 2: 0.002980 (24-hour low, the structural floor) The moving averages are starting to cross over bullishly, and price is currently holding above MA7, MA14, and MA28. After that violent rejection at the highs, the price is now trying to stabilize. We are seeing a smaller green candle forming, indicating that buyers are attempting to build a base and defend the current levels. Volume is the main story here. The volume spike during the initial pump was massive, but 24-hour turnover has settled at 168.88K USDT. The key now is whether we see a surge of buying volume to push back up, or if the momentum is fading after that huge rejection. Fundamentally, Ancient8 (A8) is experiencing a sudden surge in market interest. Spikes like this often come from ecosystem news, but the heavy wick proves that sellers are very active at the top. If buyers can hold the 0.003302 support and build momentum, a retest of the highs is possible. But be careful: if support breaks, we could easily slide back down to the 0.002980 base. How are you playing this A8 volatility? Are you buying the dip or waiting for the dust to settle? Let me know below. #ByXIMPACT #WSOT2026
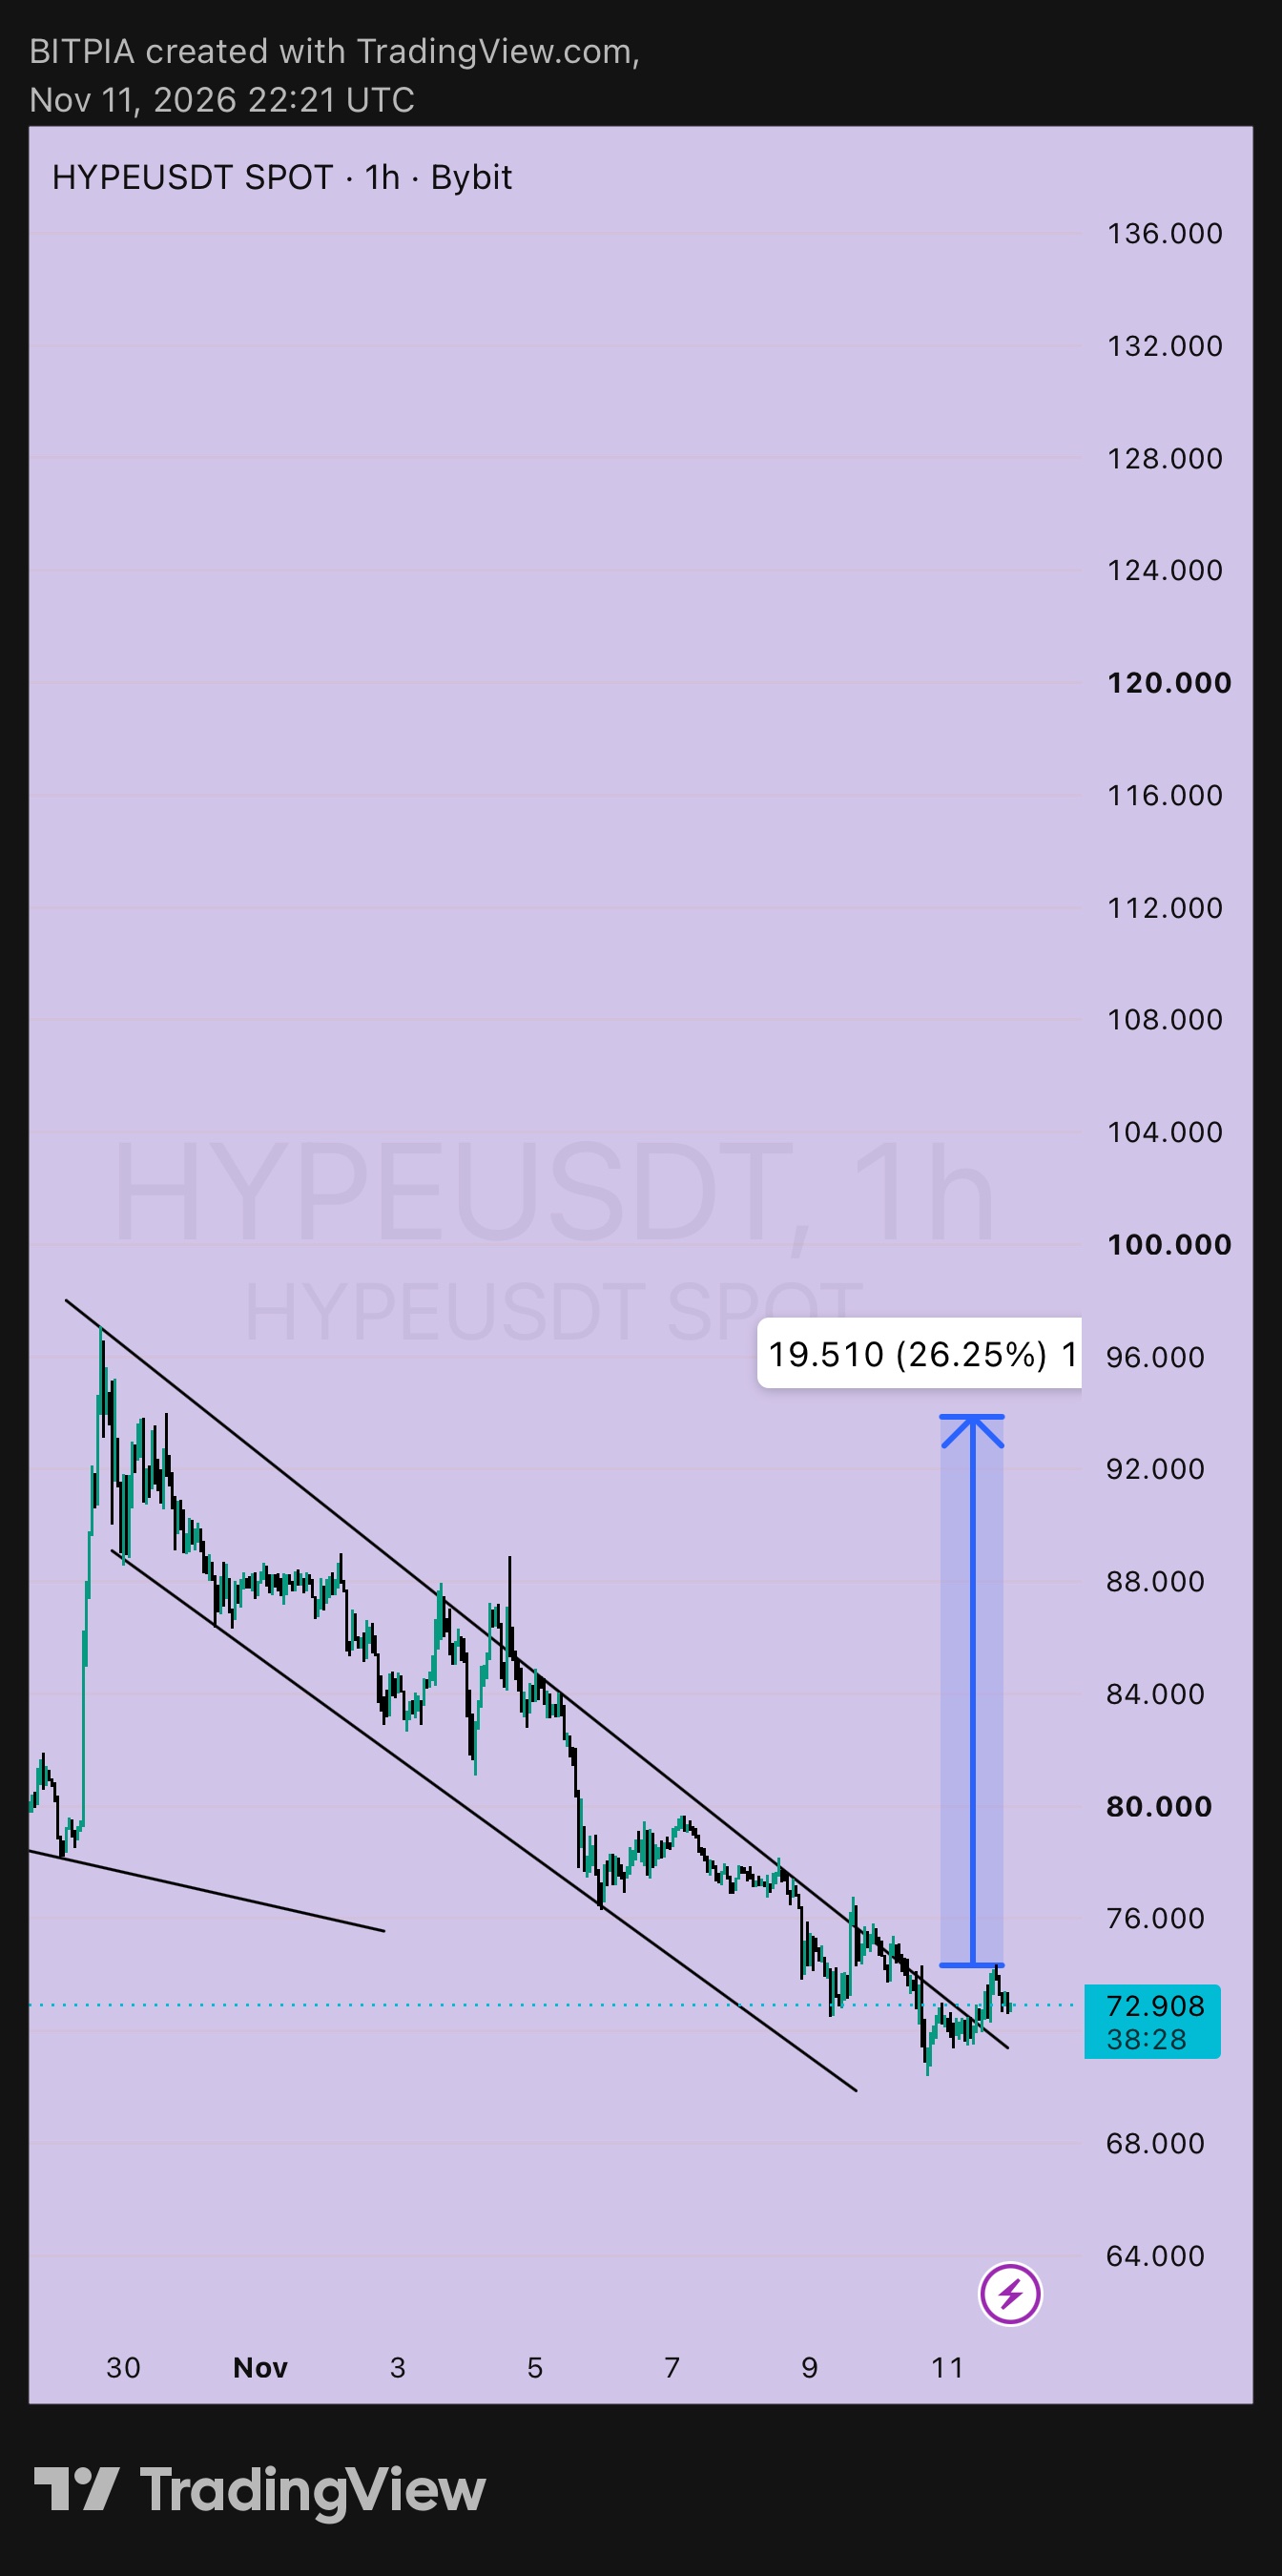
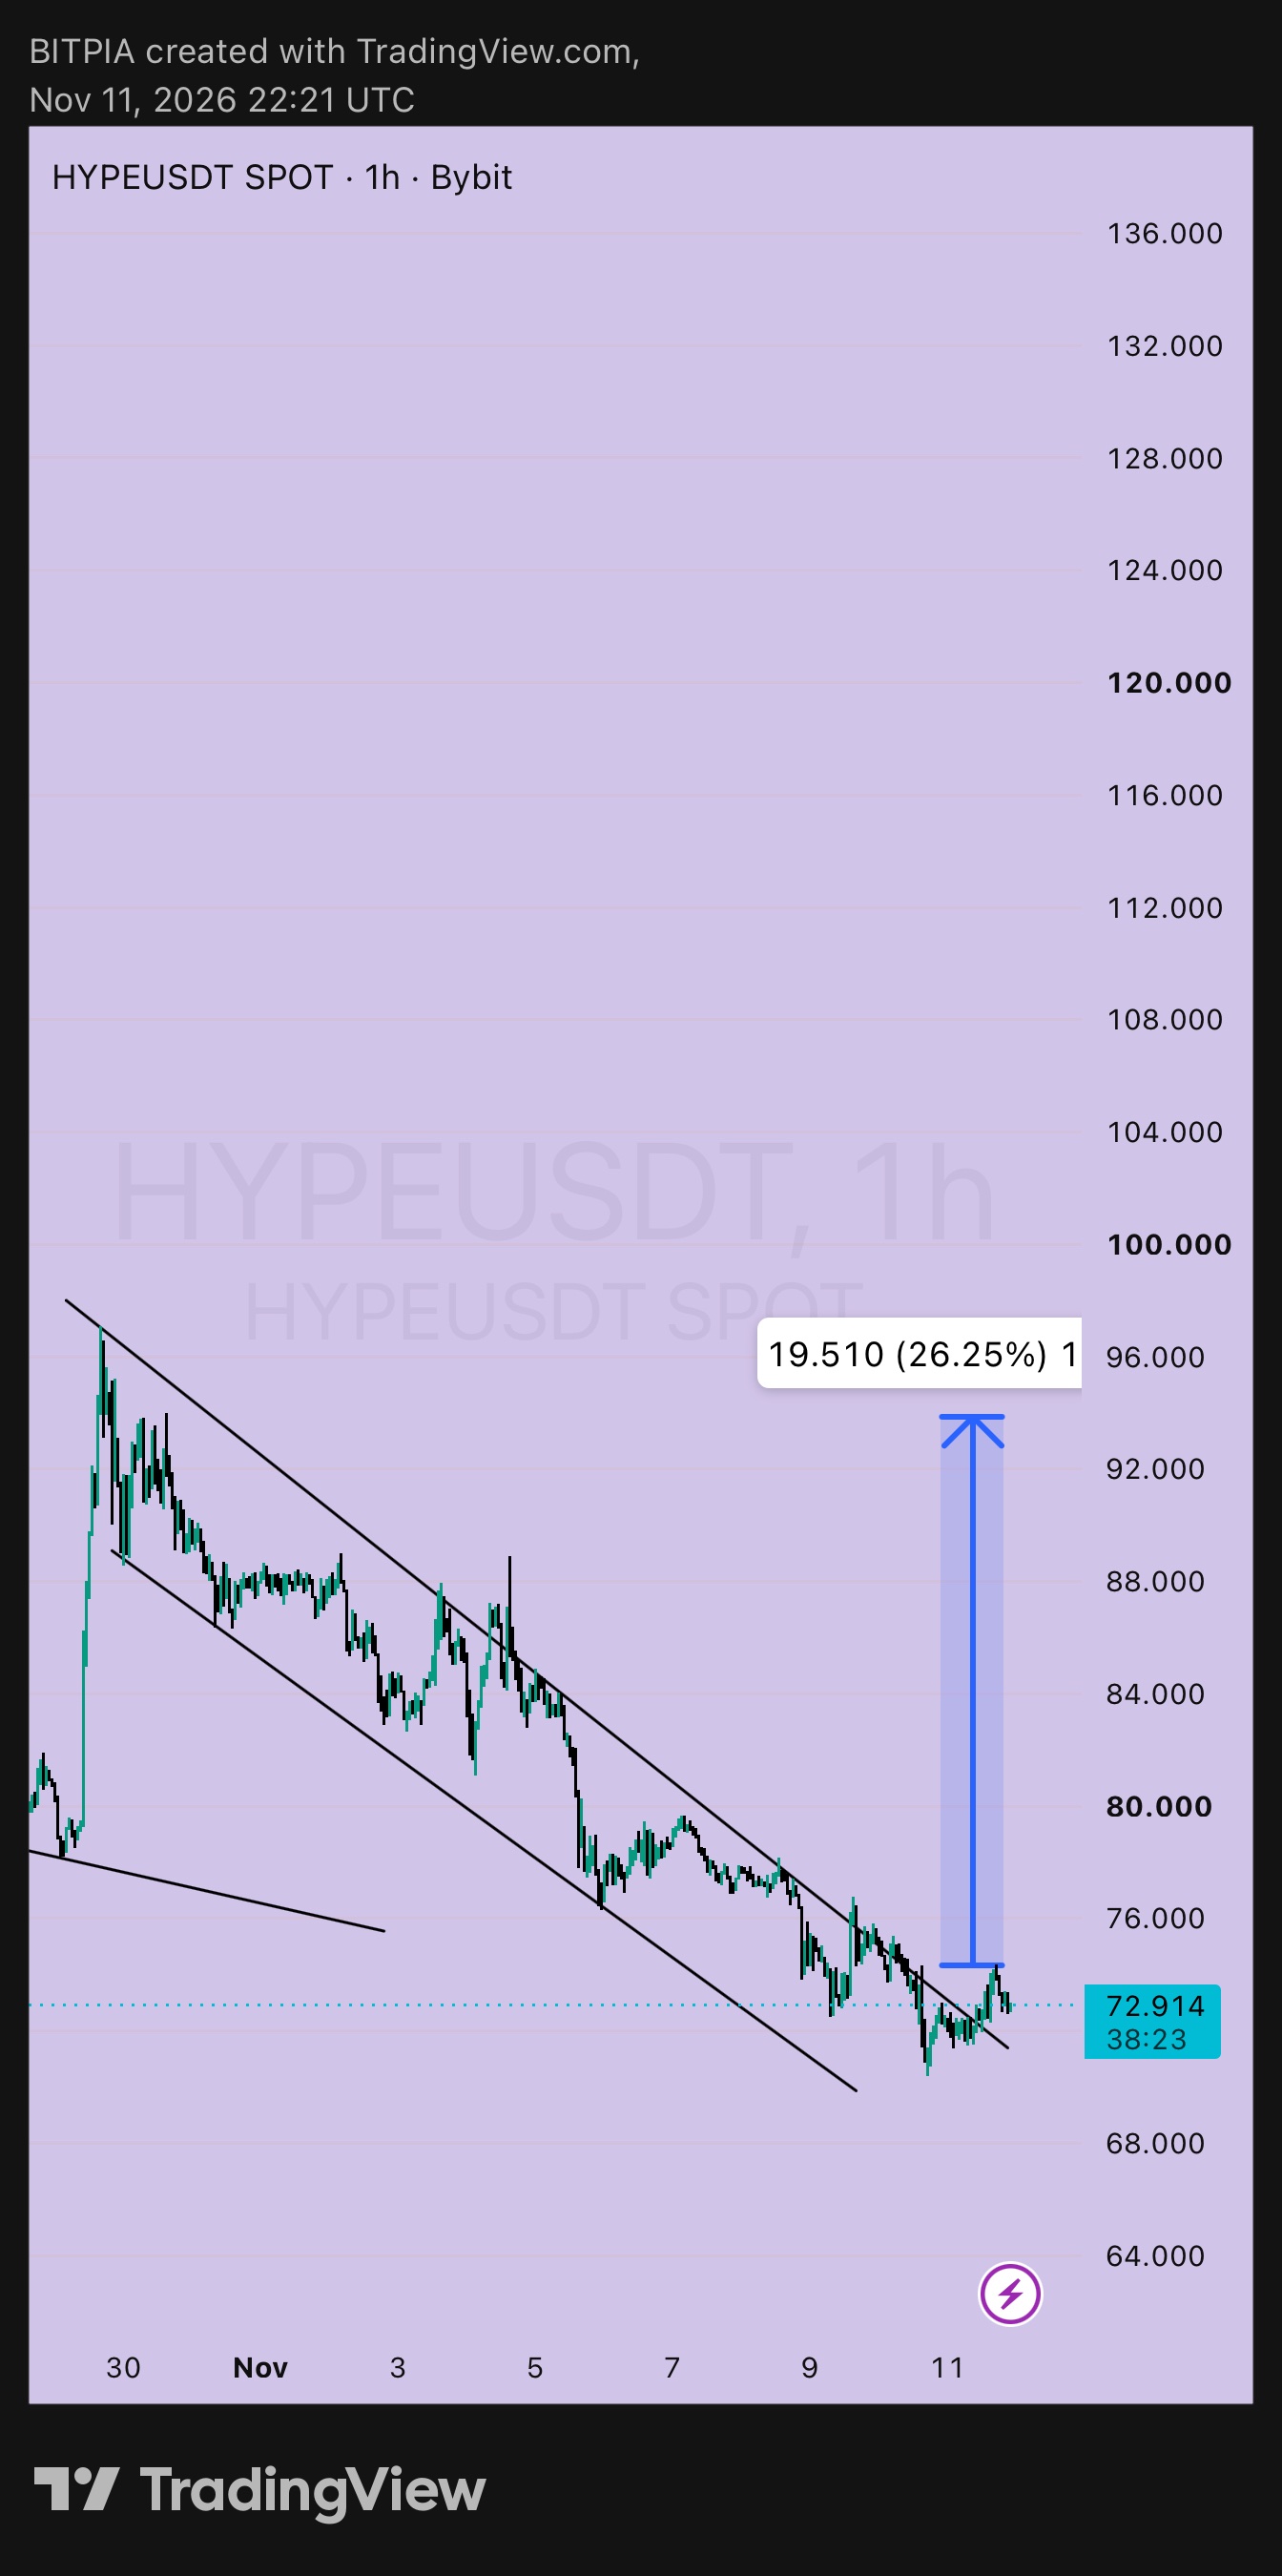
$HYPEUSDT 1h: notas para mí mismo ➤ Nota 1: dónde estoy parado El 9 de nov publiqué HYPE en 73.802 dentro de un canal bajista, con un Plan A para comprar cerca de 72.0 y un stop bajo 69.5. El precio bajó a cerca de 70.3 y regresó, así que es probable que esa entrada se haya completado. Ahora está en 72.914, alrededor de +0.9 por unidad, aproximadamente 0.4R de ganancia. ➤ Nota 2: qué cambió ▸ El precio se ha movido por encima de la línea superior del canal, que se ubica cerca de 72 a 73, y la está probando justo ahora ▸ El mínimo cerca de 70.3 se mantuvo por encima de mi stop de 69.5, así que el plan sigue intacto ▸ El movimiento medido en mi gráfico todavía apunta a cerca de 94, alrededor de un 26% por encima del extremo inferior del canal ➤ Nota 3: qué hago con la operación abierta ▸ Mantener el stop en 69.5 hasta un cierre de 1h por encima de 76 ▸ Después de eso, moverlo a punto de equilibrio cerca de 72 ▸ Objetivos: 77 (+5, alrededor de 2R), 82.5 (+10.5, alrededor de 4.2R), 94 (+22, alrededor de 8.8R, es arriesgado, así que solo dejaría una parte pequeña para eso) ➤ Nota 4: qué haría si no estoy dentro ▸ Entrada: alrededor de 72.5, en una prueba de la línea del canal rota que se mantenga ▸ Stop-loss: por debajo de 69.8 ▸ Riesgo por unidad: 2.7 ▸ Objetivos: 77 (+4.5, alrededor de 1.7R) y 82.5 (+10, alrededor de 3.7R) ▸ Comprar en 72.9 con el mismo stop significa un riesgo de 3.1, y 77 está a cerca de 1.3R de distancia. Es posible, pero una prueba de la línea da mejores números ➤ Nota 5: el Plan B sigue esperando ▸ Activador: un cierre de 1h por encima de 77.5 ▸ Entrada: alrededor de 78, stop por debajo de 74, riesgo 4 ▸ Objetivos: 82.5 (alrededor de 1.1R), 90 (alrededor de 3R), 94 (alrededor de 4R) ➤ Nota 6: qué lo cancela Un cierre de 1h por debajo de 69.5 significa que la ruptura falló, y me hago a un lado. Tamaño de posición pequeño, y bajo apalancamiento si usas perps. Ahora vete a dormir. 🌙 No es asesoría financiera. Haz tu propia investigación y solo arriesga lo que puedas permitirte perder. #ByXIMPACT #WSOT2026
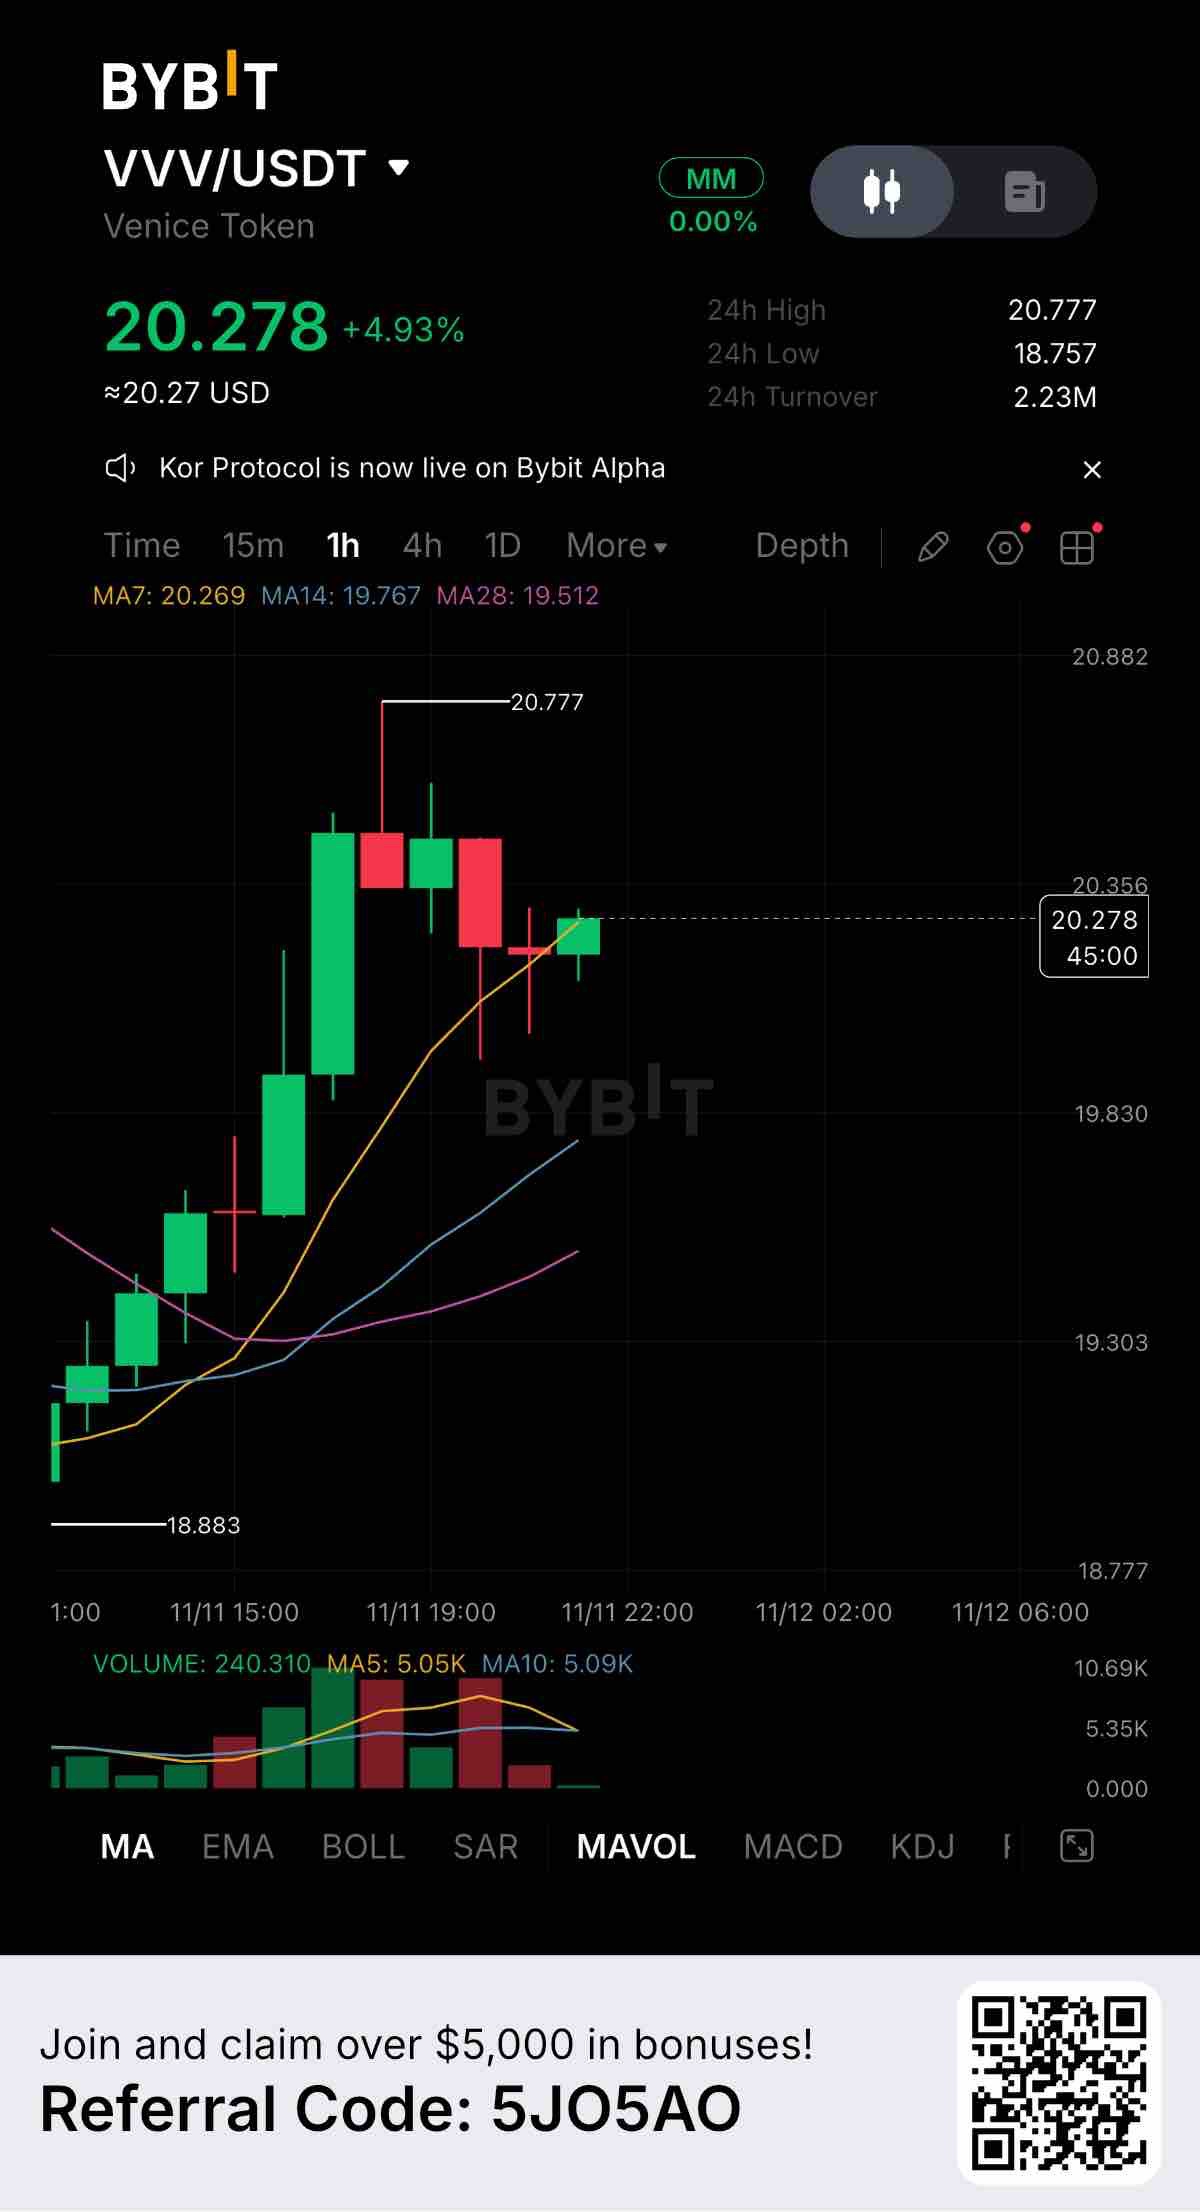
$VVVUSDT está mostrando un comportamiento clásico del mercado en el gráfico de 1 hora, cotizando actualmente en 20.278 con una ganancia del +4.93%. Después de un repunte pronunciado que llevó el precio a un máximo de 24 horas de 20.777, ahora estamos viendo un retroceso saludable a medida que los primeros compradores toman algunas ganancias. Niveles Clave a Observar: Resistencia: 20.777 (El pico reciente donde entraron los vendedores) Soporte 1: 20.269 (Media móvil de 7 días, actuando como el campo de batalla inmediato en este momento) Soporte 2: 18.757 (Mínimo de 24 horas, el soporte estructural más fuerte por debajo) Mirando las medias móviles, la tendencia sigue siendo alcista en general. El precio se mantiene justo en la media móvil de 7 días (20.269) y permanece muy por encima de la MA14 (19.767) y la MA28 (19.512). La prueba actual es si la media móvil de 7 días se mantendrá como soporte o se romperá. El volumen es saludable, con 2.23M de USDT en volumen de transacciones de 24 horas. El gráfico muestra que el volumen de venta durante este retroceso es mucho menor que el volumen de compra durante el impulso inicial, lo cual es una buena señal para los toros. Fundamentalmente, Venice Token (VVV) está manteniendo bien sus ganancias recientes. Retrocesos como este a menudo son necesarios para enfriar los indicadores sobrecalentados y permitir que entren nuevos compradores. Si el precio rebota en este nivel de soporte de 20.269, podríamos ver otro intento hacia el máximo de 20.777. Sin embargo, si pierde este nivel, es muy posible una caída hacia el área de 19.800 (cerca de la MA14). ¿Estás comprando esta caída en VVV o esperando a ver si el soporte se mantiene? Cuéntanos tus opiniones abajo. #ByXIMPACT #WSOT2026
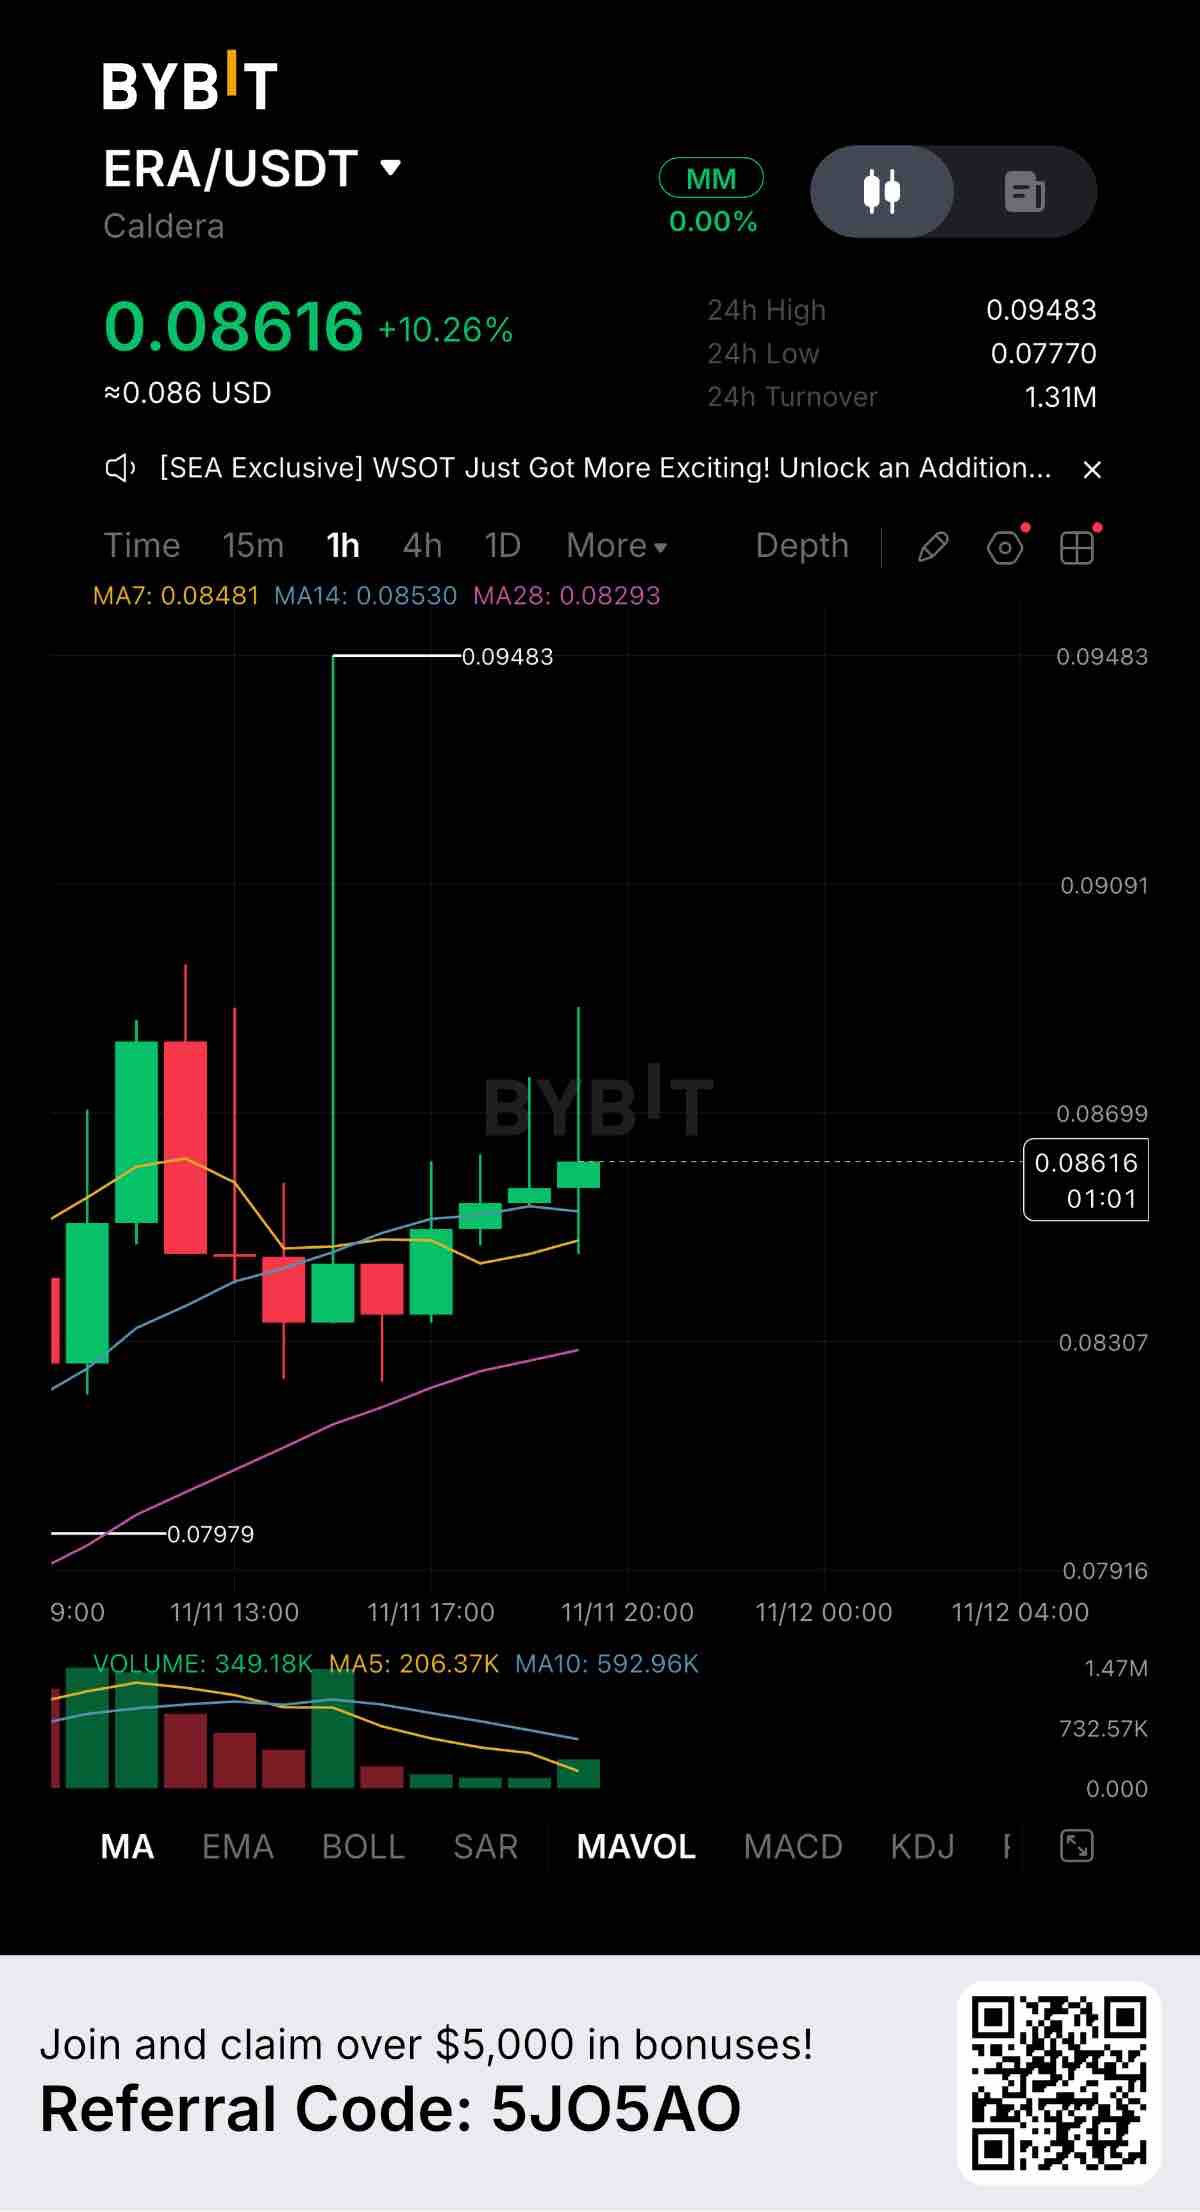
$ERAUSDT is showing interesting price action on the 1-hour chart, currently trading at 0.08616 with a solid +10.26% gain. However, looking closely at the chart, this isn't a simple straight line up. We saw a massive volatility spike that left a huge upper wick reaching all the way to 0.09483 before sellers pushed the price back down. Key Levels to Watch: Resistance: 0.09483 (The massive 24-hour high and the top of the recent wick) Support 1: 0.08481 (7-day MA, acting as immediate dynamic support) Support 2: 0.07770 (24-hour low, the structural floor) The moving averages are currently pinching together, but price is holding above MA7, MA14, and MA28. After that massive spike and rejection, the price is now consolidating and forming a series of smaller green candles. This suggests buyers are trying to build a base and regain control. Volume is a key factor here. The initial spike was met with heavy selling pressure, but the 24-hour turnover remains strong at 1.31M USDT. We need to see if buying volume can step back in to push through the previous rejection zone. Fundamentally, Caldera (ERA) is getting attention, and the sudden volatility spike often points to a reaction to news or a liquidity grab by larger players. If buyers can build enough momentum to test 0.09483 again, a breakout could follow. But right now, the safer play is watching to see if the 0.08481 support holds. If it does, we might have a solid setup for the next leg up. If it breaks, we could retest the lows. What is your read on ERA after that massive wick? Are you buying this consolidation? Let’s discuss in the comments. #ByXIMPACT #WSOT2026
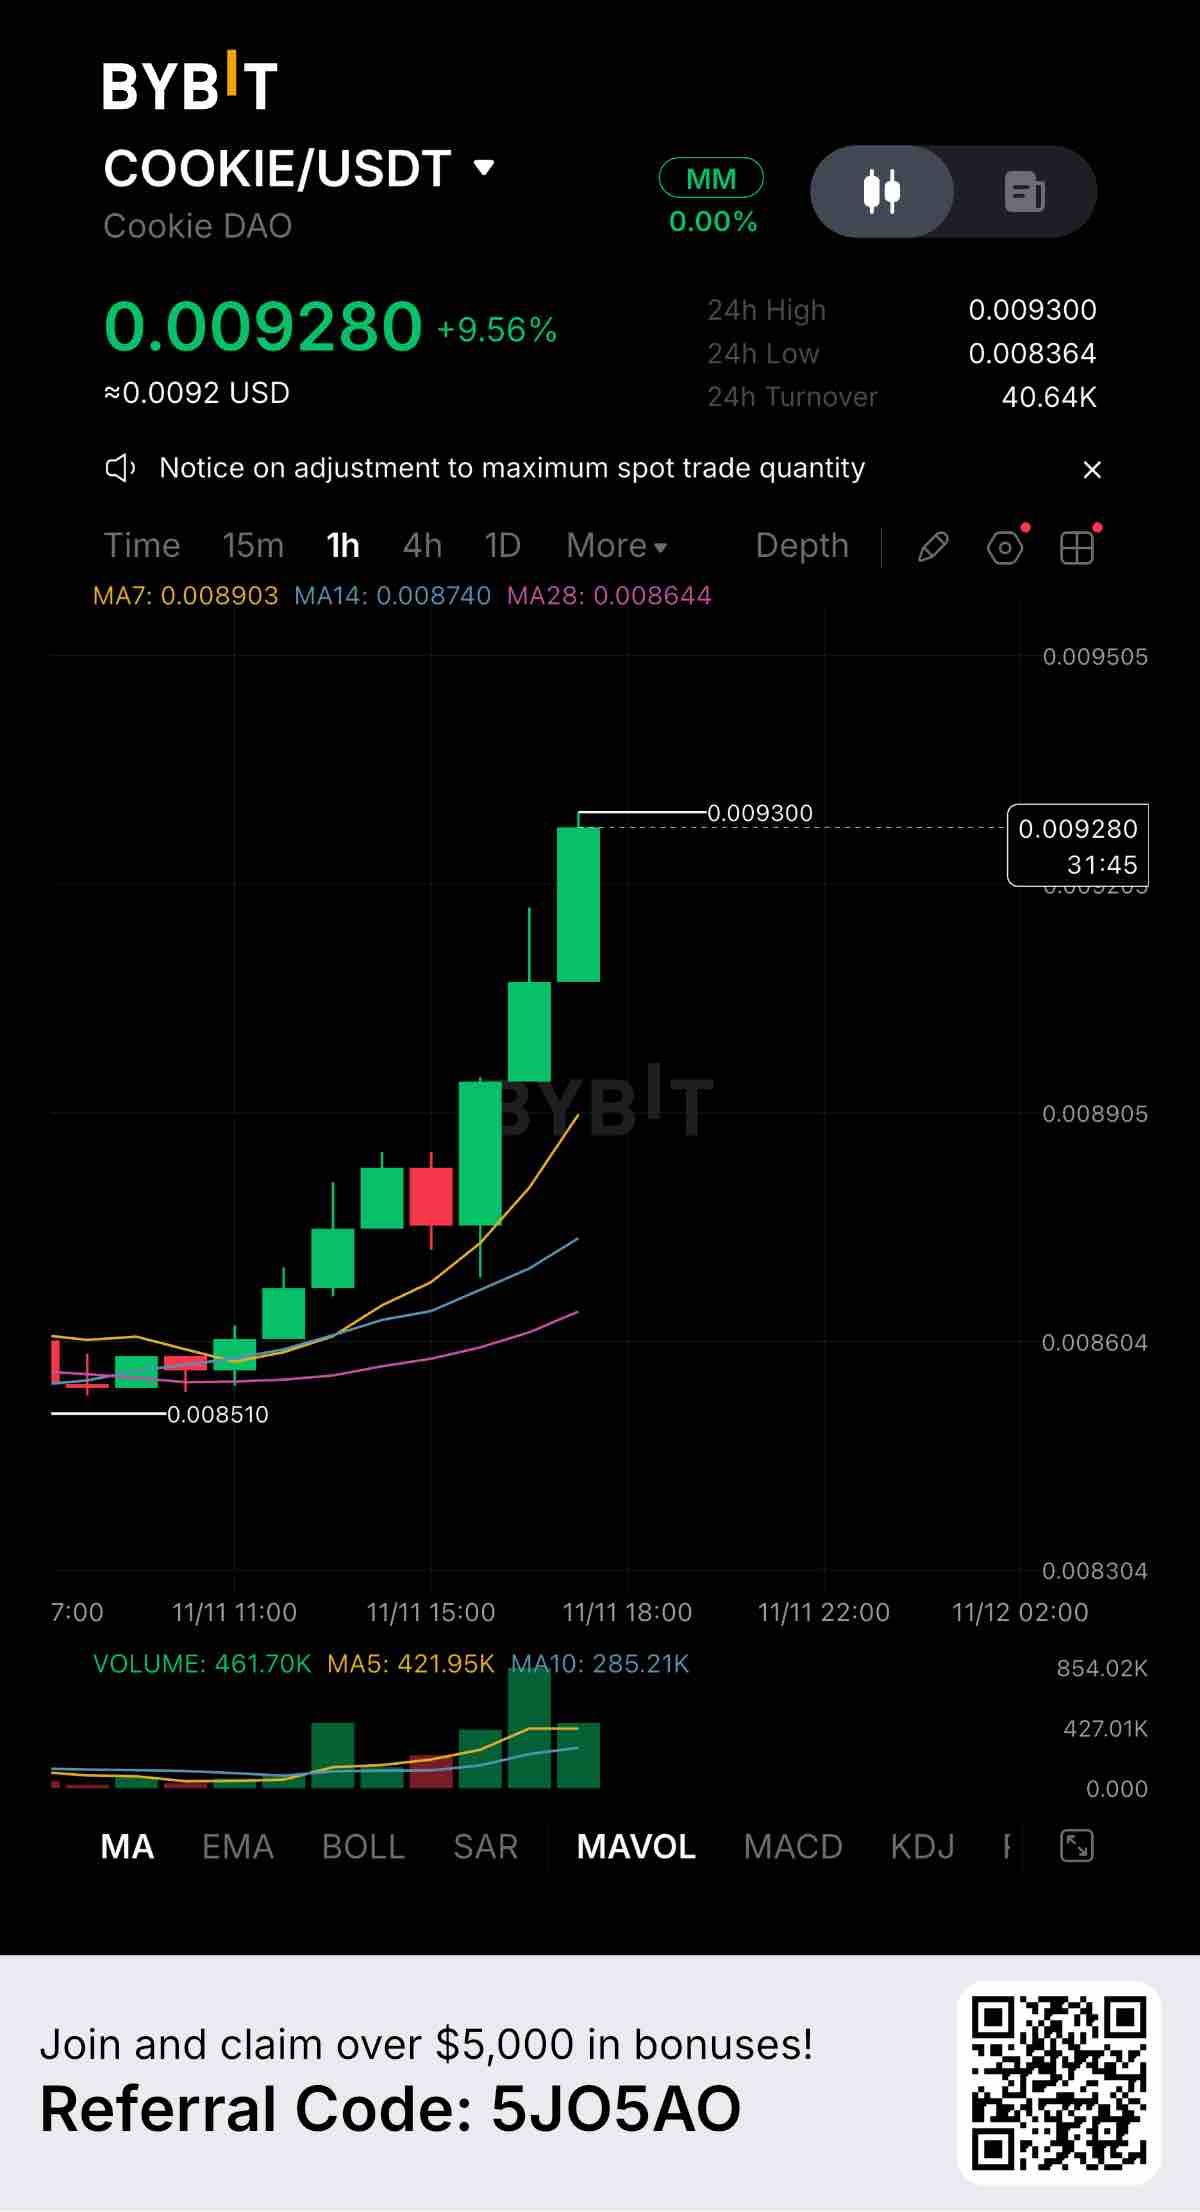
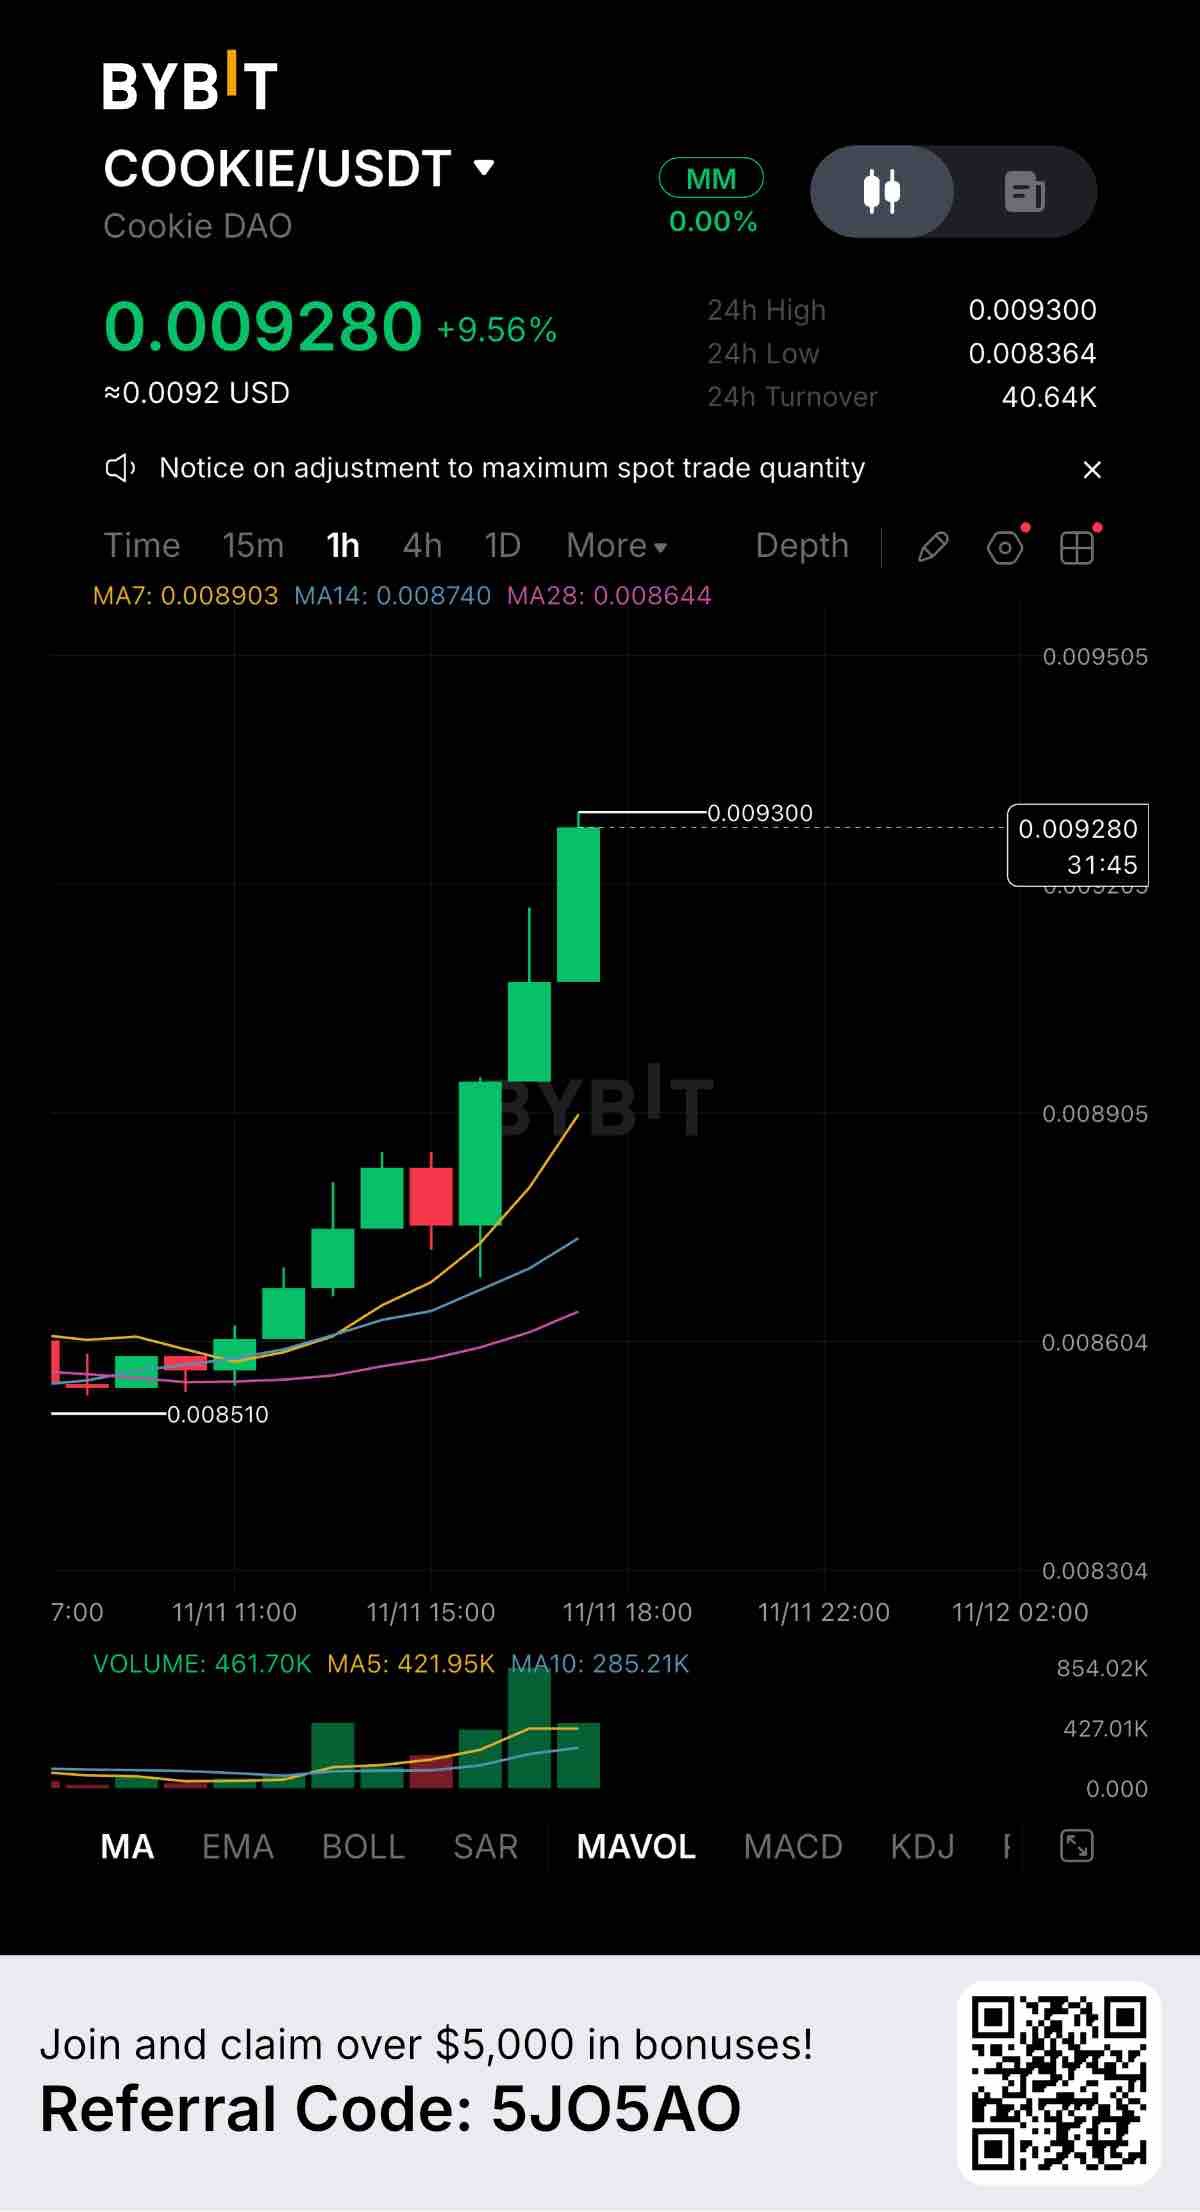
$COOKIEUSDT is putting in serious work on the 1-hour chart, currently trading at 0.009280 with a strong +9.56% gain. The price action is showing a relentless staircase pattern, with buyers stepping in aggressively on every pullback. Key Levels to Watch: Resistance: 0.009300 (The current 24-hour high, acting as the immediate ceiling) Support 1: 0.008903 (7-day MA, the first dynamic support zone) Support 2: 0.008364 (24-hour low, the stronger structural floor) The moving averages are perfectly fanned out. Price is trading well above MA7, MA14, and MA28, confirming a highly aggressive short-term uptrend. The chart shows almost no selling resistance, with only minor red candles before the next leg up. Volume is the real confirmation here. The green volume bars are expanding as the price pushes higher, backed by 40.64K USDT in 24-hour turnover. This indicates genuine buying pressure, not just low-liquidity spikes. Fundamentally, Cookie DAO (COOKIE) is capturing heavy attention. Steady, stair-step moves like this usually indicate strong community momentum and active accumulation. If buyers manage to break and hold above 0.009300, price discovery is likely. However, because the price is extended from the 7-day MA, chasing here carries risk. A retest of 0.008903 is the safer setup if you are looking to enter. Are you holding COOKIE or waiting for a pullback? Let’s hear your thoughts below. #ByXIMPACT #WSOT2026
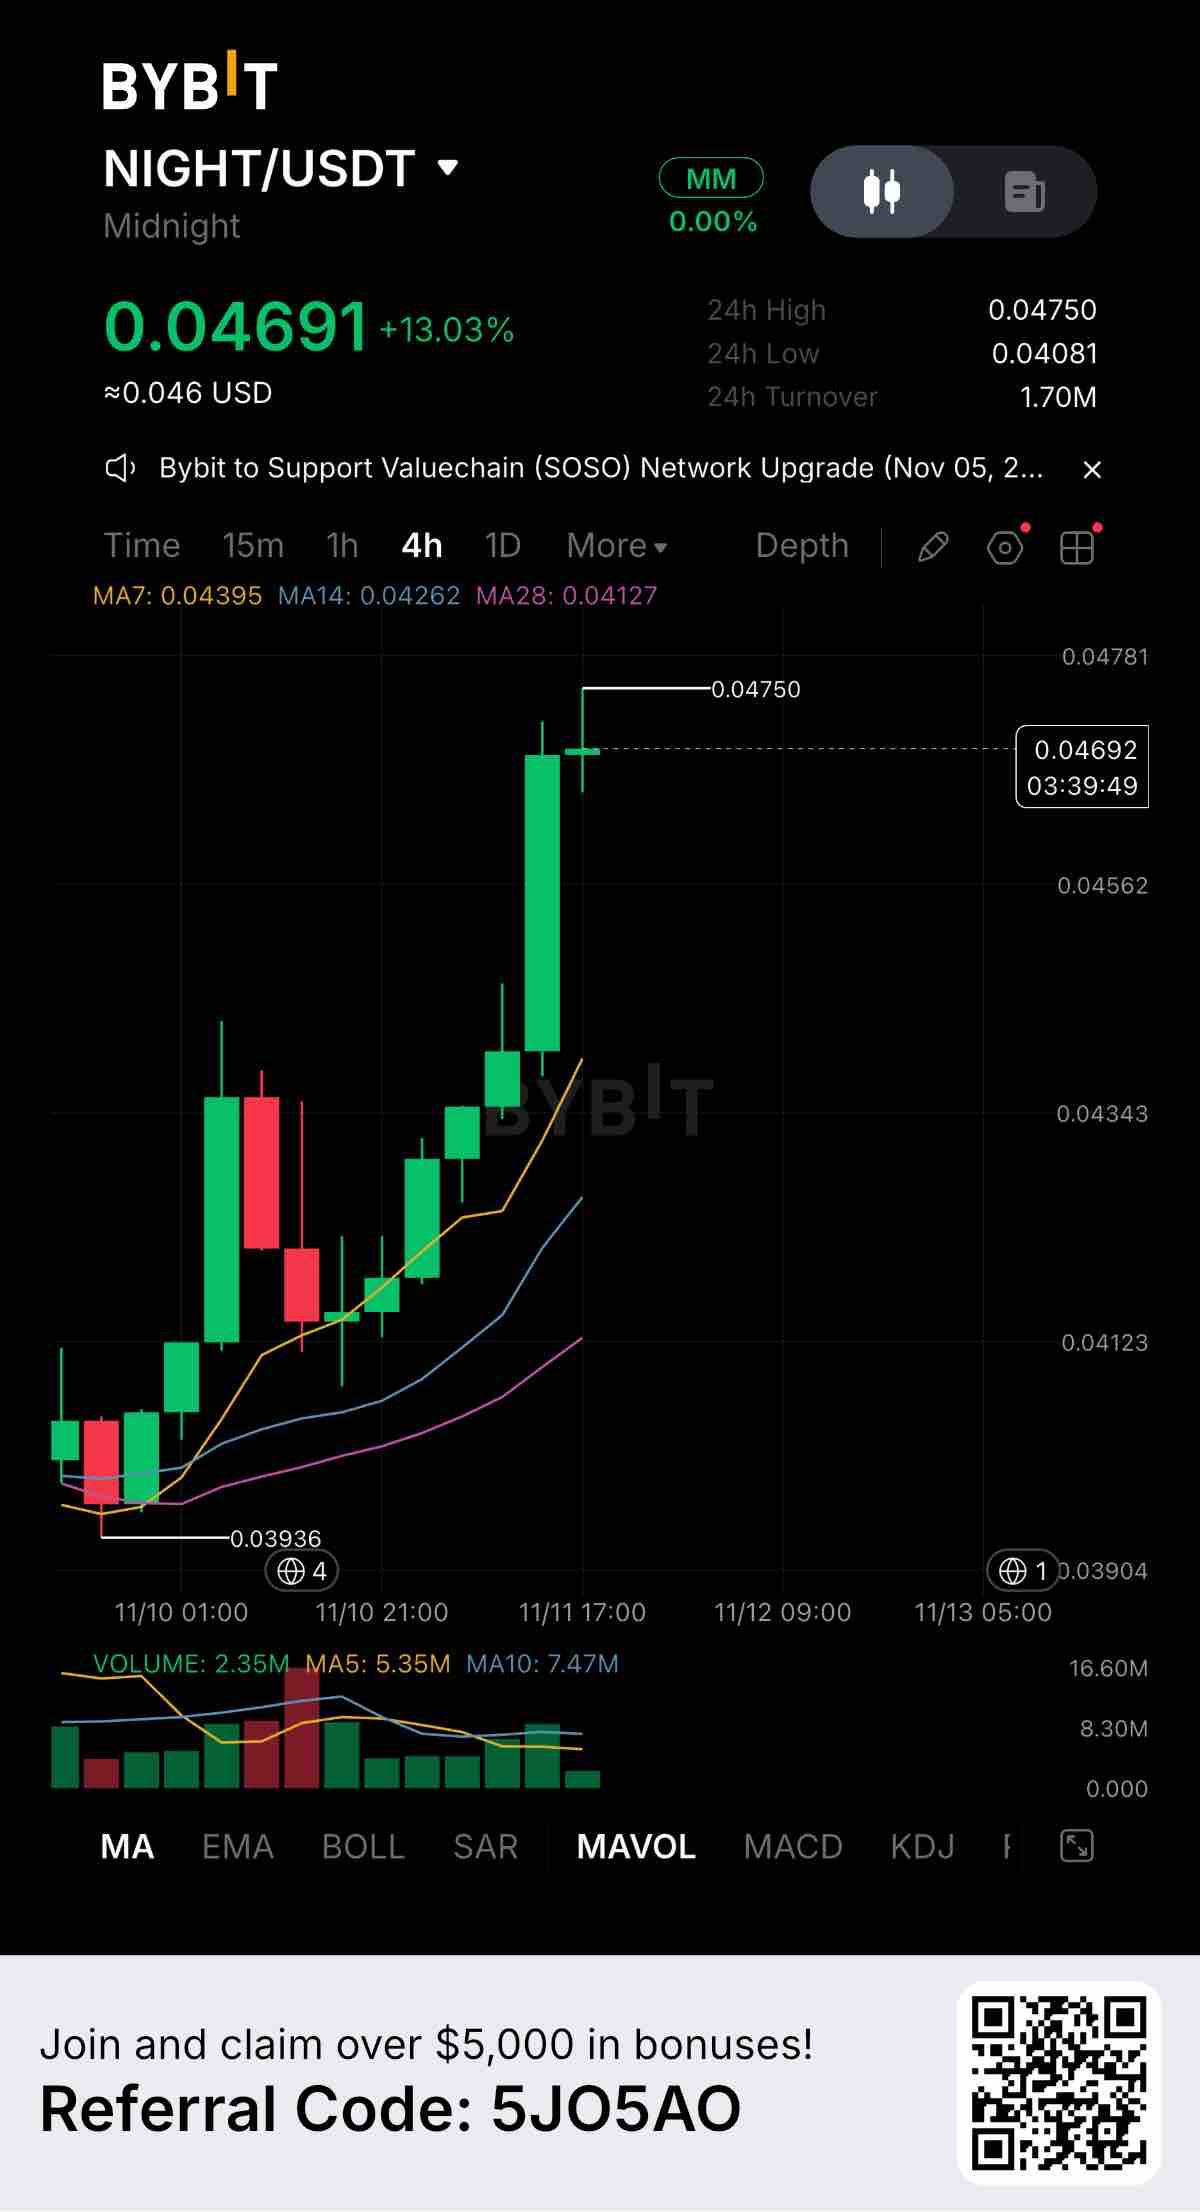
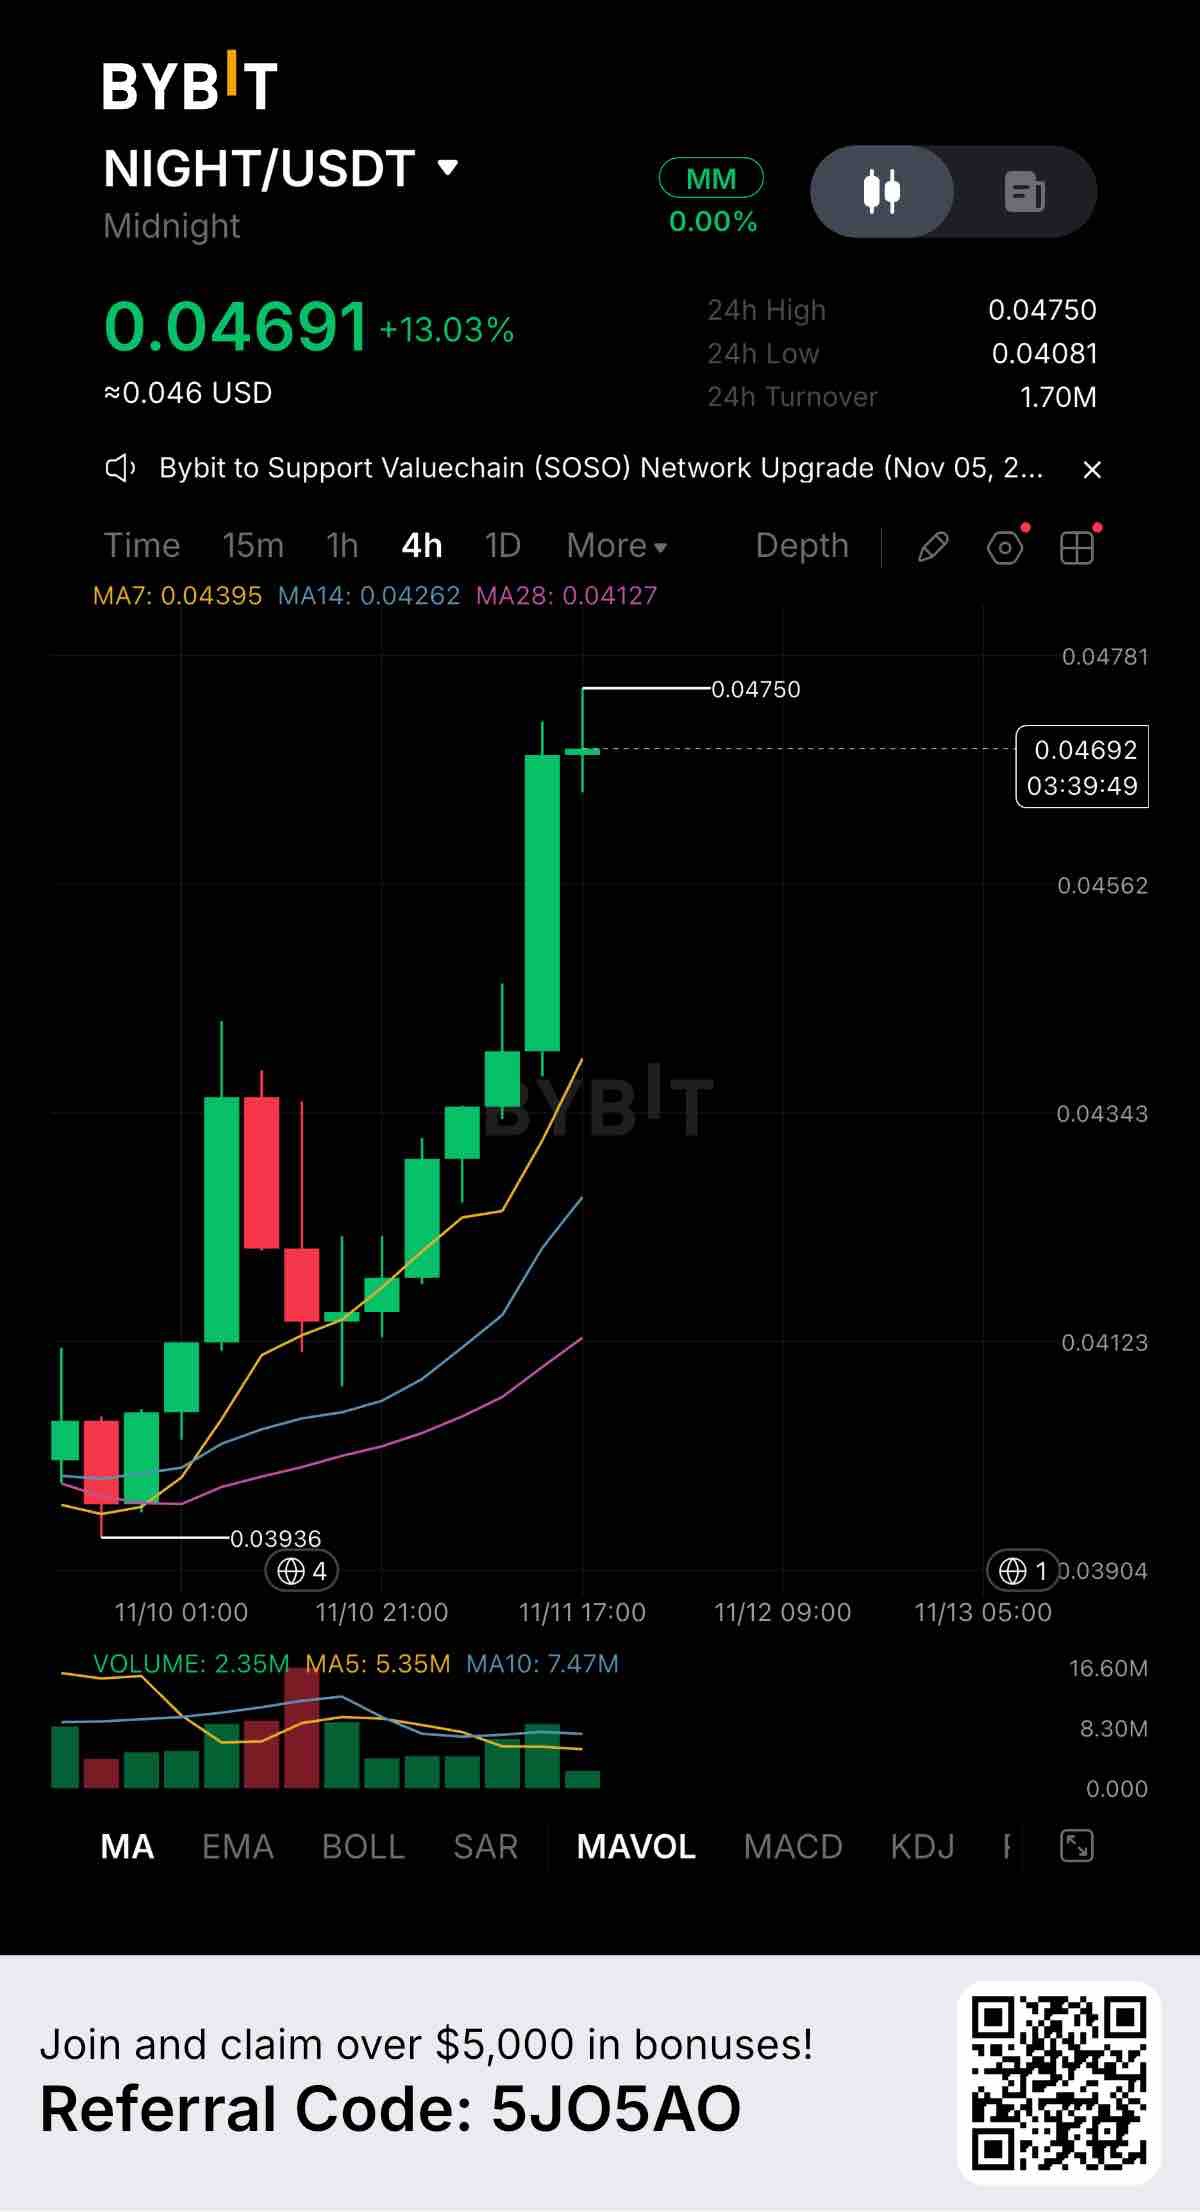
$NIGHTUSDT is showing strong bullish momentum today, currently trading at 0.04691 with a solid +13.03% gain over the last 24 hours. The 4-hour chart reveals a textbook upward trend, and buyers are clearly in control. Key Levels to Watch: Resistance: 0.04750 (The current 24-hour high, acting as the immediate ceiling) Support 1: 0.04395 (7-day MA, the first line of defense on a pullback) Support 2: 0.04081 (24-hour low, the stronger structural floor) The moving averages are perfectly stacked. Price is trading well above MA7, MA14, and MA28, which confirms the short-term trend remains incredibly strong. However, price is getting slightly extended from the 7-day MA, so a brief cool-off period wouldn't be surprising. Volume is healthy, with 1.70M USDT in 24-hour turnover. The chart shows consistent buying pressure supporting this move upward. Fundamentally, Midnight (NIGHT) is capturing solid market attention. Momentum like this usually points to growing ecosystem interest or traders rotating into fresh narratives. If buyers manage to break and hold above 0.04750, we could see price discovery continue. However, if sellers reject this level, waiting for a retest toward 0.04395 is a much safer strategy than chasing the top. Are you trading NIGHT right now? Let me know your strategy in the comments. #ByXIMPACT #WSOT2026
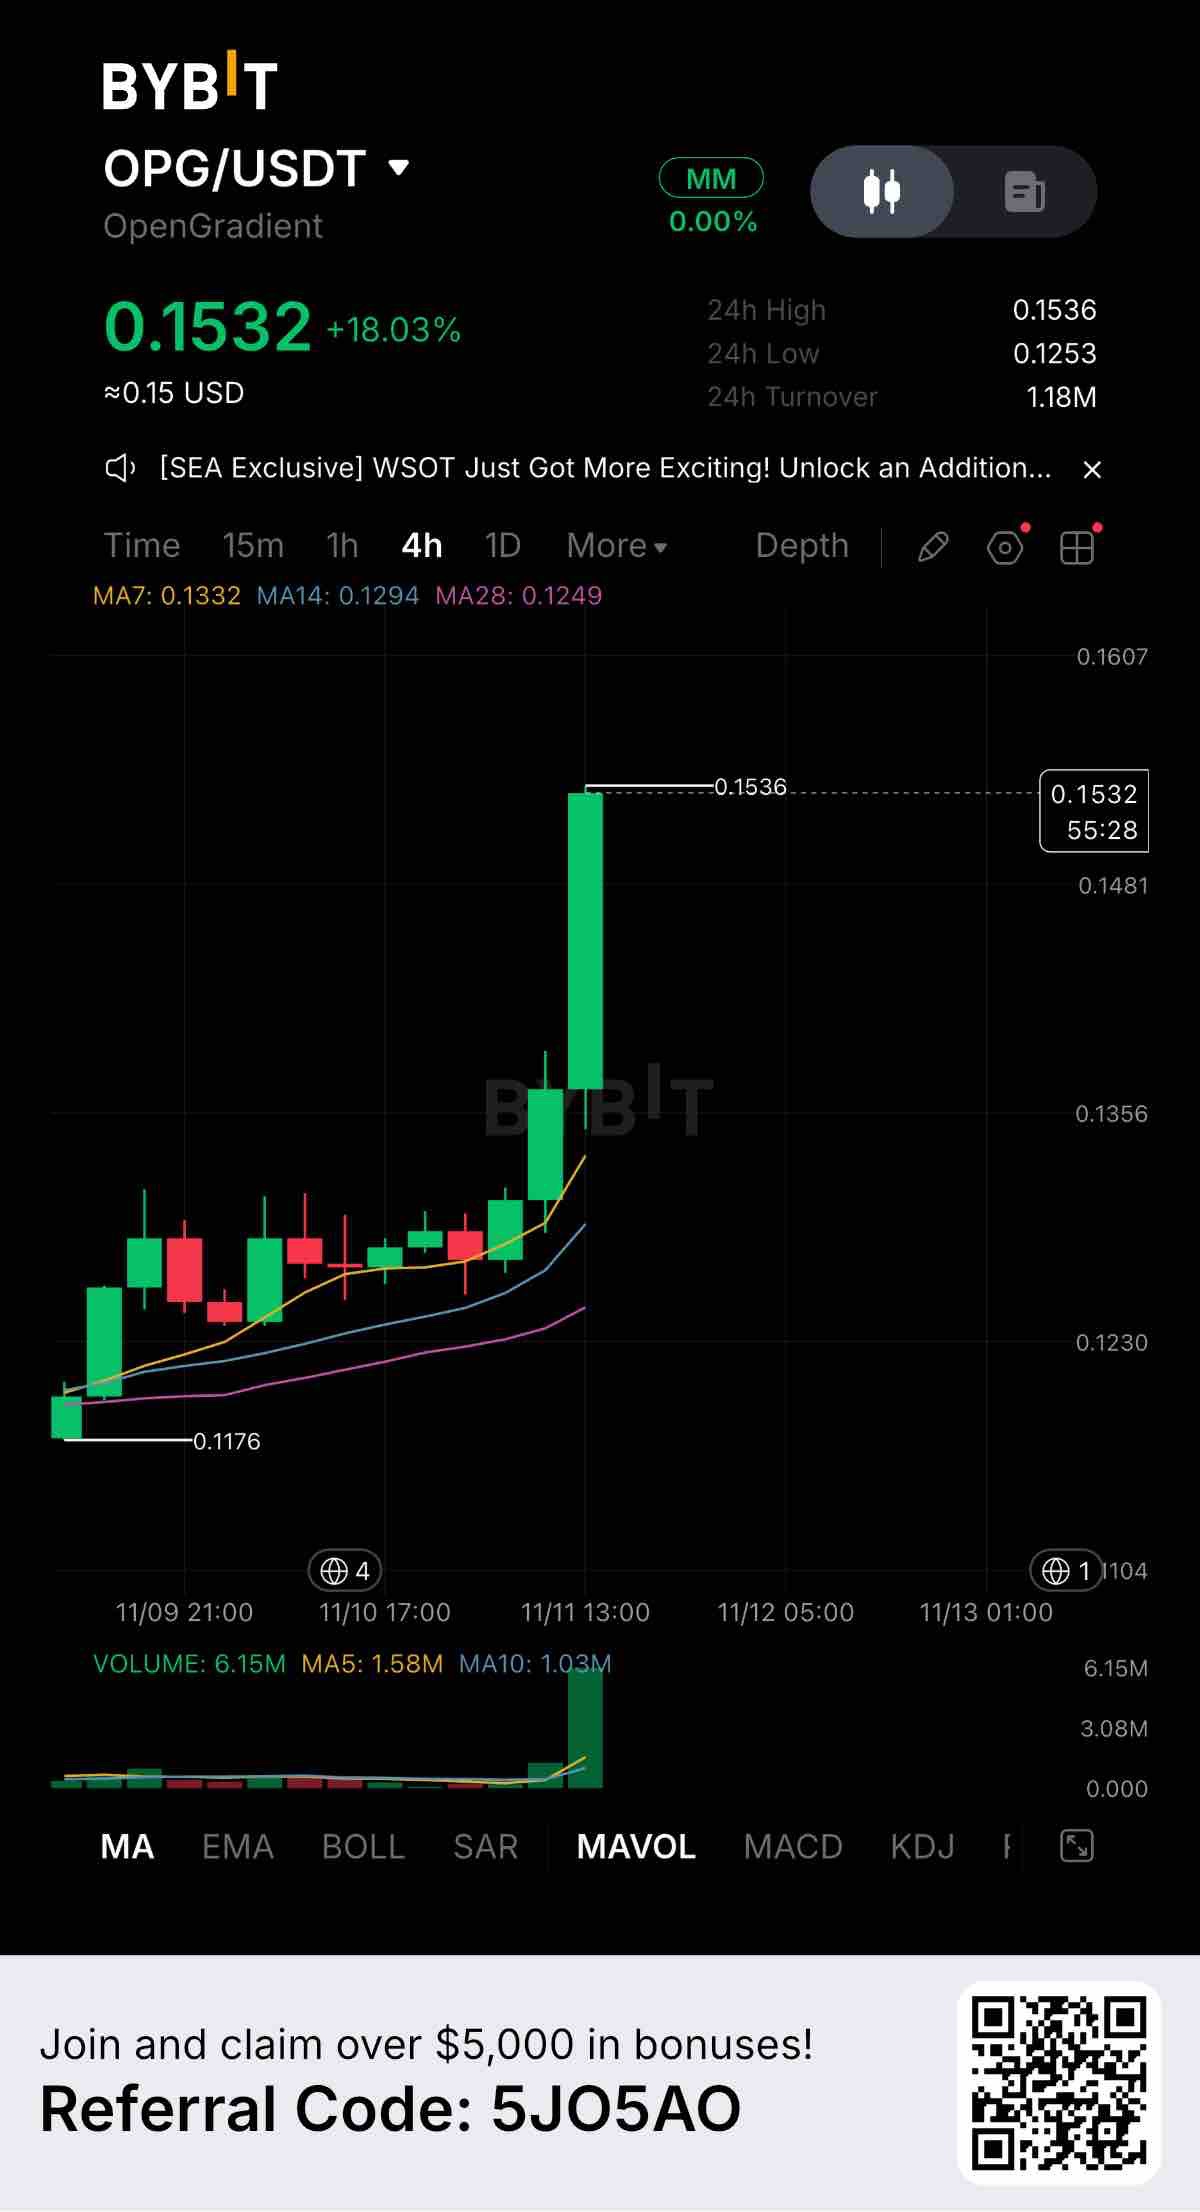
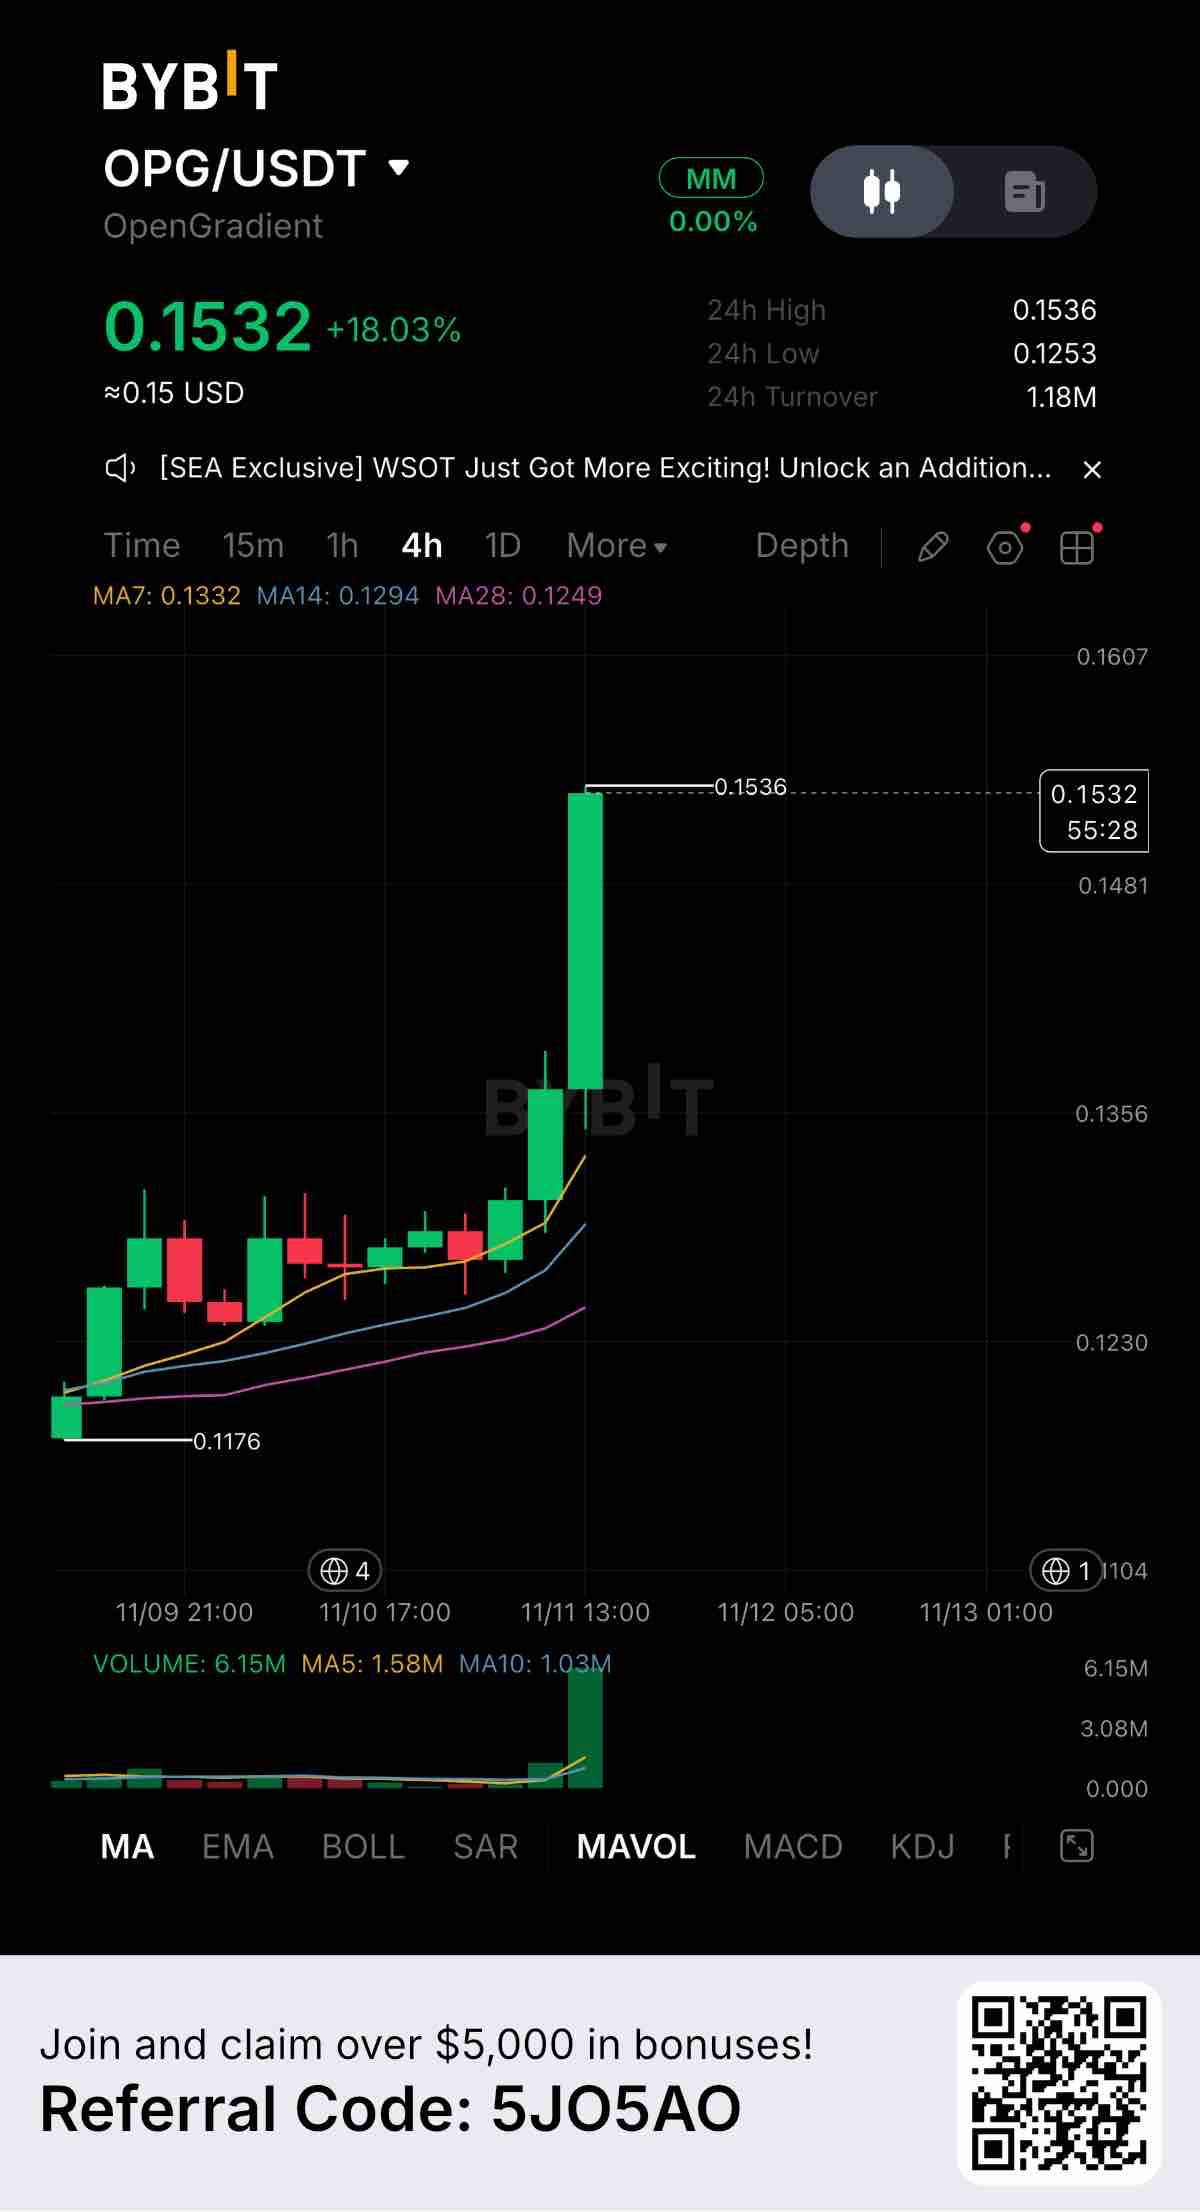
$OPGUSDT is making a massive statement today, currently trading at 0.1532 with an explosive +18.03% gain over the past 24 hours. The 4-hour chart is showing a textbook vertical breakout, and the volume confirms real money is entering the market. Key Levels to Watch: Resistance: 0.1536 (The current 24-hour high, being tested right now) Support 1: 0.1332 (7-day MA, first downside cushion) Support 2: 0.1253 (24-hour low, stronger structural floor) Looking at the moving averages, price is trading far above MA7, MA14, and MA28. This tells us momentum is incredibly fierce, but also means the asset is highly extended. Chasing a green candle this big carries risk. Volume is the real story here. The massive spike on the 4-hour chart shows strong buying pressure, backed by 1.18M USDT in 24-hour turnover. Fundamentally, OpenGradient (OPG) is capturing heavy market attention right now. Moves like this are usually driven by ecosystem developments or community momentum, and the volume proves capital is rotating in. If buyers manage to break and hold above 0.1536, we could see immediate price discovery. However, if sellers reject this level, waiting for a retest toward 0.1332 is the safer play. Are you riding this momentum or waiting for a pullback? Drop your thoughts below. #ByXIMPACT #WSOT2026
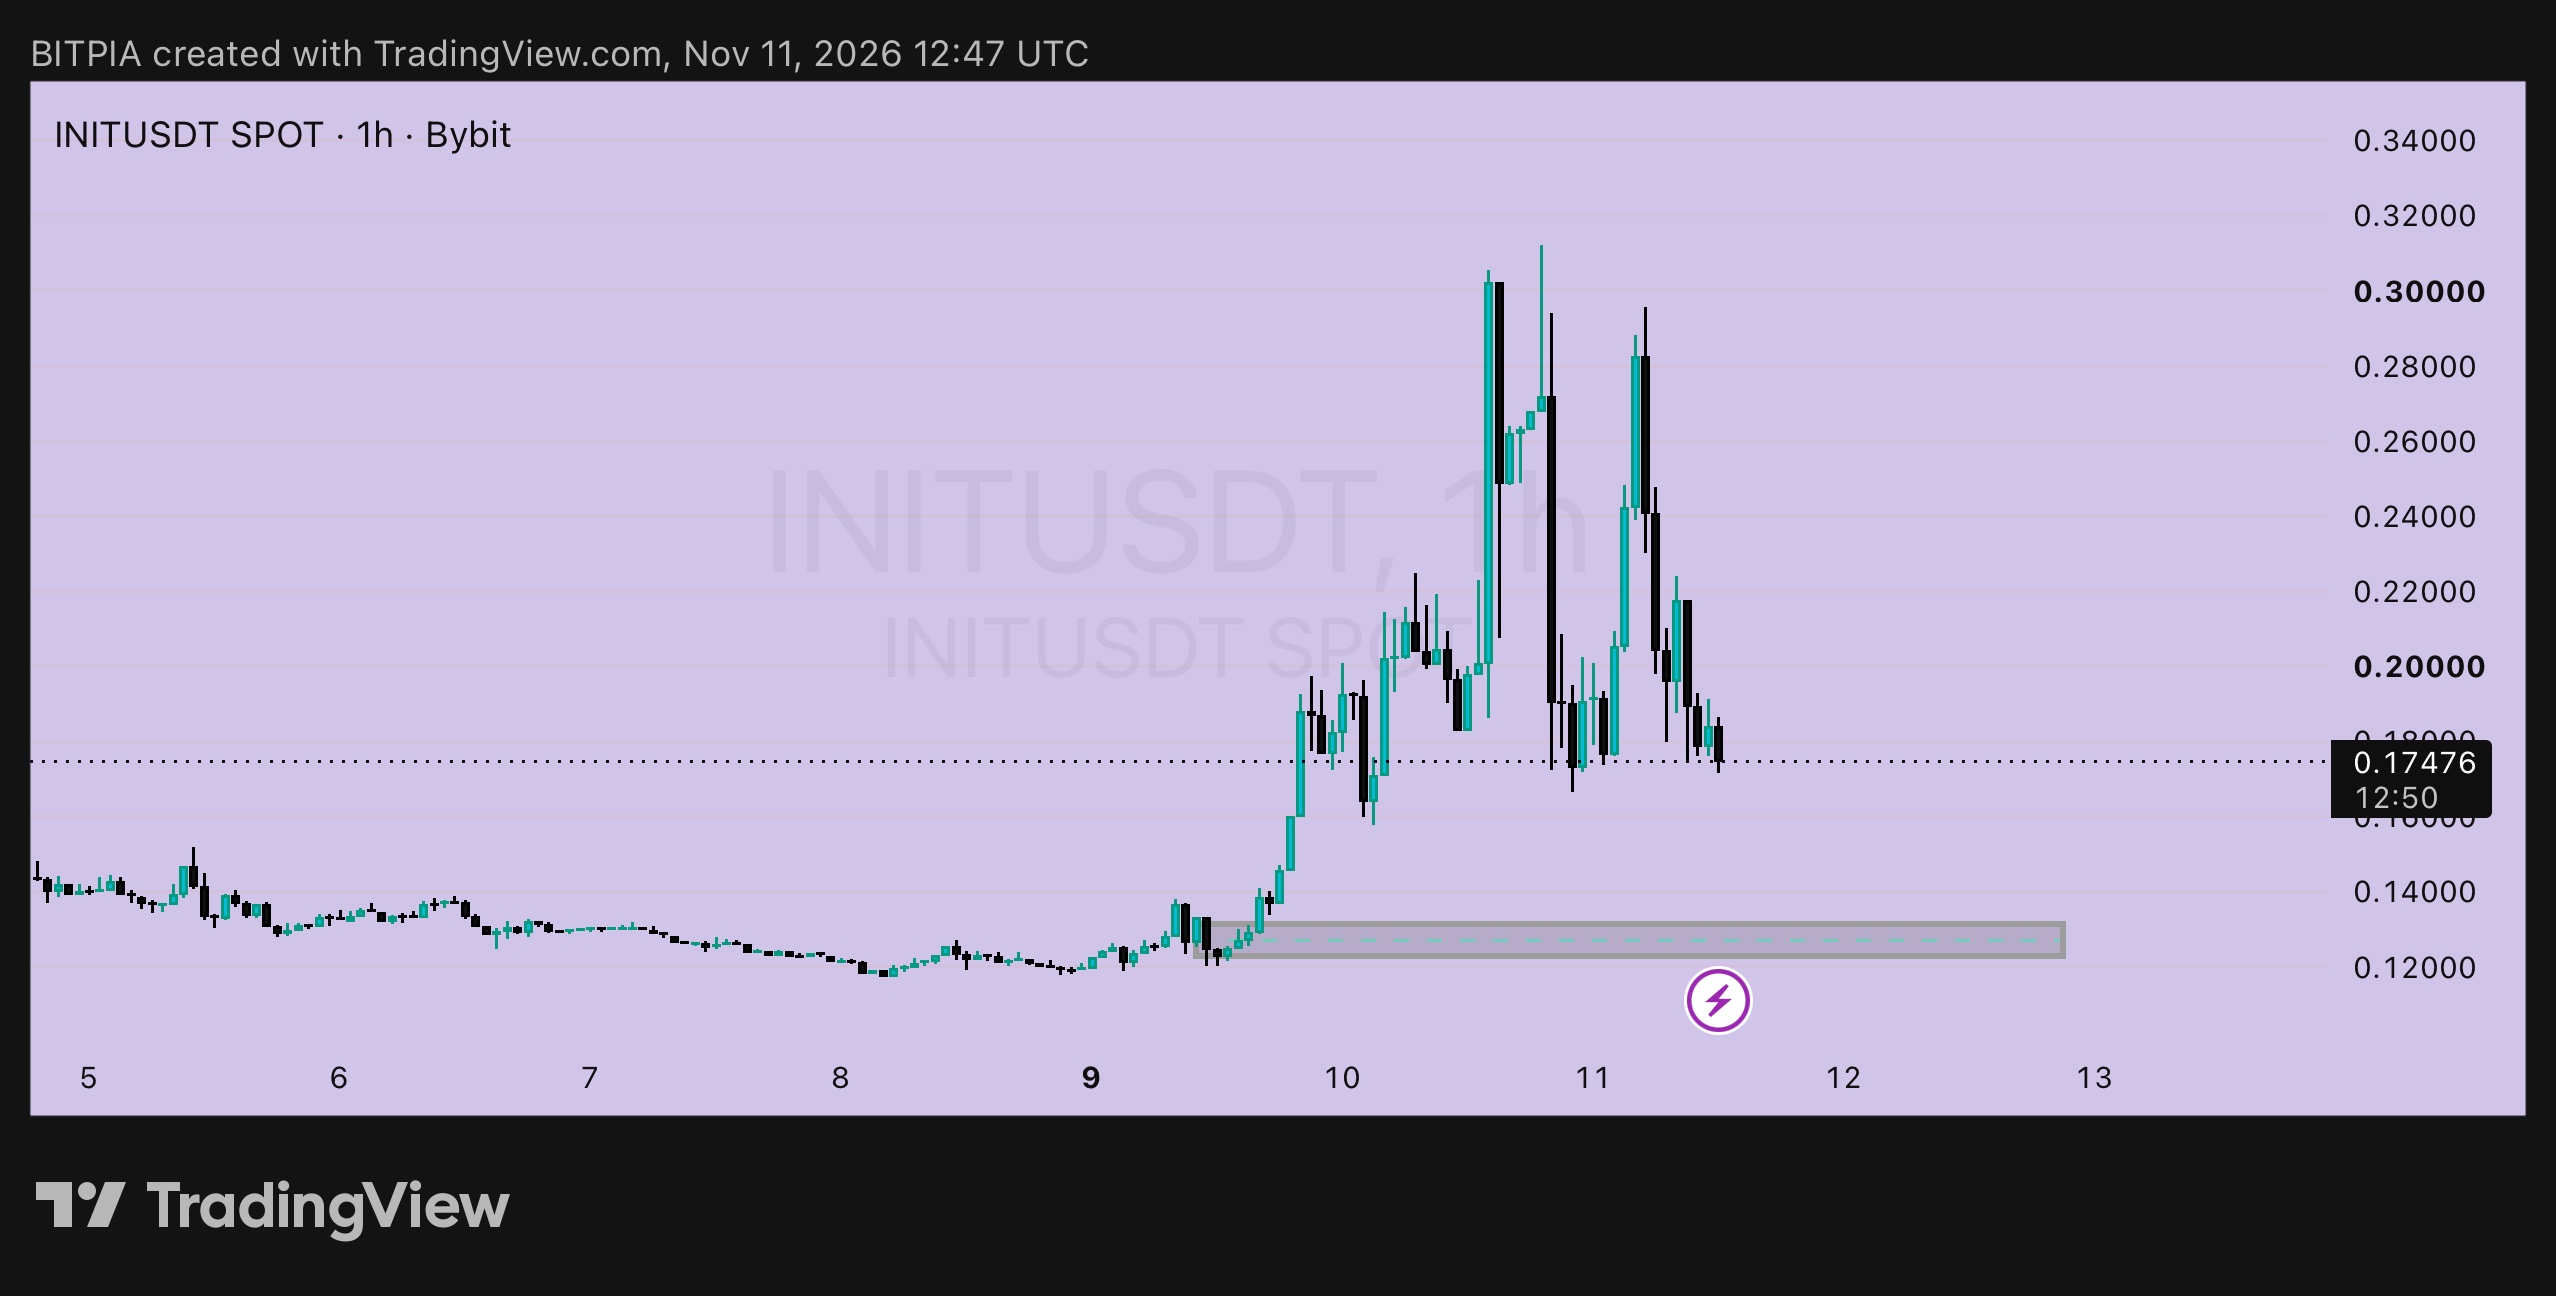
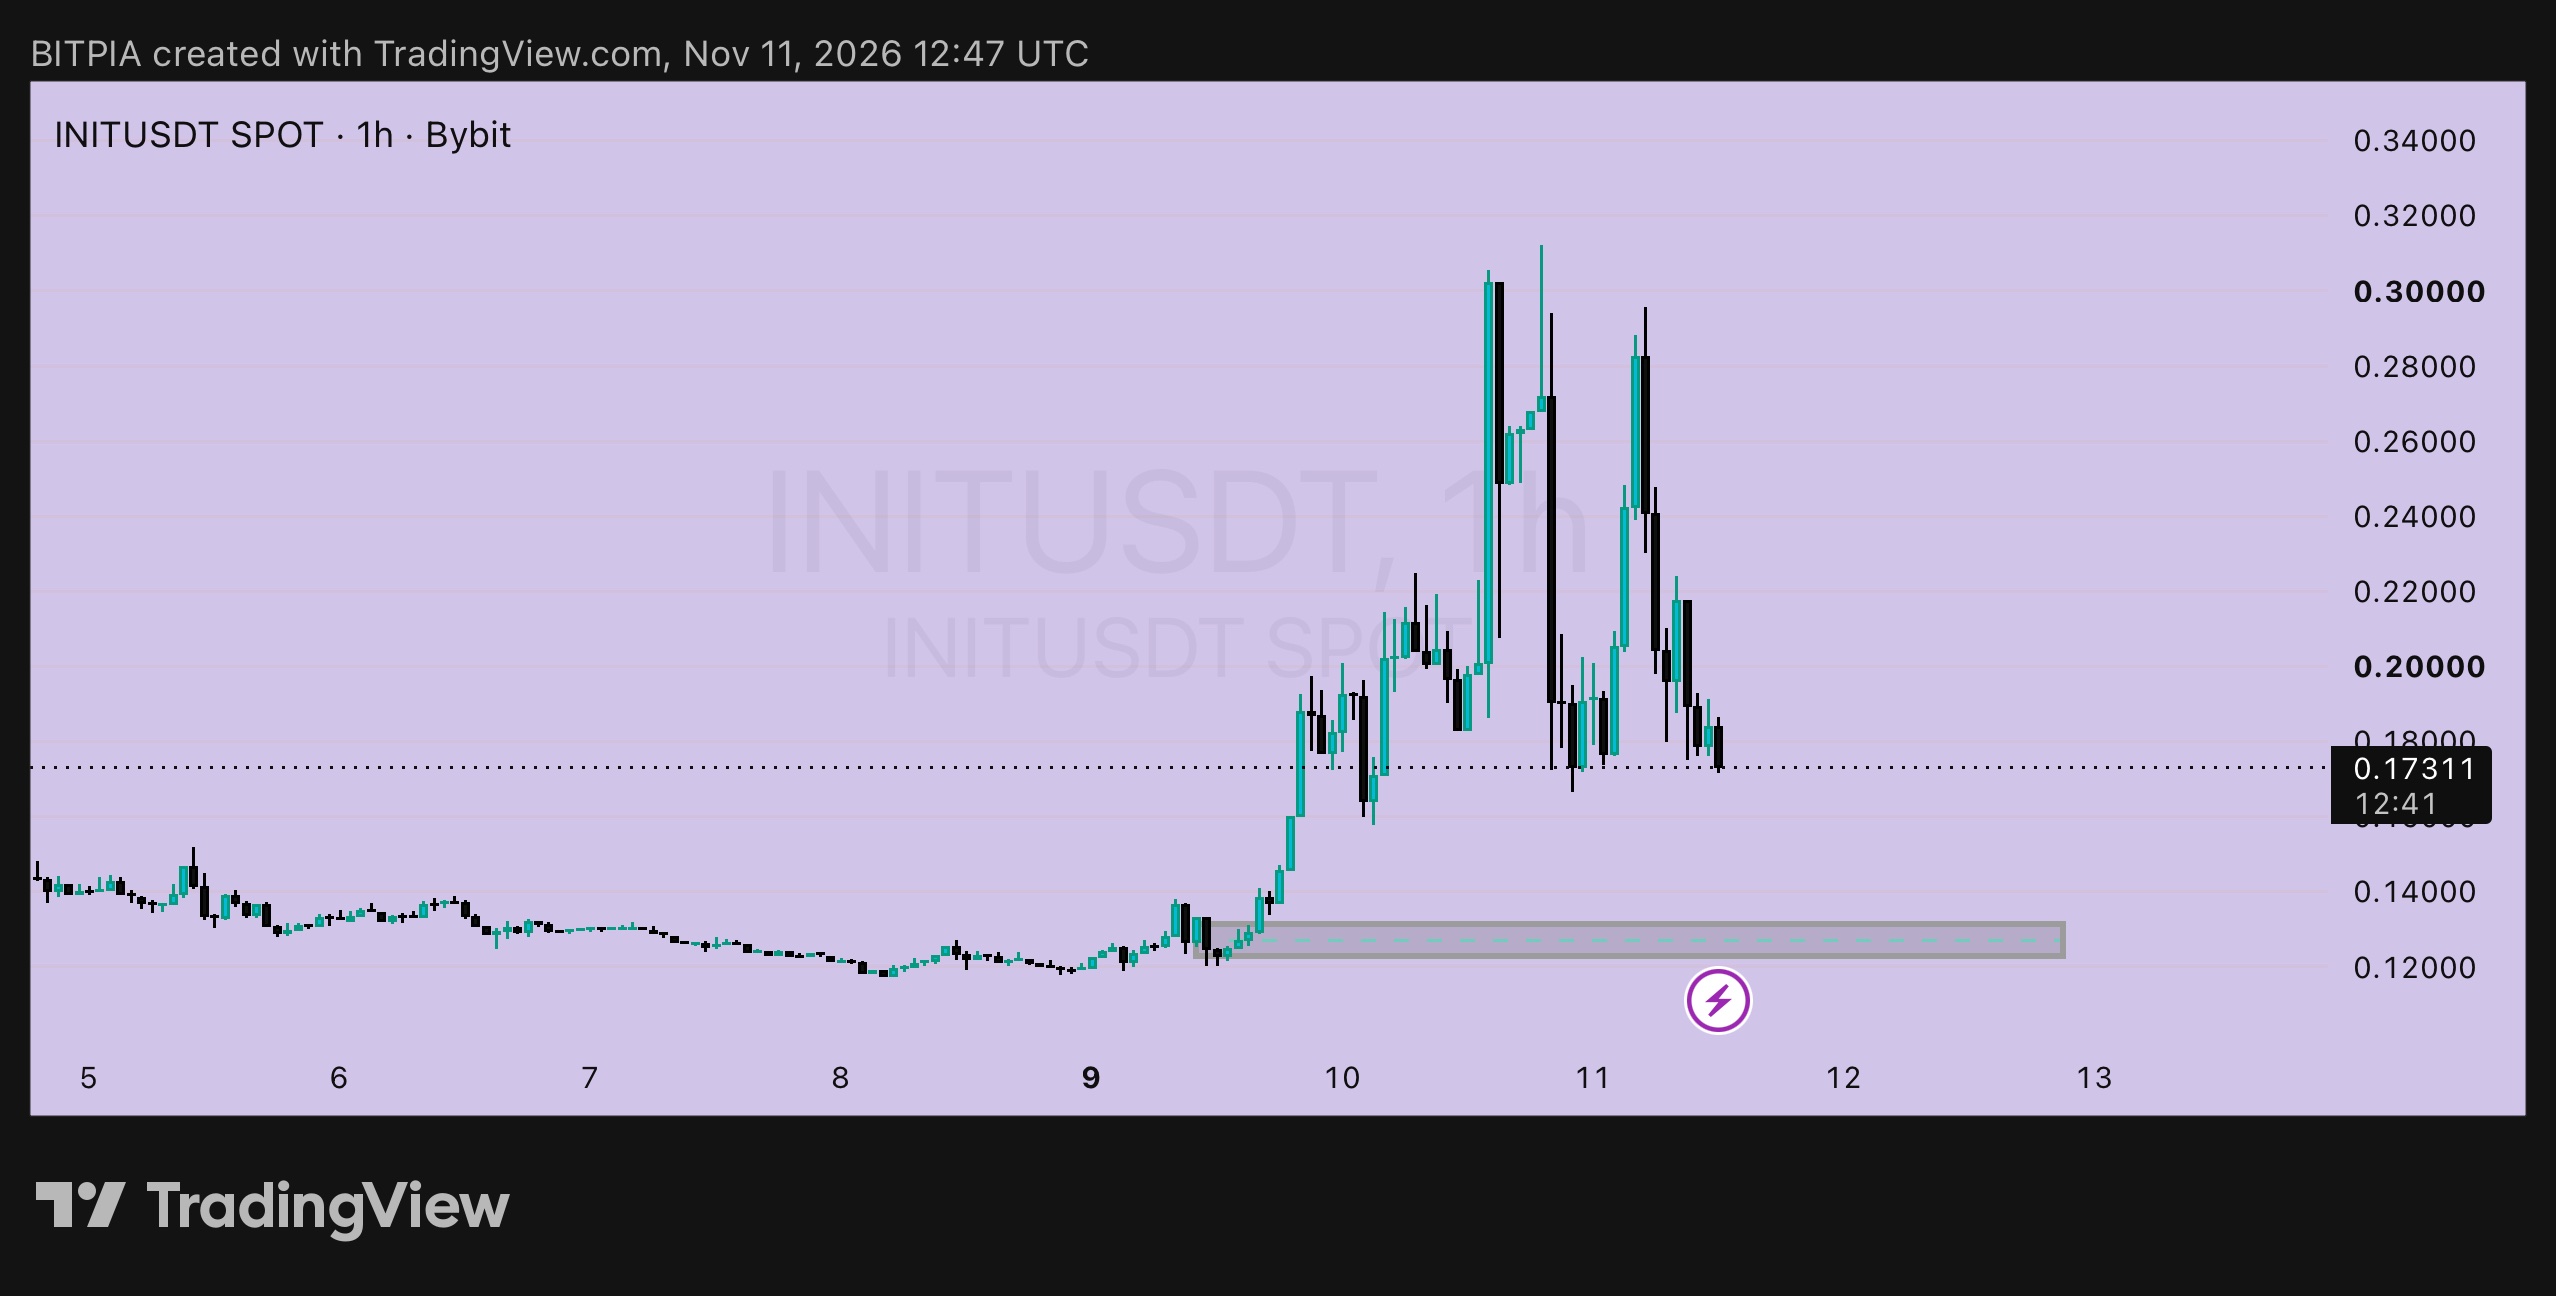
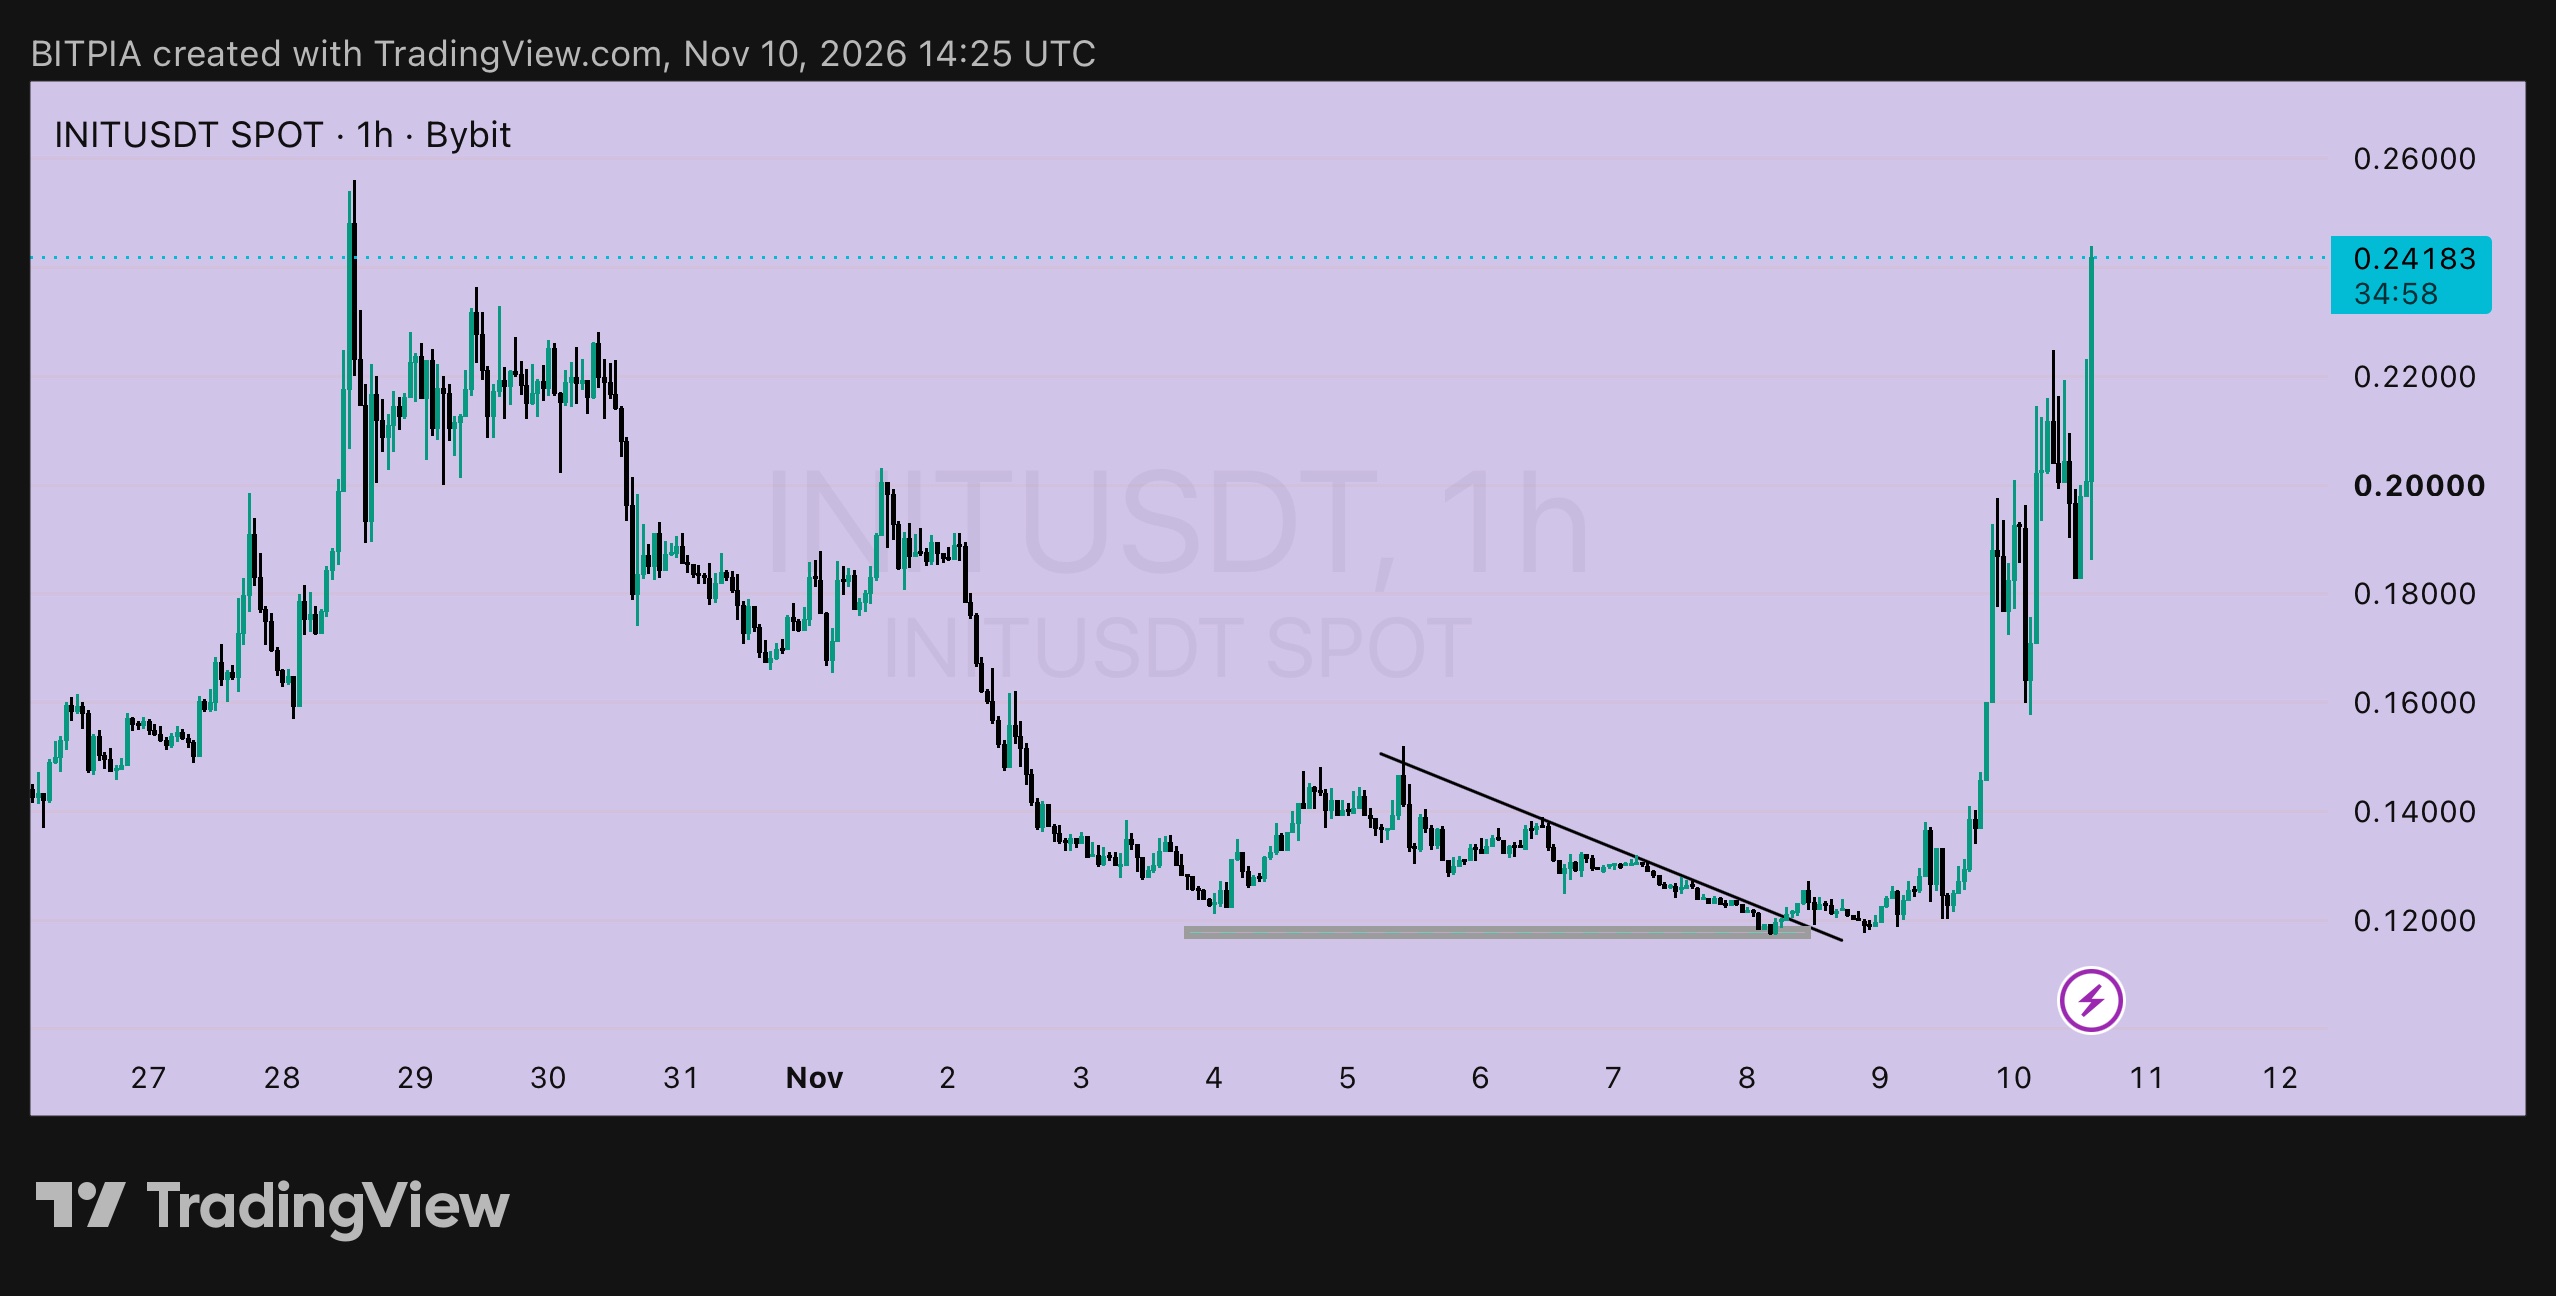
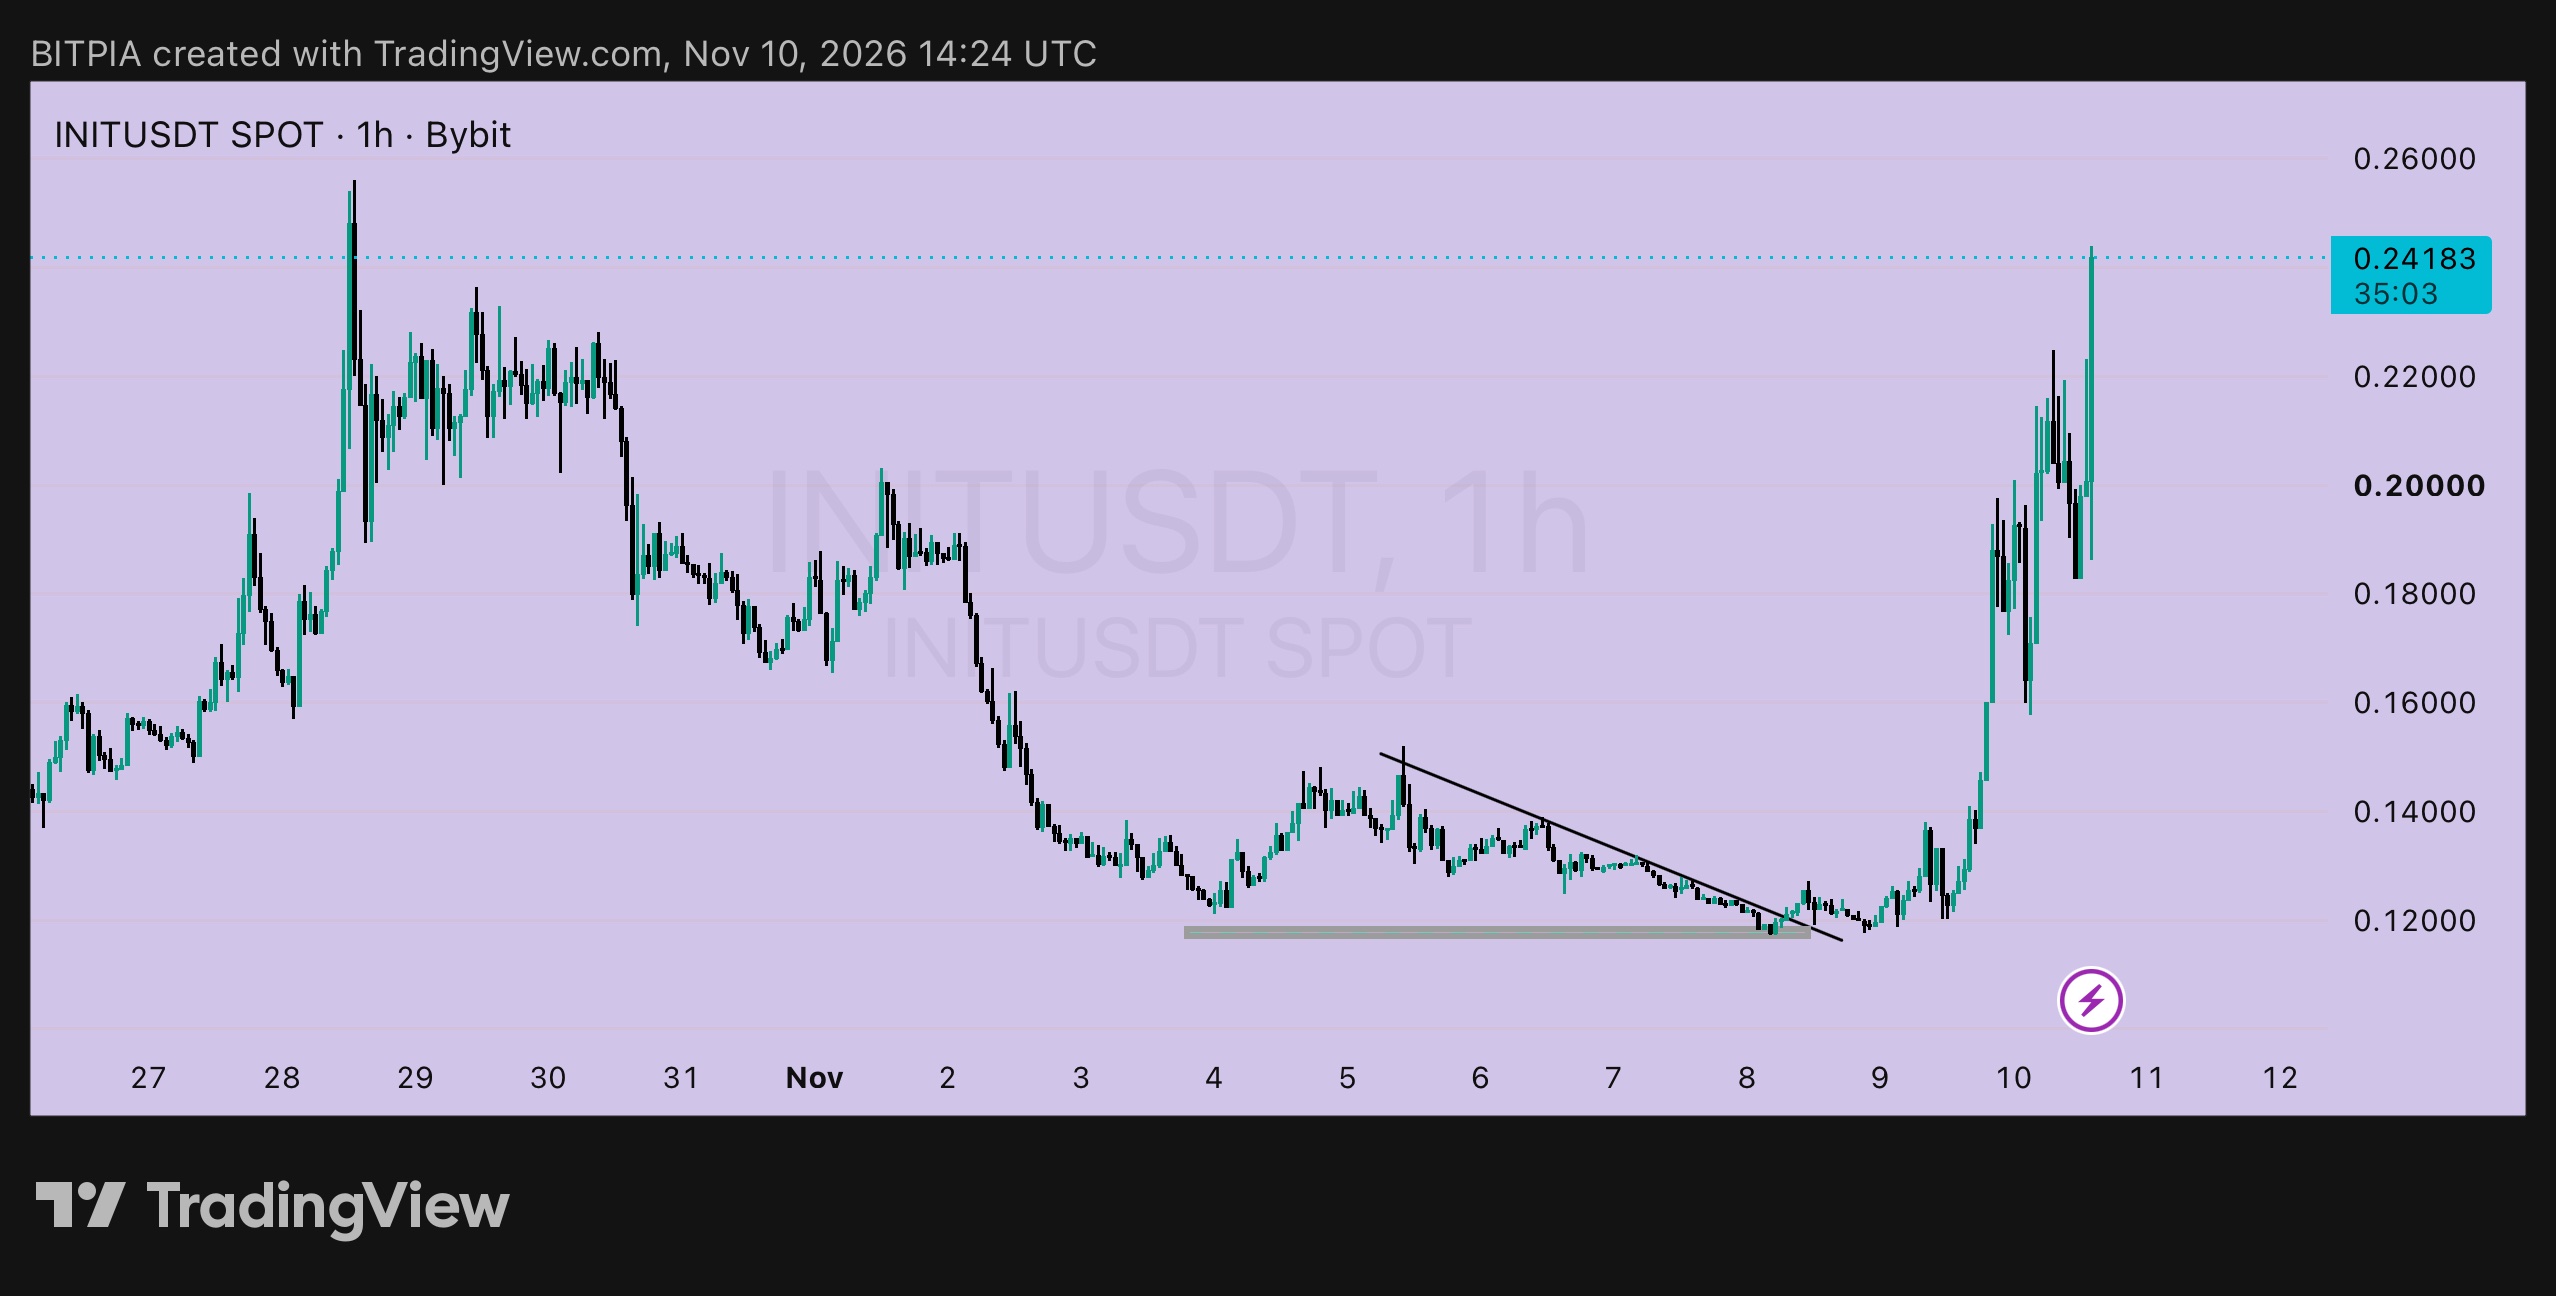
INIT 1h: closing the books 🧾 My last $INITUSDT post was at 0.24183 on Nov 10, with a plan to sell half near 0.2400 to 0.2500 and trail the stop on the rest to about 0.1800. Price went to about 0.312, fell back, made a second peak near 0.295, and is now 0.17311, under the trailing stop. Here's the receipt. ➤ The trade ▸ Entry (Door 2): 0.1200, risk 0.0050 ▸ First half: sold near 0.2400 to 0.2500, roughly 24R to 26R on that half ▸ Second half: stopped near 0.1800, roughly 12R on that half ▸ Blended result: around 18R on the whole position. A great outcome, even with a trailing stop catching the dip ➤ The honest part Price went well past my first sell zone, up to about 0.312, so selling near 0.2400 left some on the table. That's the price of taking profit before the top. I don't know the top in advance, and neither does anyone else. A 12R to 26R trade is not one I regret. ➤ What the chart says now ▸ The two tall peaks near 0.30 are behind us, and each one was sold into ▸ Price is at 0.1731, with a recent low near 0.160 ▸ The launch zone near 0.125 to 0.132 sits far below, and price may or may not return to it ➤ If you want back in Pullback plan: ▸ Entry: around 0.1650, only if the 0.160 area holds ▸ Stop-loss: below 0.1500 ▸ Risk per unit: 0.0150 ▸ Targets: 0.2000 (+0.0350, about 2.3R) and 0.2400 (+0.0750, about 5R) Reclaim plan: ▸ Trigger: a 1h close above 0.2000 ▸ Entry: around 0.2050 ▸ Stop-loss: below 0.1800 ▸ Risk per unit: 0.0250 ▸ Targets: 0.2400 (about 1.4R) and 0.2950 (+0.0900, about 3.6R) ➤ What cancels the pullback idea A 1h close under 0.1500 means the 0.160 area has failed, and I'd wait for the 0.125 to 0.132 zone before even thinking about it. Moves like this one are wild in both directions, so small size, and low leverage if you use perps. Not financial advice. Do your own research and only risk what you can afford to lose. #ByXIMPACT #WSOT2026
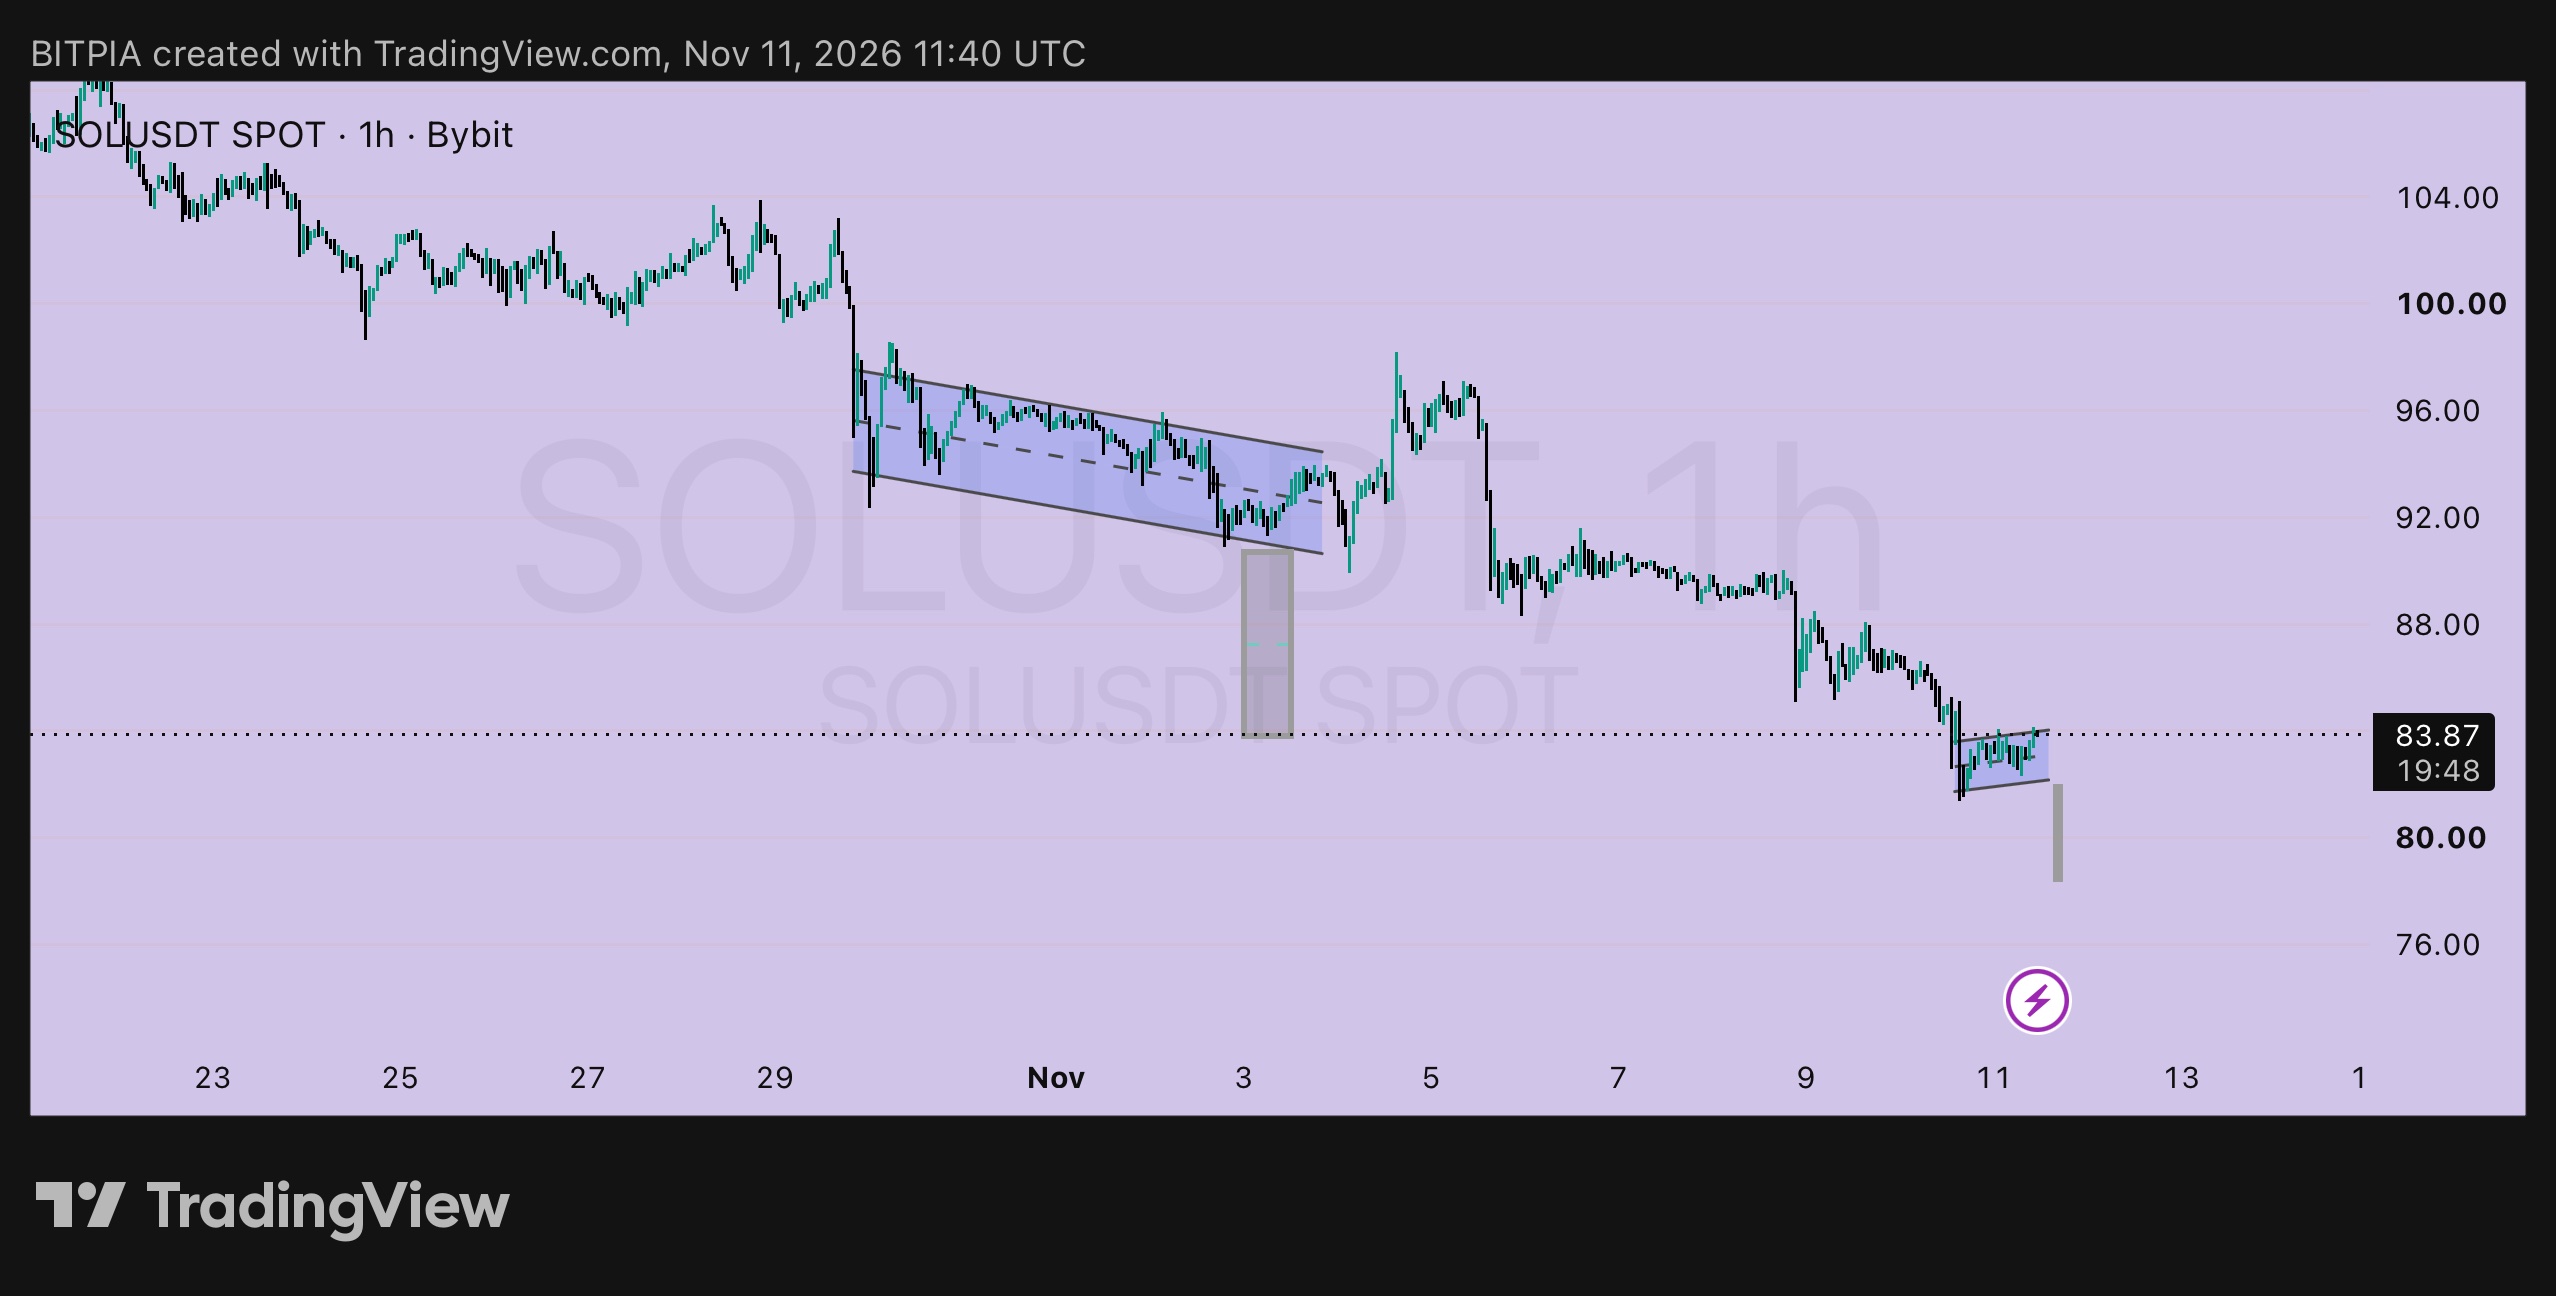
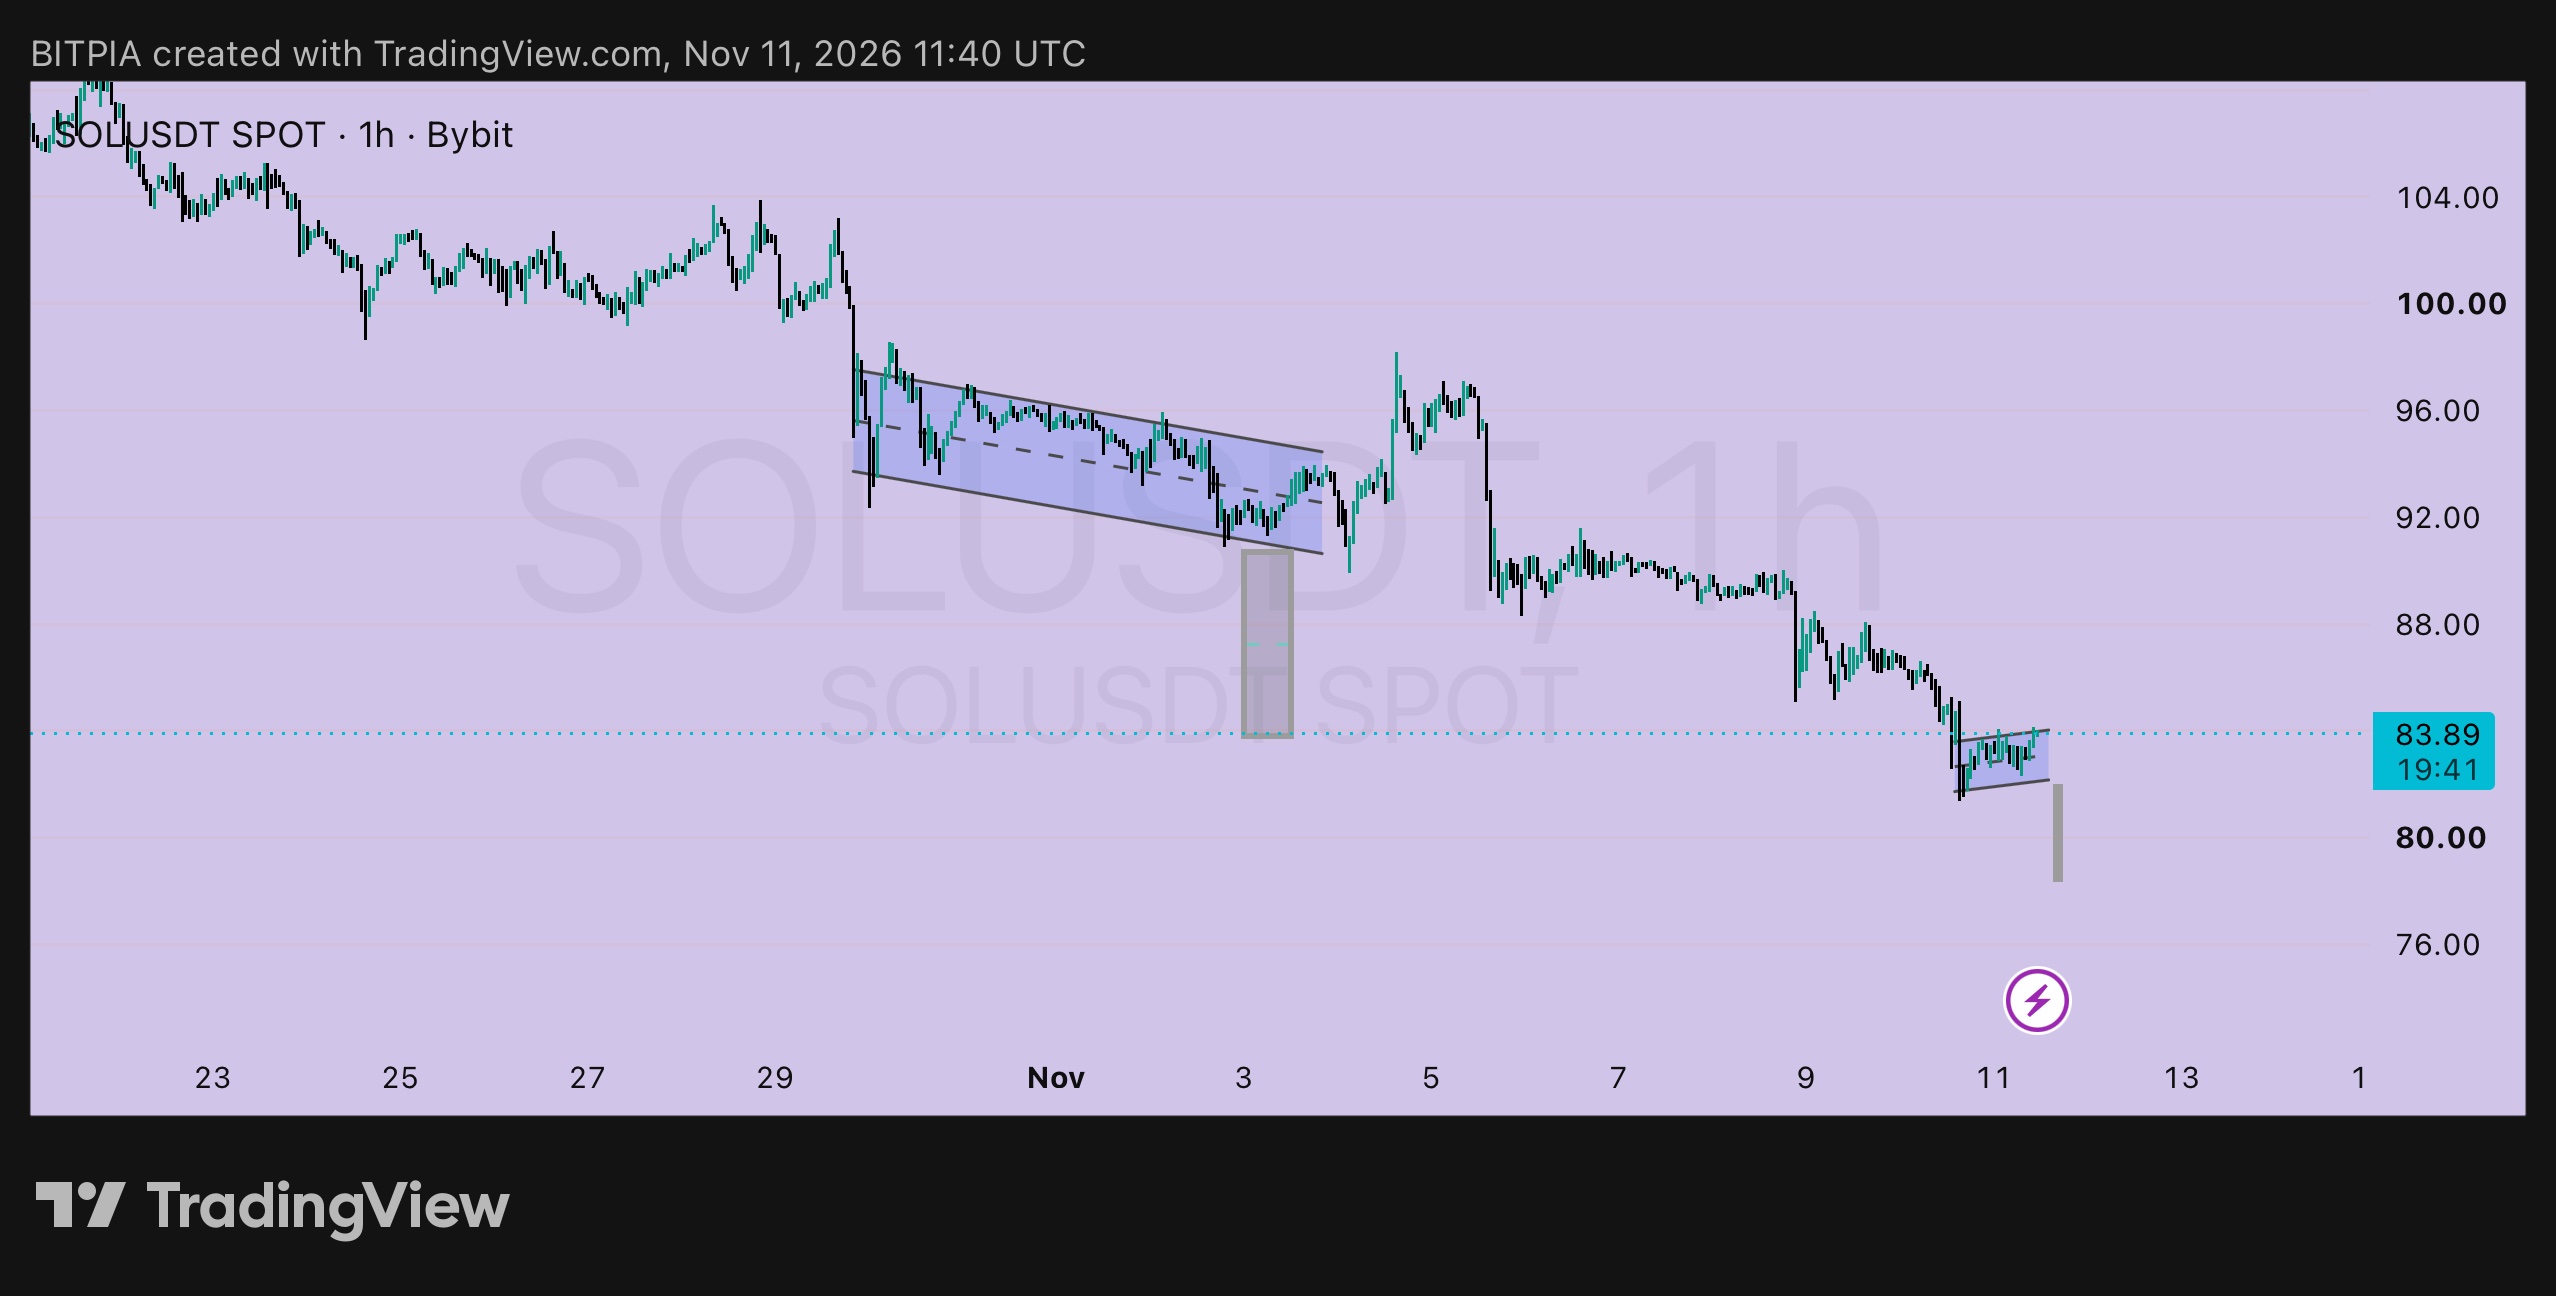
$SOLUSDT 1h: mirror review of my last plan 🪞 On Nov 6 I posted SOL at 89.77 with two sides. Here's what each one did. ➤ Side 1: short on a retest of 91.5 ▸ Plan: entry 91.5, stop above 94.0, targets 86 and 84 ▸ Result: price retested the area, then rolled over, and now trades at 83.89 ▸ Both targets were reached, about 3R from the entry for anyone who took it on a perp ➤ Side 2: long near 85 ▸ Plan: entry 85, stop below 82.5 ▸ Result: price went through 85 and made a low near 81.5, so the stop was hit ▸ Loss: about 1R. The 84 to 86 zone I expected didn't hold One side paid and the other cost me a small, planned loss. That's the reason I post both. ➤ What the chart says now ▸ Price is in a small flag on the 1h chart, roughly 82 to 84, after the move down ▸ The measured move from that flag points to about 78 ▸ The older channel and the Nov 3 flag target at 84 are both behind us ➤ Plan from here: short side, perps only ▸ Entry: around 84.0, on a retest of the flag top ▸ Stop-loss: above 85.5 ▸ Risk per unit: 1.5 ▸ Targets: 80 (+4, about 2.7R) and 78 (+6, about 4R) ➤ Plan from here: long side ▸ Trigger: a 1h close above 88 ▸ Entry: around 88.5 ▸ Stop-loss: below 86 ▸ Risk per unit: 2.5 ▸ Targets: 92 (+3.5, about 1.4R) and 96 (+7.5, about 3R) ➤ What cancels the short idea A 1h close above 85.5 means the flag is breaking up, and I'd drop it. For spot traders, the better move is to wait for a base to form, not to catch the move down. Small size, and low leverage on perps. Not financial advice. Do your own research and only risk what you can afford to lose. #ByXIMPACT #WSOT2026
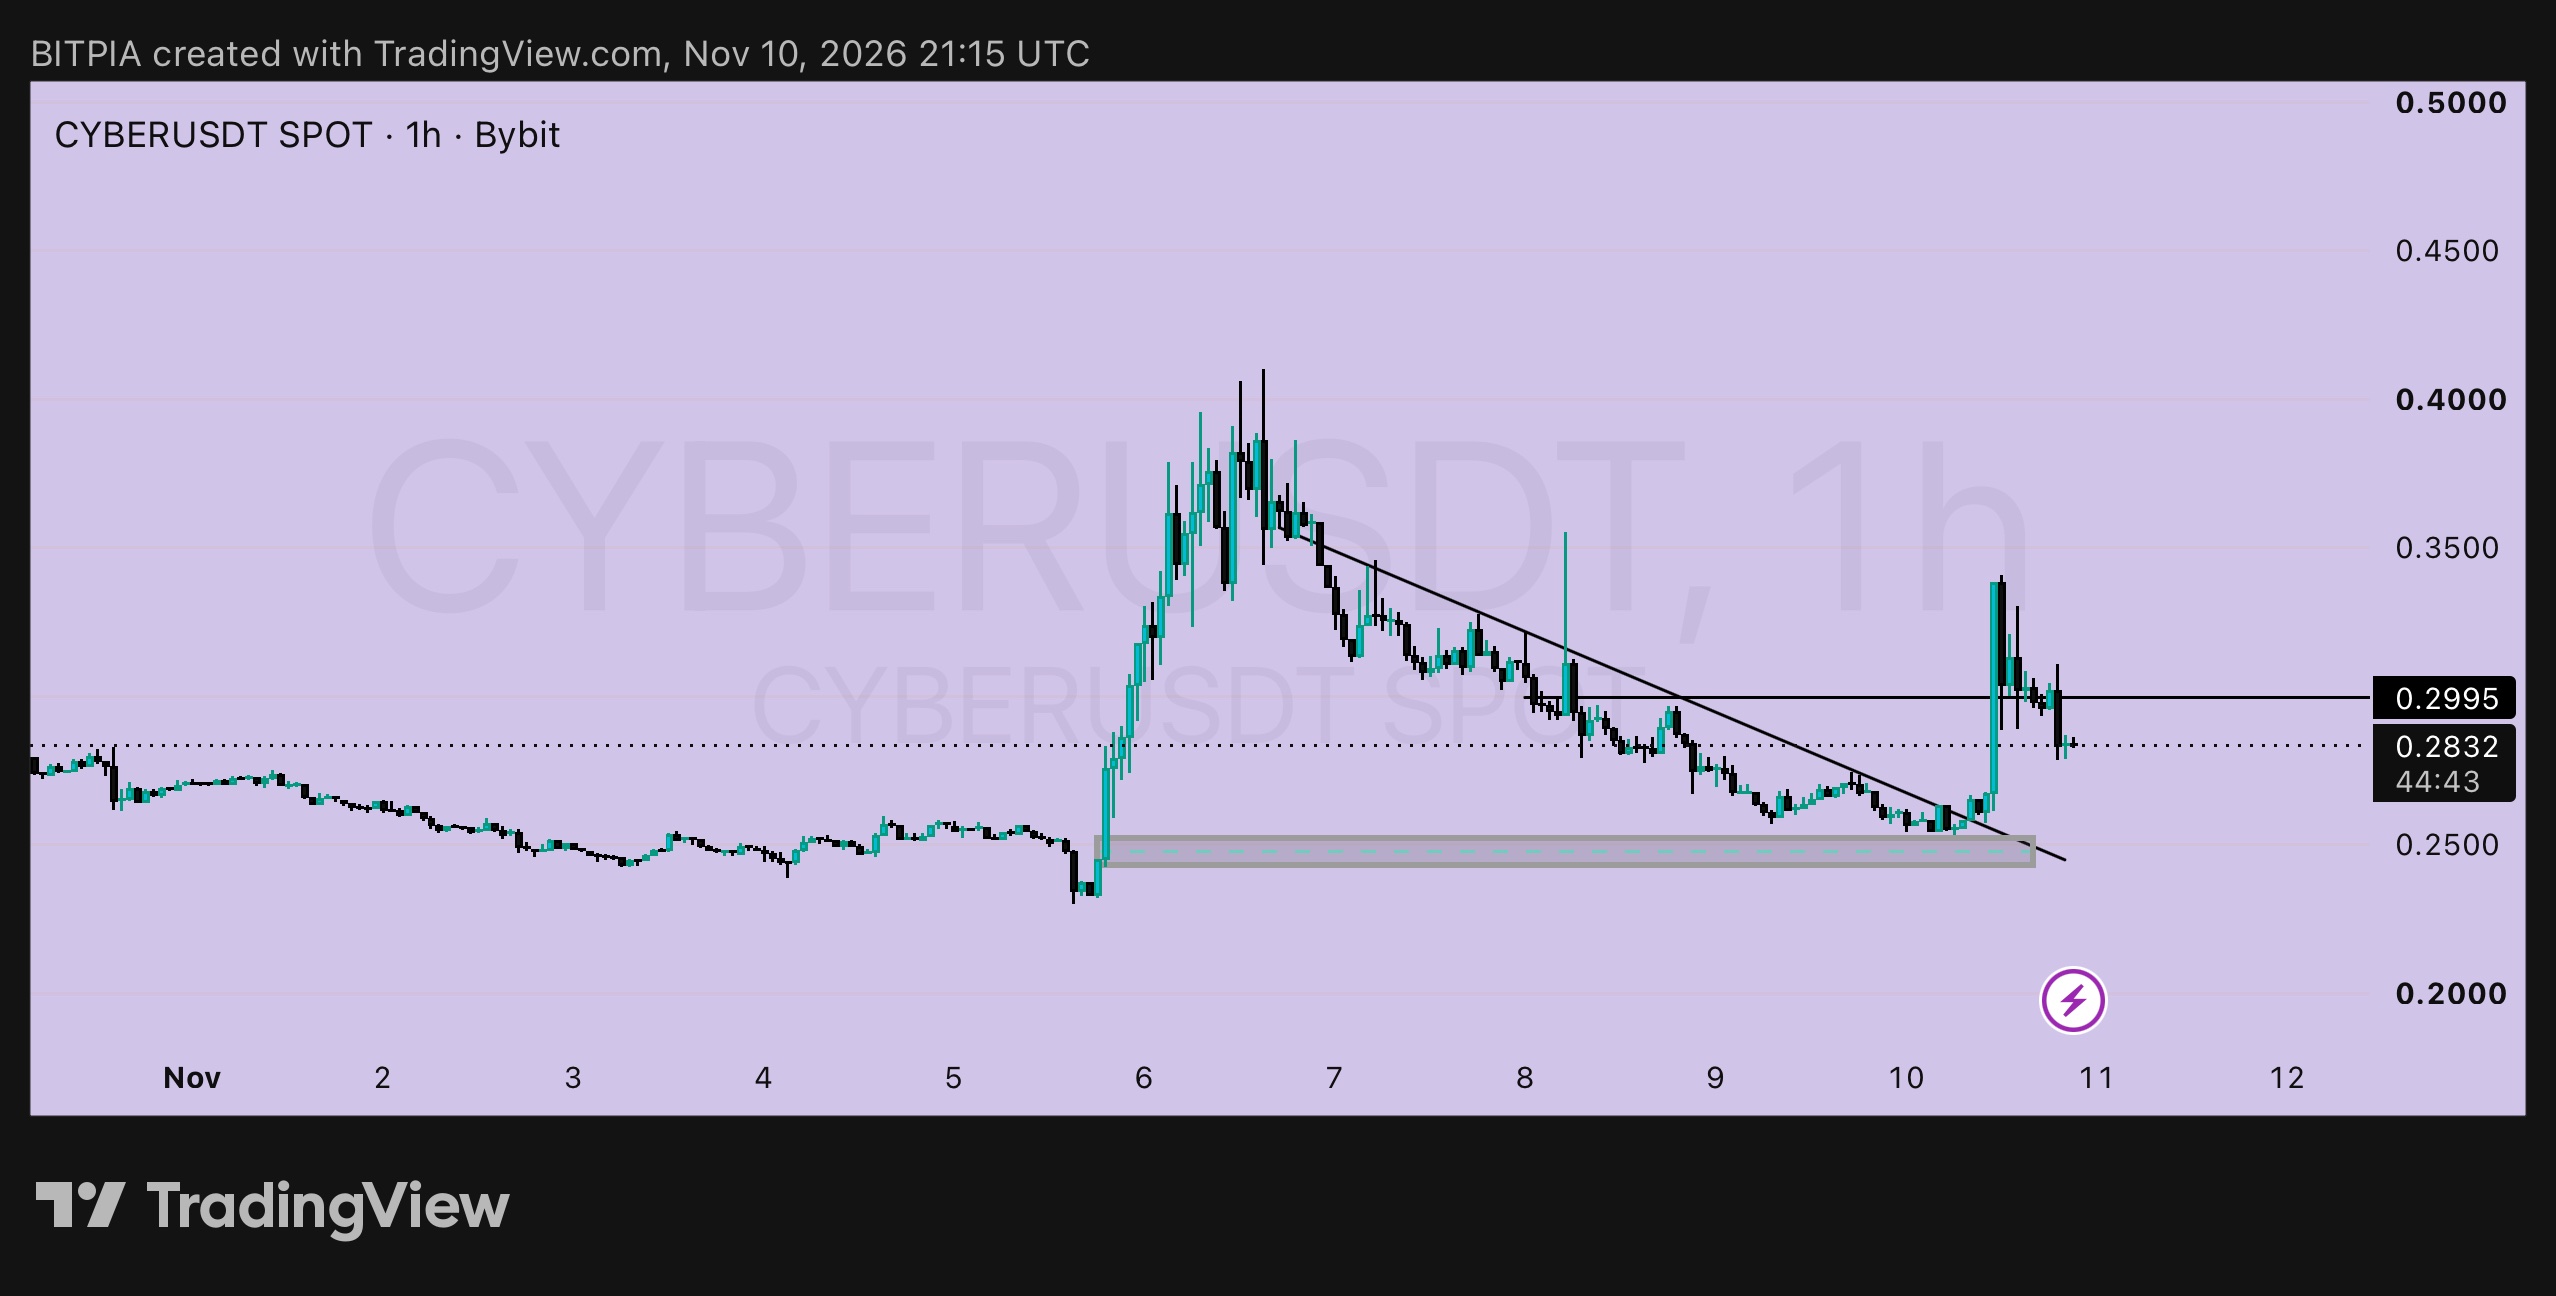
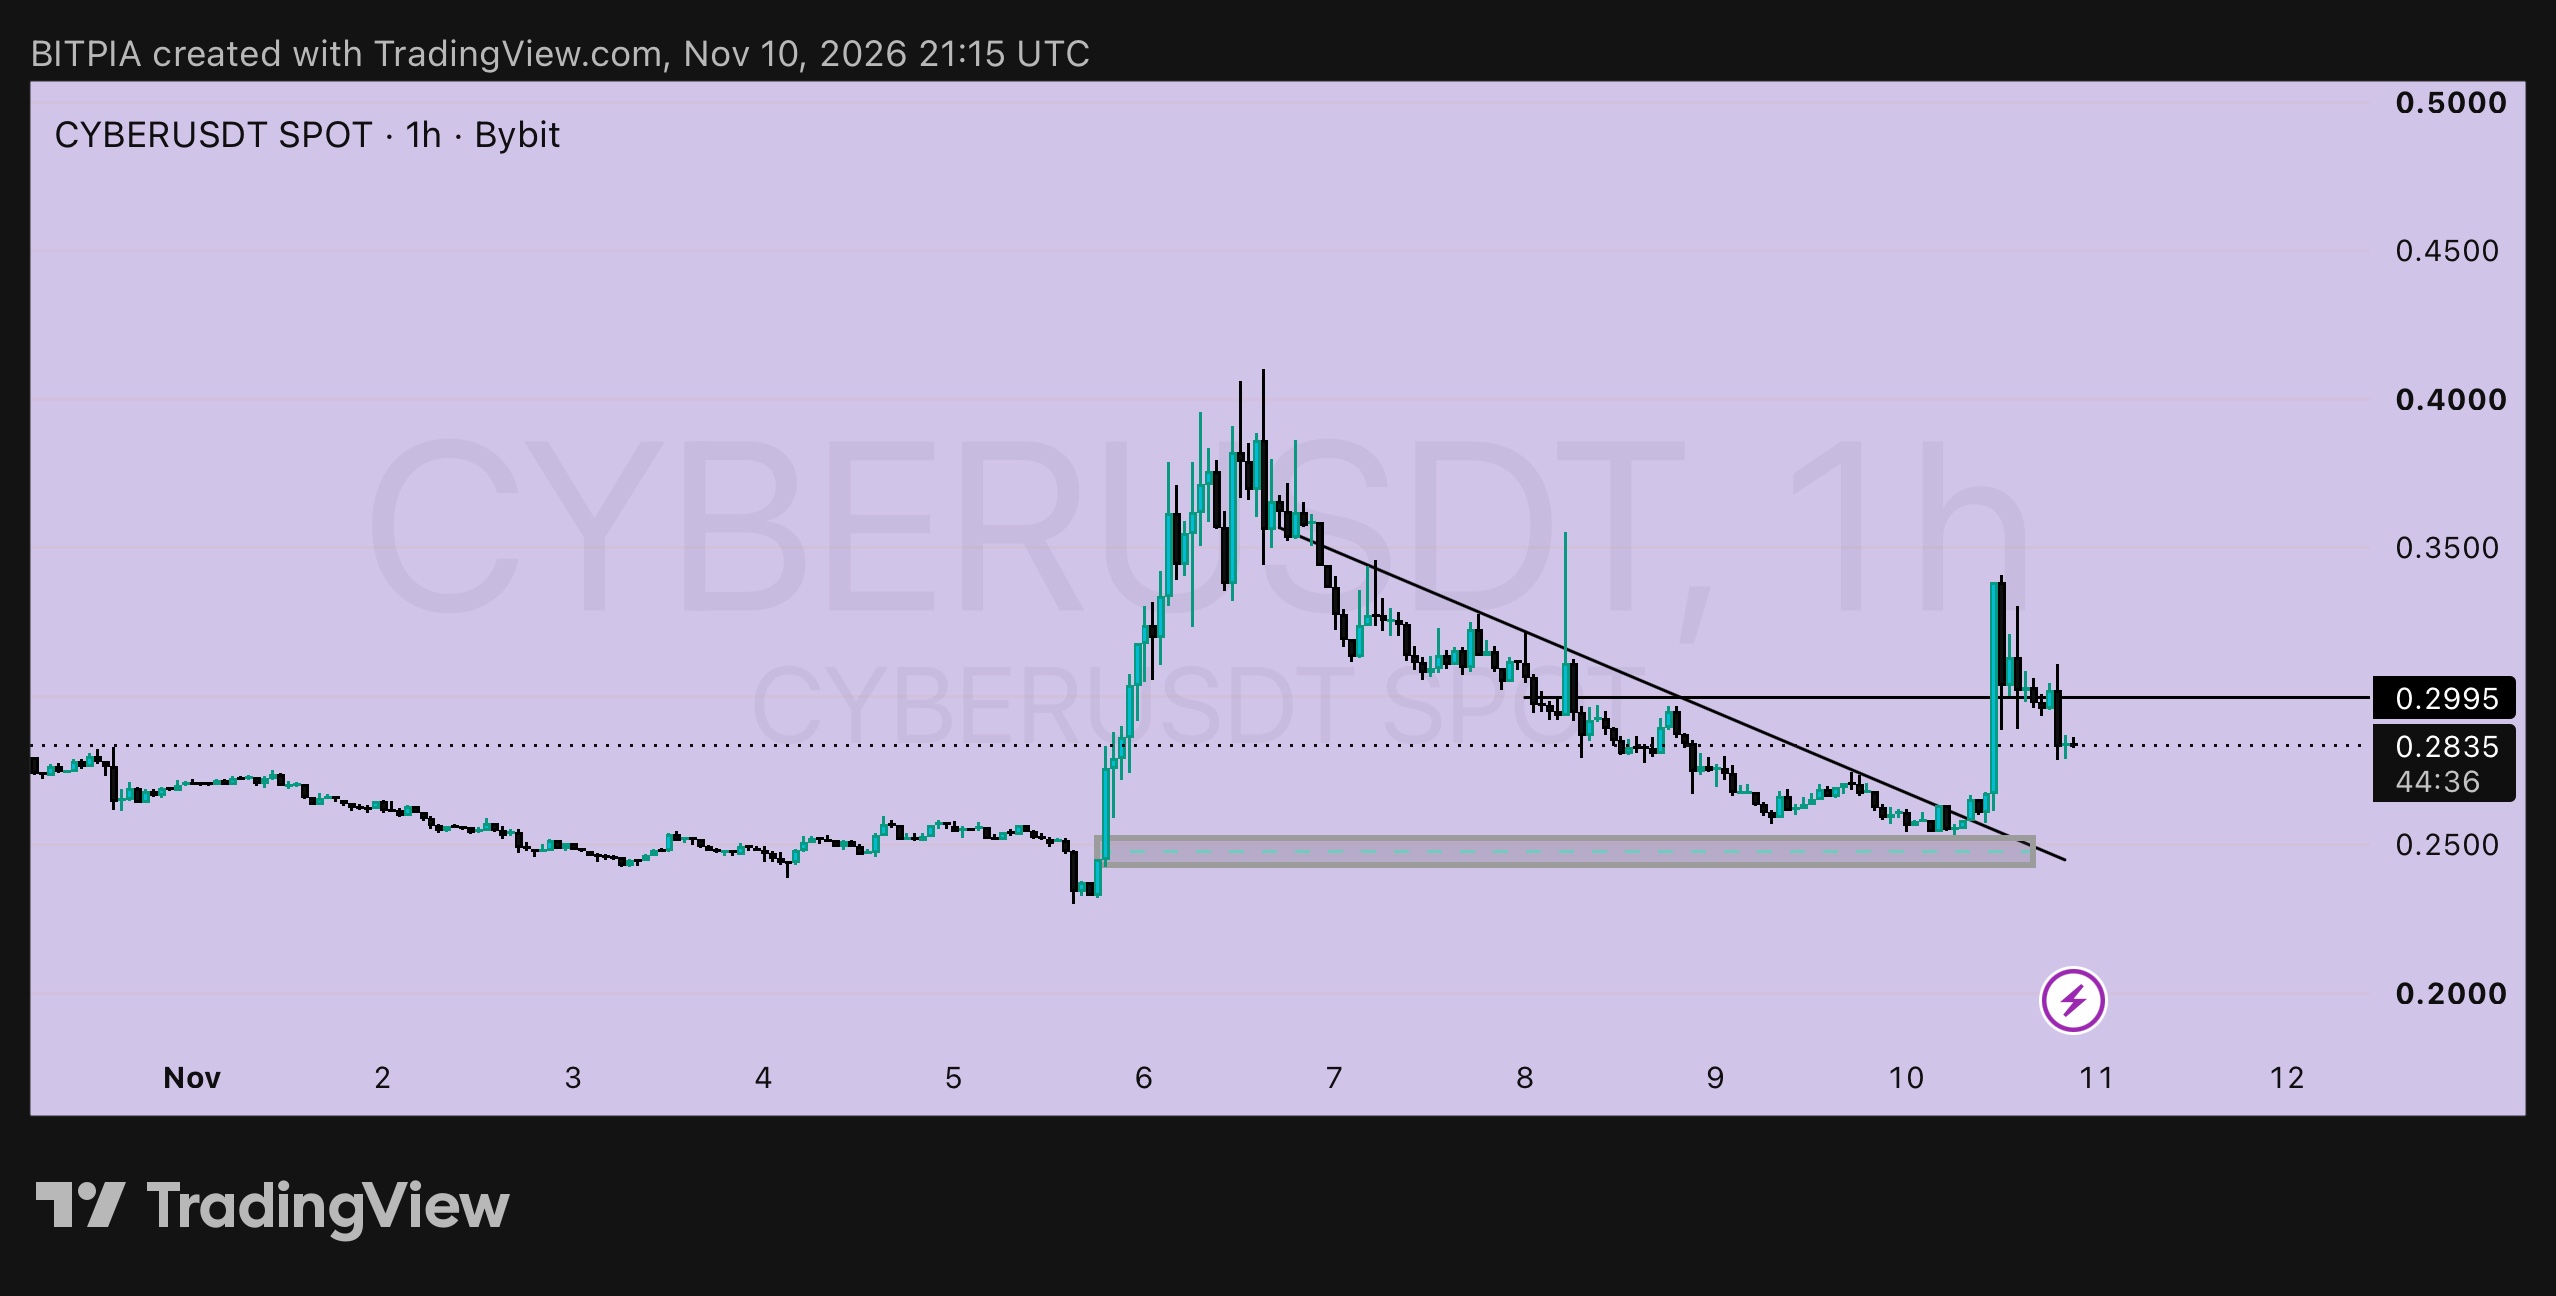
CYBER 1h: short and sweet 🍬 $CYBERUSDT broke its falling trendline this morning and jumped to about 0.345, but then gave most of it back and slid under 0.2995. Price is at 0.2835. A break that can't hold above the first resistance is a warning, not a failure yet. I'd wait for one of two clear signals. ➤ Signal 1: a retest of the floor ▸ Entry: around 0.2600, near the 0.245 to 0.255 support zone and the old trendline ▸ Stop-loss: below 0.2420 ▸ Risk per unit: 0.0180 ▸ Target 1: 0.2995, +0.0395, about 2.2R ▸ Target 2: 0.3450, +0.0850, about 4.7R ➤ Signal 2: a clean close above 0.2995 ▸ Entry: around 0.3030 ▸ Stop-loss: below 0.2800 ▸ Risk per unit: 0.0230 ▸ Targets: 0.3450 (+0.0420, about 1.8R) and 0.4000 (+0.0970, about 4.2R) ➤ Why not now At 0.2835 with the stop at 0.2420, risk is 0.0415, and the first level above is only 0.0160 away. That's under half a unit of reward for one unit of risk. ➤ What cancels it A 1h close under 0.2420 means the support zone has failed, and I'd step aside. The Nov 6 high near 0.41 shows how fast this one can move, in both directions. Small size, and low leverage if you use perps. Not financial advice. Do your own research and only risk what you can afford to lose. #ByXIMPACT #WSOT2026
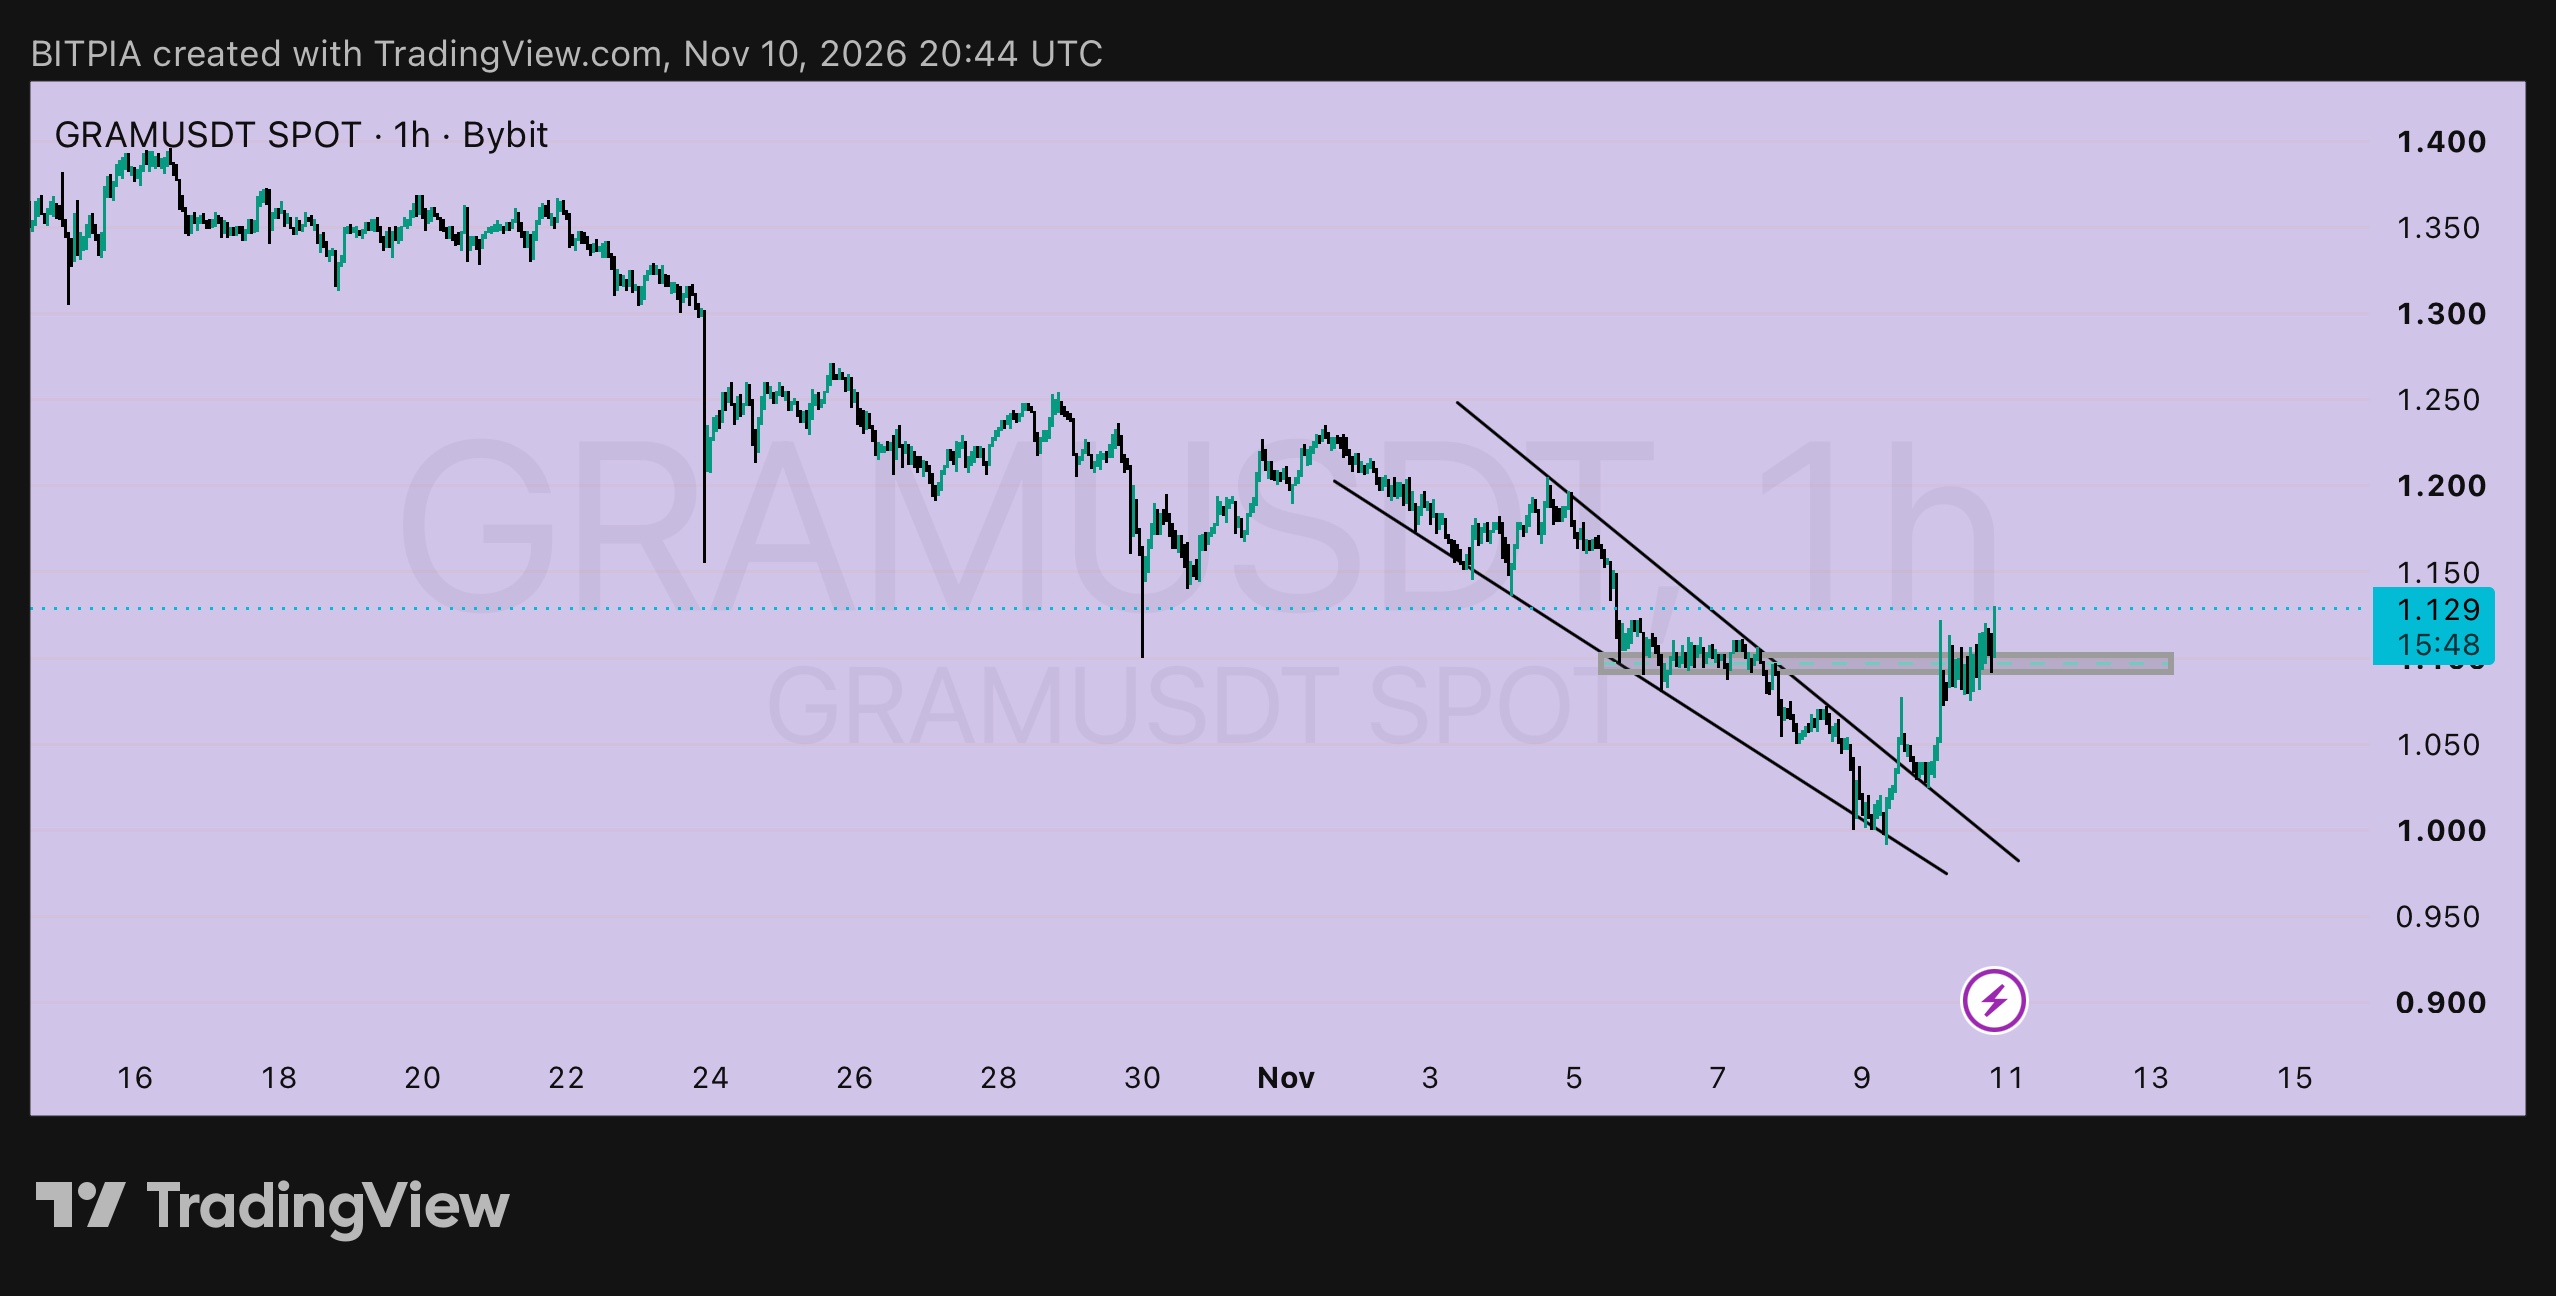
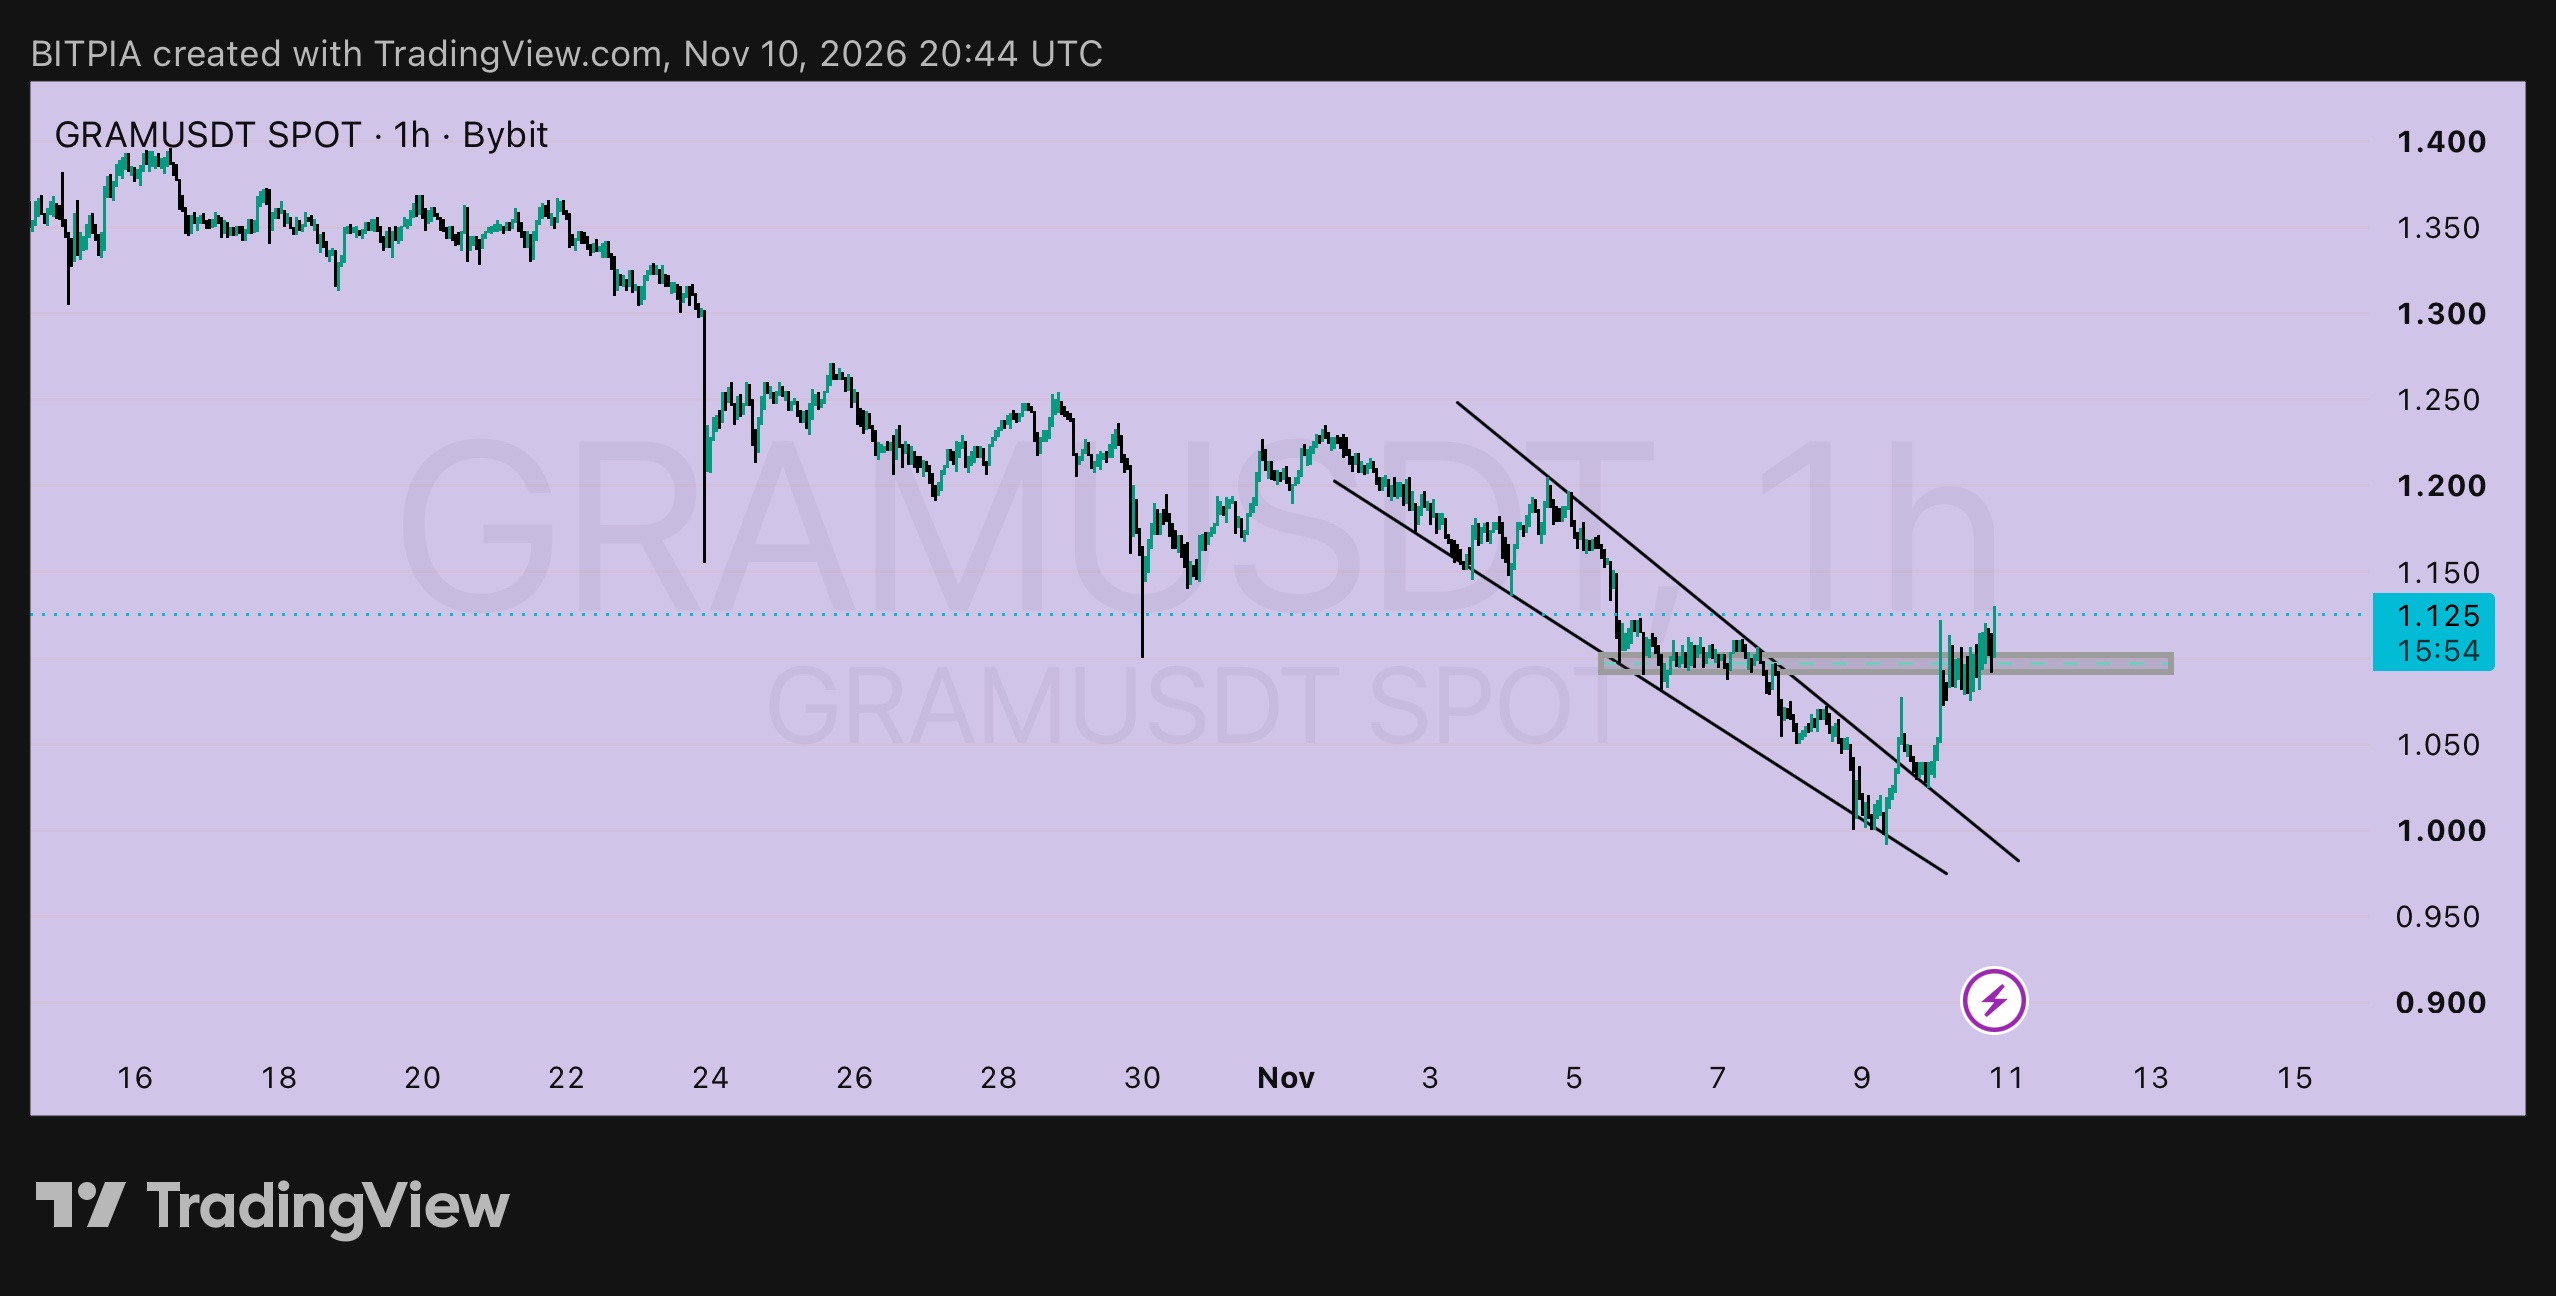
$GRAMUSDT 1h: where are we in the breakout cycle? A breakout usually goes through three stages: the break, the retest, and the continuation. Here's where GRAM stands, with price at 1.129. ➤ Stage 1: the break ✅ done ▸ Price came out of its falling channel on Nov 9 after a low near 0.99 ▸ The break was clean, with strong candles through the upper line ➤ Stage 2: the retest ✅ mostly done ▸ Price reclaimed the 1.095 to 1.105 zone, which was support before the last leg lower ▸ It has been sitting on that zone, holding it so far, which is what I want to see ➤ Stage 3: the continuation ⏳ not yet ▸ A 1h close above 1.150 would be the first confirmation ▸ After that, the next stops are 1.210 (the Nov 3 to 4 high), then 1.250 (the late-October area) ➤ My plan ▸ Entry: around 1.105, on a dip into the zone that holds ▸ Stop-loss: below 1.055, under the broken channel line ▸ Risk per unit: 0.050 ▸ Target 1: 1.150, +0.045, about 0.9R ▸ Target 2: 1.210, +0.105, about 2.1R ▸ Target 3: 1.250, +0.145, about 2.9R ➤ Chase math At 1.129 with the same stop, risk is 0.074. To 1.210 that's about 1.1R, and to 1.250 about 1.6R. Not bad, not great. The dip is better, but there's no guarantee price visits it. ➤ What cancels it A 1h close under 1.055 means the retest has failed and price is back inside the old channel, and I'd step aside. The bigger trend is still lower from 1.40 earlier this month, so size small, and keep leverage low if you use perps. Not financial advice. Do your own research and only risk what you can afford to lose. #ByXIMPACT #WSOT2026
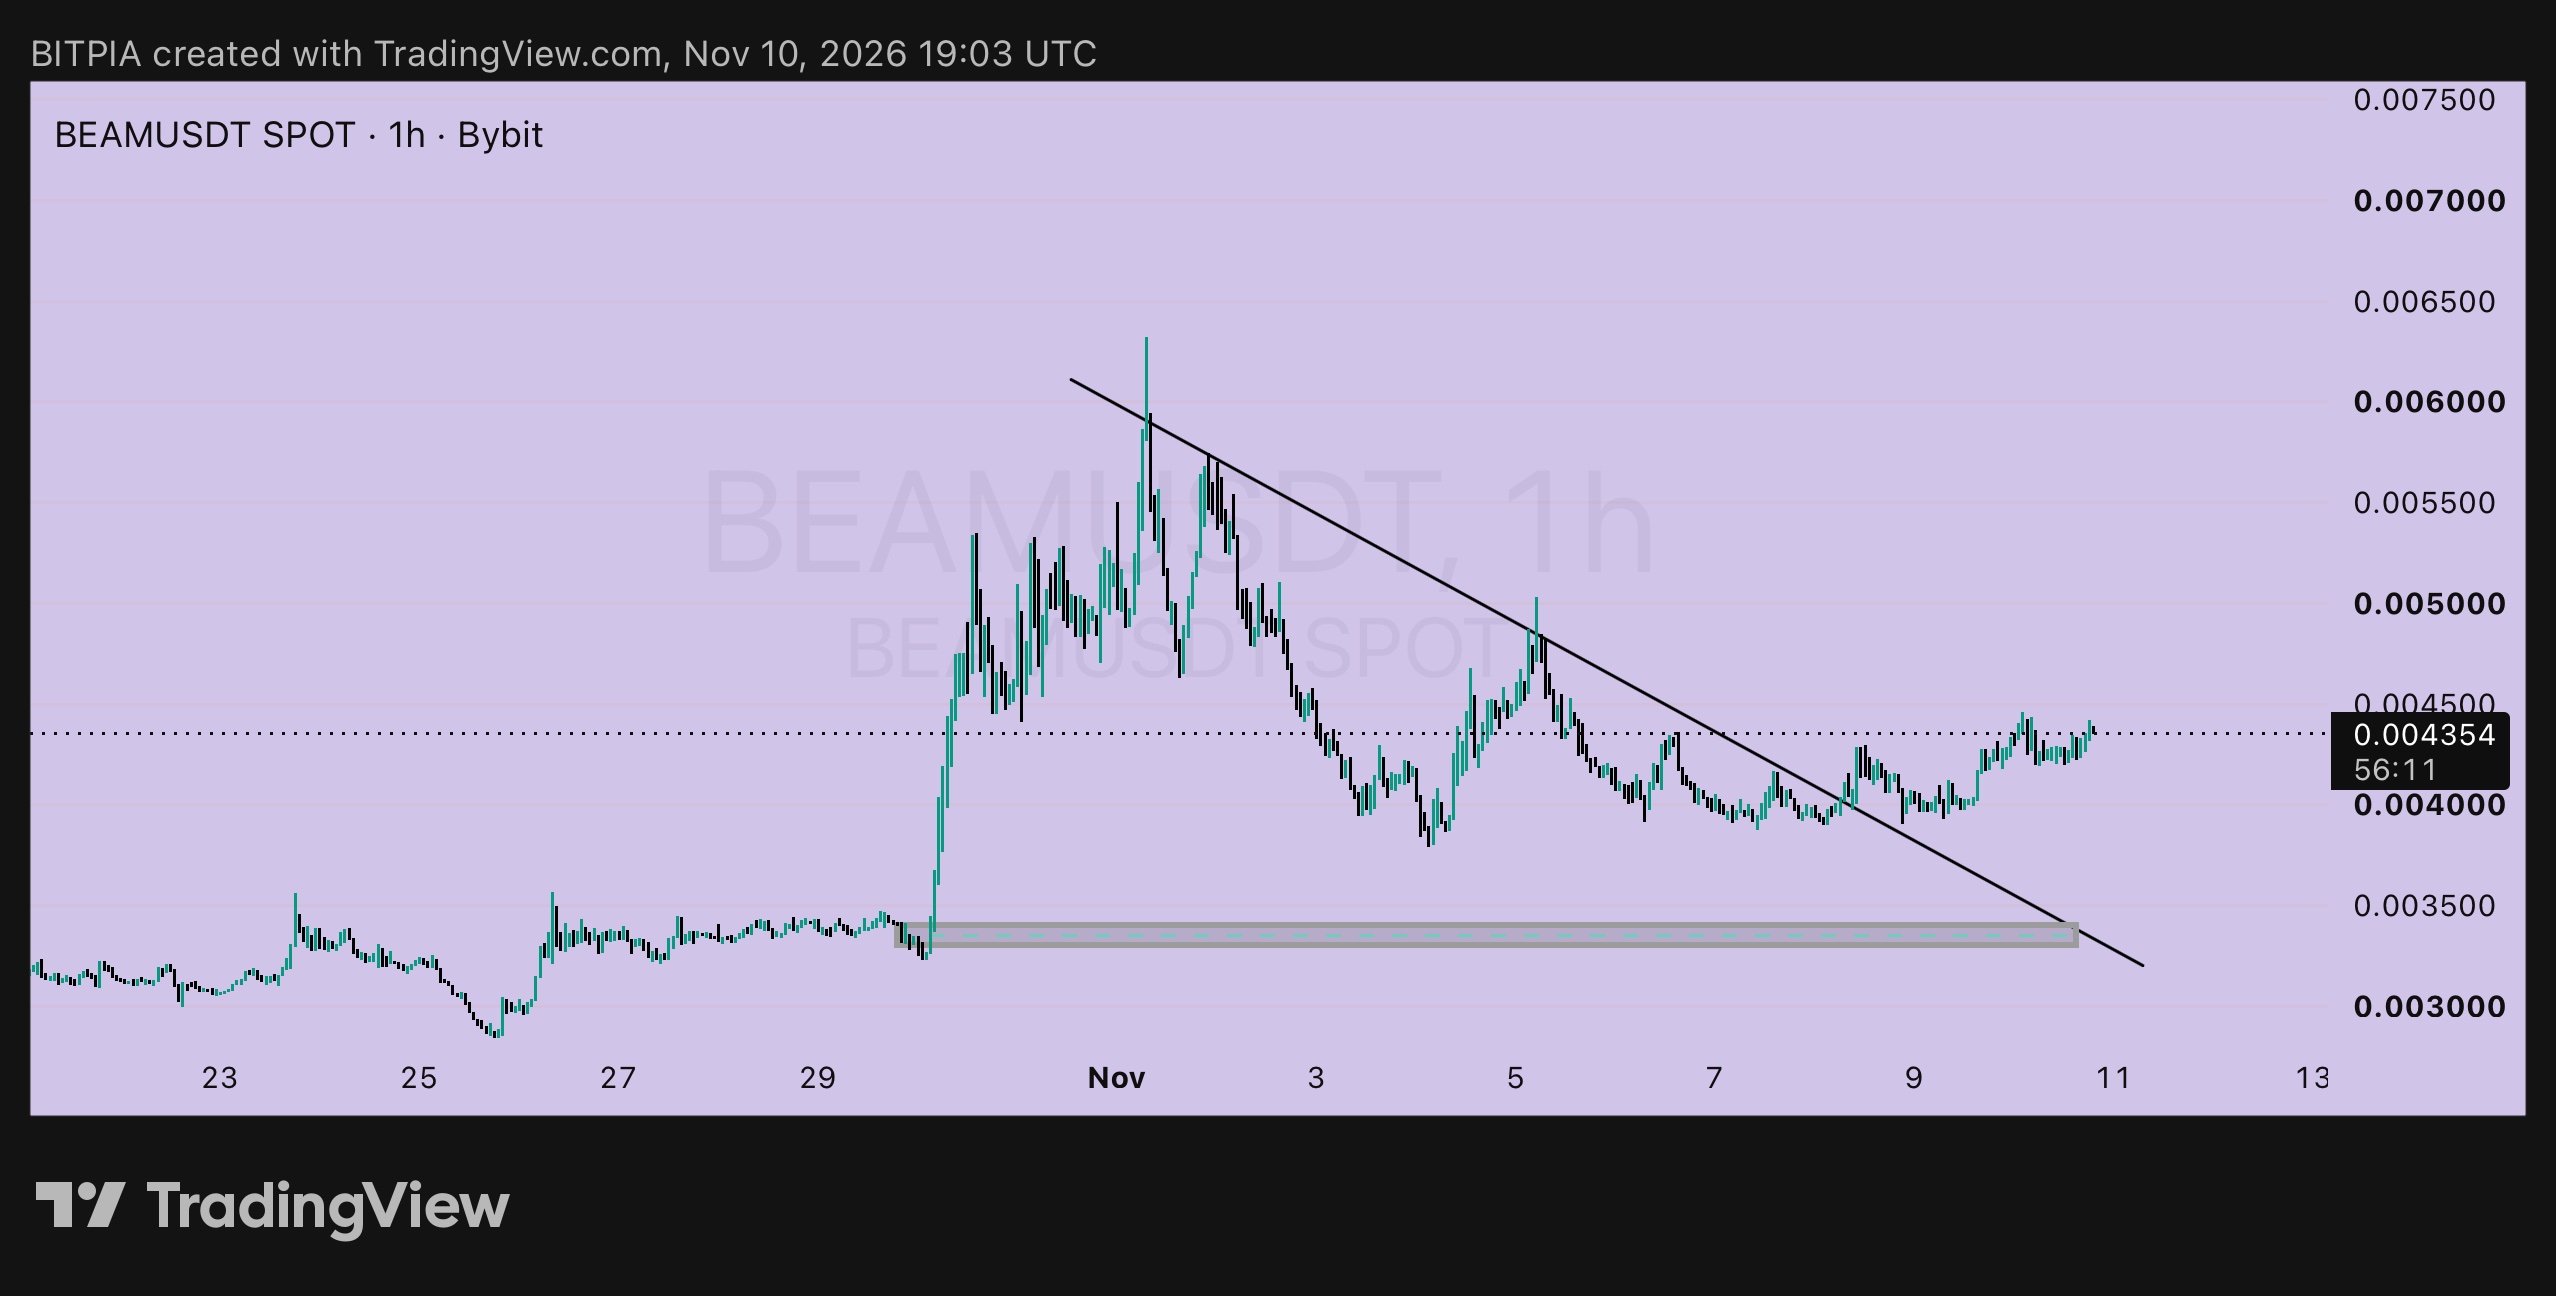
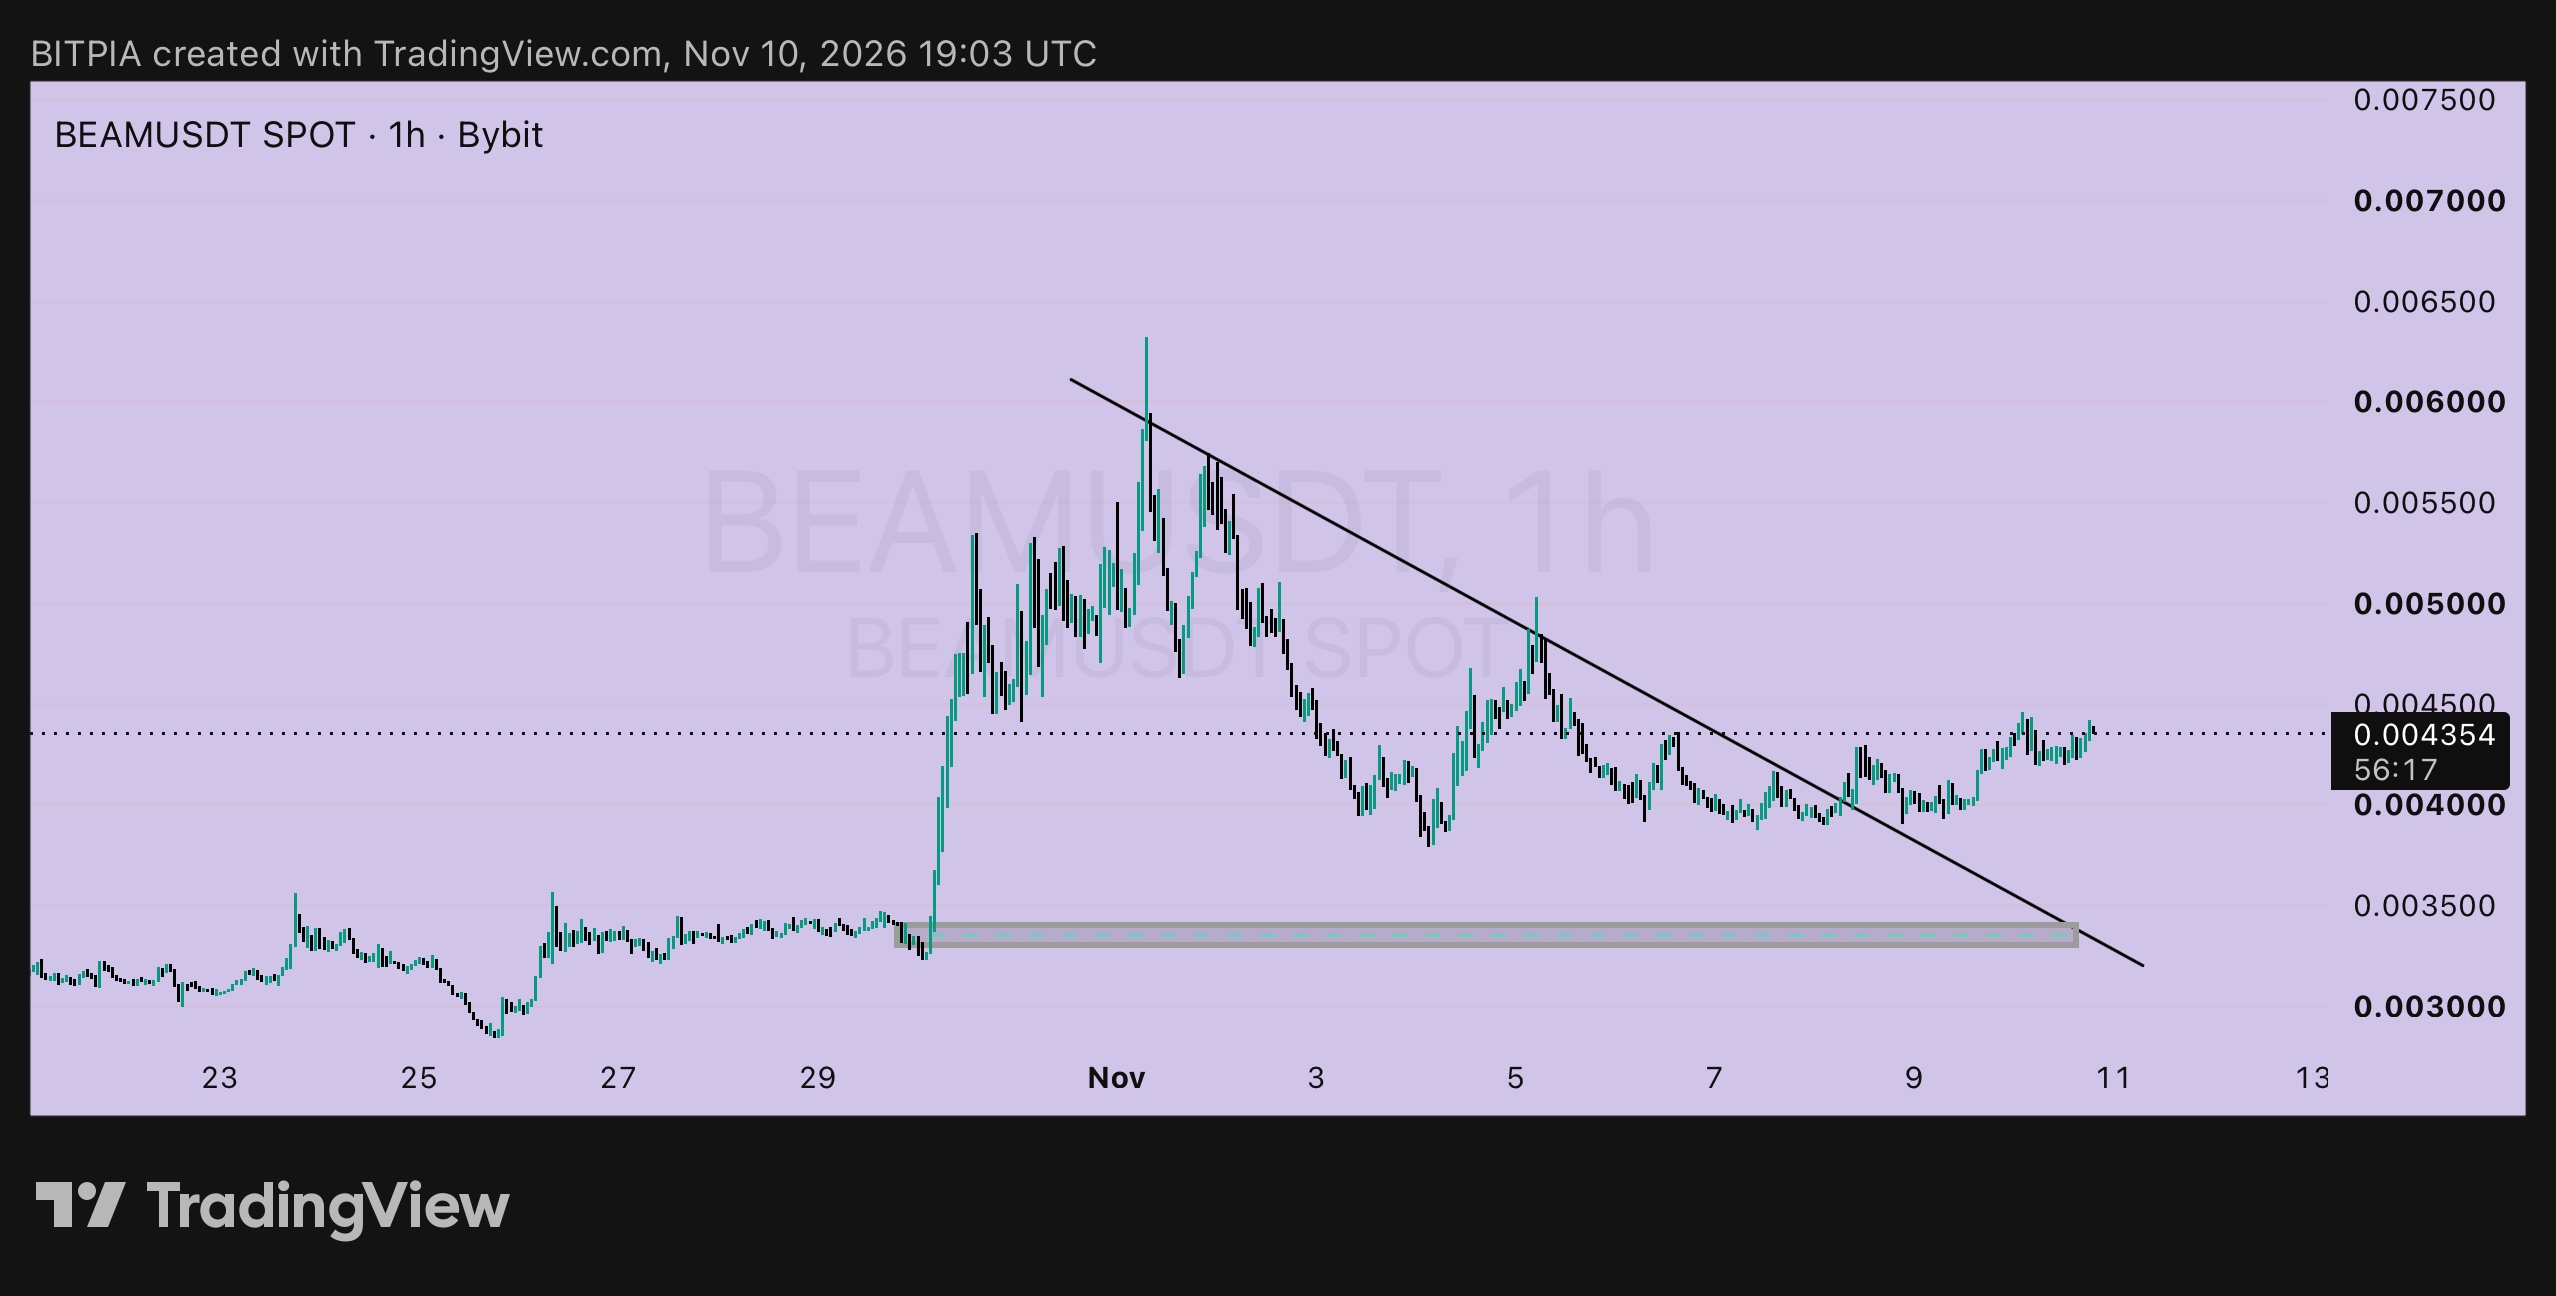
$BEAMUSDT 1h: the news ticker 📰 ➤ Breaking: the trendline is broken ▸ Price cleared the falling line from the Nov 1 high on Nov 8 and has stayed above it for two days ▸ It's at 0.004354 now, up from 0.004041 when I posted on Nov 7 ➤ Plan check: Plan A, the breakout entry at 0.00425 ▸ Status: triggered, with price closing above the line ▸ Stop-loss was 0.00385, risk 0.00040 ▸ Now about +0.0001, roughly 0.25R in profit. Not much yet, but the break held ➤ Plan check: Plan B, the early entry at 0.00395 ▸ Status: the Nov 9 low reached about 0.0039, so it likely filled ▸ Stop-loss was 0.00370, risk 0.00025 ▸ Now about +0.0004, roughly 1.6R in profit ➤ Developing: what I'd do next ▸ For open trades, raise the stop to just under 0.00385, below the Nov 9 low and the broken line ▸ Target 1: 0.00500, the area where price was rejected on Nov 5 ▸ Target 2: 0.00550 ▸ Target 3: 0.00600, close to the Nov 1 high area From the Plan A entry (0.00425), those are about 1.9R, 3.1R and 4.4R. ➤ If you're not in ▸ Entry: a dip toward 0.00415, if the old line holds as support ▸ Stop-loss: below 0.00385 ▸ Risk per unit: 0.00030 ▸ Targets: 0.00500 (+0.00085, about 2.8R) and 0.00550 (+0.00135, about 4.5R) ➤ Weather report The base zone near 0.0033 to 0.0034 is far below, so there's plenty of room between price and the launch base if things reverse. ➤ What cancels it A 1h close under 0.00385 means the break has failed, and I'd step aside. Small size, and low leverage if you use perps. Not financial advice. Do your own research and only risk what you can afford to lose. #ByXIMPACT #WSOT2026
INIT 1h: pay yourself 💰 $INITUSDT is at 0.24183. Two days ago I posted it at 0.12304 and said Door 2, the retest near 0.1200 with a stop under 0.1150, was my pick. Yesterday I moved the stop to 0.1200. Price has nearly doubled since then, and this is the moment to look at the math. ➤ The numbers ▸ Door 2 entry: 0.1200, risk 0.0050 ▸ Now: about +0.1218 per unit, roughly 24R ▸ Door 1 (0.1230, risk 0.0080) is also far ahead, around 14R ▸ Both targets I posted (0.1390 and 0.1520) were passed long ago A gain like this is the reason to have a plan before it happens. ➤ How I'd pay myself ▸ Take about half off near the 0.2400 to 0.2500 area, close to the Oct 28 high at 0.2550, where sellers appeared before ▸ Trail the stop on the rest up to about 0.1800, under this morning's pullback low ▸ After 0.2550 there's no old level on this chart to aim for, so I let the trailing stop do the work ➤ Why I'm not adding ▸ The candles are very large. Price swung from about 0.158 to 0.225 and back to 0.183 within hours ▸ At 0.2418 with a stop at 0.1780, risk is 0.0638, and 0.2550 is only about 0.2R away. That isn't a trade, it's a hope ➤ If you're not in ▸ I'd wait for a pullback toward 0.2050 and a hold above 0.2000 ▸ Stop-loss: below 0.1780 ▸ Risk per unit: 0.0270 ▸ Target: 0.2550, +0.0500, about 1.9R ▸ If it never comes back, that's fine. This move is already done ➤ What cancels it A 1h close under 0.1800 means the move has cooled. For open trades, the trailing stop does the job. After a move this big, small size, and low leverage if you use perps. Not financial advice. Do your own research and only risk what you can afford to lose. #ByXIMPACT #WSOT2026
$FIGHT 1h: the zigzag 〰️ Since October, $FIGHTUSDT has been moving in clean legs, and this is the picture I like to keep in mind. ➤ The legs so far ▸ Oct 5 to 18: a falling channel down to about 0.0026 ▸ Oct 18 to Nov 2: a rising channel up to about 0.0046 to 0.0050 ▸ Nov 2 to 9: another falling channel, down to a low near 0.00322 ▸ Now: price is at 0.003553, and it has just moved above the top line of that last falling channel If the pattern repeats, a new leg up may be starting. I'm not counting on it, because legs can fail and the 0.00375 floor from last week has turned into resistance. ➤ Where I stand on my Nov 9 plan ▸ Trigger: a 1h close above 0.00358 ▸ Status: not confirmed yet. Price touched about 0.00367 this morning, then eased back ▸ Nothing has been triggered, so nothing lost ➤ Plan A: wait for the close ▸ Entry: around 0.00360 ▸ Stop-loss: below 0.00330 ▸ Risk per unit: 0.00030 ▸ Target 1: 0.00385, +0.00025, about 0.8R ▸ Target 2: 0.00420, +0.00060, about 2R ▸ Target 3: 0.00455, +0.00095, about 3.2R ➤ Plan B: a retest ▸ Entry: around 0.00345, if price returns to the broken channel line and holds ▸ Stop-loss: below 0.00322, under the last low ▸ Risk per unit: 0.00023 ▸ Targets: 0.00385 (+0.00040, about 1.7R) and 0.00420 (+0.00075, about 3.3R) Plan B has better numbers, and it only works if price gives it to me. ➤ What cancels it A 1h close under 0.00322 means the new leg has failed, and I step aside. The 0.0030 area would be the next level I'd watch. Small size, and low leverage if you use perps. Not financial advice. Do your own research and only risk what you can afford to lose. #WSOT2026
FIGHT 1h: the floor failed, and I'm saying it plainly On Nov 7 I posted $FIGHTUSDT at 0.003873 and said the 0.00375 to 0.00385 floor was the level to watch, with a stop under 0.00352. It didn't hold. Price slid to a low near 0.00322 and is now bouncing at 0.003442. ➤ What it means for the trade ▸ If you entered near 0.00385 and used the 0.00352 stop, you were stopped out for roughly a 1R loss ▸ If you added at 0.00375 with the 0.00355 stop, the loss is about the same size, a full 1R ▸ That's the job of a stop: it kept a wrong idea small. I'd rather show you this than hide it ➤ What the chart shows now ▸ Since October, FIGHT has been moving in clean swings: a falling channel, then a rising one, and now a falling one again ▸ Price is trading under the old floor, which has turned into resistance near 0.00375 ▸ The top line of the current channel sits near 0.00352 to 0.00358, and that's the first thing to clear ➤ Plan A: wait for the channel to break up ▸ Trigger: a 1h close above 0.00358 ▸ Entry: around 0.00360 ▸ Stop-loss: below 0.00330 ▸ Risk per unit: 0.00030 ▸ Targets: 0.00385 (+0.00025, about 0.8R), 0.00420 (+0.00060, about 2R), 0.00455 (+0.00095, about 3.2R) ➤ Plan B: the next real floor ▸ Entry: around 0.00305, only if buyers show up near 0.0030 ▸ Stop-loss: below 0.00285 ▸ Risk per unit: 0.00020 ▸ Targets: 0.00345 (+0.00040, about 2R) and 0.00380 (+0.00075, about 3.75R) ➤ What I'm not doing Not buying at 0.003442 in the middle of the channel. I have no close stop there and no confirmation. ➤ What cancels it Under 0.0028, I'd look at the 0.0025 to 0.0026 area from October and wait. Small size, and low leverage if you use perps. Not financial advice. Do your own research and only risk what you can afford to lose. #ByXIMPACT #WSOT2026
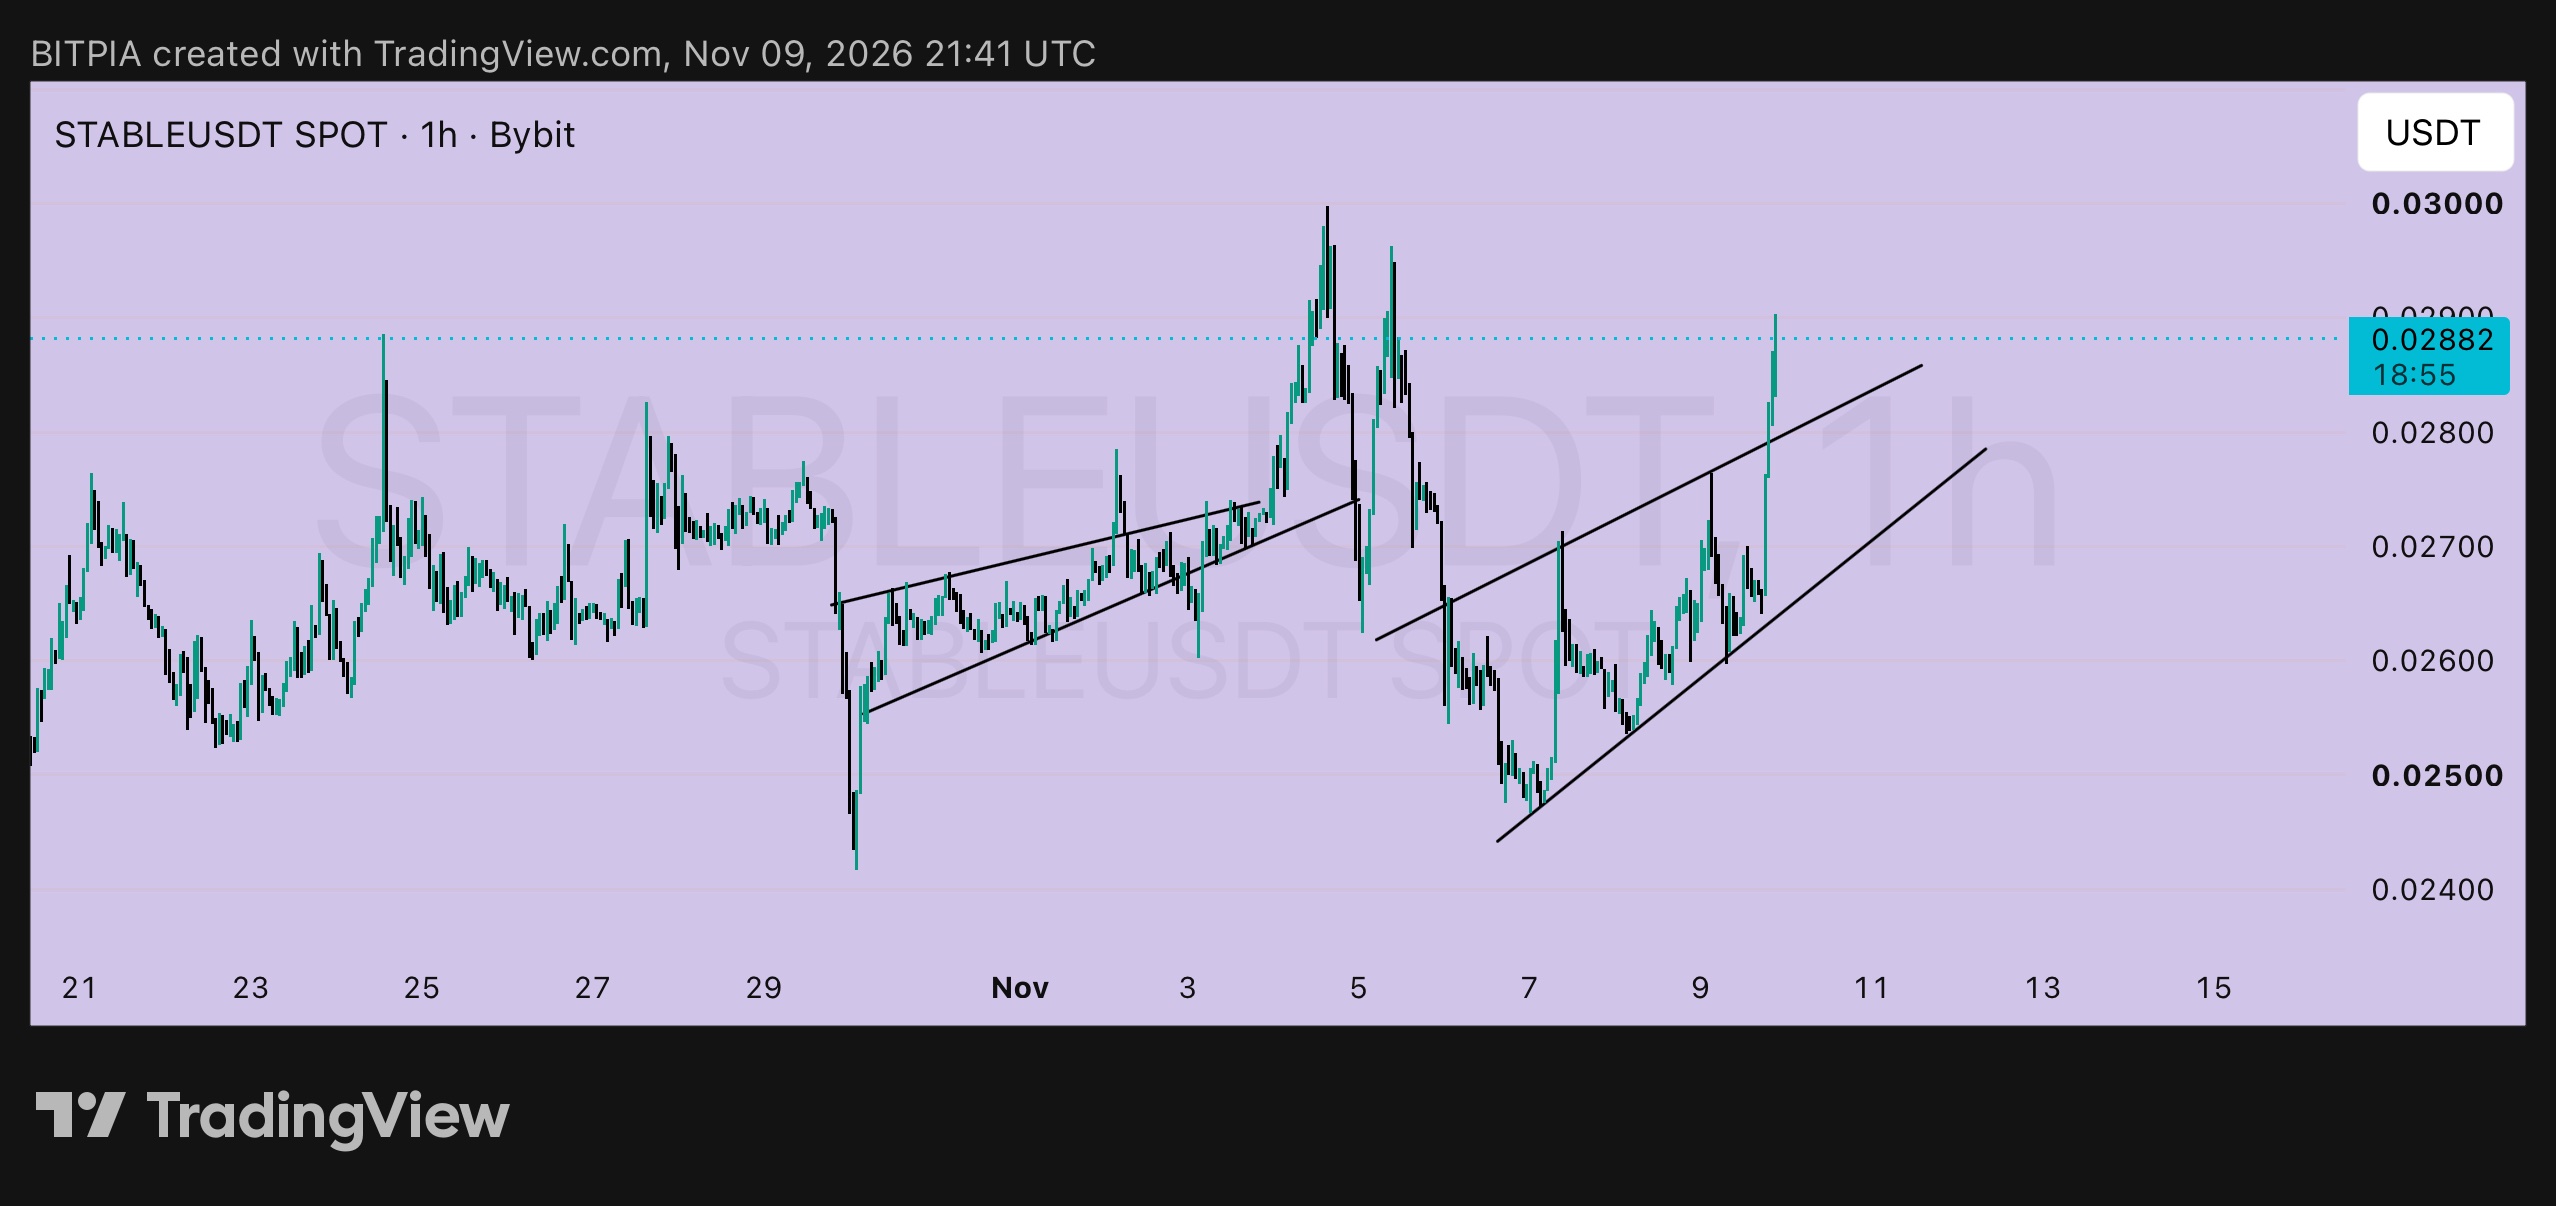
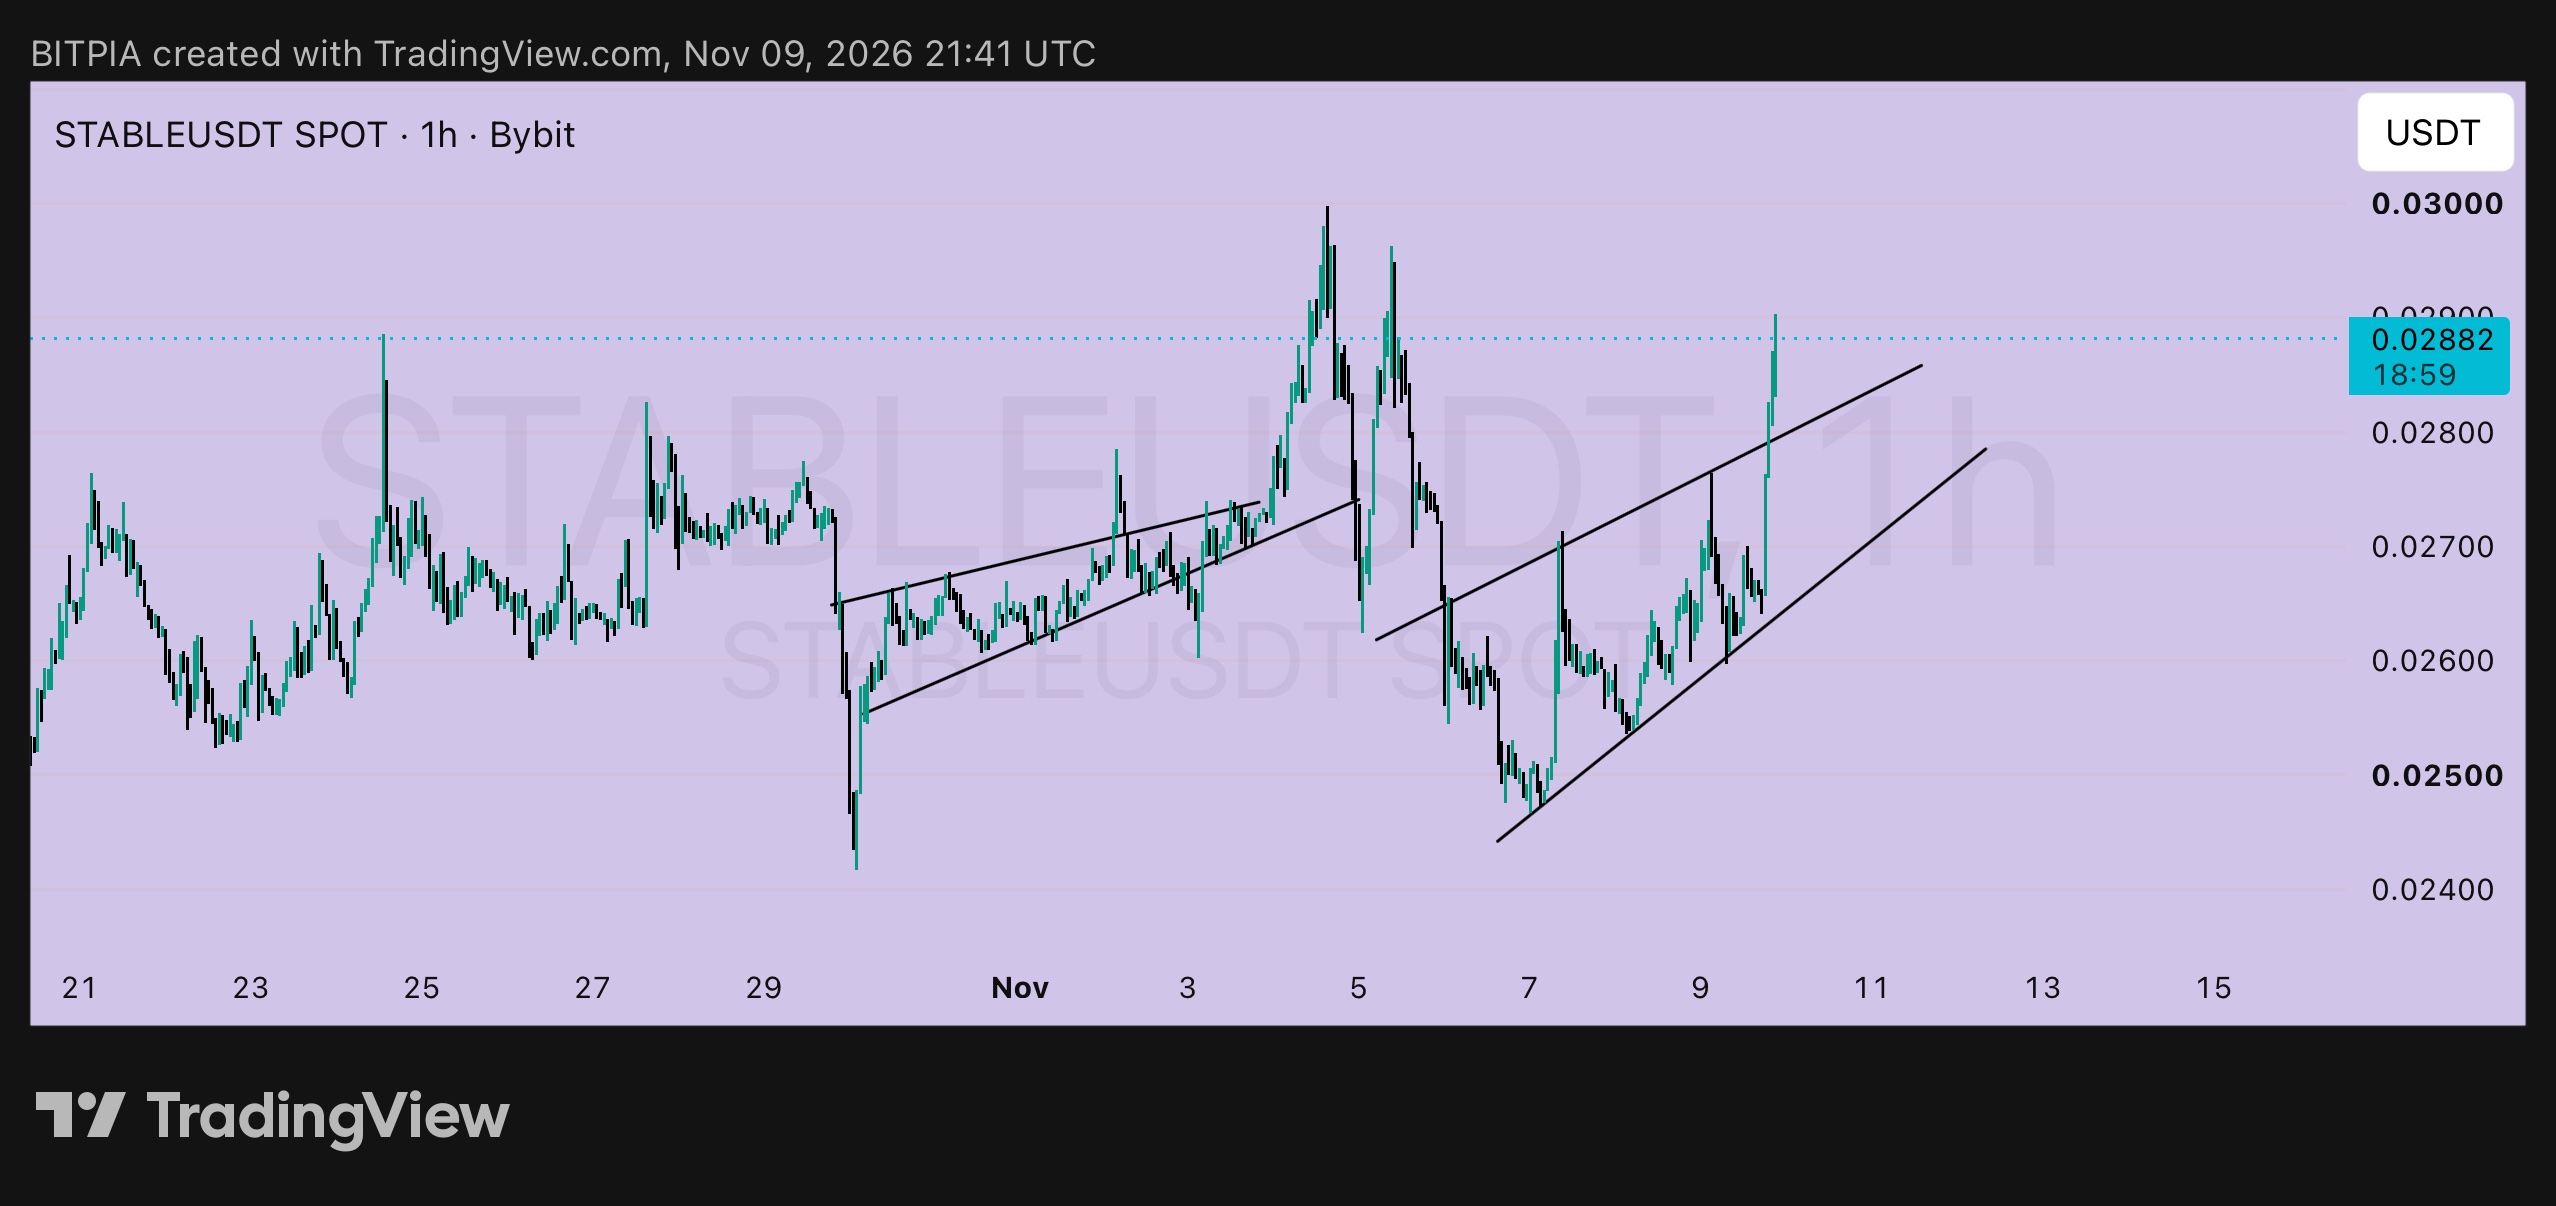
STABLE 1h: the bedtime plan 🌙 It's late in Lagos, so here's a set-and-forget version for $STABLEUSDT. Price is 0.02882 after breaking out of its rising channel, with the upper line, now near 0.0280, behind it. No need to watch the screen all night if you set these three things. ➤ Alert 1: 0.0290 ▸ The level of the Oct 24 high and a close rejection on Nov 5 ▸ If price closes above it on the 1h chart, momentum is real ➤ Alert 2: 0.0300 ▸ The Nov 4 high, and the next big round number ▸ A close above it is my breakout trigger ➤ Order idea: the retest ▸ Entry: around 0.0278, near the old channel line, if price comes back and holds ▸ Stop-loss: below 0.0262, under the channel's lower line ▸ Risk per unit: 0.0016 ▸ Target 1: 0.0300, +0.0022, about 1.4R ▸ Target 2: 0.0330, +0.0052, about 3.25R ➤ Breakout version ▸ Entry: around 0.0302, after a 1h close above 0.0300 ▸ Stop-loss: below 0.0286 ▸ Risk per unit: 0.0016 ▸ Targets: 0.0330 (+0.0028, about 1.75R) and 0.0350 (+0.0048, about 3R) ➤ Why not buy now At 0.02882 with the 0.0262 stop, risk is 0.0026, and 0.0330 is only about 1.6R away. Price is also just under 0.0290, which has stopped it before. I'd rather wait for either the retest or the clean break. ➤ What cancels it A 1h close back inside the channel and under 0.0262 means the breakout has failed, and I'd step aside. Small size, and low leverage if you use perps. Then sleep well. 💙 Not financial advice. Do your own research and only risk what you can afford to lose. #ByXIMPACT #WSOT2026
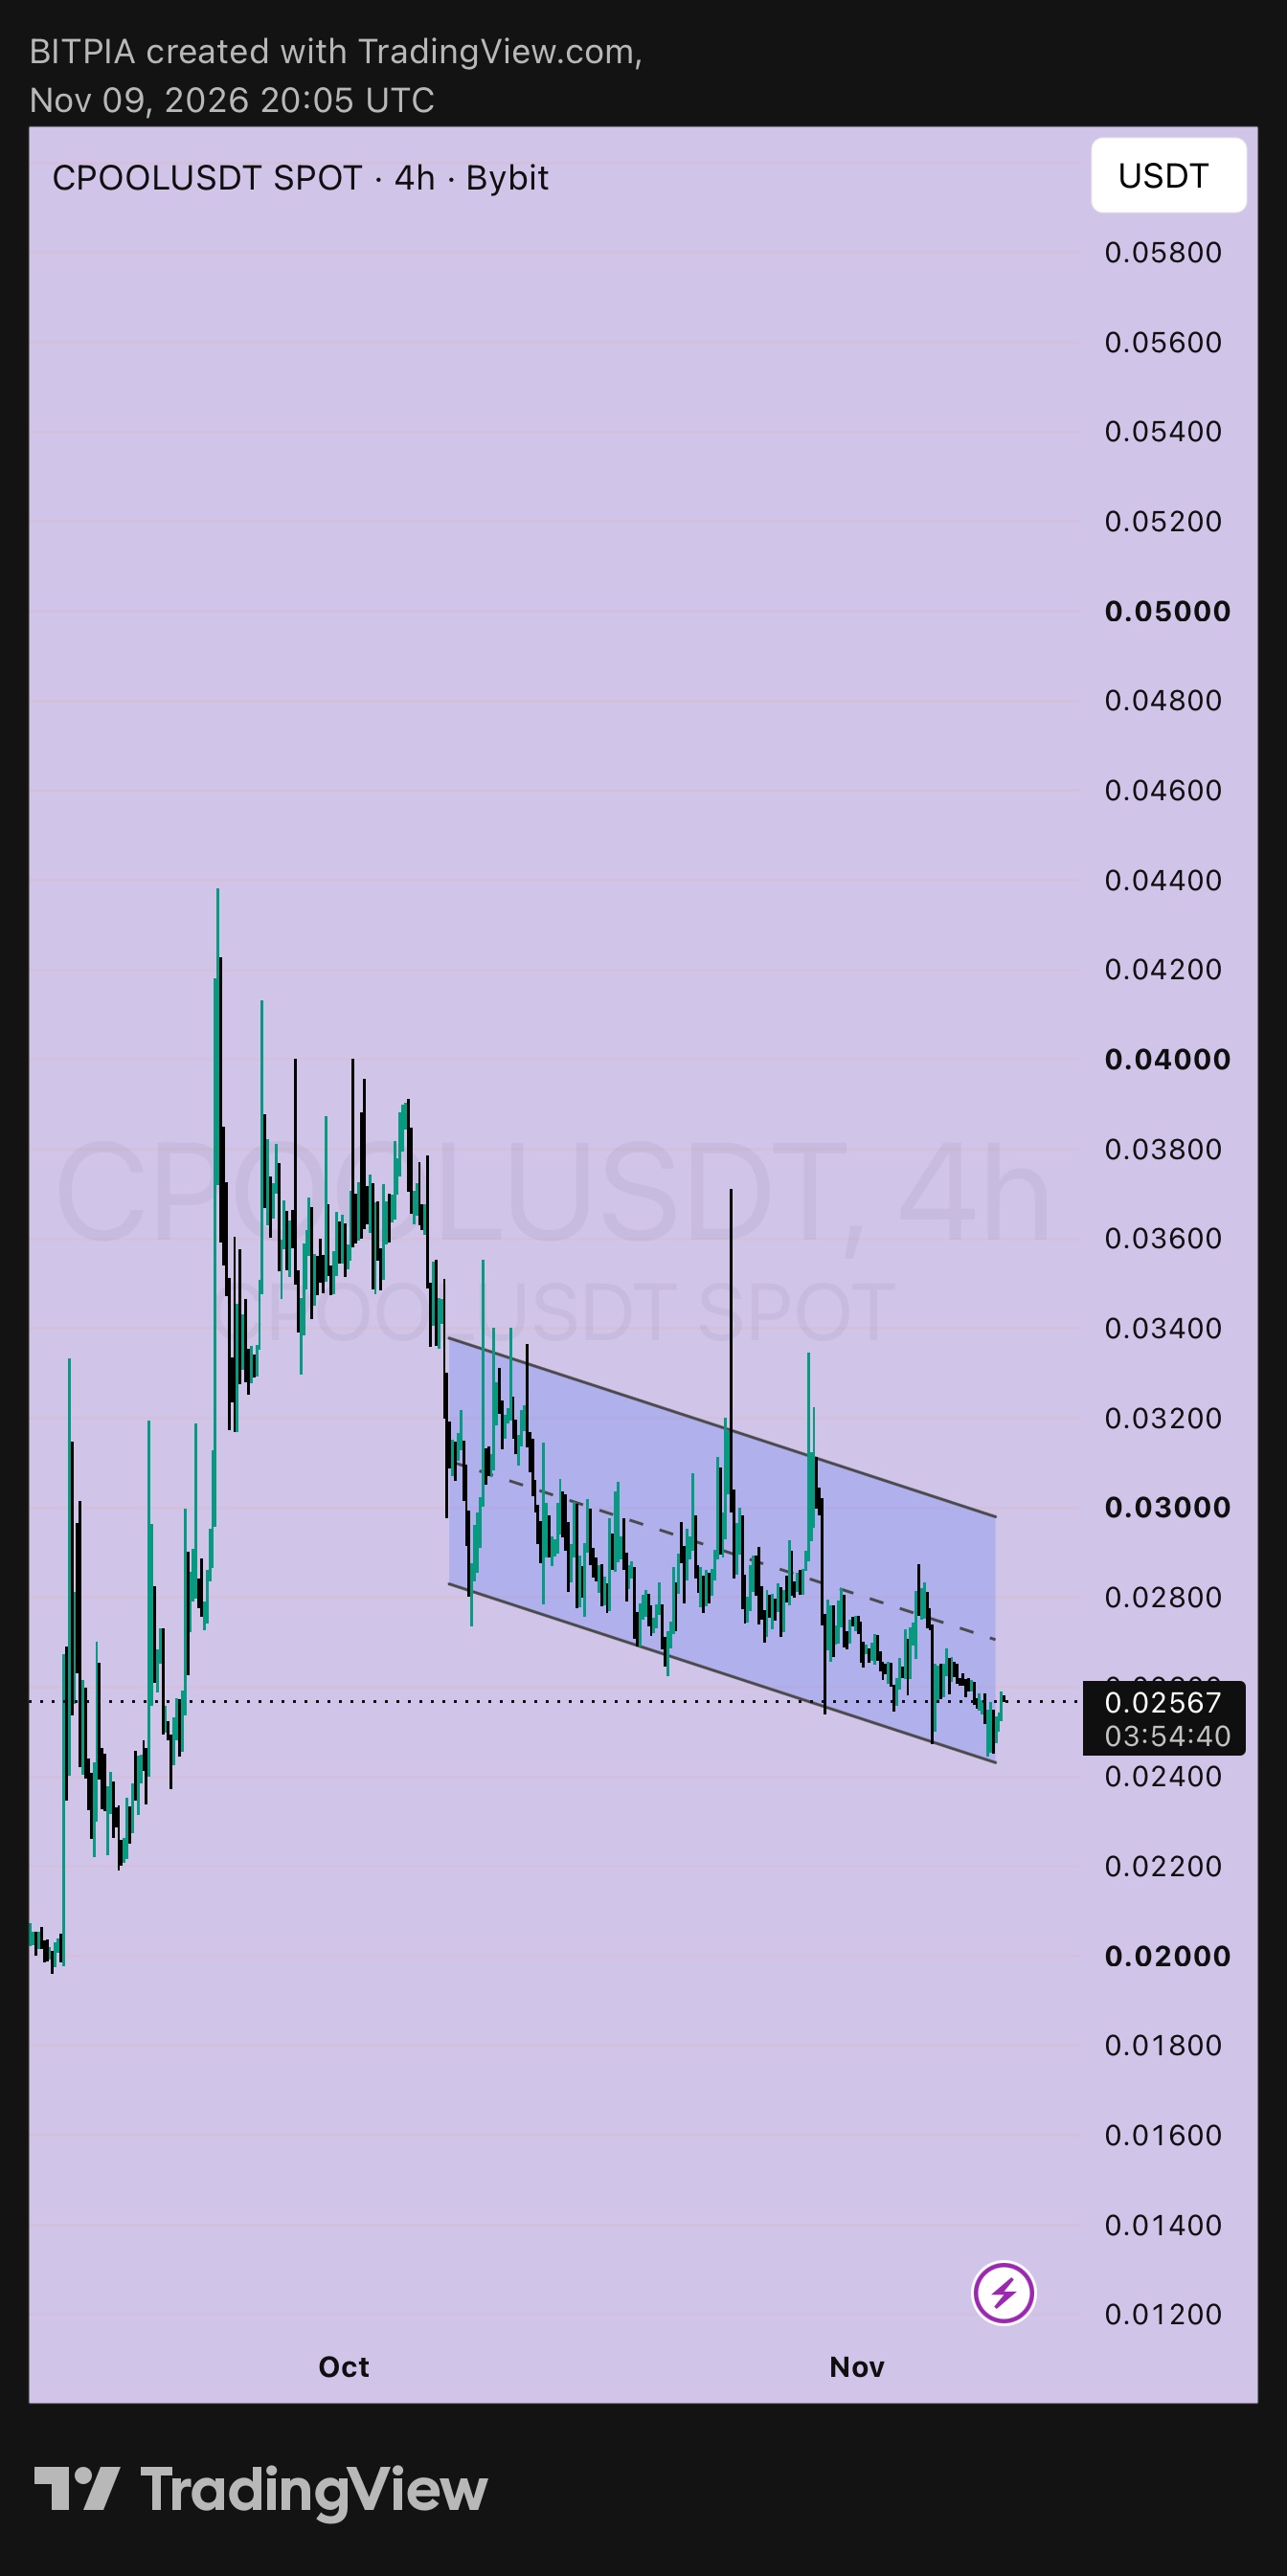
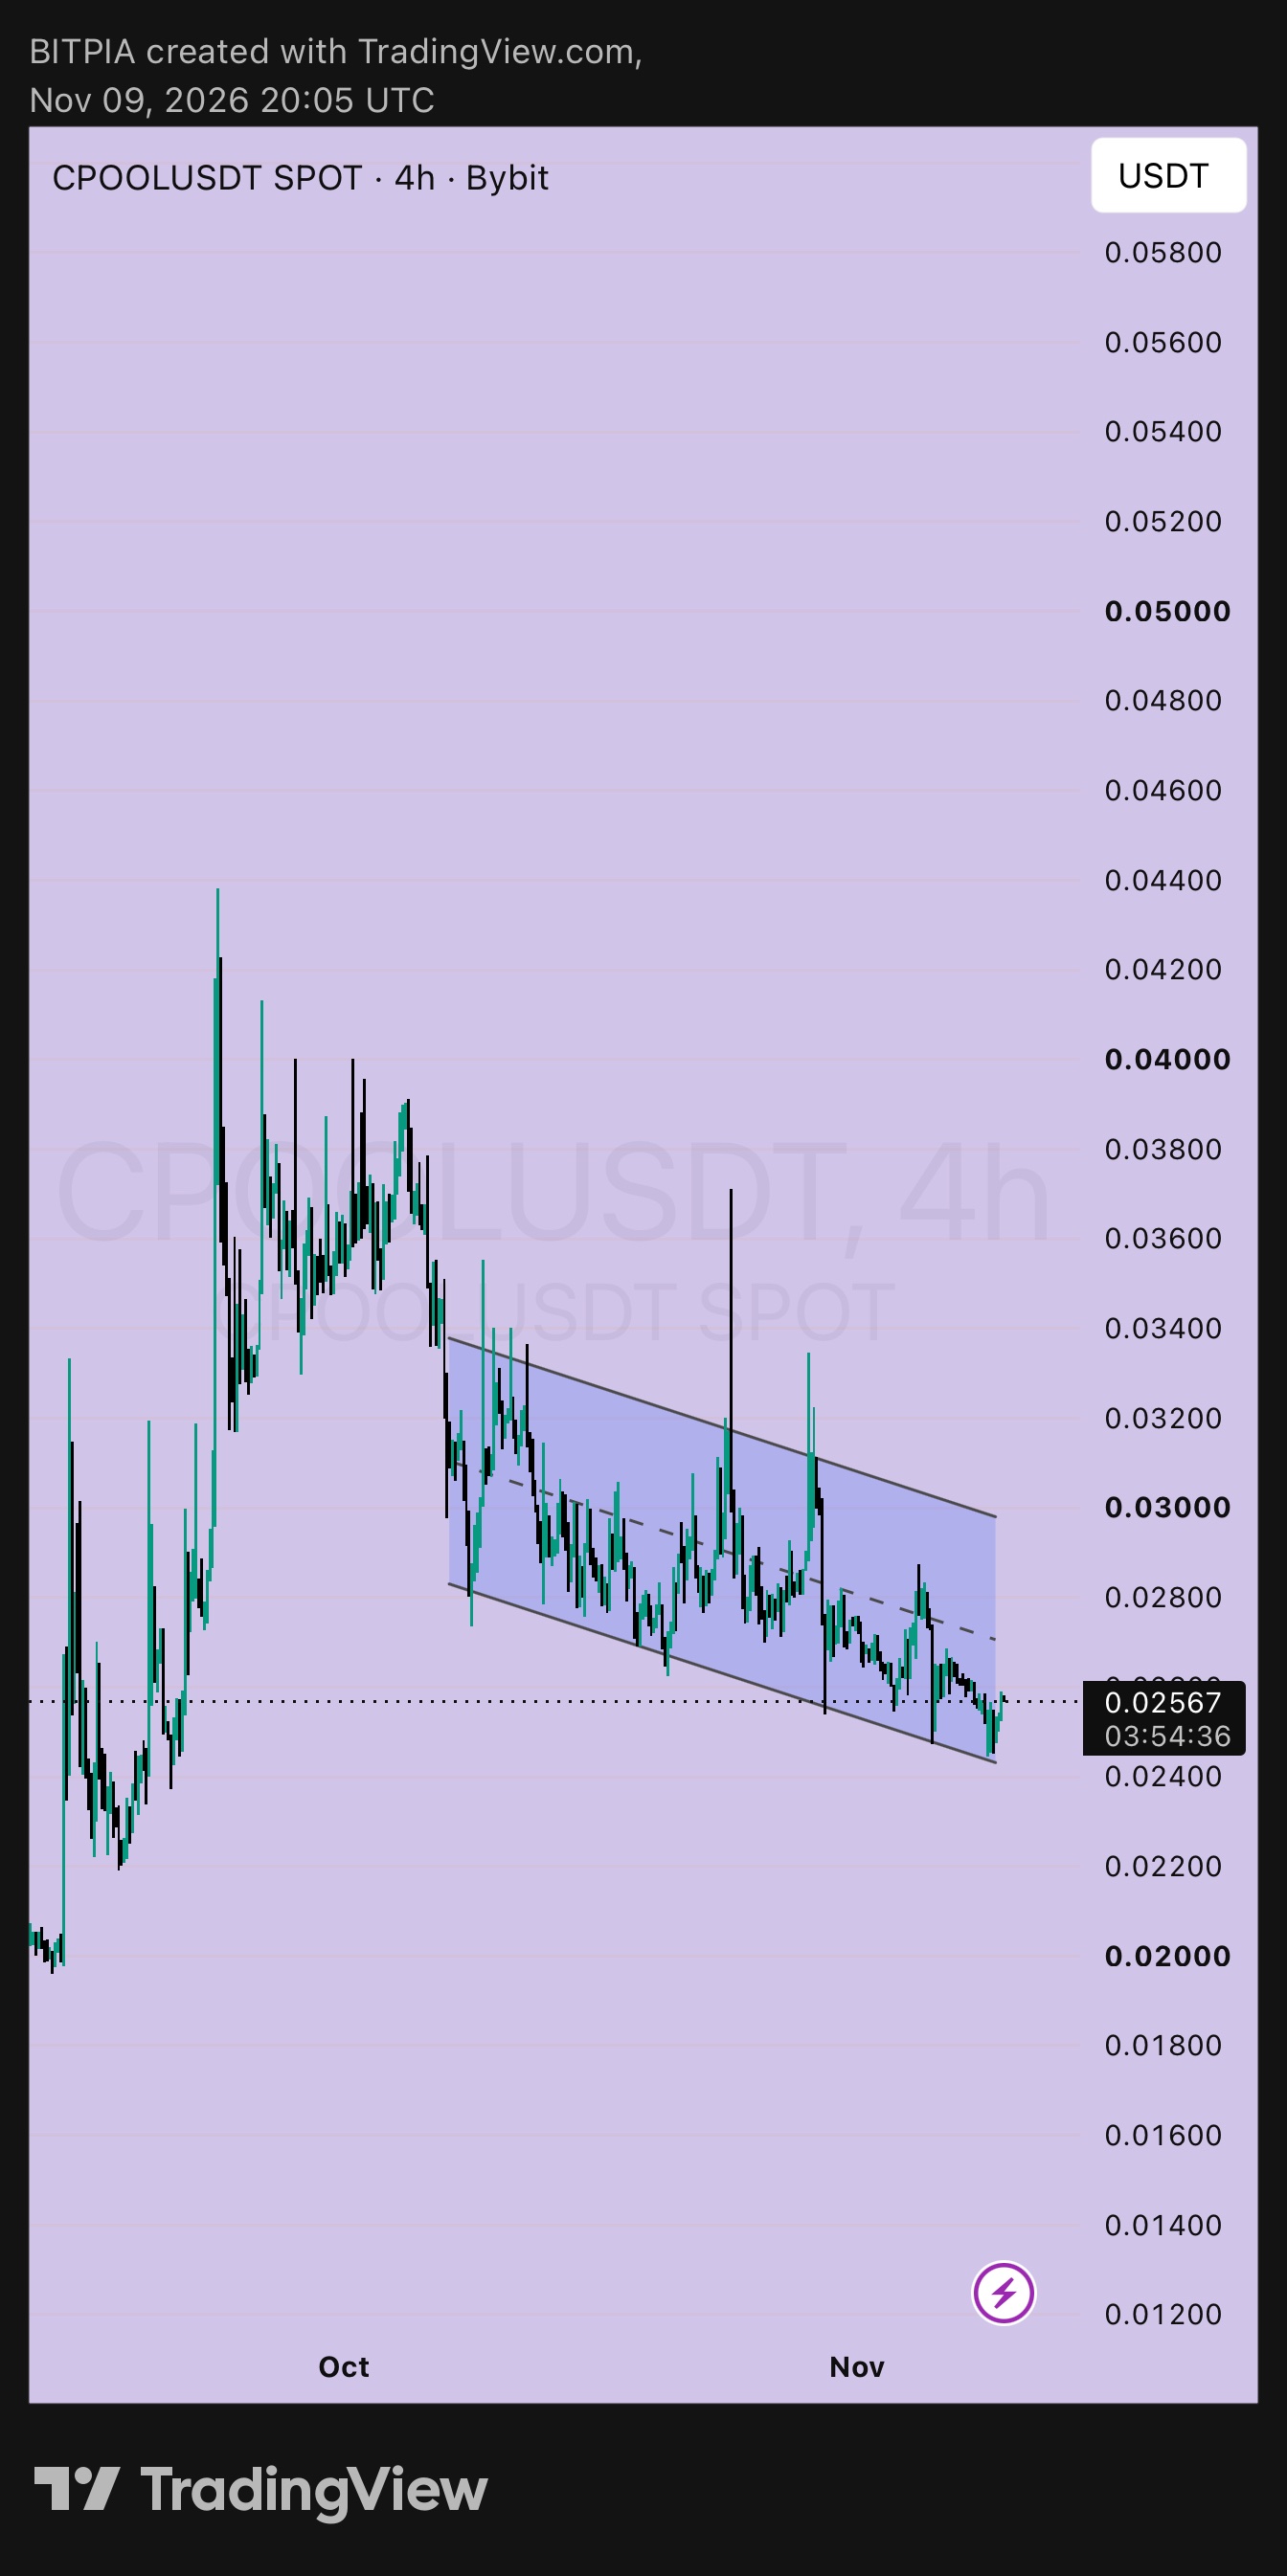
CPOOL 4h: three prices to remember 🔑 I used the latest of your two charts, with price at 0.02567. $CPOOLUSDT has been drifting down inside a falling channel since early October, and price is back near the lower line. If you remember only three prices on this chart, make it these. ➤ 0.0245: the floor ▸ The lower line and the recent lows, which buyers have defended several times ▸ Below it, the next area is the 0.0200 to 0.0220 base from September ➤ 0.0270: the middle ▸ The dashed centre line of the channel, and the first place I'd expect sellers ▸ It's also my first target ➤ 0.0300: the ceiling ▸ The upper line of the channel, with the older highs sitting above it at 0.0336 and 0.0370 ▸ A 4h close above it would be the first real sign that the channel is over ➤ Plan A: near the floor ▸ Entry: around 0.0250 ▸ Stop-loss: below 0.0235 ▸ Risk per unit: 0.0015 ▸ Target 1: 0.0270, +0.0020, about 1.3R ▸ Target 2: 0.0300, +0.0050, about 3.3R ▸ Target 3: 0.0340, +0.0090, about 6R ➤ Plan B: after the breakout ▸ Entry: around 0.0305, after a 4h close above 0.0300 ▸ Stop-loss: below 0.0280 ▸ Risk per unit: 0.0025 ▸ Targets: 0.0340 (about 1.4R) and 0.0370 (+0.0065, about 2.6R) ➤ Chase math At 0.02567 with the same stop, risk is 0.0022, and 0.0300 is about 2R away. Not terrible, but Plan A gives a better price if the floor is retested. ➤ What cancels it A 4h close under 0.0235 means the channel's lower line has failed. I'd step aside and watch the 0.0200 to 0.0220 base instead of guessing. Small size, and low leverage if you use perps. Not financial advice. Do your own research and only risk what you can afford to lose. #ByXIMPACT #WSOT2026
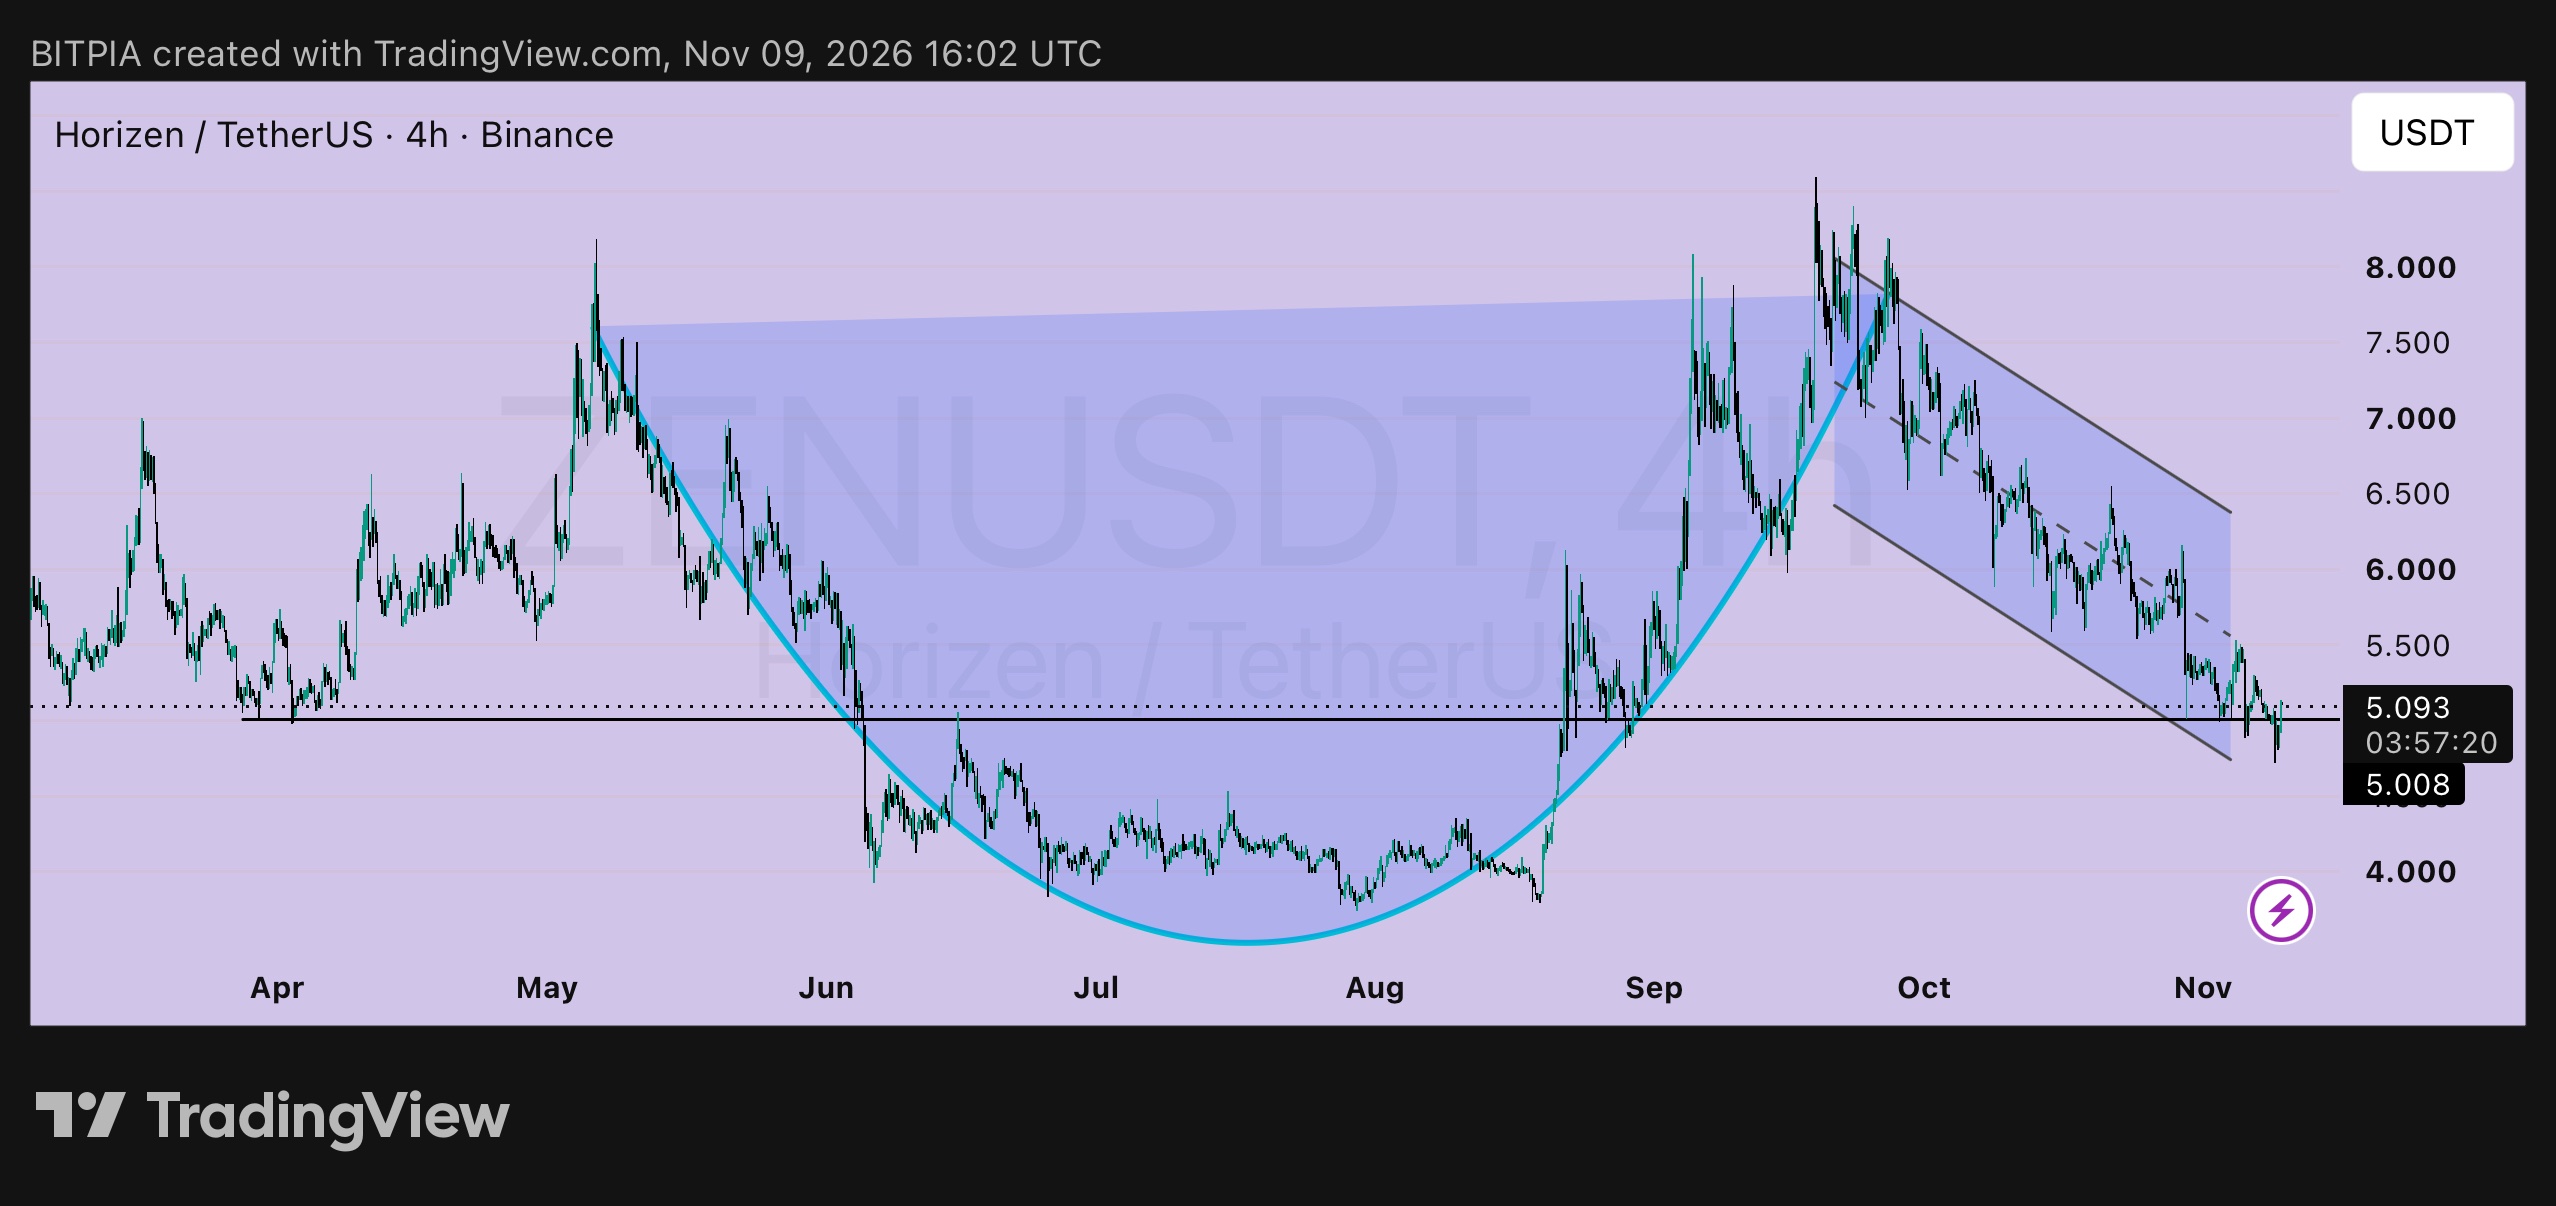
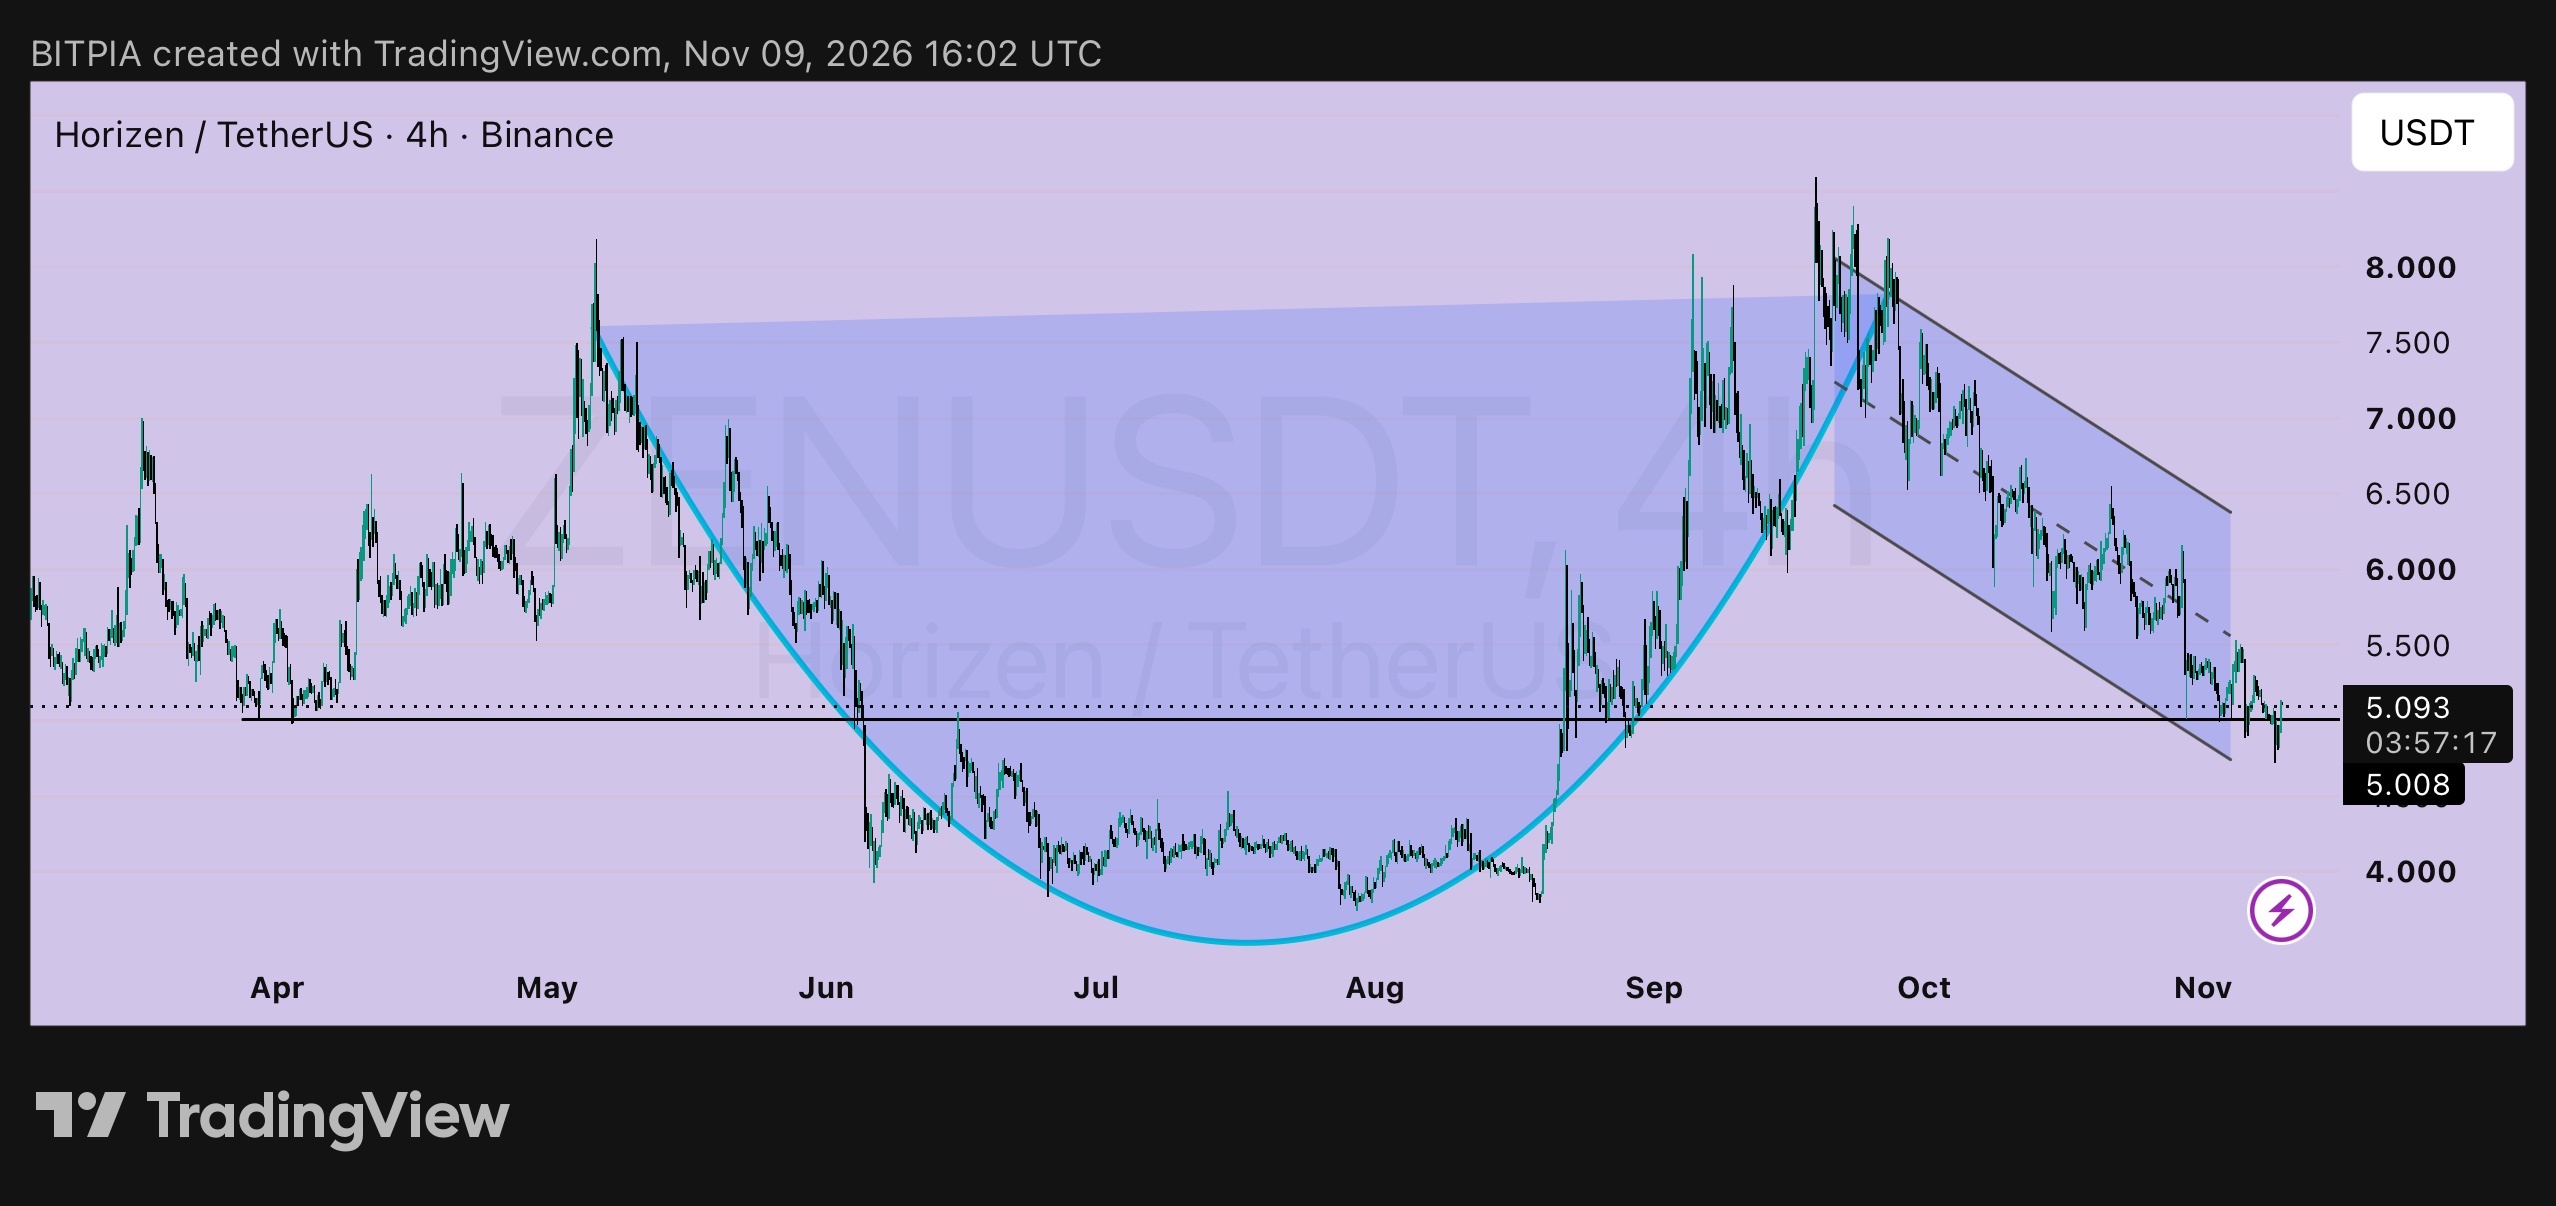
$ZEN: two timeframes, one story 🔭 I posted the daily $ZENUSDT chart on Nov 6 at 5.231 with a cup and handle plan. Now the 4h chart is at 5.093, so here's how the two views fit together. ➤ The daily view (the big picture) ▸ A rounded base from May to September, then a handle drifting down in a falling channel ▸ The cup rim sits near 7.8, and a daily close above the channel top near 6.4 would be the first sign of a breakout ▸ My early plan: entry 5.05, stop 4.65, risk 0.40 ➤ The 4h view (the details) ▸ Price is sitting on 5.008, the horizontal level that held in April and again in early September ▸ The dip this session reached about 4.97 and recovered, so buyers defended the level once more ▸ The channel's lower line sits just under, near 4.85 to 4.90 ➤ How they fit The handle looks like it's testing its lower end. If 5.008 holds and the 4h chart starts making higher lows, the early entry is working. If it doesn't, the 4.65 stop is there to keep the loss small. ➤ If you entered at 5.05 ▸ About +0.04, essentially flat ▸ Stop-loss stays at 4.65. I'm not tightening it just because price is near the level ▸ Targets: 6.40 (+1.35, about 3.4R) and 7.80 (+2.75, about 6.9R) ➤ If you're waiting for proof ▸ Trigger: a 4h close above 5.50 ▸ Entry: around 5.55 ▸ Stop-loss: below 5.00 ▸ Risk per unit: 0.55 ▸ Targets: 6.40 (about 1.5R) and 7.80 (+2.25, about 4.1R) ➤ What cancels it A 4h close under 4.85 would mean the 5.008 level and the channel's lower line have both failed, and I'd step aside. The daily plan fails below 4.65. Daily patterns take weeks, so small size, and low leverage if you use perps. Not financial advice. Do your own research and only risk what you can afford to lose. #ByXIMPACT #WSOT2026