ZENBIOA
6540Me gusta0Compartir en el chat238Aficionados95Seguir
Crypto trader | Charts, setups, & market psychology in one place..
Crypto trader | Charts, setups, & market psychology in one place..
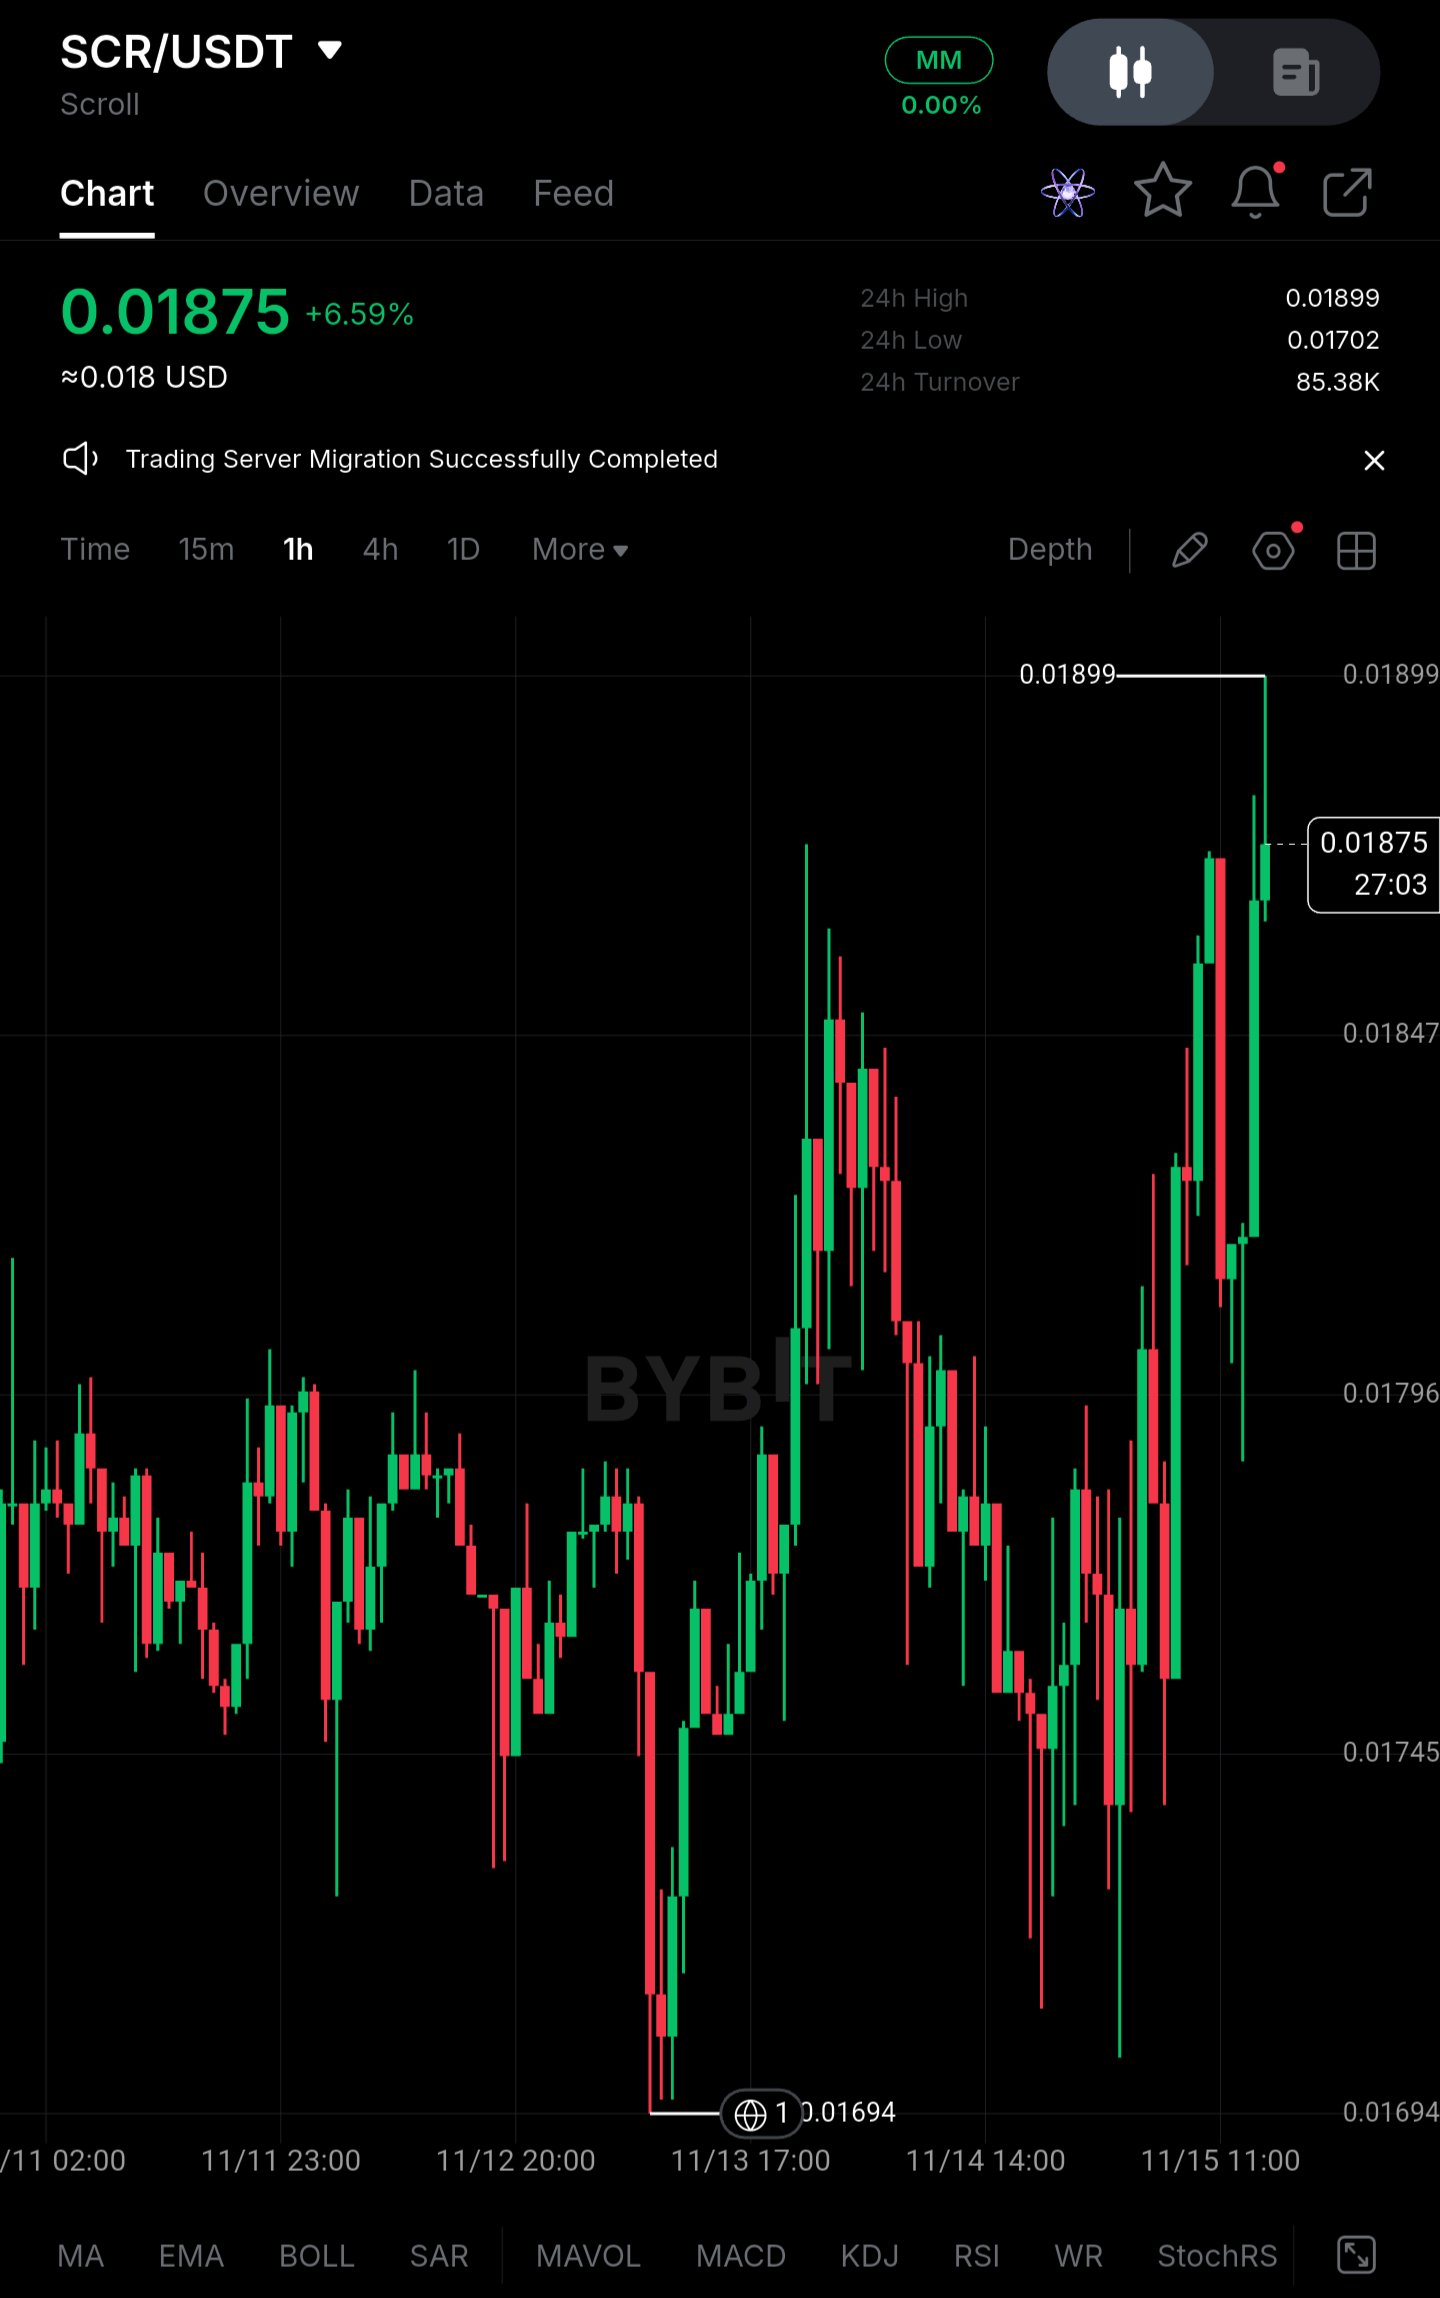
$SCRUSDT | Scroll holds near $0.0188 after a $0.01694 low, but this is not a recovery yet** Scroll (SCR) is trading around $0.01875 on the 1h chart, roughly 10% above the $0.01694 low printed on 11/13. I am not treating the current bounce as a recovery. The larger concern is the combination of institutional-scale selling pressure and a derivatives market that still leans heavily long. Whether spot demand can absorb supply, or another liquidity sweep is still ahead, remains unresolved. **Price Action** SCR is up 6.59% over the last 24 hours, within a 24h range of $0.01702 to $0.01899. The rebound off $0.01694 was sharp, but the structure since then is a series of higher lows with repeated rejection near $0.01899. The latest push into that level left a long upper wick, which signals supply at the highs. Immediate resistance sits at $0.01899, with $0.01847 as the first intraday level to defend. First support is $0.01796, followed by the $0.01745 to $0.01694 demand zone. A clean hourly close above $0.01899 would shift short-term structure, but it would not by itself reverse the broader trend, which remains under pressure. **Institutional / Large Capital Picture** SCR is a small-cap Layer 2 token, so there is no ETF channel to track. Large-wallet distribution, unlock-related supply and exchange inflows are the relevant signals. Demand has been inconsistent: the 11/12 to 11/13 sell-off printed heavy red candles with little immediate absorption, and the rebound was driven by thin, fast moves rather than steady accumulation. 24h turnover of roughly 85.38K is modest, which means a few large orders can move price in either direction. The move to $0.01694 had the character of a liquidity-driven flush rather than organic selling alone. **Liquidity & Range Conditions** Price has compressed into a relatively narrow band between $0.0180 and $0.0190 after the decline. A narrow range after a sharp drop is not evidence of accumulation. Without a clear rise in spot volume, it more often reflects pause and positioning before the next directional move. Stronger spot participation is still required to validate any bullish read. **Derivatives Positioning** Exact figures are not visible on the chart, so these are estimates based on price behavior and typical positioning for this asset: - Open interest: elevated relative to spot turnover, likely in the low-to-mid single-digit millions USD - Funding rate: positive, around +0.01% per 8h, meaning longs are paying shorts - Long/short ratio: roughly 60% of accounts long Positive funding combined with a long-tilted ratio creates vulnerability. If $0.01796 breaks, stop clusters and leveraged longs would likely unwind quickly, extending the move toward the prior low. **Key Figures** - Current price: ~$0.01875 - Immediate resistance: $0.01899 - Intermediate level: $0.01847 - Support zone: $0.01796 to $0.01745 - Recent low: $0.01694 - 24h turnover: ~85.38K - Funding: positive (~+0.01%, estimated) - Long share: ~60% (estimated) **Confirmation Levels** - Bullish: a sustained hourly close above $0.01899 with rising spot volume opens a move toward $0.0195 to $0.0200. - Bearish: a break below $0.01796 exposes $0.01745, and a loss of that level reopens a retest of $0.01694 with a risk of a lower low and fresh long liquidations. **Closing** SCR has stabilized, but stabilization is not the same as recovery. Selling pressure from larger holders and crowded long positioning are still competing with the rebound attempt. The decisive signal is whether spot buyers return while leverage stays controlled, or whether another support breakdown triggers a new wave of long liquidations. #ByXIMPACT
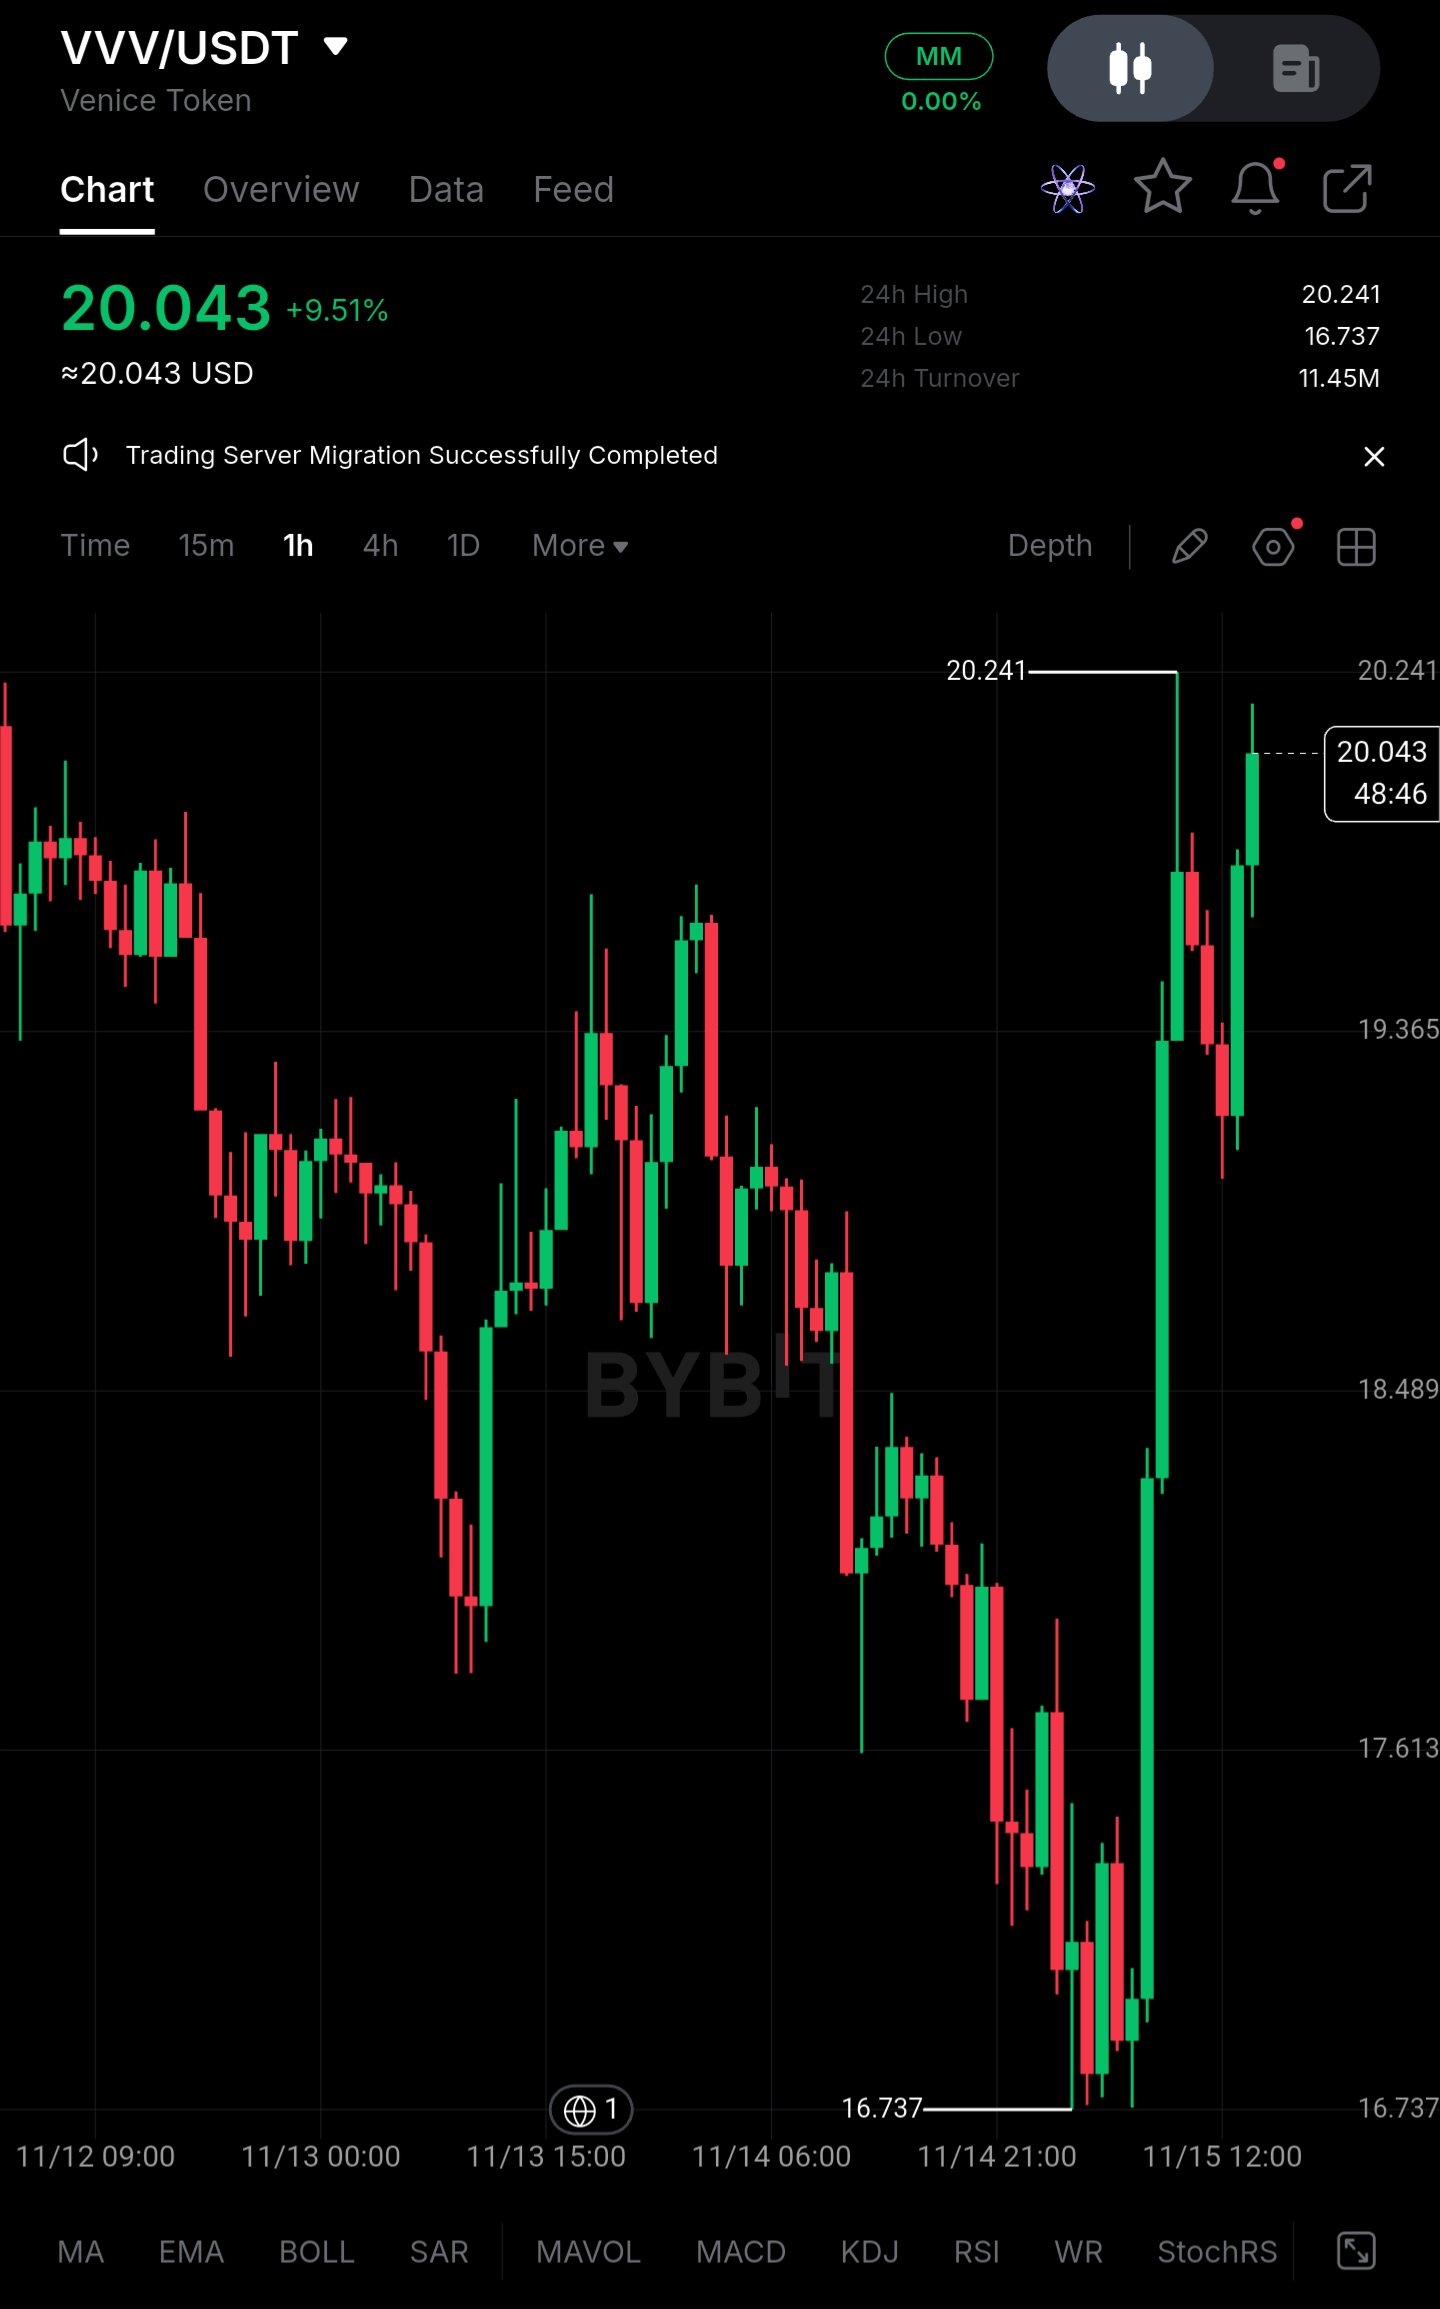
$VVVUSDT – Higher Timeframe Overview | Long on Pullback** Pair: $VVVUSDT (1H chart, Bybit) Looking at the 1H chart, VVV spent most of the last few days drifting lower and chopping around, with a clear sequence of lower highs from 11/13 into 11/14. Price bottomed at 16.737, then reversed with one of the strongest candles on the chart and pushed all the way to 20.241. It's now trading around 20.04, up roughly 9.5% on the day. I didn't catch the bounce from the lows, so I'd rather wait for a proper pullback than chase this. **Current Outlook and Key Levels** **Buying Zone: 18.489 – 19.365** This is the area where the vertical rally started to accelerate, so it's the first place I'd expect buyers to defend if price cools off. It's also a sensible retracement area for a move this extended. I'm looking for the pullback to slow down, wicks to get absorbed, and a 1H candle to close back up from the zone. A touch alone isn't enough. **Resistance Zone: 20.04 – 20.241** The 24h high at 20.241 is the obvious overhead level, and price is already pressing into it. Sellers who bought the way down may use this as a chance to exit. A clean break and sustained consolidation above 20.241 would suggest the rally is more than a one-off squeeze and that the structure is shifting higher. **Trading Setup** **Position:** Long on pullback **Entry Zone:** 18.489 – 19.365 (only after a buyer reaction, not as a blind limit) **Stop-Loss:** Below 17.613 **Invalidation:** A 1H close below 17.613 would mean the pullback is no longer a healthy retracement. It would put price back into the lower part of the previous range, and the reversal would be suspect. **Take-Profits:** - TP1: 20.241 (24h high) - TP2: No verified level above 20.241 yet. If price breaks and holds above it, I'd trail the stop and reassess instead of forcing a target. **Why This Setup Makes Sense** Buying near 20.0 means entering right under the local high after an impulsive move, with a stop that would have to sit far away. Even a small retracement would hurt the risk-to-reward. A pullback into 18.489 – 19.365 gives a more structured entry, with the stop below 17.613 and the first target at the recent high, which is a much better ratio. The reaction matters as much as the level. If buyers step in and hold, the zone is doing its job. If price slices through without a bounce, the setup isn't there and I stay out. Patience costs very little here, while chasing after a +9.5% day often means buying someone else's exit. **Risk Management** Stick to the plan. Don't move or remove the stop-loss, and size the position so a stop-out is an acceptable loss. A bullish reversal can still fail, and no setup guarantees a profit. This is not financial advice. #ByXIMPACT
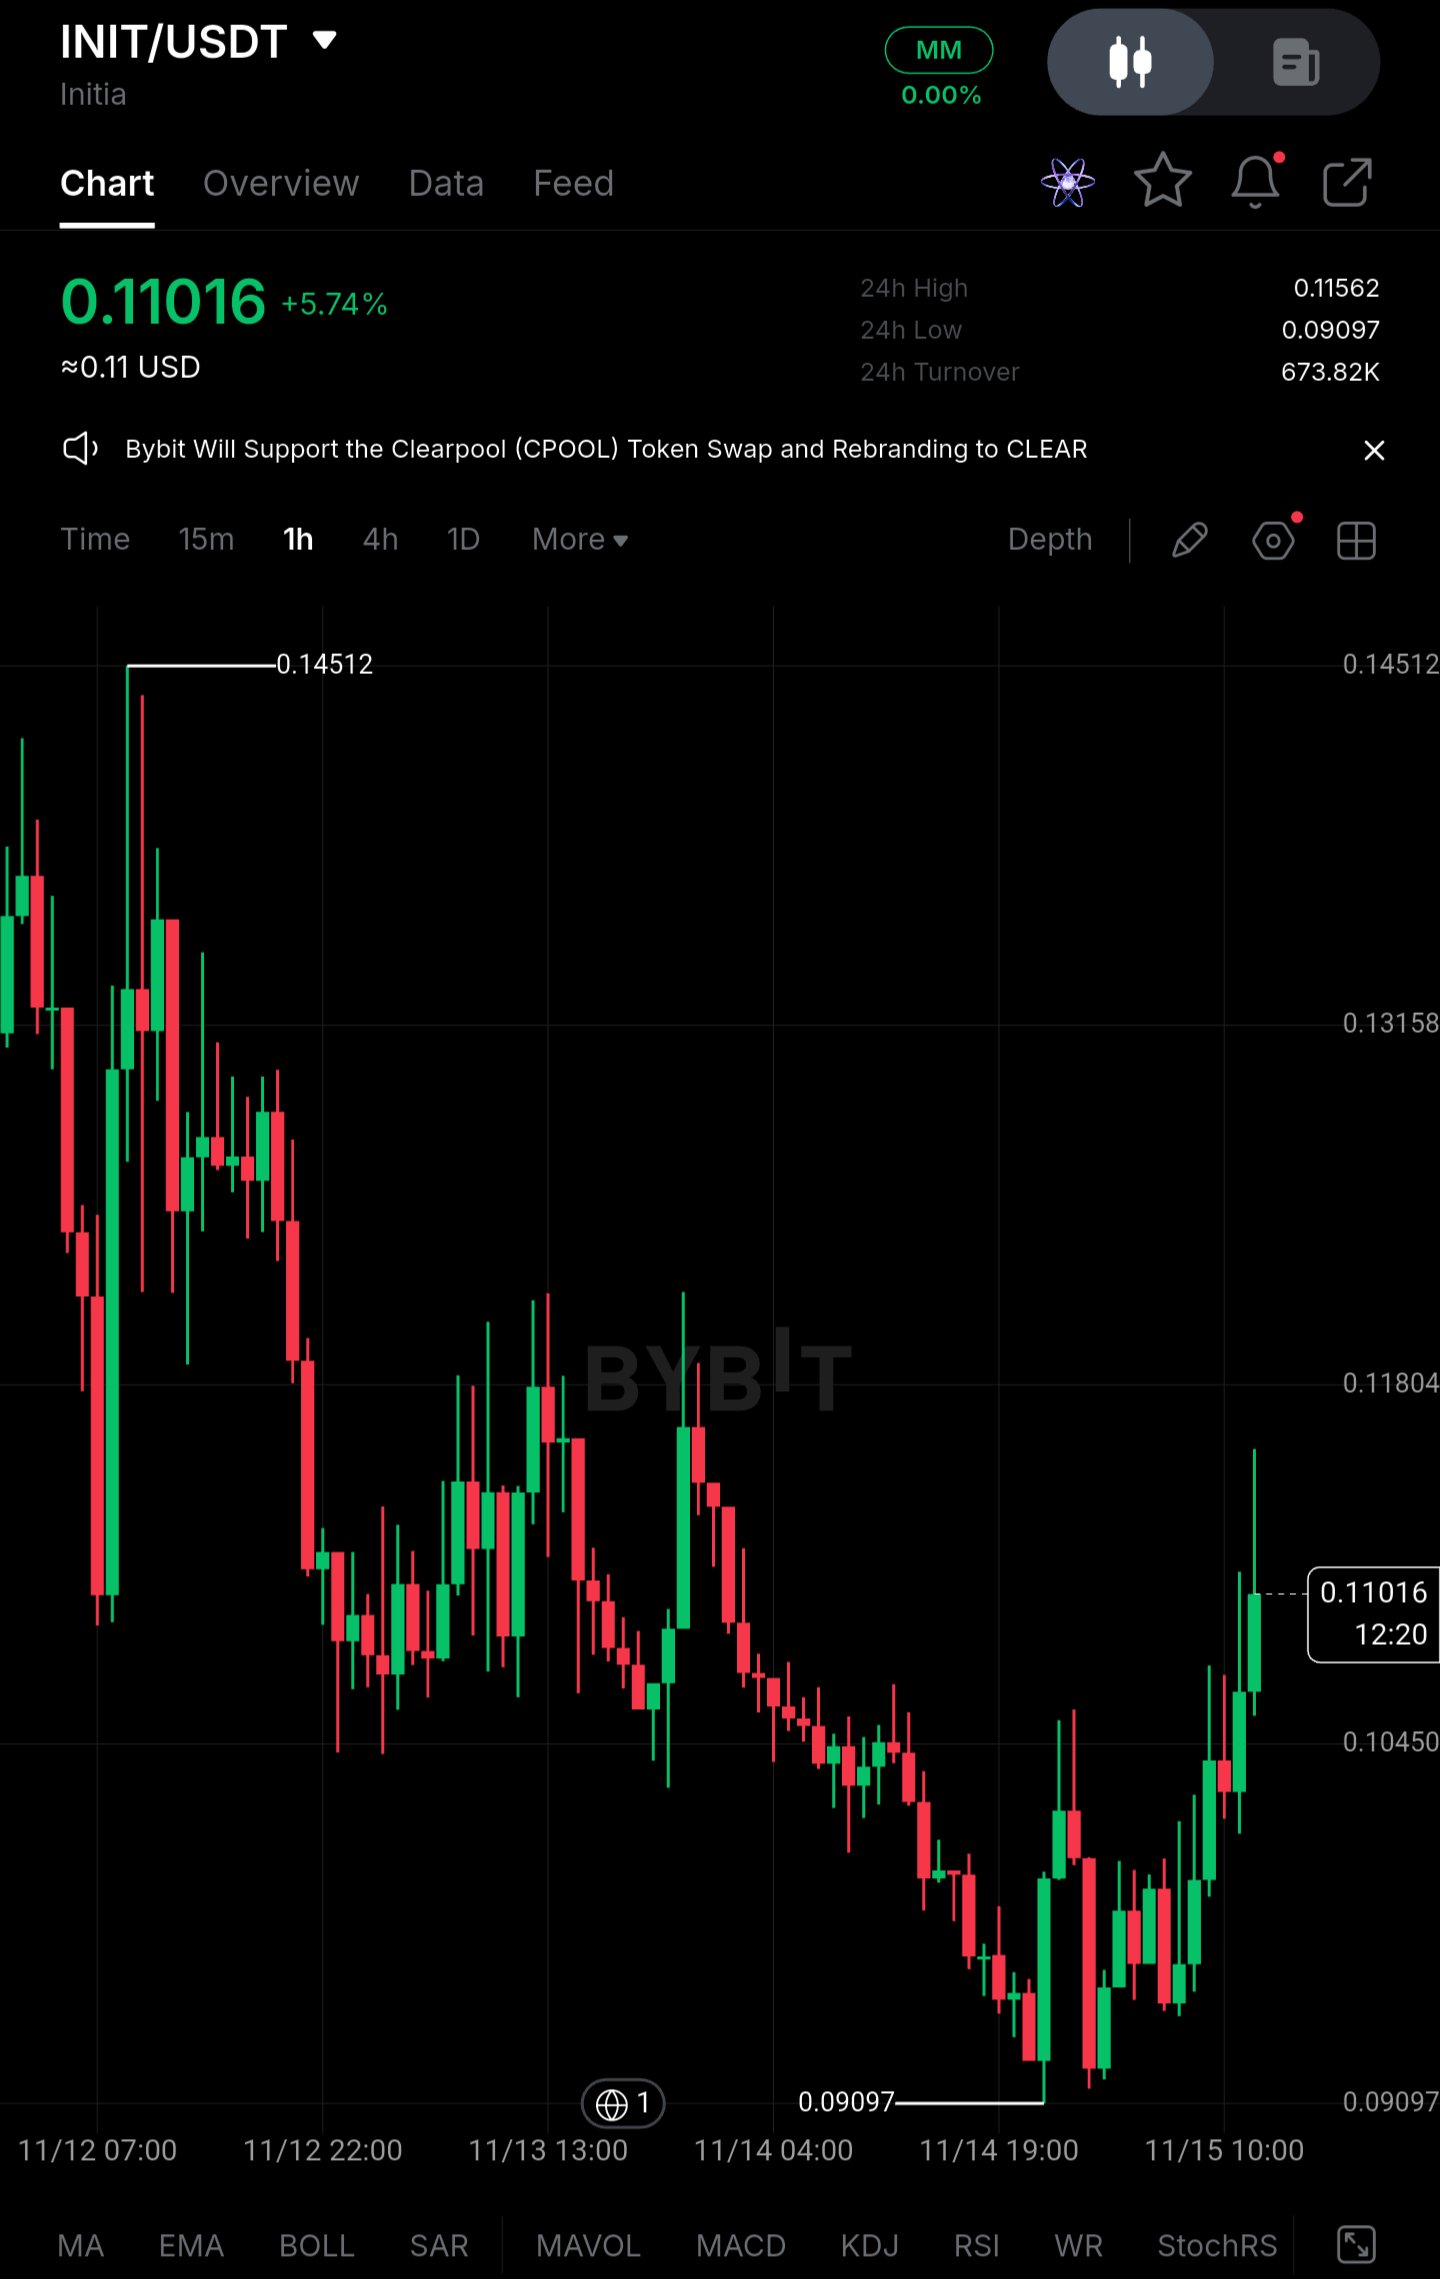
$INITUSDT – Higher Timeframe Overview | Long on Pullback** Pair: $INITUSDT INIT has spent the last few sessions in a steady downtrend, sliding from the 0.14512 high to a low of 0.09097. I didn't have any interest in catching that fall. Price has since bounced sharply, now around 0.11016 (+5.74% on the day), with the last few 1h candles pushing up and a long wick printing near the top of the move. One strong green run after a long decline doesn't tell me the trend has changed. It tells me buyers showed up at the lows, and now I want to see whether they defend higher prices. **Current Outlook and Key Levels** **Buying Zone: around 0.10450** This level sits roughly midway between the 0.09097 low and the bounce high, and it's where price consolidated before the recent push. A pullback into this area would be a retest of the breakout base. I'd want to see the selling slow down, lower wicks form, and buyers close candles back above the level. If price just slices through it on heavy red candles, there's nothing to buy. **Resistance Zone: 0.11562 – 0.11804** 0.11562 is the 24h high, and 0.11804 is the next level above it, where earlier price action found sellers on the way down. Sellers have a reason to respond here. A clean break and sustained consolidation above 0.11804, with candles holding above it instead of wicking back under, would suggest the downtrend is losing control and open the way toward the higher levels on the chart. **Trading Setup** **Position:** Long on pullback **Entry Zone:** around 0.10450 (only on buyer confirmation, not by default) **Stop-Loss:** below 0.09097 **Invalidation:** A break below the 0.09097 low means the bounce has failed and the downtrend is resuming. At that point the setup no longer has structure behind it. **Take-Profits:** - TP1: 0.11804 - TP2: 0.13158 - TP3: 0.14512 **Why This Setup Makes Sense** After a bounce this sharp, buying near 0.11 puts you right under the 24h high, with resistance close overhead and a long way to the stop. That's a poor risk profile, and it's how people end up buying the top of a relief move. Waiting for a retest of 0.10450 gives a more defined entry. If buyers defend it, the structure of higher lows starts to build. If they don't, you've lost nothing and the plan stays unchanged. The targets follow the levels visible on the chart. TP1 is the first real resistance, TP2 and TP3 are the next levels on the way back toward the previous high. The stop below 0.09097 is wide, which keeps the trade honest about what would actually invalidate it, but it also means TP1 only offers roughly 1:1 from the entry. The setup gets better with TP2 and TP3, so partial profits at TP1 make sense. **Risk Management** Stick to the plan and don't move the stop because price feels like it will turn. Because the stop is wide, position size should be smaller than usual. A recovery bounce can fail just as easily as it can continue, and no setup guarantees a profit. *Levels are taken from the 1h Bybit chart and are not financial advice.* #ByXIMPACT
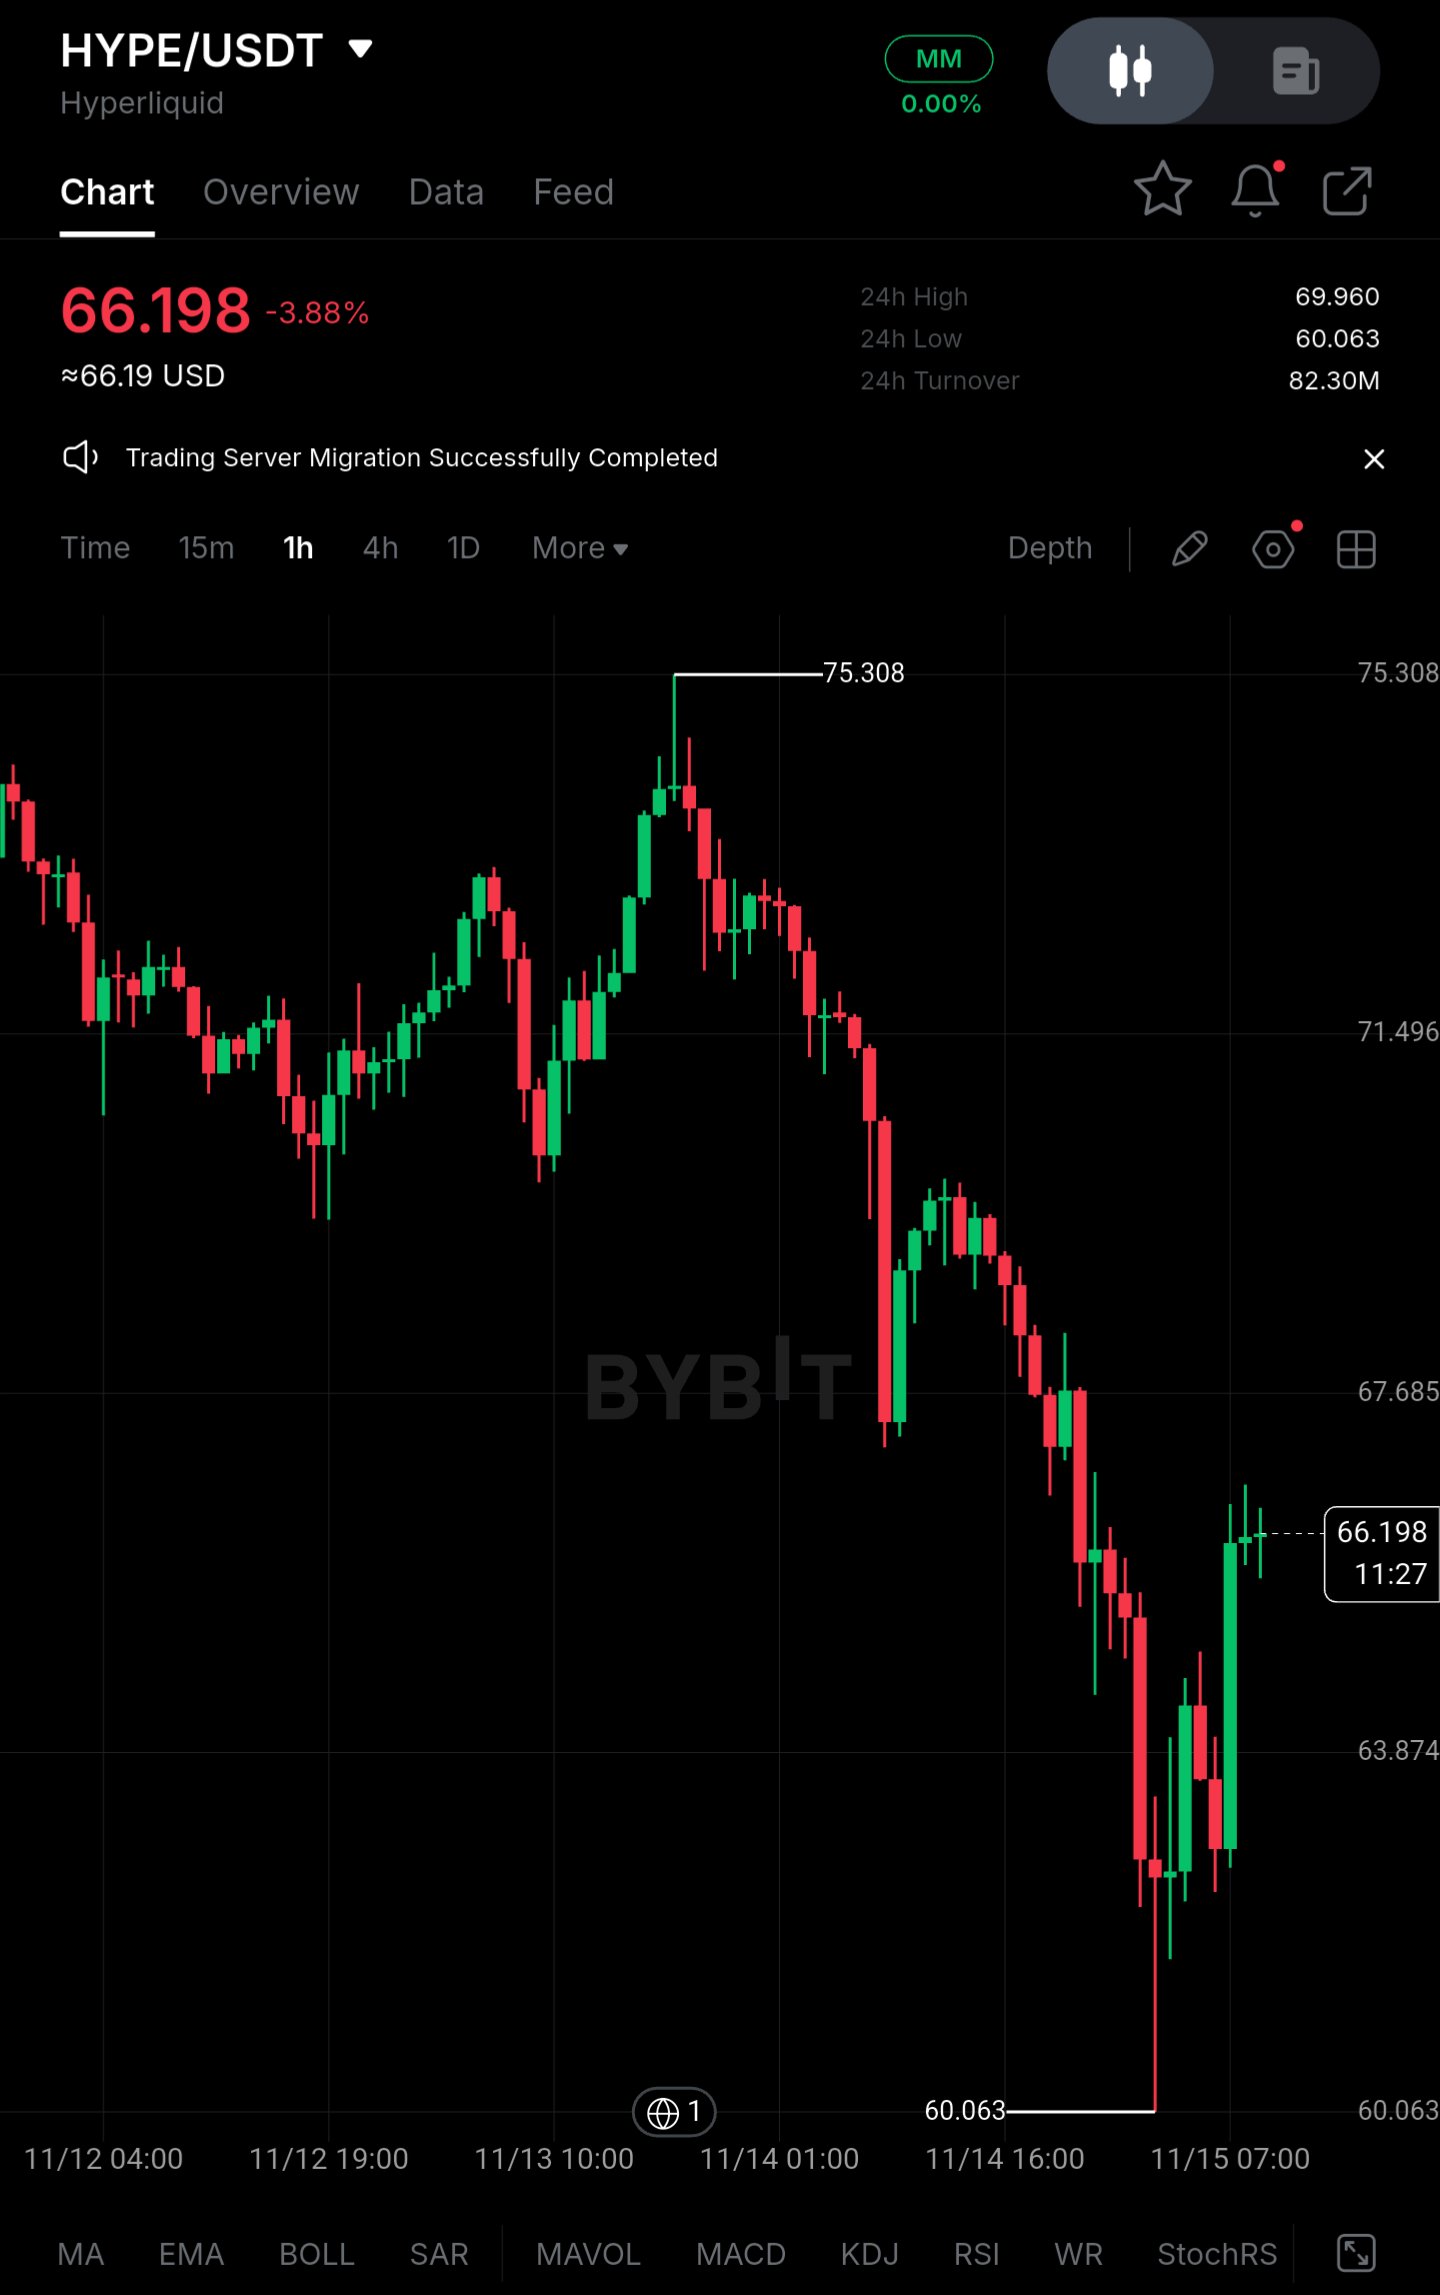
$HYPEUSDT holds near $66 after a sweep to $60.06, but I'm not treating this as a recovery yet** HYPE/USDT is trading around $66.20 (-3.88% on the day) after wicking to $60.06, its lowest print in the window. The hourly structure is a bounce inside a downtrend, not a trend change. The larger concern is large-wallet distribution combined with derivatives positioning that is still tilted long. **Price Action** - Current price: ~$66.20, about 10% above the $60.06 low and 12% below the $75.31 swing high. - Drawdown: about -20% from high to low over roughly three sessions, with a market cap of about $22B at current levels (approximate). - Immediate resistance: $67.70–$69.96. The 24h high at $69.96 is the first real test. - First support: $63.87, then the $60.06 sweep low. - The bounce has produced one strong hourly green candle off the low, followed by small-bodied candles. That is relief, not a confirmed reversal. The sequence of lower highs from $75.31 remains intact. **Large Capital Picture** - HYPE lacks the ETF flow data that BTC and ETH have, so the read comes from exchange flows and large-wallet behavior. The impulsive sell-off candles, followed by a long lower wick, are consistent with forced selling plus opportunistic dip buying. - Demand looks inconsistent. Green candles on the bounce are not matched by sustained follow-through volume. 24h turnover of ~$82.3M is modest relative to the size of the drop. - The exchange-side notice about trading server migration is a reminder that infrastructure and liquidity events can amplify moves in either direction. **Liquidity & Range Conditions** - Price has compressed into a narrow range just under $67 after the sharp decline. A narrow range after a decline is not evidence of accumulation. It more often reflects sellers pausing while liquidity rebuilds. - Stronger spot participation is still required before this range can be read constructively. **Derivatives Positioning** - Open interest: elevated relative to spot volume, estimated at the upper end of its recent range (approximate; verify on a derivatives dashboard). - Funding: estimated mildly positive, meaning longs are still paying shorts. - Long/short: roughly 55–60% of accounts long (estimate). - This positioning is the vulnerability. If $63.87 fails, crowded longs that survived the first sweep become fuel for a second leg lower. **Key Figures** - Current price: ~$66.20 - Immediate resistance: $67.70–$69.96 - Support: $63.87 - Recent low: $60.06 - 24h range: $60.06–$69.96 - 24h turnover: ~$82.3M - OI / funding: elevated / mildly positive (estimated) - Long share: ~55–60% (estimated) **Confirmation Levels** - **Bullish:** A hourly close and hold above $69.96 would be the first sign of strength. It would open $71.50, with $75.31 as the larger target. - **Bearish:** A close below $63.87 exposes a retest of $60.06. A break below that opens a deeper liquidity pocket and likely triggers a fresh round of long liquidations. **Closing** The market is stable for now, but stability is not demand. Large-wallet selling and crowded long positioning are competing with the recovery attempt. The decisive signal is whether spot buyers return while leverage stays controlled, or whether another support breakdown triggers fresh long liquidations. Until the first happens, rallies into resistance deserve skepticism. *Not financial advice. Derivatives figures are estimates, not live data.* #ByXIMPACT
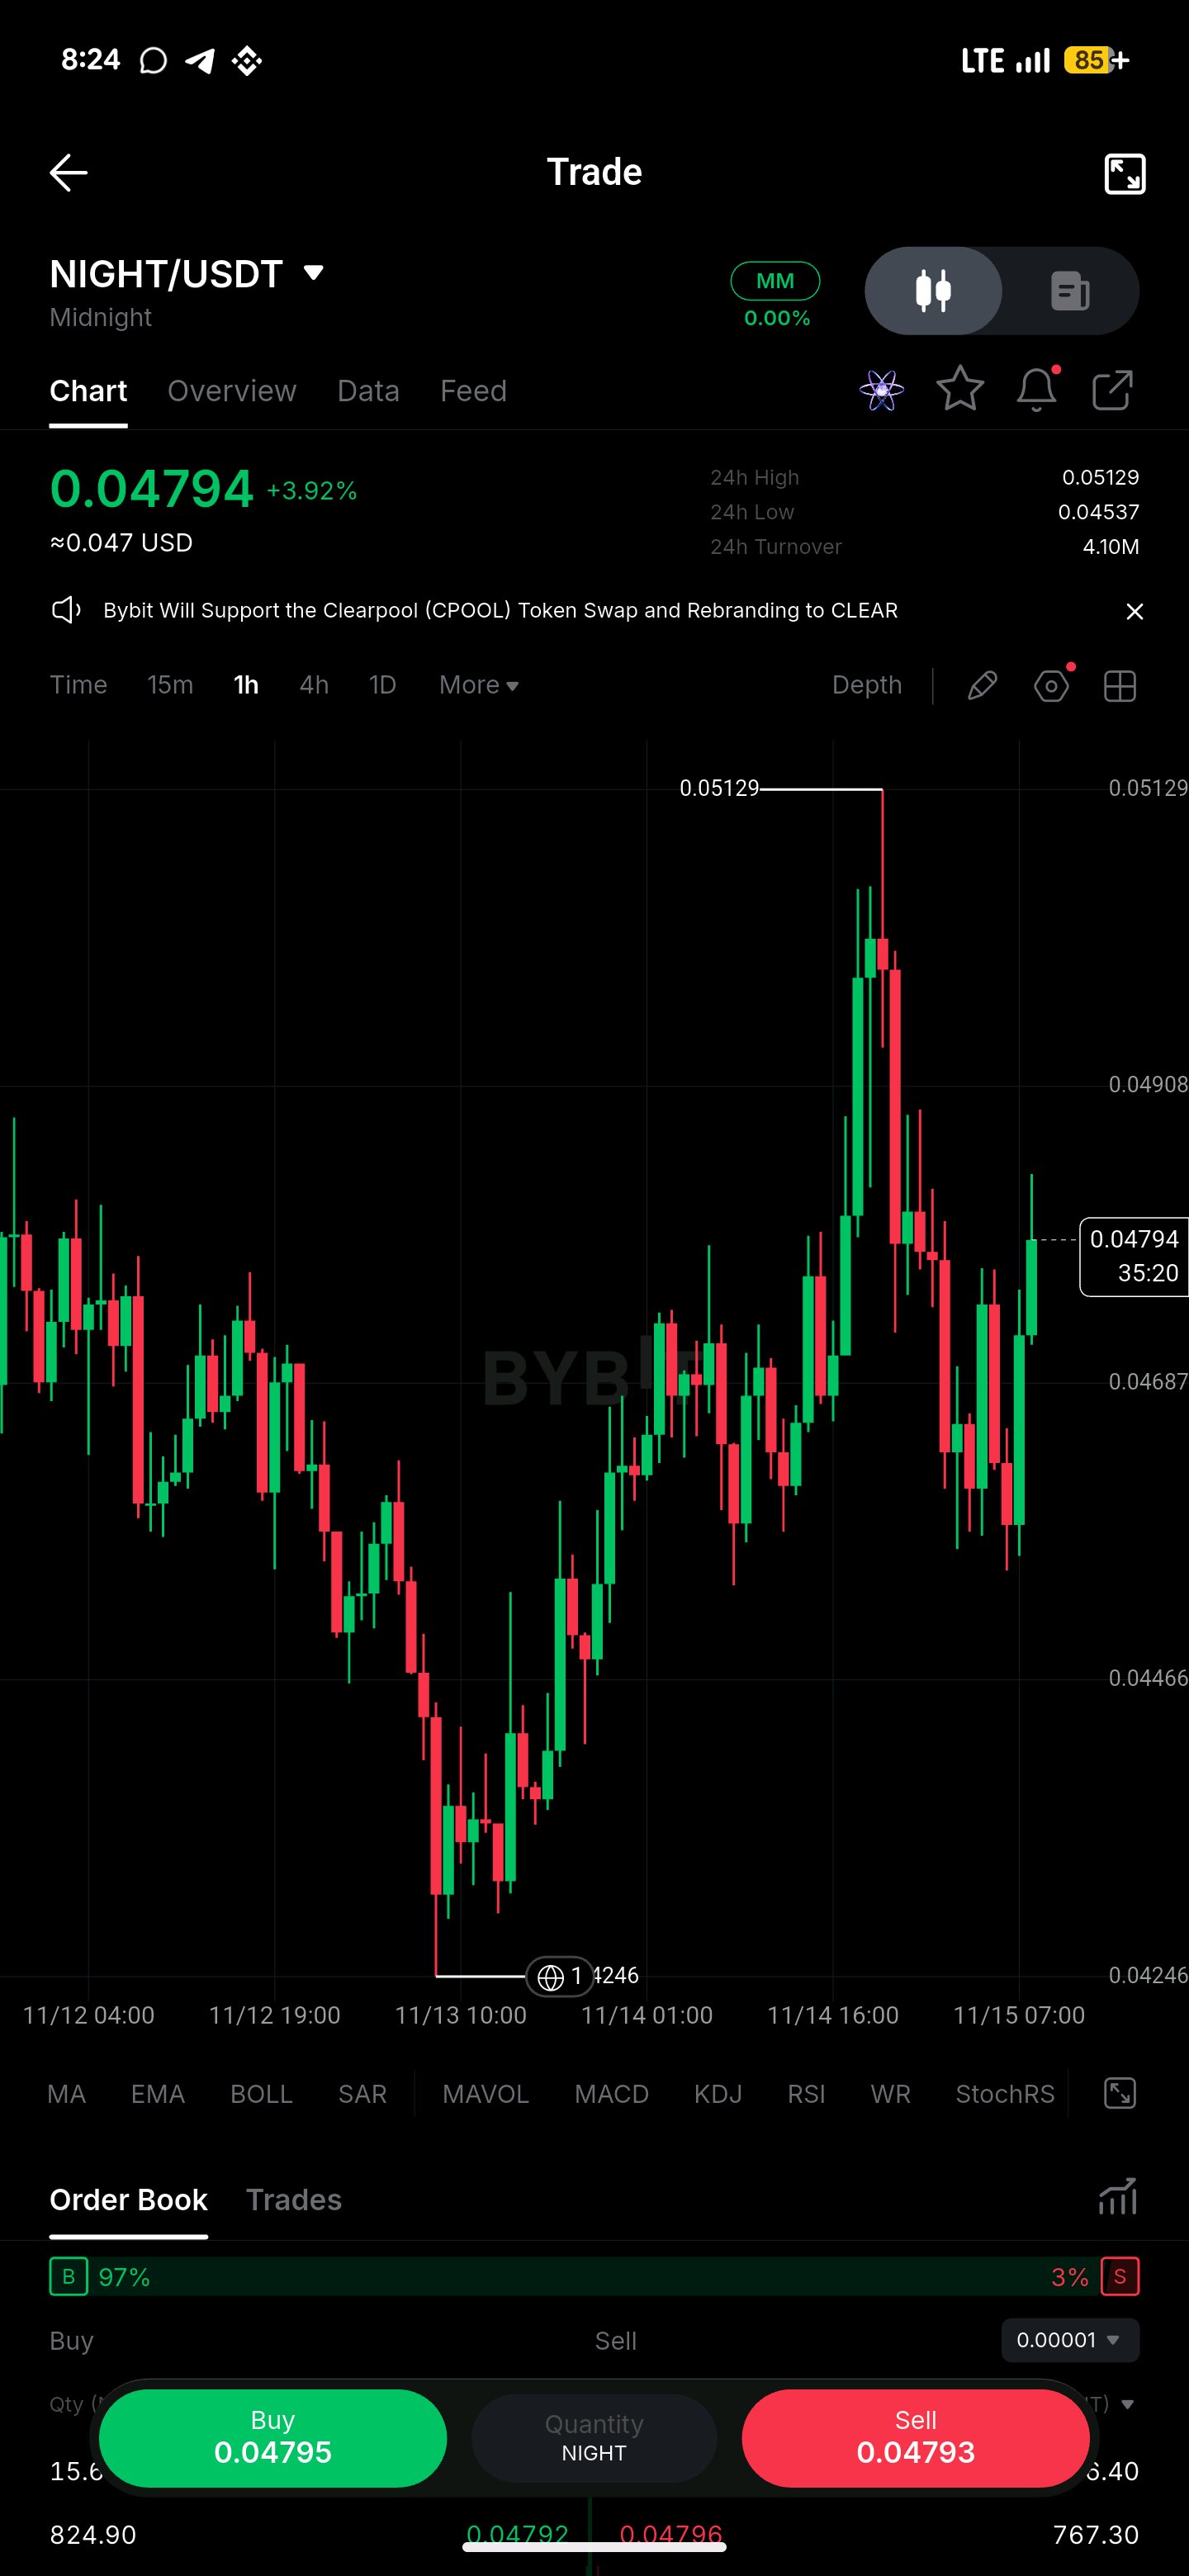
$NIGHTUSDT – Higher Timeframe Overview | Long on Pullback** Pair: $NIGHTUSDT (1H chart) **Market Observation** NIGHT has been choppy over the last few sessions. It sold off to the 0.04246 low on Nov 13, bounced, then pushed up to 0.05129 on Nov 14 before sellers stepped in. That rejection was quick, and price gave back most of the move before buyers showed up again. It's now trading around 0.04794, recovering, but still below the highs. I didn't get a clean entry on the push toward 0.05129, and I'm not interested in chasing a bounce after a rejection like that. I'd rather let price come back to me. **Current Outlook and Key Levels** *Buying Zone: 0.04537 – 0.04687* This area contains the recent 24h low at 0.04537 and the 0.04687 level that price has traded around repeatedly. It's where buyers defended the last pullback. I'd want to see a clear reaction here before treating it as a real entry: a wick rejection, a strong 1H close back above the zone, or a visible slowdown in selling. *Resistance Zone: 0.04908 – 0.05129* The 0.05129 high is the obvious ceiling, and 0.04908 is the first area where the last rally stalled. Sellers have already shown up in this range once. A breakout and sustained consolidation above 0.05129 would mean the market has accepted higher prices. A quick wick above that fails to hold would not. **Trading Setup** **Position:** Long on pullback **Entry Zone:** 0.04537 – 0.04687 (potential zone, not a confirmed entry until buyers react) **Stop-Loss:** Below 0.04466 **Invalidation:** A 1H close below 0.04466 means the pullback zone has failed and the structure is shifting back toward the 0.04246 low. At that point the long idea is off. **Take-Profits:** - TP1: 0.04908 - TP2: 0.05129 - TP3: Not defined. No verified level sits above 0.05129 on this chart, so I'd reassess if price breaks and holds there. **Why This Setup Makes Sense** The last rally to 0.05129 was impulsive and got rejected almost immediately. Entering near the highs would mean buying right where sellers have already acted, with a distant stop and little room. A pullback into 0.04537–0.04687 gives a tighter stop below 0.04466, and targets at levels the market has already respected. The zone only matters if buyers defend it. If price slices through without a reaction, there's no reason to be long. Waiting for confirmation means a smaller, cleaner risk instead of an emotional entry. TP1 at 0.04908 is the first realistic test of whether the recovery has strength, and TP2 retests the high. **Risk Management** Stick to the plan. Don't move or ignore the stop-loss, and size the position so a stop-out is an acceptable loss. A bullish structure can fail, and no setup guarantees a profit. This is not financial advice. *Note: Entry, stop and targets are derived from the levels visible on the chart. Adjust them if you have your own levels.* #ByXIMPACT
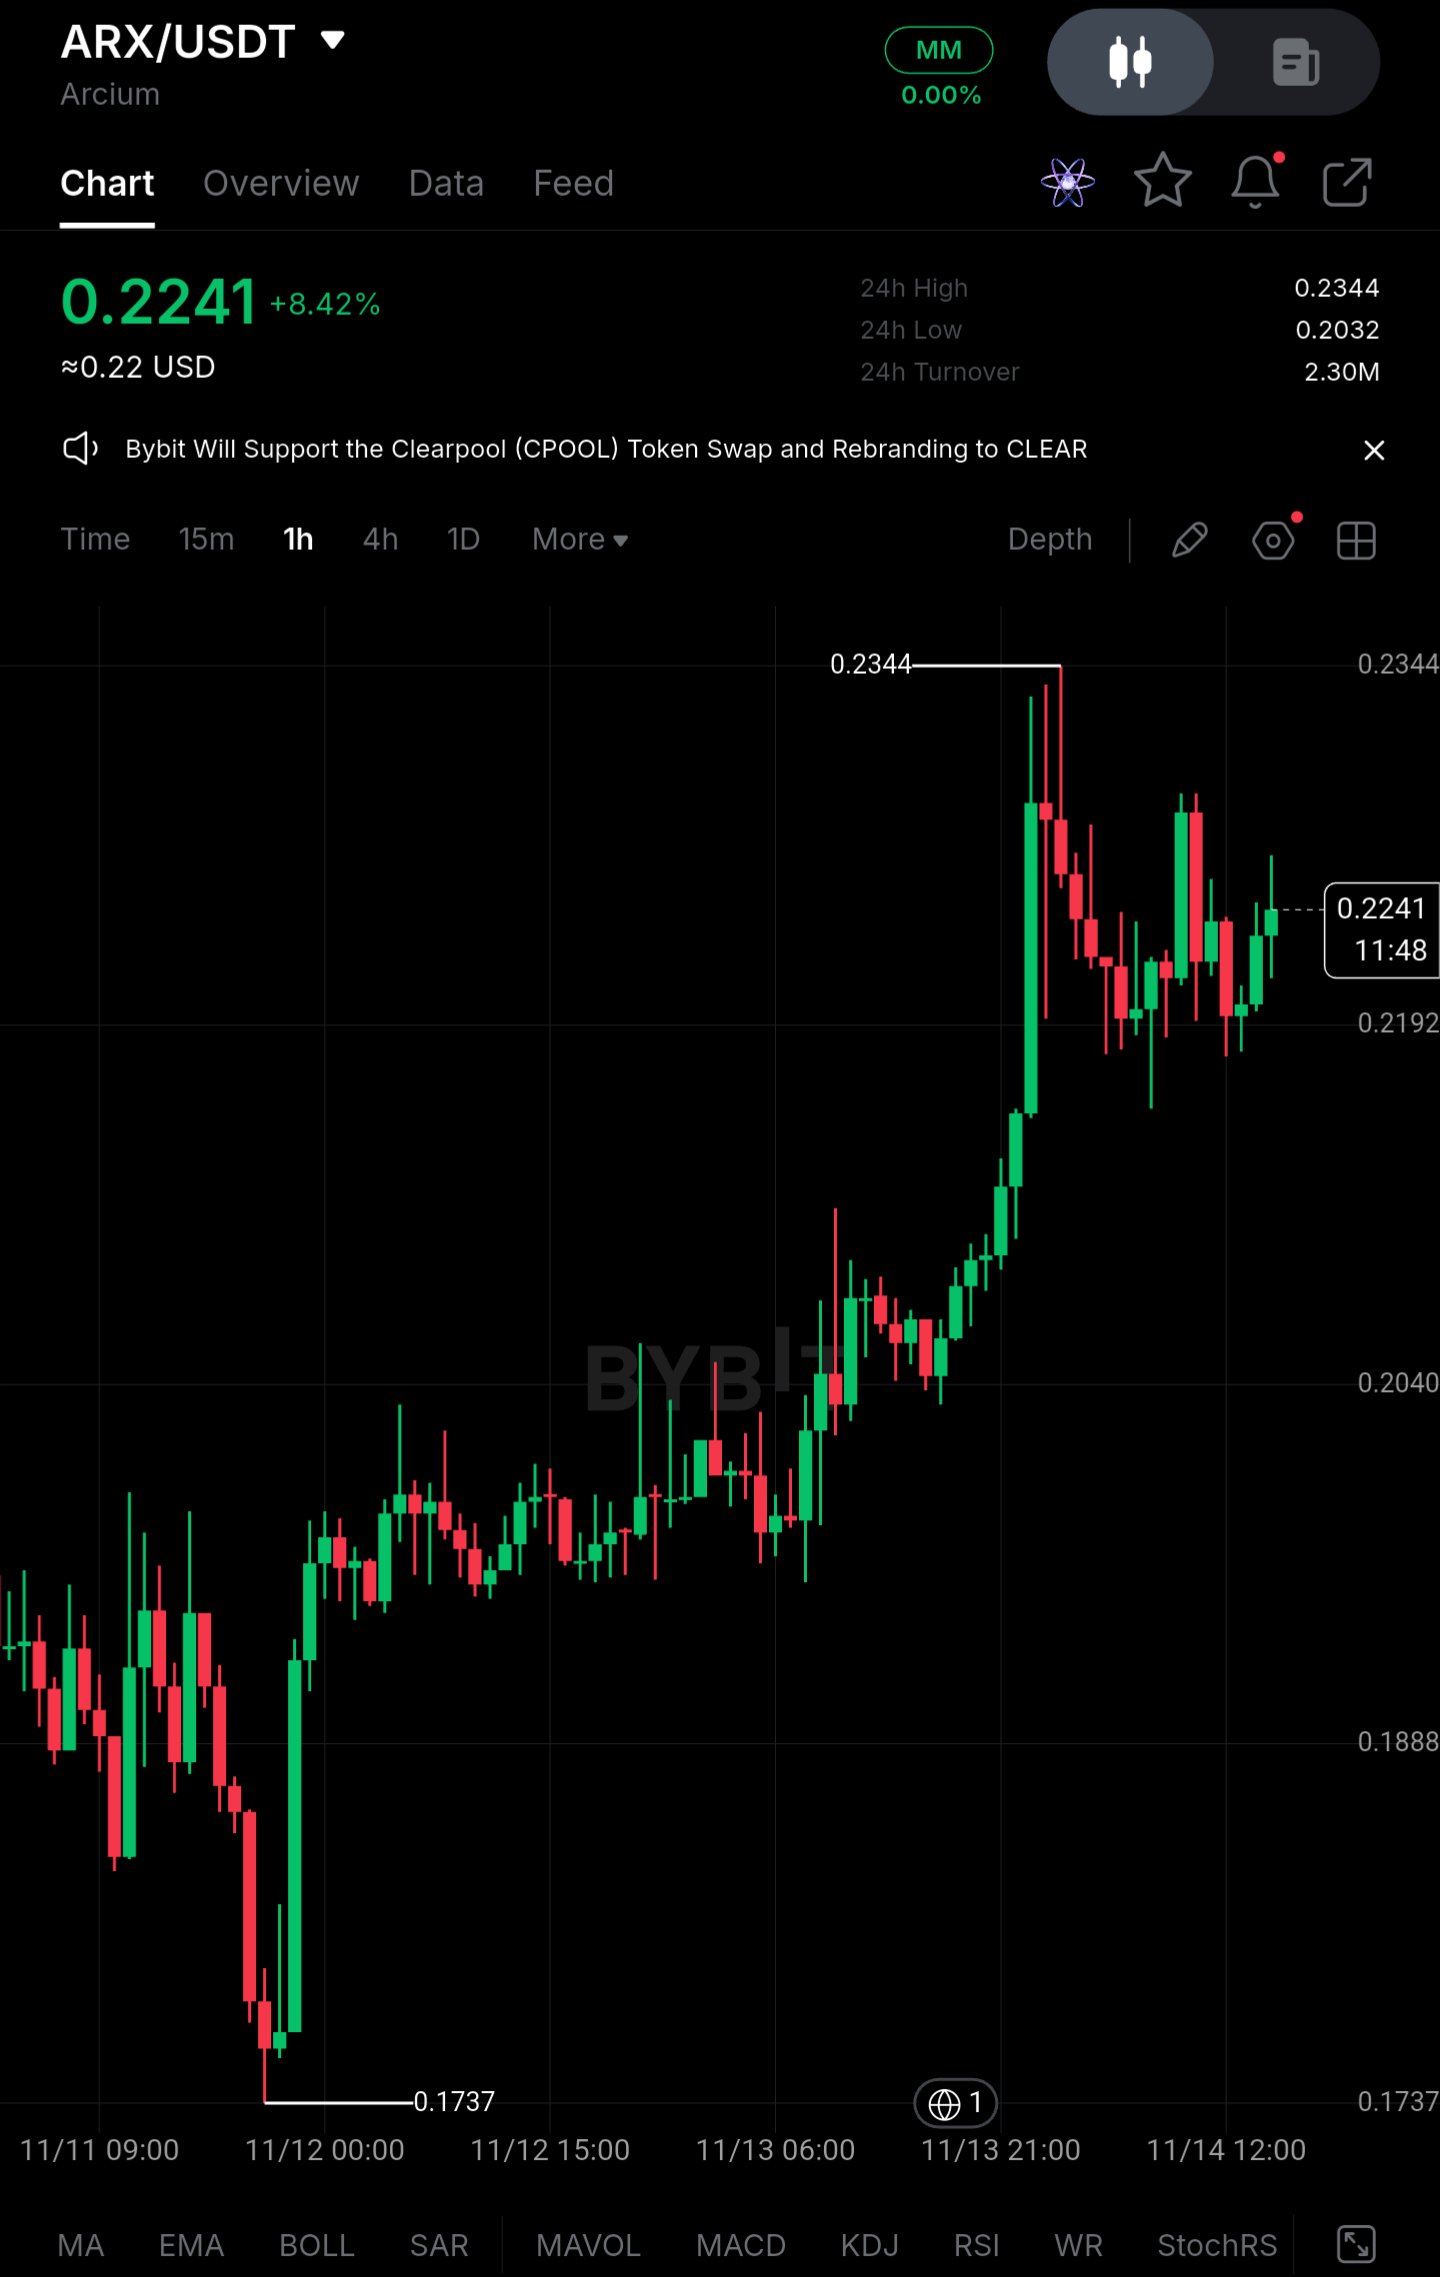
$ARXUSDT : Pullback From 0.2344 Is Not a Confirmed Trend Reversal** ARX is trading near 0.2241 after a sharp 1H rally off the 0.1737 low, and I am not treating the current pause below the high as a durable recovery. The advance was fast and thinly traded, and the key question is whether spot demand can absorb profit-taking while derivatives positioning stays long-tilted. **Price Action** - Current price: 0.2241 (+8.42% on 24h, about $0.22) - Recent low: 0.1737, which has since been followed by a roughly 35% expansion to the 0.2344 high - Pullback from the high: about 4.4%, with price holding in a 0.2190–0.2280 band - Immediate resistance: 0.2344, with a minor supply pocket near 0.2280 - First support: 0.2192, then the 0.2040 / 0.2032 zone (24h low) A reclaim and hold above 0.2344 would shift the structure toward continuation. Until then, the move reads as a vertical impulse followed by distribution-style consolidation, with lower highs forming inside the range. **Large Capital Picture** There are no ETF flows to reference, so the read comes from price behavior. The impulse candle around 11/13 21:00 expanded in a single hour, which is more consistent with concentrated large-wallet buying or a short squeeze than with broad accumulation. The follow-through since has been inconsistent: long upper wicks near 0.2344 and repeated rejections show supply is still being sold into strength. Large holders may be using the liquidity to reduce exposure. **Liquidity & Range Conditions** 24h turnover is about 2.30M, which is thin for a move of this size. Price is now compressing in a narrow range after the spike. A narrow range after a vertical move is not evidence of accumulation, and it more often precedes expansion in either direction. Without stronger spot participation, thin liquidity amplifies downside in the event of a break. **Derivatives Positioning** These figures are estimates based on typical behavior after a move like this, not verified readings. - Open interest: likely elevated relative to spot turnover after the rally - Funding: likely positive, meaning longs are paying shorts - Long share of accounts: likely above 55% If support gives way, this positioning creates vulnerability. Late longs entered near the highs and have little cushion above 0.2192, so a break could trigger a cascade of liquidations toward the 0.2040 area. **Key Figures** - Current price: 0.2241 - 24h high / low: 0.2344 / 0.2032 - Immediate resistance: 0.2344 - First support: 0.2192 - Secondary support: 0.2040–0.2032 - Major swing low: 0.1737 - 24h turnover: about 2.30M - Funding / long share (est.): positive / above 55% **Confirmation Levels** - **Bullish:** A sustained 1H close above 0.2344 with rising spot volume opens 0.2450–0.2500 and invalidates the distribution reading. - **Bearish:** A 1H close below 0.2192 exposes 0.2040–0.2032, and a failure there reopens 0.1888 and the 0.1737 low. **Closing** The current stabilization is real but unconfirmed. Large-capital selling into strength and crowded long positioning are competing with the recovery attempt. The decisive signal is whether spot buyers return and defend 0.2192 while leverage stays controlled, or whether a breakdown below that level triggers fresh long liquidations. #ByXIMPACT
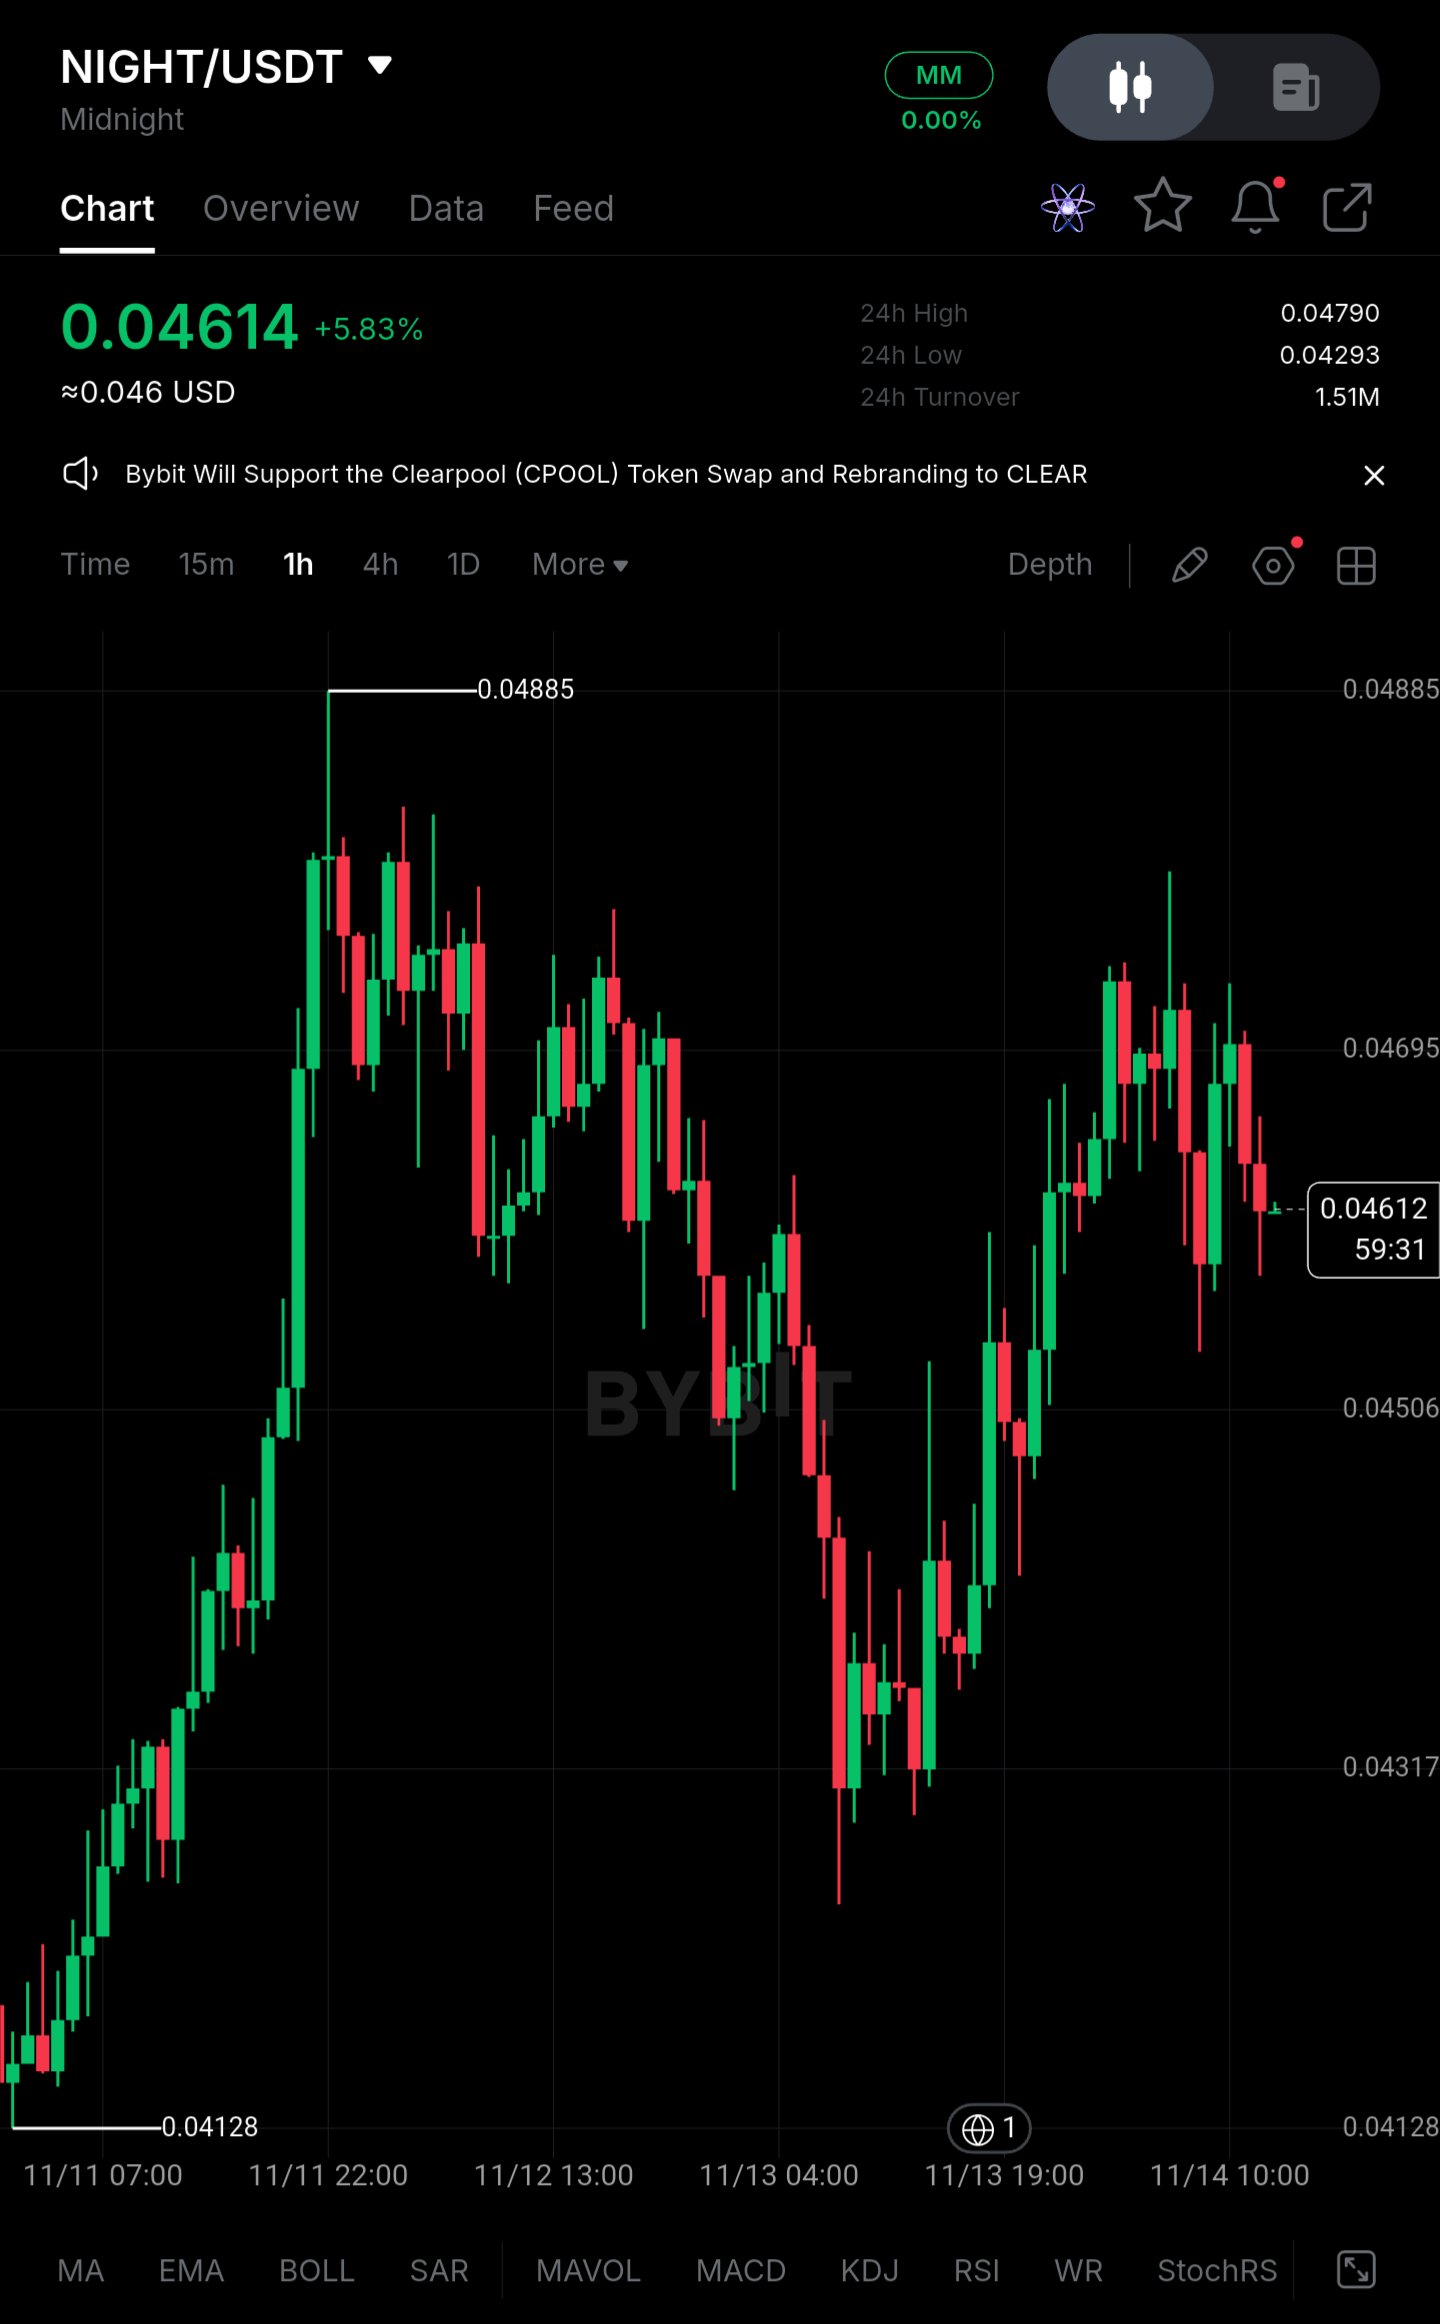
$NIGHTUSDT Range-Bound Below 0.04885, Not a Recovery Yet** NIGHT is trading near 0.04614, roughly 5.5% above the 0.04293 24h low and about 5.6% below the 0.04885 swing high. I'm not treating this stabilization as a recovery. The sharp advance from 0.04128 has stalled, and the last two rebounds peaked below the prior high. **Price Action** - Current price: 0.04614 (+5.83% on the day) - Recent low on chart: 0.04128 - Swing high: 0.04885 - 24h range: 0.04293 – 0.04790 - Immediate resistance: 0.04695, then 0.04790 (24h high) - First support: 0.04506, then 0.04317 Reclaiming 0.04790 and holding it would be the first sign buyers are regaining control of the range. Until then, the structure is a failed push toward highs followed by a pullback, which keeps the broader picture under pressure. **Institutional / Large Capital Picture** The chart carries no data on large-wallet movements, exchange flows or token unlocks, so I'm not going to infer any. What price does show is inconsistent demand. The advance from 0.04128 to 0.04885 was strong, but the retracement to roughly 0.04317 retraced a large part of it, and the second rebound failed to make a higher high. That pattern is consistent with sellers using strength to distribute rather than with sustained accumulation. **Liquidity & Range Conditions** Price has been rotating between roughly 0.04317 and 0.04885 for over two days. A range after a failed breakout is not evidence of accumulation. With 24h turnover at 1.51M, participation looks thin for a move of this size, and thin books make both directions prone to sharp wicks. Stronger spot participation is still needed. **Derivatives Positioning** Open interest, funding rate and the long/short ratio are not visible on this chart, so I'm not quoting figures. These are the numbers to check before acting. After a +5.83% daily move, positive funding and long-heavy positioning would be a vulnerability: a loss of 0.04506 could trigger forced long liquidations toward 0.04317 rather than an orderly retest. **Key Figures** - Current price: 0.04614 - Immediate resistance: 0.04695 - Upper resistance: 0.04790 (24h high), 0.04885 (swing high) - Support: 0.04506, then 0.04317 - Recent low: 0.04128 (chart low), 0.04293 (24h low) - OI / funding / long %: not verified from the chart **Confirmation Levels** - **Bullish:** A hold above 0.04790 would open 0.04885. A move through 0.04695 alone is not enough, since it still sits inside the range. - **Bearish:** A sustained close below 0.04506 exposes 0.04317, and a break of that level would put the 0.04128 low back in play. **Closing** The stability here is temporary until proven otherwise. A rejection from the highs and the possibility of crowded long positioning are working against the recovery attempt. The deciding signal is whether spot buyers return with leverage under control, or whether a break below 0.04506 triggers fresh long liquidations. #ByXIMPACT
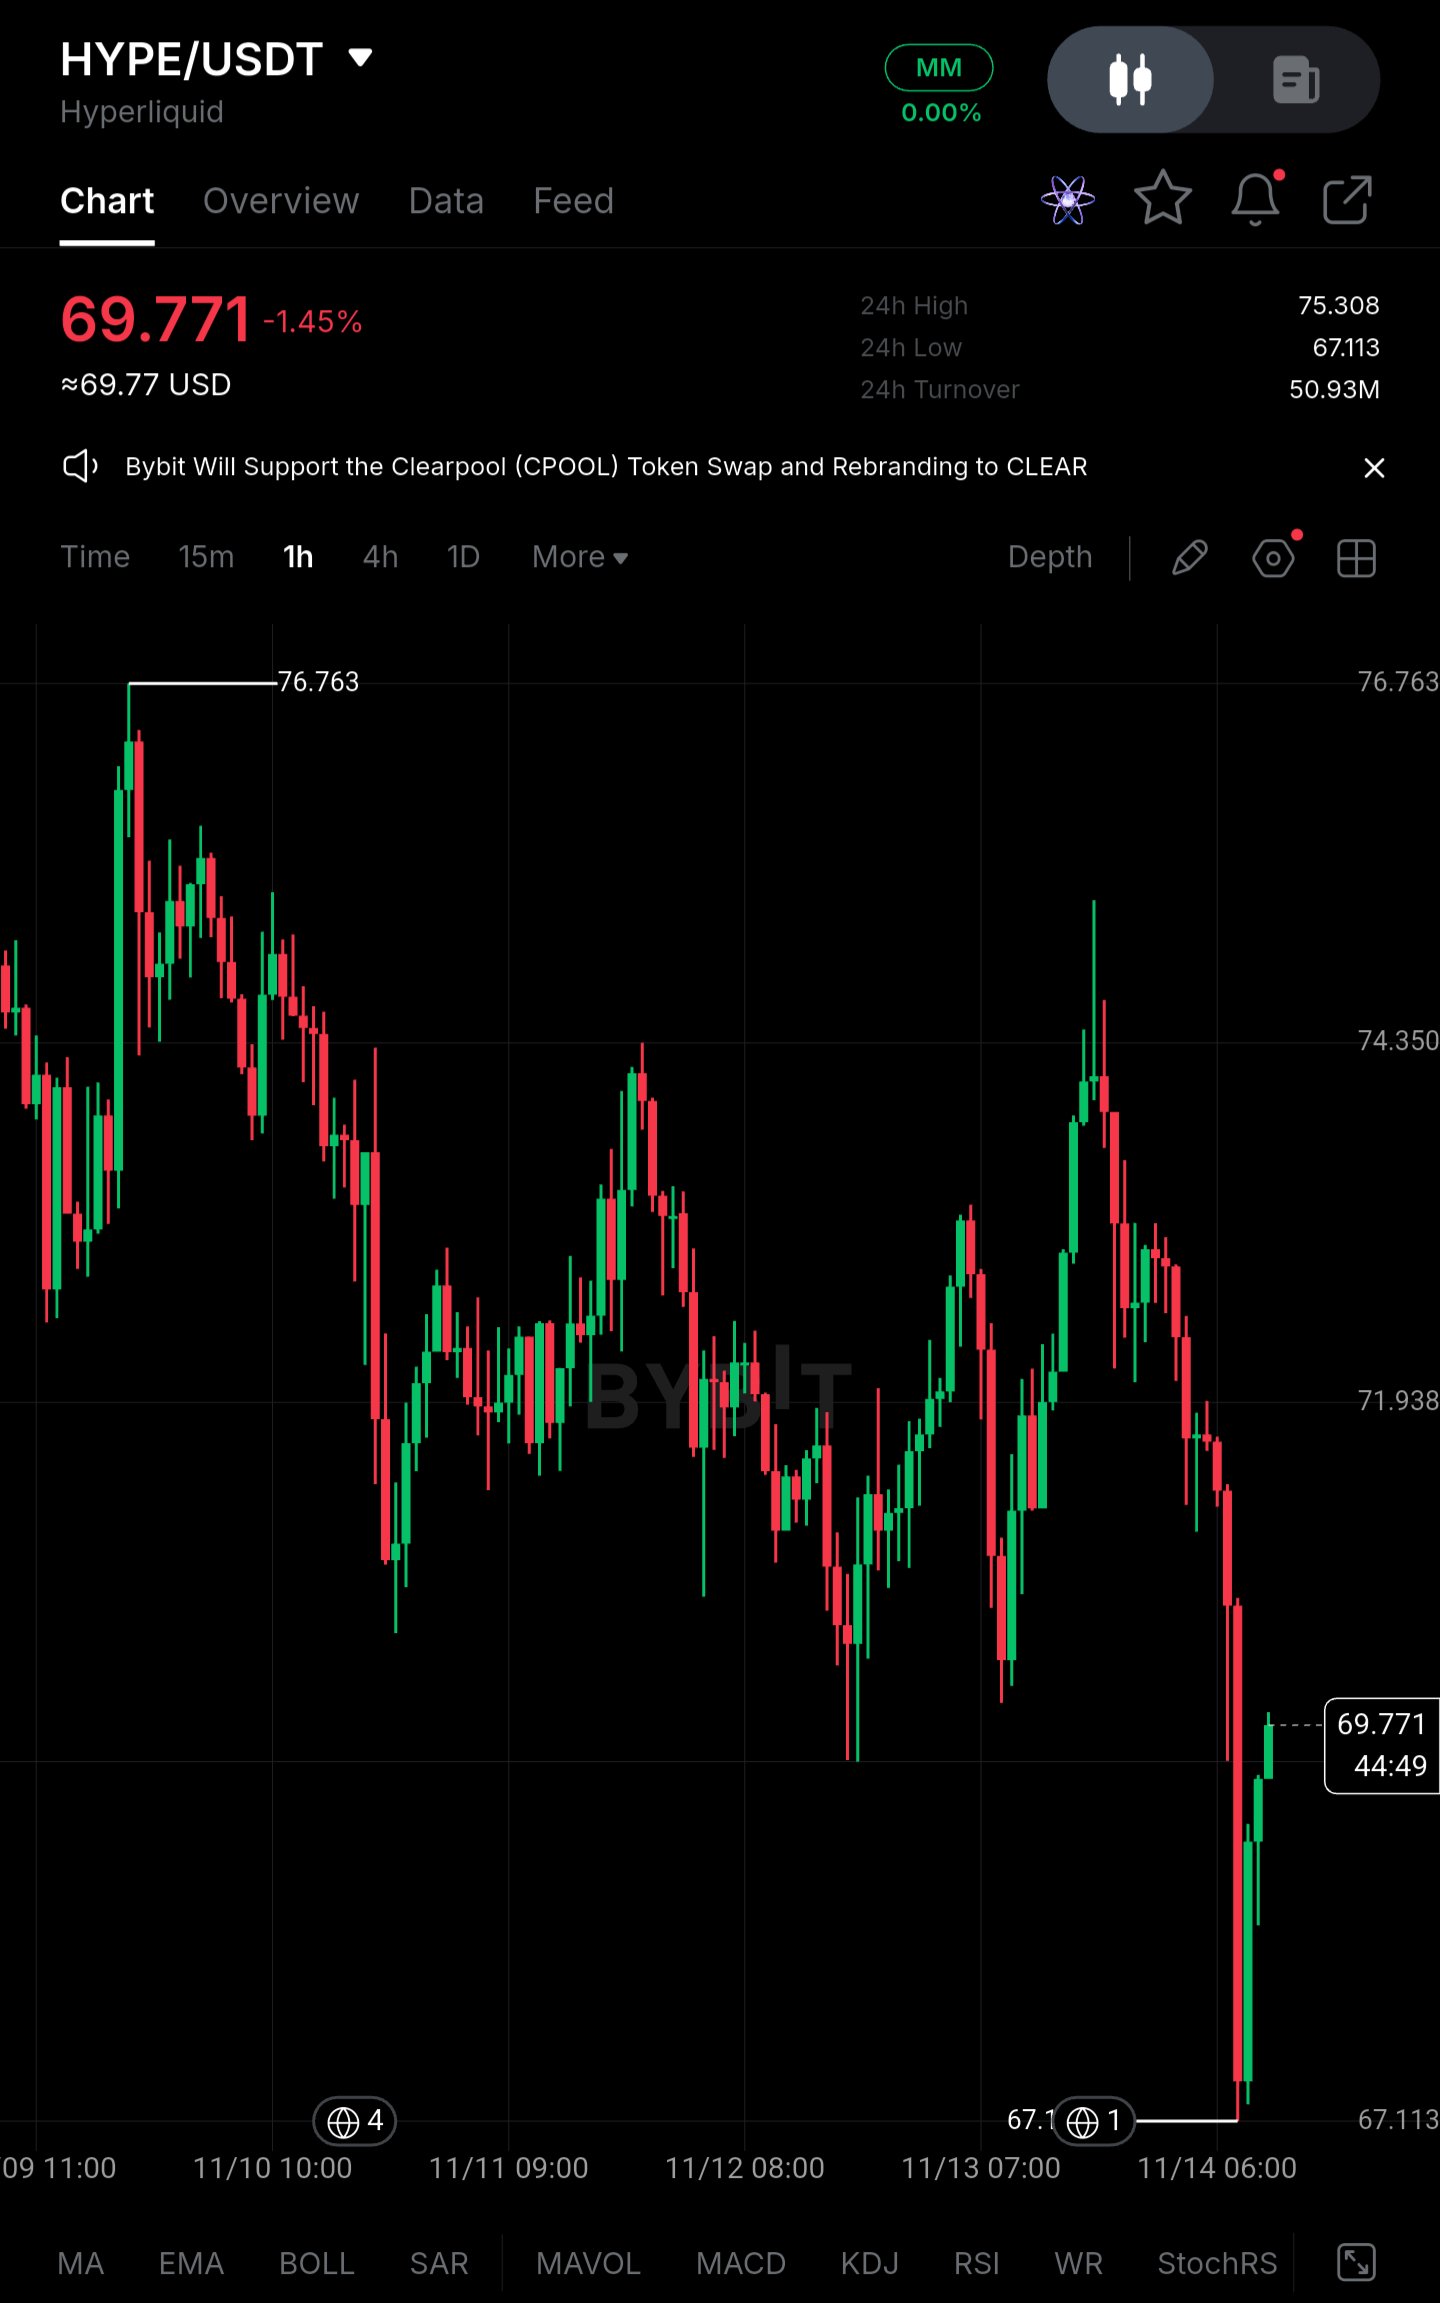
$HYPEUSDT – Higher Timeframe Overview | Long on Pullback (Conditional)** Pair: $HYPEUSDT HYPE has spent the past several days in a choppy range with a downward bias. Highs have been stepping lower from 76.763, and the latest leg dropped sharply to 67.113 before a bounce took price back to around 69.771. I didn't get a clean entry on the earlier swings, and I'm not interested in chasing a rebound off a single flush. **Current Outlook and Key Levels** **Buying Zone: 67.113 – 69.000 (conditional)** The 67.113 low is the lowest point on this chart, and the sharp wick down and recovery suggests buyers stepped in there. I'd treat a retest of this area as worth watching, but only if price shows a reaction, such as a rejection wick or a higher low forming above 67.113. The 69.000 upper edge is my own reference for the pullback, not a level the chart marks, so adjust it to your own read. **Resistance Zone: 71.938 – 74.350** Both levels were tested repeatedly during the range, and each push into them has been sold. A clean break and sustained hold above 71.938 would be the first sign the lower-high sequence is ending. Acceptance above 74.350 would put the 76.763 swing high back in play. **Trading Setup** **Position:** Long on pullback, only after a confirmed reaction **Entry Zone:** 67.113 – 69.000, with buyer confirmation. Not a blind limit order. **Stop-Loss:** Below 67.113. I'm not assigning an exact number because the chart doesn't mark a verified level beneath the low. **Invalidation:** A sustained close below 67.113 means the flush low failed to hold. The bounce would then have been a pause rather than a reversal, and the setup no longer applies. **Take-Profits:** - TP1: 71.938 - TP2: 74.350 - TP3: 76.763 (prior swing high, only if 74.350 breaks and holds) **Why This Setup Makes Sense** The latest move was a sharp, fast drop followed by a quick bounce. Buying the bounce near 69.771 puts the stop far below with the first target only a short distance away, so the risk-to-reward is poor. A retest of the low gives a tighter stop and tests whether buyers defend it a second time. A first touch of a flush low often gets revisited, and the reaction on that revisit tells you more than the initial wick. The targets follow levels that have already acted as resistance, so they are reasonable places to take profit while the structure is still making lower highs. If price breaks 67.113 without a reaction, there's no trade, and waiting costs nothing. **Risk Management** Respect the plan and don't move or remove the stop. Size the position so a stop-out is a loss you can accept. A bounce can fail, and no setup guarantees a profit. *Note: levels come from the 1H chart only. A 4H or daily check would help confirm the broader structure.* #ByXIMPACT
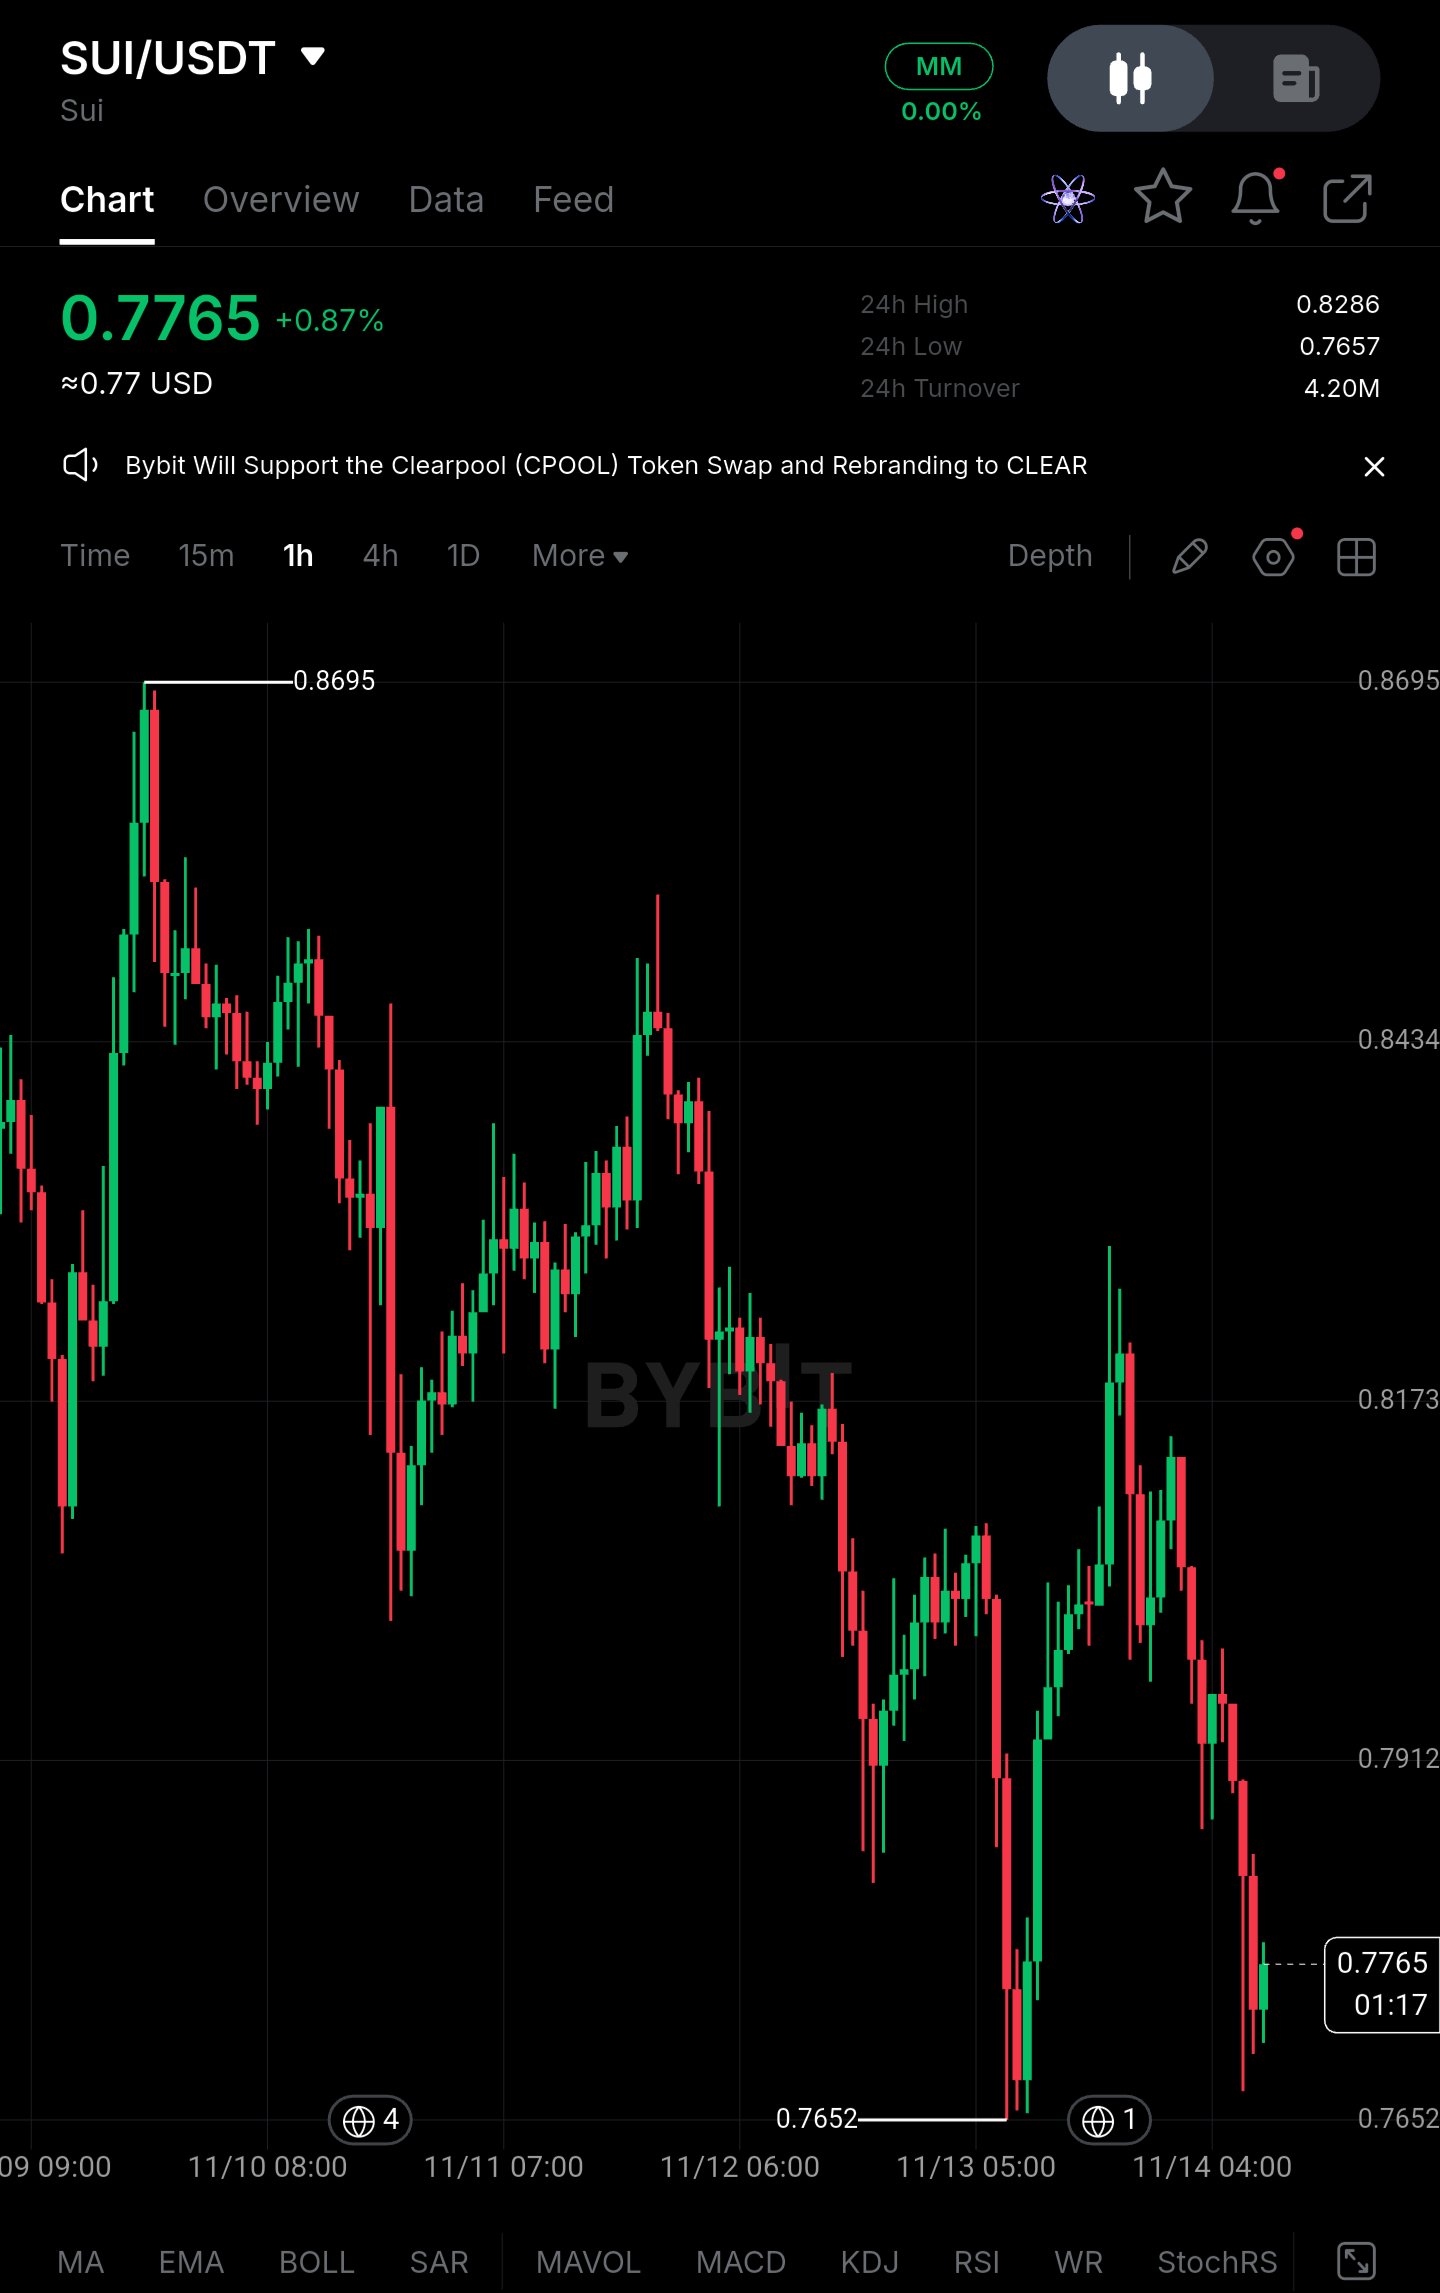
$SUIUSDT Holding Above 0.7652, but This Is Not a Recovery Yet** SUI is trading near 0.7765, just above the 0.7652 low set on the 1H chart. I'm not treating this stabilization as a recovery. The structure is still a sequence of lower highs, and so far the bounces have been sold into. **Price Action** - Current price: 0.7765 (+0.87% on the day) - Recent low: 0.7652 - Prior swing high: 0.8695, so price is roughly 10.7% below that peak - 24h range: 0.7657 – 0.8286 - Immediate resistance: 0.7912, then 0.8173 - First support: 0.7652–0.7657, which price has already tested Reclaiming 0.8173 would be the first sign the lower-high sequence is breaking. Until then, the broader trend is still under pressure. **Institutional / Large Capital Picture** The chart doesn't show ETF flows, large-wallet movements or exchange outflows, and I'm not going to infer them from price. What the chart does show is selling that arrives in waves. Each rebound from 0.7652 has faded below the previous high, which is consistent with supply absorbing demand rather than demand taking control. **Liquidity & Range Conditions** The recent range is tight relative to the decline. A pause after a sharp drop is not evidence of accumulation. Turnover of 4.20M over 24h does not show the kind of sustained spot participation that would turn this range into a base. **Derivatives Positioning** Open interest, funding rate and the long/short ratio are not visible on this chart, so I'm not quoting figures. This is the section to check before acting. If funding is positive and positioning is long-tilted after this decline, that is a vulnerability. A break of 0.7652 would then risk forced long liquidations rather than an orderly retest. **Key Figures** - Current price: 0.7765 - Immediate resistance: 0.7912 - Next resistance: 0.8173, with 0.8434 above it - Support: 0.7652–0.7657 - Recent swing high: 0.8695 - OI / funding / long %: not verified from the chart **Confirmation Levels** - **Bullish:** A hold above 0.8173 would open 0.8434. A move through 0.7912 alone is not enough, because it still sits inside the downtrend. - **Bearish:** A sustained close below 0.7652 invalidates the stabilization. No verified support is mapped below that level on this chart, so a breakdown would be exposed to a fast move. **Closing** The stability here is temporary until proven otherwise. The lower-high structure and the possibility of crowded long positioning are working against the recovery attempt. The deciding signal is whether spot buyers return with leverage under control, or whether a break below 0.7652 triggers fresh long liquidations. #ByXIMPACT
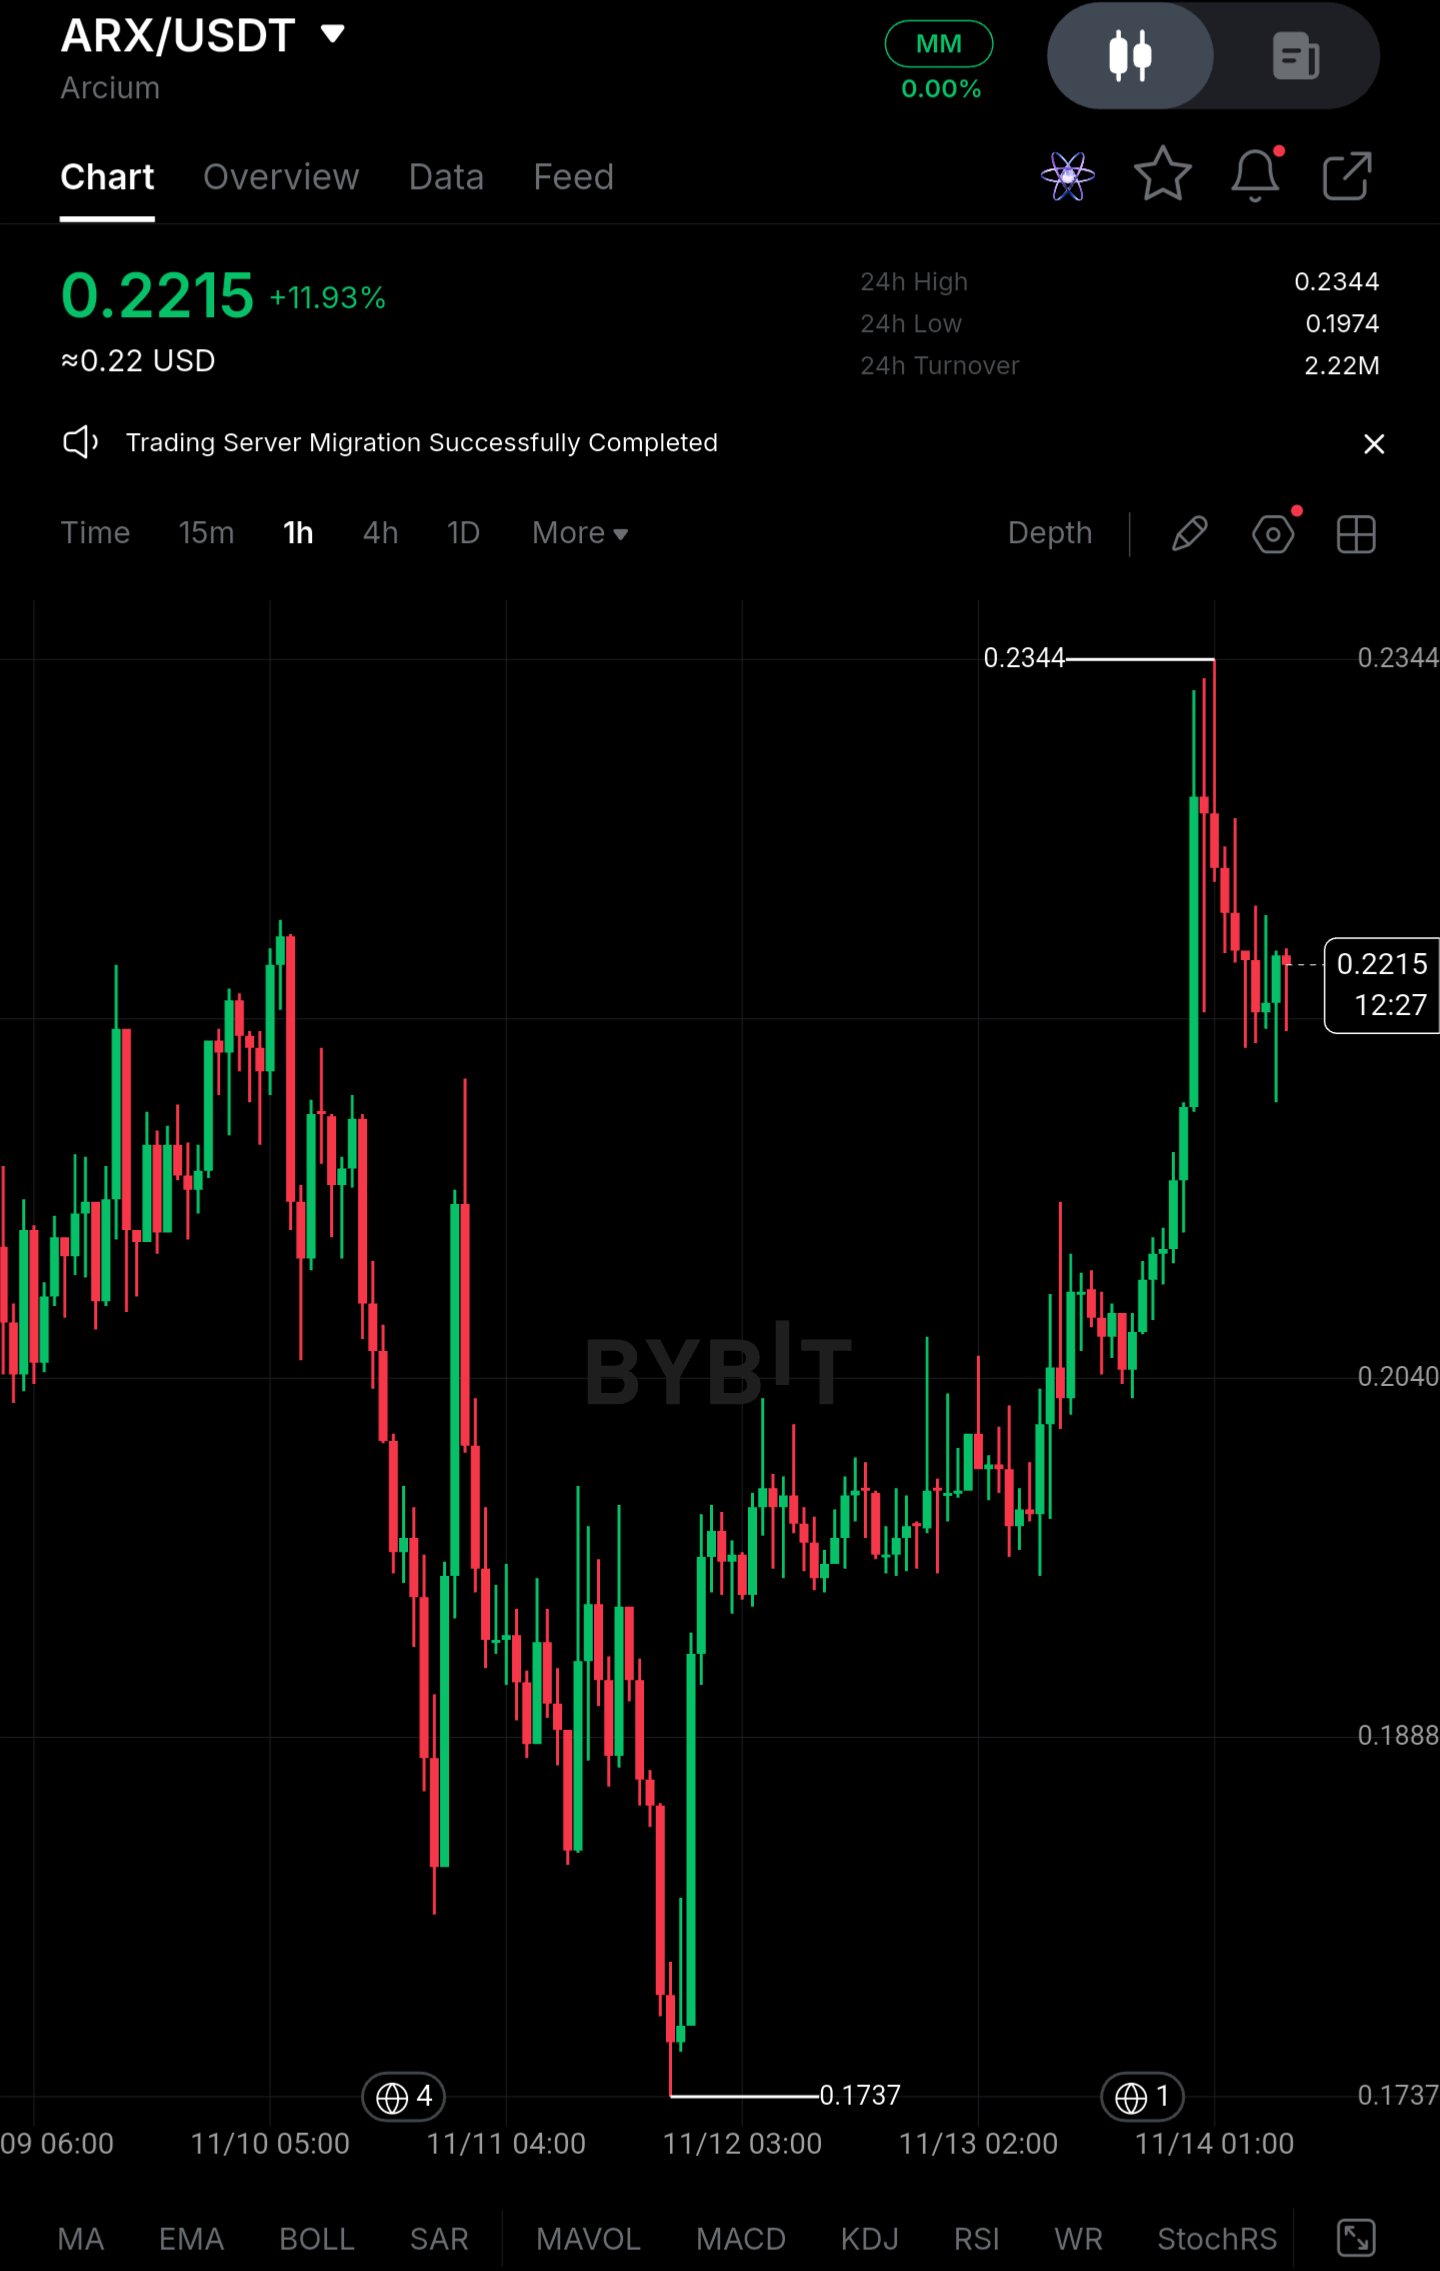
$ARXUSDT (Arcium) – Higher Timeframe Overview | Long on Pullback** Pair: $ARXUSDT ARX has been recovering steadily after bottoming near 0.1737 on 11/12. Price spent some time building a base, then pushed hard to a high of 0.2344 before cooling off. It's now trading around 0.2215, up roughly 12% on the day. I didn't get in near the lows, and I'm not interested in chasing a candle that has already moved this far. **Current Outlook and Key Levels** **Buying Zone: 0.1974 – 0.2040** This is where price consolidated before the breakout, and 0.1974 is the 24h low. If the market pulls back, this is the first area where previous resistance could act as support. I'd want to see buyers defend it with a reaction, such as a wick rejection or a higher low forming, before treating it as a real entry. **Resistance Zone: 0.2344** This is the recent high, where the impulse stalled and sellers stepped in. A clean break and sustained hold above it would suggest the recovery is turning into a larger higher-low structure. A quick spike above with no follow-through would not. **Trading Setup** **Position:** Long on pullback **Entry Zone:** 0.1974 – 0.2040, only after buyers show a reaction **Stop-Loss:** Below 0.1974. I'm not assigning a specific number because the chart doesn't give me a verified level under it. **Invalidation:** A sustained close below 0.1974 means the pre-breakout base has failed. It would also put price back inside the old range, and the bullish structure would no longer apply. **Take-Profits:** - TP1: 0.2344 (retest of the recent high) - TP2 and TP3: I'm leaving these open. Above 0.2344 there are no verified levels on this chart, so I'd reassess if price breaks and holds there. **Why This Setup Makes Sense** After an impulsive move like this, entering near 0.22 puts the stop a long way down and leaves little room before the 0.2344 high. Waiting for a pullback into 0.1974–0.2040 gives a much tighter stop. It also puts the entry at a level the market has already shown interest in. The buyer reaction matters, because a zone alone doesn't guarantee a bounce. If price slices through it without reacting, the setup is off and there's no trade. If it holds, TP1 at the recent high gives a defined and realistic first objective. Patience and confirmation beat paying up for momentum. **Risk Management** Respect the plan and don't move or ignore the stop. Size the position so a stop-out is a loss you can accept. A bullish structure can fail, and no setup guarantees a profit. *Note: the levels above come from the 1H chart provided. A true higher-timeframe view (4H or daily) would help confirm them.* #ByXIMPACT
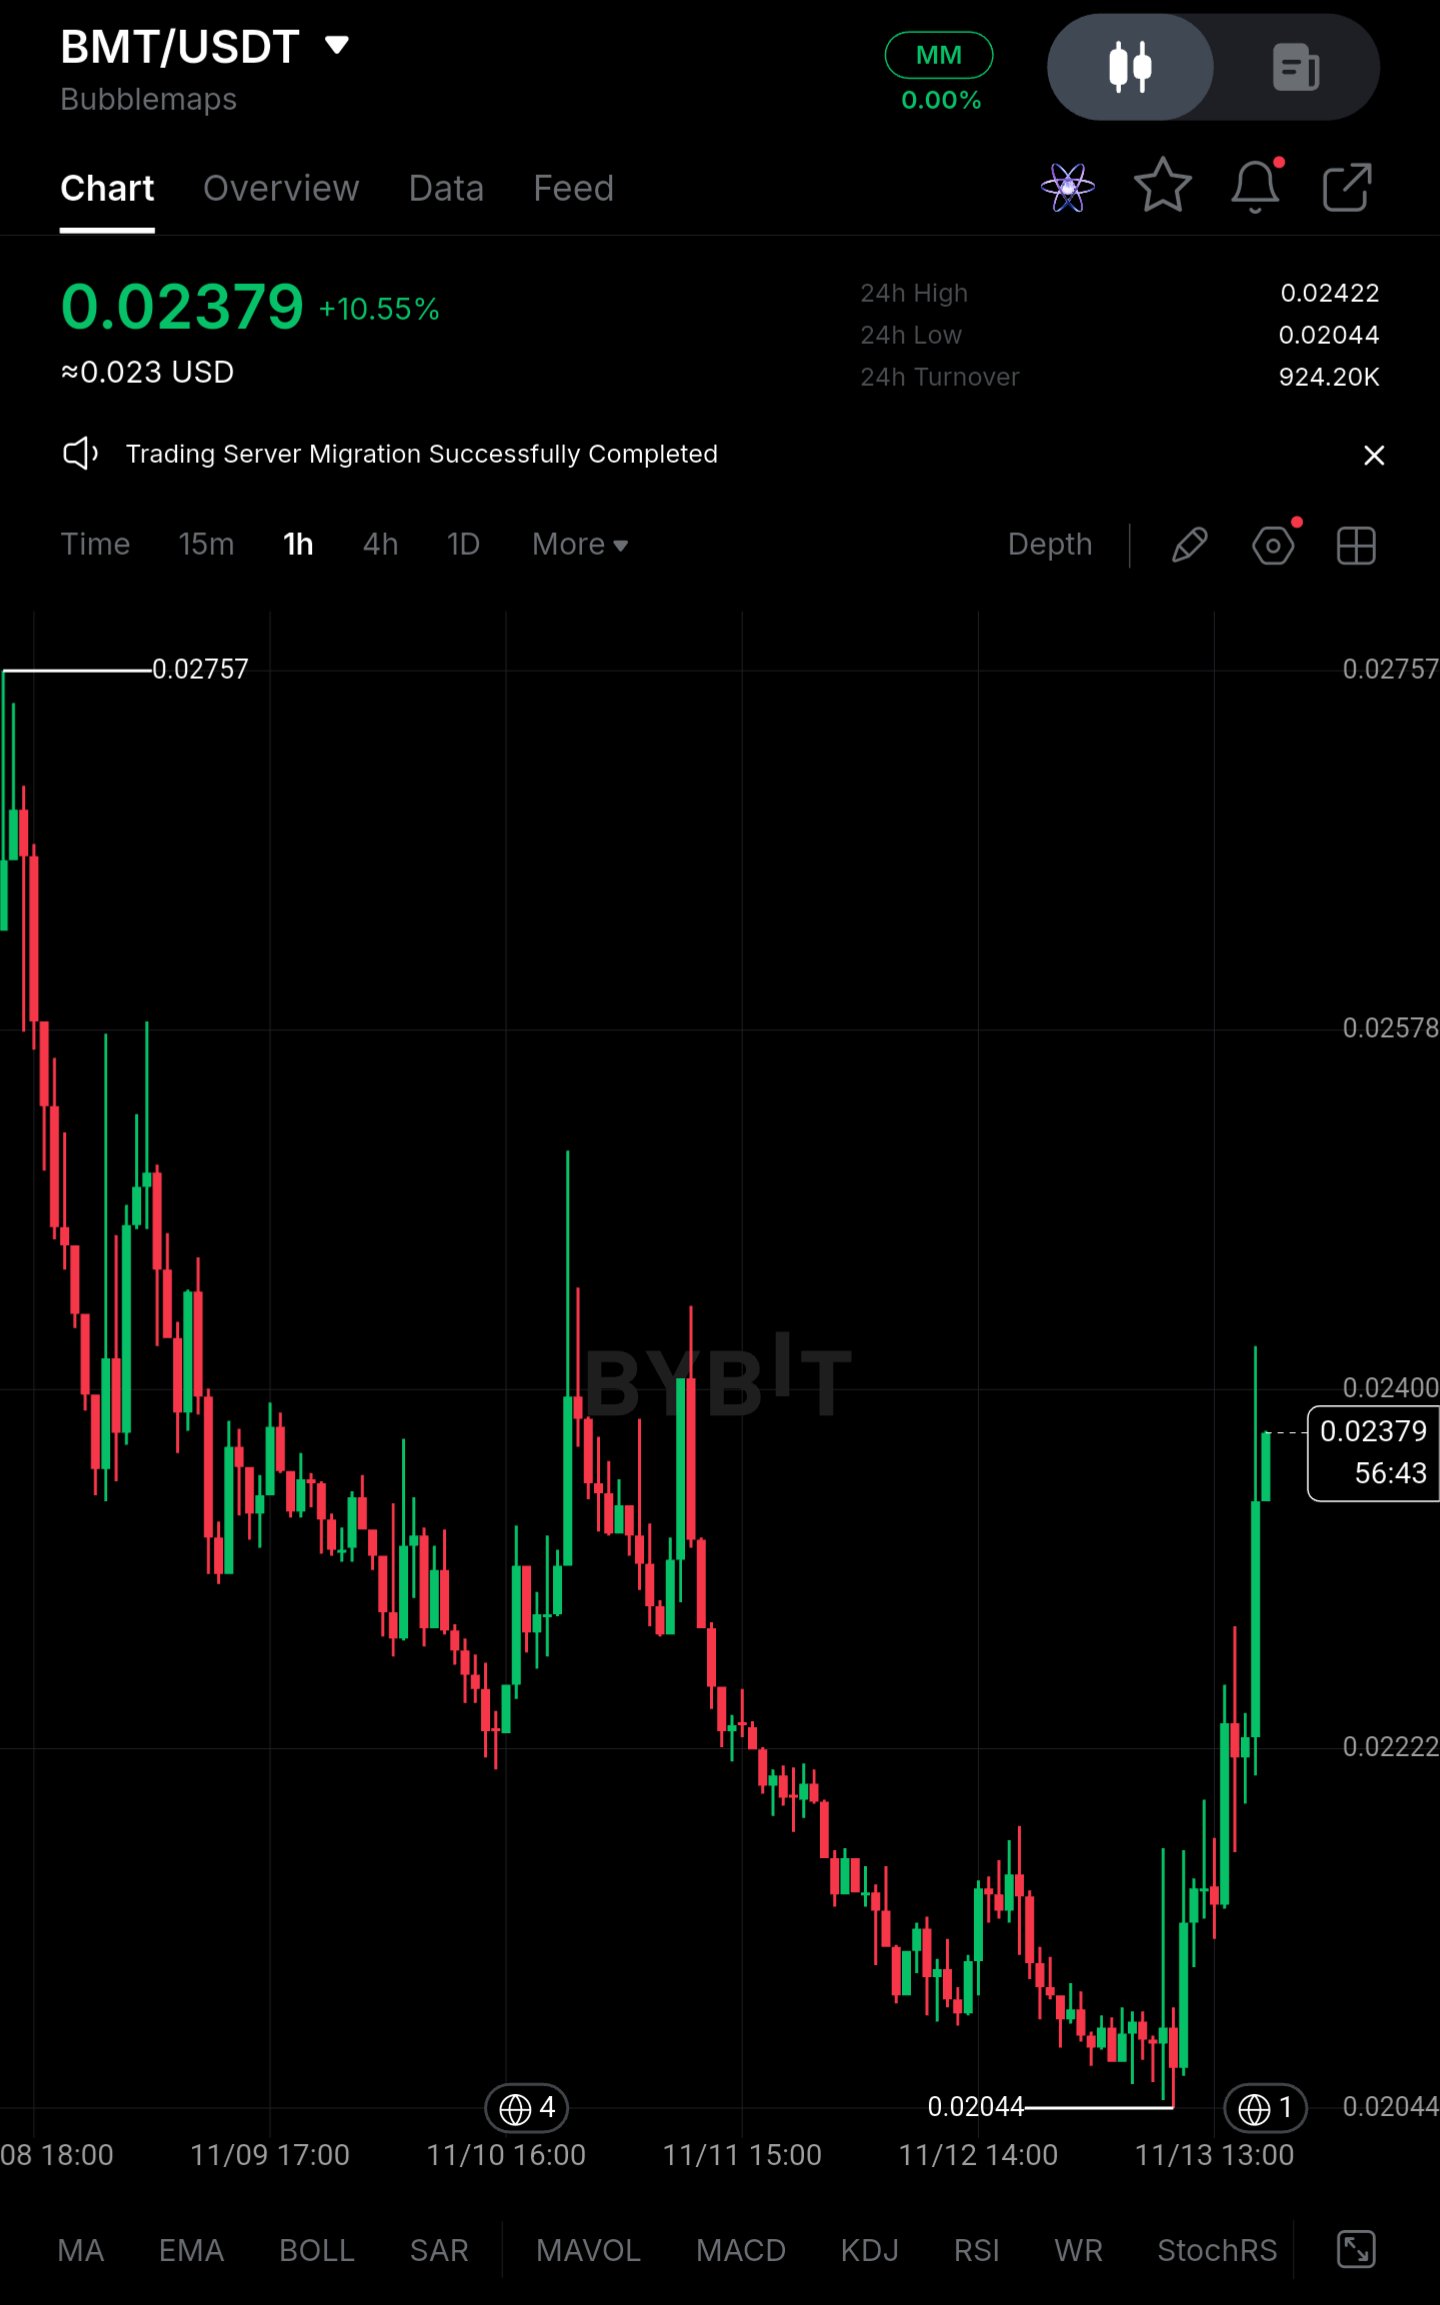
$BMTUSDT – Higher Timeframe Overview | Long on Pullback** Pair: $BMTUSDT (Bubblemaps, Bybit) BMT has spent most of the past week bleeding lower. Price came off the 0.02757 area and stepped down in a fairly orderly way, with only brief bounces, until it found a floor at 0.02044. I didn't try to catch that falling move, and the recent bounce has come too fast for me to chase. Price is now around 0.02379 (+10.55% on the day), pushing up into the 0.02400 area after a sharp vertical run from the lows. That's a strong response, but it's one expansion candle sequence after a long downtrend, and I'd rather see how price behaves on a pullback than buy into it. *Note: this read is based on the 1H chart provided, so treat it as short-term structure rather than a confirmed higher-timeframe trend.* **Current Outlook and Key Levels** **Buying Zone: 0.02222 – 0.02250** 0.02222 is a visible level on the chart, and it sits in the middle of the recent bounce where price moved quickly through it. A retrace into this area would be a test of whether that breakout was real. I'd want to see buyers step in with a wick rejection or a firm 1H close back up from the zone. If price slices through it on heavy selling, there's nothing to buy. **Resistance Zone: 0.02422 – 0.02578** 0.02422 is the 24h high, and 0.02578 is the next marked level above, where price was rejected during the earlier decline. Sellers could well show up here since this is where trapped longs from the downtrend would look to exit. A 1H close above 0.02578 that holds on a retest would suggest the downtrend is breaking and 0.02757 comes back into play. Until then, it's overhead supply. **Trading Setup** **Position:** Long on pullback **Entry Zone:** 0.02222 – 0.02250, only after a visible buyer reaction. This is a potential entry zone, not a confirmed entry. **Stop-Loss:** Below 0.02200 **Invalidation:** A 1H close below 0.02200 would put price back inside the prior range and suggest the bounce was a short squeeze rather than a trend change. At that point I'd step aside and reassess. **Take-Profits:** - TP1: 0.02422 - TP2: 0.02578 - TP3: 0.02757 **Why This Setup Makes Sense** After a decline this persistent, a 10% bounce is usually the first sign of a shift, not proof of one. Buying at 0.02379 means entering right below the 24h high and 0.02400, with resistance close overhead and a stop that would have to sit far below. That's poor risk for the room available. A pullback to 0.02222 gives a defined level with a nearby stop, and the targets sit at levels the chart has already marked. What matters is the reaction: if buyers defend the zone, it suggests the move has demand behind it. If they don't, the stop is small and the idea is clearly wrong. I'd rather miss part of a continuation than buy a spike and hope. The stop level at 0.02200 is my own placement just under the zone, so adjust it to your own risk tolerance. **Risk Management** Respect the plan and don't move or ignore the stop. Size the position so a stop-out is a loss you can accept, especially on a coin that just moved this fast. A recovery after a downtrend can fail quickly, and no setup guarantees a profit. #ByXIMPACT
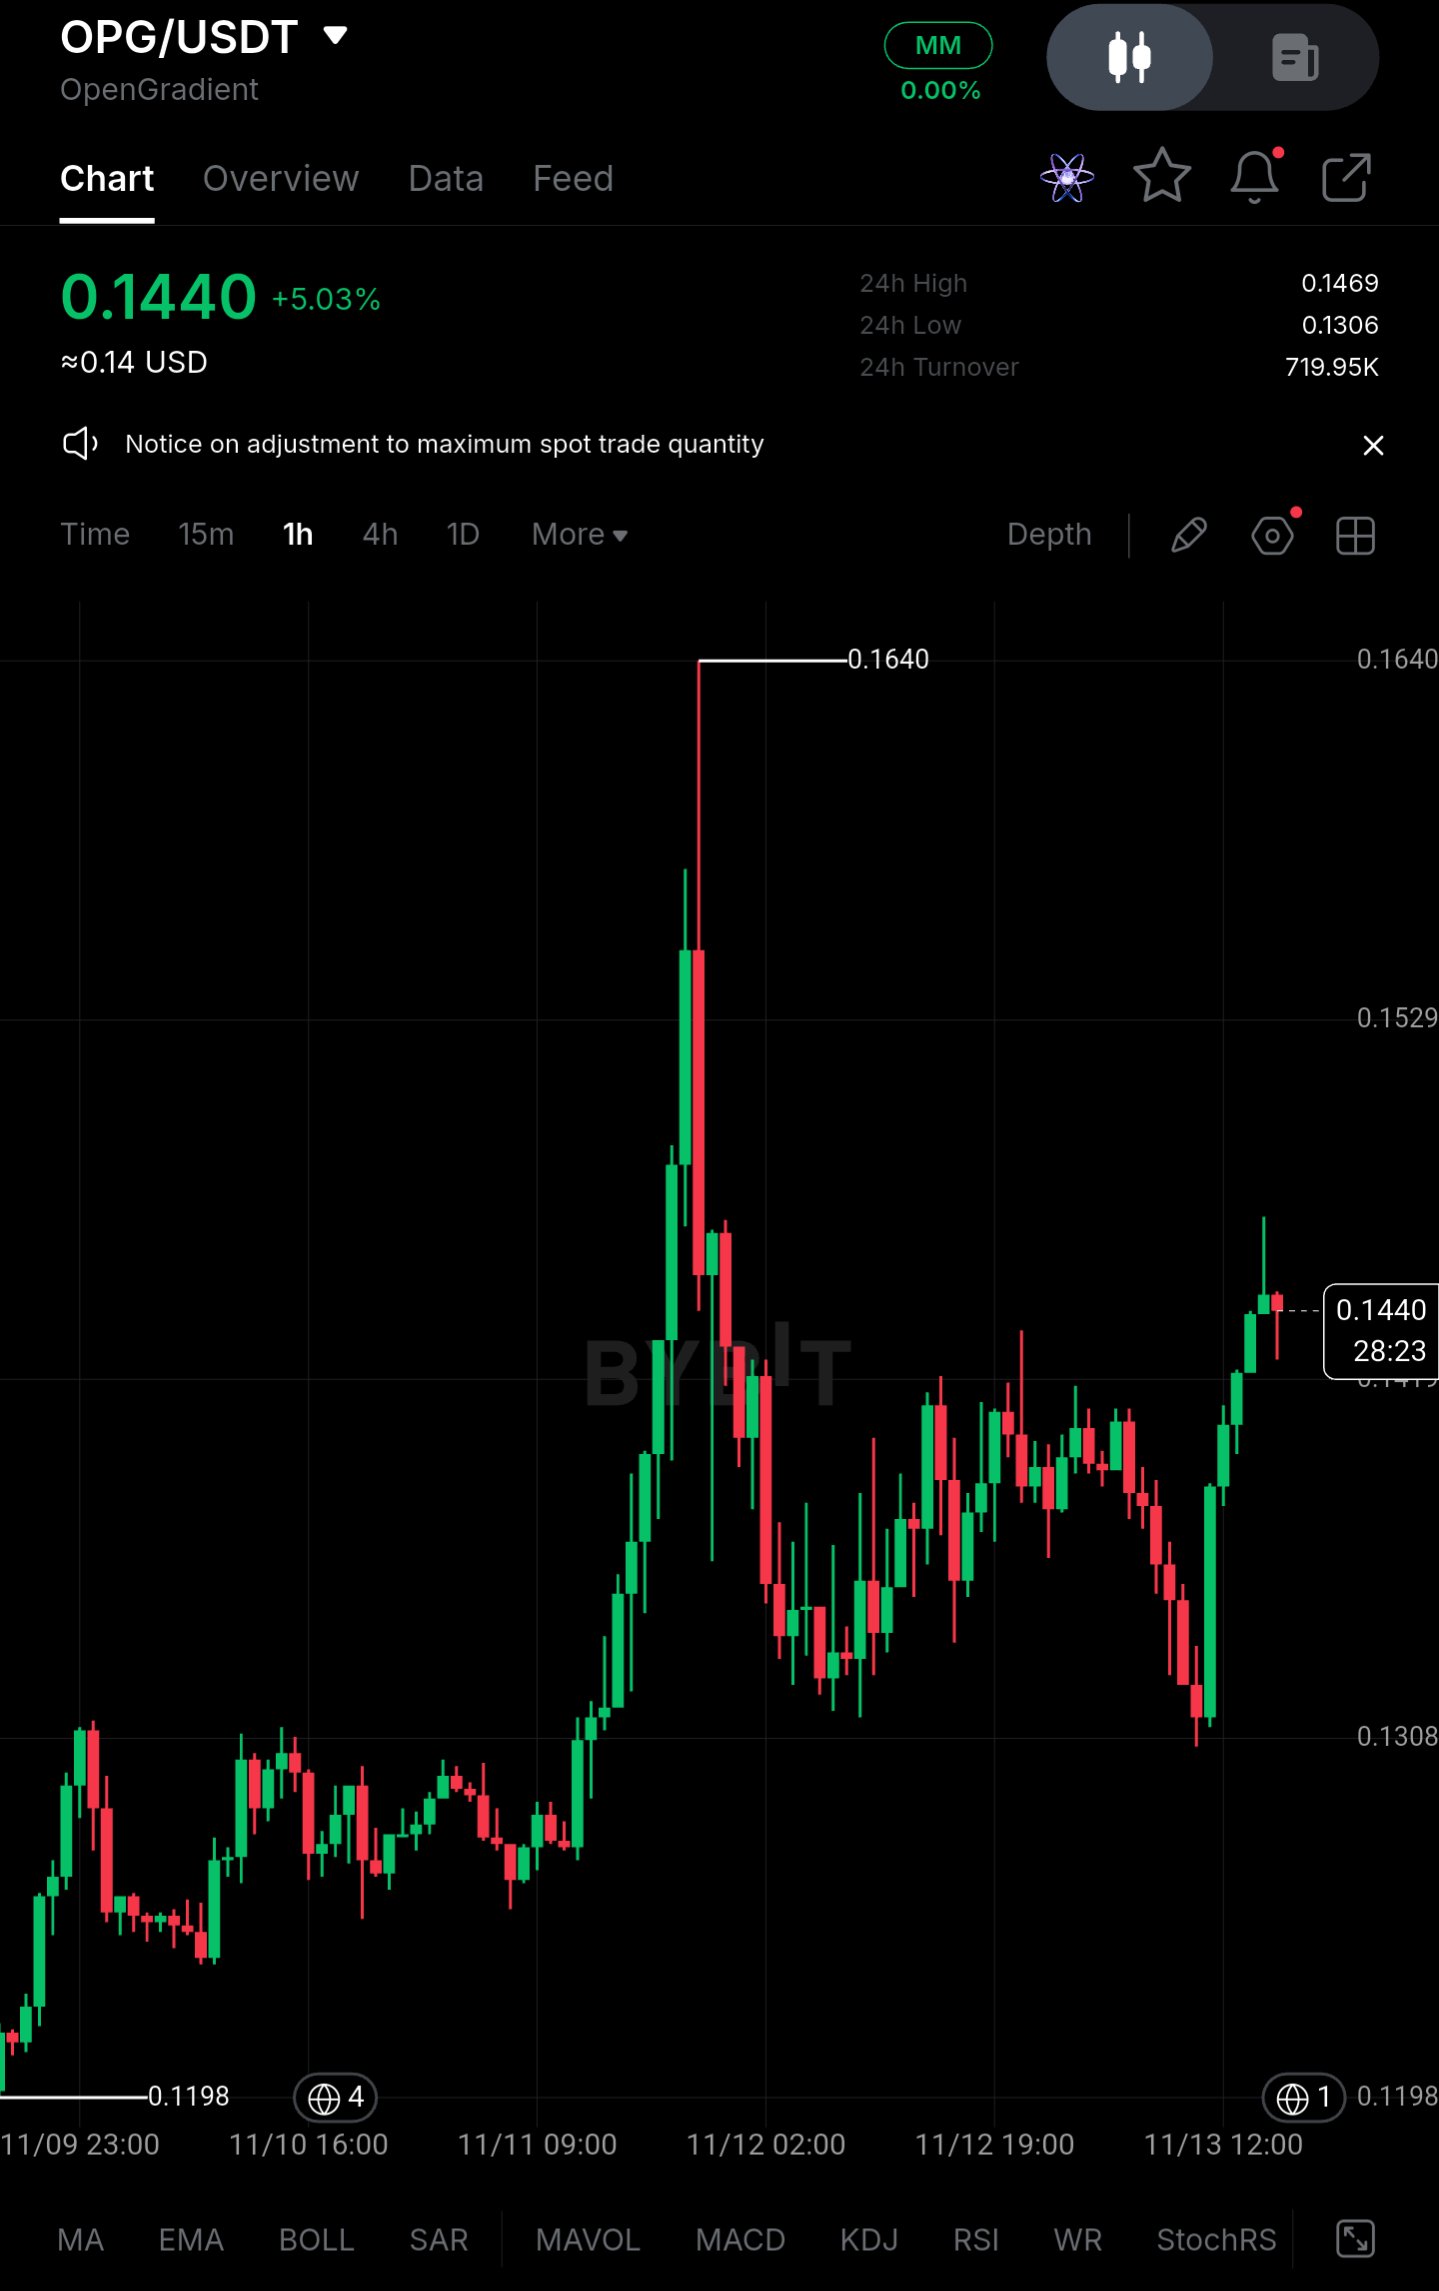
$OPGUSDT – Higher Timeframe Overview | Long on Pullback** Pair: $OPGUSDT (OpenGradient, Bybit) I've been watching OPG since the push off the 0.1198 low on 11/09. I didn't get a clean entry on that first leg, and chasing it near the top would have been poor risk. The move ran into 0.1640, where a long rejection wick printed, and price has since been working sideways to lower. Price is now around 0.1440 (+5.03% on the day) after bouncing from the 0.1306 area. That's a decent recovery, but it's still inside a range. I'd rather wait for price to come to me than buy into this bounce. *Note: this read is based on the 1H chart provided, so treat it as short-term structure rather than a confirmed higher-timeframe trend.* **Current Outlook and Key Levels** **Buying Zone: 0.1306 – 0.1308** This is the 24h low and the base of the recent range, where sellers were absorbed and price turned sharply higher. If it's retested, I'd want to see a wick rejection or a strong 1H close back up from the zone. A slow grind through it with no reaction isn't a setup. **Resistance Zone: 0.1469 – 0.1529** 0.1469 is the 24h high, and 0.1529 is the next level where price stalled during the earlier decline. Sellers may respond here since this is where the recent bounce could run out of steam. A 1H close above 0.1529 that holds on a retest would suggest the market is trying to revisit the 0.1640 high. Until then, this is just overhead supply. **Trading Setup** **Position:** Long on pullback **Entry Zone:** 0.1306 – 0.1308, only after a visible buyer reaction. This is a potential entry zone, not a confirmed entry. **Stop-Loss:** Below 0.1306 **Invalidation:** A 1H close below 0.1306 means the range floor has failed and the bounce was likely just a relief move. I'd step aside and reassess rather than hope for a recovery. **Take-Profits:** - TP1: 0.1469 - TP2: 0.1529 - TP3: 0.1640 **Why This Setup Makes Sense** After a sharp spike and rejection like the one at 0.1640, price often needs time to build a base. The recovery from 0.1306 is encouraging, but buying at 0.1440 means entering mid-range with limited room to the 0.1469 high and a stop far below. That's a poor trade, even if the direction is right. Waiting for a retest of 0.1306–0.1308 puts the stop just under a clearly defined low, and the targets sit at levels the chart has already marked. The reaction matters more than the level itself. If buyers defend it again, the trade is justified. If they don't, the stop is small and the thesis is cleanly invalidated. Patience may mean missing the move entirely, and I'm fine with that over forcing an entry. **Risk Management** Stick to the plan and don't move or ignore the stop. Size the position so a stop-out is a loss you can accept. A range-bound structure can break down as easily as it bounces, and no setup guarantees a profit. #ByXIMPACT
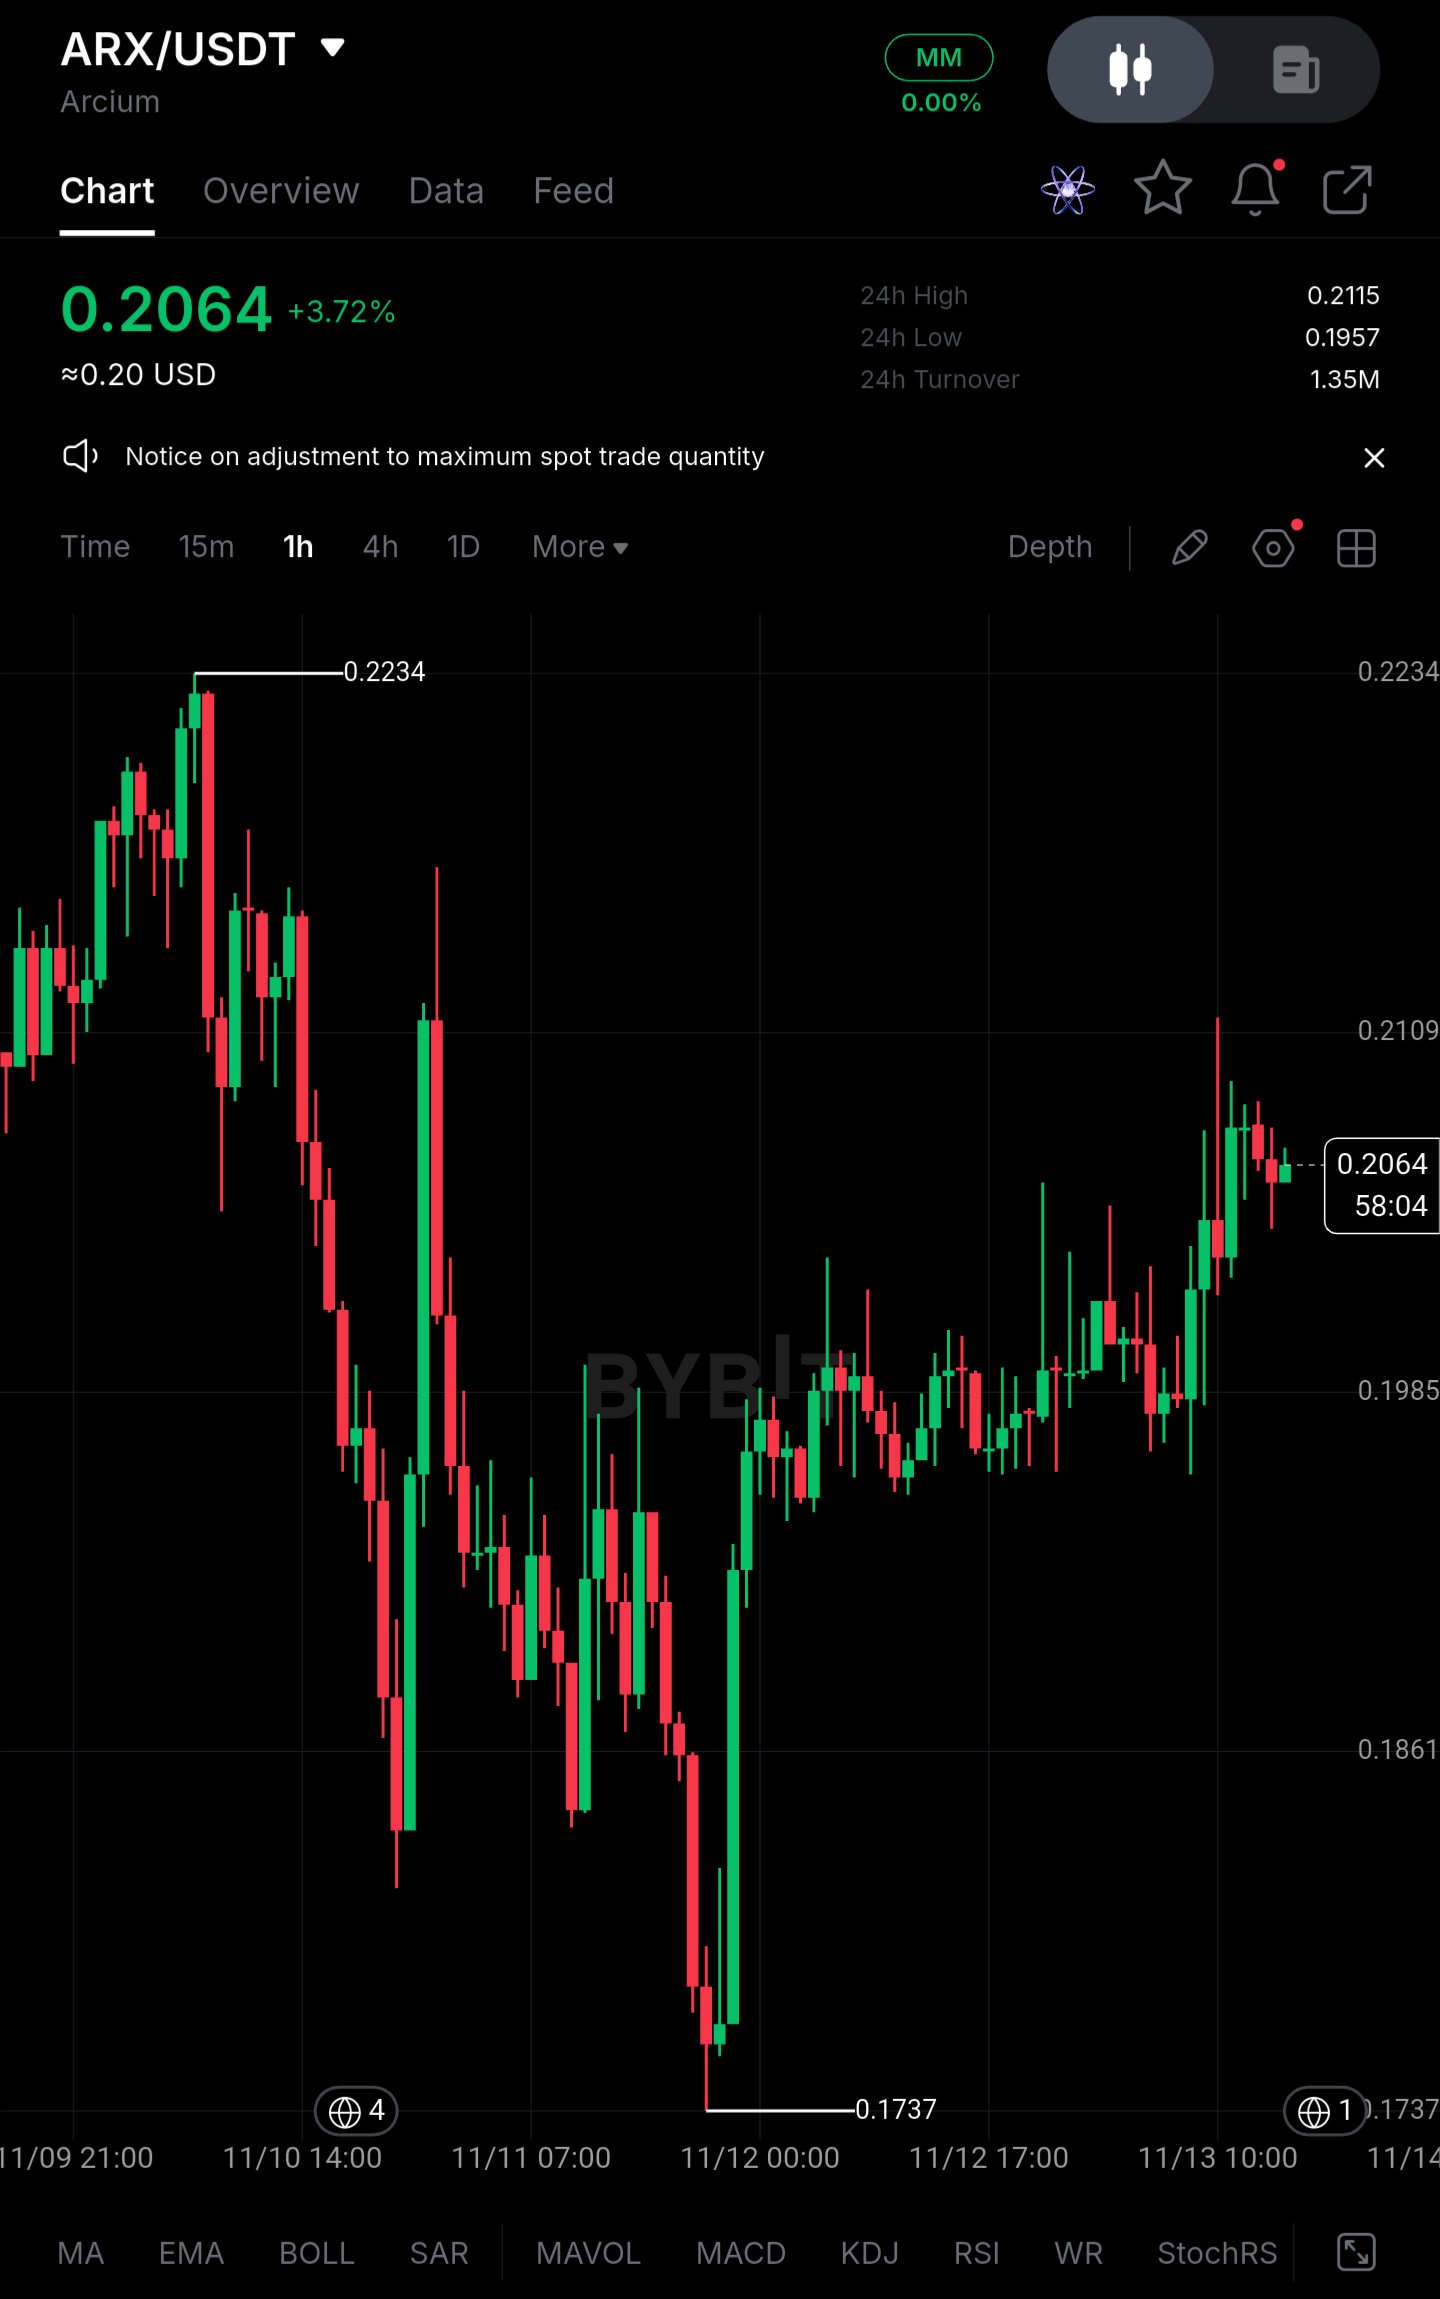
$ARXUSDT : Holding Near $0.206, But This Is Not a Recovery Yet** ARX/USDT is trading near $0.2064 after a sharp drawdown that carried price to $0.1737 on the 1H chart. The current stabilization is not being treated as a recovery. Large-capital selling pressure and a heavily long-tilted derivatives book remain the larger concern, and the bounce has not yet shown the spot demand needed to absorb it. **Price Action** ARX is at $0.2064, up 3.72% on the day, after rebounding roughly 18.8% from the $0.1737 low. That low was set on 11/12 after a steep, near-uninterrupted decline from the $0.2234 swing high, a drop of about 22%. The 24h range is narrow, $0.1957 to $0.2115, on turnover of only 1.35M. - Immediate resistance: $0.2109–$0.2115, which is the 24h high and where the latest wick was rejected - First support: $0.1985–$0.1957, where price based before the latest push higher - A reclaim of $0.2109 would improve short-term structure, but the broader trend remains under pressure, with a lower high still in place against $0.2234. **Large Capital Picture** ARX has no ETF channel, so the read comes from large-wallet and exchange-flow behavior. The V-shaped rebound from $0.1737 was driven by a single large impulse candle, not sustained bidding. The follow-through since is uneven, with alternating green and red candles and several upper wicks near $0.21. That points to inconsistent demand, with larger holders more willing to sell into strength than to accumulate. The sharp 11/11–11/12 flush also has the character of a forced-liquidation event, not orderly distribution. **Liquidity and Range Conditions** Price has compressed into a tight band after the decline. A narrow range following a sharp drop is not evidence of accumulation. Turnover of 1.35M is thin, and a move that is not backed by volume is easily reversed. Stronger spot participation is still needed before this range can be read as a base. **Derivatives Positioning** Exact figures are not visible on the chart, so these are estimates based on price behavior and typical positioning after such a rebound: - Open interest: elevated relative to spot turnover, consistent with leverage rebuilding during the bounce - Funding rate: positive, meaning longs are paying shorts - Long accounts: roughly 60–65% of positioning Positioning has rebuilt on the long side during a low-volume bounce. That creates vulnerability. If $0.1957 fails, stacked long stops and liquidations could accelerate a move back toward the recent low. **Key Figures** - Current price: ~$0.2064 - Immediate resistance: $0.2109–$0.2115 - Support zone: $0.1985–$0.1957 - Recent low: $0.1737 - Swing high: $0.2234 - 24h turnover: 1.35M - Estimated funding: positive - Estimated long share: ~60–65% **Confirmation Levels** - **Bullish:** A sustained hourly close above $0.2115 on rising spot volume would open $0.2234. Even then, the move would only be a recovery attempt, not a trend reversal. - **Bearish:** A close below $0.1957 would expose $0.1861, with $0.1737 as the next liquidity pool, where another sweep becomes likely. **Closing** The current stability is real but temporary. Large-holder selling and crowded long positioning are competing with the recovery attempt, and neither side has shown a decisive edge. The signal that matters is whether spot buyers return while leverage stays controlled, or whether another support breakdown triggers fresh long liquidations. *Not financial advice. Estimated derivatives figures should be verified against live exchange data.* #ByXIMPACT
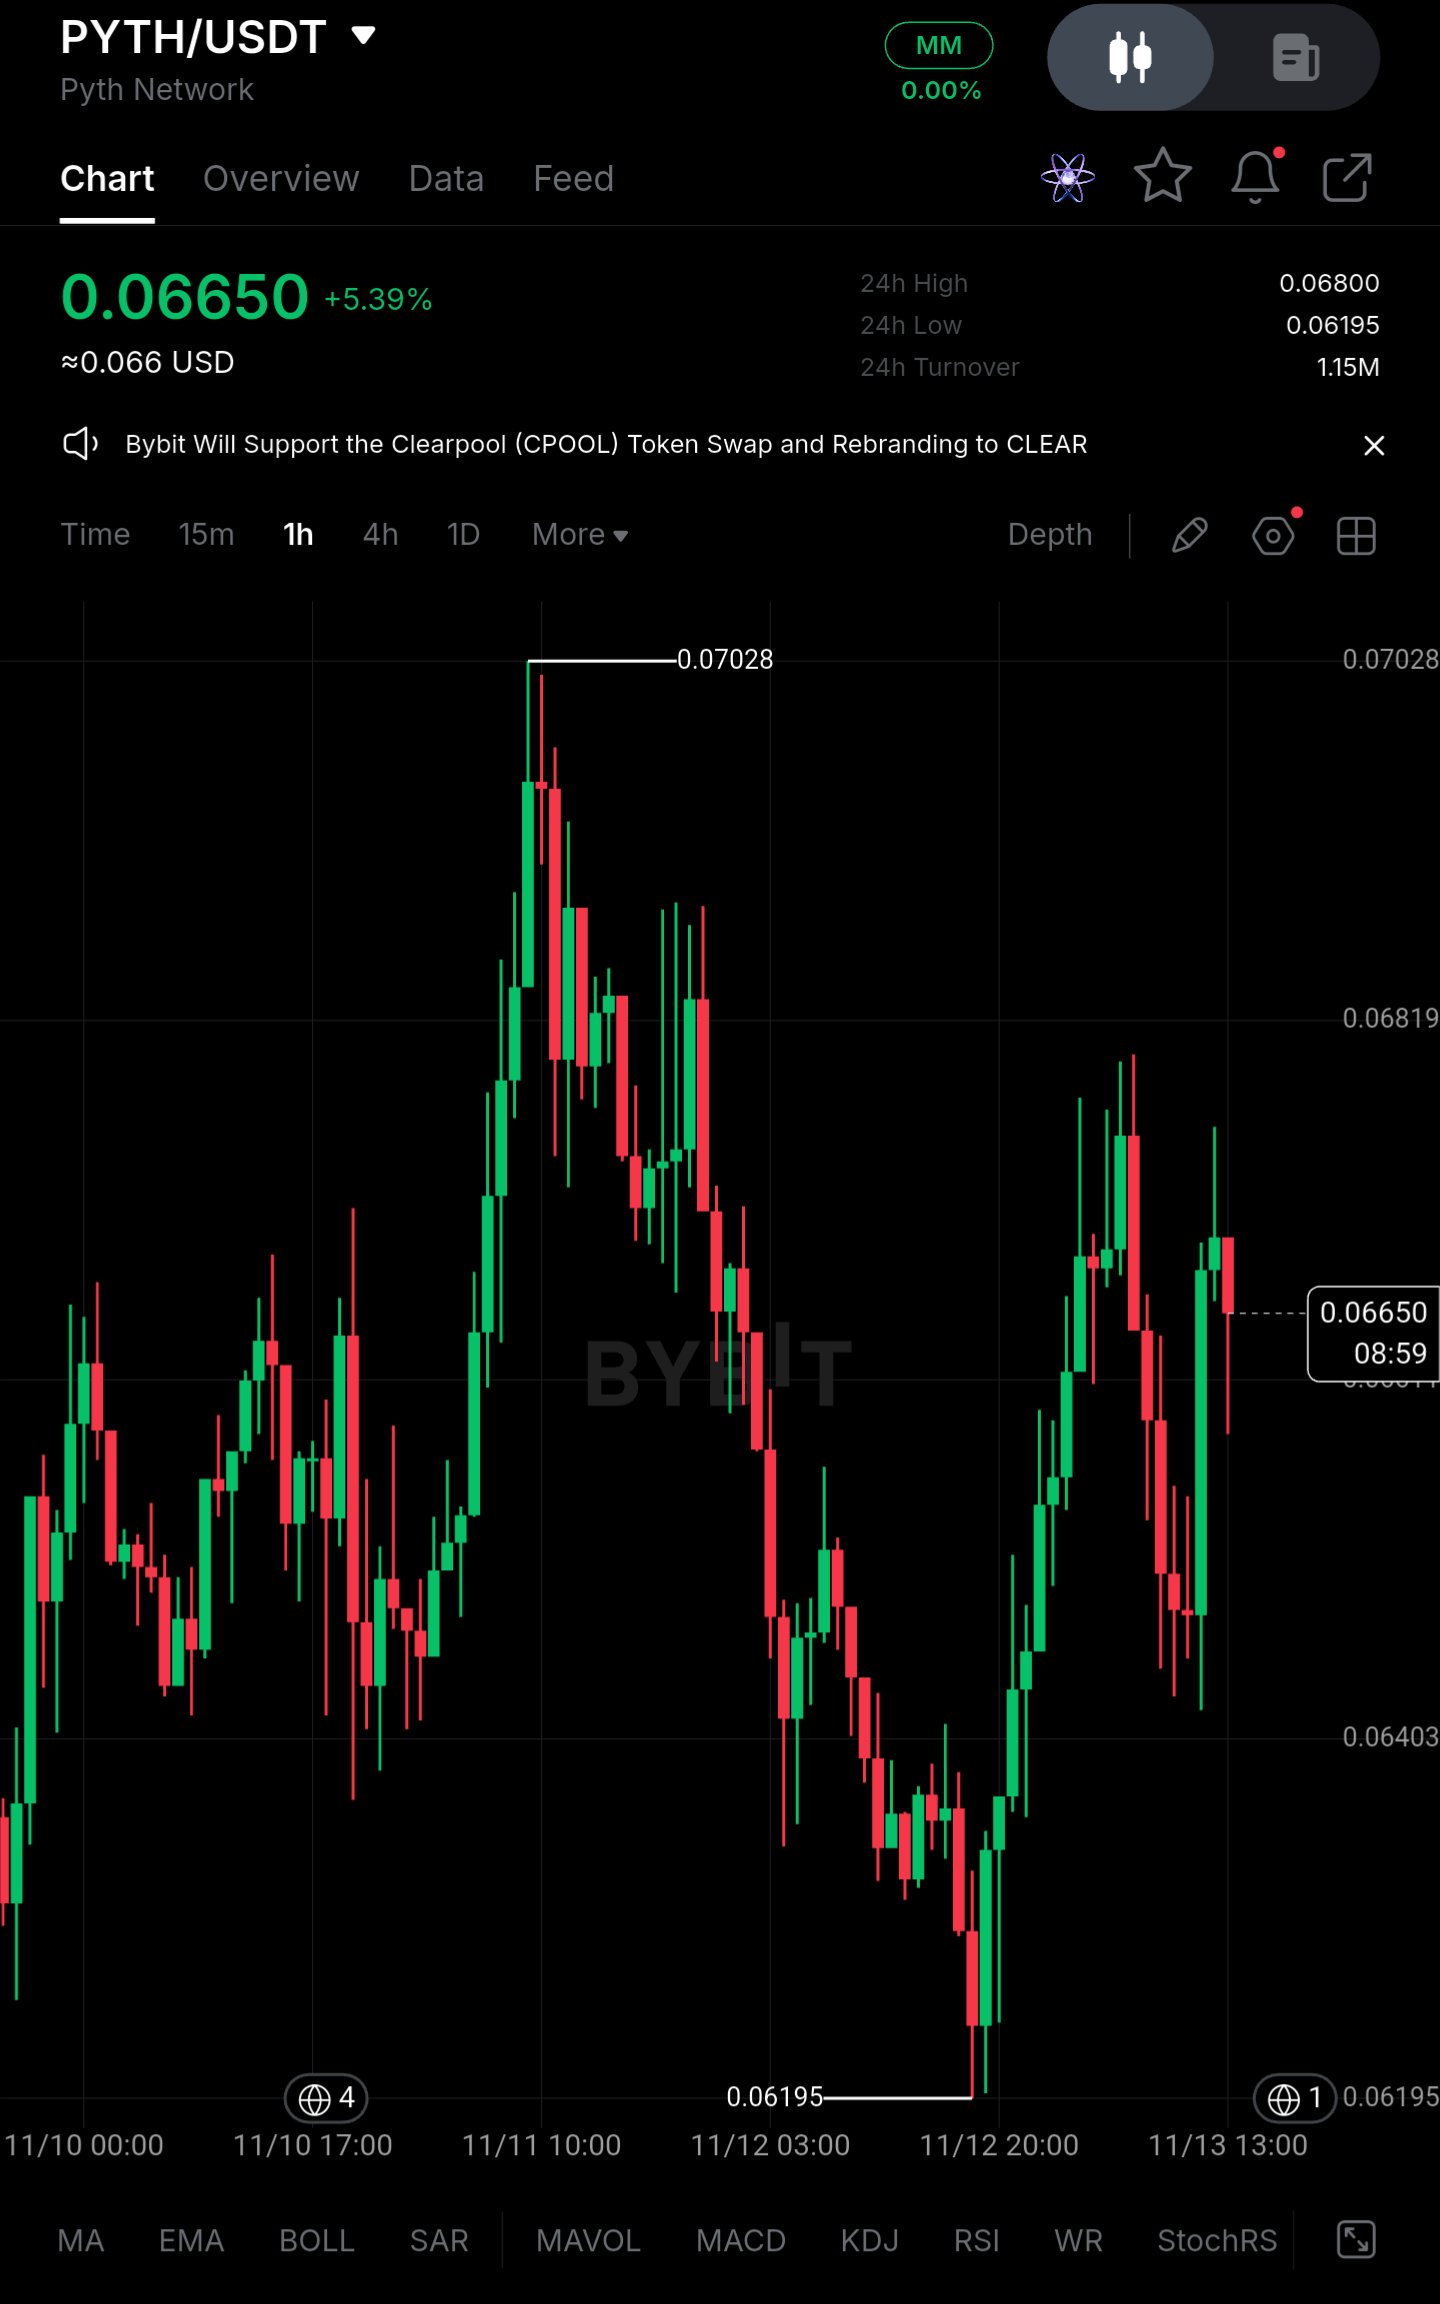
$PYTHUSDT – Higher Timeframe Overview | Long on Pullback** Pair: $PYTHUSDT **Market Observation** PYTH ran up to 0.07028 earlier in the week, then gave most of it back in a steady slide into 0.06195. Since that low, price has recovered in two legs and is now sitting around 0.06650, up about 5% on the day. The recovery looks decent, but it hasn't reclaimed the earlier highs, so I'm treating it as a bounce inside a larger range for now. I missed the first push toward 0.07028, and chasing it after the fact never felt right. The pullback has been more interesting than the breakout. **Current Outlook and Key Levels** **Buying Zone: 0.06195 – 0.06403** The 0.06195 low is the base of the recent selloff, and 0.06403 is the next level above it that the market reacted to. Together they form the area where buyers stepped in after the decline. If price pulls back here, I'd want to see a clear rejection wick or a strong hourly close back above 0.06403 before treating it as a real entry. **Resistance Zone: 0.06800 – 0.06819** The 24h high sits at 0.06800, and 0.06819 is the level just above it. Price was turned back from this area on the latest push, so sellers have already shown up here once. A hourly breakout and sustained consolidation above it would open the way toward 0.07028 and suggest the recovery is more than a bounce. **Trading Setup** **Position:** Long on pullback **Entry Zone:** 0.06195 – 0.06403, only after a visible buyer reaction **Stop-Loss:** Below 0.06195 (hourly close) **Invalidation:** A sustained close under 0.06195 means the recent low has failed. That low is the base of the whole recovery, so losing it would put the lower-low sequence back in control and the idea no longer holds. **Take-Profits:** - TP1: 0.06800 - TP2: 0.06819 - TP3: 0.07028 **Why This Setup Makes Sense** At 0.06650, price is already close to resistance at 0.06800, so a long here offers very little room before sellers show up again. Waiting for a pullback toward the 0.06195 – 0.06403 area gives a better structure: the stop goes just below a low the market has already defended, and the upside to the first target is much larger relative to the risk. TP1 and TP2 sit close together because the 0.06800 – 0.06819 band is one resistance zone, so I'd expect some reaction there and would consider reducing risk. TP3 at 0.07028 is the previous high, and reaching it would likely need a clean break of that band. If price never returns to the buy zone, there's no trade, and that's fine. Missing a move costs less than forcing an entry in the middle of a range. **Risk Management** Respect the stop and size the position so a loss below 0.06195 is acceptable. A recovery can fail, and no setup guarantees a profitable outcome. *Note: the entry zone, stop and targets weren't supplied, so I built them from the levels on your 1h chart (0.06195, 0.06403, 0.06800, 0.06819, 0.07028). Adjust them if you have your own levels, and since the chart is 1h, you may want to change "Higher Timeframe" in the title.* #ByXIMPACT
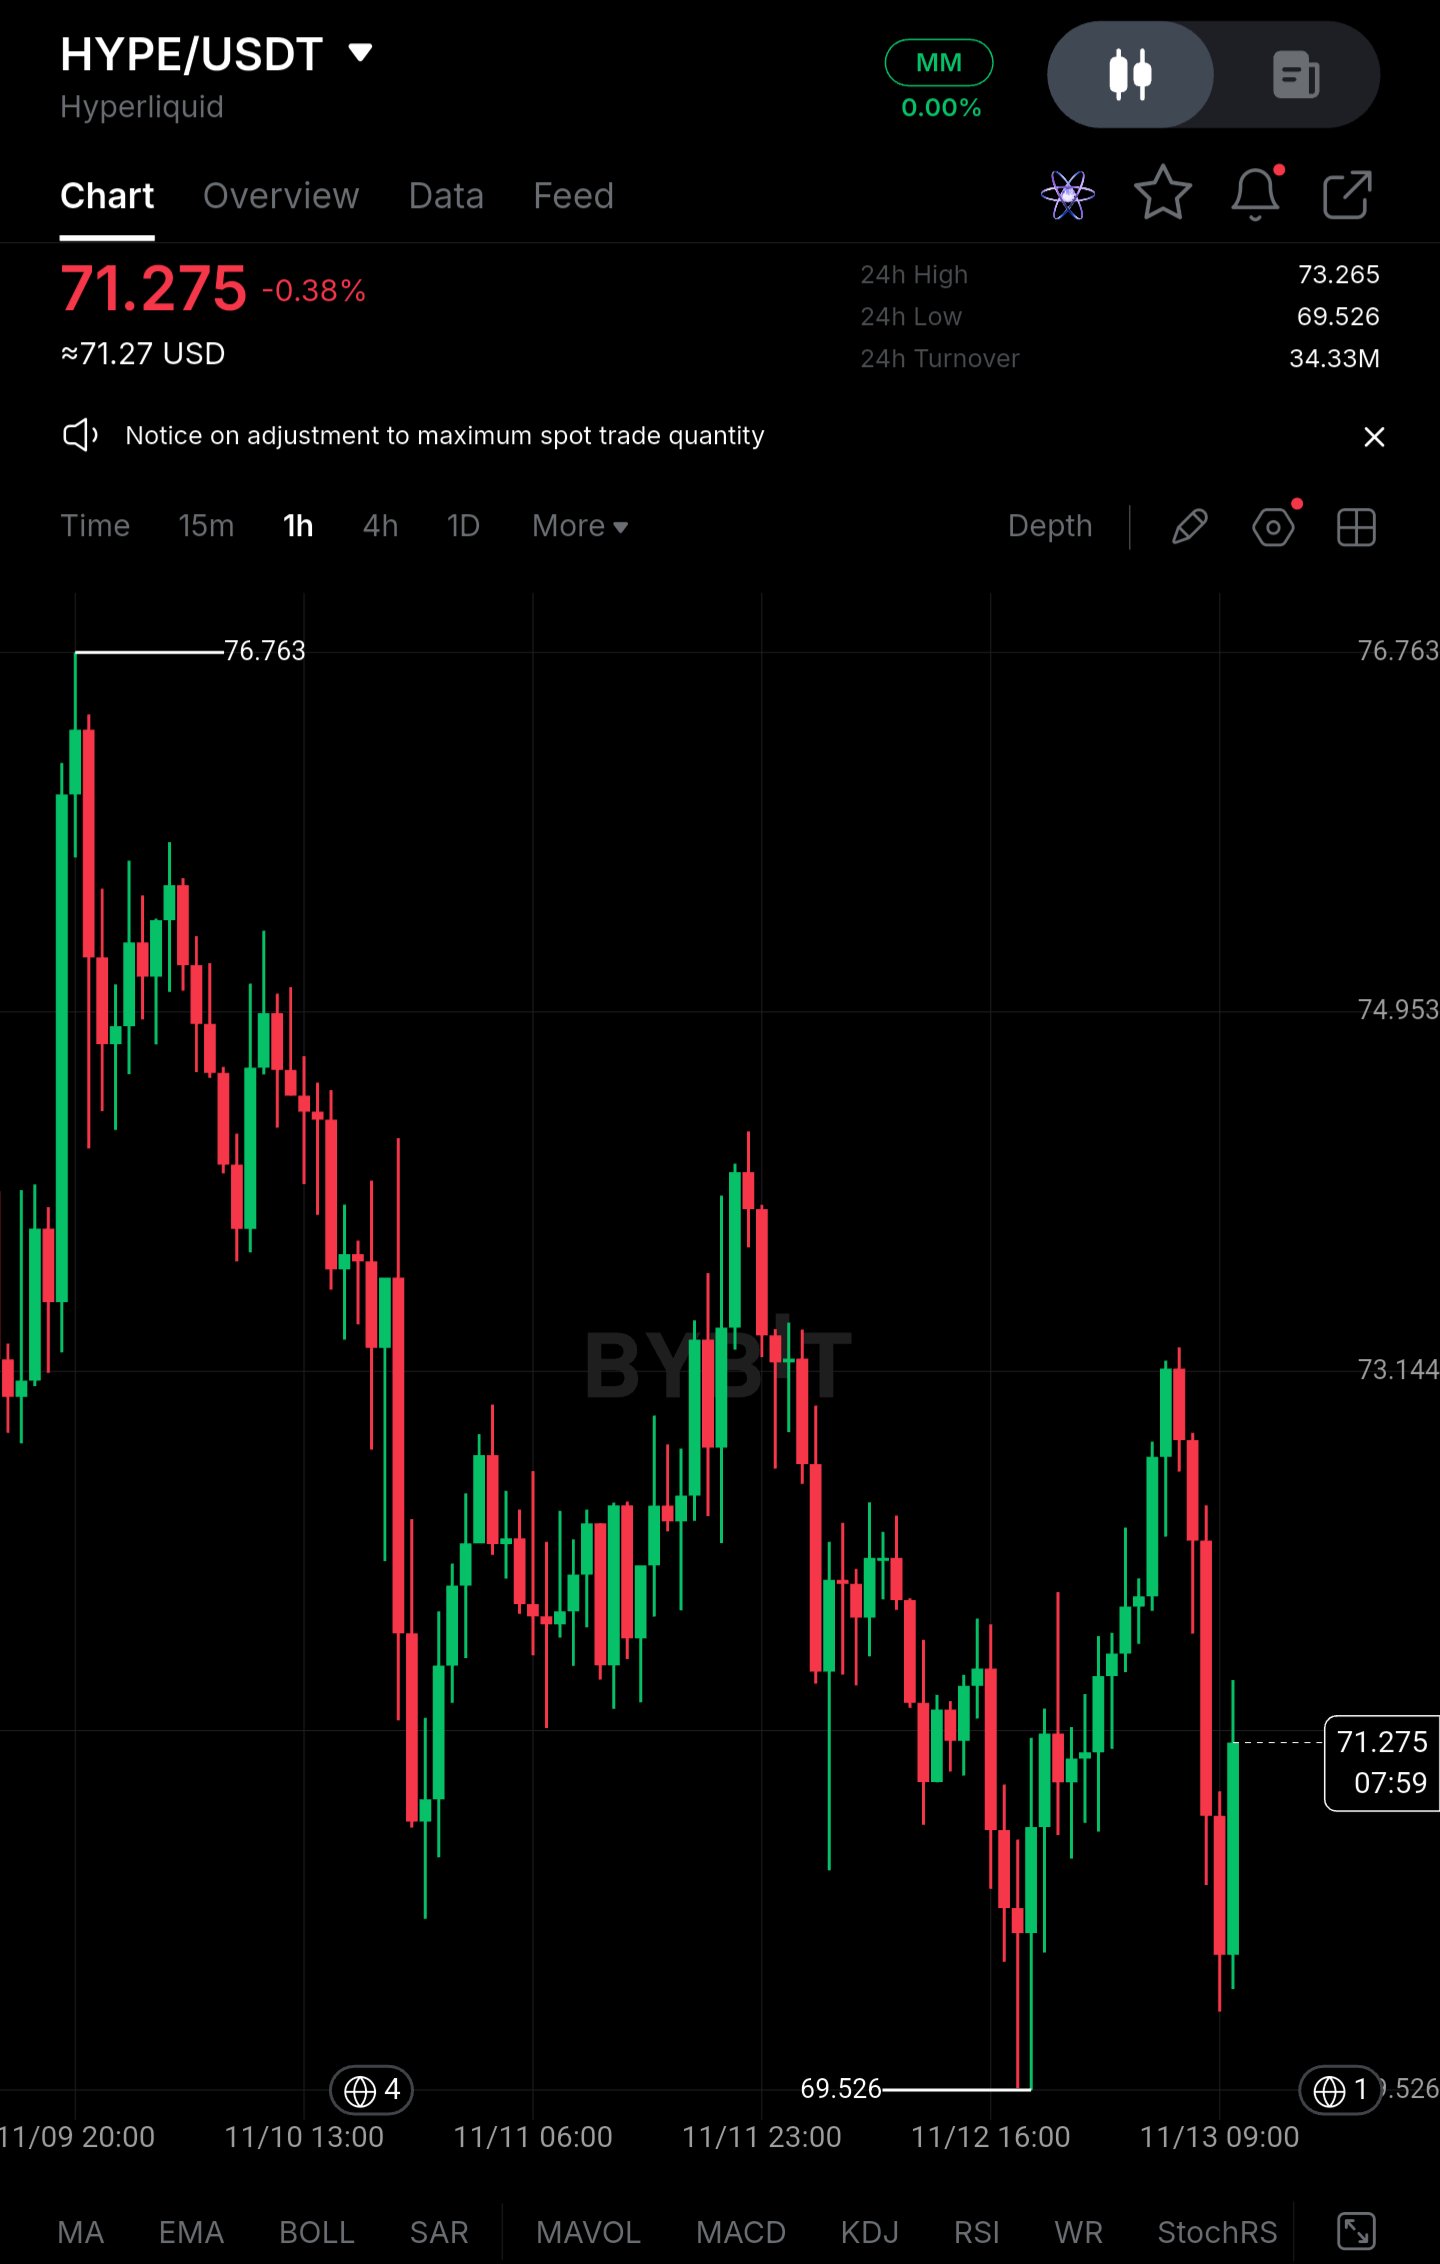
$HYPEUSDT – Resumen de Temporalidad Mayor | Posición larga en retroceso (Long on Pullback)** Par: $HYPEUSDT **Observación del mercado** HYPE ha estado inestable en el gráfico de 1h desde el impulso a 76.763 a principios de la semana. Ese pico se desvaneció en una serie de máximos más bajos (lower highs) y, desde entonces, el precio ha estado rotando dentro de un rango. Ahora se encuentra alrededor de 71.275, aproximadamente en la mitad de ese rango, que no es un punto desde el cual quiera entrar apresuradamente. No aproveché el movimiento alcista hasta 76.763, y estoy bien con eso. La estructura actual es más útil que la ruptura (breakout). **Perspectiva actual y niveles clave** **Zona de compra: alrededor de 69.5 – 70.0** El mínimo de 24h en 69.526 es el piso que los compradores han defendido hasta ahora. El precio tuvo una mecha hacia abajo y se recuperó, lo que muestra que hay demanda ahí. Me gustaría ver otra reacción en esta zona, como una mecha de rechazo pronunciada o un cierre horario verde fuerte, antes de considerarlo como una entrada real. **Zona de resistencia: 73.14 – 73.27** Esta área contiene el máximo de 24h (73.265) y el nivel de 73.144, y el precio ya ha sido rechazado desde ahí una vez. Una ruptura horaria y una consolidación sostenida por encima de esto pondrían de nuevo en juego los niveles de 74.953 y el máximo anterior en 76.763, sugiriendo que la secuencia de máximos más bajos está terminando. **Configuración de trading (Trading Setup)** **Posición:** Larga en retroceso (Long on Pullback) **Zona de entrada:** ~69.5 – 70.0, solo después de una reacción visible de los compradores **Stop-Loss:** Debajo de 69.526 (cierre horario) **Invalidación:** Un cierre sostenido por debajo de 69.526 significa que el piso del rango ha fallado. Los compradores lo defendieron, así que perderlo desplazaría la estructura hacia una continuación bajista y la idea ya no sería válida. **Toma de ganancias (Take-Profits):** - TP1: 73.144 - TP2: 74.953 - TP3: 76.763 **Por qué tiene sentido esta configuración** En 71.275, el mercado se sitúa entre el soporte y la resistencia sin una ventaja clara. Comprar aquí coloca el stop muy lejos, en el mínimo del rango, y deja poco margen antes de la resistencia en 73.1. Esperar un retroceso a 69.5 brinda un stop mucho más ajustado, ya que la invalidación se sitúa justo debajo de un nivel que el mercado ya ha respetado. Los objetivos siguen la estructura. TP1 es la primera resistencia donde el precio ya se detuvo, y TP2 y TP3 son los siguientes niveles en el camino de regreso hacia el máximo de 76.763. Si el precio nunca llega a la zona de compra, no hay operación, y prefiero perdérmela antes que forzar una entrada en medio del rango. **Gestión de riesgos** Respeta el stop y ajusta el tamaño de la posición para que una pérdida en 69.526 sea aceptable. Un piso de rango puede fallar, y ninguna configuración garantiza un resultado rentable. *Nota: la zona de entrada, el stop y los objetivos no fueron proporcionados, así que los construí a partir de los niveles en tu gráfico de 1h (69.526, 73.144, 73.265, 74.953, 76.763). Ajústalos si tienes tus propios niveles, y dado que el gráfico es de 1h, es posible que quieras cambiar "Temporalidad Mayor" en el título.* $ByXIMPACT
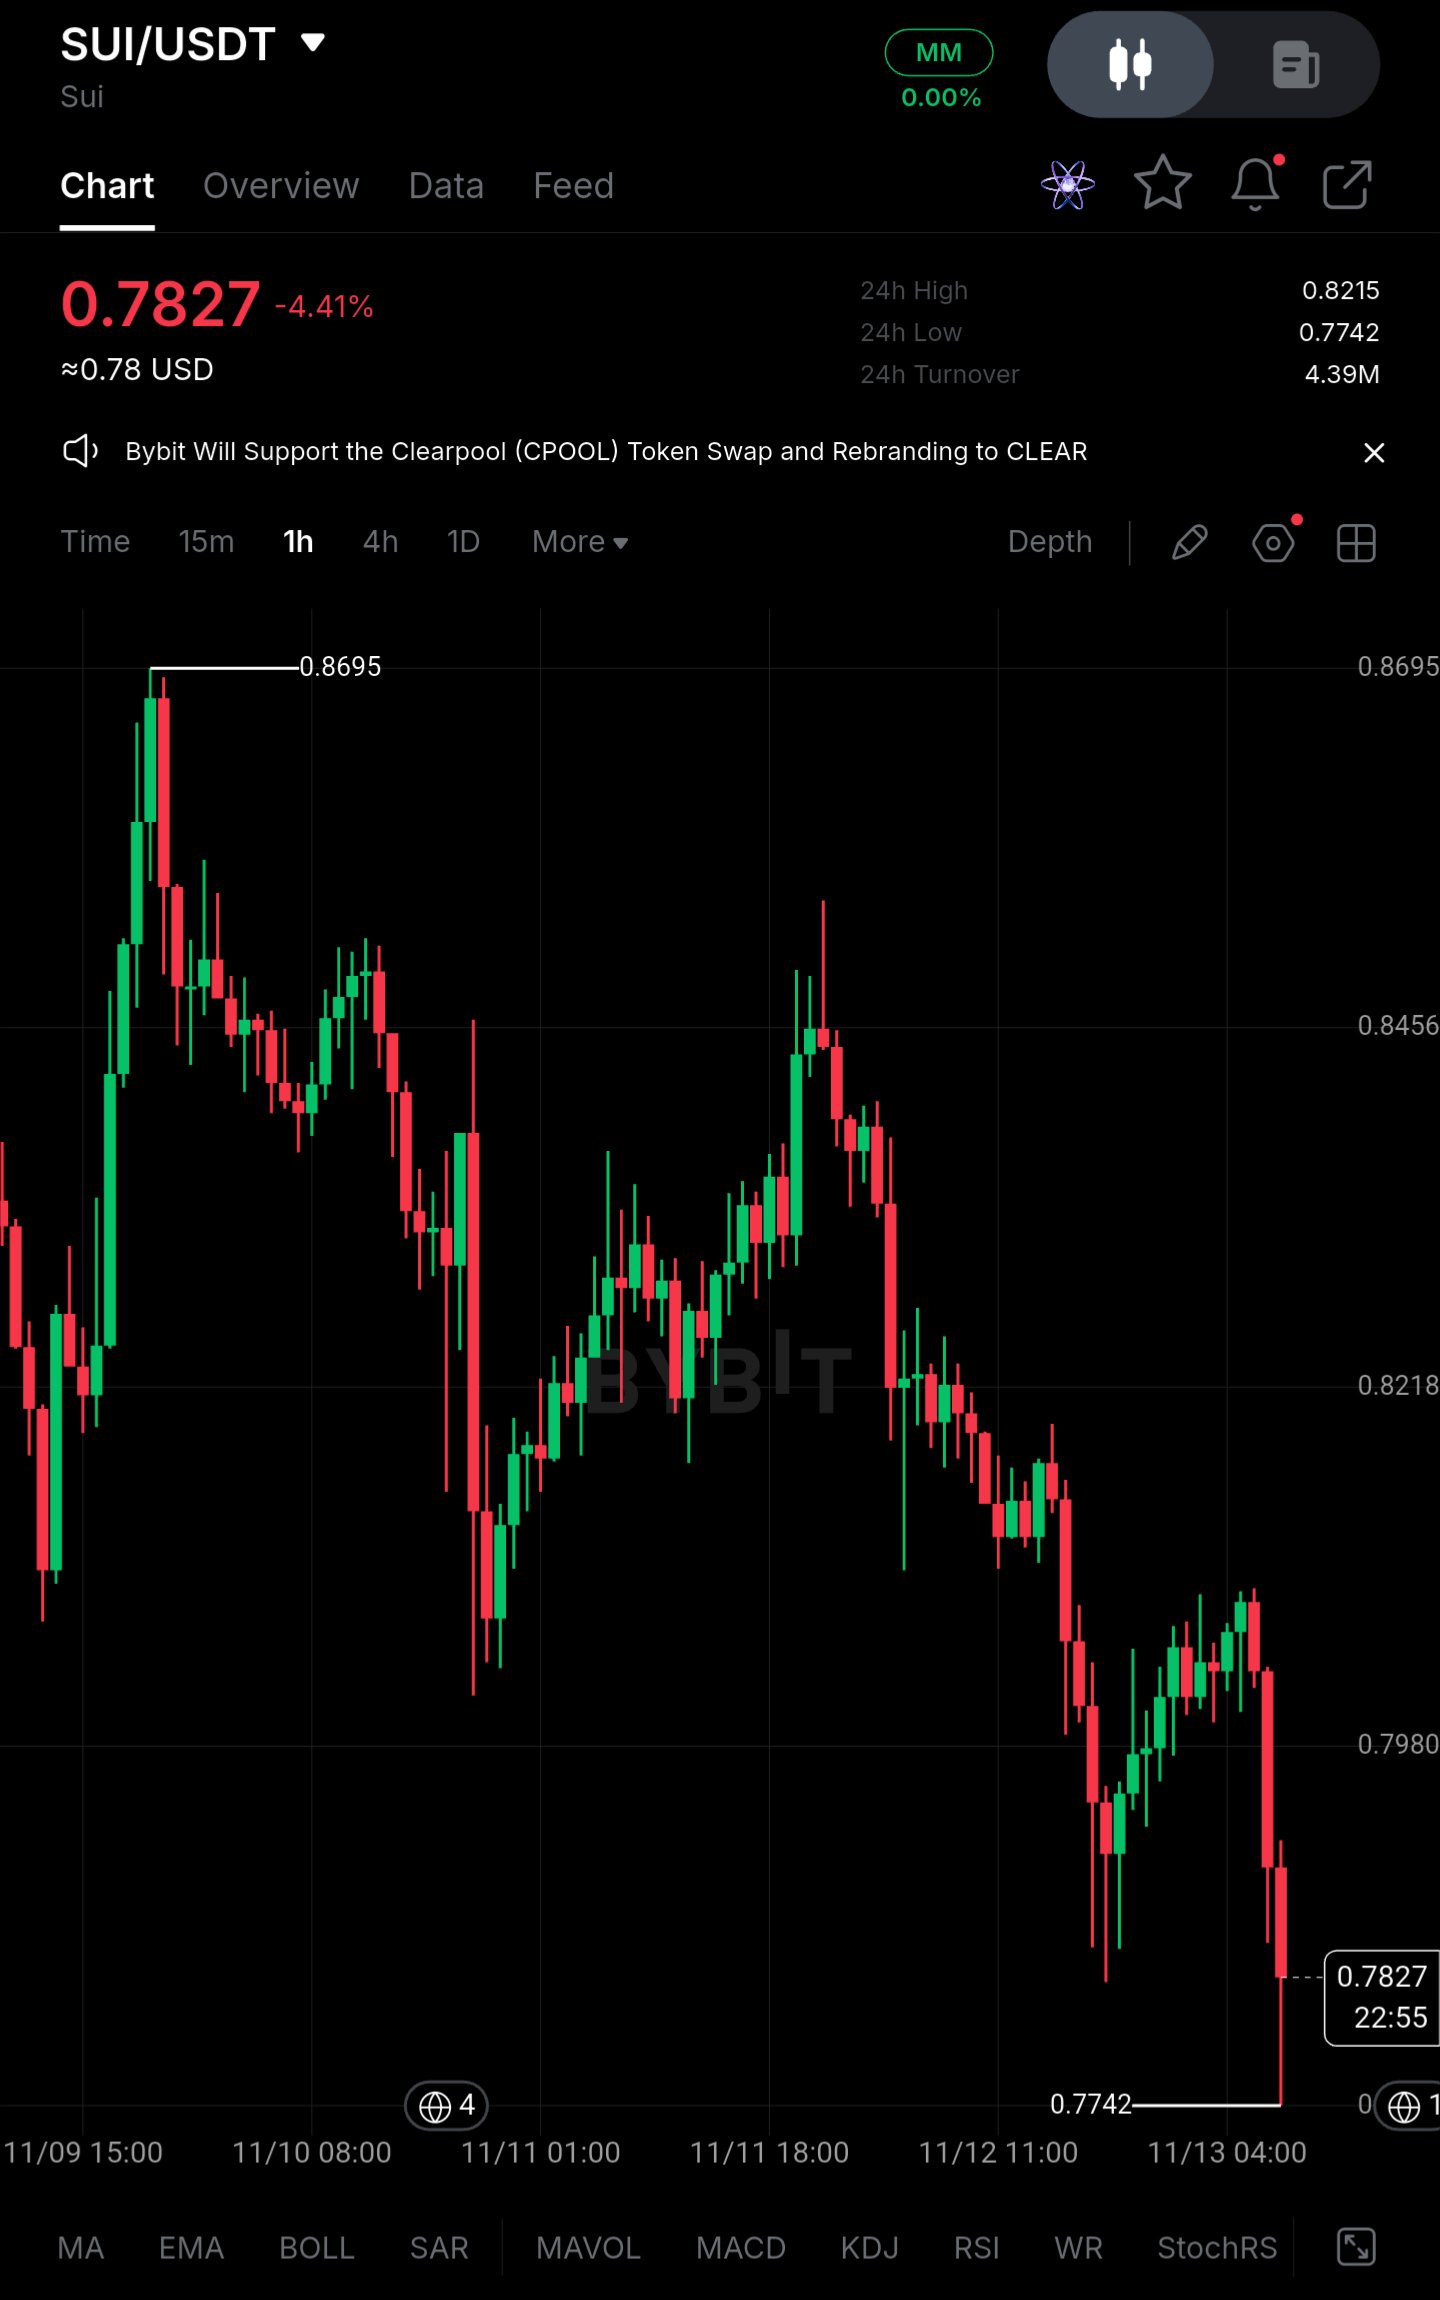
$SUIUSDT Holds Near $0.78 After a Sharp Slide, but This Is Not a Recovery Yet** SUI is trading around $0.7827 after printing a fresh low at $0.7742, down roughly 4.4% on the day. I am not treating the current pause as a recovery. The bigger concern is persistent large-wallet selling pressure combined with derivatives positioning that still leans long. **Price Action** - SUI is at $0.7827, about 10% below the $0.8695 local high from earlier in the week. - The 24h range is $0.7742 to $0.8215, and the latest hourly candles closed near the lows. - Immediate resistance sits at $0.7980, then $0.8215–$0.8218, where the late-session breakdown began. - First support is the $0.7742 low. A reclaim of $0.8218 would improve short-term structure, but the broader trend of lower highs from $0.8695 stays intact. **Large Capital Picture** Demand has been inconsistent. Each rally this week was met with heavy supply, and the breakdown from $0.84 was fast and one-directional. That pattern points to large holders and short-term funds using strength to reduce exposure rather than accumulate. Spot turnover of about 4.39M over 24 hours is not enough to show that dip buyers are absorbing this supply. **Liquidity and Range Conditions** Price is compressing just above the low after an impulsive leg down. A tight range after a drop is not evidence of accumulation. It usually means sellers are pausing, not that buyers have taken control. Real spot participation, with rising volume on up-moves and shallow pullbacks, is still missing. **Derivatives Positioning** Based on current chart behavior, positioning still looks long-tilted: - Open interest has held elevated despite the decline, which suggests leveraged longs have not been fully flushed. - Funding is estimated to be slightly positive, meaning longs are still paying shorts to hold. - Roughly 55–60% of positions are estimated to be long. This is a vulnerability. If $0.7742 breaks, forced long liquidations could accelerate the move well beyond what spot selling alone would produce. **Key Figures (derivatives values are approximate estimates)** - Current price: $0.7827 - Immediate resistance: $0.7980, then $0.8215–$0.8218 - Support: $0.7742 - Recent swing high: $0.8695 - Open interest: elevated, with no meaningful deleveraging - Funding: slightly positive - Long share: ~55–60% **Confirmation Levels** - **Bullish:** an hourly close above $0.8218 with rising spot volume would open $0.8456 and begin to repair the lower-high structure. - **Bearish:** a clean hourly close below $0.7742 exposes the $0.75 area, with $0.72 next if long liquidations cascade. **Closing** The stability near $0.78 is real, but it is temporary until proven otherwise. Large-holder selling and crowded long positioning are working against this recovery attempt. The decisive signal is whether spot buyers return while leverage stays controlled, or whether another breakdown of support triggers fresh long liquidations. #ByXIMPACT
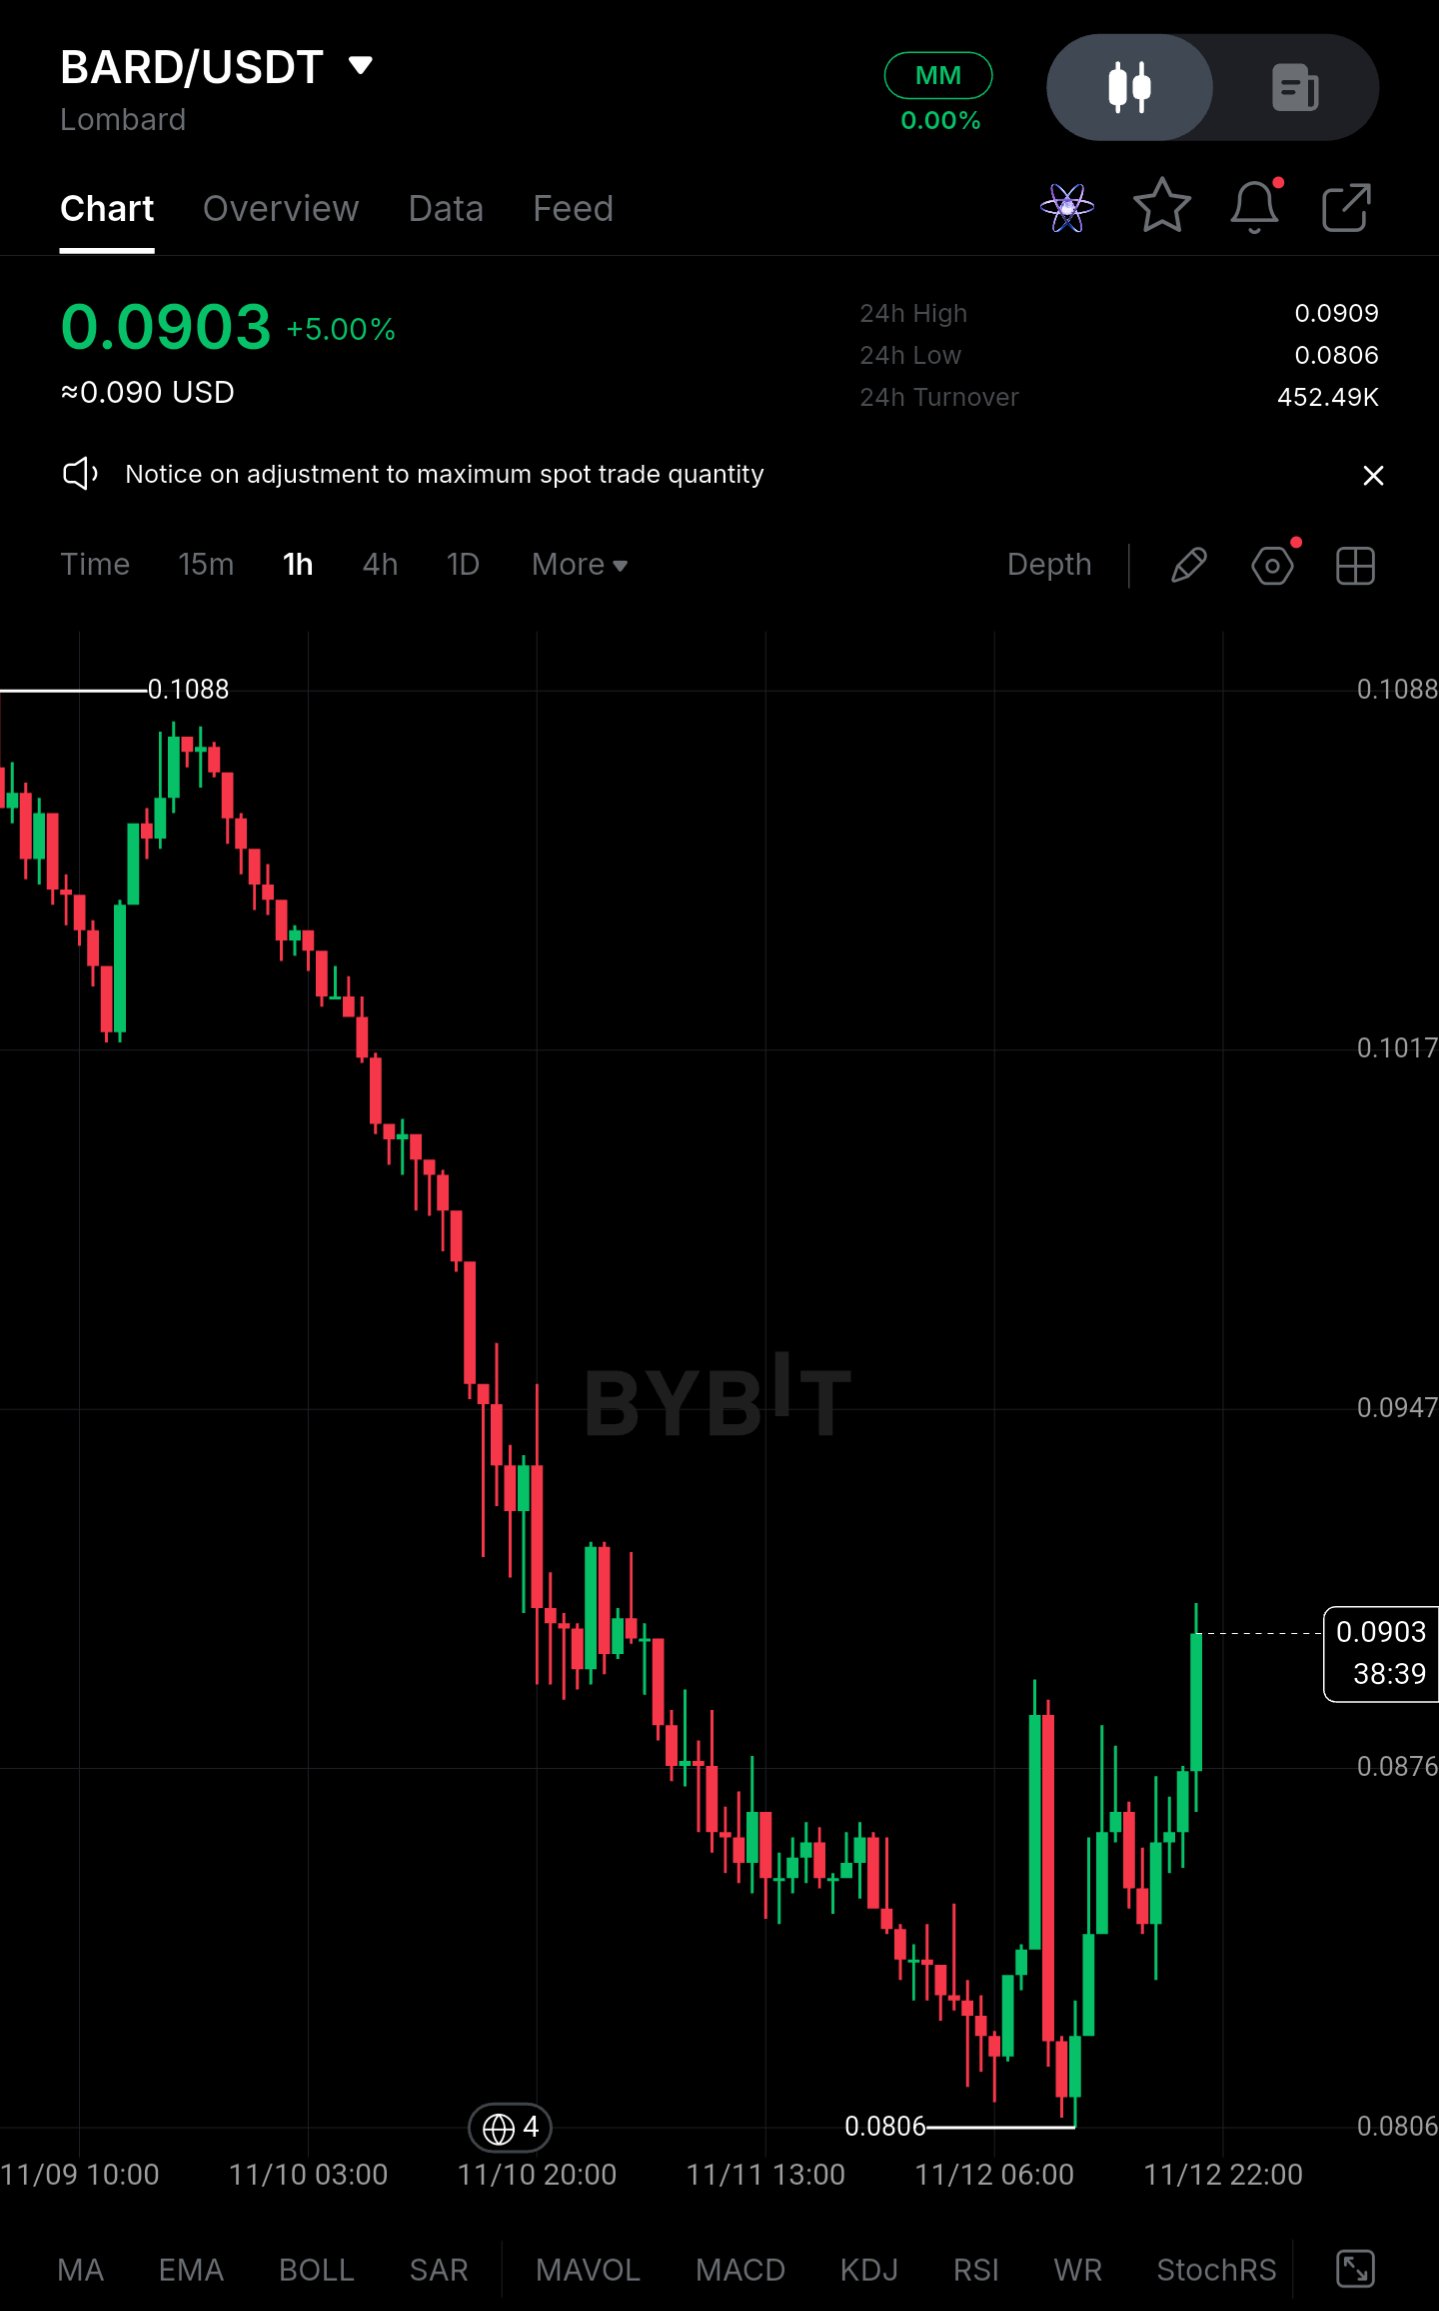
$BARDUSDT Market Analysis: Bounce Under Pressure, Not a Recovery** BARD is trading near 0.0903 after a sharp decline from the 0.1088 high to a recent low of 0.0806. I am not treating the current stabilization as a recovery. The larger concern is persistent large-holder selling combined with derivatives positioning that has stayed long-tilted through the drop. **Price Action** - Current price: 0.0903, up about 5% on the day - Recent low: 0.0806, roughly 26% below the 0.1088 high - Bounce off the low: about 12% - 24h range: 0.0806 to 0.0909, so price is pressing the top of its daily range - Immediate resistance: 0.0909, then 0.0947 - First support: 0.0876 Reclaiming 0.0947 would be the first sign of a shift in structure, but the broader trend is still lower highs and lower lows, so the move reads as a relief bounce inside a downtrend. **Large Capital Picture** For a mid-cap DeFi asset like BARD, the relevant signals are large-wallet distribution and exchange inflows rather than ETF flows. The descent from 0.1088 was steady, with consecutive red candles and few meaningful pauses, which is more consistent with sustained supply than a single liquidation event. Rebound volume has been uneven, and 24h turnover of about 452K is thin for a recovery claim. Demand is inconsistent: buyers appear near 0.0806 but fade quickly into resistance. **Liquidity & Range Conditions** Price has held in a contained band since the low, roughly 0.0806 to 0.0909. A narrow range after a sharp decline is not evidence of accumulation. It can just as easily reflect sellers pausing before another leg. Stronger spot participation is still needed to prove otherwise, and the lack of follow-through above 0.0909 suggests it is not here yet. **Derivatives Positioning** *Figures below are estimates inferred from price behavior and typical positioning for this asset, not live data. Verify against current exchange data before acting.* - Open interest: modestly elevated relative to spot turnover - Funding rate: positive (around +0.01%), so longs are paying shorts - Long accounts: roughly 55–60% of positions The bounce has not forced leverage out. Positive funding and a long-tilted book mean many participants are positioned for recovery before spot demand confirms it. If support breaks, that positioning becomes a vulnerability and could accelerate a fresh round of long liquidations. **Key Figures** - Current price area: 0.0903 - Immediate resistance: 0.0909 to 0.0947 - Higher resistance: 0.1017 - First support: 0.0876 - Major support / recent low: 0.0806 - 24h turnover: ~452K - Funding: positive (est.) - Long share: ~55–60% (est.) **Confirmation Levels** - **Bullish:** A sustained hourly close above 0.0947 with rising spot volume would open a move toward 0.1017. Without volume, a push above it is suspect. - **Bearish:** A hourly close below 0.0876 exposes a retest of 0.0806. A break below that low would confirm trend continuation and likely trigger long liquidations. **Closing** The current stability is real but temporary. Large-holder selling and crowded long positioning are competing with the recovery attempt. The decisive signal is whether spot buyers return while leverage stays controlled, or whether another support breakdown triggers fresh long liquidations. Until spot demand proves it can absorb supply, caution remains warranted. *Not financial advice.* #ByXIMPACT
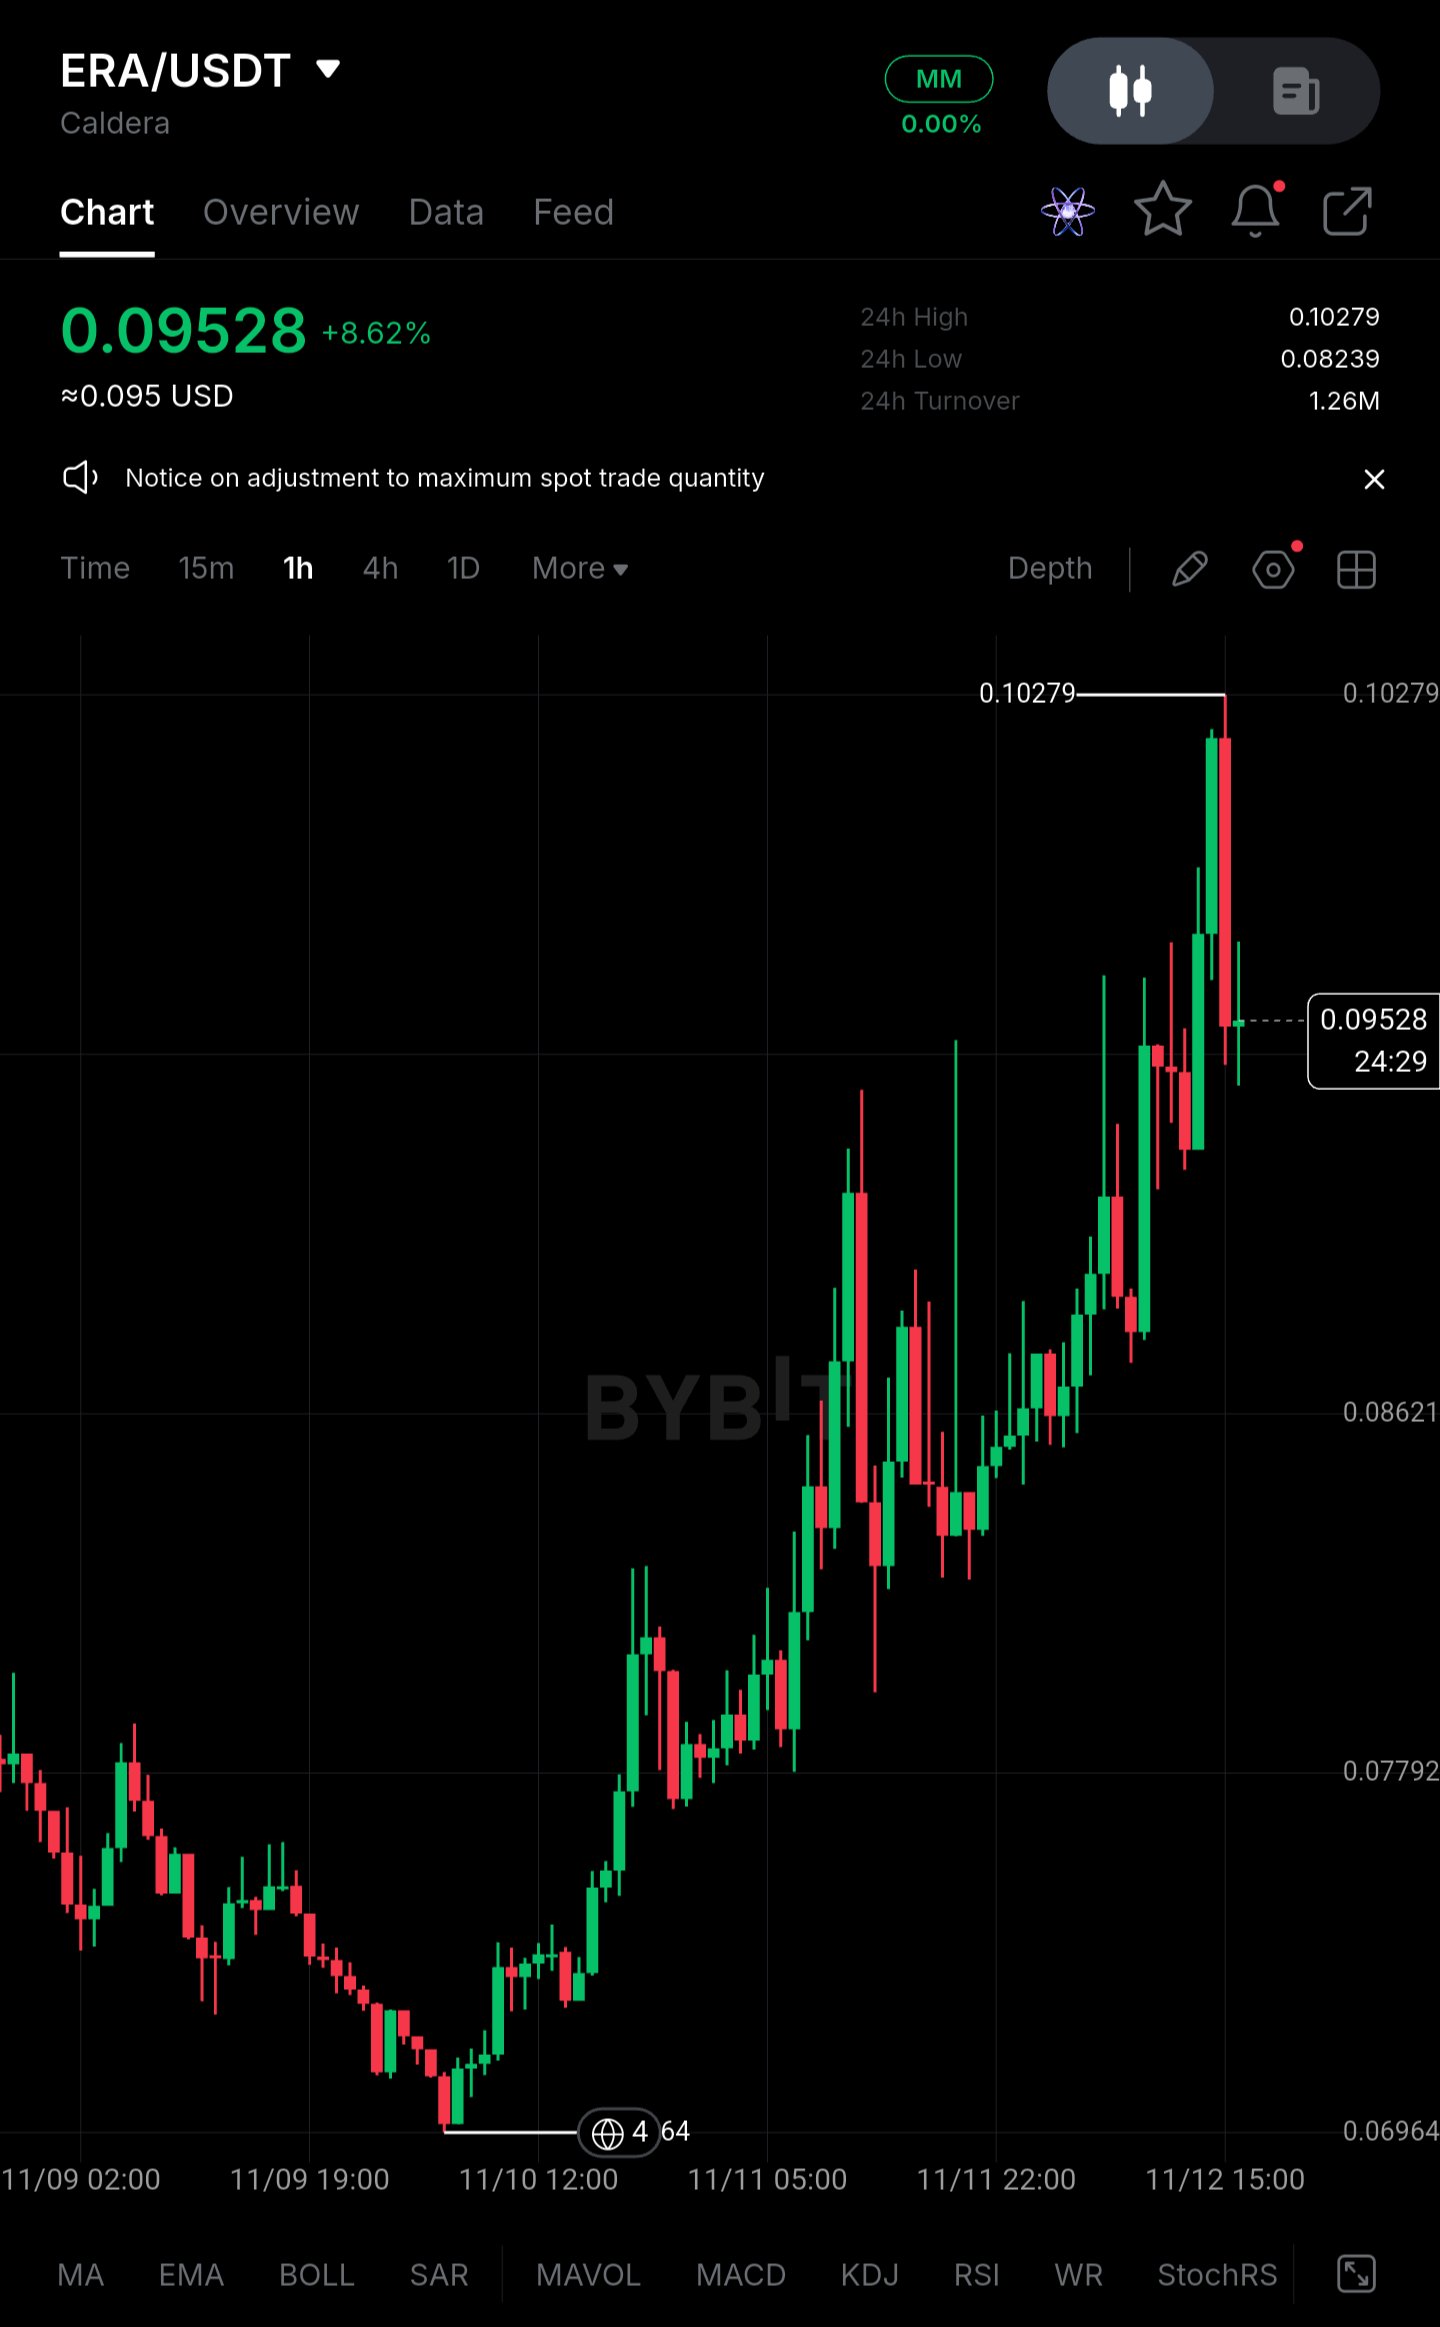
$ERAUSDT – Higher Timeframe Overview | Long on Pullback** Pair: $ERAUSDT (1H chart, Bybit) After a steady slide into the 0.0696 area, ERA has turned around and climbed almost without pausing. Price is now around 0.0953, up roughly 8.6% on the day, after tagging 0.10279. That high was rejected quickly, with a long upper wick and a red candle right under it. I didn't catch the bottom, so I'm not interested in chasing the top of this move either. **Current Outlook and Key Levels** **Buying Zone: 0.0824 – 0.0862** The 24h low sits at 0.0824, and 0.0862 is where the chart shows an earlier reaction level. Together they form a pullback area where the previous leg up was built. I'd want to see price slow down here, hold the zone, and print a higher low with buyers stepping back in. A single touch isn't enough. **Resistance Zone: around 0.1028** This is the 24h high, where the most recent push was rejected hard. Sellers are likely to defend it again. A clean break and sustained consolidation above it would show the trend can continue and turn the level into support. A quick wick above that gets sold straight back is not a breakout. **Trading Setup** **Position:** Long on pullback **Entry Zone:** 0.0824 – 0.0862, only after a visible buyer reaction **Stop-Loss:** Below 0.0824 (a close under the 24h low) **Invalidation:** If price loses 0.0824 and holds below it, the higher-low structure is broken and the bounce from 0.0696 looks more like a relief move. Below that, the next visible reference is 0.0779. **Take-Profits:** - TP1: 0.0953 (the current price area, for partial profits) - TP2: 0.1028 (24h high, the main resistance) - TP3: Not defined. There is no marked structure above the high, so I'd reassess after a confirmed breakout. **Why This Setup Makes Sense** ERA has moved from about 0.0696 to 0.1028 in a short stretch, and the last candles show sellers reacting near the top. Buying there means entering late, with a tight upside to the high and a distant invalidation. A pullback into 0.0824–0.0862 gives a much better structure. The stop can sit just below the 24h low, and the first two targets sit at levels the chart already shows. If buyers don't defend the zone, I simply don't enter. A zone is only a place to watch, and the entry needs confirmation. **Risk Management** Respect the stop and don't move it once you're in. Size the position so a loss at the stop is acceptable. A bullish structure can fail, and no setup guarantees a profit. This is a trade plan, not financial advice. #ByXIMPACT
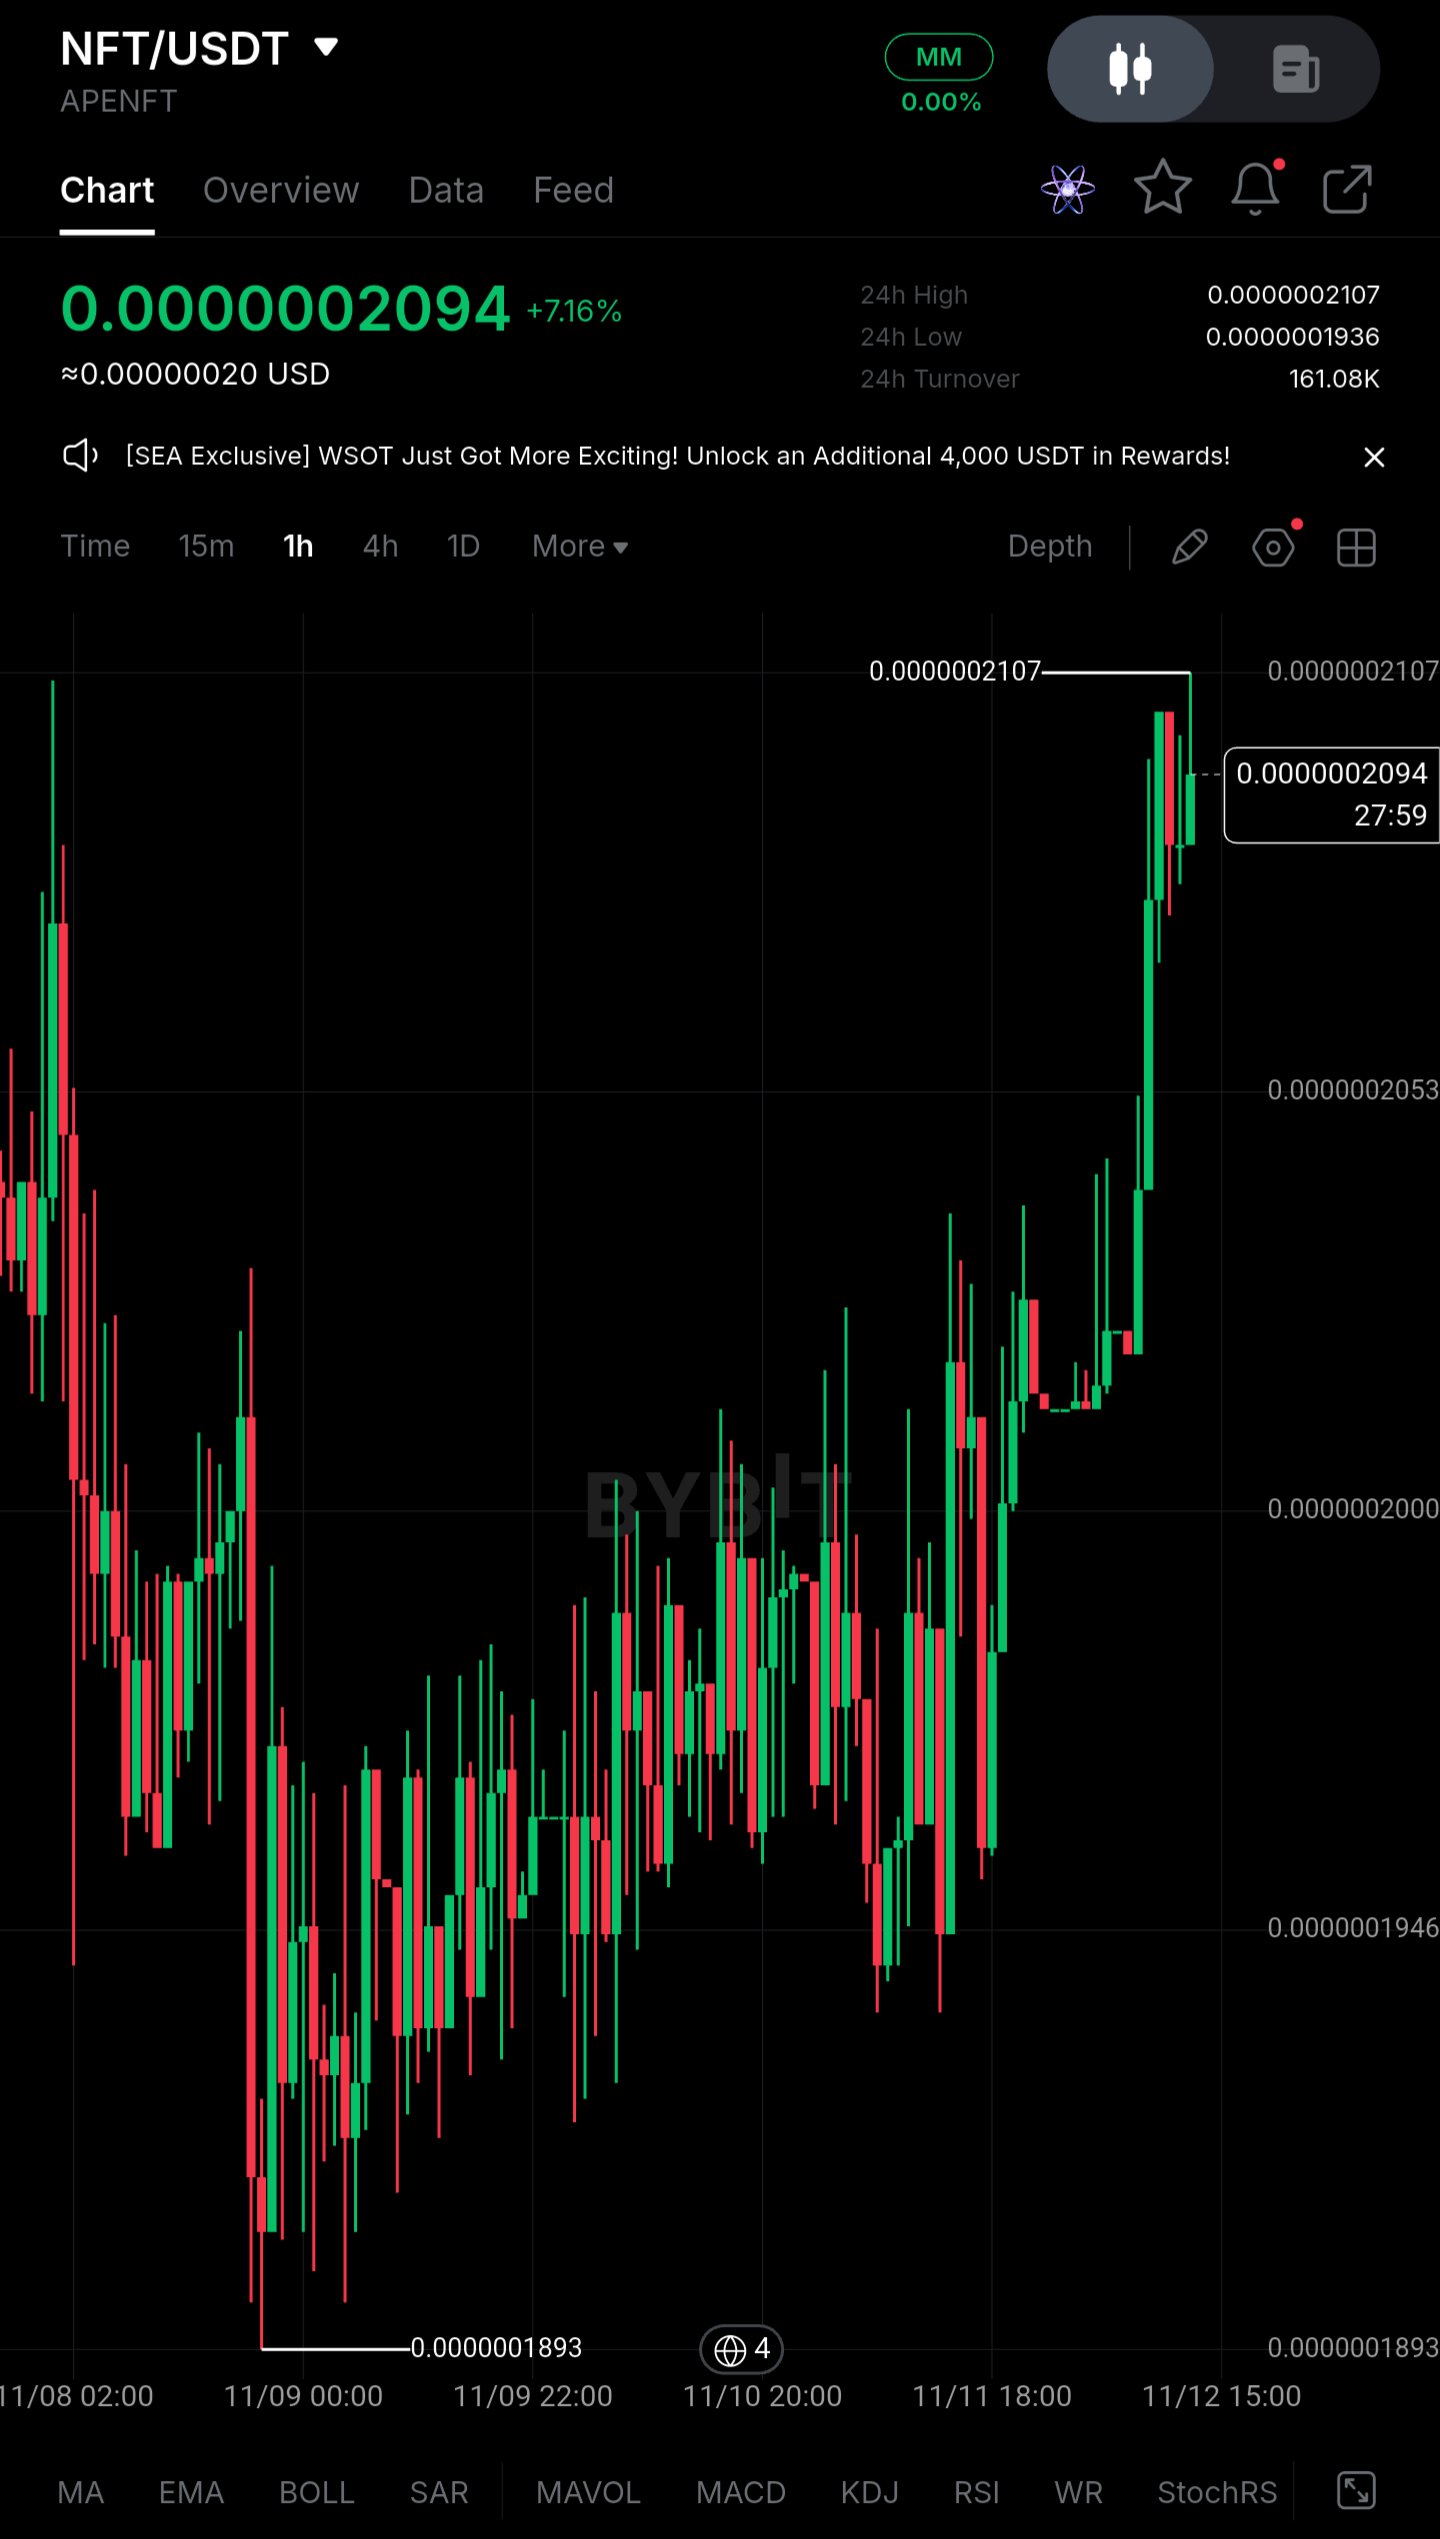
$NFTUSDT – Higher Timeframe Overview | Long on Pullback** Pair: $NFTUSDT (APENFT) NFT has been working its way higher on the 1h chart after printing a low at 0.0000001893 on 9 November. The days after that were choppy, with overlapping candles and long wicks both ways, but the lows kept getting a little higher. Today price finally pushed out of that range, and it now sits at 0.0000002094, up about 7% on the day. I didn't get involved during the base-building phase, and I'd rather wait than chase this move. **Current Outlook and Key Levels** *Buying Zone: 0.0000002000 – 0.0000002053* This area was the upper part of the recent range, where price stalled and moved sideways just before the breakout candle. Old resistance that has been broken often gets retested as support. I'd want to see buyers defend it with a visible reaction, such as a rejection wick or a strong hourly close back up. A slow bleed through the zone with no response would not count as a confirmation. *Resistance Zone: 0.0000002107* This is the 24h high, and price is only about 0.6% below it. The last candles show small bodies and upper wicks, so sellers are active. A clean break and a few hourly closes above it would suggest the range has turned into a higher base. That would be the first real sign of structural strength, though not a guarantee of continuation. **Trading Setup** - **Position:** Long on pullback - **Entry Zone:** 0.0000002000 – 0.0000002053 (only after buyer confirmation) - **Stop-Loss:** 0.0000001946 - **Invalidation:** A sustained hourly close below 0.0000001946 means price has fallen back into the old range. The breakout would then look like a failed push, and the idea is off. - **TP1:** 0.0000002107 (24h high) - **TP2:** A move beyond 0.0000002107 would mean price is trading above all levels visible on this chart. I have no verified level there, so I'd trail the stop on structure instead of setting a fixed target. TP1 alone doesn't pay well against this stop. Most of the reward would have to come from a continuation above the high, so I'd take partial profit at TP1 and manage the rest with a trailing stop. **Why This Setup Makes Sense** Buying right under 0.0000002107 after a vertical move leaves little room above and a lot of room below. If the move fades, price can drop back to the 0.0000002000 area quickly. Waiting for the pullback puts the entry closer to a level that has already been tested, and it gives me a clear point where the idea is wrong. The stop below 0.0000001946 sits under the recent higher lows, so it only triggers if the structure actually breaks. The wide stop also means a smaller position size. If price never pulls back and simply breaks higher, I'm fine missing it. Turnover is only about 161K over 24 hours, so this is a thin market, and the extra patience costs very little. **Risk Management** Stick to the plan and don't move the stop once you're in. Size the position so a stop-out is an acceptable loss, especially in a market this thin. A bullish structure can fail, and no setup guarantees a profit. *Not financial advice.* #ByXIMPACT
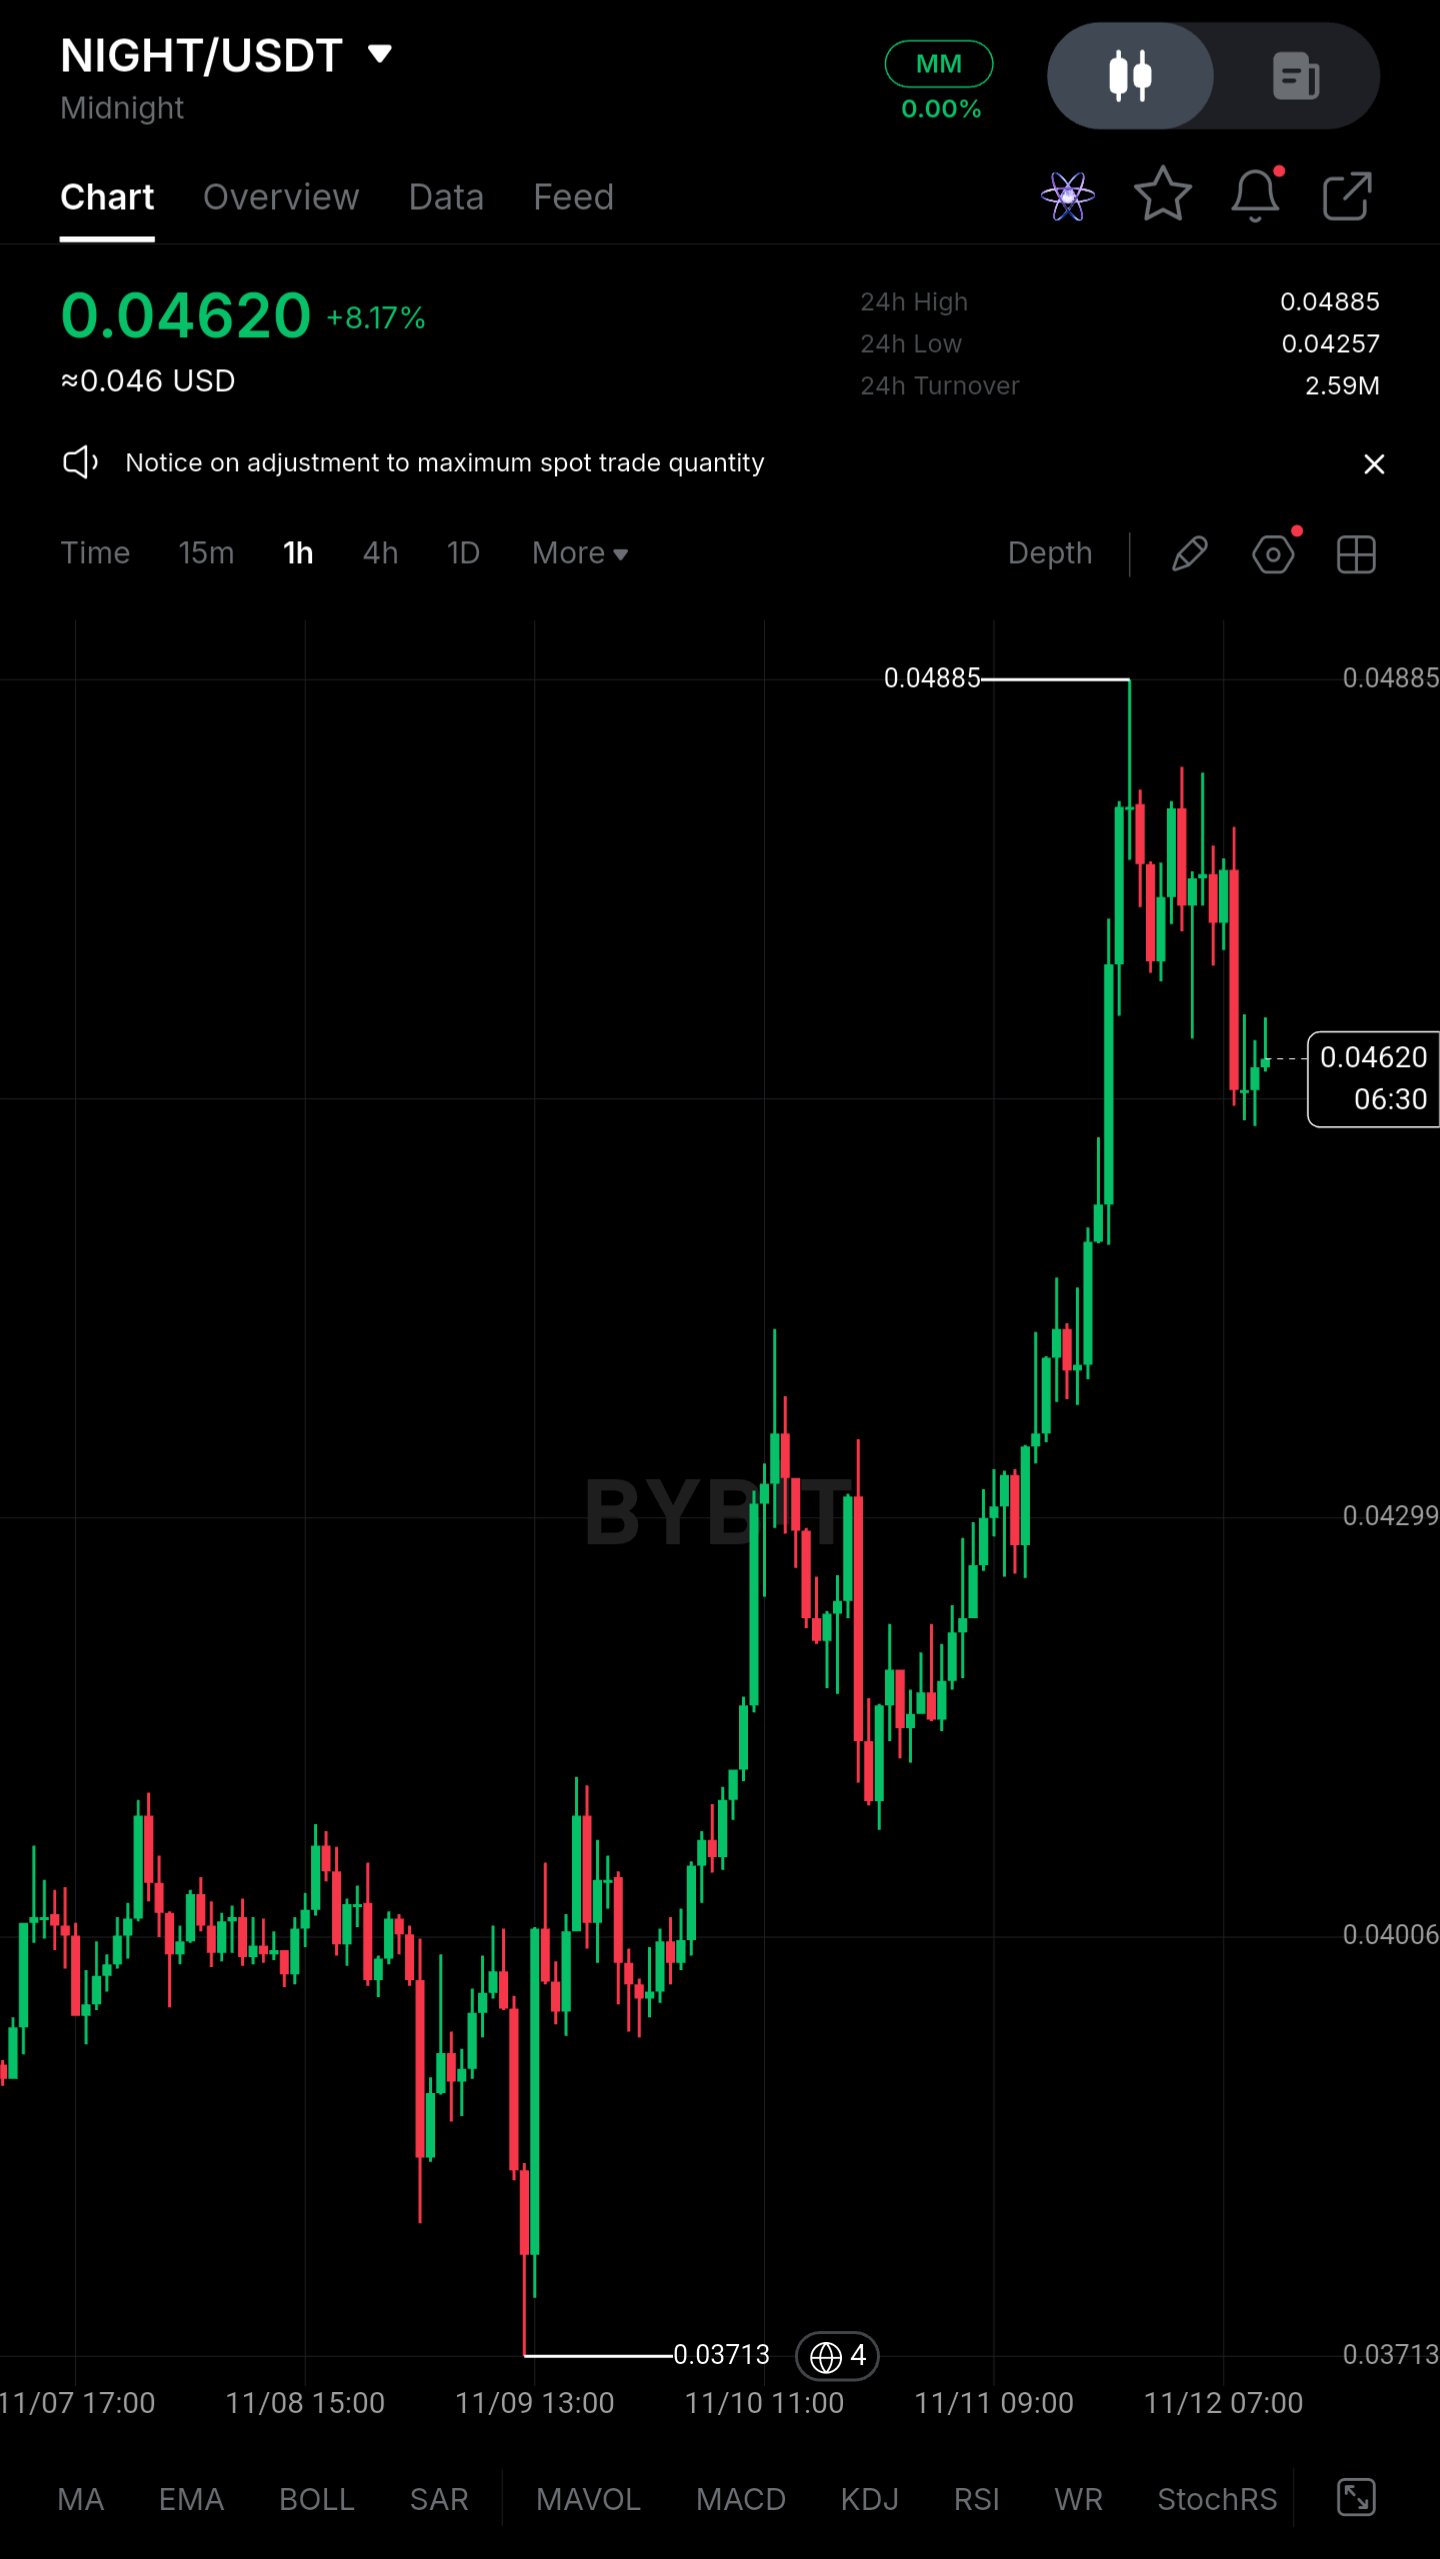
$NIGHTUSDT (Midnight) holds near $0.0462 after a rebound from $0.03713, but I'm not treating this as a recovery yet** NIGHT trades around $0.0462, up 8.17% on the day. It sits roughly 24% above the $0.03713 low from 9 November and about 5% below the 24h high of $0.04885. The bounce was sharp, but the move is already rolling over from its peak. The bigger concern is whether large holders are using this strength to distribute into a derivatives market that looks long-tilted. **Price Action** - Price: about $0.0462 (≈$0.046) - Move: roughly +31% from the $0.03713 low to the $0.04885 high, followed by a roughly 5% pullback - 24h range: $0.04257 to $0.04885, on about $2.59M in turnover - Immediate resistance: $0.0475 to $0.0488, where the latest rejection formed - First support: $0.0430 to $0.0426, the prior consolidation base and the 24h low A reclaim of $0.04885 would signal that buyers can absorb supply at the highs. Even then, the broader structure only shifts from a deep drawdown to a rebound within a range, not to a confirmed trend reversal. **Large Capital Picture** Without ETF-style flow data, large-wallet and exchange-flow behavior is the relevant lens. The sell-off into $0.03713 and the vertical rebound look more like a liquidity-driven swing than steady accumulation. The rally came in impulsive bursts, and the lower highs and long upper wicks near $0.0488 show supply is meeting every push. Demand is present, but it is inconsistent. **Liquidity & Range Conditions** The latest hourly candles are compressing after a sharp red leg from the highs. A narrow range after a fast move is not evidence of accumulation. Turnover of about $2.59M is modest for a 31% swing, which suggests the move may be thinly supported. Stronger spot participation is still needed. **Derivatives Positioning** Exact figures are not visible on a spot chart, so the following are reasonable estimates from the price structure: - Open interest: elevated and rebuilding after the squeeze off the lows - Funding: likely positive, meaning longs are paying shorts - Long share of accounts: likely around 55% to 60% This positioning is vulnerable. If $0.0430 fails, late longs from the $0.044 to $0.048 zone could be forced out, amplifying the move down. **Key Figures** - Current price: ~$0.0462 - Immediate resistance: $0.0475 to $0.0488 - Support zone: $0.0430 to $0.0426 - Recent low: $0.03713 - 24h turnover: ~$2.59M - Open interest: elevated (estimated) - Funding: positive (estimated) - Long share: ~55% to 60% (estimated) **Confirmation Levels** - Bullish: an hourly close above $0.04885 with rising spot volume opens $0.0500, then the mid-$0.05 area. - Bearish: a breakdown below $0.0430 exposes $0.0400, then a retest of the $0.03713 low, with long liquidations likely accelerating the move. **Closing** The stabilization is real but temporary. Rebound strength, large-holder supply and crowded long positioning are all competing at the same time. The decisive signal is whether spot buyers return while leverage stays controlled, or whether another support breakdown triggers fresh long liquidations. *Not financial advice.* #ByXIMPACT