PkRONY
1514Me gusta0Compartir en el chat155Aficionados174Seguir
if you would like to make a donation for tha 120 children in my Orphanage, you are welcome to do so. my uid:- 546260203
if you would like to make a donation for tha 120 children in my Orphanage, you are welcome to do so. my uid:- 546260203
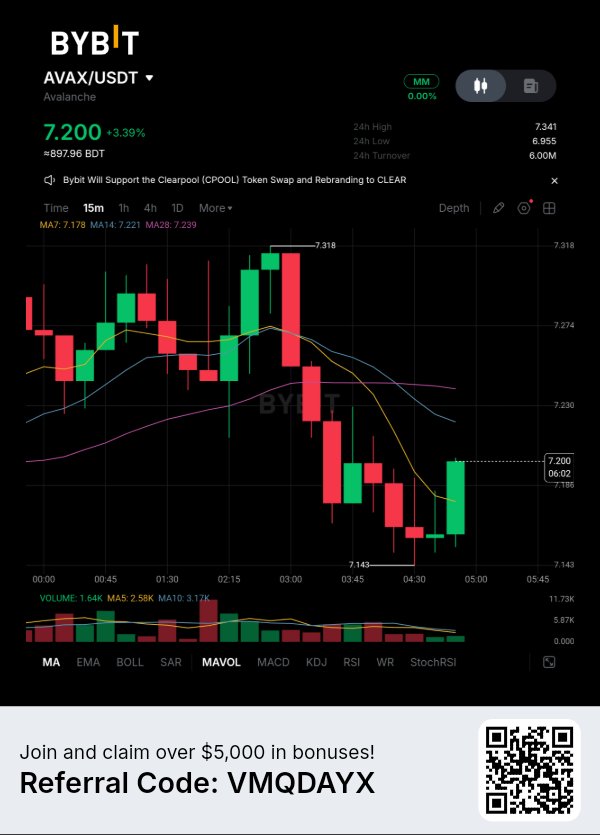
$AVAXUSDT — I turned bearish when AVAX broke its daily structure. Now I'm positioned for a bullish reversal near $7.175. Here's what changed my short-term view. The bigger downtrend hasn't disappeared. But something interesting is developing on the 4H chart, and I don't want to ignore it. Price has continued making lower lows, while RSI is forming higher lows. That's a bullish divergence. It suggests sellers are still pushing price down, but the momentum behind those moves is weakening. RSI is now around 37.18, slightly above its average at 36.62. This is an early improvement, not confirmation of a reversal. I'm heavily bullish on the possibility of a strong recovery from this area. The Structure I'm Watching AVAX is attempting to stabilize around $7.175 after a prolonged decline. If buyers reclaim the nearby $7.174–$7.238 resistance and establish a higher low, that would be my first meaningful sign of improving market structure. A confirmed bullish market structure shift could open the way toward $7.318, followed by the larger resistance region between approximately $7.80 and $8.50. My ultimate target for this setup is $8.827. I'm not restoring my previous $25 prediction. This is a separate recovery trade based on the developing 4H divergence, with a specific entry, stop and exit objective. My Long Position — TP & SL I've already positioned for this potential reversal, and my setup is marked directly on the chart. Entry: $7.175 Stop-loss: $6.802 Take-profit: $8.827 Potential upside: 23.03% Defined downside: 5.20% Risk-to-reward: 4.43:1 These are the theoretical price-based returns before leverage, fees and slippage. My conviction is strong, but the risk is real. A move through $6.802 would invalidate my marked trade. I won't widen the stop simply because I'm expecting a bullish reversal. Here's the important distinction: bullish divergence can appear before a reversal, but it cannot guarantee one. That's why I'm watching for buyers to break the sequence of lower highs rather than relying on RSI alone. I've taken my position because I believe this developing setup offers an attractive opportunity relative to its defined risk. The bearish trend brought AVAX down to this area. Now I want to see whether weakening selling momentum can finally turn into real buying strength. If that structure shift confirms, this recovery could become much more interesting. #WSOT2026
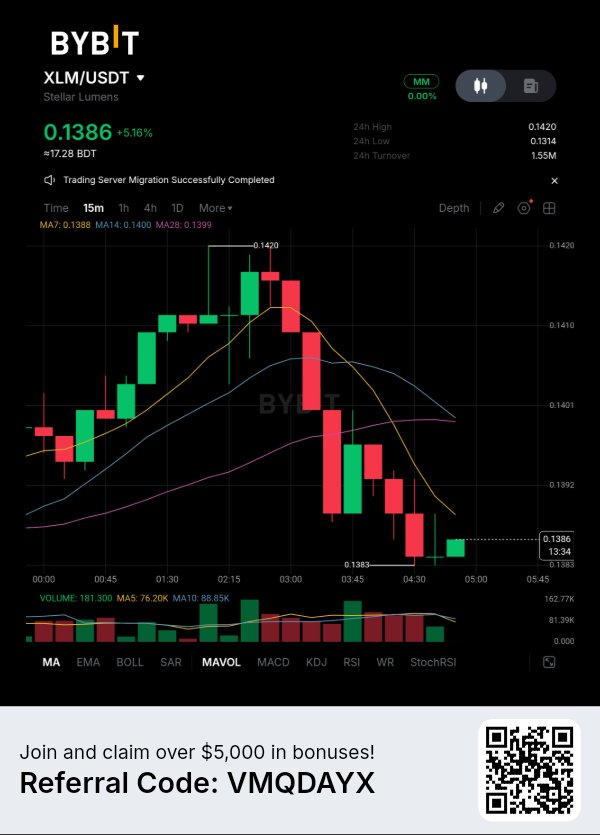
$XLMUSDT — I turned bearish when XLM broke its daily structure. Now I'm positioned for a bullish reversal near $0.1385. Here's what changed my short-term view. The bigger downtrend hasn't disappeared. But something interesting is developing on the 4H chart, and I don't want to ignore it. Price has continued making lower lows, while RSI is forming higher lows. That's a bullish divergence. It suggests sellers are still pushing price down, but the momentum behind those moves is weakening. RSI is now around 37.18, slightly above its average at 36.62. This is an early improvement, not confirmation of a reversal. I'm heavily bullish on the possibility of a strong recovery from this area. The Structure I'm Watching XLM is attempting to stabilize around $0.1385 after a prolonged decline. If buyers reclaim the nearby $0.1391–$0.1402 resistance and establish a higher low, that would be my first meaningful sign of improving market structure. A confirmed bullish market structure shift could open the way toward $0.1420, followed by the larger resistance region between approximately $0.155 and $0.165. My ultimate target for this setup is $0.1704. I'm not restoring my previous $0.50 prediction. This is a separate recovery trade based on the developing 4H divergence, with a specific entry, stop and exit objective. My Long Position — TP & SL I've already positioned for this potential reversal, and my setup is marked directly on the chart. Entry: $0.1385 Stop-loss: $0.1313 Take-profit: $0.1704 Potential upside: 23.03% Defined downside: 5.20% Risk-to-reward: 4.43:1 These are the theoretical price-based returns before leverage, fees and slippage. My conviction is strong, but the risk is real. A move through $0.1313 would invalidate my marked trade. I won't widen the stop simply because I'm expecting a bullish reversal. Here's the important distinction: bullish divergence can appear before a reversal, but it cannot guarantee one. That's why I'm watching for buyers to break the sequence of lower highs rather than relying on RSI alone. I've taken my position because I believe this developing setup offers an attractive opportunity relative to its defined risk. The bearish trend brought XLM down to this area. Now I want to see whether weakening selling momentum can finally turn into real buying strength. If that structure shift confirms, this recovery could become much more interesting. #WSOT2026
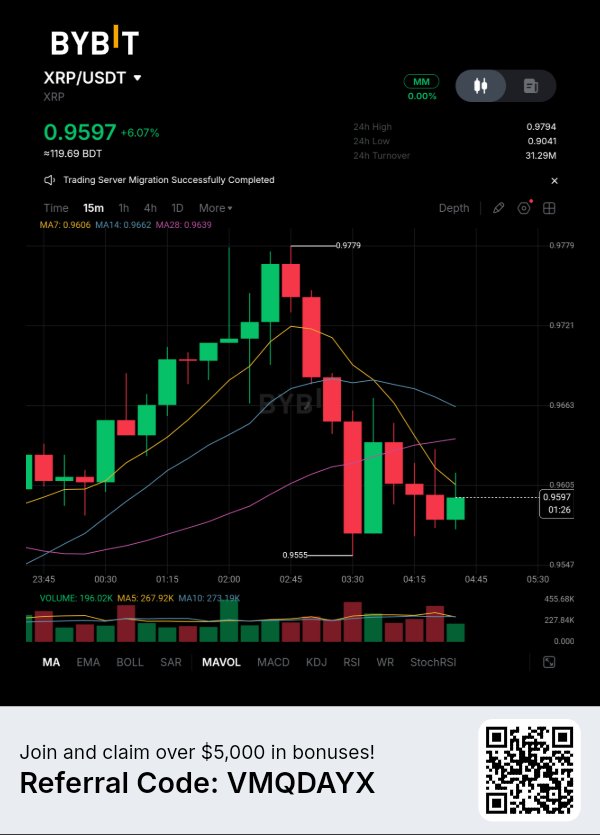
$XRPUSDT — I turned bearish when XRP broke its daily structure. Now I'm positioned for a bullish reversal near $0.9586. Here's what changed my short-term view. The bigger downtrend hasn't disappeared. But something interesting is developing on the 4H chart, and I don't want to ignore it. Price has continued making lower lows, while RSI is forming higher lows. That's a bullish divergence. It suggests sellers are still pushing price down, but the momentum behind those moves is weakening. RSI is now around 37.18, slightly above its average at 36.62. This is an early improvement, not confirmation of a reversal. I'm heavily bullish on the possibility of a strong recovery from this area. The Structure I'm Watching XRP is attempting to stabilize around $0.9586 after a prolonged decline. If buyers reclaim the nearby $0.9604–$0.9661 resistance and establish a higher low, that would be my first meaningful sign of improving market structure. A confirmed bullish market structure shift could open the way toward $0.9779, followed by the larger resistance region between approximately $1.02 and $1.10. My ultimate target for this setup is $1.179. I'm not restoring my previous $3.00 prediction. This is a separate recovery trade based on the developing 4H divergence, with a specific entry, stop and exit objective. My Long Position — TP & SL I've already positioned for this potential reversal, and my setup is marked directly on the chart. Entry: $0.9586 Stop-loss: $0.9087 Take-profit: $1.179 Potential upside: 23.03% Defined downside: 5.20% Risk-to-reward: 4.43:1 These are the theoretical price-based returns before leverage, fees and slippage. My conviction is strong, but the risk is real. A move through $0.9087 would invalidate my marked trade. I won't widen the stop simply because I'm expecting a bullish reversal. Here's the important distinction: bullish divergence can appear before a reversal, but it cannot guarantee one. That's why I'm watching for buyers to break the sequence of lower highs rather than relying on RSI alone. I've taken my position because I believe this developing setup offers an attractive opportunity relative to its defined risk. The bearish trend brought XRP down to this area. Now I want to see whether weakening selling momentum can finally turn into real buying strength. If that structure shift confirms, this recovery could become much more interesting. #WSOT2026
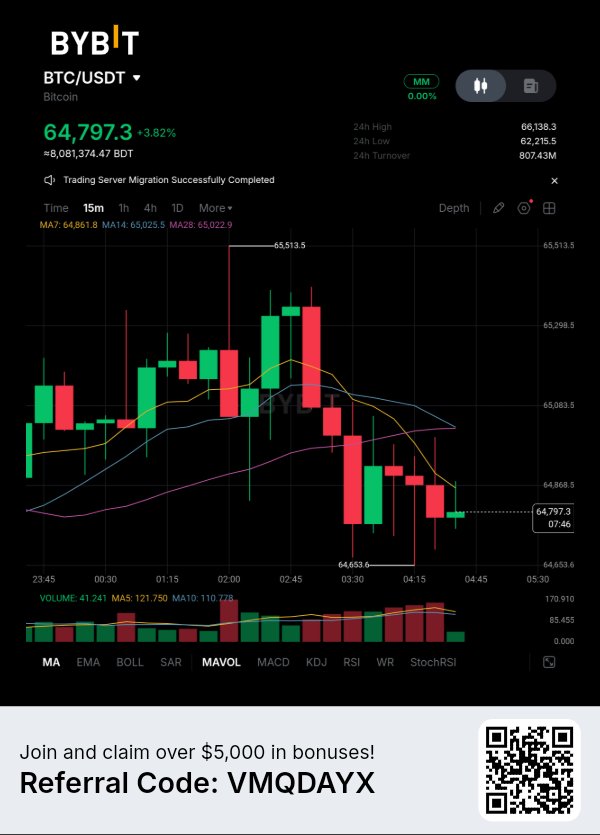
$BTCUSDT — I turned bearish when BTC broke its daily structure. Now I'm positioned for a bullish reversal near $64,839. Here's what changed my short-term view. The bigger downtrend hasn't disappeared. But something interesting is developing on the 4H chart, and I don't want to ignore it. Price has continued making lower lows, while RSI is forming higher lows. That's a bullish divergence. It suggests sellers are still pushing price down, but the momentum behind those moves is weakening. RSI is now around 37.18, slightly above its average at 36.62. This is an early improvement, not confirmation of a reversal. I'm heavily bullish on the possibility of a strong recovery from this area. The Structure I'm Watching BTC is attempting to stabilize around $64,839 after a prolonged decline. If buyers reclaim the nearby $65,000–$65,513 resistance and establish a higher low, that would be my first meaningful sign of improving market structure. A confirmed bullish market structure shift could open the way toward $66,138, followed by the larger resistance region between approximately $70,000 and $76,000. My ultimate target for this setup is $79,772. I'm not restoring my previous $100,000 prediction. This is a separate recovery trade based on the developing 4H divergence, with a specific entry, stop and exit objective. My Long Position — TP & SL I've already positioned for this potential reversal, and my setup is marked directly on the chart. Entry: $64,839 Stop-loss: $61,468 Take-profit: $79,772 Potential upside: 23.03% Defined downside: 5.20% Risk-to-reward: 4.43:1 These are the theoretical price-based returns before leverage, fees and slippage. My conviction is strong, but the risk is real. A move through $61,468 would invalidate my marked trade. I won't widen the stop simply because I'm expecting a bullish reversal. Here's the important distinction: bullish divergence can appear before a reversal, but it cannot guarantee one. That's why I'm watching for buyers to break the sequence of lower highs rather than relying on RSI alone. I've taken my position because I believe this developing setup offers an attractive opportunity relative to its defined risk. The bearish trend brought BTC down to this area. Now I want to see whether weakening selling momentum can finally turn into real buying strength. If that structure shift confirms, this recovery could become much more interesting #WSOT2026
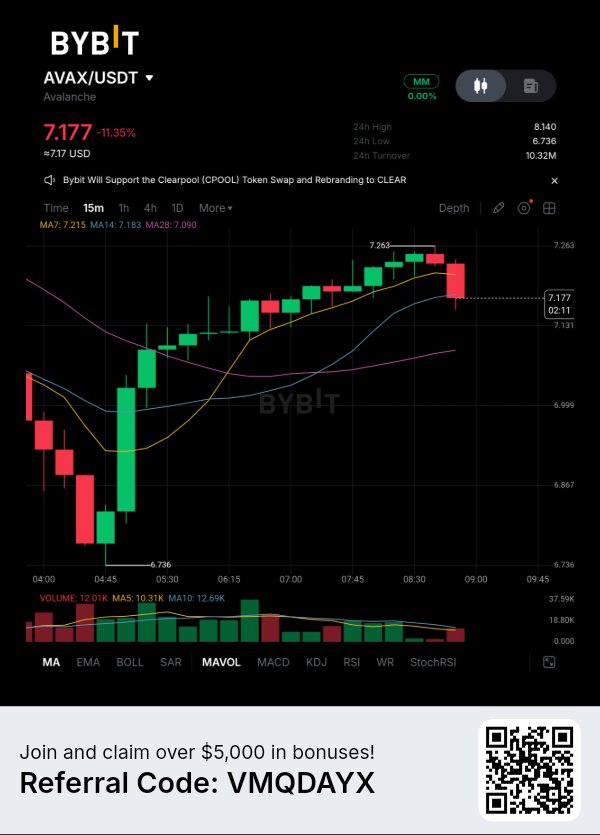
$AVAXUSDT — I turned bearish when AVAX broke its daily structure. Now I'm positioned for a bullish reversal near $7.16. Here's what changed my short-term view. The bigger downtrend hasn't disappeared. But something interesting is developing on the 4H chart, and I don't want to ignore it. Price has continued making lower lows, while RSI is forming higher lows. That's a bullish divergence. It suggests sellers are still pushing price down, but the momentum behind those moves is weakening. RSI is now around 37.18, slightly above its average at 36.62. This is an early improvement, not confirmation of a reversal. I'm heavily bullish on the possibility of a strong recovery from this area. The Structure I'm Watching AVAX is attempting to stabilize around $7.16 after a prolonged decline. If buyers reclaim the nearby $7.26–$7.30 resistance and establish a higher low, that would be my first meaningful sign of improving market structure. A confirmed bullish market structure shift could open the way toward $8.140, followed by the larger resistance region between approximately $8.30 and $8.60. My ultimate target for this setup is $8.810. I'm not restoring my previous $20 prediction. This is a separate recovery trade based on the developing 4H divergence, with a specific entry, stop and exit objective. My Long Position — TP & SL I've already positioned for this potential reversal, and my setup is marked directly on the chart. Entry: $7.161 Stop-loss: $6.789 Take-profit: $8.810 Potential upside: 23.03% Defined downside: 5.20% Risk-to-reward: 4.43:1 These are the theoretical price-based returns before leverage, fees and slippage. My conviction is strong, but the risk is real. A move through $6.789 would invalidate my marked trade. I won't widen the stop simply because I'm expecting a bullish reversal. Here's the important distinction: bullish divergence can appear before a reversal, but it cannot guarantee one. That's why I'm watching for buyers to break the sequence of lower highs rather than relying on RSI alone. I've taken my position because I believe this developing setup offers an attractive opportunity relative to its defined risk. The bearish trend brought AVAX down to this area. Now I want to see whether weakening selling momentum can finally turn into real buying strength. If that structure shift confirms, this recovery could become much more interesting. #WSOT2026
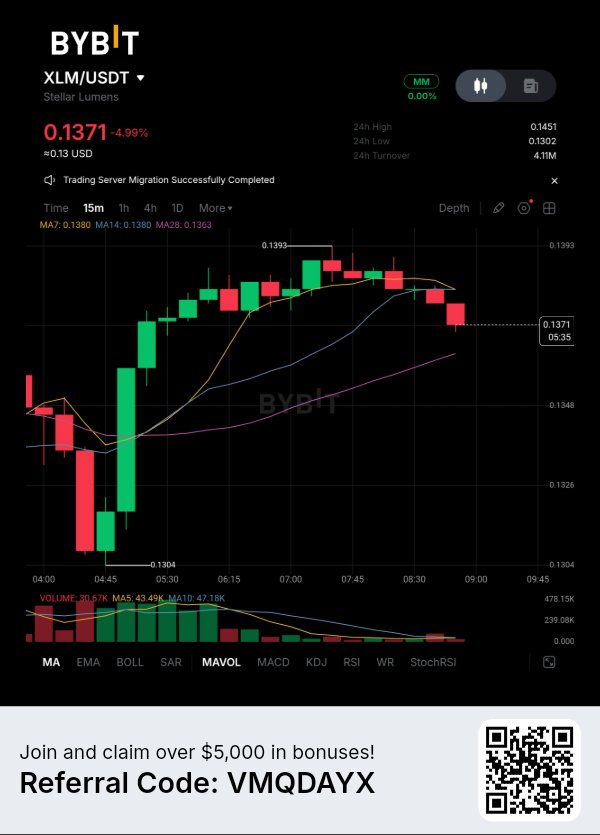
$XLMUSDT — I turned bearish when XLM broke its daily structure. Now I'm positioned for a bullish reversal near $0.137. Here's what changed my short-term view. The bigger downtrend hasn't disappeared. But something interesting is developing on the 4H chart, and I don't want to ignore it. Price has continued making lower lows, while RSI is forming higher lows. That's a bullish divergence. It suggests sellers are still pushing price down, but the momentum behind those moves is weakening. RSI is now around 37.18, slightly above its average at 36.62. This is an early improvement, not confirmation of a reversal. I'm heavily bullish on the possibility of a strong recovery from this area. The Structure I'm Watching XLM is attempting to stabilize around $0.137 after a prolonged decline. If buyers reclaim the nearby $0.139–$0.140 resistance and establish a higher low, that would be my first meaningful sign of improving market structure. A confirmed bullish market structure shift could open the way toward $0.1451, followed by the larger resistance region between approximately $0.155 and $0.160. My ultimate target for this setup is $0.1688. I'm not restoring my previous $0.30 prediction. This is a separate recovery trade based on the developing 4H divergence, with a specific entry, stop and exit objective. My Long Position — TP & SL I've already positioned for this potential reversal, and my setup is marked directly on the chart. Entry: $0.1372 Stop-loss: $0.1300 Take-profit: $0.1688 Potential upside: 23.03% Defined downside: 5.25% Risk-to-reward: 4.39:1 These are the theoretical price-based returns before leverage, fees and slippage. My conviction is strong, but the risk is real. A move through $0.1300 would invalidate my marked trade. I won't widen the stop simply because I'm expecting a bullish reversal. Here's the important distinction: bullish divergence can appear before a reversal, but it cannot guarantee one. That's why I'm watching for buyers to break the sequence of lower highs rather than relying on RSI alone. I've taken my position because I believe this developing setup offers an attractive opportunity relative to its defined risk. The bearish trend brought XLM down to this area. Now I want to see whether weakening selling momentum can finally turn into real buying strength. If that structure shift confirms, this recovery could become much more interesting. #WSOT2026
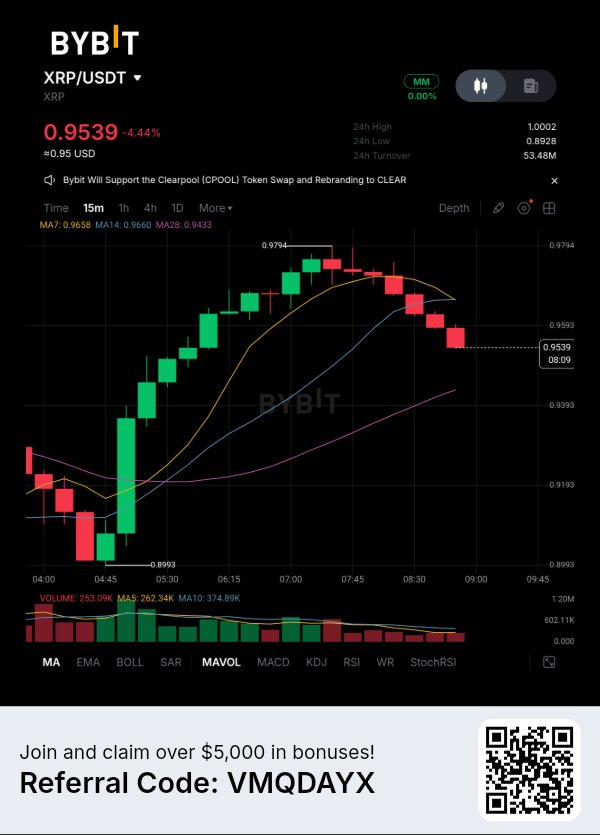
$XRPUSDT — I turned bearish when XRP broke its daily structure. Now I'm positioned for a bullish reversal near $0.95. Here's what changed my short-term view. The bigger downtrend hasn't disappeared. But something interesting is developing on the 4H chart, and I don't want to ignore it. Price has continued making lower lows, while RSI is forming higher lows. That's a bullish divergence. It suggests sellers are still pushing price down, but the momentum behind those moves is weakening. RSI is now around 37.18, slightly above its average at 36.62. This is an early improvement, not confirmation of a reversal. I'm heavily bullish on the possibility of a strong recovery from this area. The Structure I'm Watching XRP is attempting to stabilize around $0.95 after a prolonged decline. If buyers reclaim the nearby $0.98–$0.99 resistance and establish a higher low, that would be my first meaningful sign of improving market structure. A confirmed bullish market structure shift could open the way toward $1.0002, followed by the larger resistance region between approximately $1.05 and $1.10. My ultimate target for this setup is $1.1760. I'm not restoring my previous $2.00 prediction. This is a separate recovery trade based on the developing 4H divergence, with a specific entry, stop and exit objective. My Long Position — TP & SL I've already positioned for this potential reversal, and my setup is marked directly on the chart. Entry: $0.9552 Stop-loss: $0.9050 Take-profit: $1.1760 Potential upside: 23.11% Defined downside: 5.25% Risk-to-reward: 4.40:1 These are the theoretical price-based returns before leverage, fees and slippage. My conviction is strong, but the risk is real. A move through $0.9050 would invalidate my marked trade. I won't widen the stop simply because I'm expecting a bullish reversal. Here's the important distinction: bullish divergence can appear before a reversal, but it cannot guarantee one. That's why I'm watching for buyers to break the sequence of lower highs rather than relying on RSI alone. I've taken my position because I believe this developing setup offers an attractive opportunity relative to its defined risk. The bearish trend brought XRP down to this area. Now I want to see whether weakening selling momentum can finally turn into real buying strength. If that structure shift confirms, this recovery could become much more interesting. #WSOT2026
$BTCUSDT — I turned bearish when BTC broke its daily structure. Now I'm positioned for a bullish reversal near $64,476. Here's what changed my short-term view. The bigger downtrend hasn't disappeared. But something interesting is developing on the 4H chart, and I don't want to ignore it. Price has continued making lower lows, while momentum is starting to stabilize near the lows. That's an early sign of exhaustion. It suggests sellers are still pushing price down, but the momentum behind those moves is weakening. BTC is now around 64,476, after sweeping the $61,999 low and bouncing sharply. This is an early improvement, not confirmation of a reversal. I'm heavily bullish on the possibility of a strong recovery from this area. The Structure I'm Watching BTC is attempting to stabilize around $64,476 after a prolonged decline. If buyers reclaim the nearby $65,000–$66,000 resistance and establish a higher low, that would be my first meaningful sign of improving market structure. A confirmed bullish market structure shift could open the way toward $67,527, followed by the larger resistance region between approximately $70,000 and $72,000. My ultimate target for this setup is $74,850. I'm not restoring my previous $100,000 prediction. This is a separate recovery trade based on the developing 4H exhaustion, with a specific entry, stop and exit objective. My Long Position — TP & SL I've already positioned for this potential reversal, and my setup is marked directly on the chart. Entry: $64,476 Stop-loss: $61,950 Take-profit: $74,850 Potential upside: 16.09% Defined downside: 3.92% Risk-to-reward: 4.11:1 These are the theoretical price-based returns before leverage, fees and slippage. My conviction is strong, but the risk is real. A move through $61,950 would invalidate my marked trade. I won't widen the stop simply because I'm expecting a bullish reversal. Here's the important distinction: a sharp bounce from a sweep can appear before a reversal, but it cannot guarantee one. That's why I'm watching for buyers to break the sequence of lower highs rather than relying on the bounce alone. I've taken my position because I believe this developing setup offers an attractive opportunity relative to its defined risk. The bearish trend brought BTC down to this area. Now I want to see whether weakening selling momentum can finally turn into real buying strength. If that structure shift confirms, this recovery could become much more interesting. #WSOT2026
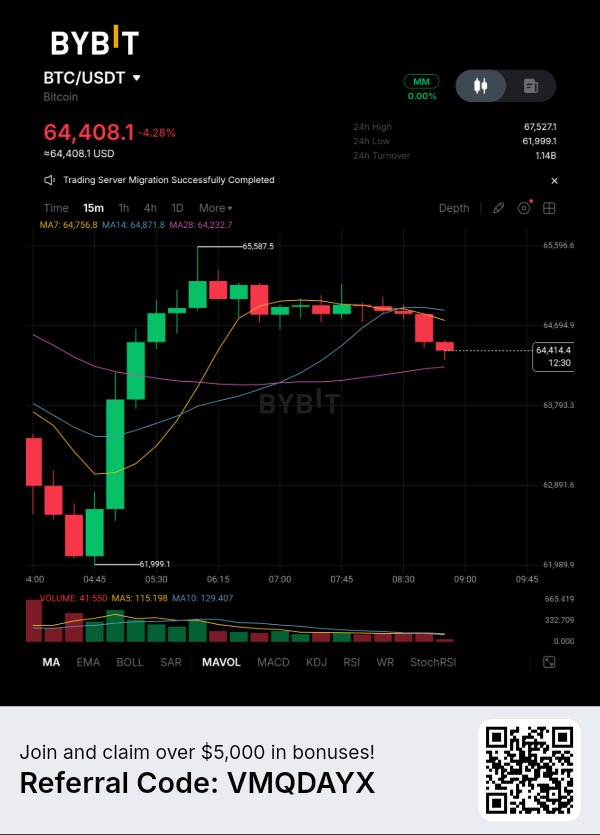
$BTCUSDT — Me volví bajista cuando BTC rompió su estructura diaria. Ahora estoy posicionado para una reversión alcista cerca de los $64,376. Esto es lo que cambió mi visión a corto plazo. La gran tendencia bajista no ha desaparecido. Pero algo interesante se está desarrollando en el gráfico de 15m y no quiero ignorarlo. El precio ha seguido marcando mínimos más bajos, mientras que el momentum comienza a desvanecerse en cada empujón hacia abajo. Eso es una divergencia alcista en el comportamiento. Sugiere que los vendedores todavía están empujando el precio a la baja, pero el momentum detrás de esos movimientos se está debilitando. BTC acaba de hacer una mecha hacia los $61,999.1 y rebotó bruscamente hacia los $64,376 aproximadamente. Esta es una mejora temprana, no una confirmación de reversión. Soy muy alcista sobre la posibilidad de una fuerte recuperación desde esta área. La estructura que estoy observando BTC intenta estabilizarse alrededor de los $64,376 después de un declive prolongado. Si los compradores recuperan la resistencia cercana de los $66,970 y establecen un mínimo más alto, esa sería mi primera señal significativa de una mejora en la estructura del mercado. Un cambio de estructura de mercado alcista confirmado podría abrir el camino hacia los $68,105, seguido por la región de resistencia más amplia entre aproximadamente $71,500 y $73,200. Mi objetivo final para esta configuración es $74,906. No estoy restaurando mi predicción anterior de $100,000. Esta es una operación de recuperación independiente basada en el rebote de 15m que se está desarrollando desde el mínimo de $61,999, con una entrada, un stop y un objetivo de salida específicos. Mi posición en largo — TP y SL Ya me he posicionado para esta posible reversión, y mi configuración está marcada directamente en el gráfico. Entrada: $64,376.1 Stop-loss: $61,999.1 Take-profit: $74,906.2 Potencial al alza: 16.36% Riesgo definido: 3.69% Relación riesgo-beneficio: 4.43:1 Estos son los retornos teóricos basados en el precio antes del apalancamiento, las comisiones y el slippage. Mi convicción es fuerte, pero el riesgo es real. Un movimiento a través de los $61,999.1 invalidaría mi operación marcada. No ampliaré el stop simplemente porque espero una reversión alcista. Aquí está la distinción importante: un rebote brusco puede aparecer antes de una reversión, pero no garantiza una. Por eso estoy atento a que los compradores rompan la secuencia de máximos más bajos en lugar de confiar solo en el rebote. He tomado mi posición porque creo que esta configuración que se está desarrollando ofrece una oportunidad atractiva en relación con su riesgo definido. La tendencia bajista llevó a BTC a esta área. Ahora quiero ver si el debilitamiento del momentum de venta finalmente puede convertirse en una fuerza de compra real. Si ese cambio de estructura se confirma, esta recuperación podría volverse mucho más interesante. #WSOT2026
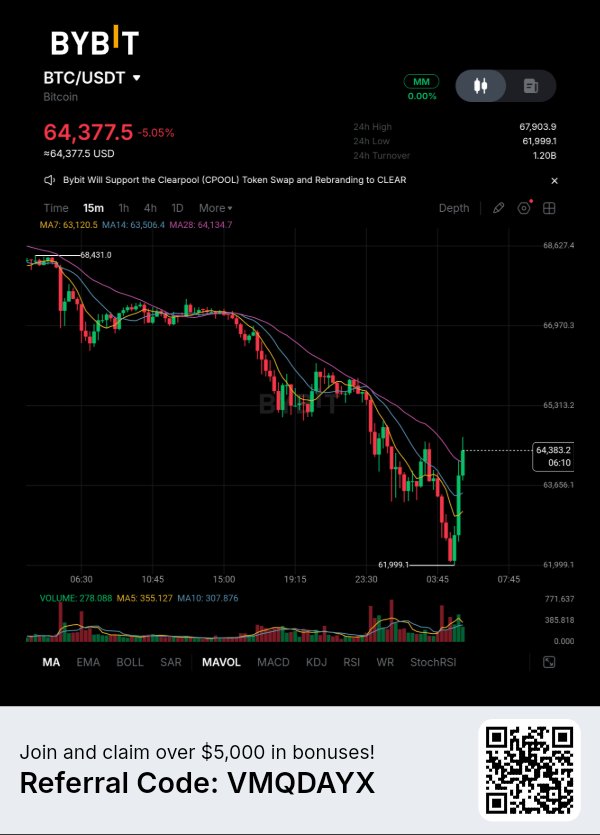
$SOLUSDT — Me puse bajista cuando SOL rompió su estructura diaria. Ahora estoy posicionado para una reversión alcista cerca de los $69. Aquí está lo que cambió mi visión a corto plazo. La tendencia bajista mayor no ha desaparecido. Pero algo interesante se está desarrollando en el gráfico de 4H y no quiero ignorarlo. El precio ha seguido haciendo mínimos más bajos, mientras que el RSI está formando mínimos más altos. Eso es una divergencia alcista. Sugiere que los vendedores siguen empujando el precio a la baja, pero el impulso detrás de esos movimientos se está debilitando. El RSI está ahora alrededor de 36.84, ligeramente por encima de su promedio en 36.12. Esta es una mejora temprana, no una confirmación de una reversión. Soy fuertemente optimista sobre la posibilidad de una recuperación sólida desde esta área. La estructura que estoy observando SOL está intentando estabilizarse alrededor de los $69 después de una caída prolongada. Si los compradores recuperan la resistencia cercana de $70.22–$72.07 y establecen un mínimo más alto, esa sería mi primera señal significativa de mejora en la estructura del mercado. Un cambio confirmado en la estructura alcista del mercado podría abrir el camino hacia los $78.67, seguido por la región de resistencia mayor entre aproximadamente $80.53 y $84.00. Mi objetivo final para esta configuración es $85.16. No voy a restaurar mi predicción anterior de $120. Esta es una operación de recuperación independiente basada en la divergencia de 4H que se está desarrollando, con un punto de entrada, stop y objetivo de salida específicos. Mi posición larga — TP y SL Ya me he posicionado para esta posible reversión, y mi configuración está marcada directamente en el gráfico. Entrada: $69.22 Stop-loss: $65.62 Take-profit: $85.16 Potencial de subida: 23.03% Riesgo de bajada definido: 5.20% Relación riesgo-recompensa: 4.43:1 Estos son los rendimientos teóricos basados en el precio antes de apalancamiento, comisiones y deslizamiento. Mi convicción es fuerte, pero el riesgo es real. Un movimiento a través de los $65.62 invalidaría mi operación marcada. No ampliaré el stop simplemente porque espero una reversión alcista. Aquí está la distinción importante: la divergencia alcista puede aparecer antes de una reversión, pero no puede garantizarla. Es por eso que estoy esperando que los compradores rompan la secuencia de máximos más bajos en lugar de confiar solo en el RSI. He tomado mi posición porque creo que esta configuración en desarrollo ofrece una oportunidad atractiva en relación con su riesgo definido. La tendencia bajista llevó a SOL hasta esta área. Ahora quiero ver si el debilitamiento del impulso de venta finalmente puede convertirse en una verdadera fuerza de compra. Si ese cambio de estructura se confirma, esta recuperación podría volverse mucho más interesante. #WSOT2026
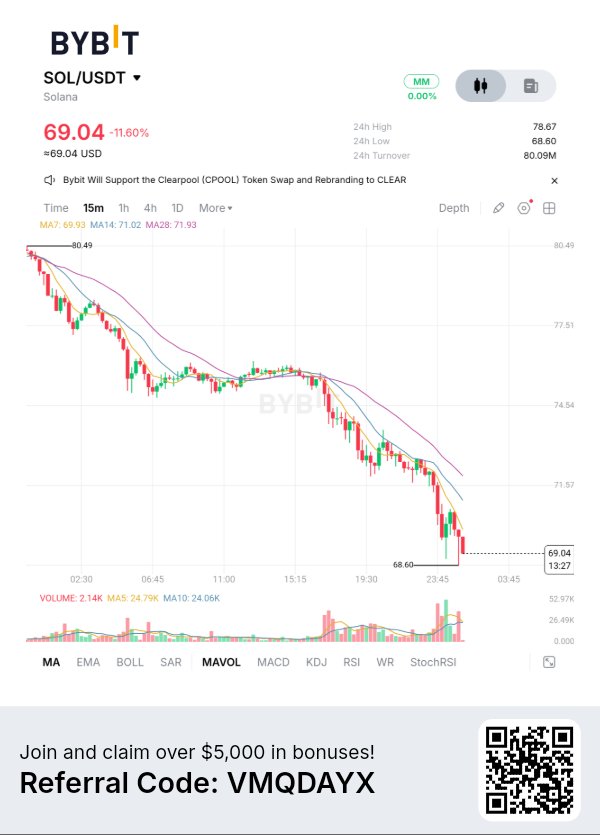
$MNTUSDT — I turned bearish when MNT broke its daily structure. Now I'm positioned for a bullish reversal near $0.39. Here's what changed my short-term view. The bigger downtrend hasn't disappeared. But something interesting is developing on the 4H chart, and I don't want to ignore it. Price has continued making lower lows, while RSI is forming higher lows. That's a bullish divergence. It suggests sellers are still pushing price down, but the momentum behind those moves is weakening. RSI is now around 37.18, slightly above its average at 36.62. This is an early improvement, not confirmation of a reversal. I'm heavily bullish on the possibility of a strong recovery from this area. The Structure I'm Watching MNT is attempting to stabilize around $0.3917 after a prolonged decline. If buyers reclaim the nearby $0.3980-$0.4027 resistance and establish a higher low, that would be my first meaningful sign of improving market structure. A confirmed bullish market structure shift could open the way toward $0.4100, followed by the larger resistance region between approximately $0.44 and $0.47. My ultimate target for this setup is $0.4819. I'm not restoring my previous $0.70 prediction. This is a separate recovery trade based on the developing 4H divergence, with a specific entry, stop and exit objective. My Long Position — TP & SL I've already positioned for this potential reversal, and my setup is marked directly on the chart. Entry: $0.3917 Stop-loss: $0.3713 Take-profit: $0.4819 Potential upside: 23.03% Defined downside: 5.20% Risk-to-reward: 4.43:1 These are the theoretical price-based returns before leverage, fees and slippage. My conviction is strong, but the risk is real. A move through $0.3713 would invalidate my marked trade. I won't widen the stop simply because I'm expecting a bullish reversal. Here's the important distinction: bullish divergence can appear before a reversal, but it cannot guarantee one. That's why I'm watching for buyers to break the sequence of lower highs rather than relying on RSI alone. I've taken my position because I believe this developing setup offers an attractive opportunity relative to its defined risk. The bearish trend brought MNT down to this area. Now I want to see whether weakening selling momentum can finally turn into real buying strength. If that structure shift confirms, this recovery could become much more interesting. #WSOT2026
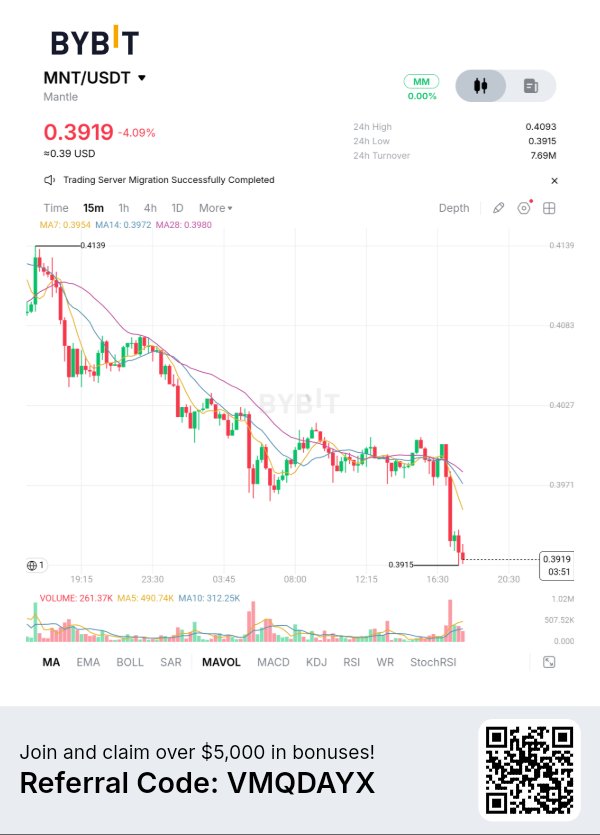
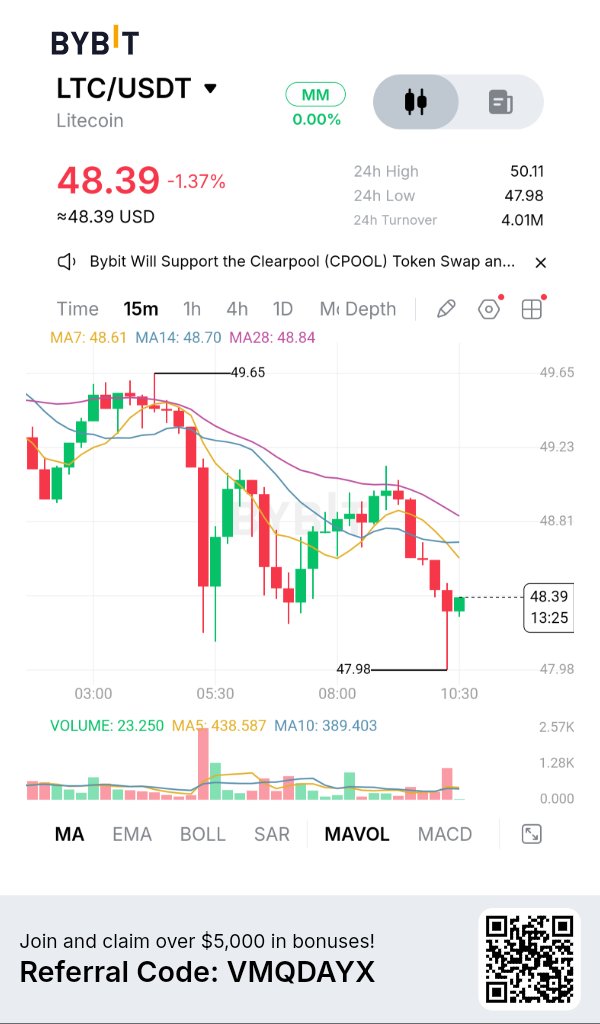
$LTCUSDT — I turned bearish when LIT broke its daily structure. Now I'm positioned for a bullish reversal near $3.07. Here's what changed my short-term view. The bigger downtrend hasn't disappeared. But something interesting is developing on the 4H chart, and I don't want to ignore it. Price has continued making lower lows, while RSI is forming higher lows. That's a bullish divergence. It suggests sellers are still pushing price down, but the momentum behind those moves is weakening. RSI is now around 37.18, slightly above its average at 36.62. This is an early improvement, not confirmation of a reversal. I'm heavily bullish on the possibility of a strong recovery from this area. The Structure I'm Watching LIT is attempting to stabilize around $3.07 after a prolonged decline. If buyers reclaim the nearby $3.14-$3.20 resistance and establish a higher low, that would be my first meaningful sign of improving market structure. A confirmed bullish market structure shift could open the way toward $3.4020, followed by the larger resistance region between approximately $3.50 and $3.68. My ultimate target for this setup is $3.778. I'm not restoring my previous $5 prediction. This is a separate recovery trade based on the developing 4H divergence, with a specific entry, stop and exit objective. My Long Position — TP & SL I've already positioned for this potential reversal, and my setup is marked directly on the chart. Entry: $3.0708 Stop-loss: $2.911 Take-profit: $3.778 Potential upside: 23.03% Defined downside: 5.20% Risk-to-reward: 4.43:1 These are the theoretical price-based returns before leverage, fees and slippage. My conviction is strong, but the risk is real. A move through $2.911 would invalidate my marked trade. I won't widen the stop simply because I'm expecting a bullish reversal. Here's the important distinction: bullish divergence can appear before a reversal, but it cannot guarantee one. That's why I'm watching for buyers to break the sequence of lower highs rather than relying on RSI alone. I've taken my position because I believe this developing setup offers an attractive opportunity relative to its defined risk. The bearish trend brought LIT down to this area. Now I want to see whether weakening selling momentum can finally turn into real buying strength. If that structure shift confirms, this recovery could become much more interesting. #WSOT2026
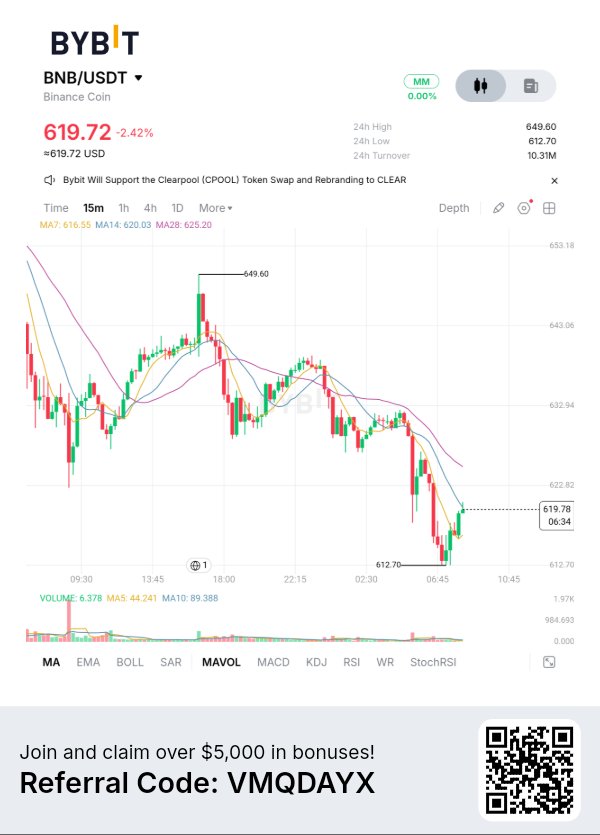
$BNBUSDT — I turned bearish when BNB broke its daily structure. Now I'm positioned for a bullish reversal near $620. Here's what changed my short-term view. The bigger downtrend hasn't disappeared. But something interesting is developing on the 4H chart, and I don't want to ignore it. Price has continued making lower lows, while RSI is forming higher lows. That's a bullish divergence. It suggests sellers are still pushing price down, but the momentum behind those moves is weakening. RSI is now around 37.18, slightly above its average at 36.62. This is an early improvement, not confirmation of a reversal. I'm heavily bullish on the possibility of a strong recovery from this area. The Structure I'm Watching BNB is attempting to stabilize around $620 after a prolonged decline. If buyers reclaim the nearby $630-$640 resistance and establish a higher low, that would be my first meaningful sign of improving market structure. A confirmed bullish market structure shift could open the way toward $649.60, followed by the larger resistance region between approximately $700 and $740. My ultimate target for this setup is $763.106. I'm not restoring my previous $1,000 prediction. This is a separate recovery trade based on the developing 4H divergence, with a specific entry, stop and exit objective. My Long Position — TP & SL I've already positioned for this potential reversal, and my setup is marked directly on the chart. Entry: $620.26 Stop-loss: $588.006 Take-profit: $763.106 Potential upside: 23.03% Defined downside: 5.20% Risk-to-reward: 4.43:1 These are the theoretical price-based returns before leverage, fees and slippage. My conviction is strong, but the risk is real. A move through $588.006 would invalidate my marked trade. I won't widen the stop simply because I'm expecting a bullish reversal. Here's the important distinction: bullish divergence can appear before a reversal, but it cannot guarantee one. That's why I'm watching for buyers to break the sequence of lower highs rather than relying on RSI alone. I've taken my position because I believe this developing setup offers an attractive opportunity relative to its defined risk. The bearish trend brought BNB down to this area. Now I want to see whether weakening selling momentum can finally turn into real buying strength. If that structure shift confirms, this recovery could become much more interesting. #WSOT2026
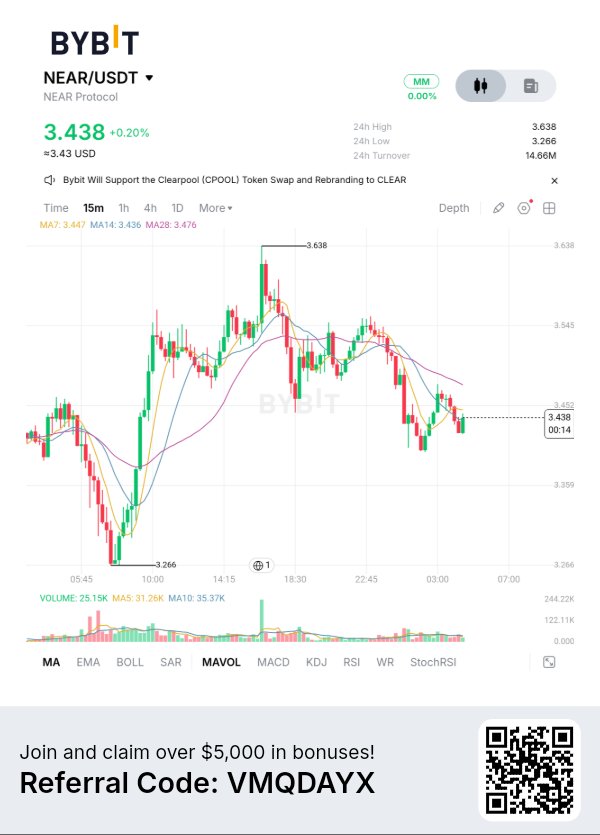
$NEARUSDT — I turned bearish when NEAR broke its daily structure. Now I'm positioned for a bullish reversal near $3.44. Here's what changed my short-term view. The bigger downtrend hasn't disappeared. But something interesting is developing on the 4H chart, and I don't want to ignore it. Price has continued making lower lows, while RSI is forming higher lows. That's a bullish divergence. It suggests sellers are still pushing price down, but the momentum behind those moves is weakening. RSI is now around 37.18, slightly above its average at 36.62. This is an early improvement, not confirmation of a reversal. I'm heavily bullish on the possibility of a strong recovery from this area. The Structure I'm Watching NEAR is attempting to stabilize around $3.44 after a prolonged decline. If buyers reclaim the nearby $3.50-$3.55 resistance and establish a higher low, that would be my first meaningful sign of improving market structure. A confirmed bullish market structure shift could open the way toward $3.638, followed by the larger resistance region between approximately $3.80 and $4.10. My ultimate target for this setup is $4.233. I'm not restoring my previous $6 prediction. This is a separate recovery trade based on the developing 4H divergence, with a specific entry, stop and exit objective. My Long Position — TP & SL I've already positioned for this potential reversal, and my setup is marked directly on the chart. Entry: $3.441 Stop-loss: $3.262 Take-profit: $4.233 Potential upside: 23.03% Defined downside: 5.20% Risk-to-reward: 4.43:1 These are the theoretical price-based returns before leverage, fees and slippage. My conviction is strong, but the risk is real. A move through $3.262 would invalidate my marked trade. I won't widen the stop simply because I'm expecting a bullish reversal. Here's the important distinction: bullish divergence can appear before a reversal, but it cannot guarantee one. That's why I'm watching for buyers to break the sequence of lower highs rather than relying on RSI alone. I've taken my position because I believe this developing setup offers an attractive opportunity relative to its defined risk. The bearish trend brought NEAR down to this area. Now I want to see whether weakening selling momentum can finally turn into real buying strength. If that structure shift confirms, this recovery could become much more interesting. #WSOT2026
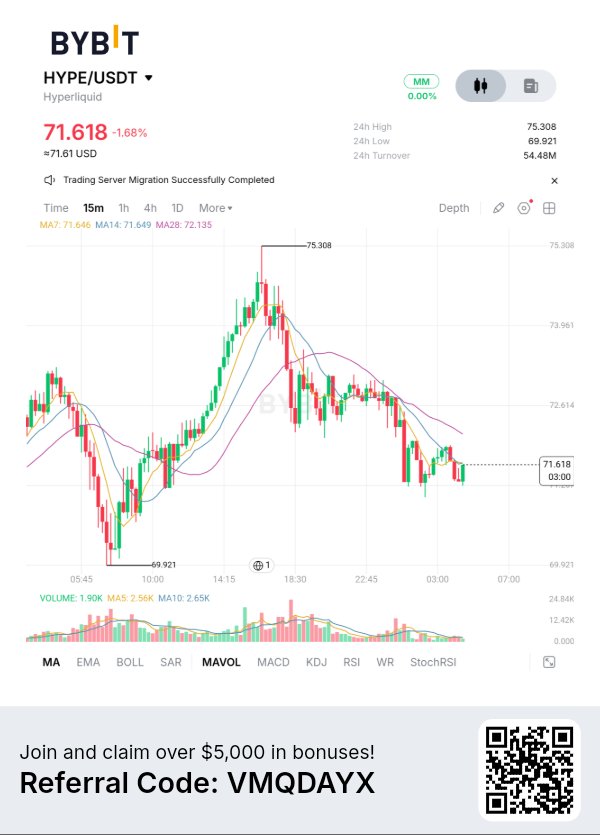
$HYPEUSDT — Me puse bajista cuando HYPE rompió su estructura diaria. Ahora estoy posicionado para una reversión alcista cerca de los $71.5. Esto es lo que cambió mi visión a corto plazo. La tendencia bajista mayor no ha desaparecido. Pero algo interesante se está desarrollando en el gráfico de 4H y no quiero ignorarlo. El precio ha seguido marcando mínimos más bajos, mientras que el RSI está formando mínimos más altos. Eso es una divergencia alcista. Sugiere que los vendedores todavía están empujando el precio a la baja, pero el impulso detrás de esos movimientos se está debilitando. El RSI está ahora alrededor de 37.18, ligeramente por encima de su promedio en 36.62. Esta es una mejora temprana, no una confirmación de reversión. Soy fuertemente alcista sobre la posibilidad de una recuperación fuerte desde esta área. La estructura que estoy observando HYPE está intentando estabilizarse alrededor de los $71.5 después de una caída prolongada. Si los compradores recuperan la resistencia cercana de los $72-$73 y establecen un mínimo más alto, esa sería mi primera señal significativa de mejora en la estructura del mercado. Un cambio confirmado en la estructura del mercado a alcista podría abrir el camino hacia los $75.308, seguido por la región de resistencia mayor entre aproximadamente $81 y $87. Mi objetivo final para esta configuración es $87.994. No estoy restableciendo mi predicción anterior de $100. Esta es una operación de recuperación separada basada en la divergencia de 4H que se está desarrollando, con una entrada, stop y objetivo de salida específicos. Mi posición larga — TP y SL Ya me he posicionado para esta posible reversión, y mi configuración está marcada directamente en el gráfico. Entrada: $71.522 Stop-loss: $67.803 Take-profit: $87.994 Potencial al alza: 23.03% Potencial a la baja definido: 5.20% Relación riesgo-beneficio: 4.43:1 Estos son los rendimientos teóricos basados en el precio antes de apalancamiento, comisiones y slippage. Mi convicción es fuerte, pero el riesgo es real. Un movimiento por debajo de los $67.803 invalidaría mi operación marcada. No ampliaré el stop simplemente porque espero una reversión alcista. Aquí está la distinción importante: la divergencia alcista puede aparecer antes de una reversión, pero no puede garantizarla. Es por eso que estoy esperando a que los compradores rompan la secuencia de máximos más bajos en lugar de confiar solo en el RSI. He tomado mi posición porque creo que esta configuración en desarrollo ofrece una oportunidad atractiva en relación con su riesgo definido. La tendencia bajista llevó a HYPE a esta área. Ahora quiero ver si el debilitamiento del impulso vendedor finalmente puede convertirse en fuerza compradora real. Si ese cambio de estructura se confirma, esta recuperación podría volverse mucho más interesante. #WSOT2026
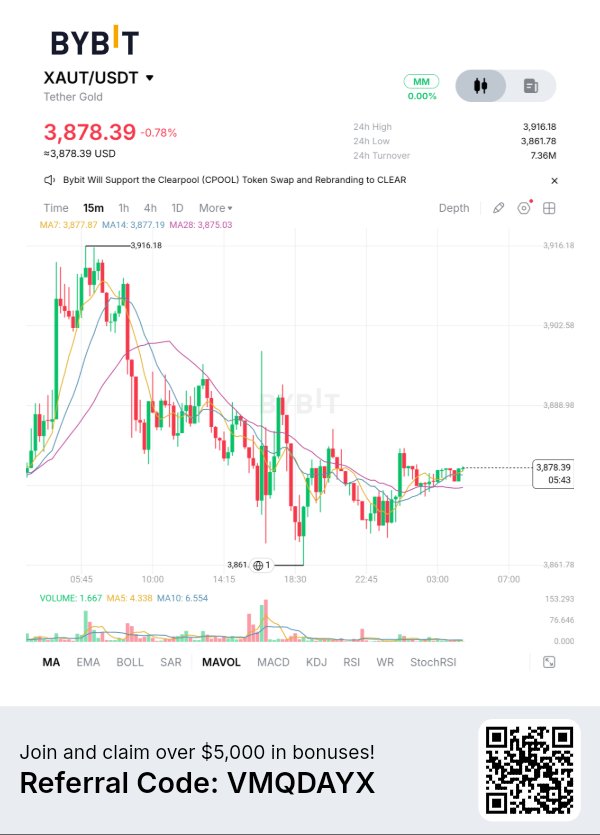
$XAUTUSDT — Me puse bajista cuando XAUT rompió su estructura diaria. Ahora estoy posicionado para una reversión alcista cerca de los $3,878. Esto es lo que cambió mi perspectiva a corto plazo. La tendencia bajista mayor no ha desaparecido. Pero algo interesante se está desarrollando en el gráfico de 4H, y no quiero ignorarlo. El precio ha seguido marcando mínimos más bajos, mientras que el RSI está formando mínimos más altos. Eso es una divergencia alcista. Sugiere que los vendedores siguen empujando el precio a la baja, pero el impulso detrás de esos movimientos se está debilitando. El RSI está ahora alrededor de 37.18, ligeramente por encima de su promedio en 36.62. Esta es una mejora temprana, no una confirmación de reversión. Soy muy alcista respecto a la posibilidad de una recuperación fuerte desde esta área. La Estructura que estoy observando XAUT está intentando estabilizarse alrededor de los $3,878 después de una caída prolongada. Si los compradores recuperan la resistencia cercana de $3,900-$3,916 y establecen un mínimo más alto, esa sería mi primera señal significativa de una mejora en la estructura del mercado. Un cambio de estructura de mercado alcista confirmado podría abrir el camino hacia los $3,916.18, seguido por la región de resistencia mayor entre aproximadamente $4,000 y $4,300. Mi objetivo final para esta configuración es $4,771.94. No voy a retomar mi predicción anterior de $5,000. Esta es una operación de recuperación separada basada en la divergencia de 4H que se está desarrollando, con un punto de entrada, stop y objetivo de salida específicos. Mi Posición en Largo — TP y SL Ya me posicioné para esta posible reversión, y mi configuración está marcada directamente en el gráfico. Entrada: $3,878.67 Stop-loss: $3,676.98 Take-profit: $4,771.94 Potencial de alza: 23.03% Baja definida: 5.20% Relación riesgo-beneficio: 4.43:1 Estos son los rendimientos teóricos basados en el precio antes de apalancamiento, comisiones y deslizamiento (slippage). Mi convicción es fuerte, pero el riesgo es real. Un movimiento a través de los $3,676.98 invalidaría mi operación marcada. No ampliaré el stop simplemente porque espero una reversión alcista. Aquí está la distinción importante: la divergencia alcista puede aparecer antes de una reversión, pero no puede garantizarla. Es por eso que estoy atento a que los compradores rompan la secuencia de máximos más bajos en lugar de confiar solo en el RSI. He tomado mi posición porque creo que esta configuración en desarrollo ofrece una oportunidad atractiva en relación con su riesgo definido. La tendencia bajista llevó a XAUT hasta esta zona. Ahora quiero ver si el debilitamiento del impulso vendedor puede finalmente convertirse en una verdadera fuerza compradora. Si esa confirmación de cambio de estructura se da, esta recuperación podría ponerse mucho más interesante. $WSOT2026
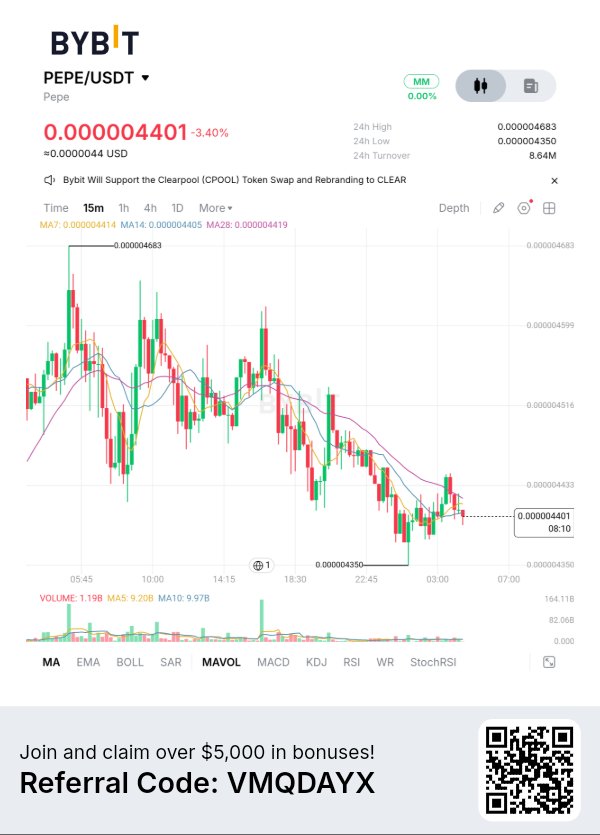
$PEPEUSDT — Me puse bajista cuando PEPE rompió su estructura diaria. Ahora estoy posicionado para una reversión alcista cerca de $0.00000440. Aquí está lo que cambió mi visión a corto plazo. La tendencia bajista mayor no ha desaparecido. Pero algo interesante se está desarrollando en el gráfico de 4H, y no quiero ignorarlo. El precio ha seguido marcando mínimos más bajos, mientras que el RSI está formando mínimos más altos. Eso es una divergencia alcista. Sugiere que los vendedores todavía están empujando el precio hacia abajo, pero el impulso detrás de esos movimientos se está debilitando. El RSI está ahora alrededor de 37.18, ligeramente por encima de su promedio en 36.62. Esta es una mejora temprana, no una confirmación de una reversión. Soy fuertemente alcista sobre la posibilidad de una recuperación sólida desde esta área. La estructura que estoy observando PEPE está intentando estabilizarse alrededor de $0.00000440 después de una caída prolongada. Si los compradores recuperan la resistencia cercana de $0.00000455-$0.00000460 y establecen un mínimo más alto, esa sería mi primera señal significativa de una mejora en la estructura del mercado. Un cambio confirmado en la estructura alcista del mercado podría abrir el camino hacia $0.000004683, seguido por la región de resistencia mayor entre aproximadamente $0.00000480 y $0.00000520. Mi objetivo final para esta configuración es $0.000005414. No estoy restableciendo mi predicción anterior de $0.000010. Esta es una operación de recuperación por separado basada en la divergencia de 4H en desarrollo, con una entrada, stop y objetivo de salida específicos. Mi posición en largo — TP & SL Ya me he posicionado para esta posible reversión, y mi configuración está marcada directamente en el gráfico. Entrada: $0.000004401 Stop-loss: $0.000004172 Take-profit: $0.000005414 Potencial al alza: 23.03% Potencial a la baja definido: 5.20% Relación riesgo-beneficio: 4.43:1 Estos son los rendimientos teóricos basados en el precio antes de apalancamiento, comisiones y deslizamiento (slippage). Mi convicción es fuerte, pero el riesgo es real. Un movimiento a través de $0.000004172 invalidaría mi operación marcada. No ampliaré el stop simplemente porque espero una reversión alcista. Aquí está la distinción importante: la divergencia alcista puede aparecer antes de una reversión, pero no puede garantizar una. Es por eso que estoy atento a que los compradores rompan la secuencia de máximos más bajos en lugar de confiar únicamente en el RSI. He tomado mi posición porque creo que esta configuración en desarrollo ofrece una oportunidad atractiva en relación con su riesgo definido. La tendencia bajista llevó a PEPE hasta esta área. Ahora quiero ver si el debilitamiento del impulso vendedor finalmente puede convertirse en una verdadera fuerza compradora. Si ese cambio de estructura se confirma, esta recuperación podría ponerse mucho más interesante. #WSOT2026
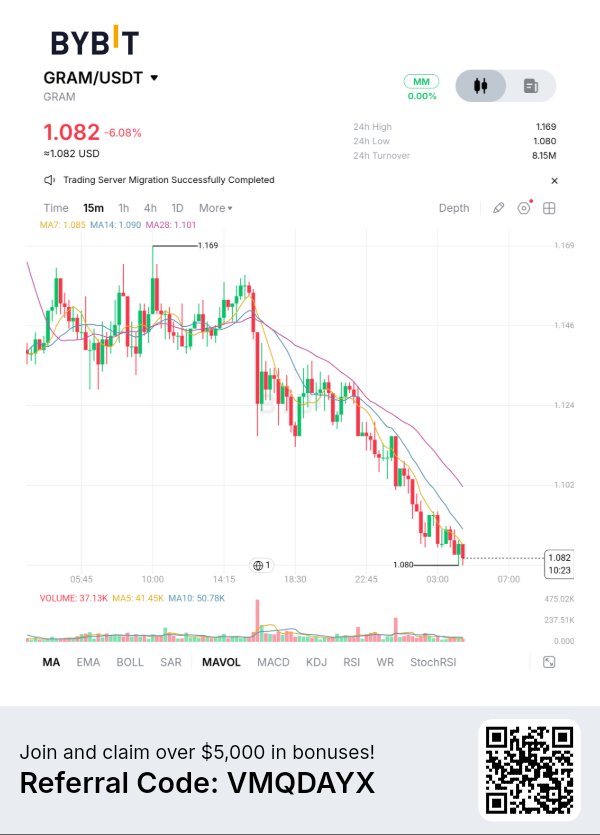
$GRAMUSDT — Me volví bajista cuando GRAM rompió su estructura diaria. Ahora estoy posicionado para una reversión alcista cerca de $1.08. Aquí te explico qué cambió mi perspectiva a corto plazo. La tendencia bajista mayor no ha desaparecido. Pero algo interesante se está desarrollando en el gráfico de 4H, y no quiero ignorarlo. El precio ha continuado marcando mínimos más bajos, mientras que el RSI está formando mínimos más altos. Eso es una divergencia alcista. Sugiere que los vendedores siguen empujando el precio a la baja, pero el impulso detrás de esos movimientos se está debilitando. El RSI está ahora alrededor de 37.18, ligeramente por encima de su promedio en 36.62. Esta es una mejora temprana, no una confirmación de una reversión. Estoy fuertemente alcista respecto a la posibilidad de una recuperación fuerte desde esta área. La estructura que estoy observando GRAM está intentando estabilizarse alrededor de $1.08 después de una caída prolongada. Si los compradores recuperan la resistencia cercana de $1.10-$1.12 y establecen un mínimo más alto, esa sería mi primera señal significativa de una mejora en la estructura del mercado. Un cambio confirmado en la estructura alcista del mercado podría abrir el camino hacia los $1.169, seguido por la región de resistencia mayor entre aproximadamente $1.20 y $1.28. Mi objetivo final para esta configuración es $1.332. No voy a retomar mi predicción anterior de $1.60. Esta es una operación de recuperación por separado basada en la divergencia de 4H en desarrollo, con un objetivo específico de entrada, stop y salida. Mi posición en largo — TP y SL Ya me posicioné para esta posible reversión, y mi configuración está marcada directamente en el gráfico. Entrada: $1.082 Stop-loss: $1.025 Take-profit: $1.332 Potencial de subida: 23.10% Riesgo a la baja definido: 5.27% Riesgo-beneficio: 4.38:1 Estos son los rendimientos teóricos basados en el precio antes de apalancamiento, comisiones y deslizamiento. Mi convicción es fuerte, pero el riesgo es real. Un movimiento por debajo de $1.025 invalidaría mi operación marcada. No voy a ampliar el stop simplemente porque espero una reversión alcista. Aquí está la distinción importante: la divergencia alcista puede aparecer antes de una reversión, pero no puede garantizarla. Es por eso que estoy atento a que los compradores rompan la secuencia de máximos más bajos en lugar de confiar solo en el RSI. He tomado mi posición porque creo que esta configuración en desarrollo ofrece una oportunidad atractiva en relación con su riesgo definido. La tendencia bajista llevó a GRAM hasta esta área. Ahora quiero ver si el debilitamiento del impulso vendedor finalmente puede convertirse en una verdadera fuerza compradora. Si ese cambio de estructura se confirma, esta recuperación podría ponerse mucho más interesante. $WSOT2026
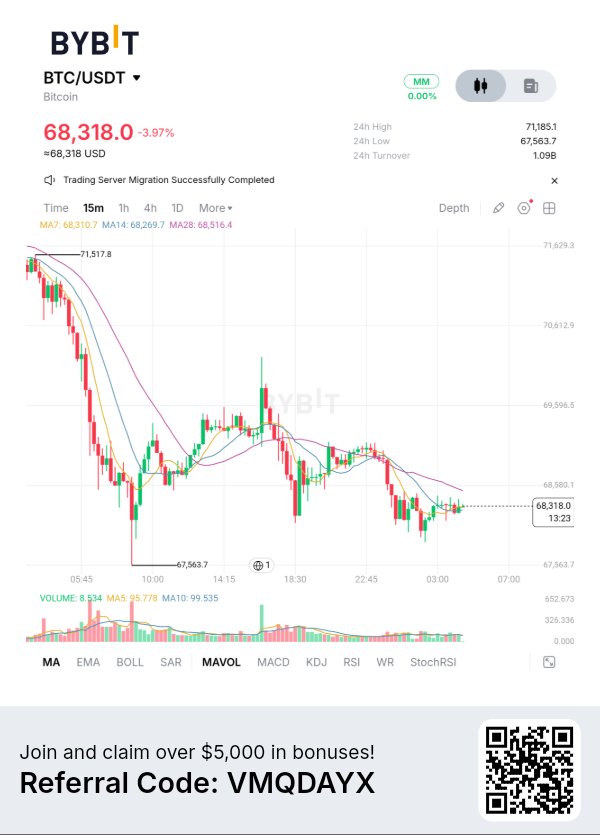
$BTCUSDT — Me puse bajista cuando BTC rompió su estructura diaria. Ahora estoy posicionado para una reversión alcista cerca de los $68,400. Esto es lo que cambió mi perspectiva a corto plazo. La tendencia bajista más grande no ha desaparecido. Pero se está desarrollando algo interesante en la gráfica de 15m / 1H, y no quiero ignorarlo. El precio ha seguido marcando mínimos más bajos, mientras que el impulso vendedor se está desvaneciendo cerca del mínimo de $67,563. Esa es una señal temprana de agotamiento. Sugiere que los vendedores todavía están presionando el precio a la baja, pero el impulso detrás de esos movimientos se está debilitando. BTC ahora cotiza alrededor de $68,404.3, manteniéndose justo por encima de su mínimo de 24 horas. Esta es una mejora temprana, no una confirmación de reversión. Soy bastante optimista sobre la posibilidad de una recuperación fuerte desde esta área. La Estructura que Estoy Observando BTC está intentando estabilizarse alrededor de los $68,400 después de una fuerte caída desde los $71,517. Si los compradores recuperan la resistencia cercana de $69,600-$70,600 y establecen un mínimo más alto, esa sería mi primera señal significativa de una mejora en la estructura del mercado. Un cambio confirmado en la estructura de mercado alcista podría abrir el camino hacia los $71,236, seguido por la región de resistencia mayor entre aproximadamente $71,500 y $72,800. Mi objetivo final para esta configuración es $72,800. No estoy restableciendo mi predicción anterior de $100,000. Esta es una operación de recuperación independiente basada en el agotamiento que se está desarrollando cerca de los mínimos, con una entrada, un stop y un objetivo de salida específicos. Mi Posición en Largo — TP (Toma de ganancias) y SL (Stop-loss) Ya me he posicionado para esta posible reversión, y mi configuración está marcada directamente en la gráfica. Entrada: $68,404.3 Stop-loss: $67,300 Take-profit: $72,800 Potencial al alza: 6.43% Riesgo definido a la baja: 1.61% Relación riesgo-beneficio: 3.98:1 Estos son los rendimientos teóricos basados en el precio antes de apalancamiento, comisiones y deslizamiento (slippage). Mi convicción es fuerte, pero el riesgo es real. Un movimiento por debajo de $67,300 invalidaría mi operación marcada. No ampliaré el stop simplemente porque espero una reversión alcista. Aquí está la distinción importante: el agotamiento cerca de un mínimo puede aparecer antes de una reversión, pero no puede garantizarla. Es por eso que estoy esperando a que los compradores rompan la secuencia de máximos más bajos en lugar de confiar solo en el impulso. He tomado mi posición porque creo que esta configuración en desarrollo ofrece una oportunidad atractiva en relación con su riesgo definido. La tendencia bajista llevó a BTC a esta área. Ahora quiero ver si el debilitamiento del impulso vendedor finalmente puede convertirse en una verdadera fuerza compradora. Si ese cambio de estructura se confirma, esta recuperación podría ponerse mucho más interesante. #WSOT2026
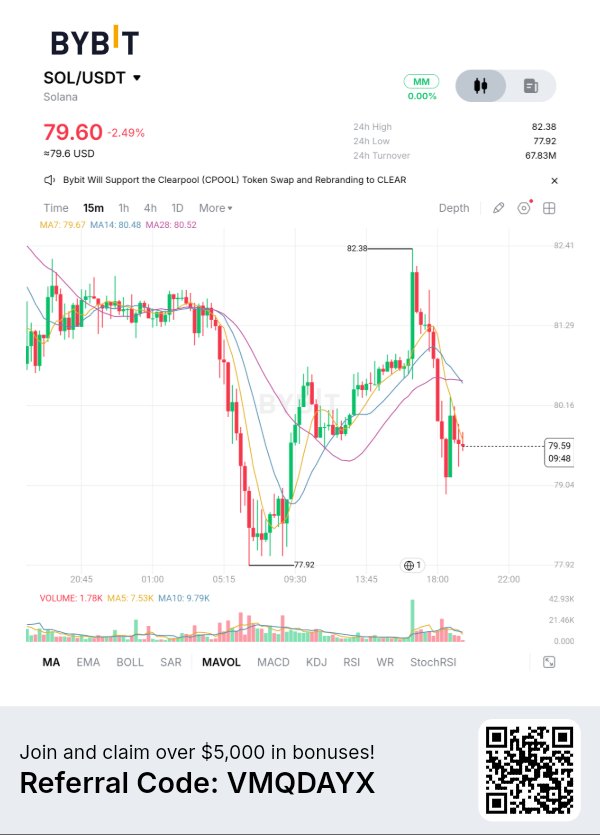
$SOLUSDT — I turned bearish when SOL broke its daily structure. Now I'm positioned for a bullish reversal near $79.72. Here's what changed my short-term view. The bigger downtrend hasn't disappeared. But something interesting is developing on the 15M chart, and I don't want to ignore it. Price has continued making lower lows, while RSI is forming higher lows. That's a bullish divergence. It suggests sellers are still pushing price down, but the momentum behind those moves is weakening. RSI is now around 37.85, slightly above its average at 36.70. This is an early improvement, not confirmation of a reversal. I'm heavily bullish on the possibility of a strong recovery from this area. The Structure I'm Watching SOL is attempting to stabilize around $79.72 after a prolonged decline. If buyers reclaim the nearby $80.50–$81.00 resistance and establish a higher low, that would be my first meaningful sign of improving market structure. A confirmed bullish market structure shift could open the way toward $82.38, followed by the larger resistance region between approximately $86 and $89.50. My ultimate target for this setup is $92.50. I'm not restoring my previous $150 prediction. This is a separate recovery trade based on the developing 15M divergence, with a specific entry, stop and exit objective. My Long Position — TP & SL I've already positioned for this potential reversal, and my setup is marked directly on the chart. Entry: $79.72 Stop-loss: $76.80 Take-profit: $92.50 Potential upside: 16.03% Defined downside: 3.66% Risk-to-reward: 4.38:1 These are the theoretical price-based returns before leverage, fees and slippage. My conviction is strong, but the risk is real. A move through $76.80 would invalidate my marked trade. I won't widen the stop simply because I'm expecting a bullish reversal. Here's the important distinction: bullish divergence can appear before a reversal, but it cannot guarantee one. That's why I'm watching for buyers to break the sequence of lower highs rather than relying on RSI alone. I've taken my position because I believe this developing setup offers an attractive opportunity relative to its defined risk. The bearish trend brought SOL down to this area. Now I want to see whether weakening selling momentum can finally turn into real buying strength. If that structure shift confirms, this recovery could become much more interesting. #WSOT2026