MSALIS
1798Me gusta0Compartir en el chat27Aficionados31Seguir
BUILDER BY PROFESSION
BUILDER BY PROFESSION
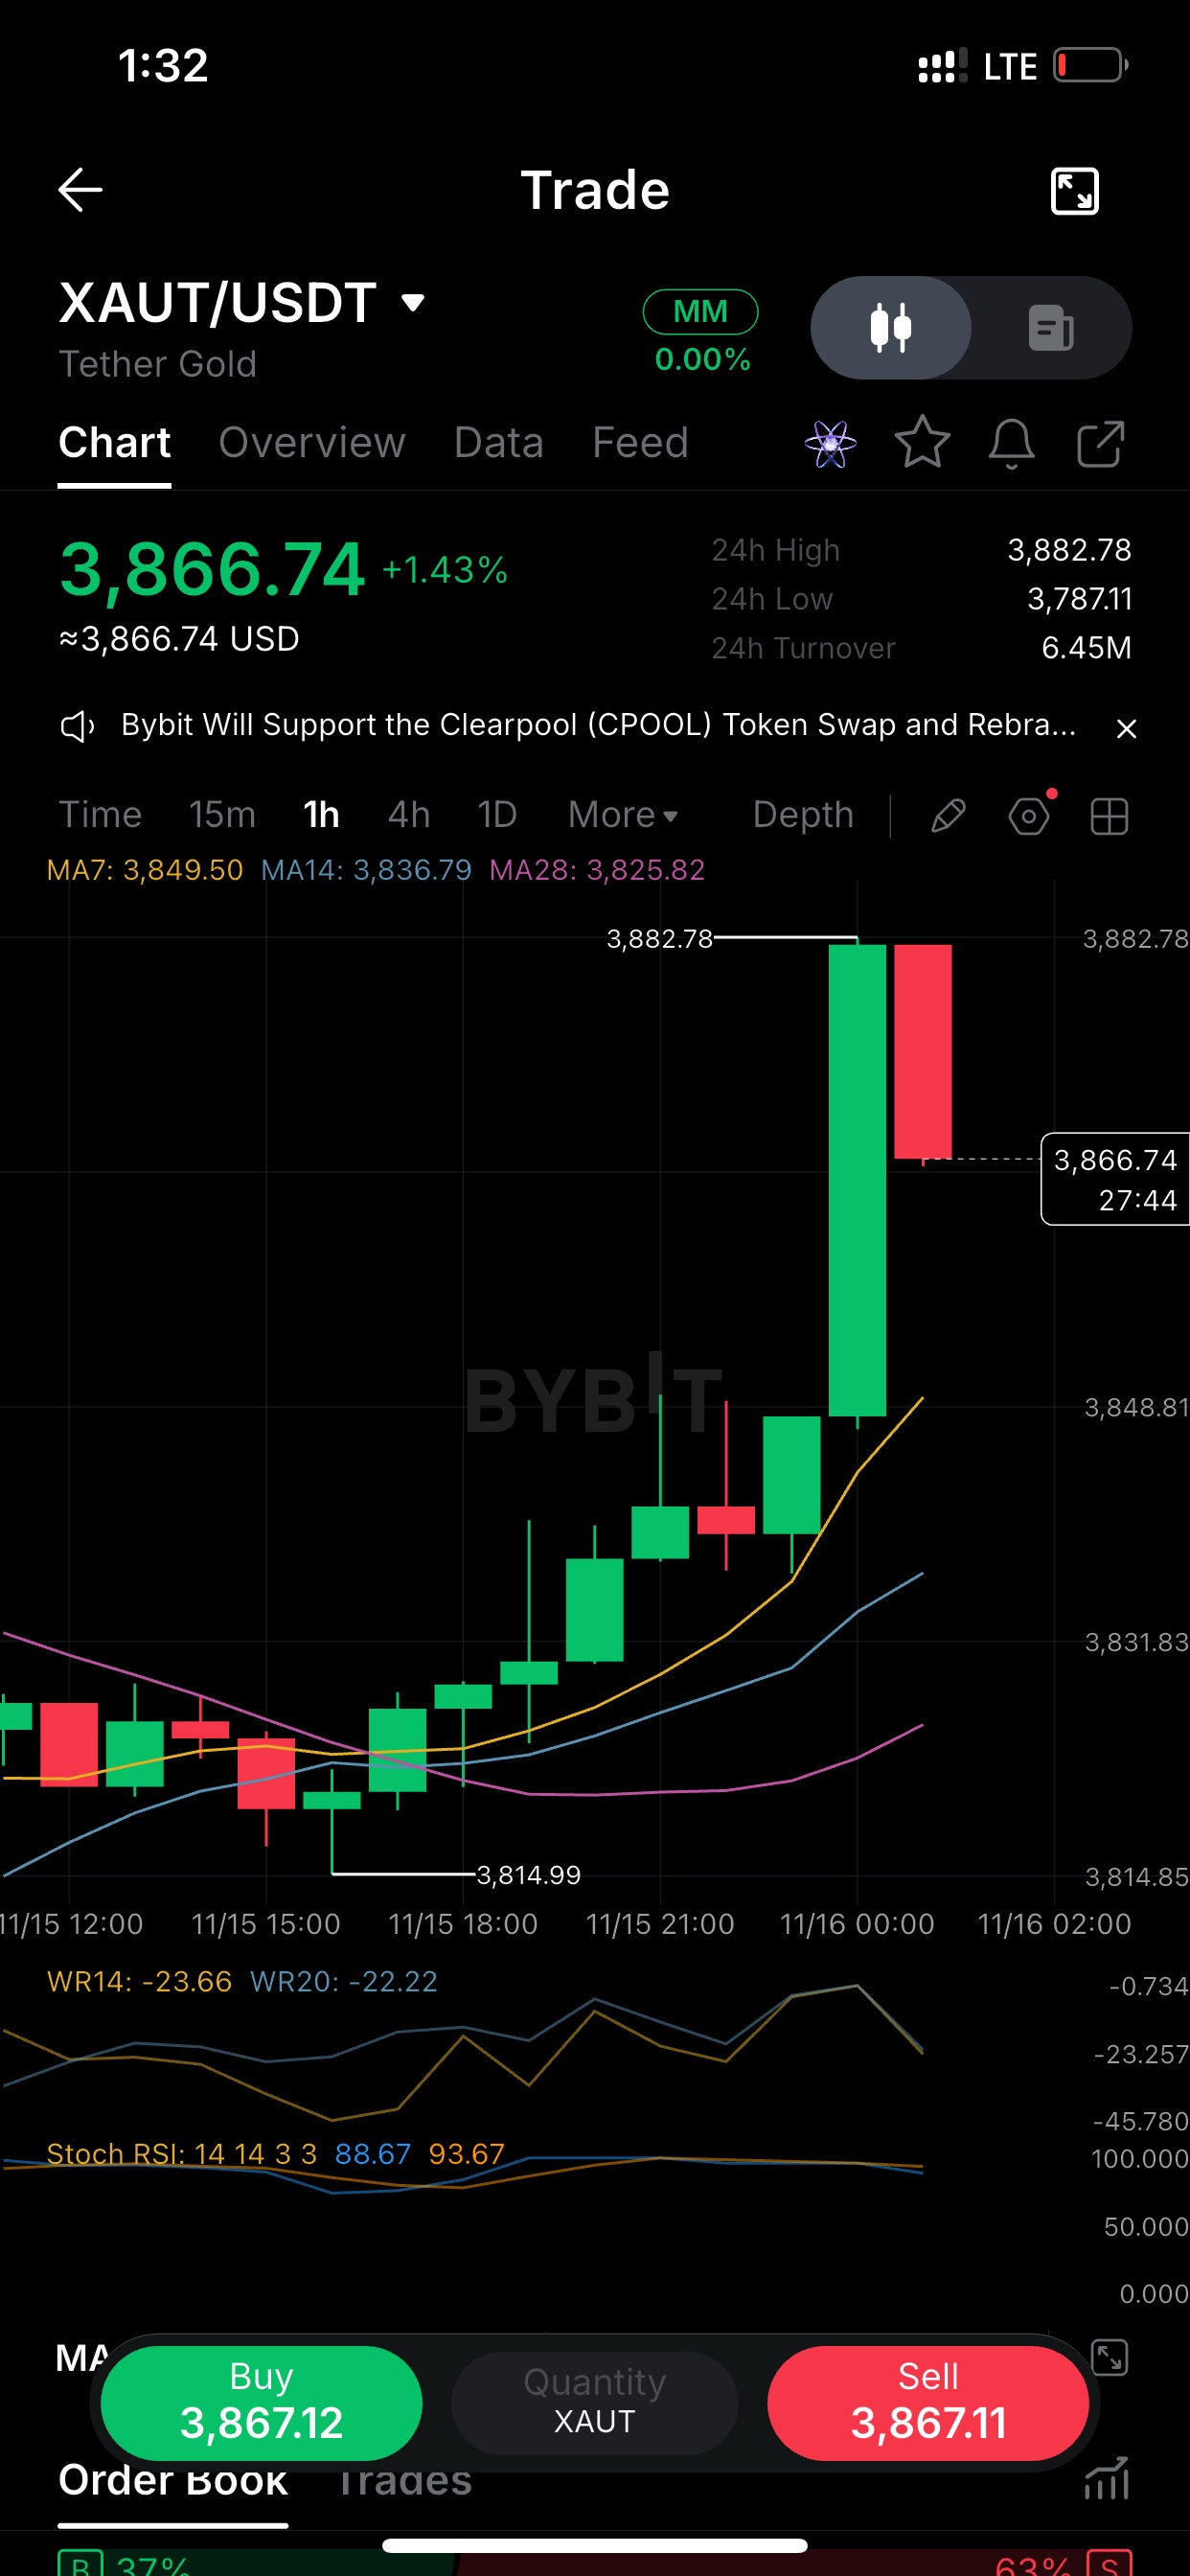
1: the structure $XAUT 1H: the 3,882.78 spike was the first real test of the move, and price is already taking some of it back. Stack is clean though. MA7 3,849 > MA14 3,837 > MA28 3,826, all rising, and the 3,815 swing low is now well behind us. I'm not chasing the green candle. First pullback toward the MA7 is the area I'd watch for a reaction. 2: the momentum read Stoch RSI on XAUT 1H is sitting at 88/93. After a +1.4% day that's not a surprise, but it does mean the easy part of this leg is probably done. Williams %R already rolled over from near zero to -23, so momentum is cooling before price has even given back much. Trend still up, entry quality is the question. I'd rather wait than pay the top of the wick. 3: levels Levels I'm using on $XAUT (1H): Resistance: 3,882.78, the 24h high, rejected once already Support: 3,849 (MA7), then 3,837 (MA14) Invalidation: back under 3,826 Price 3,866 right now, so the room to support is about 17 points and the room to resistance is about 16. That's not much edge in the middle of the range. Patience pays here. Let it come to a level. A few notes for your leaderboard score: - Post one per day at most, spaced out, so you stay clear of the duplicate and high-frequency rules.$XAUTUSDT - Add the $XAUT tag or a trading widget when you publish, since posts need one of them to count. - If you want a different tone (more aggressive, or more educational), tell me and I'll rework the set. #ByXIMPACT
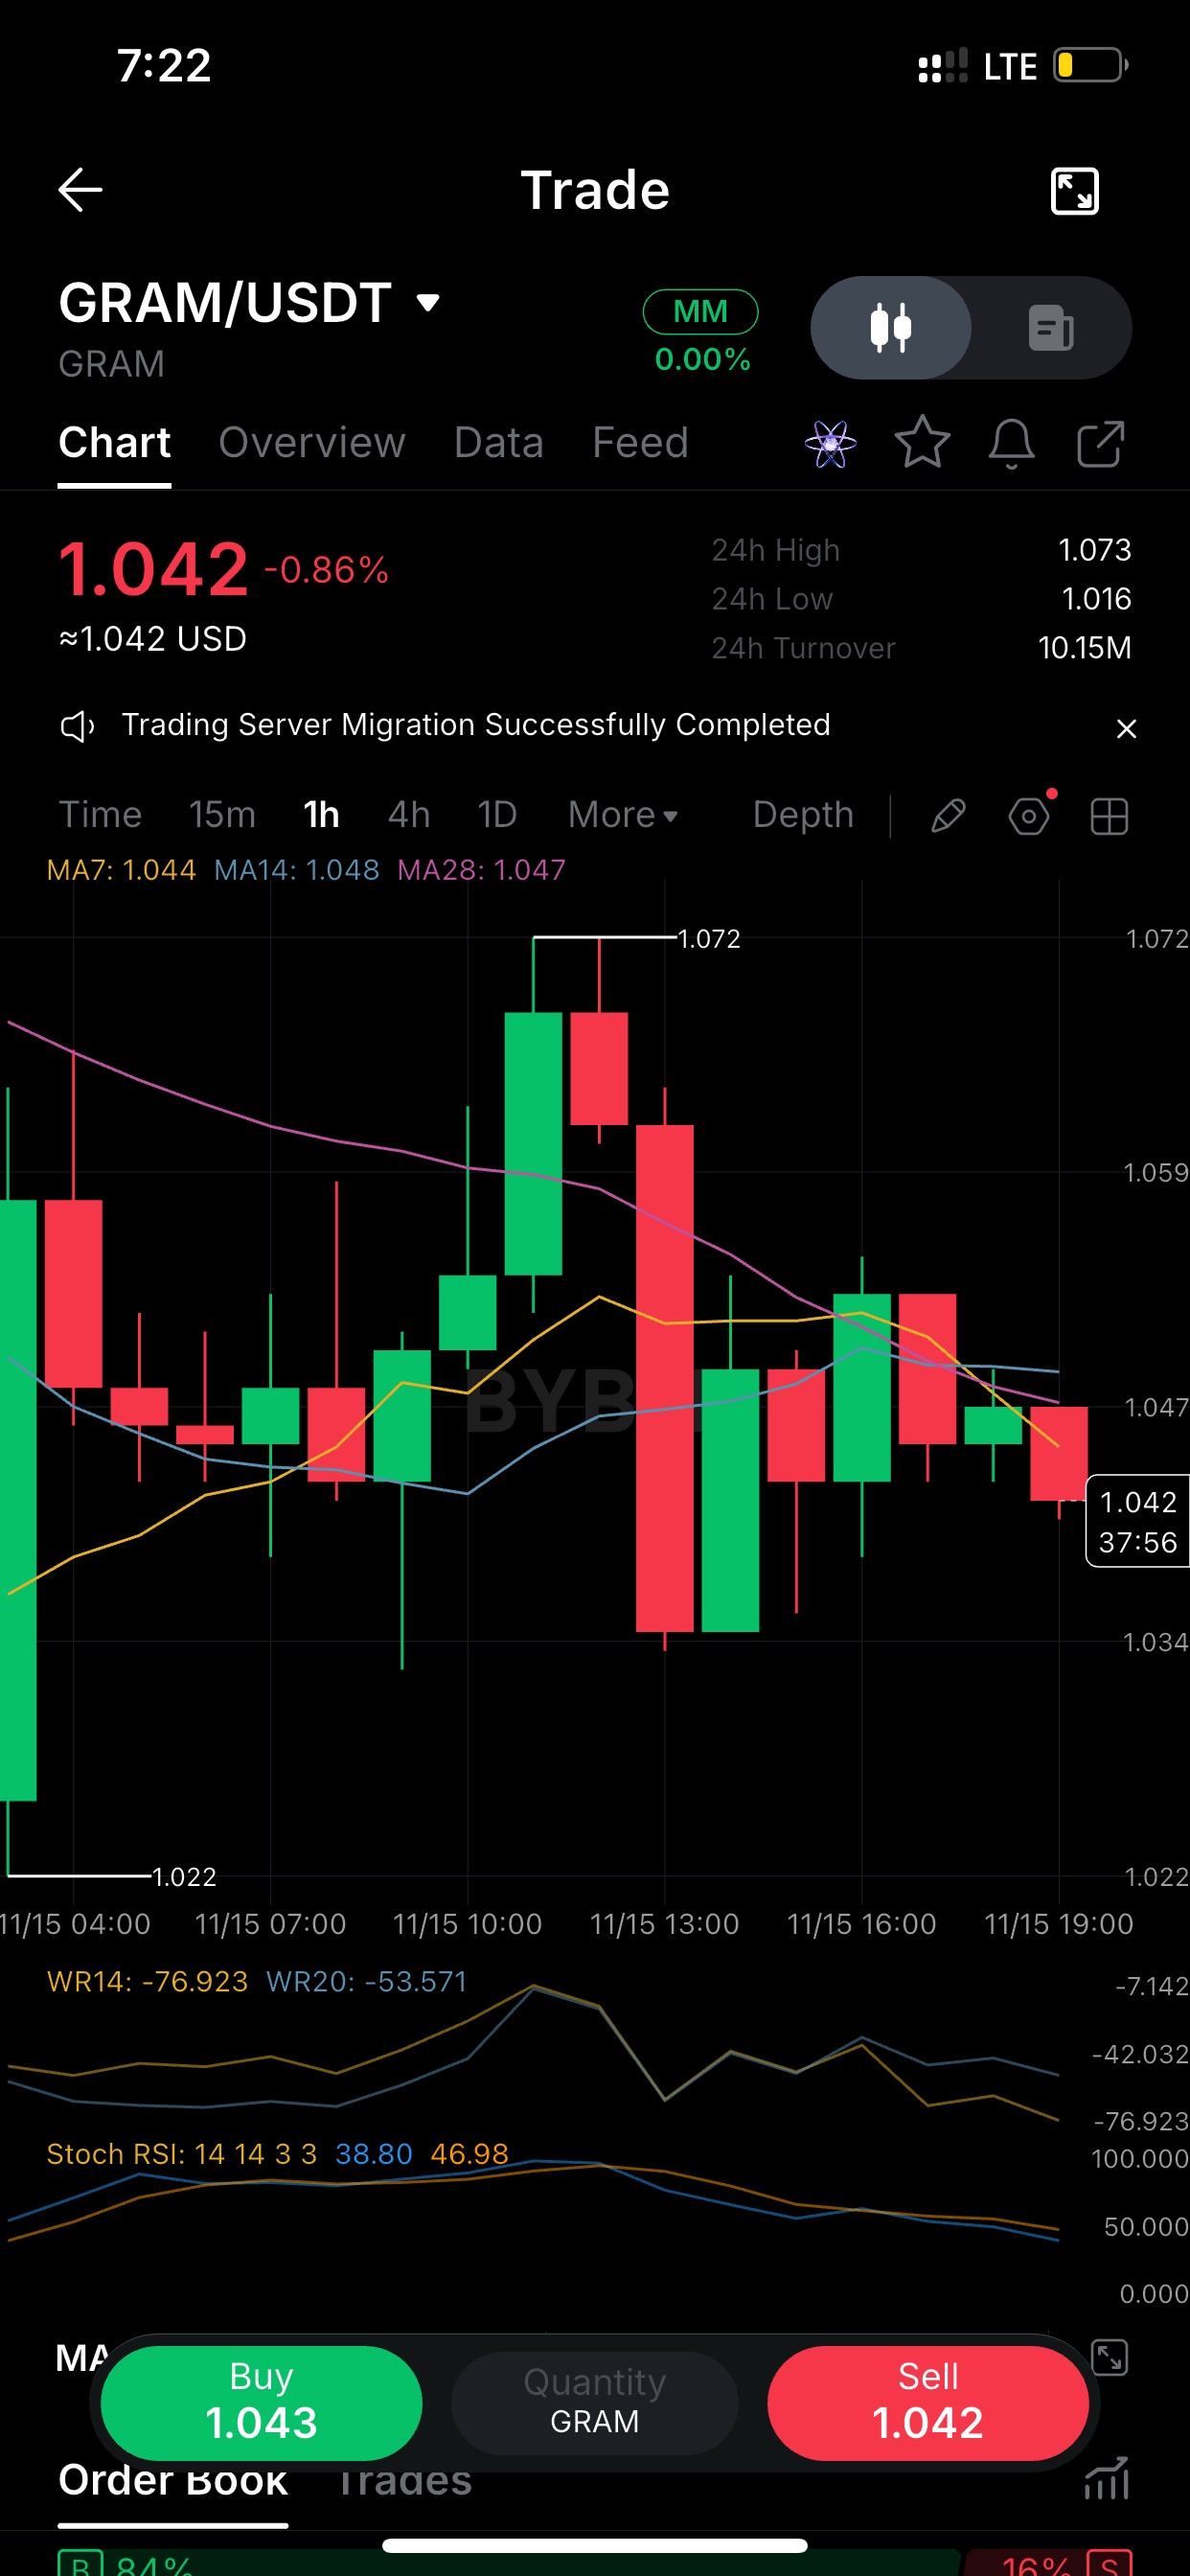
$GRAMUSDT printed 1.072 around 10:00 UTC and got sold straight back down. The red candle that followed erased almost the whole move and wicked to 1.034. Since then it's been lower highs, and price now sits at 1.042 under all three MAs (7/14/28 clustered at 1.044-1.048). That cluster is the first thing bulls need to reclaim. Until then I treat bounces as rallies into resistance, not a trend change. GRAM/USDT, 1h. Range is clean: 1.022 low, 1.072 high, and price is chopping in the lower half at 1.042. Momentum read: Stoch RSI is mid-range (about 39/47), so it's not oversold and there's room to slide further. Williams %R(14) is at -77, leaning weak but not washed out. If 1.034 (the last swing low) breaks on a closing basis, I'd expect a retest toward the 1.02 area. If buyers push back above 1.048, the bias flips neutral. Waiting on one of those two. 24h turnover on $GRAM is about 10M with a 1.016-1.073 range, so it's moving, but the 1h structure says sellers have the upper hand right now. Not chasing either side here. The setup I'd watch: a 1h close back above the MA cluster near 1.048 with a green candle that holds. Without that, every pop is just noise inside the range. One heads-up: the GRAM/USDT screen shows an MM tag and 0.00% fee badge. If this is a zero-fee or market-maker pair, trades on it are excluded from the trading impact part of the score. Your posts can still earn points on content quality, engagement and consistency, so make sure to use the coin tag or trading widget on each post. Also, spread these out over the day rather than posting all three at once, since high-frequency posting can get muted. #IMPACTbyTrade
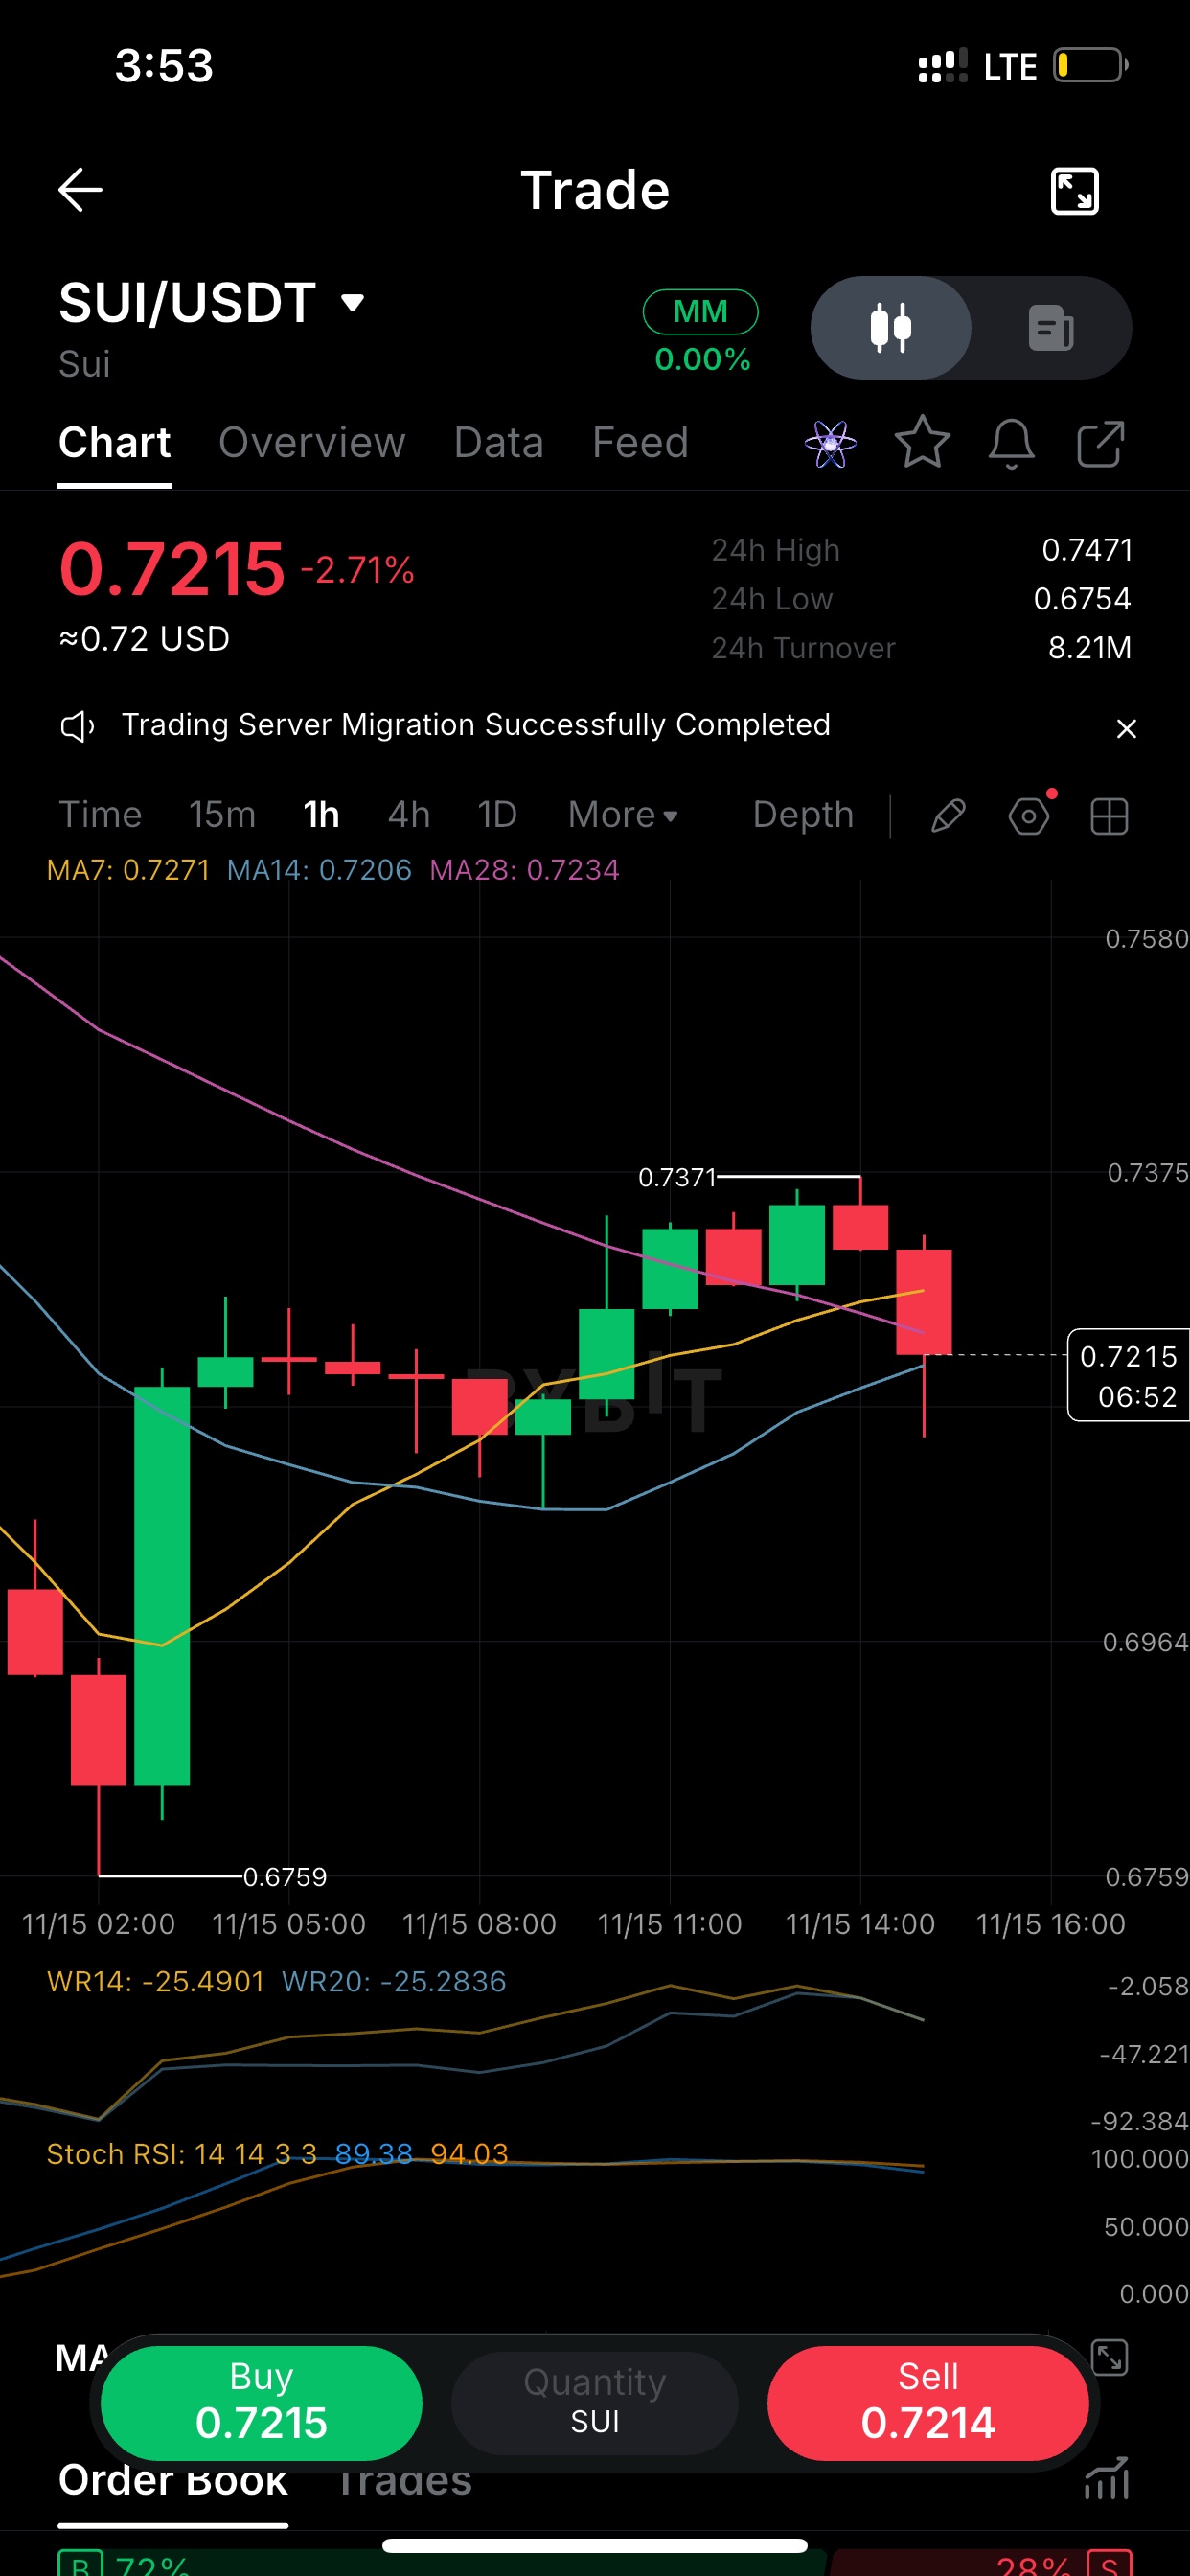
$SUIUSDT Three independent SUI posts from this 1h chart. Each is a different angle and structure, so you can post one now and save the others for later. Tap the copy icon on each block. $SUI got rejected at 0.7371 on the 1h and sold back to 0.7215 in two candles. The last bar wicked down and recovered, so dip buyers are still showing up. Price is pinned to the 14 MA (0.7206) and is below the 7 MA (0.7271) and 28 MA (0.7234). That's chop, not trend. I won't chase a long until a 1h candle closes back above 0.7271. ``` SUI levels I'm watching today: Resistance: 0.7371, the local top it just failed at. Support: 0.7206 first, then 0.6964. Range low: 0.6759, the bounce origin from early session. Bounce from 0.6759 to 0.7371 was roughly 9%. Holding above 0.72 keeps that structure intact. A clean 1h close under it and I'd expect a retest of 0.6964. Everyone sees the red candle on $SUI. I see a pullback that hasn't broken anything. Higher low from the 0.6759 flush, price still hugging the 14 MA, and sellers couldn't push it below the wick. Stoch RSI was near the top of its range, so a cool-off was due. Not bullish yet. The 0.7371 breakout is what flips my bias. Attach the $SUI coin tag or a trading widget to each post. Space them out rather than posting all three at once, since similar or rapid-fire posts can be discounted or get you muted. If you send another chart, I'll keep the voice varied. #IMPACTbyTrade
$XAUTUSDT XAUT 1h: gold-backed token is coiling around 3,820 after the 3,766 flush. MA7 (3,822), MA14 (3,815) and price are all stacked within about 10 dollars of each other, with MA28 at 3,832 just overhead. When the averages bunch up like this, the next move is usually a range break, not a drift. Candle bodies are shrinking each hour. Compression this tight rarely lasts, so I'm waiting for a close beyond 3,841 or below 3,800 before I take a side. Gold on a 1h: down 1.1% on the day, but buyers defended 3,766 and haven't let it go back. That level is the one that matters. As long as it holds, the bounce structure stays intact: higher lows from the bottom, and price back on top of MA14. The ceiling is 3,832 to 3,841, where MA28 and the previous swing high sit together. Stoch RSI is at 97 and WR14 is at -18, so the 1h is stretched into that wall. I'd expect a reaction there before any breakout. range check: 24h high 3,871 24h low 3,766 @ Now 3,825, roughly mid-range Mid-range is the worst place to open a position, so I'm not forcing anything here. Longs look cleaner on a hold above 3,815 or a break of 3,841. Shorts only make sense on a rejection from 3,832 with a lower high. Until one of those prints, it's a patience trade. As before, add thetag or a trading widget, and space the posts out. Send the next chart whenever you're ready. #IMPACTbyTrade
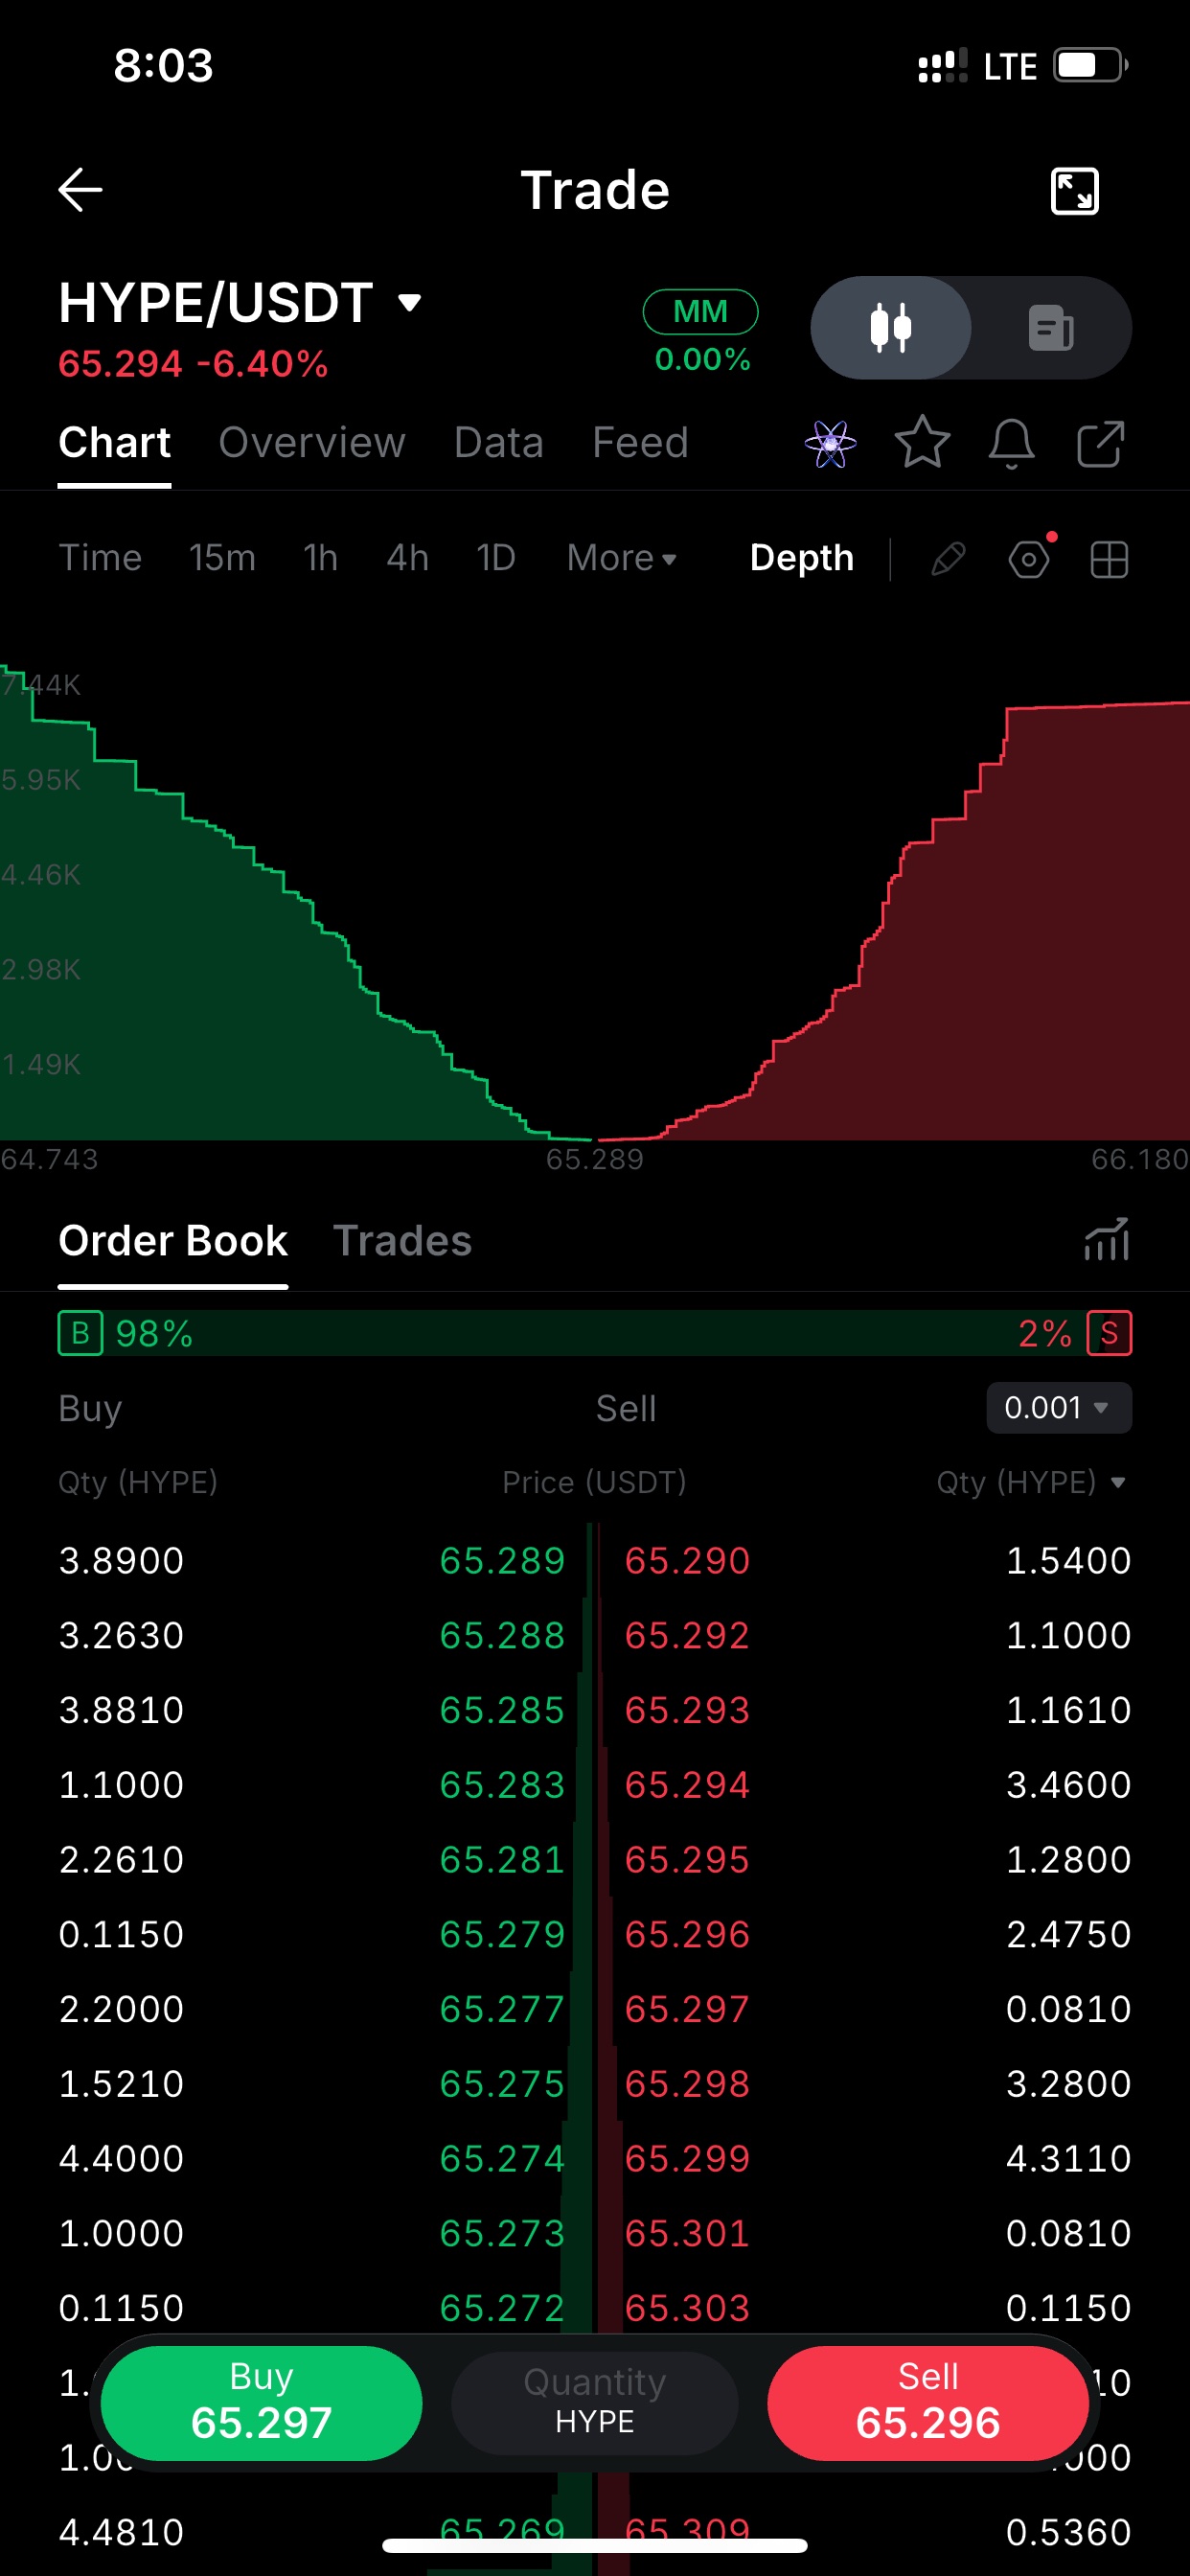
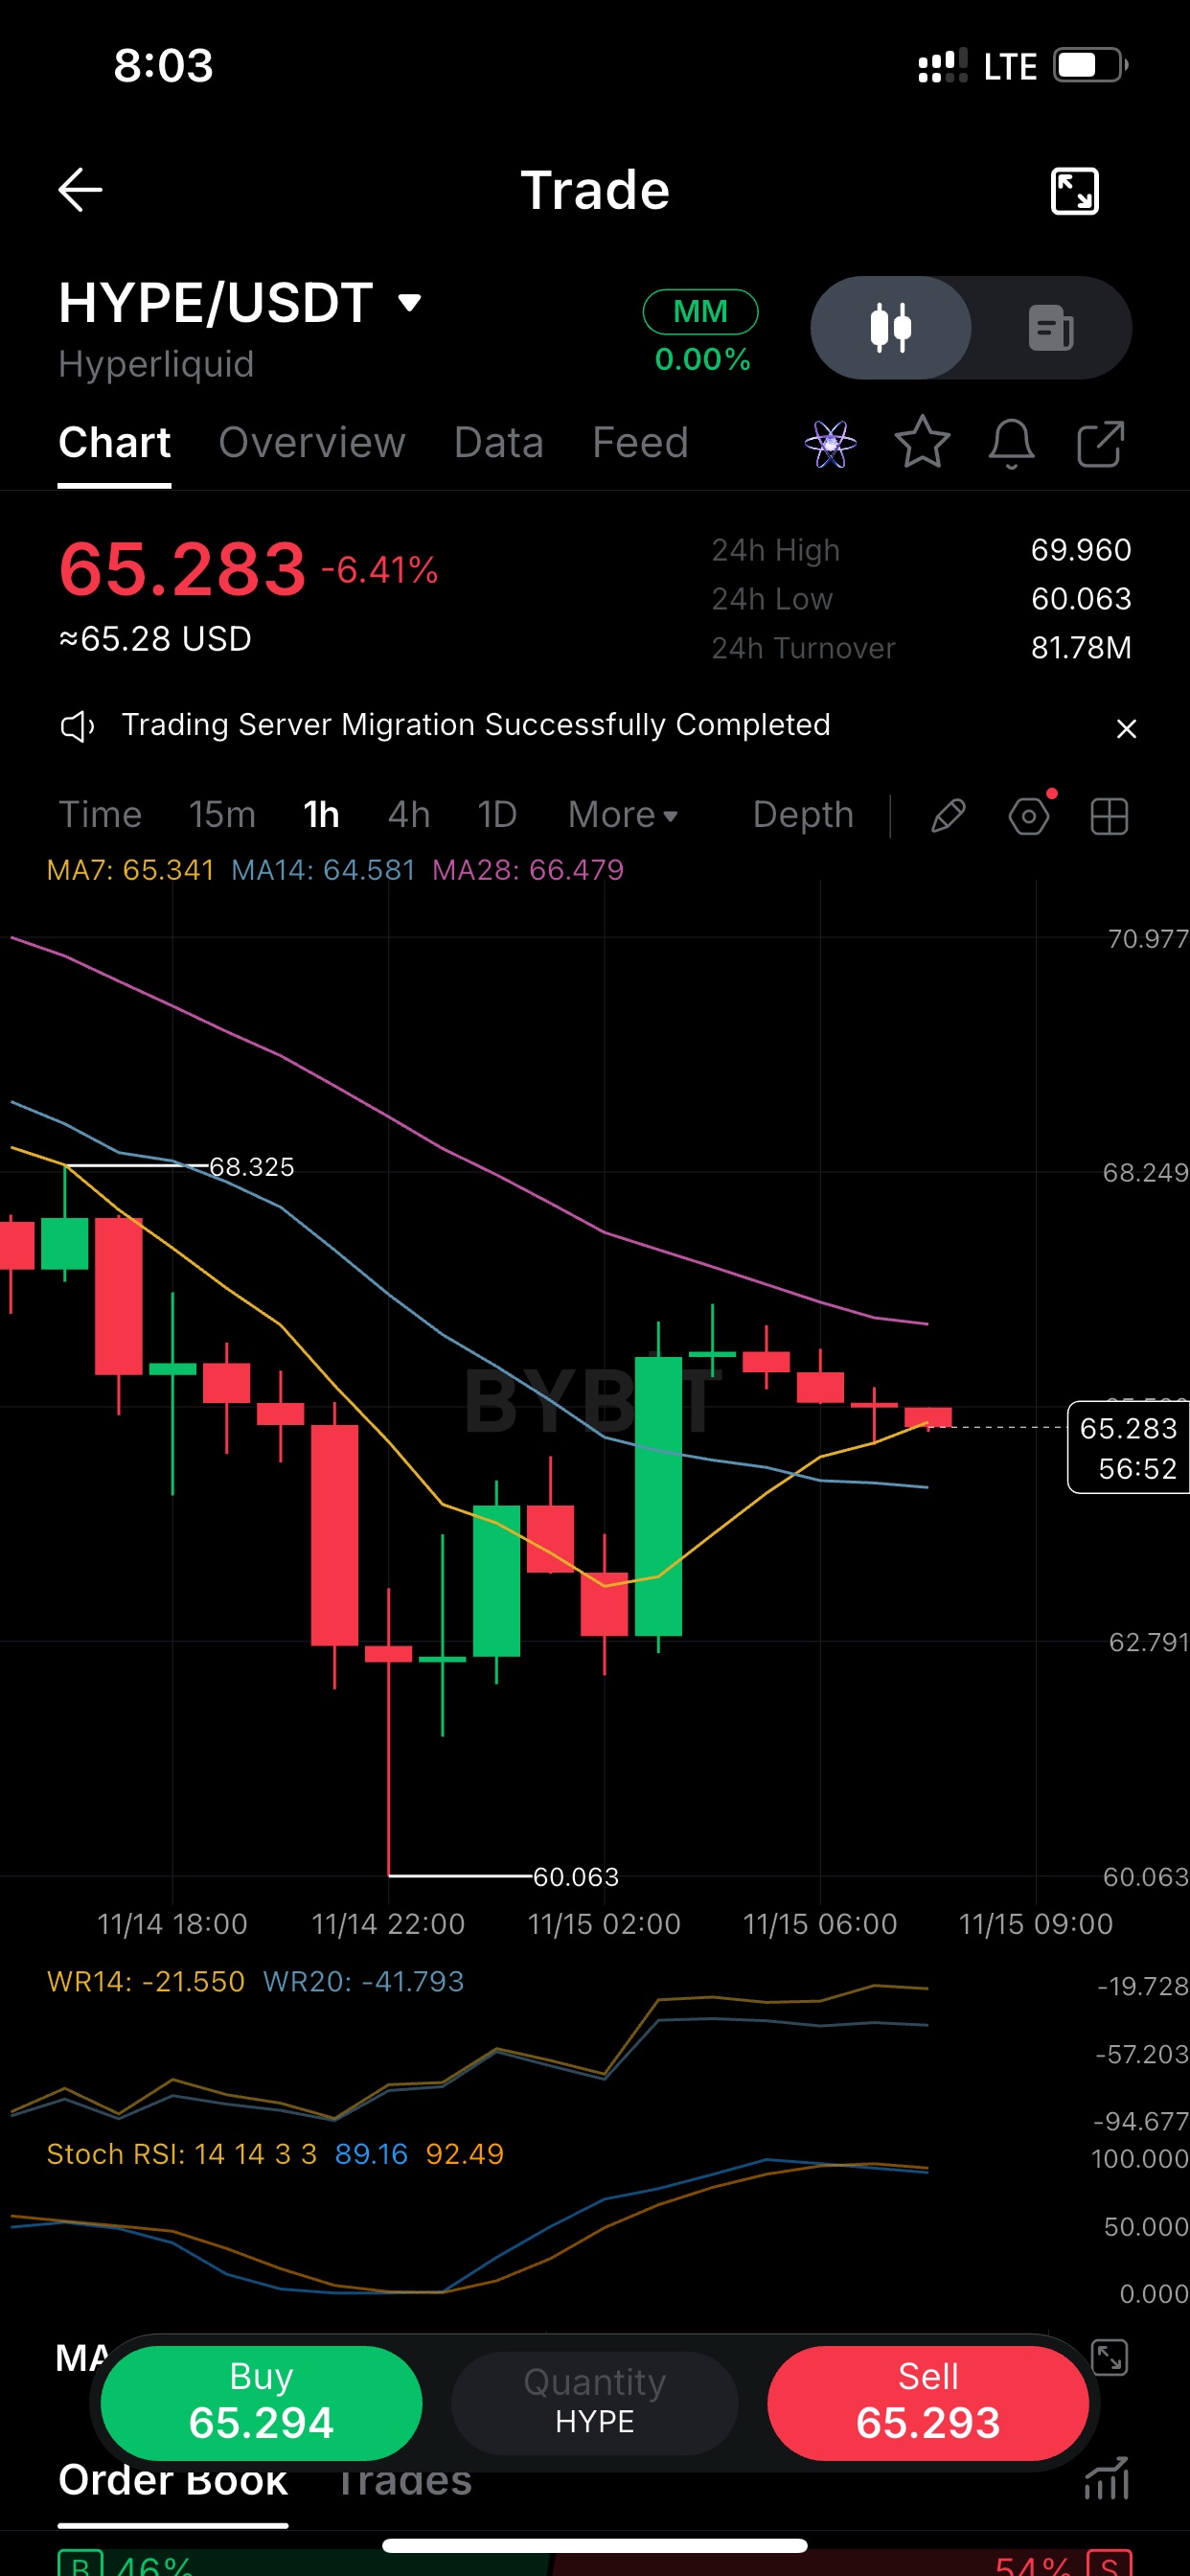
$HYPEUSDT 1h: the 60.06 flush got bought hard, but the bounce stalled right under MA28 (66.5) and price is now rolling back. Lower high, then a run of small red candles back onto MA7 at 65.3. Down 6.4% on the day, with a 69.96 to 60.06 range, so volatility is high and nobody is in control yet. Bulls need a 1h close back above 66.5. Until then this is a relief rally inside a downtrend. Post 2 Everyone saw the 60 wick. The more important question is what HYPE did afterwards. It reclaimed 65+, failed to hold the 66-67 zone, and is now back at the 7-period average. The 1h MAs are still stacked bearish with MA28 overhead and sloping down. Stoch RSI is still around 90 after that bounce, so momentum has cooled while price is giving back gains. I'm watching 64.5 (MA14). If it holds, the range stays 62 to 66.5. If it breaks, the 60 low gets retested. Post 3 HYPE 24h: high 69.96, low 60.06, now 65.28. That's a 16% swing, and price sits right in the middle of it. I'm not forcing a trade in the middle of a range. Support: 64.5, then 62.8 Resistance: 66.5, then 68.3 I'd rather wait for a reaction at one of those levels than guess direction here. Post at least a few hours apart from the earlier posts, since similar posts on the same coin can be discounted. Add thtag or a trading widget to each one. #ByXIMPACT
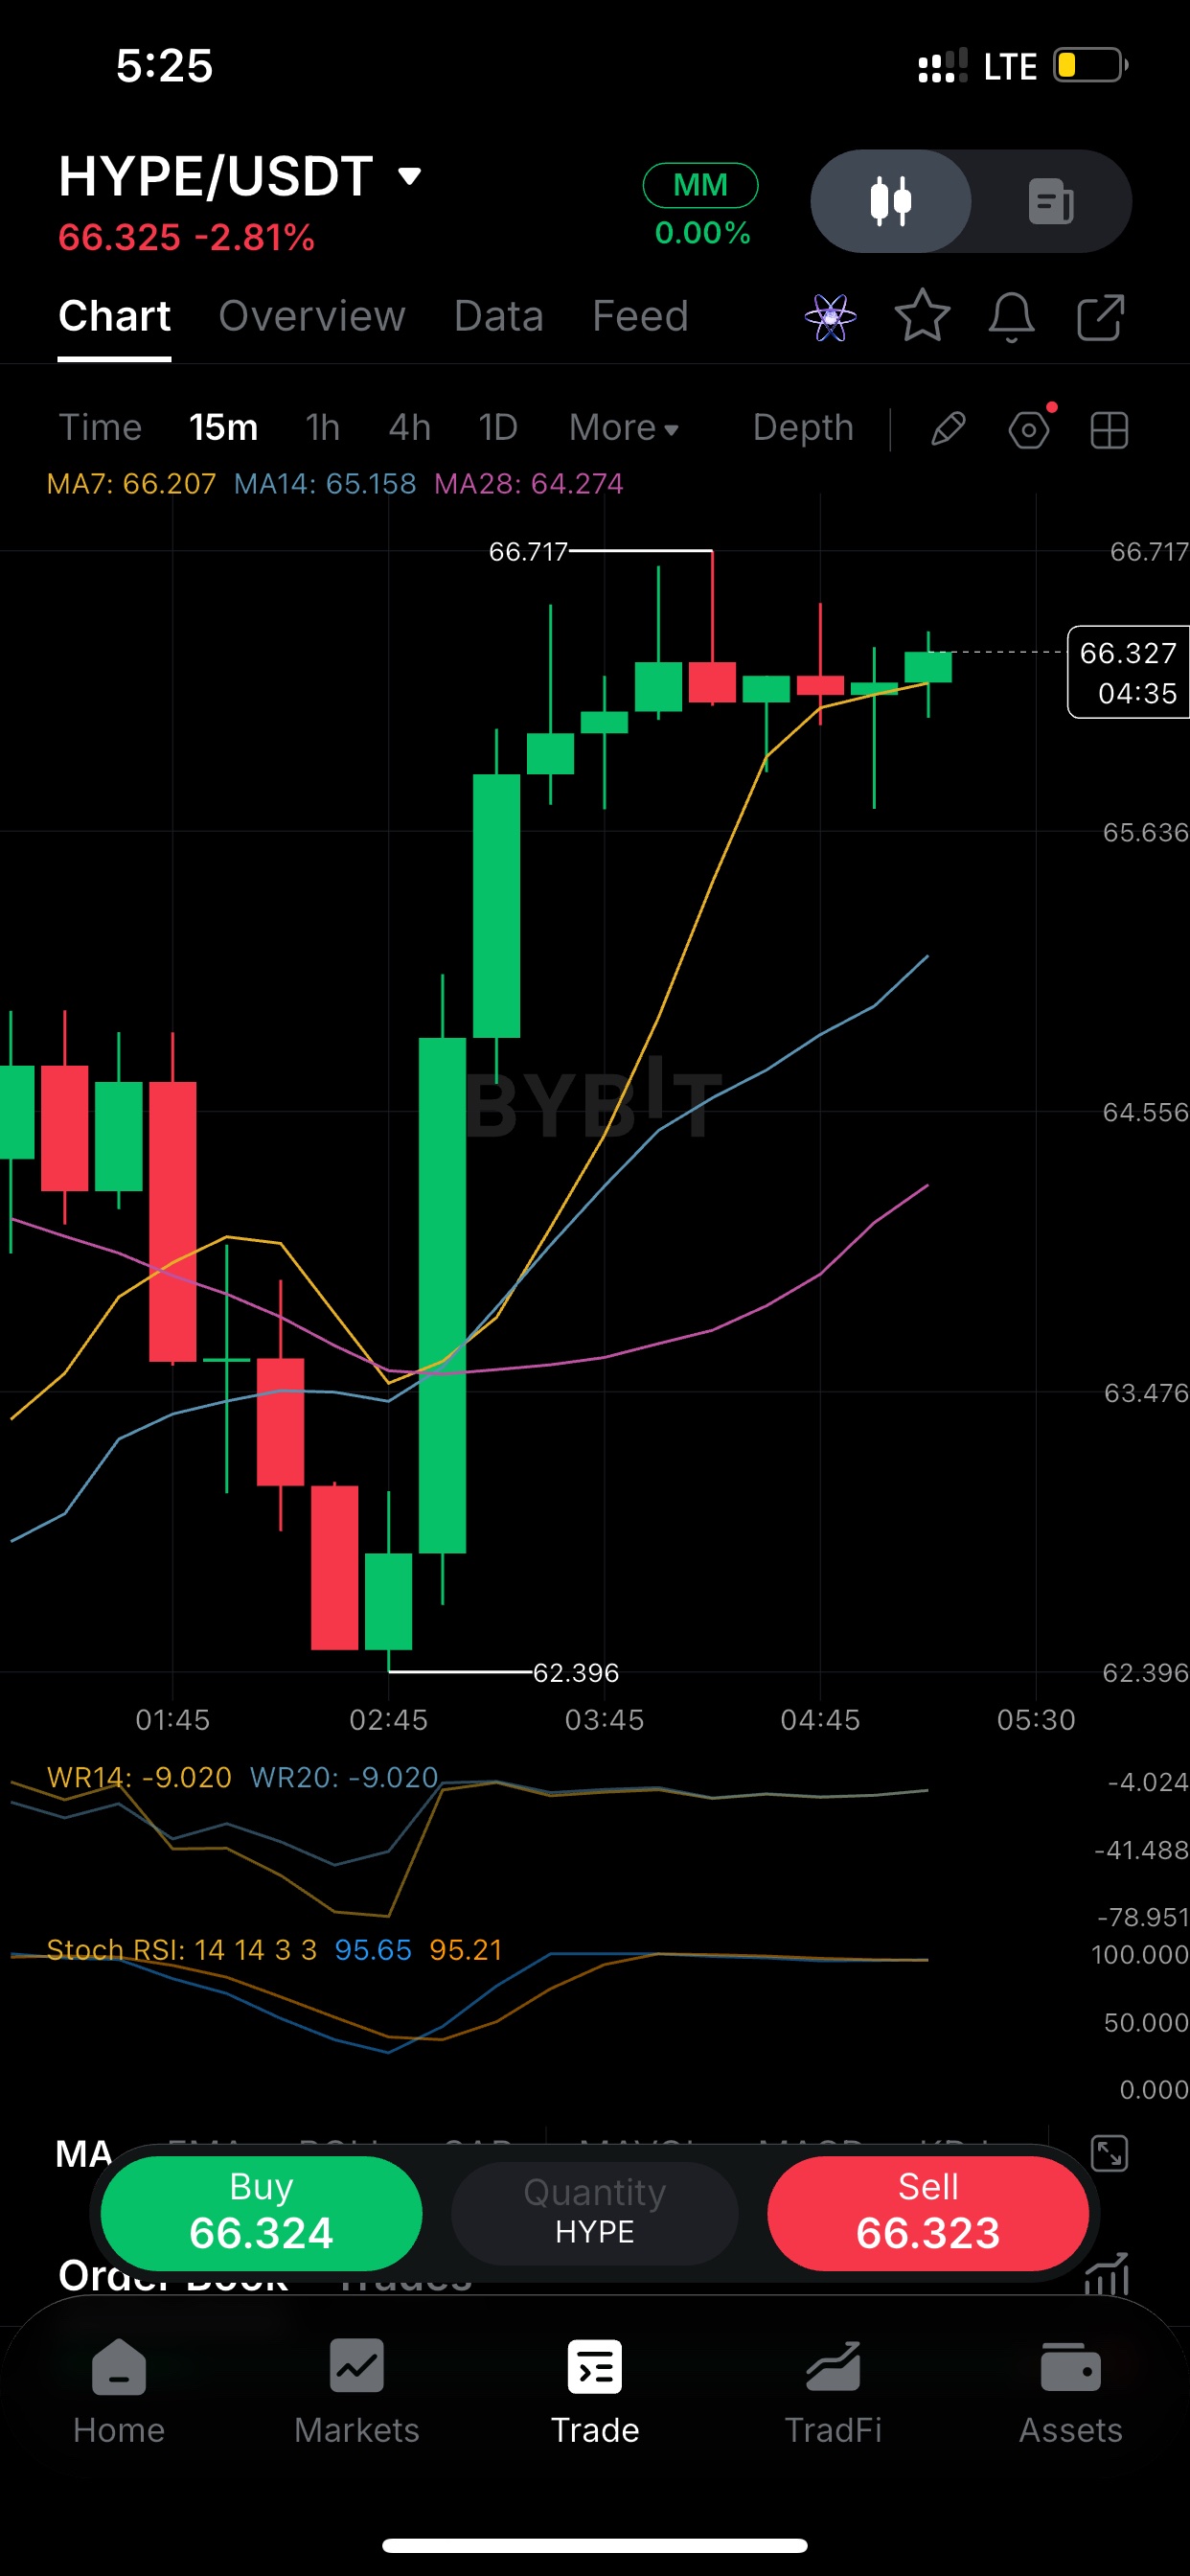
$HYPEUSDT 15m: went from 62.40 to 66.72 in about 3 hours and has since gone sideways just under the high. Candles are small, wicks are on both sides, and MA7 (66.2) is flat and acting as support. The pullbacks are shallow. That looks like digestion, not distribution. Stoch RSI is pinned at 95 and WR is at -9. Momentum is still hot, so I'm not chasing here. I'd rather see a dip toward MA7 or a clean 15m close above 66.72. HYPE is holding 66.3 after a 7% intraday leg up, and the MA stack is doing its job. MA7 66.2 > MA14 65.2 > MA28 64.3, all sloping up. The gap between MA7 and MA14 is still wide, which means price is extended from the mean. Levels I'm watching: Above: 66.72 (local high) Below: 65.6, then the 64.5 area A break of 66.72 with volume keeps the trend alive. Losing MA7 on a closing basis would be the first real warning. Five candles at the top of the range and HYPE still hasn't given anything back. Buyers are defending every small dip. The catch is that the oscillators are maxed out. Stoch RSI is around 95 and Williams %R is near -9 on the 15m. Strong trends can stay overbought for a long time, so I read this as "don't short it" rather than "go long here." My plan is to wait. If it dips to the 65.6 zone and holds, that's a better risk/reward than buying 66.3 under resistance. A few things to keep in mind for the leaderboard: - Add a trading widget or coin tag owhen you post, since it helps the post count. - Don't post two of these close together, because similar posts can be discounted and high-frequency posting can get you muted. Spread them out, or use only one per chart. - Send me your next chart and I'll write it with a different angle. #ByXIMPACT
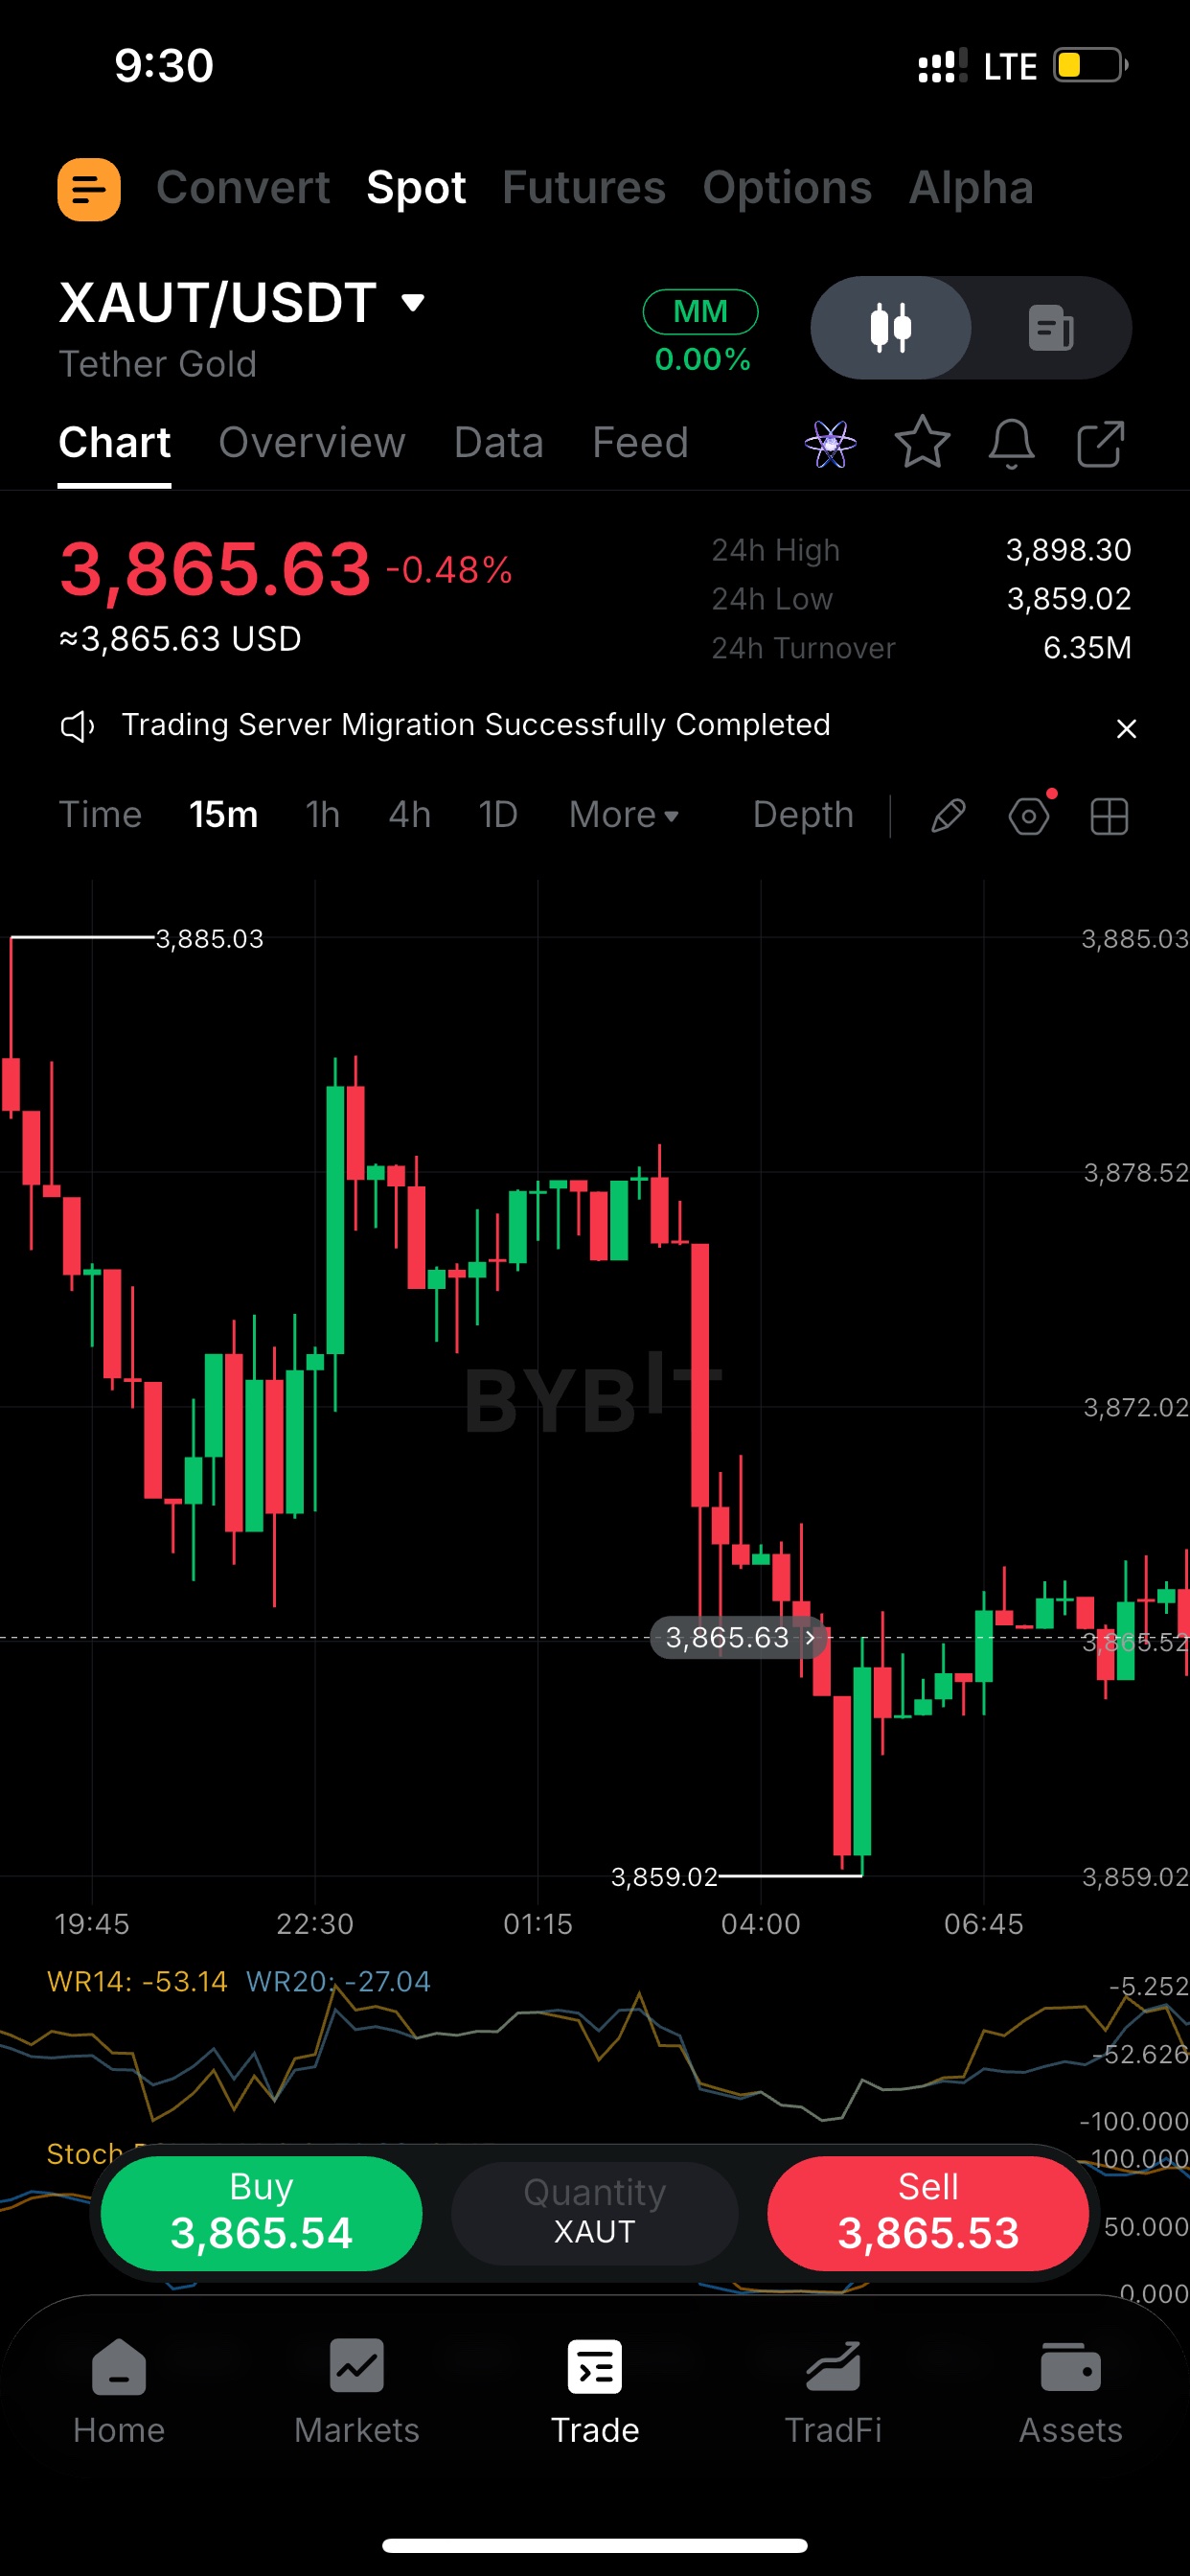
$BTCUSDT swept 65,004 on the 15m and reversed almost instantly. That long wick under the 18:00 candle looks like stops getting taken, not real selling. The bounce ran into 66,235 and failed there. Now it's back at 65.8k, with sellers still defending the upper side of this range. 65,000 to 66,200 is the box. I trade the edges, not the middle. 2 (context and risk) BTC is down 4.5% on the day after a 69,126 high, and the 15m bounce hasn't changed the trend. Lower highs since 66,645 this afternoon. Stoch RSI is pinned at 91/95, so the short-term move is stretched. A cooling-off back toward 65,400 wouldn't surprise me. A clean loss of 65,000 and I'd expect a quick move lower. No position until one of those two levels decides it. 3 15m: 65,004 held, but the bounce stalled under 66.2k. Which breaks first? 1) Reclaim of 66.2k, then a retest of 66.6k 2) Another sweep of 65k, this time with follow-through I'm leaning toward 2 unless buyers show up with volume. What's your read? - Space these out over the week and tag on each one. - If you want one more angle, I can write a short post on the 24h range (65,004 to 69,126) and where price sits inside it. #IMPACTbyTrade
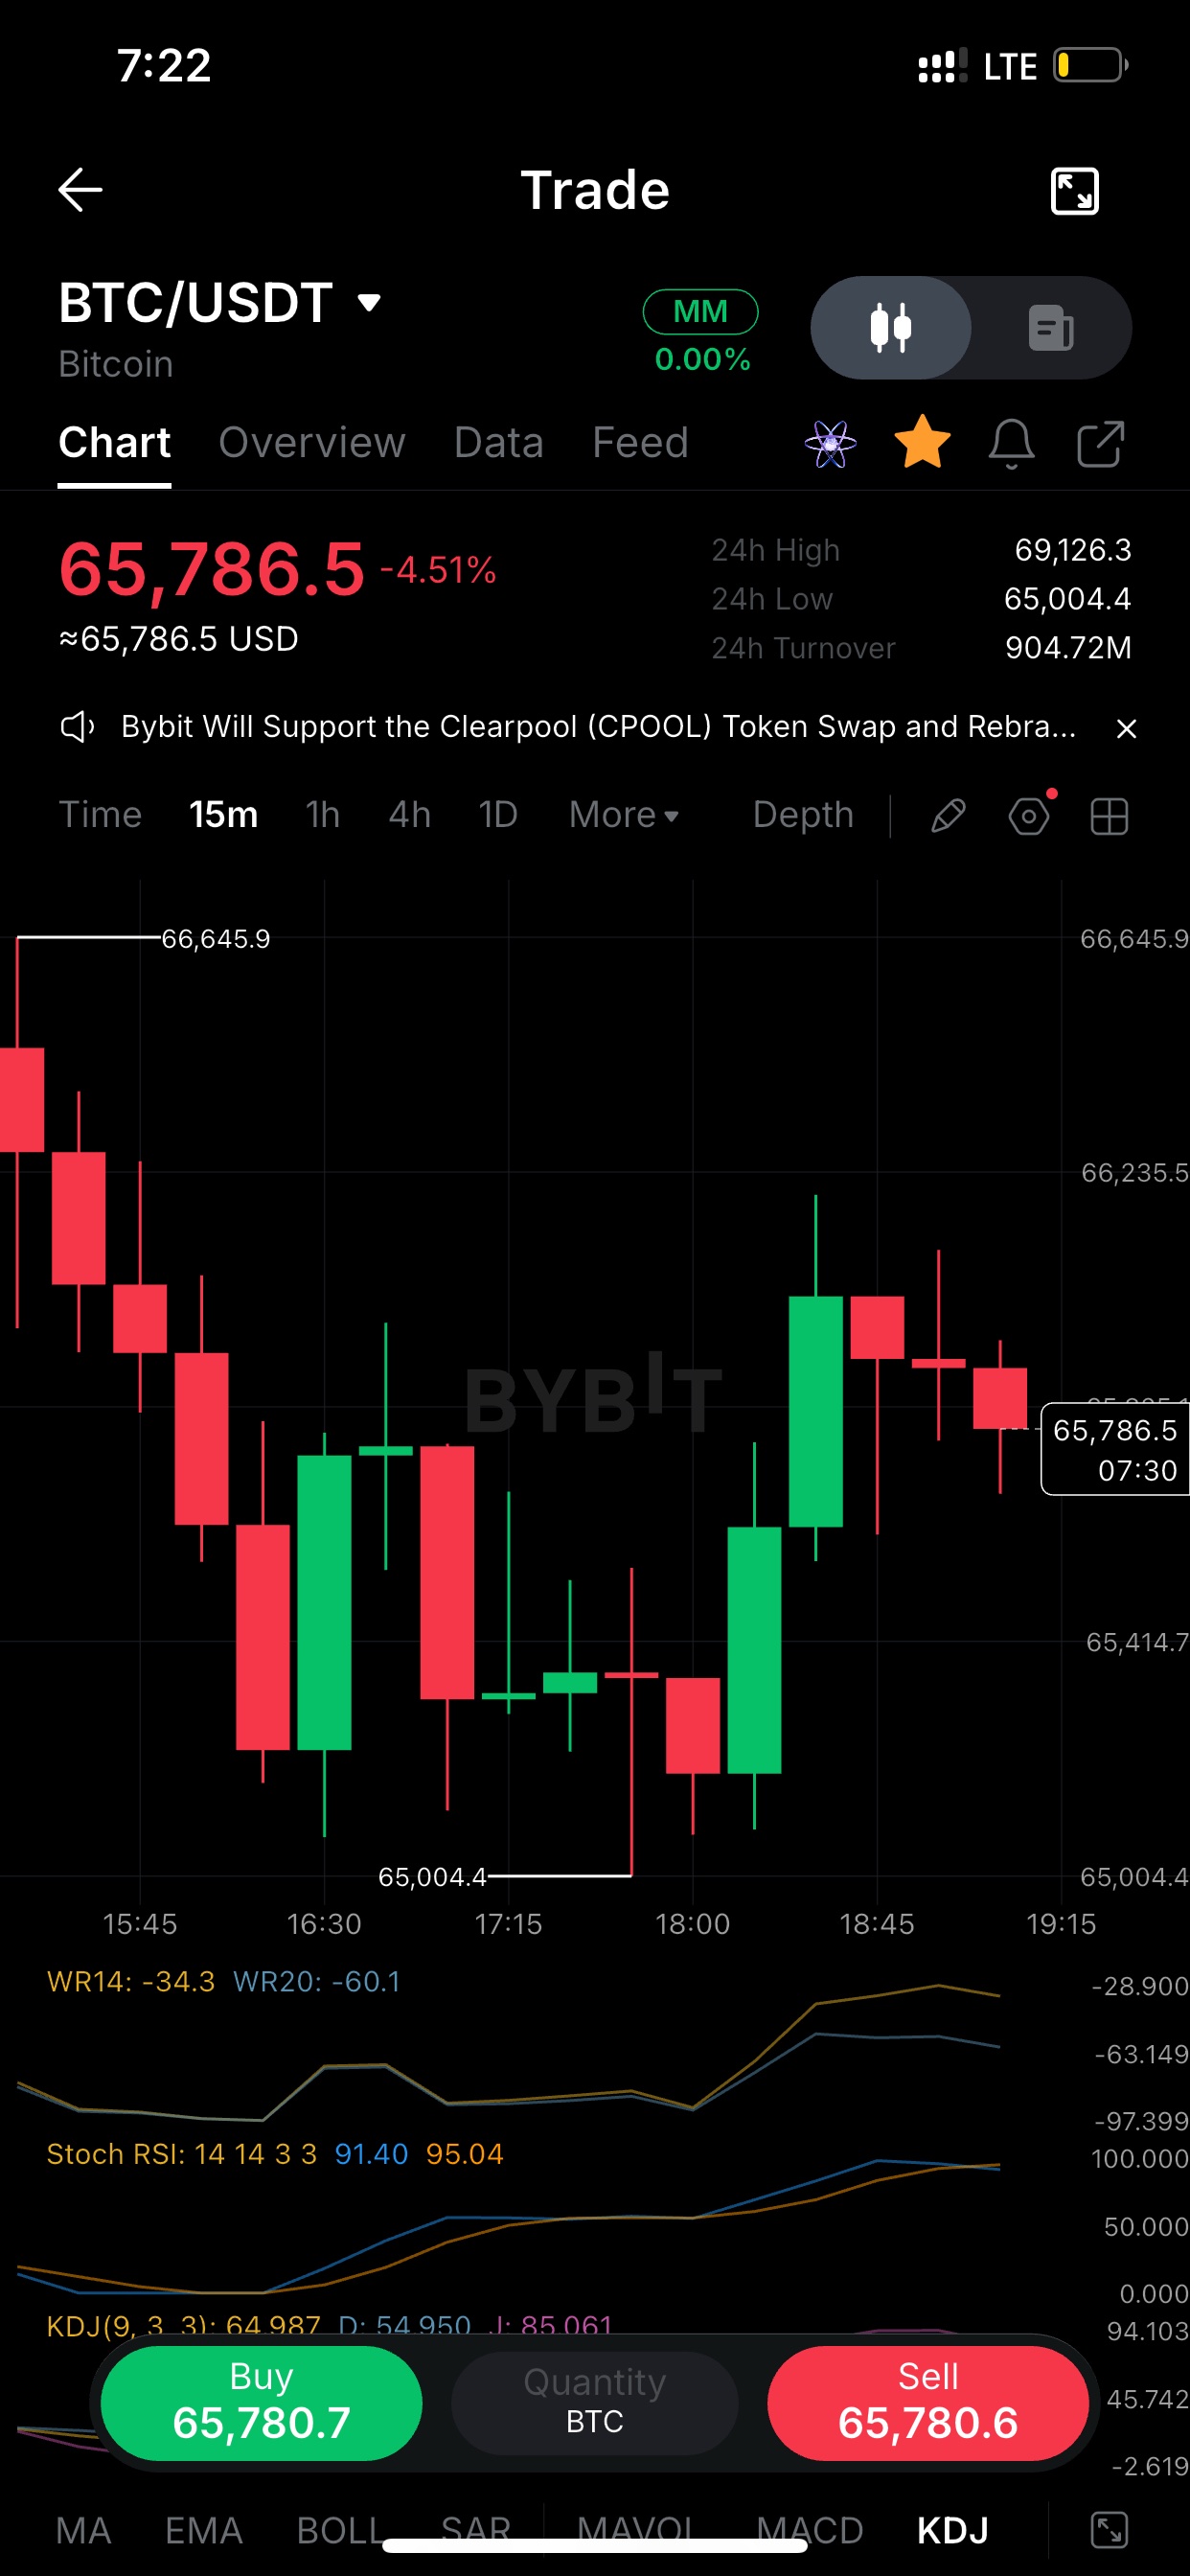
$HYPEUSDT 15m: 66.60 got defended at 15:30 and price bounced to the 68.4–69.0 zone. 69.03 was rejected twice, and now it's rolling over again at 67.5. Down 7.6% on the day, from a 73.56 high. As long as 66.60 holds this is a range. A 15m close under it opens the door to a fresh low. I'm waiting for a reclaim of 68.4 with volume before I'd consider longs. 2 (momentum read) bounced hard off 66.60, but the oscillators are already stretched. Stoch RSI is at 86/90 on the 15m while price is still printing lower highs on the bigger move down. Momentum ran ahead of price. That usually means a pullback to retest the low before any real continuation. KDJ is rolling over too (J at 73). I'm not chasing this bounce. 3 (question to the community) is -7.6% on the day, with a 24h range of 66.60 to 73.56. The 15m is basing above the low, but every push into 68.5+ keeps getting sold. Do you see this as accumulation near 66.6, or a bear flag before another leg down? I lean toward the second until 68.4 flips to support. Curious where you're watching. Posting tips for the leaderboard: - Add the tag or the trading widget on each post. - Space the posts out through the week to avoid the high-frequency mute. - Post your own chart screenshot with it. Original content scores better. - Post 3 ends with a question, which tends to draw more replies. These are chart reads, not financial advice. If you tell me your actual bias or trade (long, short, or waiting), I'll rewrite them around it. #ByXIMPACT
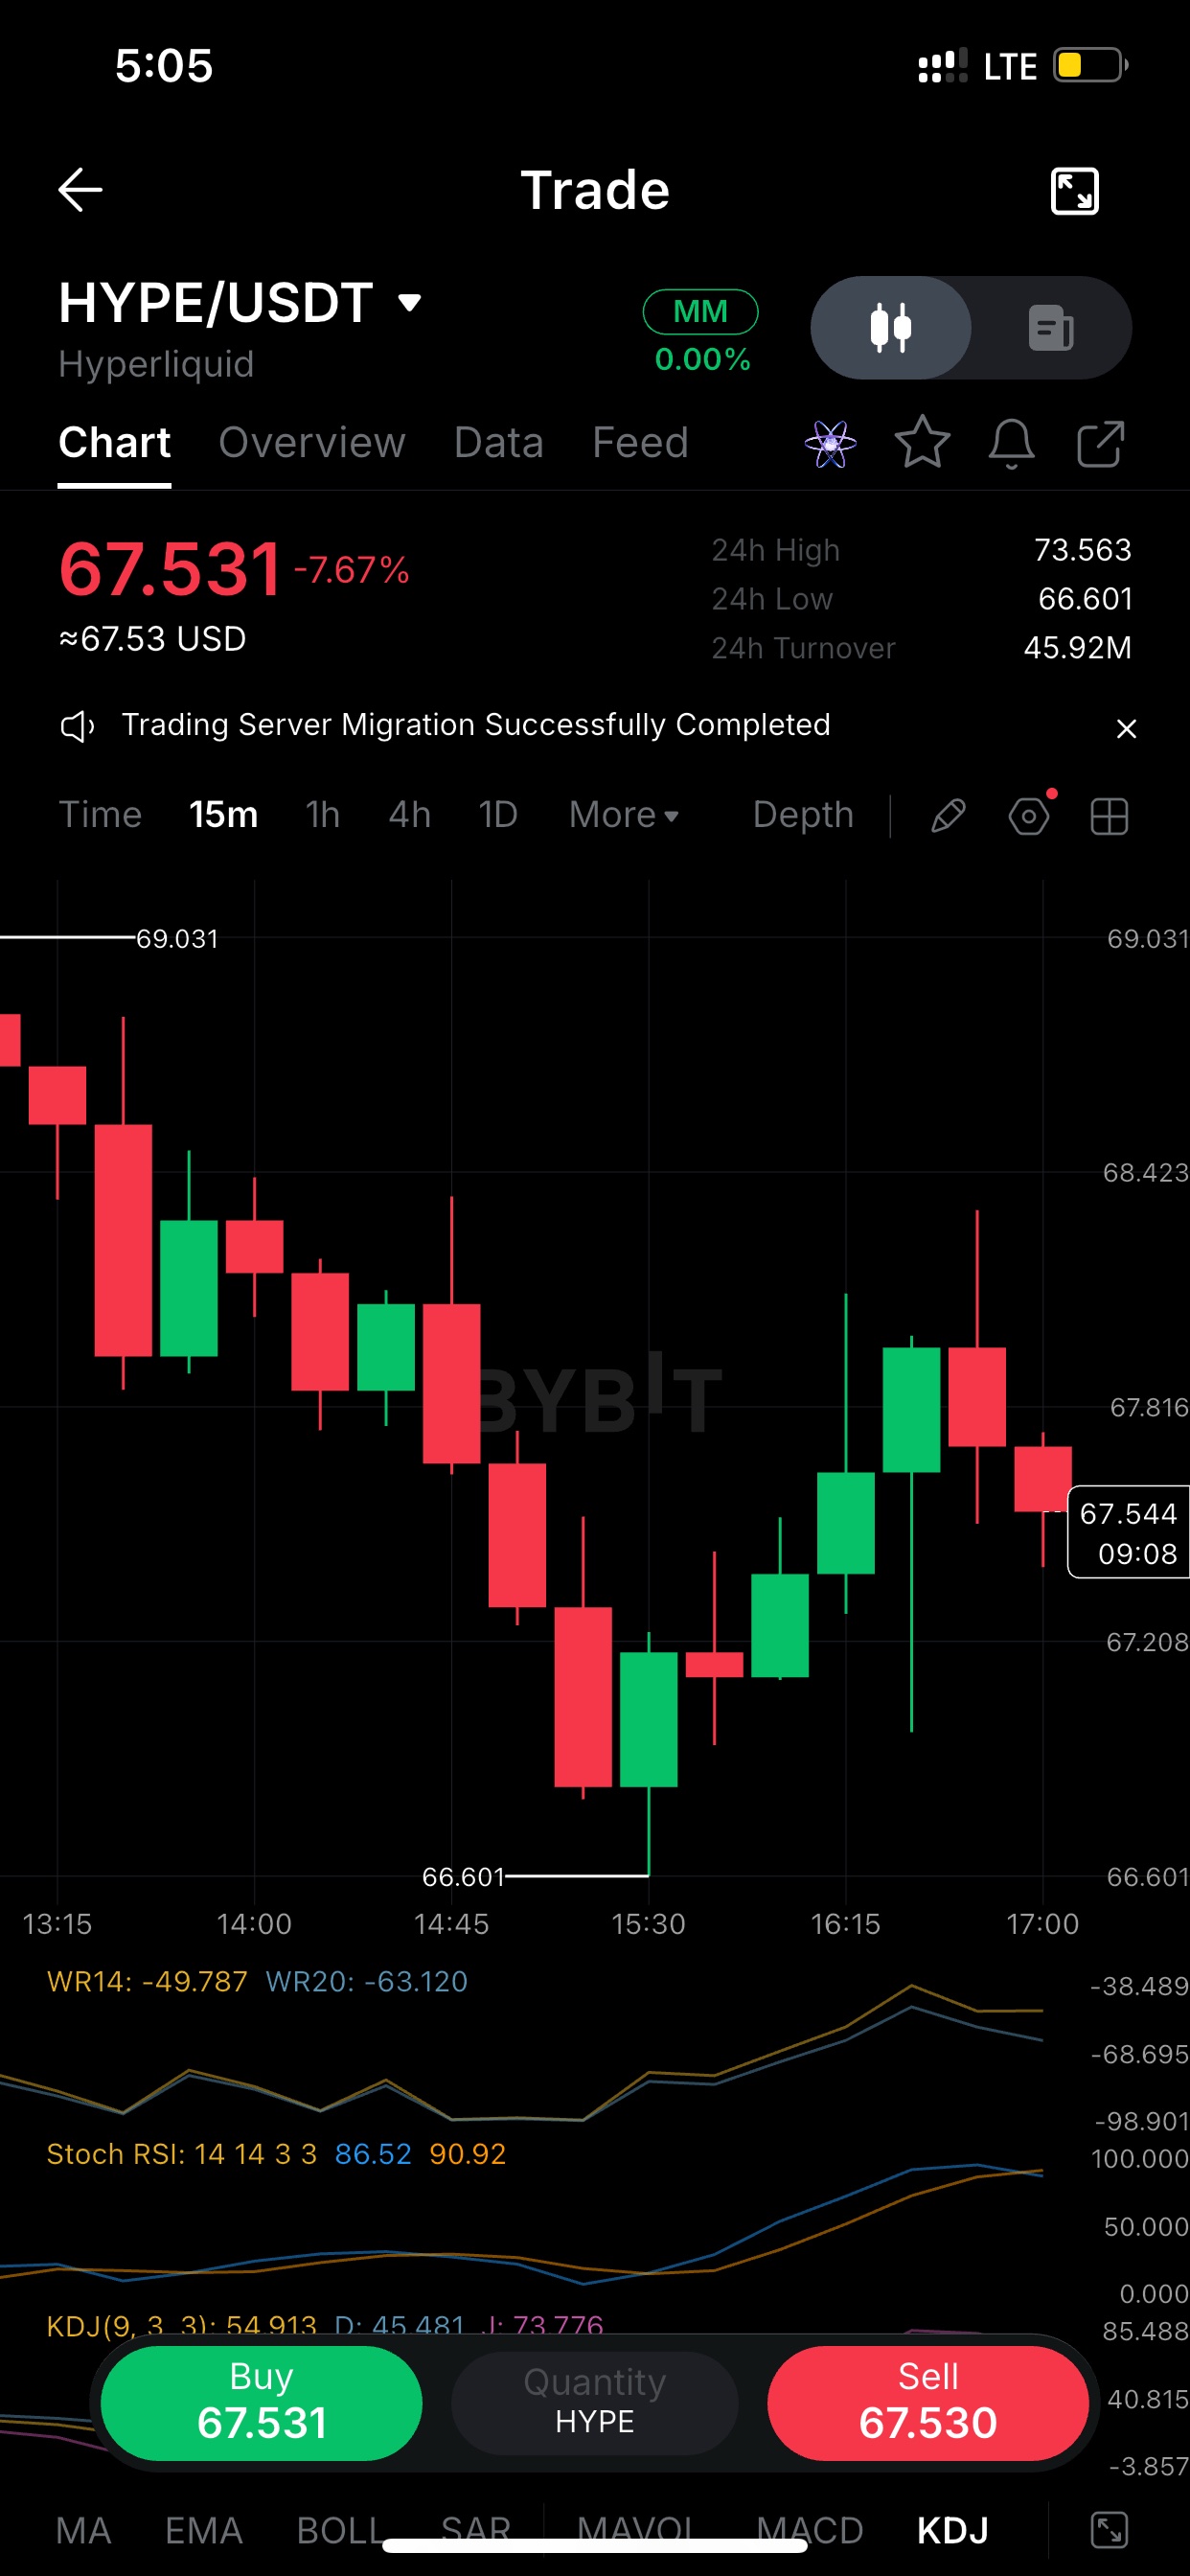
$BTCUSDT 15m: down 3.16% on the day, and price is sitting on the 66,966 intraday low. Momentum is stretched to the downside. WR14 is at -99.9, Stoch RSI is near 3, and KDJ's J line is already negative. That reads as exhaustion in the selling, not fresh strength. The 10:45 push to 67,527 got sold straight away, so sellers still control the upside. I'm watching whether 66,966 holds on the next retest. A reclaim of 67,250 would be the first sign buyers are back. A clean 15m close below 66,966 opens the 66,448 daily low. 2: $BTC levels I'm tracking on the 15m: Resistance: 67,527 (rejected hard), then 67,246 Support: 66,966, then the 24h low at 66,448 Spot: 67,064, right between the two Daily range is 66,448 to 70,217, so BTC is trading near the bottom of it. When oversold readings line up at the bottom of a range, the move is usually a bounce toward the middle or a breakdown. It rarely just chops. I'm not chasing either side until 66,966 or 67,250 breaks. 3: $BTC is down 3.16%, sitting 600 points above the 24h low, and 15m oscillators are pinned at oversold. Meanwhile, every bounce attempt since 10:45 has been faded. Which side do you trust here: the oversold bounce or the lower highs? I lean toward a relief move to 67,250 first, but only if 66,966 holds. Where's your line? Tap the copy icon on each block to paste it straight into ByX. Add the $BTC tag or trading widget when you post, since posts need one to count. #ByXIMPACT
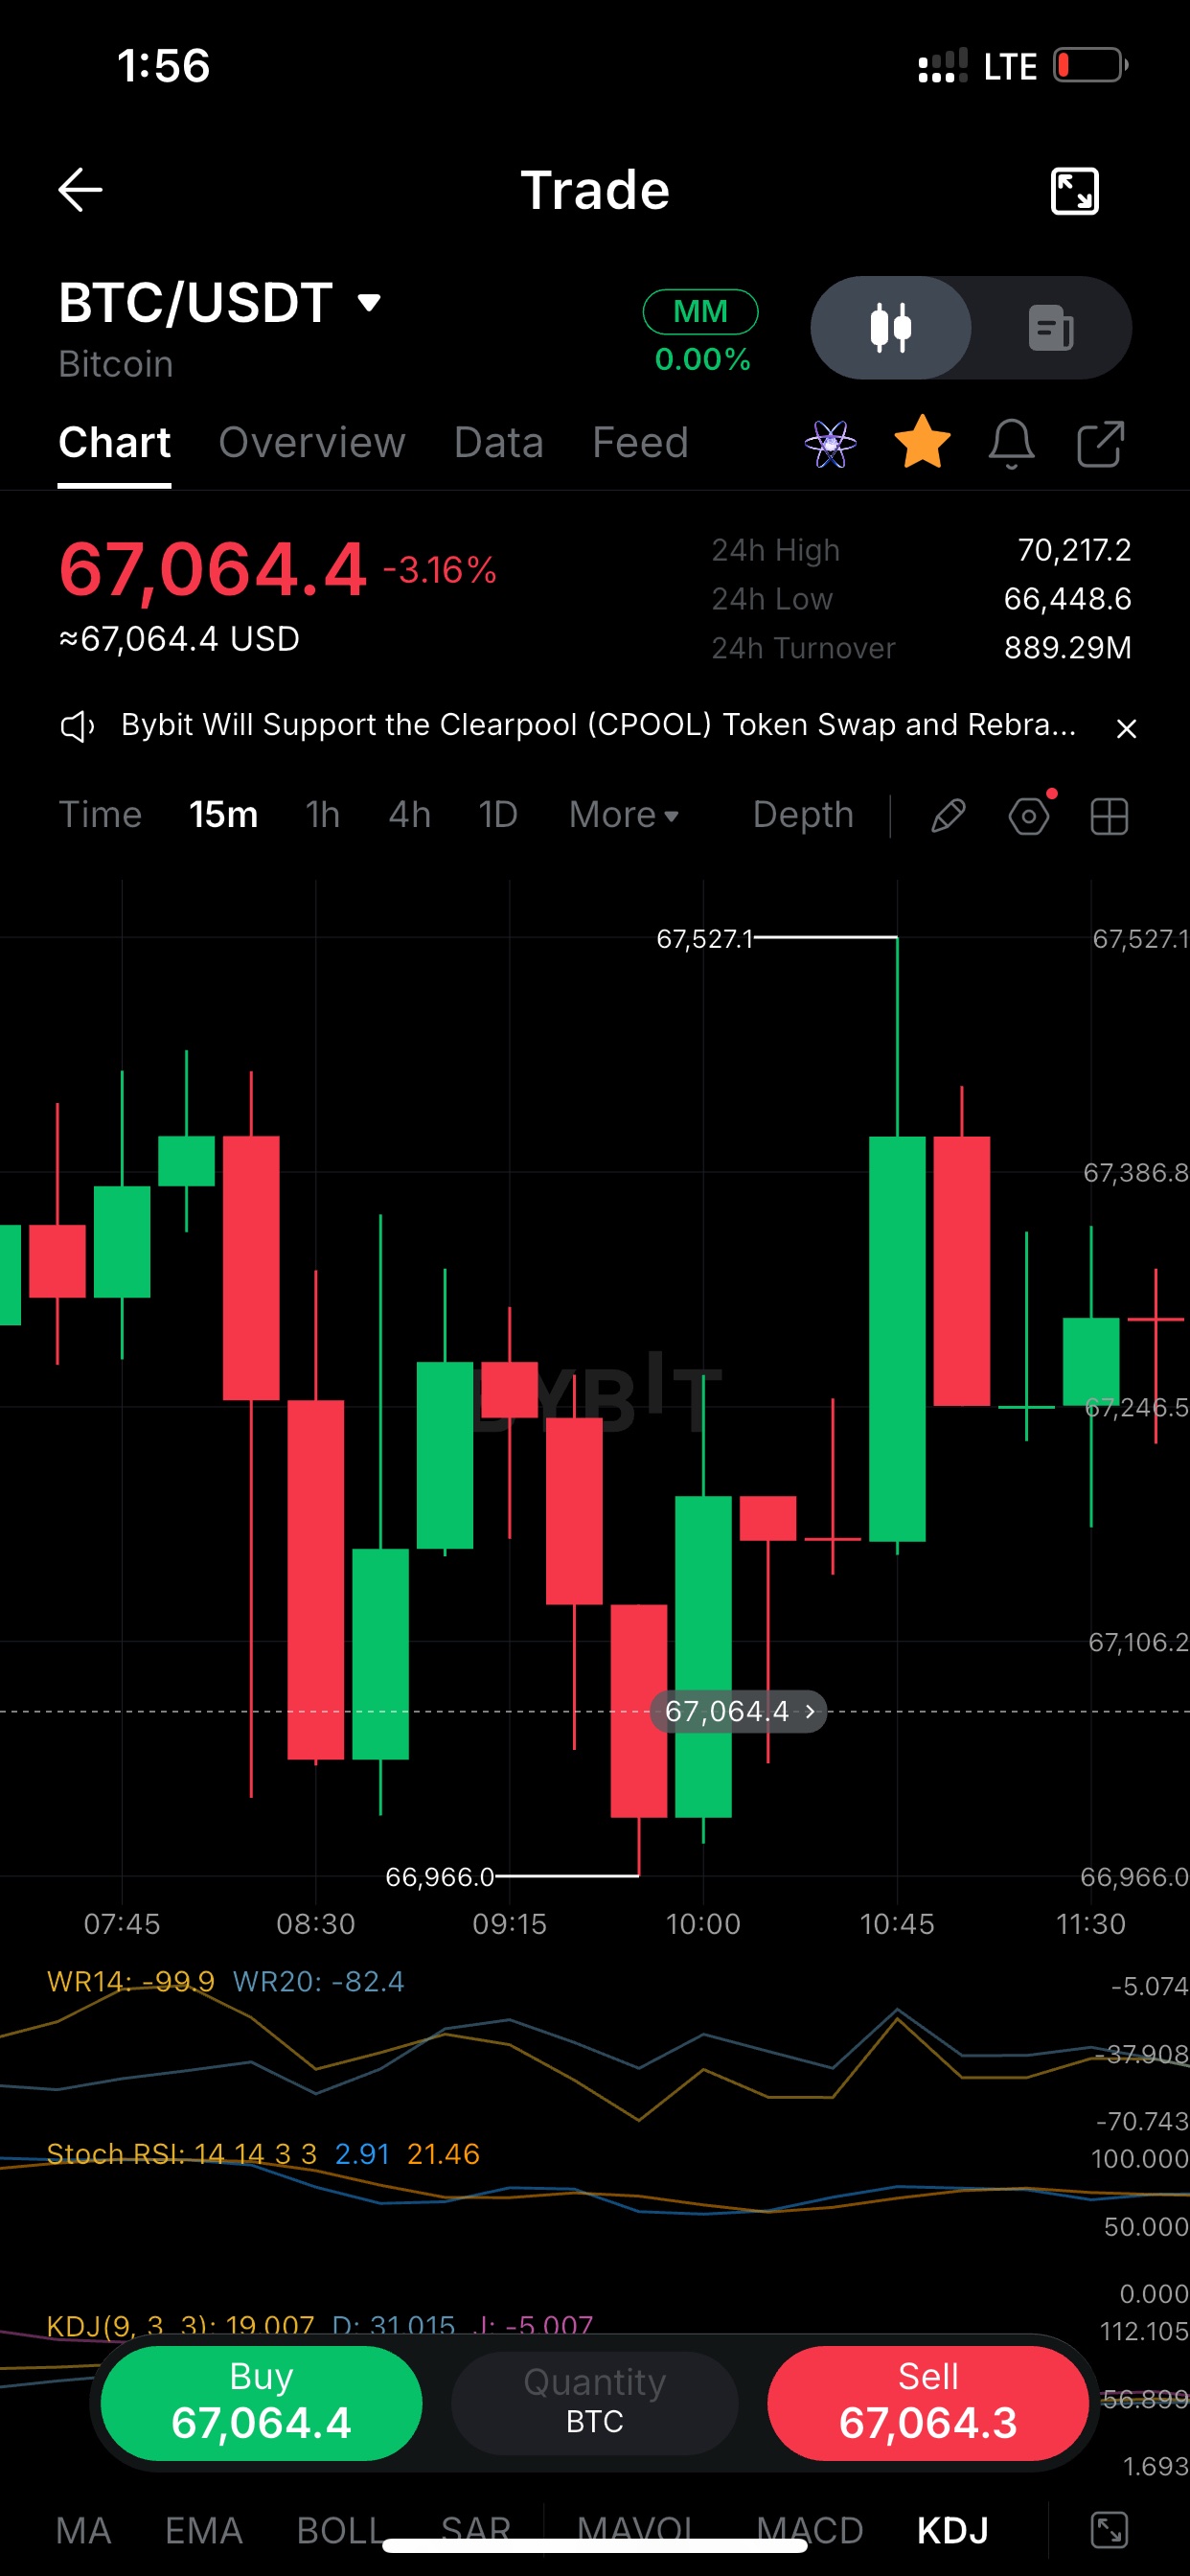
$XAUTUSDT 15m: one impulsive leg did all the damage here. Price dropped from around 3,878 straight to the 3,859 low in a single sell candle, then spent 2 hours chopping sideways without any real follow-through. The bounce back to 3,865 is shallow. The 3,872 area is the first real test. Until that flips, I treat this as a relief bounce inside a range, not a reversal. Quick read on $XAUT: Range: 3,859 to 3,885 Last: 3,865.5, in the lower third Williams %R14 around -53, so momentum is neutral, not oversold A neutral reading after a flush means the market hasn't decided yet. I'm waiting for a 15m close above 3,872 for longs, or a clean break under 3,859 before I consider shorts. Anything in the middle is noise. Sellers had control on through the overnight session, but the 3,859 low was defended and buyers stepped in with a strong green candle right at the bottom. That's a decent first sign, but one candle isn't a trend. I want to see higher lows hold above 3,860 before trusting this bounce. If they fail, the low gets retested fast. If you tell me the direction you're trading (long, short, or just watching), I can write a version with a specific trade idea. #ByXIMPACT
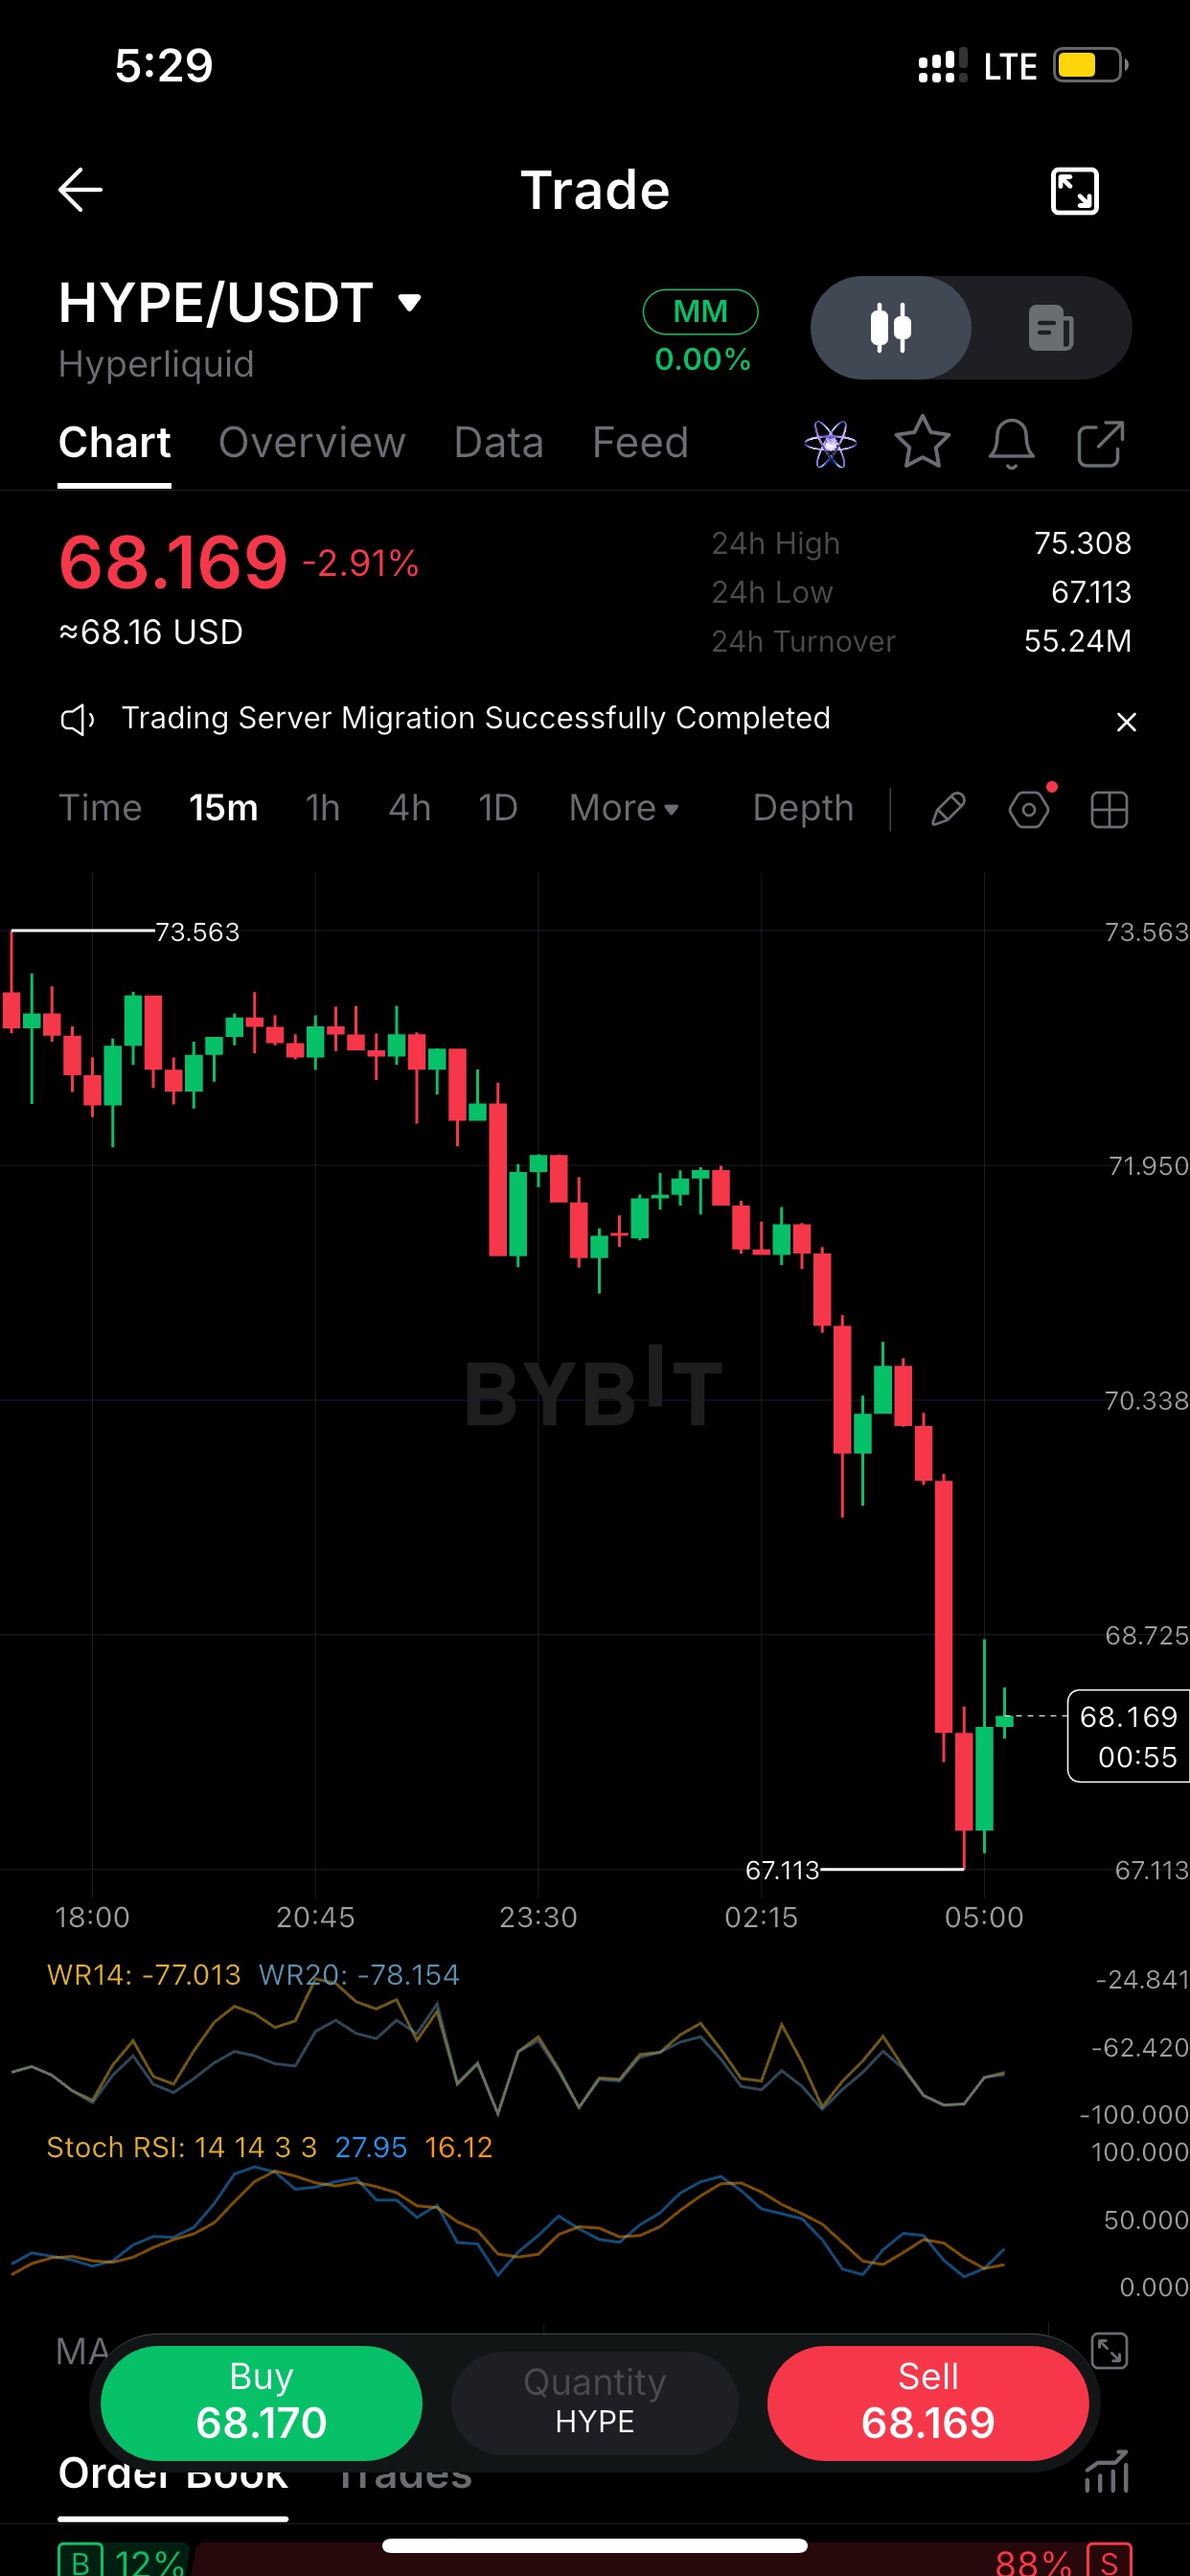
1 market structure $HYPEUSDT spent 11 hours grinding lower on the 15m, and the last leg was a single marubozu from ~70.3 into 67.1. That's a liquidation-style flush, not a slow bleed. Buyers showed up at 67.113 with two green candles, but price is still under every lower high since 73.5. A bounce is not a reversal until 68.7 flips to support. 2 momentum read Stoch RSI on15m is 27.95 / 16.12 and curling up from the floor. Williams %R is still around -77, so it's not even fully oversold. Momentum is turning, but price hasn't confirmed. I'd rather wait for a close above 68.7 than catch the knife at 68.1. 3 levels and invalidation -2.91% on the day, 24h range 67.11 to 75.31, turnover 55M. Levels I'm watching: - 67.11: the low that held - 68.72: first reclaim - 70.34: where the breakdown began Lose 67.11 on a 15m close and the bounce was just a pause. Post them at different times rather than back to back, since the rules penalize high-frequency posting and similar content. If you add a trading widget or coin tag in the app, that should help the score. Send the next chart whenever you're ready. #ByXIMPACT
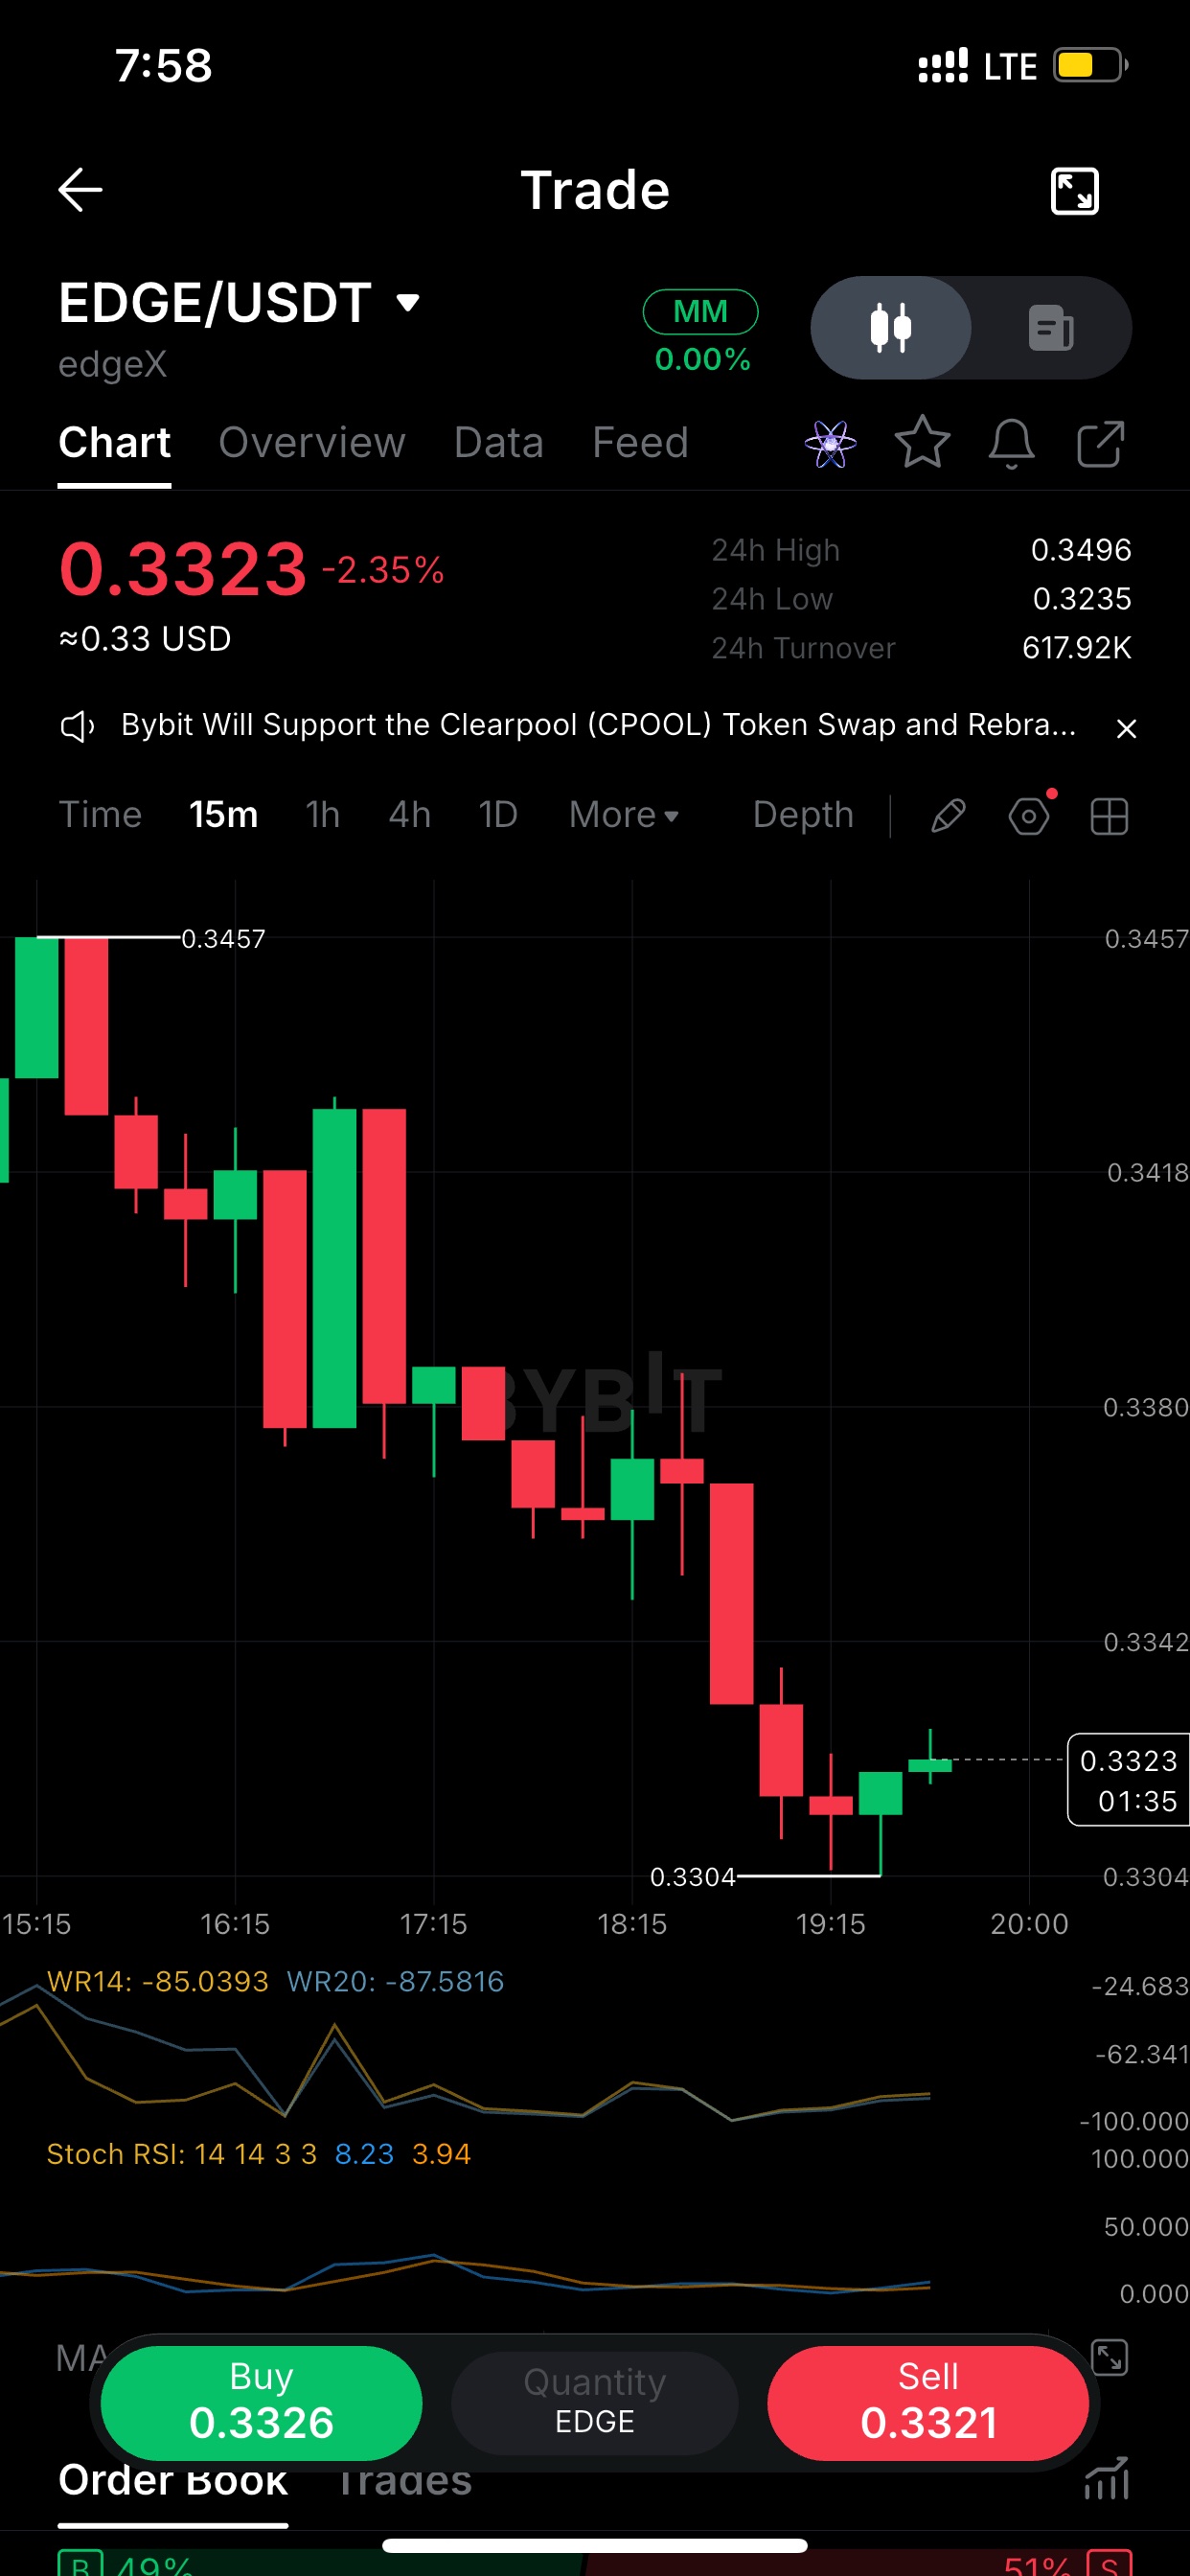
$DOGEUSDT $EDGE 15m: sellers had control from 0.3457 down to 0.3304, then it printed a higher low and the last two candles closed green. That's a bounce, not a reversal yet. Price needs to reclaim the 0.3342 area and hold it before I'd call the downtrend broken. Lose 0.3304 and the bounce thesis is dead. Volume is thin (24h turnover ~618K), so moves can overshoot in both directions. ``` **Post 2: the momentum read** ``` Stoch RSI on $EDGE 15m is at 8 / 4, and Williams %R is around -85. Both are deep in oversold territory after a roughly 4% slide in a few hours. Oversold can stay oversold in a trend, so I'm not buying the reading alone. I want a close back above the last red candle's body first. The indicators say selling is stretched, and price still has to confirm. ``` **Post 3: the risk framing** ``` Trade idea on $EDGE, not a call: the 0.3304 low is a clean invalidation level. It's only about 0.6% below the current price of 0.3323. Targets are 0.3342, then 0.3380 if buyers follow through. That's a small stop against a decent reward, but only if 0.3304 holds. If it breaks, I'm out and the idea is wrong. Order book is close to even (49% bids / 51% asks), so there's no clear edge from depth. ``` Before posting: - Attach the EDGE/USDT trading widget or coin tag so it counts as original market content. - Space the posts out. Posting too often can get you muted, and similar posts don't count. - Don't edit a post after publishing. Edits don't trigger a re-evaluation. If you send a chart on a different timeframe (1h or 4h), I can write posts around that structure instead. #IMPACTbyTrade
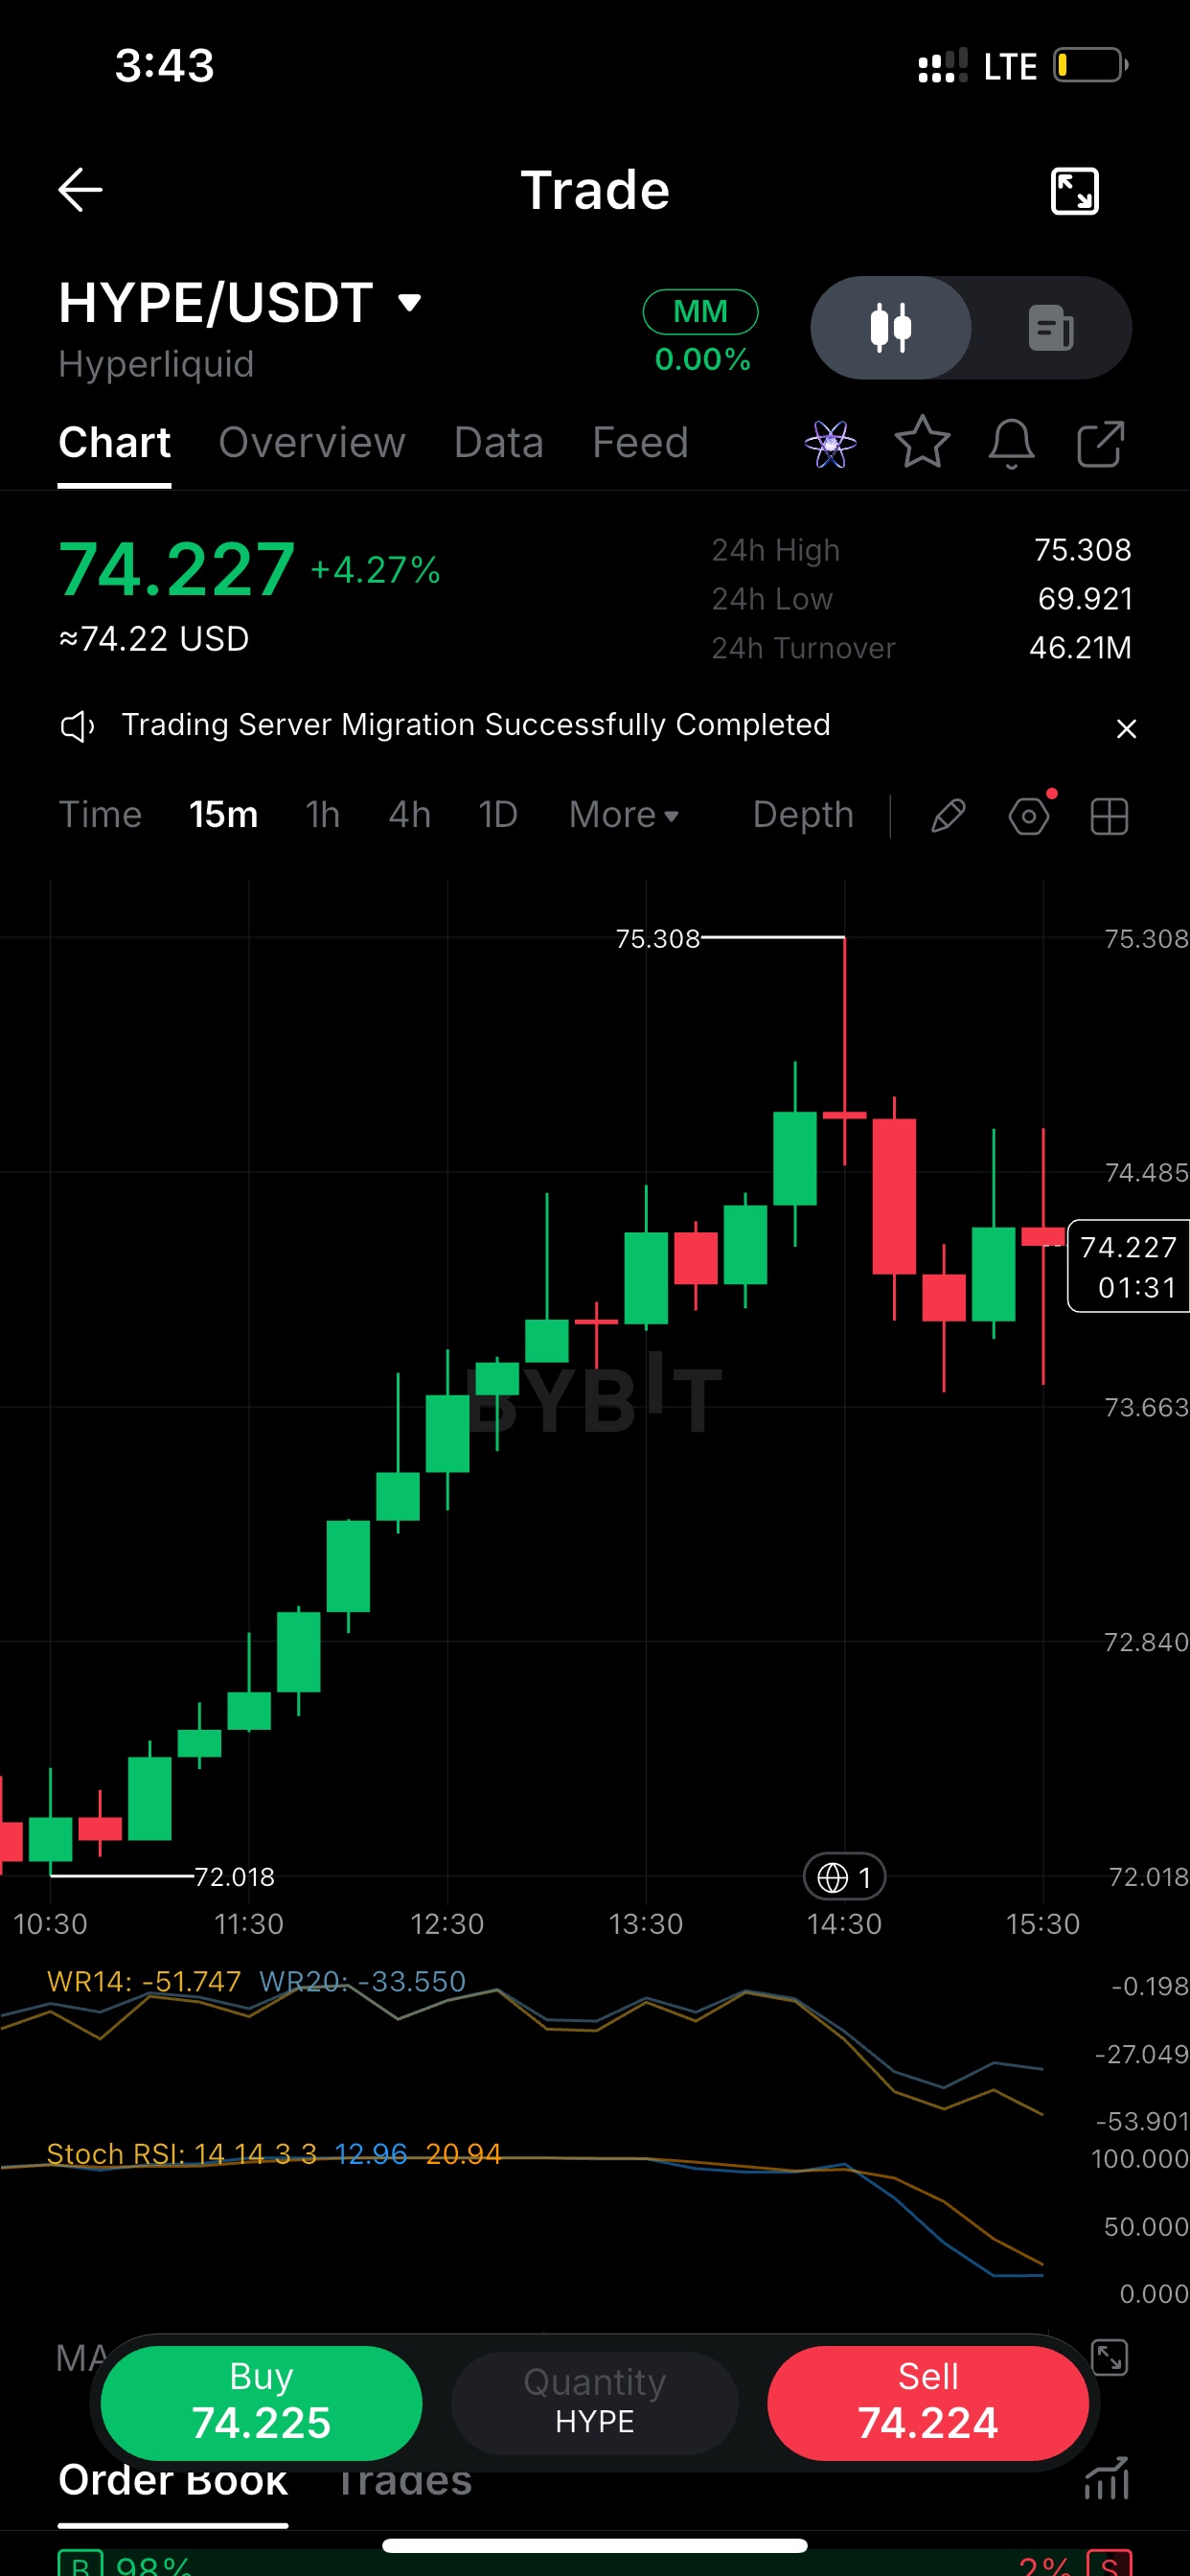
$HYPEUSDT tuvo una escalera limpia en el gráfico de 15m desde los 72.0 hasta los 75.3, casi sin velas rojas en el camino. Luego, los 75.308 fueron rechazados con fuerza: mecha superior larga y la siguiente vela cerró en rojo. Desde entonces, ha estado oscilando entre 73.7 y 74.5. El precio ha subido un 4.27% en el día, pero el impulso se ha enfriado. El Stoch RSI está abajo, cerca de 13/21, mientras que el precio se mantiene bien por encima de la base de 72. Estoy vigilando los 73.66 como línea clave. Si aguanta, el máximo de 75.3 vuelve a estar en juego. Si se rompe, los 72.8 son el siguiente nivel donde aparecieron los compradores. Lectura rápida en 15m. La tendencia en sí se ve saludable: mínimos más altos durante toda la mañana y un rango de 24h de 69.9 a 75.3 con el precio en el tercio superior. Pero los osciladores dicen que el empuje se agotó por ahora. El Williams %R se deslizó de cerca de 0 a -51, y el Stoch RSI se desplomó después del rechazo de las 14:30. Un reseteo como este suele tener dos desenlaces: construye una base y vuelve a subir, o sigue desangrándose hacia la zona de 72.8. Prefiero ver cómo se comportan las velas alrededor de 74.5 que adivinar. idea de trading, gráfico de 15m, no es consejo financiero. El tramo de impulso fue de 72.0 a 75.3 y fue rechazado en la parte superior. No entraría persiguiendo el precio aquí en 74.2. Una mejor entrada sería un retesteo de 73.66, o recuperar los 74.5 con un cierre en verde. La invalidación está por debajo de 72.84, donde el movimiento perdería su estructura. El objetivo al alza es retomar los 75.3. Con 46M de volumen en 24h, hay liquidez suficiente para seguir el movimiento hacia cualquier lado. ¿Cuál es tu nivel? Si me dices qué marco temporal o enfoque quieres (swing vs scalp, alcista vs cauteloso), puedo personalizar el siguiente conjunto. #ByXIMPACT
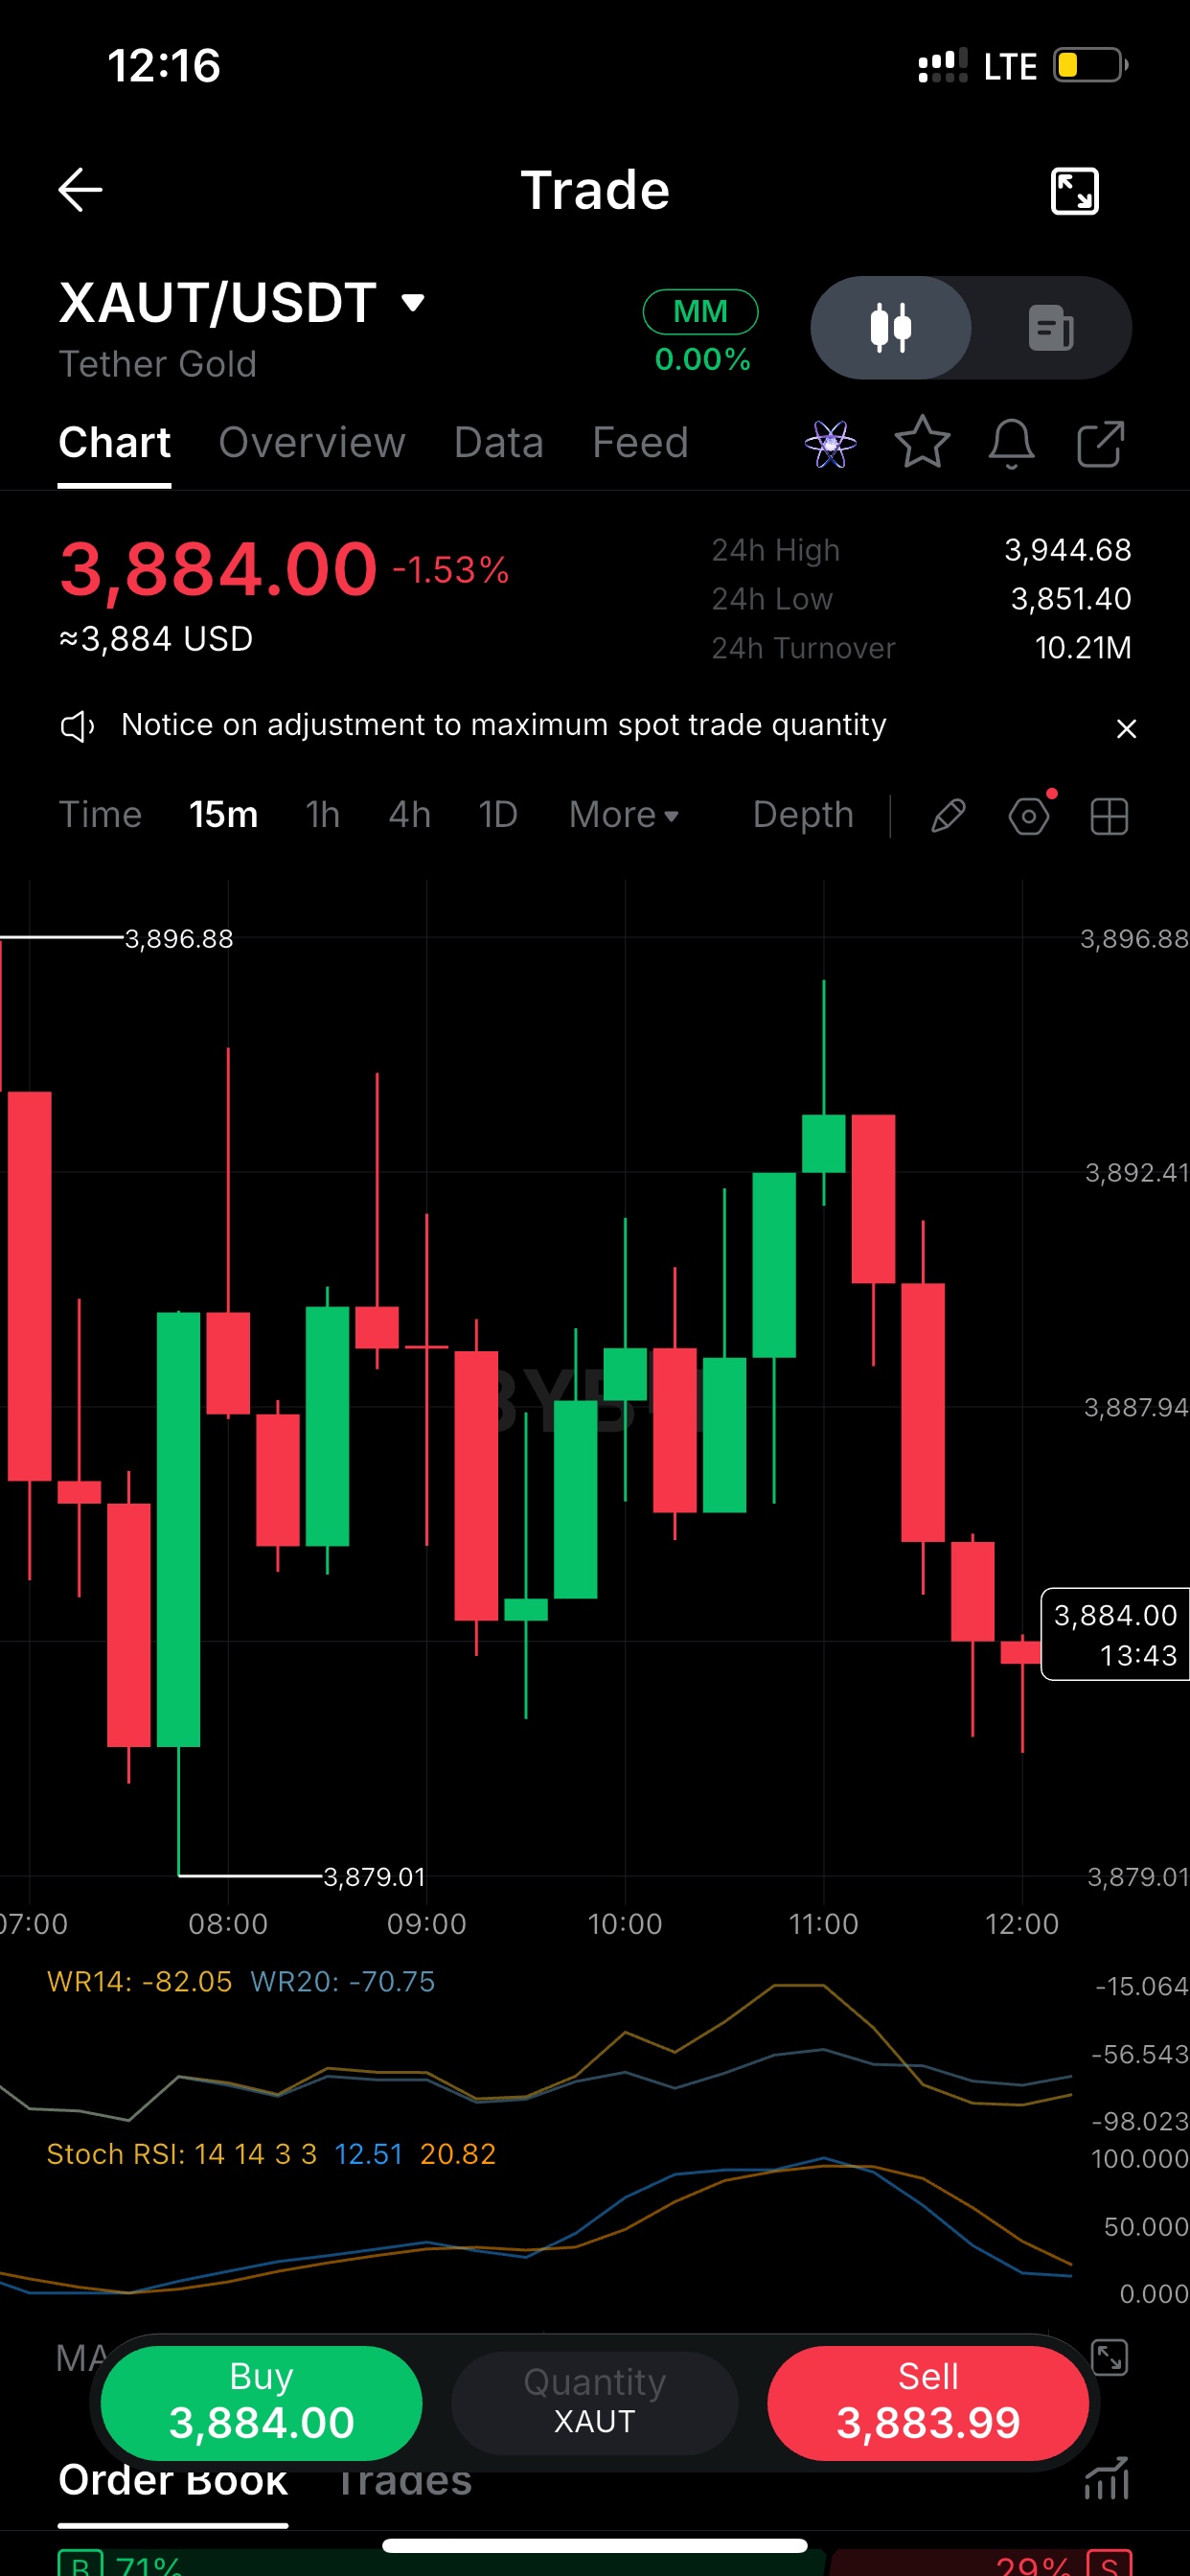
$XAUTUSDT lost the 3,896 area at 11:00 astepped down in lower highs since. 3,884 now, -1.5% on the day. The 3,879 low from the 08:00 sweep is the level that matters. A clean break under it opens the 3,851 daily low. A hold keeps this as a range inside the 3,879-3,896 box. Not chasing the middle of the range here. $XAUT on the 15m: Stoch RSI is down at 12/20 and Williams %R is around -82. Momentum is stretched to the downside, but oversold isn't a buy signal by itself. What I want to see is a reclaim of 3,888 with a green close. Until then, bounces are just relief inside a short-term downtrend. Tether Gold is trading 3,884 against a 24h range of 3,851-3,944. That puts price in the lower third after a 60-point rejection from the high. Selling pressure has been steady and bounces keep getting sold into. I'd wait for either a sweep of 3,879 that reverses, or a reclaim of 3,896, before taking a side. $XAUT I haven't added any external links, in line with the rules. Want a different angle, like a longer-timeframe view or a trade-idea format with entry and invalidation? #ByXIMPACT
$HYPEUSDT bottomed at 69.921 around 05:45 UTC and has climbed back to 71.78 in a clean staircase of higher lows. No single candle drove it. The 15m is now stalling under 71.96. The last three candles are a rejection wick, a red body and a small green one, so buyers are no longer pushing as hard as they did in the leg up. Above 71.96 the next level is 72.64. A loss of 71.28 means the move has given back its midpoint. Stoch RSI on15m is 96/98 and Williams %R is near -17. Momentum is stretched. That doesn't call a top. In a trend, overbought readings can stay pinned for hours. But it does mean chasing here has a worse risk/reward than the 70 area did two hours ago. I'd rather watch how price behaves at 71.96 than guess a reversal. If it holds, momentum is real. If it keeps rejecting, the oscillators were already warning. 24h range: 69.53 to 73.27. It's now at 71.78, almost exactly mid-range, after a full recovery from the overnight low. Mid-range is where traders overreach. The tradeable edges are the ones the market already marked: 70.60 below, 72.64 above. Between them I'm waiting, not forcing a position. If you tell me whether you're long or short, I can write a version around your actual position. Posts about your own trade tend to read as more original. #ByXIMPACT
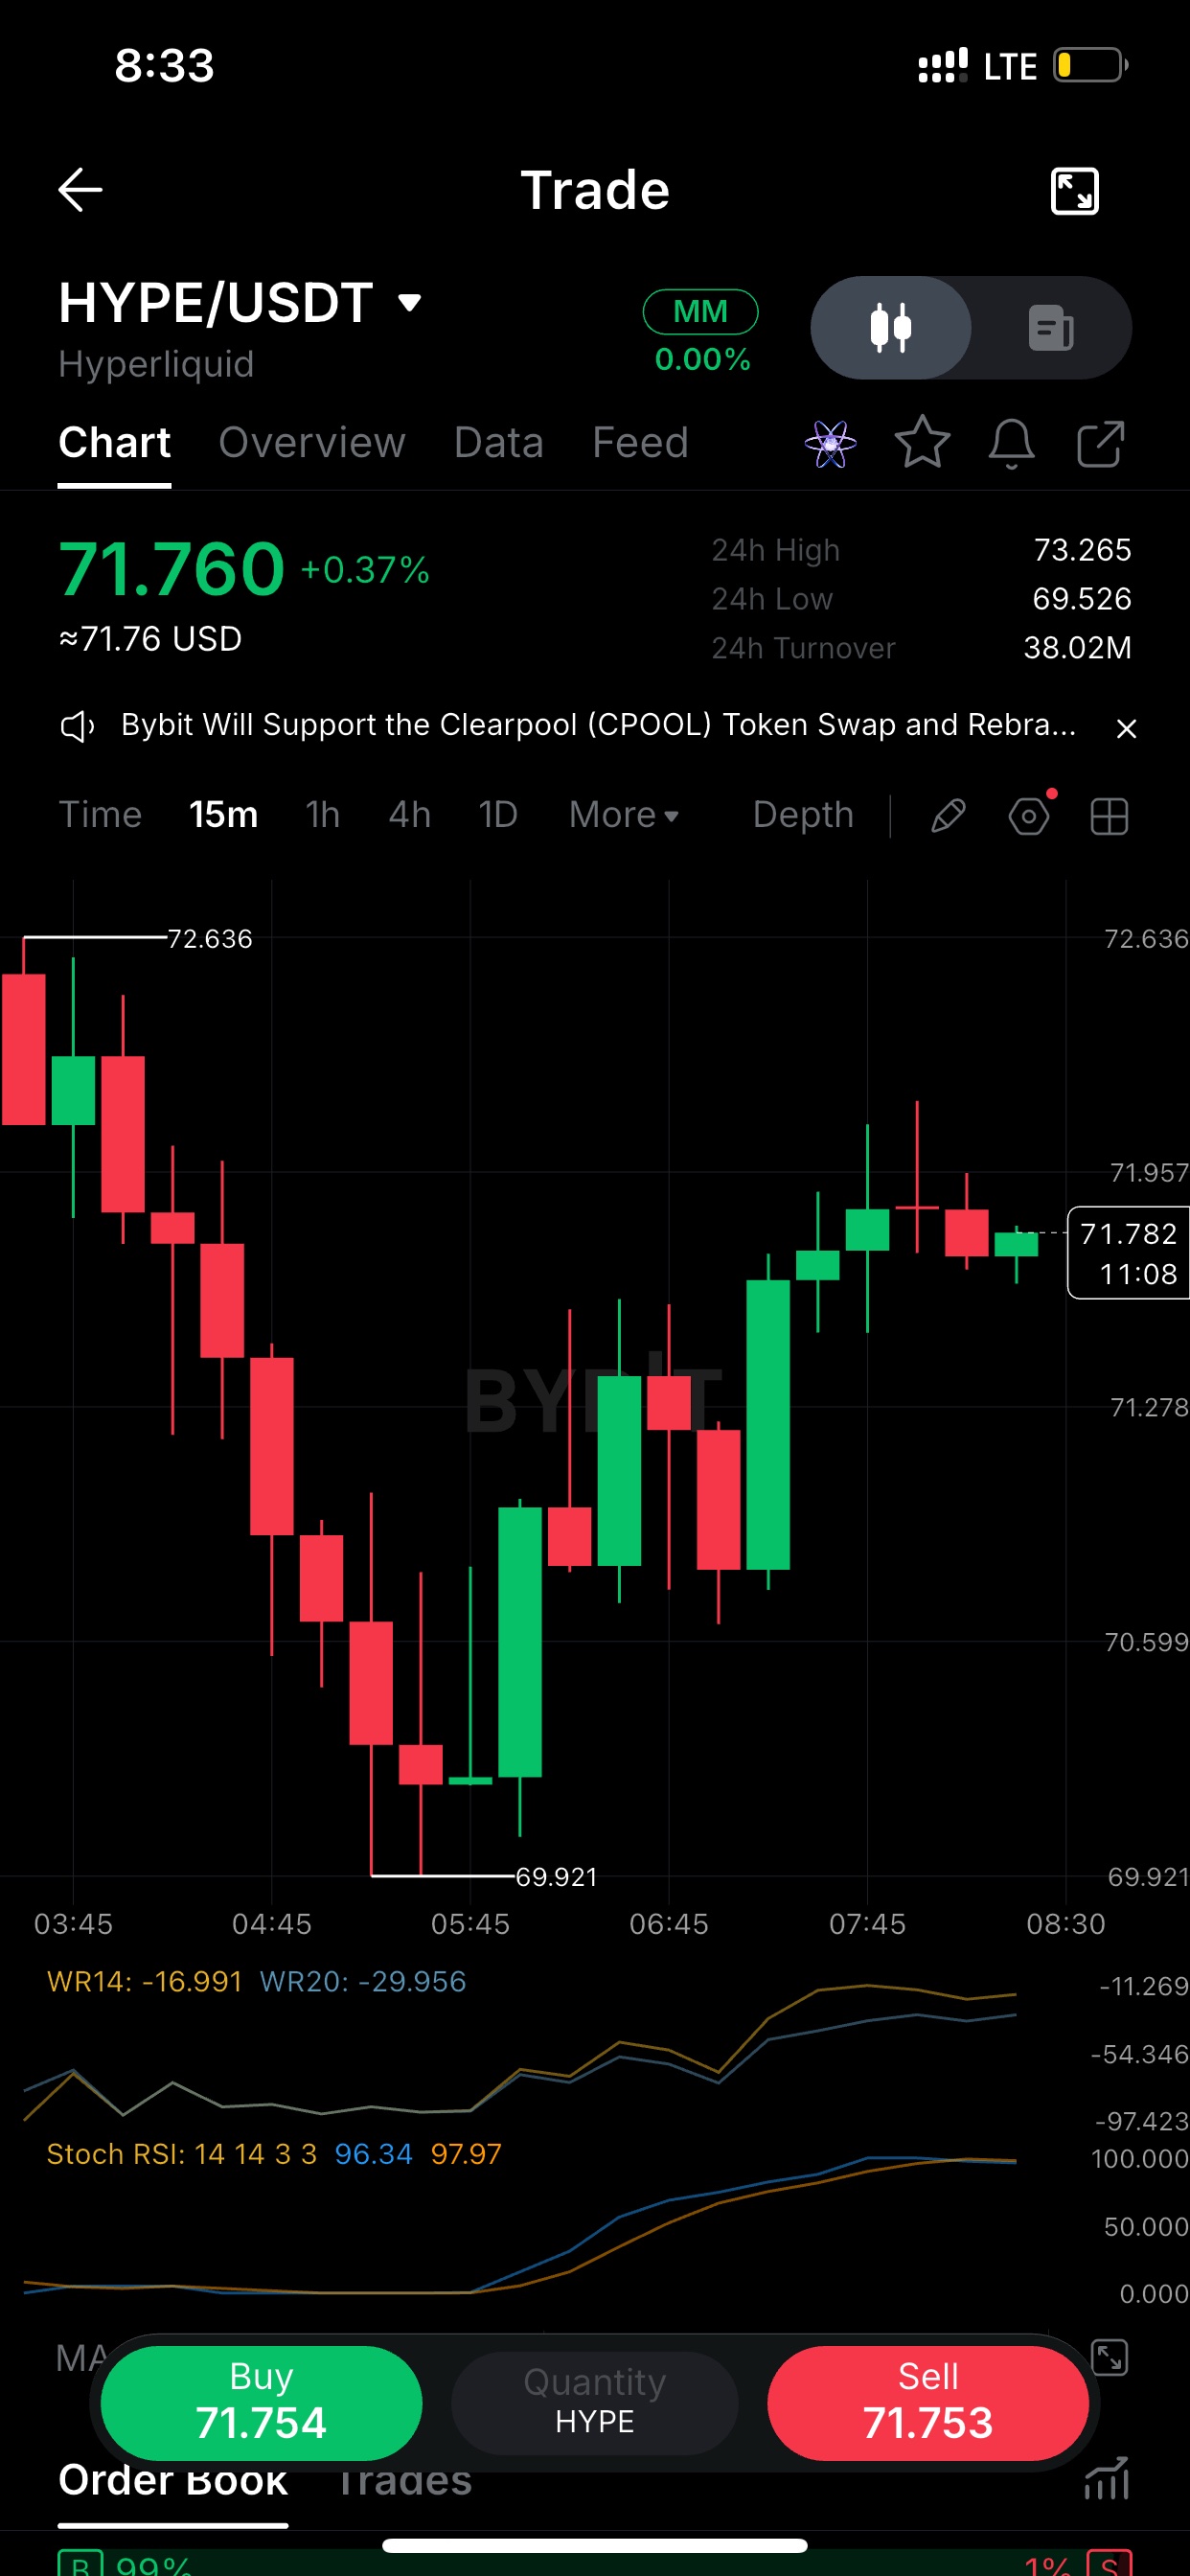
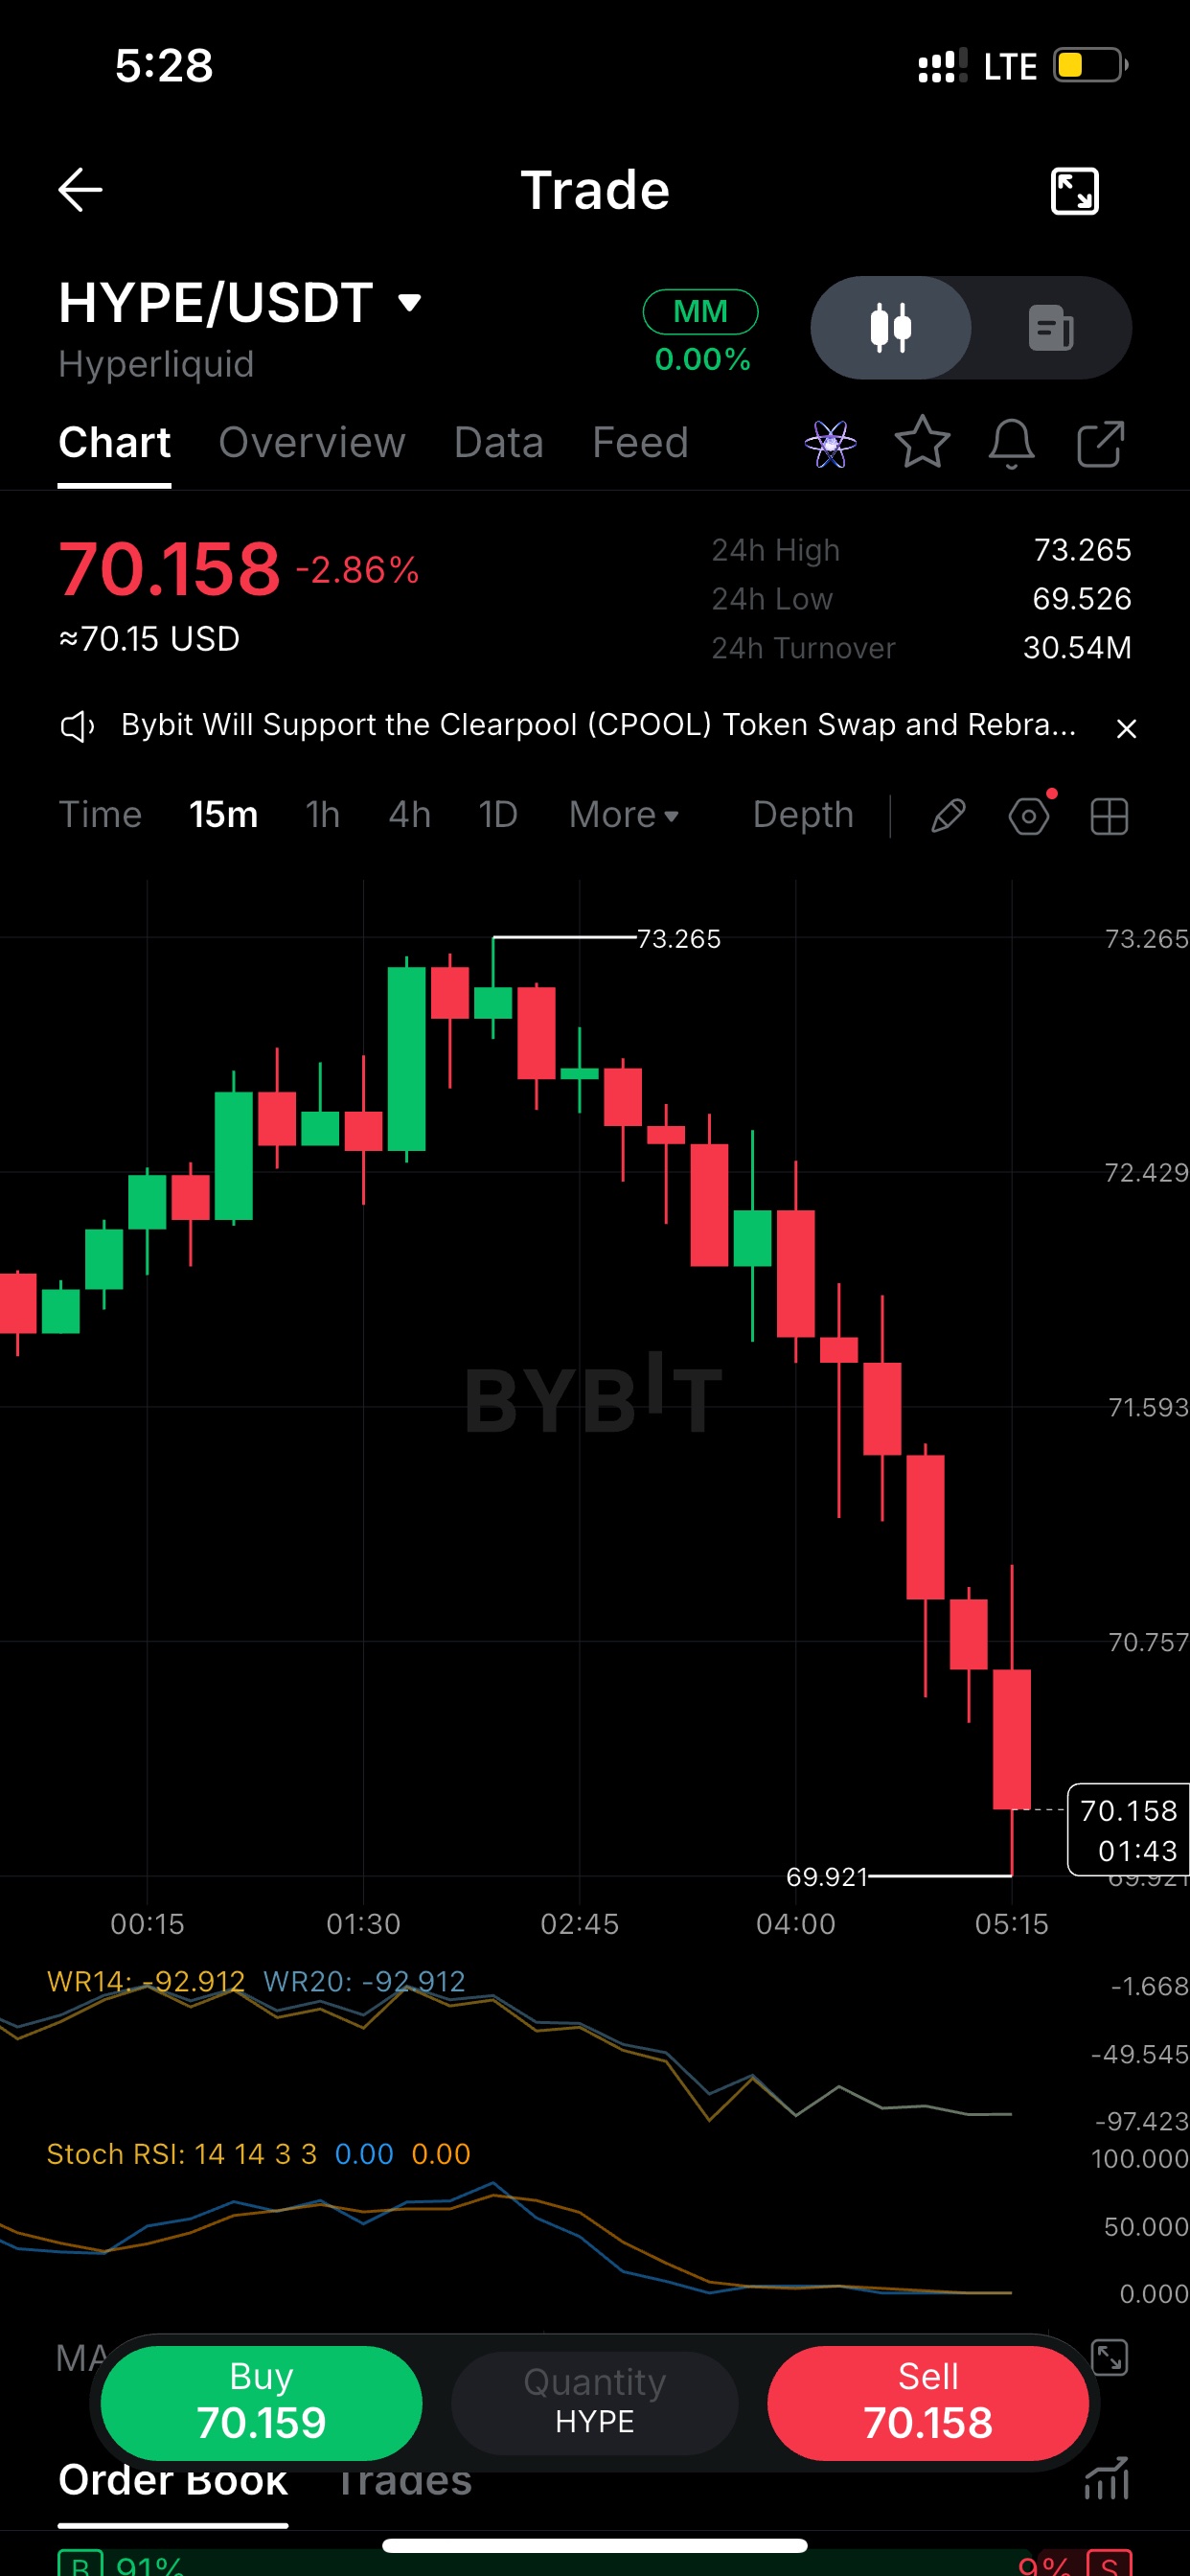
Here are three independent posts from this chart. Each has its own angle and structure, and the copy icon is in the top corner of each box. Post one at a time, spaced out, so they don't read as similar. Post 1: the rejection $HYPE got turned away at 73.265 and has bled about 2.1% since. On the 15m, every bounce since the top has been sold into, with lower highs all the way down to 70.79. The 24h low at 69.526 is only about 1.2% below, and that's the level that matters now. If it holds, this is just a pullback. If it breaks, the whole range from this morning gets unwound. I'm not chasing either direction here. 2: the momentum read $HYPE on the 15m: Stoch RSI is pinned at 0 and Williams %R is sitting around -91. That's stretched to the downside. But stretched isn't the same as reversed. In a clean trend, oversold readings can stay oversold for a long time. What I want to see is a real higher low, not just a single green candle. Until then, the reading says tired, not turned. 3: the order book angle $HYPE is trading 70.79 with roughly 64% of the visible order book on the sell side. Add 29M in 24h turnover and the move down looks like real selling, not a thin-liquidity wick. Bounces into 71.2 to 71.9 look like the first test of whether sellers are done. If price reclaims that zone and holds, the bias shifts. If not, 69.5 comes back into play. I read the levels directly off your screenshot (73.265 high, 69.526 low, 36/64 order book split). If you want a post that matches a position you actually took, tell me the side and entry and I'll write that one in your voice. Trading widgets and coin tags also count for the score, so attach the $HYPE tag or a widget when you publish. #IMPACTbyTrade
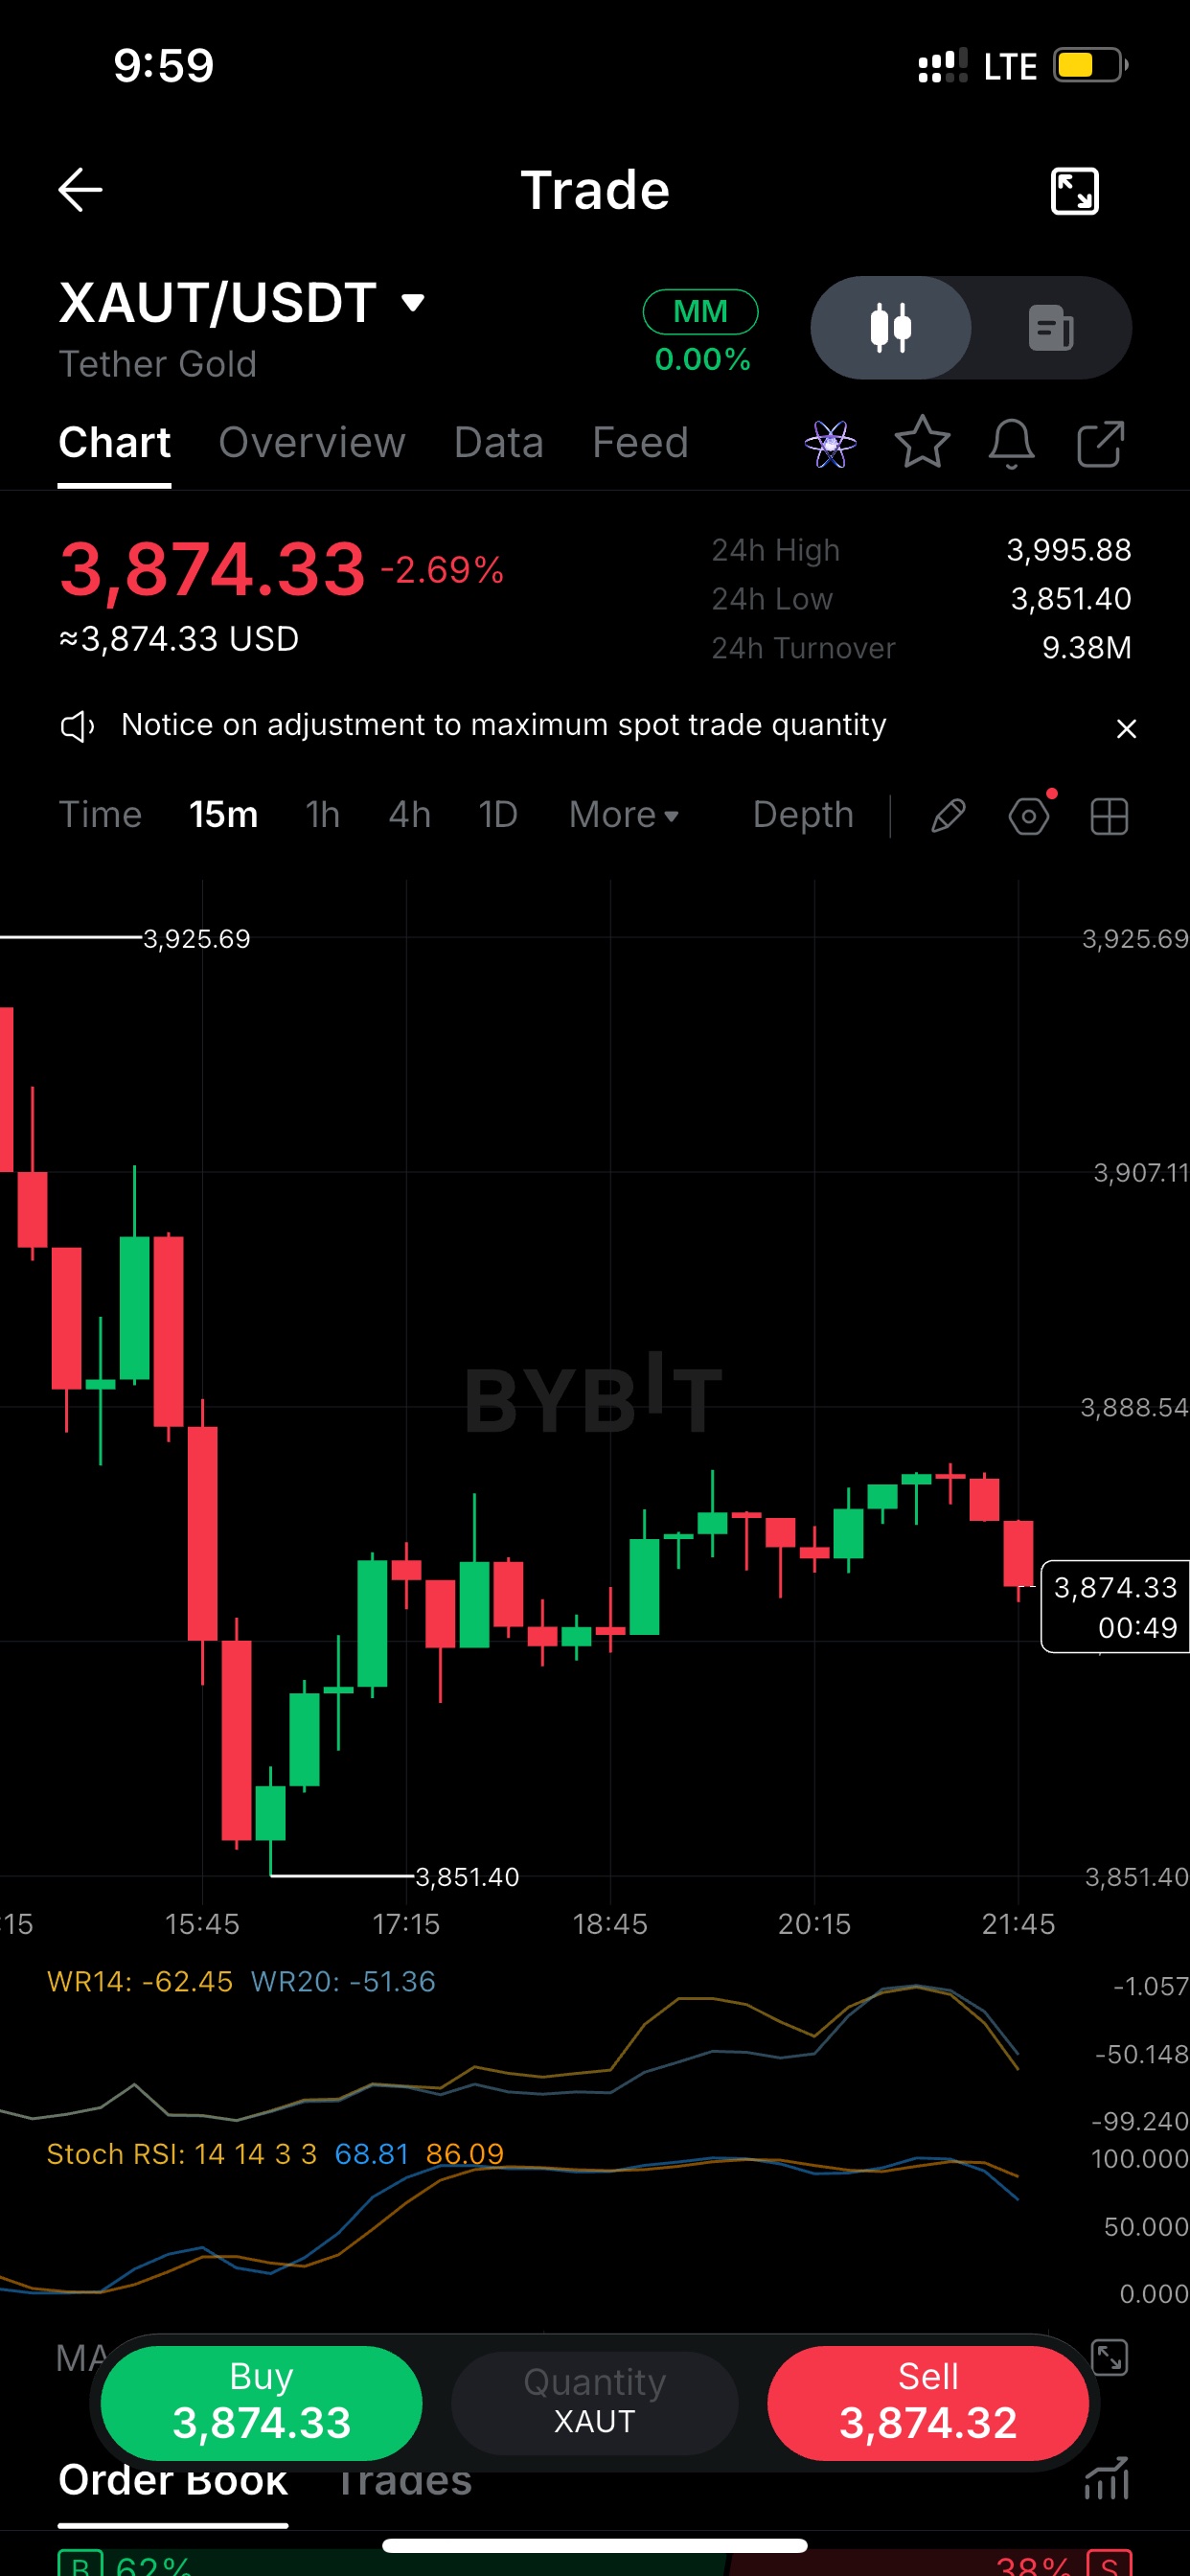
$XAUTUSDT bajó hasta los 3,851 y no ha vuelto a tocar ese nivel. Desde entonces, ha marcado mínimos más altos llegando a mediados de los 3,880s, pero las últimas dos velas de 15m son rojas y el rebote se está estancando por debajo de esa zona. Abajo un 2.7% en el día después de alcanzar un máximo de 3,995. Mantenerse por encima de 3,851 mantiene intacta la recuperación. Un cierre de 15m por debajo pone el mínimo de nuevo en juego. Gold-backed en los 15m: el precio se está recuperando, pero el impulso se está desvaneciendo. El Williams %R cayó desde cerca de la parte superior de su rango hasta alrededor de -62. El Stoch RSI tiene la línea rápida cruzando por debajo de la lenta alrededor de 69/86. Eso generalmente significa una pausa o retroceso dentro del rebote, no una continuación clara. Yo esperaría a recuperar la zona media de los 3,880s antes de confiar en el movimiento. El libro de órdenes spot tiene 62% de compras (bids) vs 38% de ventas (asks) mientras el precio se sitúa en 3,874, por debajo del máximo de la sesión de 3,995. Los compradores están defendiendo, pero ese soporte de compra no se ha convertido en una subida todavía. Es una configuración que requiere paciencia: el mínimo de 3,851 es el nivel que estoy observando, y la operación solo se pone interesante si se mantiene. No es consejo financiero, es solo mi lectura del mercado. Las publicaciones 1 y 3 están escritas para seguir siendo válidas a medida que el gráfico cambia. La publicación 2 depende de las lecturas actuales de los indicadores, así que publícala pronto o revisa los números primero. Cada publicación tiene la etiqueta de la moneda y sin enlaces externos, que son los factores que cuentan para tu puntaje. #ByXIMPACT
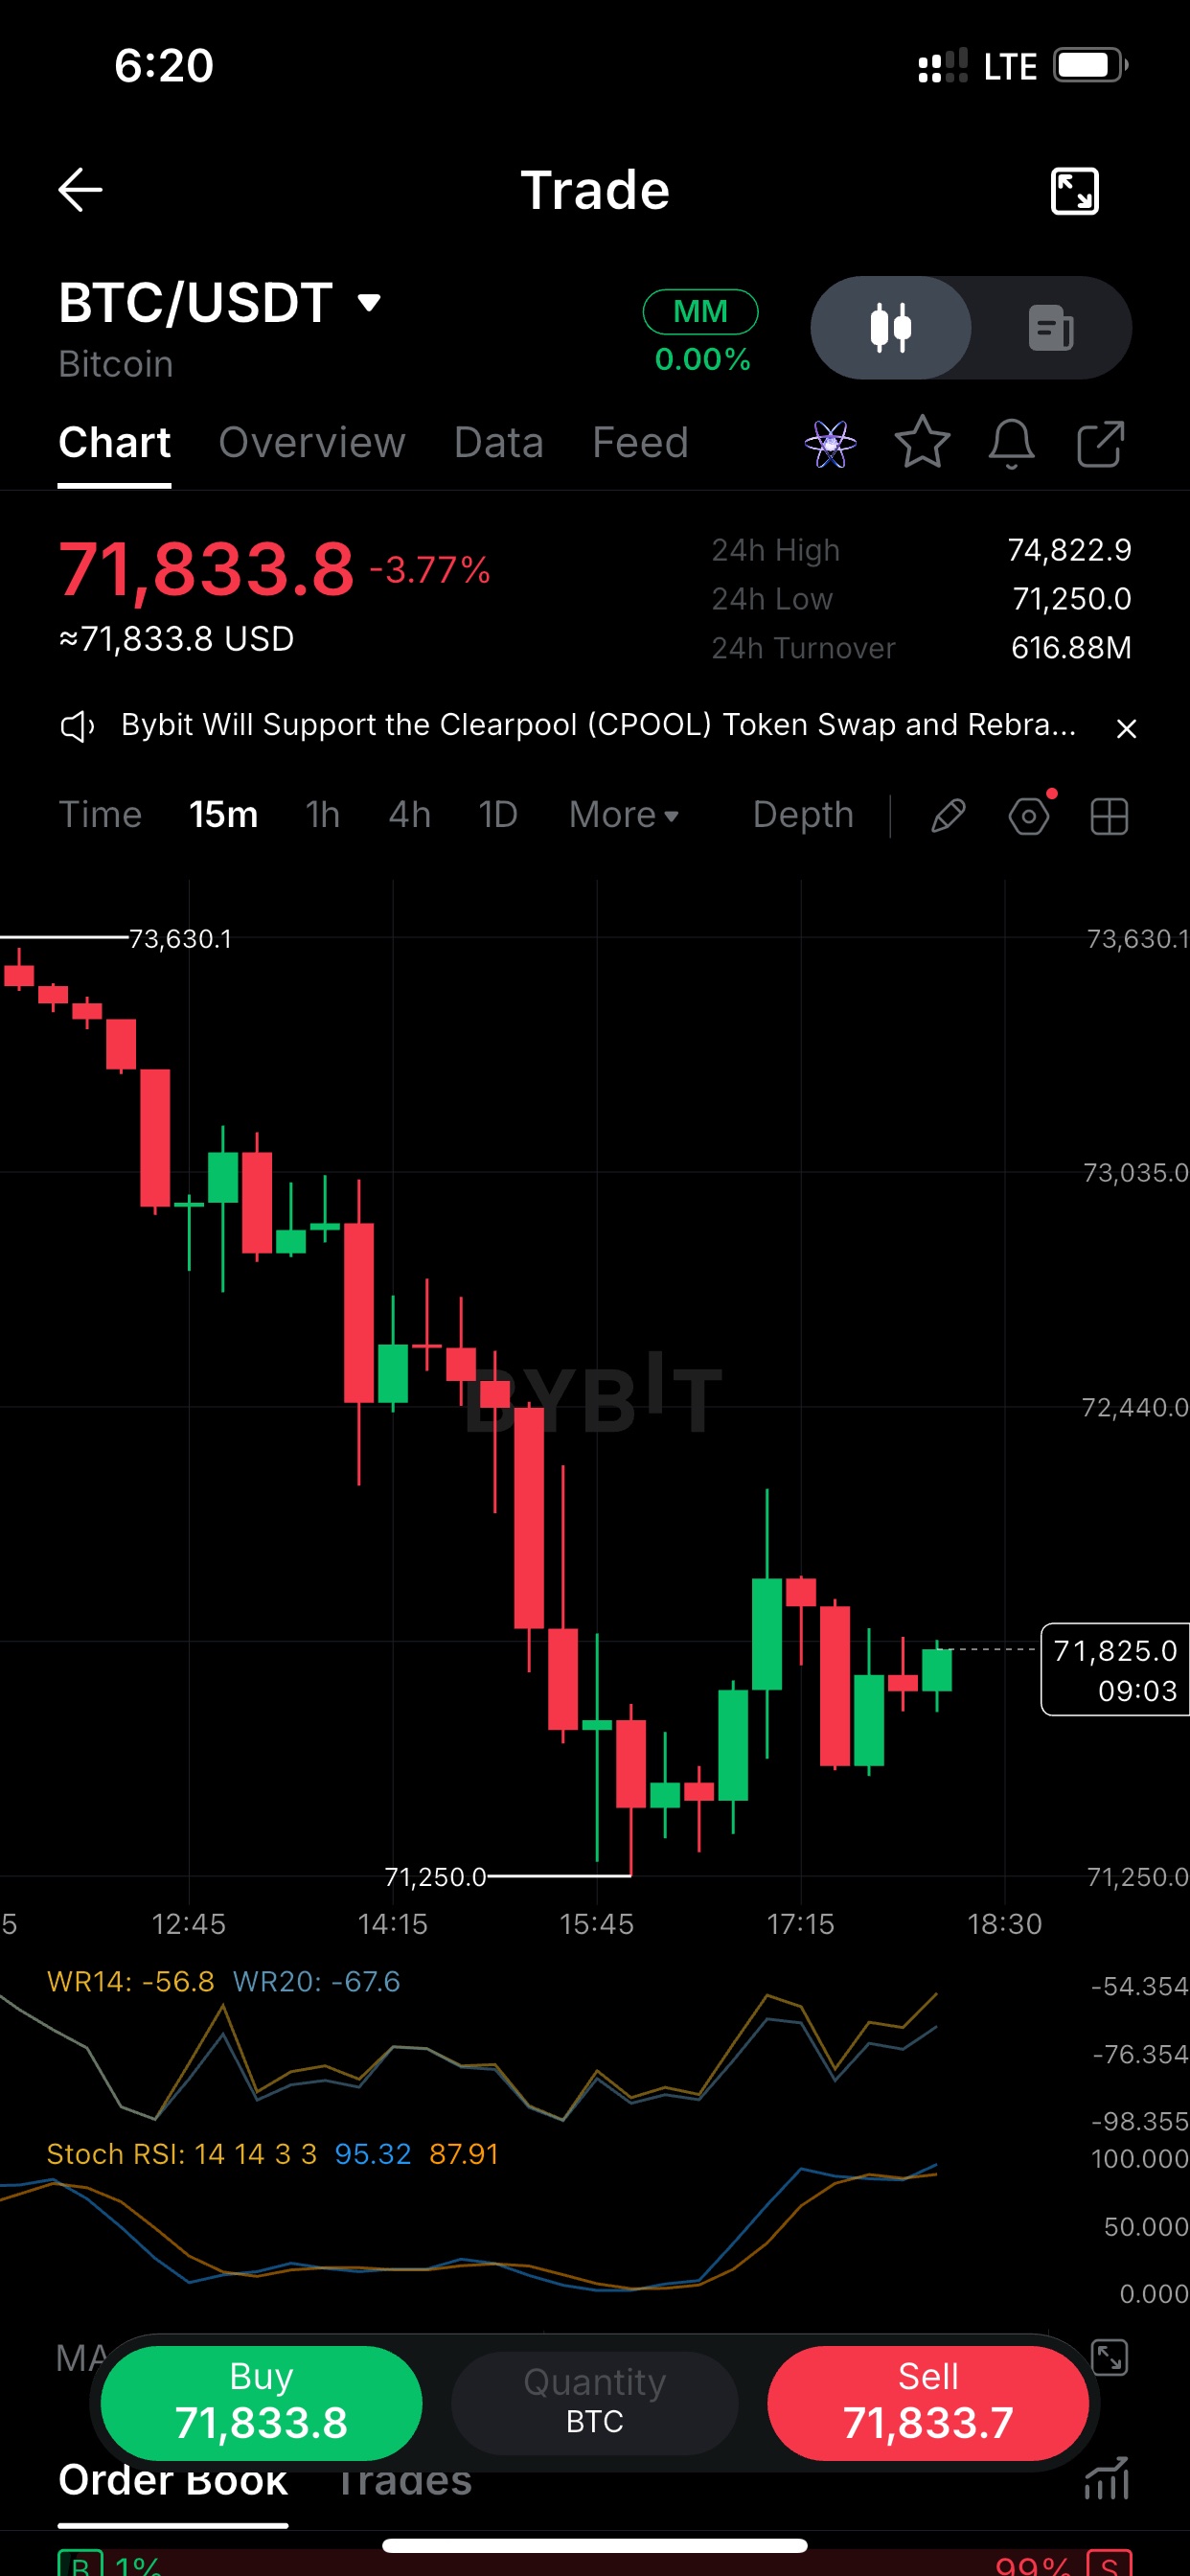
$BTCUSDT swept the 71,250 low on the 15m and bought it back almost immediately. Down 3.77% on the day, but the last few candles are holding higher lows. The bounce stalled around 72,300, and that's the level to watch. A clean reclaim there turns this from a relief bounce into a base. Rejecting there puts 71,250 back in play. Stoch RSI on the15m is already at 95/88 while price is still 1,500+ below the 73,630 breakdown level. Momentum ran ahead of structure. When that happens after a drop this size, I'd rather wait for a pullback that holds above 71,250 than chase the bounce. If it holds, the setup improves. If it doesn't, the bounce was just liquidity. intraday map after today's flush: Support: 71,250 (24h low, tested once, defended) Resistance: ~72,300 (bounce high), then 73,630 (where the breakdown began) Price is sitting at 71,800, closer to support than to any real resistance. I'm not trading the middle of this range. I want either a hold of 72,300 or another look at 71,250. Post one at a time, spaced out. The leaderboard rules penalize similar posts and high-frequency posting. Send me your next chart and I'll vary the angle again. #ByXIMPACT
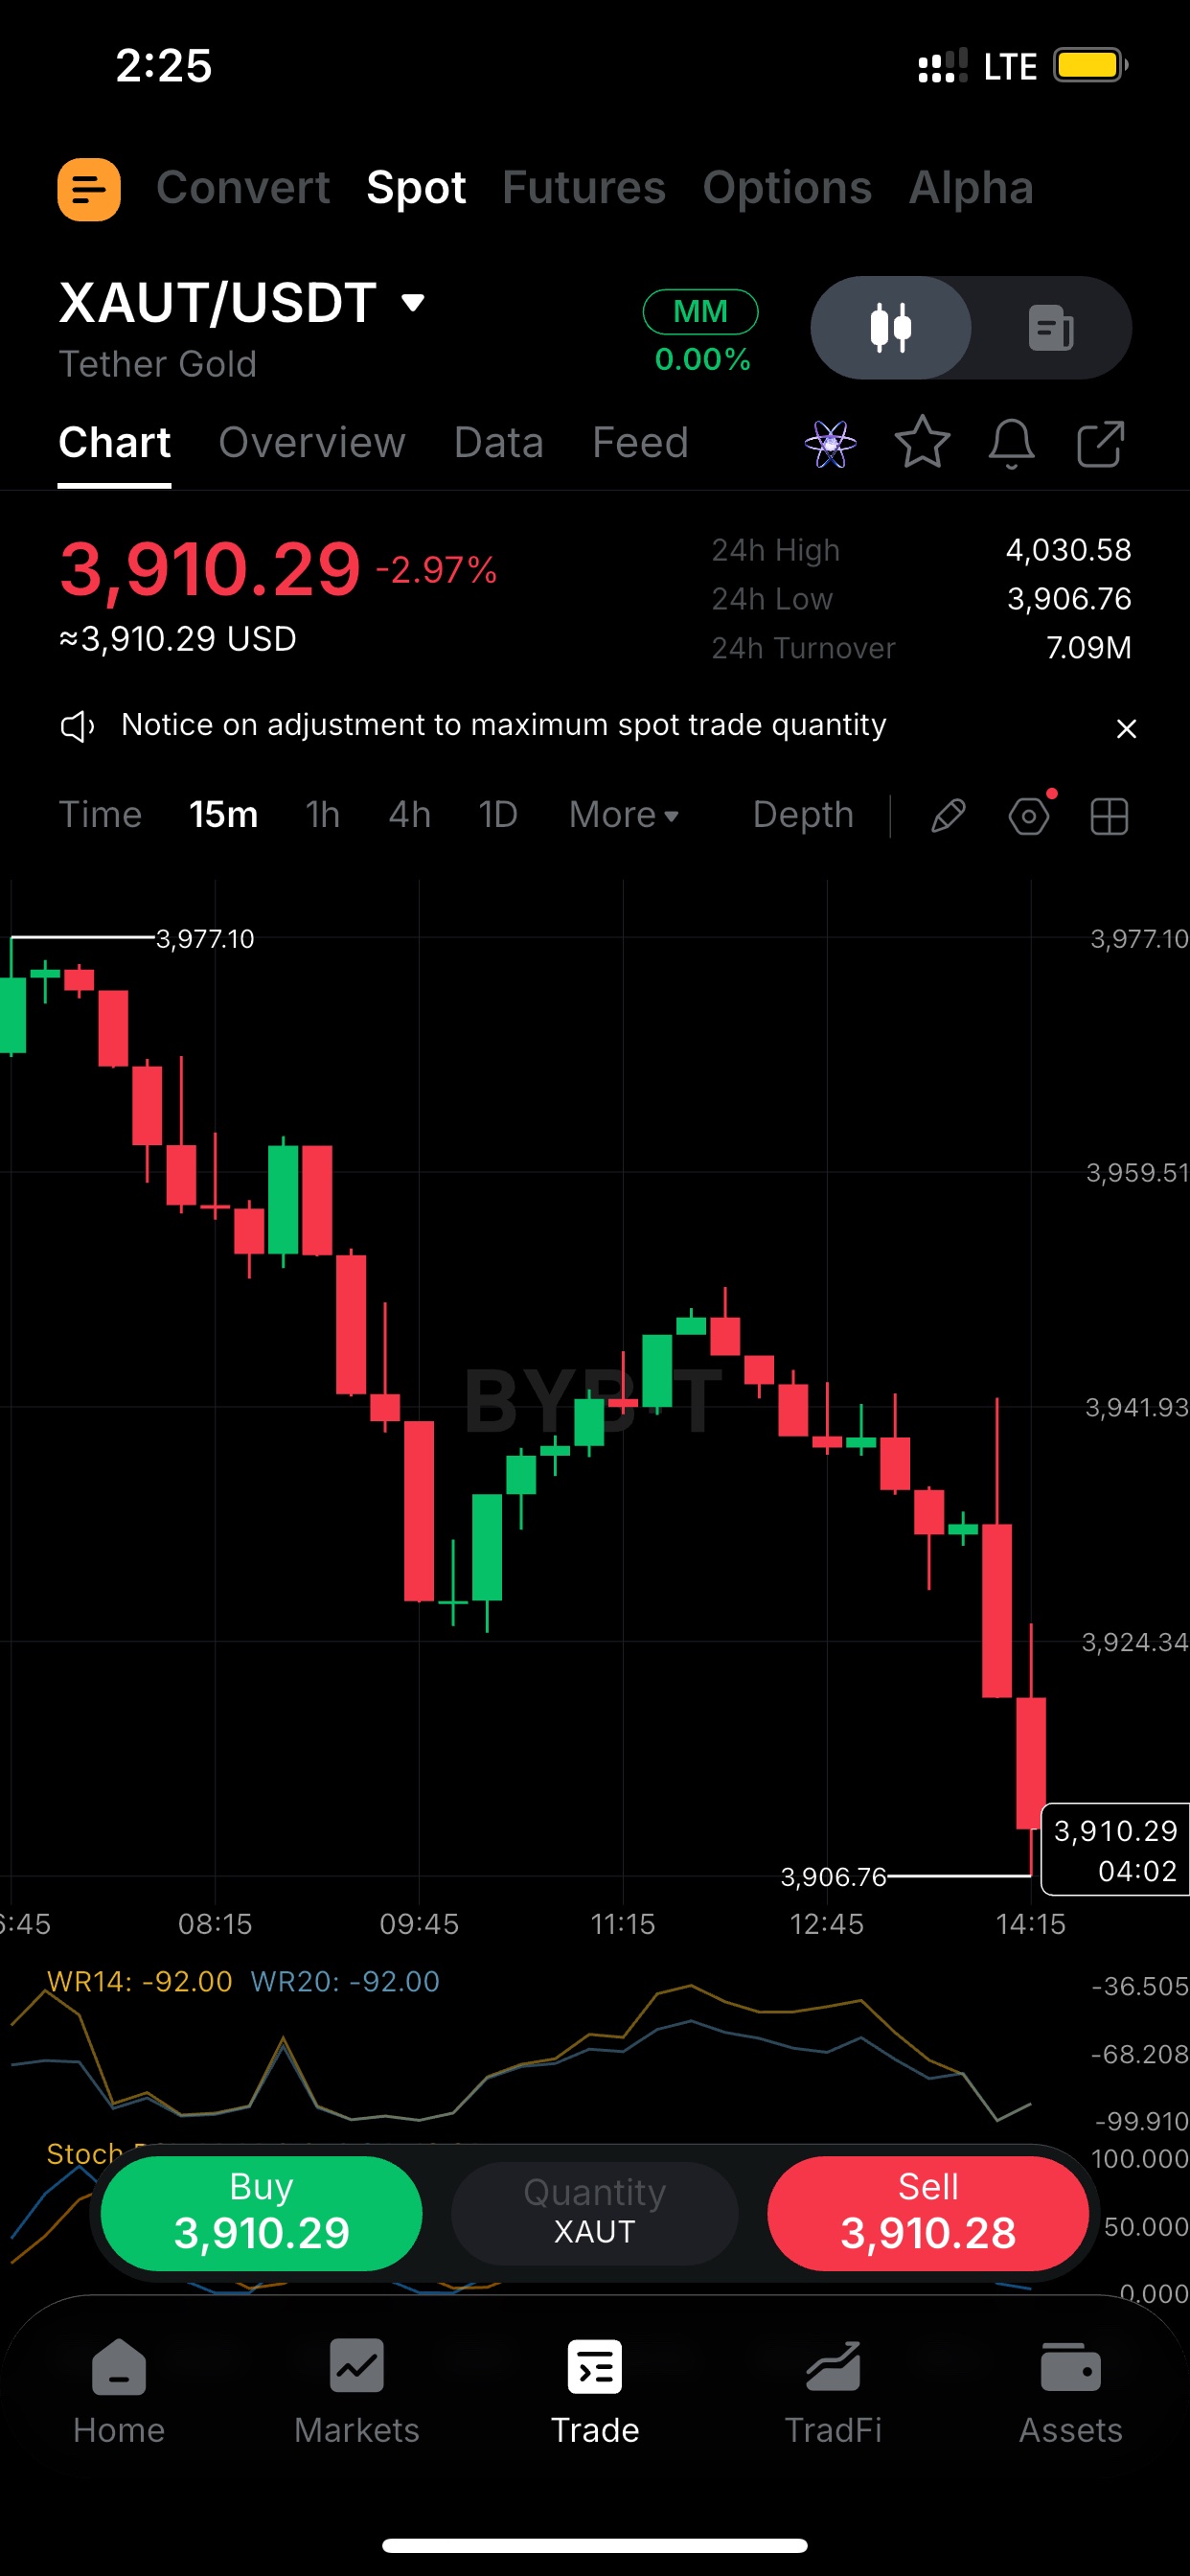
$XAUTUSDT : gold has now given back almost 3% on the day, sitting 20 bucks off the 24h high of 4,030. The 09:45 to 11:15 bounce died at 3,941, a lower high, and the last two 15m candles sold straight through 3,924 with almost no wicks below. That's trend continuation, not exhaustion. 3,906.76 is the 24h low and the only floor in view. A clean break puts price in untested territory. A reclaim of 3,924 would be the first sign sellers are tiring. Williams %R on15m is pinned at -92 and Stoch is near the bottom of its range. Textbook oversold. But oversold in a downtrend usually means "strong", not "about to bounce." The last time %R hit this zone, around 09:00, it gave a rally of roughly 35 points that failed under 3,941. So I'm not catching this one on the indicator alone. I want a candle that closes back above 3,924 first. Until then, the tape is in Gold is down 2.trading 7M in 24h turnover, and price is hovering about 3.5 points above the day's low. Two scenarios I'm watching: 1. Break and hold below 3,906: continuation, with no support until well lower. 2. Wick under 3,906 and a fast recovery: a possible stop-run, and the 3,924 to 3,941 zone becomes the target. Whichever way it goes, the trade is the reaction at that low, not the prediction. Quick notes: - All three use the coin tag. If you have a trade open, attach the trading widget, since that is a scoring factor. - Before posting, check the timestamp on your screenshot, since the 15m levels will shift quickly. - None of this is financial advice. Add your own view if you hold a position, because personal, original takes tend to read better than neutral analysis. #ByXIMPACT
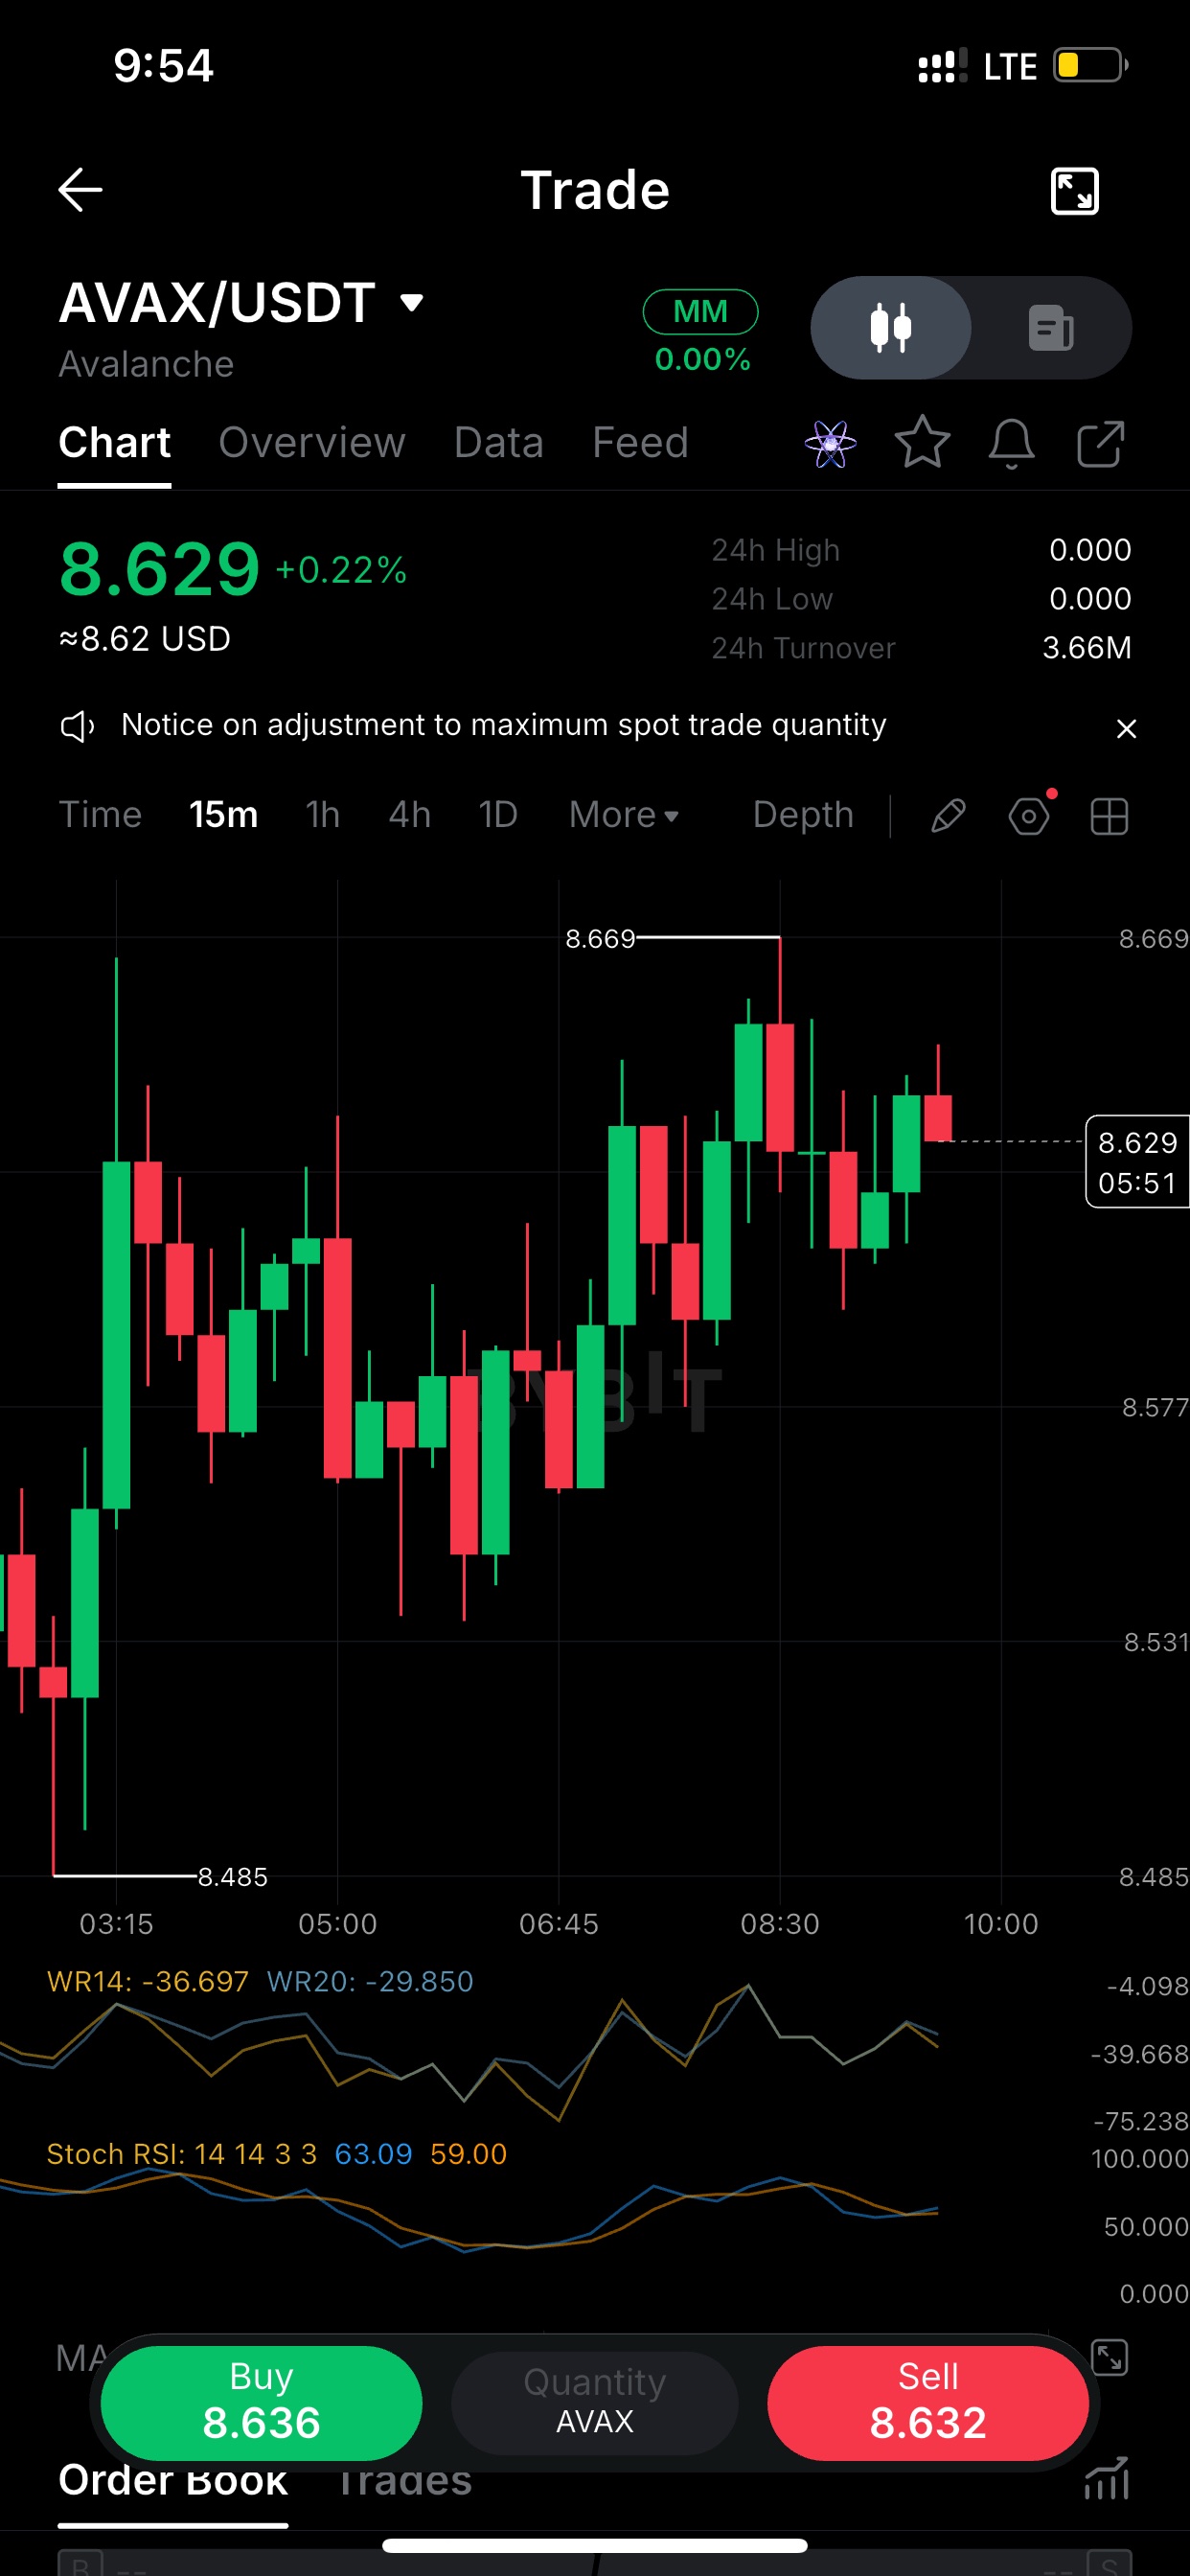
$AVAXUSDT : the 8.485 low got defended, price ran to 8.669, and the wick there shows sellers waiting. Now it's holding 8.62-8.63 with higher lows since 08:30. A clean 15m close above 8.669 would change the picture. Until then I'm treating 8.60 as the line to watch. AVAX is stuck in a tight 8.485-8.669 range on the 15m. Stoch RSI is around 59-63, so it has room before it gets stretched. Williams %R sits near -30 to -37, which isn't overbought. Momentum is mildly positive, but the 8.669 rejection tells me the breakout needs volume, not just drift. Waiting for confirmation rather than chasing. setup I'm watching: a breakout above 8.669 targets a retest of the earlier highs, while a loss of 8.55 puts the 8.485 sweep back in play. The range is only about 2%, so risk is easy to define. Which side do you think breaks first? Post 3 ends with a question to invite replies, which supports engagement. Check the live price and indicators right before posting, because these levels come from the screenshot's timestamp (9:54). Want versions for a different timeframe, or a post on another chart? #ByXIMPACT