Sabeer
11766Me gusta0Compartir en el chat274Aficionados19Seguir
El oro se encuentra en una posición interesante en este momento porque la historia macroeconómica sigue siendo favorable, pero el gráfico está pidiendo confirmación. 👀 XAUT/USDT se sitúa alrededor de los $4,426.8, casi plano con un -0.02%, con un rango de 24h muy estrecho entre $4,423.1 y $4,430.4. El volumen de operaciones actual ronda los $2.30M. El movimiento más importante vino anteriormente desde el mínimo de oscilación de $4,287.9, donde los compradores intervinieron y empujaron a XAUT de regreso hacia el área de los $4,480. Sin embargo, desde entonces, el impulso se ha enfriado y el precio se está comprimiendo alrededor de los $4,426. Esa duda tiene sentido desde el lado macro. Los últimos datos de empleo de EE. UU. fueron más fuertes de lo esperado, lo que aumentó las expectativas de una posible subida de tasas de la Fed y ejerció presión sobre el oro a través de rendimientos más altos y un dólar más fuerte. Pero la historia a largo plazo del oro no ha desaparecido. La demanda de los bancos centrales sigue siendo un soporte estructural importante; Goldman Sachs espera compras promedio de los bancos centrales de alrededor de 50 toneladas por mes en 2026 y pronostica que el oro estará alrededor de los $4,900 para fin de año. 🧠 Eso crea el conflicto interesante: Las condiciones macroeconómicas están generando presión a corto plazo, mientras que la demanda estructural sigue dándole al oro una razón para recuperarse. Ahora el gráfico necesita decidir qué lado gana. En el marco de 4H: MA7: $4,426.4 MA14: $4,435.4 MA28: $4,413.3 El precio está sentado casi directamente sobre la MA7, por debajo de la MA14 pero por encima de la MA28. Eso me dice que la recuperación no se ha roto por completo, pero los compradores tampoco han recuperado el control total. Para mí, $4,435–$4,450 es la primera área que los alcistas necesitan reclamar. Si XAUT rompe a través de ahí con volumen, la siguiente prueba seria es alrededor de los $4,480, seguida por el área psicológica de los $4,500. Pero si el precio pierde los $4,413, la recuperación comienza a verse más débil, con los $4,350 y, eventualmente, el mínimo de oscilación de $4,287.9 volviéndose importantes nuevamente. La parte interesante es el volumen: el volumen actual es de solo 24.148, por debajo de la MA5 en 45.289 y la MA10 en 137.923. Así que todavía no estoy tratando esta compresión como una ruptura. El oro tiene su historia fundamental. Ahora quiero ver si los compradores pueden hacer que el gráfico esté de acuerdo. 🔎 ¿XAUT recuperará los $4,450 a continuación, o esta recuperación de bajo volumen volverá a probar los $4,350? #ByXIMPACT $XAUTUSDT

Something interesting is happening with both Tesla and Circle: the market is starting to focus less on what they built and more on what they can scale next. 🚗 Tesla is no longer only an EV story. The company is expanding its Cybercab/robotaxi network, while Tesla has also started exploring third-party Cybercab fleet operators. At the same time, its Semi is targeting European customer deliveries by the end of 2027. But sentiment around TSLA is mixed. The bullish side is built around autonomy, FSD and new businesses beyond vehicle sales. The cautious side is watching execution and regulation closely. NHTSA is currently questioning Tesla about the self-certification of the Cybercab. 💵 Circle has its own transition happening. Arc officially launched its mainnet on September 16 with more than 100 institutional and ecosystem builders on day one. Circle is also expanding its payments infrastructure, including a proposed acquisition of Tazapay. So CRCL sentiment is also split: Bullish: USDC adoption + Arc + payments infrastructure. Cautious: execution, valuation and whether this expansion translates into sustained financial growth. That gives both stocks a similar market question: Can the next chapter become bigger than the business investors already know? TSLA is trying to turn autonomy into an operating network. CRCL is trying to turn stablecoins into financial infrastructure. And now the charts have to prove whether investors are willing to price those stories higher. Which narrative are you watching more closely Tesla's autonomy expansion or Circle's Arc + USDC ecosystem? #ByXIMPACT $CRCLXUSDT $TSLAXUSDT


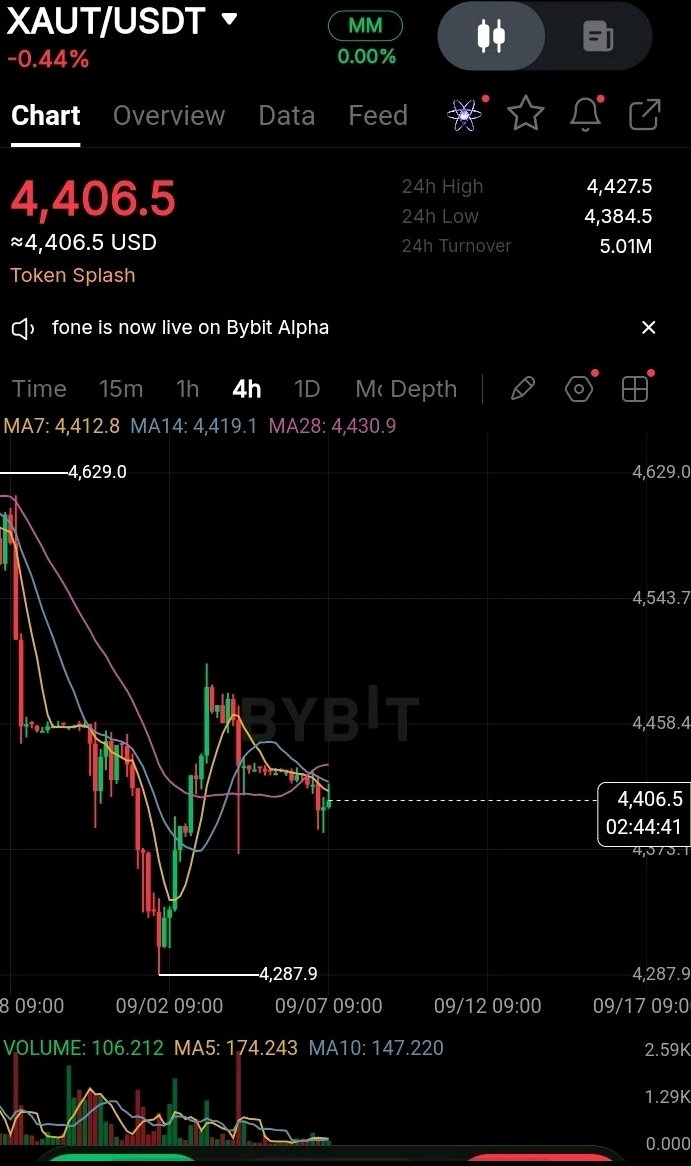
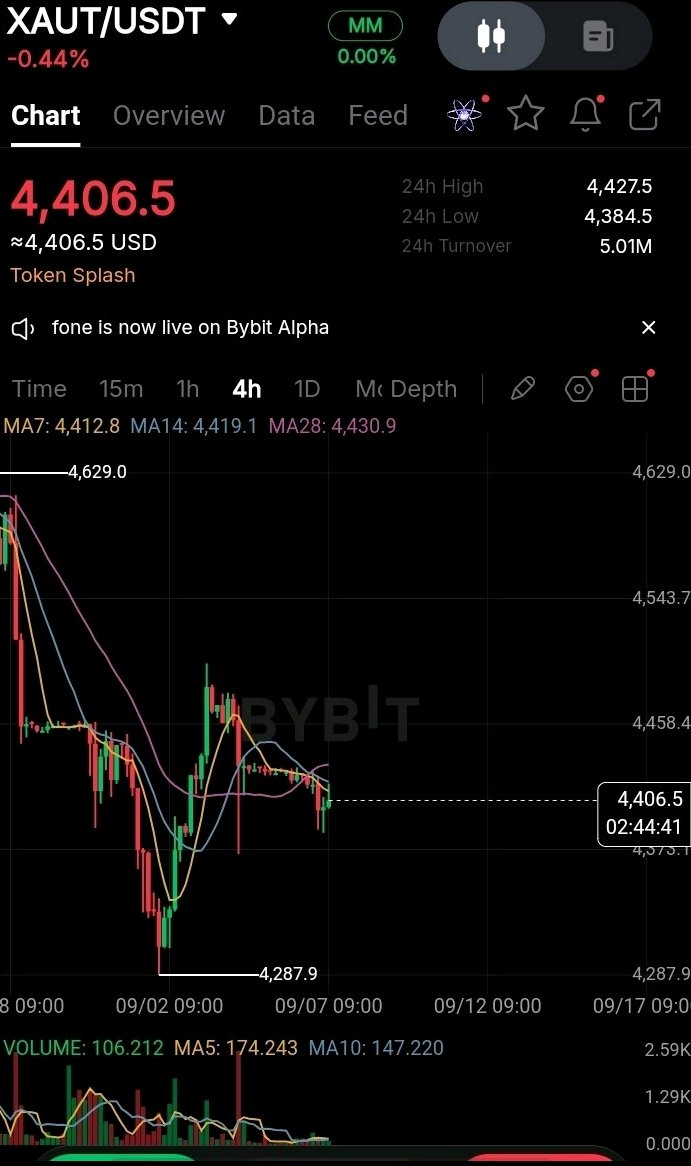
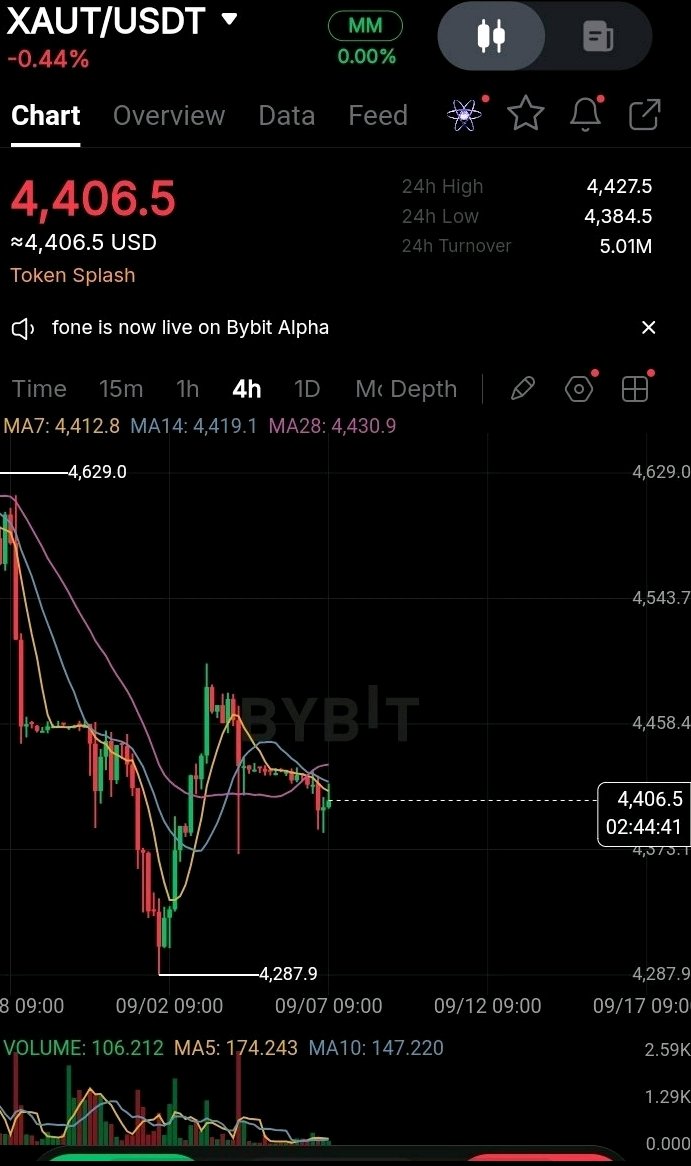
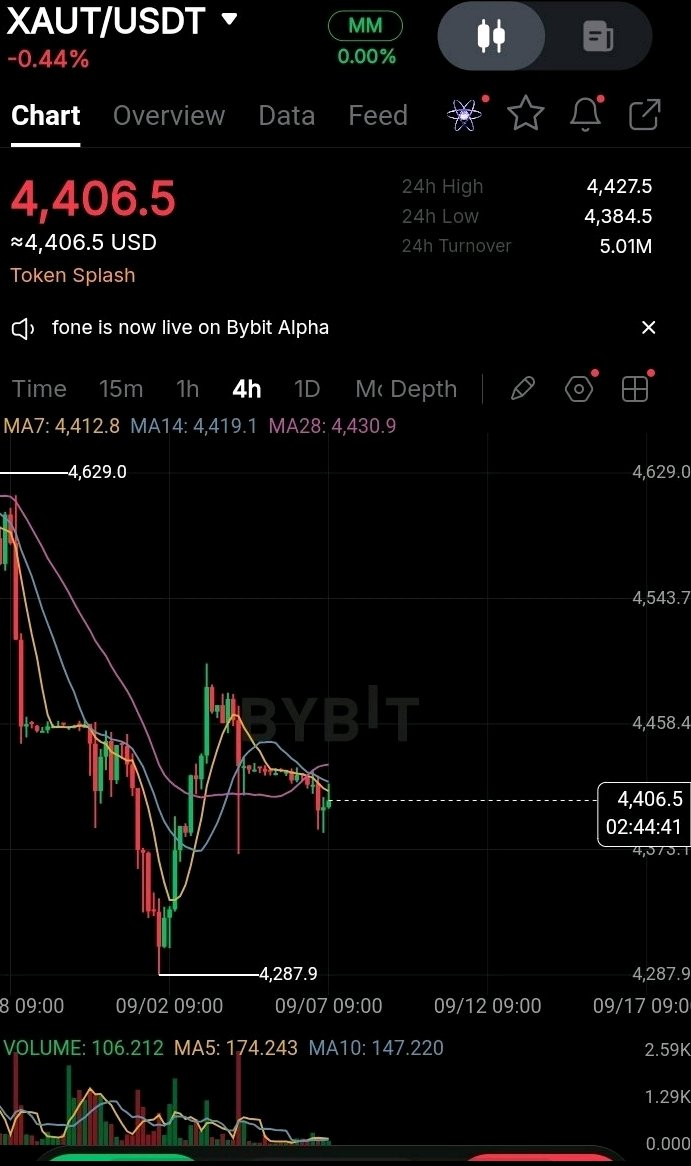
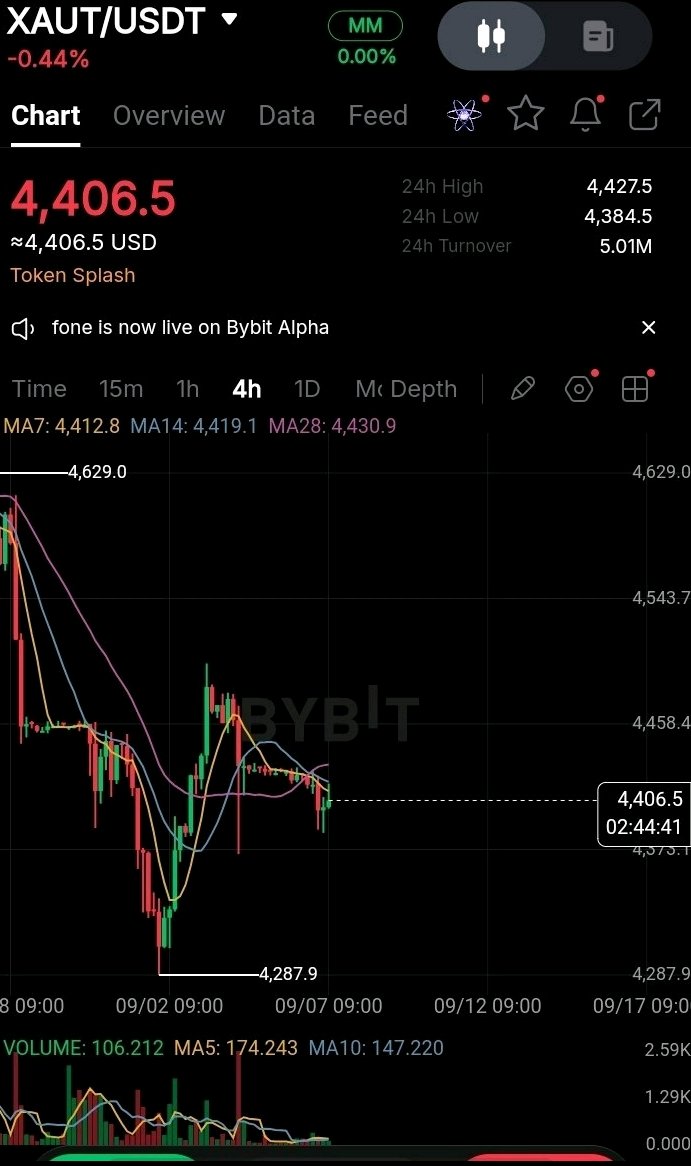
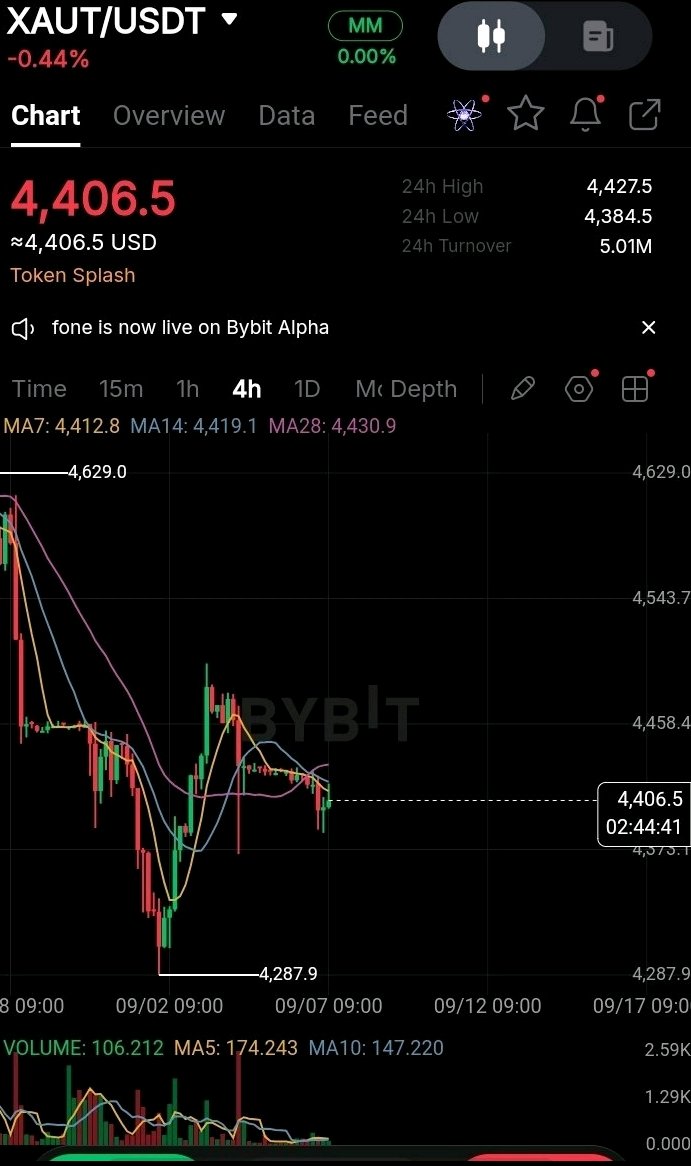
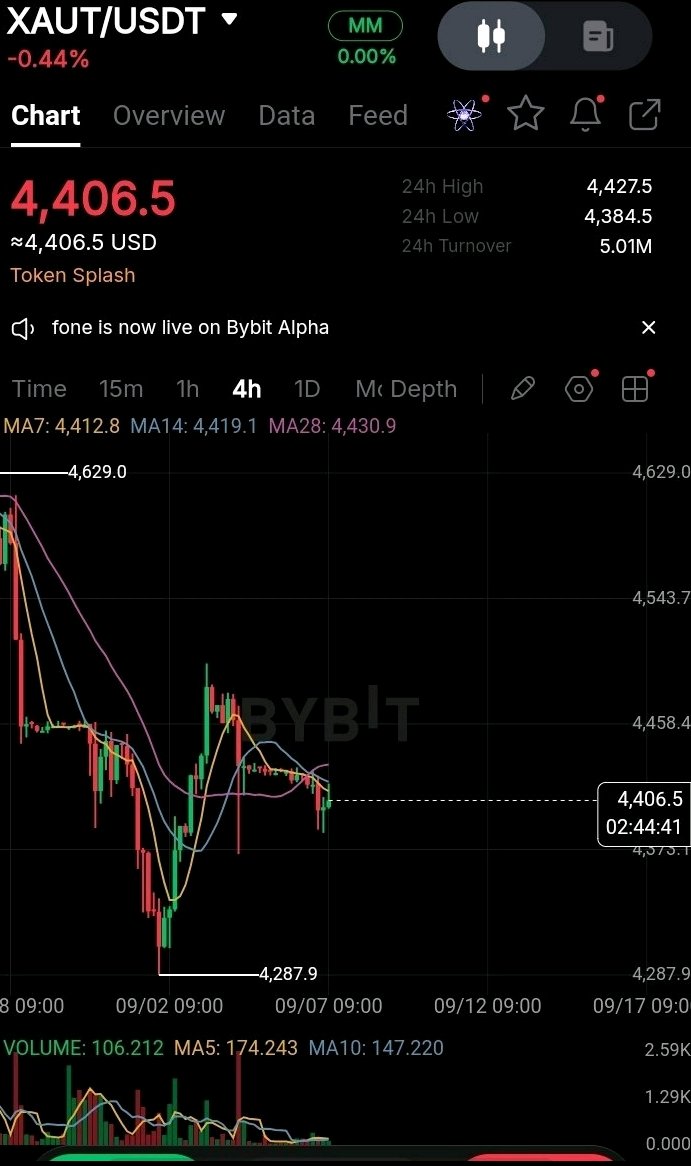
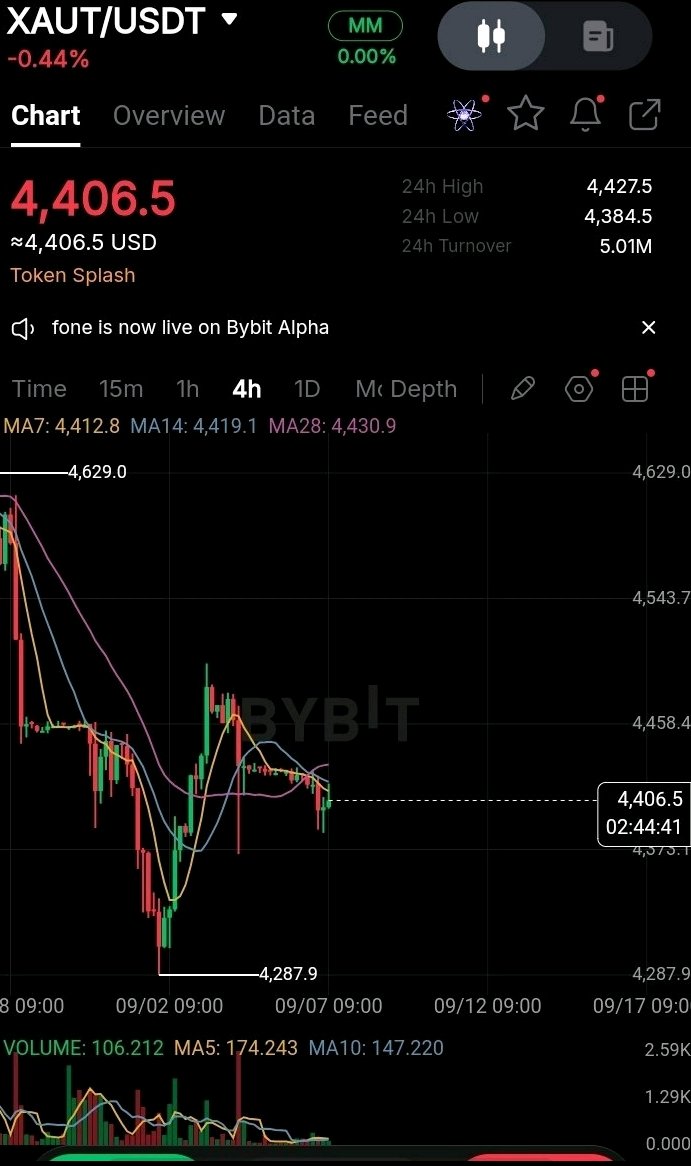
I didn’t expect gold to lose momentum this quickly after holding above the $4,400 area. The rebound had buyers interested, but the latest pullback has put price back under pressure. 📊 🟡 $XAUT/USDT is now around the $4,330–$4,340 area, with spot gold recently falling toward $4,319 as higher-for-longer rate expectations and a stronger dollar weighed on the metal. The first area I’m watching is $4,380–$4,400. Until price can reclaim that zone with strength, the short-term structure still looks vulnerable to another rejection. 👀 The bigger issue is the macro backdrop. The Fed recently raised rates by 25 bps and signaled continued tightening as inflation remains a concern. That increases the opportunity cost of holding a non-yielding asset like gold. But gold hasn't completely lost its fundamental support. Geopolitical uncertainty, inflation concerns and continued demand for defensive assets are still keeping buyers interested. That creates an interesting battle between safe-haven demand and higher interest rates. 🔥 So the setup becomes: 🚀 Bullish: reclaim $4,400 → hold above it → $4,450–$4,500 comes back into focus. ⚠️ Bearish: rejection around $4,380–$4,400 → lose $4,300 → deeper correction becomes possible. I don't want to chase gold in the middle of this range. I'd rather see whether buyers can reclaim resistance with volume, or whether sellers finally push price below $4,300. The macro story is strong enough to keep gold interesting, but the chart still needs to confirm it. Would you call this a healthy reset before another pushz, or the beginning of a deeper correction? 🧠 $XAUTUSDT #ByXIMPACT

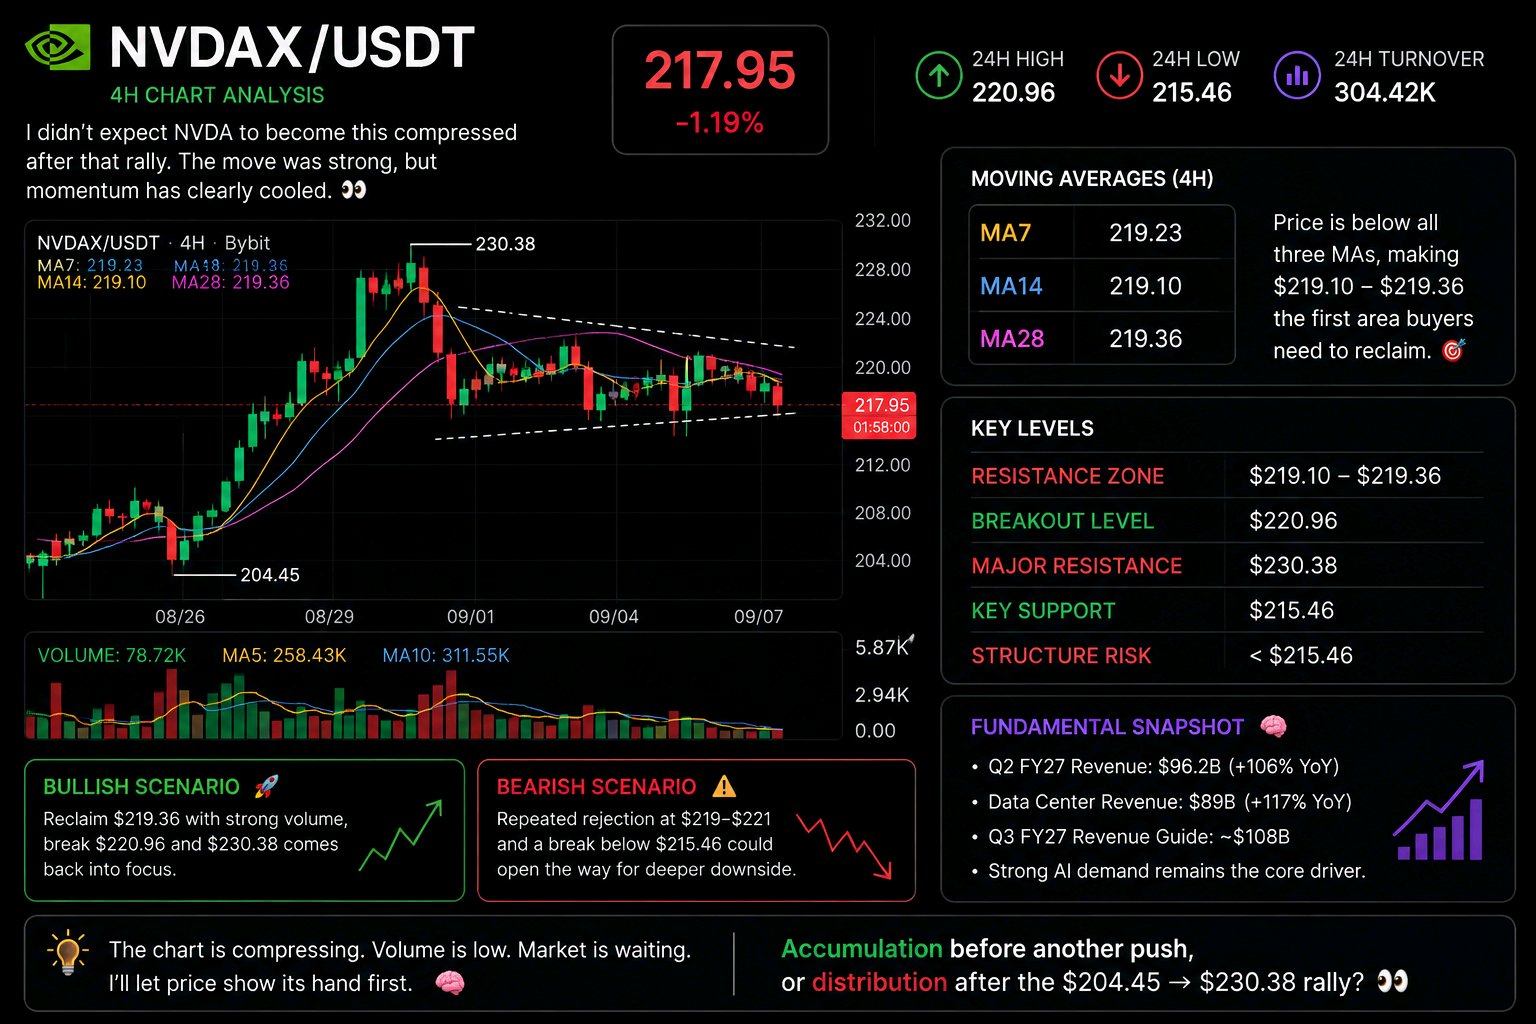
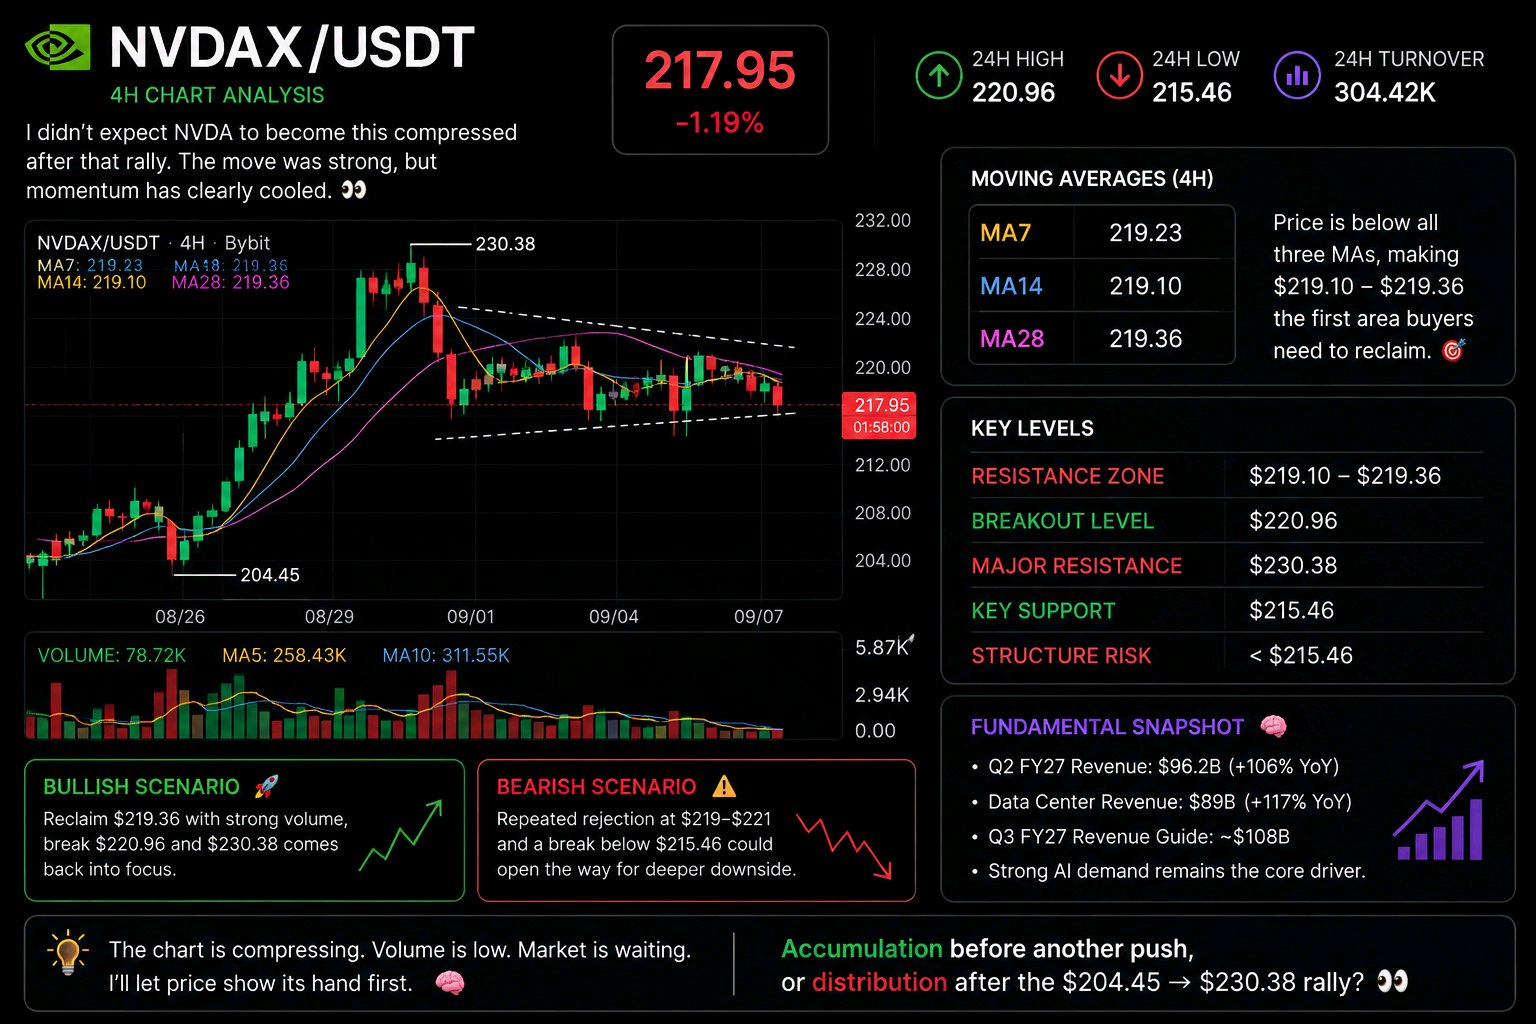
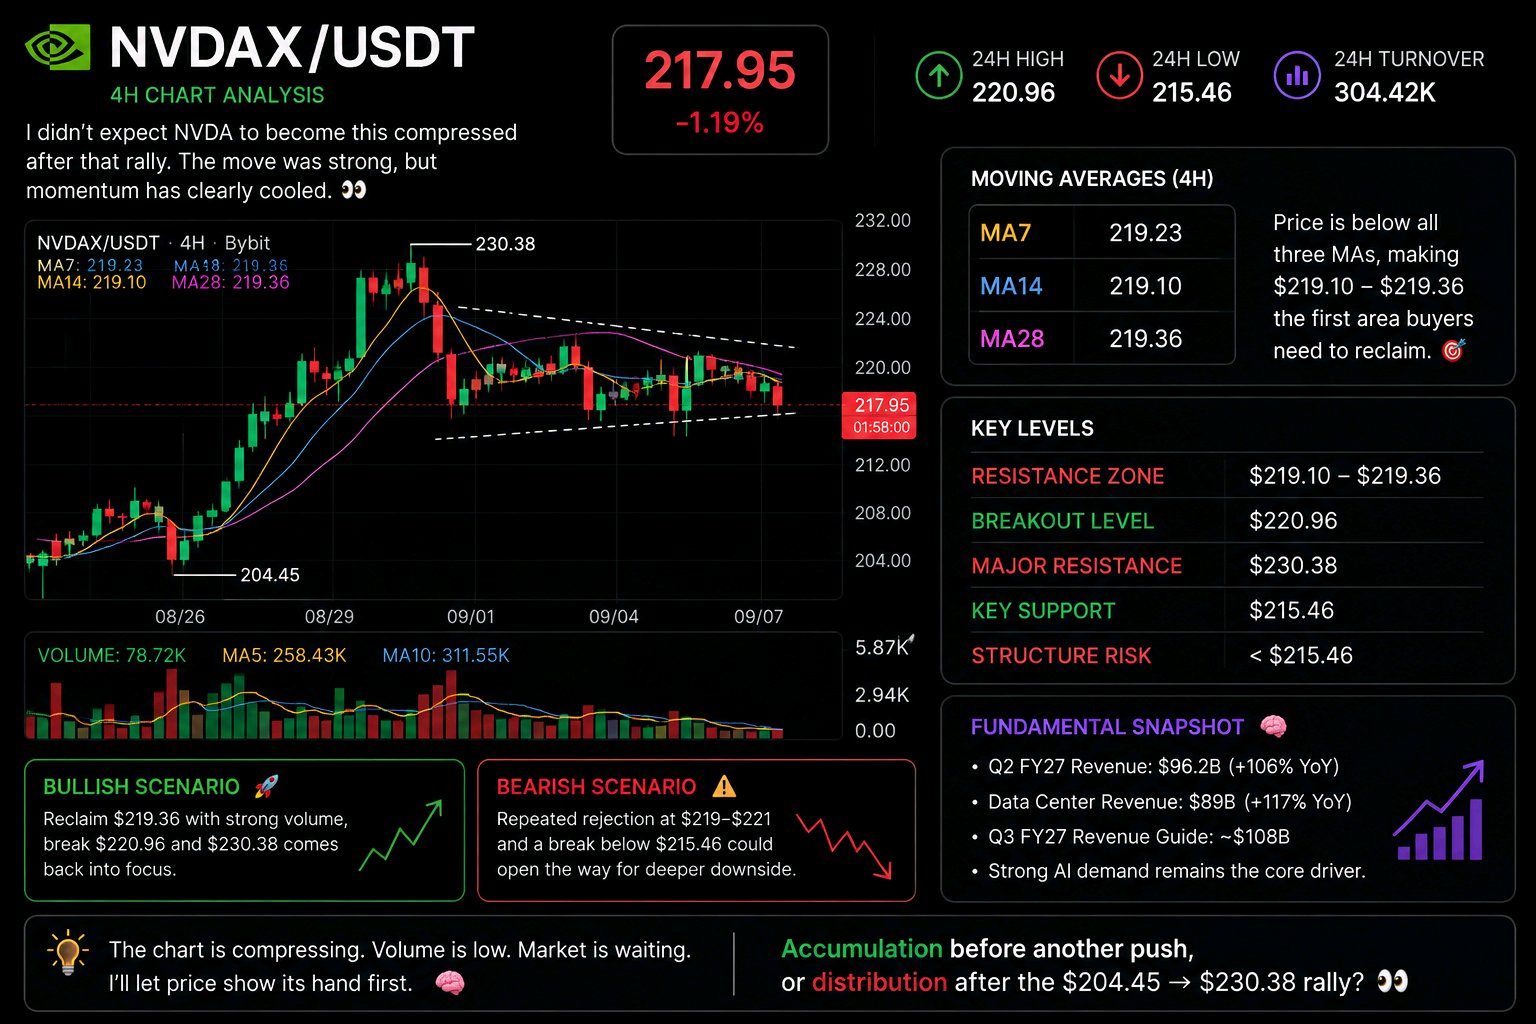
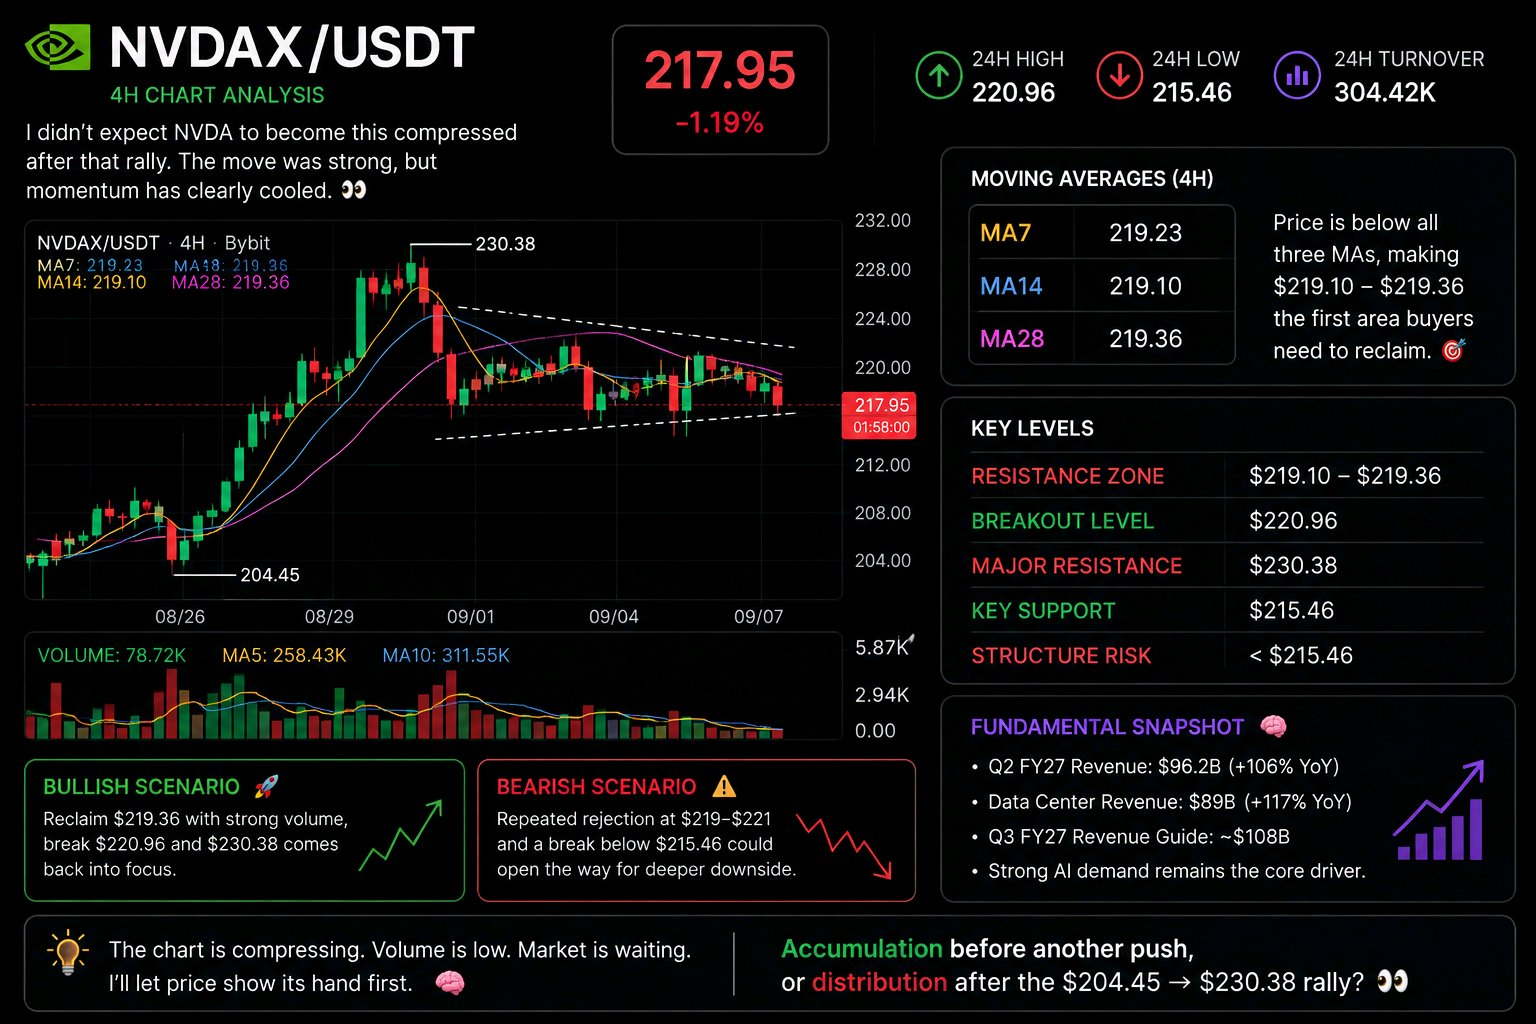
I didn’t expect NVDA to become this compressed after that rally. The move from $204.45 → $230.38 was strong, but momentum has clearly cooled. 📊 $NVDAx/USDT is now around $217.95, down 1.19%, with price sitting below a tightly packed MA structure: MA7: $219.23 MA14: $219.10 MA28: $219.36 That $219.10–$219.36 zone is the first area I want buyers to reclaim. Until that happens, the chart is still vulnerable to another rejection. 👀 Volume is also noticeably lighter. Current volume is around 78.72K, versus roughly 258.43K MA5 and 311.55K MA10. That tells me participation has dried up during the consolidation. It doesn't necessarily mean sellers are winning — it could simply mean both sides are waiting for the next catalyst. Fundamentally, Nvidia remains strong. Recent results showed $96.2B revenue, up 106% YoY, while Data Center revenue reached $89B, up 117% YoY. The company also guided for around $108B in the next quarter. 🔥 So the interesting question isn't whether Nvidia has a strong AI story. It clearly does. The question is whether buyers can translate that strength back into price. 🚀 Bullish: reclaim $219.36 → break $220.96 → $230.38 comes back into focus. ⚠️ Bearish: repeated rejection around $219–$221 → loss of $215.46 → deeper correction becomes likely. I don't want to chase this middle area. I’d rather let price show its hand first. If volume returns with a breakout, that's meaningful. If volume expands on the breakdown, that's meaningful too. Would you call this accumulation before another push, or distribution after the $204.45 → $230.38 rally? 🧠 $NVDAXUSDT #ByXIMPACT

I’d put Nvidia and Tesla together here because both are sitting in an interesting spot: strong long-term stories, but very different short-term price structures. 👀 NVDA × TSLA two AI-driven trades, two very different setups I’m paying attention to these two because the fundamentals are still giving investors reasons to stay bullish, while the charts are asking for confirmation before the next move. $NVDAx/USDT recently pushed from the $204.45 → $230.38 area, but momentum has cooled and price is now compressing below the moving-average cluster. The latest chart shows price around $217.22, with MA7 at $218.31, MA14 at $218.96 and MA28 at $218.85. That makes $218.85–$220.96 the key area for me. If buyers reclaim it with volume, the market could start rebuilding momentum toward $230.38. If $215.46 breaks with expanding volume, the recent rally becomes much more vulnerable. 📉 The interesting part is that Nvidia's fundamentals aren't showing the same weakness. Q2 FY2027 revenue reached $96.2B, up 106% YoY, while Data Center revenue hit $89B, up 117% YoY. Nvidia also guided for roughly $108B in Q3 revenue. Tesla is a different story. $TSLA is trading around the $353 area, and the market is heading into a major catalyst with Tesla's Cybercab event in Austin on September 3. That event could bring fresh momentum, but expectations are already high. Meanwhile, Tesla's China-made EV sales increased only 3.6% YoY in August, a sharp slowdown from July's 38% growth. So I see two different setups: 🚀 NVDA: strong fundamentals, but the chart needs to reclaim resistance. ⚡ TSLA: major catalyst ahead, but expectations and execution risk are much higher. That's why I wouldn't treat them the same way. Nvidia needs technical confirmation. Tesla needs catalyst confirmation. And in both cases, I’d rather wait for the market to show where the real demand is than enter sizmply because the narrative sounds bullish. If you had to choose one for the next major move NVDA after a $220.96 reclaim, or TSLA after the Cybercab catalyst which one would you take? 🧠 #ByXIMPACT $TSLAXUSDT $NVDAXUSDT


El oro está en una posición interesante en este momento porque la historia macroeconómica sigue siendo favorable, pero el gráfico está pidiendo confirmación. 👀 XAUT/USDT se sitúa alrededor de los $4,426.8, casi plano con un -0.02%, con un rango de 24 horas muy ajustado entre $4,423.1 y $4,430.4. El volumen de operaciones actual es de unos $2.30M. El movimiento más importante vino antes desde el mínimo de oscilación de $4,287.9, donde los compradores intervinieron y empujaron a XAUT de vuelta hacia el área de los $4,480. Sin embargo, desde entonces, el impulso se ha enfriado y el precio se está comprimiendo alrededor de los $4,426. Esa vacilación tiene sentido desde el lado macro. Los últimos datos de empleo de EE. UU. fueron más fuertes de lo esperado, lo que aumentó las expectativas de una posible subida de tipos de la Fed y ejerció presión sobre el oro a través de mayores rendimientos y un dólar más fuerte. Pero la historia a largo plazo del oro no ha desaparecido. La demanda de los bancos centrales sigue siendo un apoyo estructural importante, con Goldman Sachs esperando compras promedio de los bancos centrales de alrededor de 50 toneladas por mes en 2026 y pronosticando que el oro estará alrededor de los $4,900 para fin de año. 🧠 Eso crea un conflicto interesante: Las condiciones macroeconómicas están creando presión a corto plazo, mientras que la demanda estructural sigue dándole al oro una razón para recuperarse. Ahora el gráfico necesita decidir qué lado gana. En el gráfico de 4H: MA7: $4,426.4 MA14: $4,435.4 MA28: $4,413.3 El precio se encuentra casi directamente sobre la MA7, por debajo de la MA14 pero por encima de la MA28. Eso me dice que la recuperación no se ha roto por completo, pero los compradores tampoco han recuperado el control total. Para mí, los $4,435–$4,450 son la primera área que los alcistas necesitan recuperar. Si XAUT rompe por encima de ese nivel con volumen, la siguiente prueba seria está alrededor de los $4,480, seguida por el área psicológica de los $4,500. Pero si el precio pierde los $4,413, la recuperación empieza a verse más débil, con los $4,350 y eventualmente el mínimo de oscilación de $4,287.9 volviéndose importantes de nuevo. La parte interesante es el volumen: el volumen actual es de solo 24.148, por debajo de la MA5 en 45.289 y la MA10 en 137.923. Así que no estoy tratando esta compresión como una ruptura todavía. El oro tiene los fundamentos. Ahora quiero ver si los compradores pueden hacer que el gráfico esté de acuerdo. 🔎 ¿XAUT recuperará los $4,450 a continuación, o esta recuperación de bajo volumen terminará volviendo a probar los $4,350? #ByXIMPACT $XAUTUSDT

AAPL: The Event Delivered, Now Price Must Respond
Apple gave investors plenty to talk about yesterday: the $1,999 iPhone Duo, the new iPhone 18 Pro and Pro Max, upgraded AirPods, Apple Watch Series 12 and Ultra 4, plus a deeper push into AI through the new software experience. The foldable iPhone is clearly the headline, but for investors, the bigger question is whether these products can create a meaningful new upgrade cycle. What caught my attention is the reaction in AAPL itself. Despite the size of the announcement, Apple finished the session around $315.34, down roughly 0.28%, with the stock remaining inside a broader rising technical channel rather than breaking out immediately. 📈 The chart is still constructive, but price is approaching an important decision area. The structure shows higher lows developing inside the ascending channel, while price continues to push toward the upper boundary. That makes the next breakout more important than the event headline itself. If AAPL can clear the upper resistance and hold above it, the channel projection points toward a new upside leg. But there is another possibility. The market could be saying that the iPhone Duo, higher Pro pricing and AI improvements were already priced in. Apple’s shares have historically experienced some short-term “sell-the-news” behavior around major iPhone launches, even when the longer-term reaction can be stronger. So I’m watching the chart rather than chasing the excitement. Bull case: breakout above the channel → confirmation with volume → next resistance becomes the target. Bear case: rejection at the upper boundary → loss of the rising channel → deeper pullback before another attempt. The event delivered the narrative. Now AAPL needs to deliver the breakout. Would you treat this as a buy-the-dip setup, or wait for AAPL to break the channel resistance first? $AAPLXUSDT #ByXIMPACT

I didn’t expect gold to lose momentum this quickly after holding above the $4,400 area. The rebound had buyers interested, but the latest pullback has put price back under pressure. 📊 🟡 $XAUT/USDT is now around the $4,330–$4,340 area, with spot gold recently falling toward $4,319 as higher-for-longer rate expectations and a stronger dollar weighed on the metal. The first area I’m watching is $4,380–$4,400. Until price can reclaim that zone with strength, the short-term structure still looks vulnerable to another rejection. 👀 The bigger issue is the macro backdrop. The Fed recently raised rates by 25 bps and signaled continued tightening as inflation remains a concern. That increases the opportunity cost of holding a non-yielding asset like gold. But gold hasn't completely lost its fundamental support. Geopolitical uncertainty, inflation concerns and continued demand for defensive assets are still keeping buyers interested. That creates an interesting battle between safe-haven demand and higher interest rates. 🔥 So the setup becomes: 🚀 Bullish: reclaim $4,400 → hold above it → $4,450–$4,500 comes back into focus. ⚠️ Bearish: rejection around $4,380–$4,400 → lose $4,300 → deeper correction becomes possible. I don't want to chase gold in the middle of this range. I'd rather see whether buyers can reclaim resistance with volume, or whether sellers finally push price below $4,300. The macro story is strong enough to keep gold interesting, but the chart still needs to confirm it. Would you call this a healthy reset before another pushz, or the beginning of a deeper correction? 🧠 $XAUTUSDT #ByXIMPACT

I’d put Nvidia and Tesla together here because both are sitting in an interesting spot: strong long-term stories, but very different short-term price structures. 👀 NVDA × TSLA two AI-driven trades, two very different setups I’m paying attention to these two because the fundamentals are still giving investors reasons to stay bullish, while the charts are asking for confirmation before the next move. $NVDAx/USDT recently pushed from the $204.45 → $230.38 area, but momentum has cooled and price is now compressing below the moving-average cluster. The latest chart shows price around $217.22, with MA7 at $218.31, MA14 at $218.96 and MA28 at $218.85. That makes $218.85–$220.96 the key area for me. If buyers reclaim it with volume, the market could start rebuilding momentum toward $230.38. If $215.46 breaks with expanding volume, the recent rally becomes much more vulnerable. 📉 The interesting part is that Nvidia's fundamentals aren't showing the same weakness. Q2 FY2027 revenue reached $96.2B, up 106% YoY, while Data Center revenue hit $89B, up 117% YoY. Nvidia also guided for roughly $108B in Q3 revenue. Tesla is a different story. $TSLA is trading around the $353 area, and the market is heading into a major catalyst with Tesla's Cybercab event in Austin on September 3. That event could bring fresh momentum, but expectations are already high. Meanwhile, Tesla's China-made EV sales increased only 3.6% YoY in August, a sharp slowdown from July's 38% growth. So I see two different setups: 🚀 NVDA: strong fundamentals, but the chart needs to reclaim resistance. ⚡ TSLA: major catalyst ahead, but expectations and execution risk are much higher. That's why I wouldn't treat them the same way. Nvidia needs technical confirmation. Tesla needs catalyst confirmation. And in both cases, I’d rather wait for the market to show where the real demand is than enter sizmply because the narrative sounds bullish. If you had to choose one for the next major move NVDA after a $220.96 reclaim, or TSLA after the Cybercab catalyst which one would you take? 🧠 #ByXIMPACT $TSLAXUSDT $NVDAXUSDT


I didn’t expect NVDA to become this compressed after that rally. The move from $204.45 → $230.38 was strong, but momentum has clearly cooled. 📊 $NVDAx/USDT is now around $217.95, down 1.19%, with price sitting below a tightly packed MA structure: MA7: $219.23 MA14: $219.10 MA28: $219.36 That $219.10–$219.36 zone is the first area I want buyers to reclaim. Until that happens, the chart is still vulnerable to another rejection. 👀 Volume is also noticeably lighter. Current volume is around 78.72K, versus roughly 258.43K MA5 and 311.55K MA10. That tells me participation has dried up during the consolidation. It doesn't necessarily mean sellers are winning — it could simply mean both sides are waiting for the next catalyst. Fundamentally, Nvidia remains strong. Recent results showed $96.2B revenue, up 106% YoY, while Data Center revenue reached $89B, up 117% YoY. The company also guided for around $108B in the next quarter. 🔥 So the interesting question isn't whether Nvidia has a strong AI story. It clearly does. The question is whether buyers can translate that strength back into price. 🚀 Bullish: reclaim $219.36 → break $220.96 → $230.38 comes back into focus. ⚠️ Bearish: repeated rejection around $219–$221 → loss of $215.46 → deeper correction becomes likely. I don't want to chase this middle area. I’d rather let price show its hand first. If volume returns with a breakout, that's meaningful. If volume expands on the breakdown, that's meaningful too. Would you call this accumulation before another push, or distribution after the $204.45 → $230.38 rally? 🧠 #ByXIMPACT $NVDAXUSDT

El oro está en una posición interesante en este momento porque la historia macroeconómica sigue siendo favorable, pero el gráfico está pidiendo confirmación. 👀 XAUT/USDT se sitúa alrededor de los $4,426.8, casi plano con un -0.02%, con un rango de 24 horas muy ajustado entre $4,423.1 y $4,430.4. El volumen de operaciones actual es de unos $2.30M. El movimiento más importante vino antes desde el mínimo de oscilación de $4,287.9, donde los compradores intervinieron y empujaron a XAUT de vuelta hacia el área de los $4,480. Sin embargo, desde entonces, el impulso se ha enfriado y el precio se está comprimiendo alrededor de los $4,426. Esa vacilación tiene sentido desde el lado macro. Los últimos datos de empleo de EE. UU. fueron más fuertes de lo esperado, lo que aumentó las expectativas de una posible subida de tipos de la Fed y ejerció presión sobre el oro a través de mayores rendimientos y un dólar más fuerte. Pero la historia a largo plazo del oro no ha desaparecido. La demanda de los bancos centrales sigue siendo un apoyo estructural importante, con Goldman Sachs esperando compras promedio de los bancos centrales de alrededor de 50 toneladas por mes en 2026 y pronosticando que el oro estará alrededor de los $4,900 para fin de año. 🧠 Eso crea un conflicto interesante: Las condiciones macroeconómicas están creando presión a corto plazo, mientras que la demanda estructural sigue dándole al oro una razón para recuperarse. Ahora el gráfico necesita decidir qué lado gana. En el gráfico de 4H: MA7: $4,426.4 MA14: $4,435.4 MA28: $4,413.3 El precio se encuentra casi directamente sobre la MA7, por debajo de la MA14 pero por encima de la MA28. Eso me dice que la recuperación no se ha roto por completo, pero los compradores tampoco han recuperado el control total. Para mí, los $4,435–$4,450 son la primera área que los alcistas necesitan recuperar. Si XAUT rompe por encima de ese nivel con volumen, la siguiente prueba seria está alrededor de los $4,480, seguida por el área psicológica de los $4,500. Pero si el precio pierde los $4,413, la recuperación empieza a verse más débil, con los $4,350 y eventualmente el mínimo de oscilación de $4,287.9 volviéndose importantes de nuevo. La parte interesante es el volumen: el volumen actual es de solo 24.148, por debajo de la MA5 en 45.289 y la MA10 en 137.923. Así que no estoy tratando esta compresión como una ruptura todavía. El oro tiene los fundamentos. Ahora quiero ver si los compradores pueden hacer que el gráfico esté de acuerdo. 🔎 ¿XAUT recuperará los $4,450 a continuación, o esta recuperación de bajo volumen terminará volviendo a probar los $4,350? #ByXIMPACT $XAUTUSDT

Something interesting is happening with both Tesla and Circle: the market is starting to focus less on what they built and more on what they can scale next. e 🚗 Tesla is no longer only an EV story. The company is expanding its Cybercab/robotaxi network, while Tesla has also started exploring third-party Cybercab fleet operators. At the same time, its Semi is targeting European customer deliveries by the end of 2027. But sentiment around TSLA is mixed. The bullish side is built around autonomy, FSD and new businesses beyond vehicle sales. The cautious side is watching execution and regulation closely. NHTSA is currently questioning Tesla about the self-certification of the Cybercab. 💵 Circle has its own transition happening. Arc officially launched its mainnet on September 16 with more than 100 institutional and ecosystem builders on day one. Circle is also expanding its payments infrastructure, including a proposed acquisition of Tazapay. So CRCL sentiment is also split: Bullish: USDC adoption + Arc + payments infrastructure. Cautious: execution, valuation and whether this expansion translates into sustained financial growth. That gives both stocks a similar market question: Can the next chapter become bigger than the business investors already know? TSLA is trying to turn autonomy into an operating network. CRCL is trying to turn stablecoins into financial infrastructure. And now the charts have to prove whether investors are willing to price those stories higher. Which narrative are you watching more closely Tesla's autonomy expansion or Circle's Arc + USDC ecosystem? $TSLAXUSDT $CRCLXUSDT #ByXIMPACT


I didn’t expect NVDA to become this compressed after that rally. The move from $204.45 → $230.38 was strong, but momentum has clearly cooled. 📊 $NVDAx/USDT is now around $217.95, down 1.19%, with price sitting below a tightly packed MA structure: MA7: $219.23 MA14: $219.10 MA28: $219.36 That $219.10–$219.36 zone is the first area I want buyers to reclaim. Until that happens, the chart is still vulnerable to another rejection. 👀 Volume is also noticeably lighter. Current volume is around 78.72K, versus roughly 258.43K MA5 and 311.55K MA10. That tells me participation has dried up during the consolidation. It doesn't necessarily mean sellers are winning — it could simply mean both sides are waiting for the next catalyst. Fundamentally, Nvidia remains strong. Recent results showed $96.2B revenue, up 106% YoY, while Data Center revenue reached $89B, up 117% YoY. The company also guided for around $108B in the next quarter. 🔥 So the interesting question isn't whether Nvidia has a strong AI story. It clearly does. The question is whether buyers can translate that strength back into price. 🚀 Bullish: reclaim $219.36 → break $220.96 → $230.38 comes back into focus. ⚠️ Bearish: repeated rejection around $219–$221 → loss of $215.46 → deeper correction becomes likely. I don't want to chase this middle area. I’d rather let price show its hand first. If volume returns with a breakout, that's meaningful. If volume expands on the breakdown, that's meaningful too. Would you call this accumulation before another push, or distribution after the $204.45 → $230.38 rally? 🧠 $NVDAXUSDT #ByXIMPACT

I didn’t expect gold to lose momentum this quickly after holding above the $4,400 area. The rebound had buyers interested, but the latest pullback has put price back under pressure. 📊 🟡 $XAUT/USDT is now around the $4,330–$4,340 area, with spot gold recently falling toward $4,319 as higher-for-longer rate expectations and a stronger dollar weighed on the metal. The first area I’m watching is $4,380–$4,400. Until price can reclaim that zone with strength, the short-term structure still looks vulnerable to another rejection. 👀 The bigger issue is the macro backdrop. The Fed recently raised rates by 25 bps and signaled continued tightening as inflation remains a concern. That increases the opportunity cost of holding a non-yielding asset like gold. But gold hasn't completely lost its fundamental support. Geopolitical uncertainty, inflation concerns and continued demand for defensive assets are still keeping buyers interested. That creates an interesting battle between safe-haven demand and higher interest rates. 🔥 So the setup becomes: 🚀 Bullish: reclaim $4,400 → hold above it → $4,450–$4,500 comes back into focus. ⚠️ Bearish: rejection around $4,380–$4,400 → lose $4,300 → deeper correction becomes possible. I don't want to chase gold in the middle of this range. I'd rather see whether buyers can reclaim resistance with volume, or whether sellers finally push price below $4,300. The macro story is strong enough to keep gold interesting, but the chart still needs to confirm it. Would you call this a healthy reset before another pushz, or the beginning of a deeper correction? 🧠 #ByXIMPACT $XAUTUSDT

I’d put Nvidia and Tesla together here because both are sitting in an interesting spot: strong long-term stories, but very different short-term price structures. 👀 NVDA × TSLA two AI-driven trades, two very different setups I’m paying attention to these two because the fundamentals are still giving investors reasons to stay bullish, while the charts are asking for confirmation before the next move. $NVDAx/USDT recently pushed from the $204.45 → $230.38 area, but momentum has cooled and price is now compressing below the moving-average cluster. The latest chart shows price around $217.22, with MA7 at $218.31, MA14 at $218.96 and MA28 at $218.85. That makes $218.85–$220.96 the key area for me. If buyers reclaim it with volume, the market could start rebuilding momentum toward $230.38. If $215.46 breaks with expanding volume, the recent rally becomes much more vulnerable. 📉 The interesting part is that Nvidia's fundamentals aren't showing the same weakness. Q2 FY2027 revenue reached $96.2B, up 106% YoY, while Data Center revenue hit $89B, up 117% YoY. Nvidia also guided for roughly $108B in Q3 revenue. Tesla is a different story. $TSLA is trading around the $353 area, and the market is heading into a major catalyst with Tesla's Cybercab event in Austin on September 3. That event could bring fresh momentum, but expectations are already high. Meanwhile, Tesla's China-made EV sales increased only 3.6% YoY in August, a sharp slowdown from July's 38% growth. So I see two different setups: 🚀 NVDA: strong fundamentals, but the chart needs to reclaim resistance. ⚡ TSLA: major catalyst ahead, but expectations and execution risk are much higher. That's why I wouldn't treat them the same way. Nvidia needs technical confirmation. Tesla needs catalyst confirmation. And in both cases, I’d rather wait for the market to show where the real demand is than enter sizmply because the narrative sounds bullish. If you had to choose one for the next major move NVDA after a $220.96 reclaim, or TSLA after the Cybercab catalyst which one would you take? 🧠 #ByXIMPACT $NVDAXUSDT $TSLAXUSDT


El oro se encuentra en una posición interesante en este momento porque la narrativa macroeconómica sigue siendo favorable, pero el gráfico está pidiendo confirmación. 👀 XAUT/USDT se mantiene alrededor de $4,426.8, prácticamente sin cambios con un -0.02%, con un rango de 24 horas muy estrecho entre $4,423.1 y $4,430.4. El volumen de operaciones actual es de aproximadamente $2.30 millones. El movimiento más grande vino antes desde el mínimo de oscilación de $4,287.9, donde los compradores intervinieron y empujaron a XAUT de regreso hacia el área de los $4,480. Desde entonces, sin embargo, el impulso se ha enfriado y el precio se está comprimiendo alrededor de los $4,426. Esa duda tiene sentido desde el lado macro. Los datos de empleo más recientes de EE. UU. fueron más sólidos de lo esperado, lo que aumenta las expectativas de una posible subida de tasas de la Fed y ejerce presión sobre el oro a través de rendimientos más altos y un dólar más fuerte. Pero la historia del oro a largo plazo no ha desaparecido. La demanda de los bancos centrales sigue siendo un soporte estructural importante; Goldman Sachs espera compras promedio de los bancos centrales de alrededor de 50 toneladas por mes en 2026 y pronostica que el oro rondará los $4,900 para fin de año. 🧠 Eso crea un conflicto interesante: Las condiciones macroeconómicas están generando presión a corto plazo, mientras que la demanda estructural sigue dándole al oro una razón para recuperarse. Ahora el gráfico necesita decidir qué lado gana. En el marco de 4H: MA7: $4,426.4 MA14: $4,435.4 MA28: $4,413.3 El precio se encuentra casi directamente sobre la MA7, por debajo de la MA14 pero por encima de la MA28. Eso me indica que la recuperación no se ha roto por completo, pero los compradores tampoco han recuperado el control total. Para mí, $4,435–$4,450 es la primera área que los alcistas necesitan reclamar. Si XAUT rompe a través de ahí con volumen, la siguiente prueba seria está alrededor de $4,480, seguida por el área psicológica de los $4,500. Pero si el precio pierde los $4,413, la recuperación comienza a verse más débil, con los $4,350 y, eventualmente, el mínimo de oscilación de $4,287.9 volviéndose importantes nuevamente. La parte interesante es el volumen: el volumen actual es de solo 24.148, por debajo de la MA5 en 45.289 y la MA10 en 137.923. Así que todavía no trato esta compresión como una ruptura. El oro tiene esta historia fundamental. Ahora quiero ver si los compradores pueden hacer que el gráfico esté de acuerdo. 🔎 ¿XAUT recuperará los $4,450 a continuación, o esta recuperación de bajo volumen terminará volviendo a probar los $4,350? #ByXIMPACT $XAUTUSDT

AAPL: The Event Delivered, Now Price Must Respond
Apple gave investors plenty to talk about yesterday: the $1,999 iPhone Duo, the new iPhone 18 Pro and Pro Max, upgraded AirPods, Apple Watch Series 12 and Ultra 4, plus a deeper push into AI through the new software experience. The foldable iPhone is clearly the headline, but for investors, the bigger question is whether these products can create a meaningful new upgrade cycle. What caught my attention is the reaction in AAPL itself. Despite the size of the announcement, Apple finished the session around $315.34, down roughly 0.28%, with the stock remaining inside a broader rising technical channel rather than breaking out immediately. 📈 The chart is still constructive, but price is approaching an important decision area. The structure shows higher lows developing inside the ascending channel, while price continues to push toward the upper boundary. That makes the next breakout more important than the event headline itself. If AAPL can clear the upper resistance and hold above it, the channel projection points toward a new upside leg. But there is another possibility. The market could be saying that the iPhone Duo, higher Pro pricing and AI improvements were already priced in. Apple’s shares have historically experienced some short-term “sell-the-news” behavior around major iPhone launches, even when the longer-term reaction can be stronger. So I’m watching the chart rather than chasing the excitement. Bull case: breakout above the channel → confirmation with volume → next resistance becomes the target. Bear case: rejection at the upper boundary → loss of the rising channel → deeper pullback before another attempt. The event delivered the narrative. Now AAPL needs to deliver the breakout. Would you treat this as a buy-the-dip setup, or wait for AAPL to break the channel resistance first? $AAPLXUSDT #ByXIMPACT

I’d put Nvidia and Tesla together here because both are sitting in an interesting spot: strong long-term stories, but very different short-term price structures. 👀 NVDA × TSLA two AI-driven trades, two very different setups I’m paying attention to these two because the fundamentals are still giving investors reasons to stay bullish, while the charts are asking for confirmation before the next move. $NVDAx/USDT recently pushed from the $204.45 → $230.38 area, but momentum has cooled and price is now compressing below the moving-average cluster. The latest chart shows price around $217.22, with MA7 at $218.31, MA14 at $218.96 and MA28 at $218.85. That makes $218.85–$220.96 the key area for me. If buyers reclaim it with volume, the market could start rebuilding momentum toward $230.38. If $215.46 breaks with expanding volume, the recent rally becomes much more vulnerable. 📉 The interesting part is that Nvidia's fundamentals aren't showing the same weakness. Q2 FY2027 revenue reached $96.2B, up 106% YoY, while Data Center revenue hit $89B, up 117% YoY. Nvidia also guided for roughly $108B in Q3 revenue. Tesla is a different story. $TSLA is trading around the $353 area, and the market is heading into a major catalyst with Tesla's Cybercab event in Austin on September 3. That event could bring fresh momentum, but expectations are already high. Meanwhile, Tesla's China-made EV sales increased only 3.6% YoY in August, a sharp slowdown from July's 38% growth. So I see two different setups: 🚀 NVDA: strong fundamentals, but the chart needs to reclaim resistance. ⚡ TSLA: major catalyst ahead, but expectations and execution risk are much higher. That's why I wouldn't treat them the same way. Nvidia needs technical confirmation. Tesla needs catalyst confirmation. And in both cases, I’d rather wait for the market to show where the real demand is than enter sizmply because the narrative sounds bullish. If you had to choose one for the next major move NVDA after a $220.96 reclaim, or TSLA after the Cybercab catalyst which one would you take? 🧠 #ByXIMPACT $NVDAXUSDT $TSLAXUSDT


I didn’t expect gold to lose momentum this quickly after holding above the $4,400 area. The rebound had buyers interested, but the latest pullback has put price back under pressure. 📊 🟡 $XAUT/USDT is now around the $4,330–$4,340 area, with spot gold recently falling toward $4,319 as higher-for-longer rate expectations and a stronger dollar weighed on the metal. The first area I’m watching is $4,380–$4,400. Until price can reclaim that zone with strength, the short-term structure still looks vulnerable to another rejection. 👀 The bigger issue is the macro backdrop. The Fed recently raised rates by 25 bps and signaled continued tightening as inflation remains a concern. That increases the opportunity cost of holding a non-yielding asset like gold. But gold hasn't completely lost its fundamental support. Geopolitical uncertainty, inflation concerns and continued demand for defensive assets are still keeping buyers interested. That creates an interesting battle between safe-haven demand and higher interest rates. 🔥 So the setup becomes: 🚀 Bullish: reclaim $4,400 → hold above it → $4,450–$4,500 comes back into focus. ⚠️ Bearish: rejection around $4,380–$4,400 → lose $4,300 → deeper correction becomes possible. I don't want to chase gold in the middle of this range. I'd rather see whether buyers can reclaim resistance with volume, or whether sellers finally push price below $4,300. The macro story is strong enough to keep gold interesting, but the chart still needs to confirm it. Would you call this a healthy reset before another pushz, or the beginning of a deeper correction? 🧠 #ByXIMPACT $XAUTUSDT

I didn’t expect NVDA to become this compressed after that rally. The move from $204.45 → $230.38 was strong, but momentum has clearly cooled. 📊 $NVDAx/USDT is now around $217.95, down 1.19%, with price sitting below a tightly packed MA structure: MA7: $219.23 MA14: $219.10 MA28: $219.36 That $219.10–$219.36 zone is the first area I want buyers to reclaim. Until that happens, the chart is still vulnerable to another rejection. 👀 Volume is also noticeably lighter. Current volume is around 78.72K, versus roughly 258.43K MA5 and 311.55K MA10. That tells me participation has dried up during the consolidation. It doesn't necessarily mean sellers are winning — it could simply mean both sides are waiting for the next catalyst. Fundamentally, Nvidia remains strong. Recent results showed $96.2B revenue, up 106% YoY, while Data Center revenue reached $89B, up 117% YoY. The company also guided for around $108B in the next quarter. 🔥 So the interesting question isn't whether Nvidia has a strong AI story. It clearly does. The question is whether buyers can translate that strength back into price. 🚀 Bullish: reclaim $219.36 → break $220.96 → $230.38 comes back into focus. ⚠️ Bearish: repeated rejection around $219–$221 → loss of $215.46 → deeper correction becomes likely. I don't want to chase this middle area. I’d rather let price show its hand first. If volume returns with a breakout, that's meaningful. If volume expands on the breakdown, that's meaningful too. Would you call this accumulation before another push, or distribution after the $204.45 → $230.38 rally? 🧠 $NVDAXUSDT #ByXIMPACT