MdSalmanAhmedShanto
2752Like0Partages57Abonnés1Suivre
空军头子|仅作观点分享不构成任何投资建议|关注我的人都暴富了
空军头子|仅作观点分享不构成任何投资建议|关注我的人都暴富了
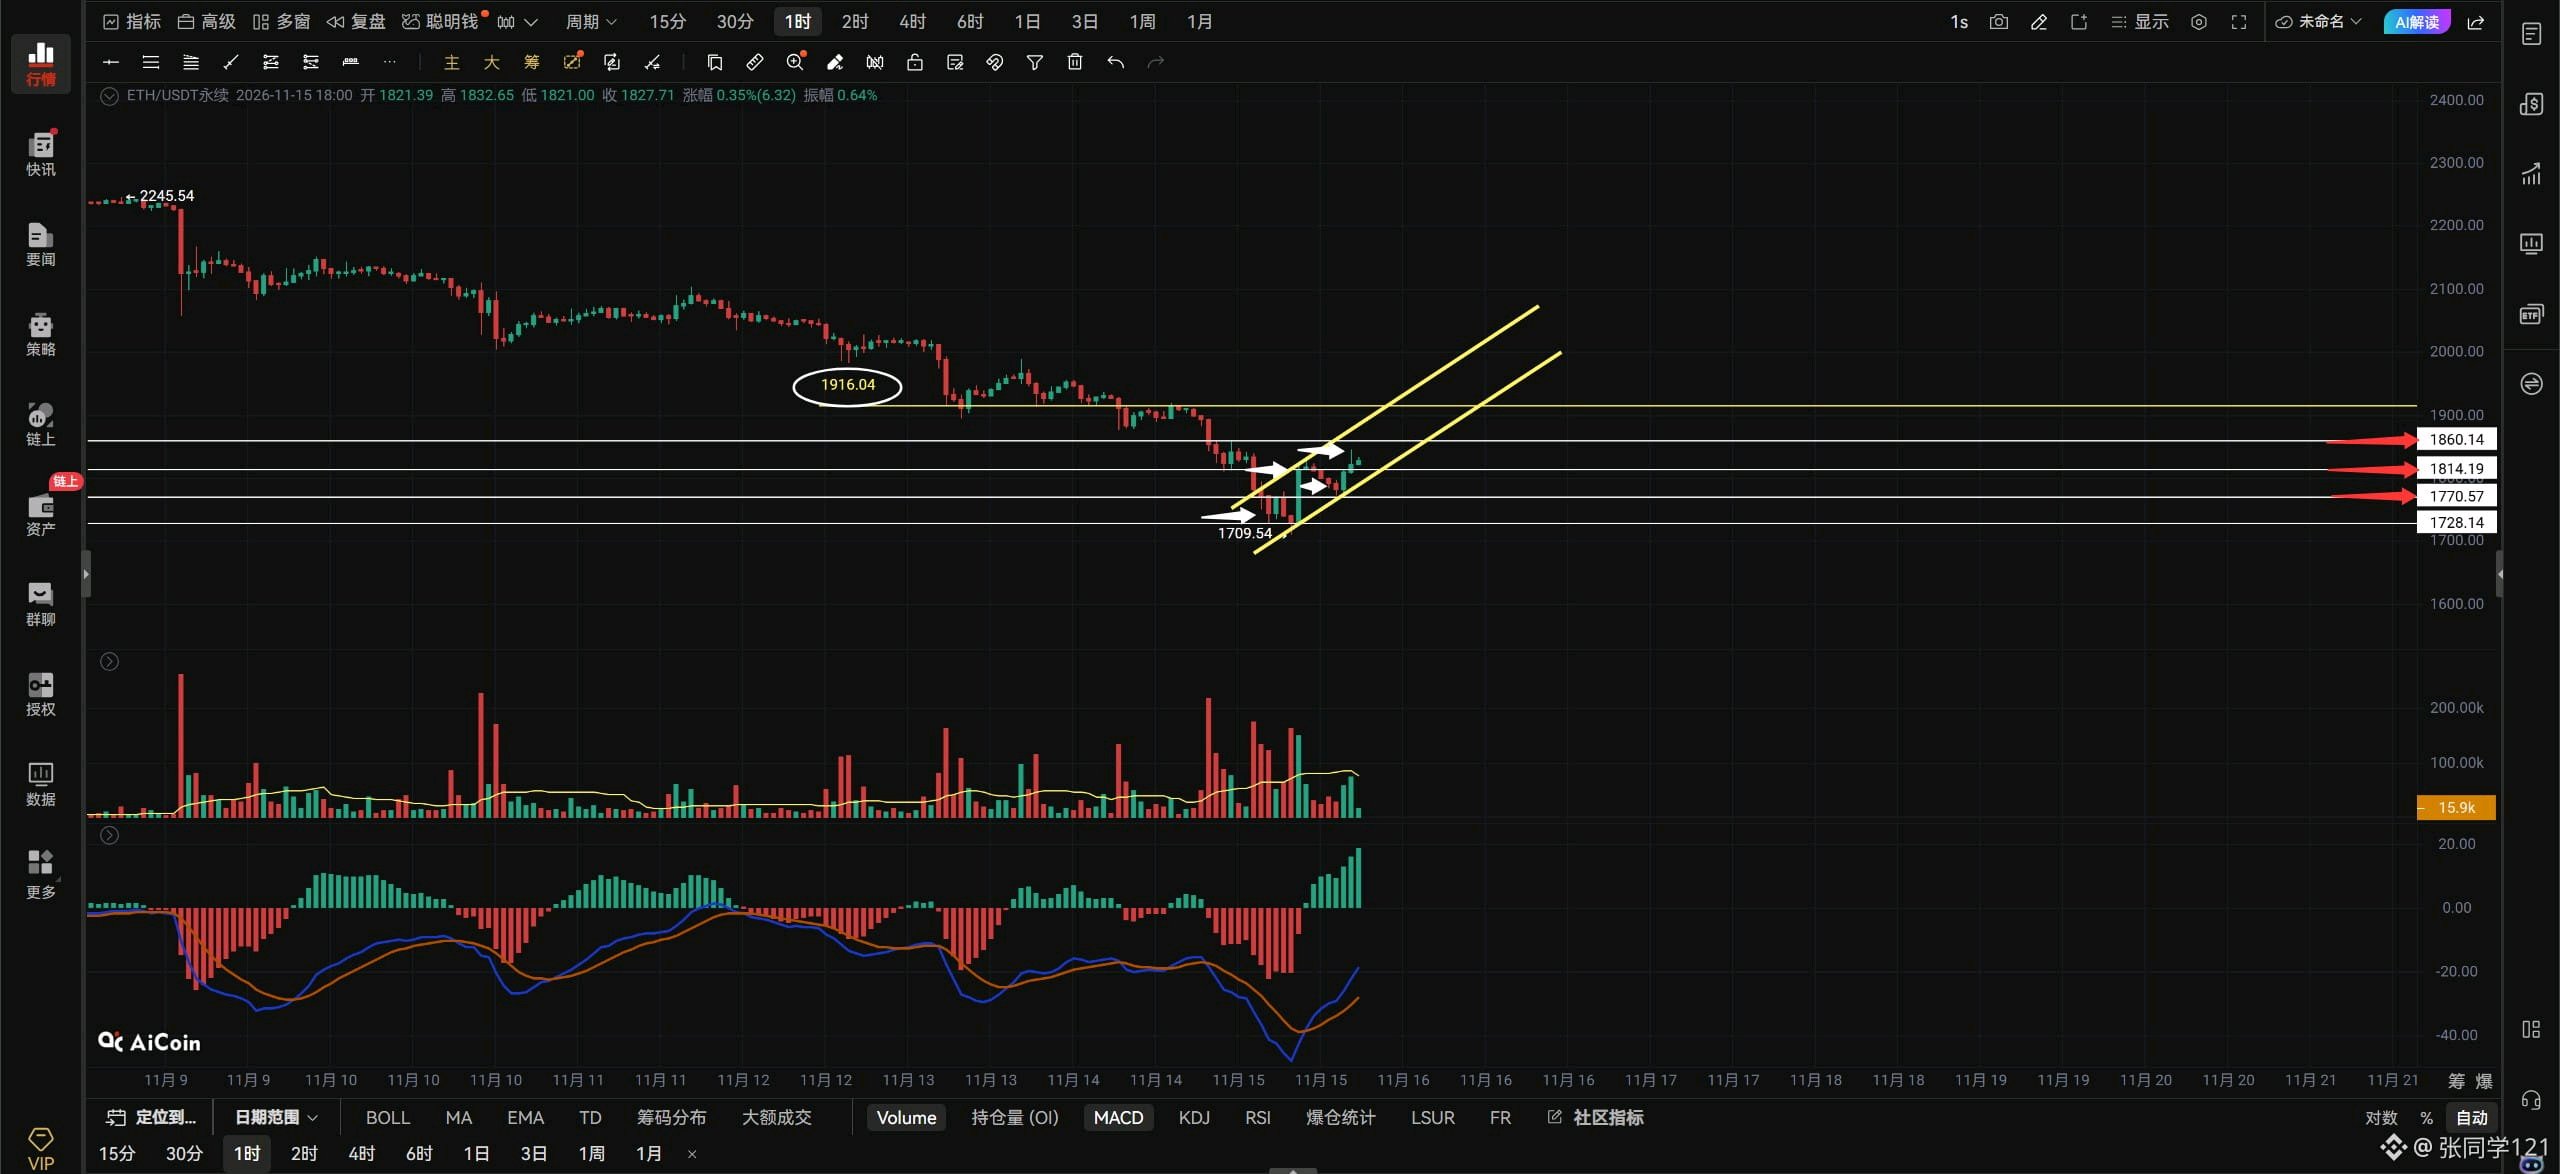
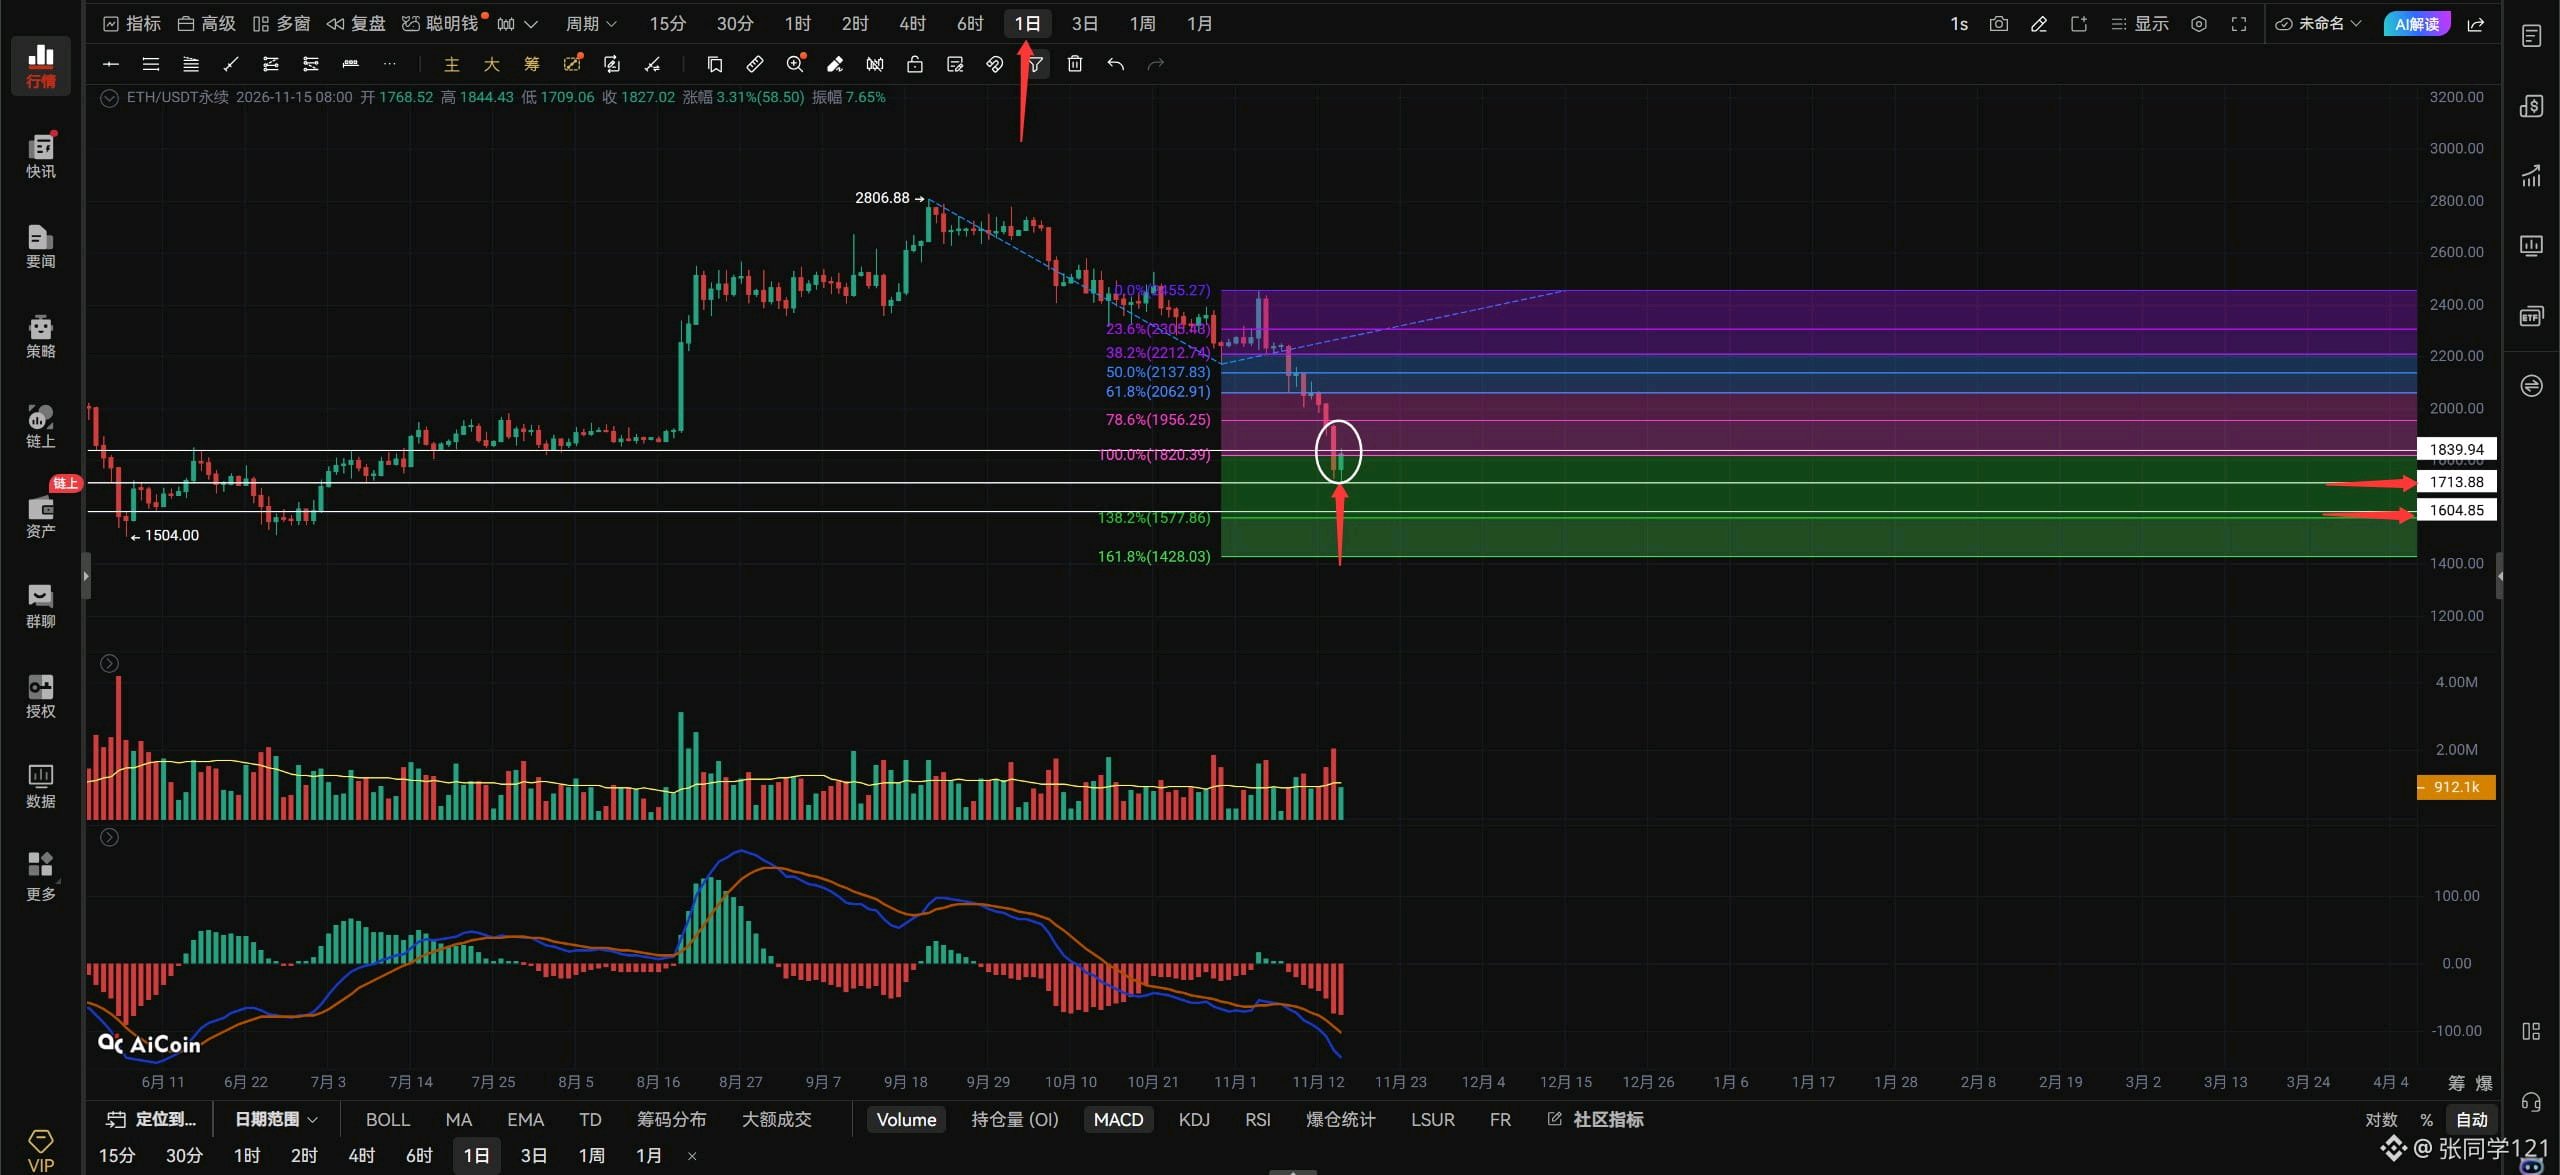
$ETHUSDT Perspectives de soirée : 15/11. L'ETH est actuellement en hausse au sein d'un canal ascendant, et ses sommets ainsi que ses creux sont orientés à la hausse, comme indiqué par la flèche blanche. L'ETH pourrait amorcer un rebond à l'échelle horaire. S'il parvient à se maintenir au-dessus de la résistance de 1814, il devrait poursuivre sa remontée pour tester la résistance de 1860. Il devra franchir les 1860 avant que l'on puisse viser plus haut, vers 1916. Tant que le repli de l'ETH ne casse pas en dessous de 1770, le rebond devrait être solide. S'il retombe sous les 1770, il testera inévitablement le plus bas précédent. Même en cas de test extrême, tant qu'il ne casse pas le plus bas précédent, il n'y a pas de problème. Donc, si vous souhaitez prendre une position longue sur l'ETH maintenant, l'approche la plus prudente est d'attendre un repli vers la zone de support 1770-1728, de chercher un signal de retournement, puis d'entrer en position longue. Si aucun signal d'achat n'apparaît dans cette zone, ne tradez pas — cela signifie que le prix pourrait continuer de chuter. Si l'ETH dépasse les 1836 avec un fort volume, les traders agressifs peuvent tenter des positions longues. S'il casse en dessous de 1809 avec un fort volume, tentez des positions courtes. Surveillez les changements de volume et utilisez des stop-loss. Si l'ETH se maintient au-dessus de 1836 sur le graphique horaire, visez 1861-1916. S'il casse sous les 1809 sur le graphique 4 heures, visez 1770-1728. Heureusement, l'ETH a trouvé un support près de 1713 sur le graphique journalier. S'il n'avait pas réussi à trouver de support près de 1713, l'objectif baissier suivant à l'échelle journalière aurait été 1600. Il n'y avait aucune nouvelle baissière derrière ce sell-off, alors pourquoi a-t-il autant chuté ? Parce que c'était le week-end ! Il ne faut pas beaucoup de capital pour faire baisser le marché pendant le week-end. Pour l'ETH sur le graphique journalier, le point clé est de savoir si la clôture journalière de demain pourra se maintenir au-dessus de 1820. Si elle clôture au-dessus de 1820, la tendance baissière journalière de l'ETH pourrait prendre fin. De plus, si la clôture journalière de l'ETH demain est au-dessus de 1820, la zone marquée par la boîte blanche formera une figure en « piercing pattern » (chandelle haussière), ce qui soutiendrait davantage un rebond à l'échelle journalière. C'est tout pour le moment.#ByXIMPACT
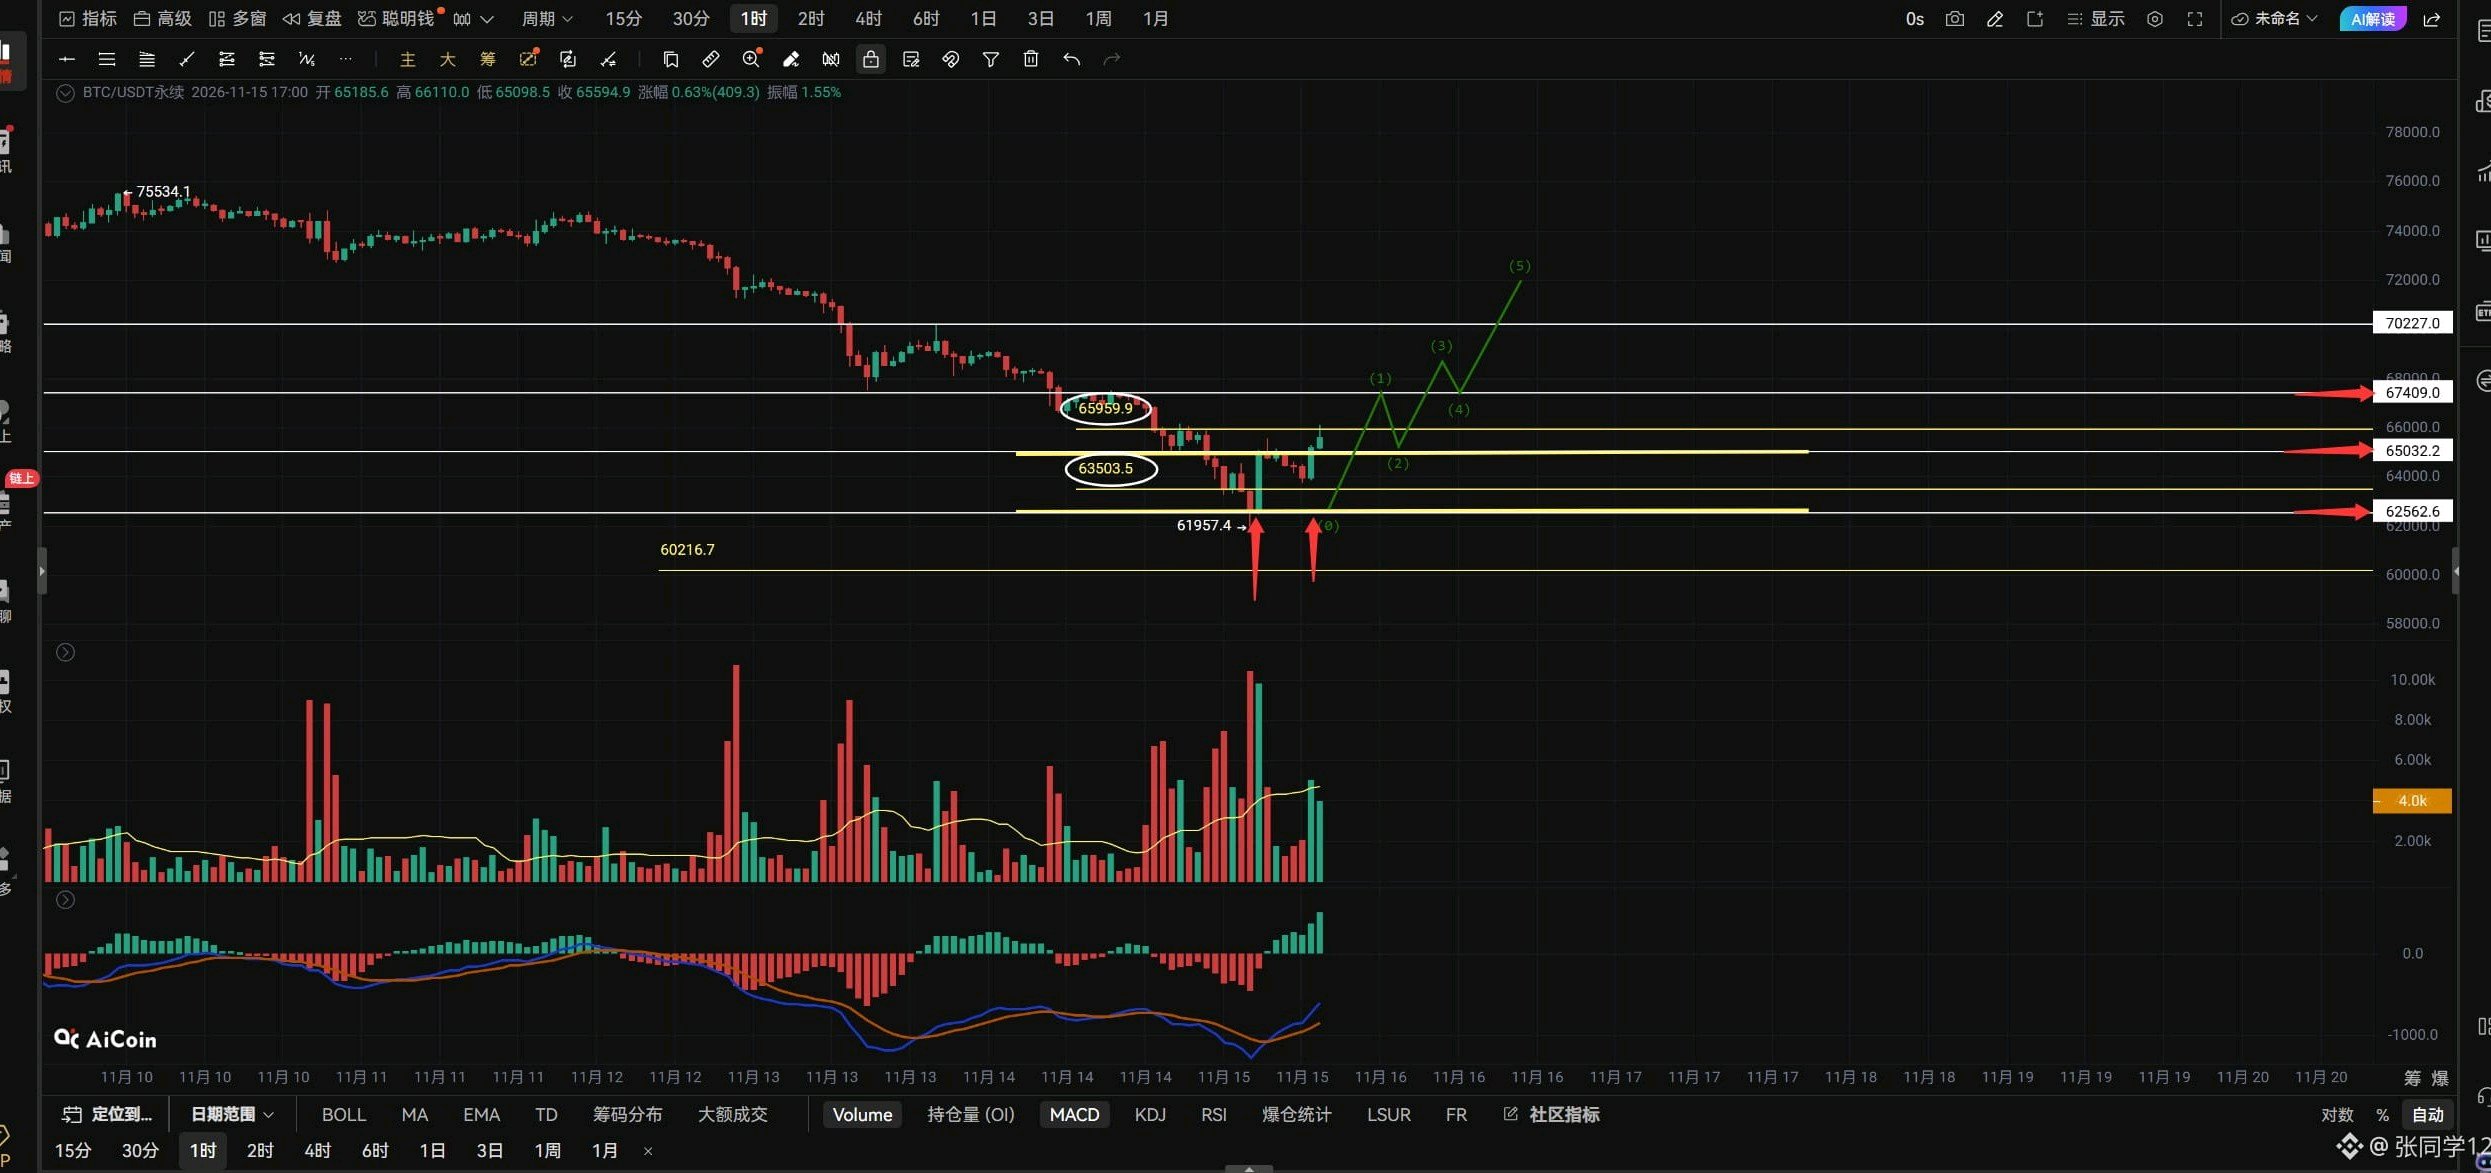
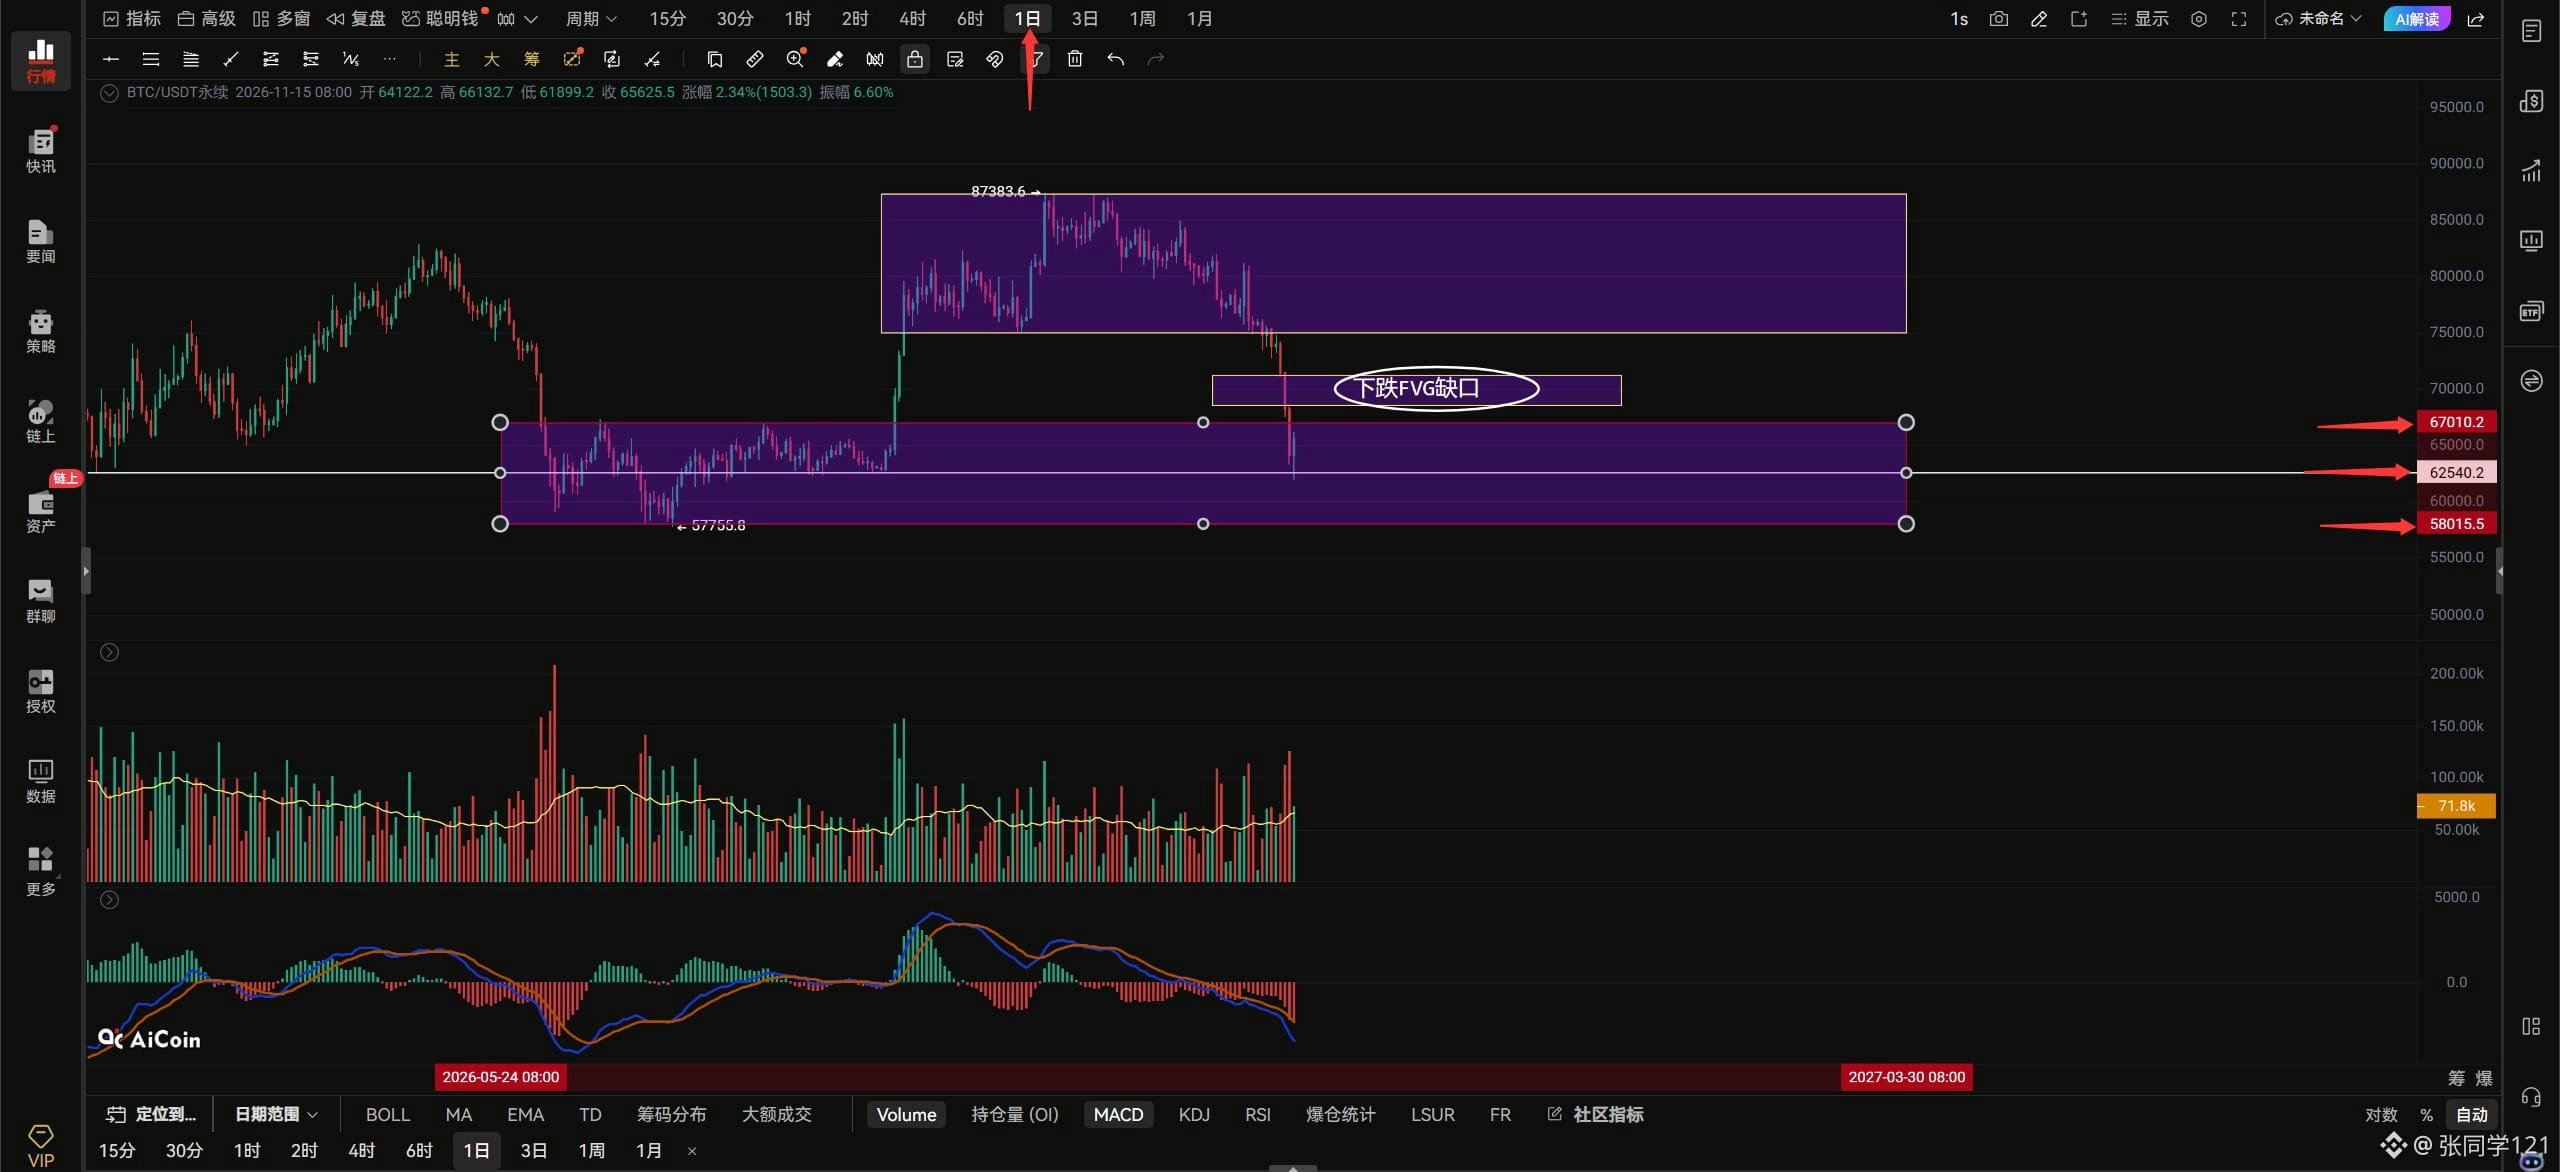
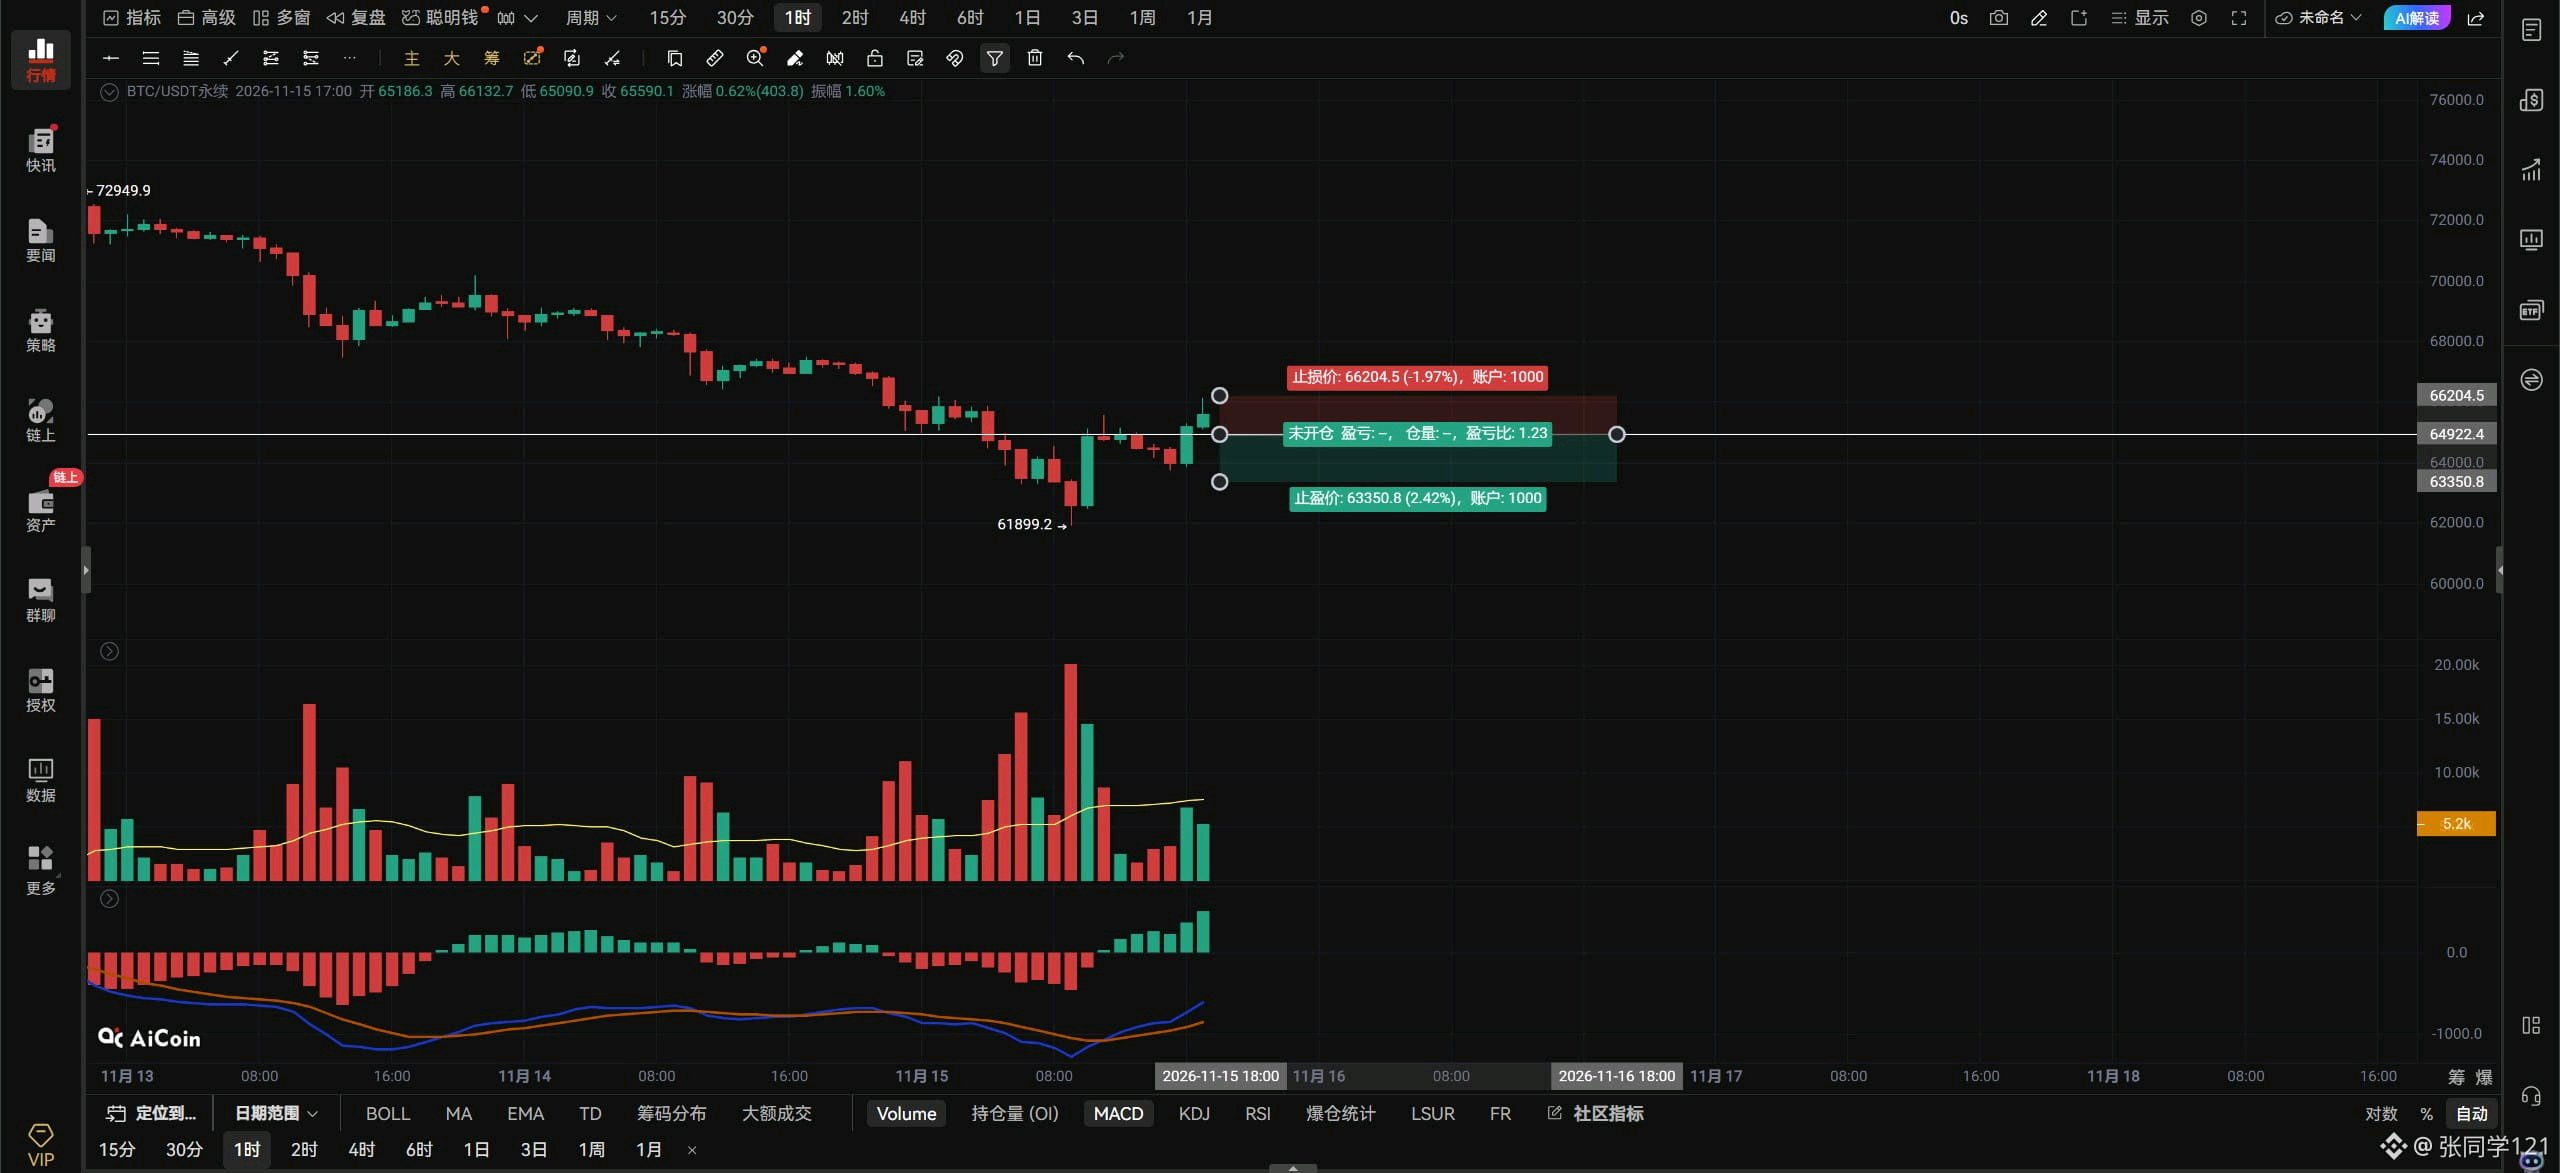
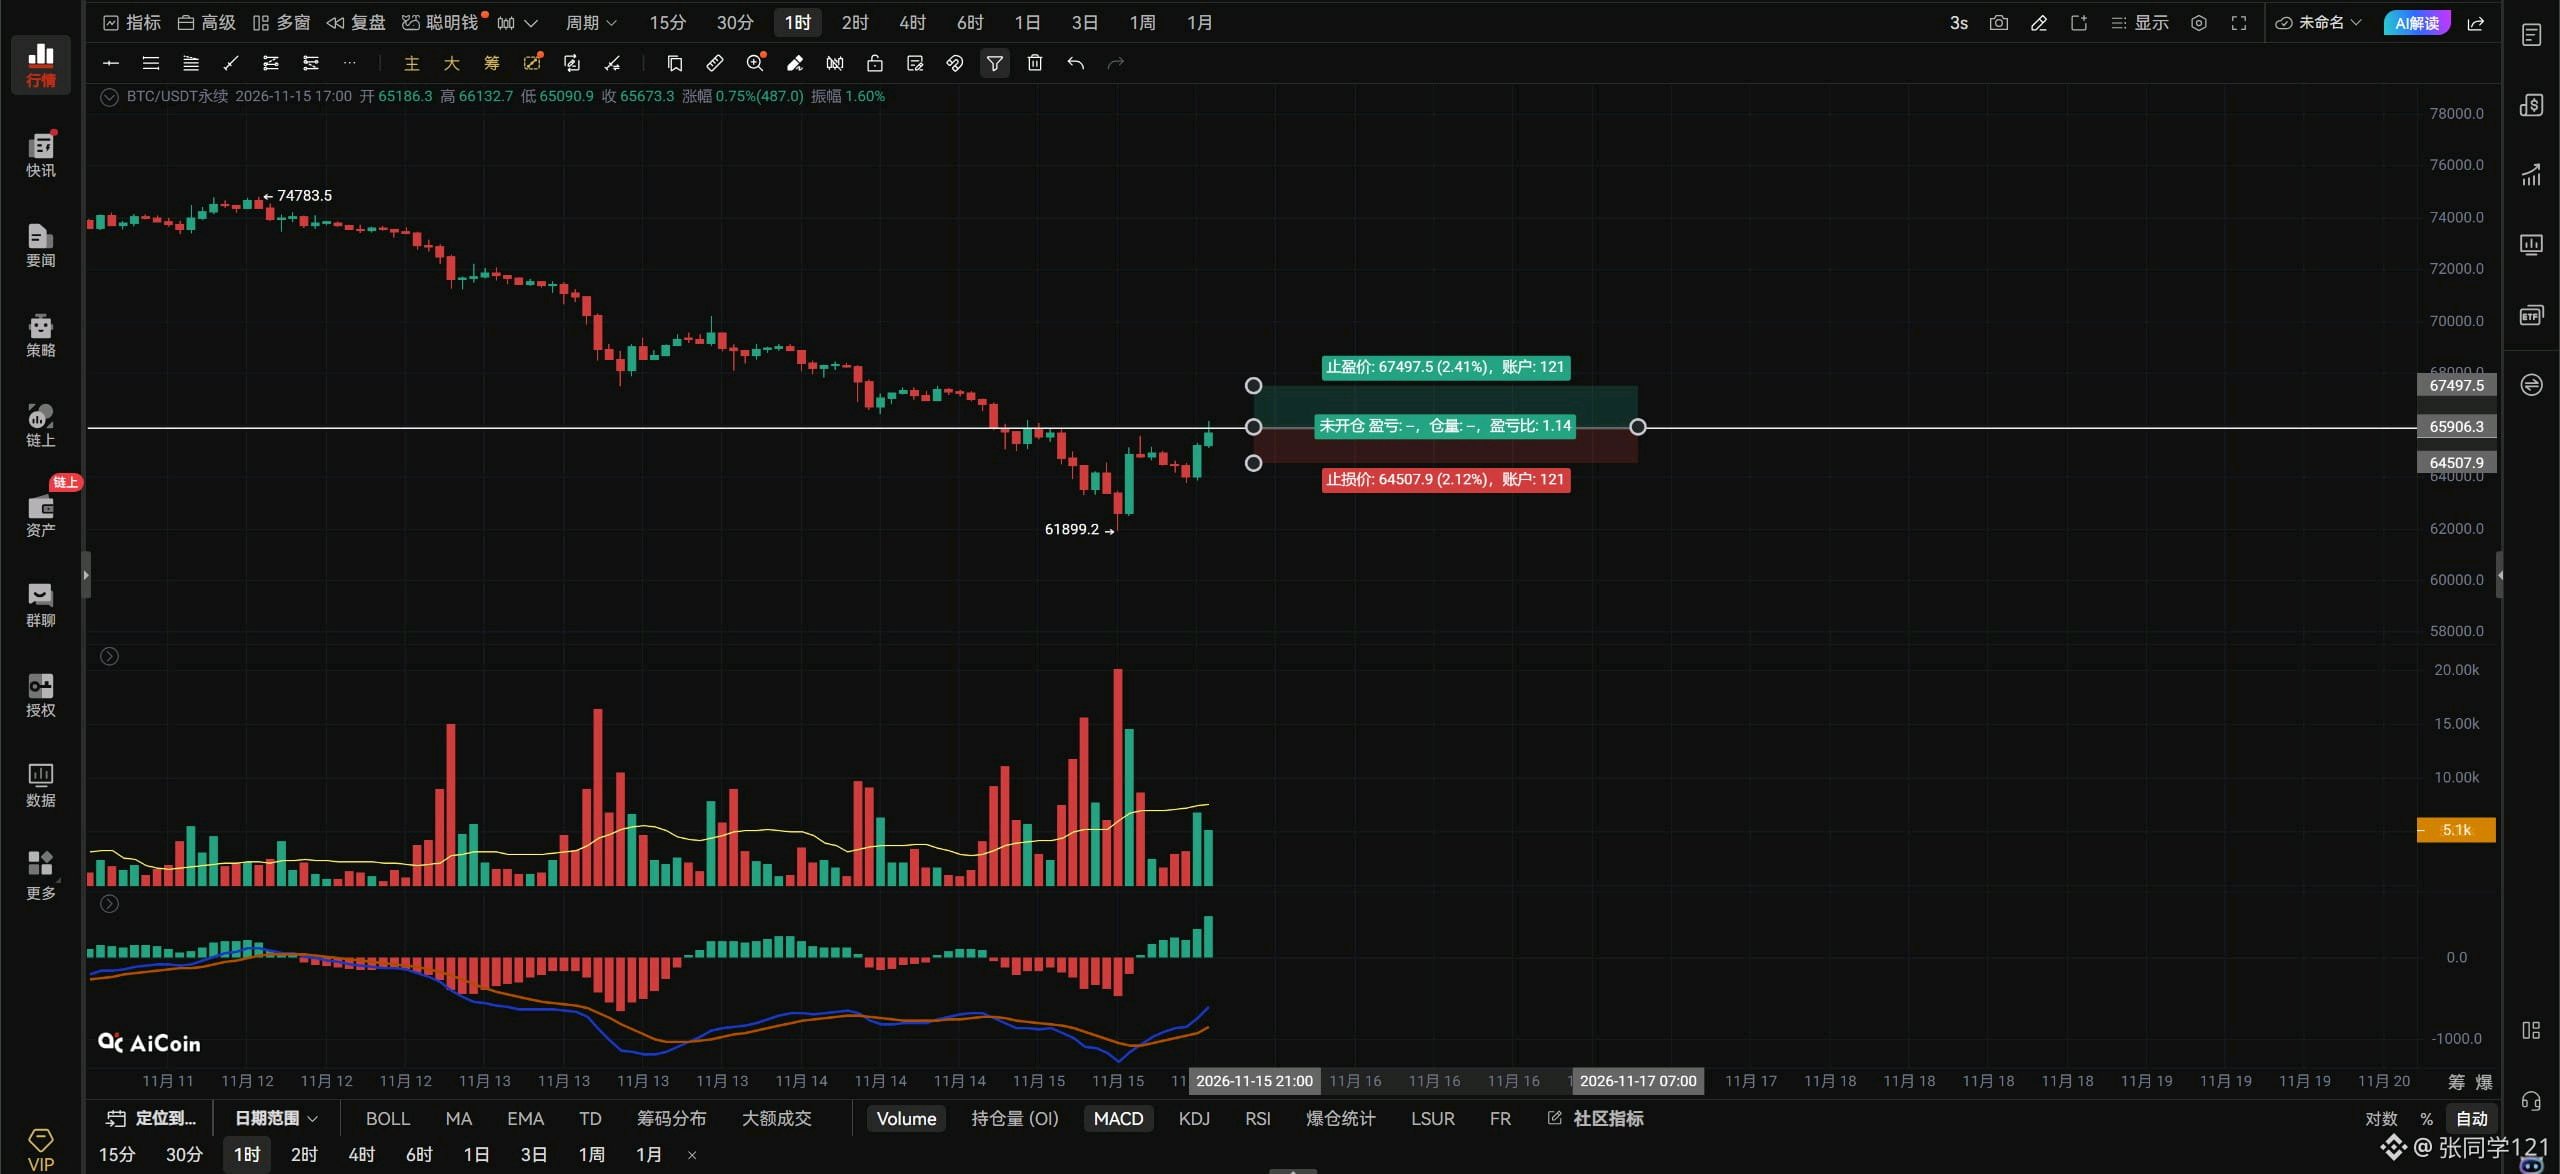
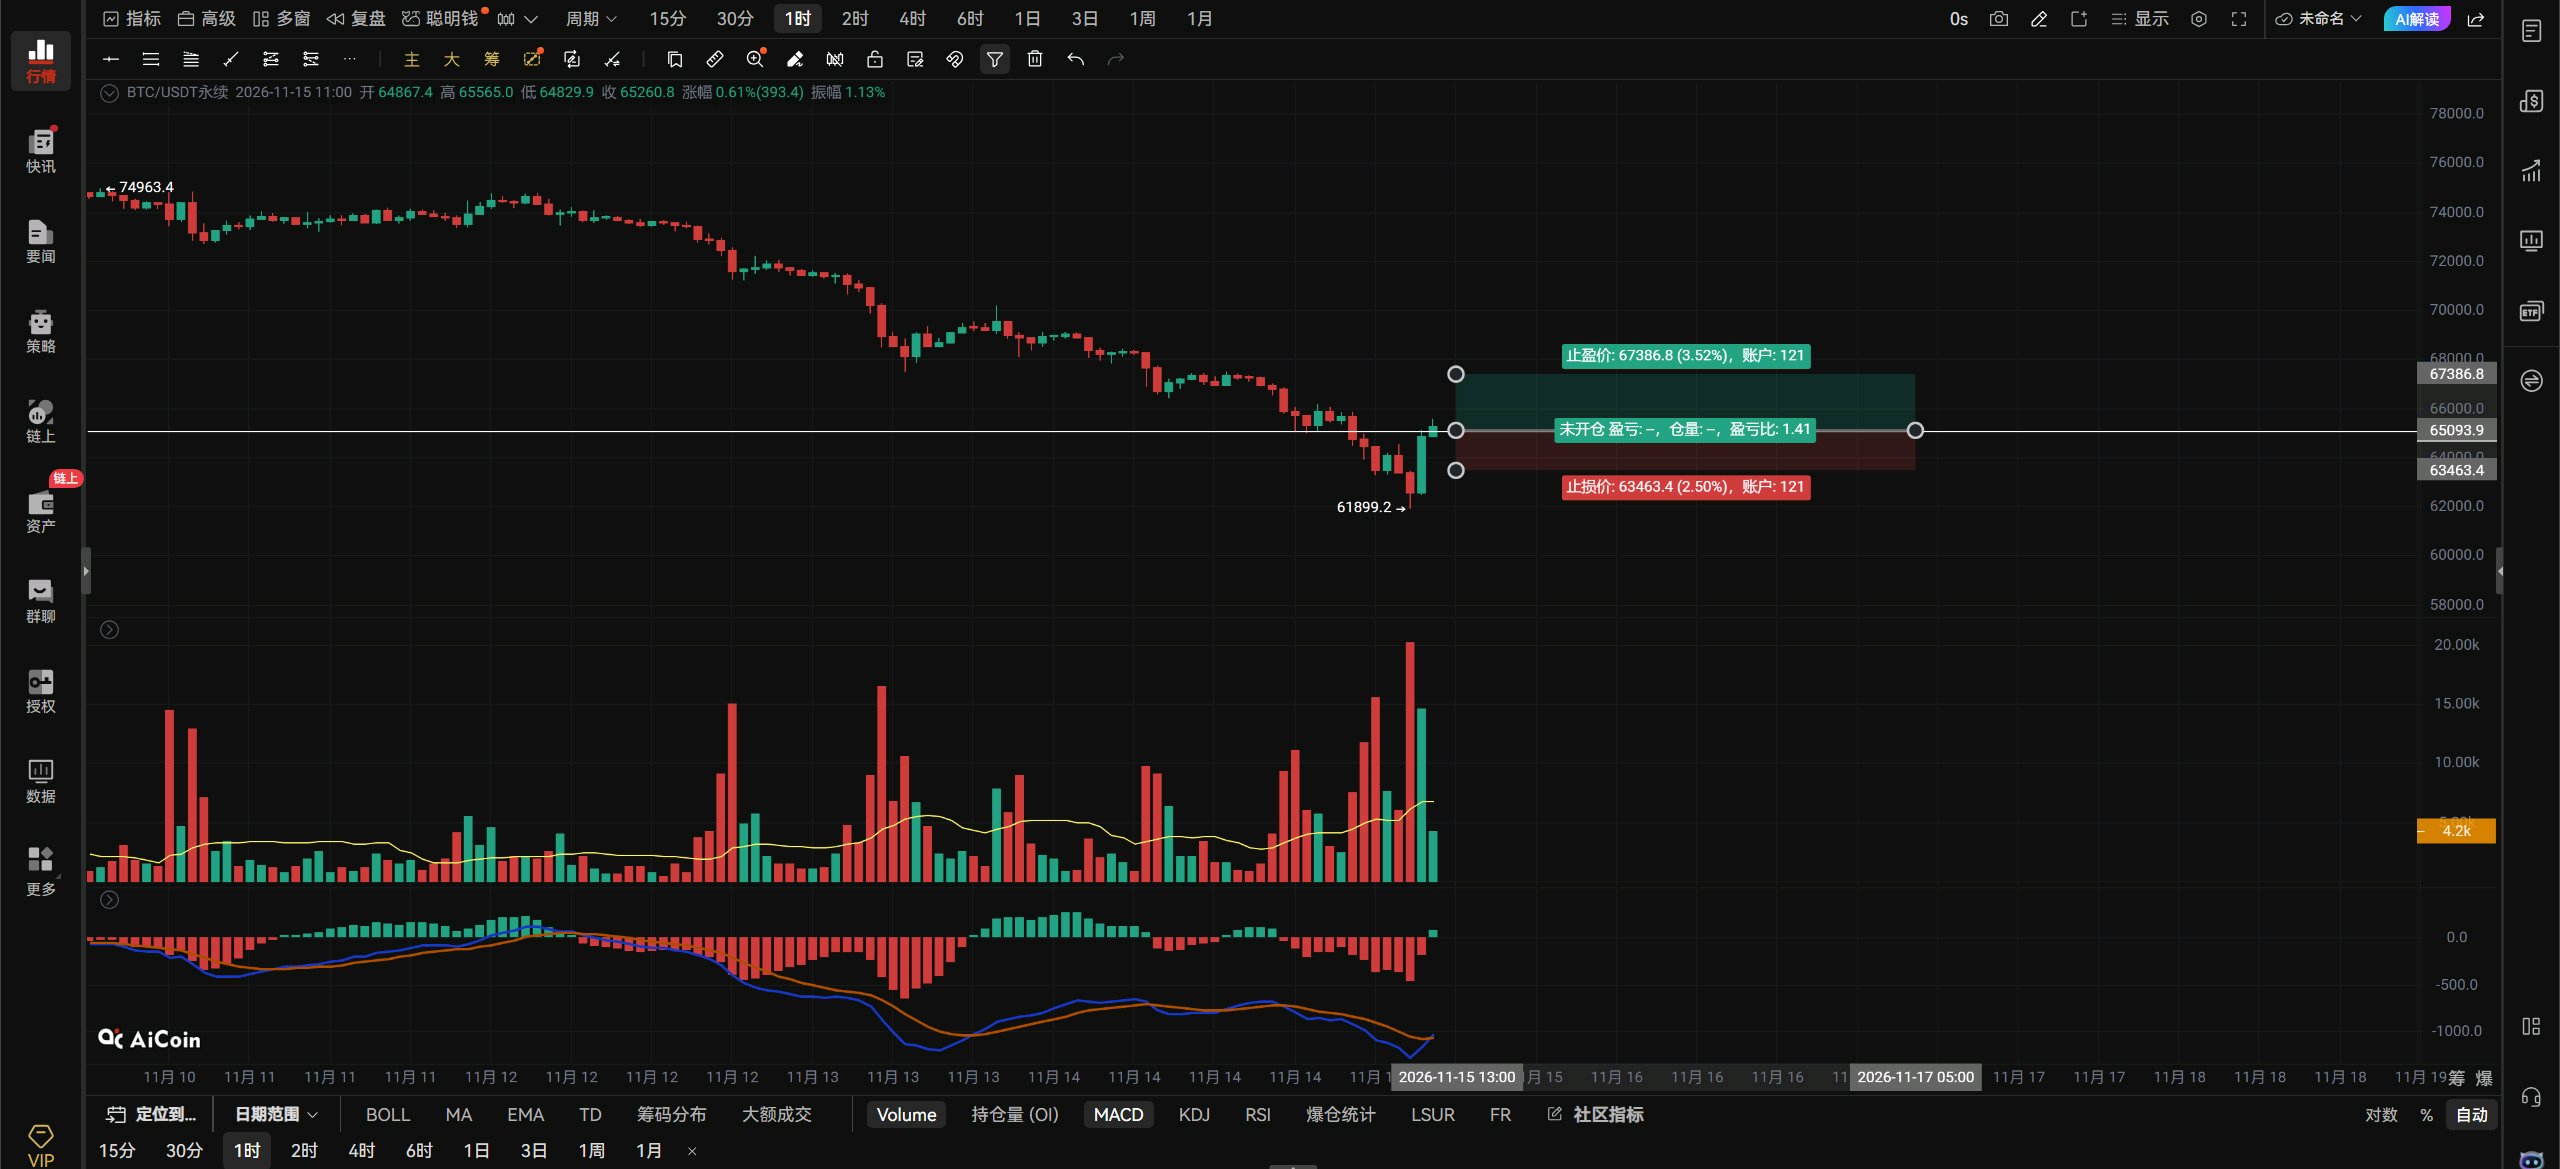
$BTCUSDT Evening Outlook: Nov. 15. Bitcoin has started to rebound and broken through the 65000 resistance, but it has now run into a new resistance at 66000. Bitcoin needs to hold above 65000 on the hourly timeframe to stop falling. To extend the rebound, it must break through 66000; then it could continue upward toward 67400. Next, we’ll see whether Bitcoin can stay above 65000. If it can’t hold above 65000, it will definitely retest the 63500–62500 area. The red arrow below points to the only test of support at 62000 so far. For a genuine uptrend to form, a second retest is inevitable. Only if that second retest forms a double bottom without breaking below the previous low can a healthy upward trend take shape. Bitcoin has fallen so much—do you think it can suddenly shoot straight to the moon? If that’s what you’re thinking, go to sleep! Anything can happen in your dreams. So if you don’t have a long position yet, don’t rush. Bitcoin has now broken through the 65000 resistance, and the 65000–62500 consolidation range has made a higher high and shown a structural break. Just patiently wait for Bitcoin to retest 63500–62500 and show a bottoming signal, then go long. Also, the US stock market is closed for the weekend, and we don’t know what will happen when it opens tomorrow. It could be another deceptive false breakout. If you rush in and go long, then it pulls back, you’ll be stuck in a losing position again. If Bitcoin breaks above 65906 with volume, aggressive traders can go long on the right-hand side. If it breaks below 64922 with volume and the rebound fails to reclaim that level, go short on the right-hand side. Use a stop-loss. On the hourly timeframe, if Bitcoin breaks above and holds 65906, the next targets are 67400–68562. If it can’t get above 65906, those targets are irrelevant. On the 4-hour timeframe, a break below 64922 would put 63500–62500 in view. Bitcoin briefly broke below 62,500 on the daily chart, but has now climbed back above it. Whether it can hold above 62,500 on the daily chart remains to be seen, since the daily close won't be confirmed until 8 a.m. tomorrow. It needs to close above 62,500 then for the daily downtrend to stabilize. For the daily chart to turn upward, it needs to break above 67,000—the upper boundary of the range. Only after breaking above 67,000 can we say the daily downtrend has temporarily ended, opening the door to filling the daily bearish FVG gap in the 68,600–71,100 range. If tomorrow's daily candle doesn't close above 62,500, there's a real chance price will retest 58,000, the lower boundary of the range. On the daily chart, 60,000 and 58,000 are the strongest support levels. If price reaches 60,000, it wouldn't hurt to go another 2,000 lower and test 58,000. Until Bitcoin breaks above 67,000 on the daily chart, the downside risk hasn't gone away. Don't let the current rebound fool you: price fell 25,000 points from 87,000 to 62,000, so a 10,000-point bounce is perfectly reasonable. Who'd stick around if it only ever went down? That's all for now. #ByXIMPACT
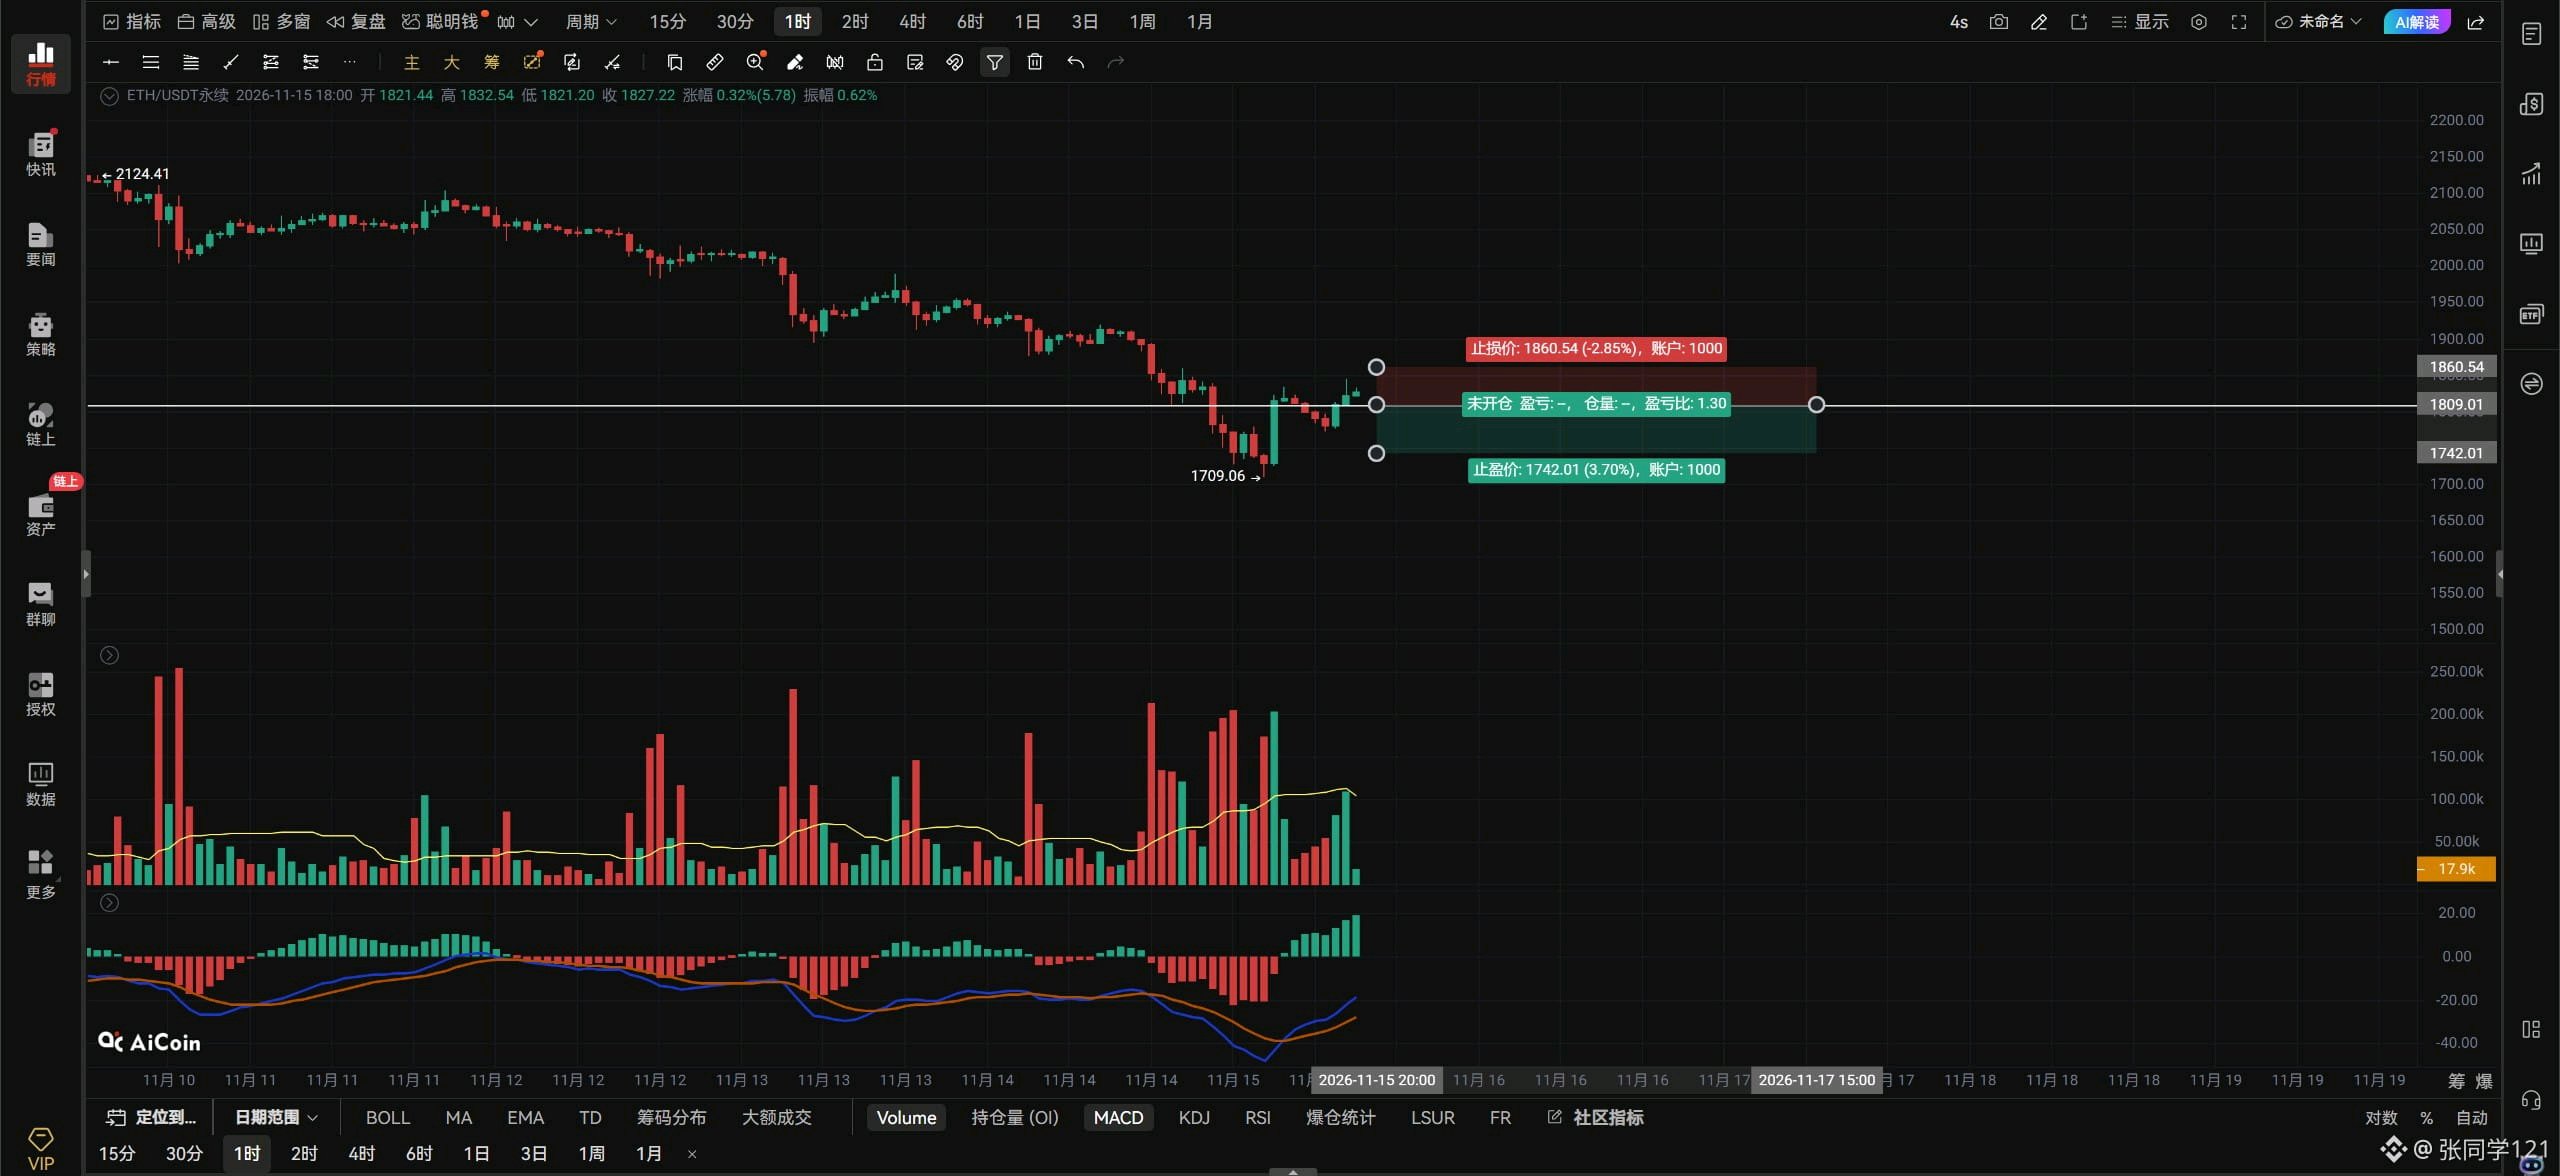
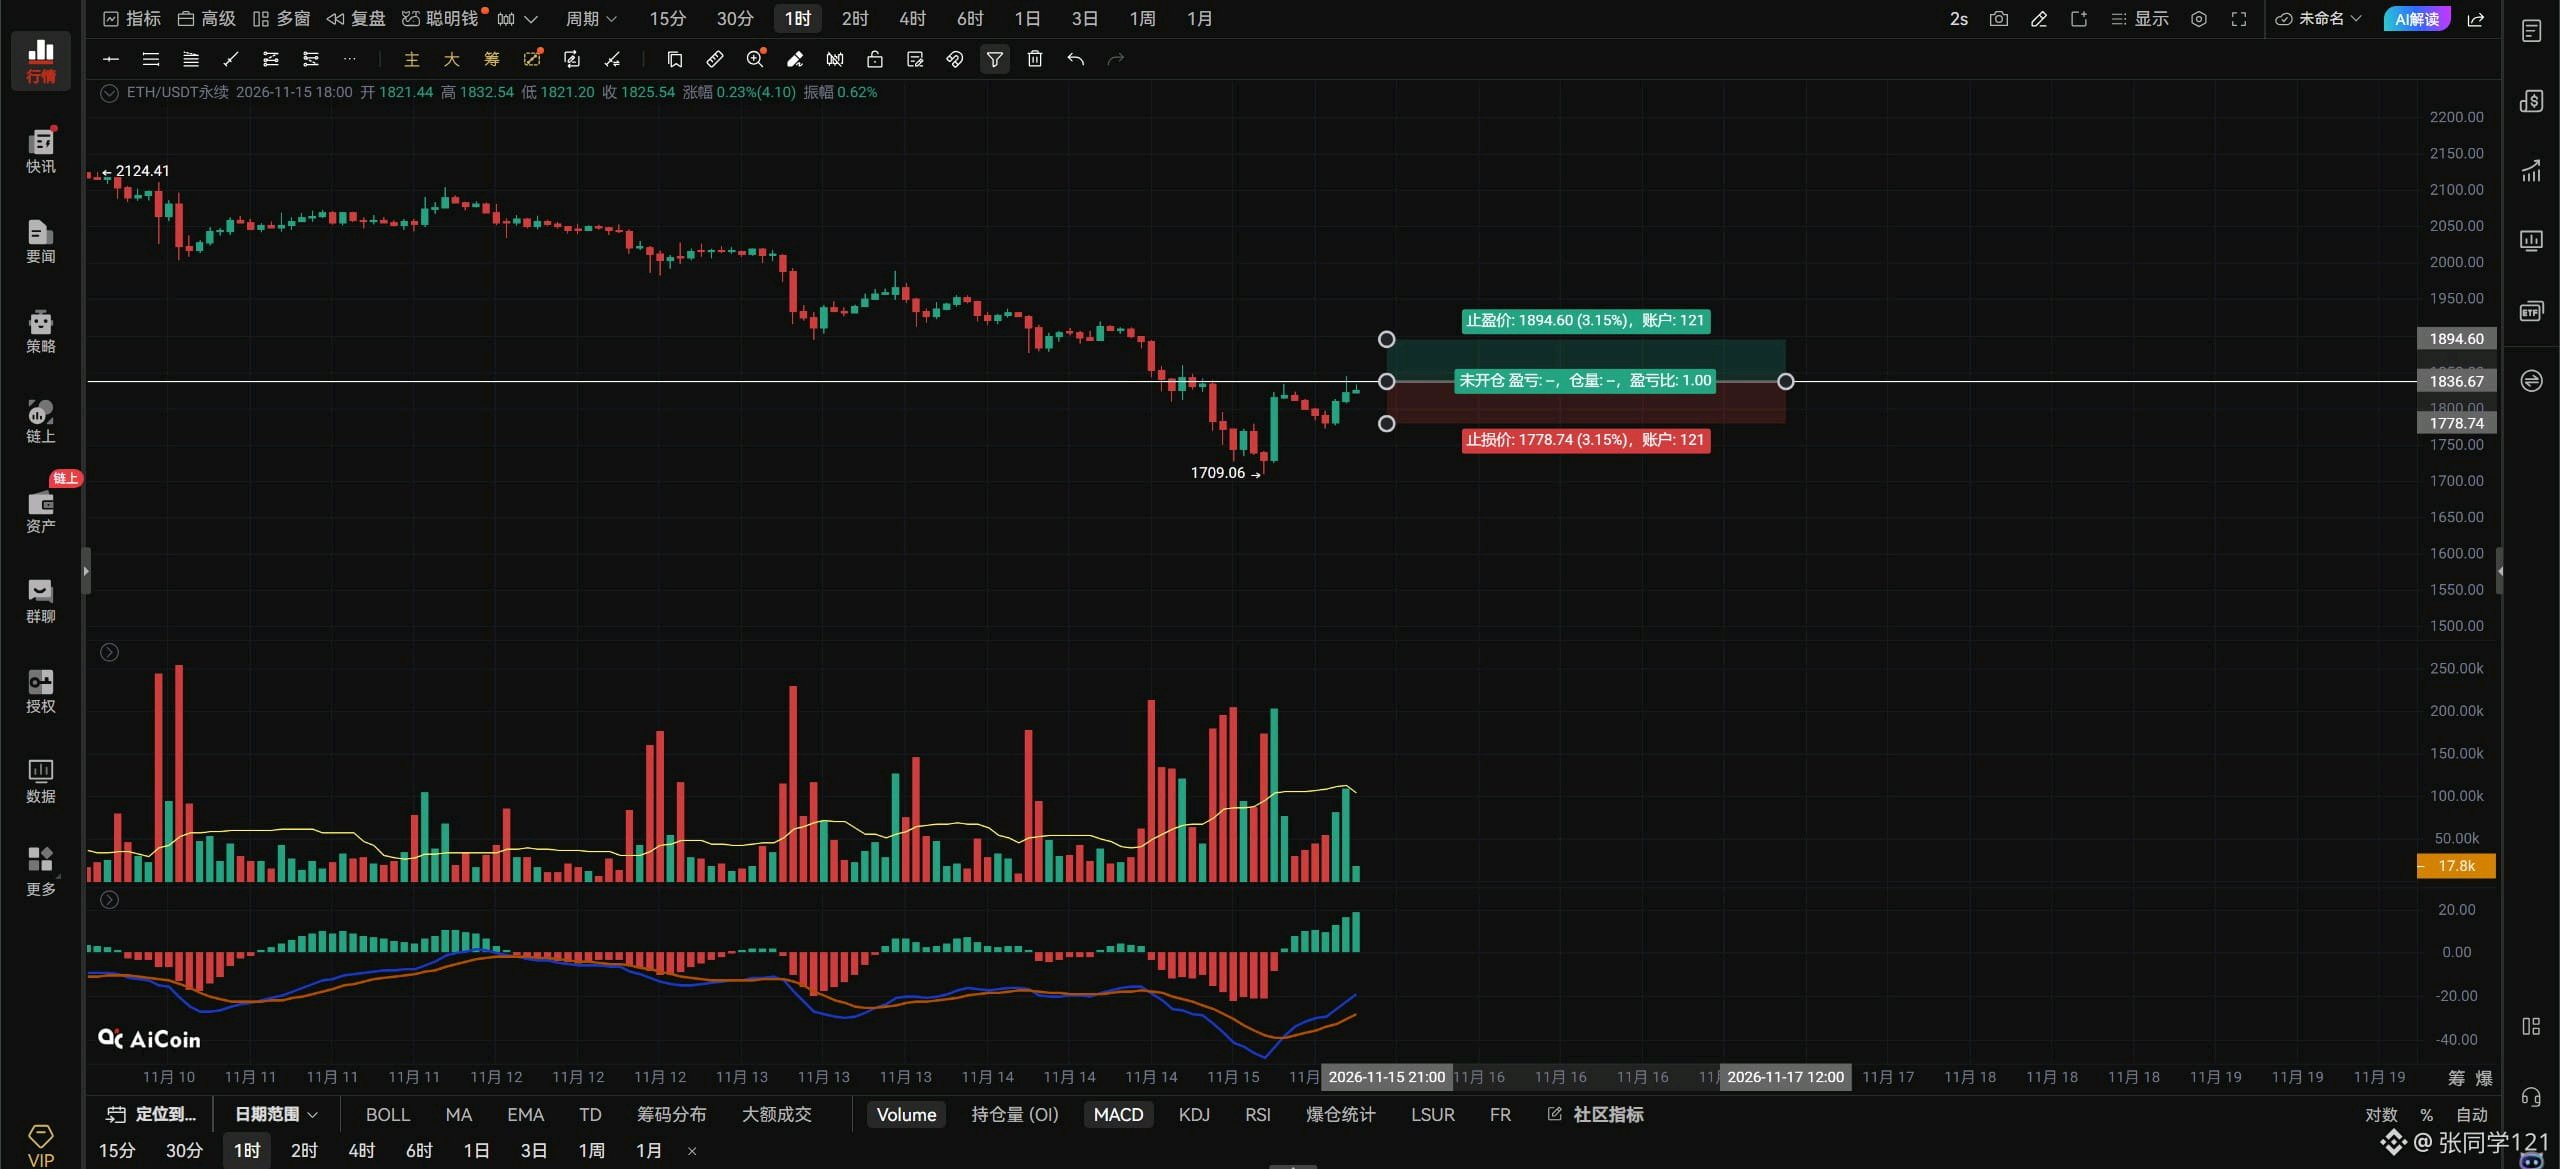
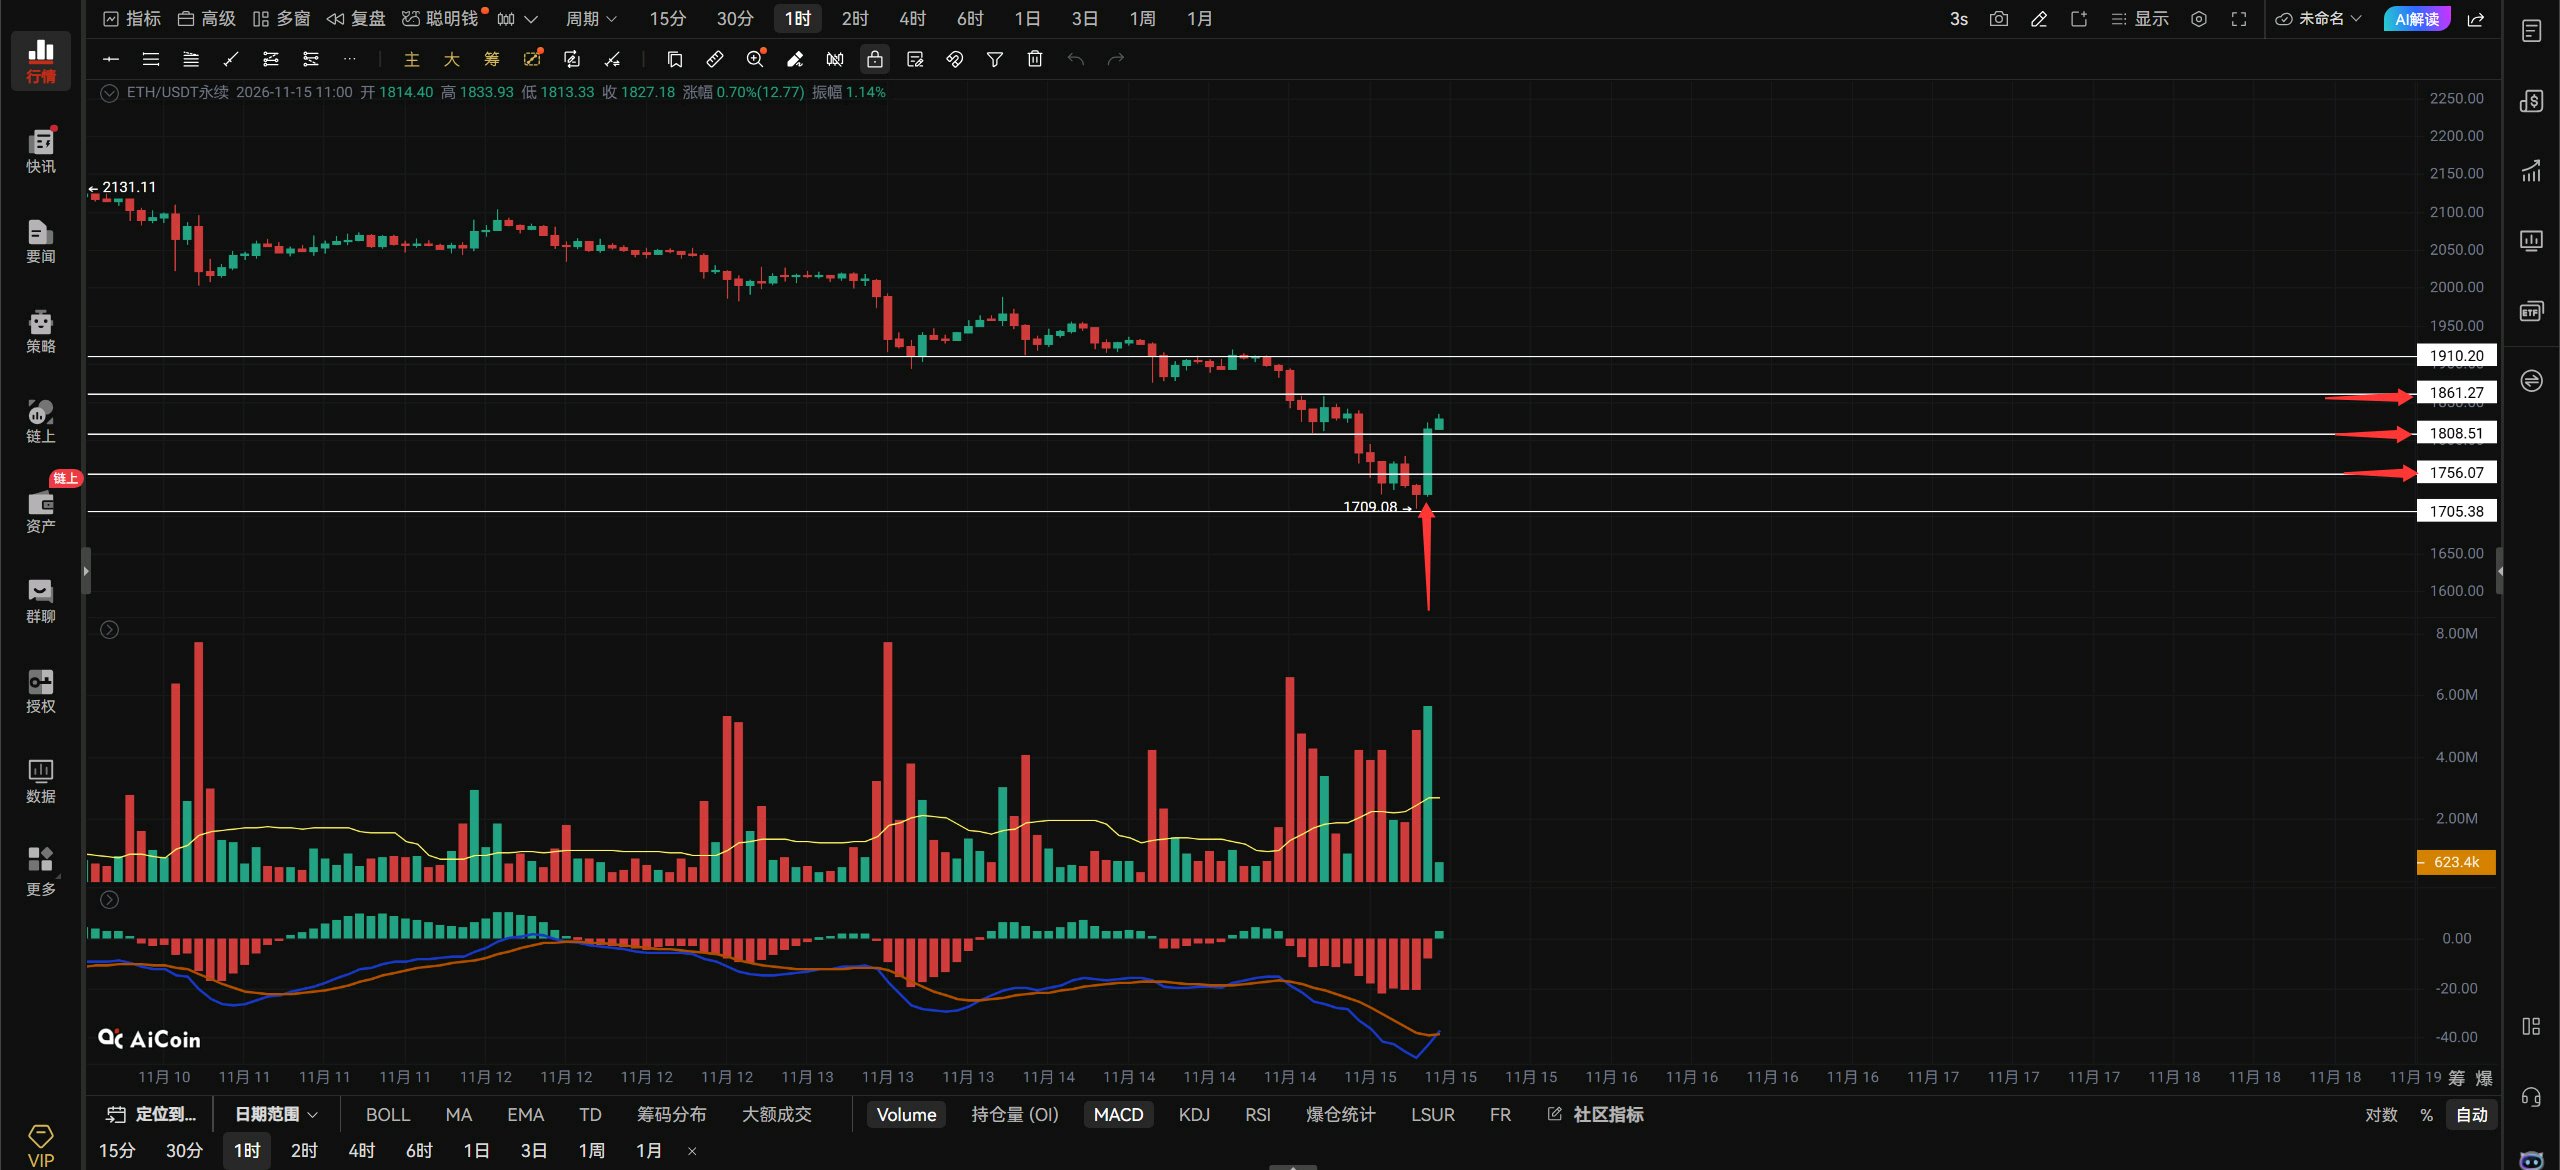
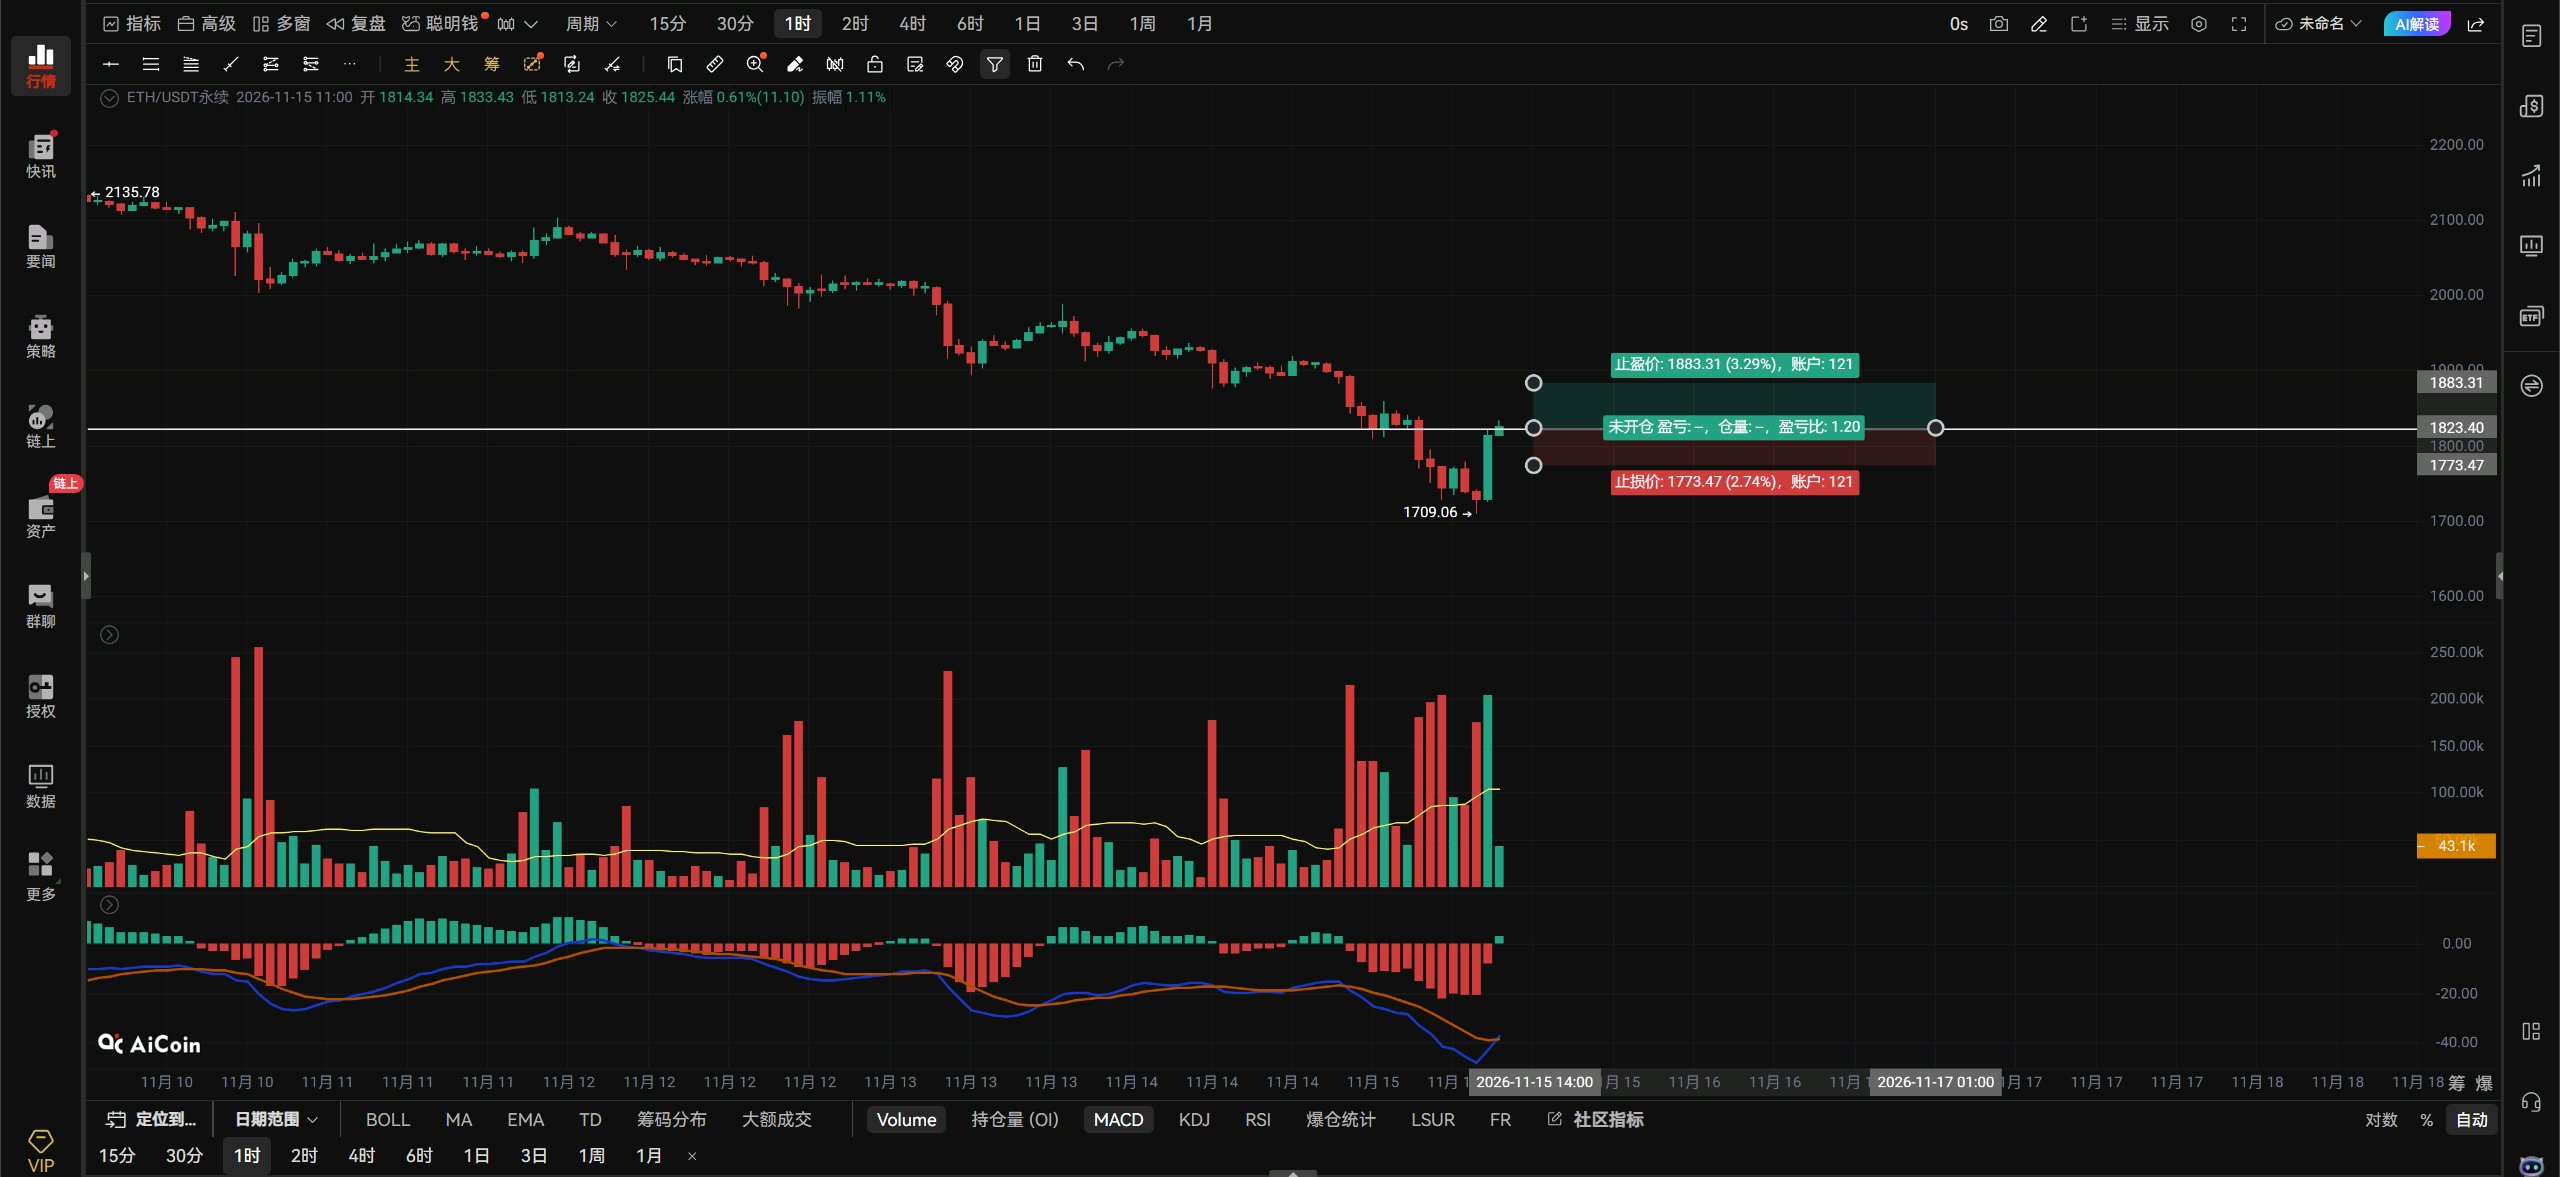
$ETHUSDT $ETH outlook: If ETH breaks above 1821 with strong volume, enter long on the breakout and set a stop-loss. If it breaks below 1784 with strong volume, enter short on the breakdown and set a stop-loss. If a pullback confirms 1740 as support, add one unit to the long position. Stop out if it breaks below 1709. If ETH holds above 1821 on the hourly chart, look for 1861–1910. Watch for a short entry of one unit at 1861. Stop out if it breaks above 1910. Countertrend wick-entry orders: long at 1680; stop out if it breaks below 1648. Resistance above: 1821–1861–1910 Support below: 1784–1740–1709 A 4-hour close below 1784 points to 1740–1709. Below ETH, where the red arrow points, a single bullish candle has pierced through several bearish candles. This shows ETH is currently strong. However, for ETH to continue rebounding, it needs to hold above 1800; only then can it keep moving up toward 1861. If it can't stay above 1800, it should at least pull back to 1756 and consolidate in the 1756–1800 range before choosing a direction. If you want to go long on ETH, it's best to wait for a pullback—don't rush to chase. That's all.#ByXIMPACT
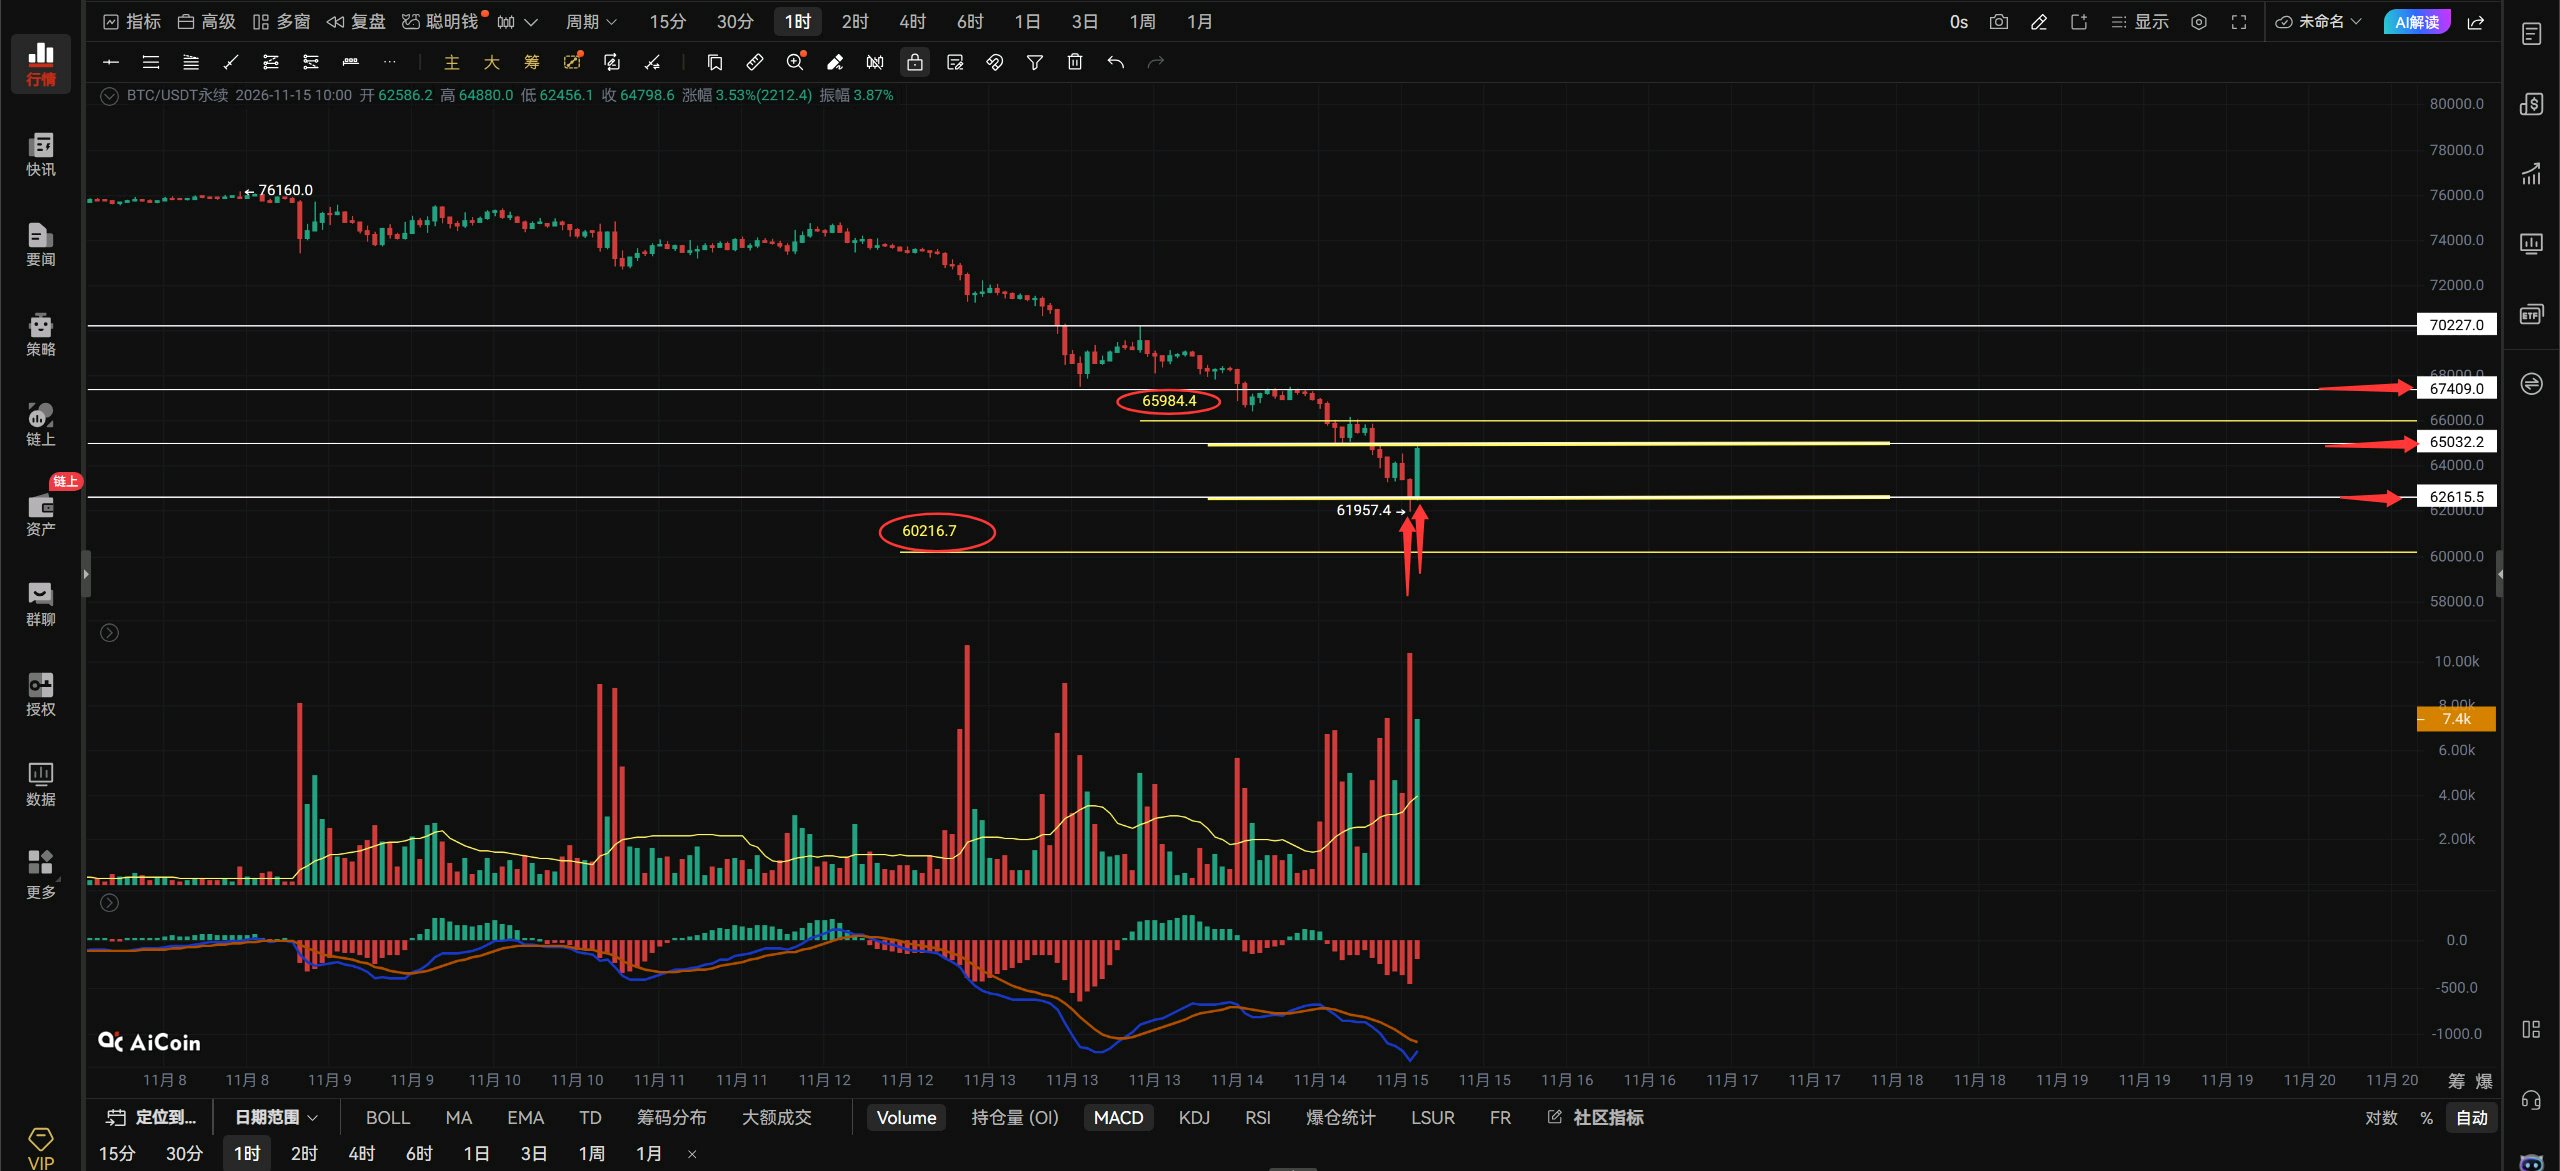
$BTCUSDT 11.15 Midday Market Outlook.🌿 $BTC Viewpoint: The weekend was wild too! I originally thought we’d see a recovery after the weekend’s decline, but I didn’t expect the weekend to be this brutal. In this market, even the world’s top traders would see their capital shrink, let alone us small retail investors. This drop has left me completely speechless; the bulls are desperate. After Bitcoin fell below 67400, it tried to rebound and reclaim 67400, but failed. Then it plunged straight to 65000. It barely paused at 65000 before continuing to fall. When I woke up this morning, I saw Bitcoin had broken below the support levels at 65000 and 62615, dropping straight to a low of 61957. A new low every time you wake up these past few days—who can take that? Bitcoin is now trading in the 65032–62615 range. Has it bottomed out? Bitcoin needs to reclaim 65000 to stop falling and rebound, with 65984–67400 as the upside targets. If it can’t get back above 65000, it may retest the previous low. The red arrow below points to a very nice bullish engulfing pattern, which suggests a rebound is likely on the hourly timeframe. But the rebound must break through the 65000 resistance; otherwise, it won’t be able to continue. Why did such a big rebound occur after the price hit around 62000? Because reaching 62000 activated buying interest around that level. Institutional bulls felt 62000 was worth buying, which is why the reaction was so strong. Next, we’ll see whether 65000 can be broken. If it breaks through, the rebound will continue; if not, wait for a second retest. If 62000 holds on the second retest, this decline will basically have run its course. If 62000 fails to hold, a new low at 60216 could appear before you know it. If you want to go long now, it’s best to wait for a bottoming signal near 62000 after a pullback. Chasing the price directly is a bit risky.#ByXIMPACT
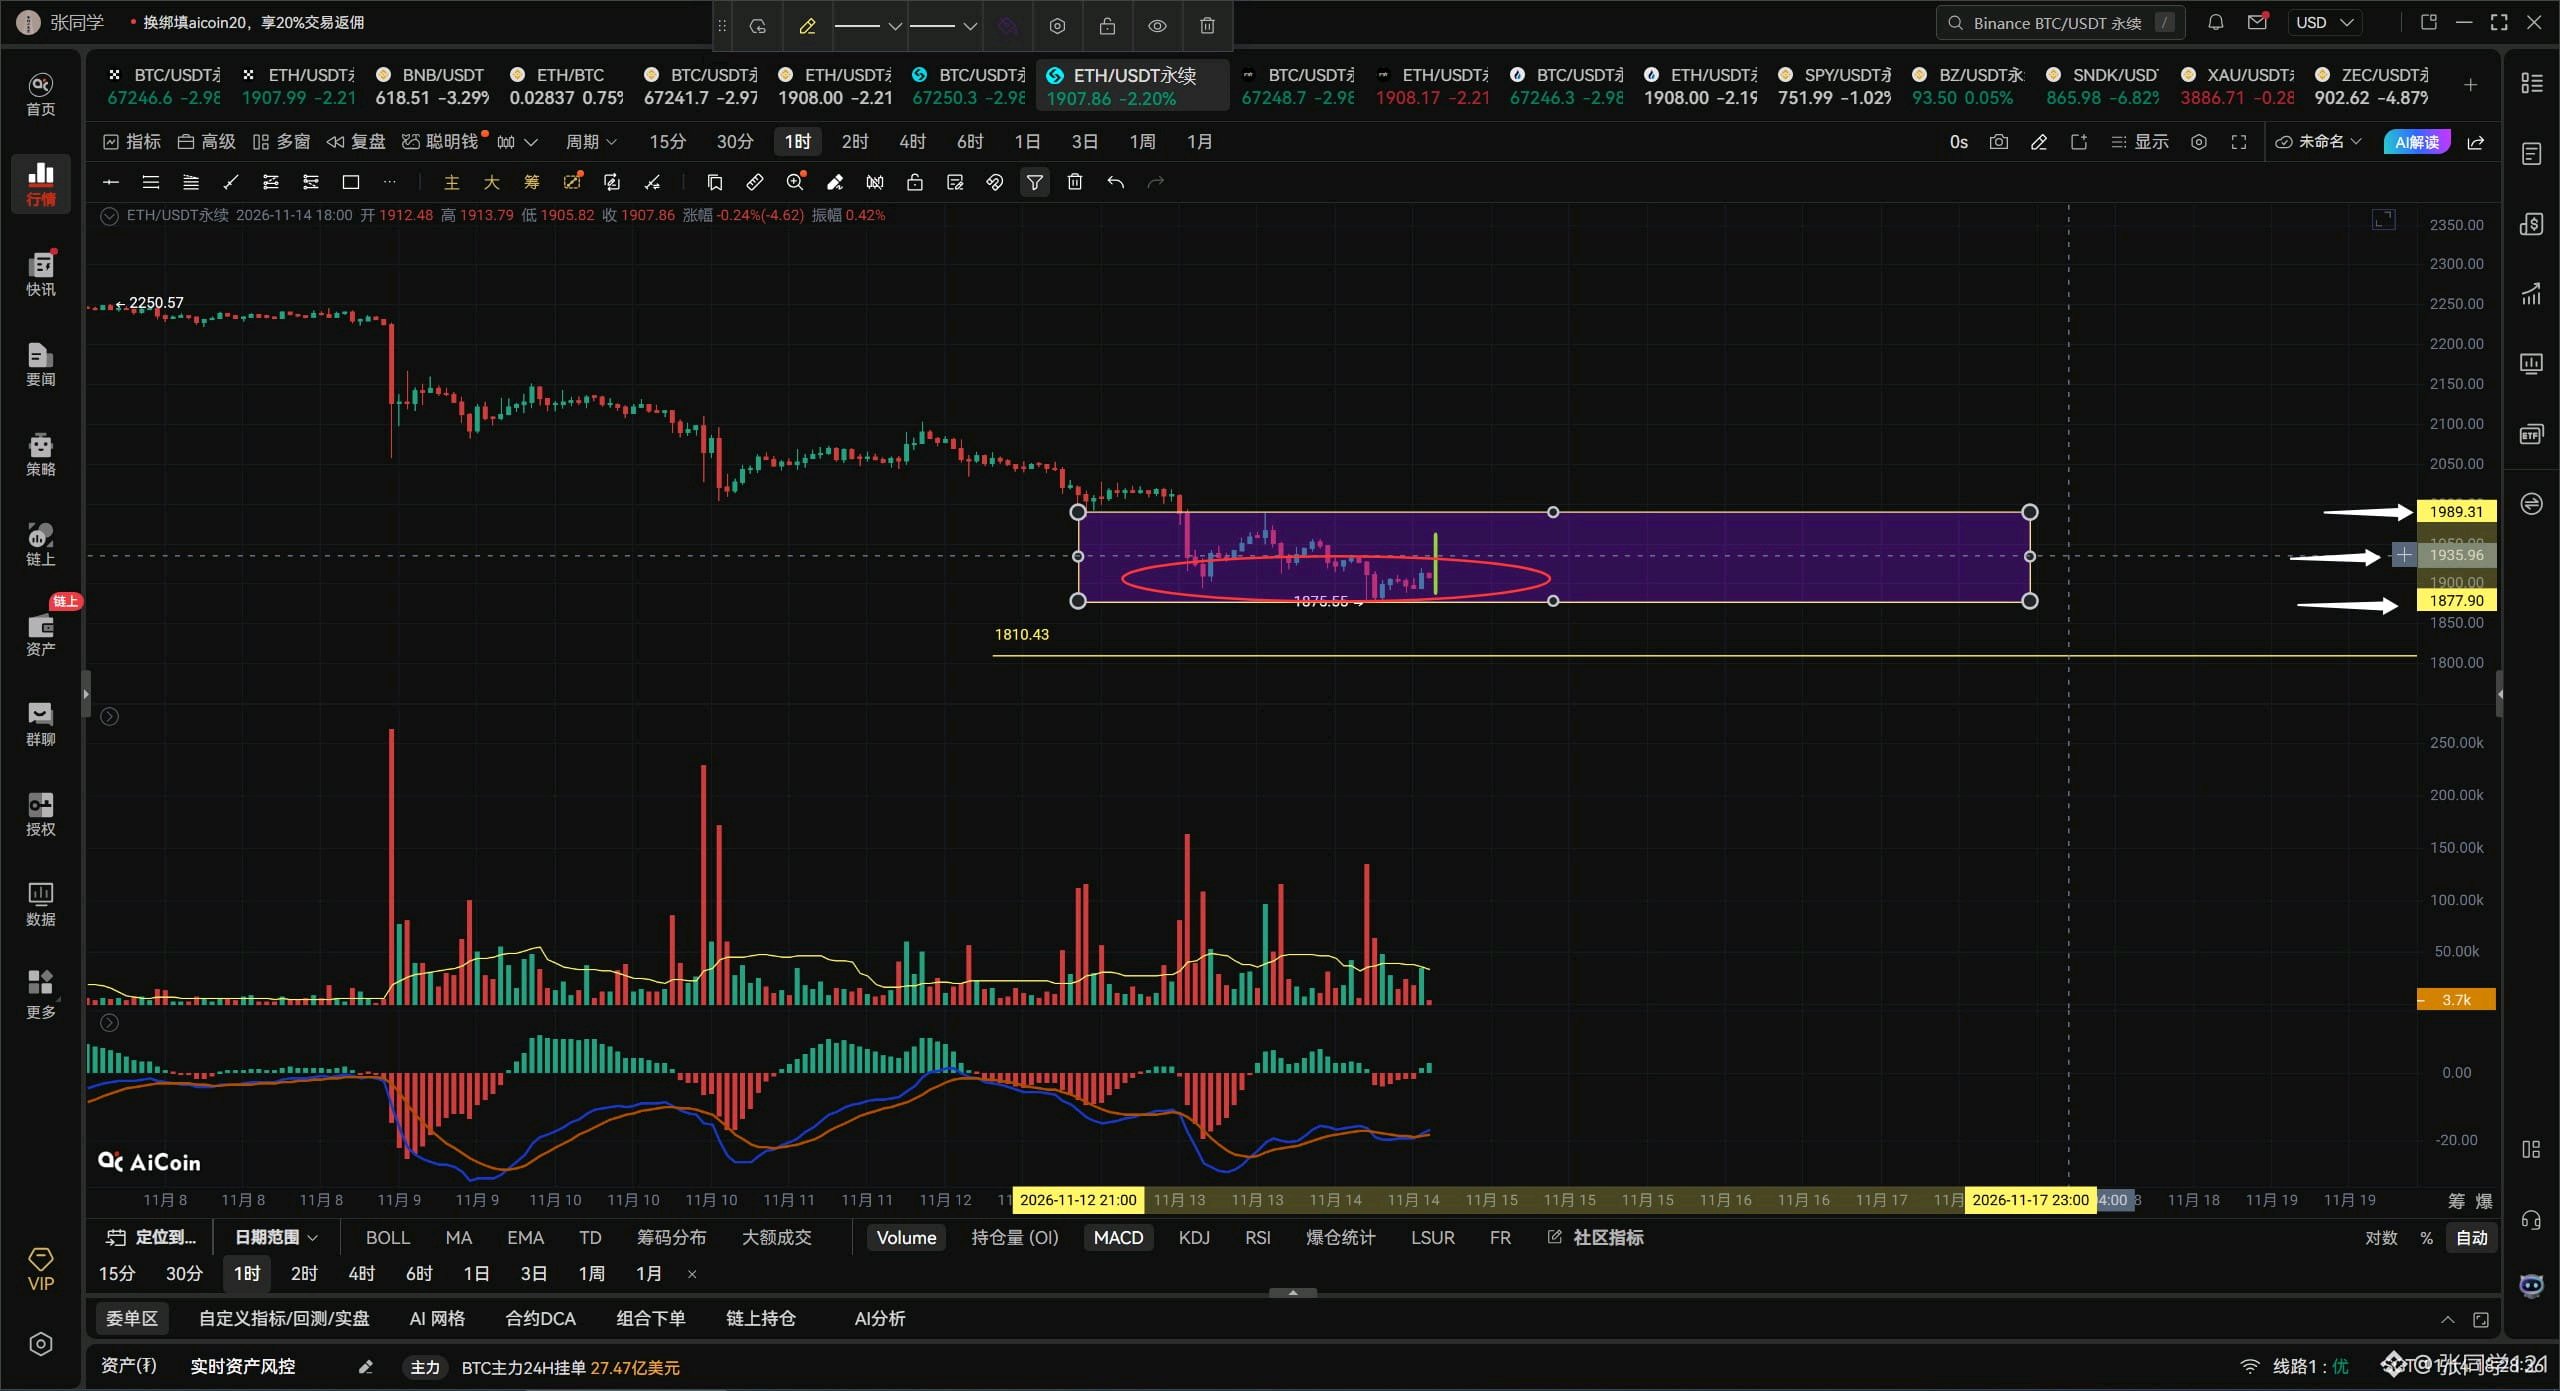
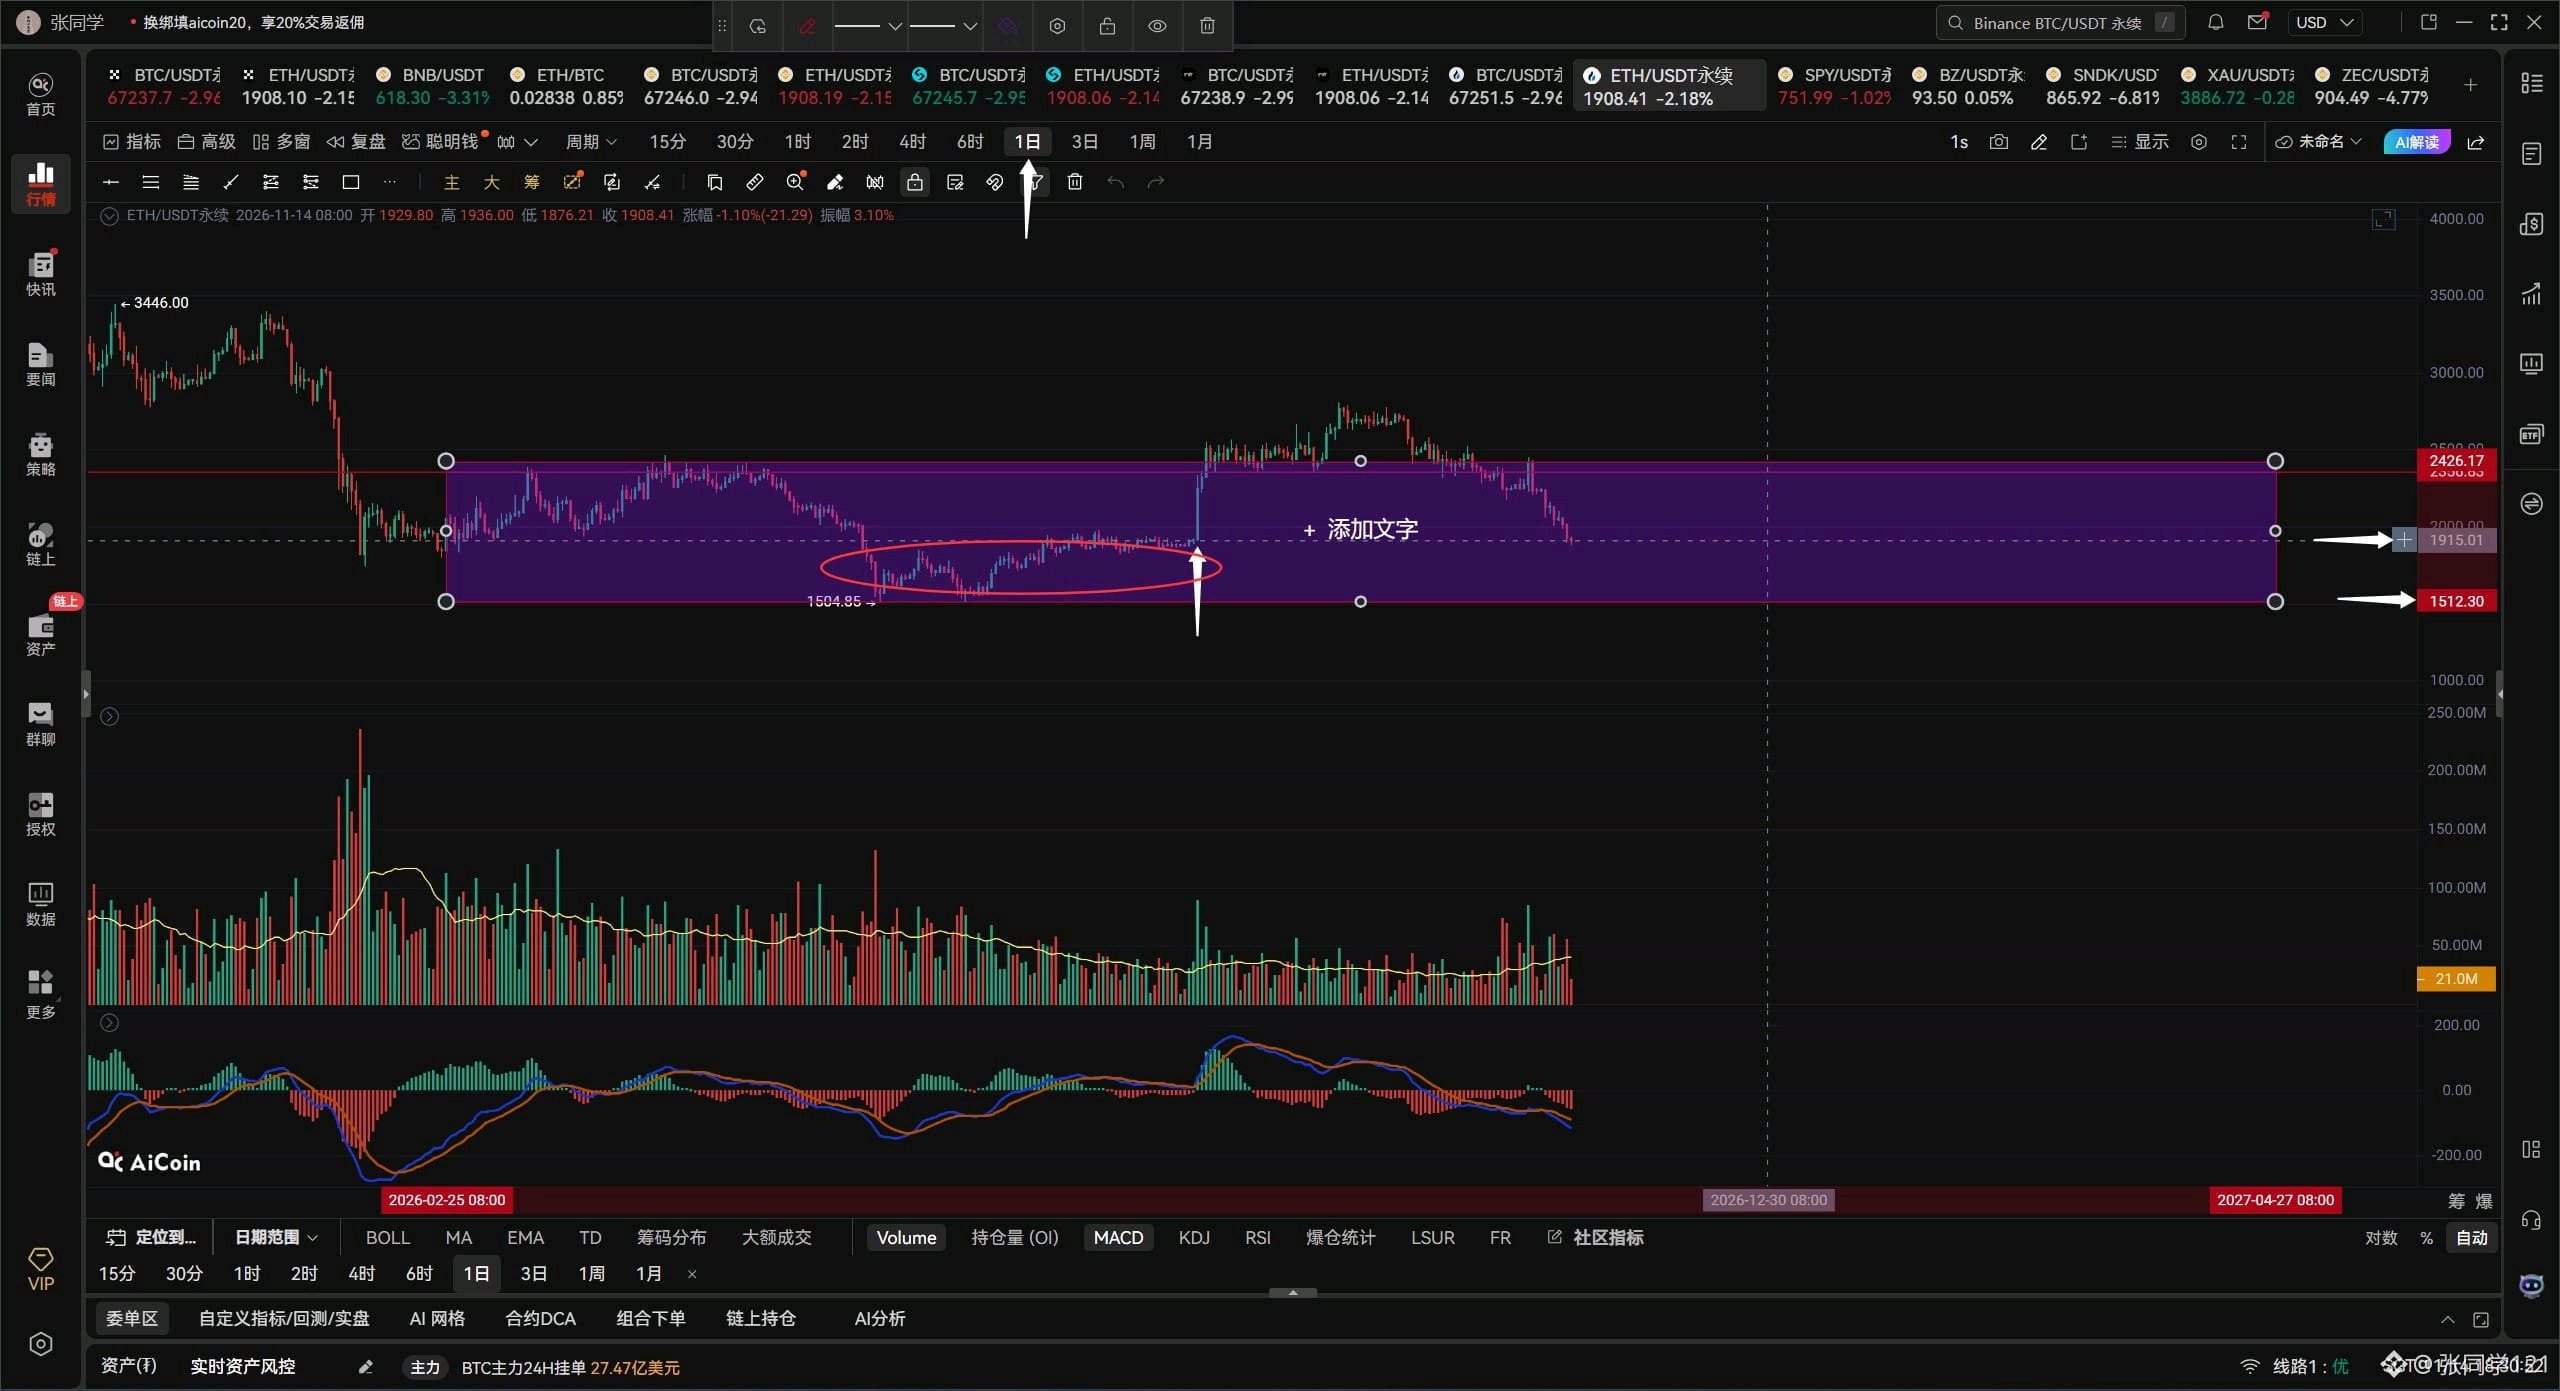
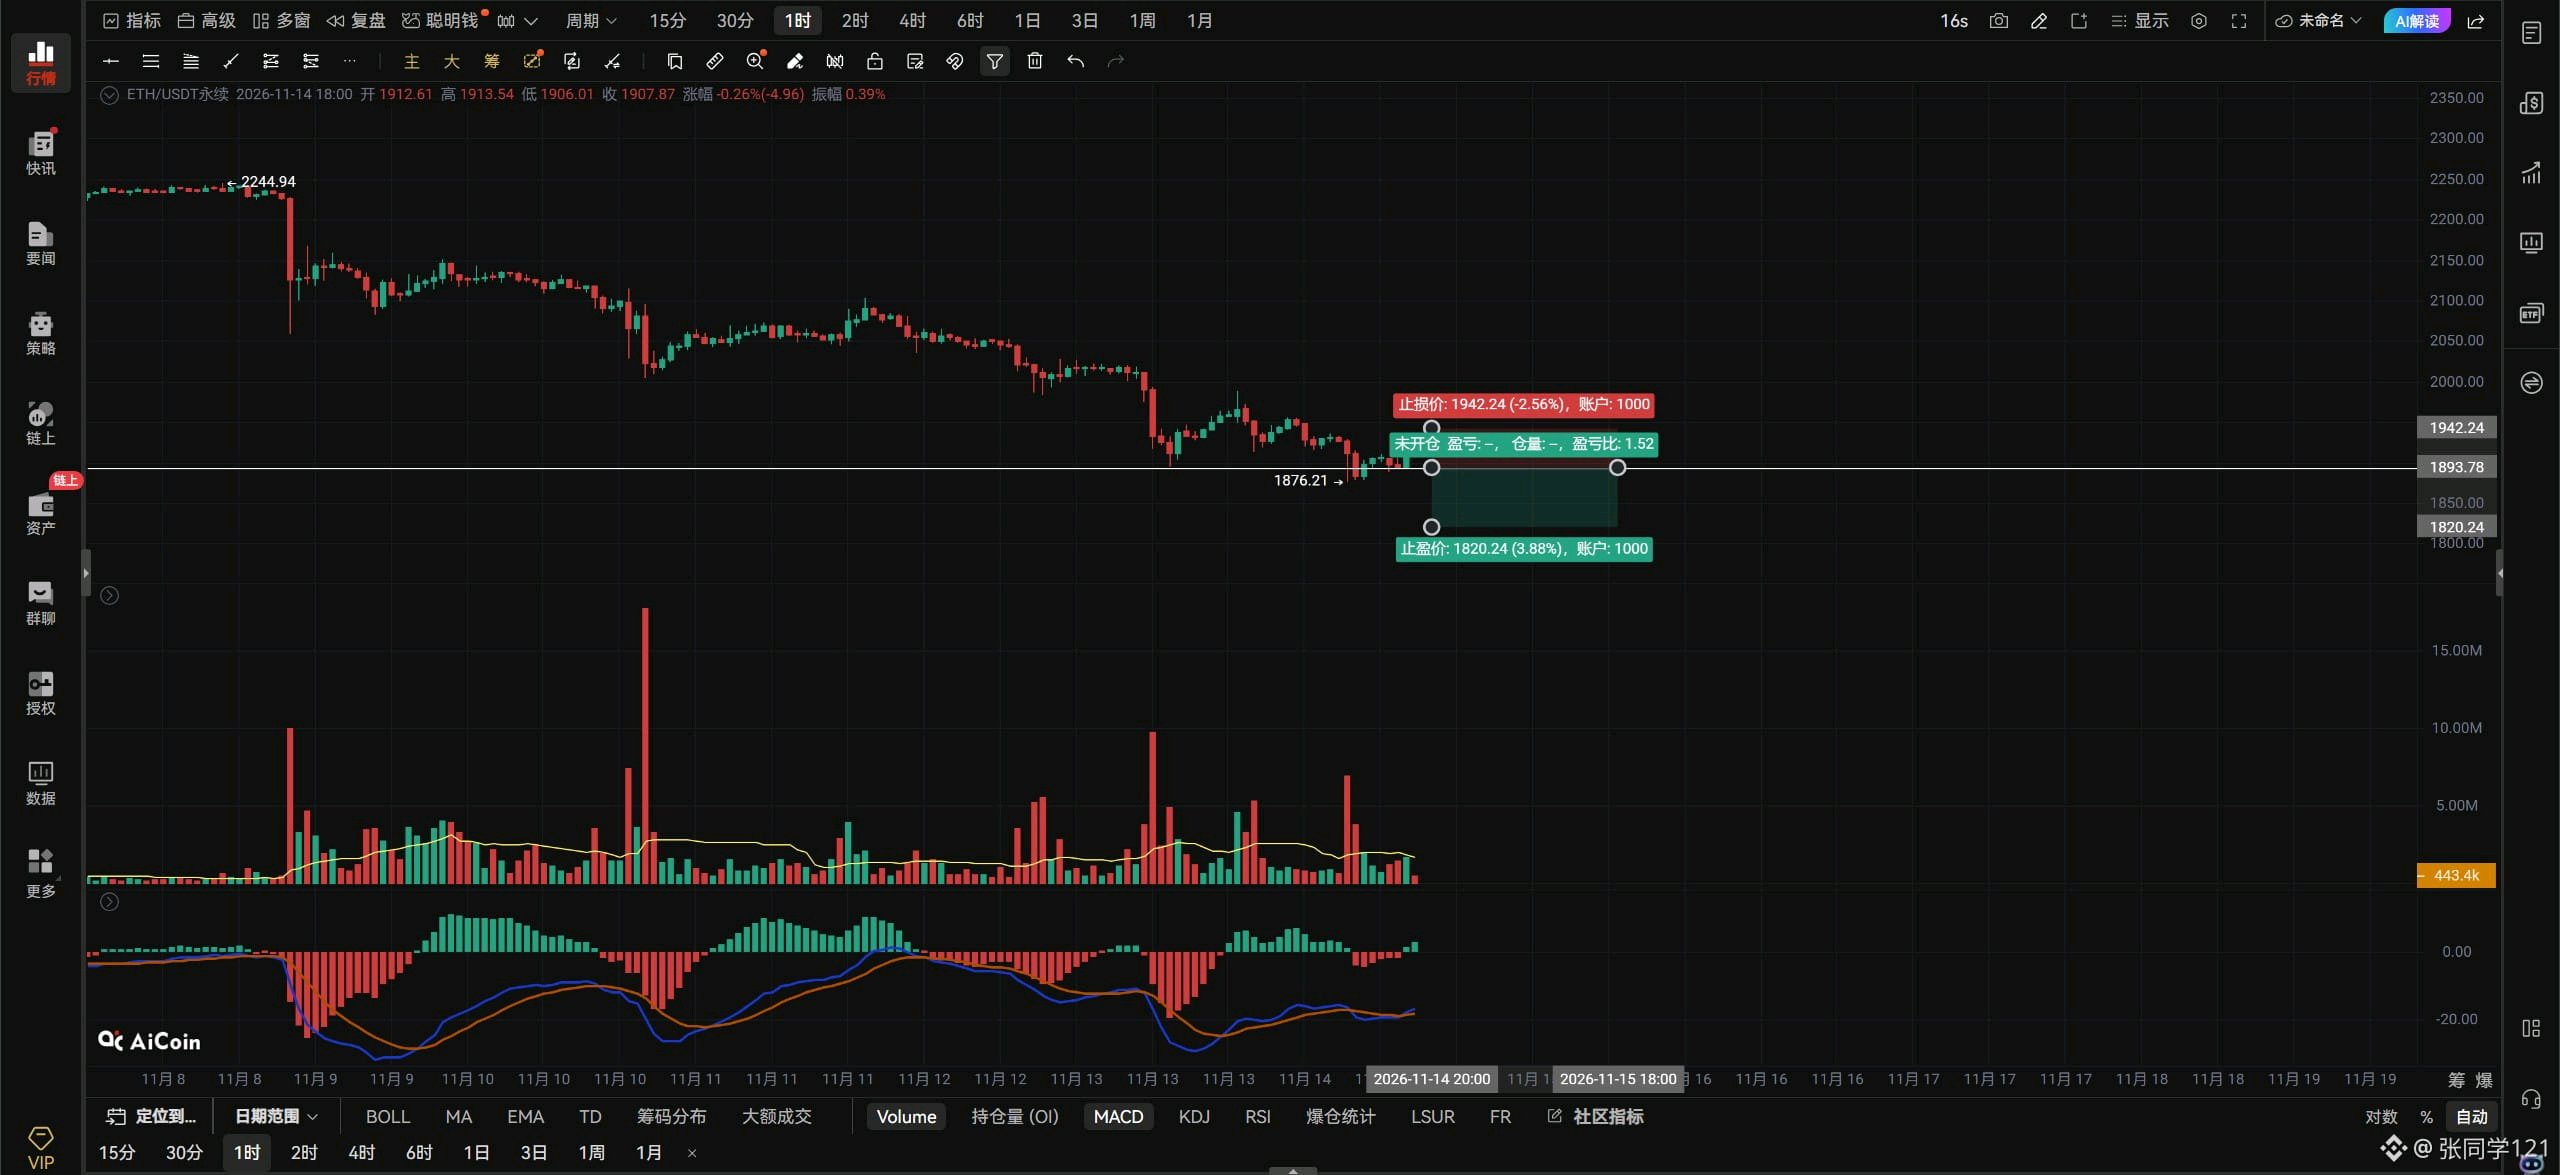
$ETHUSDT $ETH Perspectives pour la soirée du 14 nov. L'ETH est actuellement en phase de consolidation entre 1989 et 1877. Pour que l'ETH remonte, il doit franchir le point médian de cette fourchette et s'y maintenir afin de stopper sa chute et amorcer un rebond. Ce prix se situe autour de 1935, car seule une cassure au-dessus de la petite zone de consolidation marquée par la case rouge à 1935 peut générer un plus haut et prolonger le rebond vers la limite supérieure de la fourchette à 1989. S'il ne parvient pas à dépasser 1935, il ne pourra que poursuivre un trading erratique dans une fourchette étroite entre 1935 et 1877. Et comme il se négocie en dessous du point médian de la fourchette, le risque de cassure sous le précédent plus bas est élevé. Donc, pour réduire le risque de nouvelles baisses, l'ETH doit repasser au-dessus de 1935 et s'y maintenir. Si l'ETH casse les 1912 avec du volume, envisagez une position longue ; s'il casse les 1893 avec du volume, envisagez une position courte. Surveillez les changements de volume et utilisez des stop-loss. Si l'ETH se maintient au-dessus de 1912 sur le graphique horaire, visez la zone 1935–1989. S'il casse sous 1893 sur le graphique 4 heures, visez 1861–1809. Sur le graphique journalier de l'ETH, la grande bougie haussière indiquée par la flèche blanche ci-dessous a déjà été rompue. Si la clôture quotidienne de demain ne parvient pas à réintégrer cette bougie, le prix pourrait entrer dans la zone de consolidation marquée par la case rouge ci-dessous. Je ne peux pas dire avec certitude s'il atteindra 1500 ! Quoi qu'il en soit, l'ETH est en grande difficulté s'il ne parvient pas à rester au-dessus de 1900. C'est tout.#ByXIMPACT
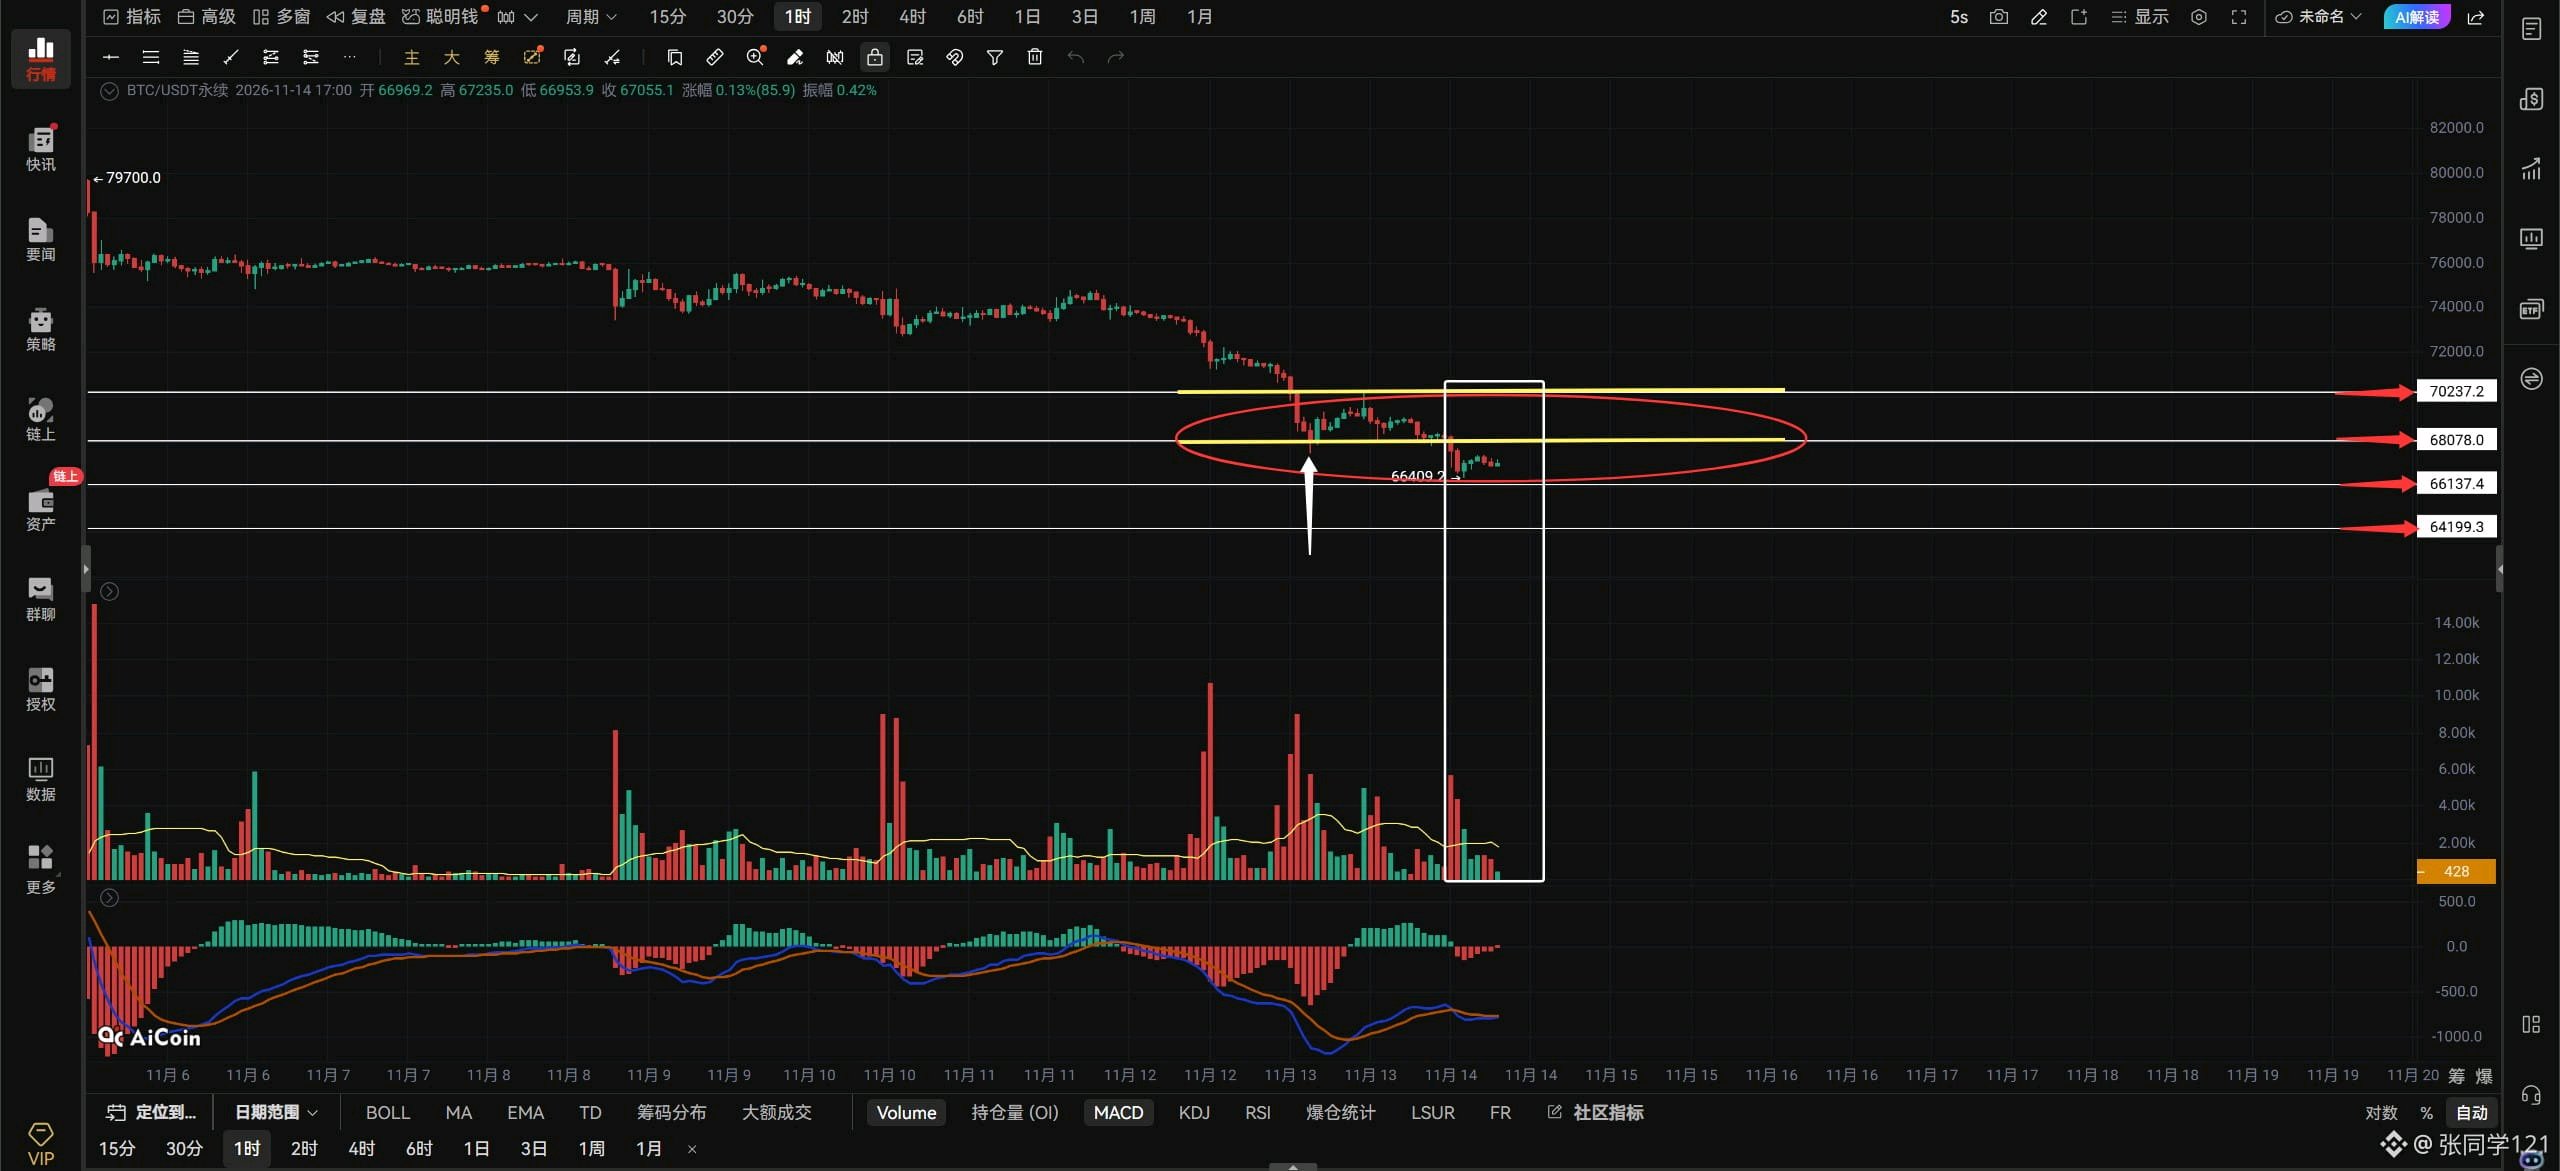
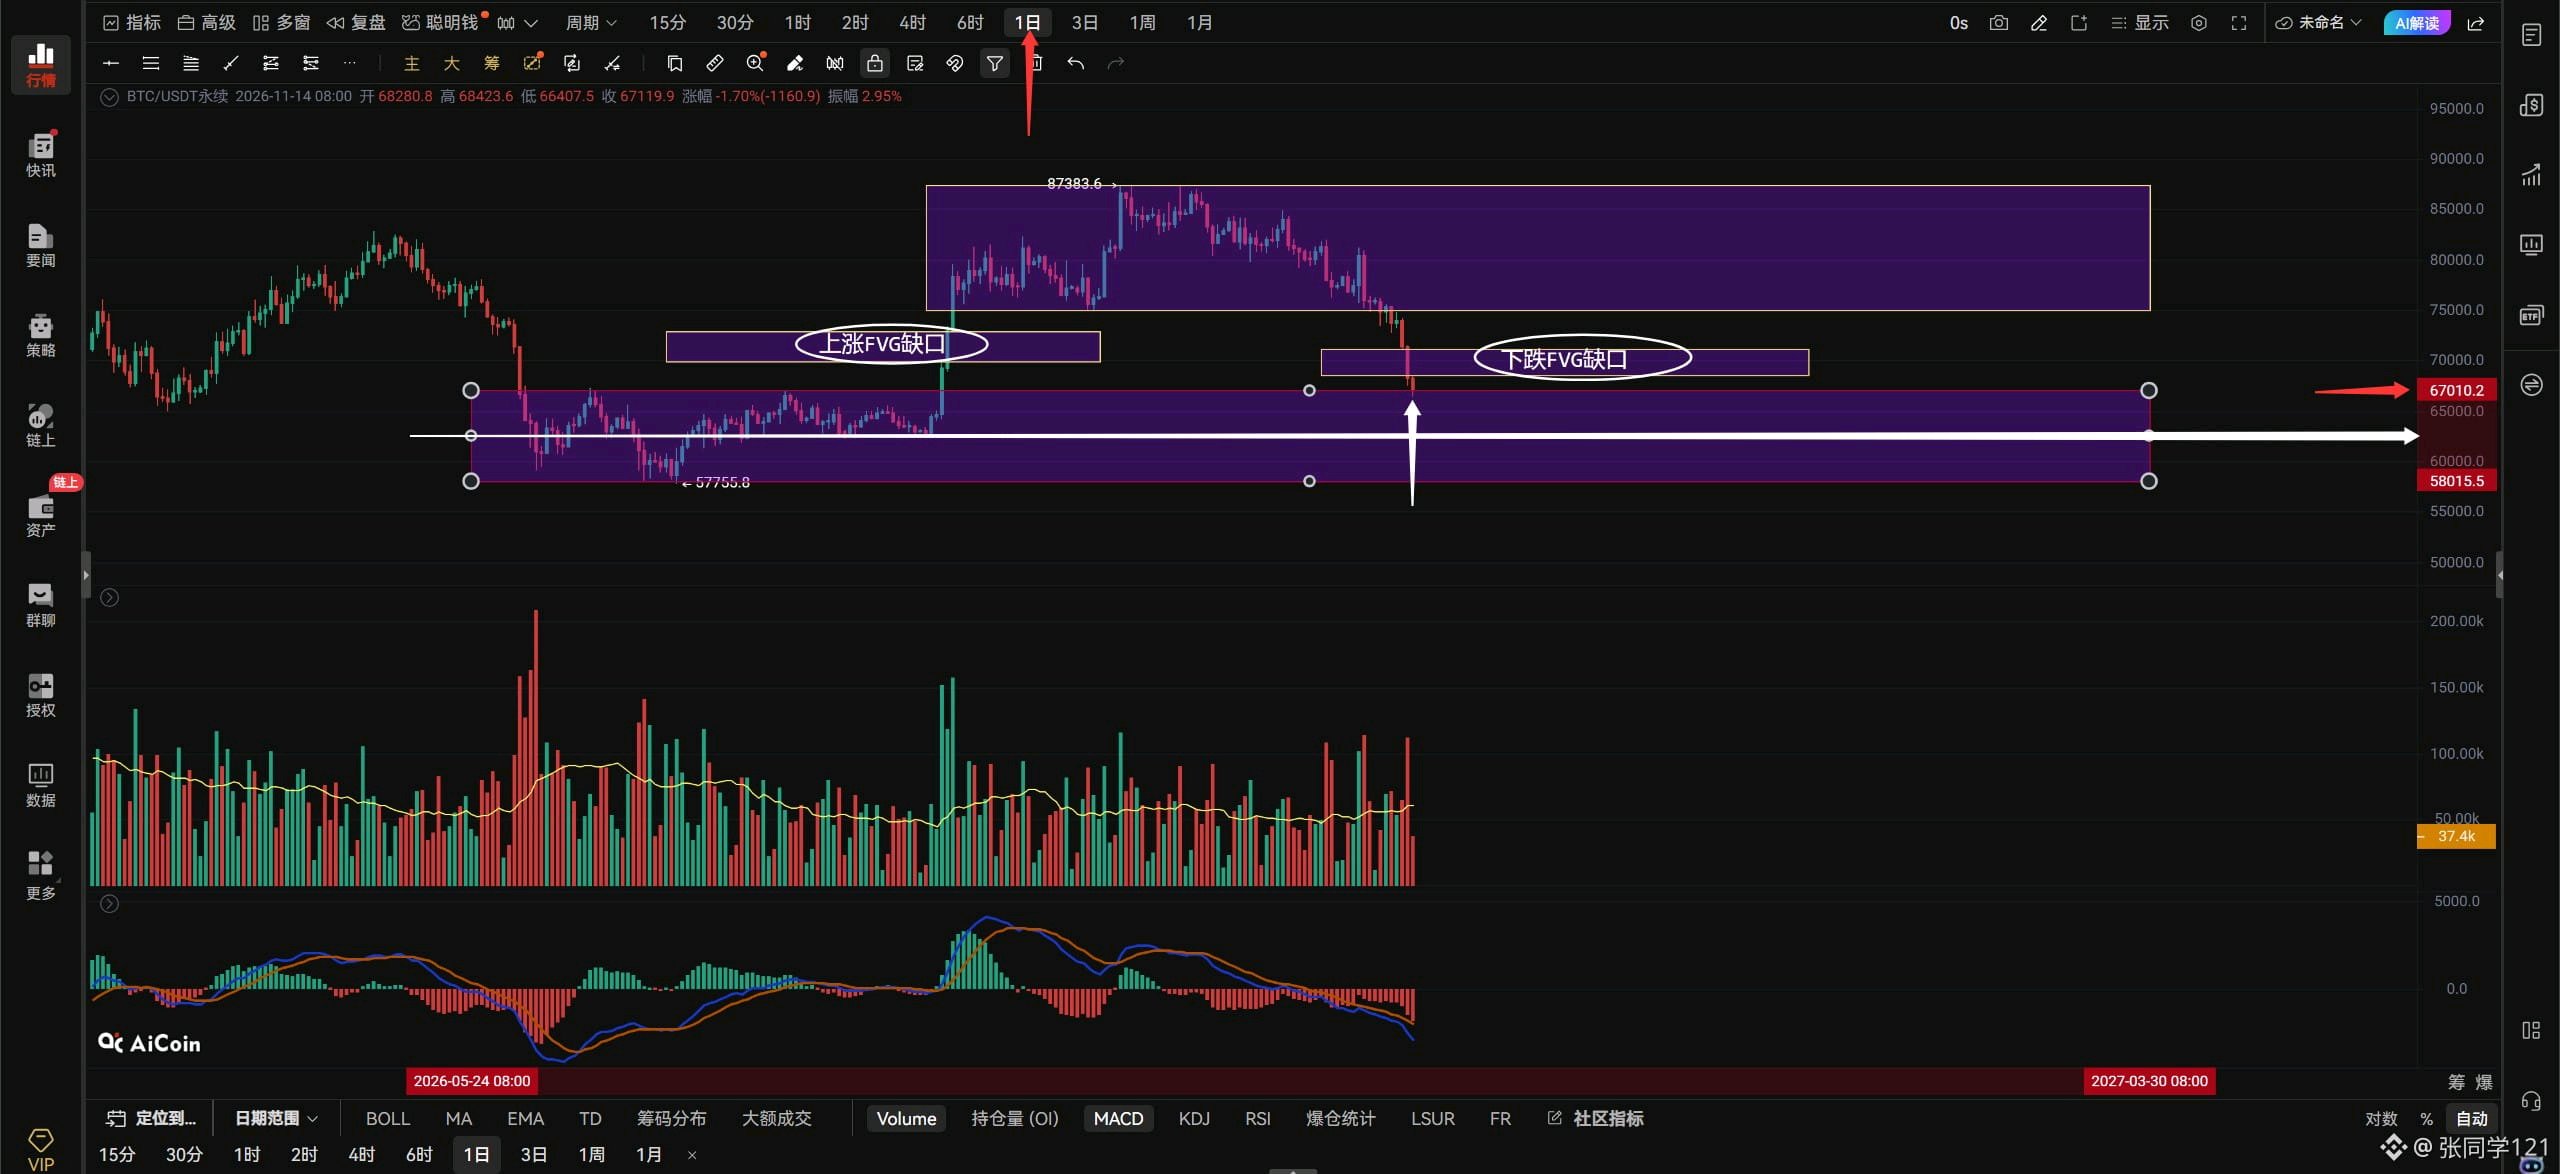
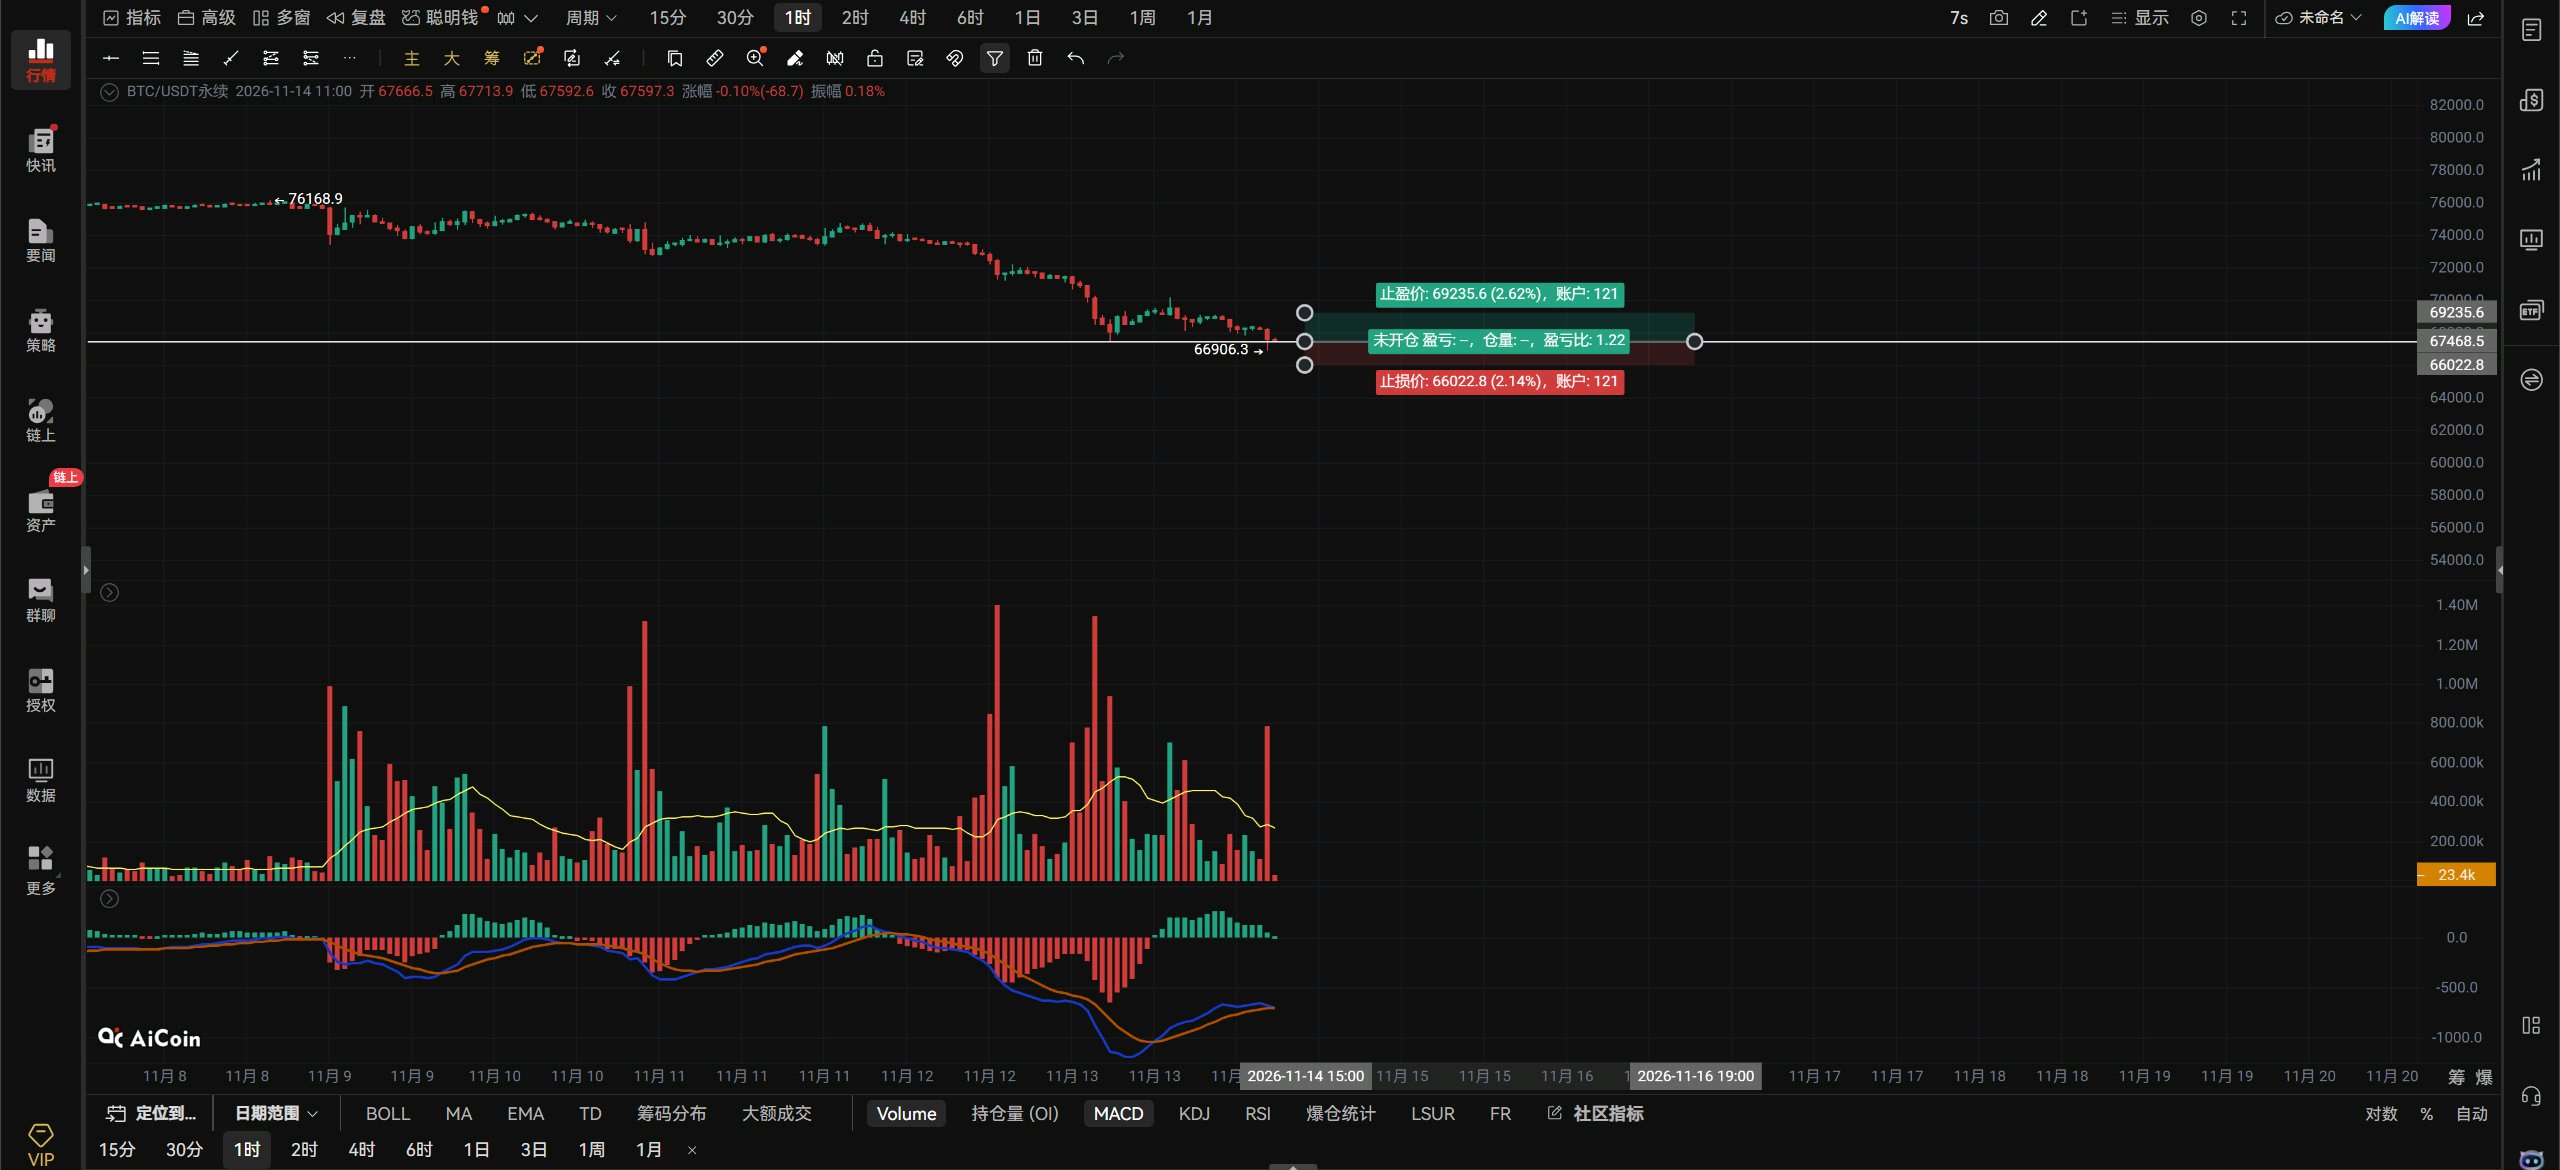
$BTCUSDT $BTC Evening outlook: 11/14. Bitcoin’s price action is heartbreaking 💔! It keeps making new lows—what is going on? Right now, Bitcoin is moving within the consolidation range marked by the red box, around 70237–66137. You can divide this range into two consolidation zones: the upper zone is 70237–68078, and the lower zone is 68078–66137. Bitcoin has now broken below the upper consolidation zone of 70237–68078 and returned to trading in the lower zone. When Bitcoin was consolidating in the upper zone, it meant that bulls at the current level were still operating in a strong range. Now that it’s back in the lower zone, the bulls have returned to a weak range and are moving sideways again. That’s not a good sign. Look at the volume below the candles marked by the white box: there’s volume on the way down, but volume is shrinking on the way up. How can Bitcoin rebound like this? It can’t even reclaim the previous low at 67400, indicated by the white arrow. To stop falling and rebound, it needs to get back above the previous low of 67400 and trade there. Only then can it find a bottom and rebound, with 68000–69000–70000 in view. If it can’t reclaim the previous low, simply holding a consolidation range of 66137–68078 would already be good. Just don’t let it fall below 66137; if it does, then 64199 is in sight. There’s no clear signal that it’s found a bottom, and it can’t get a rebound going. You don’t dare chase a short, and there’s no bottom signal for going long—what are you supposed to do? Stay on the sidelines! If you want to go long, wait for Bitcoin to retest the previous low without breaking below it and show a bottoming signal, then take a small short-term long position. Alternatively, wait for Bitcoin to break into the 67400–68000 resistance zone, then cautiously chase a small long on the right-hand side of the chart. If Bitcoin breaks above 67468 with volume, aggressive traders can chase a long on the right-hand side. If it rebounds to 68500, consider a small short on the left-hand side, with a stop-loss in place.Bitcoin breaks above and holds 67468 on the hourly chart, look for 68078–69000. There’s no point if it can’t get above 67468. If it breaks below 66733 on the 4-hour chart, look down to 66137–64199. The bullish FVG gap on the left side of Bitcoin’s daily chart has been completely filled, but there’s no sign of a bottom—instead, another bearish FVG gap has appeared on the right. The bearish FVG spans 68602–71190. Next, we’ll see whether tomorrow’s daily close can stay within that gap. If Bitcoin can get back inside it, the daily downtrend should stop. If it can’t close back inside, see that large daily consolidation range below, from 67010 to 58015? Price will move back within that range. The current daily candle has already pierced into it, which is dangerous. If tomorrow’s daily close can’t stay above 67000, then based on the range, the strongest support below is around the midpoint at 62000. Scary, huh? If things keep going like this, this market won’t be much fun. Meeting adjourned. #ByXIMPACT
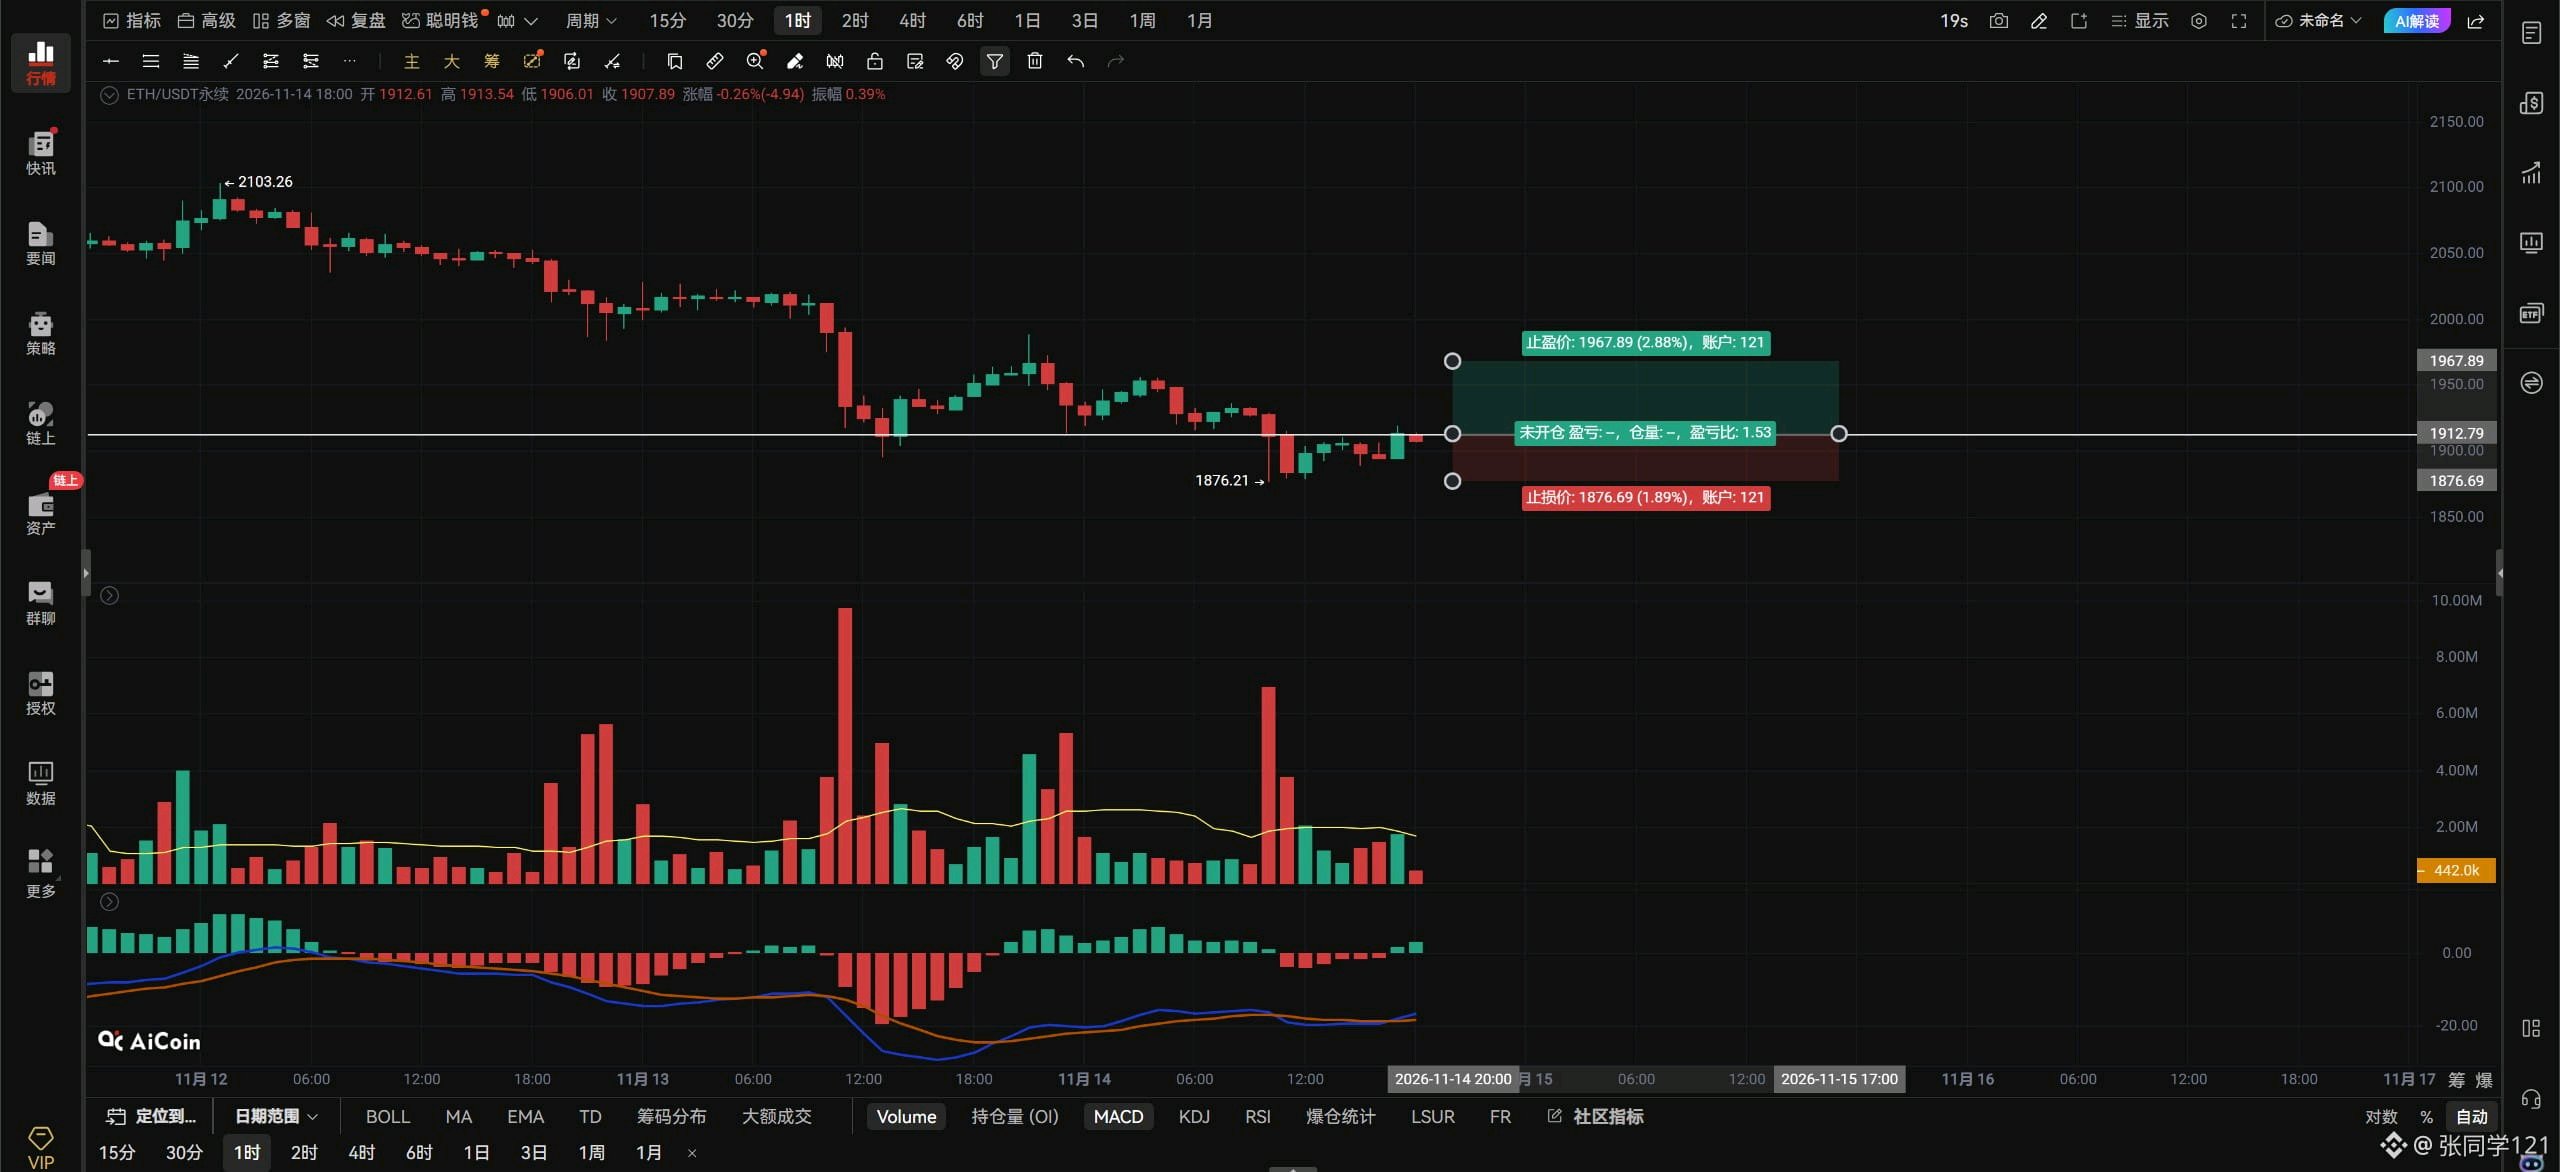
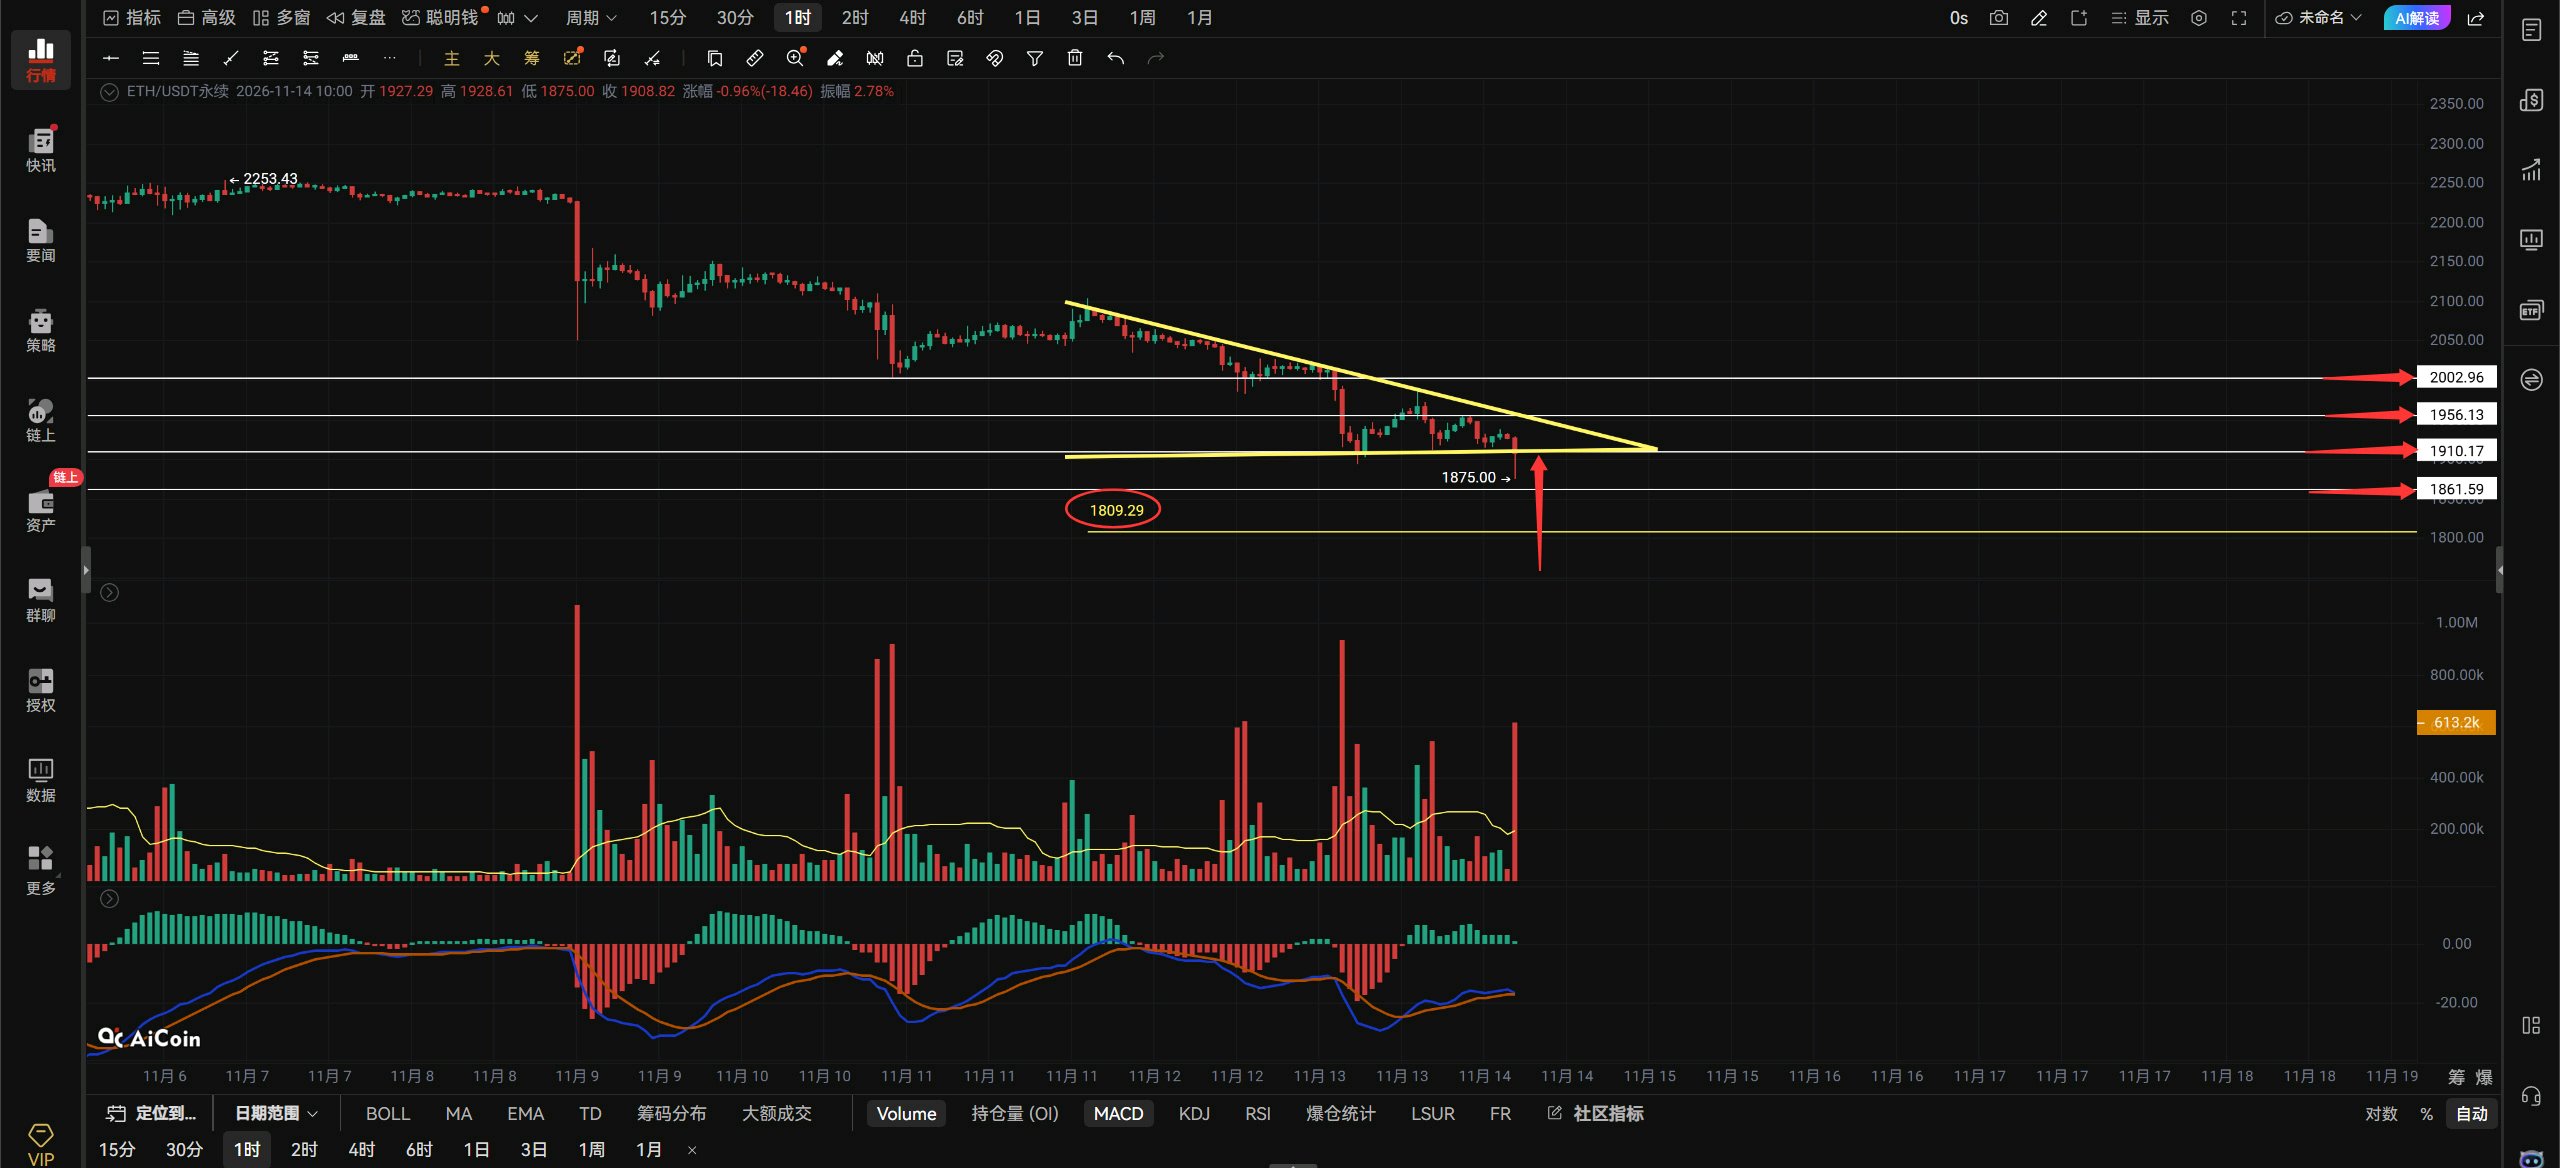
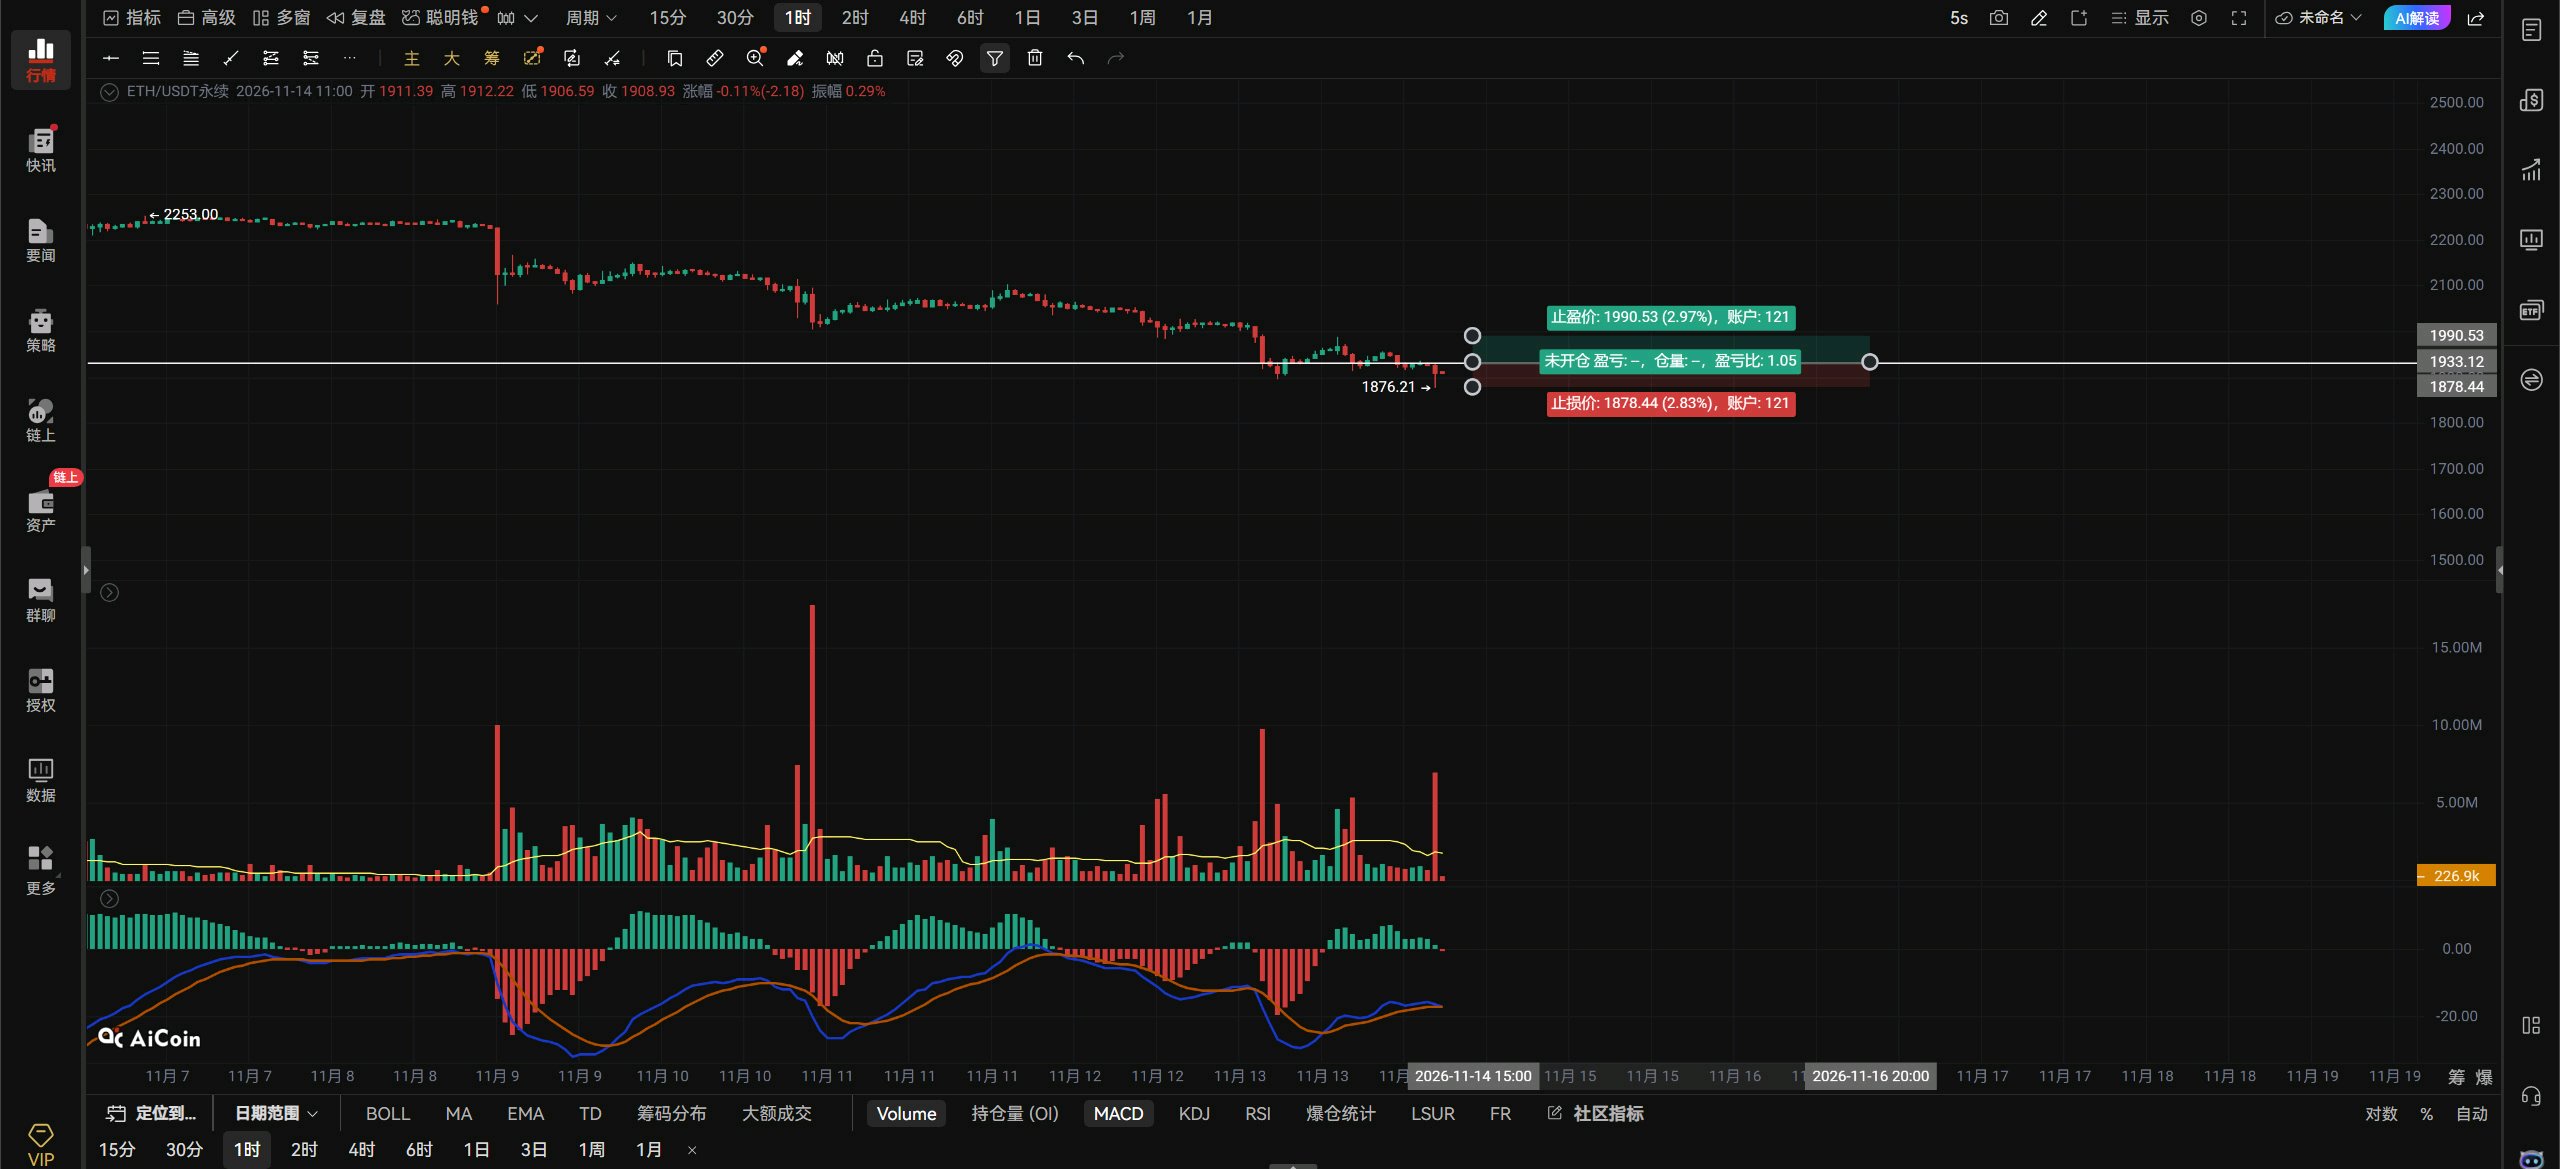
$ETHUSDT Outlook: If ETH breaks above 1933 with volume, chase the long on the right side; move the stop-loss to breakeven. If ETH breaks below 1910 with volume, chase the short on the right side; use a stop-loss. If price pulls back to 1861 and confirms support, take a long. Stop-loss if it breaks below 1821. If ETH holds above 1933 on the hourly chart, look toward 1955–2003. Watch for ETH to reach 2003 and take a short. Stop-loss if it breaks above 2046. Left-side wick orders: long at 1800; stop-loss if it breaks below 1756. Resistance above: 1933–1955–2003 Support below: 1910–1861–1821 On the 4-hour timeframe, a break below 1910 points to 1861–1821. ETH’s triangle has been broken to the downside. The question now is whether ETH can get back inside the triangle. If it does, the consolidation between 1910 and 1956 will continue. If it can’t, then 1800 is the next target. The support at 1861 will most likely be broken. ETH needs to break above 1956 to stop falling and rebound toward 2000; if it can’t get past 1956, it can only keep testing lower levels. Personally, I think we’ll see a decent rebound only once it reaches 1800. Meeting adjourned.#ByXIMPACT
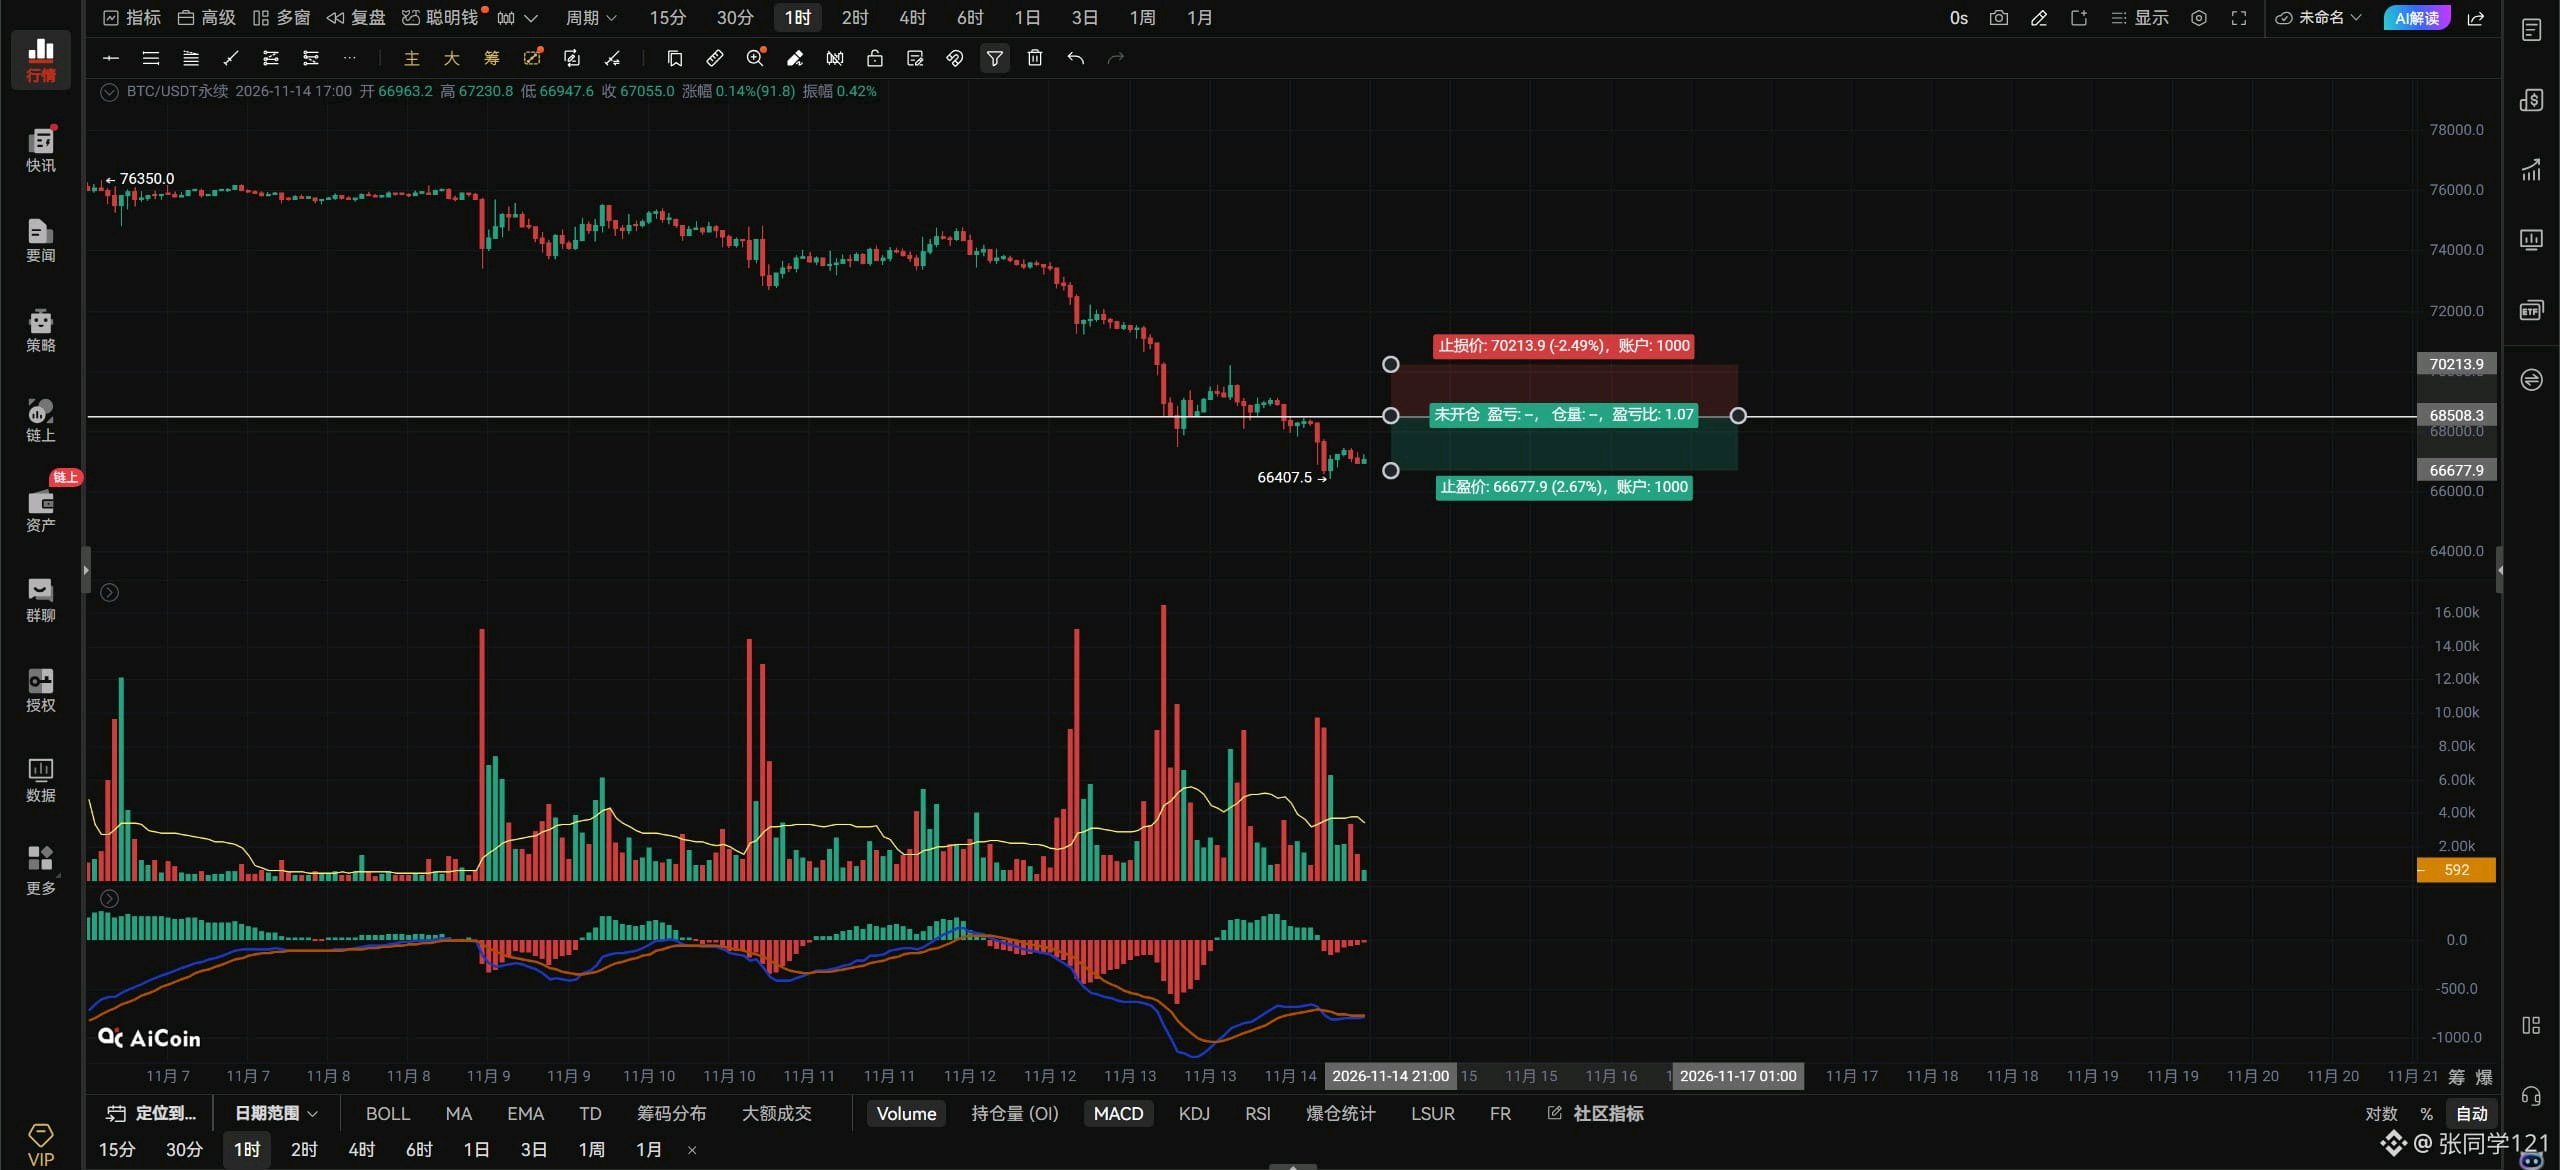
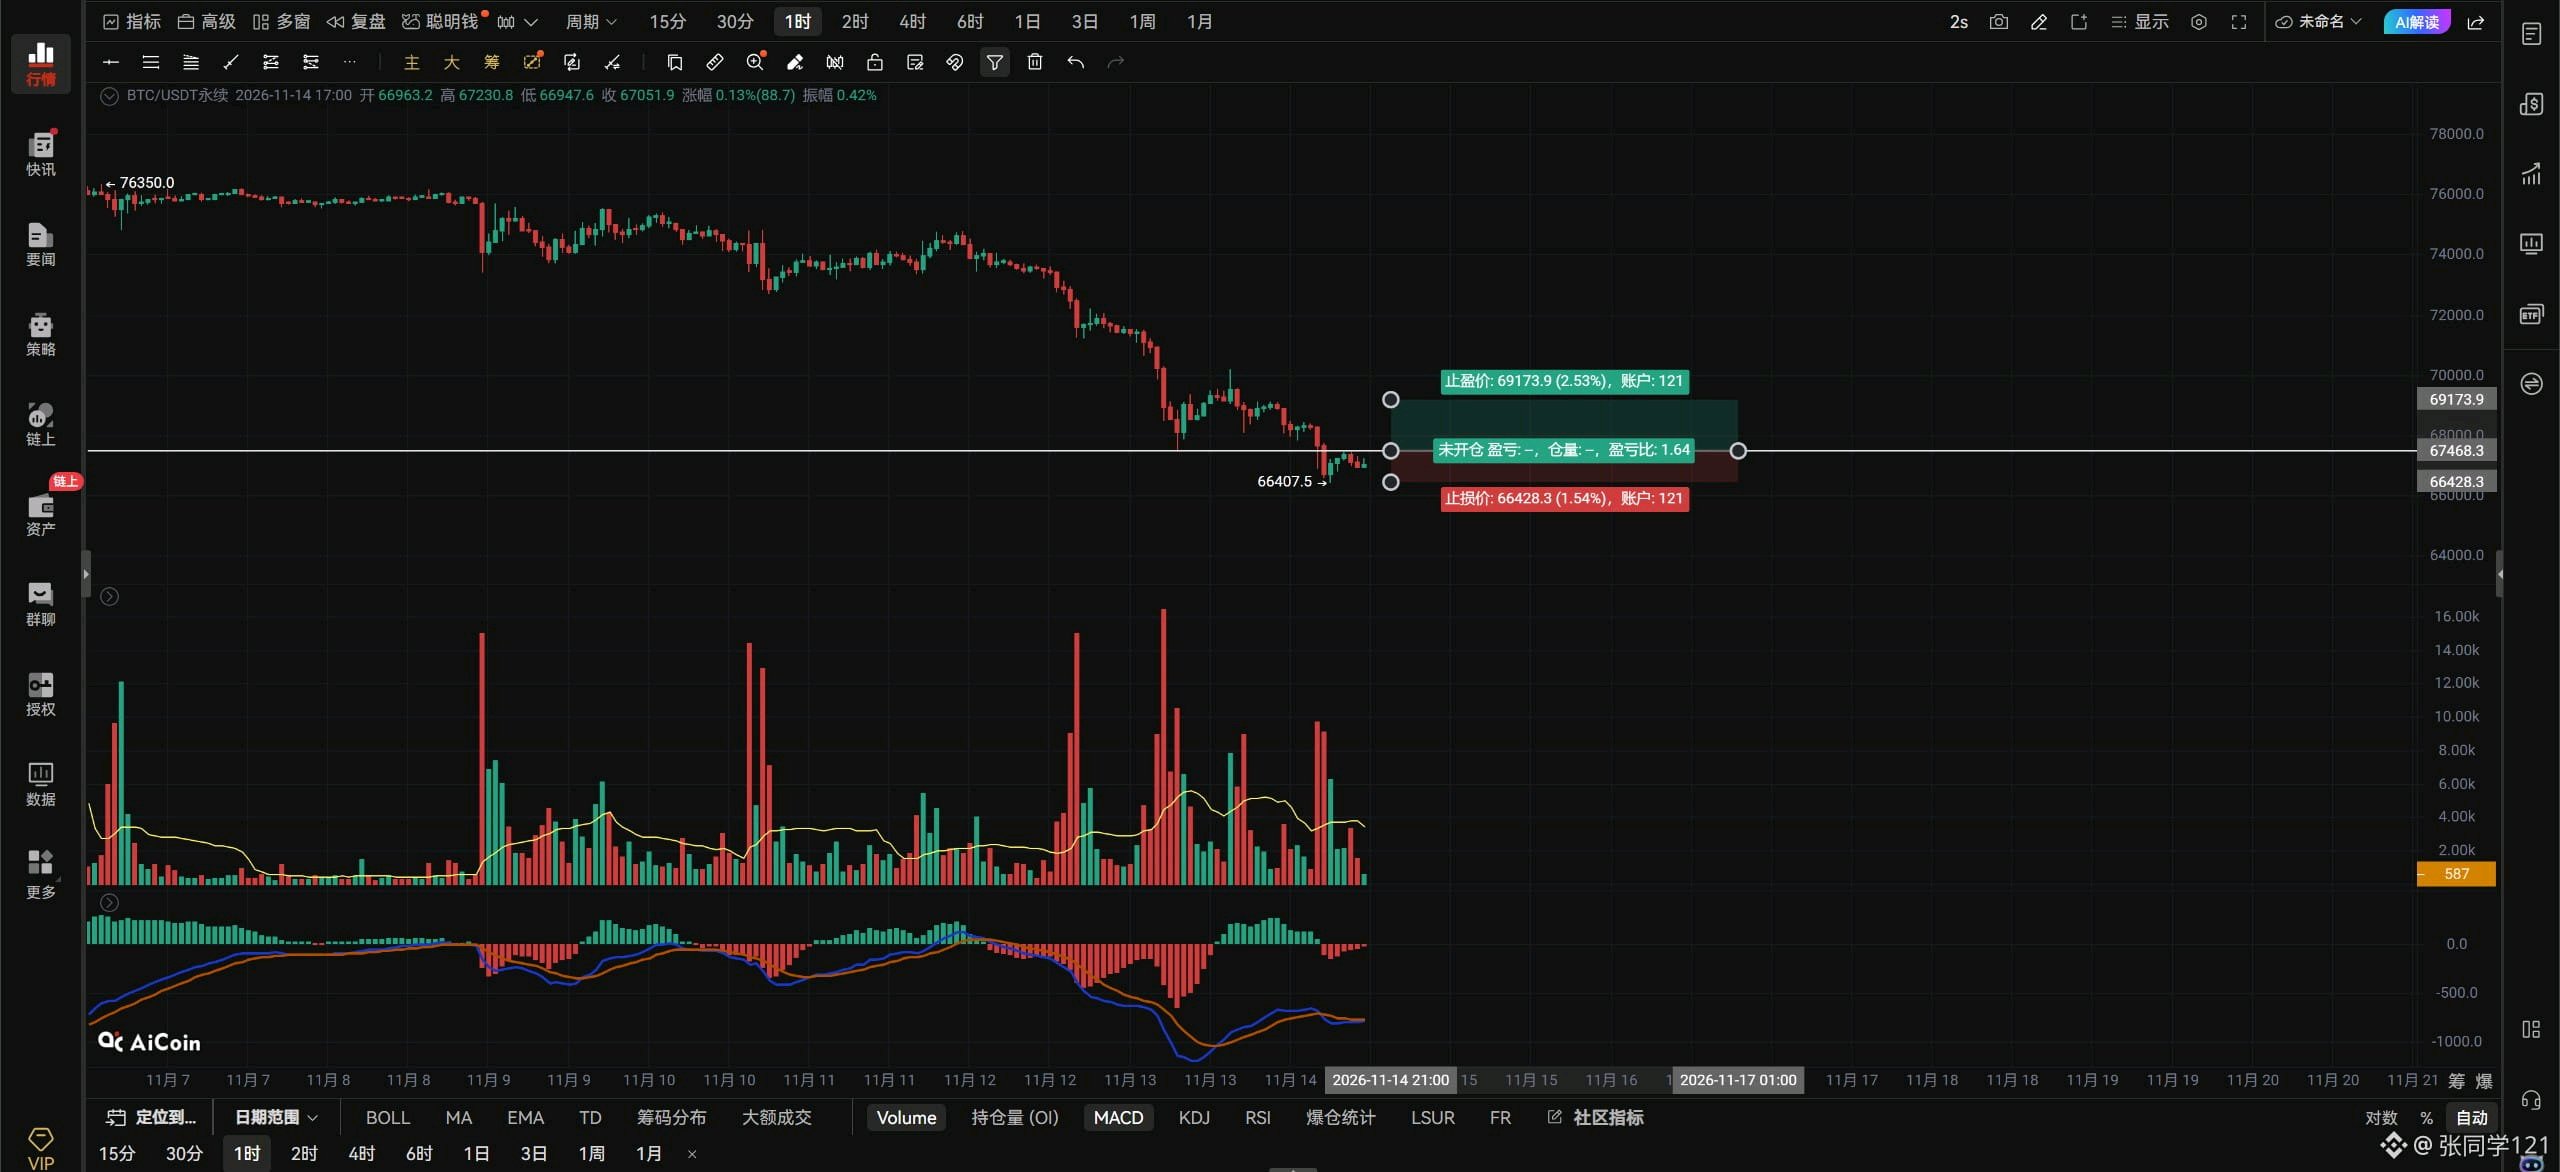
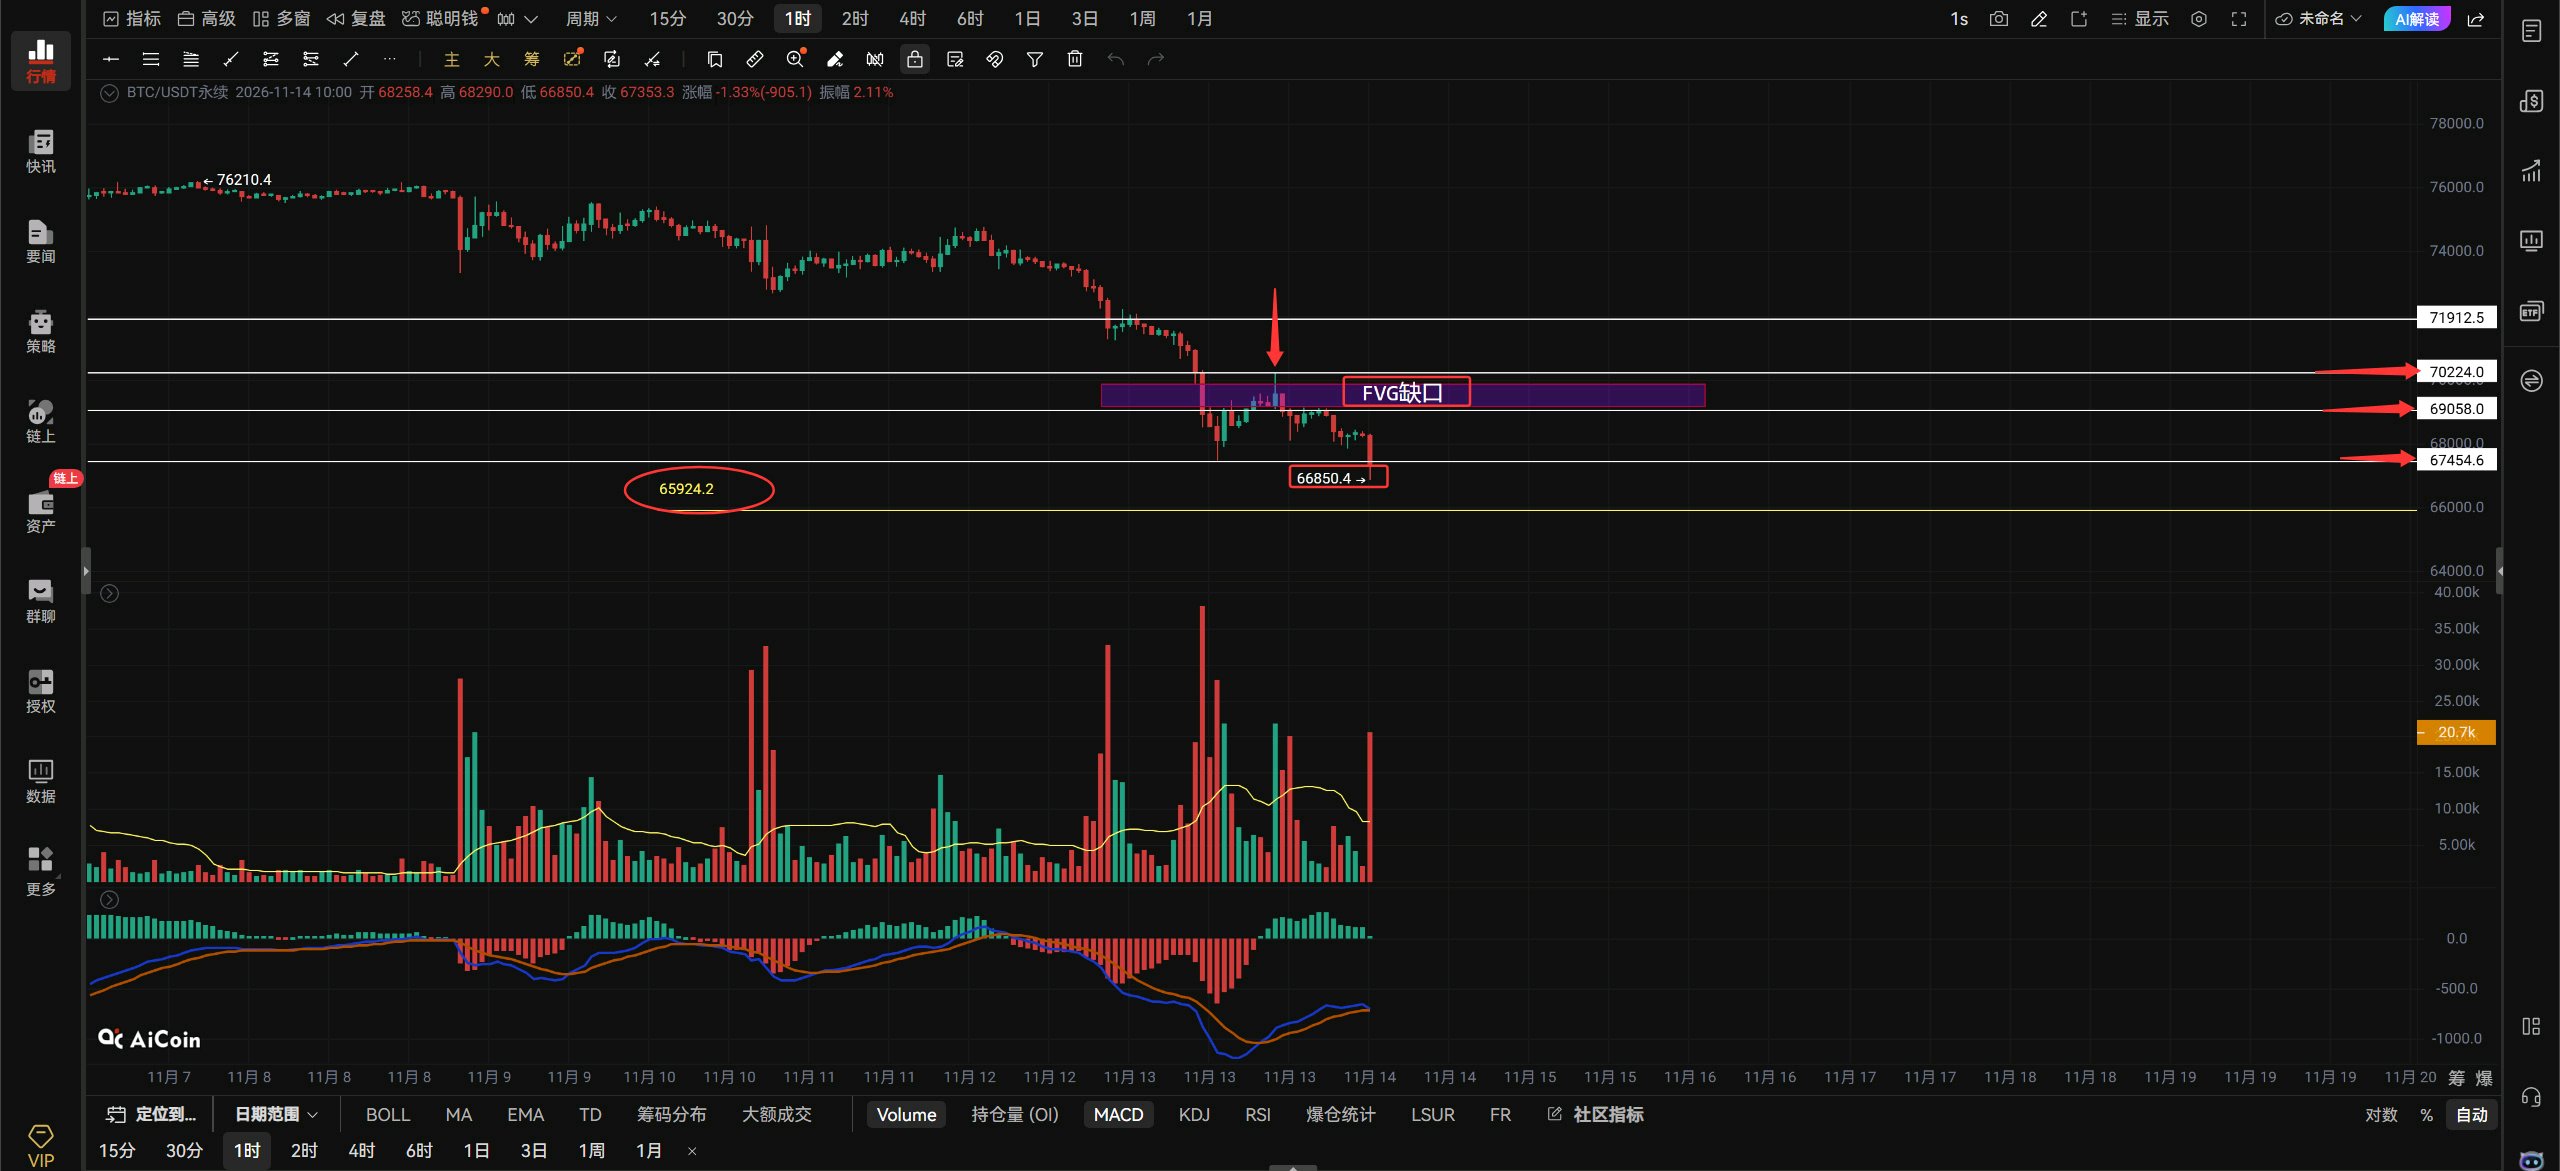
$BTCUSDT 11.14 Midday Market Outlook.🌿 $BTC Outlook: BTC made a low of 67454 yesterday and then started to rebound, filling the FVG gap above. However, the rebound failed to break through the resistance at 70224 or hold above the support at 69058. You could say this rebound was very weak. It then pulled back, broke below 69058 and the previous low, and just made another new low. That’s a new low every day! Now we’ll see whether BTC made this new low to sweep the liquidity at 67454 or is actually looking to continue falling. A sweep of the liquidity at 67454 would be acceptable; if it’s really heading down, then look to the 65924 support below. How can we tell whether it’s sweeping liquidity at 67454 or genuinely falling? Watch to see whether the hourly bearish candle currently in progress can reclaim and hold above 67454 after making a new low. If it can, that’s a liquidity sweep; if it can’t reclaim 67454, then it could fall further. Hopefully this is BTC’s last drop! If BTC can reclaim and hold above 67454, you can take a long for a rebound. Reclaiming and holding above 67454 would also set up a consolidation range between 67454 and 69058, with a chance to challenge 70224. If it can’t reclaim it, then things are looking pretty bleak. If BTC breaks above 67454 with volume, aggressive traders can chase the long on the right side. If it rebounds to 70224, take a short on the left side; use a stop-loss. If BTC breaks above 67454 and holds there on the hourly chart, look toward 69058–70224. If it can’t get above 67454, that’s no good. If BTC breaks below 67454 on the 4-hour chart, look down toward 65924–64421. Resistance above: 69058–70224–71904 Support below: 67454–65924–64421 #ByXIMPACT
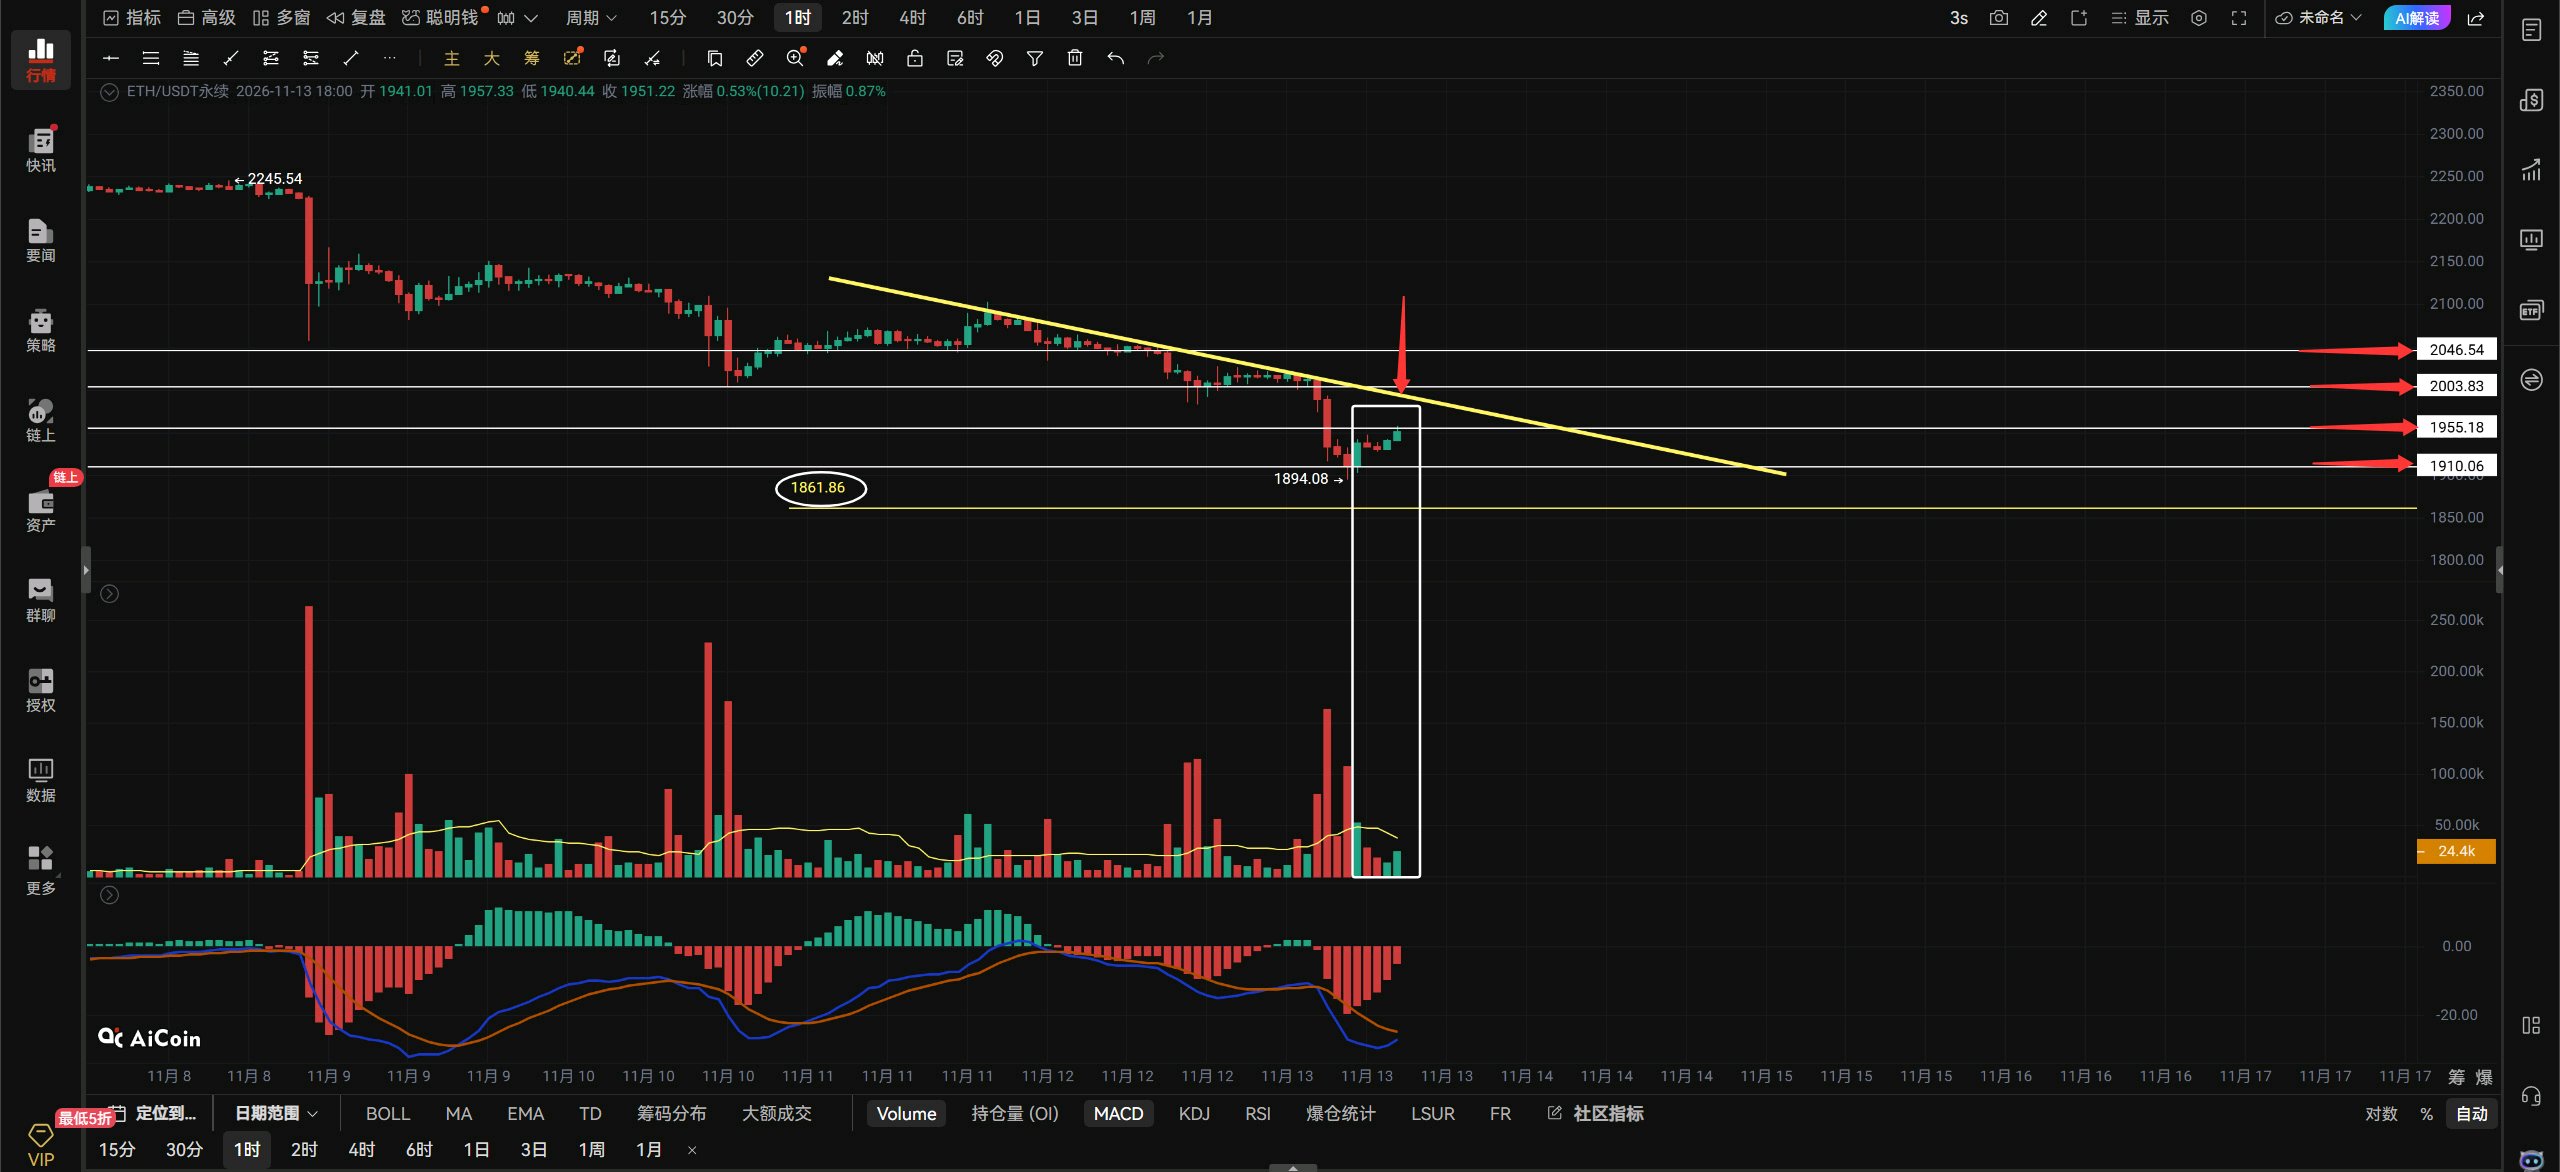
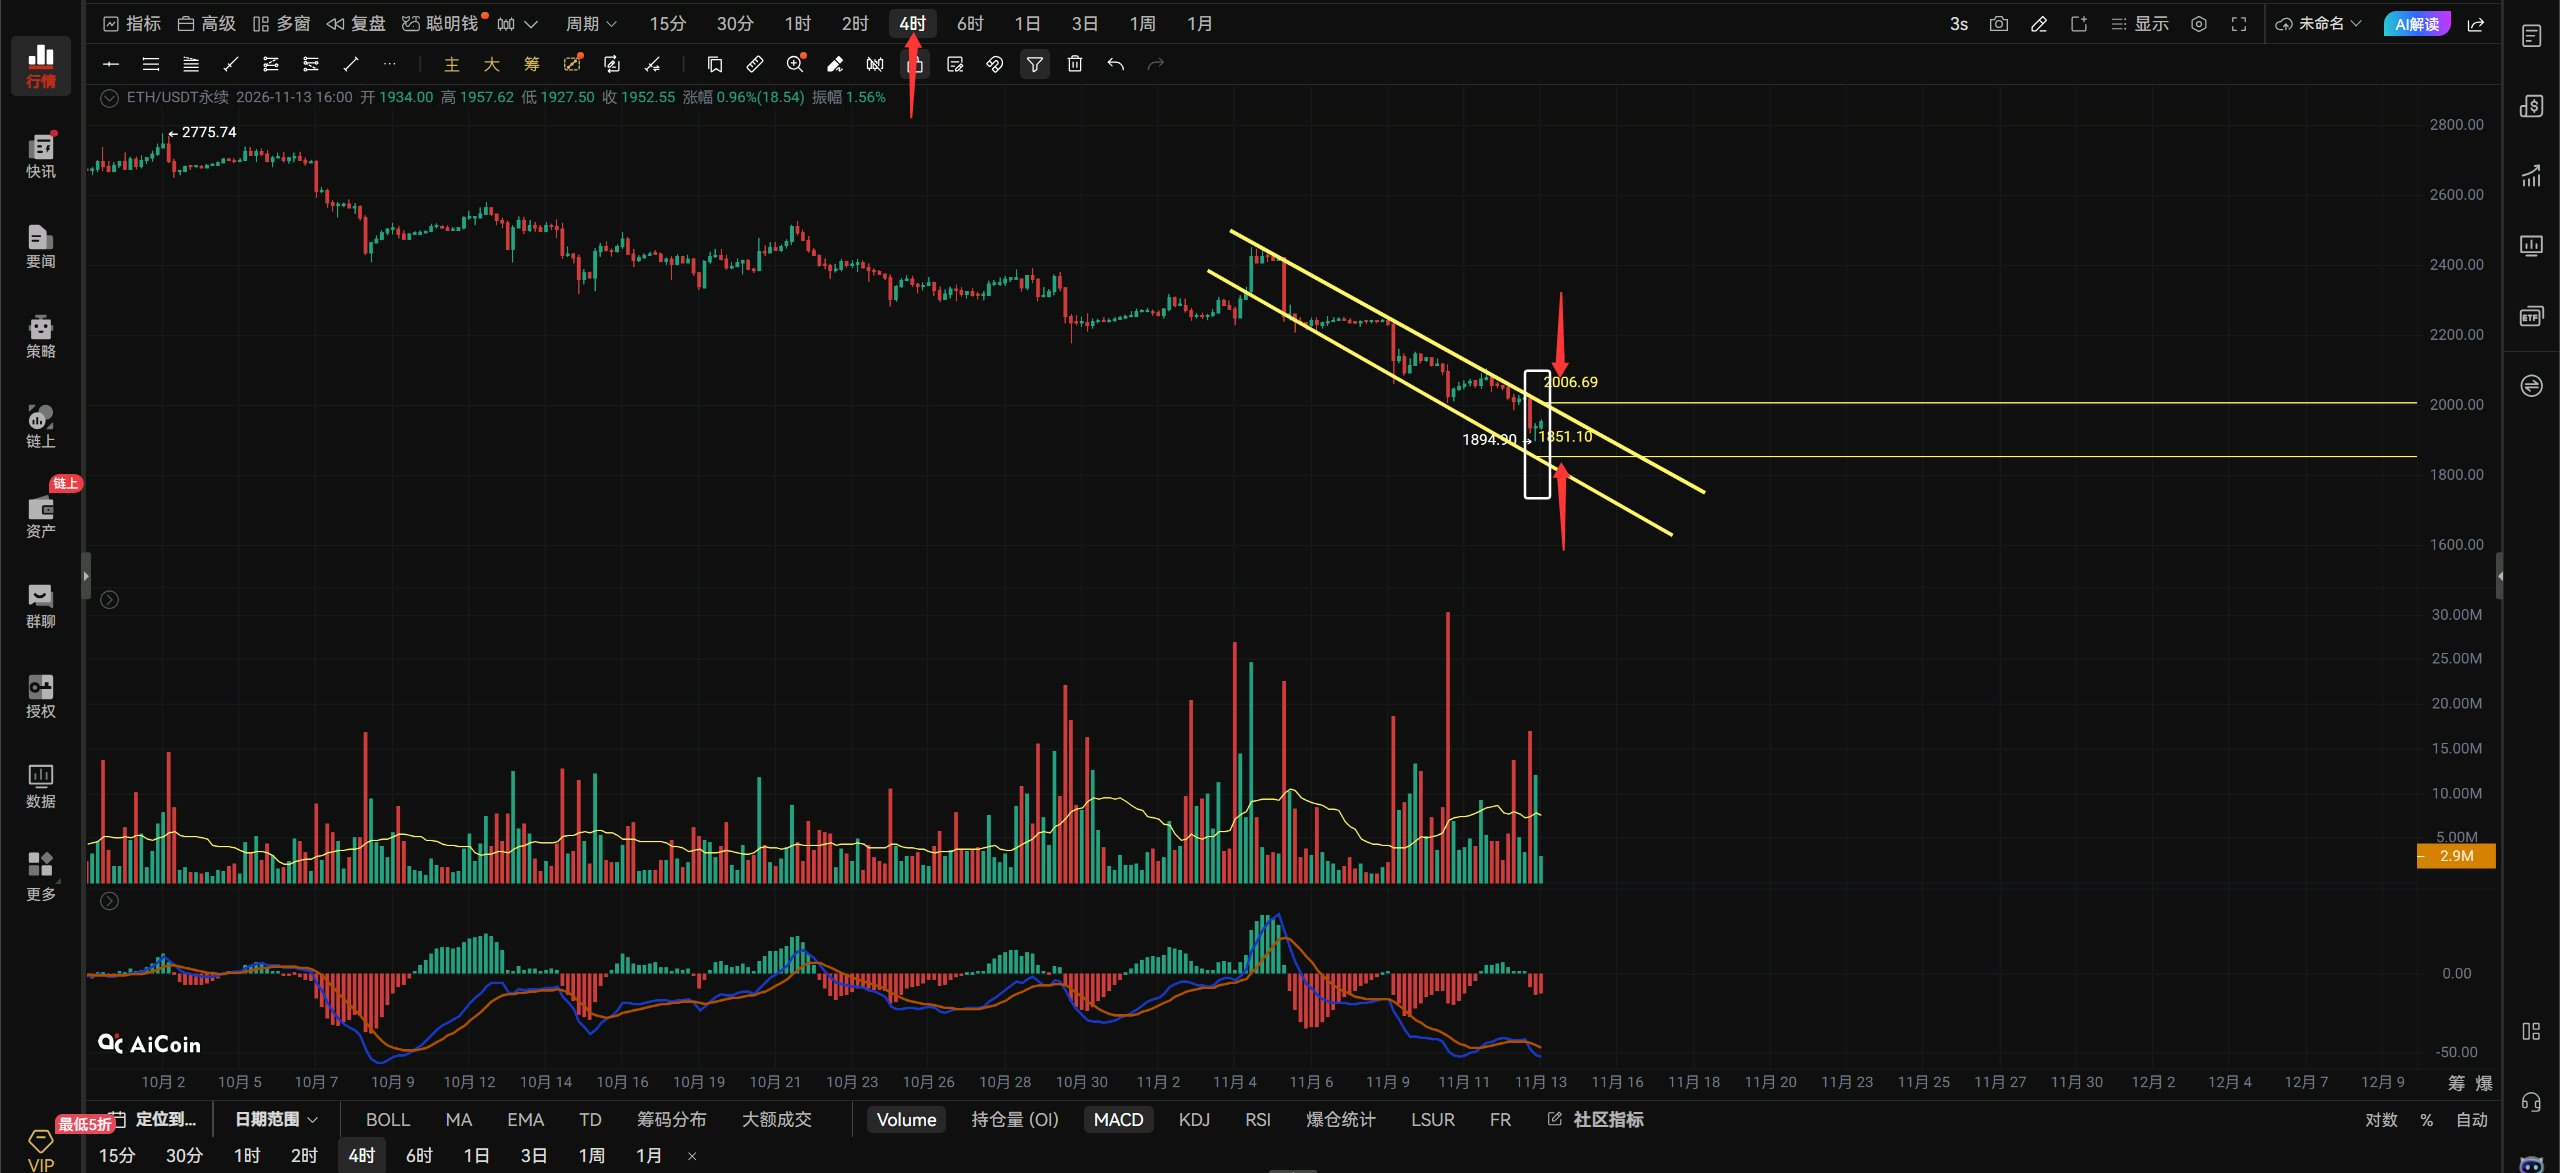
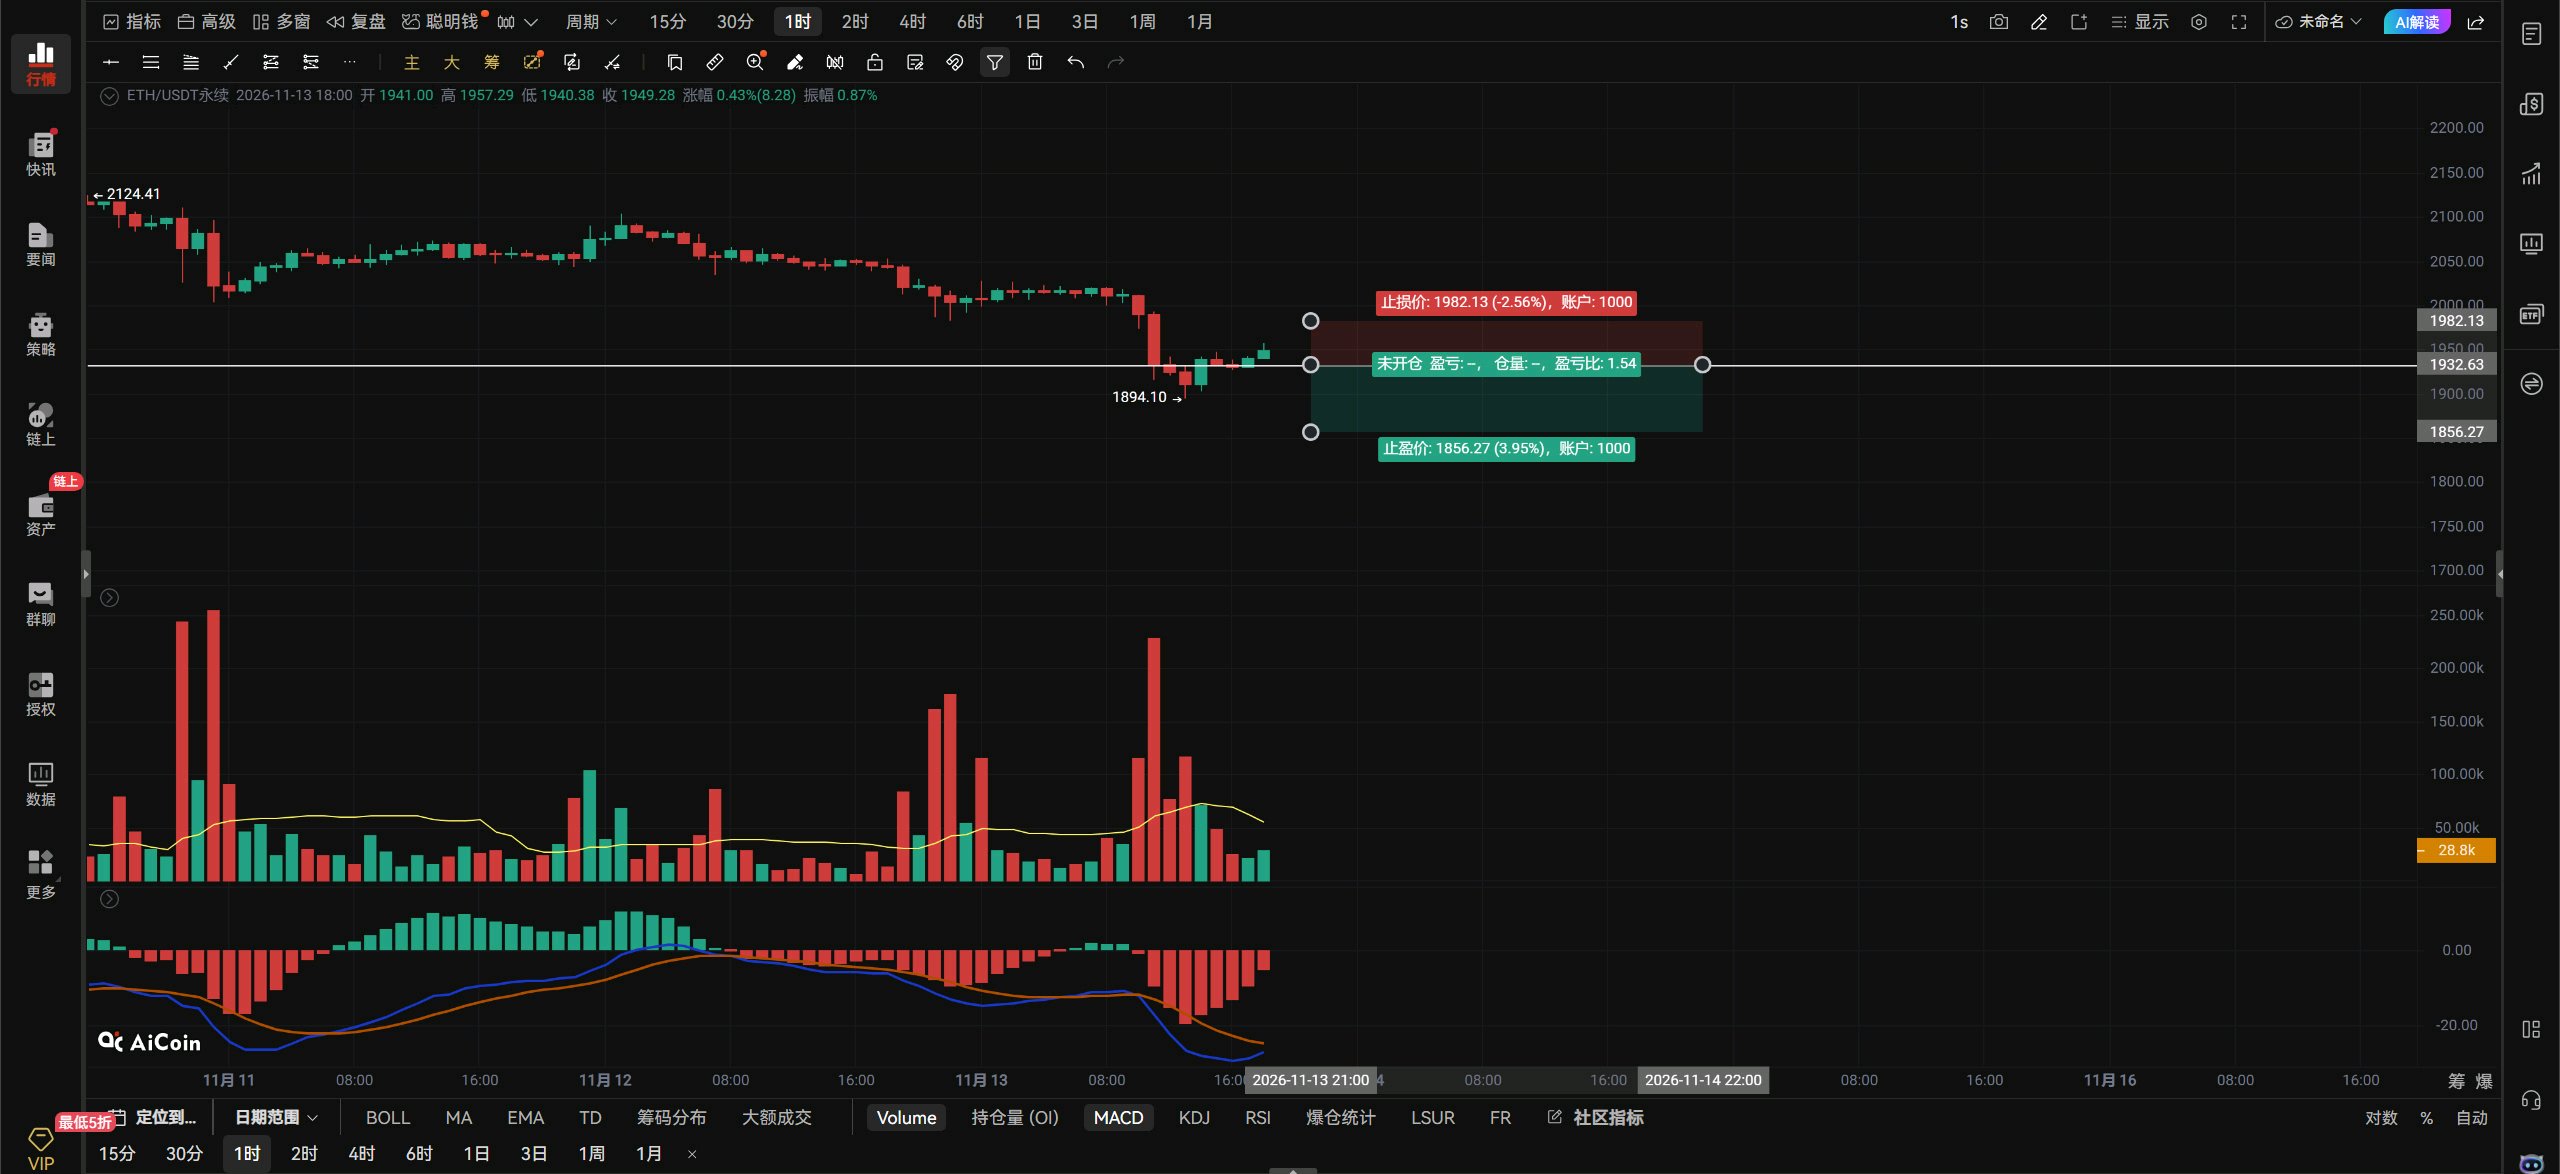
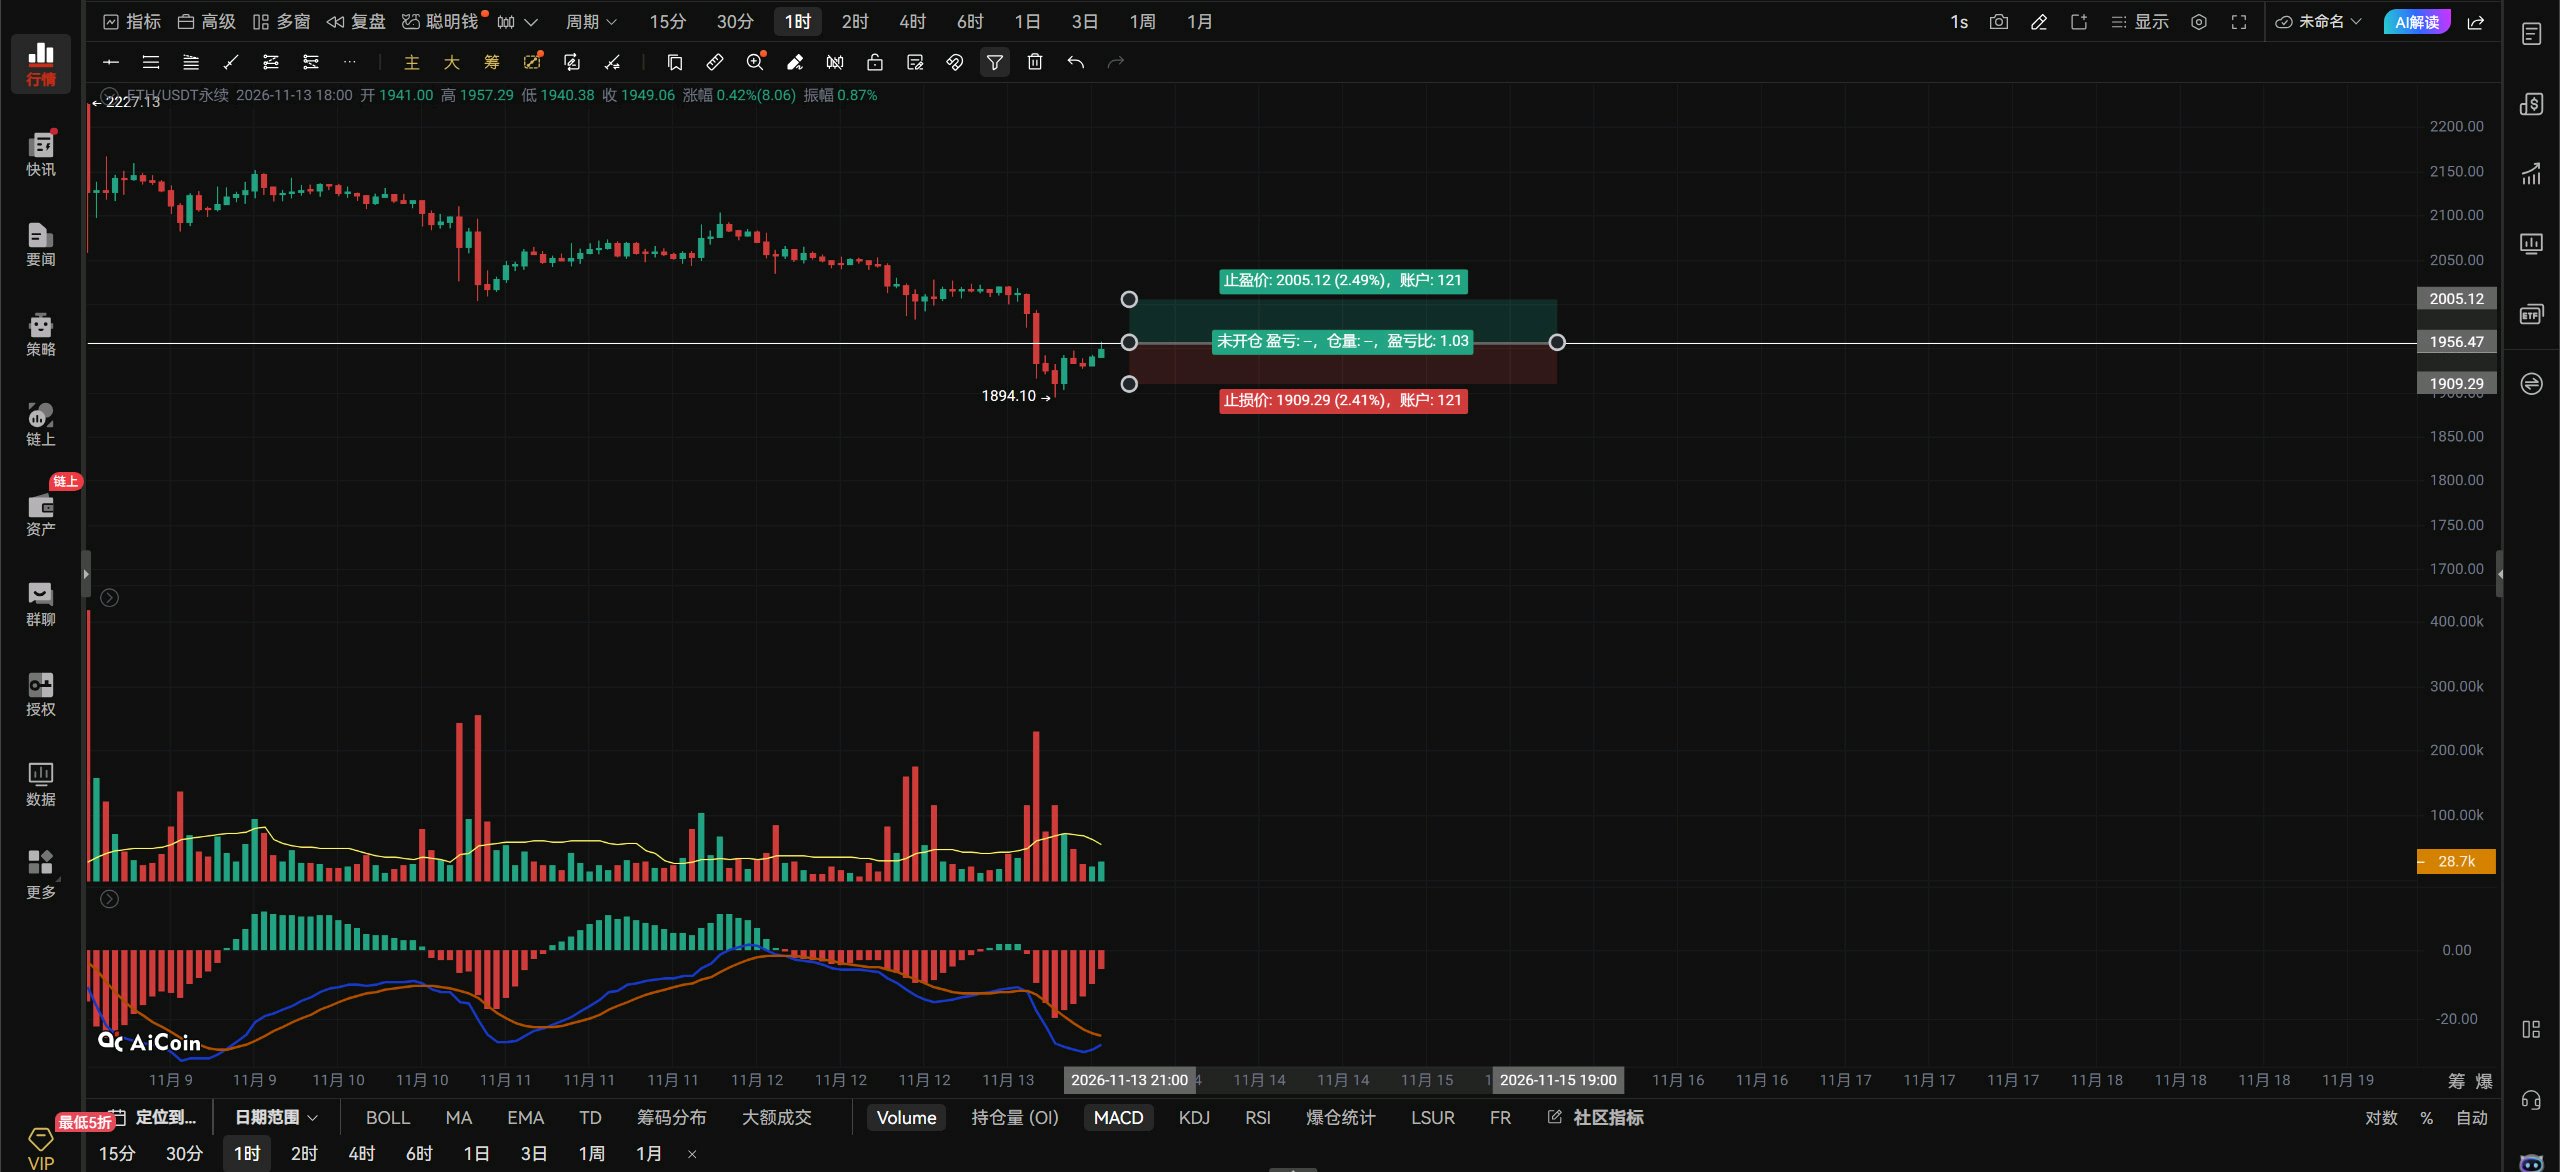
ETHUSDT Perspectives pour la soirée : 13/11. La deuxième crêpe a cassé sous les 2000, et après avoir franchi les 2000, il n'y a eu aucun rebond. On voit bien à quel point ce marché est faible ; les haussiers sont complètement écrasés. À l'heure actuelle, la deuxième crêpe ne pourra stopper sa chute et amorcer une remontée que si elle brise la résistance à 1955. Ce n'est qu'après avoir repassé les 2000 en données horaires qu'une tendance haussière s'ouvrira. Si elle ne parvient pas à casser les 1955, elle restera coincée dans la fourchette de consolidation 1955-1910. Si elle échoue à franchir les 1955 et teste à nouveau le plus bas précédent, il est fort probable qu'il soit enfoncé et qu'elle atteigne un nouveau plus bas à 1861. En regardant la position marquée par la case blanche, bien que la deuxième crêpe ait légèrement rebondi, tout comme la première, il ne s'agit que d'un rebond à faible volume. Un rebond à faible volume, c'est comme une voiture à qui il ne reste qu'une goutte d'essence : jusqu'où peut-elle aller ? Pour la deuxième crêpe, gardez juste en tête le niveau des 2000. Ce n'est qu'une fois ce niveau franchi que la hausse pourra se poursuivre sereinement. Si elle ne parvient pas à casser les 2000, elle peut retester le plus bas précédent à tout moment, et finira même par passer en dessous. Pour la deuxième crêpe, passez à l'achat (long) du côté droit après une cassure des 1955 avec du volume ; passez à la vente (short) du côté droit après une cassure sous les 1932 avec du volume. Surveillez les variations de volume et définissez vos stop loss. Pour la deuxième crêpe en données horaires, si elle se maintient au-dessus de 1955, on vise les 2000-2046. En données 4 heures, si elle passe sous les 1932, on vise les 1894-1861. La deuxième crêpe en 4 heures suit actuellement un canal baissier. Pour stopper la chute en 4 heures, elle doit casser la borne supérieure du canal à 2000. Ce n'est qu'en cassant les 2000 en 4 heures qu'elle pourra arrêter de chuter et rebondir. Si elle ne parvient pas à franchir les 2000, alors surveillez la borne inférieure du canal 4 heures à 1851 pour voir si elle peut stopper la baisse ! Une fois que le niveau 4 heures aura cassé le canal à 2000, la position marquée par la case blanche en 4 heures formera une figure d'étoile du matin. Donc, seul un franchissement des 2000 en 4 heures permettra à la deuxième crêpe de stopper sa chute et de rebondir. Si elle ne peut pas casser les 2000, le niveau 4 heures continuera d'évoluer au sein du canal de prix et de consolider. Je ne sais pas si l'ouverture du marché boursier américain accentuera la baisse ; si ça continue de chuter, ne jouez plus. Séance levée. ByXIMPACT
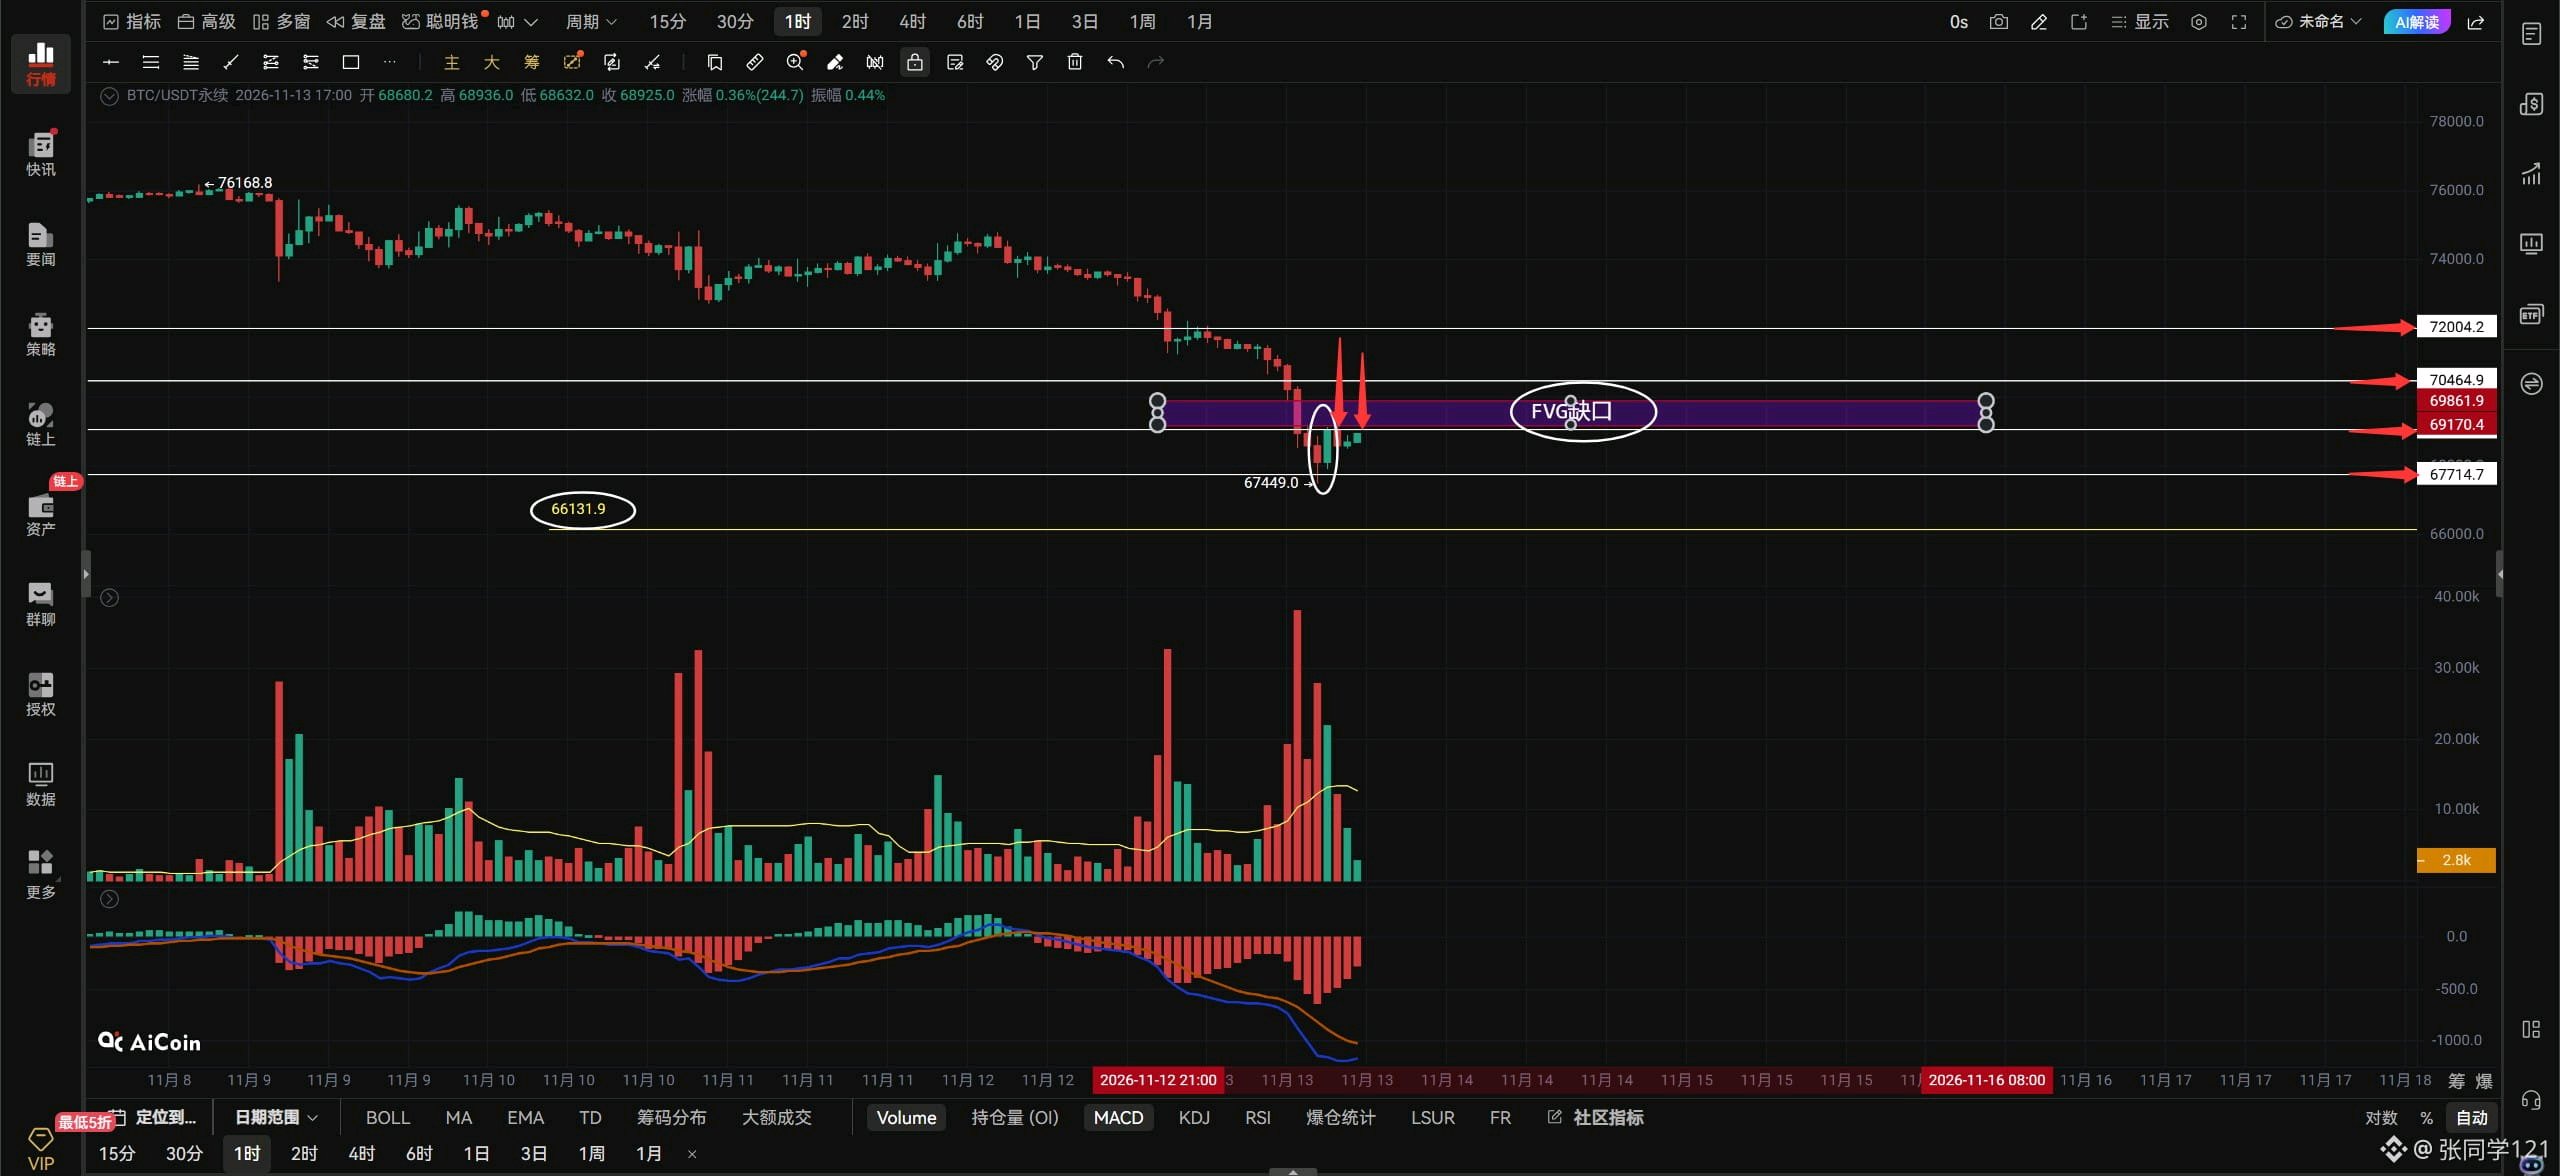
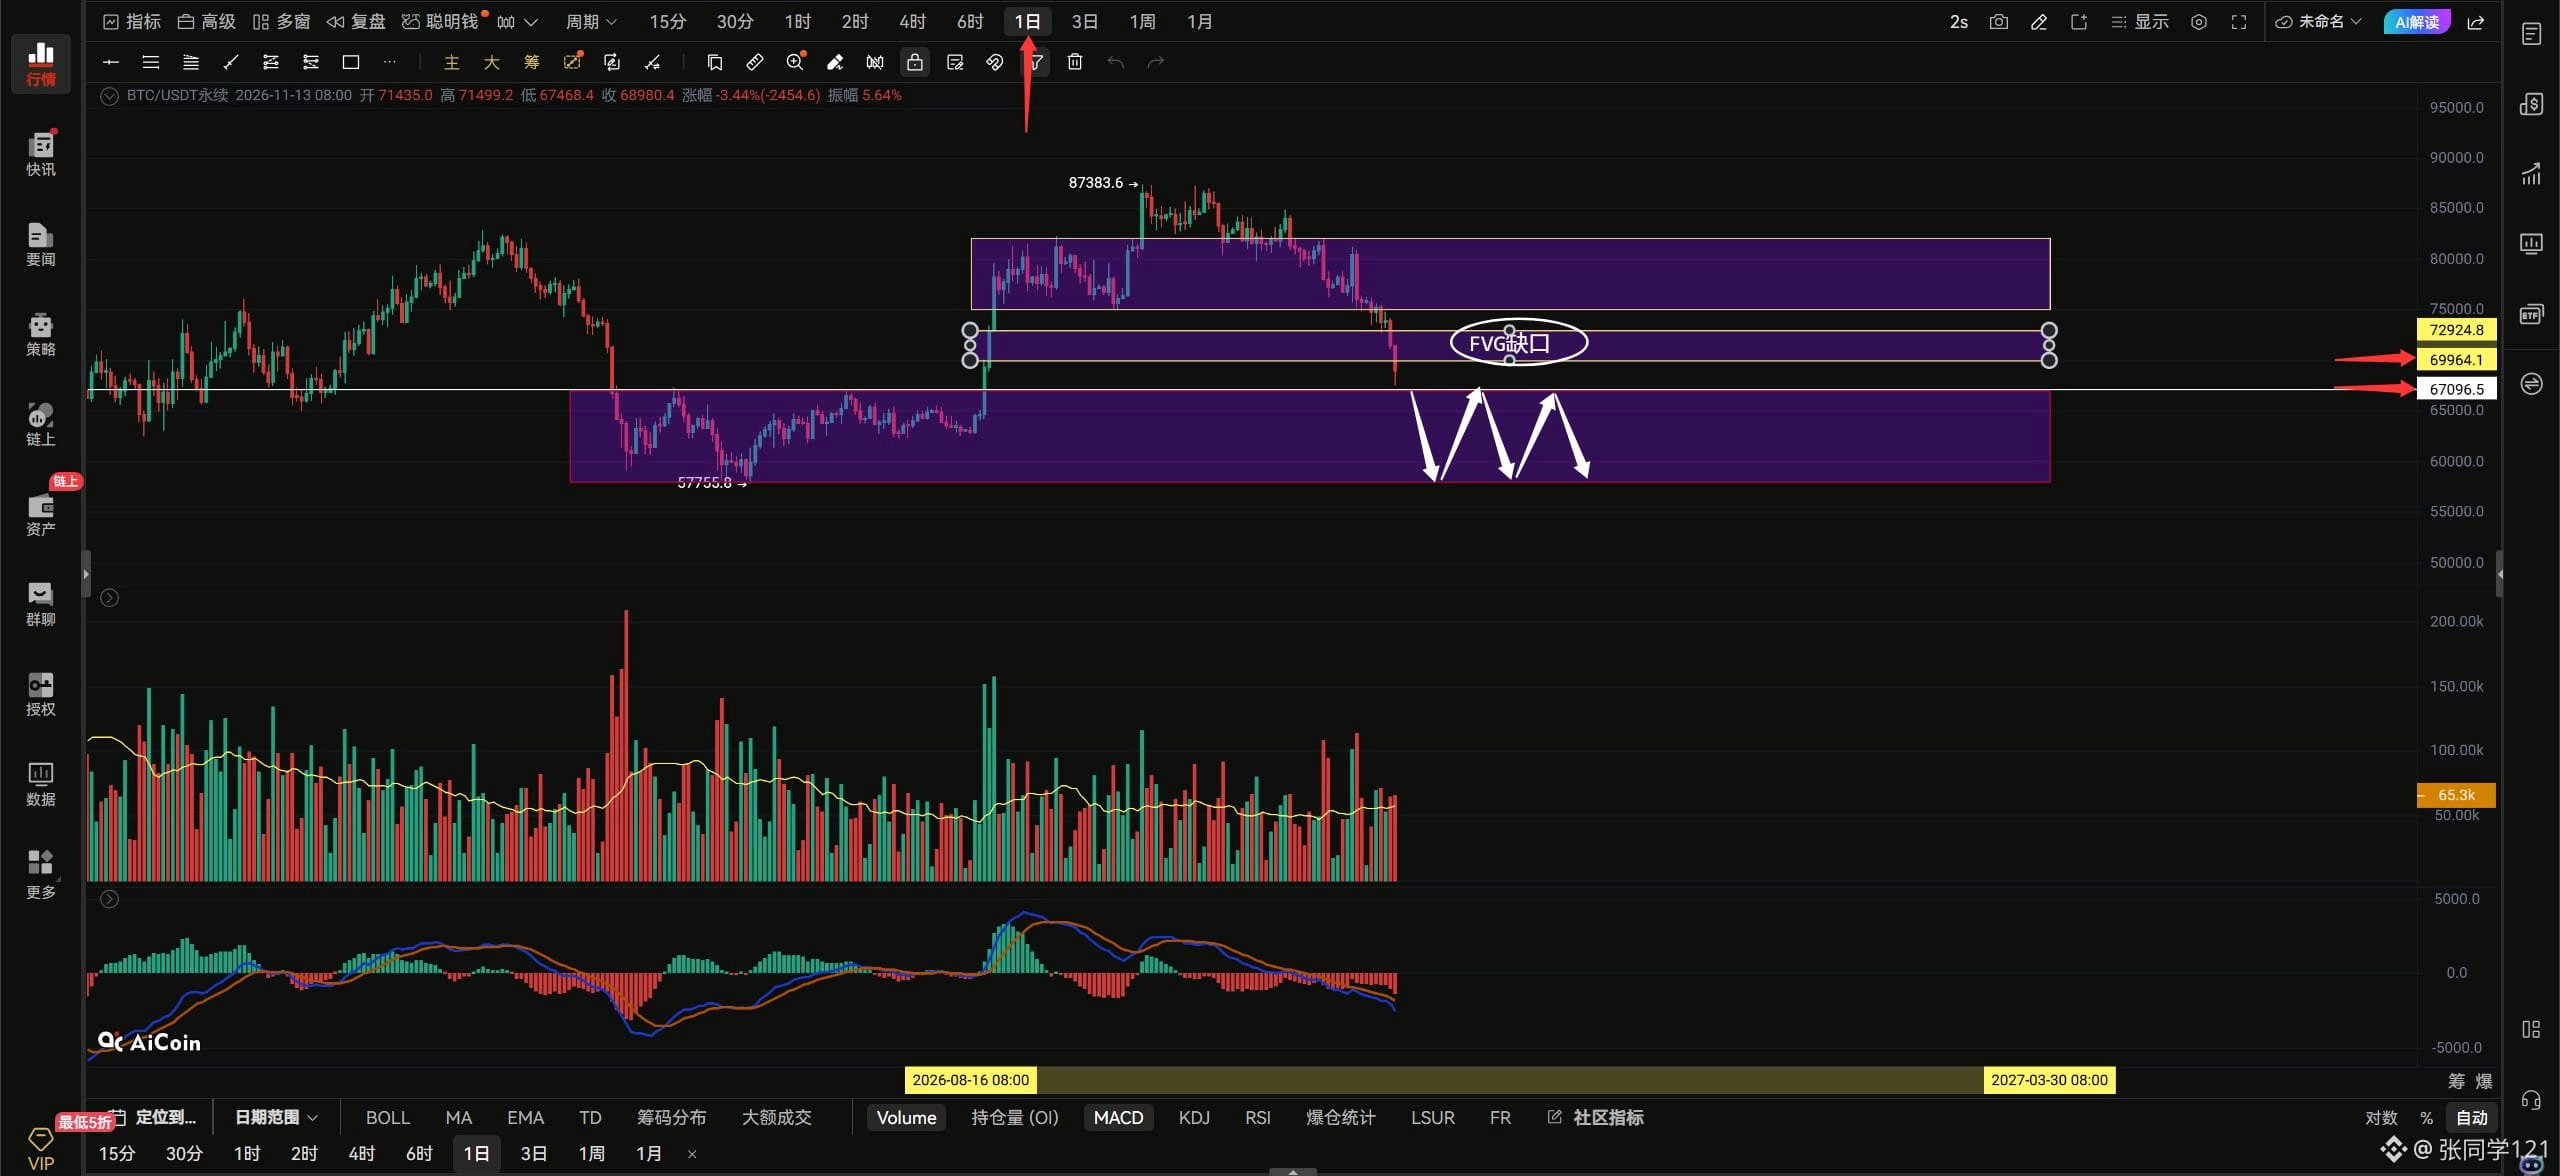
$BTCUSDT $BTC Perspectives du soir : 13/11. La dernière chute du Bitcoin a laissé tout le monde abasourdi et confus, n'est-ce pas ? Vous vous sentez perdus ? Vous avez tous peur d'acheter (go long) maintenant ? Ne perdez pas vos moyens. Continuez simplement à acheter du spot par paliers — tant que vous croyez qu'il n'ira pas à zéro, continuez d'acheter. Le Bitcoin a-t-il touché le fond ? La zone marquée par l'encadré blanc ci-dessous a montré son premier signal de retournement : une figure haussière enveloppante (bullish engulfing), ce qui suggère un rebond potentiel sur l'unité de temps actuelle. Comme le montrent les flèches rouges ci-dessus, il a déjà rebondi deux fois mais a échoué à franchir la résistance des 69 000 $. Cela signifie que le rebond manque de force et que les gros acheteurs (bulls) ne sont pas encore pleinement entrés en jeu. Donc, ce rebond peut être compris comme une correction naturelle causée par la prise de bénéfices des vendeurs à découvert (shorts), plutôt qu'un rallye porté par l'entrée sur le marché d'acteurs haussiers majeurs. Ne vous précipitez pas simplement parce que vous voyez une figure haussière enveloppante. Vérifiez si le prix peut franchir la résistance ci-dessus. S'il n'arrive pas à casser les 69 000 $ et à s'y maintenir, attention à un second retest du précédent plus bas à 64 779 $. Le Bitcoin doit dépasser les 69 000 $ avant qu'on puisse dire que la tendance baissière horaire s'est temporairement arrêtée, créant une chance de rebond vers 70 464 $. S'il n'arrive pas à franchir les 69 000 $, alors simplement maintenir une fourchette latérale entre 67 449 $ et 69 000 $ sans continuer à chuter serait déjà un bon résultat. Cette chute a été si brutale qu'un autre FVG gap est apparu sur le graphique horaire. Si le Bitcoin peut repasser au-dessus des 69 000 $, il devra combler le FVG gap au-dessus, autour de 69 170–69 861 $. Le Bitcoin rebondit maintenant, mais le volume en dessous est honnêtement décevant — c'est un rebond à faible volume. Souvenez-vous juste : si le Bitcoin ne peut pas casser les 69 000 $, il n'a pas du tout touché le fond et ne peut pas rebondir. Je pense que le Bitcoin a encore une baisse à faire, bien qu'il soit difficile de savoir jusqu'où ce dernier creux ira — peut-être 66 000 $ ou 65 000 $. On verra bien. Mon avis personnel est que le Bitcoin a chuté autant qu'il le pouvait ; même s'il continue de baisser, il ne tombera probablement pas beaucoup plus bas — 2 000 points au maximum. Alors n'ayez pas peur. Si le signal apparaît, je passerai toujours à l'achat (long). Si vous voulez acheter du Bitcoin, attendez qu'il reteste le précédent plus bas et montre un autre signal de retournement avant d'entrer. Si le Bitcoin casse les 69 000 $ avec un fort volume, les traders agressifs peuvent se positionner à l'achat. S'il casse en dessous des 68 541 $ avec un fort volume et ne parvient pas à les récupérer après un rebond, suivez le mouvement à la baisse (short). Utilisez un stop loss. Si le Bitcoin casse à la hausse et tient les 69 000 $ sur l'unité de temps horaire, visez 70 464 $–72 000 $. S'il n'arrive pas à dépasser les 69 000 $, ce n'est pas bon. S'il casse en dessous des 67 714 $ sur l'unité de temps 4 heures, regardez vers le bas, vers 66 131 $–64 753 $. Le FVG gap sur le graphique journalier du Bitcoin a également été entièrement comblé. Tout cela est allé beaucoup trop loin 😓. Ensuite, nous verrons si le Bitcoin peut repasser au-dessus du FVG gap sur le graphique journalier et trader à nouveau à l'intérieur. Le niveau de prix correspondant au retour dans le FVG gap est de 70 000 $ ; ce n'est qu'alors que le graphique journalier du Bitcoin pourra trouver un fond. D'un autre côté, si le Bitcoin continue de chuter sur le graphique journalier et casse sous le support des 67 000 $, il retournera dans la fourchette de consolidation 67 000 $–58 000 $. Honnêtement, je ne sais pas où il pourrait trouver un fond — si je vous le disais maintenant, ce ne serait qu'une supposition. Mieux vaut attendre et voir où va le Bitcoin. Réunion terminée. ByXIMPACT
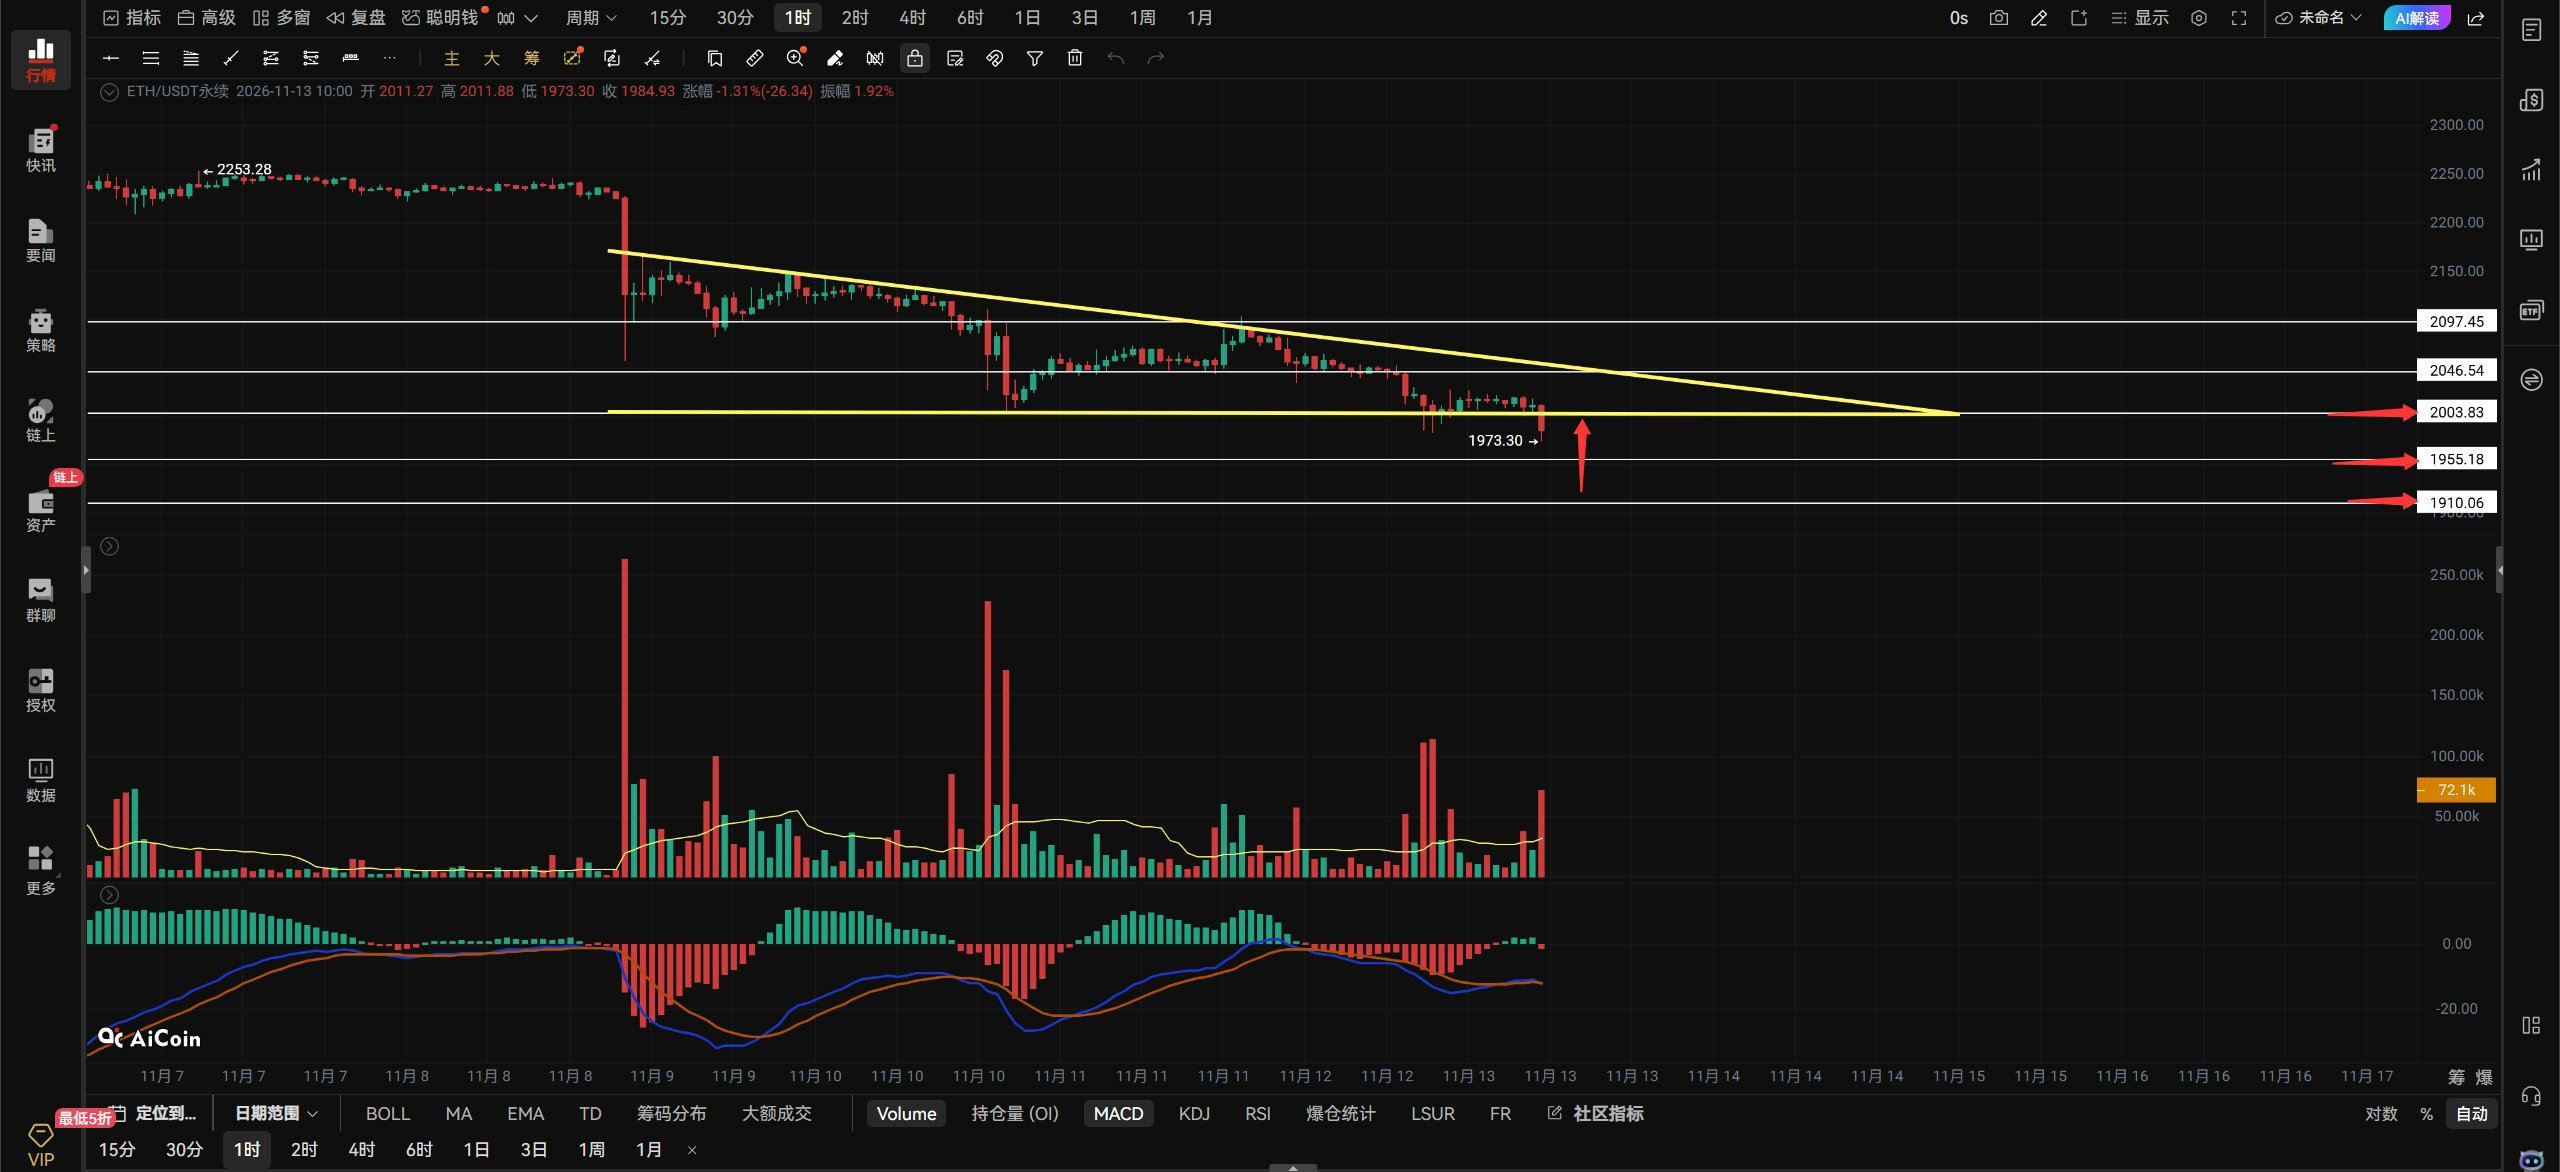
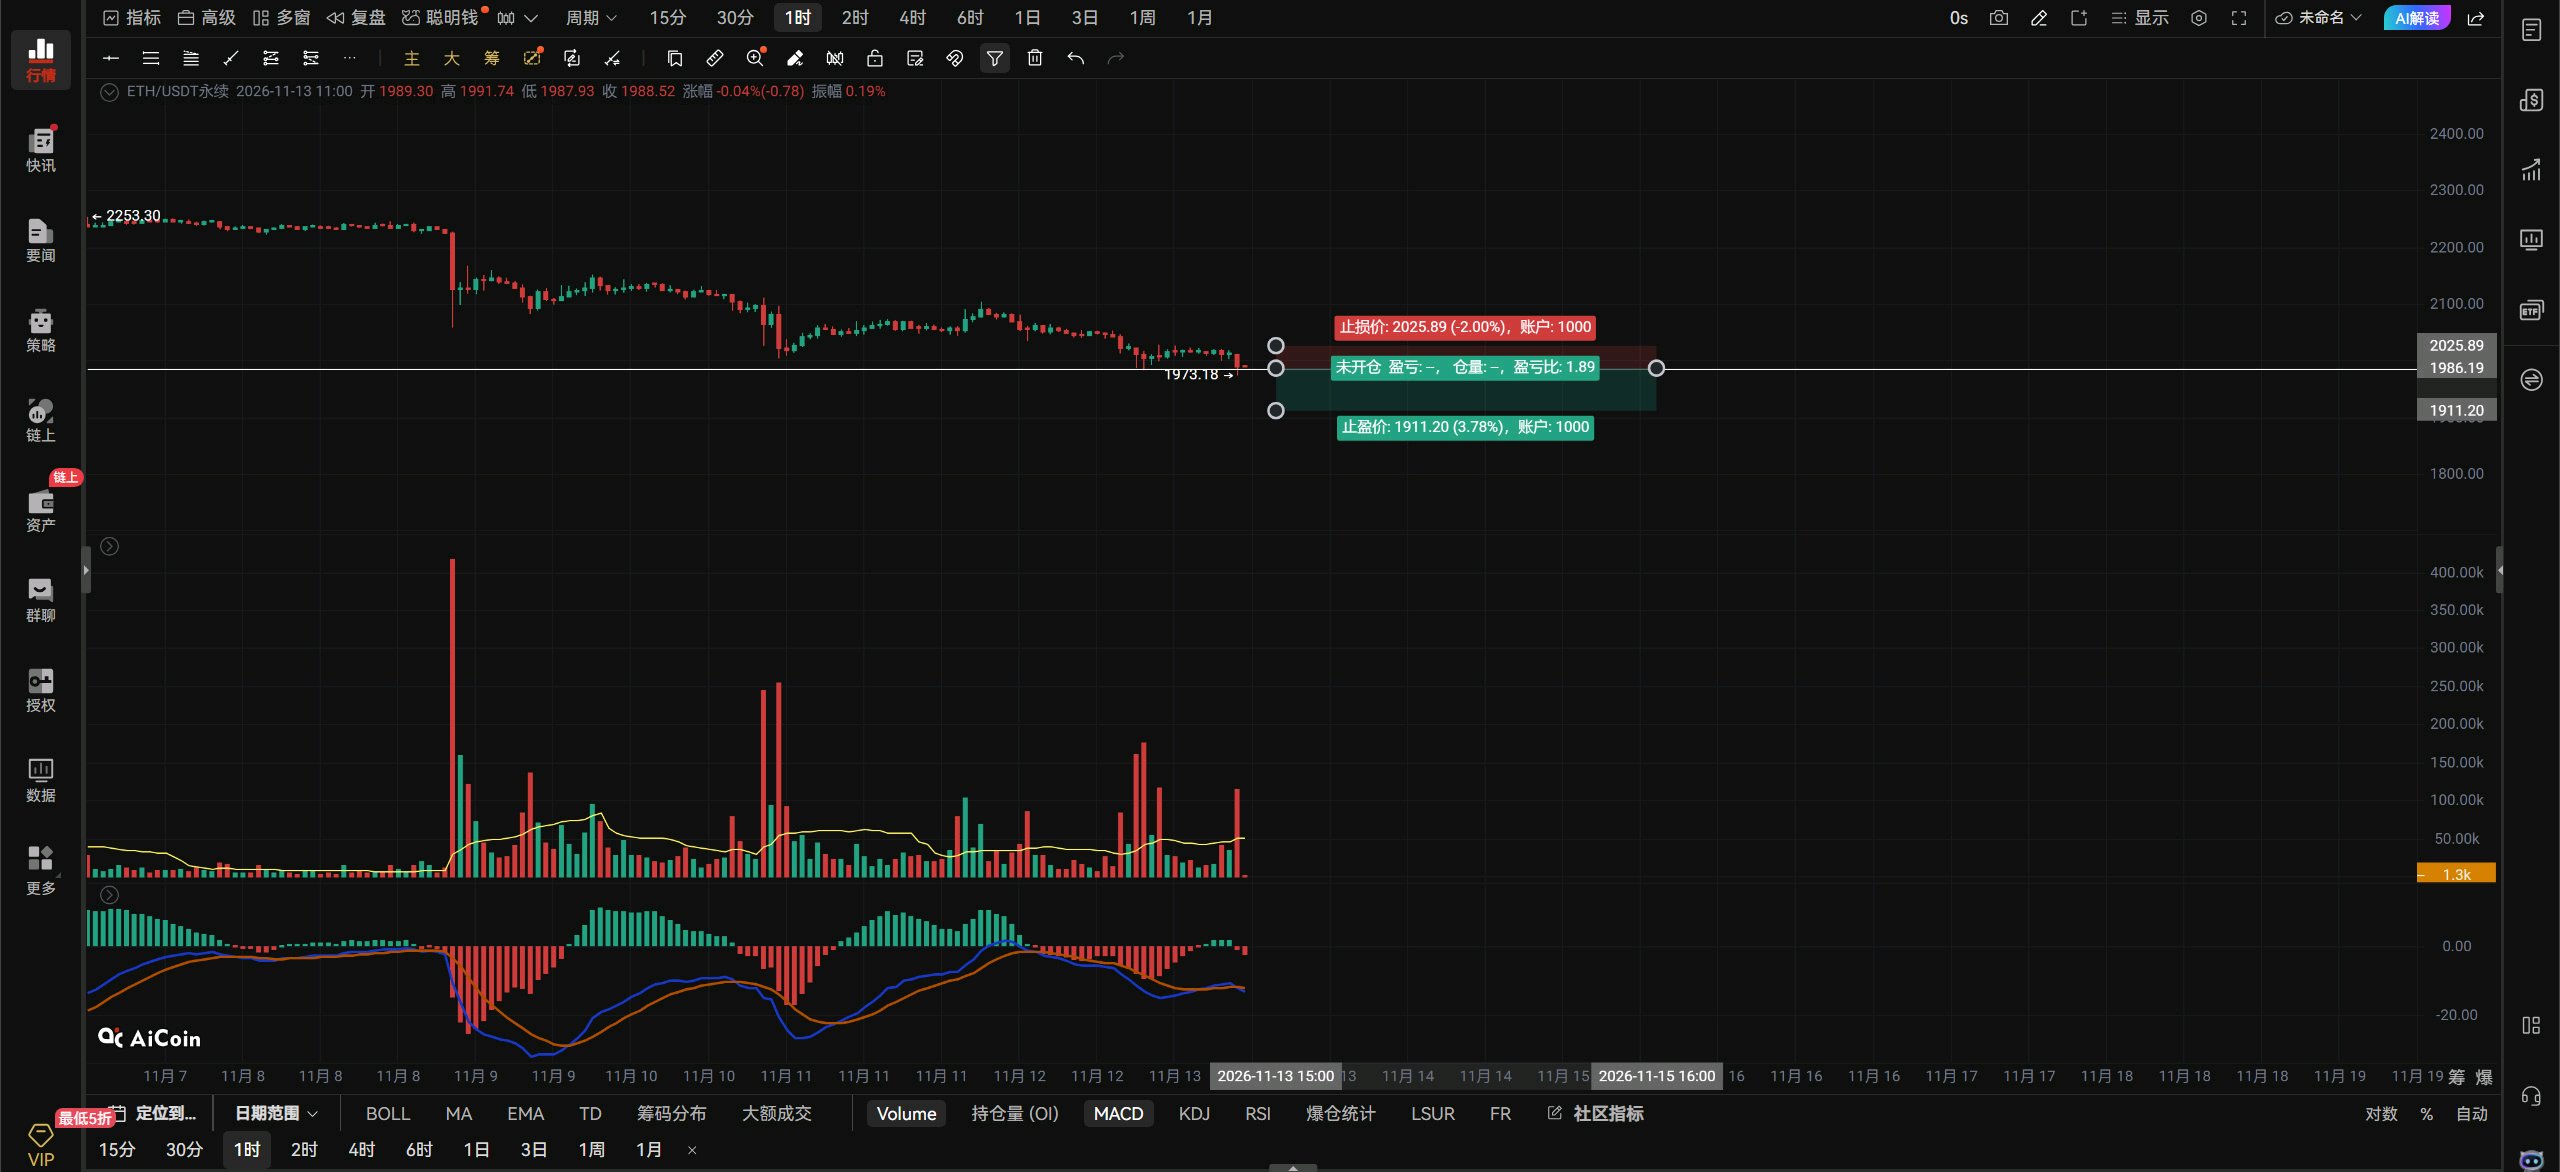
$ETHUSDT $ETH outlook: A high-volume break above 2021: chase the breakout long and use a stop-loss. A high-volume break below 1984: chase the breakdown short and use a stop-loss. If a retest of 1956 confirms support is holding, add one lot to the long position; stop out if it breaks below 1910. If ETH holds above 2021 on the hourly timeframe, look for 2046–2097. Watch for a one-lot short entry around 2046; stop out if it breaks above 2097. Left-side wick order: long at 1900; stop out if it breaks below 1872. Resistance above: 2021–2046–2097 Support below: 1984–1956–1910 On the 4-hour timeframe, a break below 1984 points down to 1956–1910. ETH is currently below the 2000 support. Wait for this hourly candle to close: if it can reclaim 2000, no big deal; if not, look for 1955–1910 next! ETH needs to reclaim 2000 to stop falling. If it can’t, ETH is basically done. That’s all.#ByXIMPACT
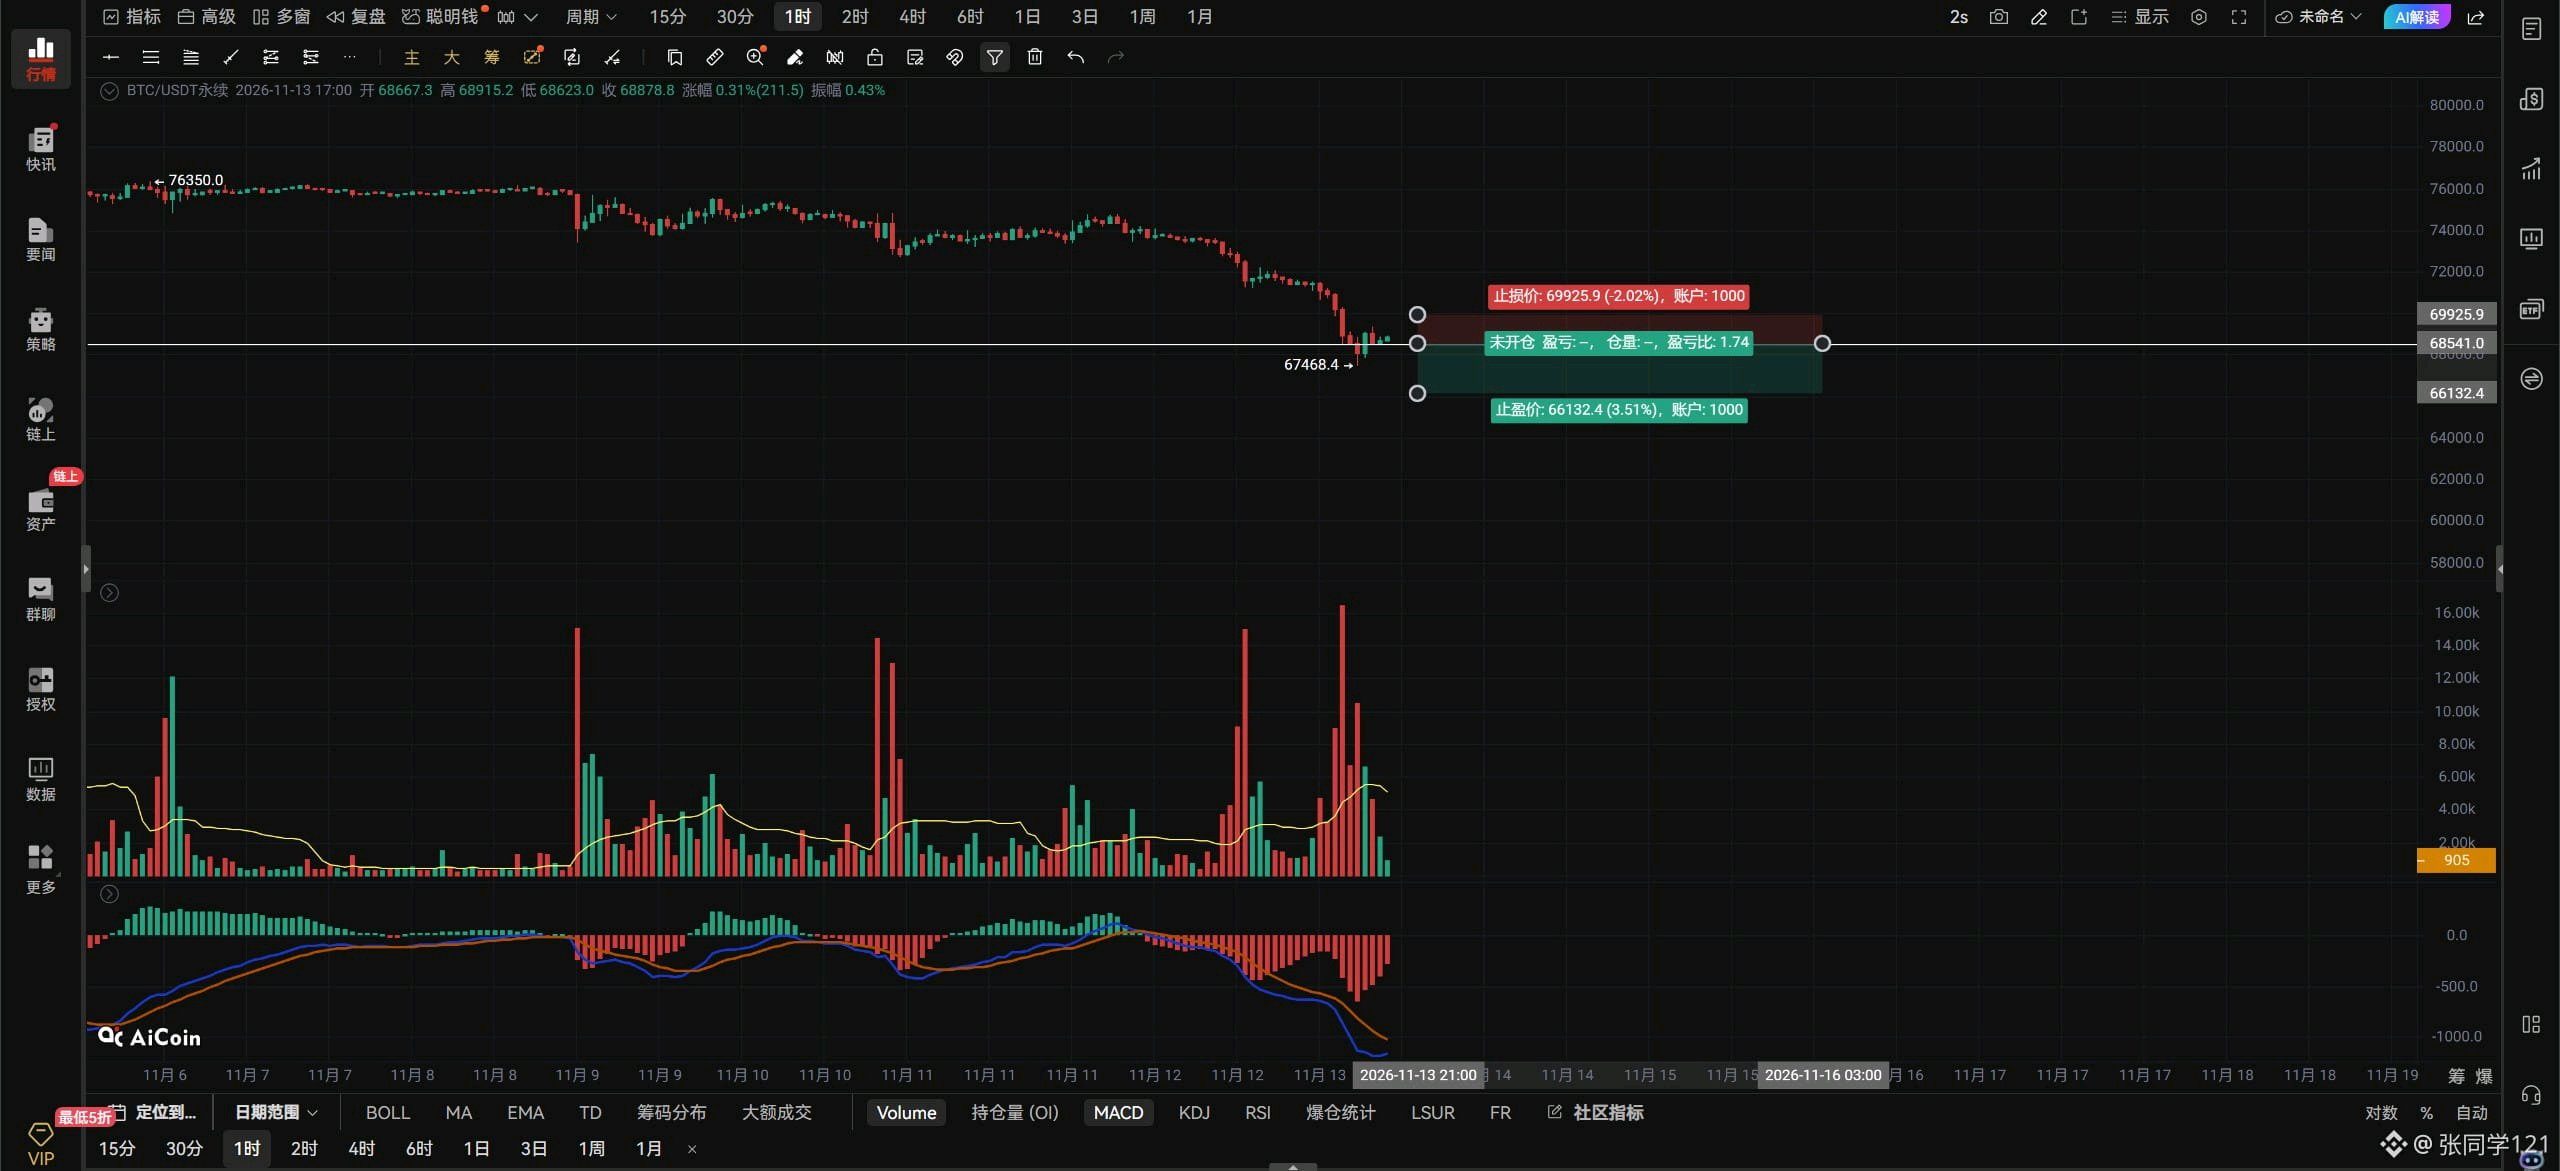
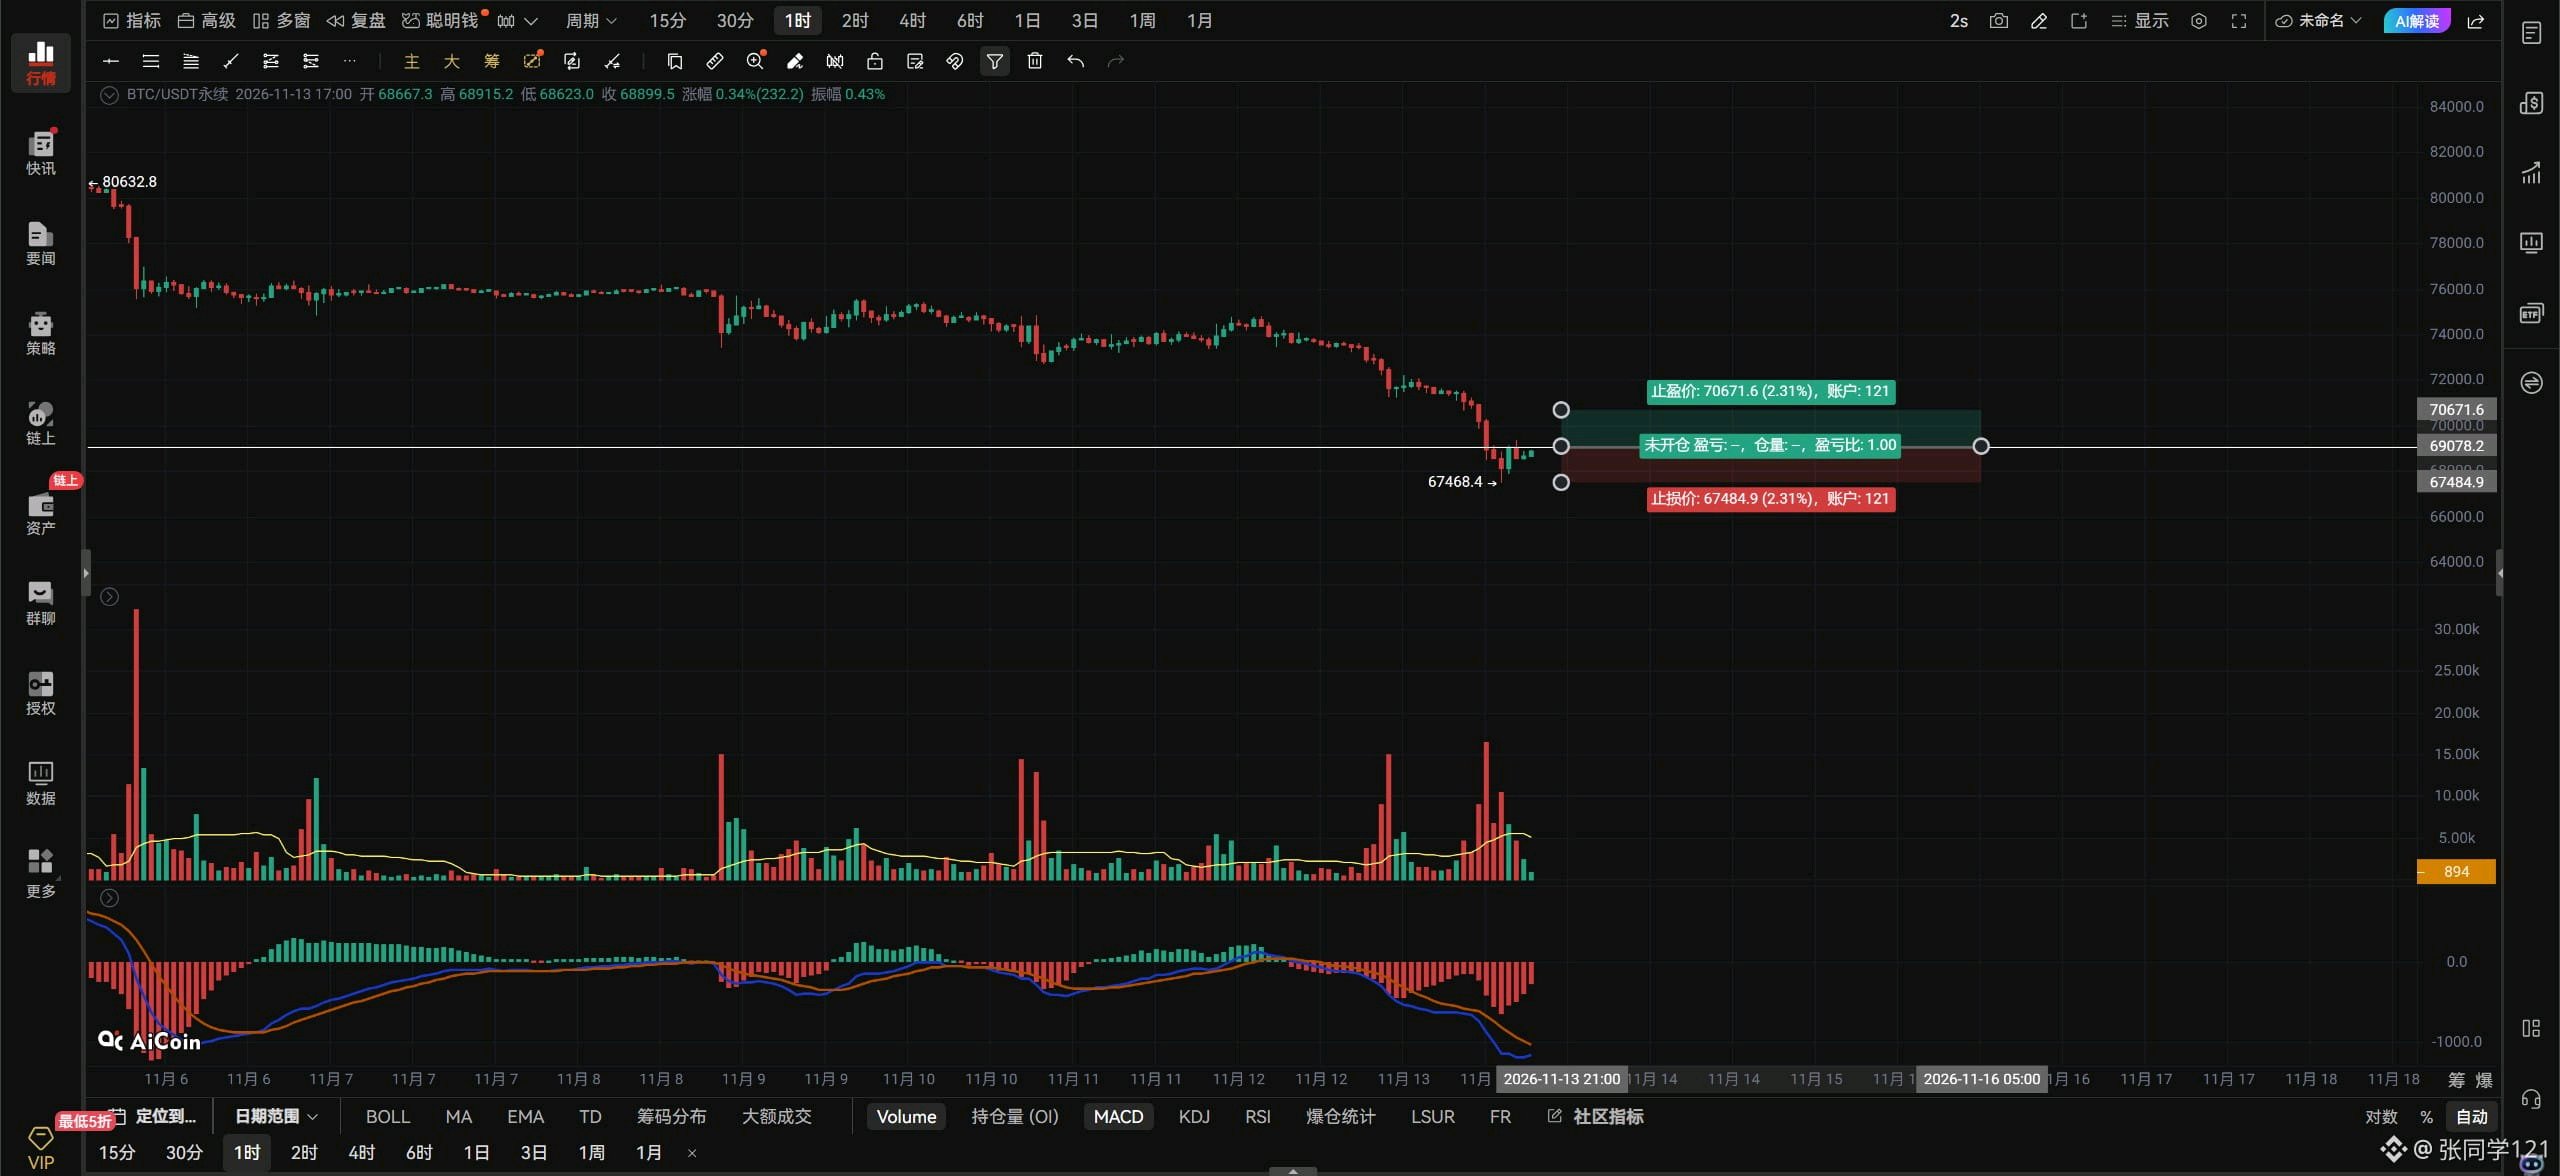
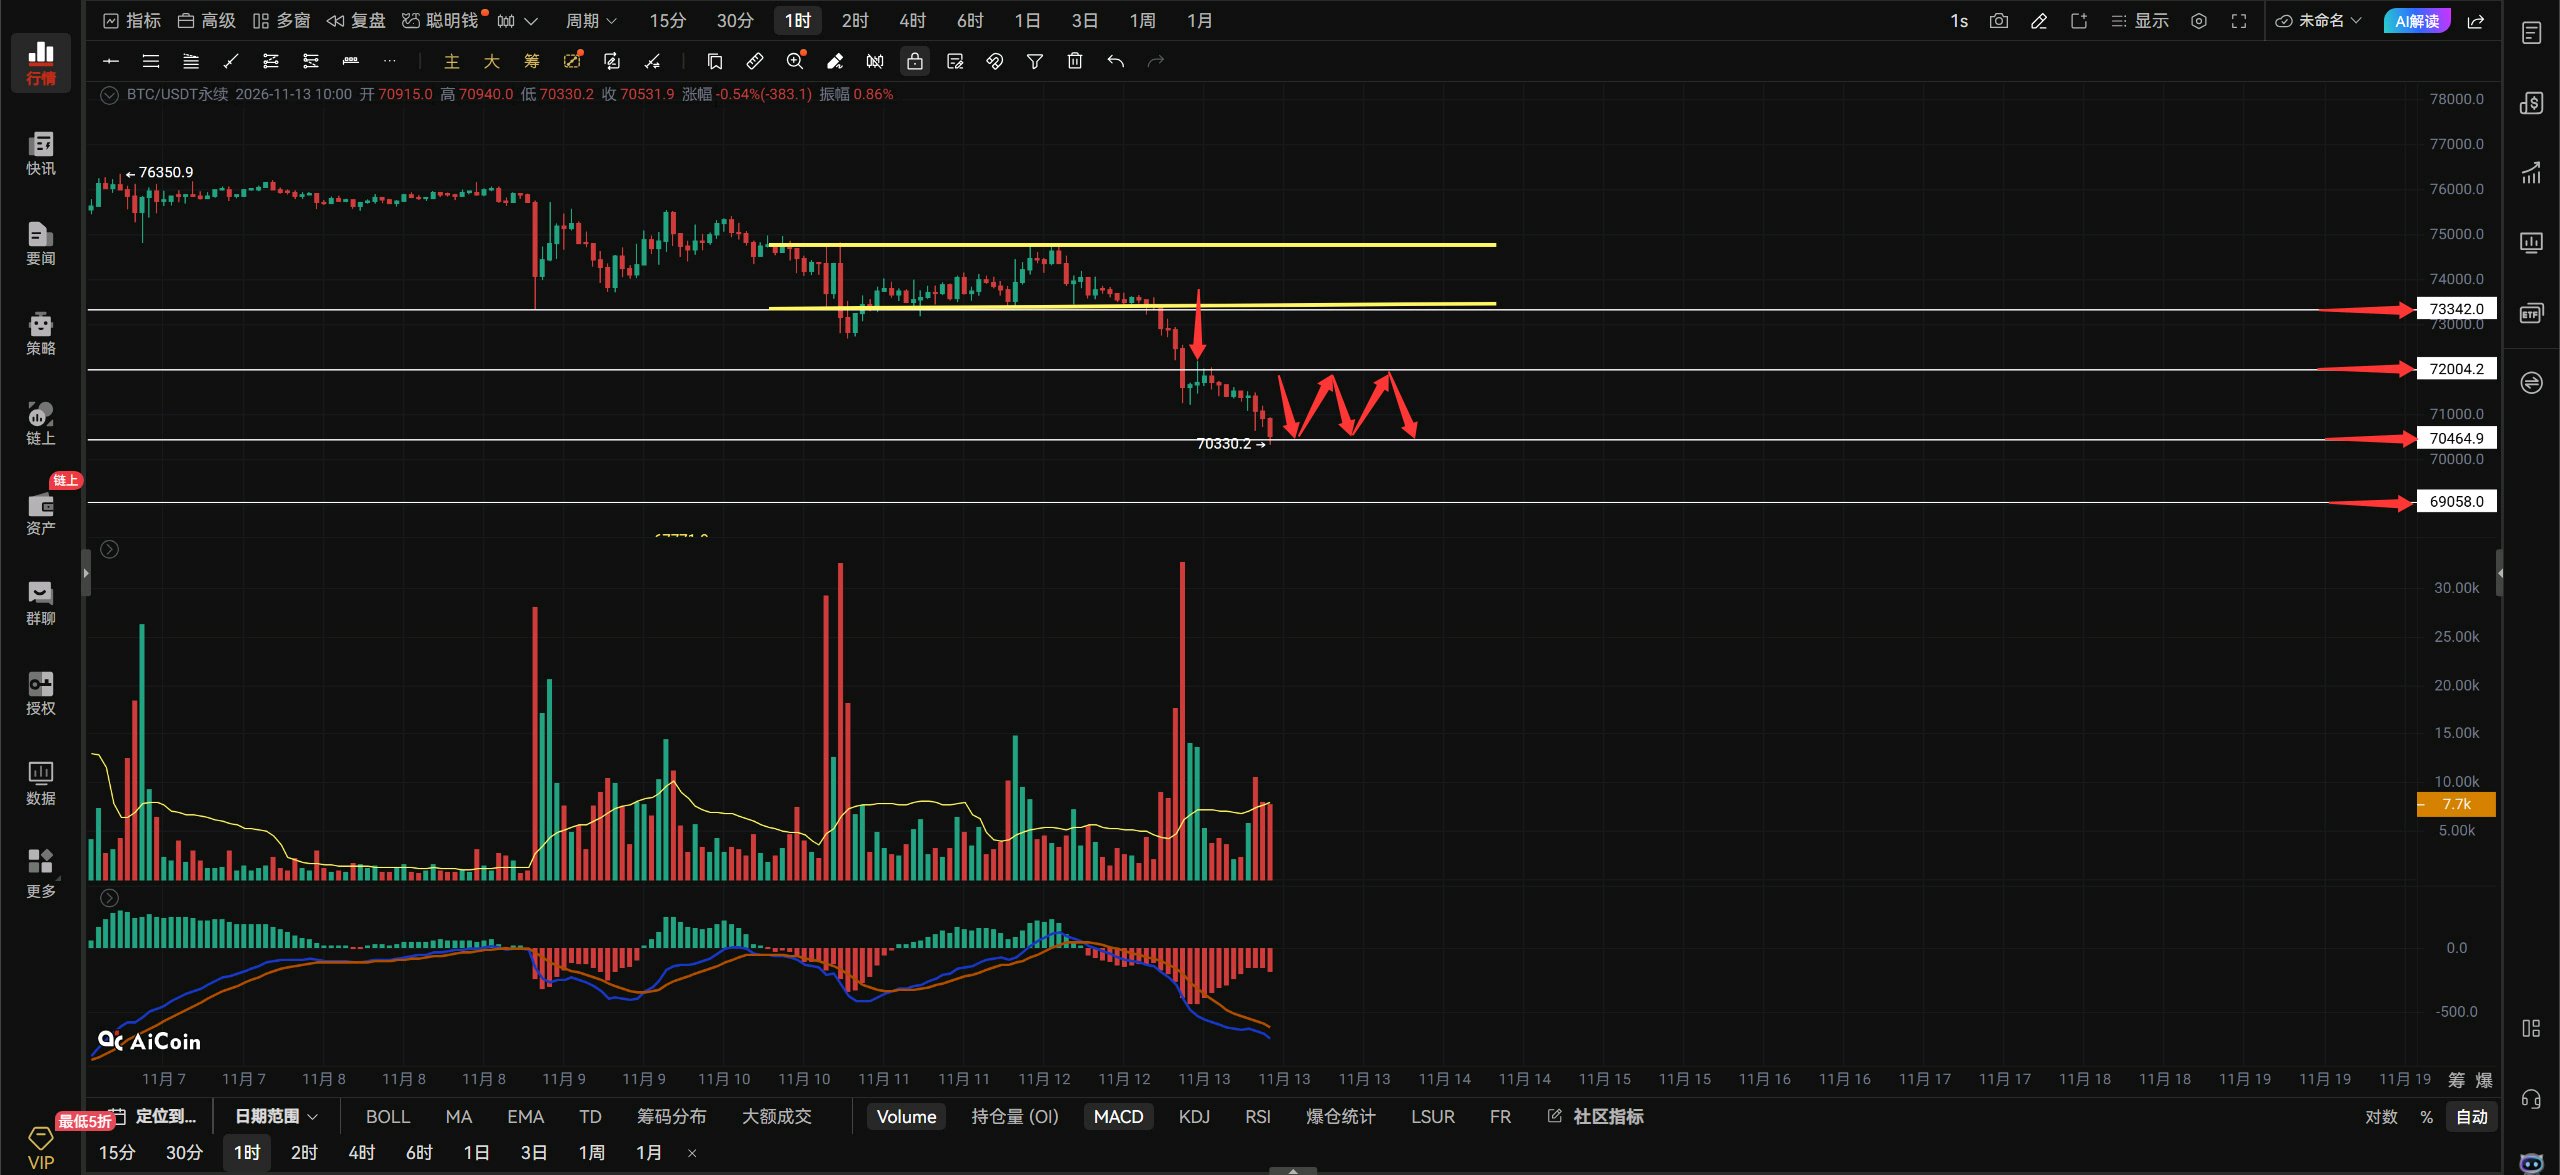
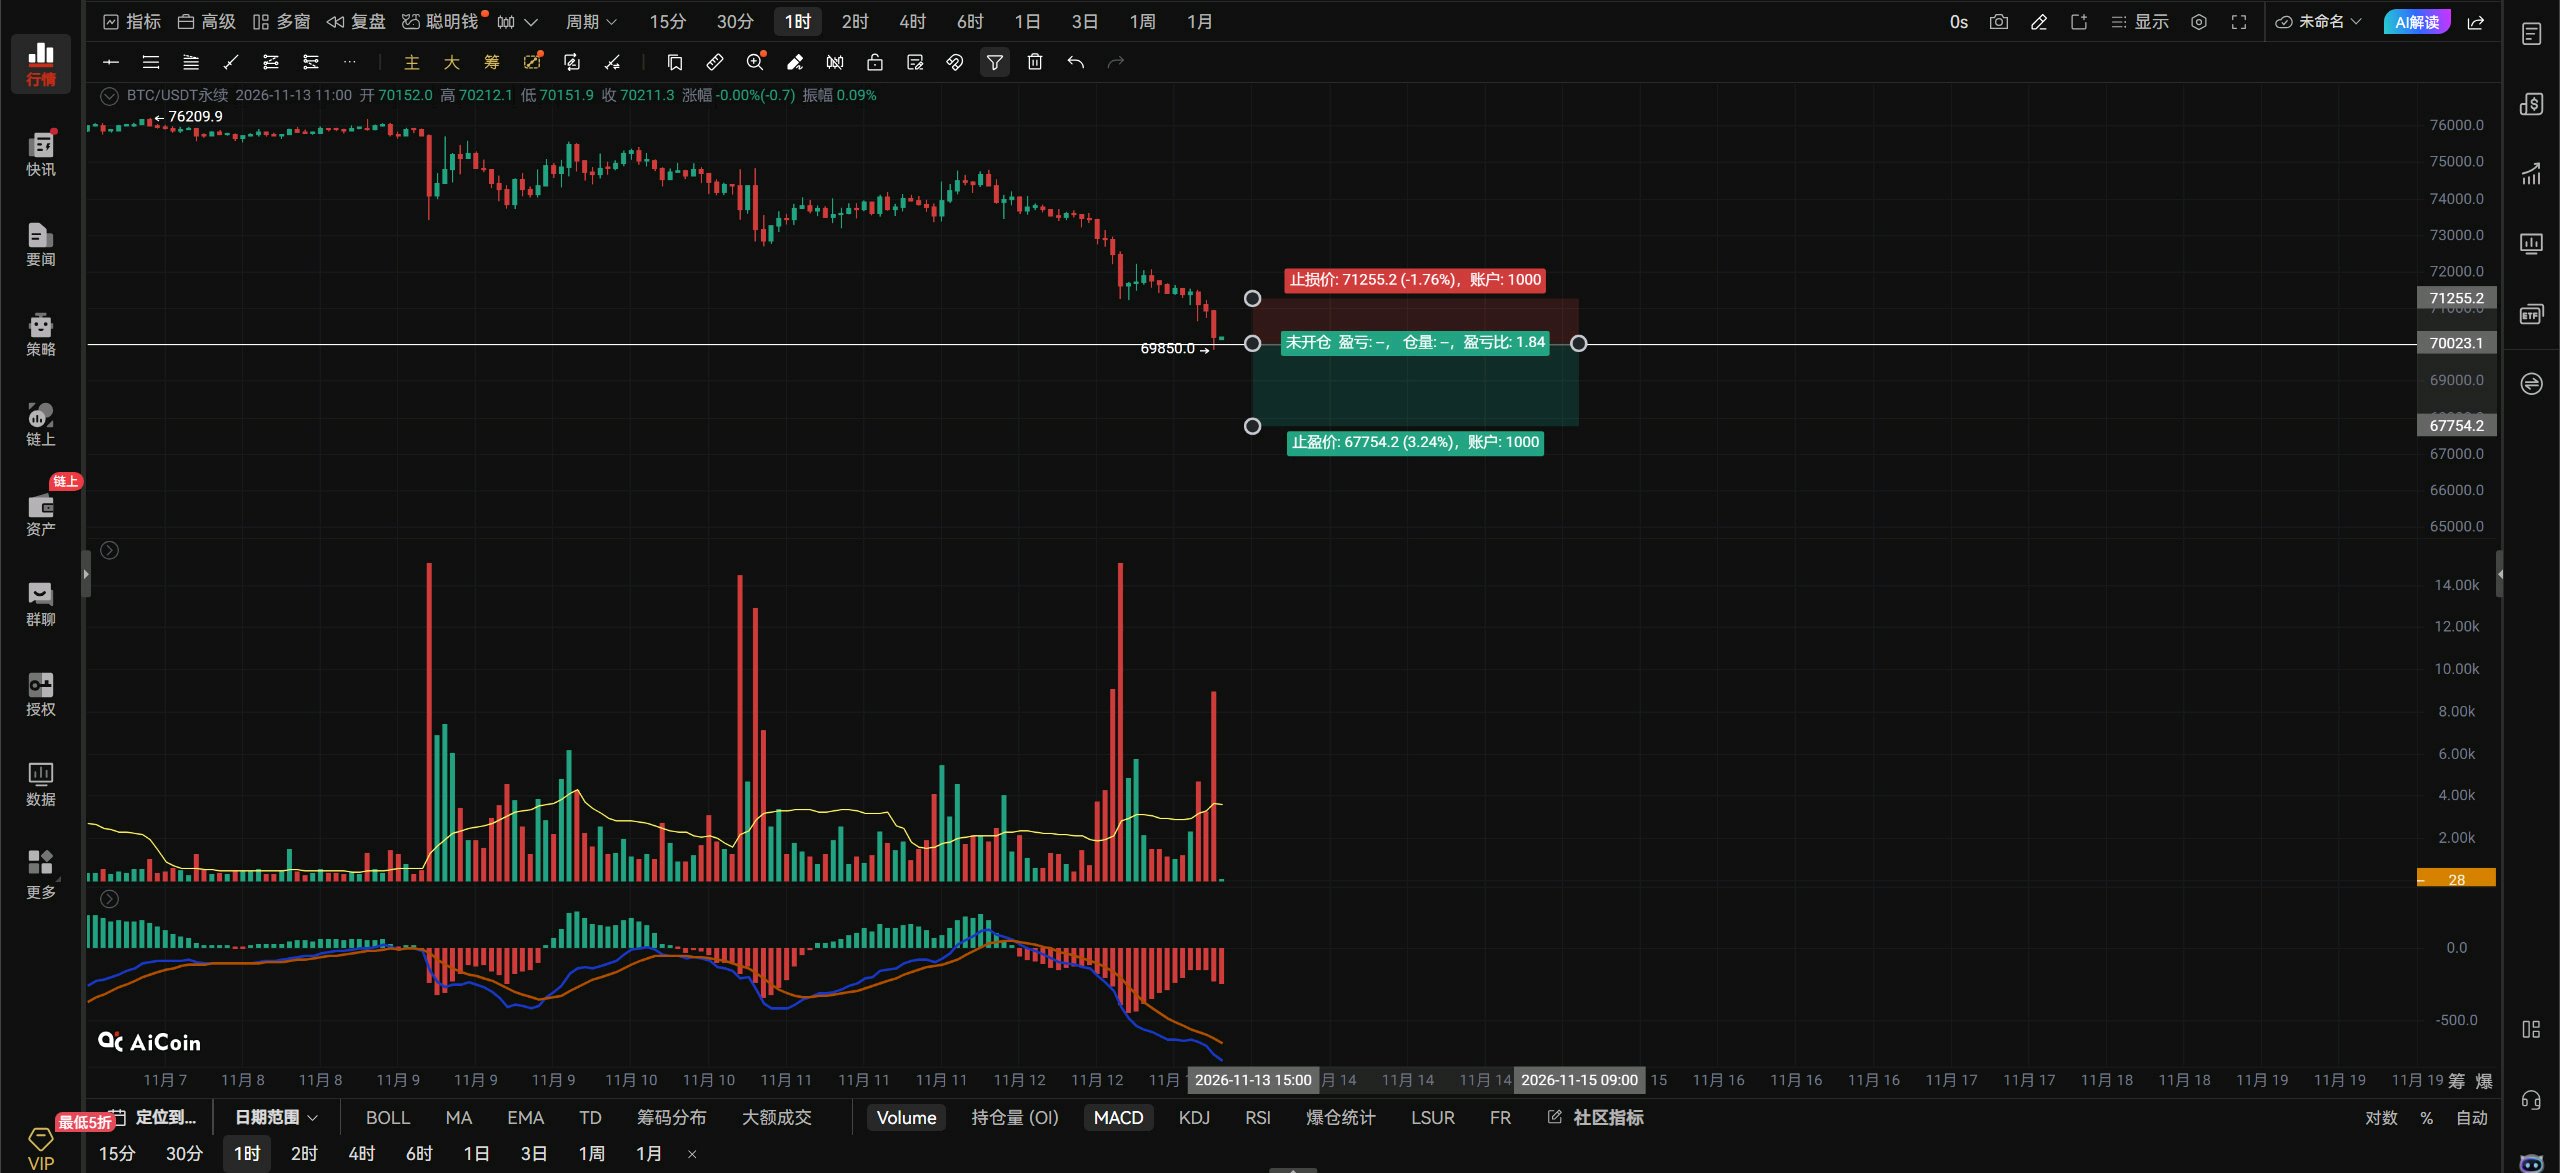
$BTCUSDT Nov. 13 midday market outlook.🌿 $BTC 's view: Bitcoin just keeps falling, and there’s no floor in sight now. Who knows where the bottom is? But I can tell you there are no signs of a bottom yet, because we haven’t seen a downward wick. A bottoming signal will only appear when there’s a rapid plunge accompanied by a wick. The long/short account ratio is still high at 3.0, which shows that retail traders going long are still increasing in number. This slow bleed doesn’t hurt retail longs much; it’s like being cut with a dull knife—painful, but the bulls can take it. It will take consecutive rapid drops to scare the bulls and bring the long/short ratio down. Once the ratio falls and there are fewer people going long, the price can be pushed up. After Bitcoin broke below the 73342 support, it didn’t stay there long; instead, it broke straight through the 72000 support. After breaking 72000, it tried to rebound and reclaim that level, as indicated by the red arrow above, but unfortunately it failed to get back above 72000. If it can’t reclaim it, then it’ll just keep falling! Bitcoin is currently testing support at 70464. If 70464 doesn’t hold, then 70,000 will be lost. Losing 70,000 could trigger panic selling, and once panic selling kicks in, there’s no telling how far it could fall. We’ll have to take it one step at a time. Only when panic selling appears will the bulls get scared and the long/short ratio come down. For now, the support below Bitcoin on the hourly chart is around 69058. At this rate, it looks like the bears won’t stop until they wipe out the bulls. If Bitcoin doesn’t break below 70464 and can consolidate between 70464 and 72000, there’s still a chance of an upward rebound. But if it breaks below 70464, it won’t be able to bounce back. What should you do if you want to go long now? Watch to see whether 70,000 gets briefly broken and then reclaimed. If it does, you can take a small long position; if it breaks straight through, stay out. If Bitcoin breaks above 70464 on strong volume, aggressive traders can chase a long on the right side. If it breaks below 70000 on strong volume and then fails to reclaim it on a rebound, chase a short on the right side. Use a stop-loss. On the hourly chart, if Bitcoin breaks above and holds 70464, look for 72000–73342. If it can’t get above 70464, there’s no point. A break below 70000 on the 4-hour chart points down to 69058–67771. Resistance above: 70464–72000–73342 Support below: 70000–69058–67771#ByXIMPACT
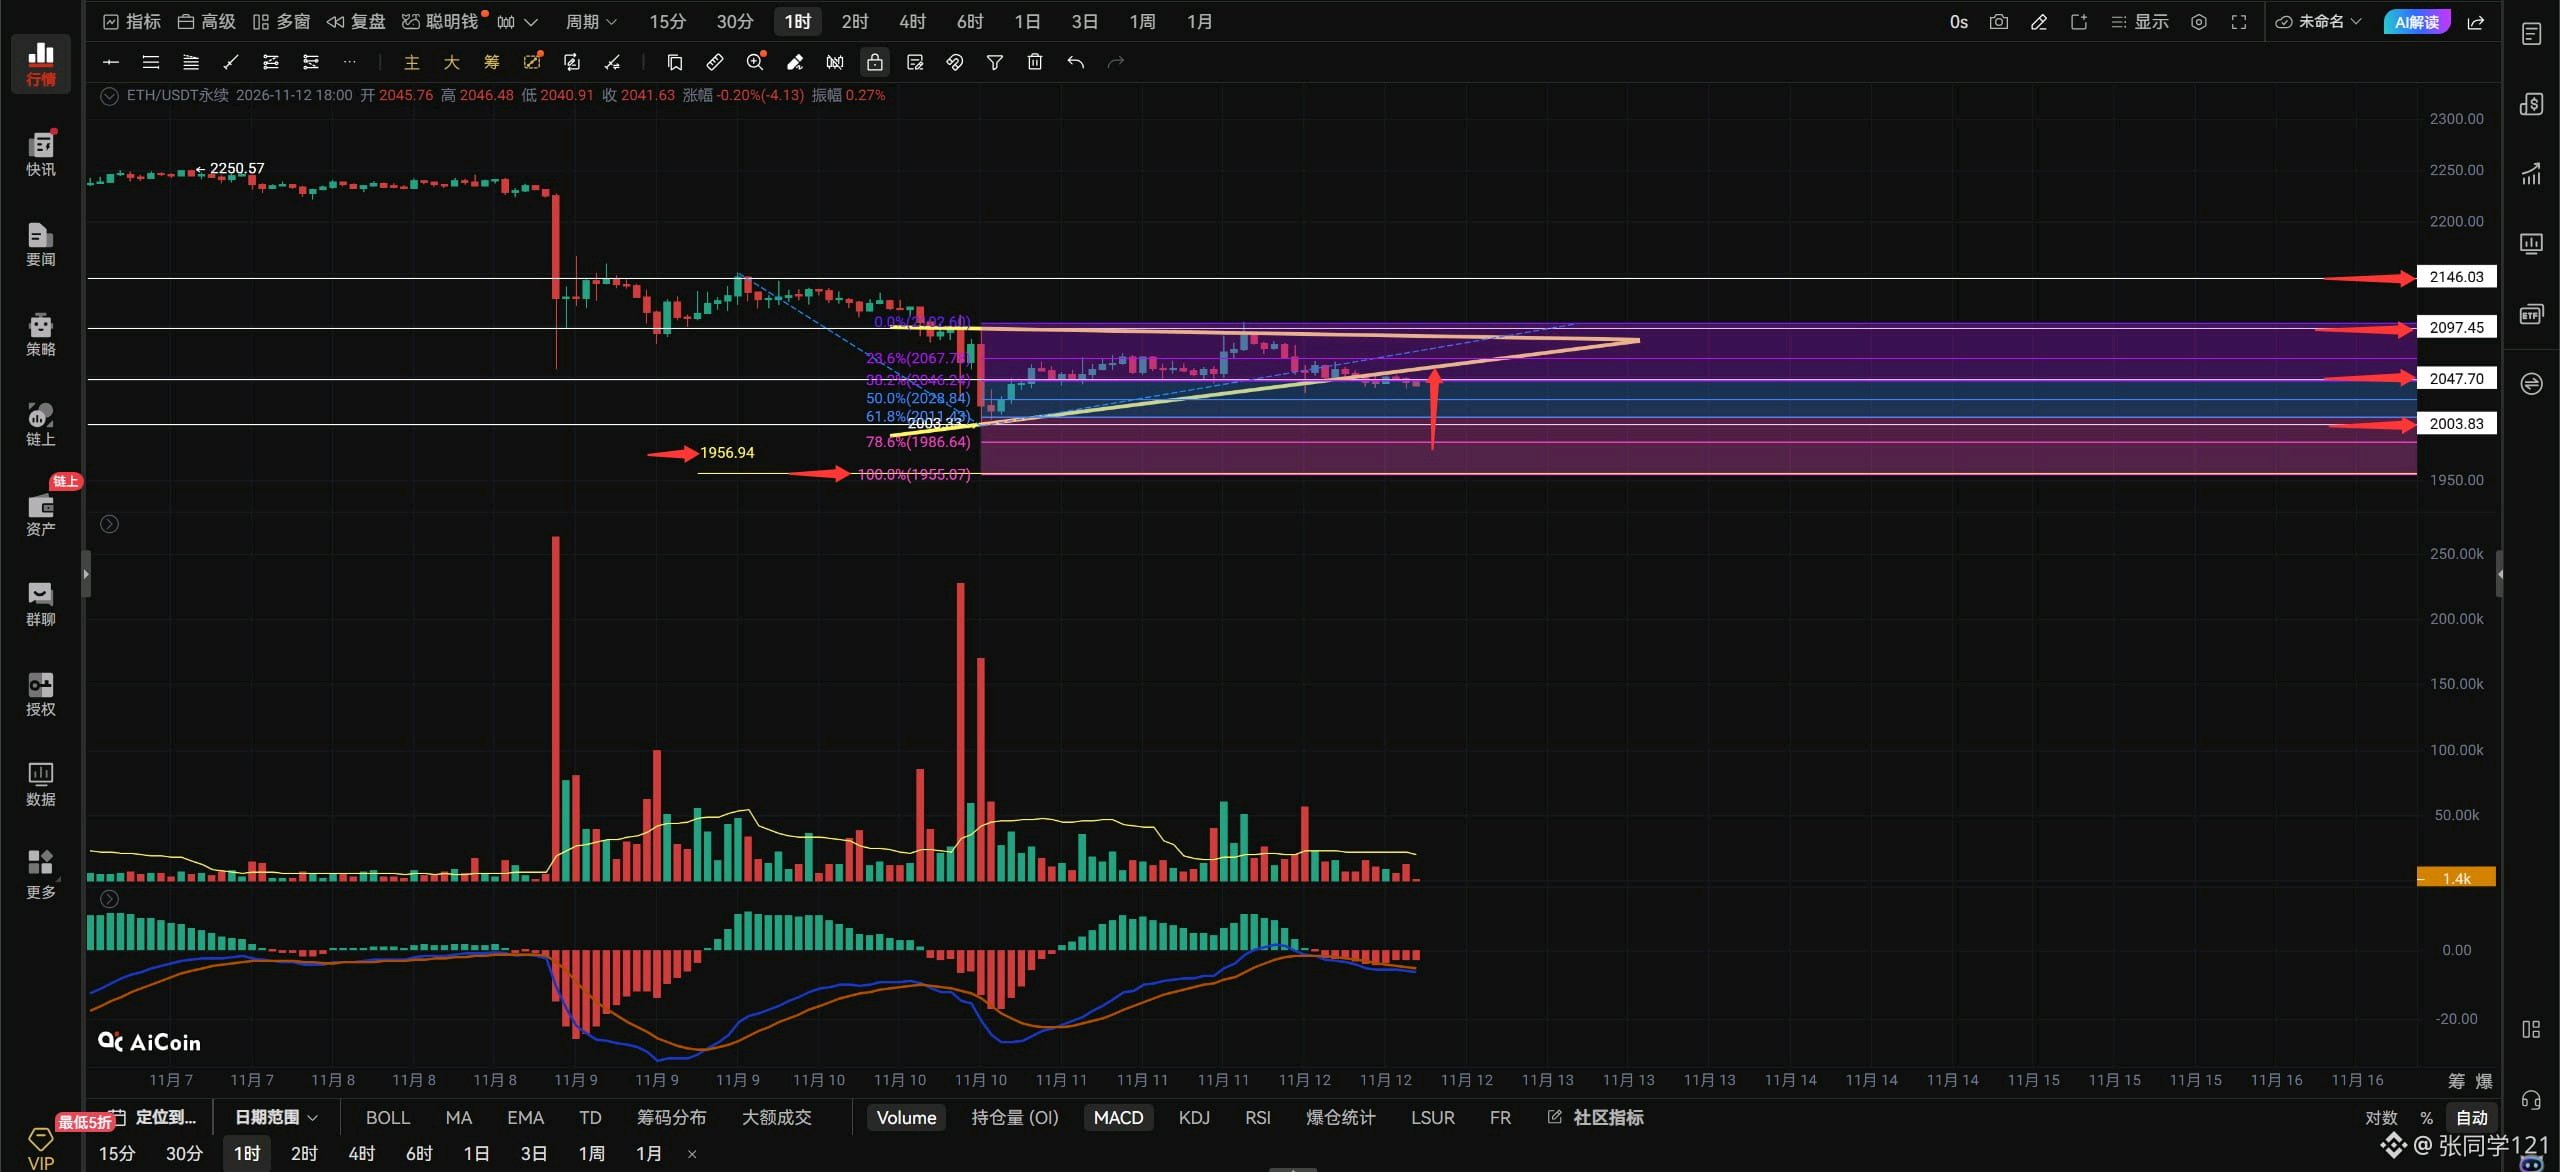
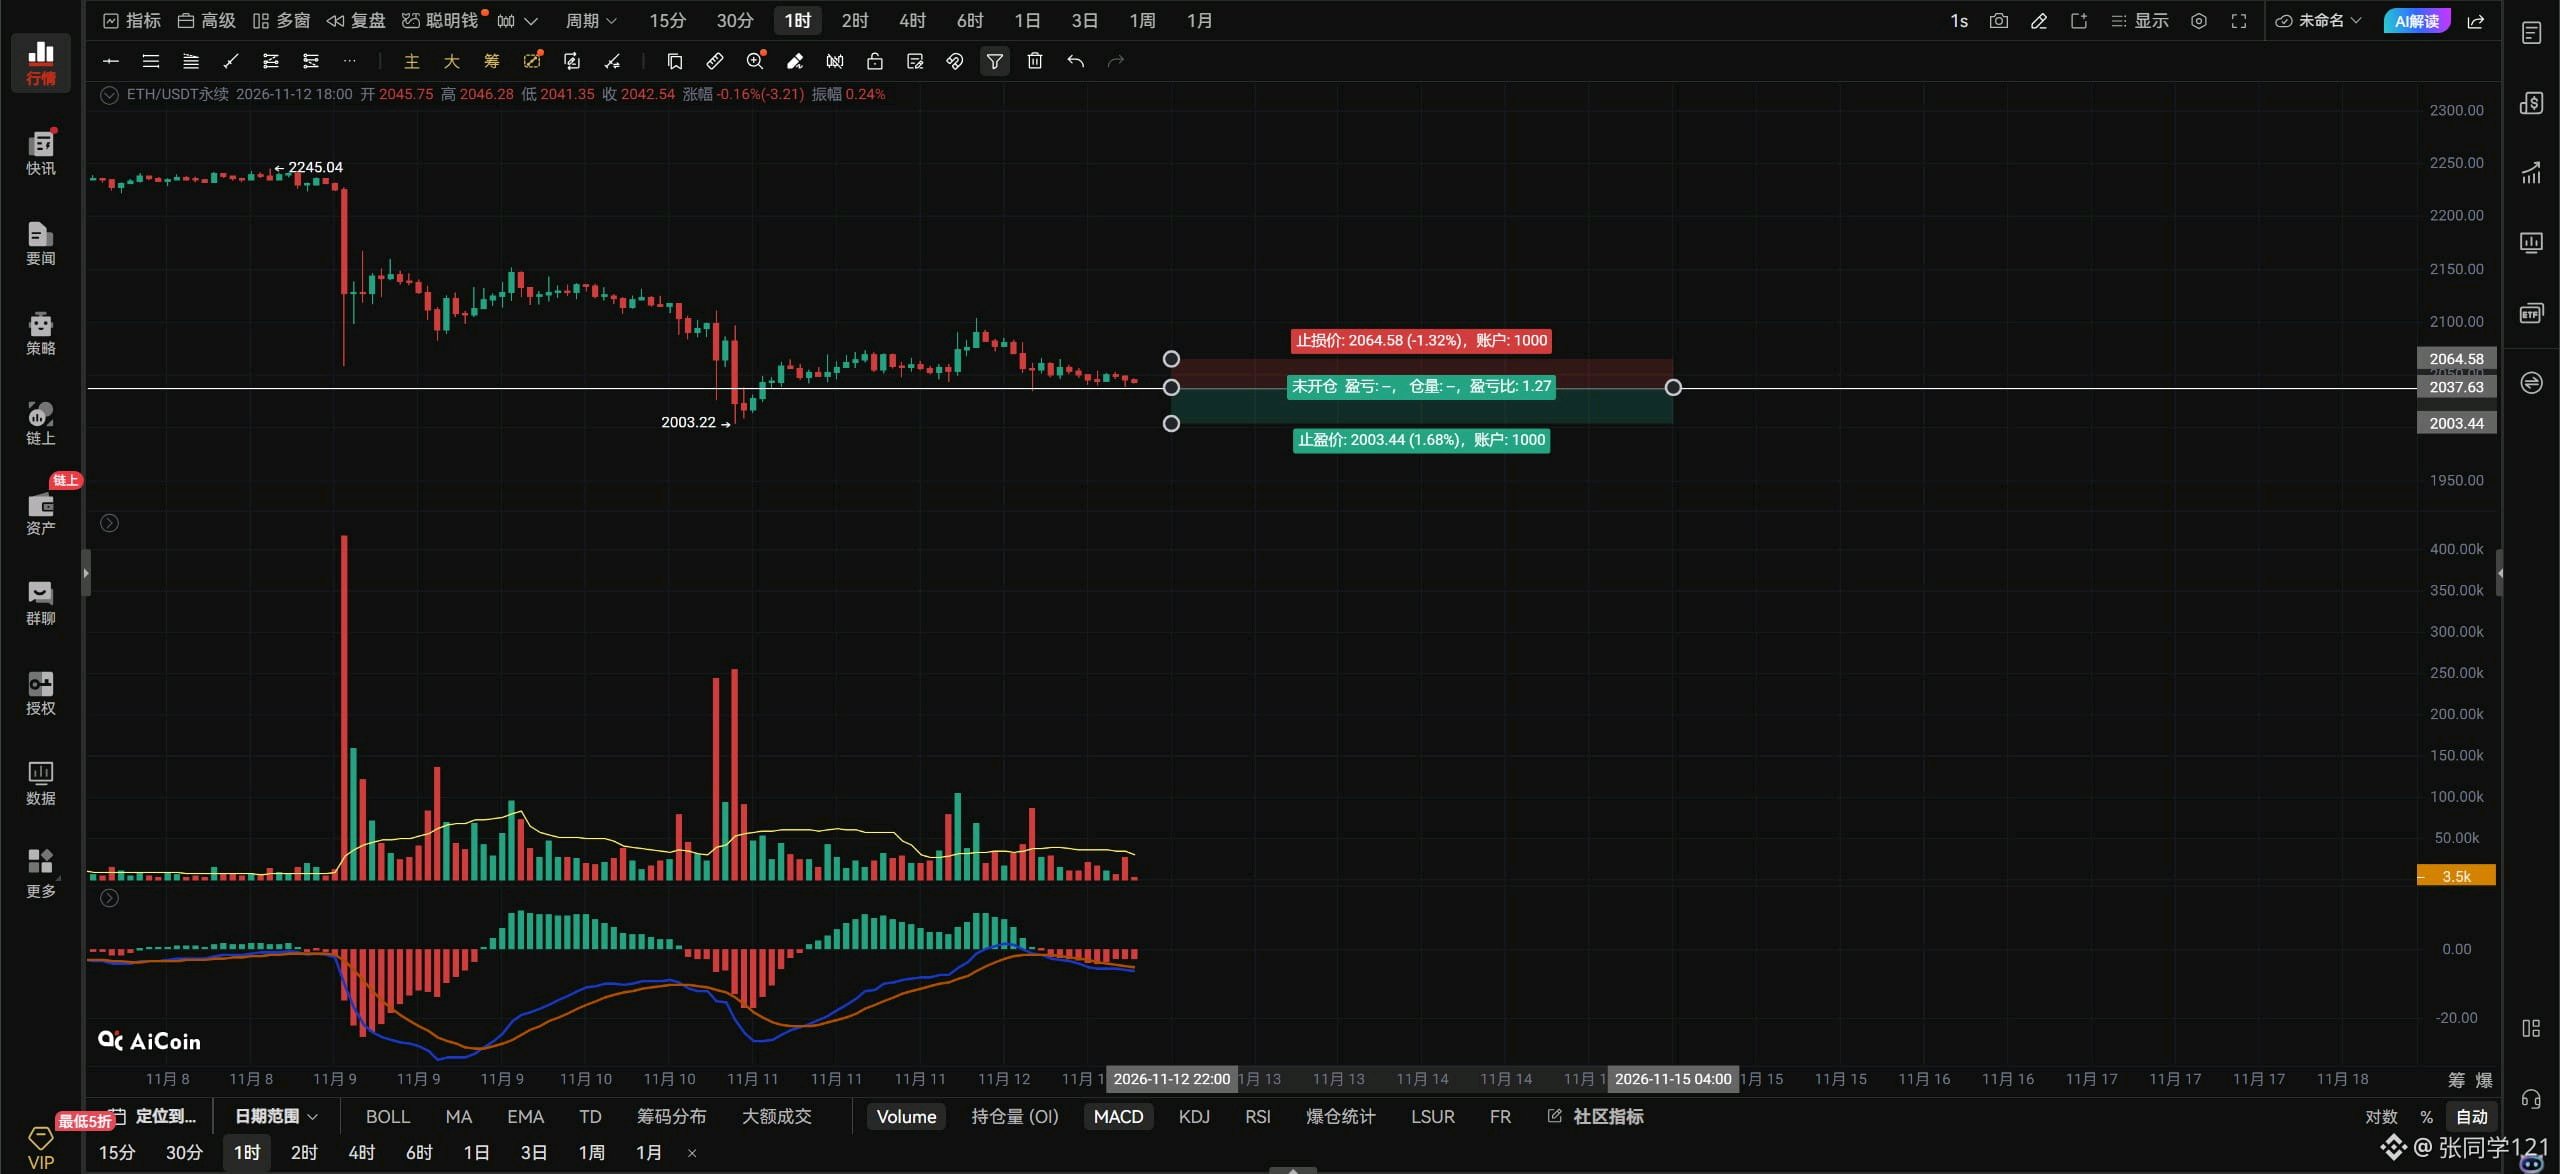
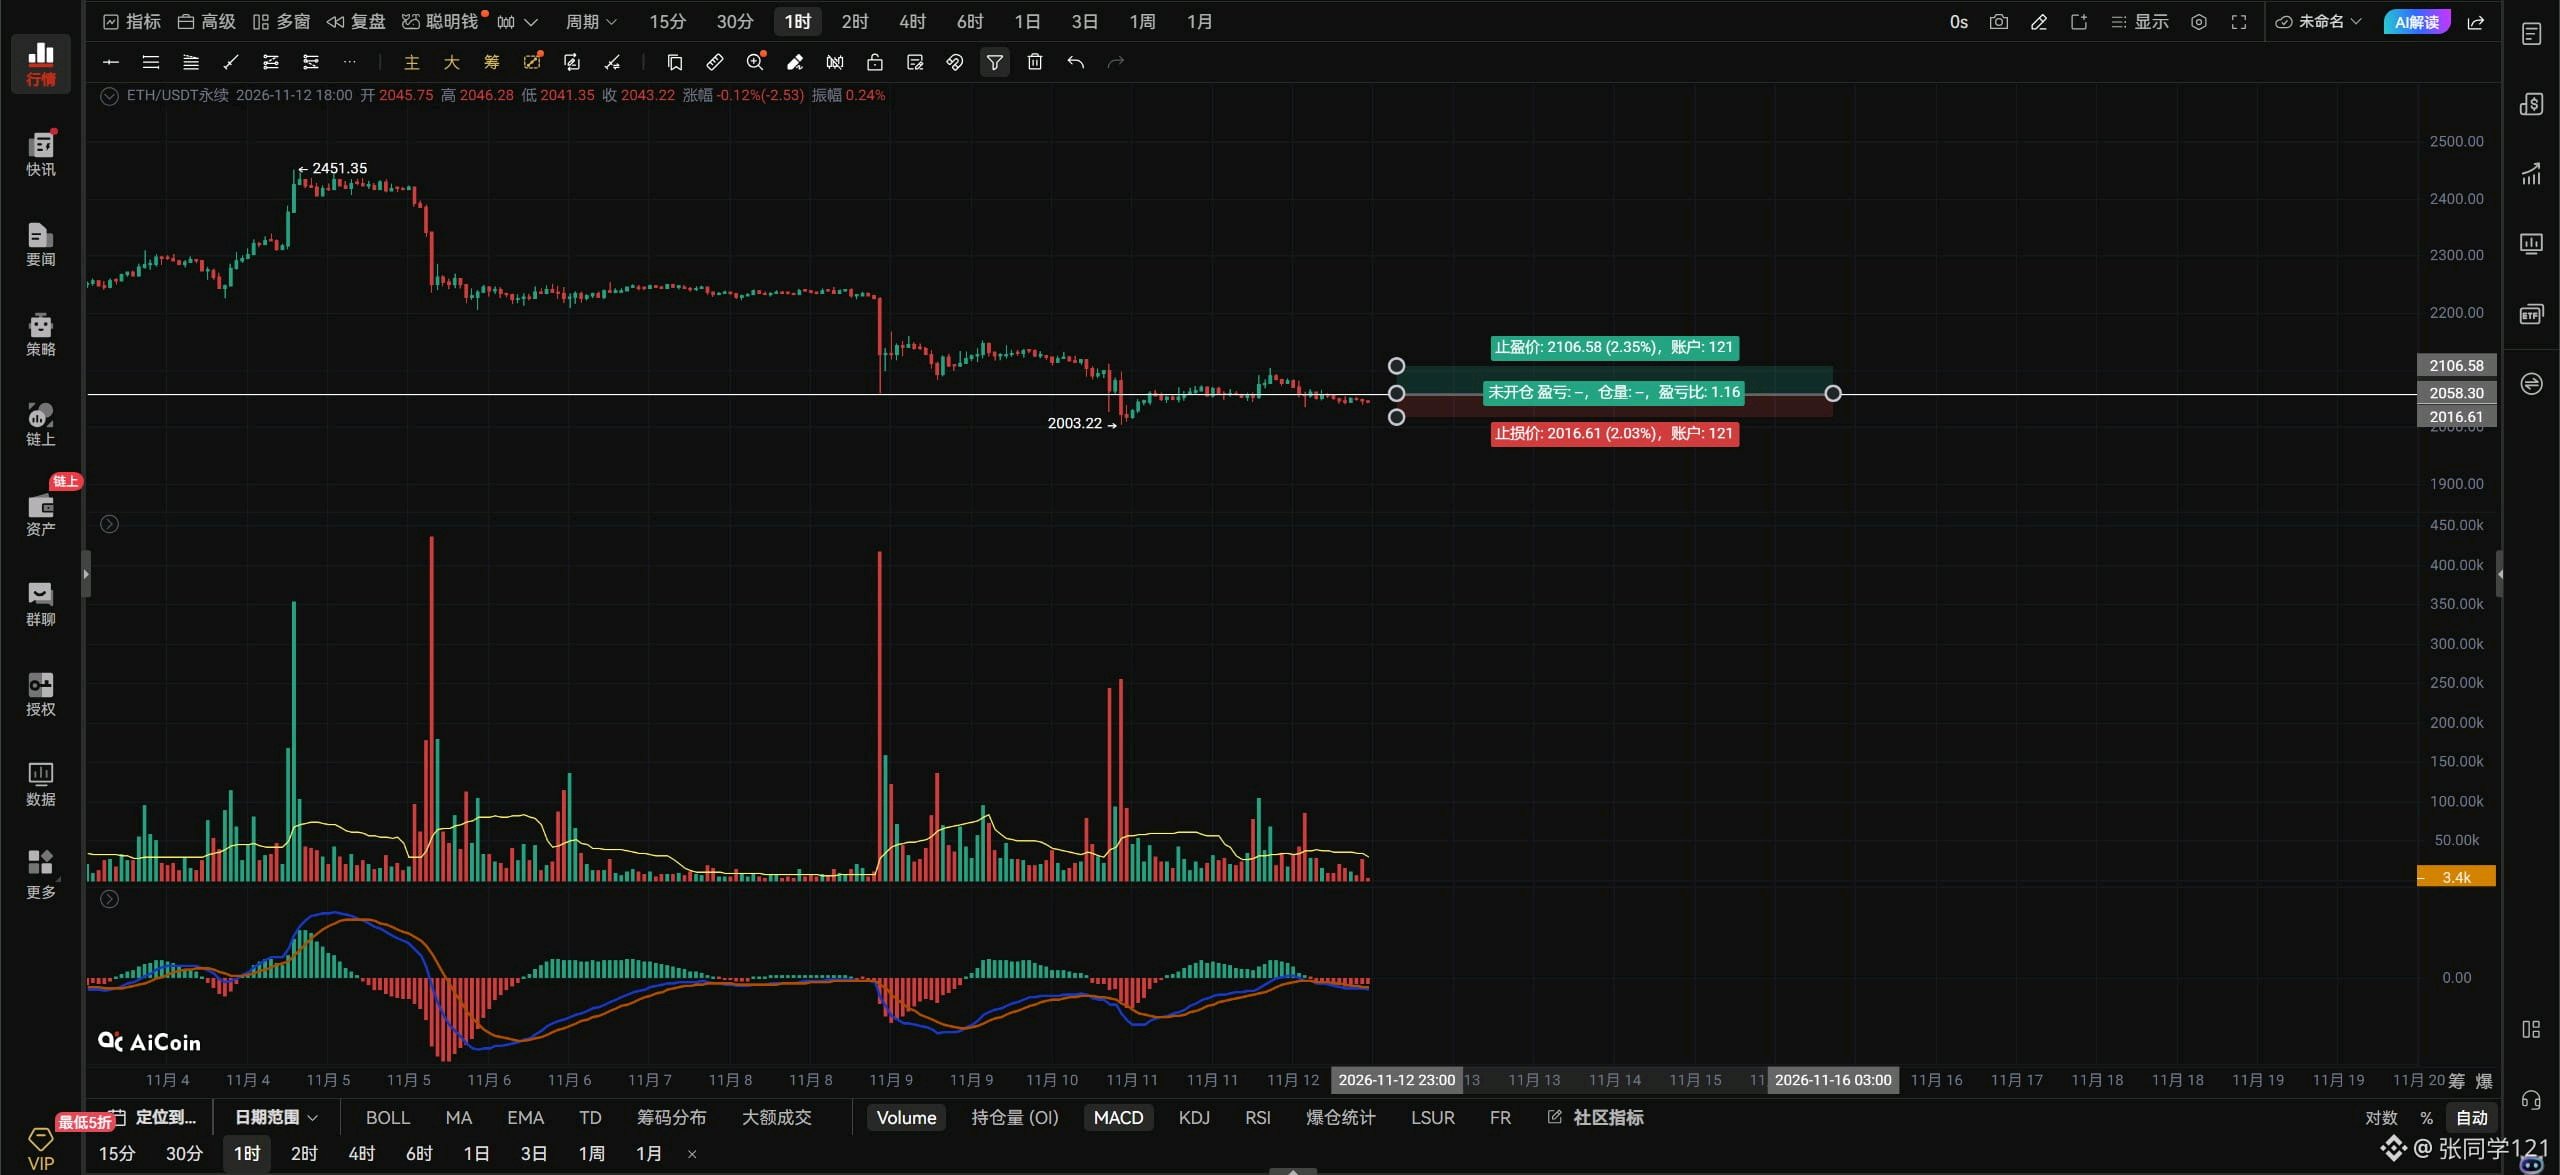
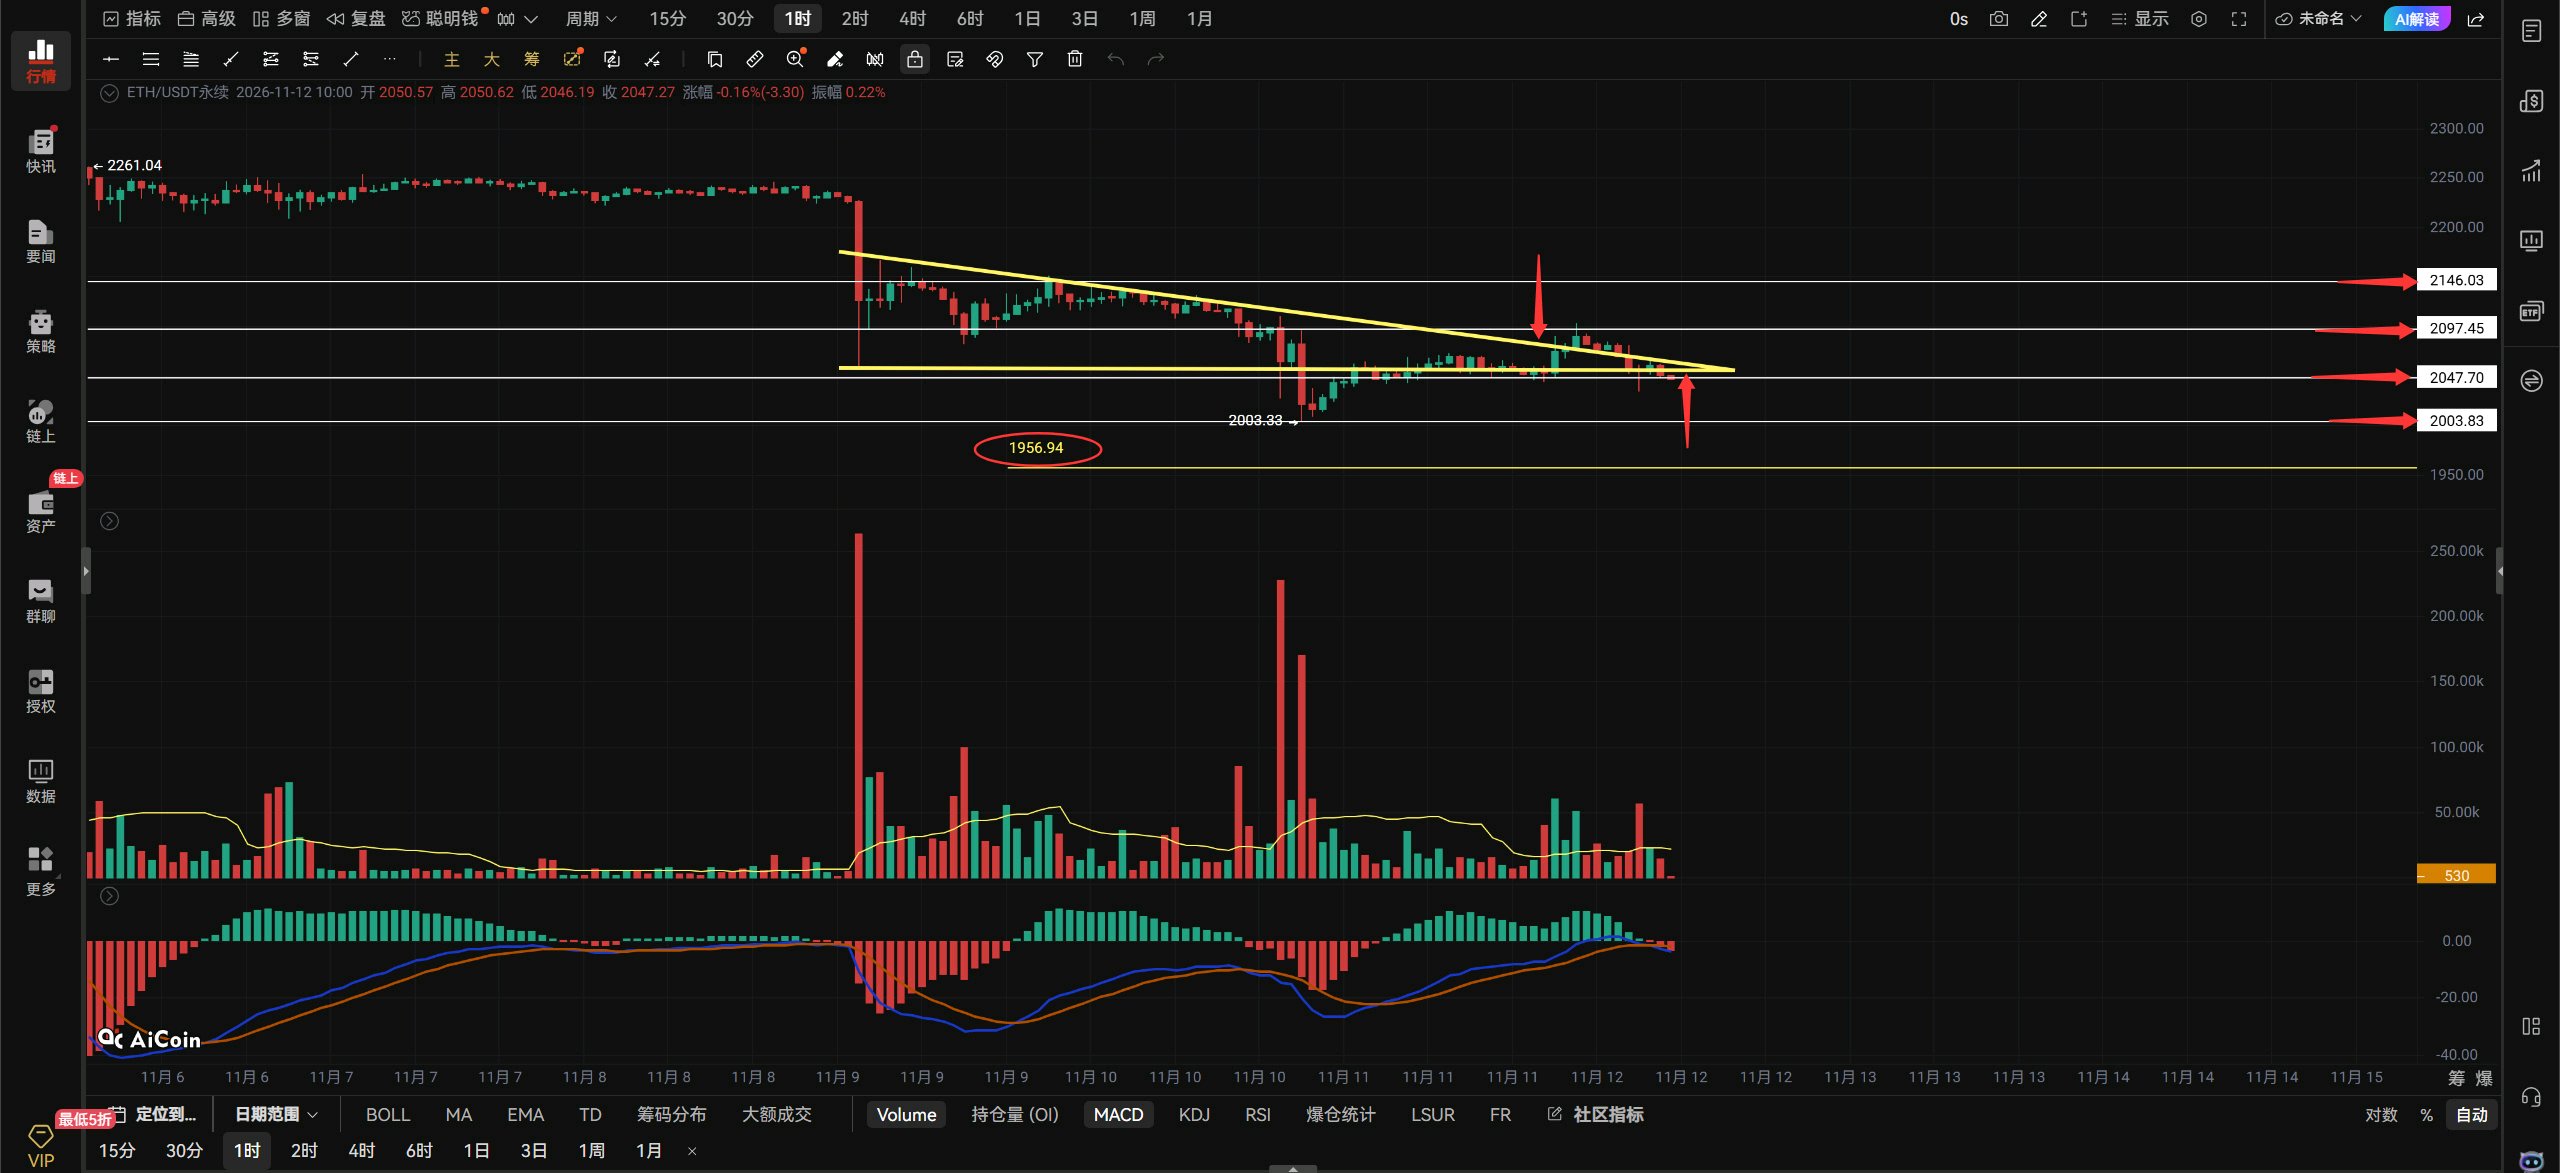
$ETHUSDT Evening outlook: Nov. 12. ETH’s triangle has broken down, and it has also fallen below the 2047 support. If it can’t reclaim 2047, it’s headed for 2000. This price action over the past few days has been really frustrating: it can’t go up, but it can’t go down much either. We don’t know what BTC and ETH are waiting for—or what other news is yet to come. ETH needs to get back above 2047 to stop falling. A break above 2097 could kick off an hourly rebound. If you’re looking to go long on ETH, you can wait for it to retest around 2000 and look for a bottoming signal, or wait for it to break above 2047 and go long on the right side. ETH must hold 2000; if it breaks below that level, Fibonacci levels point to around 1956. For this hourly downswing in ETH to rebound, it needs to break above 2146. Only then can the hourly downtrend shift from its current bearish trend to a bullish one. If ETH breaks above 2058 with strong volume, aggressive traders can go long on the right side. If it breaks below 2037 with strong volume, go short on the right side. Keep an eye on volume and use stop-losses. If ETH holds above 2058 on the hourly chart, look for 2097–2146. If it breaks below 2047 on the 4-hour chart, look for 2000–1956. There’s not much else to say about the other timeframes, since the market has been consolidating for the past few days. ETH spot around 2000 is worth buying, so go ahead and buy spot! Don’t hesitate—you might miss the move up if you’re not paying attention. Don’t assume there’s much further to fall and keep waiting for a lower price to buy spot; constantly chasing lower prices is also a form of greed. That’s all for now. $ETH #ByXIMPACT
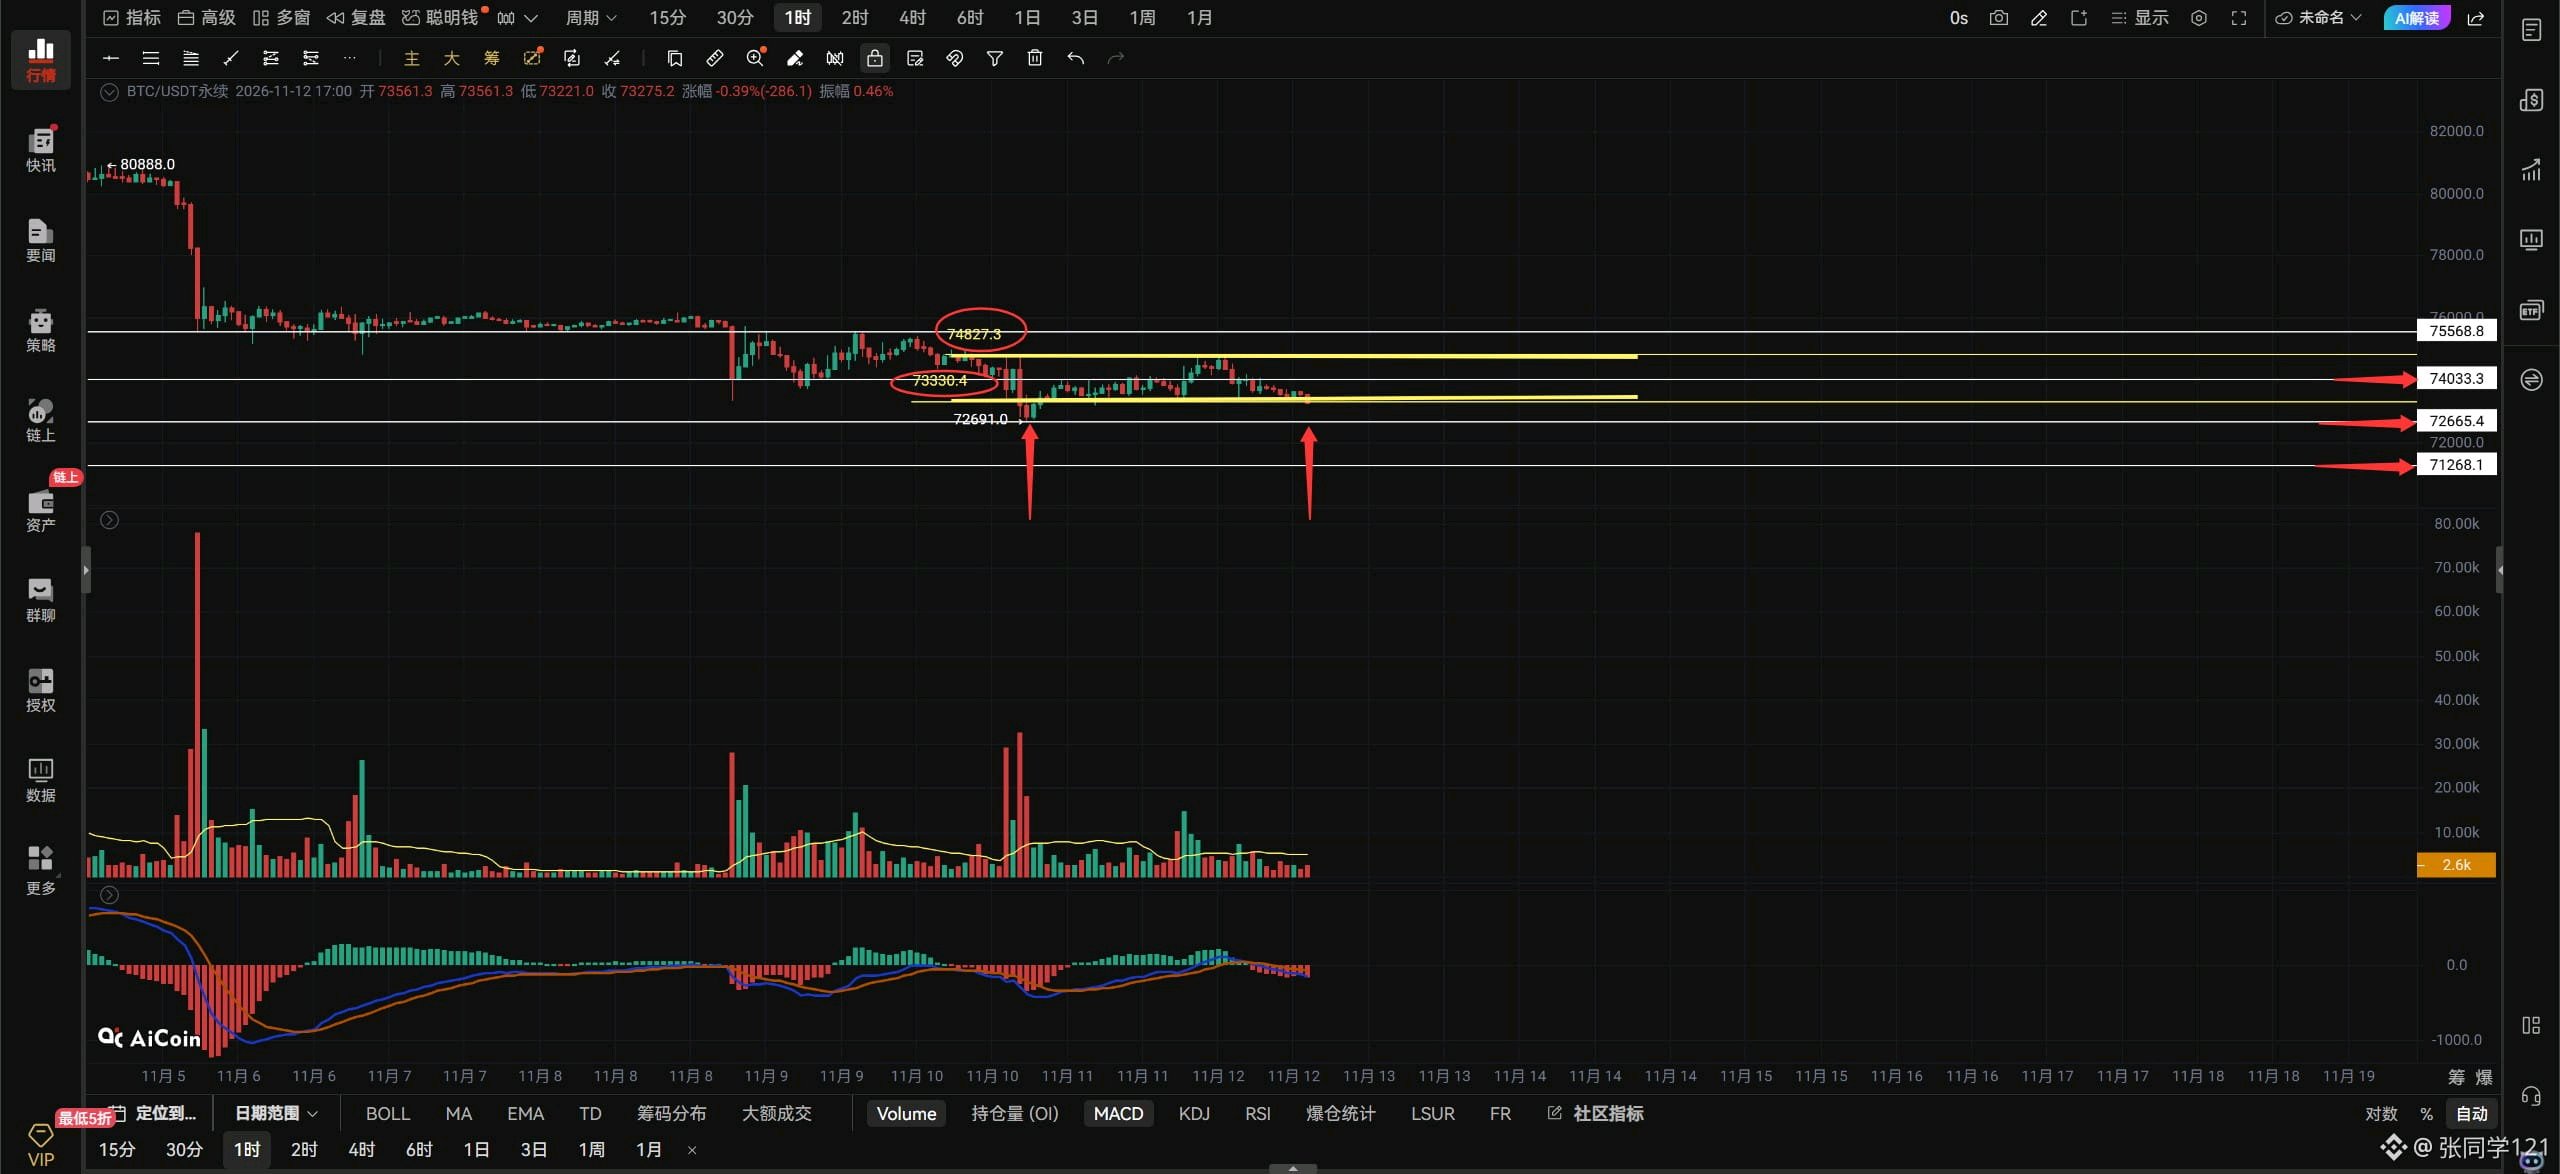
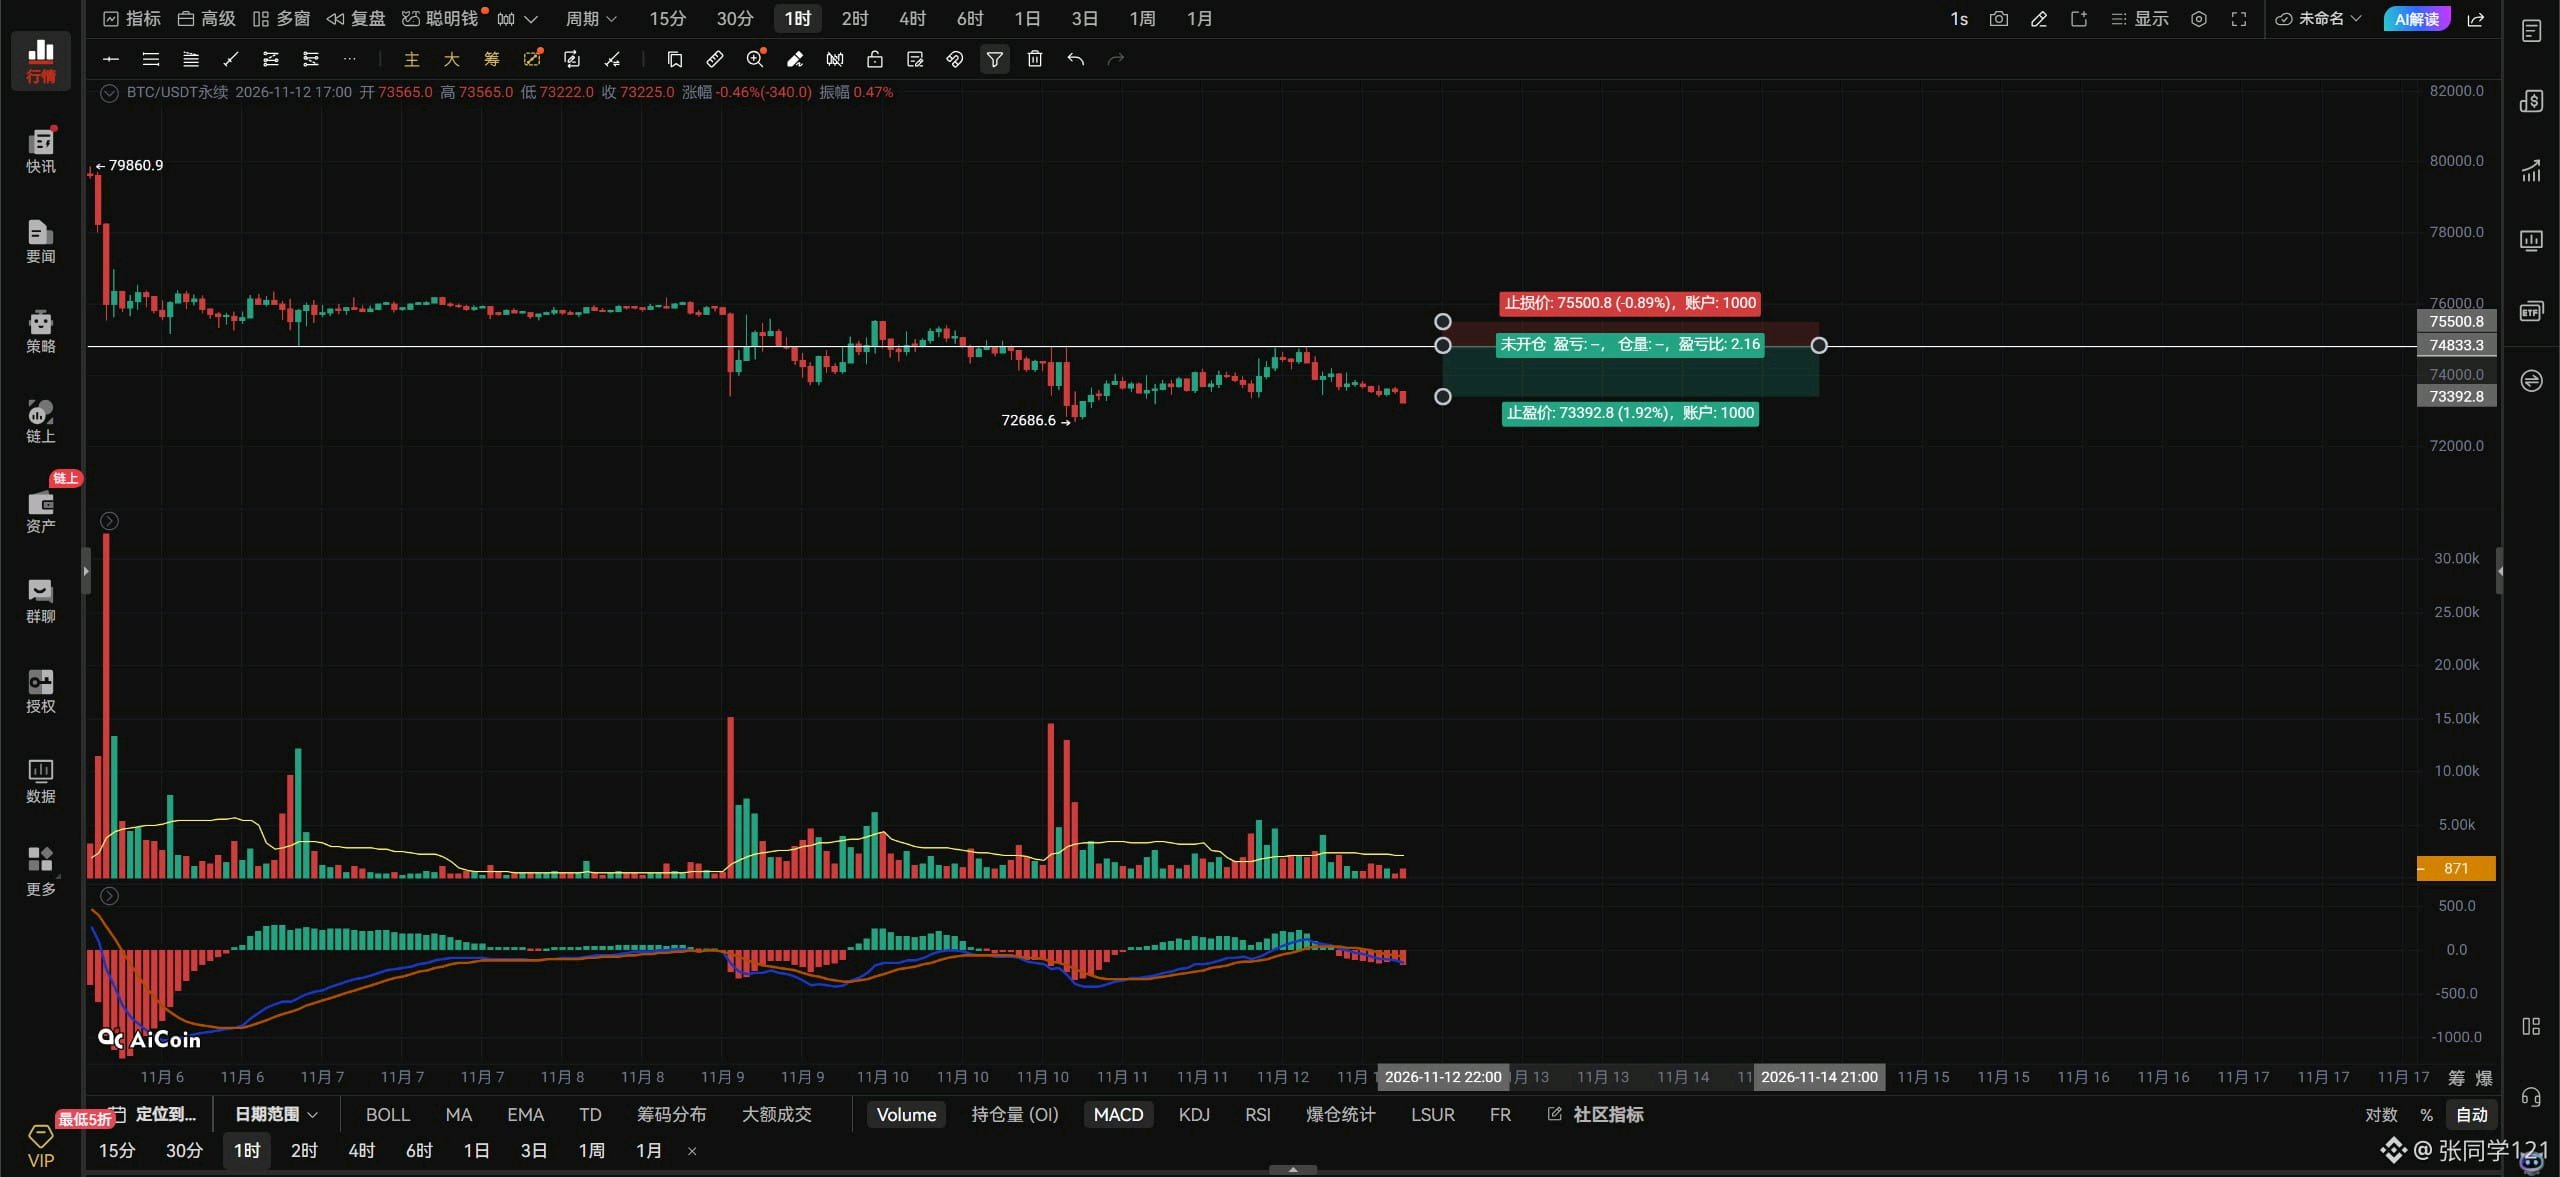
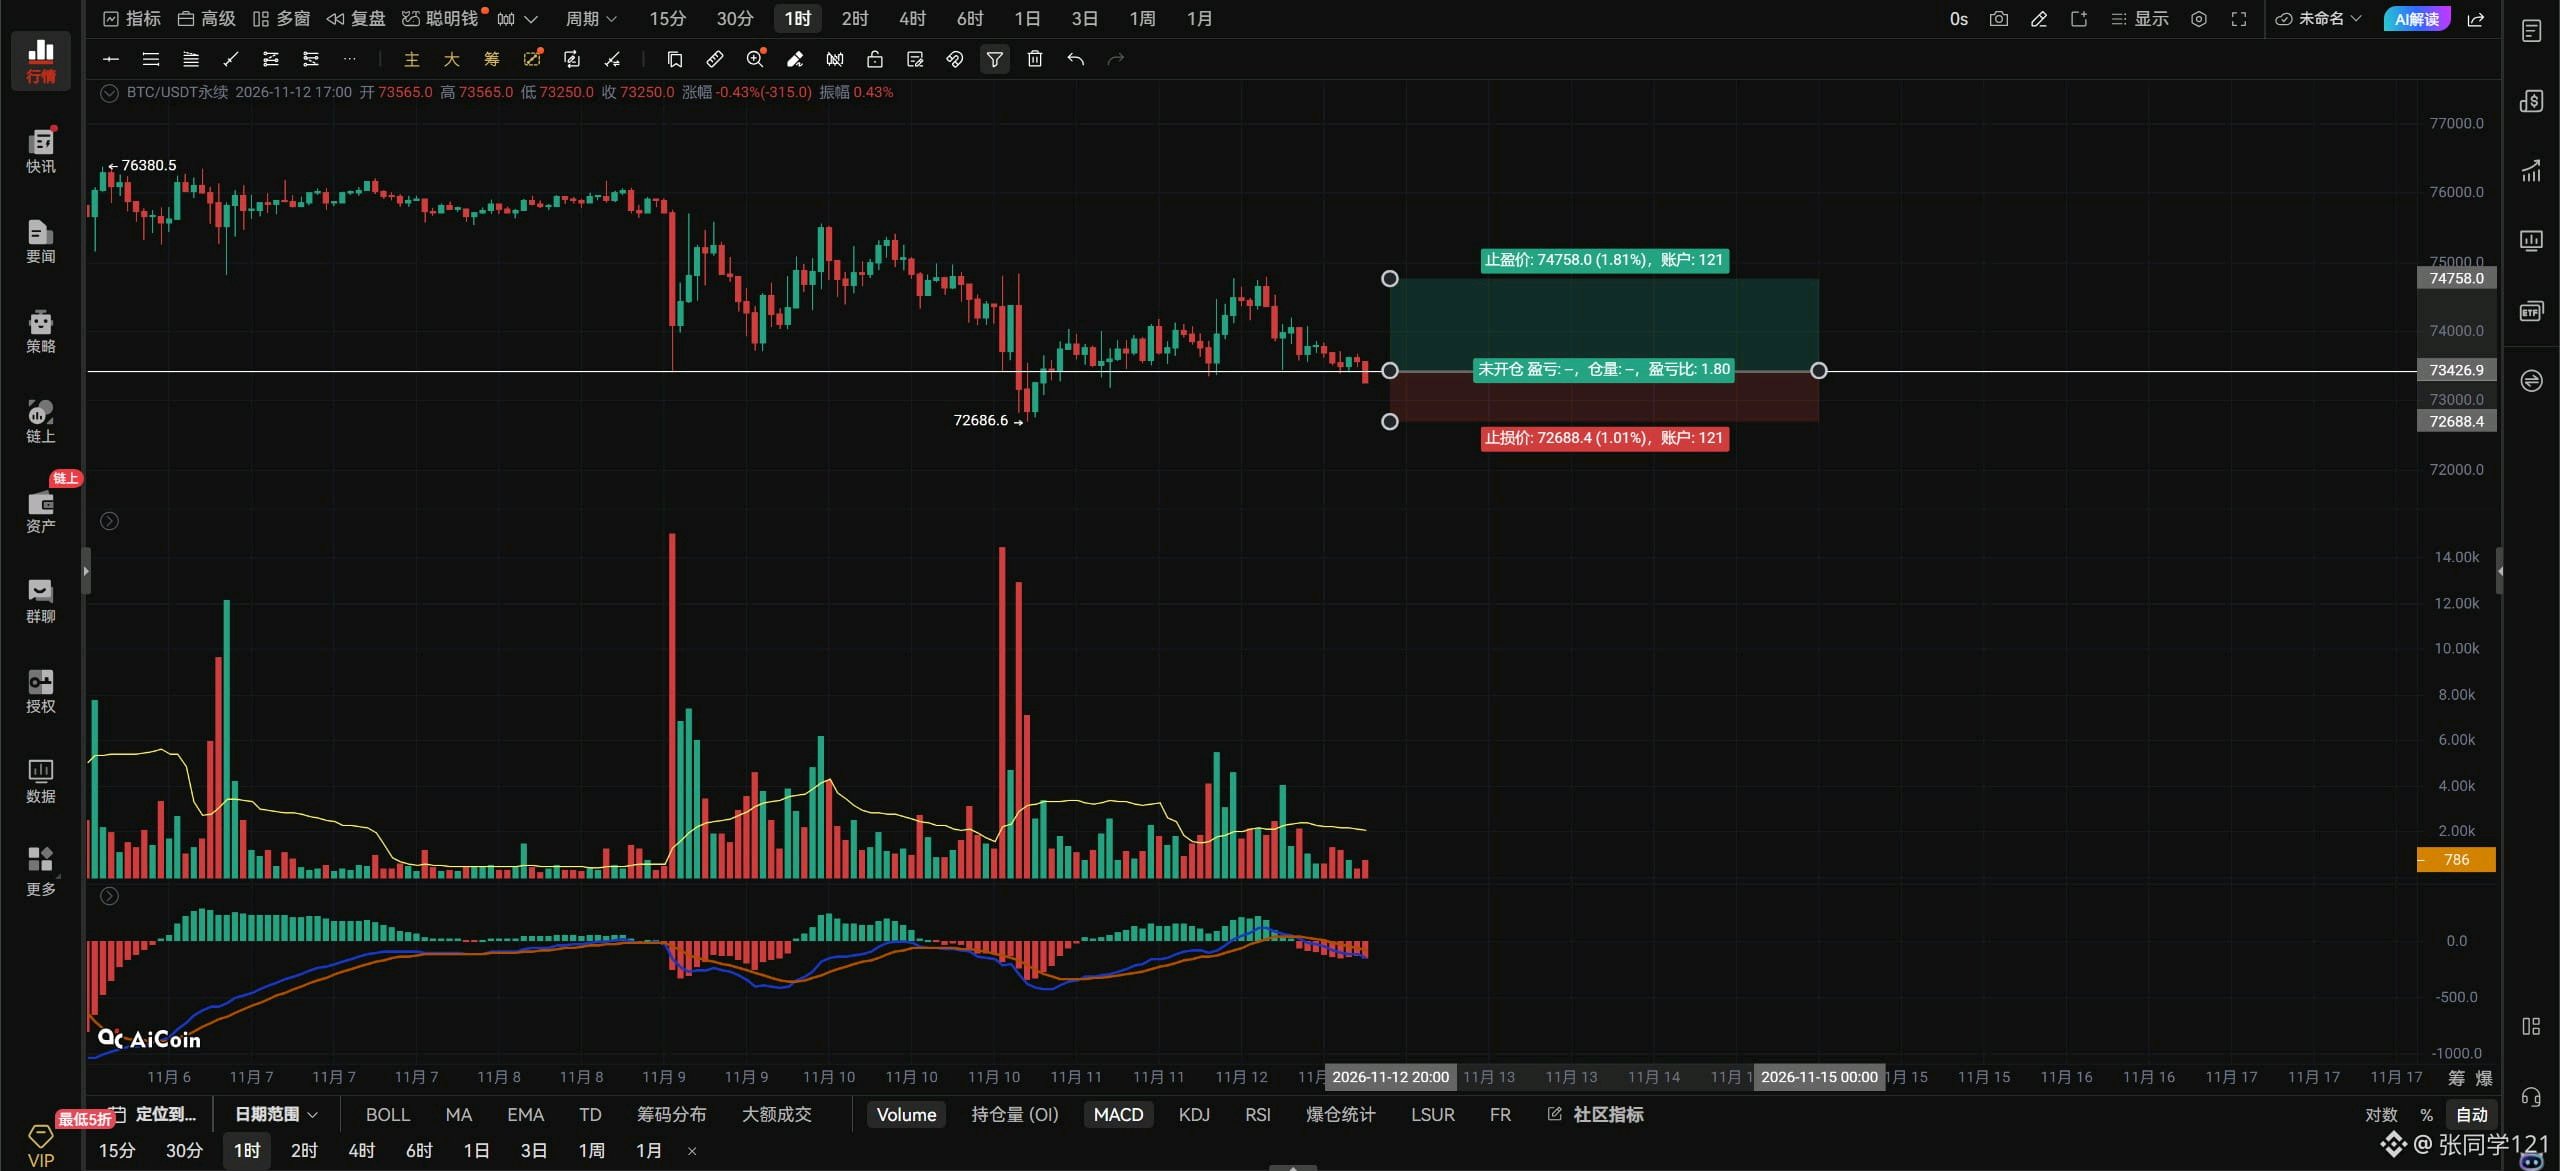
$BTCUSDT Perspectives du marché en soirée : 11/12. Le pétrole brut est en baisse et le Bitcoin est en baisse. Le pétrole brut remonte et le Bitcoin est toujours en baisse. Les actions américaines sont en hausse et le Bitcoin ne décolle toujours pas. Cette vague de ventes va-t-elle finir par s'arrêter ? Si vous continuez à chuter, les haussiers ne vont pas entrer sur le marché. Sans acheteurs en face, vous les ours, vous feriez aussi bien d'aller jouer dans la boue tout seuls ! Nous avons déjà bien chuté ; cela devrait suffire. Nous avons tant baissé sans aucune mauvaise nouvelle évidente comme catalyseur – imaginez à quel point nous pourrions chuter si un choc majeur survenait. Le Bitcoin ne doit pas passer sous le support des 73333. Une fois les 73333 cassés, un deuxième retest du plus bas précédent est envisageable. Ce serait acceptable si le plus bas précédent tient lors du deuxième retest, formant potentiellement un double creux en horaire. Si le prix consolide entre 73333 et 72691, il y aura encore une chance de tester la résistance des 74000. Si le plus bas précédent ne tient pas et est clairement enfoncé, les 71268 seront juste devant vous. Pour que le Bitcoin arrête sa chute sur le graphique horaire, il doit repasser au-dessus des 74000 et s'y maintenir. S'il n'arrive pas à récupérer les 74000, la baisse lente continuera. Pour prolonger le rebond, il doit franchir la résistance des 74800 ; ce n'est qu'à ce moment-là qu'il pourra continuer à monter vers les 75568. S'il ne parvient pas à dépasser ces deux niveaux, le Bitcoin continuera de fluctuer et de stagner dans une fourchette. Si le Bitcoin dépasse les 73426 avec un gros volume, les traders agressifs peuvent tenter de suivre le mouvement à l'achat. S'il rebondit vers les 74833, envisagez une petite vente à découvert par anticipation. Assurez-vous de placer un stop-loss. Si le Bitcoin dépasse et maintient les 73426 sur le graphique horaire, visez la zone 74000–74800. S'il n'arrive pas à passer au-dessus des 73426, cela ne sert à rien. S'il passe sous les 73333 sur le graphique en 4 heures, visez plus bas vers 72691–71268. Sur le graphique journalier du Bitcoin, j'espère que la bougie baissière qui se forme actuellement – celle indiquée par la flèche rouge ci-dessous – clôturera en bougie haussière demain. Pas besoin qu'elle soit énorme ; il suffit qu'elle englobe la bougie baissière précédente. Cela formerait une figure d'étoile du matin en journalier. Si la bougie journalière de demain ne clôture pas en hausse, alors préparez-vous à ce que le Bitcoin comble le gap FVG en dessous ! J'espère que ma prédiction se réalisera. C'est tout pour le moment.#ByXIMPACT
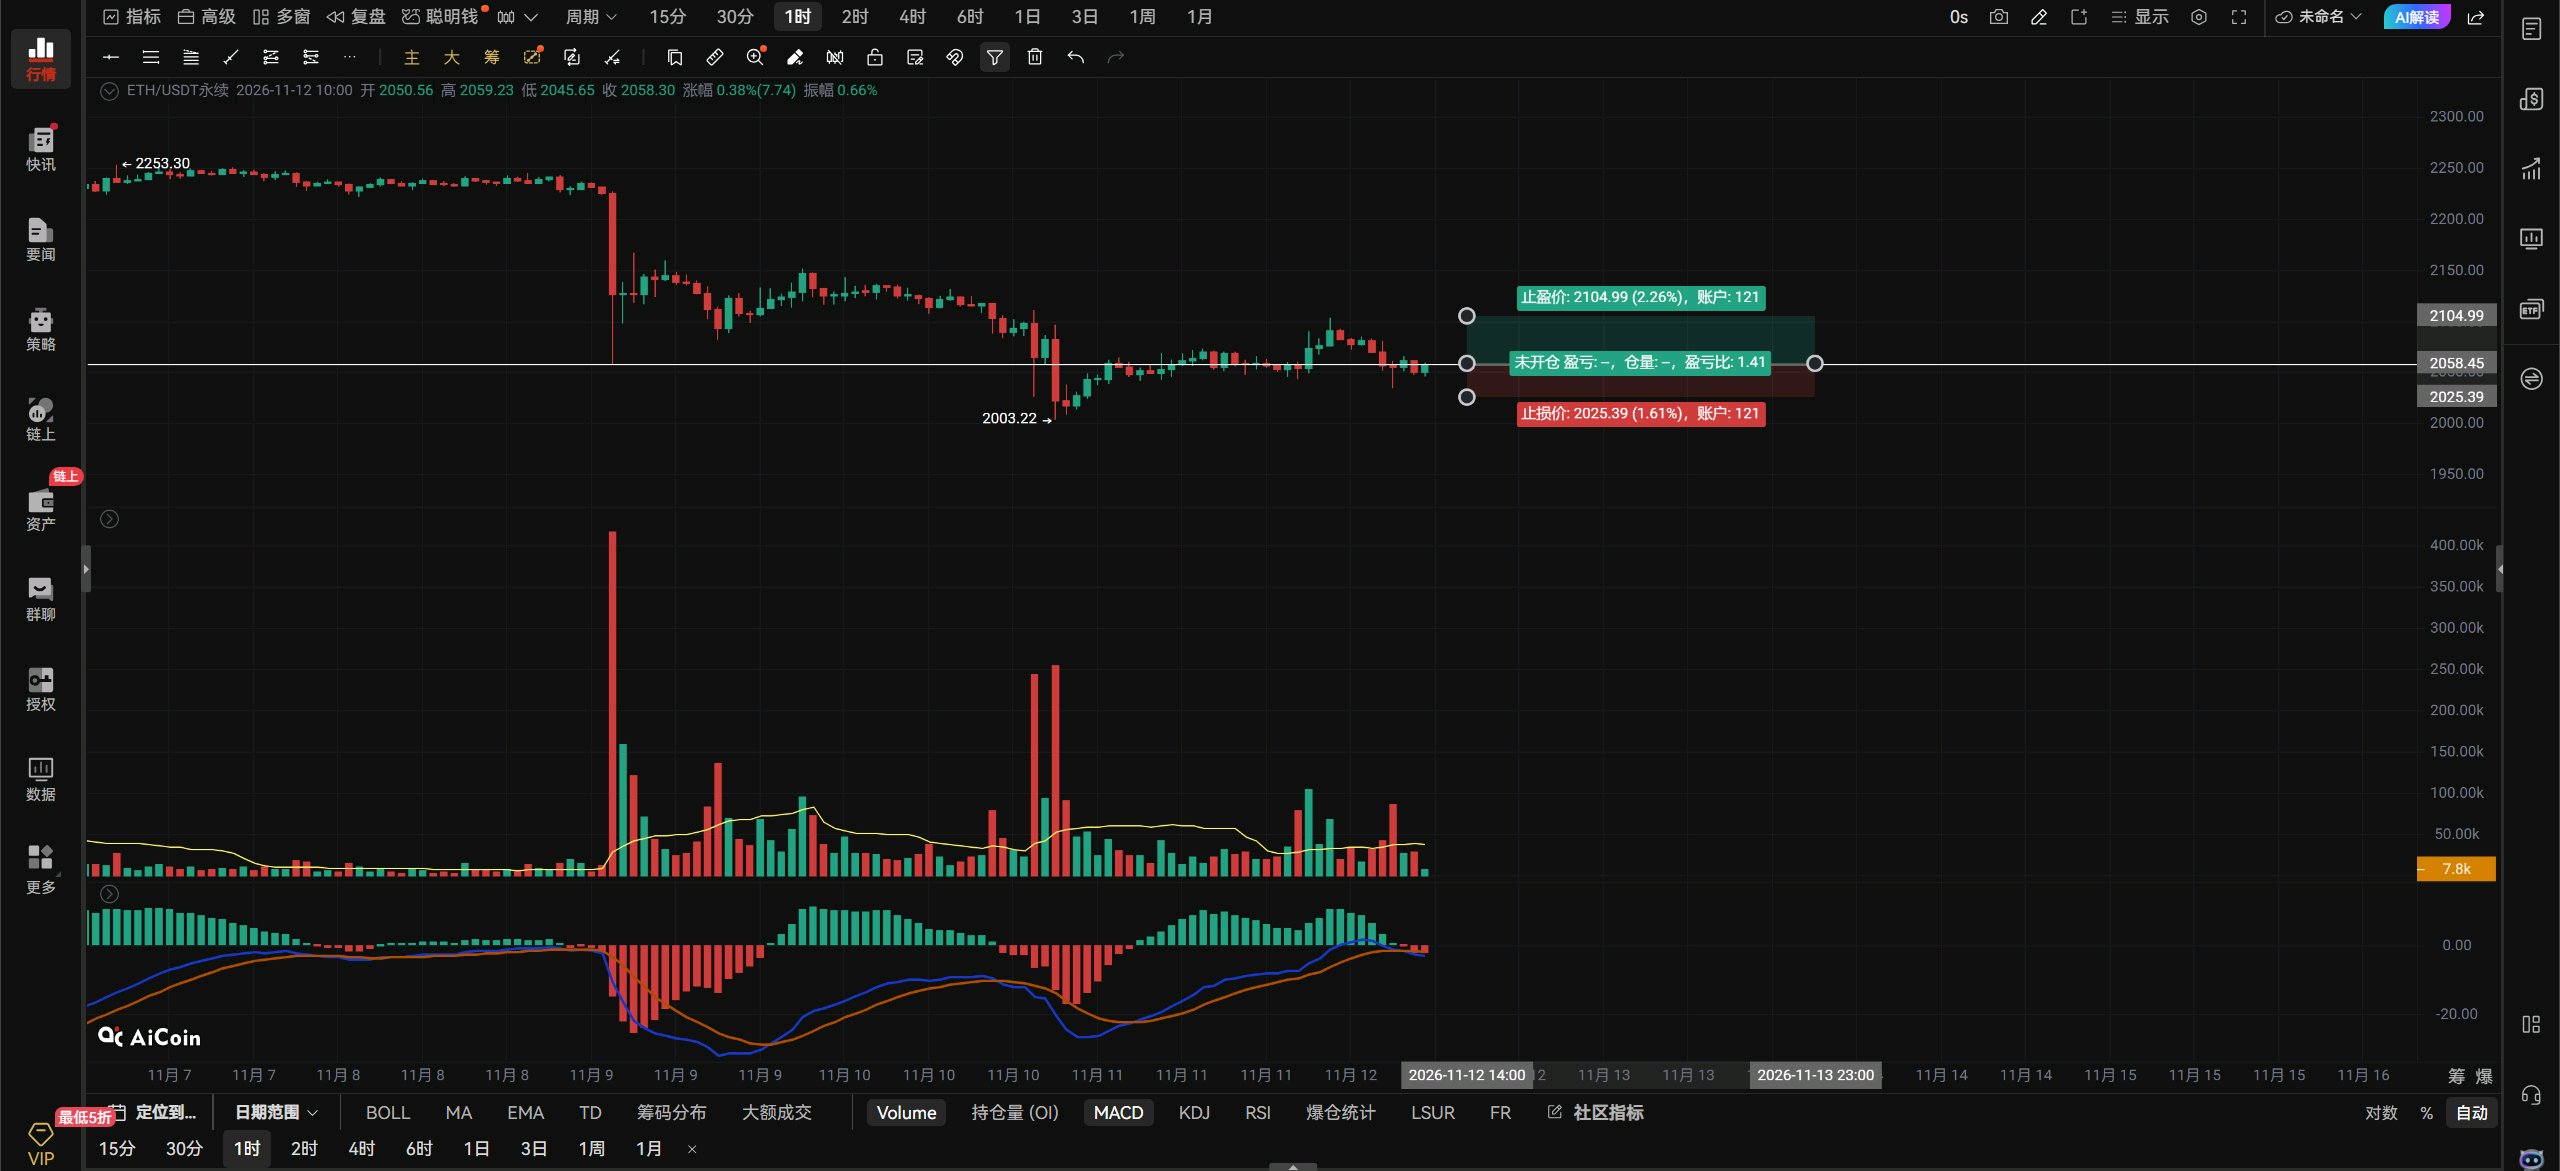
$ETHUSDT Outlook: For ETH, go long on the right side if it breaks above 2058 on strong volume. Set a stop-loss. If it breaks below 2047 on strong volume, go short on the right side. Use a stop-loss. If it retests 2003 and confirms support is holding, go long with one unit. Stop-loss if it breaks below 1956. On the hourly chart, if ETH holds above 2058, look toward 2097–2146. Watch for 2097 above ETH as a place to go short with one unit. Stop-loss if it breaks above 2146. Left-side limit orders: long at 1956; stop-loss if it breaks below 1900. Resistance above: 2058–2097–2146 Support below: 2047–2003–1956 A break below 2047 on the 4-hour chart puts 2003–1956 in view. After the false breakout from the triangle, ETH failed to push straight through 2097 and hold above it. ETH needs to break 2097 on the hourly chart to stop falling and extend its rebound toward resistance at 2146. It failed to get above 2097, and now looks ready to break support at 2047. If 2047 breaks, it will retest the previous low at 2003. If it pulls back to the previous low and holds, a bottom signal could appear, offering a long opportunity. Alternatively, if it briefly breaks below the previous low and then reclaims it, ETH could be a buy. If it breaks below the previous low and fails to recover, don’t go long—the next new low at 1956 is in play. Ideally, ETH will stay above 2047. If it can hold there, it should trade sideways between 2047 and 2097. If it breaks below 2047, ETH is toast again. That’s all.#ByXIMPACT
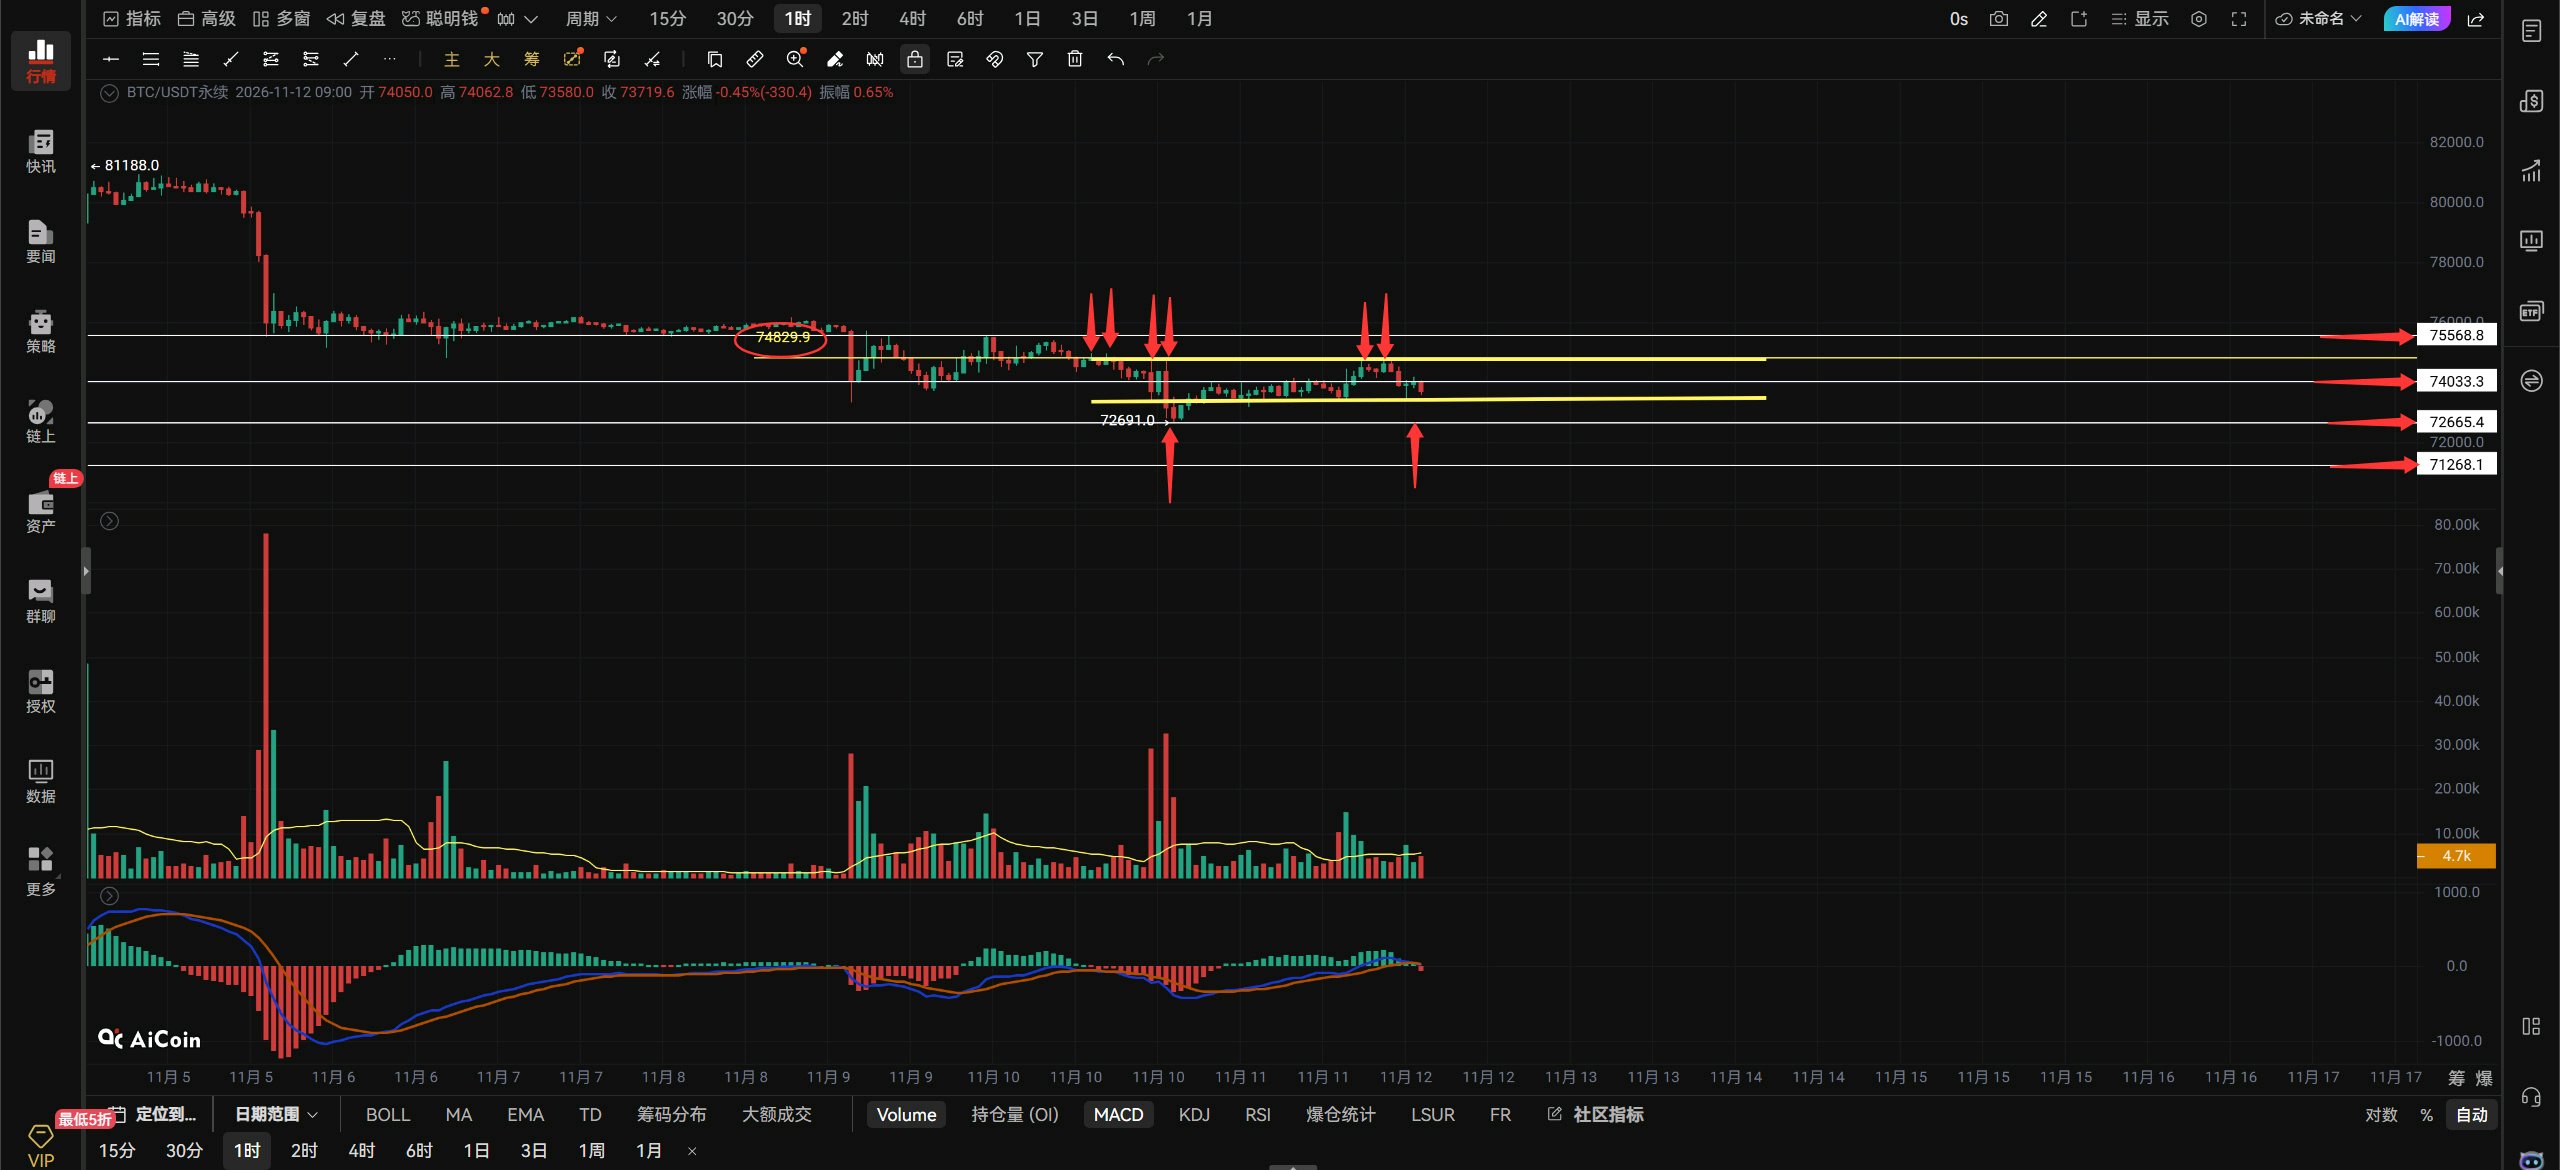
$BTCUSDT Nov. 12 Midday Market Outlook.🫏 $BTC View: Bitcoin’s price action is truly awful—there’s no follow-through at all after even a slight rise. BTC rebounded and broke above 74000, but was blocked by resistance at 74800 and couldn’t extend the rebound. It has now pulled back. Everyone, look at the red arrow above: how many times has 74800 been tested? I’ve lost count. If BTC can’t break through 74800, it can’t extend the rebound. There’s also no positive news specifically supporting BTC, so it looks helpless, isolated, and directionless. When a resistance level has been tested repeatedly without a breakout, it’s now very difficult for BTC to break through on its own. It needs a boost from positive external news; otherwise, it can only pull back. BTC is now trading below 74000 again. Next, we’ll see whether it can reclaim 74000. If it does, it will have another chance to challenge resistance at 74800. If it can’t reclaim 74000, then expect a second retest of the previous low at 72691! If it retests the previous low and holds, a potential double bottom may form. Those looking to go long BTC should watch for a bottom signal at the previous low of 72691, or wait for BTC to break above 74000 and then go long if it retests 74000 without falling below it. If BTC doesn’t break above 74800 or below 72691, expect it to consolidate within this range today! The choppy market is back. Aggressive traders can go long on the right side if BTC breaks above 74000 on strong volume. If it breaks below 73360 on strong volume and the rebound fails to reclaim that level, go short on the right side. Use a stop-loss. On the hourly chart, if BTC breaks above and holds 74000, look toward 74800–75568. If it can’t get above 74000, there’s no point. On the 4-hour chart, if it breaks below 73360, look toward 72691–71268. Resistance above: 74000–74800–75568 Support below: 73360–72691–71268 #ByXIMPACT
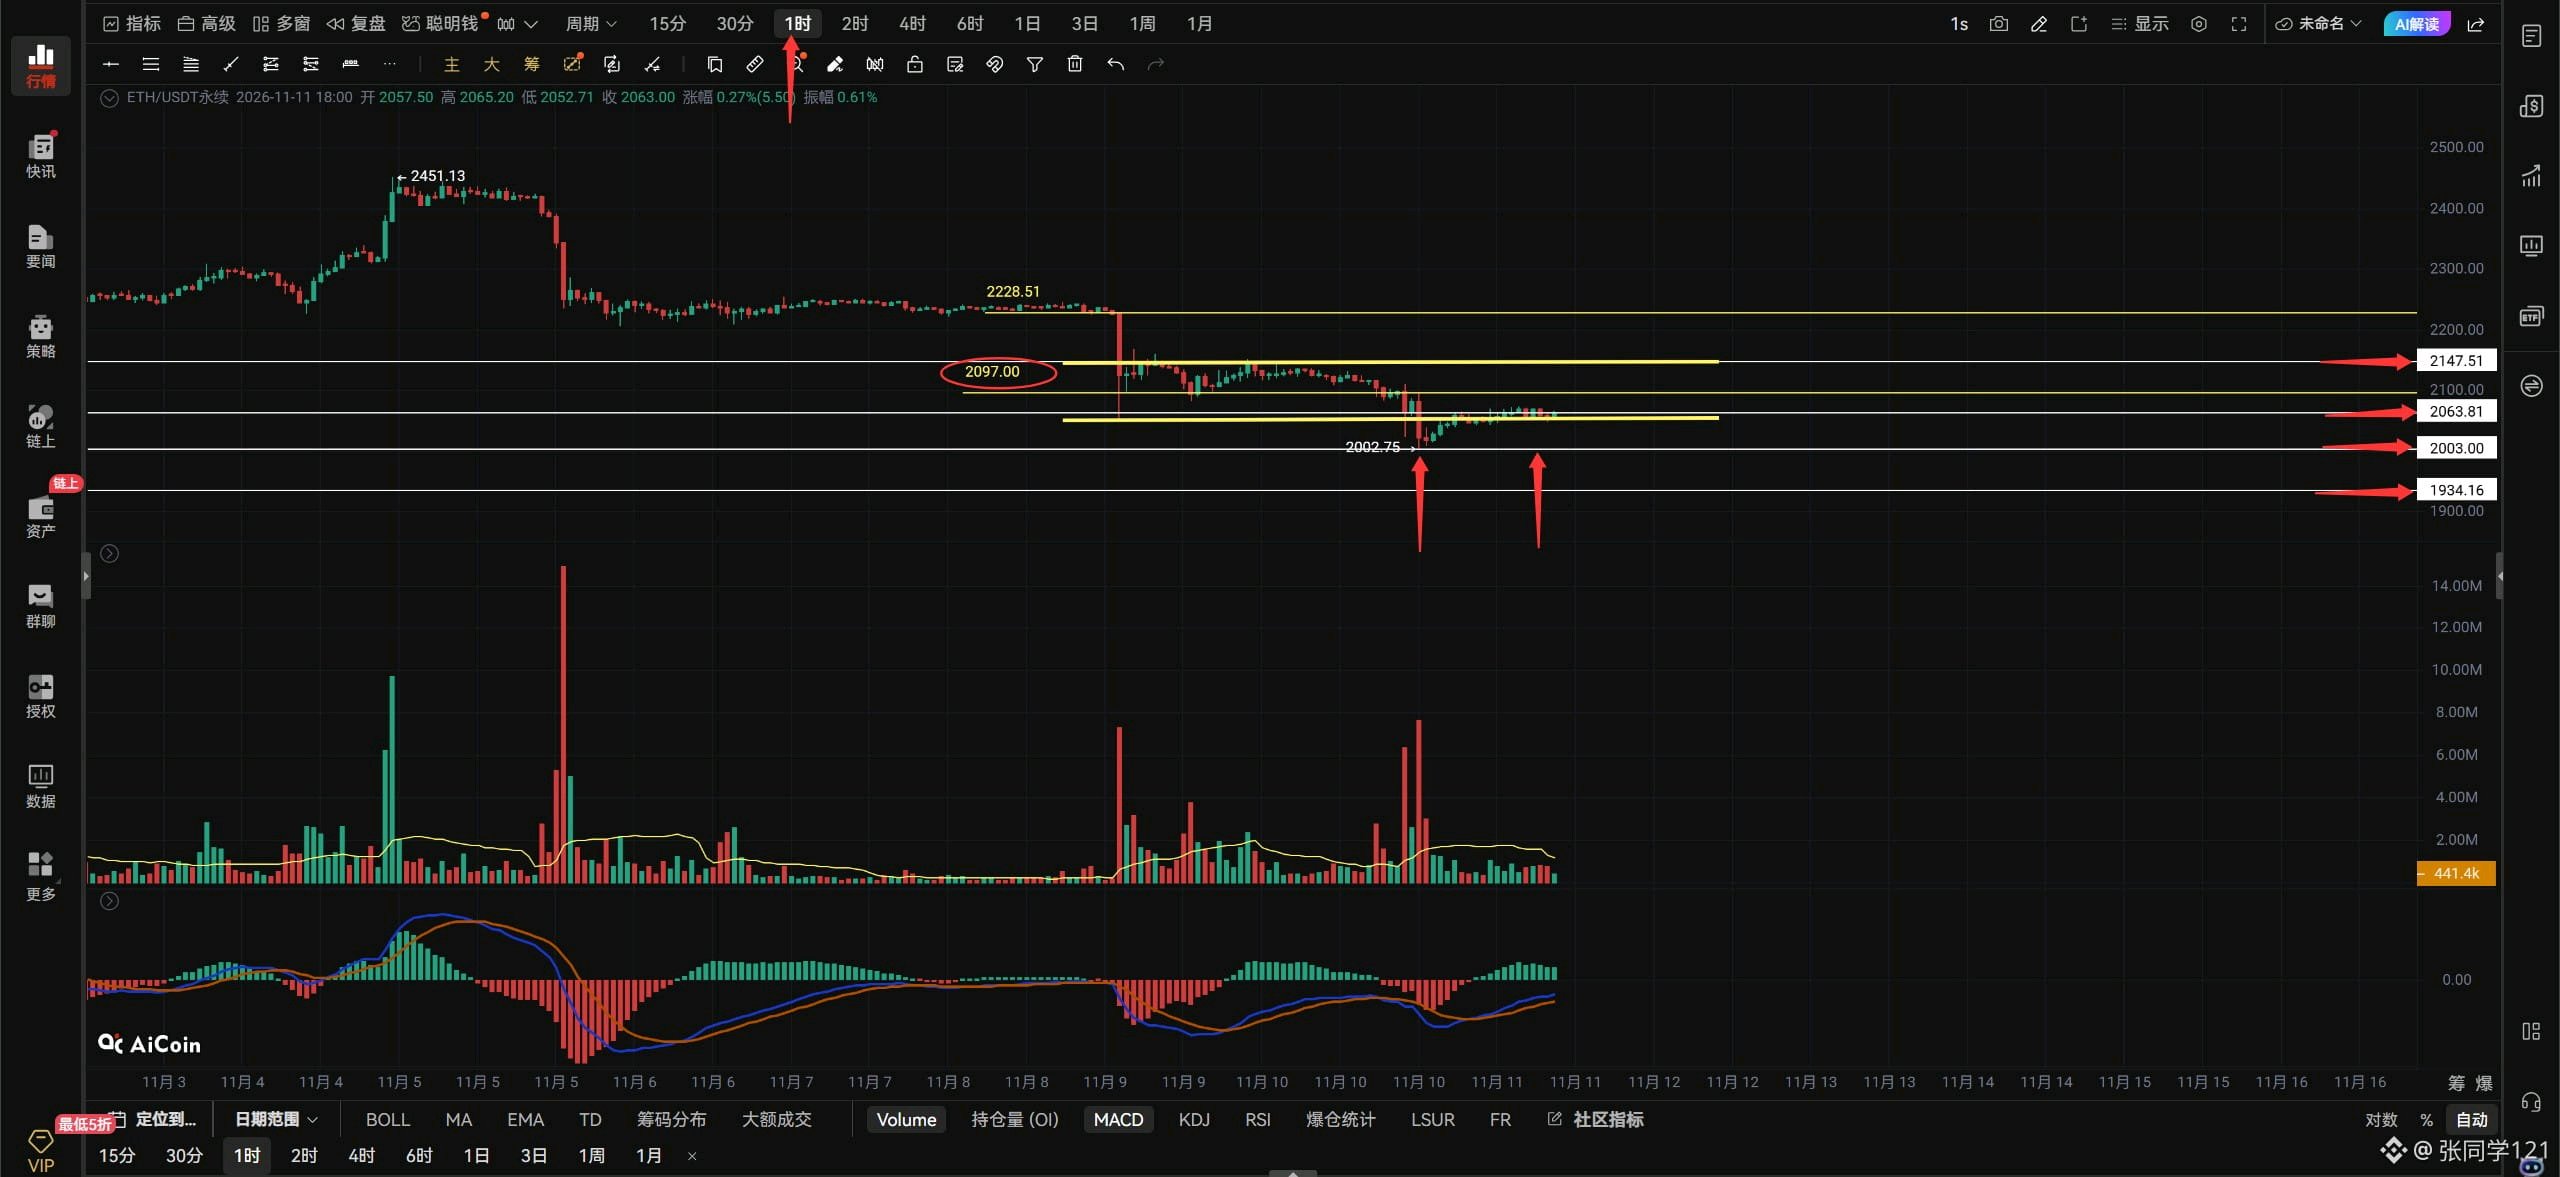
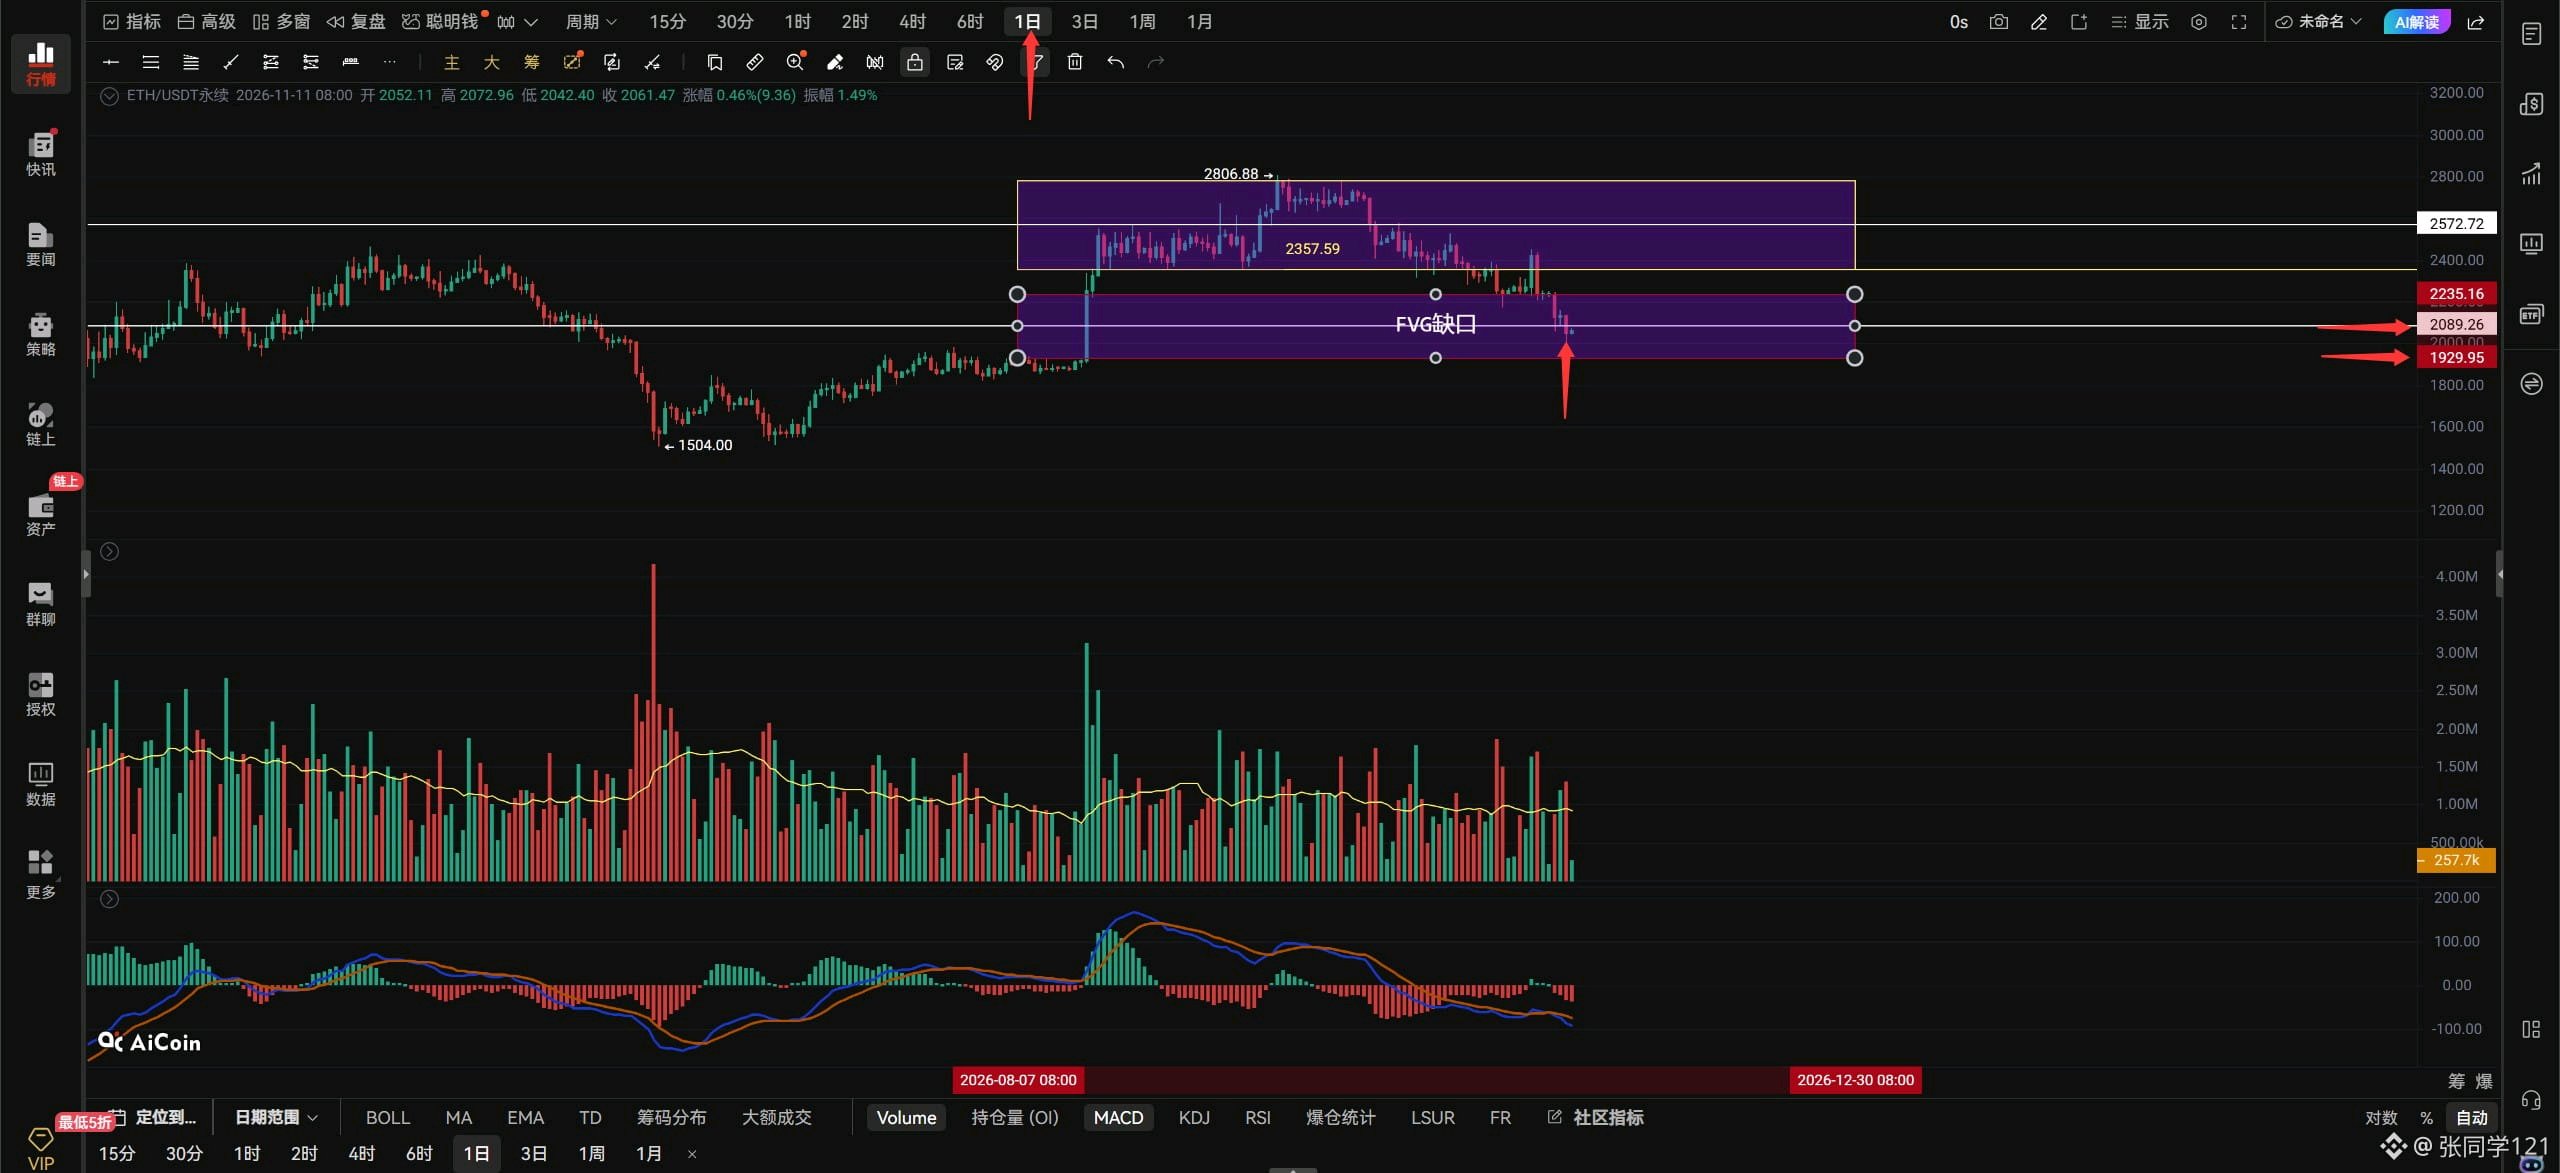
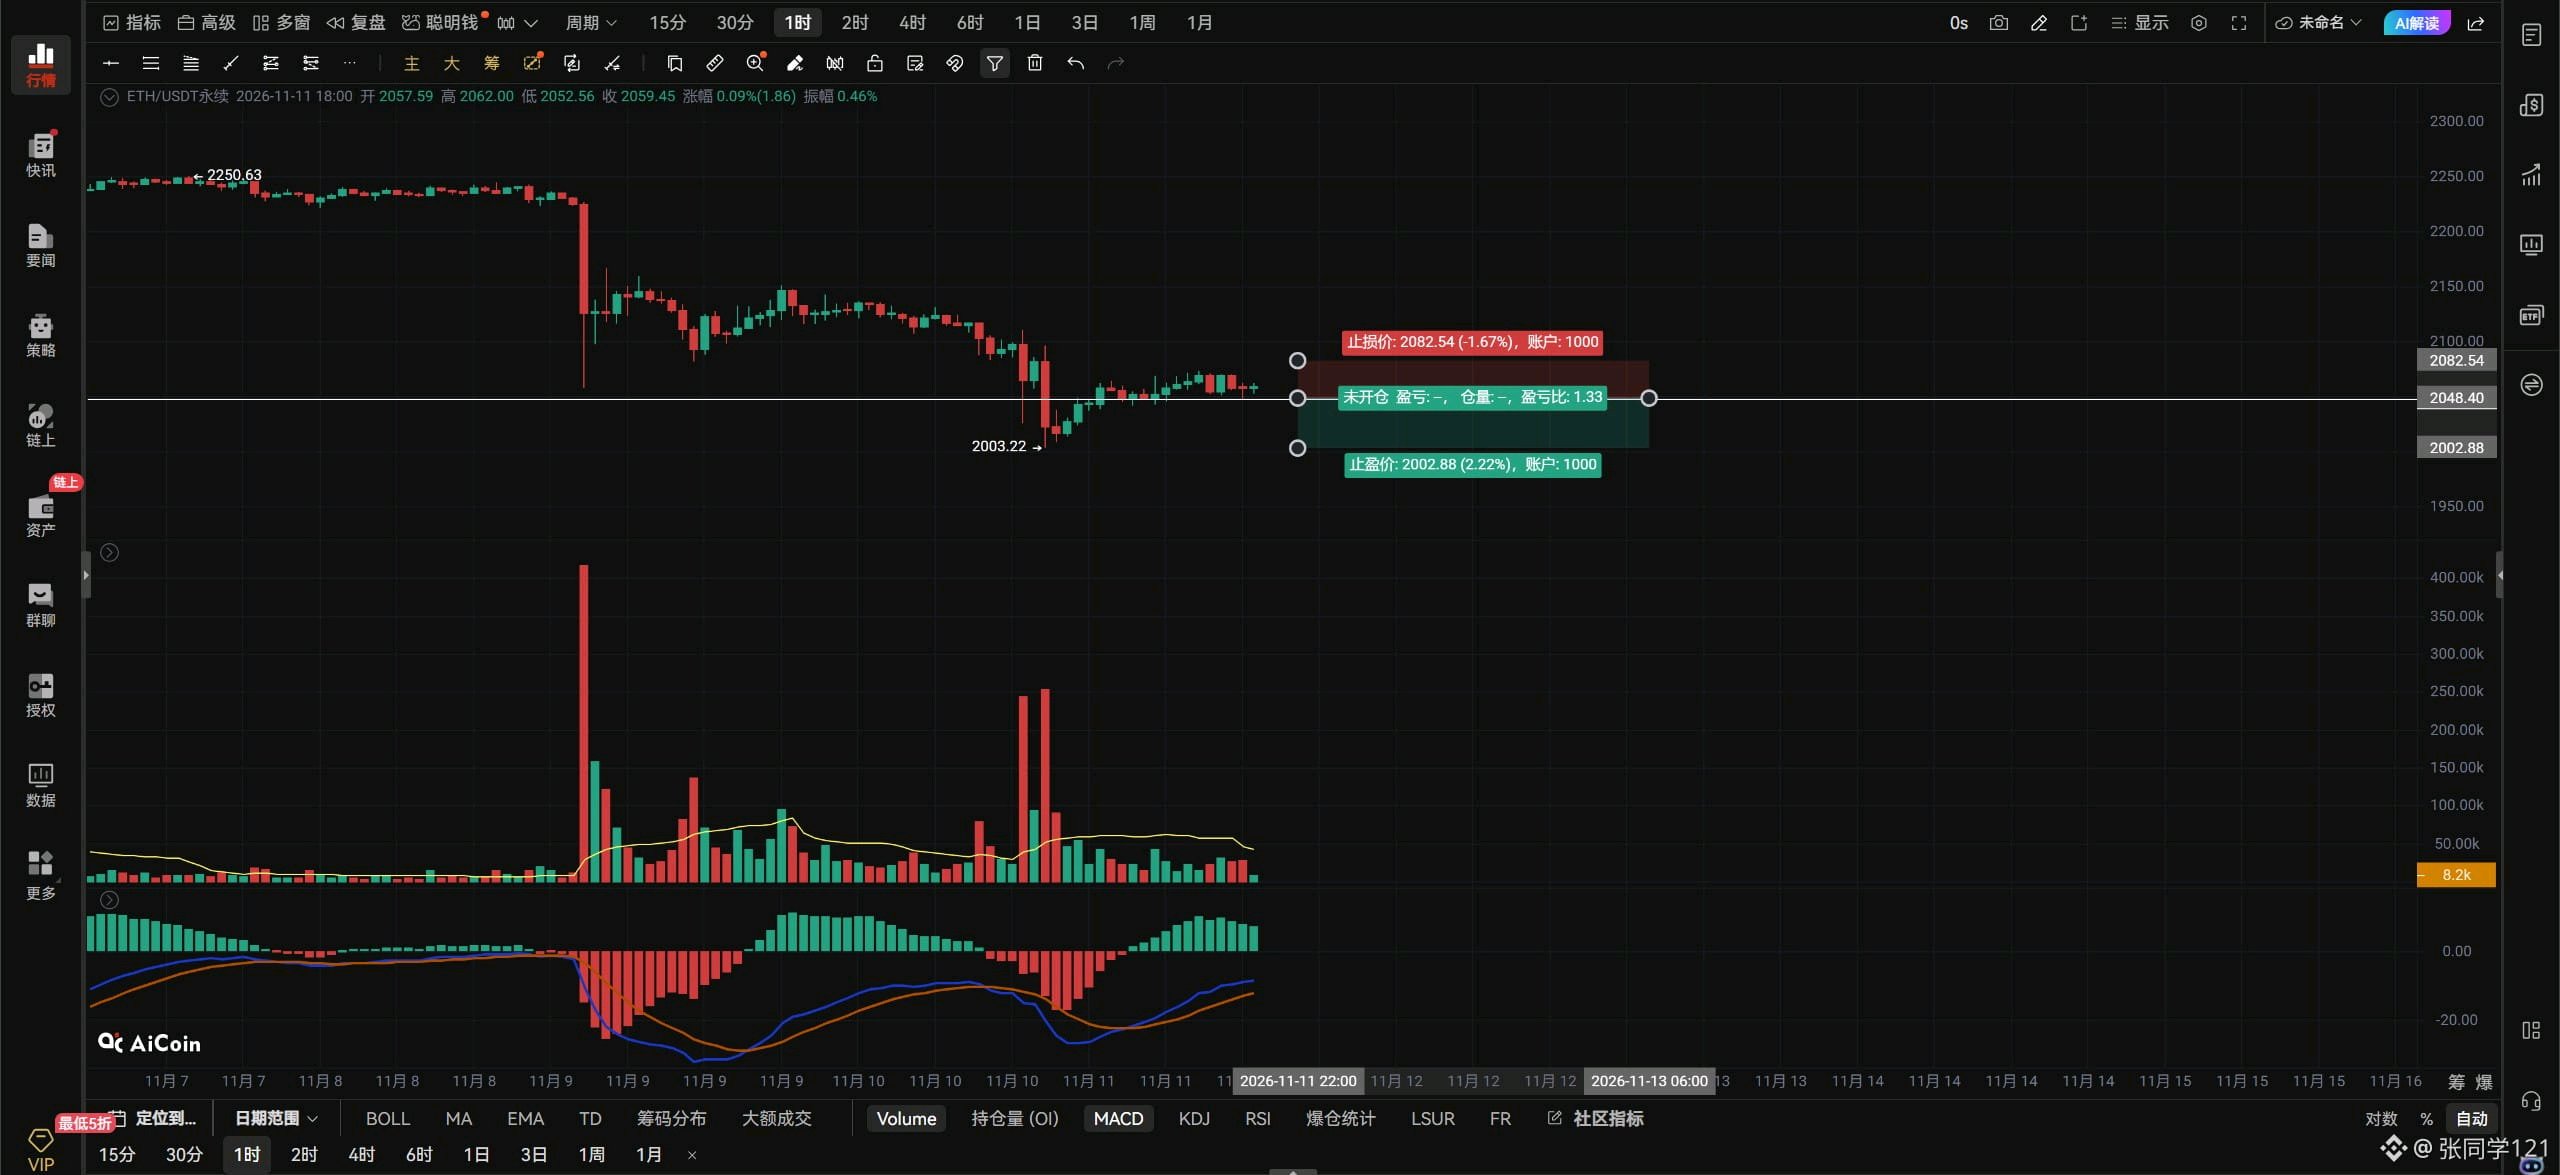
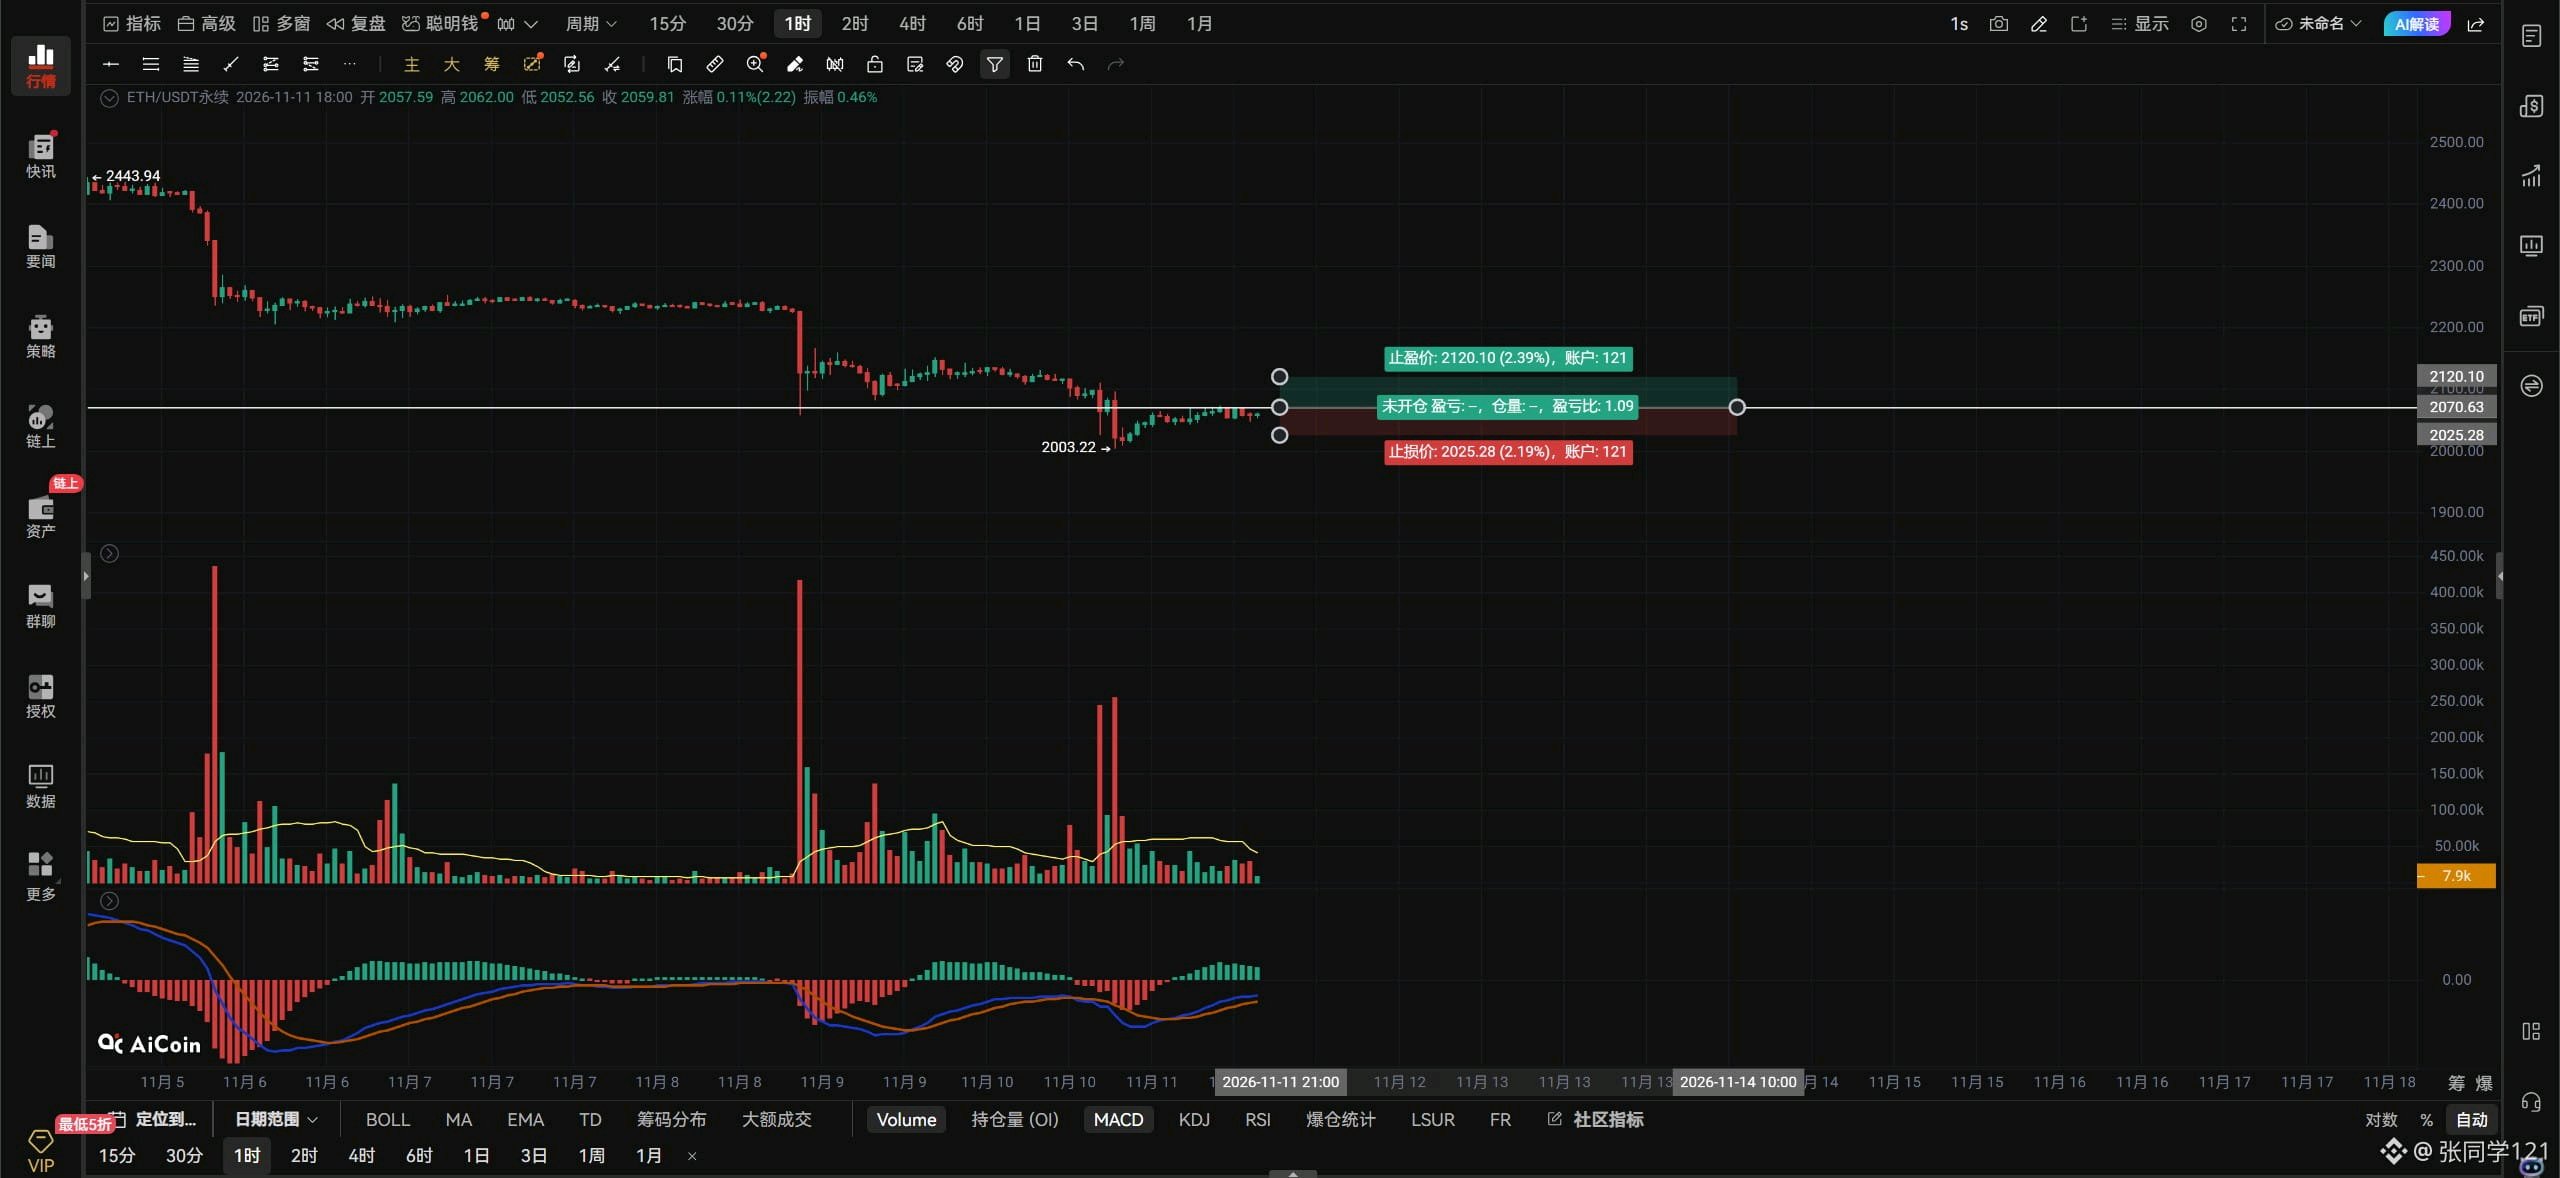
$ETHUSDT Evening outlook: 11/11. Ethereum made a false break below the 2147–2063 consolidation range, but has now moved back above 2063. It must stay above 2063 to find a bottom and rebound, with 2097–2147 as the upside target. Only a break above 2147 would restart the hourly uptrend. If Ethereum pulls back and breaks below 2063, it likely won’t hold the previous low at 2002. 2000 is major support for Ethereum, and this is the first retest of that level. If the first retest of major support at 2000 can’t produce even a $150 rebound, that suggests buyers around 2000 haven’t stepped in—people just aren’t interested. Everyone may have reached the same conclusion: Ethereum is bound to break below 2000. So if Ethereum’s first rebound from 2000 can’t get back above 2147, a second retest of 2000 will certainly break below it. Ethereum will only be temporarily out of danger if it can get back above 2147. If 2000 breaks, watch 1934! If you want to go long on Ethereum, keep an eye on major support at 2000; go long if the retest holds and a long signal appears. If it breaks straight through, wait and see. Go long on Ethereum if it breaks above 2070 with volume; go short if it breaks below 2048 with volume. Watch for changes in volume and use stop-losses. If Ethereum holds above 2070 on the hourly chart, look for 2097–2147. If it breaks below 2048 on the 4-hour chart, look down to 2000–1934. Ethereum’s daily candle ultimately closed below 2089. Ethereum is pretty much cooked; now we’ll see whether 2000 can hold and trigger a strong rebound. If Ethereum can’t get back above 2089 on the daily chart, the next downside target is around 1929. A move to 1929 would completely fill the daily gap. Once the gap is filled, we’ll have to see how much further it can fall. For now, focus mainly on shorting rebounds, with longs as a secondary strategy to catch bounces. Ethereum is already at 2000—are you still not buying spot? Waiting for 1500–1300? If it gets down to 1500–1300, you can add to your position then! But what if it never gets there—won’t you miss out on spot? Buy Ethereum spot in batches! Don’t end up slapping your thigh when it takes off. Meeting adjourned. #ByXIMPACT
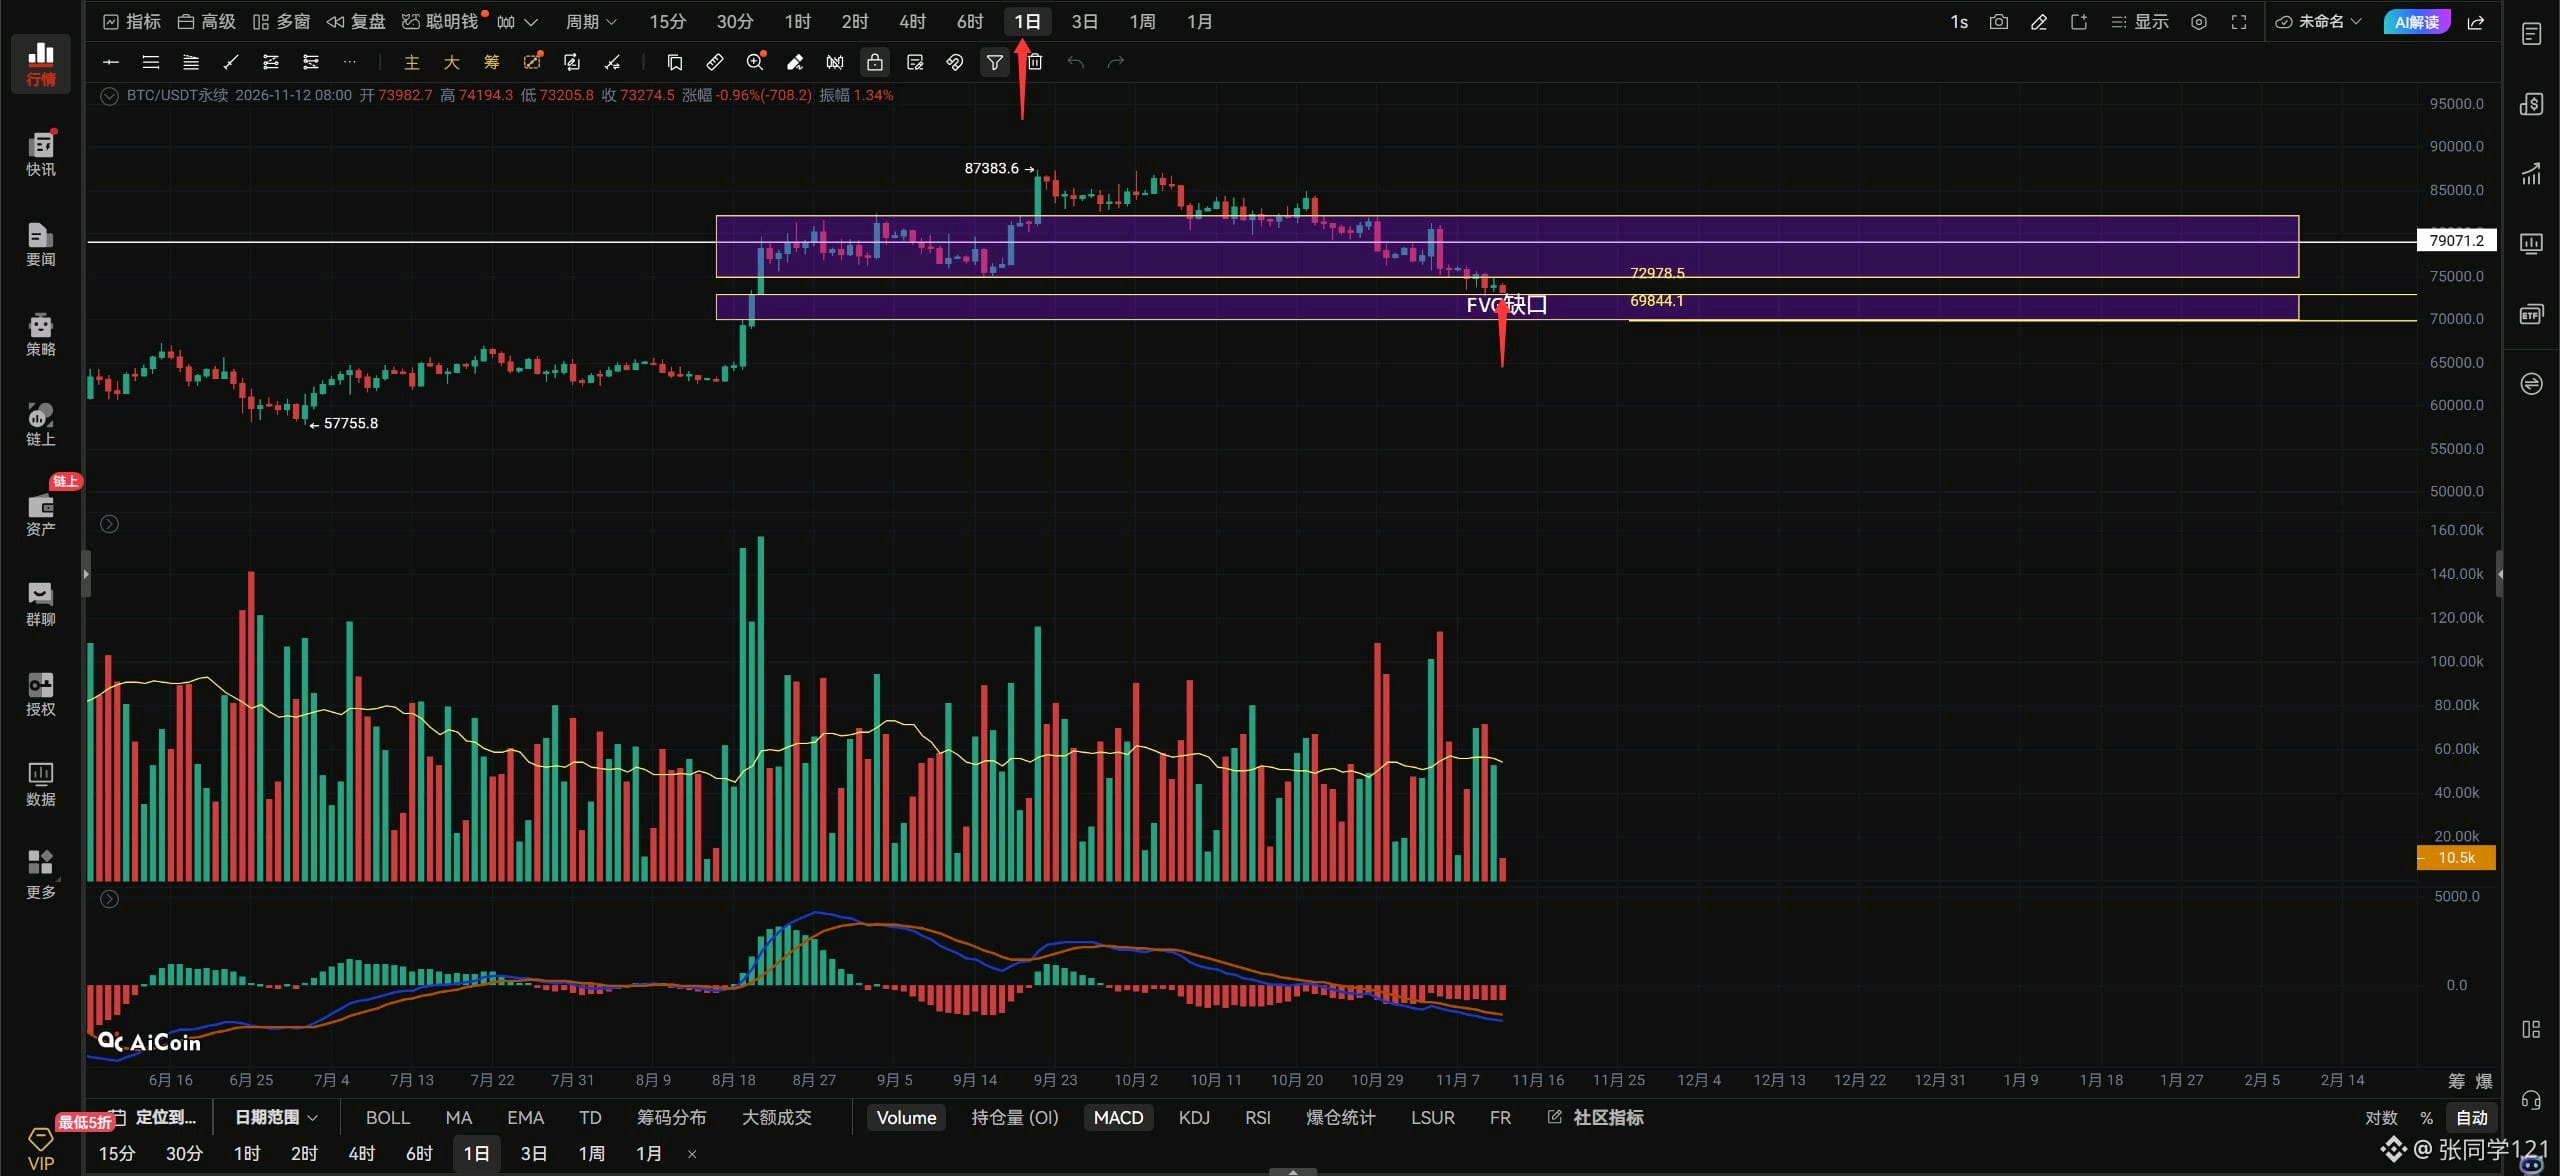
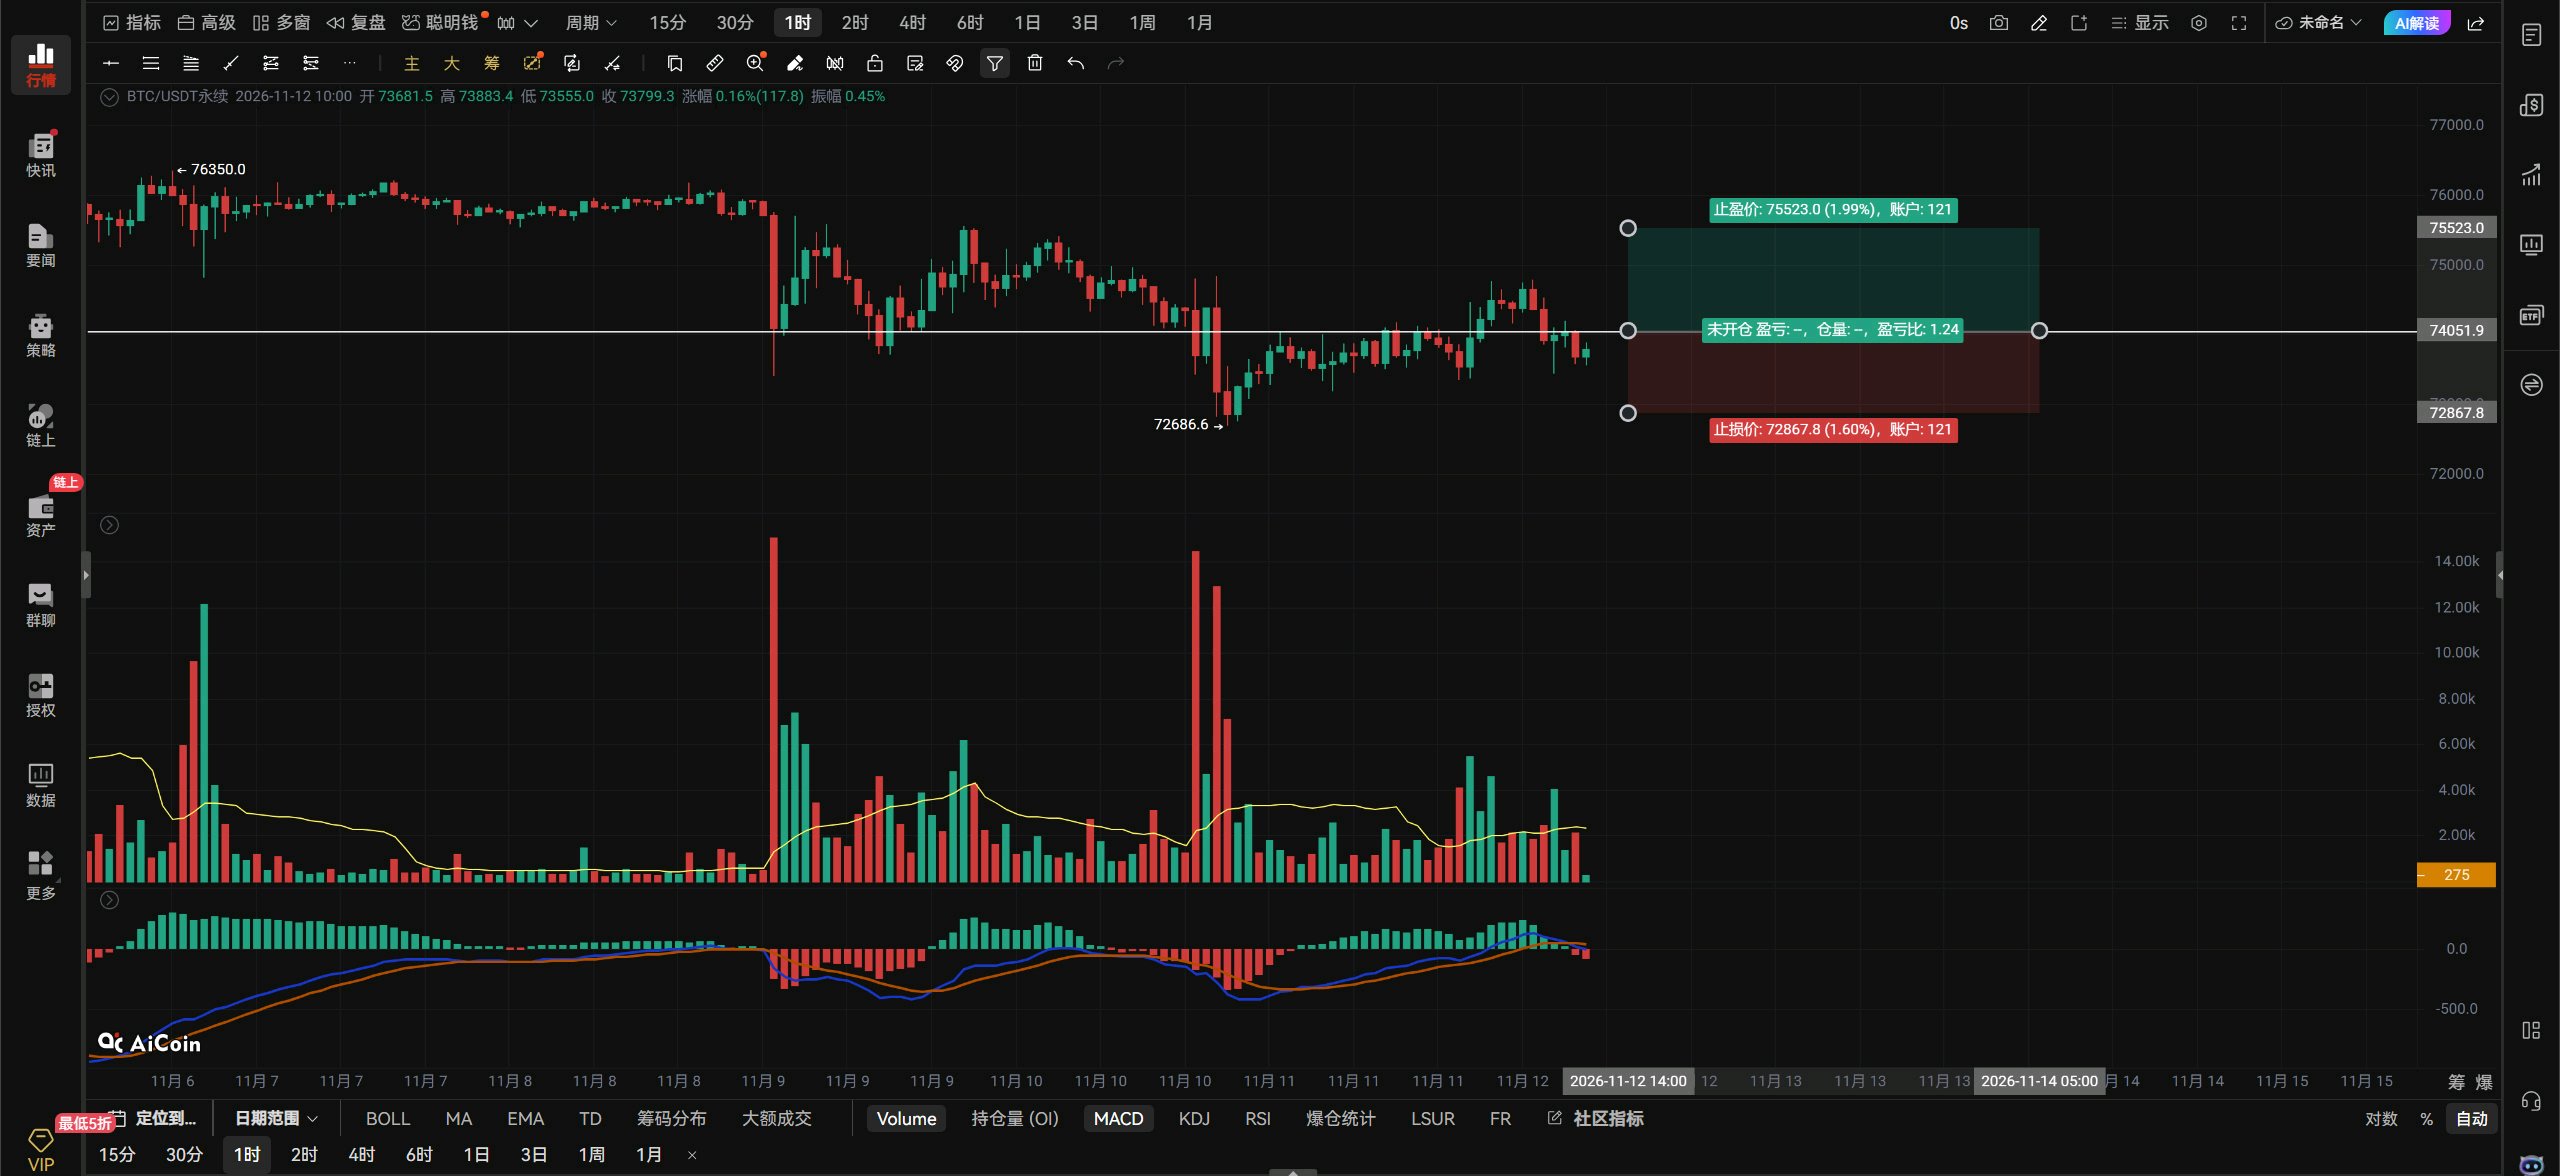
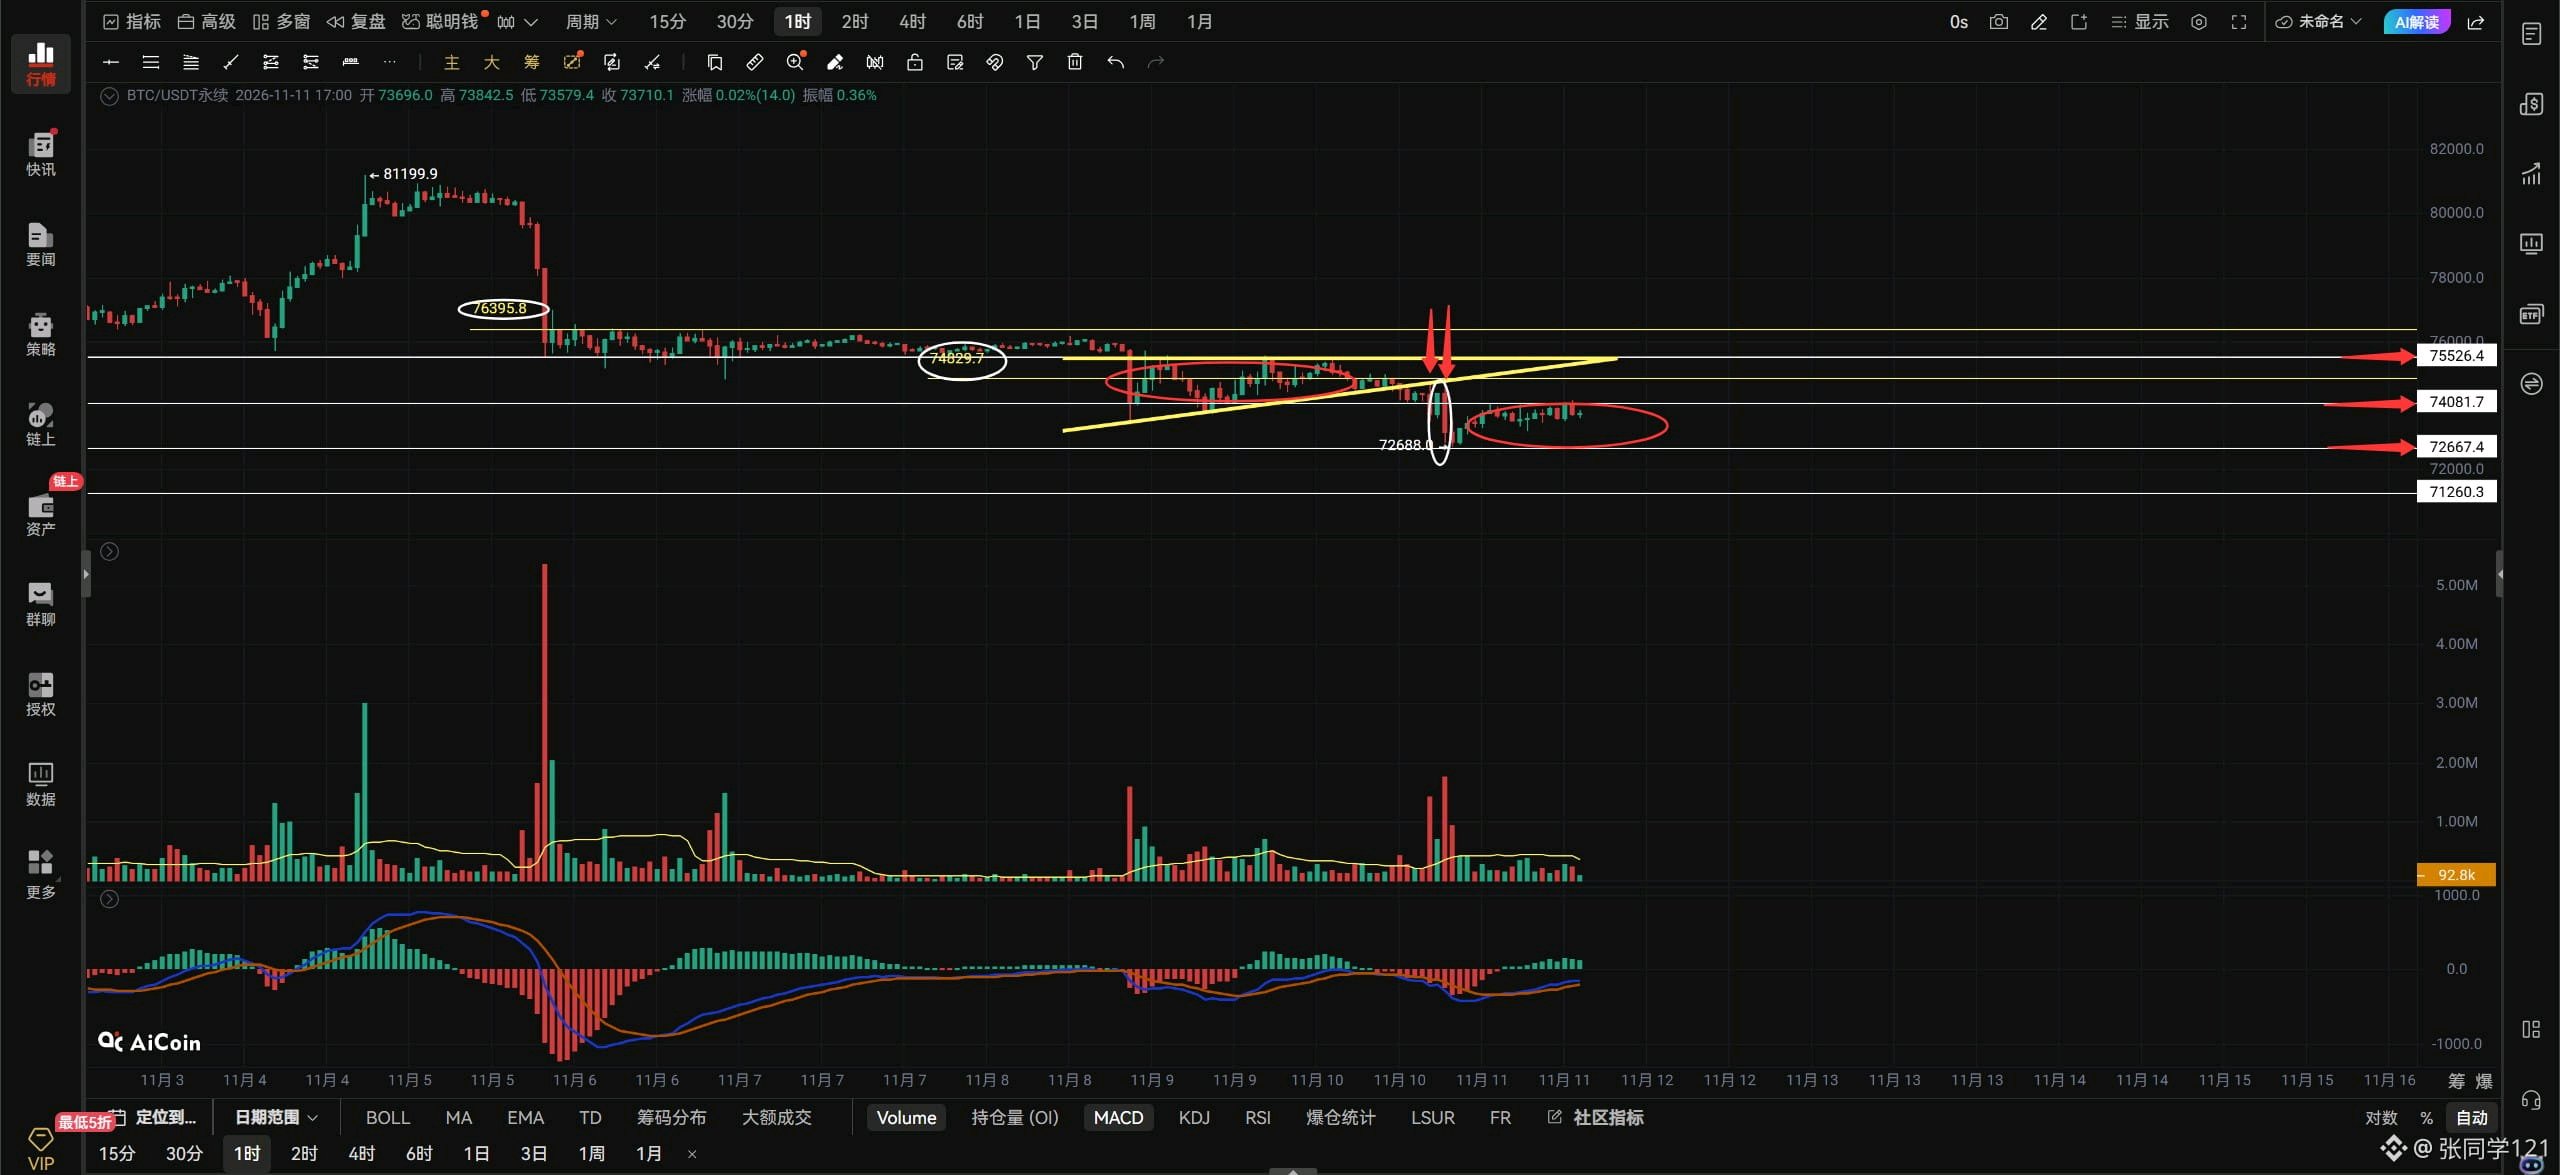
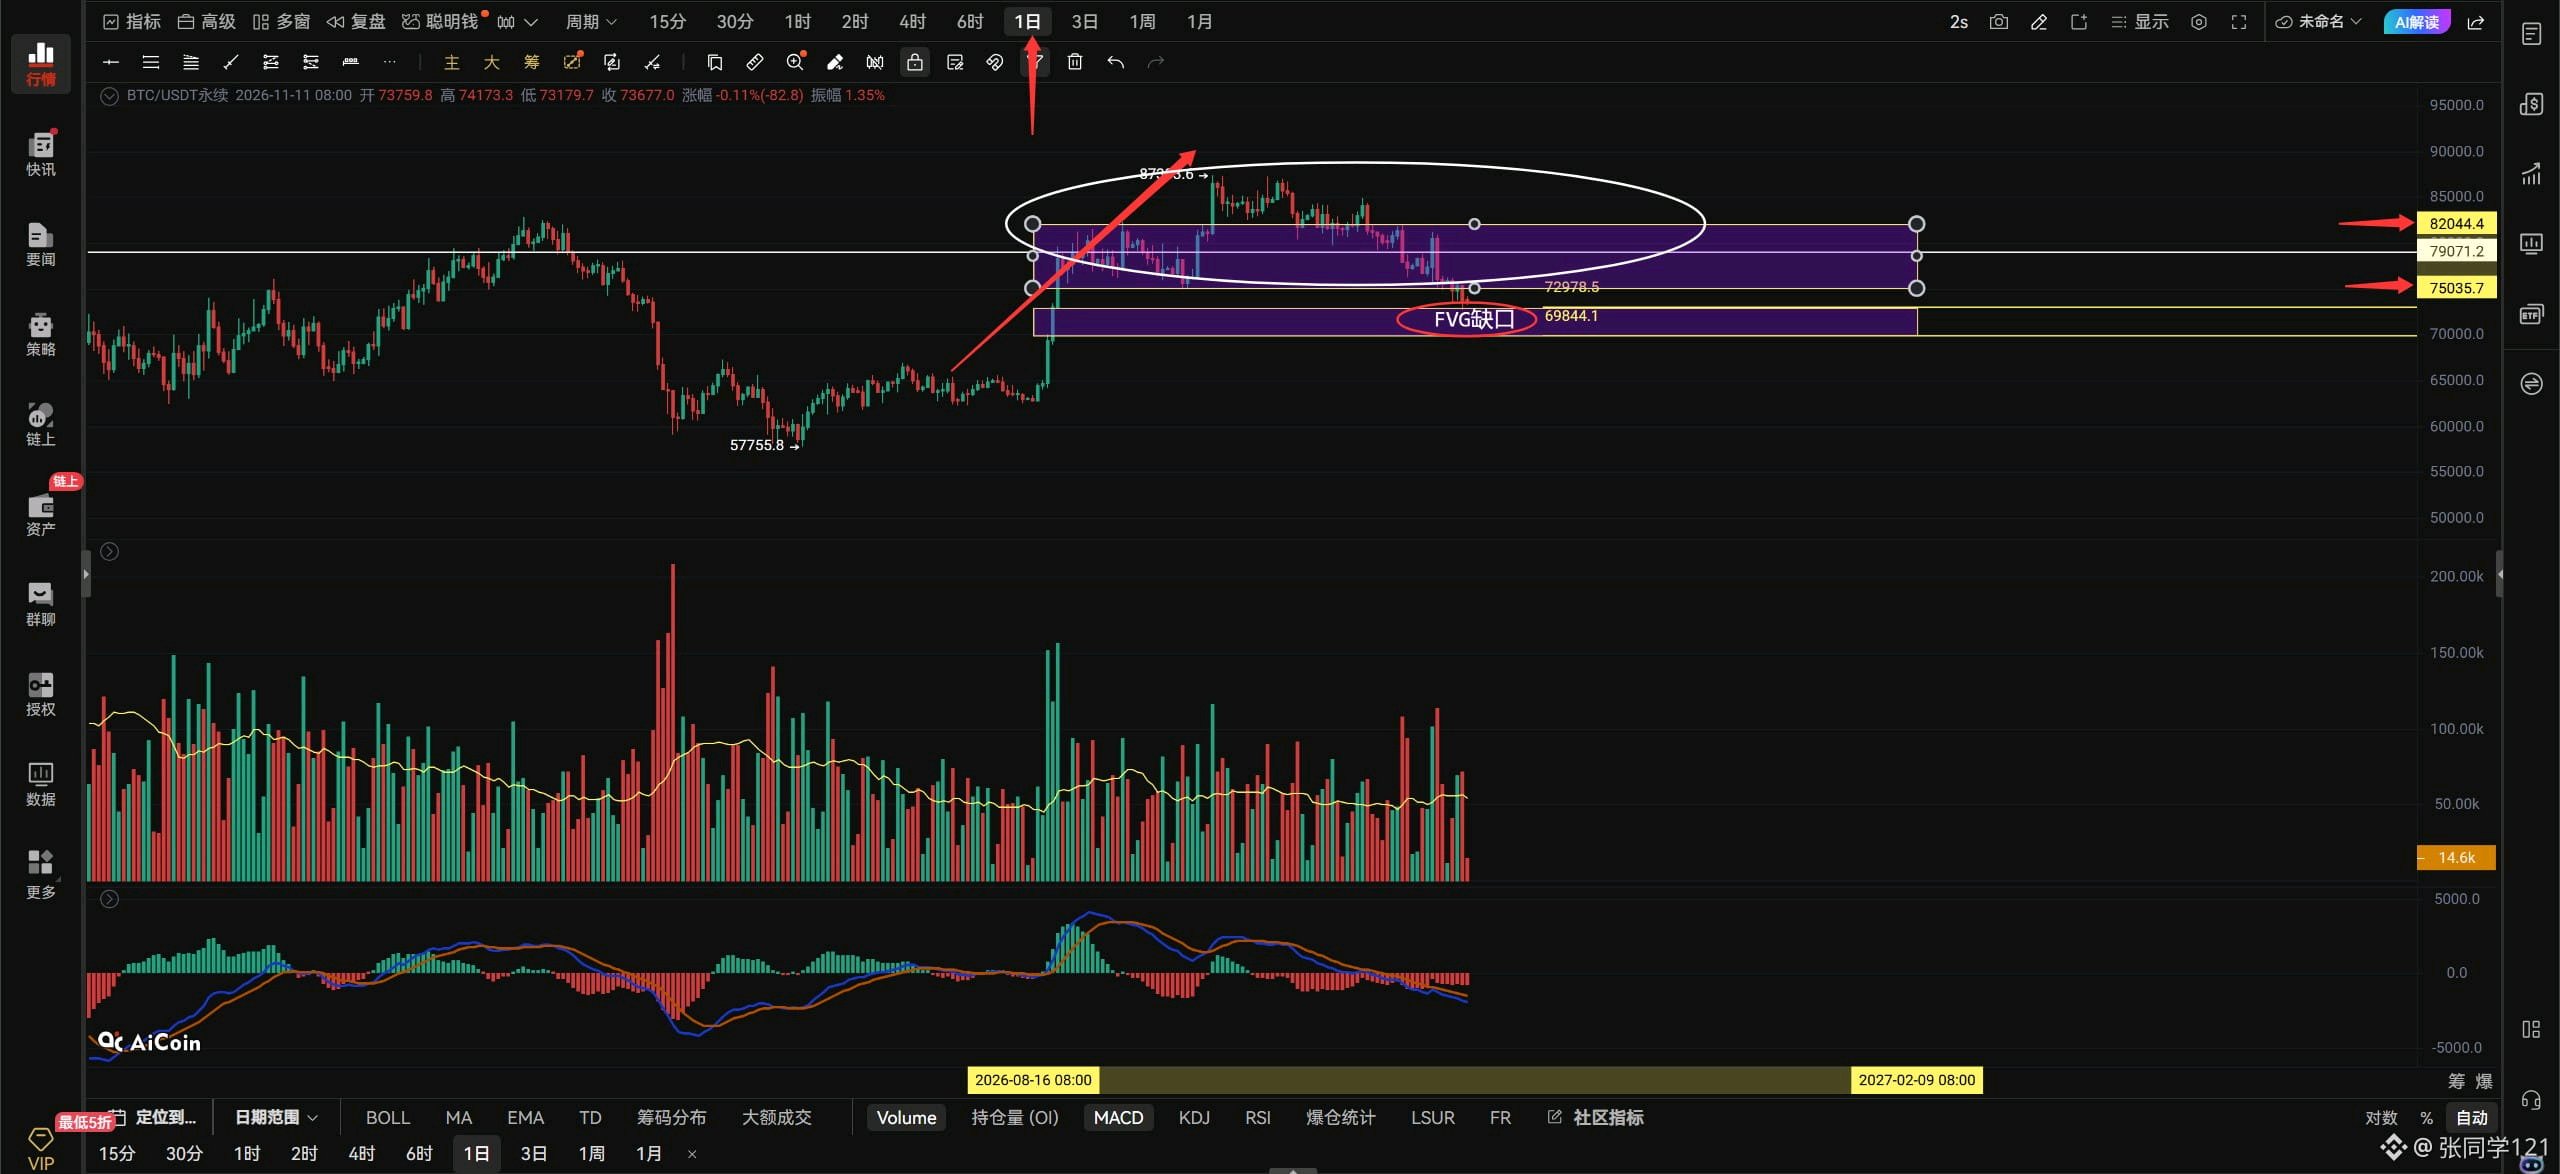
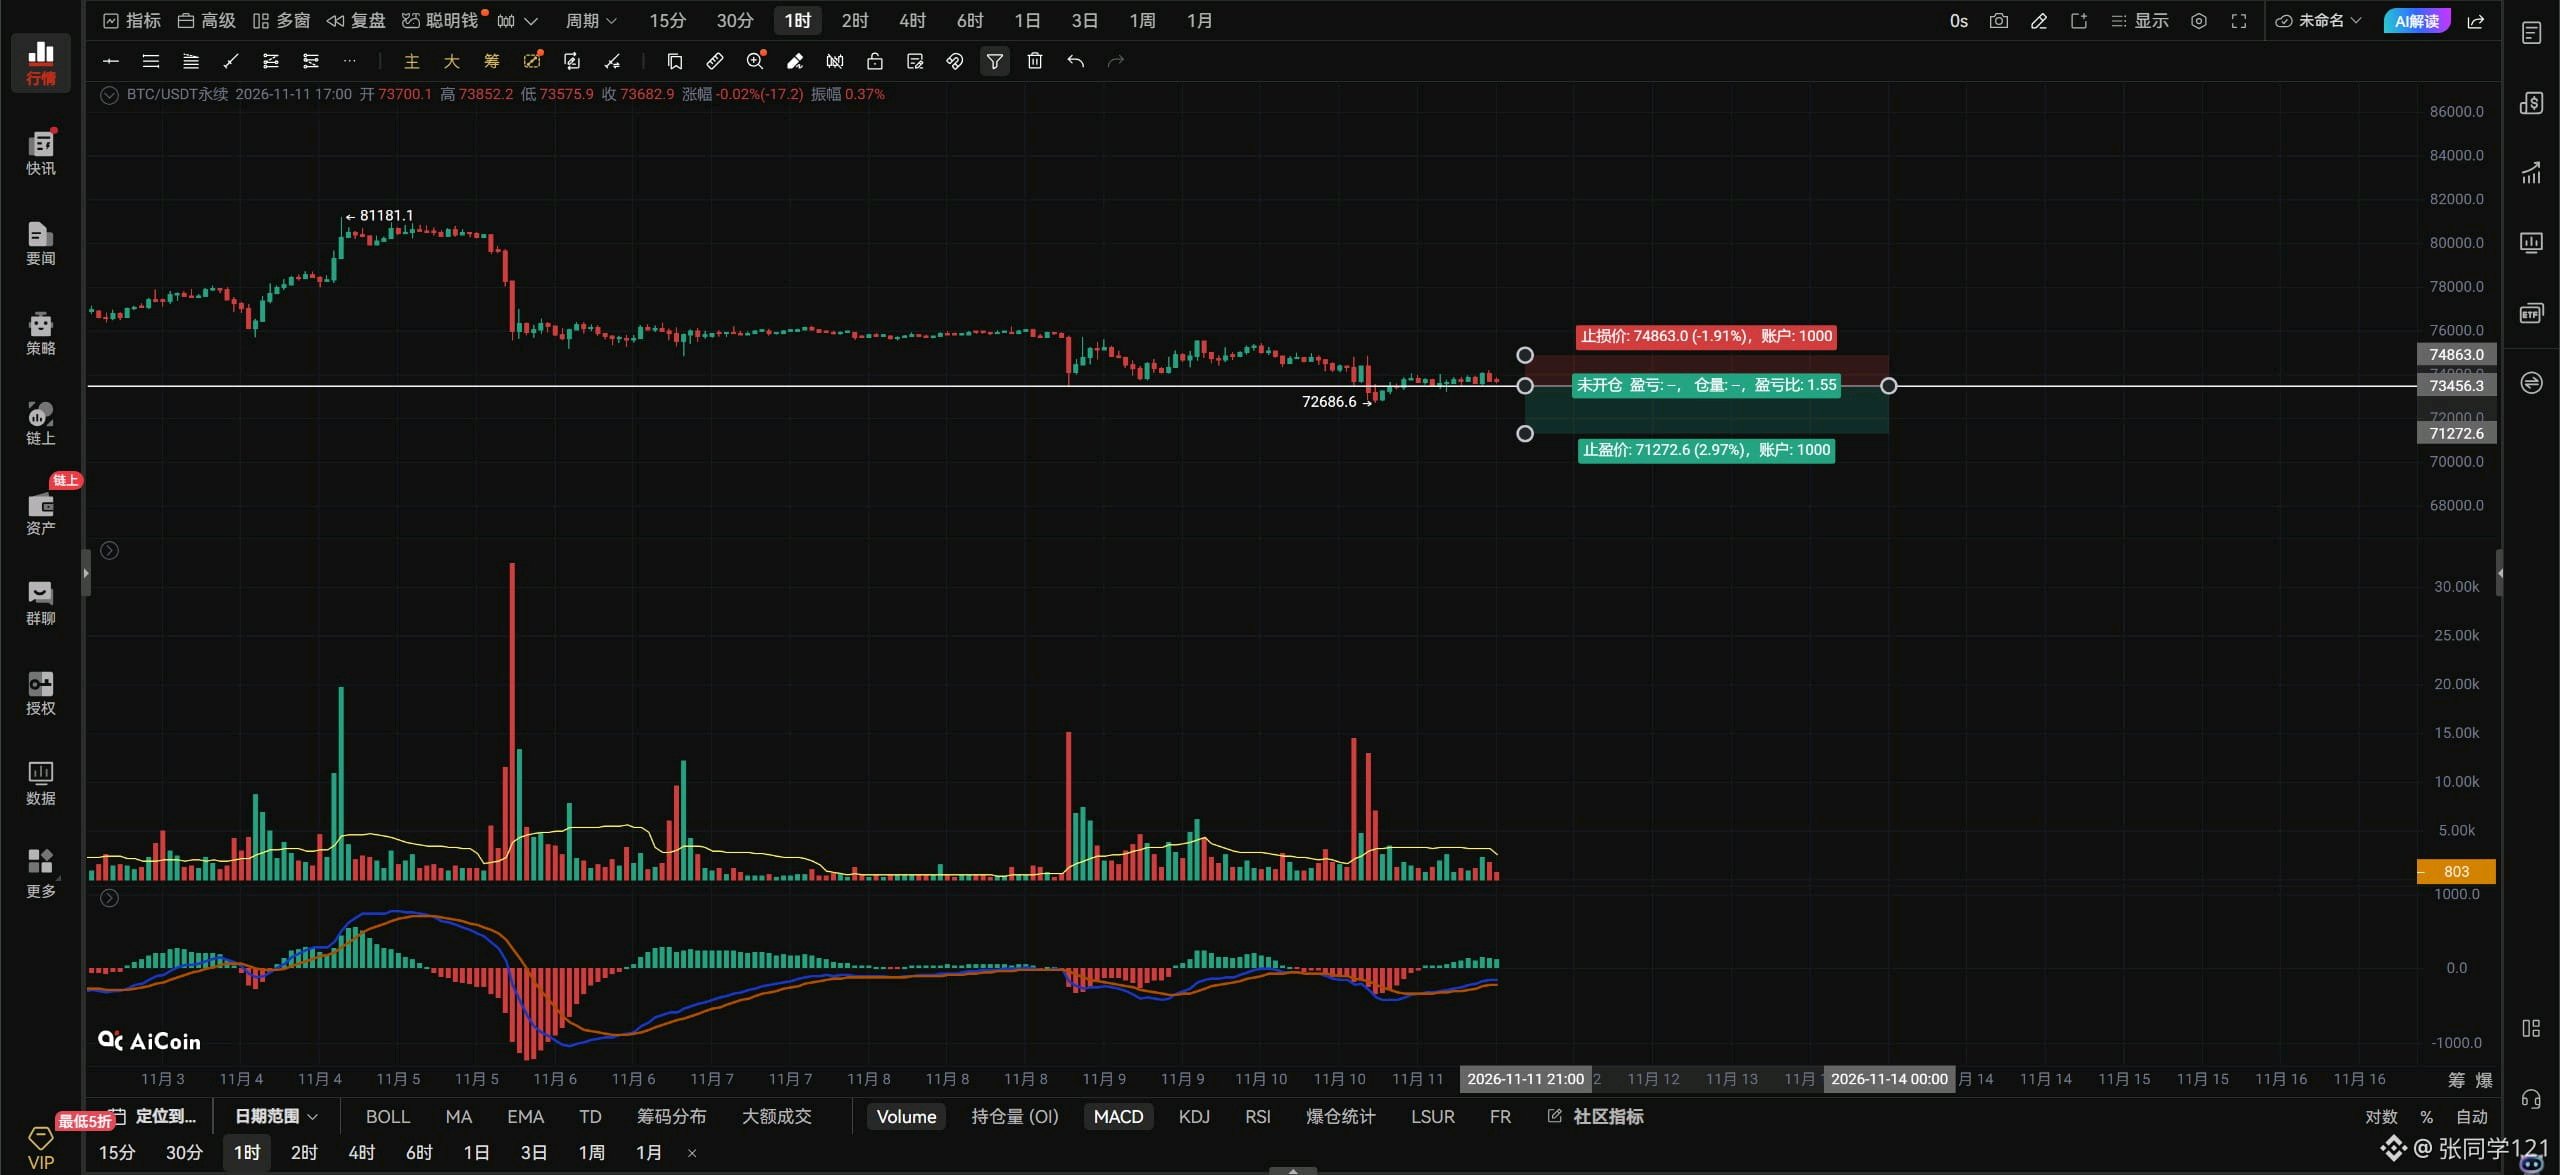
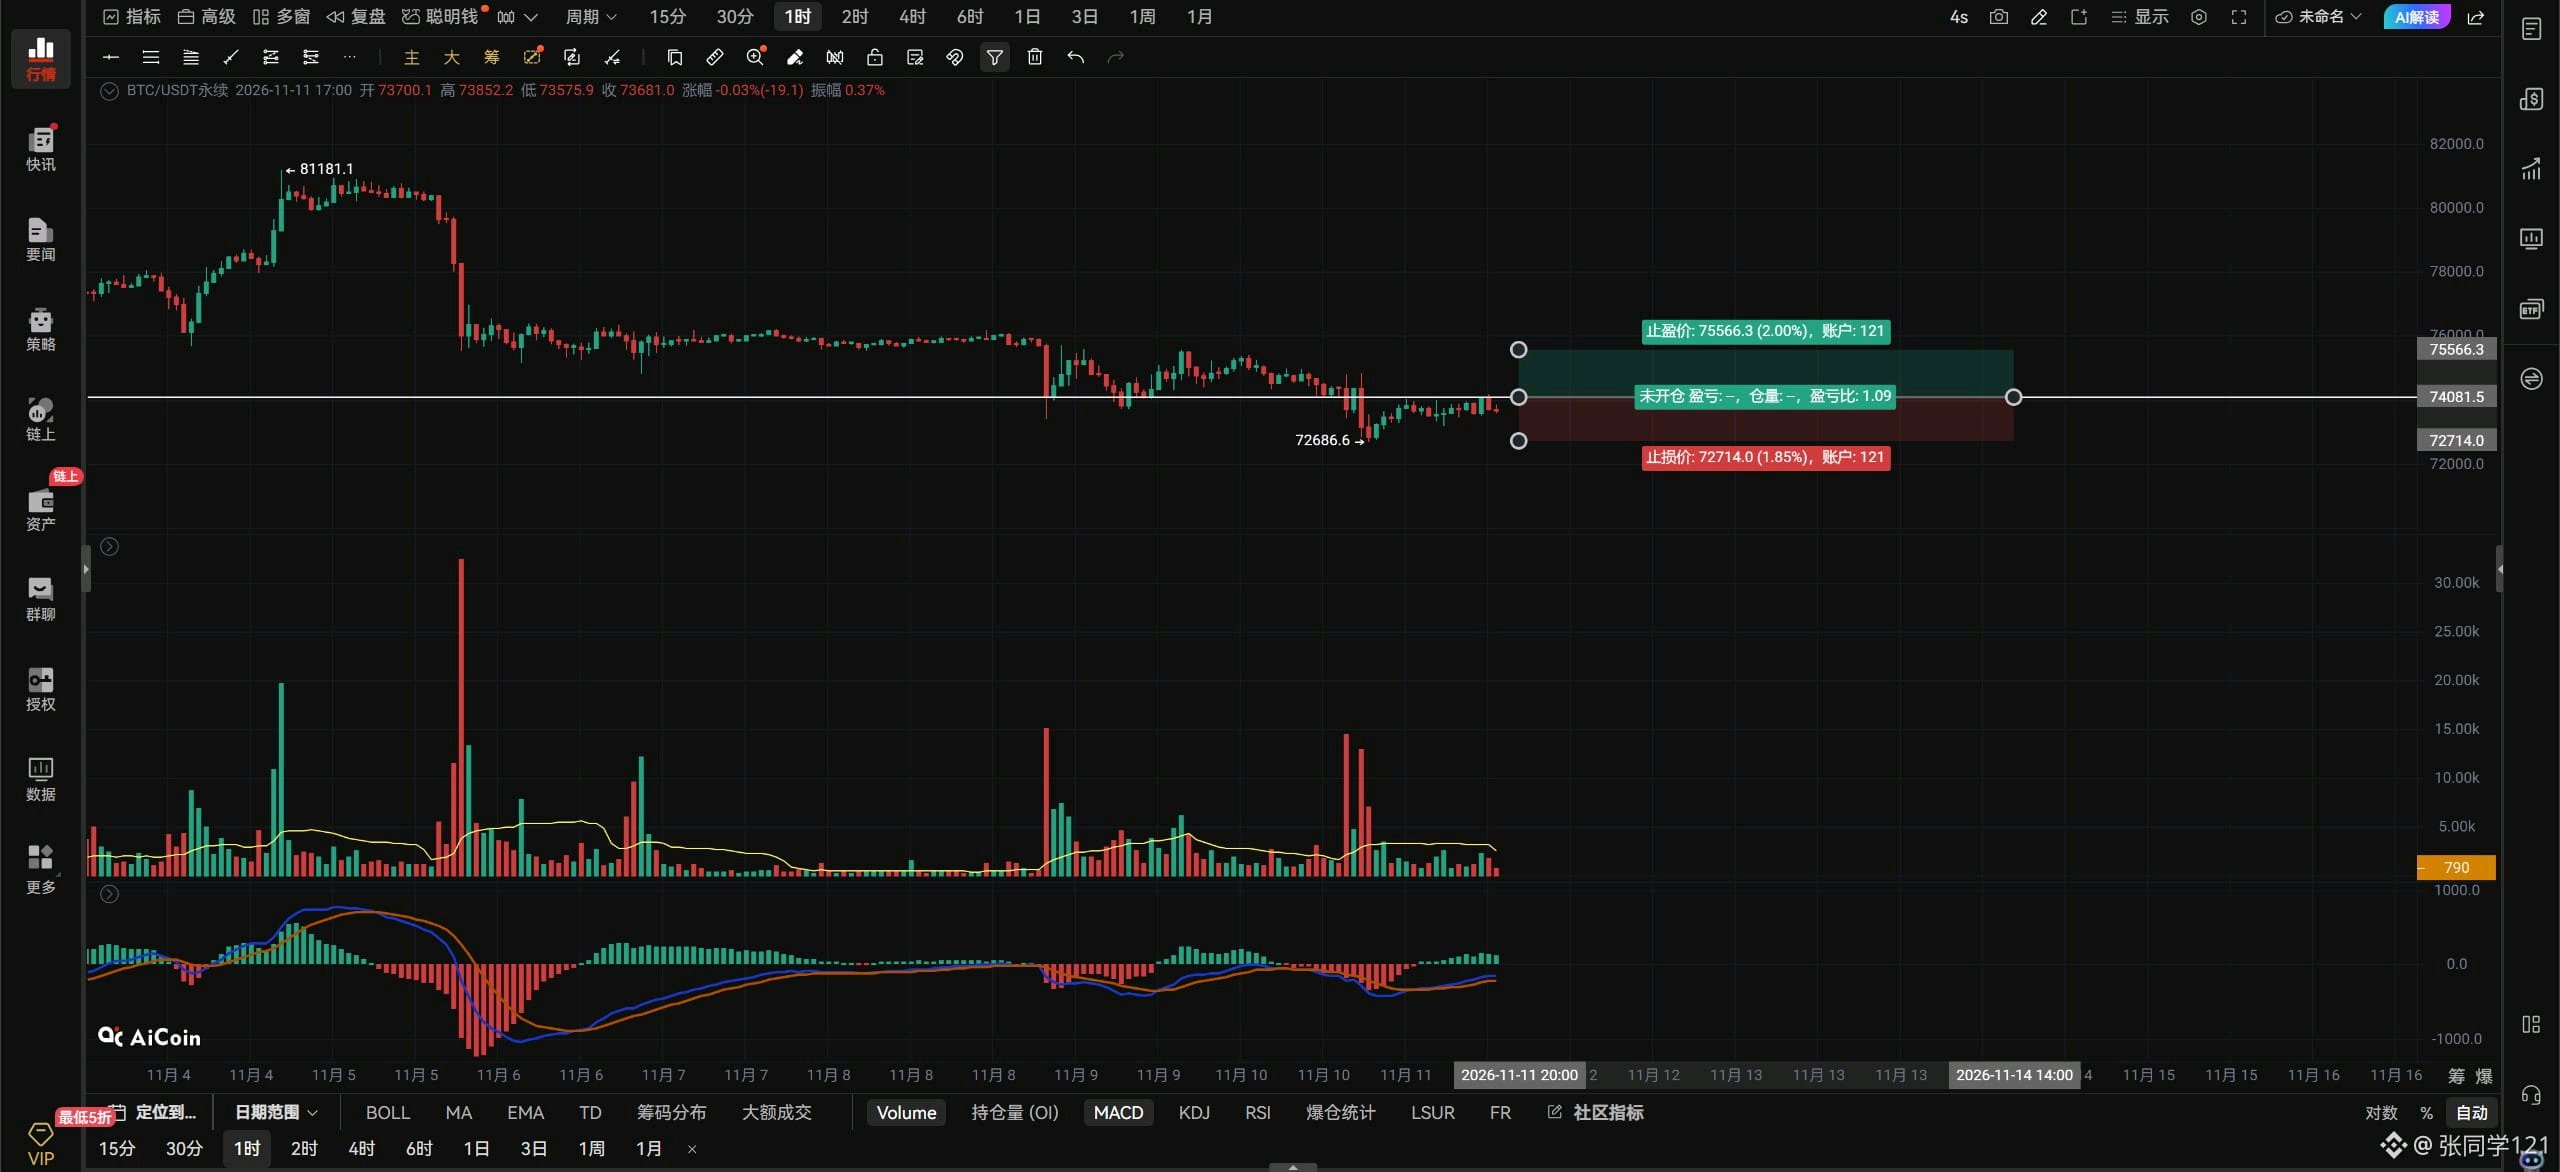
$BTCUSDT Perspectives pour la soirée du 11.11. Après que le Bitcoin soit passé sous le triangle, il a tenté à deux reprises de réintégrer celui-ci et d'évoluer à l'intérieur, comme l'indiquent les flèches rouges ci-dessus. Malheureusement, il a échoué à revenir dans le triangle. Ensuite, au niveau de la zone marquée par le cadre blanc, une bougie englobante baissière l'a fait chuter, atteignant un nouveau plus bas à 72 688. Que fait le Bitcoin actuellement ? Il consolide entre 72 688 et 74 081 et est en train de choisir à nouveau une direction. Tant que cette fourchette n'est pas cassée à la hausse ou à la baisse, il n'y aura pas de direction claire ; il continuera à consolider dans cet intervalle. Pour que le Bitcoin arrête de baisser et rebondisse, il doit impérativement repasser au-dessus de 74 081. Ce n'est qu'à cette condition qu'il pourra entamer un mouvement haussier, avec des objectifs à 74 829, 75 526 et 76 395. S'il n'arrive pas à dépasser les 74 081, ces trois niveaux ne seront pas atteints. Pourquoi doit-il franchir les 74 081 pour rebondir ? Parce que la zone 74 081–72 688 est une zone de consolidation. S'il veut monter, n'a-t-il pas besoin de sortir de la zone de consolidation marquée par le cadre rouge inférieur ? Il doit former un sommet plus élevé dans cette zone de consolidation inférieure avant de pouvoir revenir trader dans la zone du cadre rouge supérieur, n'est-ce pas ? S'il n'a même pas réussi à sortir de la zone de consolidation inférieure, comment espérez-vous que le Bitcoin monte ? Il faut y aller étape par étape, non ? Vous habitez au 11ème étage. Pouvez-vous faire un seul pas et entrer directement dans votre chambre ? Pouvez-vous voler ? 😃 ! Inversement, si la fourchette 74 081–72 688 est rompue à la baisse, un nouveau plus bas à 71 260 est probable. Lorsque le Bitcoin évolue dans une fourchette, il est préférable d'éviter de prendre position. Si vous entrez pendant cette phase, le prix oscillera simplement autour de votre prix d'entrée. Mieux vaut rester sur la touche, n'est-ce pas ? Si vous voulez acheter du Bitcoin maintenant, voici la marche à suivre : attendez que le Bitcoin reteste le précédent plus bas à 72 688 et voyez si un signal de retournement apparaît, puis achetez pour viser un rebond ; ou attendez qu'il casse les 74 081 à la hausse, puis qu'il confirme ce niveau lors d'un retest avant d'acheter. La manière la plus sûre de shorter est d'attendre que le Bitcoin rebondisse dans la zone de résistance des 75 526–76 395 et forme une figure de sommet avant de vendre à découvert. Sinon, il vaut mieux ne pas agir de manière impulsive. Si le Bitcoin dépasse les 74 081 avec un volume important, les traders agressifs peuvent tenter de suivre le mouvement à la hausse. S'il passe sous les 73 456 avec un volume important et échoue à reconquérir ce niveau lors d'un rebond, suivez le mouvement à la baisse. Assurez-vous d'utiliser un stop-loss. Sur le graphique horaire, si le Bitcoin dépasse et maintient les 74 081, visez 74 829–75 526. S'il ne parvient pas à passer au-dessus de 74 081, ces objectifs ne sont pas pertinents. Sur le graphique 4 heures, s'il passe sous les 73 456, visez 72 688–71 260. La zone de consolidation quotidienne du Bitcoin entre 75 035 et 82 044 a été rompue à la baisse. Cette cassure signifie que le rallye marqué par la grande flèche rouge sur le graphique journalier est terminé, car la structure de la zone de consolidation délimitée par le grand cadre blanc a été brisée. Ensuite, à moins que le Bitcoin ne repasse au-dessus de 75 000 sur le graphique journalier, il devra combler le gap FVG quotidien autour de 72 978–69 844. Et tant qu'il ne repasse pas au-dessus de 75 000, une baisse encore plus abrupte sur le graphique journalier est en cours. Le Bitcoin ne peut empêcher la baisse quotidienne de s'aggraver qu'en repassant au-dessus de 75 000. S'il ne parvient pas à repasser au-dessus de 75 000 d'ici trois jours, l'abîme nous appelle, vous et moi 🫳🏻 Allez, venez, venez jouer ! Il fait bon et frais ici. Séance levée.#ByXIMPACT
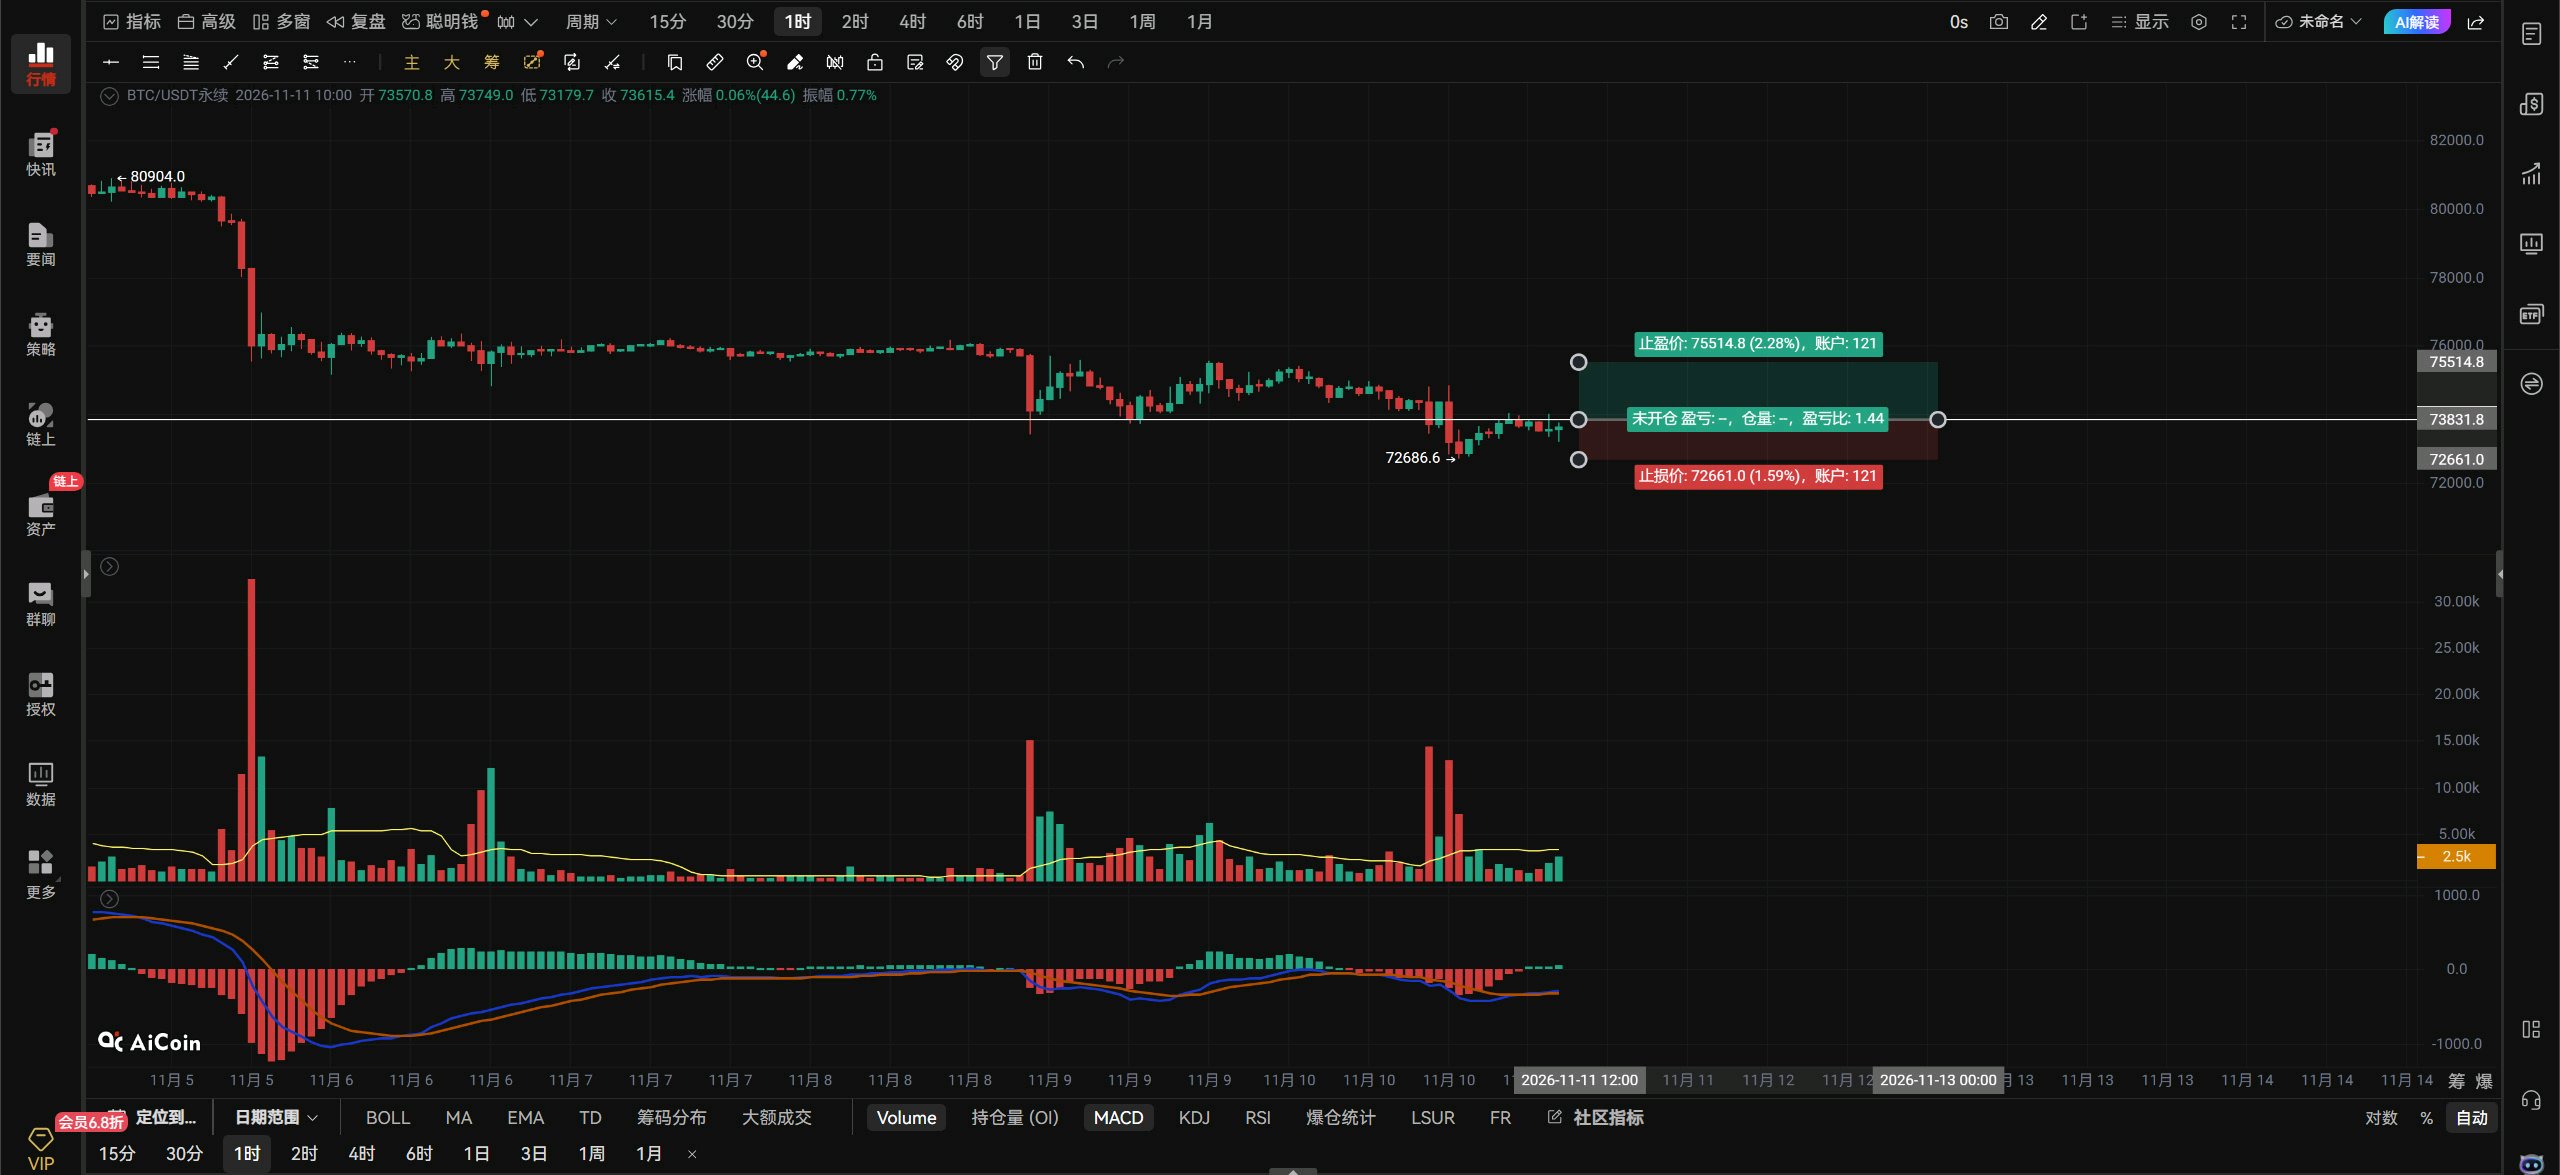
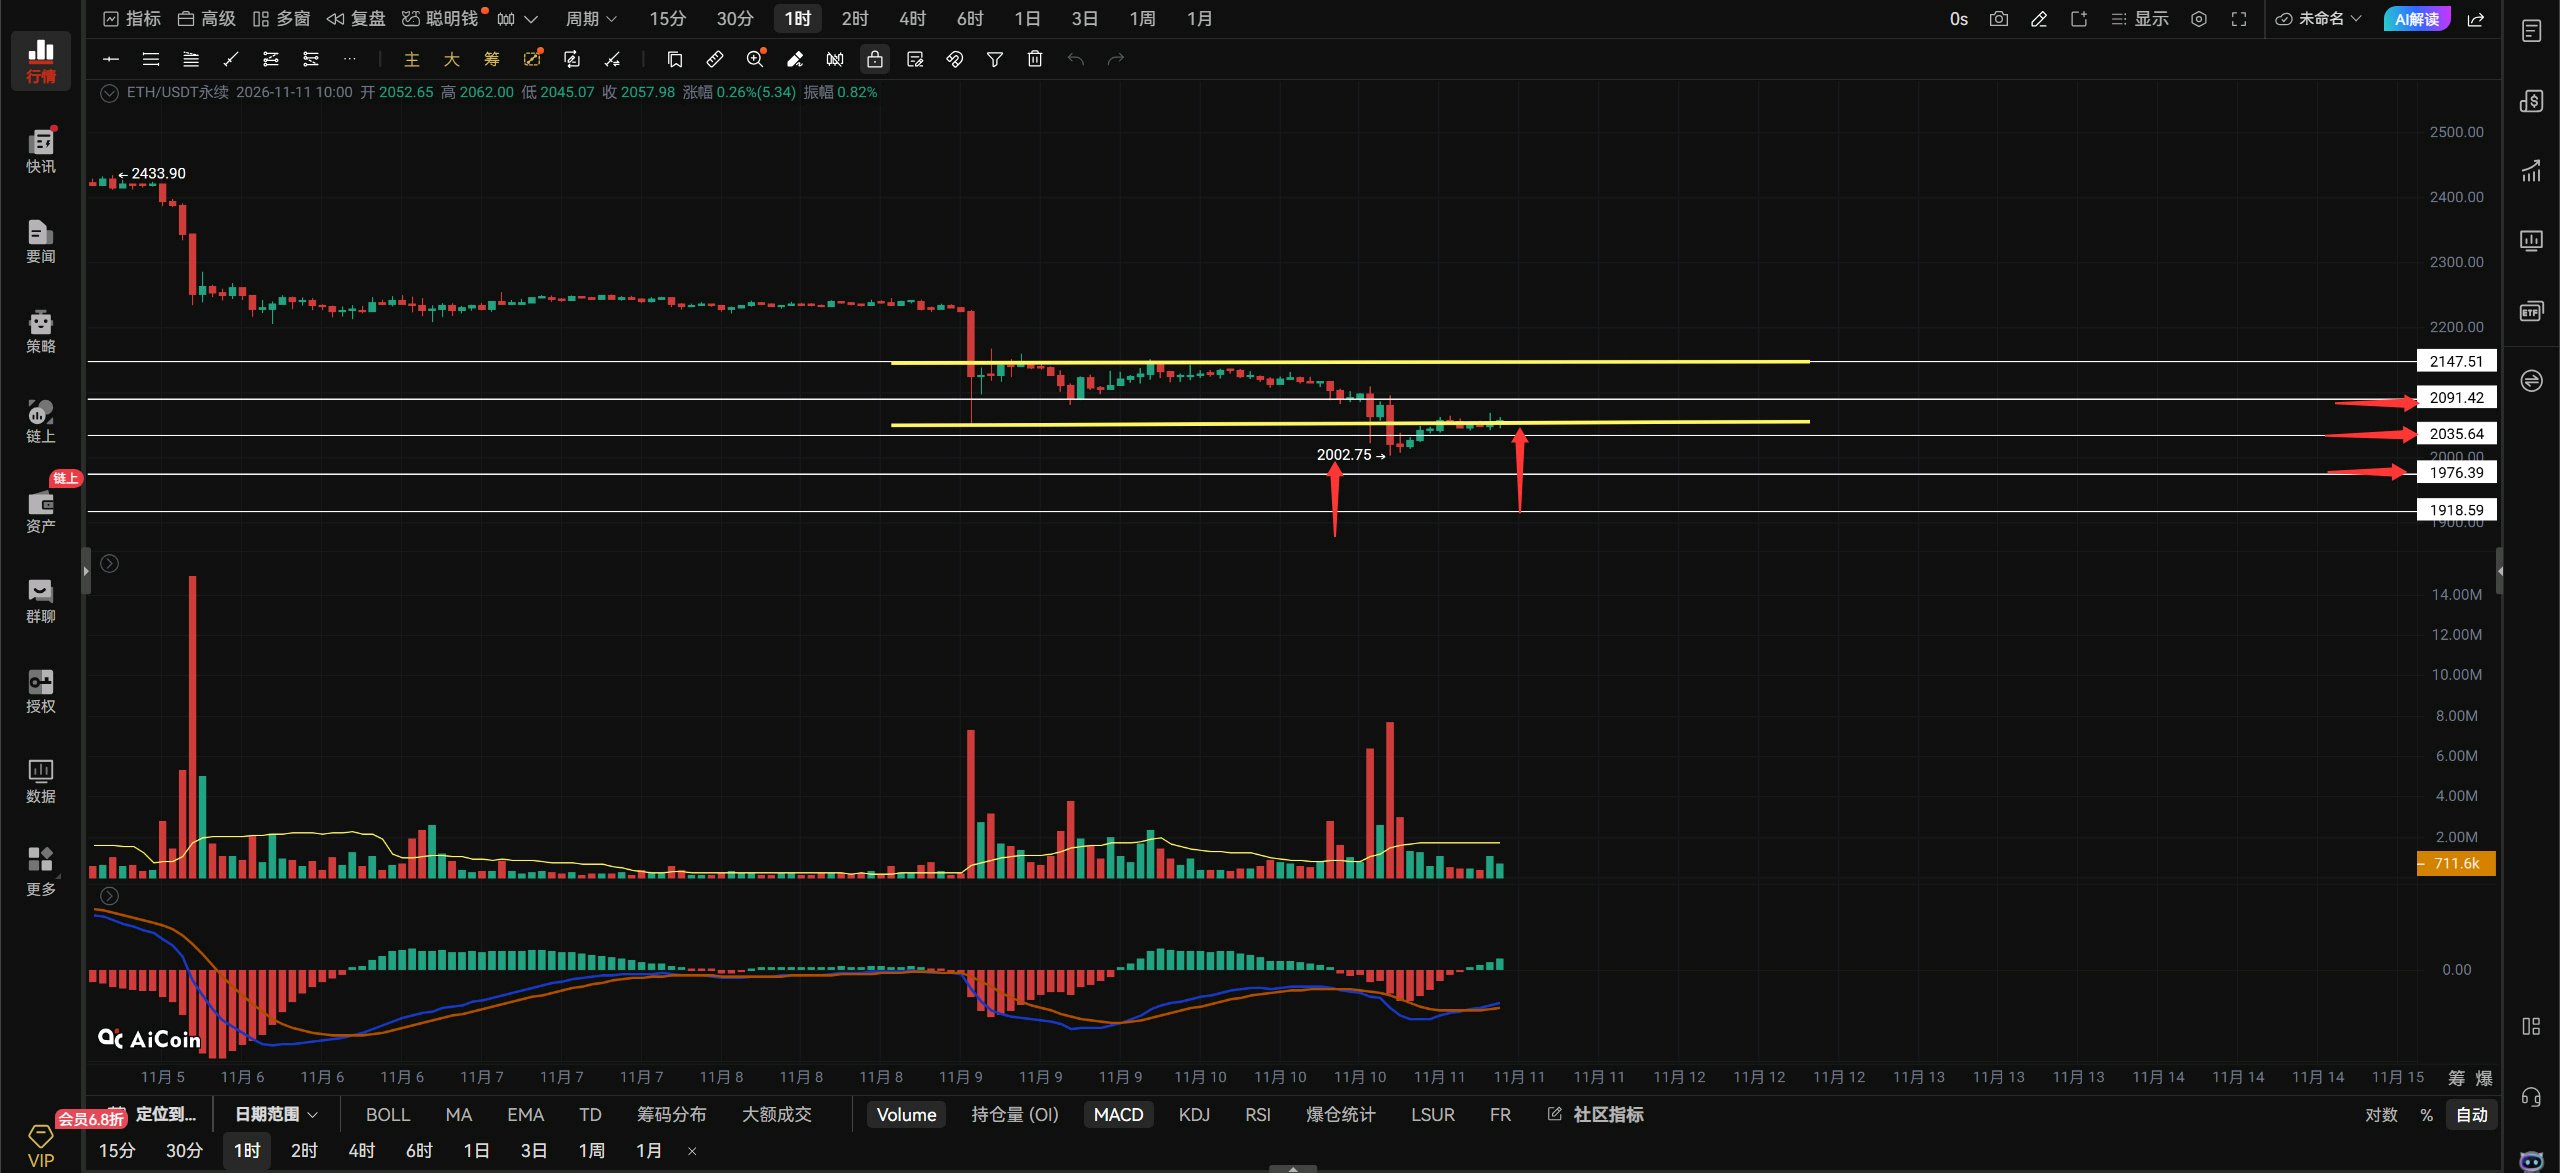
Analyse de ETHUSDT : Si l'ETH casse les 2063 avec du volume, tentez une position longue en suivant le mouvement, avec un stop-loss en place. Si ça casse sous les 2052 avec du volume, tentez une position courte en suivant le mouvement, avec un stop-loss en place. Si un retest des 2003 confirme que le support tient, ajoutez une unité au long. Sortez de position si le prix passe sous les 1976. Sur le graphique horaire, si l'ETH se maintient au-dessus des 2063, visez les 2092–2147. Surveillez l'ETH pour atteindre 2092 afin de prendre une position courte ; sortez si ça dépasse les 2147. Ordres sur mèches (left-side) : long à 1976 ; sortez si le prix passe sous les 1938. Résistance au-dessus : 2063-2092-2147 Support en dessous : 2052-2035-2003 Sur le graphique en 4 heures, une cassure sous 2052 indique 2035-2003. L'ETH a retesté le support clé à 2000 et a tenu. Maintenant, la question est de savoir si l'ETH peut rester au-dessus de 2035. Si c'est le cas, la baisse pourrait marquer une pause pour l'instant, avec une chance de tester les 2091. S'il échoue à casser les 2091, un retest des 2000 les fera sûrement céder. Une fois que l'ETH passera sous les 2000, la baisse pourrait devenir incontrôlable. C'est tout. WSOT2026 ByXIMPACT
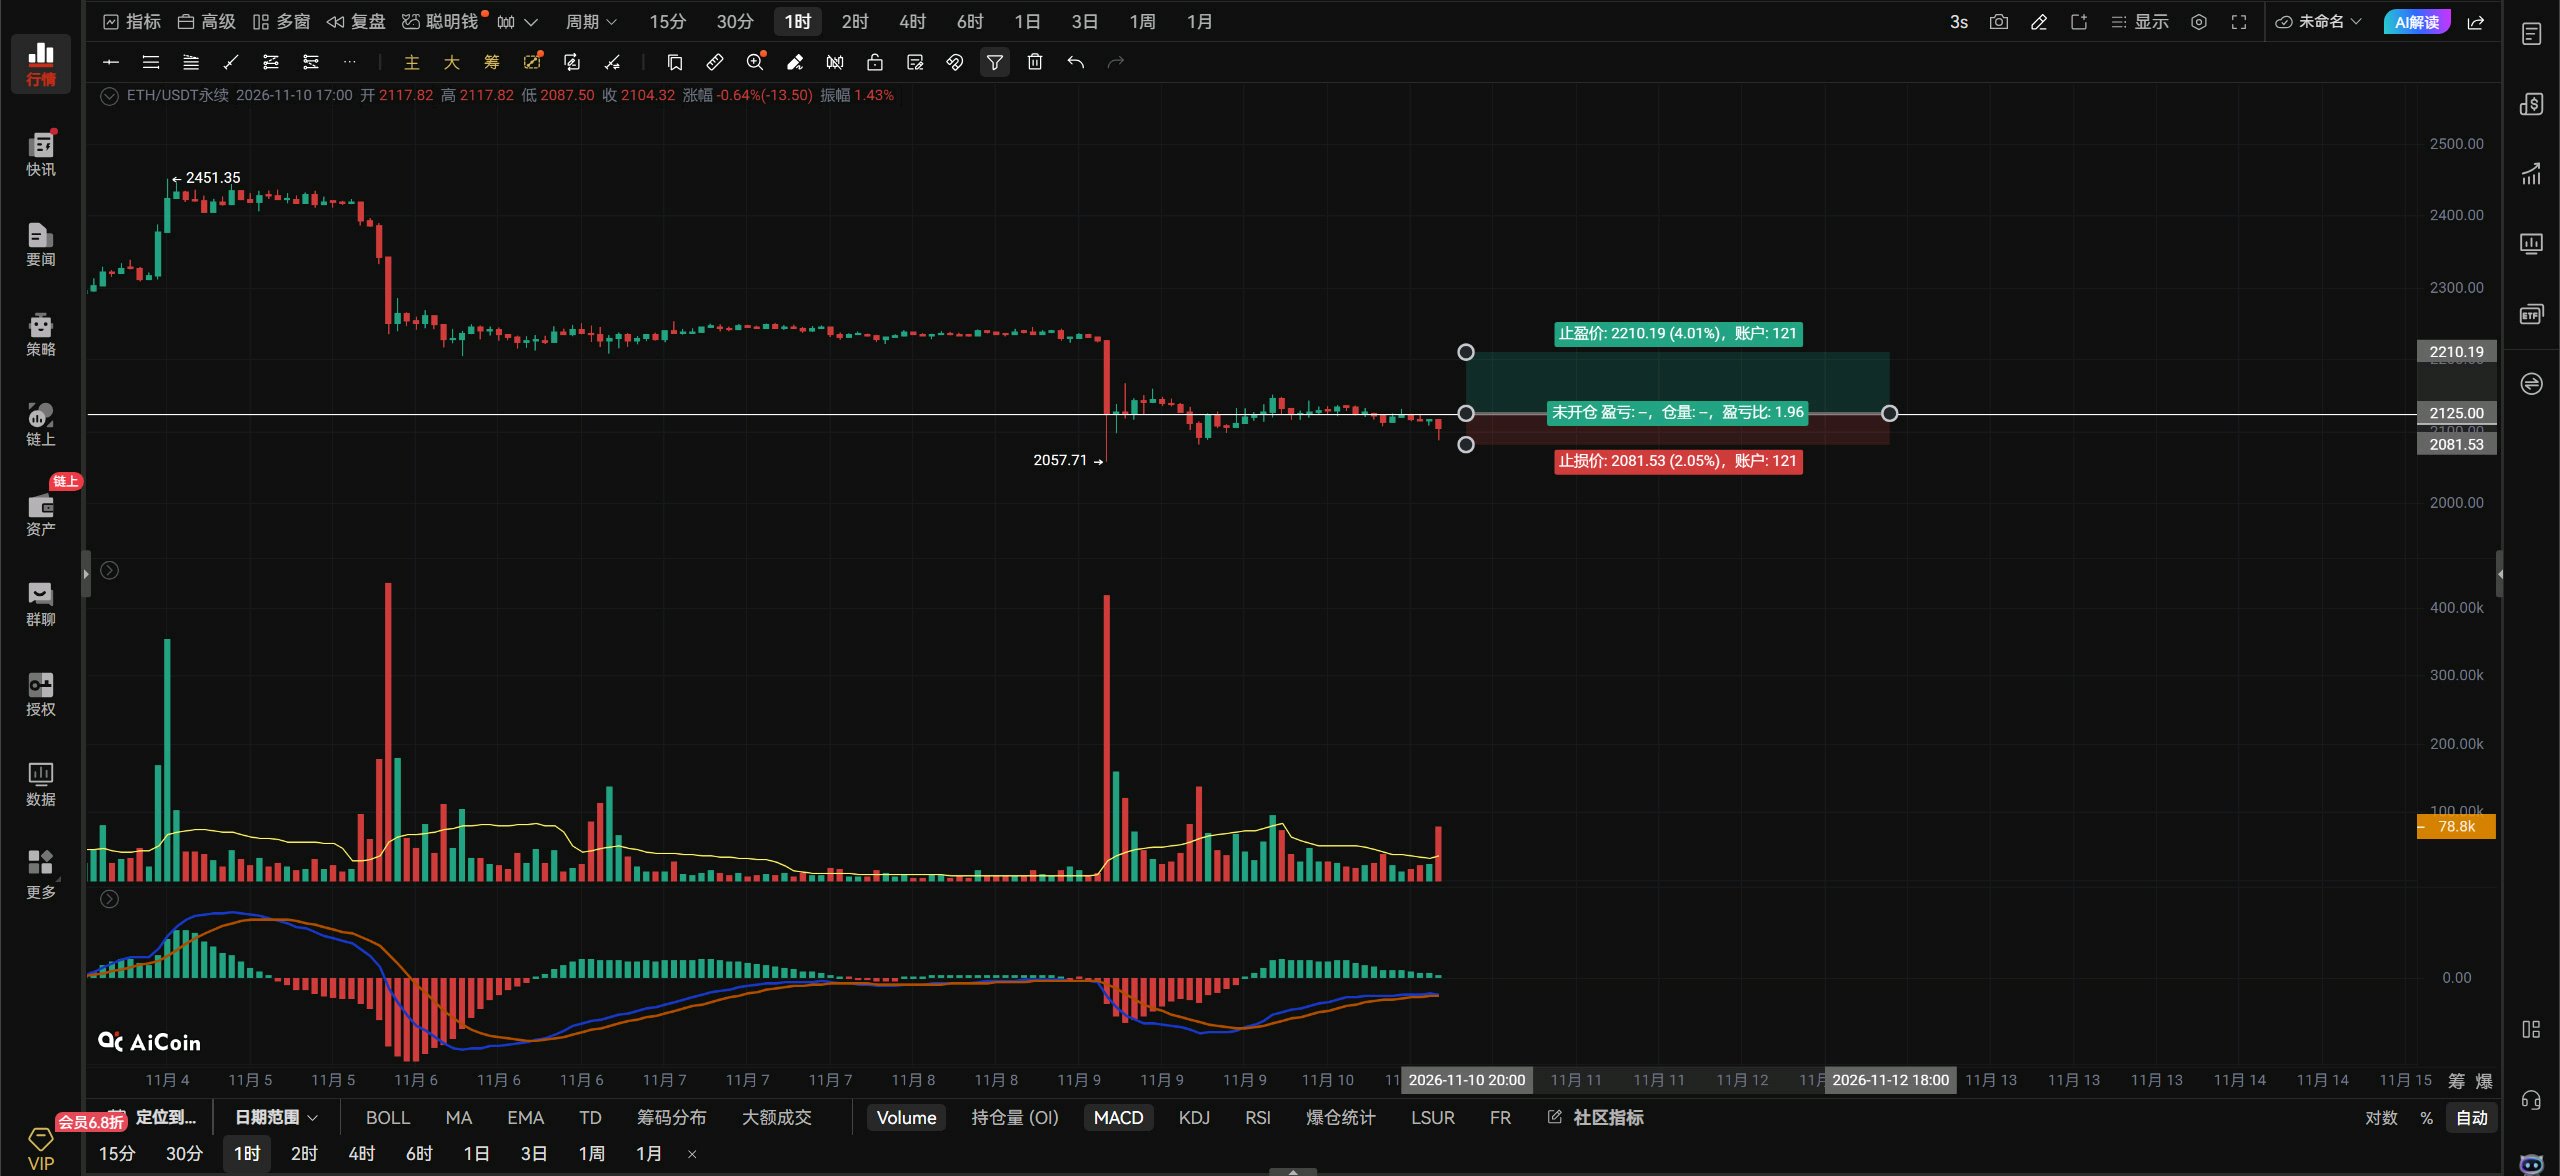
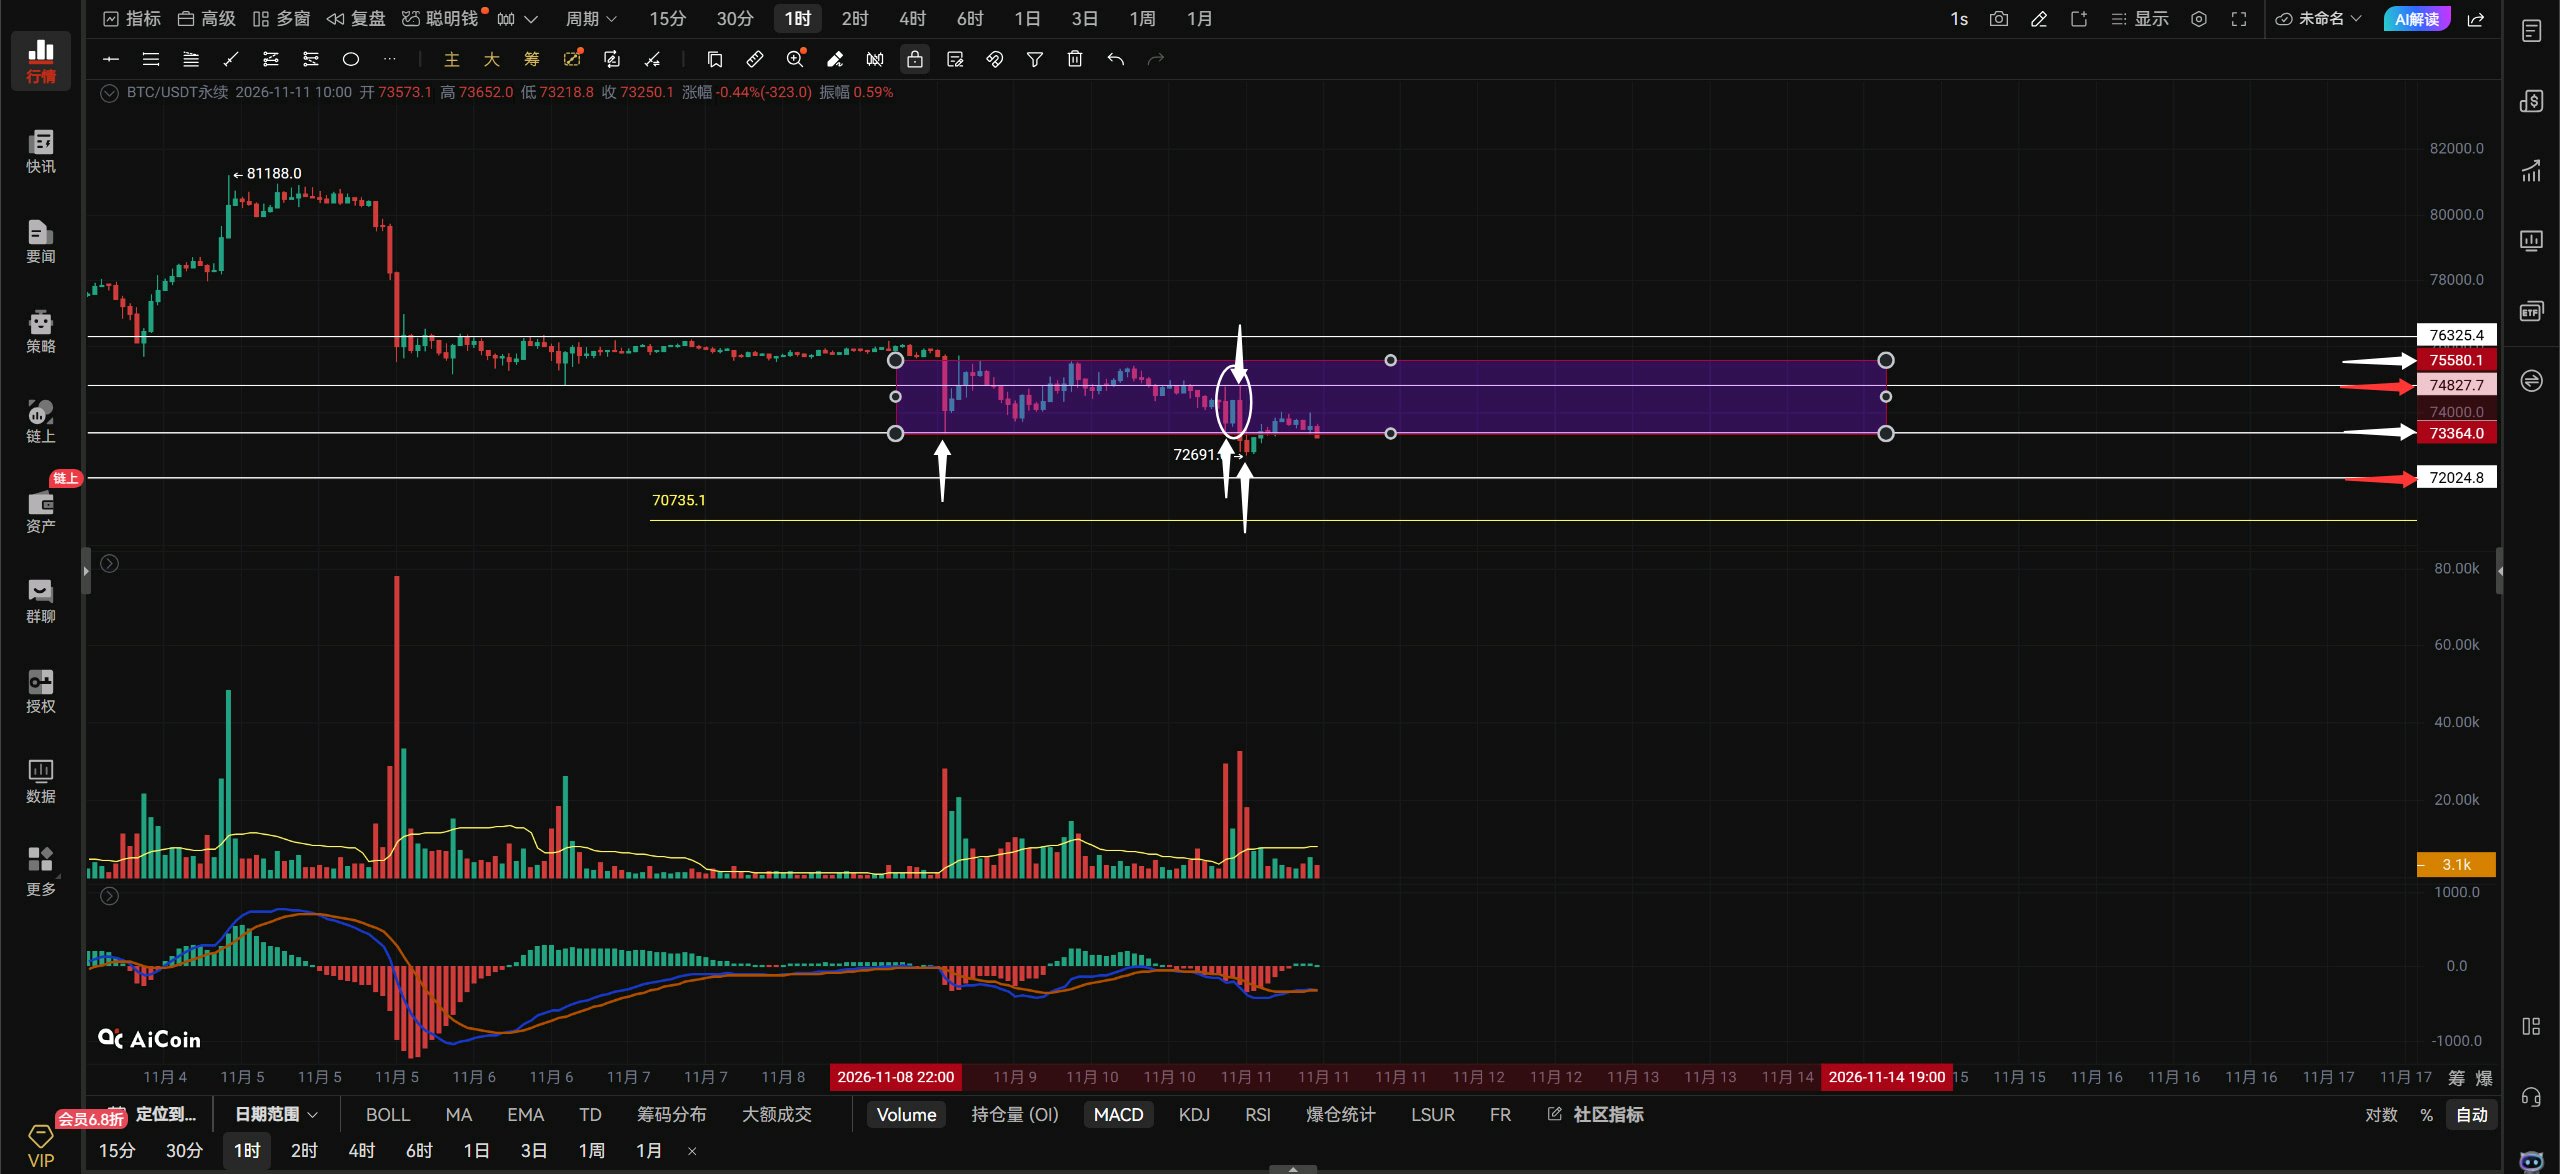
BTCUSDT 🌿Perspectives du marché du 11.11 à la mi-journée.🌿 Analyse du $BTC : Bitcoin a vraiment été bradé pour ce 11.11. Je peux vous le dire très clairement maintenant : il n'y a aucune tendance haussière sur aucune unité de temps. Tant que le prix ne récupère pas et ne se maintient pas au-dessus de 75 000, chaque rebond est une opportunité de vendre à découvert. La fourchette de consolidation de 75 580 – 73 364 du Bitcoin a été rompue. Ensuite, surveillez si le Bitcoin peut se maintenir au-dessus de 73 364. S'il y parvient, il y a encore une chance de rebond haussier ; s'il ne parvient pas à tenir les 73 364, alors attendez que le Bitcoin teste les 72 024 ! Je pensais initialement que le plus bas précédent ne serait pas cassé — la flèche blanche ci-dessous le pointe — car il n'y avait pas beaucoup de mauvaises nouvelles, et un signal de creux est apparu dans la zone marquée par le cadre blanc. Mais le rebond n'a pas réussi à franchir la résistance à 74 827, et ensuite, une seule grande bougie baissière a fracassé le plus bas précédent et a créé un plus bas encore plus bas. Bien que le Bitcoin ait atteint un plus bas, le ratio des positions longues sur les positions courtes n'a pas chuté ; il reste élevé à 2,9. On dirait que l'enthousiasme de tout le monde pour acheter la baisse ne s'est pas essoufflé ! Tout le monde veut acheter la baisse, et moi aussi, mais en regardant le marché actuel, il n'y a même pas de point bas en vue ! Le prix montait tranquillement, puis a soudainement été dumpé. Pour que le Bitcoin remonte, il doit franchir la zone de résistance 74 827 – 75 580 pour amorcer un rebond ; cela ne sert à rien s'il ne peut pas percer cette zone. Ceux qui cherchent à prendre des positions longues devraient surveiller un retest du plus bas précédent par le Bitcoin et voir si un signal de creux apparaît avant d'entrer ; sinon, attendez pour vendre à découvert dans la zone 74 827 – 75 580 ! Si le Bitcoin dépasse les 73 875 avec du volume, les traders agressifs peuvent tenter une position longue sur le côté droit. S'il rebondit vers 75 539, prenez une position courte légère sur le côté gauche, avec un stop-loss en place. Sur le graphique horaire, si le Bitcoin dépasse et se maintient au-dessus de 73 875, visez 74 827 – 75 539 ; s'il ne peut pas dépasser 73 875, cela n'a aucun intérêt. Sur le graphique 4 heures, si le prix passe sous les 73 384, visez 72 691 – 72 024. Résistance au-dessus : 73 875 – 74 827 – 75 539 Support en dessous : 73 384 – 72 691 – 72 024 ByXIMPACT