ALCHEMIST
5199Suka0Pembagian272Penggemar704Ikuti
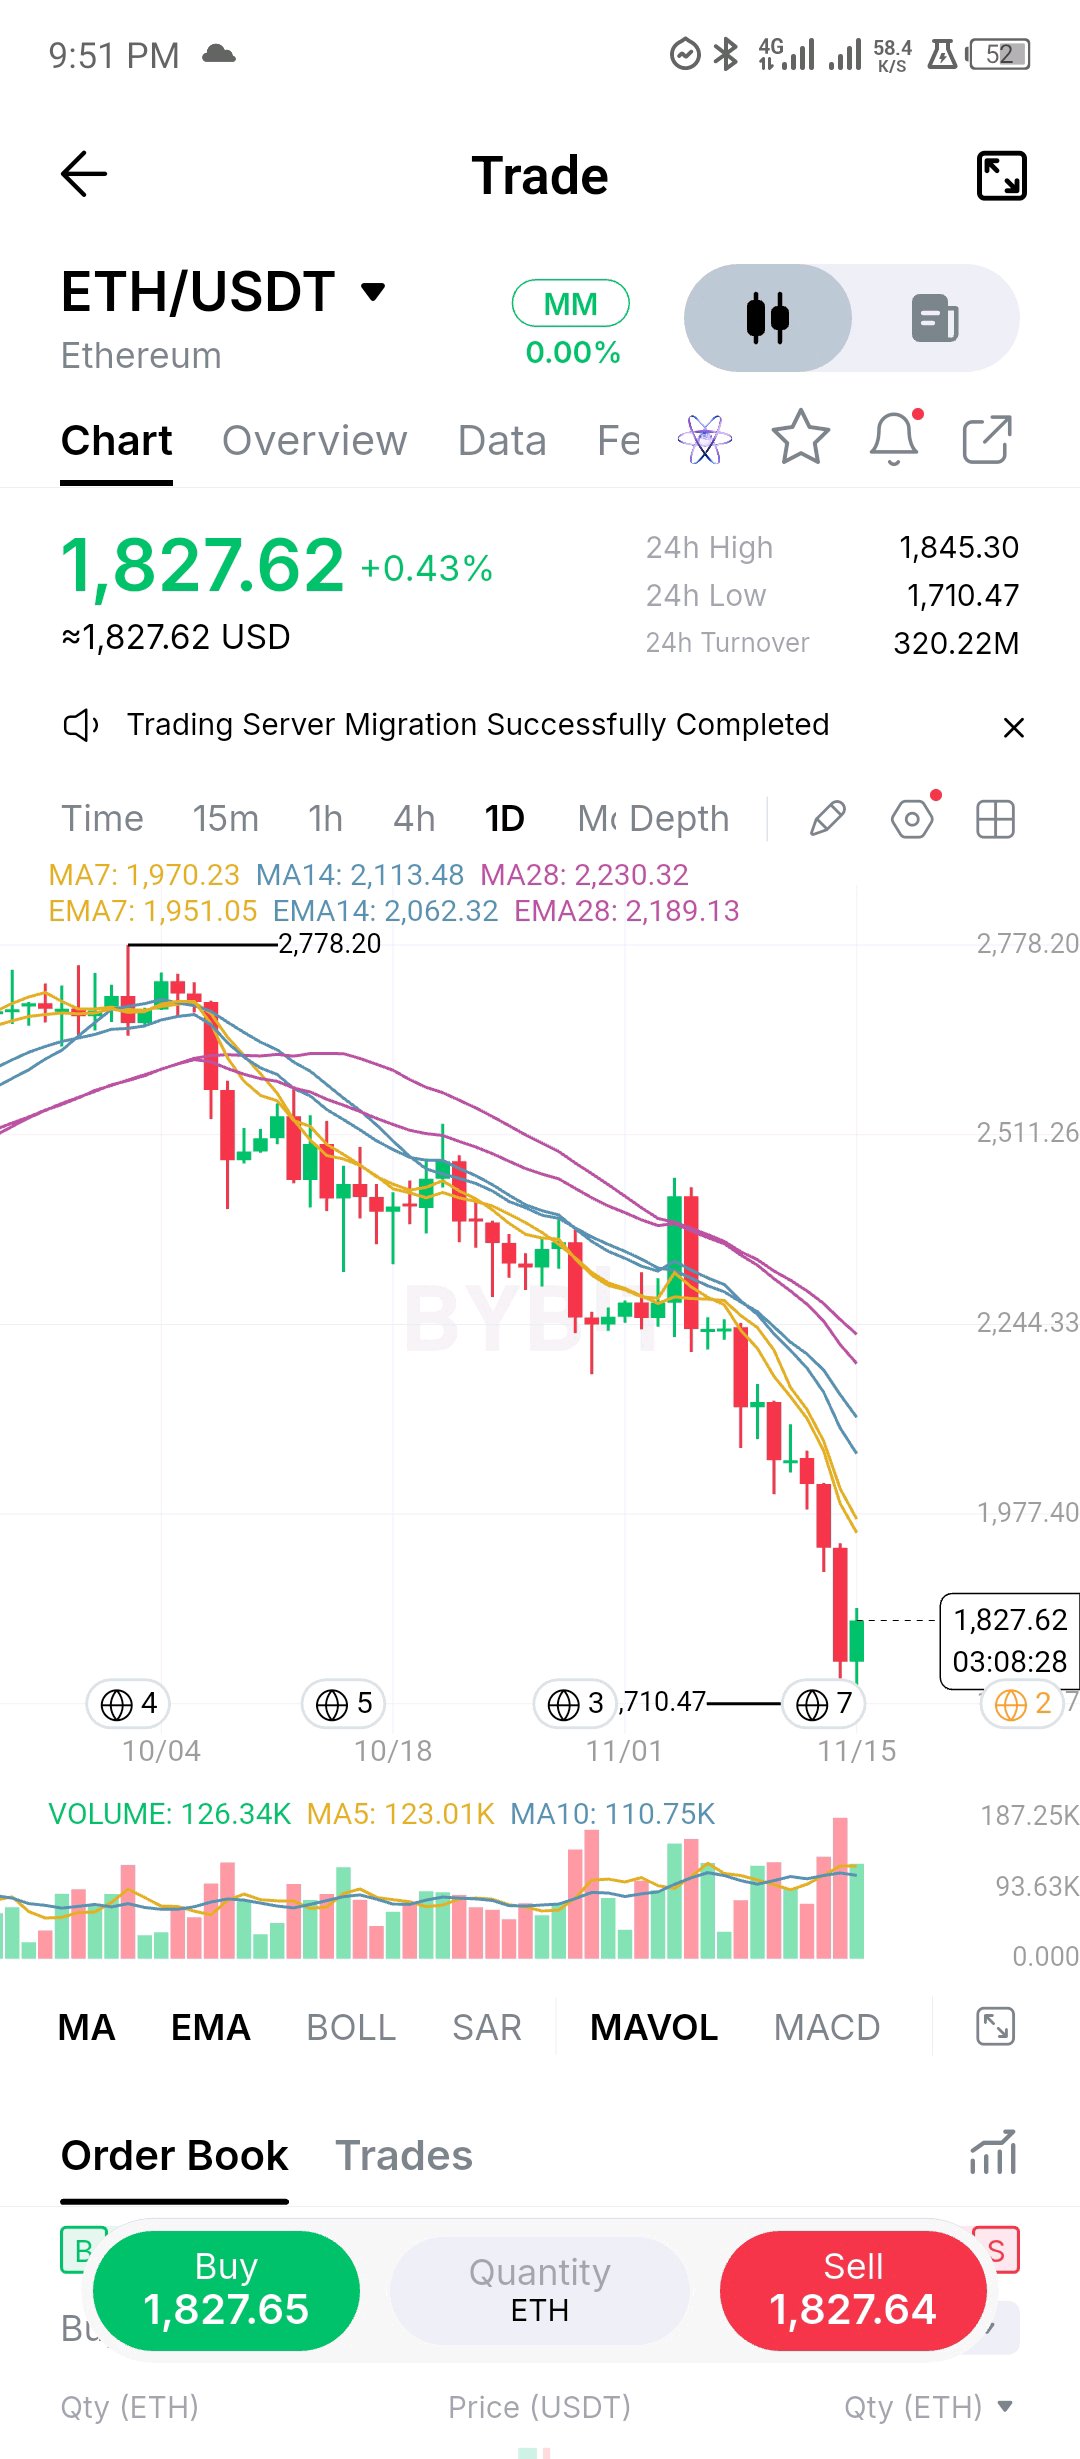
PROSPEK TEKNIS HARIAN ETH/USDT: PERTAHANAN SUPPORT LOKAL & LONJAKAN VOLUME MENGUJI PEMULIHAN MA7 Ethereum ($ETH$) mencatatkan pemulihan harian yang moderat, naik +0,43% di kisaran 1.827,62 setelah mempertahankan posisi terendah intraday di 1.710,47[span_0](start_span)[span_0](end_span). Pergerakan harga sedang mencoba untuk stabil setelah koreksi tajam dari puncak makro di 2.778,20[span_1](start_span)[span_1](end_span). • PERTIMBANGAN: Washout baru-baru ini ke 1.710,47 memicu ekspansi volume yang agresif (volume harian 126,34K vs. basis MA5 123,01K)[span_2](start_span)[span_2](end_span), menandakan penyerapan pembeli jangka pendek yang kuat di posisi terendah struktural multi-bulan. • VOLUME DAN PERPUTARAN: Volume perdagangan harian berada di 126,34K[span_3](start_span)[span_3](end_span), mengungguli MA 5-hari (123,01K) dan MA 10-hari (110,75K)[span_4](start_span)[span_4](end_span), disertai dengan perputaran 24 jam yang kuat sebesar 320,22M USDT[span_5](start_span)[span_5](end_span). • LEVEL UNTUK DIPERHATIKAN: Medan pertempuran langsung berpusat di sekitar MA7 cepat di 1.970,23 dan EMA7 di 1.951,05[span_6](start_span)[span_6](end_span), yang mewakili garis tekanan overhead dinamis pertama. • SUPPORT DAN RESISTANCE: - Level Support: 1.710,47 (Terendah 24 jam)[span_7](start_span)[span_7](end_span) dan zona akumulasi historis 3.710,47[span_8](start_span)[span_8](end_span). - Level Resistance: MA14 di 2.113,48 (EMA14 di 2.062,32) dan MA28 makro di 2.230,32[span_9](start_span)[span_9](end_span). • KONFIRMASI BULLISH & BEARISH: - Konfirmasi Bullish: Penutupan harian yang meyakinkan kembali di atas klaster EMA7 1.951,05 / MA7 1.970,23[span_10](start_span)[span_10](end_span) mengonfirmasi kelelahan penjual dan membuka jalan yang jelas menuju wilayah MA14 di 2.113,48[span_11](start_span)[span_11](end_span). - Konfirmasi Bearish: Kegagalan mempertahankan lantai support 1.710,47[span_12](start_span)[span_12](end_span) dengan volume jual yang meningkat membatalkan tesis pembentukan basis jangka pendek dan mengekspos celah likuiditas yang lebih dalam. • RENCANA PERDAGANGAN, PEMBATALAN & CATATAN RISIKO: Trader agresif dapat mencari scalping saat harga kembali ke level lokal dengan stop loss ketat di bawah 1.710. Pembatalan terjadi jika terjadi breakdown dengan volume tinggi di bawah level terendah 24 jam. Selalu kelola ukuran posisi dengan cermat dalam saluran korektif yang sangat volatil. • ANGKA KUNCI: - Harga Saat Ini: 1.827,62 USDT (+0,43%)[span_13](start_span)[span_13](end_span) - Tertinggi / Terendah 24 jam: 1.845,30 / 1.710,47[span_14](start_span)[span_14](end_span) - Perputaran 24 jam: 320,22M USDT[span_15](start_span)[span_15](end_span) - Tumpukan MA: MA7: 1.970,23 | MA14: 2.113,48 | MA28: 2.230,32[span_16](start_span)[span_16](end_span) - Tumpukan EMA: EMA7: 1.951,05 | EMA14: 2.062,32 | EMA28: 2.189,13[span_17](start_span)[span_17](end_span) Apakah Anda melakukan bidding di level demand 1.820 untuk pantulan mean-reversion menuju 2.100, atau menunggu penutupan yang terkonfirmasi melewati garis MA7[span_18](start_span)[span_18](end_span)? $ETHUSDT #ByXIMPACT $XRPUSDT
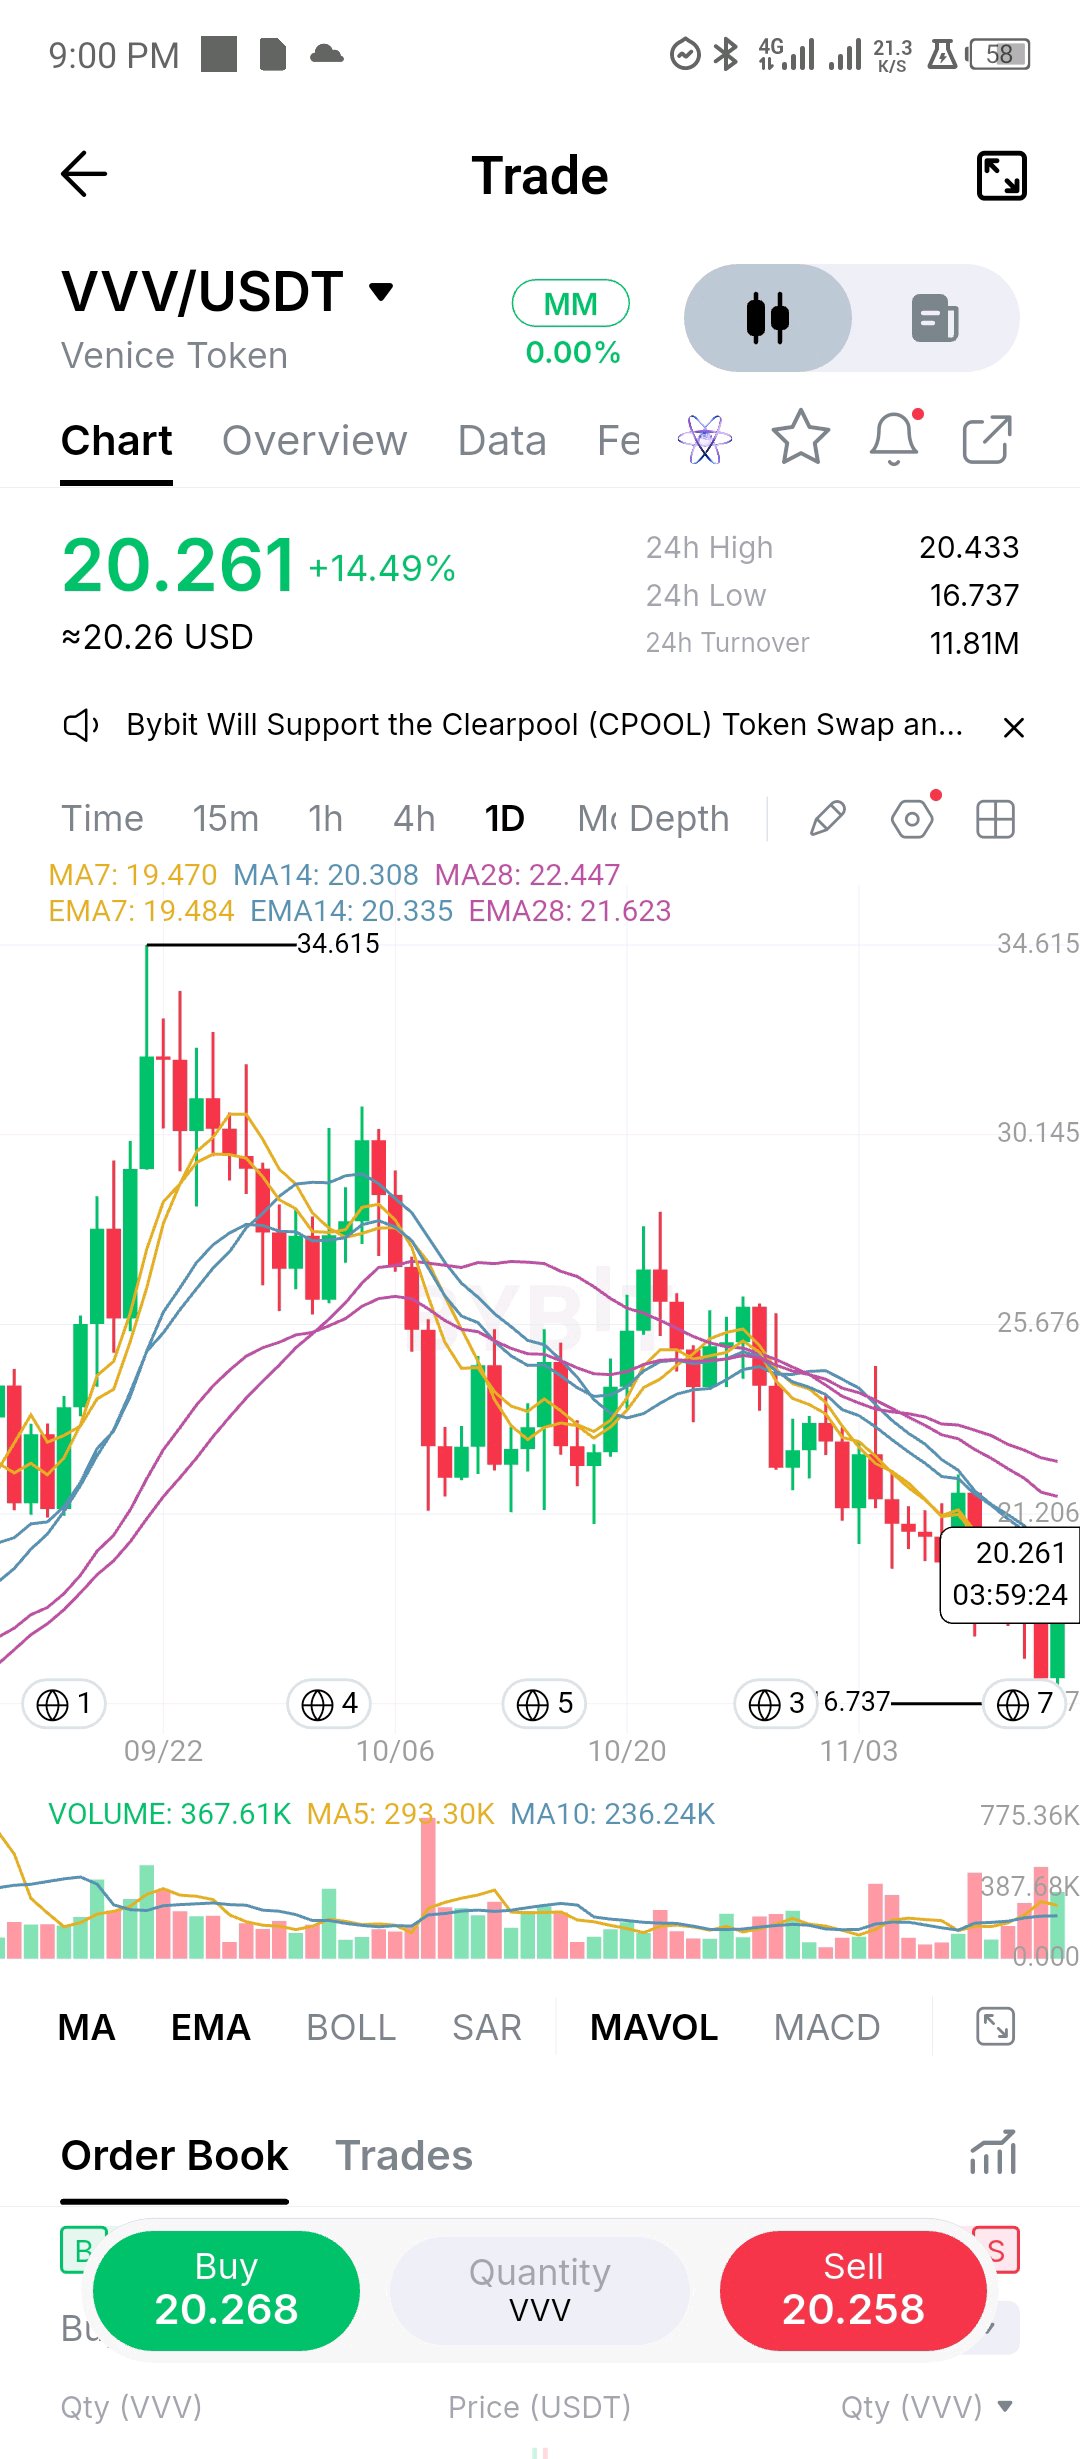
VVV/USDT: FLUSH KE 16,74 DAN PEMANTULAN 21% KE MA 14 HARI PERTIMBANGAN: Setelah penurunan 52% dari 34,615, VVV anjlok ke 16,737 dalam 24 jam terakhir dan memantul sekitar 21% ke 20,261. Harga telah merebut kembali MA 7 hari dan tepat berada di MA 14 hari (20,308), sementara MA 28 hari (22,447) masih turun di atasnya. Hal ini menjadikannya pemantulan di dalam tren turun sampai rata-rata yang lebih panjang berhasil direbut kembali. VOLUME DAN TURNOVER: Volume sebesar 367,6K dengan sisa waktu sekitar empat jam, kira-kira 1,25x dari rata-rata 5 hari (293,3K) dan sekitar 1,5x pada laju hari ini. Turnover 24 jam adalah 11,81M USDT, likuiditas cukup wajar, namun kisaran harian 20% berarti slippage bisa melonjak. LEVEL UNTUK DIPERHATIKAN: 20,31-20,34, MA 14 hari dan EMA14. Penutupan harian di atas level tersebut akan menjadi tanda pertama bahwa tren turun mulai melambat. SUPPORT DAN RESISTANCE: Support: 19,47 (MA 7 hari dan EMA7), lalu level terendah flush di 16,737. Resistance: 20,433 (tertinggi 24 jam), 21,62 (EMA28), 22,447 (MA 28 hari). RENCANA PERDAGANGAN, INVALIDASI, DAN CATATAN RISIKO: Rencana: tunggu penutupan harian di atas 20,34, lalu cari retest di 19,47 agar bertahan. Invalidasi: penutupan harian di bawah 19,47 membuat pemantulan berisiko, dan di bawah 16,737 berarti level terendah flush telah jebol. Catatan risiko: setelah pemantulan 20%, harga sering melakukan retest sebelum melanjutkan pergerakan, jadi tentukan risiko terlebih dahulu dan jaga ukuran posisi tetap kecil. Ini adalah analisis saya, bukan nasihat keuangan. KONFIRMASI BULLISH: Penutupan harian di atas 20,34 dengan volume di atas rata-rata 5 hari, kemudian diikuti pergerakan menuju 21,6 dan 22,45. KONFIRMASI BEARISH: Penolakan di MA 14 hari diikuti dengan penutupan harian di bawah 19,47, yang akan membuat level terendah 16,737 kembali berpotensi tersentuh. Penutupan di bawah 16,737 berarti mencapai level terendah baru. ANGKA KUNCI: Harga 20,261 (+14,49%). Kisaran 24 jam 16,737-20,433. MA7/14/28: 19,470 / 20,308 / 22,447. EMA7/14/28: 19,484 / 20,335 / 21,623. Tertinggi 34,615, terendah 16,737. Volume 367,61K vs rata-rata 5 hari 293,30K. Turnover 11,81M USDT. $VVVUSDT #ByXIMPACT $SOLUSDT
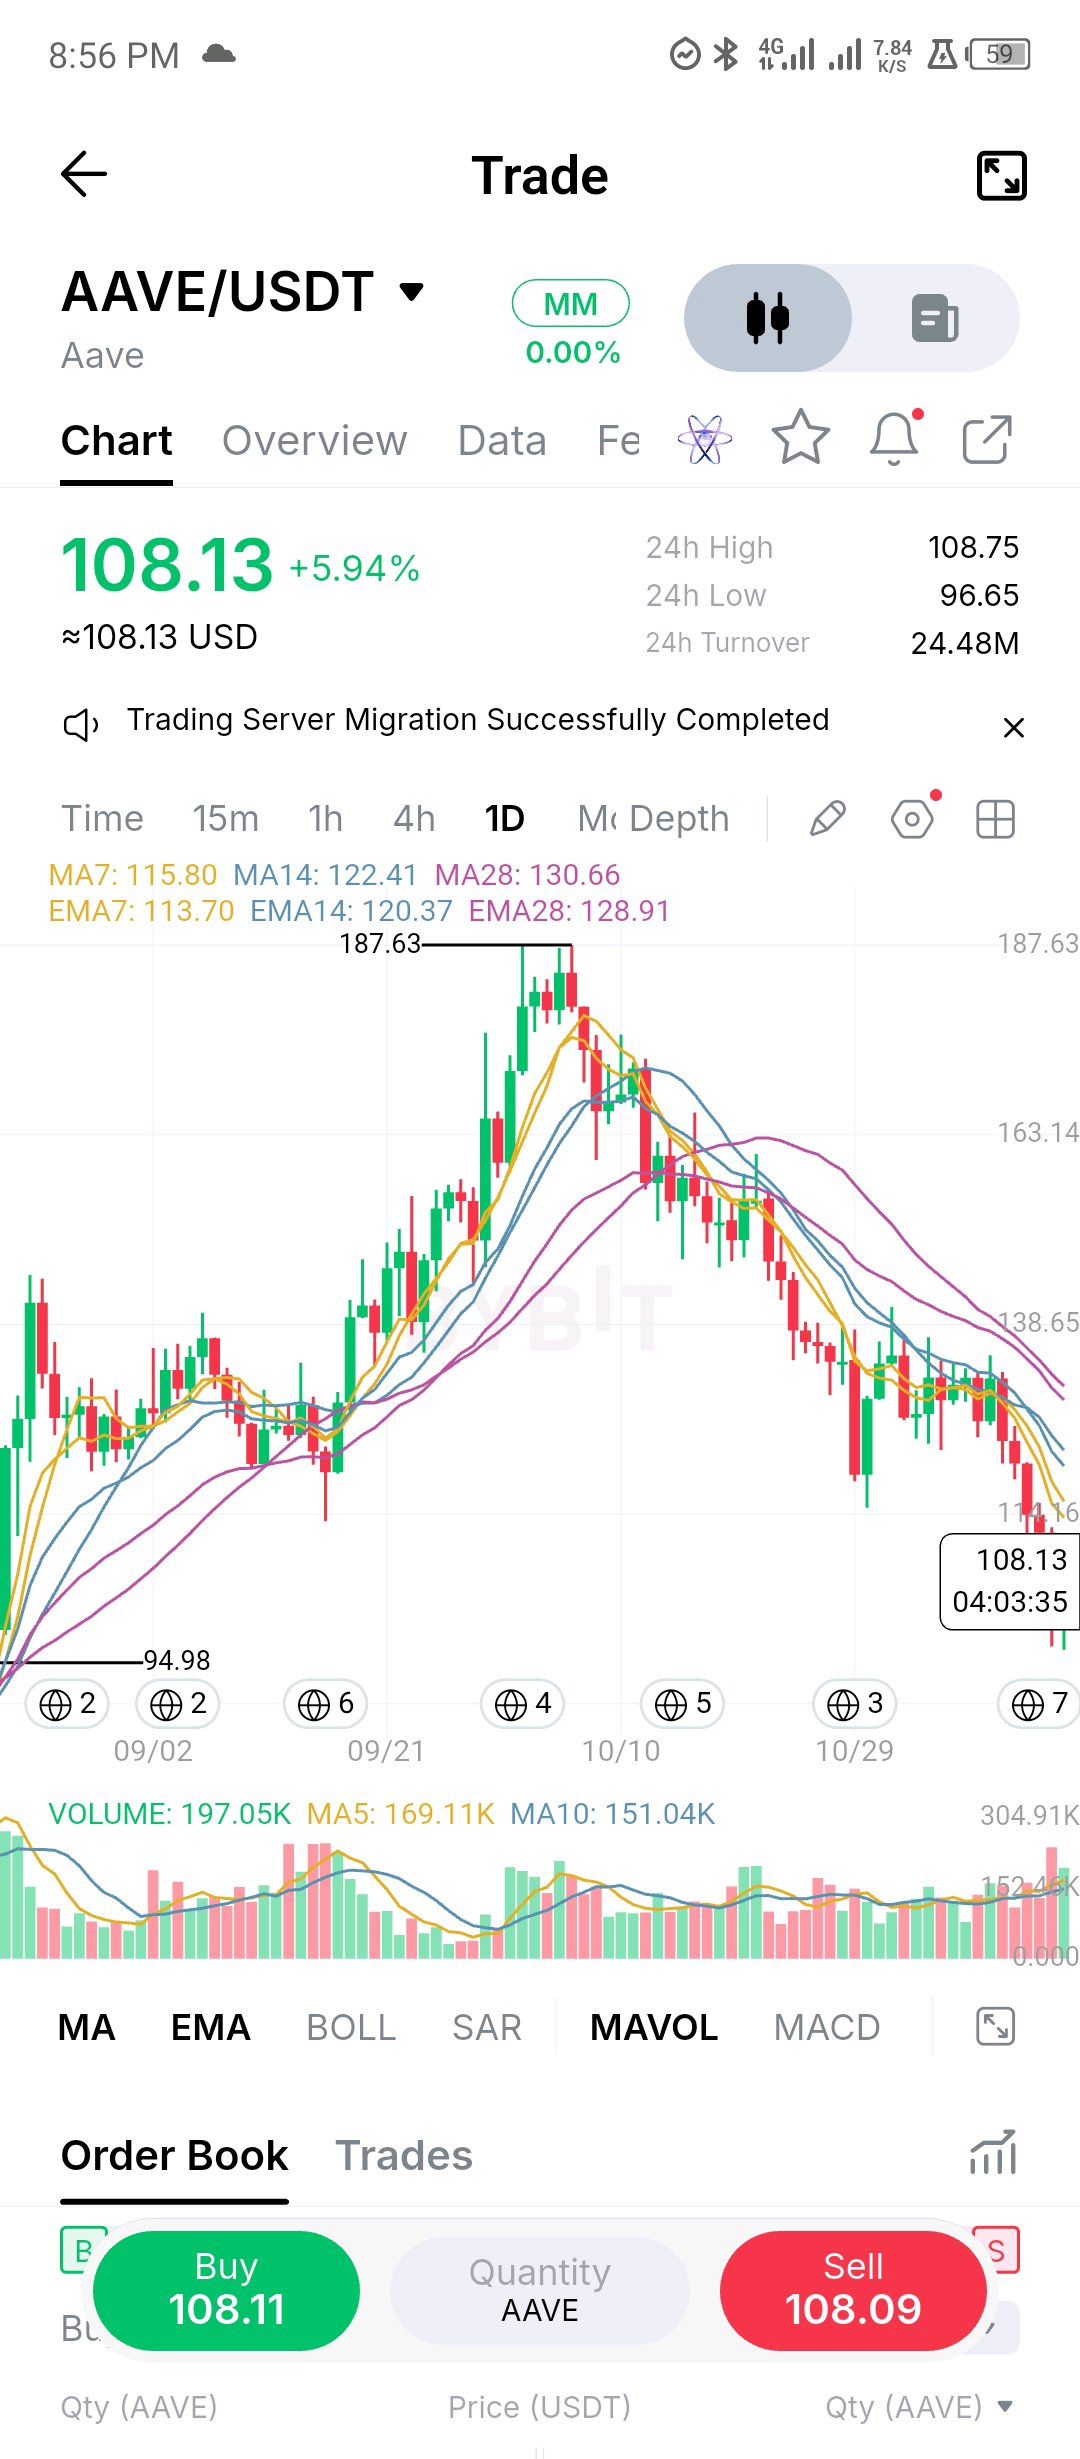
AAVE: BUYERS ARE RESPONDING, BUT THE DAILY DOWNTREND HAS NOT BEEN BROKEN Aave is an important part of decentralized finance, providing non-custodial lending and borrowing infrastructure. Its ecosystem allows users to earn interest by supplying assets and access liquidity through overcollateralized borrowing. Beyond its utility, AAVE has a notable value-accrual mechanism: the Aave DAO's $50 million annual buyback programme, funded through protocol revenue. However, strong fundamentals do not automatically translate into immediate price appreciation. The daily chart presents a market that is still attempting to recover from a prolonged decline. KEY FIGURES - Current price: $108.13 - 24-hour change: +5.94% - 24-hour high: $108.75 - 24-hour low: $96.65 - 24-hour turnover: $24.48M - Displayed volume: 197.05K AAVE MARKET CONSIDERATION AAVE has fallen substantially from its marked $187.63 peak. The recent recovery is encouraging, but price remains below the major moving averages. The current technical configuration is particularly important: - MA7: $115.80 - MA14: $122.41 - MA28: $130.66 - EMA7: $113.70 - EMA14: $120.37 - EMA28: $128.91 The averages remain bearishly aligned. This means buyers are attempting to establish a recovery while the broader daily trend still carries downside pressure. VOLUME AND TURNOVER The displayed trading volume is 197.05K, above both the MA5 reading of 169.11K and MA10 reading of 151.04K. This is a constructive development. Buying activity has improved relative to the recent volume averages. The 24-hour turnover of $24.48M also provides useful context for the level of market activity. However, one stronger volume reading is not enough to confirm sustained accumulation. SUPPORT, RESISTANCE AND LEVELS TO WATCH Immediate resistance: - $108.75 — displayed 24-hour high. - $113.70–$115.80 — first major moving-average resistance zone. - $120.37–$122.41 — next recovery barrier. - $128.91–$130.66 — broader resistance cluster. Support: - $104–$105 — near-term monitoring area, not yet confirmed as established support. - $96.65 — displayed 24-hour low. - $94.98 — previous marked chart low. BULLISH CONFIRMATION A sustained move above $108.75 would be the first positive development. The more meaningful confirmation would be a daily close above $115.80, preferably supported by expanding volume. Reclaiming $122.41 would further strengthen the recovery structure. BEARISH CONFIRMATION Failure to overcome the $113.70–$115.80 resistance region could invite renewed selling. A decisive breakdown below $96.65 would weaken the recovery thesis and bring the historical $94.98 area into focus. TRADE PLAN Bullish scenario: Avoid chasing the initial bounce. Watch for a confirmed breakout above $115.80, followed by a successful retest. The next technical areas of interest would be $120.37–$122.41 and subsequently $128.91–$130.66. Bearish scenario: If price rejects resistance and loses $96.65, avoid assuming the correction is over. Watch how price behaves around the $94.98 historical low. INVALIDATION For the bullish breakout setup, a failed reclaim followed by a sustained move back below $108.75 would weaken the immediate continuation argument. A decisive loss of the $96.65 support reference would invalidate the broader recovery thesis presented here. RISK NOTE AAVE remains volatile, and the prevailing daily moving-average structure is bearish. Breakout entries should be confirmed rather than anticipated. Position size should reflect the distance to the chosen invalidation level, and no trade should risk more than the trader can afford to lose. MY FINAL TAKE What interests me about AAVE is the contrast between improving participation and an unresolved higher-timeframe downtrend. Buyers are showing signs of returning, but they still have several resistance levels to overcome before the market can establish a convincing bullish reversal. I'm watching the $115.80 region closely. That is where the recovery will face its first meaningful structural test. Would you trust this recovery enough to consider a breakout above $115.80, or would you rather wait for stronger confirmation of a daily trend reversal? $AAVEUSDT #ByXIMPACT $BTCUSDT
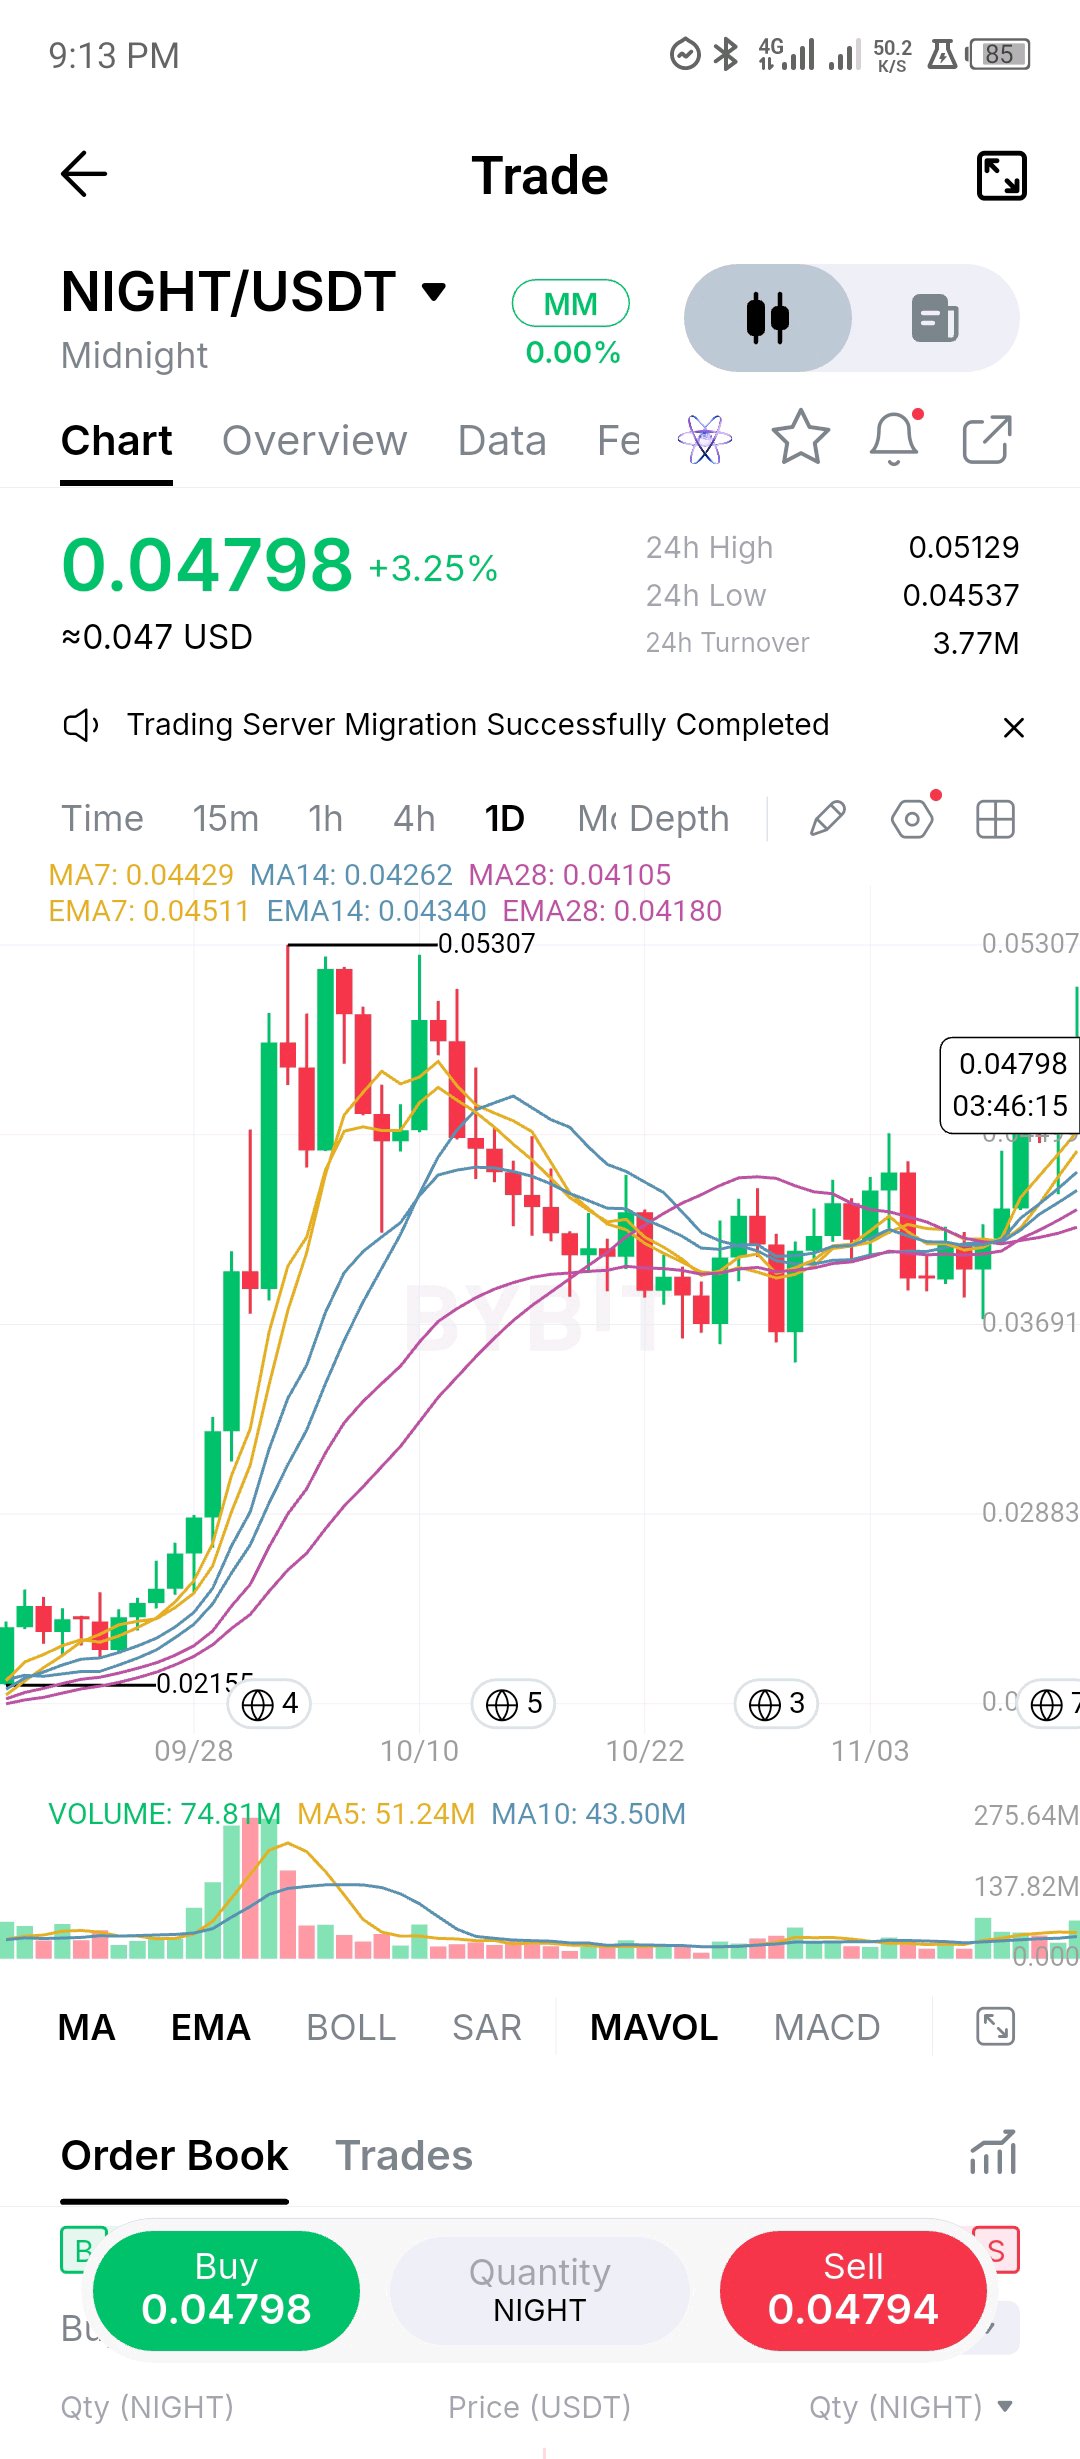
NIGHT sedang menembus keluar dari base selama lima minggu. Setelah melesat 146% dari 0,02155 ke 0,05307 di bulan September dan Oktober, koin ini menghabiskan waktu berminggu-minggu berkonsolidasi di kisaran 0,035 hingga 0,046 sementara MA 7, 14, dan 28 hari mendatar membentuk pita yang rapat (0,0443, 0,0426, 0,0411). Candle hari ini membawa harga ke 0,04798, menembus batas atas kisaran tersebut, dengan volume 75 juta yang sudah sekitar 1,5x dari rata-rata 5 hari dengan waktu tersisa kurang dari empat jam. Konfirmasinya valid. Harga berada di atas ketiga MA dan EMA, yang kini mulai berbalik naik, dan pullback setelah level tertinggi Oktober tertahan di area 0,035-0,036 pada penutupan. Pergerakan terukur dari base (ketinggian rentang ditambahkan ke titik atas) menunjuk ke sekitar 0,056, di atas level tertinggi 0,05307. Level: 0,05129 (level tertinggi hari ini) dan 0,05307 (level tertinggi Oktober) adalah resistance pertama. Pada saat pullback, 0,0455 (batas atas rentang lama, sekarang menjadi support) dan MA 7 hari di 0,0443 adalah area yang harus dipertahankan jika ini breakout yang nyata. Penutupan kembali di bawah 0,0443 akan menjadikannya false breakout. Saya lebih memilih melihat retest di batas atas rentang bertahan daripada mengejar candle yang sudah naik. $NIGHTUSDT #ByXIMPACT $SOLUSDT
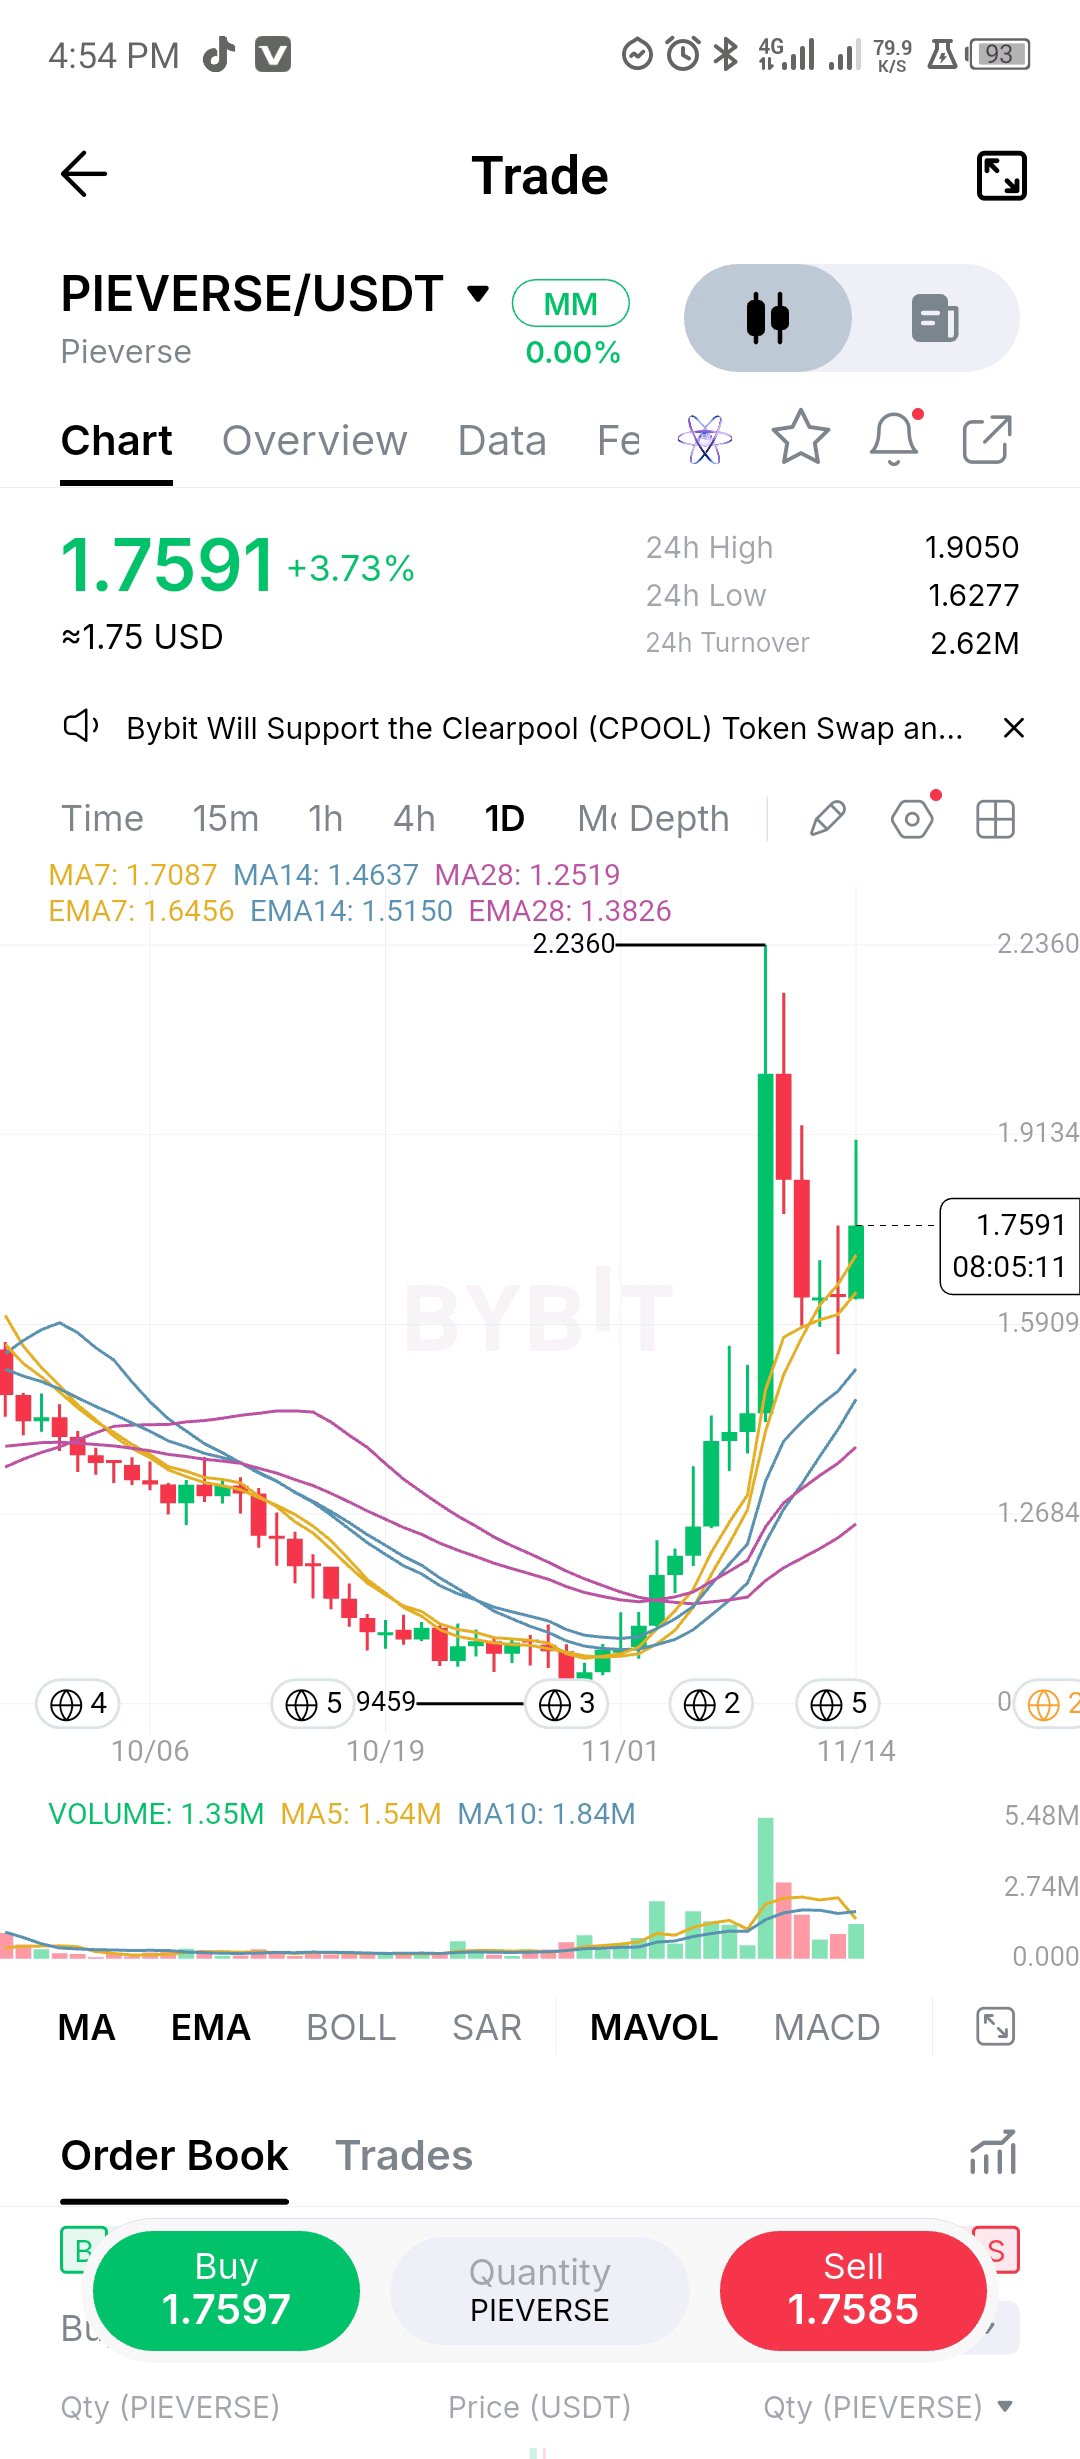
PIEVERSE melakukan apa yang dilakukan tren yang sehat: harganya naik 136% dari level terendah 0,9459 ke 2,236, terkoreksi sekitar 30% ke sekitar 1,54, dan sekarang sedang memantul dari level terendah yang lebih tinggi (higher low). Harga kembali berada di atas retracement 38,2% dari seluruh pergerakan (1,743) dan telah merebut kembali MA 7 hari (1,7087), dengan volume sekitar 1,3x dari rata-rata 5 hari pada laju hari ini. Strukturnya masih terlihat bersih di sisi bullish. MA 7, 14, dan 28 hari (1,7087, 1,4637, 1,2519) terbuka dan naik, dan harga berada 20% di atas MA 14 hari dan 40% di atas MA 28 hari. Penurunan (pullback) menghormati area retracement 50% di dekat 1,59 dan tidak pernah menyentuh MA 14 hari. Penentunya: level tertinggi 24 jam di 1,9050 dan puncak candle dorongan di sekitar 2,01 adalah resistance pertama, kemudian level tertinggi 2,236. Penutupan harian di atas 2,01 akan menjadi higher high pertama. Support berada di MA 7 hari di dekat 1,71, kemudian 1,6277 (level terendah hari ini) dan 1,59, dan penutupan di bawah 1,46 akan berarti koreksi lebih dalam daripada sekadar pola bendera (flag). Ini adalah ujian nyata pertama bagi tren sejak lonjakan tersebut, dan sejauh ini tren tersebut lolos ujian. $PIEVERSEUSDT #ByXIMPACT $BTCUSDT
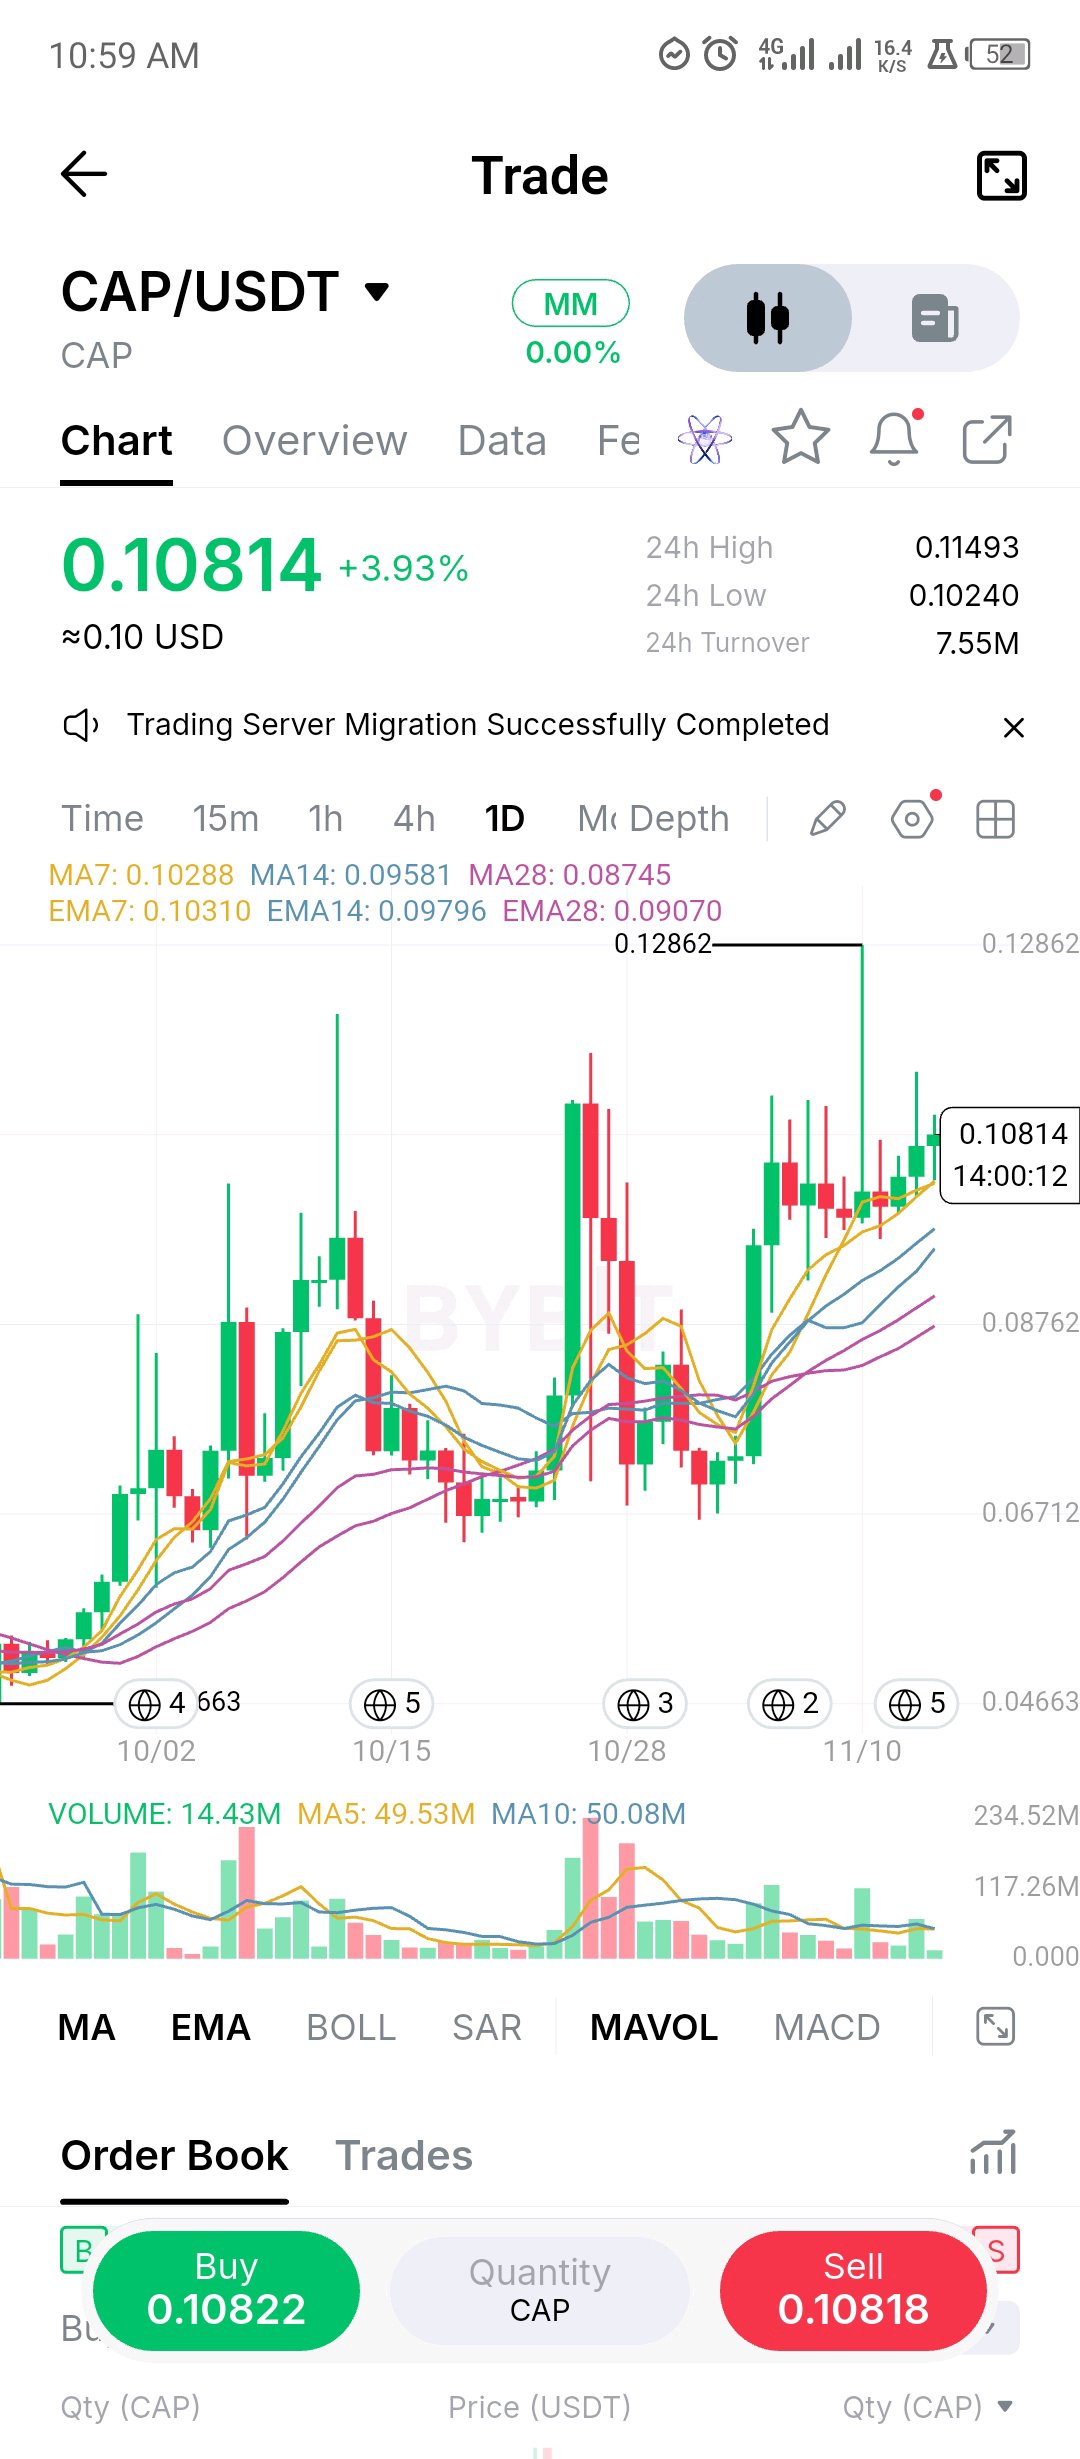
CAP ($CAP): Buyers Are Building Momentum, But One Resistance Zone Stands Between Them and a Stronger Breakout. CAP is showing an encouraging recovery on the daily timeframe. Trading around $0.10814, the token is up 3.93% in the displayed 24-hour session. More importantly, its recent price behaviour suggests that buyers have gained control of the short-term structure. What makes this setup interesting is the alignment of the moving averages. - MA7: $0.10288 - MA14: $0.09581 - MA28: $0.08745 The EMA readings tell a similar story, with all three averages positioned below the current price. This alignment supports the bullish structure and suggests that recent buying has shifted the short-term trend in favour of buyers. But I wouldn't overlook the resistance overhead. The $0.11493 level is the immediate test. A convincing break above this area could strengthen the bullish continuation argument and potentially bring the previous $0.12862 chart high back into focus. On the downside, $0.10240 is the immediate support reference. If buyers fail to defend this area, attention shifts toward the $0.09796–$0.09581 region, where the short-term averages provide additional technical support references. There is also a volume detail worth watching. Current displayed volume is 14.43M, considerably below the MA5 and MA10 readings of 49.53M and 50.08M. Price is advancing, but participation has not yet matched those earlier volume levels. That makes the next breakout attempt particularly important. Stronger volume would provide better confirmation that demand is expanding rather than simply reflecting a low-participation recovery. My reading of the market: CAP currently has a constructive daily structure. Buyers have reclaimed the moving averages, and the sequence of recent candles suggests improving price control. However, the market still needs to overcome $0.11493 to make a stronger continuation case. I'm watching whether buyers can turn that resistance into support. Until then, the bullish setup is promising, but confirmation remains the missing piece. Would you be looking for a breakout above $0.115, or waiting for a pullback toward $0.102 before considering an entry? $CAPUSDT #ByXIMPACT $BTCUSDT
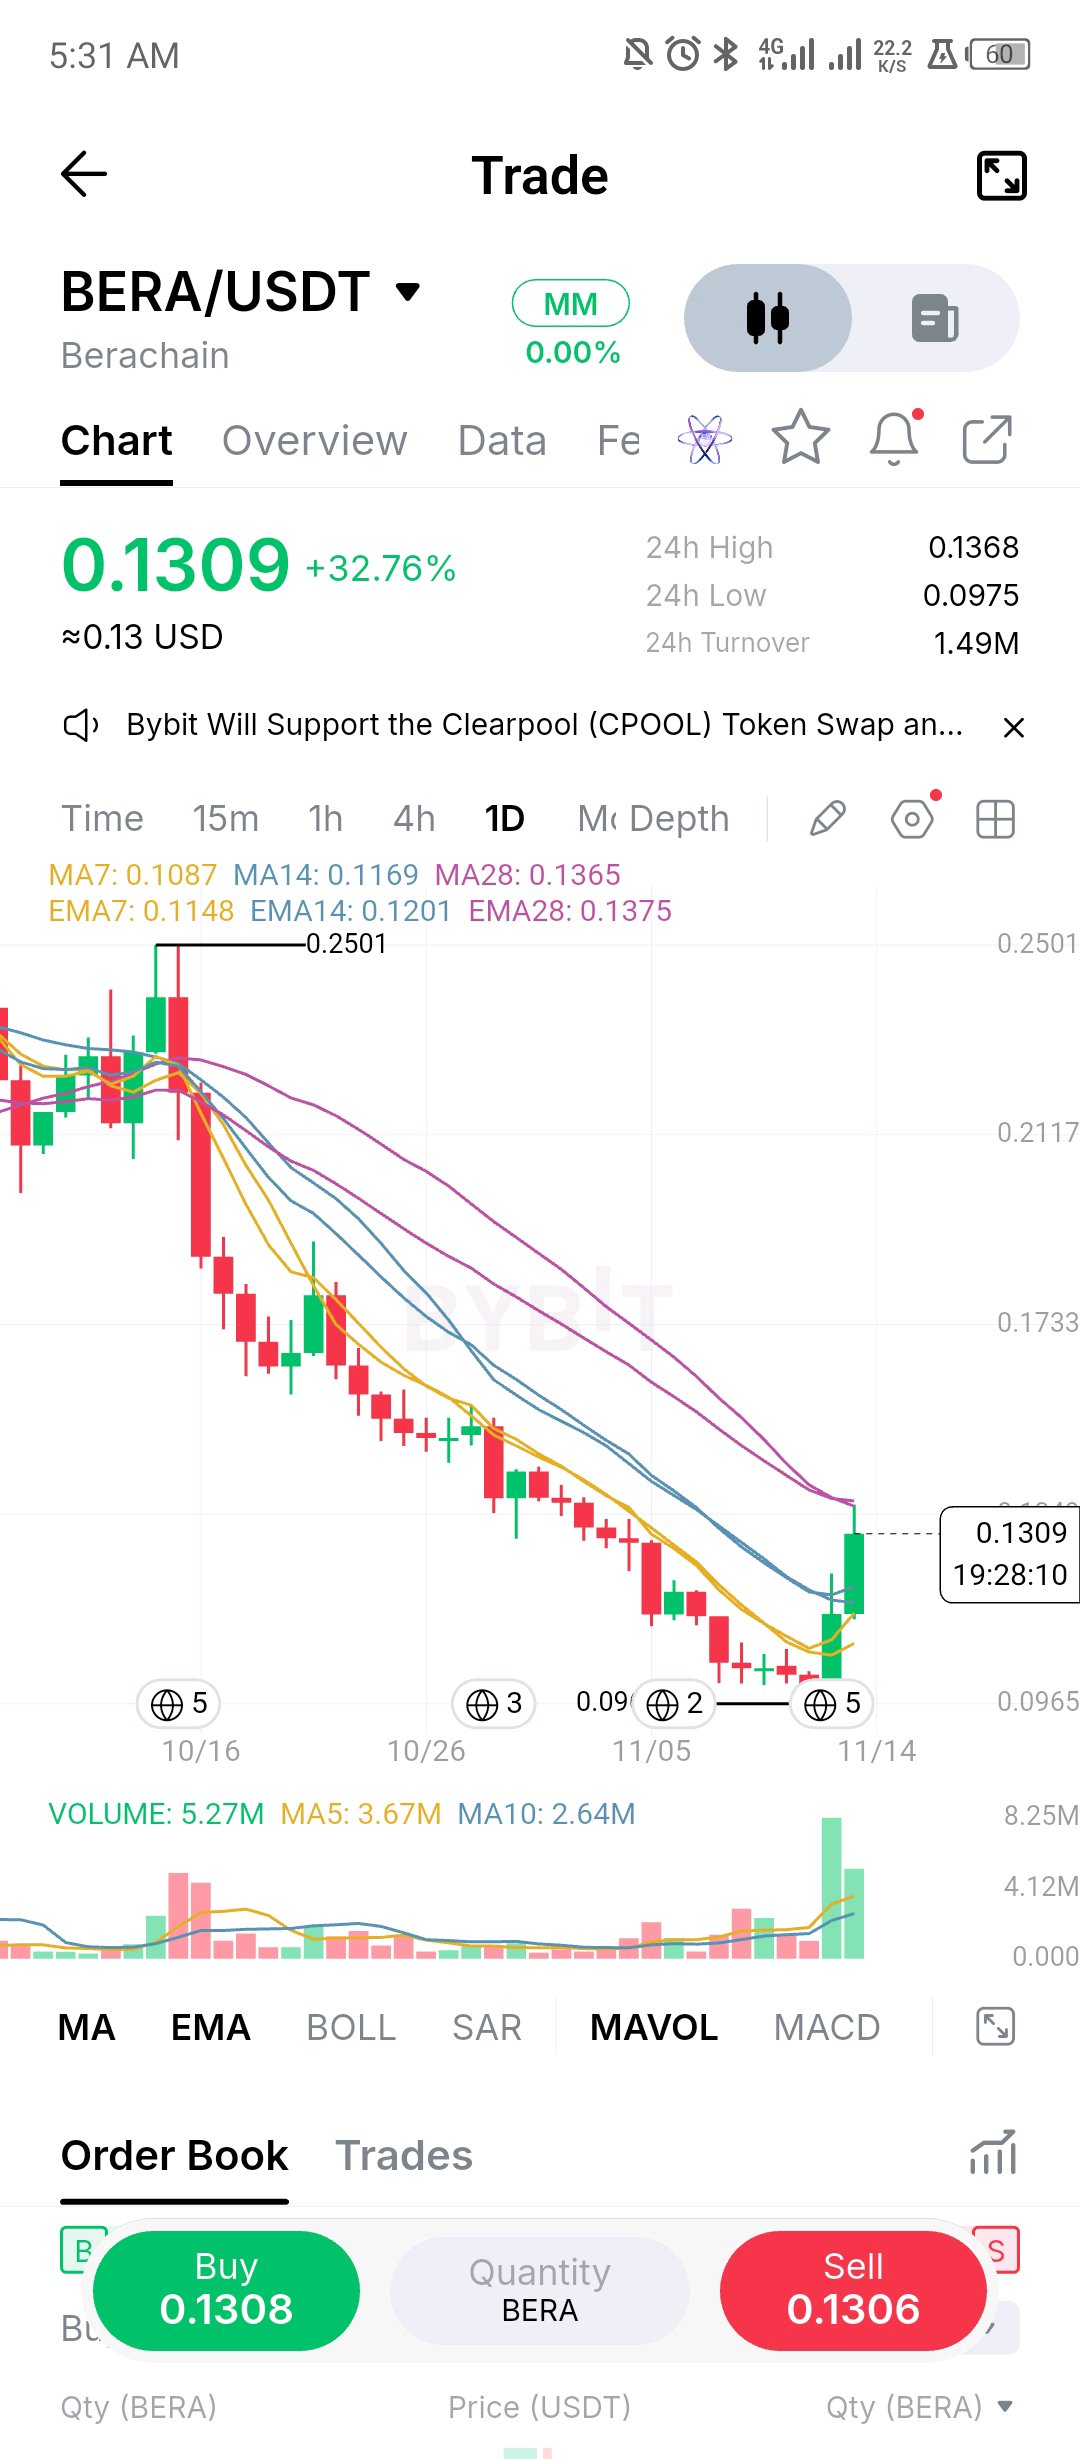
BERACHAIN ($BERA): A Powerful Rebound, But Has the Trend Actually Changed? Something interesting is happening with BERA. After an extended decline from the $0.2500 region, Berachain's native token has staged a sharp recovery, gaining 32.76% in the displayed 24-hour session to trade around $0.1309. That's a significant move, but the more important question is whether this is the beginning of a structural reversal or an aggressive relief rally. Looking at the daily chart, a few things stand out. The recovery has real momentum behind it. BERA has pushed back above its 7-day and 14-day moving averages: - MA7: $0.1087 - MA14: $0.1169 - MA28: $0.1365 The short-term recovery is encouraging, but the 28-day average remains overhead. The EMA configuration tells a similar story, with the longer-term average around $0.1375. This creates an important resistance zone between $0.1365 and $0.1375. Volume is adding credibility to the move. Displayed volume has reached 5.27M, compared with MA5 at 3.67M and MA10 at 2.64M. That expansion suggests stronger participation behind the rebound. However, increased volume alone does not confirm a trend reversal. The levels that deserve attention: - $0.1365–$0.1375: Major immediate resistance and the first serious test for buyers. - $0.1200–$0.1210: An important short-term recovery area to monitor if price pulls back. - $0.1087: The 7-day moving average and another potential support reference. - $0.0975: The recent displayed low; losing this area would seriously weaken the recovery thesis. My trading perspective: I find the volume expansion and the reclaim of the shorter moving averages encouraging. Nevertheless, I would not declare a bullish trend reversal before seeing BERA establish acceptance above the $0.1365–$0.1375 resistance region. A successful breakout and sustained hold could create room for a broader recovery. Conversely, rejection around this zone followed by a loss of $0.1200 would suggest that sellers are still defending the larger downtrend. The interesting part is that BERA has finally attracted meaningful buying interest after weeks of weakness. Now the market needs to prove that this demand can survive its first major resistance test. Would you consider this the early stage of a genuine trend reversal, or would you wait for a confirmed daily close above $0.1375? $BERAUSDT #ByXIMPACT
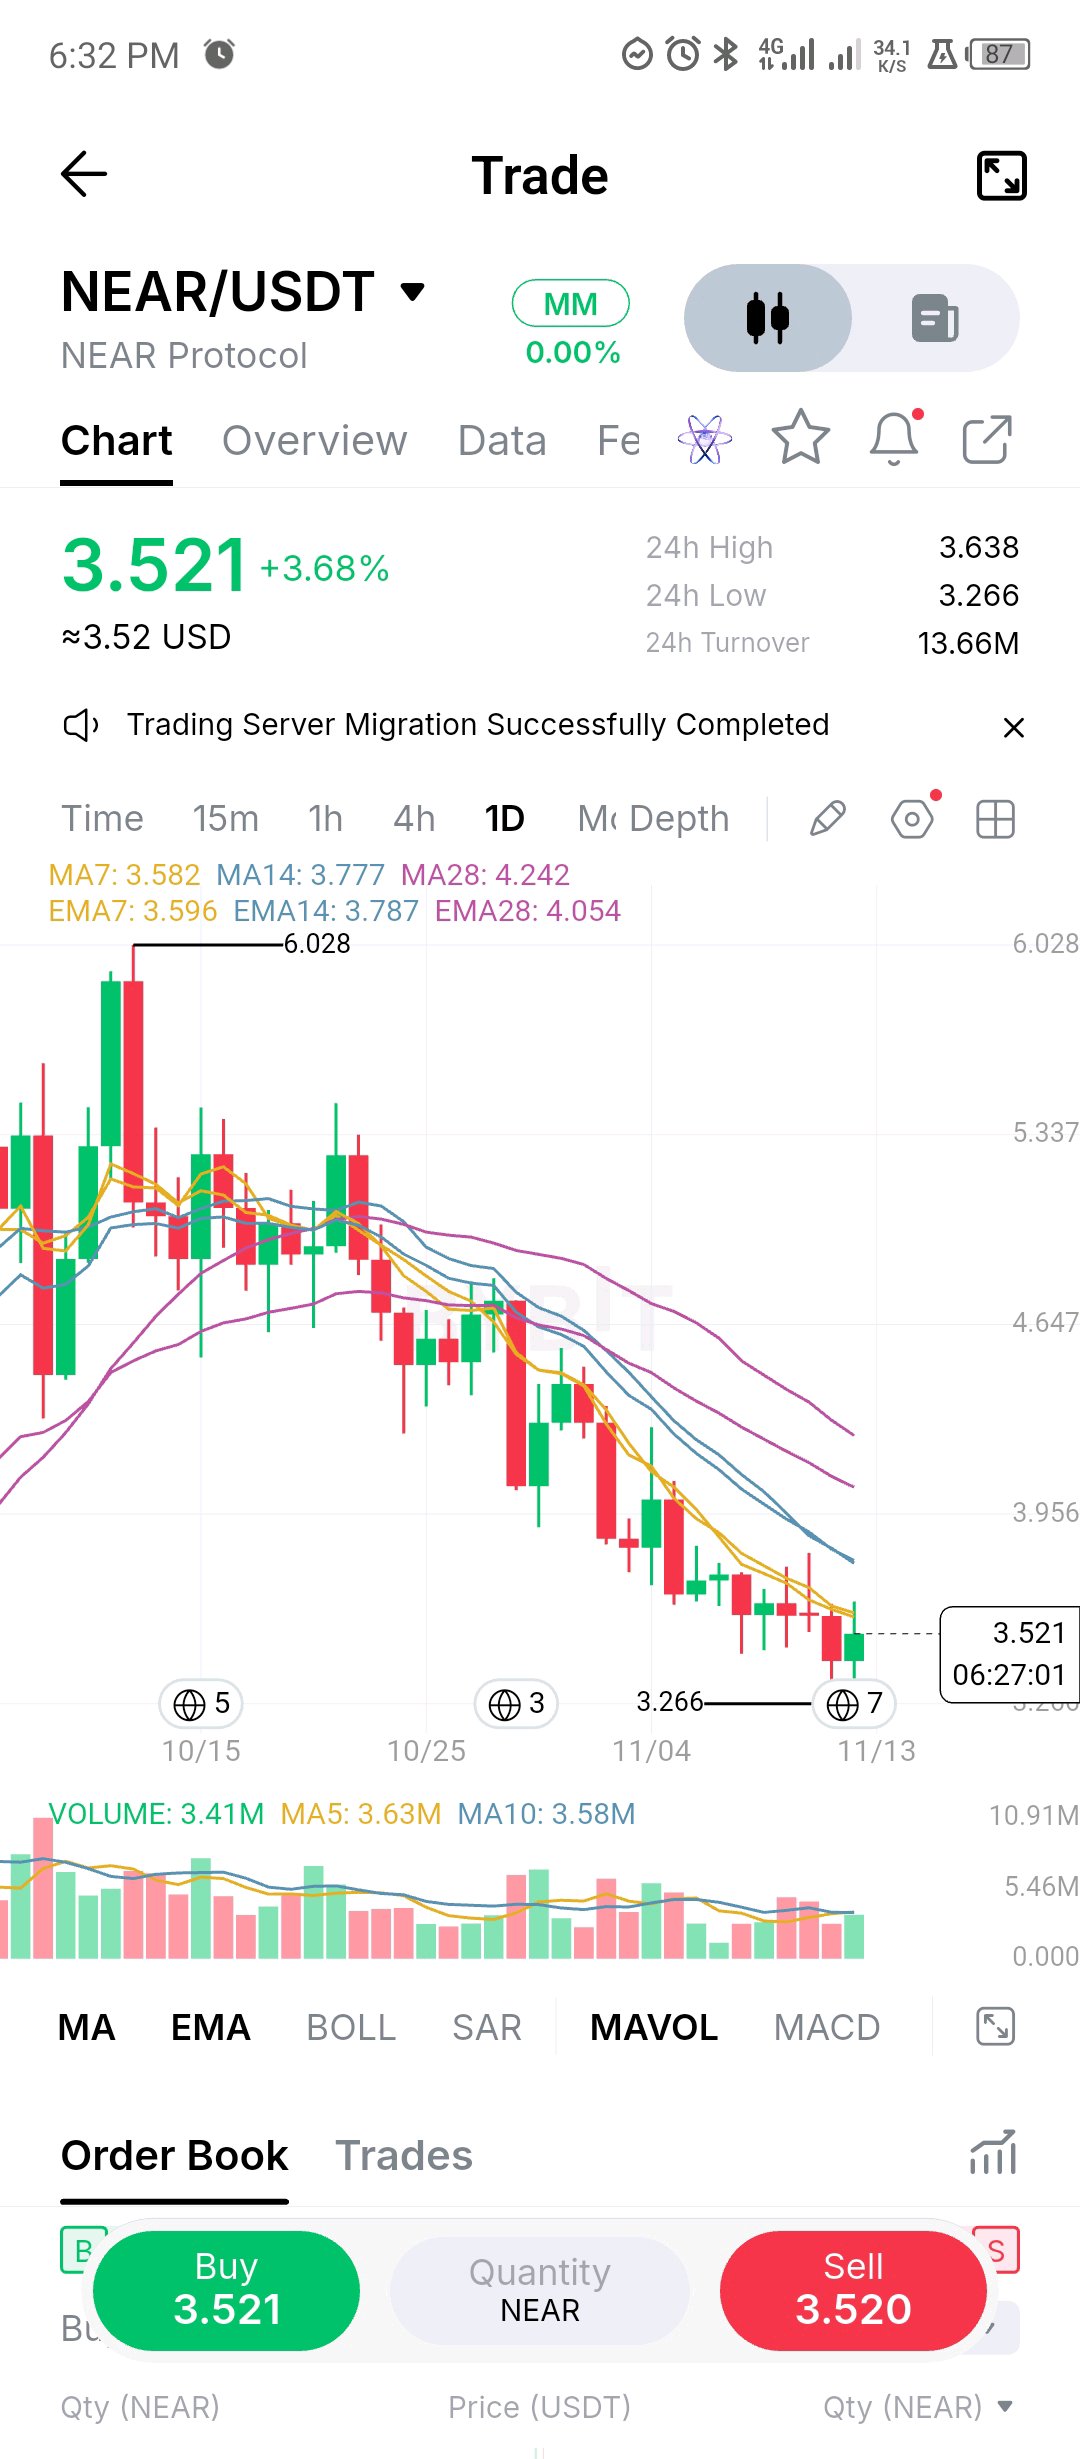
NEAR has now retraced about 67% of its entire 2.298 to 6.028 rally. The 50% level at 4.16, which was the key support last week, is now a ceiling about 18% overhead. Today's 3.266 low got bought and price is up about 8% off it at 3.521, right on the 7 day MA (3.582) and EMA7 (3.596). The trend filter hasn't changed. The 7, 14 and 28 day MAs (3.582, 3.777, 4.242) are stacked bearishly and falling, and price is 17% under the 28 day. What's different is that volume is holding up, about 1.3x its 5 day average at the pace of the day, at the first meaningful reaction after weeks of steady selling. Levels: 3.638 (today's high) and the 61.8% retrace at 3.72 are the first tests, with the 14 day MA at 3.777 behind them. Support is 3.266, then the 78.6% retrace near 3.10. A daily close over 3.78 would be the first sign the downtrend is stalling, and a close under 3.266 would target 3.1. Controlled bounce, no confirmation yet. Closes decide it. $NEARUSDT #ByXIMPACT
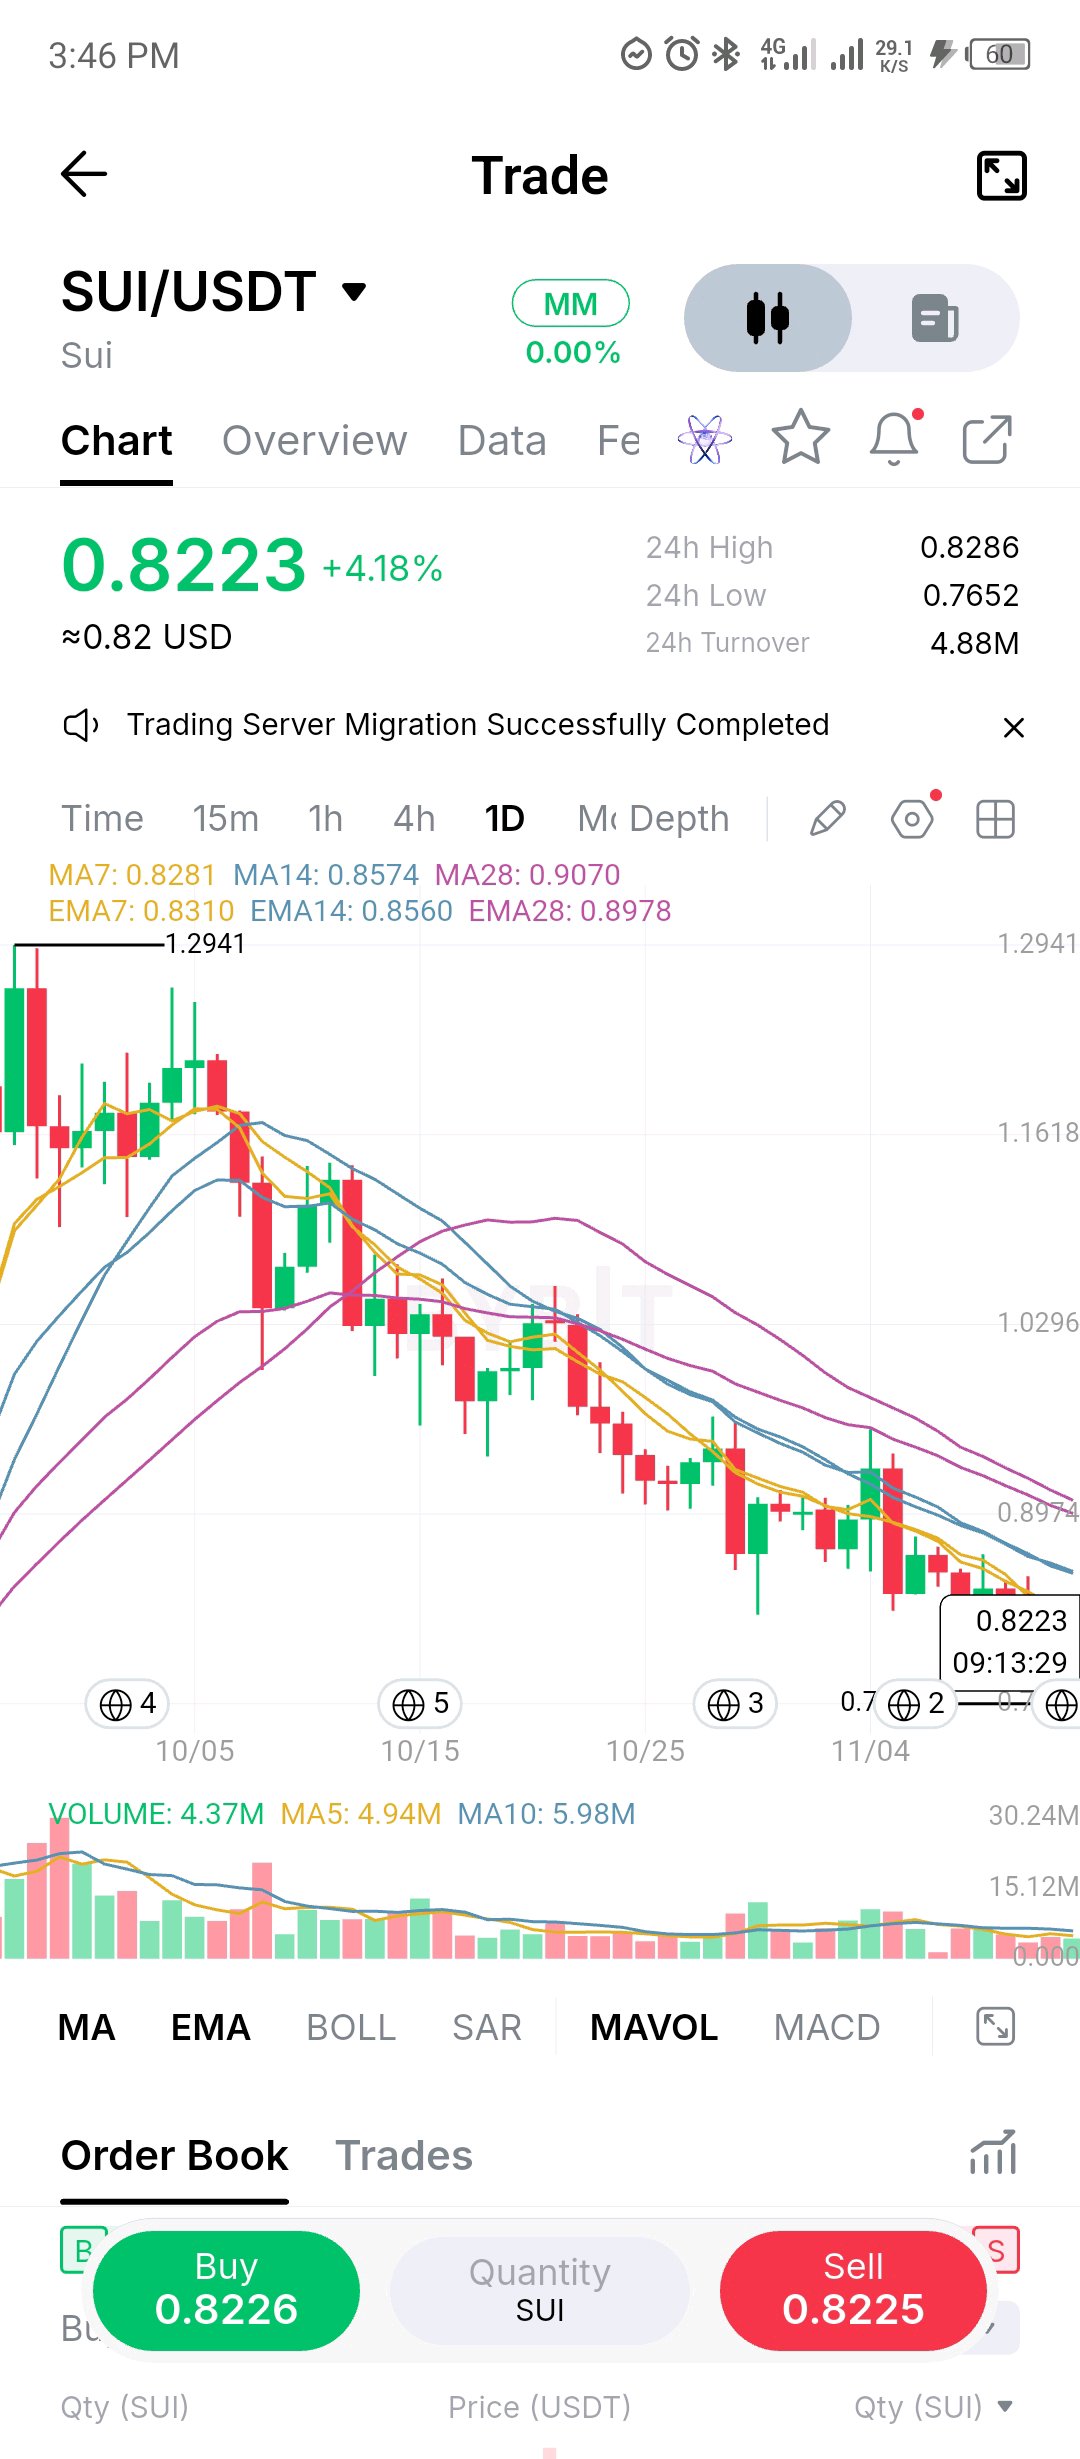
$SUIUSDT Prospek Teknis Harian SUI/USDT: Uji Moving Average Cepat Menguji Resistance Lokal Sui ($SUI) diperdagangkan naik +4,18% di sekitar 0,8223 setelah mempertahankan support intraday terendahnya di 0,7652. Aksi harga sedang mencoba untuk membangun struktur pemulihan jangka pendek setelah koreksi penurunan yang berkepanjangan dari puncak makro 1,2941. Metrik Teknis Utama: • Moving Average & Tumpukan EMA: Harga melayang tepat di bawah garis MA7 cepat (0,8281) dan EMA7 (0,8310). MA14 jangka menengah berada di 0,8574 (EMA14 di 0,8560) dan MA28 makro berada di 0,9070 (EMA28 di 0,8978). • Dinamika Volume: Volume harian terbaca 4,37 Juta, diperdagangkan mendekati garis dasar 5 hari (4,94 Juta) dan moving average 10 hari (5,98 Juta), yang menandakan penyerapan pembeli yang aktif di dekat level terendah saat ini. • Batas Kisaran Segera: Tertinggi 24 jam di 0,8286 berfungsi sebagai rintangan breakout segera, sementara perlindungan sisi bawah berlabuh pada level terendah 0,7652. Skenario Eksekusi: • Reclaim Bullish: Penutupan harian yang tegas di atas klaster resistance MA7 0,8281 / EMA7 0,8310 mengonfirmasi penyerapan pembeli jangka pendek, membuka jalan untuk menguji zona MA14 0,8574. • Invalidasi Bearish: Kehilangan lantai support 0,7652 dengan peningkatan volume jual membatalkan pengaturan pembalikan segera dan memperpanjang saluran penurunan yang lebih luas. Apakah Anda melakukan bid pada pantulan support SUI ini menuju level 0,85, atau menunggu penutupan yang terkonfirmasi melewati garis MA7? #ByXIMPACT
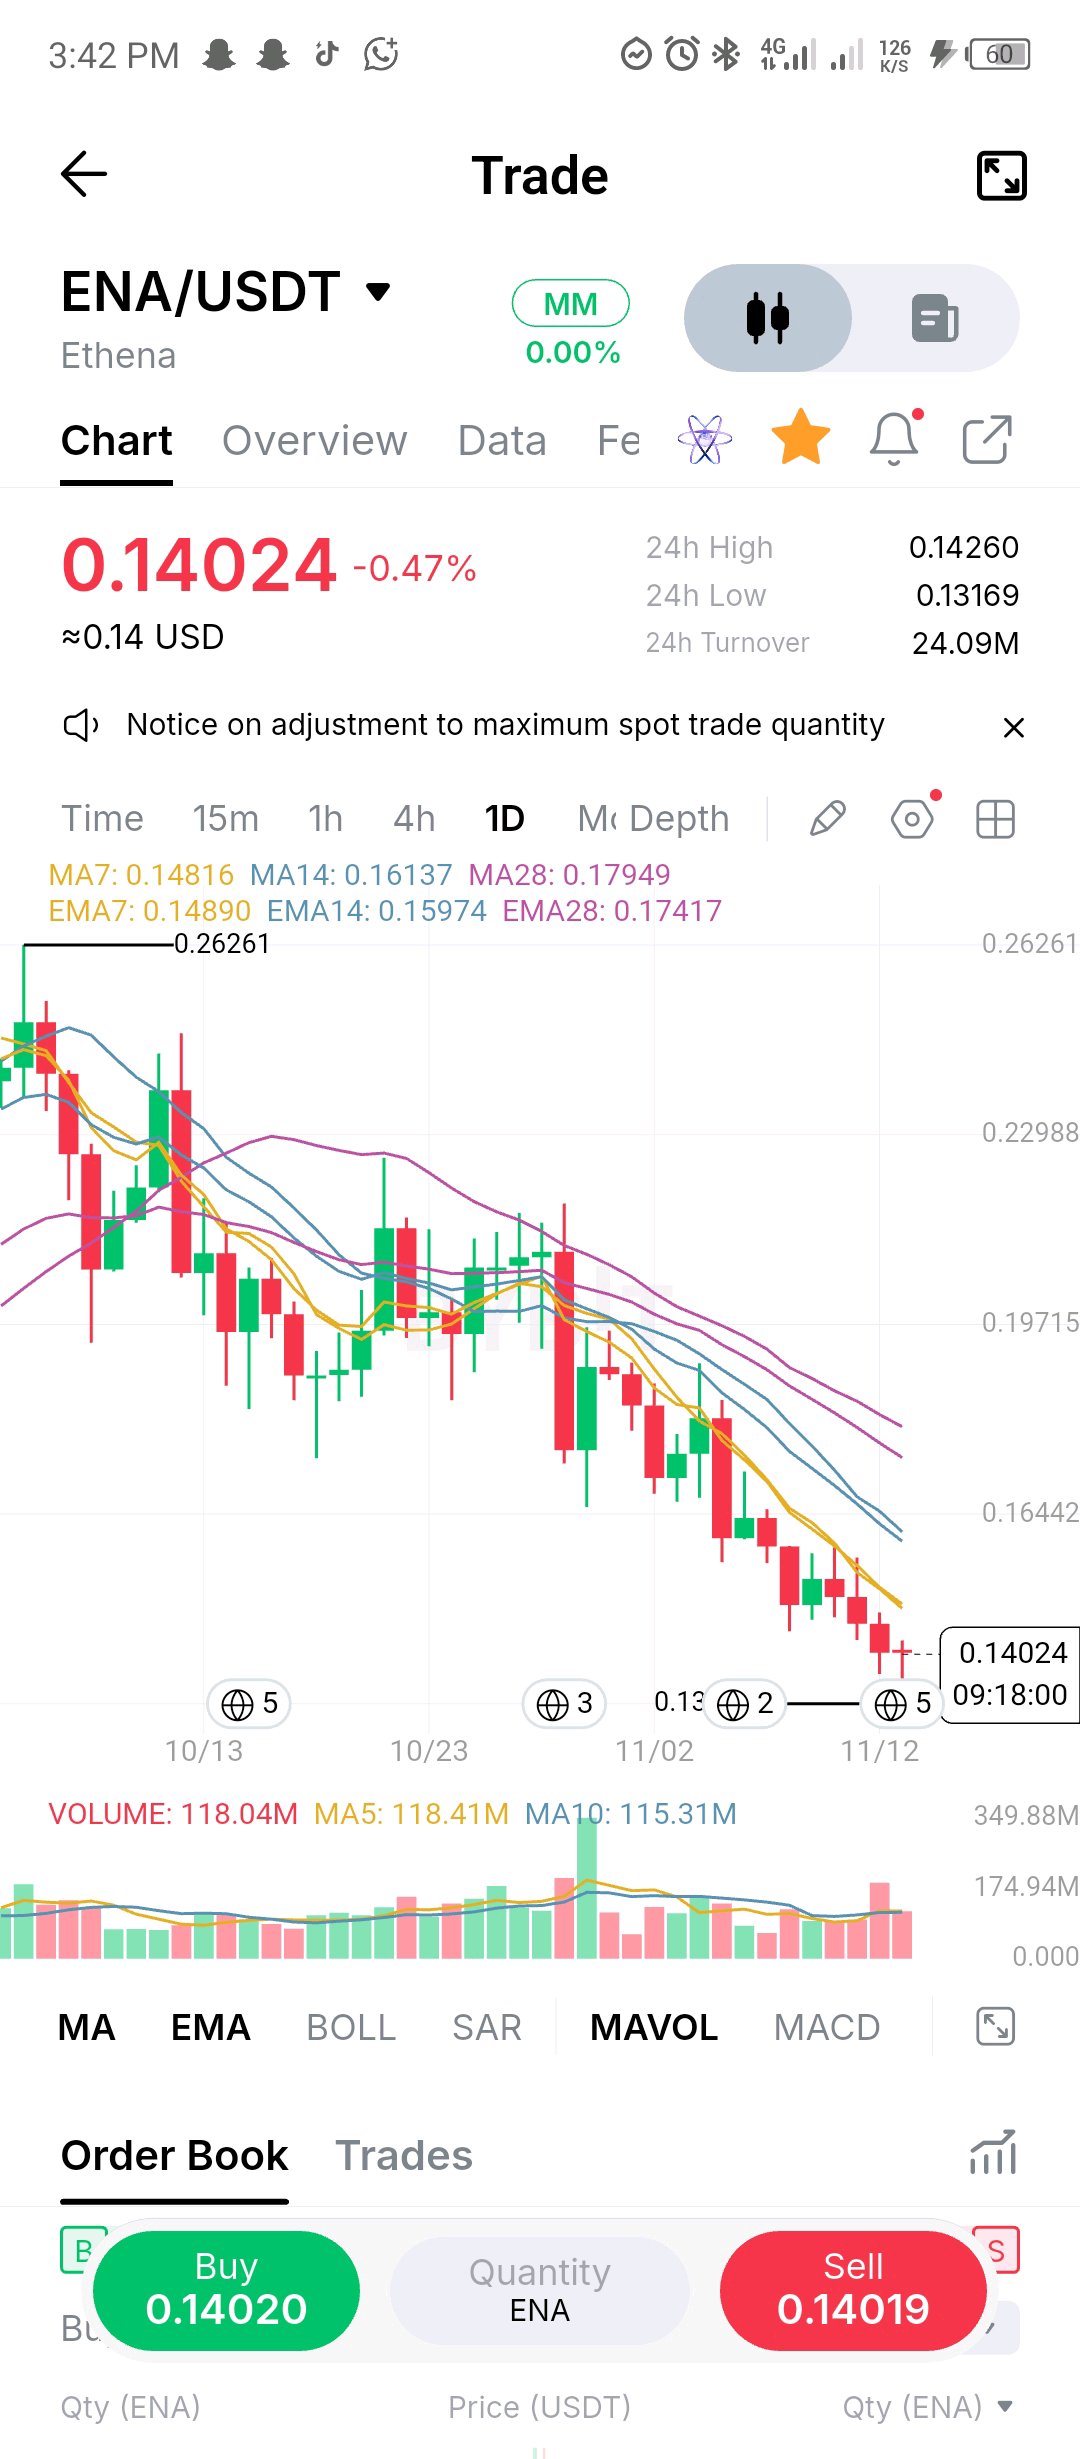
$ENA baru saja melakukan sapuan (sweep) pada level terendah September dan memantul. Dalam 24 jam terakhir, harga turun ke 0,13169, sekitar 2% di bawah level 0,13473 yang menandai awal dari seluruh reli, lalu pulih ke 0,14024 dengan volume yang sudah menyamai rata-rata 5 hari dengan sisa waktu sekitar 40% hari ini. Setelah perjalanan naik-turun 96% dari titik tertinggi 0,29465, level terendah itu adalah level utama terakhir di grafik ini. Sapuan seperti ini adalah ujian pertama, bukan kesimpulan. Rata-rata harga masih tersusun bearish dan turun (7 hari 0,14816, 14 hari 0,16137, 28 hari 0,17949), dengan harga 5% di bawah rata-rata 7 hari dan 22% di bawah rata-rata 28 hari. Lantai yang ditembus di 0,1494, 0,1675, dan 0,174 kini menjadi resistensi di atas harga. Apa yang akan saya perhatikan: penutupan harian di atas 0,1482 (MA 7 hari) akan menunjukkan pembeli merebut kembali rata-rata pertama. Penutupan kembali di bawah 0,1347 akan mengubah sapuan ini menjadi penembusan nyata dan tidak menyisakan level yang ditandai di bawahnya. Ini adalah level dengan taruhan tinggi, jadi saya menunggu penutupan harga untuk memutuskan skenario mana yang sedang terjadi. $ENAUSDT #ByXIMPACT $ENAUSDC
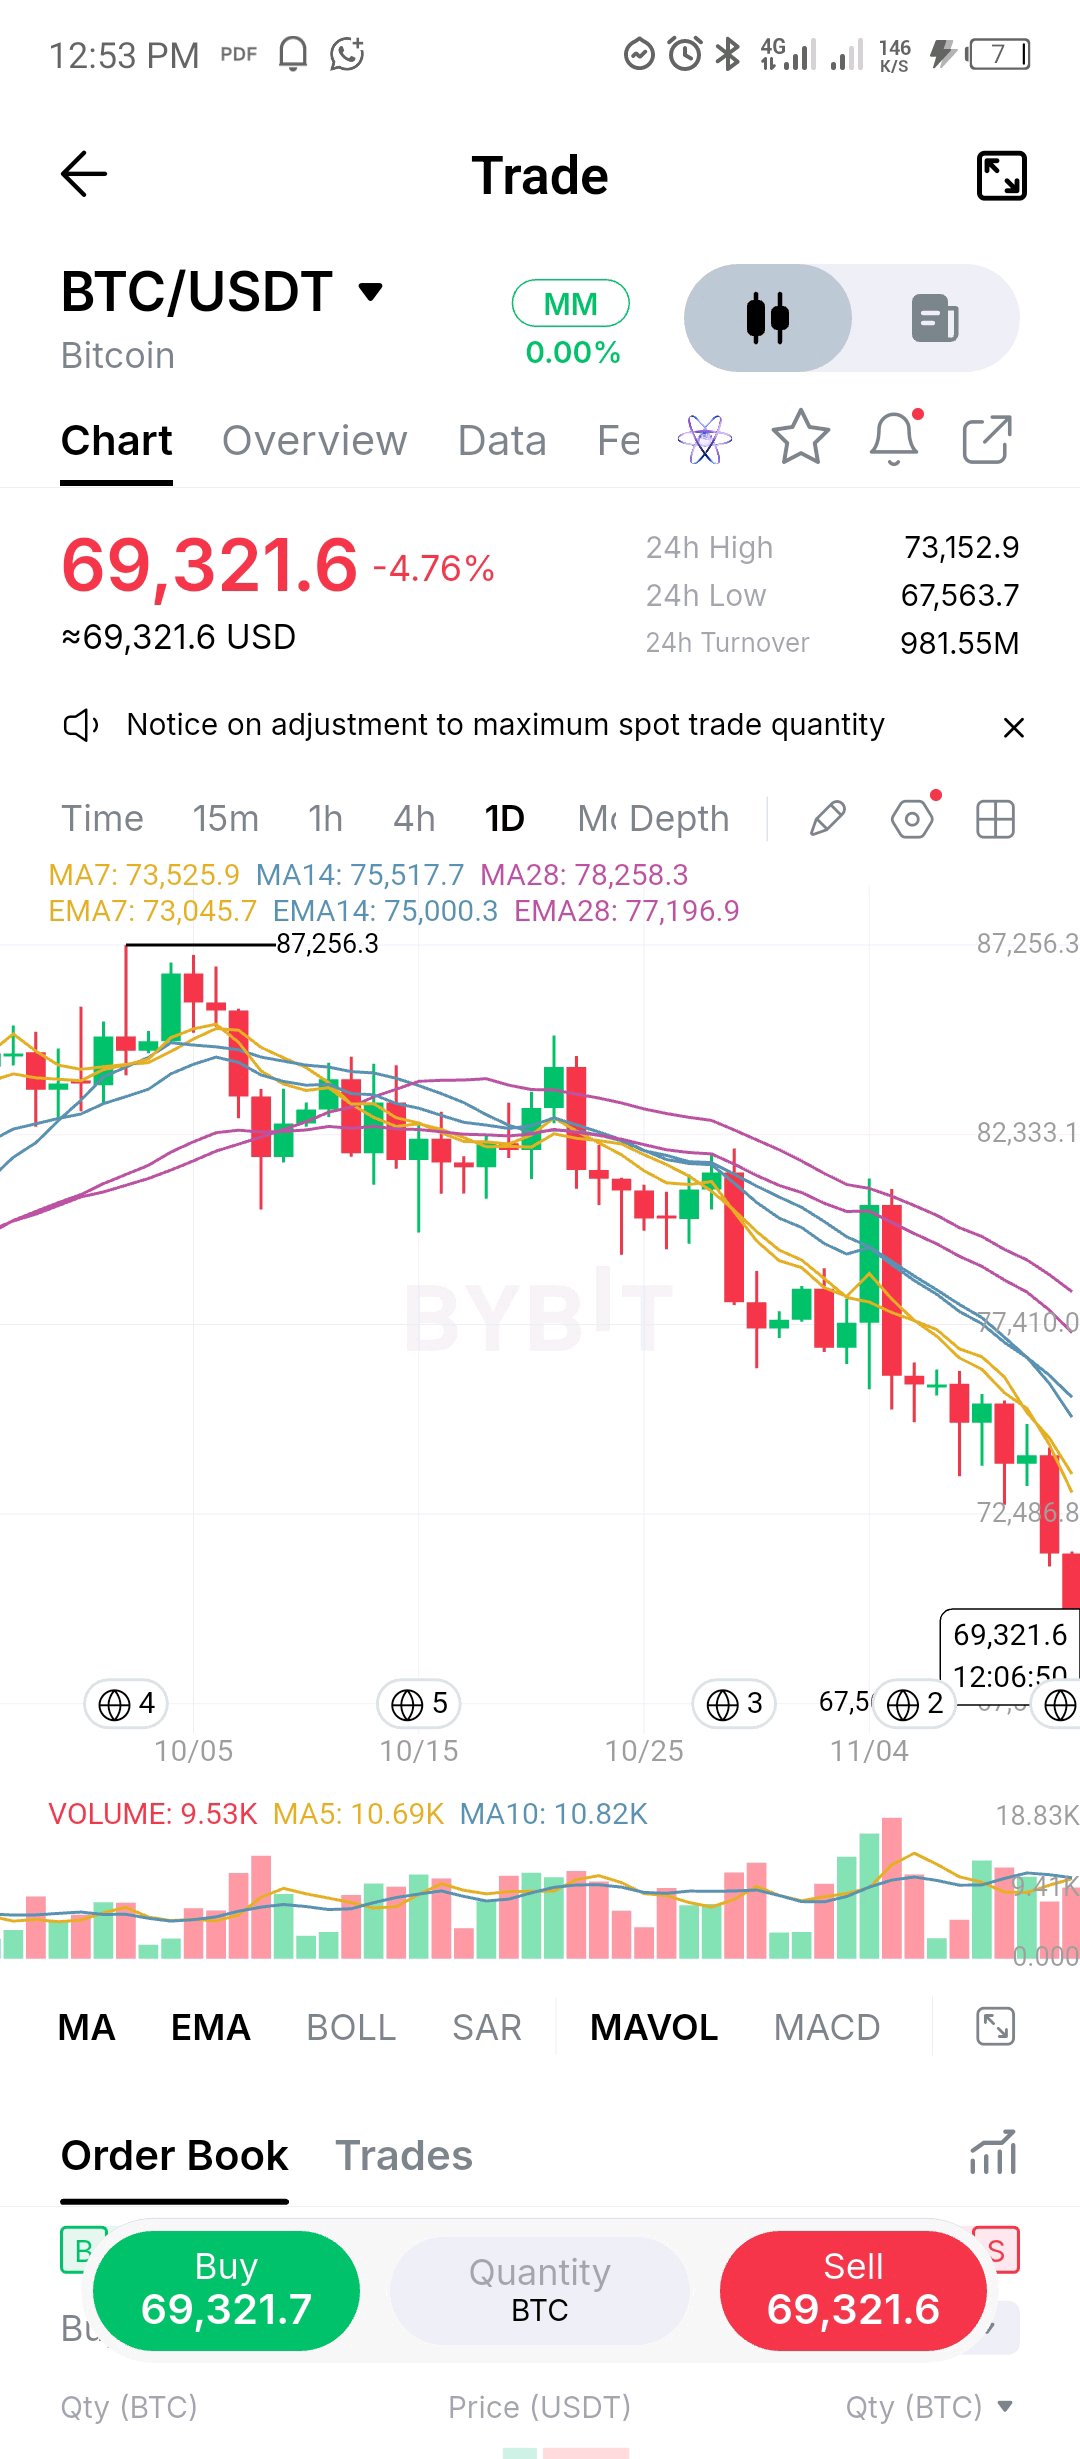
BTC baru saja kehilangan level support terakhir pada grafik ini. Setelah base 74.920 jebol awal minggu ini, level terendah 73,3k pun ikut tumbang hari ini. Harga sempat anjlok (flush) ke 67.564 lalu memantul ke sekitar 69,3k, sebuah rentang harian 8%, dengan volume yang melacak sekitar 1,8x rata-rata 5 harinya. Saat ini harganya sekitar 21% di bawah level tertinggi 87.256. Semua rata-rata berada di atas dan turun secara berurutan: 7 hari di 73.526, 14 hari di 75.518, dan 28 hari di 78.258, dengan EMA tepat berada di bawahnya. Ini membuat bekas support di 73,3k dan 74,9k menjadi resistance berlapis, dengan 70k sebagai ujian angka bulat pertama. Yang penting dari sini adalah apakah 67,5k mampu bertahan saat penutupan. Flush pada volume besar yang ditutup jauh dari level terendah bisa menandai titik terendah jangka pendek. Penutupan di level terendah membuka jalan ke 65k tanpa ada support yang terlihat di bawahnya. Untuk reclaim yang sesungguhnya, BTC perlu kembali ke atas 70k, lalu 73,3k. Ekspansi volatilitas bisa berdampak dua arah, jadi saya memantau penutupan harian, bukan ayunan intraday. $BTCUSDT #ByXIMPACT
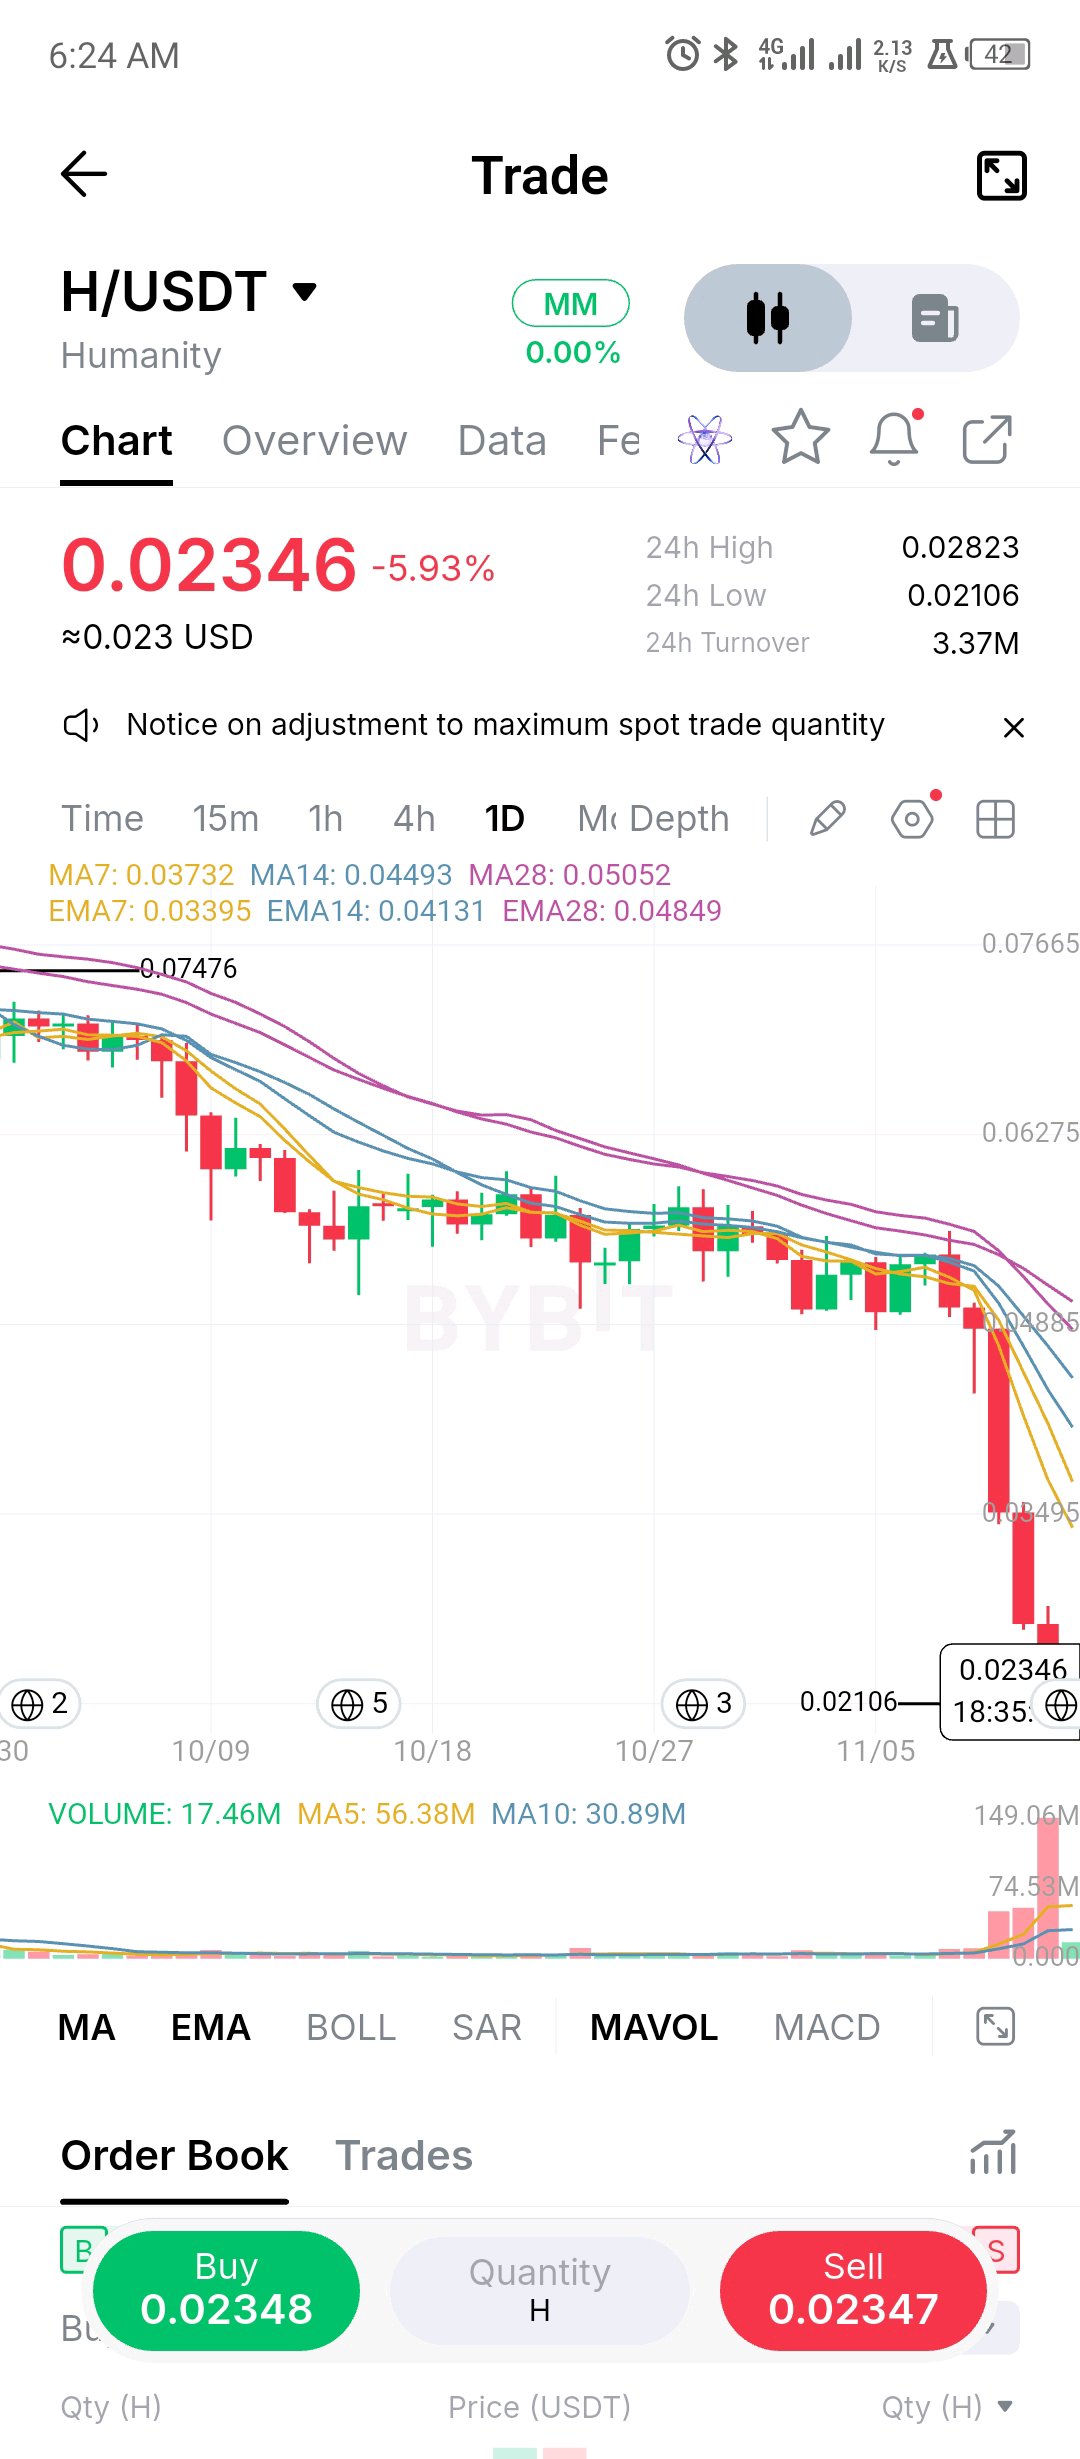
$H has gone from a quiet coil to a waterfall. After weeks in a tight band around 0.050-0.056, with the averages flat and bunched together, price broke down roughly four sessions ago and lost more than half its value in that stretch. That included a day of volume near 150M, more than double the 5 day average. Price is now 0.02346, with a 24h range of 0.02106 to 0.02823, a 34% swing in a single day. That swing is the story. A bounce to 0.0282 got sold into and the market is back near the lows. Price is about 37% under the 7 day MA (0.03732) and 54% under the 28 day (0.05052), which is about as stretched as a chart gets, and the broken range now sits far overhead as supply. Levels: 0.02106 (the low) is the line to watch, with nothing marked beneath it. A reclaim of 0.0282 (the 24h high) would be the first sign buyers can hold a bounce, and the first real resistance after that is the 7 day MA at 0.0373. Waterfalls that look cheap can keep falling. I'd wait for the low to be defended on a closing basis before treating any bounce as more than a squeeze. $HUSDT #ByXIMPACT
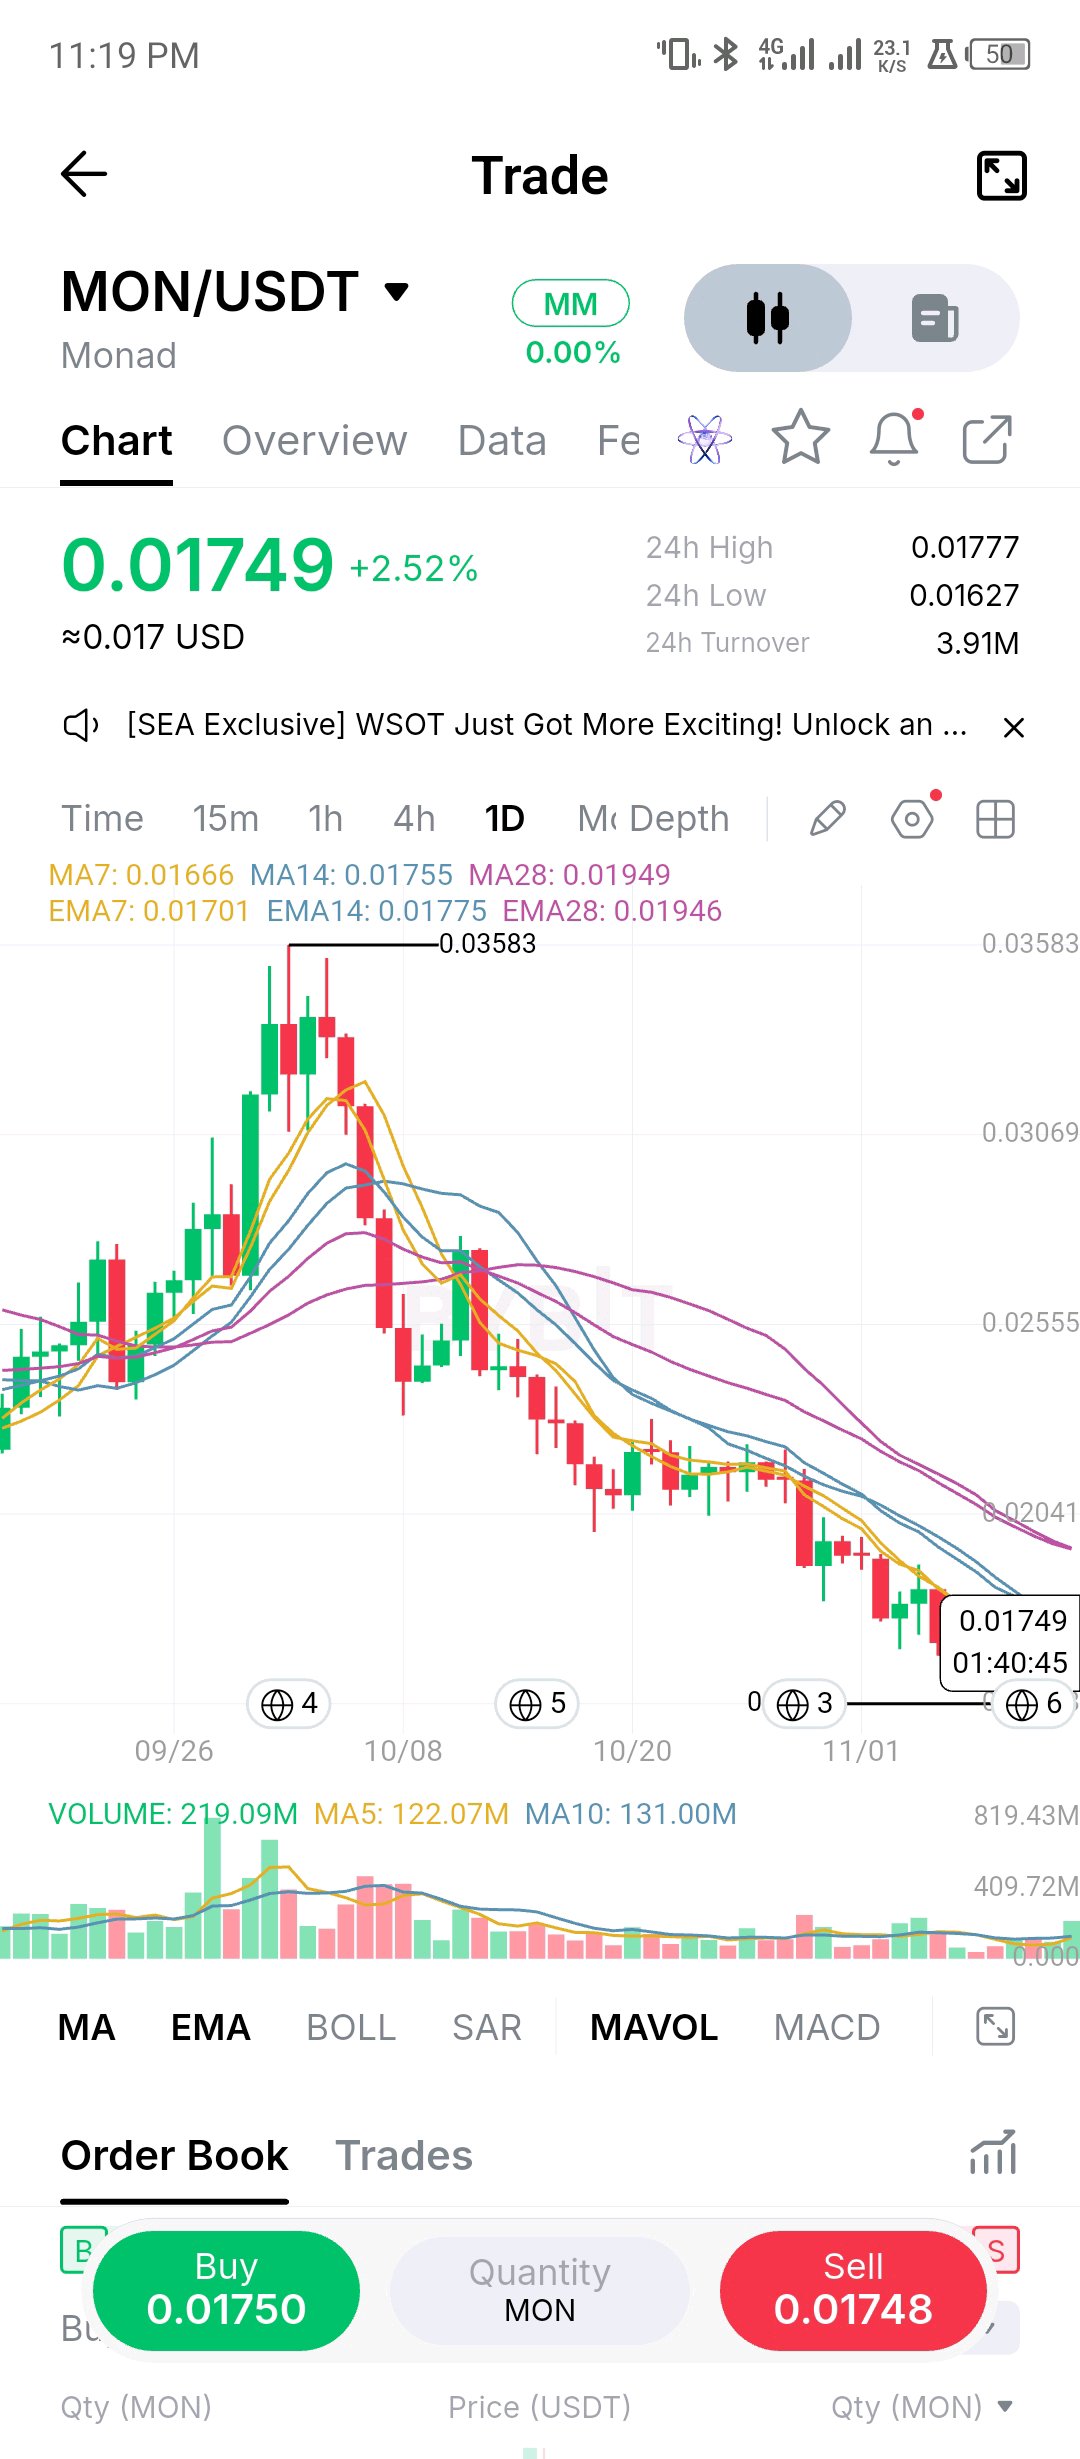
Prospek Teknikal Harian MON/USDT: Pemulihan Moving Average Cepat Menguji Resistance Lokal Monad ($MON) diperdagangkan naik +2,52% di sekitar 0,01749 setelah mempertahankan level support terendah intraday terbarunya di 0,01627[span_2](start_span)[span_2](end_span). Pergerakan harga sedang mencoba membangun struktur pemulihan jangka pendek setelah koreksi penurunan yang berkepanjangan dari puncak makro 0,03583[span_3](start_span)[span_3](end_span). Metrik Teknikal Utama: • Tumpukan Moving Average & EMA: Harga telah terdorong kembali di atas MA7 cepat (0,01666) dan EMA7 (0,01701), sementara sedang menguji MA14 terdekat di 0,01755 dan EMA14 di 0,01775[span_4](start_span)[span_4](end_span). MA28 jangka menengah berada di 0,01949 dan EMA28 di 0,01946[span_5](start_span)[span_5](end_span). • Dinamika Volume: Volume harian tercatat 219,09 juta, mengungguli garis dasar 5 hari (122,07 juta) dan rata-rata 10 hari (131,00 juta)[span_6](start_span)[span_6](end_span), menandakan partisipasi pembeli yang aktif di balik pantulan ini. • Batas Rentang Terdekat: Level tertinggi 24 jam di 0,01777 berfungsi sebagai hambatan breakout terdekat, sementara perlindungan sisi bawah berlabuh pada level terendah 0,01627[span_7](start_span)[span_7](end_span). Skenario Eksekusi: • Reclaim Bullish: Penutupan harian yang tegas di atas resistance EMA14 0,01775 mengonfirmasi penyerapan pembeli jangka pendek, membuka jalan menuju pengujian zona MA28 0,01950[span_8](start_span)[span_8](end_span). • Invalidasi Bearish: Kehilangan level support MA7 0,01666 dengan volume jual yang meningkat membatalkan tesis pembalikan jangka pendek dan mengekspos kembali lantai permintaan 0,01627[span_9](start_span)[span_9](end_span). Apakah Anda melakukan scaling in pada pemulihan MA cepat MON ini untuk swing kembali menuju level 0,0195, atau menunggu penutupan harga yang terkonfirmasi melewati 0,017? $MONUSDT #ByXIMPACT
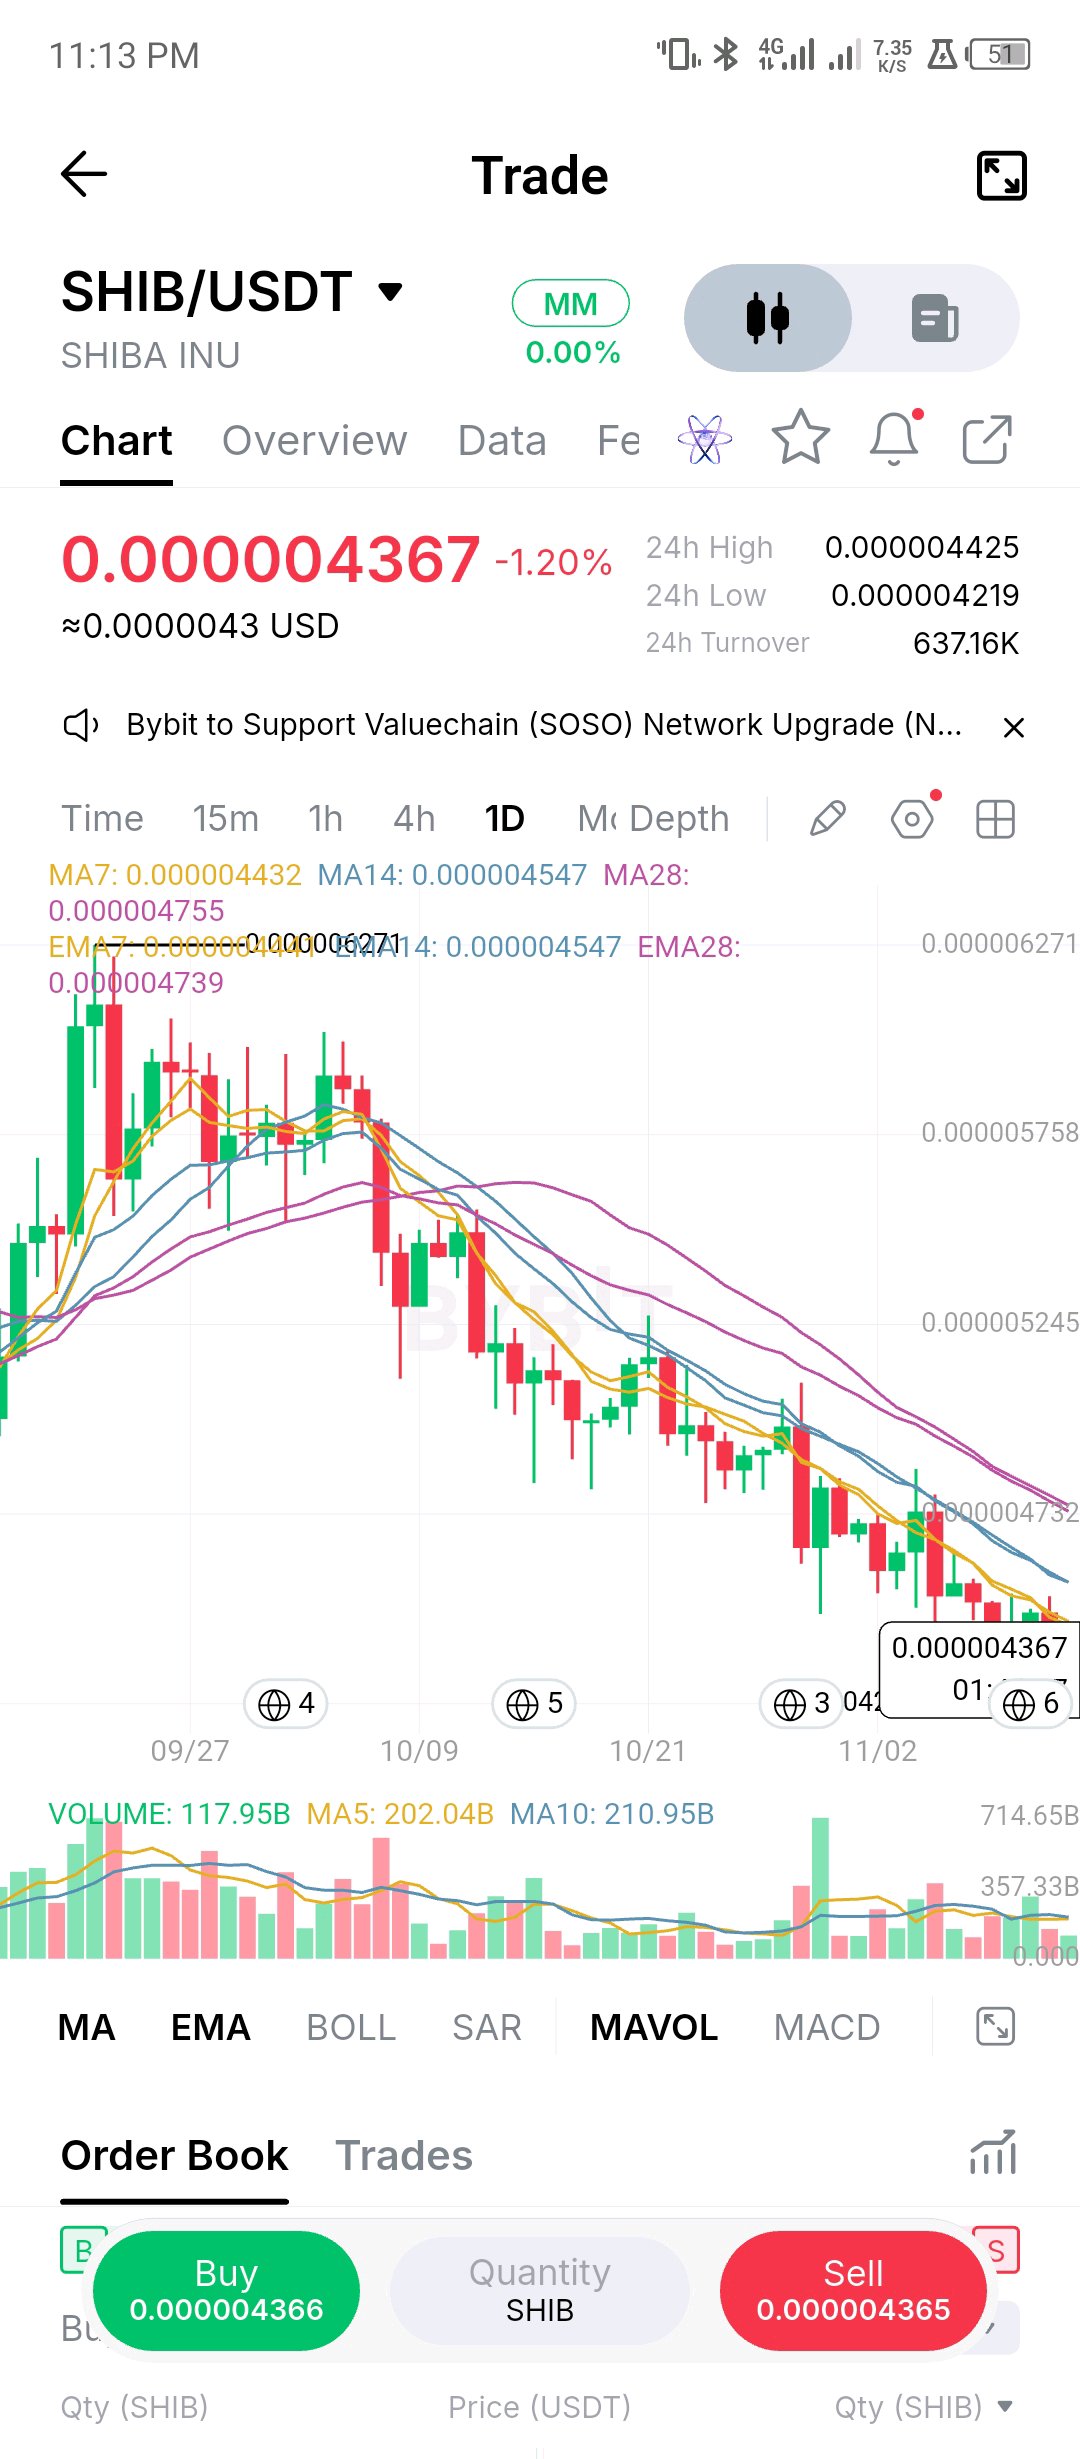
SHIB/USDT Daily Technical Outlook: Retesting Local Support Below Descending Moving Averages Shiba Inu ($SHIB$) is trading down -1.20% around 0.000004367, hovering right above its 0.000004219 intraday low[span_0](start_span)[span_0](end_span). Price action remains in a corrective phase following a steady downward trend from its macro swing highs, compressing tightly into a local demand floor[span_1](start_span)[span_1](end_span). Core Technical Metrics: • Moving Average Stack: All short-to-medium term moving averages remain aligned bearishly overhead, with the fast MA7 at 0.000004432, MA14 at 0.000004547, and MA28 at 0.000004755[span_2](start_span)[span_2](end_span). Reclaiming the MA7 is the primary requirement for bulls[span_3](start_span)[span_3](end_span). • Volume Dynamics: Daily volume reads 117.95B, trading below the 5-day baseline (202.04B) and 10-day moving average (210.95B)[span_4](start_span)[span_4](end_span), reflecting low-volatility coiling near support[span_5](start_span)[span_5](end_span). • Immediate Range Boundaries: The 24h high of 0.000004425 serves as the immediate overhead hurdle, while downside protection is anchored by the 0.000004219 low[span_6](start_span)[span_6](end_span). Execution Scenarios: • Relief Reclaim: A decisive daily close back above the 0.000004432 MA7 resistance signals potential buyer absorption at current lows, opening a path toward testing the 0.000004547 MA14 region[span_7](start_span)[span_7](end_span). • Downside Invalidation: A breakdown below the 0.000004219 support floor invalidates the current base accumulation and extends the broader downside channel[span_8](start_span)[span_8](end_span). Are you bidding this 0.0000043 demand zone for a relief bounce toward 0.0000045, or waiting for a confirmed reclaim of the MA7 line? $SHIBUSDT #ByXIMPACT
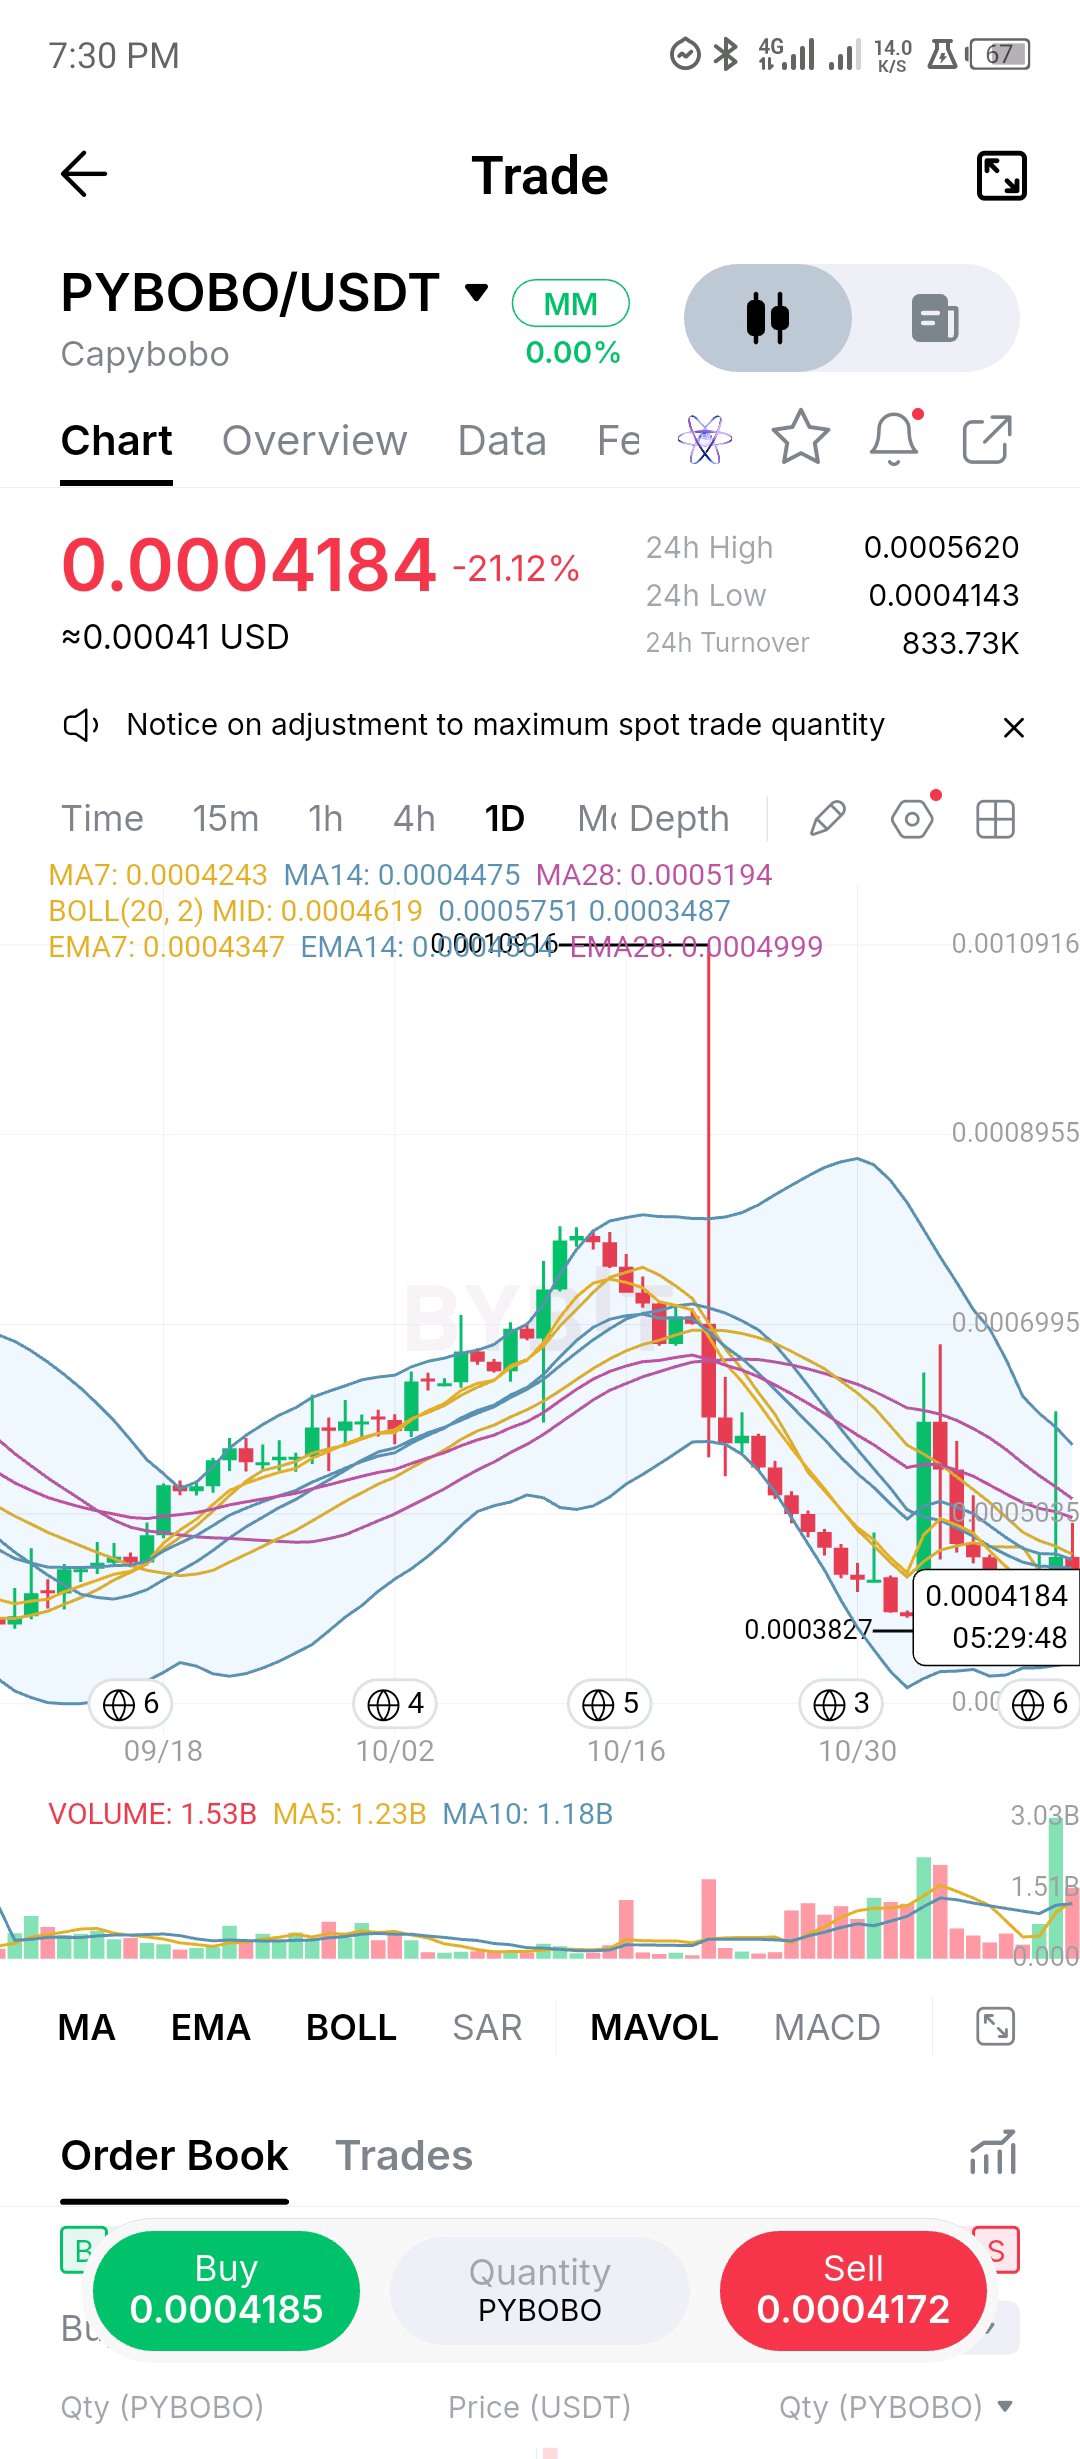
$PYBOBO/USDT Daily Technical Outlook: Testing Lower Bollinger Support Amid Sharp Volatility Contraction Capybobo ($PYBOBO$) is trading down -21.12% around 0.0004184, hovering just above its 0.0004143 intraday low[span_0](start_span)[span_0](end_span). Price action is compressing tightly near the lower Bollinger Band boundary (0.0003487), reflecting heavy selling pressure following the recent rejection from its macro highs[span_1](start_span)[span_1](end_span). Core Technical Metrics: • Moving Average & EMA Stack: Short-to-medium term moving averages are aligned bearishly overhead, with the fast MA7 at 0.0004243, MA14 at 0.0004475, and MA28 at 0.0005194[span_2](start_span)[span_2](end_span). Exponential moving averages mirror this structure with EMA7 at 0.0004347 and EMA14 at 0.0004746[span_3](start_span)[span_3](end_span). • Bollinger Bands (20, 2): The midline rests at 0.0004619 while the upper band sits at 0.0005751[span_4](start_span)[span_4](end_span), showing an expanding volatility channel as price hugs the lower support envelope[span_5](start_span)[span_5](end_span). • Volume & Range Boundaries: Daily volume reads 1.53B, remaining above the 5-day baseline (1.23B) and 10-day average (1.18B)[span_6](start_span)[span_6](end_span), indicating active volume absorption at current lows. The 24h high stands at 0.0005620[span_7](start_span)[span_7](end_span). Execution Scenarios: • Relief Reclaim: A decisive daily close back above the 0.0004243 MA7 resistance signals potential buyer absorption, opening a path toward testing the 0.0004619 Bollinger midline[span_8](start_span)[span_8](end_span). • Downside Invalidation: A breakdown below the 0.0003827 structural floor[span_9](start_span)[span_9](end_span) invalidates the current Bollinger band support defense and extends the broader downside channel. Are you bidding this lower Bollinger Band support for a mean-reversion bounce toward 0.00046, or waiting for a confirmed reclaim of the MA7 line[span_10](start_span)[span_10](end_span)? Share your trading plan below! $PYBOBOUSDT #ByXIMPACT
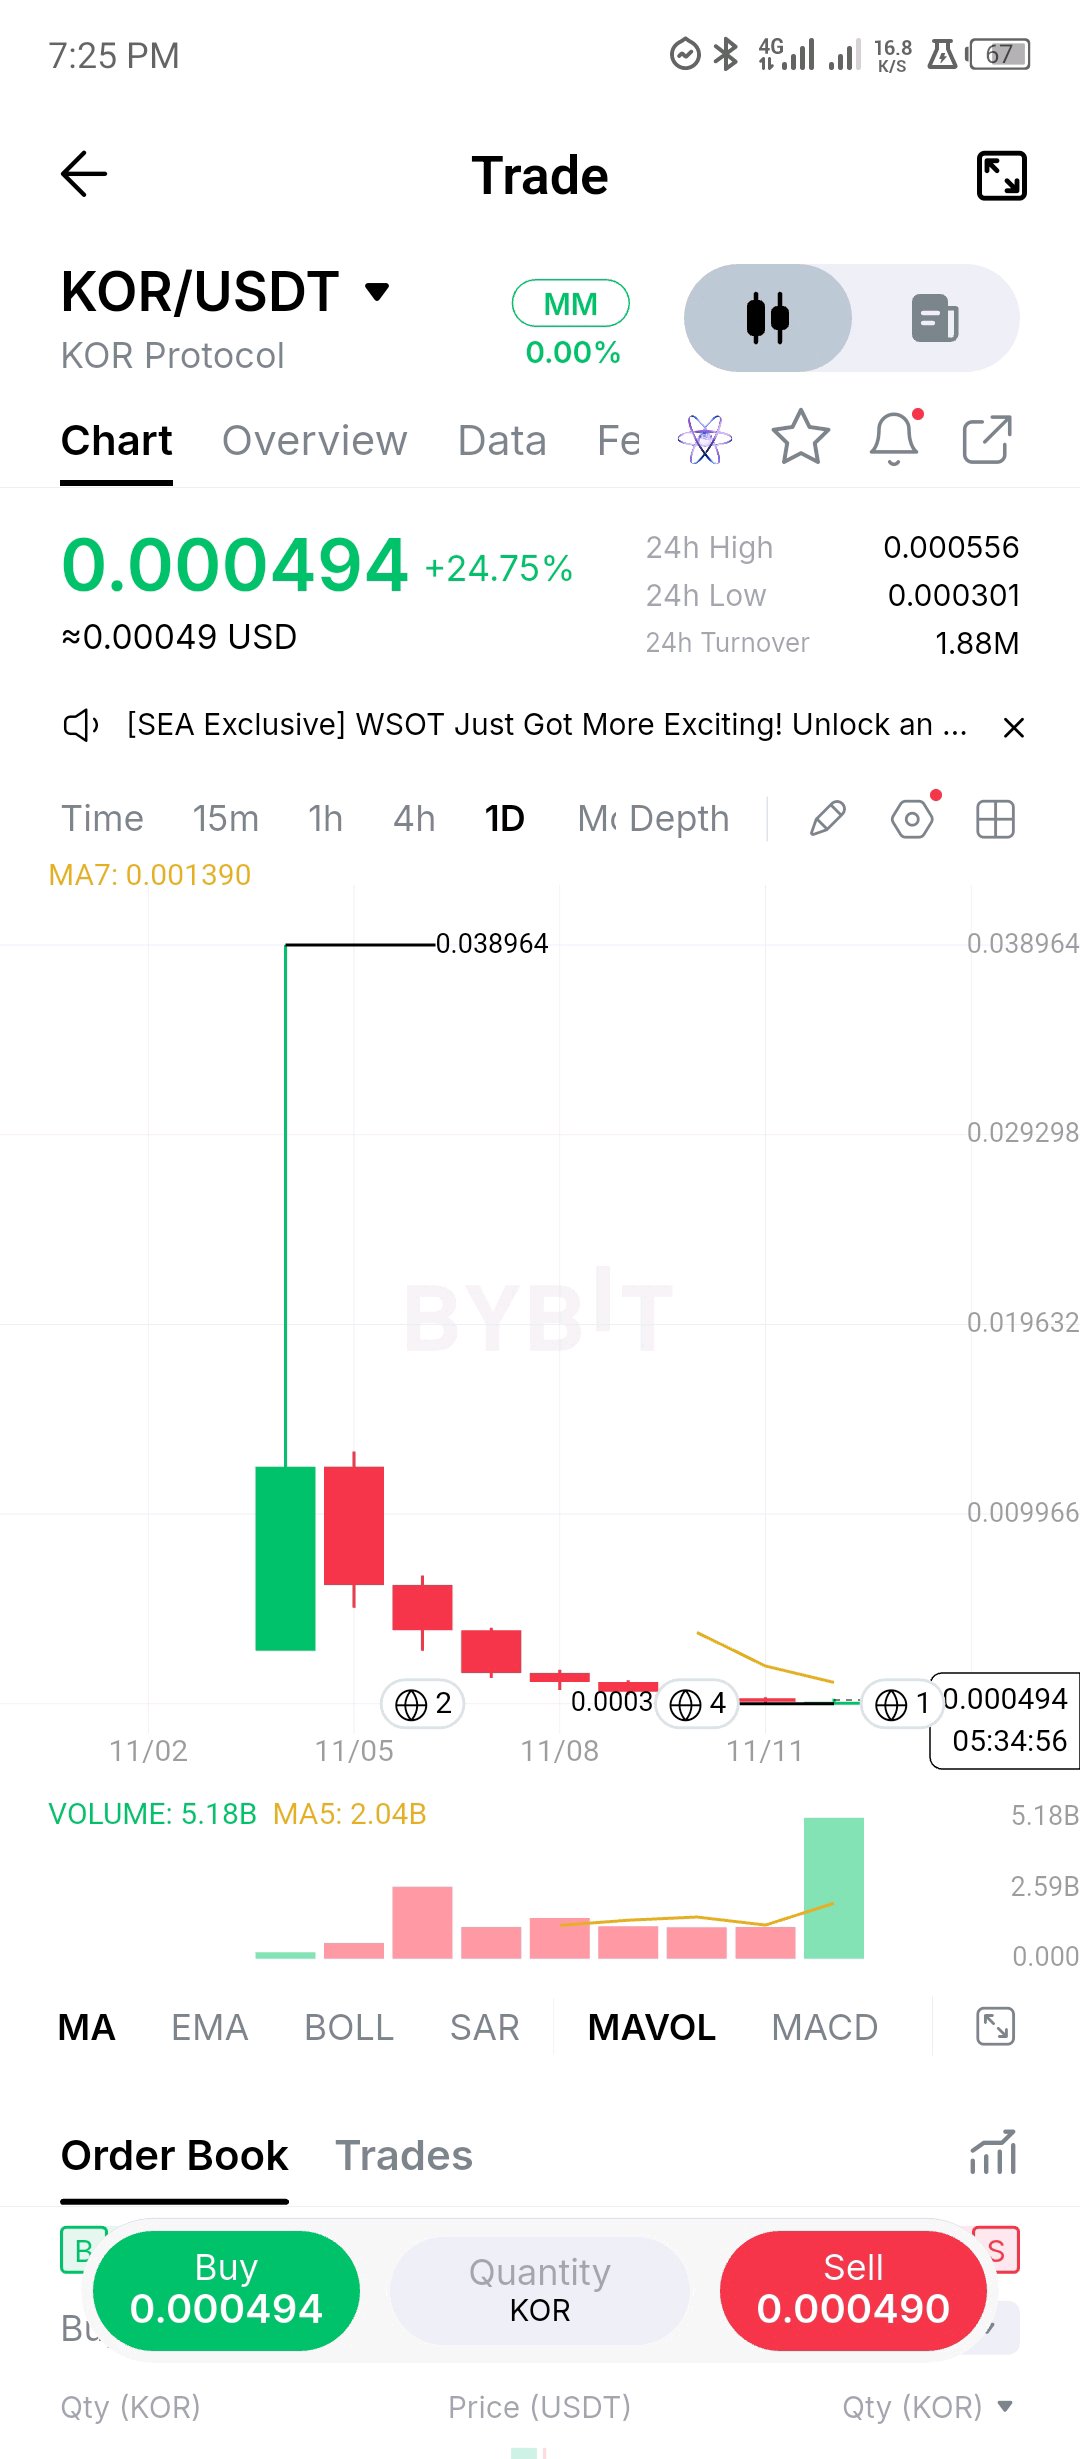
$KOR did what the low needed it to do: it held 0.000301 and bounced. Price is now 0.000494, about 64% above that low, and today's candle is the first green daily candle since listing day, on volume of 5.2B that is already 2.5x the 5 day average with a quarter of the day left, the heaviest bar on the chart. That's a real change in behavior after a week of nothing but red candles, but context matters. Price is still roughly 96% below the first-day close, and the 7 day MA (0.00139) sits almost 3x above price, so this recovery has to be judged against the recent range, not the listing spike. Levels: 0.000556 (the 24h high) is the first test, and a close above it would extend the bounce. Support is 0.000301, then nothing marked. If volume stays elevated on the next candle while the low holds, that's the beginning of a floor. If it fades, today is a squeeze in a market that still has no structure. Thin and new: small size or watching only. $KORUSDT #ByXIMPACT
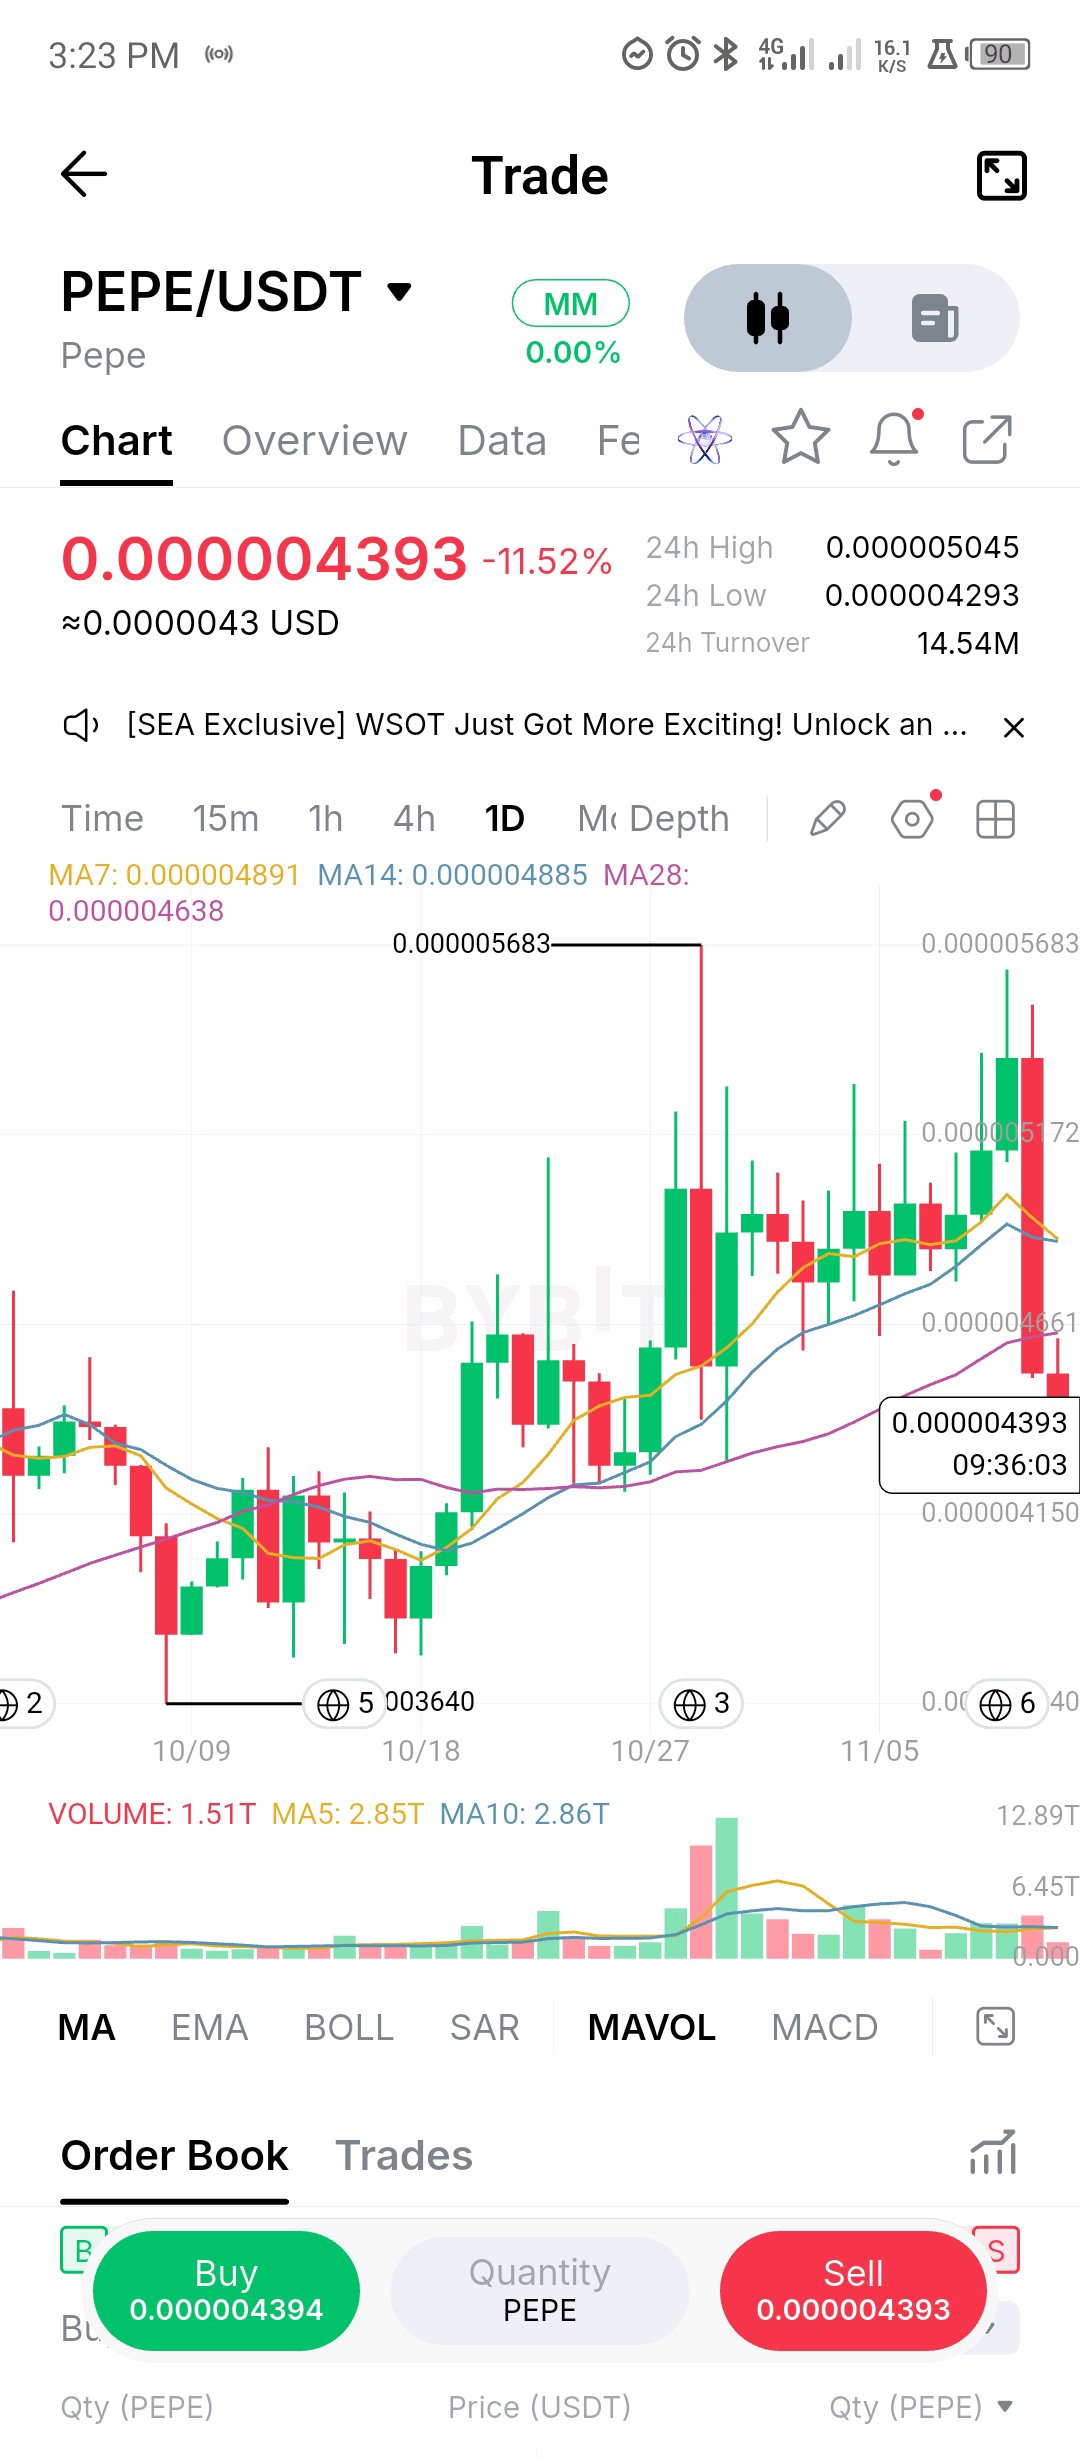
PEPE ($PEPE): The Rally Has Lost Momentum. Is This a Reset or a Deeper Correction? PEPE recently made an interesting recovery from the $0.000003640 region, eventually pushing toward $0.000005683. That move attracted buyers and briefly improved the daily structure. But the latest price action suggests that momentum is changing. Trading around $0.000004393, PEPE is down 11.52% in the displayed 24-hour session. More importantly, the rejection from recent highs has brought price back below all three moving averages. Here is what stands out: - MA7: $0.000004891 - MA14: $0.000004885 - MA28: $0.000004638 The short-term averages are now above price, while the longer average is also acting as overhead resistance. This puts the recent recovery under pressure. The levels I'm watching: $0.000004293 is the immediate support reference, corresponding to the displayed 24-hour low. Losing this level decisively could expose the market to another downward extension. On the other hand, buyers need to reclaim $0.000004638 first. A sustained move above the $0.000004885–$0.000004891 region would provide stronger evidence that momentum is recovering. Volume adds another dimension to this setup. Current displayed volume is 1.51T, against MA5 and MA10 averages of 2.85T and 2.86T respectively. Participation is relatively subdued compared with those averages, so a convincing recovery still needs stronger demand. What interests me most is the behaviour around support. The previous rally demonstrated that buyers were willing to step in at lower prices. The current decline will test whether that demand was the beginning of a larger accumulation phase or simply a temporary relief rally. I'm not ready to call this a confirmed reversal in either direction. A successful defence of support followed by a reclaim of the moving averages could change the picture. Failure to hold the recent low would keep the bearish scenario in focus. PEPE has attracted plenty of attention during its rallies, but the next meaningful signal may come from how it handles this correction. Are we looking at a healthy pullback after a strong recovery, or is PEPE preparing for another leg lower? $PEPEUSDT #ByXIMPACT
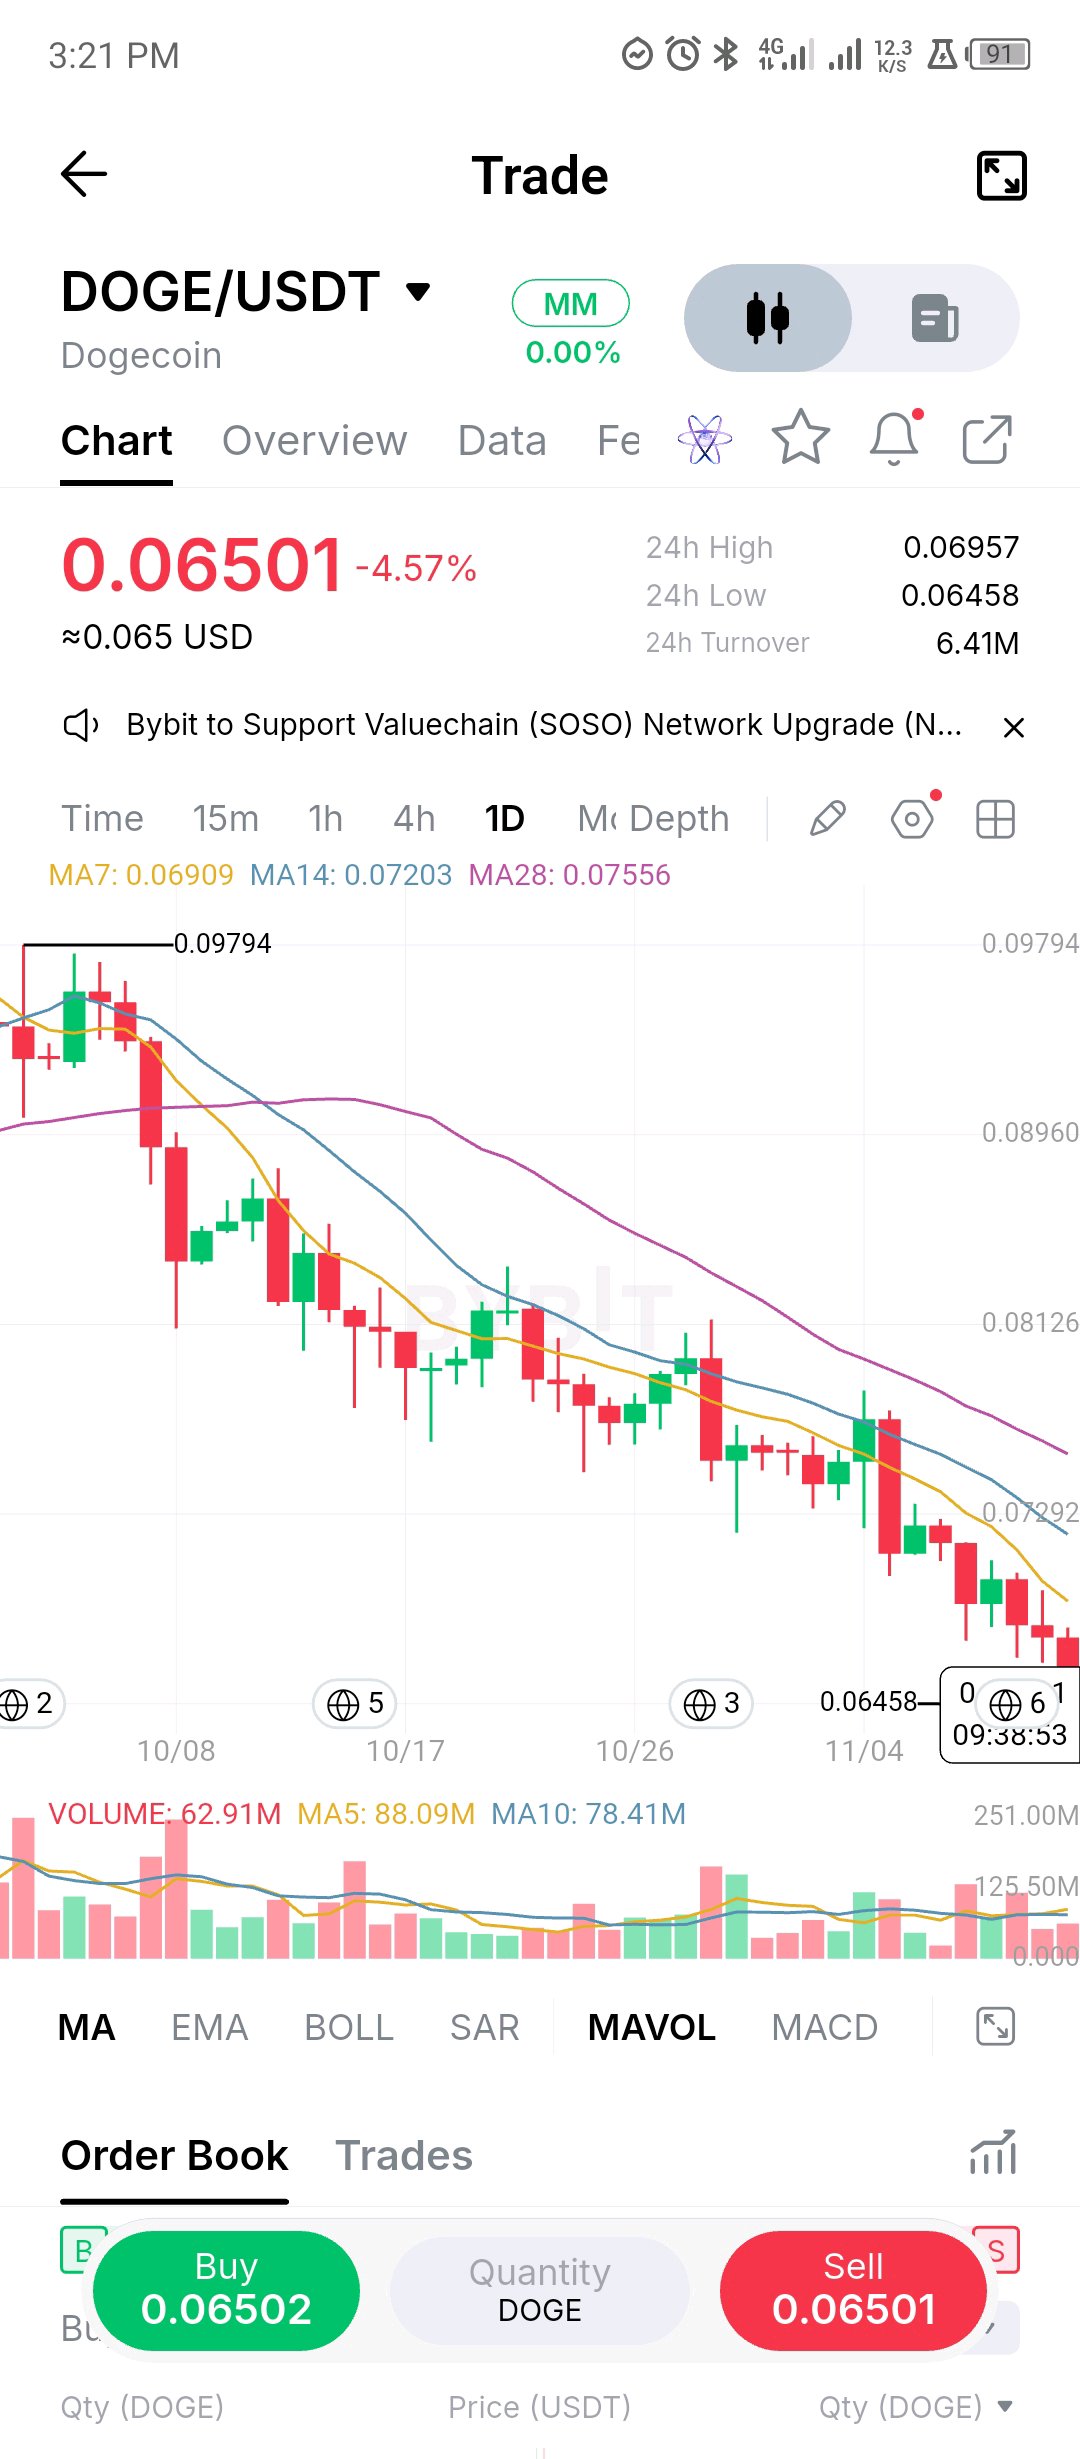
DOGECOIN ($DOGE): Selling Pressure Is Building, But Watch the Floor. Dogecoin started as an internet-inspired cryptocurrency but has evolved into one of the most recognized community-driven digital assets. Beyond its meme identity, DOGE operates as a peer-to-peer payment network using Scrypt Proof-of-Work. Its monetary model is particularly interesting: miners receive a fixed 10,000 DOGE for every block, with new blocks targeted approximately every minute. This creates continuous issuance rather than a fixed maximum supply. That supply mechanism is worth remembering when evaluating DOGE's long-term market dynamics. But right now, the daily chart is telling a much more immediate story. DOGE is trading around $0.06501, down 4.57% in the displayed 24-hour session. More importantly, the broader price structure continues to deteriorate. Since the rejection around $0.09794, the market has repeatedly printed lower highs and lower lows. Attempts to recover have struggled to produce sustained upside momentum. The moving averages reinforce this weakness: - MA7: $0.06909 - MA14: $0.07203 - MA28: $0.07556 All three remain above the current price and are sloping downward. This suggests that sellers still have structural control, while any short-term bounce may encounter resistance. The battle around $0.06458 is particularly important. This is the recent low visible on the chart and the immediate level I'm watching. A decisive daily breakdown could open the door to further downside exploration. However, if buyers defend this area and push DOGE back above $0.0690, the first indication of improving momentum would emerge. A stronger recovery would require reclaiming $0.0720 and eventually challenging the longer moving average. Volume currently sits at 62.91M, below both its displayed MA5 and MA10 averages. That makes a convincing reversal harder to establish without renewed participation. My take: DOGE doesn't need another aggressive bounce to prove itself; it needs to demonstrate that sellers are losing control. Until price reclaims important resistance levels, treating every green candle as a reversal could be premature. I'm watching the reaction around $0.06458 closely. That response may reveal whether the market is preparing to stabilize or whether downside pressure still has room to run. Is DOGE approaching a potential accumulation zone, or are buyers still waiting for a deeper correction? $DOGEUSDT #ByXIMPACT
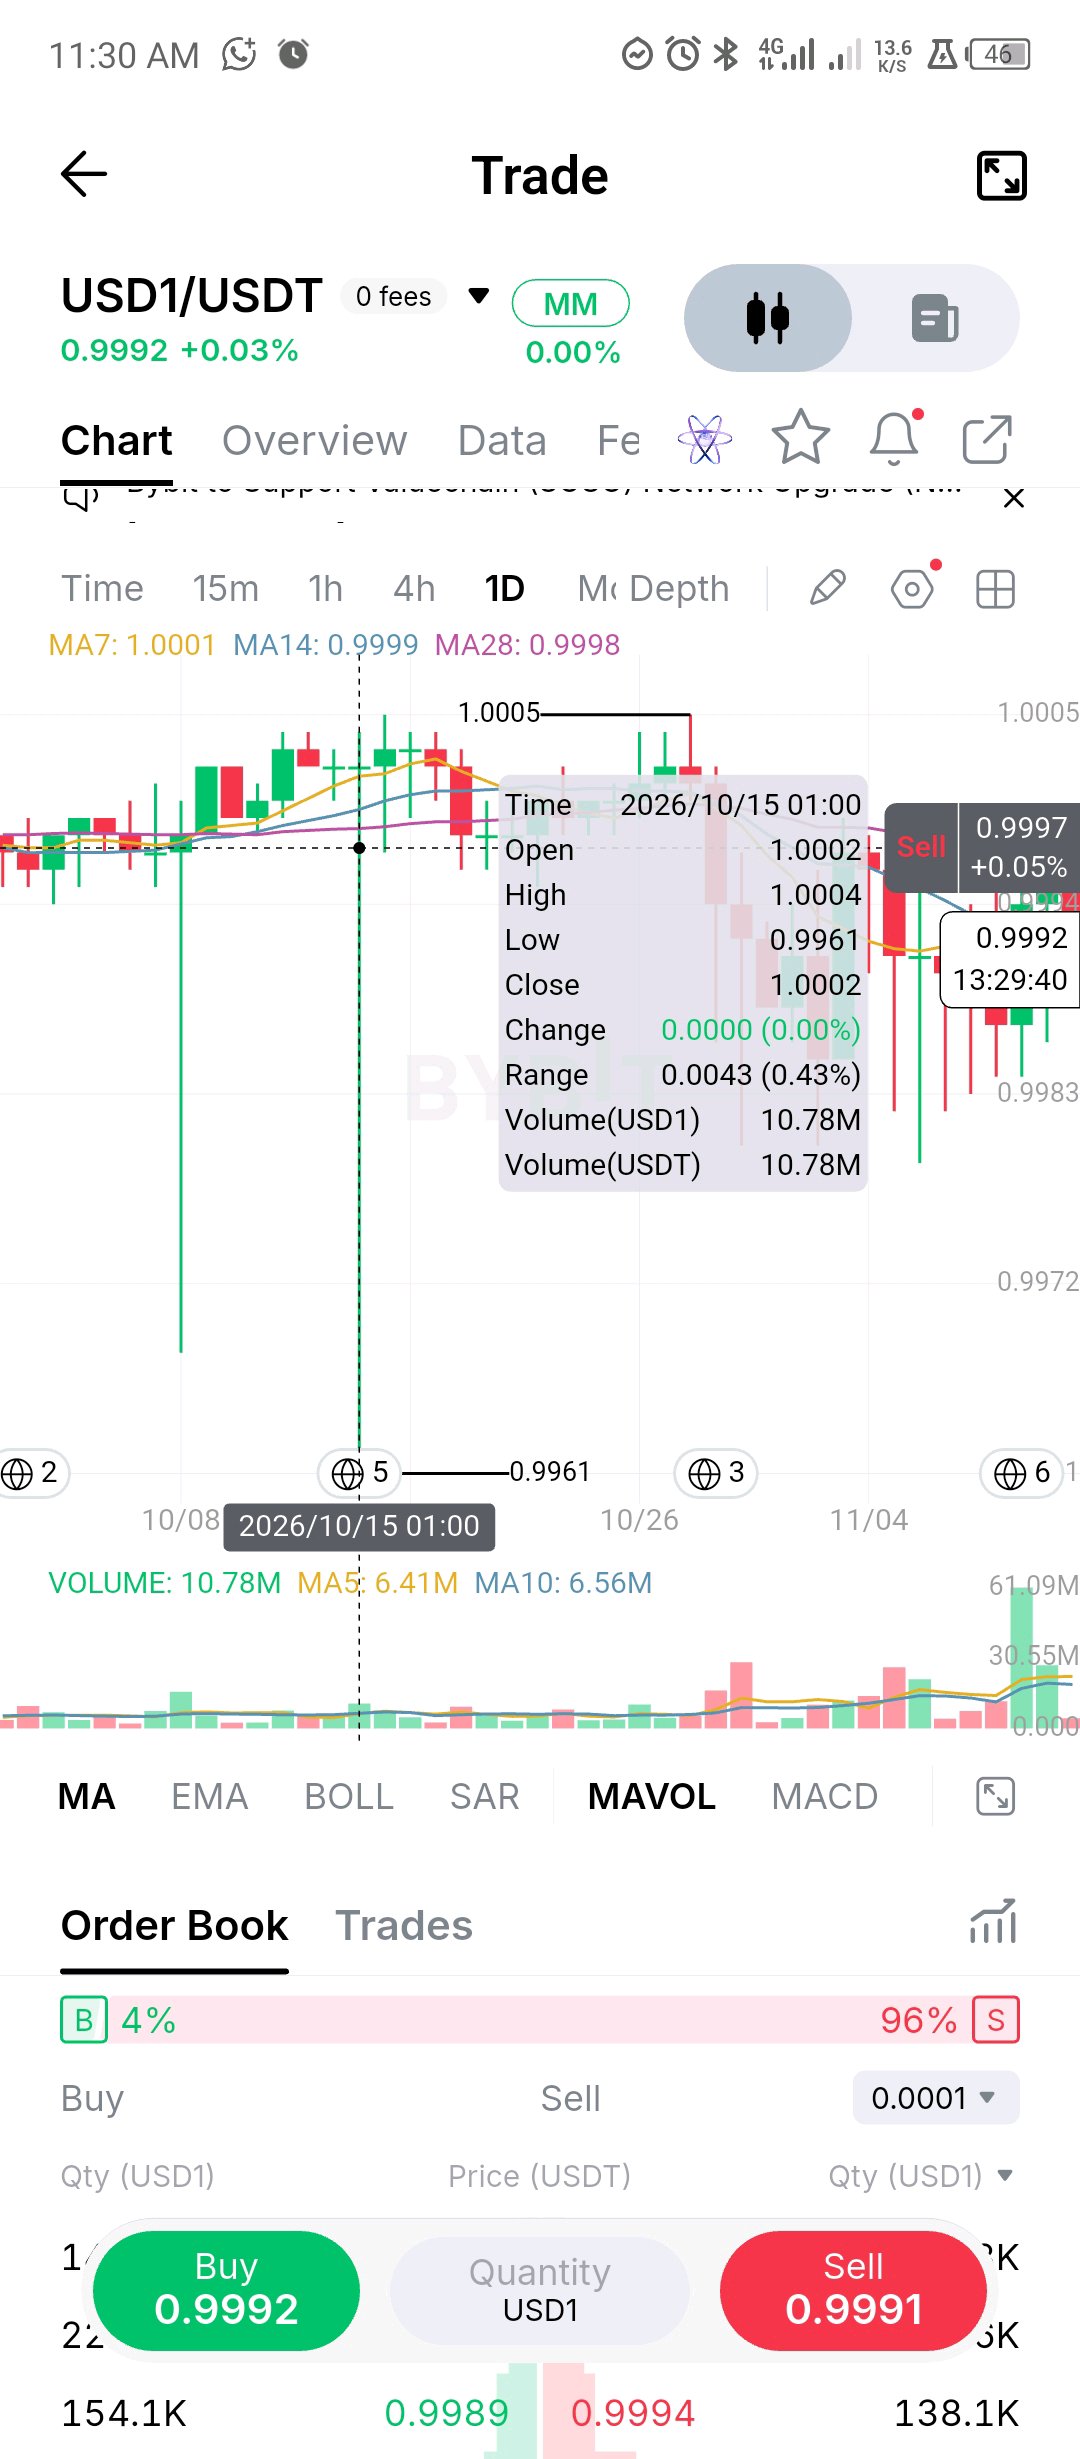
$USD1/USDT Daily Technical Outlook: Tight Peg Compression Amid Skewed Order Flow USD1 is trading at 0.9992 (+0.03%) on the daily timeframe, holding tightly near its parity peg. Price action continues to coil within a narrow range between the 0.9961 structural floor and the 1.0005 macro peak, reflecting stable arbitrage and consistent order execution. Core Technical Metrics: • Moving Average Convergence: Short and medium-term moving averages are compressed tightly around parity (MA7 at 1.0001 | MA14 at 0.9999 | MA28 at 0.9998), signaling a flat trend baseline typical of stable valuation bands. • Order Book Sentiment: The immediate order flow ratio shows a heavy ask-side skew (4% Buy vs 96% Sell pressure), highlighting an active sell wall right above current trading levels. • Volume & Range Boundaries: Daily volume shows localized spikes, with immediate overhead resistance anchored at the 1.0005 high and downside cushioning near the 0.9961 baseline. Execution & Market Context: For a stablecoin pair like USD1, this range compression points to steady peg maintenance rather than directional expansion. Monitoring brief wicks outside the 0.9961 – 1.0005 range helps identify transient liquidity shifts. How are you utilizing stablecoin pairs during choppy market phases? Let's discuss below! $USD1USDT #ByXIMPACT
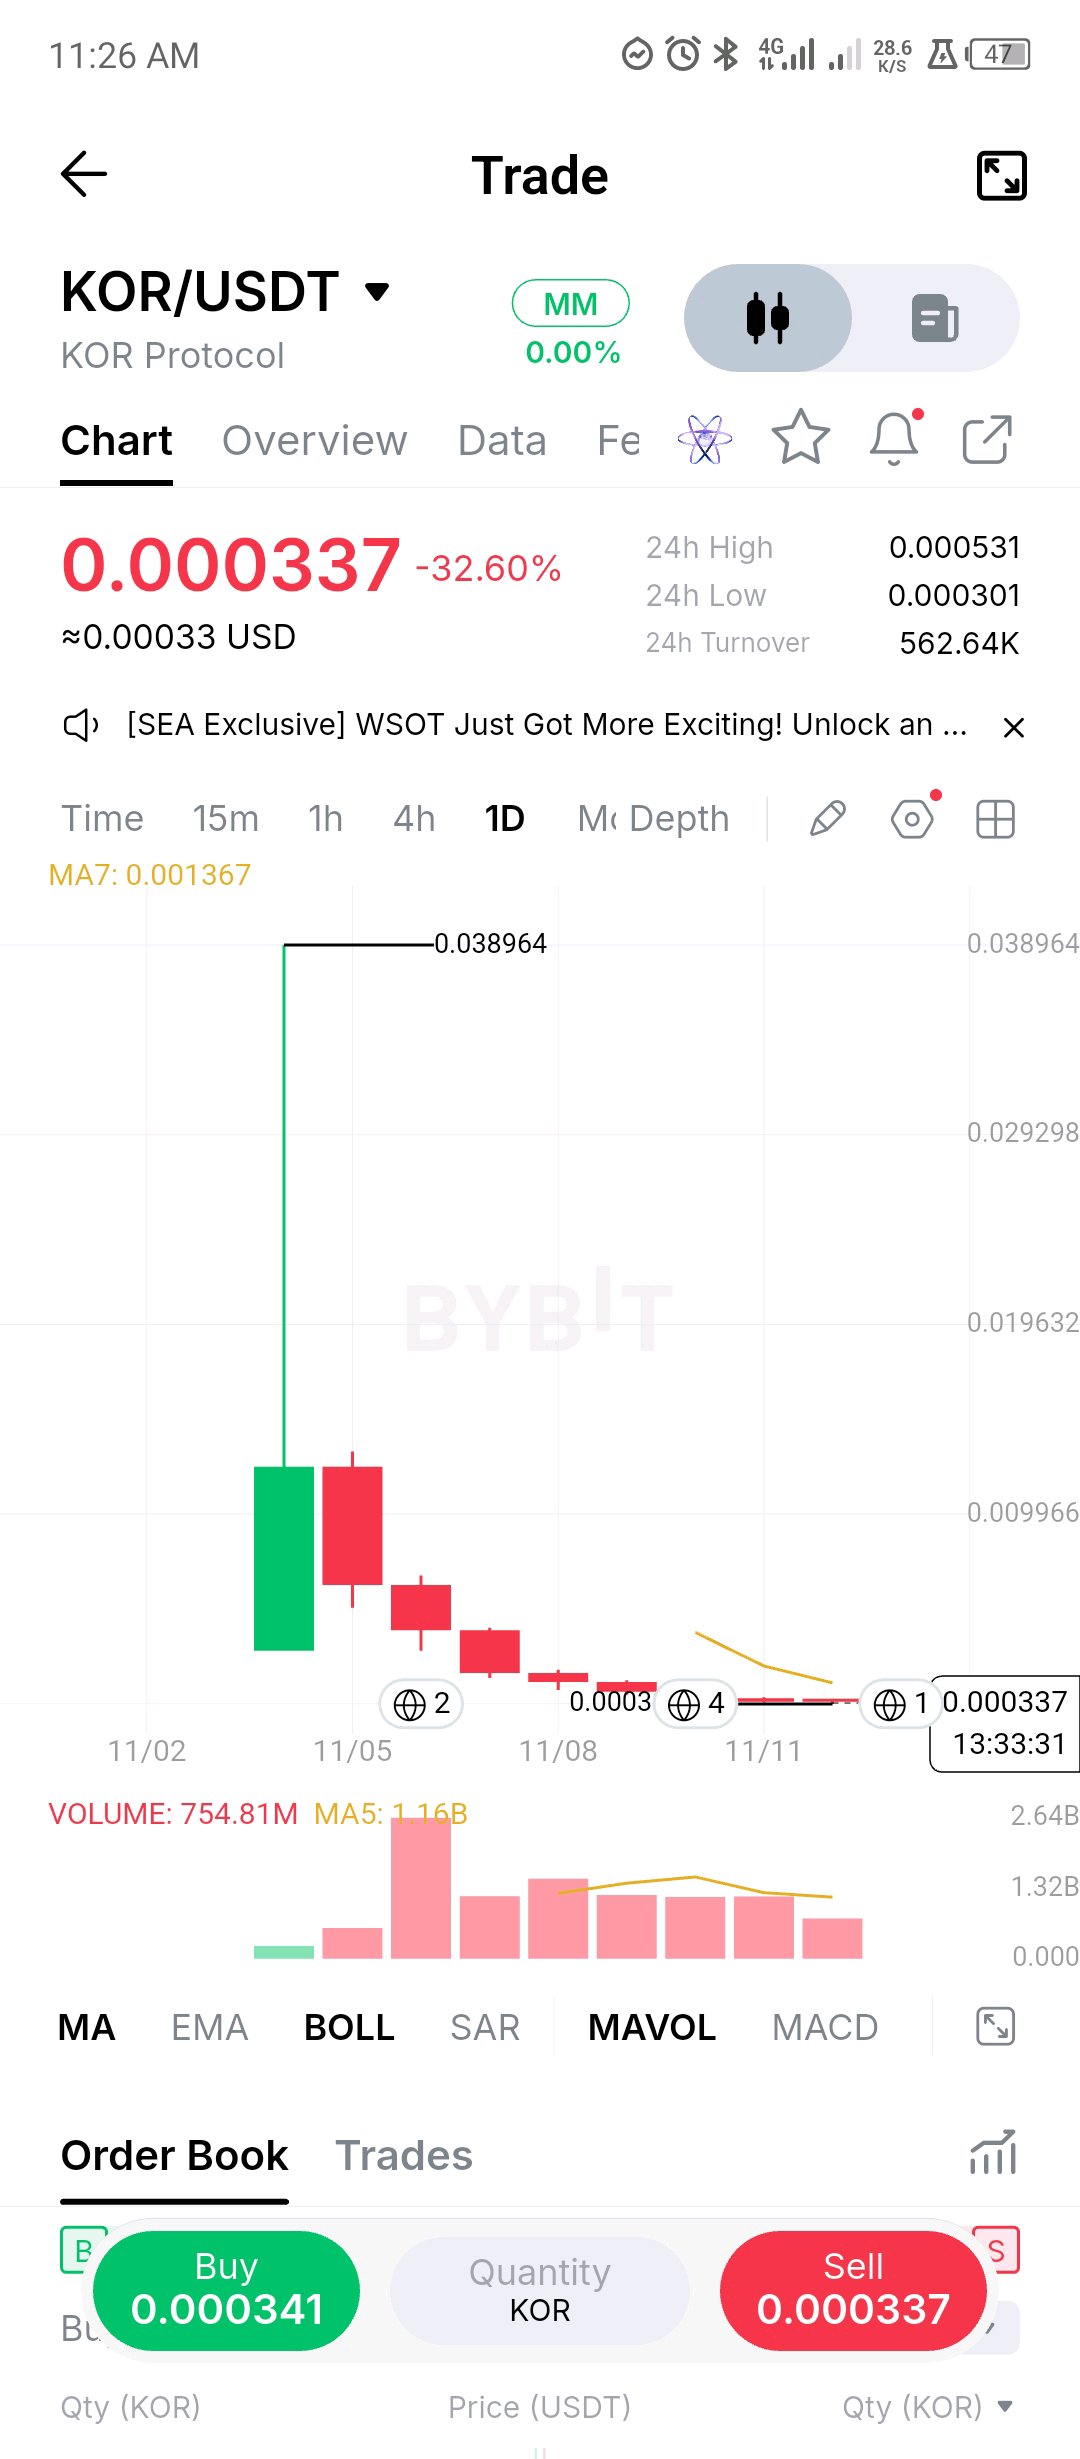
$KOR is a case study in what price discovery looks like after a new listing. The first session printed a spike to 0.038964 and closed around 0.012, and a week later it trades at 0.000337. That's roughly 97% below that first close, and down 33% in the last 24 hours alone, with a 24h range of 0.000301 to 0.000531. There's no chart structure to trade yet. No base, no higher lows, and every daily candle since the first has been red. Volume peaked a few sessions ago and has faded since, which could be the first sign of exhaustion, but price hasn't confirmed it. What I'd watch is 0.000301. If that low holds on a couple of daily closes with falling volume, price discovery may be finding a floor. If it doesn't, there's nothing marked below it on this chart. For anyone tempted by a 97% discount: that's a function of the first day's price, not of value. New listings can keep falling long after they look cheap, so size accordingly or just watch. $KORUSDT #ByXIMPACT