IBRAHIMcrypto
64394Suka0Pembagian1782Penggemar40Ikuti
PRO CRYPTO TRADER / MENTOR CRYPTO GUY 💯 /NFTs lover🎨/GAMER💻🎮/🏋
PRO CRYPTO TRADER / MENTOR CRYPTO GUY 💯 /NFTs lover🎨/GAMER💻🎮/🏋
If you think $HYPEUSDT has permanently topped just because the rest of crypto is digital trash, take a hard look at its ever expanding fundamentals Why does this matter? Because Hyperliquid is a revenue machine where every dollar of collateral and every dollar of trading volume contributes to deflationary $HYPEUSDT buybacks More adoption → less circulating $HYPE overtime. Its that simple and no other asset has this. $TSLA ran hard off its early-November low, broke the prior swing high, and is now pulling back. I'm leaning long, but I'm not buying here. I want price to come down into a specific pullback zone first. Chasing the middle of a pullback is how you get a bad entry. The drop from the recent high looks like a retracement inside the up-leg, not a trend change. The 12h still prints higher lows. Why the zone matters: - The 4h, 12h and daily moving averages stack at the same level - The 62% retracement of the last up-leg lands there too - Recent equal lows sit just below it Four separate reasons on one shelf make a bounce there mean more. The ICT read: those equal lows hold a pool of stop orders. A sweep through them that snaps back into the discount zone is the setup I'd take. Targets are the liquidity resting above the recent swing highs. Where I'm wrong: if price gives up the 12h swing low, the daily 200-day average and the bottom of the optimal retracement band together, the pullback read is dead and I step aside. Risks: Nvidia earnings on Nov 18 and December rate-hike worries could shake AI and high-beta names. Thin weekend pricing means the Monday open can gap. Not investment advice. All decisions and responsibility are your own. $BTC has only been oversold on the weekly 4 times in it's entire history 📉 But, an oversold weekly RSI hasn't always marked the final bear-market bottom. 📉 2015: BTC bottomed 210 days later. 📉 2019: Oversold RSI coincided with the bottom. 📉 2022: BTC bottomed 147 days later. 2026: Already 280 days since the initial oversold signal, with a definitive bottom still to be confirmed. When BTC first became oversold this cycle, it was trading around $60,000. Yesterday's flush saw BTC trade as low as $62,000, meaning price has spent 280 days without establishing a sustained recovery. This is the longest period between an initial weekly oversold RSI signal and a confirmed cycle bottom among the historical examples examined. Only in 2019 did the oversold RSI coincide with the final bottom. The other examples tell us, an oversold weekly RSI doesn't guarantee an immediate reversal. Historically, it has often been followed by months of further consolidation or downside before a definitive bottom forms. #IMPACTbyTrade
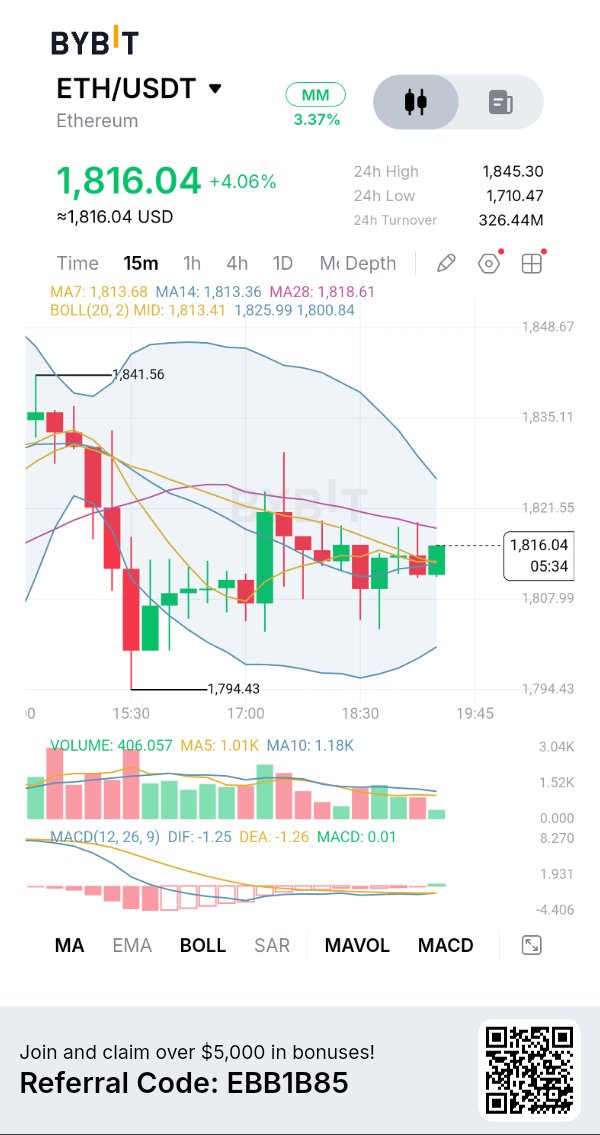
ETH Berupaya Pulih di Atas $1.816: Apakah Pembeli Sedang Bersiap untuk Reversal yang Lebih Kuat? Ethereum menunjukkan tanda-tanda stabilisasi jangka pendek setelah mengalami tekanan jual yang cukup besar, namun pemulihan saat ini masih memerlukan konfirmasi. ETH berhasil merebut kembali area $1.800 setelah penurunan menuju $1.794,43, dan pembeli kini mencoba membangun momentum di sekitar $1.816. Pertanyaan pentingnya adalah apakah pemulihan ini dapat berkembang menjadi pergerakan naik yang berkelanjutan atau apakah penjual akan menggunakan pantulan saat ini sebagai peluang lain untuk mendapatkan kembali kendali. GRAFIK + ANALISIS TEKNIS Grafik 15 menit Bybit saya untuk $ETHUSDT menunjukkan ETH diperdagangkan di sekitar $1.816,04, naik sekitar 4,06%, dengan harga tertinggi 24 jam di $1.845,30 dan terendah di $1.710,47. Struktur harga baru-baru ini menunjukkan penurunan tajam yang diikuti oleh pemulihan dan konsolidasi. Pembeli telah mempertahankan swing low di $1.794,43, tetapi harga masih mendekati beberapa level resistance di atasnya. Moving average memberikan gambaran yang menarik. MA7 berada di sekitar $1.813,68, MA14 di sekitar $1.813,36, dan MA28 di sekitar $1.818,61. ETH diperdagangkan di atas rata-rata yang lebih pendek tetapi tetap di bawah MA28, menjadikan $1.818,61 sebagai referensi resistance terdekat yang penting. Bollinger Bands menunjukkan garis tengah di sekitar $1.813,41, band atas di dekat $1.825,99, dan band bawah di sekitar $1.800,84. Pergerakan berkelanjutan di atas garis tengah dapat memperkuat pemulihan, sementara penolakan di sekitar band atas akan menunjukkan bahwa pembeli masih menghadapi resistance yang cukup besar. ANALISIS MACD + VOLUME MACD menunjukkan perbaikan awal, dengan DIF di -1,25, DEA di -1,26, dan histogram di sekitar +0,01. Histogram yang sedikit positif menunjukkan bahwa momentum bearish mulai mereda. Namun, kedua garis MACD tetap berada di bawah nol, yang berarti pembalikan momentum bullish penuh belum terkonfirmasi. Volume saat ini berada di sekitar 406.057, di bawah MA5 di 1,01K dan MA10 di 1,18K. Ini adalah kekhawatiran penting karena pemulihan berkembang tanpa partisipasi yang kuat. Saya lebih suka melihat volume yang berkembang selama breakout ke atas sebelum menganggap pergerakan ini sebagai reversal yang meyakinkan. SKENARIO BULLISH Jika ETH mempertahankan support di sekitar $1.813–$1.814 dan berhasil merebut kembali $1.818,61, saya akan memantau kelanjutan menuju $1.821,55. Breakout yang lebih kuat dapat membuka jalan menuju $1.825,99, yang sejajar dengan Bollinger Band atas. Pendekatan entry yang saya sukai adalah menunggu penutupan candle 15 menit yang menentukan di atas resistance, diikuti oleh retest yang berhasil dengan volume yang meningkat. Penurunan berkelanjutan di bawah $1.807,99 akan melemahkan pengaturan bullish jangka pendek ini. RENCANA TRADING SAYA Saya tidak akan mengejar pemulihan saat ini selama ETH diperdagangkan di antara support dan resistance. Untuk posisi long, saya ingin melihat pembeli merebut kembali $1.818,61, mengonfirmasi breakout tersebut, dan menunjukkan volume yang lebih kuat. Untuk posisi short, saya akan menunggu konfirmasi breakdown di bawah $1.807,99 dan upaya pemulihan yang gagal. $IMPACTbyTrade
QNT Surges 10% as Bulls Approach $157
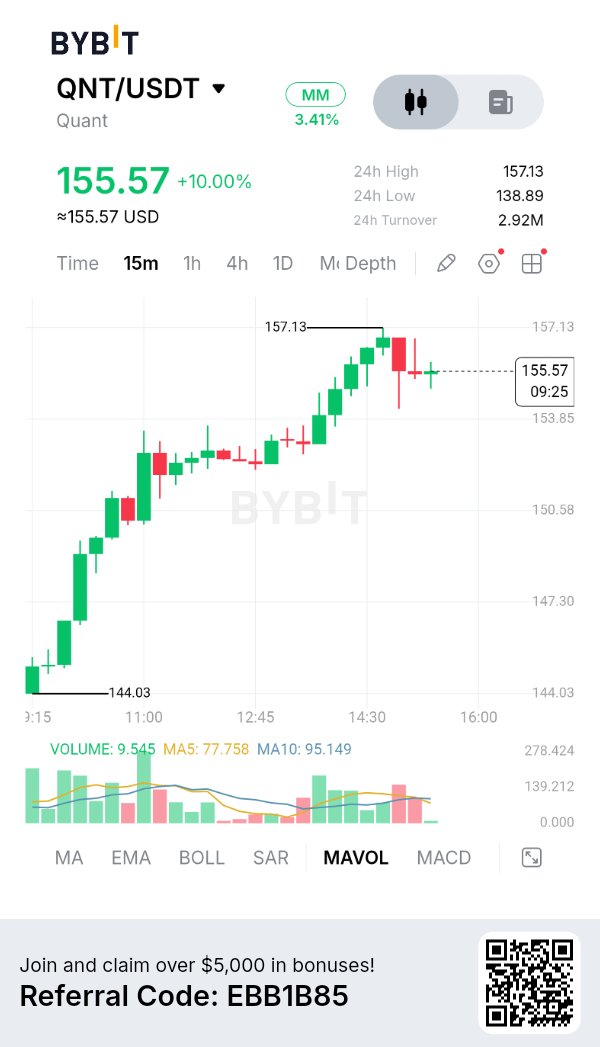
Quant's QNT is demonstrating strong intraday buying momentum, with price advancing from the $144 region toward $157.13 before encountering some selling pressure. The approximately 10% gain is significant, but the latest consolidation suggests that buyers may need to absorb available supply before attempting another upward move. My Bybit $QNTUSDT 15-minute chart shows price trading around $155.57, with a 24-hour high of $157.13 and a low of $138.89. The structure is currently bullish, with a sequence of higher highs and higher lows indicating that buyers have maintained control throughout most of the observed session. CHART + TECHNICAL ANALYSIS The most important development is the strong recovery from the visible $144.03 low. QNT advanced through the $147.30 and $150.58 regions before extending toward $157.13. This movement demonstrates considerable short-term buying interest. However, price is now consolidating around $155.57 after the rejection near the session high. The immediate resistance is $157.13. A convincing breakout above this level, supported by stronger volume, could create room for another upward extension. On the downside, I am watching $153.85 as the first important support reference. Below that, $150.58 becomes a more significant level to monitor, followed by the $147.30 region. VOLUME AND MARKET PARTICIPATION Volume currently reads approximately 9.545K, compared with MA5 at 77.758K and MA10 at 95.149K on the supplied chart. This is an important observation. Although QNT has recorded an impressive price advance, the latest trading activity is considerably below its volume averages. My interpretation is that the market needs renewed participation to sustain another breakout. Without stronger buying activity, the current consolidation could develop into a deeper pullback. I would particularly watch whether volume expands when price approaches $157.13 again. FUNDAMENTAL PERSPECTIVE Quant occupies an interesting position in the blockchain infrastructure sector through its Overledger technology. Its broader proposition focuses on interoperability, allowing different distributed ledger networks and existing financial infrastructure to communicate and exchange information. This is particularly relevant as financial institutions explore tokenization, digital asset infrastructure and the integration of blockchain technology into existing systems. QNT also has utility within the Quant ecosystem, including its role in accessing network services and supporting the platform's economic model. BULLISH SCENARIO If QNT maintains support around $153.85 and successfully breaks above $157.13 with stronger buying volume, I would consider the possibility of another bullish continuation. My next upside reference would be $160, followed by $163 as a further extension area. I would prefer a confirmed 15-minute breakout followed by a successful retest before considering an entry. A sustained move below $153.85 would weaken this immediate bullish setup. BEARISH SCENARIO If QNT repeatedly fails to overcome $157.13 and subsequently loses $153.85 on a decisive 15-minute close, I would watch for a failed retest before considering a bearish opportunity. The next downside reference would be $150.58, followed by $147.30. A deeper correction toward these levels would not automatically destroy the broader recovery, but it would indicate that buyers are losing their immediate advantage. A strong reclaim of $157.13 would invalidate this short-term bearish scenario. MY TRADING PLAN I wouldn't chase QNT after an approximately 10% intraday advance. Entering directly below resistance without confirmation could expose a position to unnecessary volatility. For a bullish setup, I want to see price hold $153.85, break $157.13 and demonstrate stronger volume during the breakout. For a bearish setup, I would wait for a confirmed breakdown below $153.85 and a failed recovery attempt. Position size should remain controlled, with a predefined stop-loss and partial profit-taking at the first target. MY INTERPRETATION The encouraging development is the strength of QNT's recovery from $144.03 and the formation of a clear upward intraday structure. However, the declining volume readings near the current price suggest that buyers need to demonstrate additional commitment before I can confidently expect another major upward extension. My short-term outlook remains cautiously bullish while $153.85 holds. The $157.13 resistance is the immediate test. If buyers overcome it with convincing volume, the recovery could continue. If they fail, a retest of lower support becomes increasingly possible. For now, I would rather wait for confirmation than chase an already extended move. The next reaction around $157.13 could determine QNT's next meaningful direction. #IMPACTbyTrade
INTERESTING IS HAPPENING WITH $HYPE
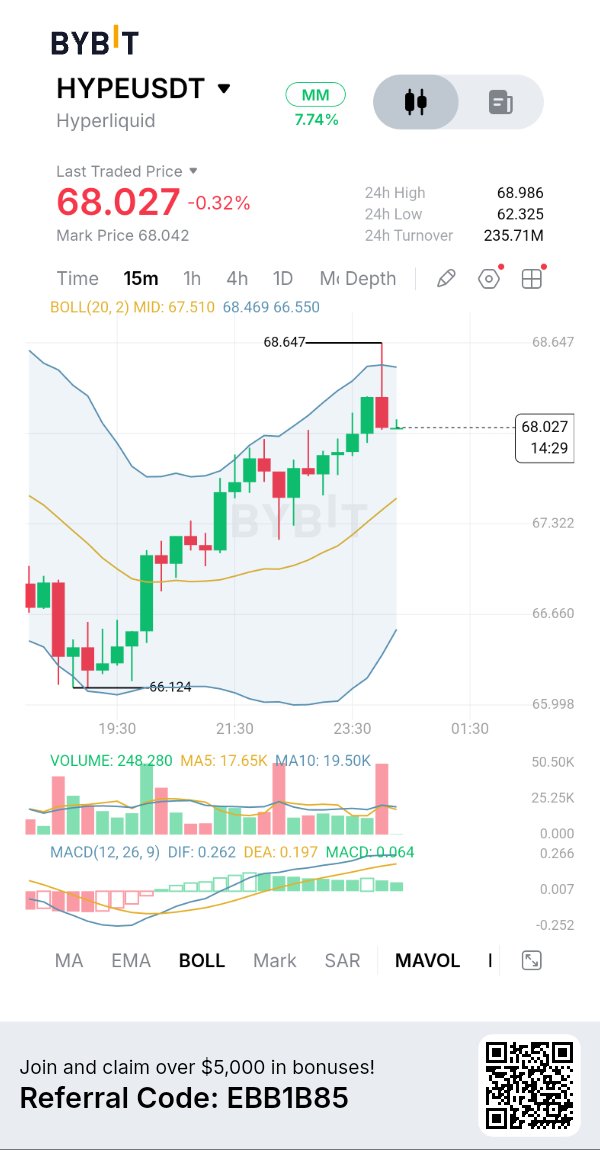
While $HYPEUSDT continues to experience significant price volatility, CoinStats data reveals a completely different trend beneath the surface. The percentage of CoinStats users holding $HYPE has climbed from approximately 0.59% to over 1.10%. That's an increase of more than 85% in the proportion of users holding the token. And the most interesting part? The chart shows a sustained upward trend, with new highs appearing even after temporary pullbacks. To me, this suggests that interest in holding $HYPE has been expanding within the CoinStats user base, despite the uncertainty surrounding short-term price movements. Of course, this data represents CoinStats users rather than the entire Hyperliquid investor population, and it doesn't tell us how much $HYPE each person holds. Still, the direction is worth paying attention to. Prices can fall while the proportion of portfolio trackers holding an asset continues to rise. That's exactly the kind of divergence I like to monitor when evaluating market sentiment. The price chart shows volatility. The ownership trend shows growing participation. #IMPACTbyTrade
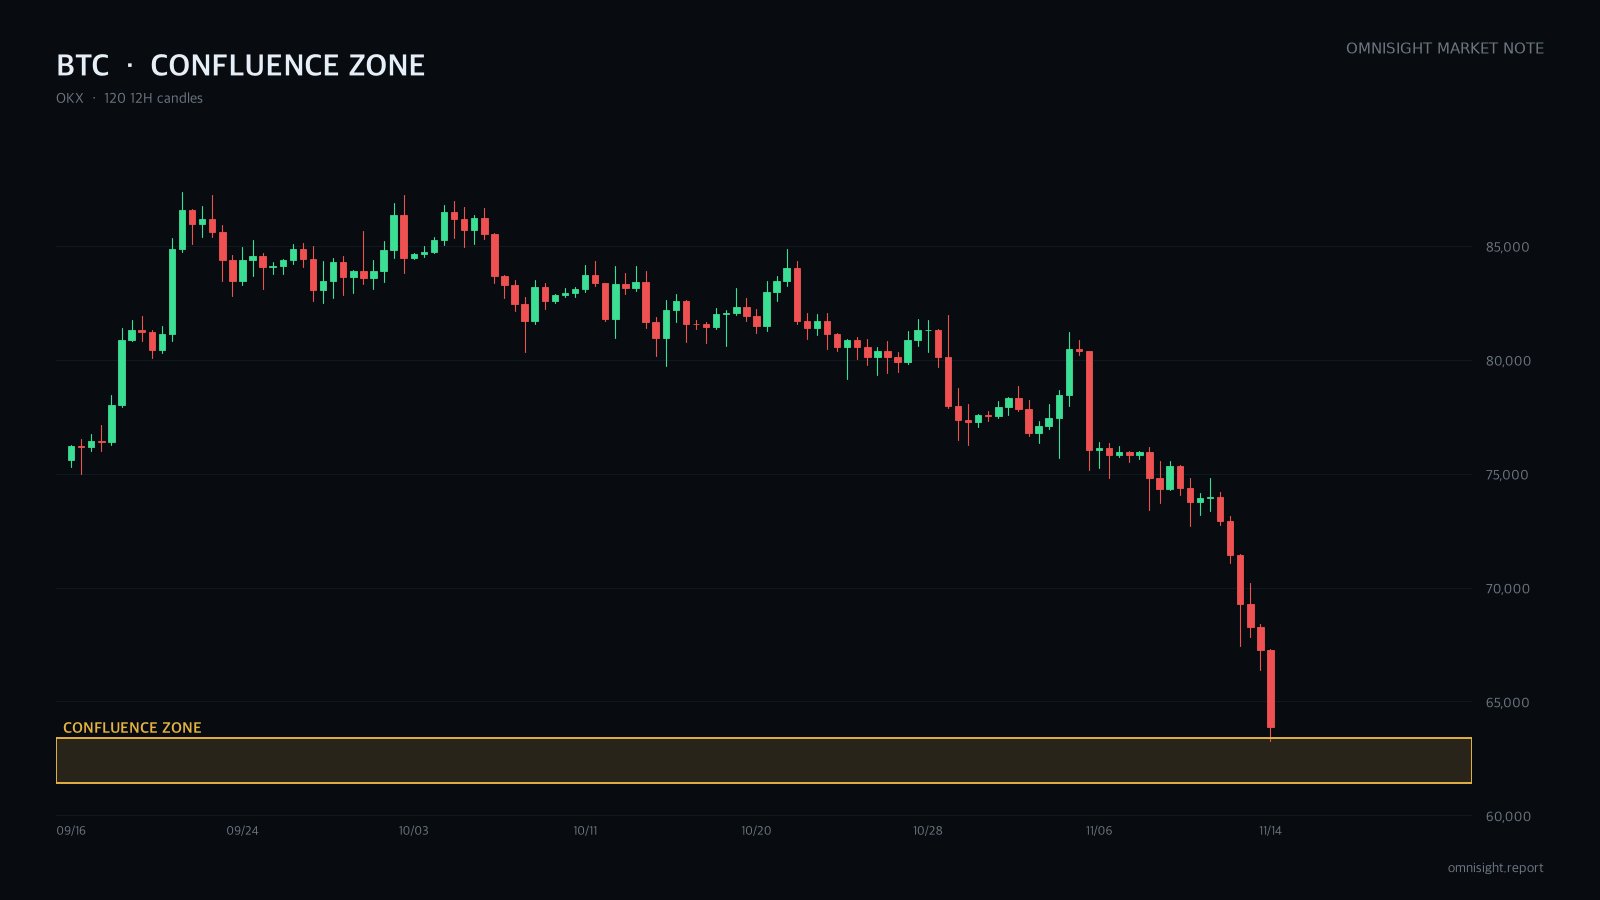
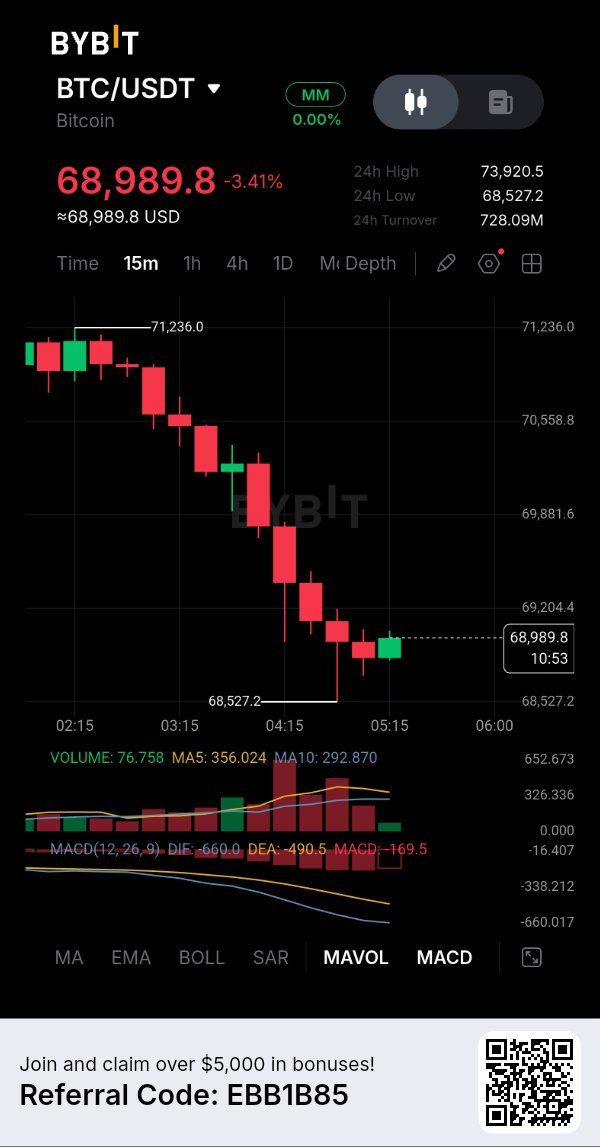
I'm leaning long $BTCUSDT, but not at the current price. It slid hard in under two weeks and is now sitting on the old base where the last rally started. I want a limit fill on one more flush under the lows. The catch: every timeframe is still in a downtrend. Context: it fell close to 6% this morning alone and sits below every moving average. Funding is negative and fear is extreme. Why I still lean up: - Three of four technical methods point long, and all three flag the same zone. - Volume on the daily, hourly and 15m charts printed range highs. That looks like capitulation. - On the 1h, price made a lower low while RSI made a higher low. Downside force is fading. Different methods, same area. That overlap is why I'd rest an order there. The Elliott read: the drop from the top is a clean five-wave move. Wave 5 already exceeds wave 1's length, so it's late. I'm waiting just above the extension targets for that last leg to finish. Where I'm wrong: a daily close below the old accumulation base, which also breaks the extension count. Then it's a deeper leg, not a bottom. Risks: Fed hike odds and ETF outflows keep macro bearish. Thin weekend liquidity can run stops fast. Not investment advice. All decisions and responsibility are your own. #IMPACTbyTrade
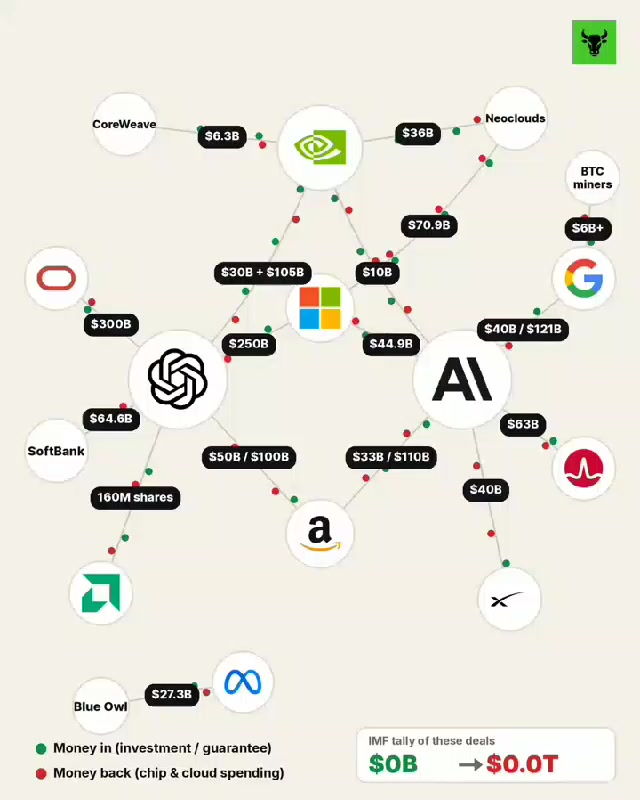
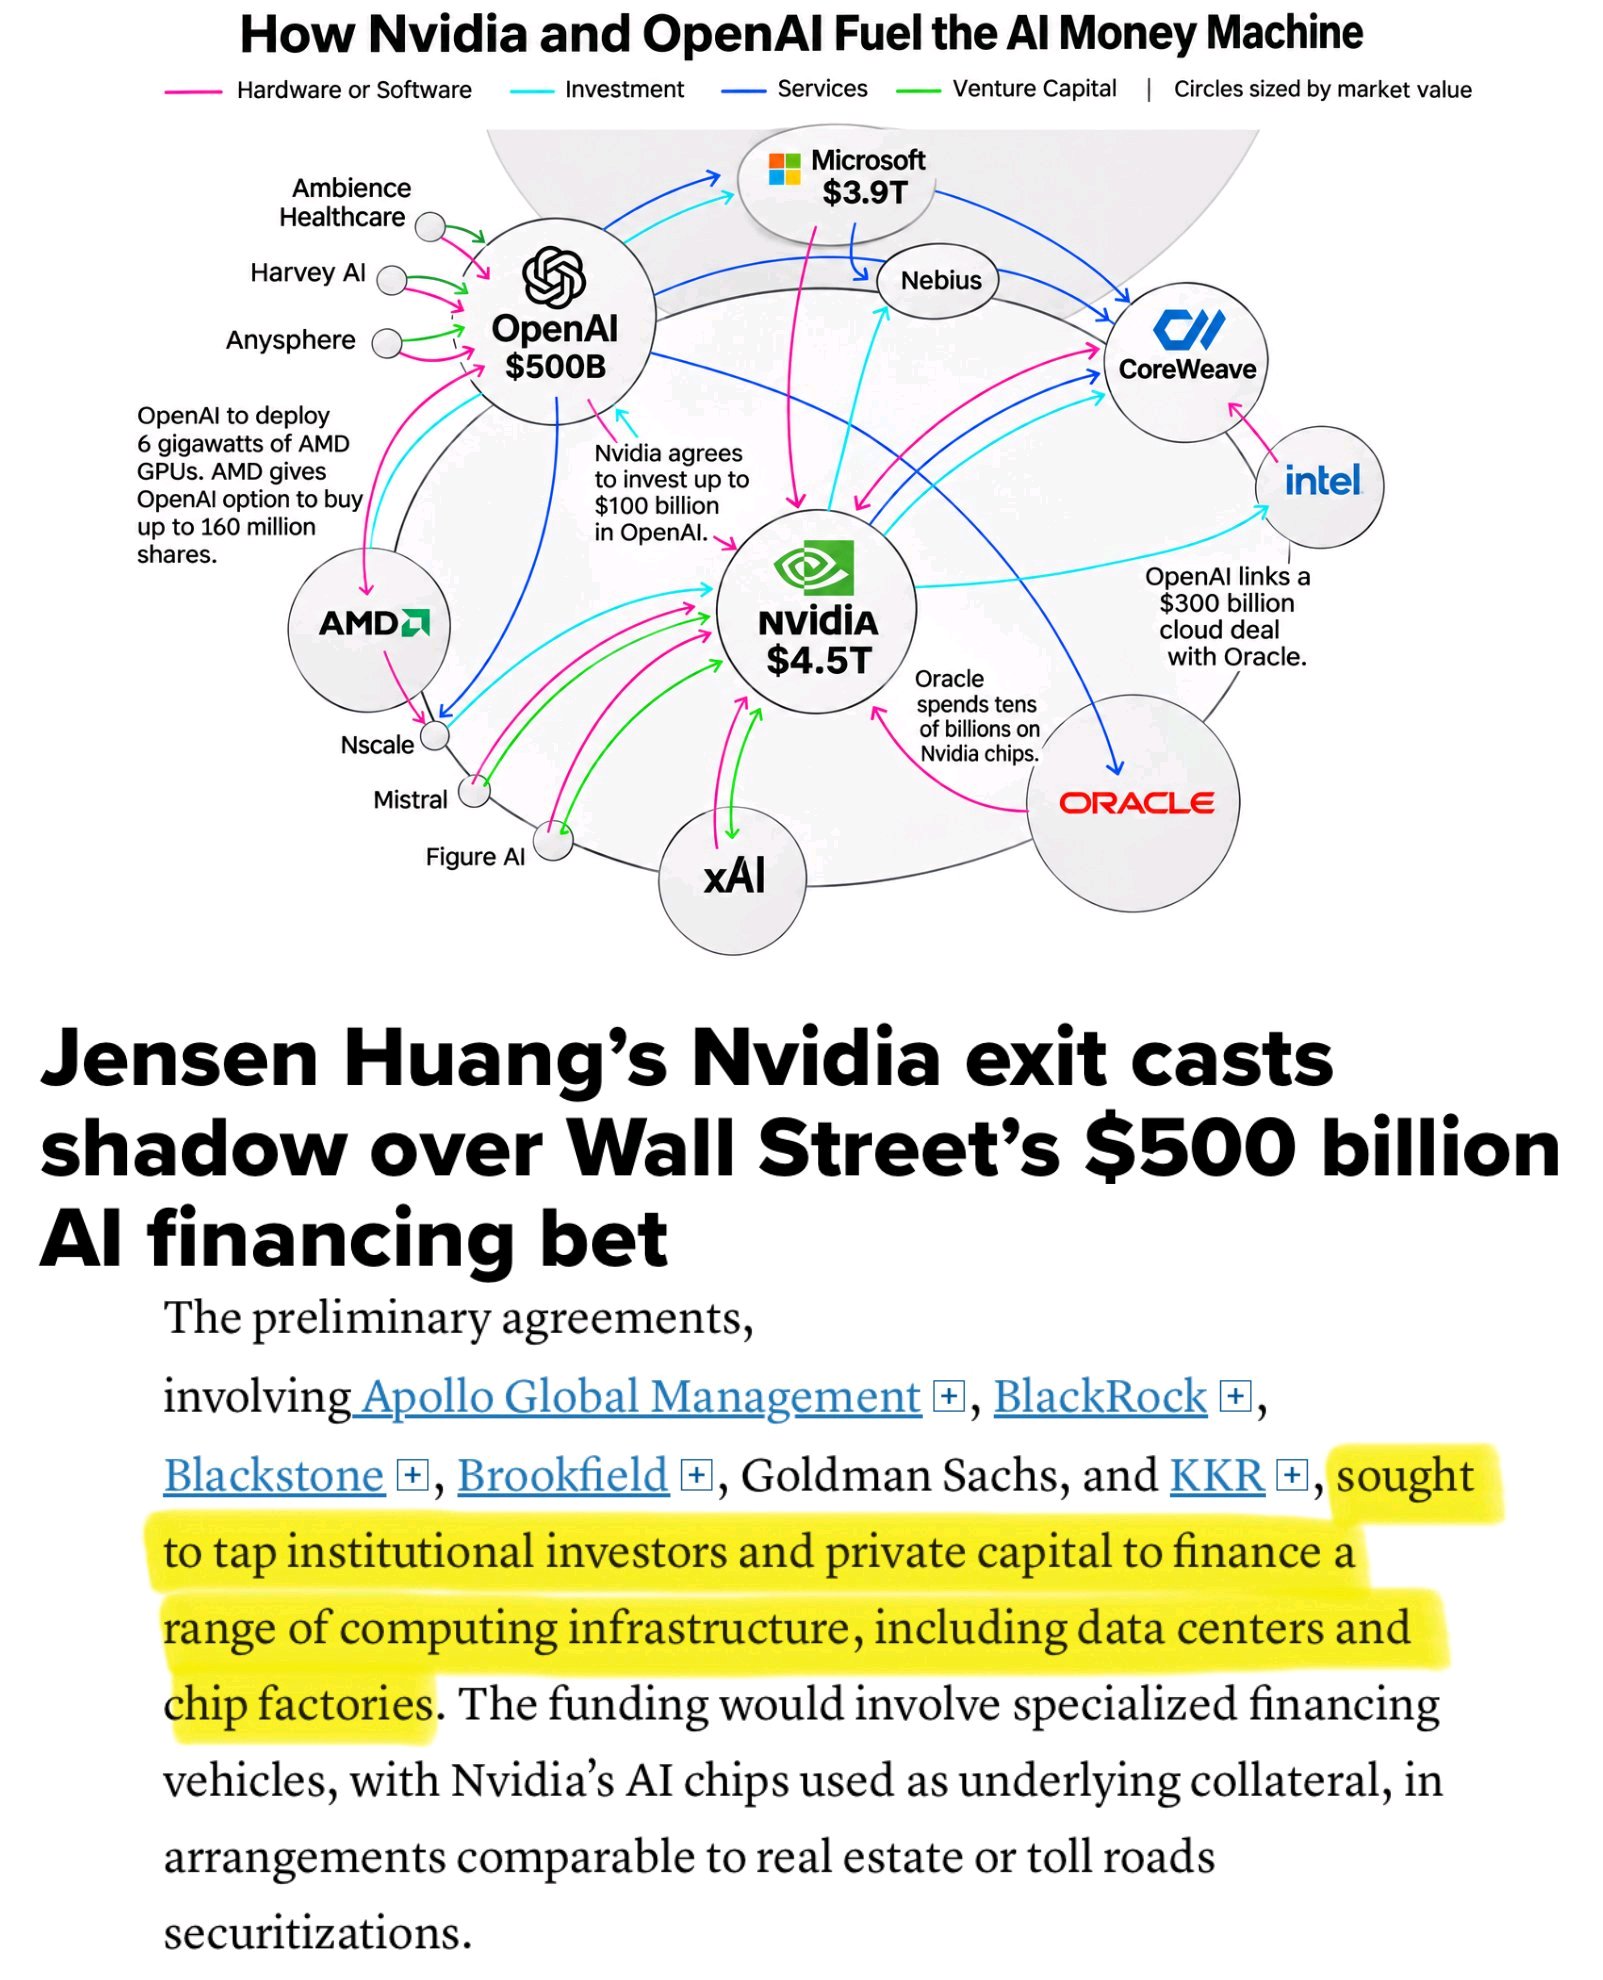
IMF secara resmi telah membunyikan alarm bahwa transaksi pembiayaan sirkular yang terikat dengan ledakan AI mencapai angka fantastis $1,4 triliun (sekitar 1.900 triliun won) 🤯 Singkatnya, perusahaan teknologi besar dan produsen chip berinvestasi pada pelanggan yang membeli produk mereka, sekaligus menjamin utang pelanggan tersebut, lalu uang itu berputar-putar dan kembali sebagai pendapatan perusahaan teknologi besar. Ini adalah skema round-robin yang masif lol Berikut adalah rincian dari 17 transaksi sirkular AI yang kini diungkap ke pasar. Angkanya benar-benar gila. 1. Nvidia $NVDAXUSDT ↔ OpenAI Nvidia berinvestasi $30 miliar di OpenAI dan menjamin hingga $105 miliar dalam bentuk sewa untuk pusat data di Ohio. OpenAI mengisi pusat data tersebut dengan chip Nvidia. 2. Oracle $ORCL ↔ OpenAI OpenAI telah menandatangani kesepakatan cloud senilai $300 miliar dengan Oracle. Oracle memaksimalkan pinjamannya untuk membangunnya. 3. Microsoft $MSFT ↔ OpenAI Microsoft memiliki sekitar 27% saham OpenAI, dan OpenAI telah berkomitmen untuk membelanjakan $250 miliar pada cloud Azure milik Microsoft. 4. SoftBank ↔ OpenAI SoftBank telah mengucurkan $64,6 miliar ke OpenAI, dan OpenAI menyewa pusat data dari anak perusahaan SoftBank, SB Energy. 5. Amazon $AMZN ↔ OpenAI Amazon berinvestasi hingga $50 miliar di OpenAI, dan OpenAI telah memperluas kontrak cloud Amazon mereka sebesar $100 miliar lagi. 6. AMD $AMD ↔ OpenAI AMD memberikan waran kepada OpenAI untuk membeli hingga 160 juta lembar sahamnya dengan harga $0,01 per saham (hampir gratis). Sebagai gantinya, OpenAI membeli chip AMD. 7. Google $GOOGL ↔ Anthropic Google berinvestasi hingga $40 miliar di Anthropic, dan Anthropic telah berkomitmen untuk membelanjakan setidaknya $121 miliar pada Google Cloud. 8. Amazon ↔ Anthropic Amazon berinvestasi hingga $33 miliar di Anthropic, dan Anthropic telah berkomitmen untuk membelanjakan setidaknya $110 miliar pada AWS. 9. Broadcom $AVGO ↔ Anthropic Bank memberikan pinjaman $63 miliar kepada perusahaan tujuan khusus (SPC) untuk membeli chip Broadcom dan menyewakannya kepada Anthropic. Broadcom bahkan menjamin nilai sisa dari chip bekas tersebut. 10. Microsoft + Nvidia ↔ Anthropic Bersama-sama, keduanya berinvestasi hingga $15 miliar, dan Anthropic telah berkomitmen untuk membelanjakan setidaknya $44,9 miliar pada cloud Microsoft. 11. SpaceX $SPCXXUSDT ↔ Anthropic SpaceX mengambil pinjaman sebesar $40 miliar untuk membeli chip Nvidia dan menjual kembali daya komputasi tersebut kepada Anthropic. Ngomong-ngomong, Nvidia adalah pemegang saham SpaceX. 12. Nvidia ↔ CoreWeave $CRWV Nvidia memiliki sekitar 11% saham CoreWeave dan telah menjamin akan membeli kapasitas yang tidak terpakai senilai $6,3 miliar. CoreWeave, tentu saja, membeli chip Nvidia. 13. Nvidia ↔ Neoclouds Nvidia telah berjanji untuk membeli kapasitas senilai $36 miliar dari perusahaan cloud AI kecil dan menengah. Mereka menggunakan pendapatan yang dijamin tersebut sebagai jaminan untuk meminjam uang dan membeli chip Nvidia. 14. Microsoft ↔ Core Scientific, Nebius $NBIS, IREN $IREN Microsoft telah menandatangani kontrak senilai hingga $70,9 miliar dengan mereka, dan mereka menggunakan uang tersebut untuk membeli GPU. 15. Google ↔ Mantan Penambang Bitcoin Google menjamin sewa pusat data senilai miliaran dolar untuk TeraWulf $WULF dan Cipher Mining $CIFR dengan imbalan kepemilikan saham. 16. Meta $META ↔ Blue Owl $OWL Mereka sedang membangun pusat data senilai $27,3 miliar melalui usaha patungan (joint venture), dengan Meta mendukungnya melalui jaminan sebesar $28 miliar. 17. IPO Anthropic Pemasok chip dan cloud seperti Nvidia, Google, AMD, Micron $MU, Broadcom, dan Microsoft membeli saham senilai $26 miliar dalam IPO Anthropic. Sementara itu, Anthropic sendiri berutang ratusan miliar dolar kepada perusahaan-perusahaan ini di masa depan 😂 Mengapa ini penting? Selama uang terus berputar dan utang terus bergulir, semua pihak mulai dari perusahaan teknologi besar, semikonduktor, hingga pusat data tampak seolah pendapatan mereka meroket, dengan kejutan laba setiap kuartal. Namun inilah masalahnya. Pesta $1,4 triliun ini hanya akan terus berlanjut jika konsumen akhir membelanjakan uang dalam jumlah besar untuk layanan AI. Saat monetisasi di ujung rantai tidak memenuhi ekspektasi, peringatan bombastis dari IMF adalah bahwa perusahaan model AI dan neocloud yang meminjam dana untuk membiayai belanja modal (CAPEX) akan menjadi yang pertama meledak, dan perusahaan teknologi besar yang memiliki investasi ekuitas serta jaminan sewa yang terikat dalam campuran tersebut bisa melihat kepala mereka terpenggal dalam efek domino. Intinya: Saat uang mengalir, ini adalah mesin gerak abadi paling memukau di dunia, tetapi saat pompa berhenti, ini bisa berubah menjadi keruntuhan domino yang bersejarah. Jadi, Anda benar-benar harus memeriksa jaminan dan utang di balik angka pendapatan tersebut. Bukan rekomendasi untuk membeli atau menjual saham tertentu, bukan juga saran investasi. Anda membuat keputusan sendiri dan menanggung tanggung jawab sendiri (Bukan Nasihat Keuangan) #IMPACTbyTrade
$HYPEUSDT kehilangan rata-rata 1 tahunnya dan titik terendah ayunan (swing low) sebelumnya dalam satu penutupan harian, turun lebih dari 12%. Bias saya adalah short. Tapi saya tidak akan menjual di sini. Saya ingin adanya pemantulan kembali ke zona yang ditinggalkan oleh breakdown tersebut. Menjual saat harga sedang jatuh (the hole) biasanya memberikan eksekusi harga yang terburuk. Strukturnya terlihat jelas saat turun. Lower high pada chart 4 jam dan 12 jam. EMA tersusun bearish. Apa yang mendasari analisis gabungan ini: - Tiga dari empat metode teknikal mengarah ke bawah - Penutupan harian berada di bawah rata-rata tahunan dan lantai lama (support lama) - Latar belakang risk-off: CPI yang panas, suku bunga mendekati level tertinggi, arus keluar ETF Alasan-alasan yang menumpuk dalam satu rentang sempit memberi perlindungan bagi penjual. Pandangan ICT: harga berada jauh di area diskon dari pergerakan tersebut. Sisi premium menyimpan gap yang belum terisi dari penurunan, low 4 jam yang telah jebol, EMA20 1 jam, dan retracement Fibonacci yang dalam, semuanya tumpang tindih. Di situlah saya akan menjual. Di bawah, likuiditas sisi jual (sell-side) di bawah low baru-baru ini adalah target pertama. Di mana saya salah: jika ada dorongan menembus high internal 4 jam dan rata-rata tahunan yang telah jebol. Itu adalah perubahan struktur, bukan sekadar retrace. Risiko: setiap timeframe sangat oversold, dan analisis Elliott melihat adanya pemantulan. Jika harga meluncur tanpa memantul, order tidak akan pernah terisi dan saya tidak akan mengejarnya. Bukan saran investasi. Semua keputusan dan tanggung jawab ada di tangan Anda. #IMPACTbyTrade
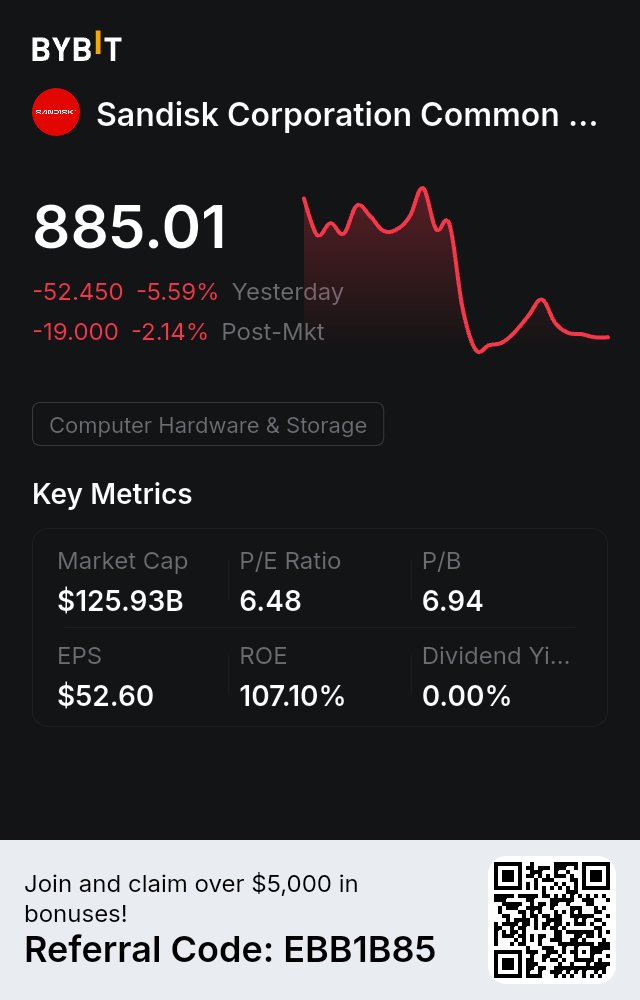
$SNDK turun lagi sekitar 8% hari ini, total hampir 15% dalam dua hari. $MU turun 4% hingga 5%, dan SK hynix turun sekitar 5%. Pertama, pisahkan antara fundamental dengan harga saham. $MU mencatat pendapatan $54,2 miliar pada kuartal terakhir, naik dari hanya $11,3 miliar setahun sebelumnya, dengan margin laba kotor GAAP sebesar 86,8%. Panduannya memperkirakan kenaikan sekitar 13% lagi pada kuartal mendatang. Kinerja tersebut akan menjadi yang terbaik di industri mana pun. Namun, $MU turun sekitar 20% selama sebulan terakhir dan telah jatuh lebih dari 30% dari level tertingginya. Dengan angka-angka yang begitu bagus, mengapa harga sahamnya masih jatuh? Fase paling berbahaya bagi saham memori sering kali bukanlah saat perusahaan merugi, melainkan saat margin sedang sangat tinggi dan pasar mulai memperhitungkan gelombang pasokan berikutnya jauh-jauh hari. Margin kotor 86,8% di industri yang dikenal dengan fluktuasinya yang liar saja sudah cukup membuat Anda sulit tidur. Aksi jual ini bukan tentang kuartal ini; ini adalah diskon untuk pertanyaan "berapa lama puncak ini bisa bertahan?" Ada tekanan lain minggu ini. $NVDA sedang mengganti CEO, dan pasar khawatir kecepatan pesanan komputasi AI hilir bisa terganggu. HBM paling dekat hubungannya dengan $NVDA, jadi yang pertama mengalami penyesuaian harga. $SNDK memproduksi NAND, jadi posisinya agak sedikit lebih jauh dari $NVDA, tetapi saham ini sebelumnya telah reli lebih kencang. Pada hari Rabu, harganya naik lebih dari 10% dalam satu hari bersamaan dengan $MU, jadi kenaikan tersebut dikembalikan lagi dengan cepat selama dua hari terakhir. Namun, ada beberapa hal yang tidak berubah. Pasokan memori masih ketat. Pabrik baru $MU senilai $4,5 miliar di Taiwan baru saja menghentikan pekerjaan karena perselisihan tenaga kerja, sehingga ekspansi kapasitas hanya akan melambat. SK hynix telah menjual setengah dari pasokannya untuk dua tahun ke depan. $NVDA bukan satu-satunya perusahaan yang menjalankan AI; akselerator perusahaan lain juga membutuhkan memori dengan bandwidth tinggi. Perubahan kepemimpinan di $NVDA mungkin mengganggu penentuan waktu, tetapi tidak mengubah dari mana permintaan itu berasal. Jadi, saya masih bullish pada sektor memori. Namun, bersikap bullish pada memori bukan berarti harus menangkap pisau yang jatuh saat ini. Pergerakan harian sebesar 5% adalah hal yang normal untuk saham-saham ini. Sejak Oktober, $MU telah bergerak lebih dari 5% pada sepertiga hari perdagangan mereka. Dengan laporan pendapatan $NVDA dan listing $ANT yang masih akan datang, volatilitas itu hanya akan semakin besar. Bersikap bullish pada suatu industri dan menentukan kapan harus masuk serta seberapa besar posisi yang diambil adalah dua pertanyaan yang berbeda. Saya akan menunggu dua hal: pertama, apa yang dikatakan $NVDA tentang HBM dan pesanan dalam laporan pendapatannya, dan kedua, agar $MU dan $SNDK berhenti jatuh dan membentuk titik terendah lebih tinggi (higher low) pertama mereka. Kemudian saya akan membeli secara bertahap, daripada langsung masuk saat masih di tengah pendakian. Permintaan masih ada, dan siklusnya masih ada. Kedua hal ini harus diakui. $NVDAXUSDT #SanDiskMengumumkanPecahSaham8Untuk1 #Penjualan Massal Saham Teknologi AI Menghapus 2,5 Triliun dari Nasdaq 100 #IMPACTbyTrade
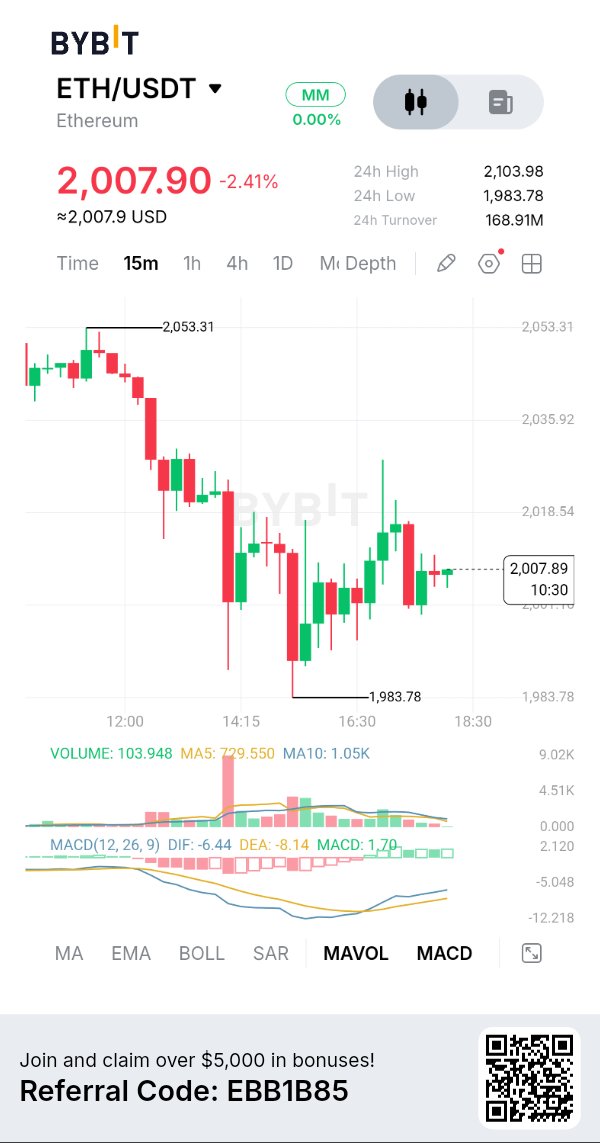
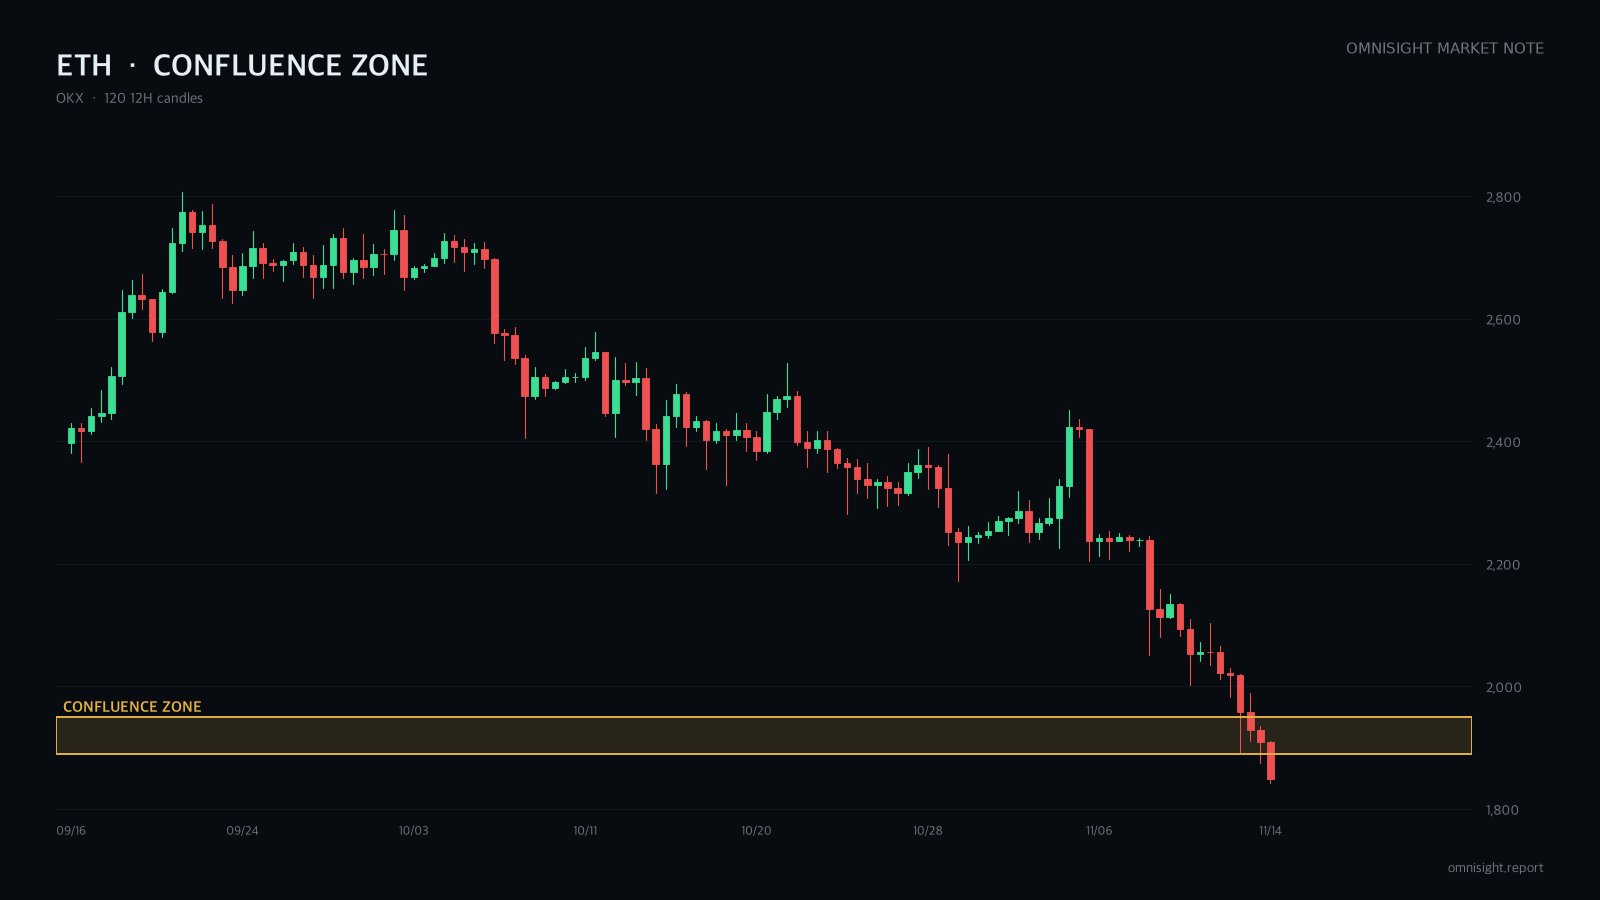
$ETHUSDT baru saja anjlok ke harga terendahnya dalam 50 hari hanya dalam waktu satu jam. Analisis saya masih short, tapi saya tidak akan menjual di kondisi seperti ini. Saya menunggu pantulan ke zona di mana support yang jebol berubah menjadi resistance. Masalahnya: aset ini sudah sangat oversold, dan itu bisa berakibat dua arah. Grafik harian, 12 jam, dan 4 jam semuanya mencetak lower high dan lower low. Harga berada di bawah setiap moving average pada timeframe tersebut. Kenapa short: - Struktur tren turun di semua timeframe yang lebih tinggi. - Bullish divergence hanya terlihat pada 4 jam dan 1 jam, tidak pada 12 jam atau harian. - Latar belakang risk-off dan arus keluar ETF bertindak sebagai pendukung tren, bukan pemicu utama. Dua dari empat metode teknikal condong ke short. Tren timeframe yang lebih tinggi menjadi penentu. Pandangan ICT: support 4 jam yang jebol, up-candle terakhir sebelum penurunan, dan titik tengah dari penurunan terakhir semuanya menumpuk di satu area. Menjual di sisi retrace yang mahal adalah cara short yang paling bersih di sini. Kapan saya salah: pergerakan di atas harga tertinggi pantulan kemarin mengakhiri urutan lower-high. Jika candle 4 jam ditutup dengan body di atas harga tertinggi pantulan terakhir sebelum fill, saya akan membatalkan order. Risiko: kondisi sangat oversold dan funding negatif bisa memicu squeeze tajam. Dan jika harga terus merosot tanpa pantulan, order tidak akan pernah terisi. Bukan nasihat investasi. Semua keputusan dan tanggung jawab adalah milik Anda. #IMPACTbyTrade
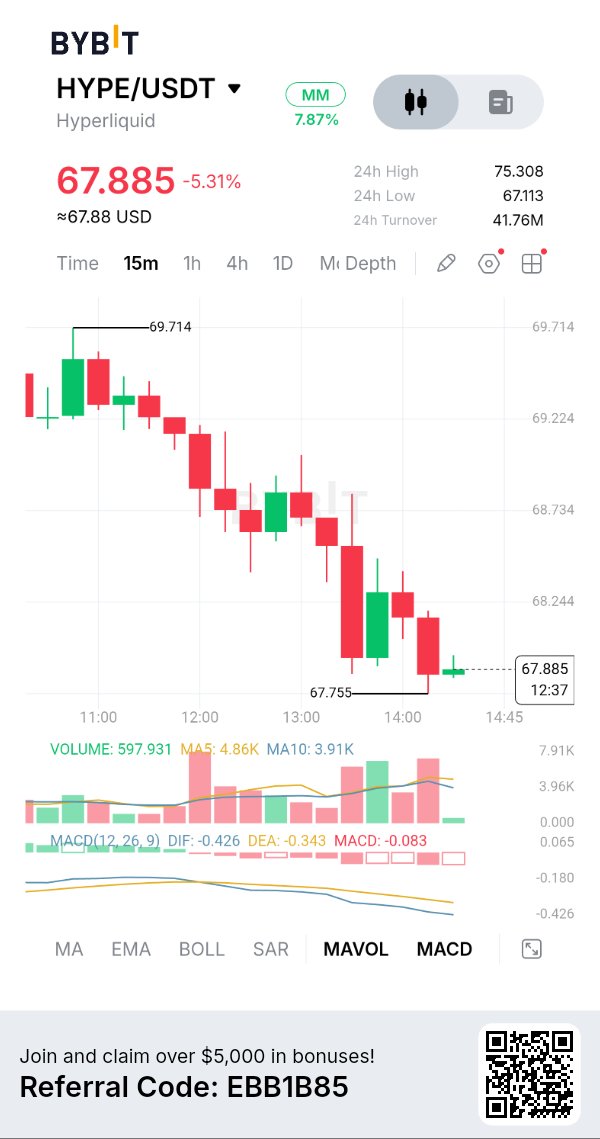
$HYPEUSDT lost the floor it held for two days, and it didn't just wick it. Two big hourly candles closed through on roughly 4x normal volume. I'm short-biased, waiting for a bounce back into that broken floor. The catch: it's already oversold, so no chasing. Since the cycle high, both highs and lows have been stepping lower on the daily and 12h. Why the retest area matters: - The broken floor, the daily 200 EMA and today's unfilled hourly gap stack in one place. - It also lines up with the deep retracement of today's drop. - A first retest of old support is where sellers tend to reappear. That overlap is why it's a zone, not a single line. On ICT, the liquidity below the floor wasn't swept and reclaimed. It was taken with closes. That turns the old floor into resistance, and the upper half of today's drop becomes the area to sell into, not chase. I'm wrong if a 4h close reclaims today's high along with the short-term averages. That's a reversal, not a pullback, and the short case is gone. Risks: BTC just hit a 12-week low after heavy liquidations, so sharp squeezes can hit. HYPE's own tailwinds (rising open interest, buybacks) may slow the drop. Not investment advice. All decisions and responsibility are your own. #IMPACTbyTrade
🚨 This is why Bitcoin keeps crashing
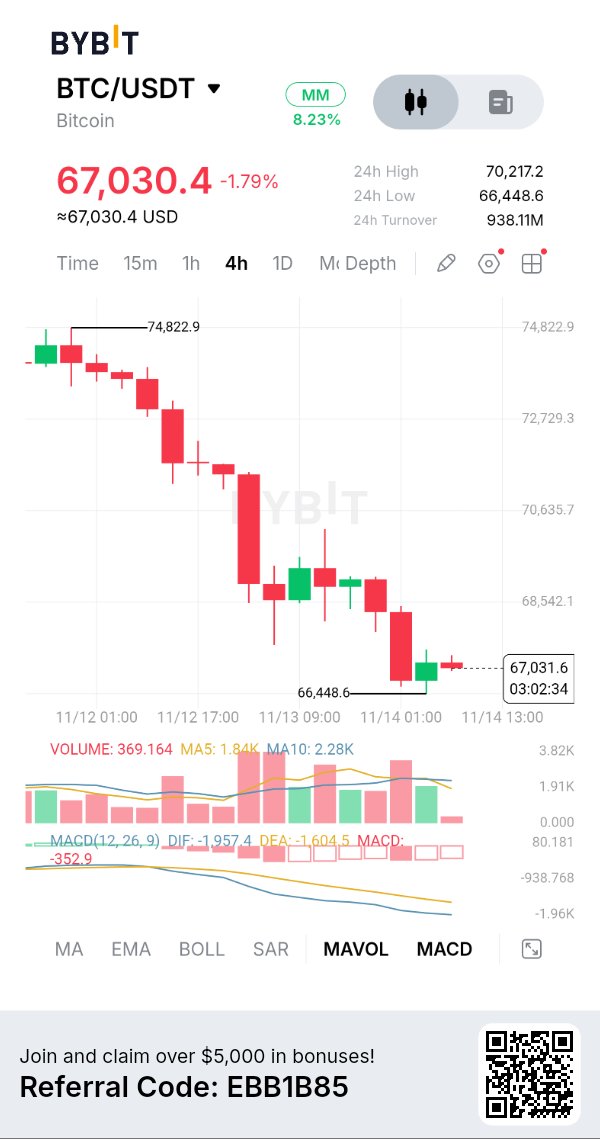
If you still think $BTCUSDT trades like an asset whose price is determined by supply and demand, you need to read this carefully. Because that market no longer exists at all. What you're seeing right now is not normal price action. This isn't just an AI stock sell-off. This isn't just a higher-than-expected inflation reading. And this is definitely not retail investors panic-selling. Most people have no idea what's happening. And by the time everything becomes obvious, the damage has already been done. And by the time everything becomes obvious, the damage has already been done. This cycle didn't start today. It's been quietly brewing beneath the surface for years. And now it's accelerating. The truth is: Once Bitcoin exposure can be created on paper, the 21 million coin cap no longer determines the price. And when paper determines the price, Bitcoin follows leverage and forced selling. That's exactly what's happening to Bitcoin. And it's the same kind of breakdown that has already hit these markets: → Gold → Silver → Oil → Stocks Once derivatives take over, real buyers lose control. Bitcoin's original investment thesis has collapsed. Bitcoin's value was built on two ideas: → A hard cap of 21 million coins → No coin being lent out twice The moment Wall Street built the following on top of it, that framework died: → Futures settled in cash rather than coins → Perpetual contracts → Options → ETFs → Broker loans, wrapped BTC and swaps Since then, paper Bitcoin has effectively become unlimited. Not on-chain. But in the market that determines the price, and that's what really matters. Liquidations. The one metric that explains everything. Over $1.6 billion in leveraged bets wiped out in 24 hours. $870 million hit Bitcoin longs. Spot Bitcoin ETFs saw $1.88 billion in outflows this month. Once paper selling overwhelms real buyers, the price no longer responds to demand. It responds to positions, hedging and cascading liquidations. Wall Street can now sell Bitcoin. They're not guessing the direction. They're doing what they do in every derivatives-driven market: 1⃣ Create paper BTC 2⃣ Short the bounce 3⃣ Force liquidations 4⃣ Close out at lower prices 5⃣ Repeat This isn't “betting.” This is inventory creation. One real BTC can now be counted as: → One ETF share → One futures contract → One perpetual contract → One broker loan All at the same time. That's four claims on a single coin. That's not a free market. That's a Wall Street pricing system wearing a Bitcoin mask. You can choose to ignore it, but don't pretend nobody warned you. $BTC is trading at $68,658, down 4.28% in 24 hours, its lowest level since August and 45.6% below its high of $126,200. If it loses $65,000, traders will next watch $62,500. Throughout the weekend, liquidation data and ETF fund flows will keep showing up on our screens. Follow us to get confirmed data first. #IMPACTbyTrade
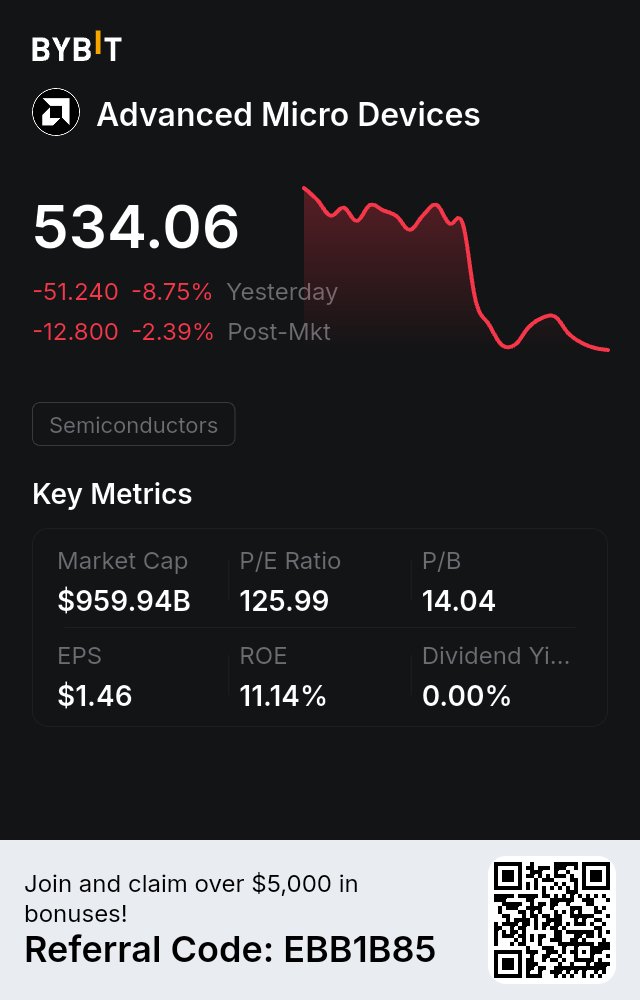
$AMD fell 10% in a single day, even harder than $NVDA. That’s the key thing to understand today. On Thursday, the day Jensen Huang stepped down, the market’s first reaction was to pull money out of $NVDA and move it into $AMD and $AVGO, betting that if Nvidia ran into trouble, orders would flow to its rivals. Today, that trade was unwound entirely: $AMD fell about 10% intraday, $AVGO about 5%, while $NVDA fell only 2% to 3%. The positions that had been moved over were pulled back in a single day, showing that the market wasn’t betting on who would take market share from whom, but was marking down the entire AI supply chain together. The reason for the markdown also came out into the open today. While Jensen Huang was there, $NVDA had been financing and guaranteeing loans for new cloud companies downstream, using its own money to help customers buy its own chips. The moment he left, the market’s first concern was whether that circular financing could keep turning. So the hardest hit today were new cloud companies like $CRWV and $NBIS, both down about 9% intraday. Britain’s Nscale revised its prospectus, with its net loss for the first nine months widening to $1.7 billion. $MSFT is also rumored to be reexamining its contracts with new cloud companies and planning to use fewer of them. Optical modules $LITE and $COHR, and servers $DELL and $HPE, fell anywhere from 6% to 11%. Where the money is flowing out is clear from the order of the declines: those most dependent on financing fell first, those living off $NVDA orders fell next, and the giants with the thickest cash flows fell the least. Interest rates are also working against the market. The 10-year U.S. Treasury yield climbed back above 5% on Thursday, rose above 5.1% intraday today, and the 30-year is around 5.4%. PPI was actually milder than expected, but the bond market isn’t buying it. Tech stocks with high valuations and heavy capital spending are the most sensitive to this number. The Nasdaq 100 fell about 1.7% intraday, the Dow was basically flat, and consumer staples were actually rising. Then there’s next week’s $ANT. Pricing is Wednesday, listing is Thursday, 825 million shares at $70 to $78 per share, raising as much as over $60 billion. With a subscription of that size, funds have to free up cash in advance, and the easiest way is to sell the AI stocks they already hold that have risen and are liquid. $NVDA itself also committed to subscribing for $10 billion in the placement, and now that Jensen Huang is gone, the market is also guessing whether that money will still come through. With these three things stacked on top of each other, a drop like today’s is not surprising at all. So why isn’t this a crash yet? Because only the AI chain is falling; the broader market hasn’t collapsed with it. The S&P fell less than 1% intraday, and the Dow was flat. Money is rotating within tech and hiding in defensive sectors, not selling everything. The kind of panic that sent the SOX down 12% in a single day on 11/5 did not show up today. Positioning has to be calculated carefully too. Through Thursday’s close, the SOX was about 12% higher than last Friday. The earlier rebound was too fast, and part of today’s drop is giving back that rebound. What comes next comes down to two things. One is $NVDA’s earnings on 11/17: how the new management talks about orders, and how it talks about financing for customers. The other is $ANT’s pricing and its first-day performance. If $ANT goes smoothly, it means the primary market is still willing to pay up for AI assets, and the money that was pulled out has a chance to flow back. If pricing is pushed to the bottom of the range or it even opens below the offering price, this round of selling will most likely go back to test the 11/5 lows. I won’t catch a falling knife like $AMD’s 10% drop in a single day this week, and I won’t bet on $NVDA’s earnings night either. Trim on the rebound, buy in batches when it reaches a level, and keep cash to get through next week. The companies are still the same companies. It’s just that right now, no one is willing to carry a bit more exposure before $ANT lists. #JensenHuangExitTestsNvidiasAILeadership $NVDAXUSDT #IMPACTbyTrade
IMF FLAGGED $1.4 TRILLION IN CIRCULAR AI DEALS.
Big Tech is funding its own customers so they can keep buying from Big Tech. Here is every known AI circular financing loop right now: 1. Nvidia ↔ OpenAI: Nvidia invested $30 billion in OpenAI and guarantees up to $105 billion of its Ohio data center leases. OpenAI fills those data centers with Nvidia chips. 2. Oracle ↔ OpenAI: OpenAI signed a $300 billion cloud deal with Oracle. Oracle is borrowing heavily to build the data centers for it. 3. Microsoft ↔ OpenAI: Microsoft owns about 27% of OpenAI. OpenAI committed $250 billion to Microsoft's Azure cloud. 4. SoftBank ↔ OpenAI: SoftBank invested $64.6 billion in OpenAI. OpenAI rents data centers from SoftBank's SB Energy. 5. Amazon ↔ OpenAI: Amazon is investing up to $50 billion in OpenAI. OpenAI expanded its Amazon cloud deal by $100 billion. 6. AMD ↔ OpenAI: AMD gave OpenAI the right to buy up to 160 million AMD shares for $0.01 each. In return, OpenAI buys AMD chips. 7. Google ↔ Anthropic: Google is investing up to $40 billion in Anthropic. Anthropic committed at least $121 billion to Google Cloud. 8. Amazon ↔ Anthropic: Amazon is investing up to $33 billion in Anthropic. Anthropic committed at least $110 billion to Amazon's cloud. 9. Broadcom ↔ Anthropic: Banks lent $63 billion to a special company that buys Broadcom chips and leases them to Anthropic. Broadcom backs the chips' resale value. 10. Microsoft + Nvidia ↔ Anthropic: They are investing up to $15 billion combined. Anthropic committed at least $44.9 billion to Microsoft's cloud. 11. SpaceX ↔ Anthropic: SpaceX borrowed $40 billion to buy Nvidia chips and sells the computing power to Anthropic. Nvidia is a SpaceX shareholder. 12. Nvidia ↔ CoreWeave: Nvidia owns about 11% of CoreWeave and agreed to buy $6.3 billion of its unused capacity. CoreWeave buys Nvidia chips. 13. Nvidia ↔ neoclouds: Nvidia agreed to buy $36 billion of cloud capacity from smaller AI cloud companies. They use that guaranteed income to borrow and buy Nvidia chips. 14. Microsoft ↔ Nscale, Nebius, IREN: Microsoft signed up to $70.9 billion in contracts with them. They use the money to buy GPUs. 15. Google ↔ former bitcoin miners: Google guarantees billions in leases at TeraWulf and Cipher and gets their shares in return. 16. Meta ↔ Blue Owl: A $27.3 billion data center was built through a joint company, with Meta backing it with a $28 billion guarantee. 17. Anthropic IPO: Its chip and cloud suppliers, Nvidia, Google, AMD, Micron, Broadcom and Microsoft, are buying $26 billion of its shares. Anthropic owes those same companies hundreds of billions in future spending. When money keeps flowing, these loops make everyone's revenue look strong. $NVDAXUSDT #IMPACTbyTrade
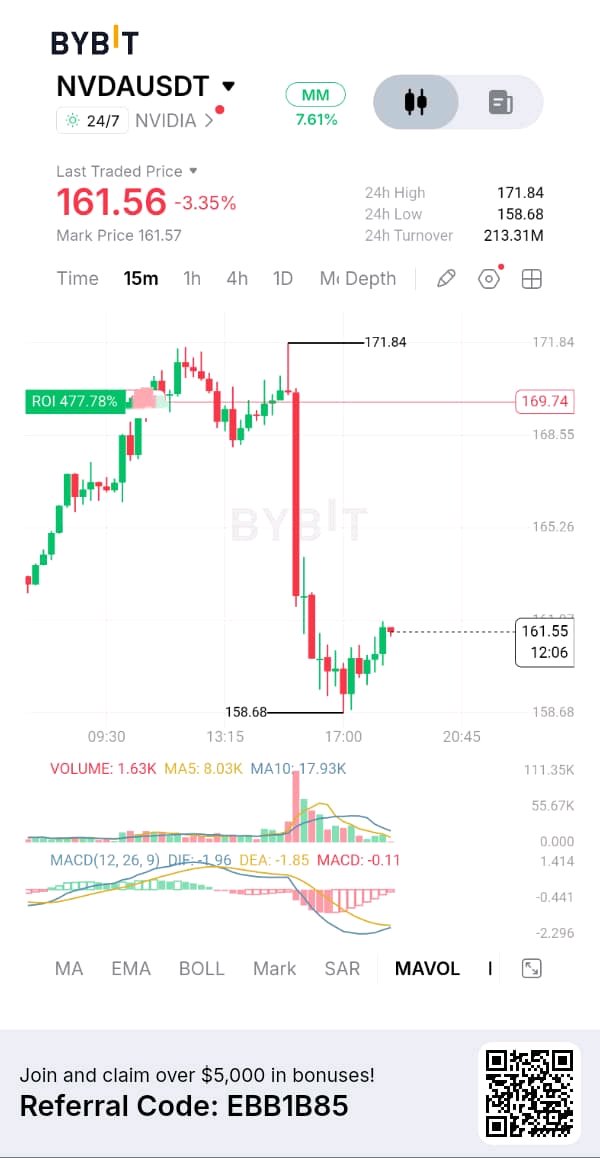
NVIDIA's NVDAUSDT market is experiencing significant selling pressure after a sharp intraday reversal from the $171.84 high. Although buyers have started defending the $158.68 region, the recovery remains relatively weak, and the market has not yet confirmed that the selling pressure is over. My Bybit 15-minute chart shows $NVDAXUSDT trading around $161.56, down approximately 3.35%. The price action suggests that sellers have regained short-term control following an earlier bullish move. The next reaction around $158.68 could determine whether this is simply a temporary correction or the beginning of another downward leg. CHART + TECHNICAL ANALYSIS The most important development is the aggressive bearish candle that pushed price from the $169 region toward $160, followed by another move that established an intraday low of $158.68. Buyers have attempted to recover from that low, gradually pushing price toward $161.56. However, the recovery has not yet reclaimed the previous breakdown structure. MACD remains negative, with DIF at -1.96, DEA at -1.85 and histogram around -0.11. Although the negative histogram suggests bearish momentum is easing slightly, the indicator has not confirmed a bullish reversal. FUNDAMENTAL PERSPECTIVE NVIDIA remains one of the most important companies in the global semiconductor industry, with its GPUs playing a central role in artificial intelligence training, data centers and accelerated computing. Its long-term growth opportunity is connected to continued AI infrastructure investment, demand for advanced chips and expansion of enterprise computing. However, strong company fundamentals do not prevent short-term market corrections. Valuation, earnings expectations, capital expenditure trends and broader technology-sector sentiment can all influence price performance. MACRO + MARKET CONDITIONS Technology stocks are sensitive to interest-rate expectations, liquidity conditions and changes in investor appetite for risk. A weaker broader equity market could increase pressure on NVDA, even if its company-specific fundamentals remain strong. I would also monitor the performance of major semiconductor stocks and the wider Nasdaq market. A recovery supported by the broader technology sector would provide stronger confirmation than an isolated bounce. MY TRADING PLAN I wouldn't chase the current bounce or enter blindly during the consolidation. For a bullish position, I want to see buyers defend $158.68, reclaim resistance and demonstrate stronger volume. For a bearish position, I would prefer a confirmed breakdown followed by a failed attempt to recover the lost support. Position sizing will remain controlled, with a predefined stop-loss and partial profit-taking at the first target. #IMPACTbyTrade
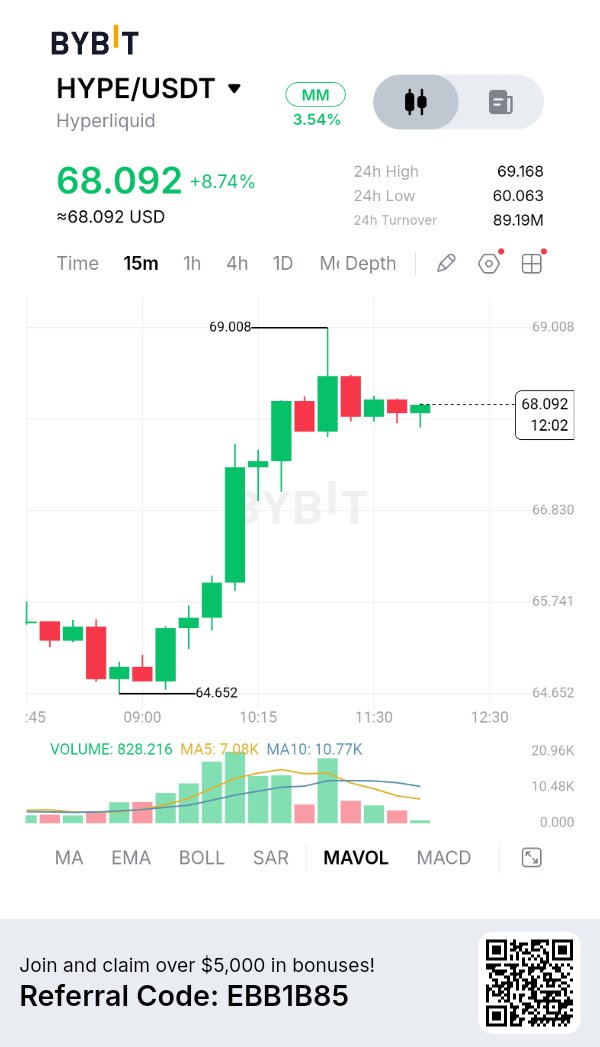
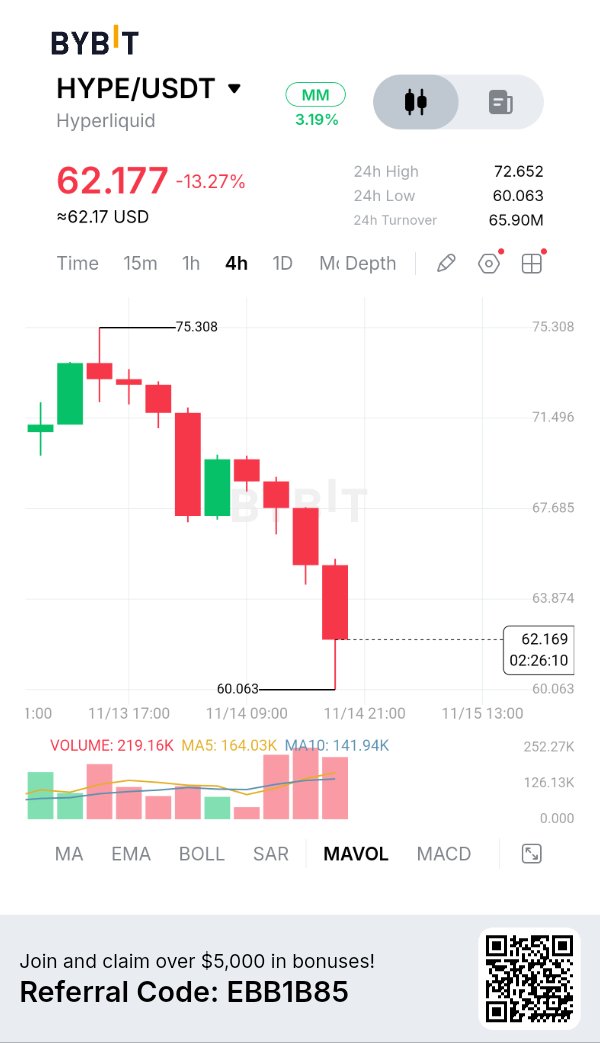
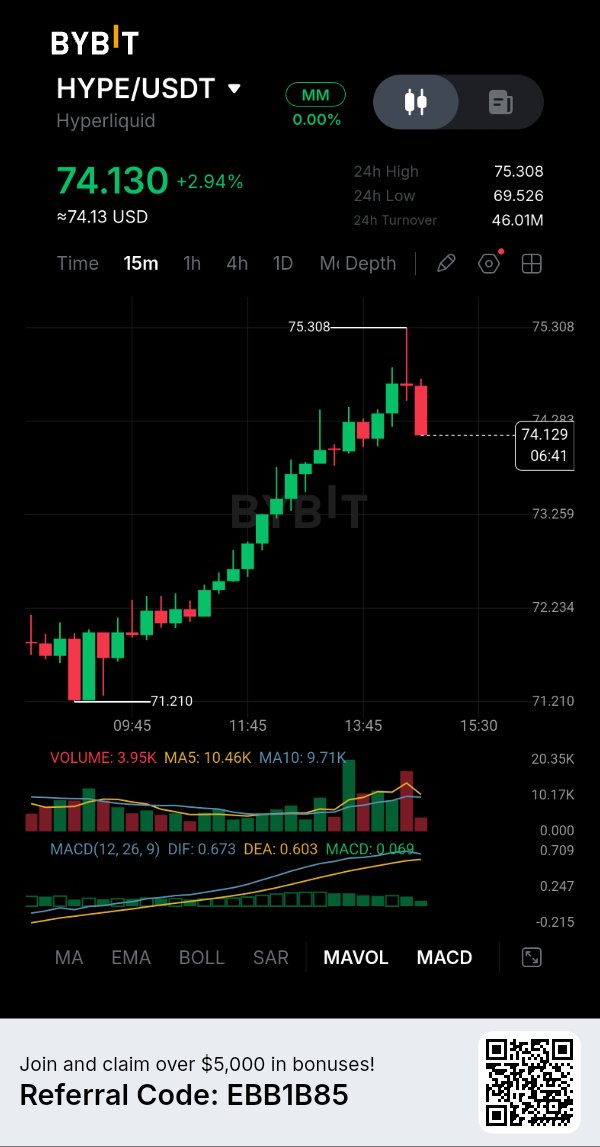
$HYPEUSDT is showing renewed buying strength after recovering from the $71 region, but the latest rejection near $75.30 suggests that the market is approaching an important decision point. Buyers have made considerable progress during this intraday recovery, although the next move will depend on whether they can overcome resistance with stronger volume and maintain the newly established bullish structure CHART + TECHNICAL ANALYSIS My Bybit $HYPEUSDT 15-minute chart shows price trading around $74.13, up approximately 2.94%. Price advanced from an intraday low of $71.210 to a high of $75.308, representing a strong recovery within the observed session. For HYPE, the important question is how increasing platform activity translates into sustainable token demand. A growing ecosystem can strengthen long-term fundamentals, but token appreciation still depends on market demand, liquidity and the economic value captured by the token. TOKENOMICS AND VALUE ACCRUAL HYPE has utility within the Hyperliquid ecosystem, including staking, validator participation and trading-related mechanisms. An important component of its token economics is the Assistance Fund, which uses protocol revenue to acquire HYPE through its fee-related mechanism. This creates a potential connection between platform activity and token supply reduction. The key levels on my chart are $75.308 resistance, $73.259 immediate support, $72.234 secondary support and $71.210 as the major visible intraday swing low. FUNDAMENTAL ANALYSIS Hyperliquid continues to develop its position as a major decentralized trading infrastructure platform. Its ecosystem includes perpetual futures, spot markets and HyperEVM, which expands the possibilities for decentralized applications and financial services. The HIP-3 framework is particularly interesting because it allows approved third-party deployers to introduce additional perpetual markets. This potentially expands the range of assets and trading opportunities available within the ecosystem. The candle structure shows a sequence of higher highs and higher lows, suggesting that short-term buyers have gained control. However, the latest rejection candle indicates that sellers are becoming active around the $75.30 resistance region. MACD remains positive, with DIF at 0.673, DEA at 0.603 and histogram around +0.069. This indicates that bullish momentum is still present, although the narrowing difference between the MACD lines makes it important to monitor whether momentum continues improving. Volume currently reads approximately 3.95K, below MA5 at 10.46K and MA10 at 9.71K. This is an important observation because a breakout without stronger trading participation may struggle to sustain itself. #IMPACTbyTrade

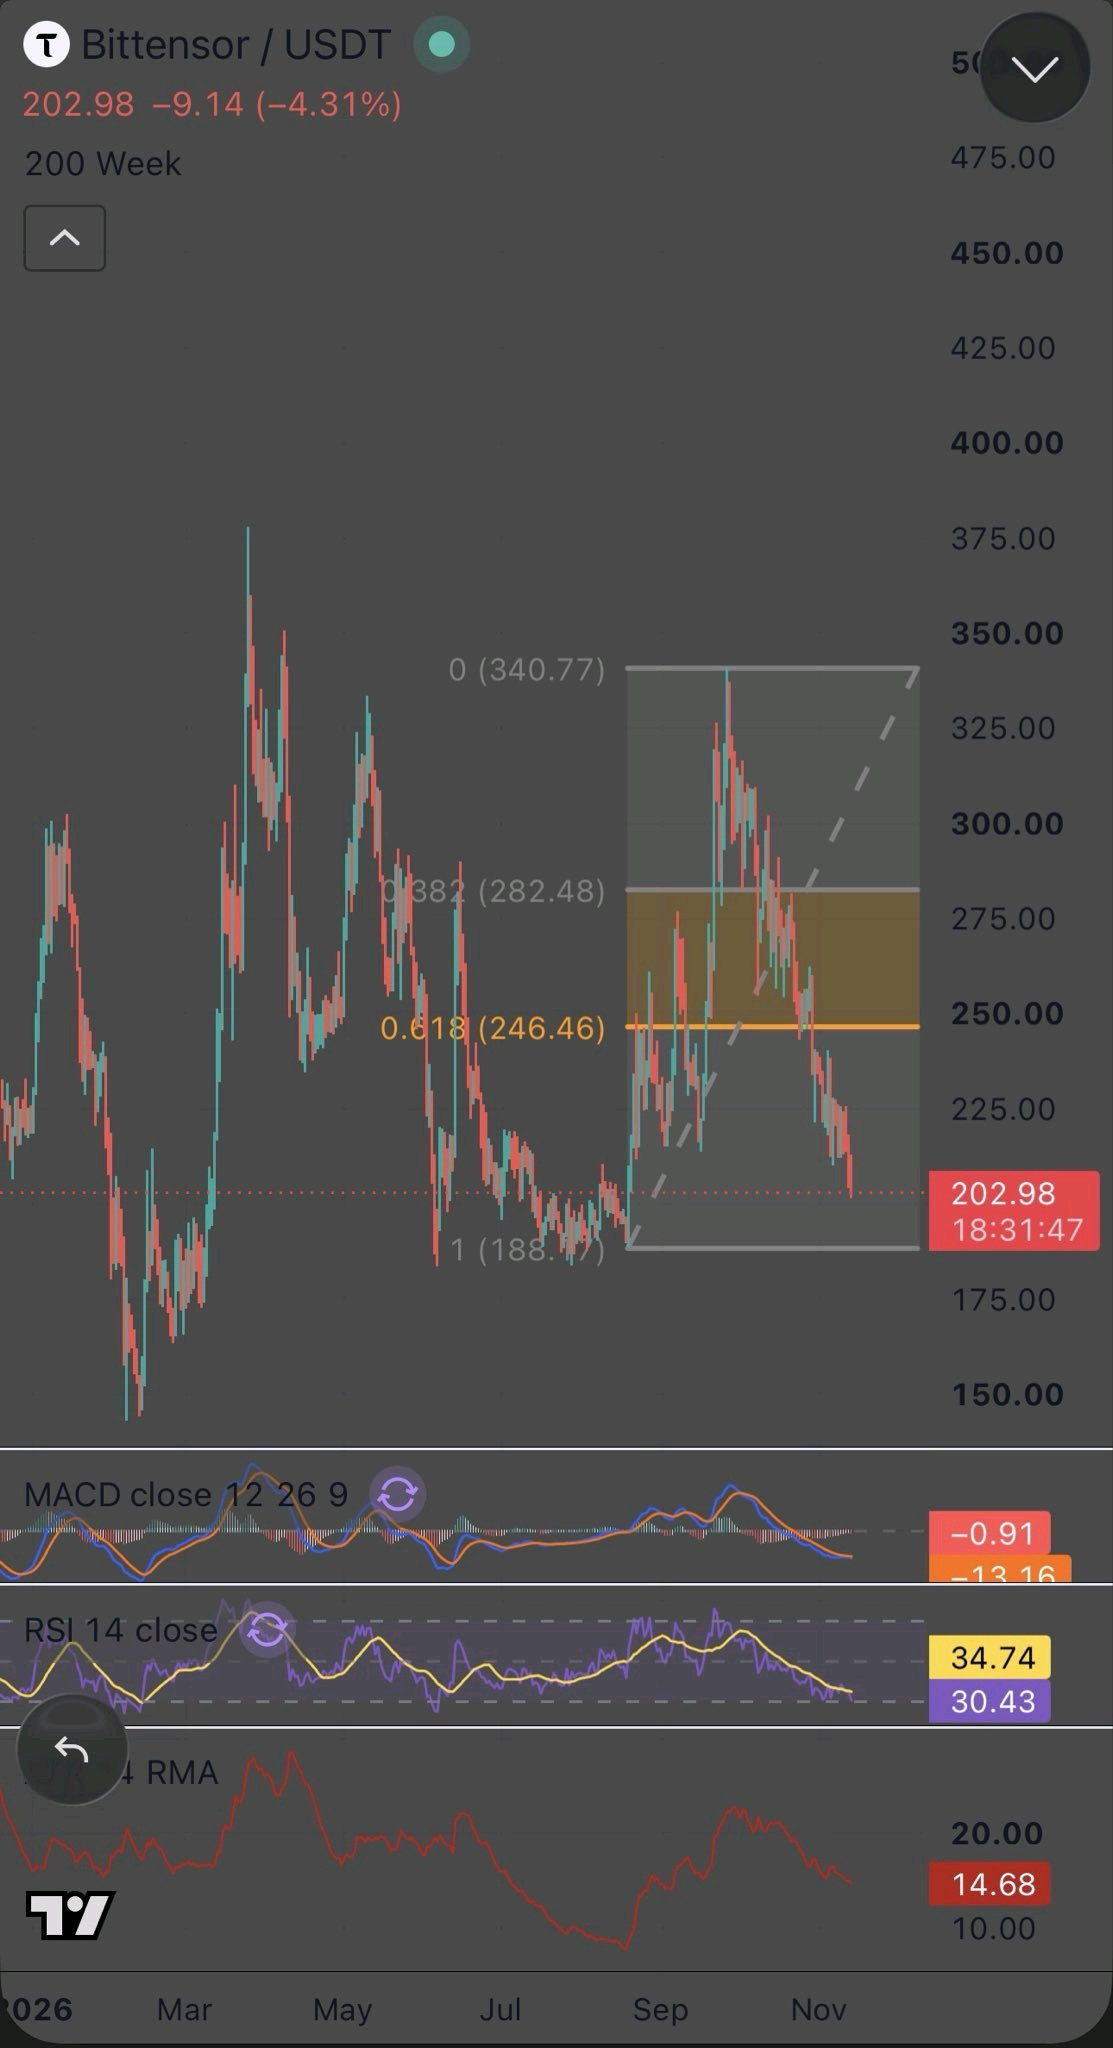
Kamu membeli $TAO di harga $280 karena akhirnya merasa aman lagi. Sekarang kamu buka chart, lihat harga $203, dan langsung menutup aplikasinya sebelum ada yang bertanya bagaimana kabar portofoliomu. Aku tahu perasaan itu. Itulah tepatnya kenapa aku terus membagikan level ini selama berminggu-minggu. Fib ditarik dari titik terendah $188 ke titik tertinggi $340: 0.382 berada di $282 0.618 berada di $246 Retrace penuh berada di $188 'Golden pocket' adalah garis pembatasnya. Begitu ditembus di akhir Oktober, setiap pantulan langsung mati tepat di bawahnya. Sekarang $TAO diperdagangkan di $203. Itu sekitar 7% di atas lantai yang terus aku tunjukkan saat kebanyakan orang masih menunggu $340 kembali. Apa yang dikatakan momentum saat ini: RSI mendekati 30, mengetuk area oversold (jenuh jual) MACD masih di bawah sinyal, tapi histogramnya mulai menyusut Penjual mulai lelah, meskipun mereka belum selesai sepenuhnya Level penentu ada di $188. Jika bertahan, ini akan menjadi double bottom dengan basis Juli. Dinding pertama yang harus direbut kembali adalah $246. Jika jebol pada penutupan harian, tesis ini batal. Titik terendah bulan Maret di dekat $150 akan kembali menjadi perhatian. Aku tidak menebak ke mana arahnya. Aku sudah menggambar petanya berminggu-minggu lalu dan harganya hanya mengikutinya. Rasa sakit yang kamu rasakan hari ini sudah tercetak di chart ini jauh sebelum dampaknya sampai ke portofoliomu. $QNTUSDT $NVDAXUSDT #IMPACTbyTrade
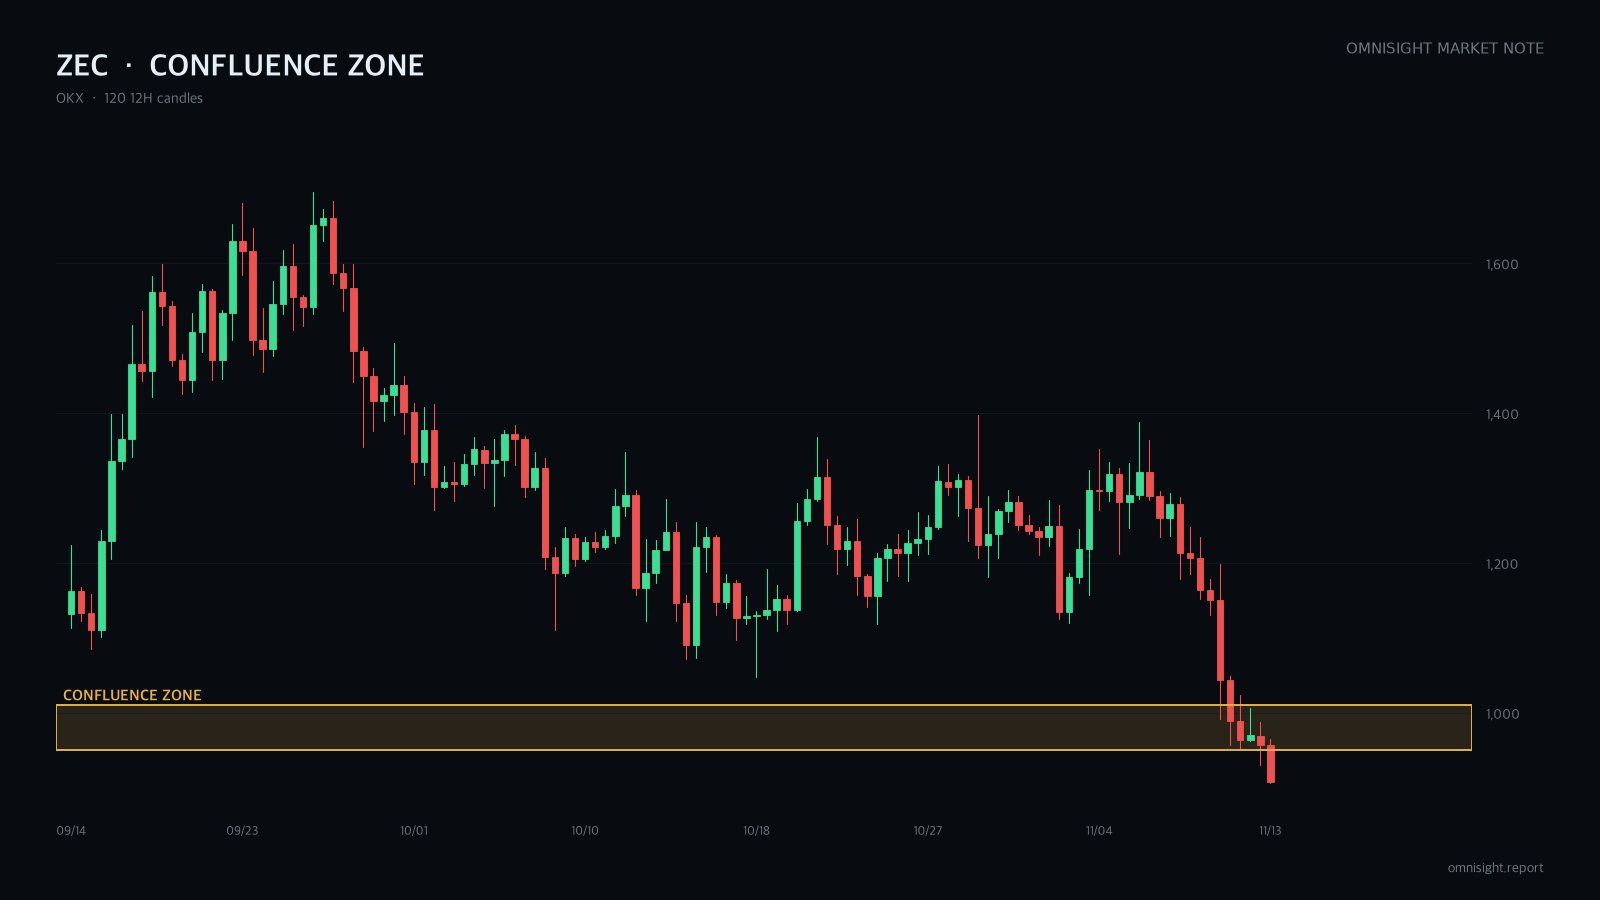
$ZEC lost a six-week floor on heavy volume and has now printed four lower highs on the daily. I'm leaning short, but I'm not selling here. I want a bounce back into the area where the break happened. The catch: it's already deeply oversold, so that bounce may never come. The floor held for six weeks before two heavy sell days took it out. Price then lost the 12h long-term average too. Every daily rally since has stalled lower than the last. What lines up in the sell area: - the 50-79% retracement of the latest 4h leg down - the recent 1h bounce highs - the underside of the broken floor, where trapped buyers may want out Three reasons in one area is why I wait instead of chasing. From an ICT view, higher-timeframe structure has already broken down, so retracements are premium to sell, not a reversal. Buy-side liquidity sits above the recent 4h and 12h swing highs. The stop goes beyond that, so a sweep alone doesn't take me out. I'm wrong if a 4h candle closes back above the 12h swing high. That ends the lower-high sequence. Risks: price may fall straight to the daily 200 EMA without retracing, leaving the order unfilled. Post-crash BTC swings can whip both ways. Not investment advice. All decisions and responsibility are your own. $BTCUSDT #IMPACTbyTrade
$BTCUSDT baru saja mencetak titik terendah baru setelah penurunan tajam. Saya bearish, tapi saya tidak akan menjual di sini. Saya menunggu pantulan (bounce) untuk kembali ke support yang baru saja ditembus. Mengejar likuidasi biasanya adalah posisi short terburuk yang bisa Anda ambil. Sejak level tertinggi awal November, timeframe harian, 12 jam, dan 4 jam semuanya terus membuat lower high dan lower low. Penurunan hari ini menembus kotak 4 jam yang bertahan sejak tadi malam. Alasan saya masih condong short: - Keempat metode teknis menunjuk ke arah yang sama. - RSI terus turun seiring dengan harga. Tidak ada bullish divergence; timeframe 4 jam menunjukkan hidden bearish divergence. - Makro adalah pendorong (tailwind), bukan pemicu: CPI yang panas, arus keluar ETF. Zona saya menumpuk kotak yang rusak, retracement ~38% dari penurunan hari ini, dan gap 1 jam. Tes ulang pertama dari support yang berubah menjadi resistance. Pada Elliott, wave 3 turun baru saja menyamai panjang wave 1. Pantulan wave-4 biasanya dimulai di sini dan terhenti di dekat retracement itu sebelum wave kelima turun. Saya salah jika harga menembus swing high 12 jam terakhir dan tumpang tindih dengan level terendah wave-(i). Itu akan mematahkan urutan lower-high dan membatalkan hitungan ini. Risiko: sangat oversold setelah squeeze yang panjang, jadi pantulannya bisa sangat kuat. Acara Fed dan indeks bisa memperpanjang ini hingga 3-10 hari. Bukan nasihat investasi. Semua keputusan dan tanggung jawab adalah milik Anda sendiri. #IMPACTbyTrade
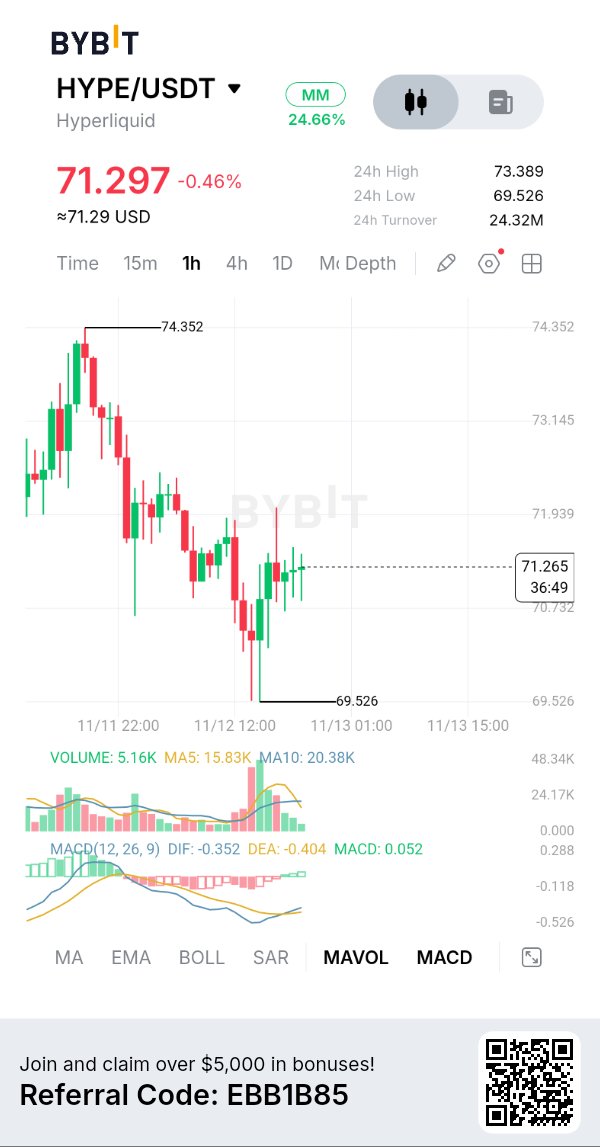
$HYPEUSDT has made lower highs and lower lows on the daily, 12h and 4h. I'm bearish, but I'm not selling here. Price sits in the discount half of the 4h range after a sharp drop. Shorting this spot gives a poor risk/reward. I'm waiting for a bounce into the zone above. Since the prior peak, each 4h bounce has stalled below the last one. No structure shift yet. Why the zone above matters: - It is the 0.618-0.79 retracement of the latest down leg - The 4h 20 EMA runs right through it - It overlaps the supply left by the last up candle before the drop - A broken support now sits there as resistance Four separate reasons stacked in one band. That is where I expect sellers to test again. ICT read: the bearish order block covers the premium half of the range. Selling a retrace into it keeps the stop above structure. The first target sits under the double bottom, where sell-side stops are resting. Where I'm wrong: a break above the last lower high on the 4h/12h. That ends the lower-high sequence, and I step aside. Risks: the recent low lines up with the daily 200 EMA. And BTC just hit a 12-week low on rate and Nvidia CEO headlines, so swings can be violent both ways. Not investment advice. All decisions and responsibility are your own. #IMPACTbyTrade
$ETHUSDT swept below its prior low today and snapped back. It looks like a bottom. I read it as fuel for a bounce I want to sell. Bias: short. I'm waiting for the bounce to reach today's broken support. The catch: the bounce could run past it. Context: daily, 12h and 4h all print lower highs and lower lows. Price sits below the 20, 50 and 200 EMAs on every timeframe. Today's inflation shock pushed it through a round-number floor before buyers stepped in. Why that zone: - Three of four technical methods (ICT, Wyckoff, Elliott) point short - Broken support, a 1h order cluster and the midpoint of the recent drop stack in one area - Macro and news are risk-off, so there's little fuel for a bigger rally When independent reads land on one zone, sellers have a reason to defend it. From an ICT lens, the sweep took out resting stops but didn't change structure. No break above the last 4h lower high yet, so rallies are retracements inside a downtrend. Where I'm wrong: a 4h close above that lower high breaks the sequence. Then I step aside. Risks: - Bullish divergence on 4h and 1h could stretch the bounce - If price drops without bouncing, the order never fills. I won't chase Not investment advice. All decisions and responsibility are your own. #IMPACTbyTrade